united states
securities and exchange commission
washington, d.c. 20549
form n-csr
certified shareholder report of registered management
investment companies
Investment Company Act file number 811-22208
Valued Advisers Trust
(Exact name of registrant as specified in charter)
Ultimus Fund Solutions, LLC 225 Pictoria Drive, Suite 450 Cincinnati, OH 45246
(Address of principal executive offices) (Zip code)
Ultimus Fund Solutions, LLC
Attn: Zachary P. Richmond
225 Pictoria Drive, Suite 450
Cincinnati, OH 45246
(Name and address of agent for service)
Registrant's telephone number, including area code: 513-587-3400
Date of fiscal year end: 1/31
Date of reporting period: 1/31/2022
Item 1. Reports to Stockholders.
| |
| |
| |
| |
| |
 |
| |
| |
| |
| |
| |
| |
| |
| |
| |
| Belmont Theta Income Fund |
| |
| |
| |
| |
| |
| Annual Report |
| |
| January 31, 2022 |
| |
| |
| |
| |
| |
| Fund Adviser: |
Belmont Capital, LLC d/b/a Belmont Capital GroupTM
1875 Century Park E., Suite 1780
Los Angeles, CA 90067 |
| |
| |
| |
| |
| |
| Belmont Theta Income Fund |
| Management’s discussion of Fund performance (Unaudited) |
| January 31, 2022 |
Dear Shareholders:
Overview:
The Belmont Theta Income Fund was launched on April 30, 2018, with the goal of offering our income generating Theta Overlay Program options strategy in a mutual fund format. The objective of the Fund is the long-term growth of capital and income generation with limited correlation to equity markets.
Performance Results:
For the 12 months ended January 31, 2022, Institutional Class shares of the Belmont Theta Income Fund returned 1.73% at net asset value. The Fund’s primary benchmark, the Cboe S&P 500® Iron Condor Index, returned 1.22% for the same period.
Explanation of Fund Performance:
The Fund seeks to generate returns through yield of the Government short-term fixed income securities and realized option premium income. The Fund purchases short-term Government fixed income as collateral for the Theta Overlay Program options strategy. The options strategy writes out of the money call and put spreads on the S&P 500® Index (SPX) to capitalize on time decay and the volatility risk premium (VRP) typically imbedded in option pricing. Historically, there has been a premium between the implied volatility of option pricing and realized volatility of the SPX which the Fund seeks to exploit through its risk managed process. The strategy should benefit from higher short term interest rates along with moderate volatility in the SPX relative to the option premium collected. Lower short term interest rates and high velocity moves in either direction in the price of the SPX can be potentially negative for strategy performance.
The economic recovery continued in 2021 and the SPX rallied to all-time highs notching a +26.89% return for the calendar year ended December 2021. Fueled by historically low interest rates and continued quantitative easing from the Federal Reserve, the upward trend in the S&P 500 persisted throughout the calendar year with the worst peak-to-trough drawdown being just 5.2%. That puts it in the bottom 10% of all calendar year drawdowns over the past 94 years of data. This allowed the Fund to realize the majority of option premium collected through the selling of its put spreads. Conversely, the lack of “back and forth” for the better part of the fiscal year ended January 2022 challenged the call spread positions. Additional loses to the call spreads were mitigated through active risk management, placing the fund in a position to end the fiscal year with positive returns.
| Belmont Theta Income Fund |
| Management’s discussion of Fund performance (Unaudited) |
| (continued) |
| January 31, 2022 |
Finally, the fixed income portion of the Fund’s strategy added almost no additional return as short-term rates were near zero for the entire fiscal year.
Outlook:
Looking forward we feel that, the Theta Overlay Program options strategy should continue to benefit from elevated Cboe Exchange’s Cboe Volatility Index levels, and our proactive risk management approach tested since 2011. Additionally, there is an opportunity to continue collecting higher VRP than in previous years, as many of the specialized funds which previously provided the option market supply have shut down and have yet to be replaced. An equity market with less extremes (upside & downside) than experienced recently could also benefit the option component of the Fund. We anticipate that the fixed income strategy will continue to be invested in high quality US Treasury securities and would benefit from the Federal Open Market Committee’s follow through with proposed rate increases.
Thank you for your continued support and please reach out with any questions or visit www.belmontcapfunds.com for other information about the Fund.
Stephen J. Solaka
Managing Partner & Portfolio Manager
Investment Results (Unaudited)
Average Annual Total Returns* as of January 31, 2022
| | | | | | Since |
| | | | | | Inception |
| | | | | | (April 30, |
| | One Year | | Three Years | | 2018) |
| Belmont Theta Income Fund | 1.73% | | (0.46)% | | (0.69)% |
| Cboe S&P 500® Iron Condor Index(a) | 1.22% | | (0.58)% | | (2.27)% |
| ICE BofA US 3-Month Treasury Bill Index(b) | 0.03% | | 0.93% | | 1.16% |
Total annual operating expenses as disclosed in the Belmont Theta Income Fund (the “Fund”) prospectus dated May 28, 2021, were 3.20% of average daily net assets (2.10% after fee waivers/ expense reimbursements by Belmont Capital, LLC (the “Adviser”)). The Adviser has contractually agreed to waive or limit its fees and to assume other expenses of the Fund until May 31, 2022, so that total annual fund operating expenses do not exceed 1.99%. This contractual arrangement may only be terminated by mutual consent of the Adviser and the Board of Trustees of the Value Advisers Trust (the “Trust”), and it will automatically terminate upon the termination of the investment advisory agreement between the Trust and the Adviser. This operating expense limitation does not apply to: (i) interest, (ii) taxes, (iii) brokerage commissions, (iv) other expenditures which are capitalized in accordance with generally accepted accounting principles, (v) other extraordinary expenses not incurred in the ordinary course of the Fund’s business, (vi) dividend expense on short sales, (vii) expenses incurred under a plan of distribution under Rule 12b-1, and (viii) expenses that the Fund has incurred but did not actually pay because of an expense offset arrangement, if applicable, in any fiscal year. The operating expense limitation also excludes any “Acquired Fund Fees and Expenses,” which are the expenses indirectly incurred by the Fund as a result of investing in money market funds or other investment companies, including exchange-traded funds, that have their own expenses. Each waiver or reimbursement of an expense by the Adviser is subject to repayment by the Fund within the three years following the date on which the fee waiver or expense reimbursement occurred, provided that the Fund is able to make the repayment without exceeding the expense limitation in place at the time of the waiver or reimbursement and the expense limitation in place at the time of the repayment. Additional information pertaining to the Fund’s expense ratios as of January 31, 2022 can be found in the financial highlights.
The performance quoted represents past performance, which does not guarantee future results. The investment return and principal value of an investment will fluctuate so that an investor’s shares, when redeemed, may be worth more or less than their original cost. The returns shown do not reflect deduction of taxes that a shareholder would pay on Fund distributions or the redemption of Fund shares. Current performance of the Fund may be lower or higher than the performance quoted. The Fund’s investment objectives, risks, charges and expenses must be considered carefully before investing. Performance data current to the most recent month end may be obtained by calling (800) 789-1087.
| * | Average annual total returns reflect any change in price per share and assume the reinvestment of all distributions. The Fund’s returns reflect any fee reductions during the applicable periods. If such fee reductions had not occurred, the quoted performance would have been lower. |
| (a) | Cboe S&P 500® Iron Condor Index (“Index”) is designed to track the performance of a hypothetical option trading strategy that 1) sells a rolling monthly out-of-the-money (OTM) S&P 500® Index (SPX) put option (delta ≈ - 0.20) and a rolling monthly OTM SPX call option (delta ≈ 0.20); 2) buys a rolling monthly OTM SPX put option (delta ≈ - 0.05) and a rolling monthly OTM SPX call option (delta ≈ 0.05) to reduce risk; and 3) holds a money market account invested in one- |
Investment Results (Unaudited) (continued)
month Treasury bills, which is rebalanced on option roll days and is designed to limit the downside return of the Index.
| (b) | ICE BofA US 3-Month Treasury Bill Index is comprised of a single issue purchased at the beginning of the month and held for a full month. At the end of the month that issue is sold and rolled into a newly selected issue. The issue selected at each month-end rebalancing is the outstanding Treasury Bill that matures closest to, but not beyond, three months from the rebalancing date. To qualify, an issue must have settled on or before the rebalancing date. |
The Fund’s investment objectives, strategies, risks, charges and expenses must be considered carefully before investing. The prospectus contains this and other important information about the Fund and may be obtained by calling (800) 789-1087. Please read it carefully before investing.
The Fund is distributed by Ultimus Fund Distributors, LLC, Member FINRA/SIPC.
Investment Results (Unaudited) (continued)
Comparison of the Growth of a $10,000 Investment in the Belmont Theta Income Fund, the Cboe S&P 500® Iron Condor Index and the ICE BofA US 3-Month Treasury Bill Index.
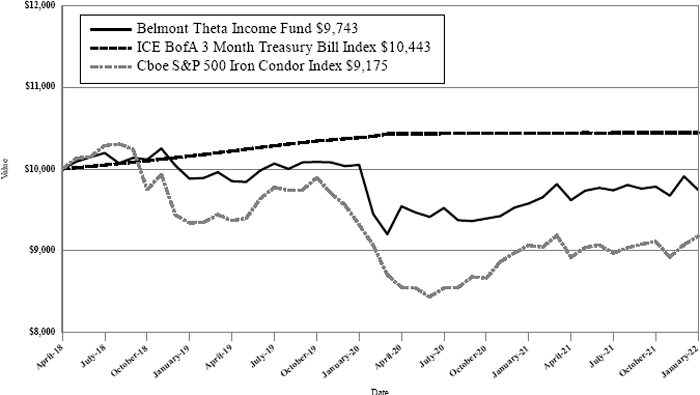
The chart above assumes an initial investment of $10,000 made on April 30, 2018 (commencement of operations) and held through January 31, 2022. The Cboe S&P 500 Iron Condor Index (“Index”) is designed to track the performance of a hypothetical option trading strategy that 1) sells a rolling monthly out-of-the-money (OTM) S&P 500 Index (SPX) put option (delta ≈ - 0.20) and a rolling monthly out-of-the-money (OTM) SPX call option (delta ≈ 0.20); 2) buys a rolling monthly OTM SPX put option (delta ≈ - 0.05) and a rolling monthly OTM SPX call option (delta ≈ 0.05) to reduce risk; and 3) holds a money market account invested in one-month Treasury bills, which is rebalanced on option roll days and is designed to limit the downside return of the index. Individuals cannot invest directly in the Index; however, an individual may invest in exchange-traded funds or other investment vehicles that attempt to track the performance of a benchmark index. THE FUND’S RETURN REPRESENTS PAST PERFORMANCE AND DOES NOT GUARANTEE FUTURE RESULTS. The returns shown do not reflect deduction of taxes that a shareholder would pay on Fund distributions or the redemption of Fund shares. Investment returns and principal values will fluctuate so that your shares, when redeemed, may be worth more or less than their original purchase price.
Current performance may be lower or higher than the performance data quoted. For more information on the Fund, and to obtain performance data current to the most recent month-end, or to request a prospectus, please call (800) 789-1087. You should carefully consider the investment objectives, potential risks, management fees, and charges and expenses of the Fund before investing. The Fund’s prospectus contains this and other information about the Fund, and should be read carefully before investing.
The Fund is distributed by Ultimus Fund Distributors, LLC, Member FINRA/SIPC.
Fund Holdings (Unaudited)
Belmont Theta Income Fund Holdings as of January 31, 2022*
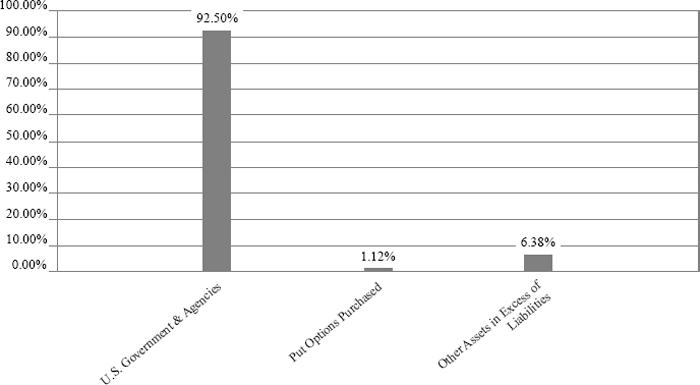
| * | As a percentage of net assets. |
The investment objective of the Fund is to seek long-term growth of capital and income generation with limited correlation to equity markets.
Availability of Portfolio Schedule (Unaudited)
The Fund files its complete schedule of portfolio holdings with the Securities and Exchange Commission (the “SEC”) for the first and third quarters of each fiscal year as an exhibit to its reports on Form N-PORT. The Fund’s Form N-PORT reports are available on the SEC’s website at http:// www.sec.gov and on the Fund’s website at http://www.belmontcapfunds.com.
Belmont Theta Income Fund
Schedule of Investments
January 31, 2022
| | | Principal | | | | | |
| | | Amount | | | Fair Value | |
| U.S. GOVERNMENT & AGENCIES(a)(b)(c) — 92.50% | | | | | | | | |
| United States Treasury Bill, 0.03%, 3/24/2022 | | $ | 2,000,000 | | | $ | 1,999,795 | |
| United States Treasury Bill, 0.02%, 5/19/2022 | | | 1,000,000 | | | | 999,235 | |
| United States Treasury Bill, 0.04%, 8/11/2022 | | | 2,000,000 | | | | 1,995,198 | |
| United States Treasury Bill, 0.08%, 11/3/2022 | | | 2,000,000 | | | | 1,991,302 | |
| United States Treasury Bill, 0.14%, 12/1/2022 | | | 2,000,000 | | | | 1,989,542 | |
| United States Treasury Bill, 0.29%, 12/29/2022 | | | 1,000,000 | | | | 993,440 | |
| United States Treasury Bill, 0.54%, 1/26/2023 | | | 2,000,000 | | | | 1,984,792 | |
| Total U.S. Government & Agencies (Cost $11,982,426) | | | | | | | 11,953,304 | |
| | | Number of | | | Notional | | | Exercise | | | Expiration | | | |
| Description | | Contracts | | | Amount | | | Price | | | Date | | Fair Value | |
| PUT OPTIONS PURCHASED — 1.12% | | | | | | | | | | | | | | | | | | |
| S & P 500 Index(c) | | | 85 | | | $ | 38,382,155 | | | $ | 3,950.00 | | | March 2022 | | $ | 144,925 | |
| Total Options Purchased (Cost $751,684) | | | | | | | | | | | | | | | | | 144,925 | |
| Total Investments — 93.62% (Cost $12,734,110) | | | | | 12,098,229 | |
| Other Assets in Excess of Liabilities — 6.38% | | | 824,716 | |
| NET ASSETS — 100.00% | | | $ | 12,922,945 | |
| (a) | All of these securities are held as collateral for options. |
| (b) | The rate shown represents effective yield at time of purchase. |
| (c) | Non-income producing security. |
See accompanying notes which are an integral part of these financial statements.
Belmont Theta Income Fund
Schedule of Open Written Option Contracts
January 31, 2022
| | | Number of | | | Notional | | | Exercise | | | Expiration | | | |
| Description | | Contracts | | | Amount | | | Price | | | Date | | Fair Value | |
| WRITTEN PUT OPTIONS (2.21)% | | | | | | | | | | | | | | | | | | |
| S & P 500 Index(a) | | | (85 | ) | | $ | (38,382,155 | ) | | $ | 4,150.00 | | | March 2022 | | $ | (285,175 | ) |
| | | | | | | | | | | | | | | | | | | |
| Total Written Options (Premiums Received $1,209,007) | | $ | (285,175 | ) |
| (a) | Non-income producing security. |
See accompanying notes which are an integral part of these financial statements.
Belmont Theta Income Fund
Statement of Assets and Liabilities
January 31, 2022
| Assets | | | | | | | | |
| Investments in securities at fair value (cost $12,734,110) (Note 3) | | | $ | | | | 12,098,229 | |
| Cash | | | | | | | 270,242 | |
| Cash held at broker for options transactions | | | | | | | 871,992 | |
| Interest receivable | | | | | | | 4 | |
| Prepaid expenses | | | | | | | 6,797 | |
| Total Assets | | | | | | | 13,247,264 | |
| Liabilities | | | | | | | | |
| Options written, at value (premium received $1,209,007) | | | | | | | 285,175 | |
| Payable to Adviser (Note 4) | | | | | | | 4,922 | |
| Payable to Administrator (Note 4) | | | | | | | 7,107 | |
| Payable to trustees | | | | | | | 2,130 | |
| Other accrued expenses | | | | | | | 24,985 | |
| Total Liabilities | | | | | | | 324,319 | |
| Net Assets | | | $ | | | | 12,922,945 | |
| Net Assets consist of: | | | | | | | | |
| Paid-in capital | | | $ | | | | 13,143,284 | |
| Accumulated deficit | | | | | | | (220,339 | ) |
| Net Assets | | | $ | | | | 12,922,945 | |
| Shares outstanding (unlimited number of shares authorized, no par value) | | | | | | | 665,399 | |
| Net asset value, offering and redemption price per share (Note 2) | | | $ | | | | 19.42 | |
See accompanying notes which are an integral part of these financial statements.
Belmont Theta Income Fund
Statement of Operations
For the year ended January 31, 2022
| Investment Income | | | | |
| Interest income | | $ | 7,078 | |
| Total investment income | | | 7,078 | |
| Expenses | | | | |
| Investment Adviser fees (Note 4) | | | 229,178 | |
| Administration fees (Note 4) | | | 42,000 | |
| Fund accounting fees (Note 4) | | | 31,270 | |
| Legal fees | | | 21,185 | |
| Audit and tax preparation fees | | | 18,460 | |
| Registration expenses | | | 16,932 | |
| Transfer agent fees (Note 4) | | | 12,000 | |
| Printing and postage expenses | | | 8,002 | |
| Trustee fees | | | 5,368 | |
| Interest expense | | | 4,053 | |
| Custodian fees | | | 3,000 | |
| Miscellaneous expense | | | 26,624 | |
| Total expenses | | | 418,072 | |
| Fees contractually waived by Adviser (Note 4) | | | (153,403 | ) |
| Net operating expenses | | | 264,669 | |
| Net investment loss | | | (257,591 | ) |
| Net Realized and Change in Unrealized Gain (Loss) on Investments | | | | |
| Net realized gain (loss) on: | | | | |
| Investment securities | | | (458,973 | ) |
| Written options | | | 736,668 | |
| Change in unrealized appreciation (depreciation) on: | | | | |
| Investment securities | | | (565,287 | ) |
| Written options | | | 773,397 | |
| Net realized and change in unrealized gain on investments | | | 485,805 | |
| Net increase in net assets resulting from operations | | $ | 228,214 | |
See accompanying notes which are an integral part of these financial statements.
Belmont Theta Income Fund
Statements of Changes in Net Assets
| | | For the Year | | | For the Year | |
| | | Ended January | | | Ended January | |
| | | 31, 2022 | | | 31, 2021 | |
| Increase (Decrease) in Net Assets due to: | | | | | | | | |
| Operations | | | | | | | | |
| Net investment loss | | $ | (257,591 | ) | | $ | (148,363 | ) |
| Net realized gain (loss) on investment securities transactions and written options | | | 277,695 | | | | (700,877 | ) |
| Net change in unrealized appreciation of investment securities and written options | | | 208,110 | | | | 42,581 | |
| Net increase (decrease) in net assets resulting from operations | | | 228,214 | | | | (806,659 | ) |
| Capital Transactions - Institutional Class: | | | | | | | | |
| Proceeds from shares sold | | | 1,667,519 | | | | 1,302,524 | |
| Amount paid for shares redeemed | | | (1,797,810 | ) | | | (3,684,440 | ) |
| Net decrease in net assets resulting from capital transactions | | | (130,291 | ) | | | (2,381,916 | ) |
| Total Increase (Decrease) in Net Assets | | | 97,923 | | | | (3,188,575 | ) |
| Net Assets | | | | | | | | |
| Beginning of year | | | 12,825,022 | | | | 16,013,597 | |
| End of year | | $ | 12,922,945 | | | $ | 12,825,022 | |
| Share Transactions - Institutional Class: | | | | | | | | |
| Shares sold | | | 85,715 | | | | 69,094 | |
| Shares redeemed | | | (92,260 | ) | | | (196,459 | ) |
| Net decrease in shares | | | (6,545 | ) | | | (127,365 | ) |
See accompanying notes which are an integral part of these financial statements.
Belmont Theta Income Fund - Institutional Class
Financial Highlights
(For a share outstanding during each period)
| | | For the Years Ended January 31, | | | For the | |
| | | | | | | | | | | | Period | |
| | | | | | | | | | | | Ended | |
| | | | | | | | | | | | January 31, | |
| | 2022 | | | 2021 | | | 2020 | | | 2019(a) | |
| Selected Per Share Data: | | | | | | | | | | | | | | | | |
| Net asset value, beginning of period | | $ | 19.09 | | | $ | 20.03 | | | $ | 19.76 | | | $ | 20.00 | |
| Investment operations: | | | | | | | | | | | | | | | | |
| Net investment income (loss) | | | (0.39 | ) | | | (0.22 | ) | | | 0.01 | | | | — | (b) |
| Net realized and unrealized gain (loss) | | | 0.72 | | | | (0.72 | ) | | | 0.32 | | | | (0.24 | ) |
| Total from investment operations | | | 0.33 | | | | (0.94 | ) | | | 0.33 | | | | (0.24 | ) |
| Less distributions to shareholders from: | | | | | | | | | | | | | | | | |
| Net investment income | | | — | | | | — | | | | (0.01 | ) | | | — | |
| Net realized gains | | | — | | | | — | | | | (0.05 | ) | | | — | |
| Total distributions | | | — | | | | — | | | | (0.06 | ) | | | — | |
| Net asset value, end of period | | $ | 19.42 | | | $ | 19.09 | | | $ | 20.03 | | | $ | 19.76 | |
| Total Return(c) | | | 1.73 | % | | | (4.69 | )% | | | 1.71 | % | | | (1.20 | )% (d) |
| Ratios and Supplemental Data: | | | | | | | | | | | | | | | | |
| Net assets, end of period (000 omitted) | | $ | 12,923 | | | $ | 12,825 | | | $ | 16,014 | | | $ | 12,839 | |
| Ratio of net expenses to average net assets(e) | | | 2.02 | % | | | 2.10 | % | | | 2.14 | % | | | 2.20 | % (f) |
| Ratio of expenses to average net assets before waiver and reimbursement | | | 3.19 | % | | | 3.20 | % | | | 3.02 | % | | | 4.97 | % (f) |
| Ratio of net investment income (loss) to average net assets | | | (1.97 | )% | | | (1.08 | )% | | | 0.06 | % | | | (0.05 | )% (f) |
| Portfolio turnover rate | | | — | % | | | — | % | | | —% | | | | — | % (d) |
| (a) | For the period April 30, 2018 (commencement of operations) to January 31, 2019. |
| (b) | Rounds to less than $0.005 per share. |
| (c) | Total return represents the rate that the investor would have earned or lost on an investment in the Fund, assuming reinvestment of distributions. |
| (e) | This ratio includes the impact of broker interest fees. If this cost had been excluded, the ratio of expenses to average net assets would have been 1.99% for the periods ended January 31, 2022, January 31, 2021, January 31, 2020 and January 31, 2019, respectively. |
See accompanying notes which are an integral part of these financial statements.
Belmont Theta Income Fund
Notes to the Financial Statements
January 31, 2022
NOTE 1. ORGANIZATION
The Belmont Theta Income Fund (the “Fund”) is registered under the Investment Company Act of 1940, as amended (“1940 Act”), as an open-end diversified series of Valued Advisers Trust (the “Trust”). The Trust is a management investment company established under the laws of Delaware by an Agreement and Declaration of Trust dated June 13, 2008 (the “Trust Agreement”). The Trust Agreement permits the Board of Trustees (the “Board”) to issue an unlimited number of shares of beneficial interest of separate series without par value. The Fund is one of a series of funds authorized by the Board. The Fund currently offers one class of shares: Institutional Shares. The Fund commenced operations on April 30, 2018. The Fund’s investment adviser is Belmont Capital, LLC d/b/a Belmont Capital GroupTM (the “Adviser”). The investment objective of the Fund is to seek long-term growth of capital and income generation with limited correlation to equity markets.
NOTE 2. SIGNIFICANT ACCOUNTING POLICIES
The Fund is an investment company and follows accounting and reporting guidance under Financial Accounting Standards Board Accounting Standards Codification (“ASC”) Topic 946, “Financial Services-Investment Companies.” The following is a summary of significant accounting policies followed by the Fund in the preparation of its financial statements. These policies are in conformity with generally accepted accounting principles in the United States of America (“GAAP”).
Estimates – The preparation of financial statements in conformity with GAAP requires management to make estimates and assumptions that affect the reported amounts of assets and liabilities and disclosure of contingent assets and liabilities at the date of the financial statements and the reported amounts of increases and decreases in net assets from operations during the reporting period. Actual results could differ from those estimates.
Federal Income Taxes – The Fund makes no provision for federal income or excise tax. The Fund has qualified and intends to qualify each year as a regulated investment company (“RIC”) under subchapter M of the Internal Revenue Code of 1986, as amended, by complying with the requirements applicable to RICs and by distributing substantially all of its taxable income. The Fund also intends to distribute sufficient net investment income and net realized capital gains, if any, so that it will not be subject to excise tax on undistributed income and gains. If the required amount of net investment income or gains is not distributed, the Fund could incur a tax expense.
As of and during the fiscal year ended January 31, 2022, the Fund did not have any liabilities for any unrecognized tax benefits. The Fund recognizes interest and penalties, if any, related to unrecognized tax benefits as income tax expense on the Statement of Operations when incurred. During the fiscal year ended January 31, 2022, the Fund did not incur any
Belmont Theta Income Fund
Notes to the Financial Statements (continued)
January 31, 2022
interest or penalties. Management of the Fund has reviewed tax positions taken in tax years that remain subject to examination by all major tax jurisdictions, including federal (i.e., the last three tax year ends and the interim tax period since then, as applicable). Management believes that there is no tax liability resulting from unrecognized tax benefits related to uncertain tax positions taken.
Expenses – Expenses incurred by the Trust that do not relate to a specific fund of the Trust are allocated to the individual funds based on each fund’s relative net assets or another appropriate basis (as determined by the Board).
Security Transactions and Related Income – The Fund follows industry practice and records security transactions on the trade date for financial reporting purposes. The specific identification method is used for determining gains or losses for financial statement and income tax purposes. Dividend income is recorded on the ex-dividend date and interest income is recorded on an accrual basis. Discounts and premiums on securities purchased are accreted or amortized using the effective interest method. Non-cash income, if any, is recorded at the fair market value of the securities received. Withholding taxes on foreign dividends, if any, have been provided for in accordance with the Fund’s understanding of the applicable country’s tax rules and rates.
Dividends and Distributions – The Fund intends to distribute its net investment income and net realized long-term and short-term capital gains, if any, at least annually. Dividends and distributions to shareholders, which are determined in accordance with income tax regulations, are recorded on the ex-dividend date. The treatment for financial reporting purposes of distributions made to shareholders during the period from net investment income or net realized capital gains may differ from their ultimate treatment for federal income tax purposes. These differences are caused primarily by differences in the timing of the recognition of certain components of income, expense or realized capital gain for federal income tax purposes. Where such differences are permanent in nature, they are reclassified among the components of net assets based on their ultimate characterization for federal income tax purposes. Any such reclassifications will have no effect on net assets, results of operations or net asset value (“NAV”) per share of the Fund.
For the fiscal year ended January 31, 2022, the Fund made the following reclassifications to increase (decrease) the components of net assets due to net operating losses:
| | | Accumulated Earnings |
| Paid-In Capital | | (Deficit) |
| $(256,147) | | $256,147 |
Share Valuation – The NAV is calculated each day the New York Stock Exchange (the “NYSE”) is open by dividing the total value of the Fund’s assets, less liabilities, by the number of shares outstanding for the Fund.
Belmont Theta Income Fund
Notes to the Financial Statements (continued)
January 31, 2022
Options – The Fund utilizes an option premium collection strategy that implements a put spread and a call spread on the S&P 500® Index (SPX) to create a number of defined-risk trades. A defined-risk trade is essentially where a series of financial instruments (such as options) are entered into where the terms and conditions of the financial instruments are, in combination, designed to limit the overall risk. Stock index options are put options and call options on various stock indices. In most respects, they are identical to listed options on common stocks. The option holder who exercises the index option receives an amount of cash if the closing level of the stock index upon which the option is based is greater than, in the case of a call, or less than, in the case of a put, the exercise price of the option. Options trading is a highly specialized activity that entails greater than ordinary investment risk. Options may be more volatile than the underlying investments, and therefore may be subject to greater fluctuation than an investment in the underlying instruments themselves.
In implementing its option premium collection strategy, the Fund will sell (write) a put option (creating a short position) while simultaneously purchasing another put option at a different strike price (creating a long position) – the combination of these two put option positions creates a defined-risk trade. Additionally, the Fund will sell (write) a call option (creating another short position) while simultaneously purchasing another call option at a different strike price (creating another long position) – the combination of these two call options positions creates another defined-risk trade for the Fund. The Fund’s put spreads and call spreads each contain the following characteristics: (i) the long and short options of each spread have the same number of contracts, (ii) the long option of each spread will have a further out-of-the-money strike price than the short option; (iii) the long option of each spread will have at least the same or longer expiration date than the short option.
The Fund generally utilizes weekly and monthly SPX options with expirations of 90 days or less. SPX options are European-style options, which means that they can be exercised only at expiration. Based on the Adviser’s assessment of market conditions, the Adviser may close one or more sides of a spread at any time for purposes of risk management of the Fund.
The Adviser monitors all SPX option strikes for the optimal sale of put spreads and call spreads. Once the Fund has entered into a position, the Adviser attempts to realize as much of the net premium as possible. The Fund may decide to close its option spread positions prior to expiration, which may result in realizing less than the net option premium initially collected. Positions are generally re-set on a monthly basis, but the Adviser may determine to close and/or adjust option spreads prior to expiration for purposes of risk management. The Adviser may at times determine to take a temporary defensive position and not implement its option spread writing investment strategy. The option premium collection strategy may result in the generation of positive returns for the Fund; however, the loss potential if the strategy is not effective may be greater than the profit potential. The
Belmont Theta Income Fund
Notes to the Financial Statements (continued)
January 31, 2022
Fund may lose significantly more than the premium it receives in highly volatile market conditions.
The Fund is required to pledge collateral for the option trades and it will hold cash, money market instruments, or treasury bills as collateral for all such options trades. The Fund’s custodian will segregate such collateral for the benefit of the counterparty. Therefore, the Fund must typically maintain a large percentage of cash and cash equivalents within the Fund. The Fund’s option spread positions will effectively lever the portfolio and will target a notional exposure of no greater than three times the pledged collateral value.
Derivative Transactions – The following tables identify the location and fair value of derivative instruments on the Statement of Assets and Liabilities as of January 31, 2022 and the effect of derivative instruments on the Statement of Operations for the fiscal year ended January 31, 2022.
As of January 31, 2022:
| Location of Derivatives on Statement of Assets and Liabilities |
| Derivatives | | Asset Derivatives | | Liability Derivatives | | Fair Value | |
| Equity Price Risk: | | | | | | | |
| Options Purchased | | Investments in securities at fair value | | | | $ | 144,925 | |
| | | | | | | | | |
| Options Written | | | | Options written, at fair value | | | (285,175 | ) |
For the fiscal year ended January 31, 2022:
| | | | | | | | Change in Unrealized | |
| | | Location of Gain (Loss) on | | Realized Gain | | | Appreciation | |
| | | Derivatives on Statement of | | (Loss) on | | | (Depreciation) on | |
| Derivatives | | Operations | | Derivatives | | | Derivatives | |
| Equity Price Risk: | | | | | | | | | | |
| Options purchased | | Net realized gain and change in unrealized appreciation (depreciation) on investment securities | | $ | (458,973 | ) | | $ | (537,133 | ) |
| Options written | | Net realized gain and change in unrealized appreciation (depreciation) on written options | | | 736,668 | | | | 773,397 | |
Belmont Theta Income Fund
Notes to the Financial Statements (continued)
January 31, 2022
The following summarizes the average ending monthly fair value of derivatives outstanding during the fiscal year ended January 31, 2022:
| | Average Ending Monthly |
| Derivatives | Fair Value(a) |
| Options Purchased | $64,633 |
| Options Written | (188,621) |
| (a) | Average based on the eleven months during the period that had activity |
The following table provides a summary of offsetting financial liabilities and derivatives and the effect of derivative instruments on the Statement of Assets and Liabilities as of January 31, 2022:
| | | | | | | | | | | | Gross Amounts Not Offset | | | | |
| | | | | | | | | | | | in Statements of Assets and | | | | |
| | | | | | | | | | | | Liabilities | | | | |
| | | | | | | | | Net Amounts | | | | | | | | | | |
| | | | | | Gross Amounts | | | of Liabilities | | | | | | | | | | |
| | | | | | Offset in | | | Presented in | | | | | | | | | | |
| | | Gross Amounts | | | Statement of | | | Statement of | | | | | | | | | | |
| | | of Recognized | | | Assets and | | | Assets and | | | Financial | | | Collateral | | | Net | |
| | | Liabilities | | | liabilities | | | Liabilities | | | Instruments | | | Pledged | | | Amount | |
| Written Options | | $ | 285,175 | | | $ | — | | | $ | 285,175 | | | $ | (285,175 | ) | | $ | — | | | $ | — | |
NOTE 3. SECURITIES VALUATION AND FAIR VALUE MEASUREMENTS
The Fund values its portfolio securities at fair value as of the close of regular trading on the NYSE (normally 4:00 p.m. Eastern time) on each business day the NYSE is open for business. Fair value is defined as the price that the Fund would receive upon selling an investment in a timely transaction to an independent buyer in the principal or most advantageous market of the investment. GAAP establishes a three-tier hierarchy to maximize the use of observable market data and minimize the use of unobservable inputs and to establish classification of fair value measurements for disclosure purposes.
Inputs refer broadly to the assumptions that market participants would use in pricing the asset or liability, including assumptions about risk (the risk inherent in a particular valuation technique used to measure fair value including a pricing model and/or the risk inherent in the inputs to the valuation technique). Inputs may be observable or unobservable. Observable inputs are inputs that reflect the assumptions market participants would use in pricing the asset or liability developed based on market data obtained and available from sources independent of the reporting entity. Unobservable inputs are inputs that reflect the reporting entity’s own assumptions about the assumptions market participants would use
Belmont Theta Income Fund
Notes to the Financial Statements (continued)
January 31, 2022
in pricing the asset or liability developed based on the best information available in the circumstances.
Various inputs are used in determining the value of the Fund’s investments. These inputs are summarized in the three broad levels listed below.
● Level 1 – unadjusted quoted prices in active markets for identical investments and/or registered investment companies where the value per share is determined and published and is the basis for current transactions for identical assets or liabilities at the valuation date
● Level 2 – other significant observable inputs (including, but not limited to, quoted prices for an identical security in an inactive market, quoted prices for similar securities, interest rates, prepayment speeds, credit risk, etc.)
● Level 3 – significant unobservable inputs (including the Fund’s own assumptions in determining fair value of investments based on the best information available)
The inputs used to measure fair value may fall into different levels of the fair value hierarchy. In such cases, for disclosure purposes, the level in the fair value hierarchy which is reported is determined based on the lowest level input that is significant to the fair value measurement in its entirety.
Debt securities are valued by using the mean between the closing bid and ask prices provided by a pricing service. If the closing bid and ask prices are not readily available, the pricing service may provide a price determined by a matrix pricing method. Matrix pricing is a mathematical technique used to value fixed income securities without relying exclusively on quoted prices. Matrix pricing takes into consideration recent transactions, yield, liquidity, risk, credit quality, coupon, maturity, type of issue and any other factors or market data the pricing service deems relevant for the actual security being priced and for other securities with similar characteristics. These securities will generally be categorized as Level 2 securities. If the Adviser decides that a price provided by the pricing service does not accurately reflect the fair value of the securities or when prices are not readily available from a pricing service, securities are valued at fair value as determined by the Adviser, in conformity with guidelines adopted by and subject to review of the Board. These securities will generally be categorized as Level 3 securities.
Equity securities that are traded on any stock exchange are generally valued at the last quoted sale price on the security’s primary exchange. Lacking a last sale price, an exchange-traded security is generally valued at its last bid price. Securities traded in the NASDAQ over-the-counter market are generally valued at the NASDAQ Official Closing Price. When using market quotations and when the market is considered active, the security is classified as a Level 1 security. In the event that market quotations are not readily available
Belmont Theta Income Fund
Notes to the Financial Statements (continued)
January 31, 2022
or are considered unreliable due to market or other events, the Fund values its securities and other assets at fair value in accordance with policies established by and under the general supervision of the Board. Under these policies, the securities will be classified as Level 2 or 3 within the fair value hierarchy, depending on the inputs used.
Investments in mutual funds, including money market mutual funds, are generally priced at the ending NAV. These securities are categorized as Level 1 securities.
Exchange-traded options on securities and indices purchased or sold by the Fund generally will be valued at the mean of the last bid and ask prices. If there is no such reported ask on the valuation date, purchased options are valued at the most recent bid price. If there is no such reported bid on the valuation date, written options are valued at the most recent ask price. On the last business day of each month, the Cboe Options Exchange (“Cboe”) conducts special end-of-month non-trading closing rotations for the sole purpose of determining the fair value of the S&P 500 Index (SPX) option series. For month end valuations of SPX, the Cboe adjusted price will be used if the special end-of-month non-trading closing rotation fair value price differs from the price provided at market close. Options will generally be categorized as Level 2 securities.
In accordance with the Trust’s valuation policies, the Adviser is required to consider all appropriate factors relevant to the value of securities for which it has determined other pricing sources are not available or reliable as described above. No single method exists for determining fair value, because fair value depends upon the circumstances of each individual case. As a general principle, the current fair value of a security being valued by the Adviser would be the amount that the Fund might reasonably expect to receive upon the current sale. Methods that are in accordance with this principle may, for example, be based on (i) a multiple of earnings; (ii) a discount from market prices of a similar freely traded security (including a derivative security or a basket of securities traded on other markets, exchanges or among dealers); or (iii) yield to maturity with respect to debt issues, or a combination of these and other methods. Fair-value pricing is permitted if, in the Adviser’s opinion, the validity of market quotations appears to be questionable based on factors such as evidence of a thin market in the security based on a small number of quotations, a significant event occurs after the close of a market but before the Fund’s NAV calculation that may affect a security’s value, or the Adviser is aware of any other data that calls into question the reliability of market quotations.
Belmont Theta Income Fund
Notes to the Financial Statements (continued)
January 31, 2022
The following is a summary of the inputs used to value the Fund’s investments as of January 31, 2022:
| Valuation Inputs |
| Assets | | Level 1 | | | Level 2 | | | Level 3 | | | Total | |
| U.S. Government & Agencies | | $ | — | | | $ | 11,953,304 | | | $ | — | | | $ | 11,953,304 | |
| Put Options Purchased | | | — | | | | 144,925 | | | | — | | | | 144,925 | |
| Total | | $ | — | | | $ | 12,098,229 | | | $ | — | | | $ | 12,098,229 | |
| Valuation Inputs |
| Assets | | Level 1 | | | Level 2 | | | Level 3 | | | Total | |
| Written Put Options | | $ | — | | | $ | (285,175 | ) | | $ | — | | | $ | (285,175 | ) |
| Total | | $ | — | | | $ | (285,175 | ) | | $ | — | | | $ | (285,175 | ) |
The Fund did not hold any investments at the end of the reporting period for which significant unobservable inputs (Level 3) were used in determining fair value; therefore, no reconciliation of Level 3 securities is included for this reporting period.
NOTE 4. FEES AND OTHER TRANSACTIONS WITH AFFILIATES AND OTHER SERVICE PROVIDERS
Under the terms of the investment advisory agreement, on behalf of the Fund (the “Agreement”), the Adviser manages the Fund’s investments subject to oversight of the Board. As compensation for its services, the Fund pays the Adviser a fee, computed and accrued daily and paid monthly at an annual rate of 1.75% of the average daily net assets of the Fund. For the fiscal year ended January 31, 2022, the Adviser earned a fee of $229,178 from the Fund before the waivers described below. At January 31, 2022, the Fund owed the Adviser $4,922.
The Adviser has contractually agreed to waive or limit its fees and to assume other expenses of the Fund until May 31, 2022, so that total annual fund operating expenses do not exceed 1.99%. This contractual arrangement may only be terminated by mutual consent of the Adviser and the Board, and it will automatically terminate upon the termination of the investment advisory agreement between the Trust and the Adviser. This operating expense limitation does not apply to: (i) interest, (ii) taxes, (iii) brokerage commissions, (iv) other expenditures which are capitalized in accordance with generally accepted accounting principles, (v) other extraordinary expenses not incurred in the ordinary course of the Fund’s business, (vi) dividend expense on short sales, (vii) expenses incurred under a plan of distribution under Rule 12b-1, and (viii) expenses that the Fund has incurred but did not actually pay because of an expense offset arrangement, if applicable, in any fiscal year. The operating expense limitation also excludes any “Acquired Fund Fees and Expenses,” which are the expenses indirectly incurred by the Fund as a result of investing in money
Belmont Theta Income Fund
Notes to the Financial Statements (continued)
January 31, 2022
market funds or other investment companies, including exchange-traded funds, that have their own expenses.
Each fee waiver or expense reimbursement by the Adviser is subject to repayment by the Fund within the three years following the date the fee waiver or expense reimbursement occurred, provided that the Fund is able to make the repayment without exceeding the expense limitation that is in effect at the time of the repayment or at the time of the fee waiver or expense reimbursement, whichever is lower. For the fiscal year ended January 31, 2022, the Adviser waived fees or reimbursed expenses totaling $153,403. As of January 31, 2022, the Adviser may seek repayment of investment advisory fee waivers and expense reimbursements as follows:
| Recoverable Through | | | | |
| January 31, 2023 | | $ | 140,267 | |
| January 31, 2024 | | | 151,031 | |
| January 31, 2025 | | | 153,403 | |
The Trust retains Ultimus Fund Solutions, LLC (“Ultimus” or “Administrator”) to provide the Fund with administration and compliance (including a chief compliance officer), fund accounting, and transfer agent services, including all regulatory reporting. For the fiscal year ended January 31, 2022, the Administrator earned fees of $42,000 for administration and compliance services, $31,270 for fund accounting services and $12,000 for transfer agent services. At January 31, 2022, the Administrator was owed $7,107 for these services.
The officers and one trustee of the Trust are members of management and/or employees of the Administrator and are not paid by the Trust for services to the Fund. Ultimus Fund Distributors, LLC (the “Distributor”), a wholly-owned subsidiary of Ultimus, acts as the distributor of the Fund’s shares. There were no payments made to the Distributor by the Fund for the fiscal year ended January 31, 2022.
NOTE 5. PURCHASES AND SALES OF SECURITIES
For the fiscal year ended January 31, 2022, there were no purchases or sales of investment securities, other than short-term investments and short-term U.S. government obligations.
Belmont Theta Income Fund
Notes to the Financial Statements (continued)
January 31, 2022
NOTE 6. FEDERAL TAX INFORMATION
At January 31, 2022, the net unrealized appreciation (depreciation) and tax cost of investments, including written options, for tax purposes was as follows:
| Gross unrealized appreciation | | $ | — | |
| Gross unrealized depreciation | | | (29,122 | ) |
| Net unrealized depreciation on investments | | $ | (29,122 | ) |
| Tax cost of investments | | $ | 11,842,176 | |
The difference between book basis and tax basis of unrealized appreciation (depreciation) is primarily attributable to the mark to market adjustments on options contracts.
At January 31, 2022, the components of accumulated earnings (deficit) on a tax basis were as follows:
| Accumulated capital and other losses | | $ | (191,217 | ) |
| Unrealized depreciation on investments | | | (29,122 | ) |
| Total accumulated deficit | | $ | (220,339 | ) |
As of January 31, 2022, the Fund had short-term and long-term capital loss carryforwards of $67,991 and $101,852, respectively. These capital loss carryforwards, which do not expire, may be utilized in future years to offset net realized capital gains, if any, prior to distributing such gains to shareholders.
As of January 31, 2022, the Fund deferred Qualified Late Year Ordinary losses of $21,374. During the fiscal year ended January 31, 2022, the Fund utilized capital loss carryforwards of $513,959.
NOTE 7. COMMITMENTS AND CONTINGENCIES
The Trust indemnifies its officers and Trustees for certain liabilities that may arise from their performance of their duties to the Trust or the Fund. Additionally, in the normal course of business, the Trust enters into contracts that contain a variety of representations and warranties which provide general indemnifications. The Trust’s maximum exposure under these arrangements is unknown, as this would involve future claims that may be made against the Trust that have not yet occurred.
NOTE 8. SUBSEQUENT EVENTS
Management of the Fund has evaluated the need for disclosures and/or adjustments resulting from subsequent events through the date at which these financial statements were issued. Based upon this evaluation, management has determined there were no items requiring adjustment of the financial statements or additional disclosure.
Report of Independent Registered Public Accounting Firm
To the Shareholders of Belmont Theta Income Fund and
Board of Trustees of Valued Advisers Trust
Opinion on the Financial Statements
We have audited the accompanying statement of assets and liabilities, including the schedules of investments and open written option contracts, of Belmont Theta Income Fund (the “Fund”), a series of Valued Advisers Trust, as of January 31, 2022, the related statement of operations for the year then ended, the statements of changes in net assets for each of the two years in the period then ended, the related notes, and the financial highlights for each of the four periods in the period then ended (collectively referred to as the “financial statements”). In our opinion, the financial statements present fairly, in all material respects, the financial position of the Fund as of January 31, 2022, the results of its operations for the year then ended, the changes in net assets for each of the two years in the period then ended, and the financial highlights for each of the four periods in the period then ended, in conformity with accounting principles generally accepted in the United States of America.
Basis for Opinion
These financial statements are the responsibility of the Fund’s management. Our responsibility is to express an opinion on the Fund’s financial statements based on our audits. We are a public accounting firm registered with the Public Company Accounting Oversight Board (United States) (“PCAOB”) and are required to be independent with respect to the Fund in accordance with the U.S. federal securities laws and the applicable rules and regulations of the Securities and Exchange Commission and the PCAOB.
We conducted our audits in accordance with the standards of the PCAOB. Those standards require that we plan and perform the audit to obtain reasonable assurance about whether the financial statements are free of material misstatement whether due to error or fraud.
Our audits included performing procedures to assess the risks of material misstatement of the financial statements, whether due to error or fraud, and performing procedures that respond to those risks. Such procedures included examining, on a test basis, evidence regarding the amounts and disclosures in the financial statements. Our procedures included confirmation of securities owned as of January 31, 2022, by correspondence with the custodian and broker. Our audits also included evaluating the accounting principles used and significant estimates made by management, as well as evaluating the overall presentation of the financial statements. We believe that our audits provide a reasonable basis for our opinion.
We have served as the Fund’s auditor since 2018.
COHEN & COMPANY, LTD.
Cleveland, Ohio
March 25, 2022
Liquidity Risk Management Program (Unaudited)
Valued Advisers Trust has adopted and implemented a written liquidity risk management program as required by Rule 22e-4 (the “Liquidity Rule”) under the Investment Company Act. The program is reasonably designed to assess and manage the Fund’s liquidity risk, taking into consideration, among other factors, the Fund’s investment strategy and the liquidity of its portfolio investments during normal and reasonably foreseeable stressed conditions; its short and long-term cash flow projections; and its cash holdings and access to other funding sources. The Board of Trustees approved the appointment of a Liquidity Administrator Committee, which includes representatives from Belmont Capital, LLC, the Fund’s investment adviser, and Ultimus Fund Solutions, LLC, the Fund’s Administrator. The Liquidity Administrator Committee is responsible for the program’s administration and oversight and for reporting to the Board on at least an annual basis regarding the program’s operation and effectiveness. The Liquidity Administrator Committee updated its assessment of the Fund’s liquidity risk profile, considering additional data gathered during the period June 1, 2020 through May 31, 2021 (the “Review Period”) and the adequacy and effectiveness of the liquidity risk management program’s operations during the Review Period in order to prepare a written report for the Board of Trustees (the “Report”) for consideration at its meeting held on September 1, 2021. The Report noted that during the Review Period the Fund did not experience unusual stress or disruption to its operations related to purchase and redemption activity. It further noted that during the Review Period the Fund held adequate levels of cash and highly liquid investments to meet shareholder redemption activities in accordance with applicable requirements. The Report concluded that (i) the Trust’s liquidity risk management program is reasonably designed to prevent violations of the Liquidity Rule and (ii) the Trust’s liquidity risk management program had been effectively implemented during the Review Period.
Summary of Fund Expenses (Unaudited)
As a shareholder of the Fund, you incur two types of costs: (1) transaction and (2) ongoing costs, including management fees and other Fund expenses. These examples are intended to help you understand your ongoing costs (in dollars) of investing in the Fund and to compare these costs with the ongoing costs of investing in other mutual funds. The example is based on an investment of $1,000 invested at the beginning of the period and held for the entire period from August 1, 2021 through January 31, 2022.
Actual Expenses
The first line of the table below provides information about actual account values and actual expenses. You may use the information in this line, together with the amount you invested, to estimate the expenses that you paid over the period. Simply divide your account value by $1,000 (for example, an $8,600 account value divided by $1,000 = 8.6), then multiply the result by the number in the first line under the heading entitled “Expenses Paid During Period” to estimate the expenses you paid on your account during this period.
Hypothetical Example for Comparison Purposes
The second line of the table below provides information about hypothetical account values and hypothetical expenses based on the Fund’s actual expense ratio and an assumed rate of return of 5% per year before expenses, which is not the Fund’s actual return. The hypothetical account values and expenses may not be used to estimate the actual ending account balance or expenses you paid for the period. You may use this information to compare the ongoing costs of investing in the Fund and other funds. To do so, compare this 5% hypothetical example with the 5% hypothetical examples that appear in the shareholder reports of other funds.
Expenses shown in the table are meant to highlight your ongoing costs only and do not reflect any transactional costs. Therefore, the second line of the table below is useful in comparing ongoing costs only and will not help you determine the relative costs of owning different funds. In addition, if transaction costs were included, your costs would have been higher.
| | | Beginning | | | Ending | | | | | | | |
| | | Account | | | Account | | | Expenses | | | | |
| | | Value | | | Value | | | Paid | | | Annualized | |
| | | August 1, | | | January 31, | | | During | | | Expense | |
| | | 2021 | | | 2022 | | | Period(a) | | | Ratio | |
| Actual | | | 1,000.00 | | | $ | 1,000.50 | | | $ | 10.18 | | | | 2.02 | % |
| Hypothetical(b) | | | 1,000.00 | | | $ | 1,015.02 | | | $ | 10.26 | | | | 2.02 | % |
| (a) | Expenses are equal to the Fund’s annualized expense ratios, multiplied by the average account value over the period, multiplied by 184/365 (to reflect the one-half year period). |
| (b) | Hypothetical assumes 5% annual return before expenses. |
| Trustees and Officers (Unaudited) |
The Board of Trustees supervises the business activities of the Trust. Each Trustee serves as a trustee until termination of the Trust unless the Trustee dies, resigns, retires or is removed.
The following table provides information regarding each of the Independent Trustees.
| Name, Address*, (Age), | Principal Occupation During | |
| Position with Trust**, | Past 5 Years and Other | |
| Term of Position with Trust | Directorships | Other Directorships |
Andrea N. Mullins, 54
Independent Trustee
Since December 2013
Chairperson since
March 2017 | Current: Private investor; Independent Contractor, SWM Advisors (since April 2014). | Trustee, Angel Oak Funds Trust (since February 2019) (5 portfolios); Trustee, Angel Oak Strategic Credit Fund (since February 2019); Trustee, Angel Oak Financial Strategies Income Term Trust (since May 2019); Trustee, Angel Oak Dynamic Financial Strategies Income Term Trust (since June 2020); Trustee, Angel Oak Credit Opportunities Term Trust (since January 2021); Trustee and Audit Committee Chair, Cushing Mutual Funds Trust (since November 2021) (2 portfolios); Trustee and Audit Committee Chair, Cushing MLP & Infrastructure Fund (since November 2021). |
| Trustees and Officers (Unaudited) (continued) |
| Name, Address*, (Age), | Principal Occupation During | |
| Position with Trust**, Term | Past 5 Years and Other | |
| of Position with Trust | Directorships | Other Directorships |
Ira P. Cohen, 63
Independent Trustee
Since June 2010 | Current: Independent financial services consultant (since February 2005); Executive Vice President of Asset Management Services, Recognos Financial (since August 2015). | Trustee and Audit Committee Chairman, Griffin Institutional Access Credit Fund (since January 2017); Trustee and Audit Committee Chairman, Griffin Institutional Real Estate Access Fund (since May 2014); Trustee, Angel Oak Funds Trust (since October 2014) (5 portfolios); Trustee, Chairman, and Nominating and Governance Committee Chairman, Angel Oak Strategic Credit Fund (since December 2017); Trustee, U.S. Fixed Income Trust (since March 2019); Trustee and Chairman, Angel Oak Financial Strategies Income Term Trust (since May 2019); Trustee, Angel Oak Dynamic Financial Strategies Income Term Trust (since June 2020); Trustee, Angel Oak Credit Opportunities Term Trust (since January 2021). |
| * | The address for each Trustee is 225 Pictoria Drive, Suite 450, Cincinnati, Ohio 45246. |
| ** | As of the date of this report, the Trust consists of 15 series. |
The following table provides information regarding the Trustee who is considered an “interested person” of the Trust, as that term is defined under the 1940 Act.
| Name, Address*, (Age), | Principal Occupation During | |
| Position with Trust**, | Past 5 Years and Other | |
| Term of Position with Trust | Directorships | Other Directorships |
Mark J. Seger***, 60
Trustee Since March 2017
Interim President Since December 2021 | Current: Vice Chairman and Co- Founder, Ultimus Fund Solutions, LLC and its subsidiaries (since 1999). | None. |
| * | The address for each Trustee is 225 Pictoria Drive, Suite 450, Cincinnati, Ohio 45246. |
| ** | As of the date of this report, the Trust consists of 15 series. |
| *** | Mr. Seger is considered an “interested person” of the Trust because of his relationship with the Trust’s administrator, transfer agent, and distributor. |
| Trustees and Officers (Unaudited) (continued) |
The following table provides information regarding the Officers of the Trust:
| Name, Address*, (Age), | | |
| Position with Trust**, | Principal Occupation During | |
| Term of Position with Trust | Past 5 Years | Other Directorships |
Mark J. Seger***, 60
Trustee Since March 2017
Interim President
Since December 2021 | Current: Vice Chairman and Co- Founder, Ultimus Fund Solutions, LLC and its subsidiaries (since 1999). | None. |
Kevin J. Patton, 51
Chief Compliance Officer
Since March 2020 | Current: Assistant Vice President, Compliance Officer, Ultimus Fund Solutions, LLC (since January 2020). Previous: Partner and Chief Compliance Officer, Renaissance Investment Management (August 2005 to January 2020). | None. |
Carol J. Highsmith, 57
Vice President Since August
2008 Secretary Since March 2014 | Current: Vice President, Ultimus Fund Solutions, LLC (since December 2015). | None. |
Matt J. Miller, 46
Vice President Since
December 2011 | Current: Assistant Vice President, Relationship Management, Ultimus Fund Solutions, LLC (since December 2015). | None. |
Zachary P. Richmond, 41
Principal Financial Officer
and Treasurer Since
September 2021 | Current: Vice President, Financial Administration, Ultimus Fund Solutions, LLC (since February 2019). Previous: Assistant Vice President, Associate Director of Financial Administration, Ultimus Fund Solutions, LLC (December 2015 to February 2019). | None. |
| Trustees and Officers (Unaudited) (continued) |
| Name, Address*, (Age), | Principal Occupation During | |
| Position with Trust**, Term | Past 5 Years and Other | |
| of Position with Trust | Directorships | Other Directorships |
Stephen L. Preston, 55
AML Officer Since June
2017 | Current: Chief Compliance Officer of Ultimus Fund Distributors, LLC (since June 2011), Vice President, Financial Operations Principal, and Anti- Money Laundering Officer, Ultimus Fund Distributors, LLC (since April 2021), Treasurer, Financial Operations Principal, Chief Compliance Officer, and Anti-Money Laundering Officer, Northern Lights Distributors, LLC (since April 2021). Previous: Chief Compliance Officer, Ultimus Fund Solutions, LLC (June 2011 to August 2019); Chief Compliance Officer, Unified Financial Securities, LLC (April 2018 to December 2019) | None. |
| * | The address for each Officer is 225 Pictoria Drive, Suite 450, Cincinnati, Ohio 45246. |
| ** | As of the date of this report, the Trust consists of 15 series. |
| Other Information (Unaudited) |
The Fund’s Statement of Additional Information (“SAI”) includes additional information about the trustees and is available without charge, upon request. You may call toll-free at (800) 789-1087 to request a copy of the SAI or to make shareholder inquiries.
| Investment Advisory Agreement Approval (Unaudited) |
At a meeting held on December 2-3, 2021, the Board of Trustees (the “Board”) considered the renewal of the Investment Advisory Agreement (the “Belmont Agreement”) between Valued Advisers Trust (the “Trust”) and Belmont Capital, LLC (“Belmont”) with respect to the Belmont Theta Income Fund (the “Belmont Fund”). Belmont provided written information to the Board to assist the Board in its considerations.
Counsel reminded the Trustees of their fiduciary duties and responsibilities as summarized in a memorandum from his firm, including the factors to be considered, and the application of those factors to Belmont and the Belmont Agreement. In assessing these factors and reaching its decision, the Board took into consideration information furnished by Belmont and the Trust’s other service providers for the Board’s review and consideration throughout the year at regular Board meetings, as well as information specifically prepared or presented in connection with the annual renewal process, including: (i) reports regarding the services and support provided to the Belmont Fund by Belmont; (ii) quarterly assessments of the investment performance of the Belmont Fund by personnel of Belmont; (iii) commentary on the reasons for the Belmont Fund’s performance; (iv) presentations by Belmont addressing its investment philosophy, investment strategy, personnel, and operations; (v) compliance and audit reports concerning the Belmont Fund and Belmont; (vi) disclosure information contained in the Trust’s registration statement and Belmont’s Form ADV; and (vii) a memorandum from Counsel, that summarized the fiduciary duties and responsibilities of the Board in reviewing and approving the Belmont Agreement. The Board also requested and received various informational materials including, without limitation: (a) documents containing information about Belmont, including its financial information, a description of personnel and the services it provides to the Belmont Fund; information on Belmont’s investment advice and performance; summaries of the Belmont Fund’s expenses, compliance program, current legal matters, and other general information; (b) comparative expense and performance information for other mutual funds with strategies similar to the Belmont Fund; and (c) the benefits to be realized by Belmont from its relationship with the Belmont Fund. The Board did not identify any particular information that was most relevant to its consideration of the Belmont Agreement and each Trustee may have afforded different weight to the various factors.
1. The nature, extent, and quality of the services to be provided by Belmont. In this regard, the Board considered Belmont’s responsibilities under the Belmont Agreement. The Trustees considered the services being provided by Belmont to the Belmont Fund. The Trustees discussed, among other things: the quality of Belmont’s investment advisory services (including research and recommendations with respect to portfolio securities), its process for formulating investment recommendations and assuring compliance with the Belmont Fund’s investment objectives and limitations, its coordination of services for the Belmont Fund among the Belmont Fund’s service providers, and its efforts to promote the Belmont Fund and grow its assets. The Trustees considered Belmont’s continuity of, and commitment to retain, qualified personnel and Belmont’s commitment to maintain and enhance its resources and systems. The Trustees considered Belmont’s personnel, including the education and experience of the personnel. After considering the foregoing information and further information in the Meeting materials provided by Belmont (including Belmont’s Form ADV), the Board concluded that, in light of all the facts and circumstances, the nature, extent, and quality of the services provided by Belmont were satisfactory and adequate for the Belmont Fund.
2. Investment Performance of the Belmont Fund and Belmont. In considering the investment performance of the Belmont Fund and Belmont, the Trustees compared the performance of the Belmont Fund with the performance of funds in the same Morningstar category, as well as
| Investment Advisory Agreement Approval (Unaudited) |
| (continued) |
with peer group data and the Belmont Fund’s benchmark. The Trustees noted that the Belmont Fund had underperformed compared to its peer group median for the one year, three year, and since inception periods ended September 30, 2021. They observed that the Belmont Fund performed better than its style-specific benchmark for the year-to-date, three year, and since inception periods ended September 30, 2021, but underperformed for the one year period. With regard to its broad market benchmark, they noted that the Belmont Fund performed better for the one year period, and underperformed for the three year and since inception periods. The Trustees observed that the Belmont Fund had outperformed its category average for the year-to-date, one-year, and three year periods ended September 30, 2021, and had underperformed the category median for the period since inception. The Trustees also considered the consistency of Belmont’s management of the Belmont Fund with its investment objective, strategies, and limitations. The Trustees considered the Belmont Fund’s performance relative to the performance of Belmont’s theta overlay program and noted that the performance was very close. They considered Belmont’s explanation regarding the reasons for the small difference, and determined that the explanation was reasonable. After reviewing and discussing the investment performance of the Belmont Fund further, Belmont’s experience managing the Belmont Fund, Belmont’s historical performance, and other relevant factors, the Board concluded, in light of all the facts and circumstances, that the investment performance of the Belmont Fund and Belmont was acceptable.
3. The costs of the services to be provided and profits to be realized by Belmont from the relationship with the Belmont Fund. In considering the costs of services to be provided and the profits to be realized by Belmont from the relationship with the Belmont Fund, the Trustees considered: (1) Belmont’s financial condition; (2) the asset level of the Belmont Fund; (3) the overall expenses of the Belmont Fund; and (4) the nature and frequency of advisory fee payments. The Trustees reviewed information provided by Belmont regarding its profits associated with managing the Belmont Fund. The Trustees also considered potential benefits for Belmont in managing the Belmont Fund. The Trustees then compared the fees and expenses of the Belmont Fund (including the management fee) to other comparable mutual funds. The Trustees observed that the Belmont Fund’s advisory fee was the highest in its Morningstar category, and equal to the highest of its peer group. They also noted that the Belmont Fund’s net expense ratio was above the average and median of its peer group and its Morningstar category, but was below the maximum in both cases. The Trustees considered Belmont’s view that the funds included in the Morningstar category and in the peer group are not comparable to the Belmont Fund, and the Board was satisfied that Belmont had sufficiently differentiated the Belmont Fund from others in the peer group. Based on the foregoing, the Board concluded that the fees to be paid to Belmont by the Belmont Fund and the profits to be realized by Belmont, in light of all the facts and circumstances, were fair and reasonable in relation to the nature and quality of the services provided by Belmont.
4. The extent to which economies of scale would be realized as the Belmont Fund grows and whether advisory fee levels reflect these economies of scale for the benefit of the Belmont Fund’s investors. In this regard, the Board considered the Belmont Fund’s fee arrangements with Belmont. The Board considered that while the management fee remained the same at all asset levels, the Belmont Fund’s shareholders had experienced benefits from the Belmont Fund’s expense limitation arrangement, and that Belmont had agreed to extend that arrangement for another year. They also noted that the Belmont Fund’s shareholders would continue to benefit from the economies of scale under the Trust’s agreements with service providers other than Belmont. In light of the
| Investment Advisory Agreement Approval (Unaudited) |
| (continued) |
foregoing, the Board determined that the Belmont Fund’s fee arrangements, in light of all the facts and circumstances, were fair and reasonable in relation to the nature and quality of the services provided by Belmont.
5. Possible conflicts of interest and benefits to Belmont. In considering Belmont’s practices regarding conflicts of interest, the Trustees evaluated the potential for conflicts of interest and considered such matters as the experience and ability of the advisory personnel assigned to the Belmont Fund; the basis of decisions to buy or sell securities for the Belmont Fund and/or Belmont’s other accounts; and the substance and administration of Belmont’s code of ethics. The Trustees also considered disclosure in the registration statement of the Trust relating to Belmont’s potential conflicts of interest. The Trustees discussed Belmont’s practices for seeking best execution for the Belmont Fund’s portfolio transactions. The Board noted that Belmont does not engage in soft dollar arrangements and has not identified any indirect benefits from its relationship with the Belmont Fund. Based on the foregoing, the Board determined that Belmont’s standards and practices relating to the identification and mitigation of potential conflicts of interest were satisfactory.
After additional consideration of the factors delineated in the memorandum provided by counsel and further discussion among the Board members, the Board determined to approve the continuation of the Belmont Agreement.
| FACTS | WHAT DOES BELMONT THETA INCOME FUND (THE “Fund”) DO WITH YOUR PERSONAL INFORMATION? |
| |
| Why? | Financial companies choose how they share your personal information. Federal law gives consumers the right to limit some but not all sharing. Federal law also requires us to tell you how we collect, share, and protect your personal information. Please read this notice carefully to understand what we do. |
| |
| What? | The types of personal information we collect and share depend on the product or service you have with us. This information can include: |
| | |
| | ■ Social Security number |
| | |
| | ■ account balances and account transactions |
| | |
| | ■ transaction or loss history and purchase history |
| | |
| | ■ checking account information and wire transfer instructions |
| | |
| | When you are no longer our customer, we continue to share your information as described in this notice. |
| |
| How? | All financial companies need to share customers’ personal information to run their everyday business. In the section below, we list the reasons financial companies can share their customers’ personal information; the reasons the Fund chooses to share; and whether you can limit this sharing. |
| Reasons we can share your personal information | Does the Fund share? |
For our everyday business purposes —
such as to process your transactions, maintain your account(s), respond to court orders and legal investigations, or report to credit bureaus | Yes |
For our marketing purposes —
to offer our products and services to you | No |
| For joint marketing with other financial companies | No |
For our affiliates’ everyday business purposes —
information about your transactions and experiences | No |
For our affiliates’ everyday business purposes —
information about your creditworthiness | No |
| For nonaffiliates to market to you | No |
| Questions? | Call (800) 789-1087 |
| Who we are |
| Who is providing this notice? | Belmont Theta Income Fund
Ultimus Fund Distributors, LLC (Distributor)
Ultimus Fund Solutions, LLC (Administrator) |
| What we do |
| How does the Fund protect my personal information? | To protect your personal information from unauthorized access and use, we use security measures that comply with federal law. These measures include computer safeguards and secured files and buildings. Our service providers are held accountable for adhering to strict policies and procedures to prevent any misuse of your nonpublic personal information. |
| How does the Fund collect my personal information? | We collect your personal information, for example, when you ■ open an account or deposit money ■ buy securities from us or sell securities to us ■ make deposits or withdrawals from your account ■ give us your account information ■ make a wire transfer ■ tell us who receives the money ■ tell us where to send the money ■ show your government-issued ID ■ show your driver’s license |
| Why can’t I limit all sharing? | Federal law gives you the right to limit only ■ sharing for affiliates’ everyday business purposes— information about your creditworthiness ■ affiliates from using your information to market to you ■ sharing for nonaffiliates to market to you State laws and individual companies may give you additional rights to limit sharing. |
| Definitions |
| Affiliates | Companies related by common ownership or control. They can be financial and nonfinancial companies. ■ Belmont Capital, LLC d/b/a Belmont Capital GroupTM., the investment adviser to the Fund, could be deemed to be an affiliate. |
| Nonaffiliates | Companies not related by common ownership or control. They can be financial and nonfinancial companies. ■ The Fund does not share your personal information with nonaffiliates so they can market to you |
| Joint marketing | A formal agreement between nonaffiliated financial companies that together market financial products or services to you. ■ The Fund does not jointly market. |
PROXY VOTING
A description of the policies and procedures that the Fund uses to determine how to vote proxies relating to portfolio securities and information regarding how the Fund voted those proxies during the most recent twelve month period ended June 30, are available (1) without charge upon request by calling the Fund at (800) 789-1087 and (2) in Fund documents filed with the Securities and Exchange Commission (“SEC”) on the SEC’s website at www.sec.gov.
TRUSTEES Andrea N. Mullins, Chairperson Ira P. Cohen Mark J. Seger OFFICERS Mark J. Seger, Interim Principal Executive Officer and President Zachary P. Richmond, Principal Financial Officer and Treasurer Kevin J. Patton, Chief Compliance Officer Carol J. Highsmith, Vice President and Secretary INVESTMENT ADVISER Belmont Capital, LLC d/b/a Belmont Capital Group™ 1875 Century Park E., Suite 1780 Los Angeles,CA 90067 DISTRIBUTOR UltimusFund Distributors, LLC 225 PictoriaDrive, Suite 450 Cincinnati, OH 45246 | INDEPENDENT REGISTERED PUBLIC ACCOUNTING FIRM Cohen & Company, Ltd. 1350 Euclid Avenue, Suite 800 Cleveland, OH 44115 LEGAL COUNSEL Troutman Pepper Hamilton Sanders LLP 3000 Two Logan Square 18th and Arch Streets Philadelphia, PA 19103 CUSTODIAN Huntington National Bank 41 South High Street Columbus, OH 43215 ADMINISTRATOR, TRANSFER AGENT AND FUND ACCOUNTANT UltimusFund Solutions, LLC 225 PictoriaDrive, Suite 450 Cincinnati, OH 45246 |
This report is intended only for the information of shareholders or those who have received the Fund’s prospectus which contains information about the Fund’s management fee and expenses. Please read the prospectus carefully before investing.
Distributed by Ultimus Fund Distributors, LLC
Member FINRA/SIPC
BELMONT-AR-22
| |
| |
 |
| |
| |
Channing Capital Management LLC
The Wisdom of Experienced Investing |
| |
| |
| |
| |
| |
| |
| |
| Channing Intrinsic Value Small-Cap Fund |
| |
| Institutional Class - OWLLX |
| |
| Annual Report |
| |
| January 31, 2022 |
| |
| |
| |
| |
| |
| |
| |
| |
| |
| |
| |
| |
| |
| Fund Adviser: |
| Channing Capital Management, LLC |
| 10 S. LaSalle Street, Suite 2401 |
| Chicago, IL 60603 |
| (312) 223-0211 |
| www.channingcapital.com |
| |
| Channing Intrinsic Value Small-Cap Fund |
| Management’s Discussion of Fund Performance |
| (Unaudited) |
| January 31, 2022 |
| |
Channing Intrinsic Value Small-Cap Fund Letter to Shareholders
Dear Fellow Shareholders,
This annual report covers the period June 30, 2021, through January 31, 2022 – the Channing Intrinsic Value Small-Cap Fund’s first fiscal period. The Fund achieved a total return of -2.03% for the fiscal period commencing June 30, 2021, and ending January 31, 2022, outperforming the Russell 2000® Value Index (“Russell 2000 Value”) total return of -4.66%.
This report includes a commentary from the Lead Portfolio Manager, Wendell E. Mackey. You will also find a listing of the portfolio holdings as of January 31, 2022, as well as financial statements and detailed information about the performance and positioning of the Fund.
It was a unique year as investors struggled with challenges of new COVID-19 variants, first Delta and now Omicron, rising inflation, supply chain constraints, a Meme stock craze, and rising interest rates. Despite the challenges, the market continued its upward ascent and once again reached new highs. We believe what occurred in the first half of 2021 is not atypical from past cycles – a low-quality rally. And while these periods do occur, market cycles are typically dominated by investor focus on high quality companies that demonstrate consistent and predictable results. We (and most market practitioners) expect the same for this cycle going forward.
One of the most surprising takeaways from 2021 was the persistent dominance of value over growth. The Russell 2000 Value Index advanced 28.3% in 2021 versus 2.8% for Russell 2000 Growth. Per Steven DeSanctis of Jefferies, this disparity was the largest since 2000. For our Small-Cap Value portfolio, 2021 was a tale of two markets, with the first half of the year being dominated by lower quality stocks, most notably companies with leverage, lower market capitalizations, and lower (in some cases negative) profitability. These factors contributed to a challenging environment for our strategy and were exacerbated by a dovish Federal Reserve who remained on the sidelines as speculative fervor drove markets to favor companies with questionable fundamentals over higher quality, profitable, and well-managed businesses. As we transitioned into the second half of the year, investor appetite shifted to focus on companies with higher return on equities, profitability, and balance sheet integrity – elements that are an integral part of our intrinsic value approach which resulted in our strategy delivering strong outperformance relative to the benchmark through the end of the year. In our view, the speculation witnessed in the beginning of the year was exacerbated by a dovish tone from the Federal Open Market
| Channing Intrinsic Value Small-Cap Fund |
| Management’s Discussion of Fund Performance |
| (Unaudited) (continued) |
| January 31, 2022 |
| |
Committee (“FOMC”) as it continued to stand behind its theory that core inflation was “transitory” and thus remain accommodative. As we moved into the 2nd half of 2021, it became clear to all market participants that inflation would not be transitory as labor shortages impacted wages and supply chain constraints impacted prices. Throughout this period, the FOMC gradually turned more hawkish culminating in the Committee’s decision to double the tapering of its balance sheet in December – this change toward a rising interest rate environment, shifted investor sentiment to favor quality companies thus benefitting our intrinsic value discipline.
In the fourth quarter, many of these issues persisted as investors continued to grapple with COVID-19, vaccine reluctance, virus mutations/outbreaks, and the potential risk of more economically damaging mitigation efforts. While in 2020, COVID-19 risks to the economy were increasing and at an increasing rate, in 2022 and beyond, we firmly believe this risk is decreasing at an increasing rate. Moreover, despite the current outbreak and a record number of cases, the Omicron variant, while more contagious, appears to be less virulent. These factors could potentially hasten the pandemic end as COVID-19 becomes more endemic and businesses and policies adapt to life with the virus, and investors focus on the unfolding “more normal” economic recovery.
The second area of concern for investors has been inflation. In our view, inflation will remain top-of-mind for investors given the more hawkish tone from the Federal Reserve at its December meeting. As expected, the FOMC confirmed it would double the pace of its tapering and signaled three potential rate increases in 2022 as it looks to control inflation and decrease the monetary stimulus the economy needed to emerge from the COVID-19 pandemic. In a rising rate environment, we believe our high-quality approach is well-positioned as the market shifts its focus to companies with high-quality management teams, profitable operations, strong balance sheets, growing free cash flow, and reasonable valuations.
While there are risks that we are continually taking into account as we manage the portfolio for 2022 and beyond, we believe individual stock selection will remain an essential and differentiating attribute. We continue to believe the key elements to navigate the current environment are the improvement in Consumer and CEO confidence coupled with an ongoing recovery fueled by increased vaccination rates and COVID-19 moving into the rear-view mirror. We believe there are a plethora of high-quality, value opportunities within our portfolio and numerous others that are under consideration where there is considerable upside. The key to our intrinsic value strategy is to maintain our discipline as higher-quality companies begin to gain traction and ultimately outperform as the market
| Channing Intrinsic Value Small-Cap Fund |
| Management’s Discussion of Fund Performance |
| (Unaudited) (continued) |
| January 31, 2022 |
| |
matures. Ultimately, the investment team sticking to Channing’s high conviction/high-quality approach to intrinsic value investing will drive portfolio performance over the long term.
The investment team for the Channing Intrinsic Value Small-Cap Fund thanks you for the trust that you have placed in us to manage your assets.
Sincerely,
Wendell Mackey, CFA
Founder, Co-Chief Executive Officer & Chief Investment Officer
| Investment Results (Unaudited) |
| |
Total Returns* as of January 31, 2022
| | Since |
| | Inception |
| | (June 30, |
| | 2021) |
| Channing Intrinsic Value Small-Cap Fund | (2.03)% |
| Russell 2000® Value Index(a) | (4.66)% |
| | |
Total annual operating expenses based on estimated amounts for the current fiscal year, as disclosed in the Channing Intrinsic Value Small-Cap Fund (the “Fund”) prospectus dated May 10, 2021, were 1.11% of average daily net assets (0.95% after fee waivers/expense reimbursements by Channing Capital Management, LLC (the “Adviser”)). The Adviser has contractually agreed to waive or limit its fees and to assume other expenses of the Fund until May 31, 2023, so that total annual fund operating expenses do not exceed 0.95%. This contractual arrangement may only be terminated by mutual consent of the Adviser and the Board of Trustees of Valued Advisers Trust (the “Trust”), and it will automatically terminate upon the termination of the investment advisory agreement between the Trust and the Adviser. This operating expense limitation does not apply to: (i) interest, (ii) taxes, (iii) brokerage commissions, (iv) other expenditures which are capitalized in accordance with generally accepted accounting principles, (v) other extraordinary expenses not incurred in the ordinary course of the Fund’s business, (vi) dividend expense on short sales, (vii) expenses incurred under a plan of distribution under Rule 12b-1, and (viii) expenses that the Fund has incurred but did not actually pay because of an expense offset arrangement, if applicable, in any fiscal year. The operating expense limitation also excludes any “Acquired Fund Fees and Expenses,” which are the expenses indirectly incurred by the Fund as a result of investing in money market funds or other investment companies, including exchange-traded funds, that have their own expenses. Each fee waiver or reimbursement of an expense by the Adviser is subject to repayment by the Fund within the three years following the date on which the fee waiver or expense reimbursement occurred, provided that the Fund is able to make the repayment without exceeding the expense limitation in place at the time of the waiver or reimbursement and the expense limitation in place at the time of the repayment. Additional information pertaining to the Fund’s expense ratios as of January 31, 2022 can be found in the financial highlights.
The performance quoted represents past performance, which does not guarantee future results. The investment return and principal value of an investment will fluctuate so that an investor’s shares, when redeemed, may be worth more or less than their original cost. The returns shown do not reflect deduction of taxes that a shareholder would pay on Fund distributions or the redemption of Fund shares. Current performance of the Fund may be lower or higher than the performance quoted. The Fund’s investment objectives, risks, charges and expenses must be considered carefully before investing. Performance data current to the most recent month end may be obtained by calling (833) 565-1919.
| * | Total returns reflect any change in price per share and assume the reinvestment of all distributions. The Fund’s returns reflect any fee reductions during the applicable periods. If such fee reductions had not occurred, the quoted performance would have been lower. Total returns for periods of less than one year are not annualized. |
| (a) | The Russell 2000® Value Index (“Index”) is a widely recognized unmanaged index of equity prices and is representative of a broader market and range of securities than are found in the Fund’s portfolio. The Index measures the performance of those Russell 2000® Index companies (the 2,000 smallest companies in the Russell 3000® Index (the 3,000 largest U.S. companies based on total |
| Investment Results (Unaudited) (continued) |
| |
market capitalization), which represents approximately 10% of the total market capitalization of the Russell 3000® Index) with lower price-to-book ratios and lower forecasted growth values. Individuals cannot invest directly in an index; however, an individual can invest in exchange-traded funds or other investment vehicles that attempt to track the performance of a benchmark index.
The Fund’s investment objectives, strategies, risks, charges and expenses must be considered carefully before investing. The prospectus contains this and other important information about the Fund and may be obtained by calling (833) 565-1919. Please read it carefully before investing.
The Fund is distributed by Ultimus Fund Distributors, LLC, Member FINRA/SIPC.
| Investment Results (Unaudited) (continued) |
| |
Comparison of the Growth of a $100,000 Investment in the Channing Intrinsic Value Small-Cap Fund and the Russell 2000® Value Index.
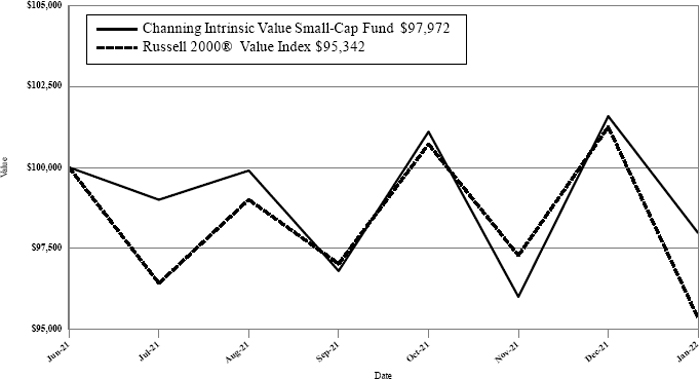
The chart above assumes an initial investment of $100,000 made on June 30, 2021 (commencement of operations) and held through January 31, 2022. THE FUND’S RETURN REPRESENTS PAST PERFORMANCE AND DOES NOT GUARANTEE FUTURE RESULTS. The returns shown do not reflect deduction of taxes that a shareholder would pay on Fund distributions or the redemption of Fund shares. Investment returns and principal values will fluctuate so that your shares, when redeemed, may be worth more or less than their original purchase price.
Current performance may be lower or higher than the performance data quoted. For more information on the Fund, and to obtain performance data current to the most recent month-end, or to request a prospectus, please call (833) 565-1919. You should carefully consider the investment objectives, potential risks, management fees, and charges and expenses of the Fund before investing. The Fund’s prospectus contains this and other information about the Fund and should be read carefully before investing.
The Fund is distributed by Ultimus Fund Distributors, LLC, Member FINRA/SIPC.
| Fund Holdings (Unaudited) |
| |
| Channing Intrinsic Value Small-Cap Fund Holdings as of January 31, 2022* |
| |
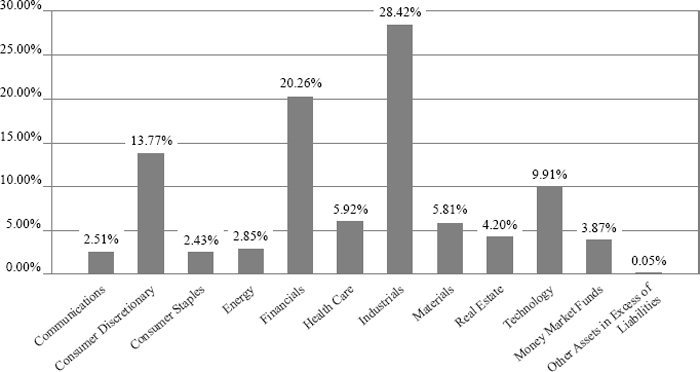
| * | As a percentage of net assets. |
The investment objective of the Fund is long-term capital appreciation.
| Availability of Portfolio Schedule (Unaudited) |
| |
The Fund files its complete schedule of portfolio holdings with the Securities and Exchange Commission (the “SEC”) for the first and third quarters of each fiscal year as an exhibit to its reports on Form N-PORT. The Fund’s Form N-PORT reports are available on the SEC’s website at http:// www.sec.gov and on the Fund’s website at www.channingcapital.com.
| Channing Intrinsic Value Small-Cap Fund |
| Schedule of Investments |
| January 31, 2022 |
| COMMON STOCKS — 96.08% | | Shares | | | Fair Value | |
| Communications — 2.51% | | | | | | | | |
| Gray Television, Inc. | | | 2,246 | | | $ | 46,829 | |
| | | | | | | | | |
| Consumer Discretionary — 13.77% | | | | | | | | |
| Asbury Automotive Group, Inc.(a) | | | 237 | | | | 38,150 | |
| Boyd Gaming Corp.(a) | | | 806 | | | | 47,925 | |
| Callaway Golf Co.(a) | | | 92 | | | | 2,195 | |
| Madison Square Garden Entertainment Corp., Class A(a) | | | 676 | | | | 47,881 | |
| Marriott Vacations Worldwide Corp. | | | 273 | | | | 44,330 | |
| OneSpaWorld Holdings Ltd.(a) | | | 3,370 | | | | 34,778 | |
| PVH Corp. | | | 442 | | | | 41,994 | |
| | | | | | | | 257,253 | |
| Consumer Staples — 2.43% | | | | | | | | |
| Darling Ingredients, Inc.(a) | | | 712 | | | | 45,404 | |
| | | | | | | | | |
| Energy — 2.85% | | | | | | | | |
| PDC Energy, Inc. | | | 898 | | | | 53,224 | |
| | | | | | | | | |
| Financials — 20.26% | | | | | | | | |
| Artisan Partners Asset Management, Inc., Class A | | | 922 | | | | 39,840 | |
| Banner Corp. | | | 886 | | | | 55,029 | |
| Cadence Bank | | | 1,624 | | | | 50,620 | |
| Horace Mann Educators Corp. | | | 777 | | | | 29,534 | |
| Independent Bank Corp. | | | 594 | | | | 50,104 | |
| Pacific Premier Bancorp, Inc. | | | 1,134 | | | | 43,376 | |
| Stifel Financial Corp. | | | 719 | | | | 53,853 | |
| Synovus Financial Corp. | | | 1,127 | | | | 56,080 | |
| | | | | | | | 378,436 | |
| Health Care — 5.92% | | | | | | | | |
| Integer Holdings Corp.(a) | | | 461 | | | | 36,147 | |
| Merit Medical Systems, Inc.(a) | | | 623 | | | | 34,545 | |
| NuVasive, Inc.(a) | | | 766 | | | | 39,840 | |
| | | | | | | | 110,532 | |
| Industrials — 28.42% | | | | | | | | |
| Allegiant Travel Co.(a) | | | 225 | | | | 40,199 | |
| Brink’s Co. (The) | | | 749 | | | | 52,265 | |
| Cactus, Inc., Class A | | | 1,112 | | | | 53,889 | |
| Gibraltar Industries, Inc.(a) | | | 730 | | | | 40,004 | |
| Harsco Corp.(a) | | | 2,490 | | | | 39,093 | |
| Hillenbrand, Inc. | | | 878 | | | | 40,809 | |
| Kennametal, Inc. | | | 1,285 | | | | 44,422 | |
| MSA Safety, Inc. | | | 313 | | | | 43,006 | |
| Regal Rexnord Corp. | | | 302 | | | | 47,861 | |
| SPX Corp.(a) | | | 904 | | | | 47,171 | |
| SPX FLOW, Inc. | | | 525 | | | | 45,255 | |
| Zurn Water Solutions Corp. | | | 1,212 | | | | 37,014 | |
| | | | | | | | 530,988 | |
| Materials — 5.81% | | | | | | | | |
| Allegheny Technologies, Inc.(a) | | | 3,052 | | | | 55,821 | |
| | | | | | | | | |
See accompanying notes which are an integral part of these financial statements.
| Channing Intrinsic Value Small-Cap Fund |
| Schedule of Investments (continued) |
| January 31, 2022 |
| COMMON STOCKS — 96.08% - (continued) | | Shares | | | Fair Value | |
| Materials — 5.81% - continued | | | | | | | | |
| Avient Corp. | | | 1,057 | | | $ | 52,607 | |
| | | | | | | | 108,428 | |
| Real Estate — 4.20% | | | | | | | | |
| Corporate Office Properties Trust | | | 1,613 | | | | 40,744 | |
| Physicians Realty Trust | | | 2,065 | | | | 37,707 | |
| | | | | | | | 78,451 | |
| Technology — 9.91% | | | | | | | | |
| ExlService Holdings, Inc.(a) | | | 23 | | | | 2,772 | |
| FormFactor, Inc.(a) | | | 1,042 | | | | 44,535 | |
| II-VI, Inc.(a) | | | 738 | | | | 46,789 | |
| ManTech International Corp., Class A | | | 548 | | | | 39,587 | |
| MaxLinear, Inc.(a) | | | 856 | | | | 51,378 | |
| | | | | | | | 185,061 | |
| | | | | | | | | |
| Total Common Stocks (Cost $1,807,175) | | | | | | | 1,794,606 | |
| | | | | | | | | |
| MONEY MARKET FUNDS - 3.87% | | | | | | | | |
| First American Treasury Obligations Fund, Class X, 0.01%(b) | | | 72,224 | | | | 72,224 | |
| Total Money Market Funds (Cost $72,224) | | | | | | | 72,224 | |
| Total Investments — 99.95% (Cost $1,879,399) | | | | | | | 1,866,830 | |
| Other Assets in Excess of Liabilities — 0.05% | | | | | | | 950 | |
| NET ASSETS — 100.00% | | | | | | $ | 1,867,780 | |
| | | | | | | | | |
| (a) | Non-income producing security. |
| (b) | Rate disclosed is the seven day effective yield as of January 31, 2022. |
See accompanying notes which are an integral part of these financial statements.
| Channing Intrinsic Value Small-Cap Fund |
| Statement of Assets and Liabilities |
| January 31, 2022 |
| Assets | | | | |
| Investments in securities at fair value (cost $1,879,399) (Note 3) | | $ | 1,866,830 | |
| Receivable for fund shares sold | | | 10,000 | |
| Receivable for investments sold | | | 14,560 | |
| Receivable from Adviser (Note 4) | | | 13,361 | |
| Prepaid expenses | | | 2,294 | |
| Total Assets | | | 1,907,045 | |
| Liabilities | | | | |
| Payable for investments purchased | | | 2,159 | |
| Payable to Administrator (Note 4) | | | 7,090 | |
| Payable to trustees | | | 1,571 | |
| Other accrued expenses | | | 28,445 | |
| Total Liabilities | | | 39,265 | |
| Net Assets | | $ | 1,867,780 | |
| Net Assets consist of: | | | | |
| Paid-in capital | | $ | 1,888,297 | |
| Accumulated deficit | | | (20,517 | ) |
| Net Assets | | $ | 1,867,780 | |
| Shares outstanding (unlimited number of shares authorized, no par value) | | | 191,255 | |
| Net asset value, offering and redemption price per share (Note 2) | | $ | 9.77 | |
See accompanying notes which are an integral part of these financial statements.
| Channing Intrinsic Value Small-Cap Fund |
| Statement of Operations |
| For the period ended January 31, 2022(a) |
| Investment Income | | | | |
| Dividend income | | $ | 10,748 | |
| Total investment income | | | 10,748 | |
| Expenses | | | | |
| Investment Adviser fees (Note 4) | | | 6,178 | |
| Administration, fund accounting and compliance service fees (Note 4) | | | 40,834 | |
| Audit and tax preparation fees | | | 17,000 | |
| Legal fees | | | 11,287 | |
| Transfer agent fees (Note 4) | | | 8,789 | |
| Custodian fees | | | 5,933 | |
| Printing and postage expenses | | | 4,226 | |
| Trustee fees | | | 3,641 | |
| Registration expenses | | | 443 | |
| Miscellaneous expense | | | 15,188 | |
| Total expenses | | | 113,519 | |
| Fees contractually waived and expenses reimbursed by Adviser (Note 4) | | | (105,136 | ) |
| Net operating expenses | | | 8,383 | |
| Net investment income | | | 2,365 | |
| Net Realized and Change in Unrealized Gain (Loss) on Investments | | | | |
| Net realized loss on investment securities transactions | | | (6,707 | ) |
| Net change in unrealized depreciation on investment securities | | | (12,569 | ) |
| Net realized and change in unrealized loss on investments | | | (19,276 | ) |
| Net decrease in net assets resulting from operations | | $ | (16,911 | ) |
| (a) | For the period June 30, 2021 (commencement of operations) to January 31, 2022. |
See accompanying notes which are an integral part of these financial statements.
| Channing Intrinsic Value Small-Cap Fund |
| Statement of Changes in Net Assets |
| | | For the Period | |
| | | Ended January 31, | |
| | | 2022(a) | |
| Increase (Decrease) in Net Assets due to: | | | | |
| Operations | | | | |
| Net investment income | | $ | 2,365 | |
| Net realized loss on investment securities transactions | | | (6,707 | ) |
| Net change in unrealized depreciation of investment securities | | | (12,569 | ) |
| Net decrease in net assets resulting from operations | | | (16,911 | ) |
| Distributions to shareholders from Earnings (Note 2) | | | (4,208 | ) |
| Total distributions | | | (4,208 | ) |
| Capital Transactions - Institutional Class: | | | | |
| Proceeds from shares sold | | | 1,886,000 | |
| Reinvestment of distributions | | | 2,899 | |
| Net increase in net assets resulting from capital transactions | | | 1,888,899 | |
| Total Increase in Net Assets | | | 1,867,780 | |
| Net Assets | | | | |
| Beginning of period | | | — | |
| End of period | | $ | 1,867,780 | |
| Share Transactions - Institutional Class: | | | | |
| Shares sold | | | 190,962 | |
| Shares issued in reinvestment of distributions | | | 293 | |
| Net increase in shares | | | 191,255 | |
| (a) | For the period June 30, 2021 (commencement of operations) to January 31, 2022. |
See accompanying notes which are an integral part of these financial statements.
| Channing Intrinsic Value Small-Cap Fund - Institutional Class |
| Financial Highlights |
| |
| (For a share outstanding during the period) |
| | | For the | |
| | | Period | |
| | | Ended | |
| | | January 31, | |
| | | 2022(a) | |
| Selected Per Share Data: | | | | |
| Net asset value, beginning of period | | $ | 10.00 | |
| Investment operations: | | | | |
| Net investment income | | | 0.02 | |
| Net realized and unrealized loss on investments | | | (0.22) | |
| Total from investment operations | | | (0.20) | |
| Less distributions to shareholders from: | | | | |
| Net investment income | | | (0.03) | |
| Total distributions | | | (0.03) | |
| Net asset value, end of period | | $ | 9.77 | |
| Total Return(b) | | | (2.03 | )% (c) |
| Ratios and Supplemental Data: | | | | |
| Net assets, end of period (000 omitted) | | $ | 1,868 | |
| Ratio of net expenses to average net assets | | | 0.95 | % (d) |
| Ratio of expenses to average net assets before waiver and reimbursement | | | 12.86 | % (d) |
| Ratio of net investment income to average net assets | | | 0.27 | % (d) |
| Portfolio turnover rate | | | 23 | % (c) |
| | | | | |
| (a) | For the period June 30, 2021 (commencement of operations) to January 31, 2022. |
| (b) | Total return represents the rate that the investor would have earned or lost on an investment in the Fund, assuming reinvestment of distributions. |
See accompanying notes which are an integral part of these financial statements.
| Channing Intrinsic Value Small-Cap Fund |
| Notes to the Financial Statements |
| January 31, 2022 |
| |
NOTE 1. ORGANIZATION
The Channing Intrinsic Value Small-Cap Fund (the “Fund”) is registered under the Investment Company Act of 1940, as amended (“1940 Act”), as an open-end diversified series of Valued Advisers Trust (the “Trust”). The Trust is a management investment company established under the laws of Delaware by an Agreement and Declaration of Trust dated June 13, 2008 (the “Trust Agreement”). The Trust Agreement permits the Board of Trustees (the “Board” or “Trustees”) to issue an unlimited number of shares of beneficial interest of separate series without par value. The Fund is one of a series of funds authorized by the Board. The Fund currently offers one class of shares: Institutional Shares. The Fund commenced operations on June 30, 2021. The Fund’s investment adviser is Channing Capital Management, LLC (the “Adviser”). The investment objective of the Fund is long-term capital appreciation.
NOTE 2. SIGNIFICANT ACCOUNTING POLICIES
The Fund is an investment company and follows accounting and reporting guidance under Financial Accounting Standards Board Accounting Standards Codification (“ASC”) Topic 946, “Financial Services-Investment Companies.” The following is a summary of significant accounting policies followed by the Fund in the preparation of its financial statements. These policies are in conformity with generally accepted accounting principles in the United States of America (“GAAP”).
Estimates – The preparation of financial statements in conformity with GAAP requires management to make estimates and assumptions that affect the reported amounts of assets and liabilities and disclosure of contingent assets and liabilities at the date of the financial statements and the reported amounts of increases and decreases in net assets from operations during the reporting period. Actual results could differ from those estimates.
Federal Income Taxes – The Fund makes no provision for federal income or excise tax. The Fund intends to qualify each year as a regulated investment company (“RIC”) under subchapter M of the Internal Revenue Code of 1986, as amended, by complying with the requirements applicable to RICs and by distributing substantially all of its taxable income. The Fund also intends to distribute sufficient net investment income and net realized capital gains, if any, so that it will not be subject to excise tax on undistributed income and gains. If the required amount of net investment income or gains is not distributed, the Fund could incur a tax expense.
As of and during the fiscal period ended January 31, 2022, the Fund did not have any liabilities for any unrecognized tax benefits. The Fund recognizes interest and penalties, if any, related to unrecognized tax benefits as income tax expense on the Statement of Operations when incurred. During the fiscal period ended January 31, 2022, the Fund did
| Channing Intrinsic Value Small-Cap Fund |
| Notes to the Financial Statements (continued) |
| January 31, 2022 |
| |
not incur any interest or penalties. Management of the Fund has reviewed tax positions taken in tax years that remain subject to examination by all major tax jurisdictions, including federal (i.e., the interim tax period since inception, as applicable). Management believes that there is no tax liability resulting from unrecognized tax benefits related to uncertain tax positions taken.
Expenses – Expenses incurred by the Trust that do not relate to a specific fund of the Trust are allocated to the individual funds based on each fund’s relative net assets or another appropriate basis (as determined by the Board).
Security Transactions and Related Income – The Fund follows industry practice and records security transactions on the trade date for financial reporting purposes. The specific identification method is used for determining gains or losses for financial statement and income tax purposes. Dividend income is recorded on the ex-dividend date and interest income is recorded on an accrual basis.
The calendar year end classification of distributions received from REITs during the fiscal year are reported subsequent to year end; accordingly, the Fund estimates the character of REIT distributions based on the most recent information available. Non-cash income, if any, is recorded at the fair market value of the securities received. Withholding taxes on foreign dividends, if any, have been provided for in accordance with the Fund’s understanding of the applicable country’s tax rules and rates.
Dividends and Distributions – The Fund intends to distribute its net investment income and net realized long-term and short-term capital gains, if any, at least annually. Dividends and distributions to shareholders, which are determined in accordance with income tax regulations, are recorded on the ex-dividend date. The treatment for financial reporting purposes of distributions made to shareholders during the period from net investment income or net realized capital gains may differ from their ultimate treatment for federal income tax purposes. These differences are caused primarily by differences in the timing of the recognition of certain components of income, expense or realized capital gain for federal income tax purposes. Where such differences are permanent in nature, they are reclassified among the components of net assets based on their ultimate characterization for federal income tax purposes. Any such reclassifications will have no effect on net assets, results of operations or net asset value (“NAV”) per share of the Fund.
| Channing Intrinsic Value Small-Cap Fund |
| Notes to the Financial Statements (continued) |
| January 31, 2022 |
| |
For the fiscal period ended January 31, 2022, the Fund made the following reclassifications to increase (decrease) the components of net assets:
| | | Accumulated Earnings |
| Paid-In Capital | | (Deficit) |
| $(602) | | $602 |
| | | |
Share Valuation – The NAV is calculated each day the New York Stock Exchange (the “NYSE”) is open by dividing the total value of the Fund’s assets, less liabilities, by the number of shares outstanding for the Fund.
NOTE 3. SECURITIES VALUATION AND FAIR VALUE MEASUREMENTS
The Fund values its portfolio securities at fair value as of the close of regular trading on the NYSE (normally 4:00 p.m. Eastern time) on each business day the NYSE is open for business. Fair value is defined as the price that the Fund would receive upon selling an investment in a timely transaction to an independent buyer in the principal or most advantageous market of the investment. GAAP establishes a three-tier hierarchy to maximize the use of observable market data and minimize the use of unobservable inputs and to establish classification of fair value measurements for disclosure purposes.
Inputs refer broadly to the assumptions that market participants would use in pricing the asset or liability, including assumptions about risk (the risk inherent in a particular valuation technique used to measure fair value including a pricing model and/or the risk inherent in the inputs to the valuation technique). Inputs may be observable or unobservable. Observable inputs are inputs that reflect the assumptions market participants would use in pricing the asset or liability developed based on market data obtained and available from sources independent of the reporting entity. Unobservable inputs are inputs that reflect the reporting entity’s own assumptions about the assumptions market participants would use in pricing the asset or liability developed based on the best information available in the circumstances.
Various inputs are used in determining the value of the Fund’s investments. These inputs are summarized in the three broad levels listed below.
| ● | Level 1 – unadjusted quoted prices in active markets for identical investments and/or registered investment companies where the value per share is determined and published and is the basis for current transactions for identical assets or liabilities at the valuation date |
| ● | Level 2 – other significant observable inputs (including, but not limited to, quoted prices for an identical security in an inactive market, quoted prices for similar securities, interest rates, prepayment speeds, credit risk, etc.) |
| ● | Level 3 – significant unobservable inputs (including the Fund’s own assumptions in determining fair value of investments based on the best information available) |
| Channing Intrinsic Value Small-Cap Fund |
| Notes to the Financial Statements (continued) |
| January 31, 2022 |
| |
The inputs used to measure fair value may fall into different levels of the fair value hierarchy. In such cases, for disclosure purposes, the level in the fair value hierarchy which is reported is determined based on the lowest level input that is significant to the fair value measurement in its entirety.
Equity securities that are traded on any stock exchange are generally valued at the last quoted sale price on the security’s primary exchange. Lacking a last sale price, an exchange-traded security is generally valued at its last bid price. Securities traded in the NASDAQ over-the-counter market are generally valued at the NASDAQ Official Closing Price. When using market quotations and when the market is considered active, the security is classified as a Level 1 security. In the event that market quotations are not readily available or are considered unreliable due to market or other events, the Fund values its securities and other assets at fair value in accordance with policies established by and under the general supervision of the Board. Under these policies, the securities will be classified as Level 2 or 3 within the fair value hierarchy, depending on the inputs used.
Investments in mutual funds, including money market mutual funds, are generally priced at the ending NAV. These securities are categorized as Level 1 securities.
In accordance with the Trust’s valuation policies, the Adviser is required to consider all appropriate factors relevant to the value of securities for which it has determined other pricing sources are not available or reliable as described above. No single method exists for determining fair value, because fair value depends upon the circumstances of each individual case. As a general principle, the current fair value of a security being valued by the Adviser would be the amount that the Fund might reasonably expect to receive upon the current sale. Methods that are in accordance with this principle may, for example, be based on (i) a multiple of earnings; (ii) a discount from market prices of a similar freely traded security (including a derivative security or a basket of securities traded on other markets, exchanges or among dealers); or (iii) yield to maturity with respect to debt issues, or a combination of these and other methods. Fair-value pricing is permitted if, in the Adviser’s opinion, the validity of market quotations appears to be questionable based on factors such as evidence of a thin market in the security based on a small number of quotations, a significant event occurs after the close of a market but before the Fund’s NAV calculation that may affect a security’s value, or the Adviser is aware of any other data that calls into question the reliability of market quotations.
| Channing Intrinsic Value Small-Cap Fund |
| Notes to the Financial Statements (continued) |
| January 31, 2022 |
| |
The following is a summary of the inputs used to value the Fund’s investments as of January 31, 2022:
| Valuation Inputs | |
| Assets | | Level 1 | | | Level 2 | | | Level 3 | | | Total | |
| Common Stocks(a) | | $ | 1,794,606 | | | $ | — | | | $ | — | | | $ | 1,794,606 | |
| Money Market Funds | | | 72,224 | | | | — | | | | — | | | | 72,224 | |
| Total | | $ | 1,866,830 | | | $ | — | | | $ | — | | | $ | 1,866,830 | |
| (a) | Refer to Schedule of Investments for sector classifications. |
The Fund did not hold any investments at the end of the reporting period for which significant unobservable inputs (Level 3) were used in determining fair value; therefore, no reconciliation of Level 3 securities is included for this reporting period.
NOTE 4. FEES AND OTHER TRANSACTIONS WITH AFFILIATES AND OTHER SERVICE PROVIDERS
Under the terms of the investment advisory agreement, on behalf of the Fund (the “Agreement”), the Adviser manages the Fund’s investments subject to oversight of the Board. As compensation for its services, the Fund pays the Adviser a fee, computed and accrued daily and paid monthly at an annual rate of 0.70% of the average daily net assets of the Fund. For the fiscal period ended January 31, 2022, the Adviser earned a fee of $6,178 from the Fund before the waivers and reimbursements described below. At January 31, 2022, the Adviser owed the Fund $13,361.
The Adviser has contractually agreed to waive or limit its fees and to assume other expenses of the Fund until May 31, 2023, so that total annual fund operating expenses do not exceed 0.95%. This contractual arrangement may only be terminated by mutual consent of the Adviser and the Board, and it will automatically terminate upon the termination of the investment advisory agreement between the Trust and the Adviser. This operating expense limitation does not apply to: (i) interest, (ii) taxes, (iii) brokerage commissions, (iv) other expenditures which are capitalized in accordance with GAAP, (v) other extraordinary expenses not incurred in the ordinary course of the Fund’s business, (vi) dividend expense on short sales, (vii) expenses incurred under a plan of distribution under Rule 12b-1, and (viii) expenses that the Fund has incurred but did not actually pay because of an expense offset arrangement, if applicable, in any fiscal year. The operating expense limitation also excludes any “Acquired Fund Fees and Expenses,” which are the expenses indirectly incurred by the Fund as a result of investing in money market funds or other investment companies, including exchange-traded funds, that have their own expenses.
Each fee waiver or expense reimbursement by the Adviser is subject to repayment by the Fund within the three years following the date the fee waiver or expense reimbursement occurred, provided that the Fund is able to make the repayment without exceeding the
| Channing Intrinsic Value Small-Cap Fund |
| Notes to the Financial Statements (continued) |
| January 31, 2022 |
| |
expense limitation that is in effect at the time of the repayment or at the time of the fee waiver or expense reimbursement, whichever is lower. For the fiscal period ended January 31, 2022, the Adviser waived fees or reimbursed expenses totaling $105,136. As of January 31, 2022, the Adviser may seek repayment of investment advisory fee waivers and expense reimbursements as follows:
| Recoverable Through | |
| January 31, 2025 | | $ | 105,136 | |
| | | | | |
The Trust retains Ultimus Fund Solutions, LLC (“Ultimus” or “Administrator”) to provide the Fund with administration, fund accounting, compliance (including a chief compliance officer) and transfer agent services, including all regulatory reporting. For the fiscal period ended January 31, 2022, the Administrator earned fees of $40,834 for administration, fund accounting and compliance services and $8,789 for transfer agent services. At January 31, 2022, the Administrator was owed $7,090 for these services.
The officers and one trustee of the Trust are members of management and/or employees of the Administrator and are not paid by the Trust for services to the Fund. Ultimus Fund Distributors, LLC (the “Distributor”), a wholly-owned subsidiary of Ultimus, acts as the distributor of the Fund’s shares. There were no payments made to the Distributor by the Fund for the fiscal period ended January 31, 2022.
NOTE 5. PURCHASES AND SALES OF SECURITIES
For the fiscal period ended January 31, 2022, purchases and sales of investment securities, other than short-term investments, were $2,171,430 and $356,404, respectively.
There were no purchases or sales of long-term U.S. government obligations during the fiscal period ended January 31, 2022.
NOTE 6. FEDERAL TAX INFORMATION
At January 31, 2022, the net unrealized appreciation (depreciation) and tax cost of investments for tax purposes was as follows:
| Gross unrealized appreciation | | $ | 85,606 | |
| Gross unrealized depreciation | | | (103,452 | ) |
| Net unrealized depreciation on investments | | | (17,846 | ) |
| Tax cost of investments | | $ | 1,884,676 | |
At January 31, 2022, the difference between book basis and tax basis unrealized appreciation (depreciation) is attributable to the tax deferral of losses on wash sales.
| Channing Intrinsic Value Small-Cap Fund |
| Notes to the Financial Statements (continued) |
| January 31, 2022 |
| |
The tax character of distributions paid for the fiscal period ended January 31, 2022 was as follows:
| | | 2022 | |
| Distributions paid from: | | | | |
| Ordinary income(a) | | $ | 4,208 | |
| Total distributions paid | | $ | 4,208 | |
| (a) | Short-term capital gain distributions are treated as ordinary income for tax purposes. |
At January 31, 2022, the components of accumulated earnings (deficit) on a tax basis were as follows:
| Accumulated capital and other losses | | $ | (2,671 | ) |
| Unrealized depreciation on investments | | | (17,846 | ) |
| Total accumulated deficit | | $ | (20,517 | ) |
| | | | | |
As of January 31, 2022, the Fund had short-term capital loss carryforwards of $1,429. These capital loss carryforwards, which do not expire, may be utilized in future years to offset net realized capital gains, if any, prior to distributing such gains to shareholders. As of January 31, 2022, the Fund had deferred Qualified Late Year Ordinary losses of $1,241.
NOTE 7. SECTOR RISK
If the Fund has significant investments in the securities of issuers within a particular sector, any development affecting that sector will have a greater impact on the value of the net assets of the Fund than would be the case if the Fund did not have significant investments in that sector. In addition, this may increase the risk of loss in the Fund and increase the volatility of the Fund’s NAV per share. For instance, economic or market factors, regulatory changes or other developments may negatively impact all companies in a particular sector, and therefore the value of the Fund’s portfolio will be adversely affected. As of January 31, 2022, the Fund had 28.42% of the value of its net assets invested in stocks within the Industrials sector.
NOTE 8. BENEFICIAL OWNERSHIP
The beneficial ownership, either directly or indirectly, of more than 25% of the voting securities of a fund creates a presumption of control of the fund, under Section 2(a) (9) of the 1940 Act. At January 31, 2022, Fasken Limited owned 52.4% of the outstanding shares of the Fund. As a result, Fasken Limited may be deemed to control the Fund.
| Channing Intrinsic Value Small-Cap Fund |
| Notes to the Financial Statements (continued) |
| January 31, 2022 |
| |
NOTE 9. COMMITMENTS AND CONTINGENCIES
The Trust indemnifies its officers and Trustees for certain liabilities that may arise from their performance of their duties to the Trust or the Fund. Additionally, in the normal course of business, the Trust enters into contracts that contain a variety of representations and warranties which provide general indemnifications. The Trust’s maximum exposure under these arrangements is unknown, as this would involve future claims that may be made against the Trust that have not yet occurred.
NOTE 10. SUBSEQUENT EVENTS
Management of the Fund has evaluated the need for disclosures and/or adjustments resulting from subsequent events through the date at which these financial statements were issued. Based upon this evaluation, management has determined there were no items requiring adjustment of the financial statements or additional disclosure.
| Report of Independent Registered Public Accounting Firm |
| |
To the Shareholders of Channing Intrinsic Value Small-Cap Fund
and Board of Trustees of Valued Advisers Trust
Opinion on the Financial Statements
We have audited the accompanying statement of assets and liabilities, including the schedule of investments, of Channing Intrinsic Value Small-Cap Fund (the “Fund”), a series of Valued Advisers Trust, as of January 31, 2022, and the related statements of operations and changes in net assets, the related notes, and the financial highlights for the period June 30, 2021 (commencement of operations) through January 31, 2022 (collectively referred to as the “financial statements”). In our opinion, the financial statements present fairly, in all material respects, the financial position of the Fund as of January 31, 2022, the results of its operations, changes in net assets, and the financial highlights for the period June 30, 2021 (commencement of operations) through January 31, 2022, in conformity with accounting principles generally accepted in the United States of America.
Basis for Opinion
These financial statements are the responsibility of the Fund’s management. Our responsibility is to express an opinion on the Fund’s financial statements based on our audit. We are a public accounting firm registered with the Public Company Accounting Oversight Board (United States) (“PCAOB”) and are required to be independent with respect to the Fund in accordance with the U.S. federal securities laws and the applicable rules and regulations of the Securities and Exchange Commission and the PCAOB.
We conducted our audit in accordance with the standards of the PCAOB. Those standards require that we plan and perform the audit to obtain reasonable assurance about whether the financial statements are free of material misstatement whether due to error or fraud.
Our audit included performing procedures to assess the risks of material misstatement of the financial statements, whether due to error or fraud, and performing procedures that respond to those risks. Such procedures included examining, on a test basis, evidence regarding the amounts and disclosures in the financial statements. Our procedures included confirmation of securities owned as of January 31, 2022, by correspondence with the custodian and brokers; when replies were not received from brokers, we performed other auditing procedures. Our audit also included evaluating the accounting principles used and significant estimates made by management, as well as evaluating the overall presentation of the financial statements. We believe that our audit provides a reasonable basis for our opinion.
We have served as the Fund’s auditor since 2021.
COHEN & COMPANY, LTD.
Cleveland, Ohio
March 25, 2022
| Summary of Fund Expenses (Unaudited) |
| |
As a shareholder of the Fund, you incur two types of costs: (1) transaction and (2) ongoing costs, including management fees and other Fund expenses. These examples are intended to help you understand your ongoing costs (in dollars) of investing in the Fund and to compare these costs with the ongoing costs of investing in other mutual funds. The example is based on an investment of $1,000 invested at the beginning of the period and held for the entire period from August 1, 2021 through January 31, 2022.
Actual Expenses
The first line of the table below provides information about actual account values and actual expenses. You may use the information in this line, together with the amount you invested, to estimate the expenses that you paid over the period. Simply divide your account value by $1,000 (for example, an $8,600 account value divided by $1,000 = 8.6), then multiply the result by the number in the first line under the heading entitled “Expenses Paid During Period” to estimate the expenses you paid on your account during this period.
Hypothetical Example for Comparison Purposes
The second line of the table below provides information about hypothetical account values and hypothetical expenses based on the Fund’s actual expense ratio and an assumed rate of return of 5% per year before expenses, which is not the Fund’s actual return. The hypothetical account values and expenses may not be used to estimate the actual ending account balance or expenses you paid for the period. You may use this information to compare the ongoing costs of investing in the Fund and other funds. To do so, compare this 5% hypothetical example with the 5% hypothetical examples that appear in the shareholder reports of other funds.
Expenses shown in the table are meant to highlight your ongoing costs only and do not reflect any transactional costs. Therefore, the second line of the table below is useful in comparing ongoing costs only and will not help you determine the relative costs of owning different funds. In addition, if transaction costs were included, your costs would have been higher.
| | | Beginning | | | Ending | | | | | | |
| | | Account | | | Account | | | Expenses | | | |
| | | Value | | | Value | | | Paid | | | Annualized |
| | | August 1, | | | January 31, | | | During | | | Expense |
| | | 2021 | | | 2022 | | | Period(a) | | | Ratio |
| Actual | | $ | 1,000.00 | | | $ | 989.60 | | | $ | 4.74 | | | 0.95% |
| Hypothetical(b) | | $ | 1,000.00 | | | $ | 1,020.42 | | | $ | 4.84 | | | 0.95% |
| | | | | | | | | | | | | | | |
| (a) | Expenses are equal to the Fund’s annualized expense ratios, multiplied by the average account value over the period, multiplied by 184/365 (to reflect the one-half year period). |
| (b) | Hypothetical assumes 5% annual return before expenses. |
| Additional Federal Income Tax Information (Unaudited) |
| |
The Form 1099-DIV you receive in January 2023 will show the tax status of all distributions paid to your account in calendar year 2022. Shareholders are advised to consult their own tax adviser with respect to the tax consequences of their investment in the Fund. As required by the Internal Revenue Code and/or regulations, shareholders must be notified regarding the status of qualified dividend income for individuals and the dividends received deduction for corporations.
Qualified Dividend Income. The Fund designates approximately 100% or up to the maximum amount of such dividends allowable pursuant to the Internal Revenue Code, as qualified dividend income eligible for a reduced tax rate.
Qualified Business Income. The Fund designates approximately 0% of its ordinary income dividends, or up to the maximum amount of such dividends allowable pursuant to the Internal Revenue Code, as qualified business income.
Dividends Received Deduction. Corporate shareholders are generally entitled to take the dividends received deduction on the portion of the Fund’s dividend distribution that qualifies under tax law. For the Fund’s calendar year 2022 ordinary income dividends, 100% qualifies for the corporate dividends received deduction.
For the year ended January 31, 2022, the Fund designated $– as long-term capital gain distributions.
| Trustees and Officers (Unaudited) |
The Board of Trustees supervises the business activities of the Trust. Each Trustee serves as a trustee until termination of the Trust unless the Trustee dies, resigns, retires or is removed.
The following table provides information regarding each of the Independent Trustees.
| Name, Address*, (Age), | Principal Occupation During | |
| Position with Trust**, | Past 5 Years and Other | |
| Term of Position with Trust | Directorships | Other Directorships |
Andrea N. Mullins, 54
Independent Trustee
Since December 2013
Chairperson since
March 2017 | Current: Private investor; Independent Contractor, SWM Advisors (since April 2014). | Trustee, Angel Oak Funds Trust (since February 2019) (5 portfolios); Trustee, Angel Oak Strategic Credit Fund (since February 2019); Trustee, Angel Oak Financial Strategies Income Term Trust (since May 2019); Trustee, Angel Oak Dynamic Financial Strategies Income Term Trust (since June 2020); Trustee, Angel Oak Credit Opportunities Term Trust (since January 2021); Trustee and Audit Committee Chair, Cushing Mutual Funds Trust (since November 2021) (2 portfolios); Trustee and Audit Committee Chair, Cushing MLP & Infrastructure Fund (since November 2021). |
| Trustees and Officers (Unaudited) (continued) |
| Name, Address*, (Age), | Principal Occupation During | |
| Position with Trust**, Term | Past 5 Years and Other | |
| of Position with Trust | Directorships | Other Directorships |
Ira P. Cohen, 63
Independent Trustee
Since June 2010 | Current: Independent financial services consultant (since February 2005); Executive Vice President of Asset Management Services, Recognos Financial (since August 2015). | Trustee and Audit Committee Chairman, Griffin Institutional Access Credit Fund (since January 2017); Trustee and Audit Committee Chairman, Griffin Institutional Real Estate Access Fund (since May 2014); Trustee, Angel Oak Funds Trust (since October 2014) (5 portfolios); Trustee, Chairman, and Nominating and Governance Committee Chairman, Angel Oak Strategic Credit Fund (since December 2017); Trustee, U.S. Fixed Income Trust (since March 2019); Trustee and Chairman, Angel Oak Financial Strategies Income Term Trust (since May 2019); Trustee, Angel Oak Dynamic Financial Strategies Income Term Trust (since June 2020); Trustee, Angel Oak Credit Opportunities Term Trust (since January 2021). |
| * | The address for each Trustee is 225 Pictoria Drive, Suite 450, Cincinnati, Ohio 45246. |
| ** | As of the date of this report, the Trust consists of 15 series. |
The following table provides information regarding the Trustee who is considered an “interested person” of the Trust, as that term is defined under the 1940 Act.
| Name, Address*, (Age), | Principal Occupation During | |
| Position with Trust**, | Past 5 Years and Other | |
| Term of Position with Trust | Directorships | Other Directorships |
Mark J. Seger***, 60
Trustee Since March 2017
Interim President
Since December 2021 | Current: Vice Chairman and Co- Founder, Ultimus Fund Solutions, LLC and its subsidiaries (since 1999). | None. |
| * | The address for each Trustee is 225 Pictoria Drive, Suite 450, Cincinnati, Ohio 45246. |
| ** | As of the date of this report, the Trust consists of 15 series. |
| *** | Mr. Seger is considered an “interested person” of the Trust because of his relationship with the Trust’s administrator, transfer agent, and distributor. |
| Trustees and Officers (Unaudited) (continued) |
The following table provides information regarding the Officers of the Trust:
| Name, Address*, (Age), | | |
| Position with Trust**, | Principal Occupation During | |
| Term of Position with Trust | Past 5 Years | Other Directorships |
Mark J. Seger***, 60
Trustee Since March 2017
Interim President
Since December 2021 | Current: Vice Chairman and Co- Founder, Ultimus Fund Solutions, LLC and its subsidiaries (since 1999). | None. |
Kevin J. Patton, 51
Chief Compliance Officer
Since March 2020 | Current: Assistant Vice President, Compliance Officer, Ultimus Fund Solutions, LLC (since January 2020). Previous: Partner and Chief Compliance Officer, Renaissance Investment Management (August 2005 to January 2020). | None. |
Carol J. Highsmith, 57
Vice President Since August
2008
Secretary Since March 2014 | Current: Vice President, Ultimus Fund Solutions, LLC (since December 2015). | None. |
Matt J. Miller, 46
Vice President Since
December 2011 | Current: Assistant Vice President, Relationship Management, Ultimus Fund Solutions, LLC (since December 2015). | None. |
Zachary P. Richmond, 41
Principal Financial Officer
and Treasurer Since
September 2021 | Current: Vice President, Financial Administration, Ultimus Fund Solutions, LLC (since February 2019). Previous: Assistant Vice President, Associate Director of Financial Administration, Ultimus Fund Solutions, LLC (December 2015 to February 2019). | None. |
| Trustees and Officers (Unaudited) (continued) |
| Name, Address*, (Age), | Principal Occupation During | |
| Position with Trust**, Term | Past 5 Years and Other | |
| of Position with Trust | Directorships | Other Directorships |
Stephen L. Preston, 55
AML Officer Since June
2017 | Current: Chief Compliance Officer of Ultimus Fund Distributors, LLC (since June 2011), Vice President, Financial Operations Principal, and Anti- Money Laundering Officer, Ultimus Fund Distributors, LLC (since April 2021), Treasurer, Financial Operations Principal, Chief Compliance Officer, and Anti-Money Laundering Officer, Northern Lights Distributors, LLC (since April 2021). Previous: Chief Compliance Officer, Ultimus Fund Solutions, LLC (June 2011 to August 2019); Chief Compliance Officer, Unified Financial Securities, LLC (April 2018 to December 2019) | None. |
| * | The address for each Officer is 225 Pictoria Drive, Suite 450, Cincinnati, Ohio 45246. |
| ** | As of the date of this report, the Trust consists of 15 series. |
| Other Information (Unaudited) |
The Fund’s Statement of Additional Information (“SAI”) includes additional information about the trustees and is available without charge, upon request. You may call toll-free at (833) 565-1919 to request a copy of the SAI or to make shareholder inquiries.
| FACTS | WHAT DOES CHANNING INTRINSIC VALUE SMALL-CAP FUND (THE “FUND”) DO WITH YOUR PERSONAL INFORMATION? |
| |
| Why? | Financial companies choose how they share your personal information. Federal law gives consumers the right to limit some but not all sharing. Federal law also requires us to tell you how we collect, share, and protect your personal information. Please read this notice carefully to understand what we do. |
| |
| What? | The types of personal information we collect and share depend on the product or service you have with us. This information can include: |
| | |
| | ■ Social Security number |
| | |
| | ■ account balances and account transactions |
| | |
| | ■ transaction or loss history and purchase history |
| | |
| | ■ checking account information and wire transfer instructions |
| | |
| | When you are no longer our customer, we continue to share your information as described in this notice. |
| |
| How? | All financial companies need to share customers’ personal information to run their everyday business. In the section below, we list the reasons financial companies can share their customers’ personal information; the reasons the Fund chooses to share; and whether you can limit this sharing. |
| Reasons we can share your personal information | Does the Fund share? |
For our everyday business purposes —
such as to process your transactions, maintain your account(s), respond to court orders and legal investigations, or report to credit bureaus | Yes |
For our marketing purposes —
to offer our products and services to you | No |
| For joint marketing with other financial companies | No |
For our affiliates’ everyday business purposes —
information about your transactions and experiences | No |
For our affiliates’ everyday business purposes —
information about your creditworthiness | No |
| For nonaffiliates to market to you | No |
| Questions? | Call (833) 565-1919 |
| Who we are |
| Who is providing this notice? | Channing Intrinsic Value Small-Cap Fund
Ultimus Fund Distributors, LLC (Distributor)
Ultimus Fund Solutions, LLC (Administrator) |
| What we do |
| How does the Fund protect my personal information? | To protect your personal information from unauthorized access and use, we use security measures that comply with federal law. These measures include computer safeguards and secured files and buildings. Our service providers are held accountable for adhering to strict policies and procedures to prevent any misuse of your nonpublic personal information. |
| How does the Fund collect my personal information? | We collect your personal information, for example, when you ■ open an account or deposit money ■ buy securities from us or sell securities to us ■ make deposits or withdrawals from your accountinformation ■ give us your account information ■ make a wire transfer ■ tell us who receives the money ■ tell us where to send the money ■ show your government-issued ID ■ show your driver’s license |
| Why can’t I limit all sharing? | Federal law gives you the right to limit only ■ sharing for affiliates’ everyday business purposes— information about your creditworthiness ■ affiliates from using your information to market to you ■ sharing for nonaffiliates to market to you State laws and individual companies may give you additional rights to limit sharing. |
| Definitions |
| Affiliates | Companies related by common ownership or control. They can be financial and nonfinancial companies. ■ Channing Capital Management, LLC the investment adviser to the Fund, could be deemed to be an affiliate. |
| Nonaffiliates | Companies not related by common ownership or control. They can be financial and nonfinancial companies. ■ The Fund does not share your personal information with nonaffiliates so they can market to you |
| Joint marketing | A formal agreement between nonaffiliated financial companies that together market financial products or services to you. ■ The Fund does not jointly market. |
PROXY VOTING
A description of the policies and procedures that the Fund uses to determine how to vote proxies relating to portfolio securities and information regarding how the Fund voted those proxies during the most recent twelve month period ended June 30, are available (1) without charge upon request by calling the Fund at (833) 565-1919 and (2) in Fund documents filed with the Securities and Exchange Commission (“SEC”) on the SEC’s website at www.sec.gov.
TRUSTEES Andrea N. Mullins, Chairperson Ira P. Cohen Mark J. Seger OFFICERS Mark J. Seger, Interim Principal Executive Officer and President Zachary P. Richmond, Principal Financial Officer and Treasurer Kevin J. Patton, Chief Compliance Officer Carol J. Highsmith, Vice President and Secretary INVESTMENT ADVISER Channing Capital Management, LLC 10 S. LaSalle Street, Suite 2401 Chicago, IL 60603 DISTRIBUTOR UltimusFund Distributors, LLC 225 PictoriaDrive, Suite 450 Cincinnati, OH 45246 | INDEPENDENT REGISTERED PUBLIC ACCOUNTING FIRM Cohen & Company, Ltd. 1350 Euclid Avenue, Suite 800 Cleveland, OH 44115 LEGAL COUNSEL Troutman Pepper Hamilton Sanders LLP 3000 Two Logan Square 18th and Arch Streets Philadelphia, PA 19103 CUSTODIAN U.S. Bank, N.A. 425 Walnut Street Cincinnati, OH 45202 ADMINISTRATOR, TRANSFER AGENT AND FUND ACCOUNTANT UltimusFund Solutions, LLC 225 PictoriaDrive, Suite 450 Cincinnati, OH 45246 |
This report is intended only for the information of shareholders or those who have received the Fund’s prospectus which contains information about the Fund’s management fee and expenses. Please read the prospectus carefully before investing.
Distributed by Ultimus Fund Distributors, LLC, Member FINRA/SIPC.
Channing-AR-2022
| |
| |
| |
| |
| |
| |
| |
| |
| |
| |
 |
| |
| |
| |
| |
| |
| |
| |
| |
| |
| |
| Summitry Equity Fund |
| |
| GGEFX |
| |
| |
| |
| |
| |
| Annual Report |
| |
| January 31, 2022 |
| |
| |
| |
| |
| |
| Summitry LLC |
| 919 Hillsdale Boulevard, Suite 150 |
| Foster City, CA 94404 |
| (866) 954-6682 |
| |
| |
| |
| |
| Summitry Equity Fund |
| Management’s Discussion of Fund Performance |
| For The Fiscal Year Ended January 31, 2022 (Unaudited) |
The Summitry Equity Fund (the “Fund”) returned 24.72% for the fiscal year ended January 31, 2022. In comparison, our benchmark, the S&P 500® Index (“S&P 500”)*, returned 23.29% during the same period. Since inception on April 1, 2009, the Fund has returned 419.12% as compared to the 620.35% return of the benchmark.
As we entered 2021, we noted that speculative behavior in the markets was in an uptrend. To address the COVID-19 crisis, the Federal Reserve had flooded the capital markets with liquidity and the Federal government had provided individuals and businesses with large stimulus checks. Both actions fueled a dramatic economic and market recovery and lifted the animal spirits among market participants. Individuals poured money with abandon into stocks, particularly growth and “stay-at-home” stocks, and into ETFs that pursued exciting investment themes. Platforms like Robinhood and Reddit enabled some individuals to engage in generally irrational behavior involving what was dubbed the “meme stocks.” Institutional investors were not to be outdone and poured money into private equity and venture capital at rates never seen previously. According to Crunchbase, venture fundings in the first half of 2021 of nearly $290 billion represented an increase of 61% over the prior peak, and 250 new “unicorns,” defined as private companies with valuations in excess of $1 billion, were minted. We viewed this as a worrisome development but noted that the self-reinforcing nature of the market allows these things to persist for extended periods before the market delivers a wake-up call to remind us that markets are uncaring of those who are careless with their money.
Speculation has always been a two-edged sword. During the year, much of this behavior paid off but we saw instances where the opposite edge of the sword cut deeply. Established companies like DocuSign and PayPal, whose stocks simply got grossly ahead of the fundamentals, suffered massive declines when forced to guide the Street’s expectations down. Growth stock investor Cathy Wood’s flagship ARK Innovation Fund lost -21.8% in 2021 as the forces that helped fuel its ascent—momentum-driven investor fund flows into the ETF—reversed and likely accelerated its decline. Crunchbase’s nine “notable” IPOs of the second quarter of 2021 debuted with a collective market capitalization of $276 billion. As of January 2022, the total market capitalization of this cohort of businesses is about $185 billion, a decline of roughly -33%. The INDXX SPAC & Nextgen IPO Index, which follows the performance of Special Purpose Acquisitions Corporations (“SPACs”), declined by -30% in 2021. Even the stock of Robinhood, ground zero for retail speculation, was down by -53% at year-end from its July 29, 2021, IPO price. These are signs that the speculative balloon is deflating. We should remain watchful, as both the creation and reversal of bubbles is a process that takes time. These events serve as a reminder that investing is not a game and why we feel that we can best serve you by resisting
| Summitry Equity Fund |
| Management’s Discussion of Fund Performance (continued) |
| For The Fiscal Year Ended January 31, 2022 (Unaudited) |
temptation and sticking to our tried-and-true approach to long-term wealth compounding. Not every one of our stocks performed as well as we would have liked, as is always the case, but we believe the businesses we own are sound, their prices are reasonable, and their managements produced real intrinsic value through the year. With this process and with these holdings, we feel that we are poised for further long-term gains.
All of this said, 2021 was a very good year for investors in stocks. The Dow Jones Industrial Average, S&P 500 and NASDAQ Composite indexes rose by 21.0%, 28.7% and 22.2%, respectively, including dividends. The year finished strong, with fourth quarter total returns for the three indexes of 7.9%, 11.0% and 8.5%, respectively. Moreover, market volatility was virtually absent during the year. The largest drawdown in the S&P 500 Index, occurring between September 2nd and October 4th, was only -5.5%. It may be hard to reconcile this notion of calmness in the markets with the previous illustrations of losses suffered by speculators, but we note that IPOs do not register in the S&P 500 Index, and that the winners in this index of 500 stocks more than compensated for the losers. To put this low drawdown statistic in perspective, in the 41 calendar years since 1980, the market has been this “calm” only three times. The average calendar-year drawdown over this period was -14%.
S&P 500 Intra-year Declines vs. Calendar Year Returns
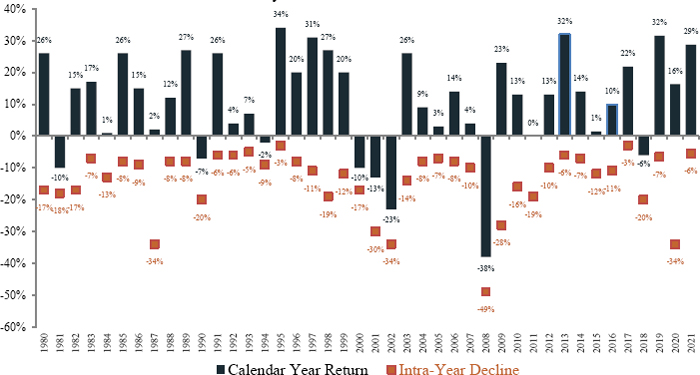
| Summitry Equity Fund |
| Management’s Discussion of Fund Performance (continued) |
| For The Fiscal Year Ended January 31, 2022 (Unaudited) |
We spoke about recency bias in our third-quarter investor call and cautioned that the average retail investor has developed unrealistic expectations about the returns that equity markets can generate over the long-run. The relative calm of markets over the past year reinforces these misguided expectations. Investor complacency helps explain why margin debt at brokerages increased by nearly $200 billion, or 27% versus the prior year and domestic equity ETFs enjoyed over $460 billion in net inflows. We expect that investor return expectations will be tested at some point, and that market volatility will eventually return to its previous averages. After-all, the Federal Reserve’s next move is to tighten, not loosen, monetary policy and the efforts in Congress to further extend government stimulus payments have stalled. Those market tailwinds are gone. Of course, we have no idea the timing of this return to “normal.” Whether the new money that has entered the market via Robinhood will remain invested amid market volatility or will be withdrawn, time will tell. But if history repeats itself, hot money comes and hot money goes. We have been through many of these episodes without changing our tune. Market volatility is never a pleasant experience, but these periods often provide us with our best opportunities to position our accounts for long-term growth. So, rather than fear market volatility, we will accept that it is a normal market dynamic and seek to take advantage of it.
When bull markets are long in the tooth and valuations are generally full, the work gets harder. We remind ourselves that protection is as important as growth when accepting equity market risk. We remember that the stock market is comprised of thousands of individual securities whose long-term paths are tied to the fortunes of the companies of which these securities represent an ownership interest. We need not “play” the markets with the speculators, but rather we can choose where to put our money to work and which securities to avoid. We work hard to understand the opportunity and the risks we face, and we forge ahead deliberately and unemotionally. We hope and expect that this discipline will serve your long-term financial needs.
Bond markets are a traditional safe haven from equity risk, but with interest rates as low as they are today, the tradeoffs are complicated. Bond markets faced some headwinds in 2021 as the benchmark 10-year Treasury yield rose from 0.87% on January 1, 2021, to 1.44% on December 31, 2021. Bond prices move inversely with changes in interest rates. Investment grade credit spreads (the difference in yield demanded by investors for corporate credit risk relative to “risk-free” Treasury securities) fluctuated throughout the year but ended the year roughly where they began. Consequently, the Barclays Aggregate Bond Index, a fair proxy of the broad investment grade bond market, produced a total loss for the year of -1.77%. High-yield bonds fared a little better, fueled by some of the same factors as the stock market. Investors were inclined over the course of the year to accept more risk, so
| Summitry Equity Fund |
| Management’s Discussion of Fund Performance (continued) |
| For The Fiscal Year Ended January 31, 2022 (Unaudited) |
junk bond credit spreads narrowed by about 76 basis points. Treasury Inflation Protected Securities logged positive returns as the threat of inflation increased as the year progressed. The Blackrock iShares TIPS Bond ETF, for example, produced a return of 5.67% in 2021.
During the period, the Fund outperformed on a relative basis primarily due to security selection. From a sector perspective, relative to the benchmark, the portfolio maintained an overweight position in Financials, Communication Services and Consumer Discretionary. Financials, which began the period as our largest sector prior, was also our best performing sector and returned 52.6%. Our top performing stocks were all Financials. Wells Fargo was up 81.9%, Charles Schwab up 73.3%, and Bank of America increased 59.3% for the period. These businesses benefited from the expectations for an improving post-COVID economy and the likelihood that the Federal Reserve would reverse their long-held easy monetary policy and begin to tighten interest rates in the new year. Alphabet ended the period as our largest holding followed by Meta Platforms (formerly Facebook), Berkshire Hathaway, Microsoft, Lowe’s and Fiserv.
From a sector perspective, Health Care and Consumer Discretionary, were our worst performing sectors, though each were produced positive absolute returns. Walt Disney, Ross Stores and Medtronic were our worst performing stocks falling 14.9%, 12.5% and 5.6% respectively during the period. These were the only positions that were negative for the period.
We added the following six (6) new positions to the Fund: Northrop Grumman, Salesforce, Dollar General, Nintendo, Taiwan Semiconductor, and Netflix. During the period we sold the following two (2) positions in their entirety: Fox Corporation and Blackrock.
In addition to the stock and security selection, the advisor’s decision to waive fees and reimburse expenses to the Fund due to the expense limitation cap impacted performance. Had the advisor not waived and reimbursed these expenses, the performance of the Fund would have been lower.
We remain focused on our long-term discipline of investing in high-quality, large-cap businesses that trade at attractive valuations and are confident in our belief that our style of investing is particularly well-suited for the period ahead.
Sincerely,
Summitry, LLC
| Summitry Equity Fund |
| Management’s Discussion of Fund Performance (continued) |
| For The Fiscal Year Ended January 31, 2022 (Unaudited) |
| * | The S&P 500® Index is a widely recognized unmanaged index of equity prices and is representative of a broader market and range of securities than is found in the Fund’s portfolio. Individuals cannot invest directly in the Index; however, an individual can invest in exchange traded funds or other investment vehicles that attempt to track the performance of a benchmark index. |
The views in the foregoing discussion were those of the Fund’s investment advisor as of the date set forth above and may not reflect its views on the date this Annual Report is first published or anytime thereafter. These views are intended to assist shareholders in understanding their investment in the Fund and do not constitute investment advice.
The performance information quoted above represents past performance and past performance does not guarantee future results. Investment return and principal value of an investment will fluctuate so that an investor’s shares, when redeemed, may be worth more or less than their original cost. Current performance may be lower or higher than the performance data quoted. Performance data, current to the most recent month end, may be obtained by calling the Fund at 1-866-954-6682. Fee waivers and expense reimbursements have positively impacted Fund performance. An investor should consider the Fund’s investment objectives, risks, and charges and expenses carefully before investing. The Fund’s Prospectus contains this and other important information. For information on the Fund’s expense ratio, please see the Financial Highlights Table found within the accompanying Annual Report.
Investment Results (Unaudited)
Average Annual Total Returns* as of January 31, 2022
| | One Year | | Five Year | | Ten Year |
| Summitry Equity Fund | 24.72% | | 12.69% | | 12.80% |
| S&P 500® Index(a) | 23.29% | | 16.78% | | 15.43% |
Total annual operating expenses, as disclosed in the most recent Summitry Equity Fund (the “Fund”) prospectus dated May 28, 2021, were 1.36% of the Fund’s average daily net assets (1.26% after fee waivers/expense reimbursements by Summitry LLC (the “Adviser”)). The Adviser has contractually agreed to waive or limit its fees and to assume other expenses of the Fund until May 31, 2022, so that Total Annual Fund Operating Expenses do not exceed 1.25%. This contractual arrangement may only be terminated by mutual consent of the Adviser and the Board of Trustees of Valued Advisers Trust (the “Trust”), and it will automatically terminate upon the termination of the investment advisory agreement between the Trust and the Adviser. This operating expense limitation does not apply to: (i) interest, (ii) taxes, (iii) brokerage commissions, (iv) other expenditures which are capitalized in accordance with generally accepted accounting principles, (v) other extraordinary expenses not incurred in the ordinary course of the Fund’s business, (vi) dividend expense on short sales, (vii) expenses incurred under a plan of distribution under Rule 12b-1, and (viii) expenses that the Fund has incurred but did not actually pay because of an expense offset arrangement, if applicable, incurred by the Fund in any fiscal year. The operating expense limitation also excludes any “Acquired Fund Fees and Expenses,” which are the expenses indirectly incurred by the Fund as a result of investing in money market funds or other investment companies that have their own expenses. Each fee waiver or reimbursement of an expense by the Adviser is subject to repayment by the Fund within the three years following the date on which the fee waiver or expense reimbursement occurred, provided that the Fund is able to make the repayment without exceeding the expense limitation in place at the time of the waiver or reimbursement and the expense limitation in place at the time of the repayment.
The performance quoted represents past performance, which does not guarantee future results. The investment return and principal value of an investment will fluctuate so that an investor’s shares, when redeemed, may be worth more or less than their original cost. The returns shown do not reflect deduction of taxes that a shareholder would pay on Fund distributions or the redemption of Fund shares. Current performance of the Fund may be lower or higher than the performance quoted. Performance data current to the most recent month end may be obtained by calling (866) 954-6682.
| * | Average annual total returns reflect any change in price per share and assume the reinvestment of all distributions. The Fund’s returns reflect any fee reductions during the applicable periods. If such fee reductions had not occurred, the quoted performance would have been lower. Information pertaining to the Fund’s expense ratios as of January 31, 2022 can be found in the financial highlights. |
| (a) | The S&P 500® Index (the “S&P 500”) is a widely recognized unmanaged index of equity securities and is representative of a broader domestic equity market and range of securities than is found in the Fund’s portfolio. Individuals cannot invest directly in the S&P 500; however, an individual can invest in exchange-traded funds or other investment vehicles that attempt to track the performance of a benchmark index. |
The Fund’s investment objectives, strategies, risks, charges and expenses must be considered carefully before investing. The prospectus contains this and other important information about the Fund and may be obtained by calling (866) 954-6682. Please read it carefully before investing.
The Fund is distributed by Ultimus Fund Distributors, LLC, Member FINRA/SIPC.
Investment Results (Unaudited) (continued)
Comparison of the Growth of a $10,000 Investment in the Summitry Equity Fund and the S&P 500® Index.
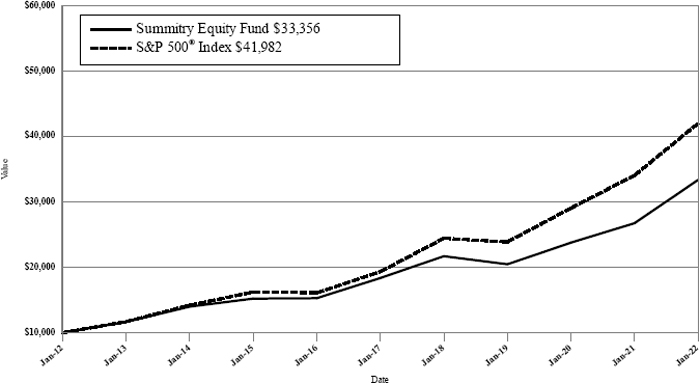
The chart above assumes an initial investment of $10,000 made on January 31, 2012 and held through January 31, 2022. THE FUND’S RETURN REPRESENTS PAST PERFORMANCE AND DOES NOT GUARANTEE FUTURE RESULTS. The returns shown do not reflect deduction of taxes that a shareholder would pay on Fund distributions or the redemption of Fund shares. Investment returns and principal values will fluctuate so that your shares, when redeemed, may be worth more or less than their original purchase price.
Current performance may be lower or higher than the performance data quoted. For more information on the Fund, and to obtain performance data current to the most recent month-end, or to request a prospectus, please call (866) 954-6682. You should carefully consider the investment objectives, potential risks, management fees, and charges and expenses of the Fund before investing. The Fund’s prospectus contains this and other information about the Fund and should be read carefully before investing.
The Fund is distributed by Ultimus Fund Distributors, LLC, Member FINRA/SIPC.
Fund Holdings (Unaudited)
Summitry Equity Fund Holdings as of January 31, 2022*
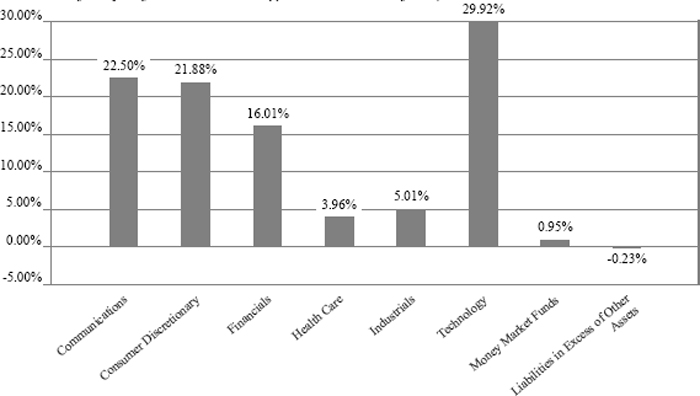
| * | As a percentage of net assets. |
The investment objective of the Fund is to provide long-term capital appreciation. A secondary objective is to provide current income.
Availability of Portfolio Schedule (Unaudited)
The Fund files its complete schedule of portfolio holdings with the Securities and Exchange Commission (the “SEC”) for the first and third quarters of each fiscal year as an exhibit to its reports on Form N-PORT. The Fund’s Form N-PORT reports are available on the SEC’s website at http:// www.sec.gov and on the Fund’s website at www.summitryfunds.com.
| Summitry Equity Fund |
| Schedule of Investments |
| January 31, 2022 |
| COMMON STOCKS — 99.28% | | Shares | | | Fair Value | |
| Communications — 22.50% | | | | | | | | |
| Alphabet, Inc., Class A(a) | | | 2,018 | | | $ | 5,460,848 | |
| Meta Platforms, Inc., Class A(a) | | | 17,010 | | | | 5,328,553 | |
| Netflix, Inc.(a) | | | 5,650 | | | | 2,413,341 | |
| Walt Disney Co. (The)(a) | | | 22,250 | | | | 3,181,083 | |
| | | | | | | 16,383,825 | |
| Consumer Discretionary — 21.88% | | | | | | | | |
| Booking Holdings, Inc.(a) | | | 890 | | | | 2,185,956 | |
| CarMax, Inc.(a) | | | 15,640 | | | | 1,738,699 | |
| Dollar General Corp. | | | 10,710 | | | | 2,232,821 | |
| Lowe’s Companies, Inc. | | | 15,270 | | | | 3,624,334 | |
| Ross Stores, Inc. | | | 29,180 | | | | 2,852,345 | |
| Ulta Beauty, Inc.(a) | | | 9,055 | | | | 3,293,666 | |
| | | | | | | 15,927,821 | |
| Financials — 16.01% | | | | | | | | |
| Bank of America Corp. | | | 30,920 | | | | 1,426,649 | |
| Berkshire Hathaway, Inc., Class B(a) | | | 14,115 | | | | 4,418,277 | |
| Charles Schwab Corp. (The) | | | 23,800 | | | | 2,087,260 | |
| Citigroup, Inc. | | | 26,610 | | | | 1,732,843 | |
| Wells Fargo & Co. | | | 36,975 | | | | 1,989,255 | |
| | | | | | | 11,654,284 | |
| Health Care — 3.96% | | | | | | | | |
| Agilent Technologies, Inc. | | | 9,105 | | | | 1,268,509 | |
| Medtronic PLC | | | 15,630 | | | | 1,617,548 | |
| | | | | | | 2,886,057 | |
| Industrials — 5.01% | | | | | | | | |
| Northrop Grumman Corp. | | | 5,975 | | | | 2,210,152 | |
| W.W. Grainger, Inc. | | | 2,905 | | | | 1,438,295 | |
| | | | | | | 3,648,447 | |
| Technology — 29.92% | | | | | | | | |
| Fiserv, Inc.(a) | | | 33,915 | | | | 3,584,815 | |
| Mastercard, Inc., Class A | | | 8,760 | | | | 3,384,689 | |
| Microsoft Corp. | | | 12,740 | | | | 3,961,886 | |
| Nintendo Co. Ltd. - ADR | | | 34,035 | | | | 2,079,539 | |
| salesforce.com, Inc.(a) | | | 8,645 | | | | 2,011,086 | |
| Taiwan Semiconductor Manufacturing Co. Ltd. - ADR | | | 16,800 | | | | 2,060,184 | |
| Visa, Inc., Class A | | | 14,595 | | | | 3,300,951 | |
| Zebra Technologies Corp., Class A(a) | | | 2,745 | | | | 1,397,534 | |
| | | | | | | | 21,780,684 | |
| | | | | | | | | |
| Total Common Stocks (Cost $42,856,411) | | | | | | | 72,281,118 | |
See accompanying notes which are an integral part of these financial statements.
| Summitry Equity Fund |
| Schedule of Investments (continued) |
| January 31, 2022 |
| MONEY MARKET FUNDS - 0.95% | | Shares | | | Fair Value | |
| Fidelity Investments Money Market Government Portfolio, Institutional Class, 0.01%(b) | | | 692,873 | | | $ | 692,873 | |
| Total Money Market Funds (Cost $692,873) | | | | | | | 692,873 | |
| | | | | | | | | |
| Total Investments — 100.23% (Cost $43,549,284) | | | | | | | 72,973,991 | |
| Liabilities in Excess of Other Assets — (0.23)% | | | | | | | (167,199 | ) |
| NET ASSETS — 100.00% | | | | | | $ | 72,806,792 | |
| (a) | Non-income producing security. |
| (b) | Rate disclosed is the seven day effective yield as of January 31, 2022. |
ADR - American Depositary Receipt
See accompanying notes which are an integral part of these financial statements.
Summitry Equity Fund
Statement of Assets and Liabilities
January 31, 2022
| Assets | | | | |
| Investments in securities at fair value (cost $43,549,284) (Note 3) | | $ | 72,973,991 | |
| Receivable for fund shares sold | | | 5,355 | |
| Dividends receivable | | | 19,142 | |
| Prepaid expenses | | | 7,185 | |
| Total Assets | | | 73,005,673 | |
| Liabilities | | | | |
| Payable for fund shares redeemed | | | 104,809 | |
| Payable to Adviser (Note 4) | | | 55,213 | |
| Payable to Administrator (Note 4) | | | 9,860 | |
| Payable to Trustees | | | 1,785 | |
| Other accrued expenses | | | 27,214 | |
| Total Liabilities | | | 198,881 | |
| Net Assets | | $ | 72,806,792 | |
| Net Assets consist of: | | | | |
| Paid-in capital | | $ | 40,961,647 | |
| Accumulated earnings | | | 31,845,145 | |
| Net Assets | | $ | 72,806,792 | |
| Shares outstanding (unlimited number of shares authorized, no par value) | | | 2,888,318 | |
| Net asset value (“NAV”), offering and redemption price per share (Note 2) | | $ | 25.21 | |
See accompanying notes which are an integral part of these financial statements.
Summitry Equity Fund
Statement of Operations
For the year ended January 31, 2022
| Investment Income | | | | |
| Dividend income (net of foreign taxes withheld of $4,551) | | $ | 472,455 | |
| Total investment income | | | 472,455 | |
| Expenses | | | | |
| Investment Adviser fees (Note 4) | | | 739,268 | |
| Administration and compliance services fees (Note 4) | | | 69,317 | |
| Fund accounting fees (Note 4) | | | 29,483 | |
| Legal fees | | | 24,558 | |
| Transfer agent fees (Note 4) | | | 20,000 | |
| Audit and tax preparation fees | | | 18,460 | |
| Registration expenses | | | 11,818 | |
| Custodian fees | | | 10,888 | |
| Printing and postage expenses | | | 7,865 | |
| Trustee fees | | | 5,803 | |
| Insurance expenses | | | 2,880 | |
| Miscellaneous | | | 27,207 | |
| Total expenses | | | 967,547 | |
| Fees contractually waived by Adviser (Note 4) | | | (43,156 | ) |
| Net operating expenses | | | 924,391 | |
| Net investment loss | | | (451,936 | ) |
| Net Realized and Change in Unrealized Gain (Loss) on Investments | | | | |
| Net realized gain on investment securities transactions | | | 7,682,520 | |
| Net change in unrealized appreciation of investment securities | | | 8,191,603 | |
| Net realized and change in unrealized gain on investments | | | 15,874,123 | |
| Net increase in net assets resulting from operations | | $ | 15,422,187 | |
See accompanying notes which are an integral part of these financial statements.
Summitry Equity Fund
Statements of Changes in Net Assets
| | | For the Year | | | For the Year | |
| | | Ended January 31, | | | Ended January 31, | |
| | | 2022 | | | 2021 | |
| Increase (Decrease) in Net Assets due to: | | | | | | | | |
| Operations | | | | | | | | |
| Net investment loss | | $ | (451,936 | ) | | $ | (206,788 | ) |
| Net realized gain on investment securities transactions | | | 7,682,520 | | | | 195,249 | |
| Net change in unrealized appreciation of investment securities | | | 8,191,603 | | | | 6,693,066 | |
| Net increase in net assets resulting from operations | | | 15,422,187 | | | | 6,681,527 | |
| Distributions to Shareholders (Note 2) | | | | | | | | |
| Earnings | | | (4,860,586 | ) | | | — | |
| Total distributions | | | (4,860,586 | ) | | | — | |
| Capital Transactions | | | | | | | | |
| Proceeds from shares sold | | | 4,775,786 | | | | 4,863,599 | |
| Reinvestment of distributions | | | 4,860,586 | | | | — | |
| Amount paid for shares redeemed | | | (10,711,790 | ) | | | (9,184,617 | ) |
| Net decrease in net assets resulting from capital transactions | | | (1,075,418 | ) | | | (4,321,018 | ) |
| Total Increase in Net Assets | | | 9,486,183 | | | | 2,360,509 | |
| Net Assets | | | | | | | | |
| Beginning of year | | | 63,320,609 | | | | 60,960,100 | |
| End of year | | $ | 72,806,792 | | | $ | 63,320,609 | |
| Share Transactions | | | | | | | | |
| Shares sold | | | 184,360 | | | | 259,176 | |
| Shares issued in reinvestment of distributions | | | 187,958 | | | | — | |
| Shares redeemed | | | (415,272 | ) | | | (504,673 | ) |
| Net decrease in shares outstanding | | | (42,954 | ) | | | (245,497 | ) |
See accompanying notes which are an integral part of these financial statements.
Summitry Equity Fund
Financial Highlights
(For a share outstanding during each year)
| | | For the Years Ended January 31, | |
| | | 2022 | | | 2021 | | | 2020 | | | 2019 | | | 2018 | |
| Selected Per Share Data | | | | | | | | | | | | | | | | | | | | |
| Net asset value, beginning of year | | $ | 21.60 | | | $ | 19.19 | | | $ | 16.97 | | | $ | 19.43 | | | $ | 17.79 | |
| Investment operations: | | | | | | | | | | | | | | | | | | | | |
| Net investment income (loss) | | | (0.16) | | | | (0.07 | ) | | | 0.02 | | | | 0.01 | | | | — | (a) |
| Net realized and unrealized gain (loss) on investments | | | 5.54 | | | | 2.48 | | | | 2.72 | | | | (1.17 | ) | | | 3.13 | |
| Total from investment operations | | | 5.38 | | | | 2.41 | | | | 2.74 | | | | (1.16) | | | | 3.13 | |
| Less distributions to shareholders from: | | | | | | | | | | | | | | | | | | | | |
| Net investment income | | | — | | | | — | | | | (0.03 | ) | | | — | | | | — | |
| Net realized gains | | | (1.77 | ) | | | — | | | | (0.49 | ) | | | (1.30 | ) | | | (1.49 | ) |
| Total distributions | | | (1.77 | ) | | | — | | | | (0.52) | | | | (1.30 | ) | | | (1.49 | ) |
| Net asset value, end of year | | $ | 25.21 | | | $ | 21.60 | | | $ | 19.19 | | | $ | 16.97 | | | $ | 19.43 | |
| Total Return(b) | | | 24.72 | % | | | 12.56 | % | | | 16.15 | % | | | (5.70 | )% | | | 18.18 | % |
| Ratios and Supplemental Data: | | | | | | | | | | | | | | | | | | | | |
| Net assets, end of year (000 omitted) | | $ | 72,807 | | | $ | 63,321 | | | $ | 60,960 | | | $ | 55,046 | | | $ | 62,373 | |
| Ratio of expenses to average net assets after expense waiver | | | 1.25 | % | | | 1.25 | % | | | 1.25 | % | | | 1.25 | % | | | 1.25 | % |
| Ratio of expenses to average net assets before expense waiver | | | 1.31 | % | | | 1.35 | % | | | 1.35 | % | | | 1.35 | % | | | 1.33 | % |
| Ratio of net investment income (loss) to average net assets after expense waiver | | | (0.61 | )% | | | (0.36 | )% | | | 0.11 | % | | | 0.07 | % | | | 0.01 | % |
| Portfolio turnover rate | | | 23.57 | % | | | 23.21 | % | | | 27.62 | % | | | 31.30 | % | | | 22.38 | % |
| | | | | | | | | | | | | | | | | | | | | |
| (a) | Rounds to less than $0.005 per share. |
| (b) | Total return in the above table represents the rate that the investor would have earned or lost on an investment in the Fund, assuming reinvestment of distributions. |
See accompanying notes which are an integral part of these financial statements.
Summitry Equity Fund
Notes to the Financial Statements
January 31, 2022
NOTE 1. ORGANIZATION
The Summitry Equity Fund (the “Fund”) is registered under the Investment Company Act of 1940, as amended (“1940 Act”), as an open-end diversified series of Valued Advisers Trust (the “Trust”), and commenced operations on April 1, 2009. The Trust is a management investment company established under the laws of Delaware by an Agreement and Declaration of Trust dated June 13, 2008 (the “Trust Agreement”). The Trust Agreement permits the Board of Trustees (the “Board” or “Trustees”) to issue an unlimited number of shares of beneficial interest of separate series without par value. The Fund is one of a series of funds authorized by the Board. The Fund’s investment adviser is Summitry LLC (the “Adviser”). The investment objective of the Fund is to provide long-term capital appreciation. A secondary objective is to provide current income.
NOTE 2. SIGNIFICANT ACCOUNTING POLICIES
The Fund is an investment company and follows accounting and reporting guidance under Financial Accounting Standards Board Accounting Standards Codification (“ASC”) Topic 946, “Financial Services-Investment Companies.” The following is a summary of significant accounting policies followed by the Fund in the preparation of its financial statements. These policies are in conformity with generally accepted accounting principles in the United States of America (“GAAP”).
Estimates – The preparation of financial statements in conformity with GAAP requires management to make estimates and assumptions that affect the reported amounts of assets and liabilities and disclosure of contingent assets and liabilities at the date of the financial statements and the reported amounts of increases and decreases in net assets from operations during the reporting period. Actual results could differ from those estimates.
Federal Income Taxes – The Fund makes no provision for federal income or excise tax. The Fund has qualified and intends to qualify each year as a regulated investment company (“RIC”) under subchapter M of the Internal Revenue Code of 1986, as amended, by complying with the requirements applicable to RICs and by distributing substantially all of its taxable income. The Fund also intends to distribute sufficient net investment income and net realized capital gains, if any, so that it will not be subject to excise tax on undistributed income and gains. If the required amount of net investment income or gains is not distributed, the Fund could incur a tax expense.
As of and during the fiscal year ended January 31, 2022, the Fund did not have any liabilities for any unrecognized tax benefits. The Fund recognizes interest and penalties, if any, related to unrecognized tax benefits as income tax expense on the Statement of Operations when incurred. During the fiscal year ended January 31, 2022, the Fund did not incur any interest or penalties. Management of the Fund has reviewed tax positions taken in tax years
Summitry Equity Fund
Notes to the Financial Statements (continued)
January 31, 2022
that remain subject to examination by all major tax jurisdictions, including federal (i.e., the last three tax year ends and the interim tax period since then, as applicable). Management believes that there is no tax liability resulting from unrecognized tax benefits related to uncertain tax positions taken.
Expenses – Expenses incurred by the Trust that do not relate to a specific fund of the Trust are allocated to the individual funds based on each fund’s relative net assets or another appropriate basis (as determined by the Board).
Security Transactions and Related Income – The Fund follows industry practice and records security transactions on the trade date for financial reporting purposes. The specific identification method is used for determining gains or losses for financial statement and income tax purposes. Dividend income is recorded on the ex-dividend date and interest income is recorded on an accrual basis. Non-cash income, if any, is recorded at the fair market value of the securities received. Withholding taxes on foreign dividends, if any, have been provided for in accordance with the Fund’s understanding of the applicable country’s tax rules and rates.
Dividends and Distributions – The Fund intends to distribute its net investment income and net realized long-term and short-term capital gains, if any, at least annually. Dividends and distributions to shareholders, which are determined in accordance with income tax regulations, are recorded on the ex-dividend date. The treatment for financial reporting purposes of distributions made to shareholders during the period from net investment income or net realized capital gains may differ from their ultimate treatment for federal income tax purposes. These differences are caused primarily by differences in the timing of the recognition of certain components of income, expense or realized capital gain for federal income tax purposes. Where such differences are permanent in nature, they are reclassified among the components of net assets based on their ultimate characterization for federal income tax purposes. Any such reclassifications will have no effect on net assets, results of operations or net asset value (“NAV”) per share of the Fund.
For the fiscal year ended January 31, 2022, the Fund made the following reclassifications to increase (decrease) the components of net assets due to net operating losses:
| | | Accumulated Earnings |
| Paid-In Capital | | (Deficit) |
| $(275,077) | | $275,077 |
Share Valuation – The NAV is calculated each day the New York Stock Exchange (the “NYSE”) is open by dividing the total value of the Fund’s assets, less liabilities, by the number of shares outstanding for the Fund.
Summitry Equity Fund
Notes to the Financial Statements (continued)
January 31, 2022
NOTE 3. SECURITIES VALUATION AND FAIR VALUE MEASUREMENTS
The Fund values its portfolio securities at fair value as of the close of regular trading on the NYSE (normally 4:00 p.m. Eastern time) on each business day the NYSE is open for business. Fair value is defined as the price that the Fund would receive upon selling an investment in a timely transaction to an independent buyer in the principal or most advantageous market of the investment. GAAP establishes a three-tier hierarchy to maximize the use of observable market data and minimize the use of unobservable inputs and to establish classification of fair value measurements for disclosure purposes.
Inputs refer broadly to the assumptions that market participants would use in pricing the asset or liability, including assumptions about risk (the risk inherent in a particular valuation technique used to measure fair value including a pricing model and/or the risk inherent in the inputs to the valuation technique). Inputs may be observable or unobservable. Observable inputs are inputs that reflect the assumptions market participants would use in pricing the asset or liability developed based on market data obtained and available from sources independent of the reporting entity. Unobservable inputs are inputs that reflect the reporting entity’s own assumptions about the assumptions market participants would use in pricing the asset or liability developed based on the best information available in the circumstances.
Various inputs are used in determining the value of the Fund’s investments. These inputs are summarized in the three broad levels listed below.
● Level 1 – unadjusted quoted prices in active markets for identical investments and/or registered investment companies where the value per share is determined and published and is the basis for current transactions for identical assets or liabilities at the valuation date
● Level 2 – other significant observable inputs (including, but not limited to, quoted prices for an identical security in an inactive market, quoted prices for similar securities, interest rates, prepayment speeds, credit risk, etc.)
● Level 3 – significant unobservable inputs (including the Fund’s own assumptions in determining fair value of investments based on the best information available)
The inputs used to measure fair value may fall into different levels of the fair value hierarchy. In such cases, for disclosure purposes, the level in the fair value hierarchy which is reported is determined based on the lowest level input that is significant to the fair value measurement in its entirety.
Equity securities that are traded on any stock exchange are generally valued at the last quoted sale price on the security’s primary exchange. Lacking a last sale price, an exchange-
Summitry Equity Fund
Notes to the Financial Statements (continued)
January 31, 2022
traded security is generally valued at its last bid price. Securities traded in the NASDAQ over-the-counter market are generally valued at the NASDAQ Official Closing Price. When using market quotations and when the market is considered active, the security is classified as a Level 1 security. In the event that market quotations are not readily available or are considered unreliable due to market or other events, the Fund values its securities and other assets at fair value in accordance with policies established by and under the general supervision of the Board. Under these policies, the securities will be classified as Level 2 or 3 within the fair value hierarchy, depending on the inputs used.
Investments in mutual funds, including money market mutual funds, are generally priced at the ending NAV. These securities are categorized as Level 1 securities.
In accordance with the Trust’s valuation policies, the Adviser is required to consider all appropriate factors relevant to the value of securities for which it has determined other pricing sources are not available or reliable as described above. No single method exists for determining fair value, because fair value depends upon the circumstances of each individual case. As a general principle, the current fair value of a security being valued by the Adviser would be the amount that the Fund might reasonably expect to receive upon the current sale. Methods that are in accordance with this principle may, for example, be based on (i) a multiple of earnings; (ii) a discount from market prices of a similar freely traded security (including a derivative security or a basket of securities traded on other markets, exchanges or among dealers); or (iii) yield to maturity with respect to debt issues, or a combination of these and other methods. Fair-value pricing is permitted if, in the Adviser’s opinion, the validity of market quotations appears to be questionable based on factors such as evidence of a thin market in the security based on a small number of quotations, a significant event occurs after the close of a market but before the Fund’s NAV calculation that may affect a security’s value, or the Adviser is aware of any other data that calls into question the reliability of market quotations.
The following is a summary of the inputs used to value the Fund’s investments as of January 31, 2022:
| Valuation Inputs |
| Assets | | Level 1 | | | Level 2 | | | Level 3 | | | Total | |
| Common Stocks(a) | | $ | 72,281,118 | | | $ | — | | | $ | — | | | $ | 72,281,118 | |
| Money Market Funds | | | 692,873 | | | | — | | | | — | | | | 692,873 | |
| Total | | $ | 72,973,991 | | | $ | — | | | $ | — | | | $ | 72,973,991 | |
| (a) | Refer to Schedule of Investments for sector classifications. |
The Fund did not hold any investments at the end of the reporting period for which significant unobservable inputs (Level 3) were used in determining fair value; therefore, no reconciliation of Level 3 securities is included for this reporting period.
Summitry Equity Fund
Notes to the Financial Statements (continued)
January 31, 2022
NOTE 4. FEES AND OTHER TRANSACTIONS WITH AFFILIATES AND OTHER SERVICE PROVIDERS
Under the terms of the investment advisory agreement on behalf of the Fund, the Adviser manages the Fund’s investments subject to oversight of the Board. As compensation for its services, the Fund pays the Adviser a fee, computed and accrued daily and paid monthly, at an annual rate of 1.00% of the average daily net assets of the Fund. For the fiscal year ended January 31, 2022, the Adviser earned a fee of $739,268 from the Fund before the waivers described below. At January 31, 2022, the Fund owed the Adviser $55,213.
The Adviser has contractually agreed to waive or limit its fees and to assume certain Fund operating expenses, until May 31, 2022, so that total annual operating expenses do not exceed 1.25%. This contractual arrangement may only be terminated by mutual consent of the Adviser and the Board, and it will automatically terminate upon the termination of the investment advisory agreement between the Trust and the Adviser. This operating expense limitation does not apply to interest, taxes, brokerage commissions, other expenditures which are capitalized in accordance with GAAP, other extraordinary expenses not incurred in the ordinary course of the Fund’s business, dividend expense on short sales, expenses incurred under a plan of distribution under Rule 12b-1, and expenses that the Fund has incurred but did not actually pay because of an expense offset arrangement, if applicable, incurred by the Fund in any fiscal year. The operating expense limitation also excludes any “Acquired Fund Fees and Expenses.” Acquired Fund Fees and Expenses represent the pro rata expense indirectly incurred by the Fund as a result of investing in other investment companies, including exchange-traded funds, closed-end funds and money market funds that have their own expenses. For the fiscal year ended January 31, 2022, the Adviser waived fees of $43,156.
Each fee waiver or expense reimbursement by the Adviser is subject to repayment by the Fund within the three years following the date the fee waiver or expense reimbursement occurred, provided that the Fund is able to make the repayment without exceeding the expense limitation in effect at the time of the waiver or reimbursement and any expense limitation in place at the time of the repayment. This contractual arrangement may only be terminated by mutual consent of the Adviser and the Board, and it will automatically terminate upon the termination of the investment advisory agreement between the Trust and the Adviser. As of January 31, 2022, the Adviser may seek repayment of investment advisory fee waivers and expense reimbursements as follows:
| Recoverable Through | | | | |
| January 31, 2023 | | $ | 58,638 | |
| January 31, 2024 | | | 59,497 | |
| January 31, 2025 | | | 43,156 | |
Summitry Equity Fund
Notes to the Financial Statements (continued)
January 31, 2022
The Trust retains Ultimus Fund Solutions, LLC (“Ultimus” or “Administrator”) to provide the Fund with administration and compliance (including a chief compliance officer), fund accounting, and transfer agent services, including all regulatory reporting. For the fiscal year ended January 31, 2022, the Administrator earned fees of $69,317 for administration and compliance services, $29,483 for fund accounting services and $20,000 for transfer agent services. At January 31, 2022, the Fund owed the Administrator $9,860 for such services.
The officers and one trustee of the Trust are members of management and/or employees of the Administrator and are not paid by the Trust for services to the Fund. Ultimus Fund Distributors, LLC (the “Distributor”), a wholly-owned subsidiary of Ultimus, acts as the distributor of the Fund’s shares. There were no payments made to the Distributor by the Fund for the fiscal year ended January 31, 2022.
The Fund has adopted a Distribution Plan (the “Plan”) pursuant to Rule 12b-1 under the 1940 Act. The Plan provides that the Fund will pay the Distributor and/or any registered securities dealer, financial institution or any other person (the “Recipient”) a shareholder servicing fee of 0.25% of the average daily net assets of the Fund in connection with the promotion and distribution of the Fund’s shares or the provision of personal services to shareholders, including, but not necessarily limited to, advertising, compensation to underwriters, dealers and selling personnel, the printing and mailing of prospectuses to other than current Fund shareholders, the printing and mailing of sales literature and servicing shareholder accounts (“12b-1 Expenses”). The Fund or Distributor may pay all or a portion of these fees to any Recipient who renders assistance in distributing or promoting the sale of shares, or who provides certain shareholder services, pursuant to a written agreement. The Plan is a compensation plan, which means that compensation is provided regardless of 12b-1 Expenses actually incurred. It is anticipated that the Plan will benefit shareholders because an effective sales program typically is necessary in order for the Fund to reach and maintain a sufficient size to achieve efficiently its investment objectives and to realize economies of scale. The Plan is not active and will not be activated prior to May 31, 2022.
NOTE 5. PURCHASES AND SALES OF SECURITIES
For the fiscal year ended January 31, 2022, purchases and sales of investment securities, other than short-term investments, were $16,801,970 and $19,433,246, respectively.
There were no purchases or sales of long-term U.S. government obligations during the fiscal year ended January 31, 2022.
Summitry Equity Fund
Notes to the Financial Statements (continued)
January 31, 2022
NOTE 6. FEDERAL TAX INFORMATION
At January 31, 2022, the net unrealized appreciation (depreciation) and tax cost of investments for tax purposes was as follows:
| Gross unrealized appreciation | | $ | 29,433,671 | |
| Gross unrealized depreciation | | | (8,964 | ) |
| Net unrealized appreciation on investments | | $ | 29,424,707 | |
| Tax cost of investments | | $ | 43,549,284 | |
The tax character of distributions paid for the fiscal years ended January 31, 2022 and January 31, 2021 were as follows:
| Distributions paid from: | | 2022 | | | 2021 | |
| Long-term capital gains | | $ | 4,860,586 | | | $ | — | |
| Total distributions paid | | $ | 4,860,586 | | | $ | — | |
At January 31, 2022, the components of accumulated earnings (deficit) on a tax basis were as follows:
| Undistributed long-term capital gains | | $ | 2,473,193 | |
| Accumulated capital and other losses | | | (52,755 | ) |
| Unrealized appreciation on investments | | | 29,424,707 | |
| Total accumulated earnings | | $ | 31,845,145 | |
As of January 31, 2022, the Fund had deferred Qualified Later Year Ordinary losses of $52,755. During the fiscal year ended January 31, 2022, the Fund utilized capital loss carryforwards of $6,057.
NOTE 7. SECTOR RISK
If the Fund has significant investments in the securities of issuers within a particular sector, any development affecting that sector will have a greater impact on the value of the net assets of the Fund than would be the case if the Fund did not have significant investments in that sector. In addition, this may increase the risk of loss in the Fund and increase the volatility of the Fund’s NAV per share. For instance, economic or market factors, regulatory changes or other developments may negatively impact all companies in a particular sector, and therefore the value of the Fund’s portfolio will be adversely affected. As of January 31, 2022, the Fund had 29.92% of the value of its net assets invested in stocks within the Technology sector.
Summitry Equity Fund
Notes to the Financial Statements (continued)
January 31, 2022
NOTE 8. COMMITMENTS AND CONTINGENCIES
The Trust indemnifies its officers and Trustees for certain liabilities that may arise from their performance of their duties to the Trust or the Fund. Additionally, in the normal course of business, the Trust enters into contracts that contain a variety of representations and warranties which provide general indemnifications. The Trust’s maximum exposure under these arrangements is unknown, as this would involve future claims that may be made against the Trust that have not yet occurred.
NOTE 9. SUBSEQUENT EVENTS
Management of the Fund has evaluated the need for disclosures and/or adjustments resulting from subsequent events through the date at which these financial statements were issued. Based upon this evaluation, management has determined there were no items requiring adjustment of the financial statements or additional disclosure.
Report of Independent Registered Public Accounting Firm
To the Shareholders of Summitry Equity Fund and
Board of Trustees of Valued Advisers Trust
Opinion on the Financial Statements
We have audited the accompanying statement of assets and liabilities, including the schedule of investments, of Summitry Equity Fund (the “Fund”), a series of Valued Advisers Trust, as of January 31, 2022, the related statement of operations for the year then ended, the statements of changes in net assets for each of the two years in the period then ended, the related notes, and the financial highlights for each of the five years in the period then ended (collectively referred to as the “financial statements”). In our opinion, the financial statements present fairly, in all material respects, the financial position of the Fund as of January 31, 2022, the results of its operations for the year then ended, the changes in net assets for each of the two years in the period then ended, and the financial highlights for each of the five years in the period then ended, in conformity with accounting principles generally accepted in the United States of America.
Basis for Opinion
These financial statements are the responsibility of the Fund’s management. Our responsibility is to express an opinion on the Fund’s financial statements based on our audits. We are a public accounting firm registered with the Public Company Accounting Oversight Board (United States) (“PCAOB”) and are required to be independent with respect to the Fund in accordance with the U.S. federal securities laws and the applicable rules and regulations of the Securities and Exchange Commission and the PCAOB.
We conducted our audits in accordance with the standards of the PCAOB. Those standards require that we plan and perform the audit to obtain reasonable assurance about whether the financial statements are free of material misstatement whether due to error or fraud.
Our audits included performing procedures to assess the risks of material misstatement of the financial statements, whether due to error or fraud, and performing procedures that respond to those risks. Such procedures included examining, on a test basis, evidence regarding the amounts and disclosures in the financial statements. Our procedures included confirmation of securities owned as of January 31, 2022, by correspondence with the custodian. Our audits also included evaluating the accounting principles used and significant estimates made by management, as well as evaluating the overall presentation of the financial statements. We believe that our audits provide a reasonable basis for our opinion.
We have served as the Fund’s auditor since 2011.
COHEN & COMPANY, LTD.
Cleveland, Ohio
March 25, 2022
Summary of Fund Expenses (Unaudited)
As a shareholder of the Fund, you incur two types of costs: (1) transaction and (2) ongoing costs, including management fees and other Fund expenses. These examples are intended to help you understand your ongoing costs (in dollars) of investing in the Fund and to compare these costs with the ongoing costs of investing in other mutual funds. The example is based on an investment of $1,000 invested at the beginning of the period and held for the entire period from August 1, 2021 through January 31, 2022.
Actual Expenses
The first line of the table below provides information about actual account values and actual expenses. You may use the information in this line, together with the amount you invested, to estimate the expenses that you paid over the period. Simply divide your account value by $1,000 (for example, an $8,600 account value divided by $1,000 = 8.6), then multiply the result by the number in the first line under the heading entitled “Expenses Paid During Period” to estimate the expenses you paid on your account during this period.
Hypothetical Example for Comparison Purposes
The second line of the table below provides information about hypothetical account values and hypothetical expenses based on the Fund’s actual expense ratio and an assumed rate of return of 5% per year before expenses, which is not the Fund’s actual return. The hypothetical account values and expenses may not be used to estimate the actual ending account balance or expenses you paid for the period. You may use this information to compare the ongoing costs of investing in the Fund and other funds. To do so, compare this 5% hypothetical example with the 5% hypothetical examples that appear in the shareholder reports of other funds.
Expenses shown in the table are meant to highlight your ongoing costs only and do not reflect any transactional costs. Therefore, the second line of the table below is useful in comparing ongoing costs only and will not help you determine the relative costs of owning different funds. In addition, if transaction costs were included, your costs would have been higher.
| | | Beginning | | | Ending | | | | | | | |
| | | Account | | | Account | | | Expenses | | | | |
| | | Value | | | Value | | | Paid | | | Annualized | |
| | | August 1, | | | January 31, | | | During | | | Expense | |
| | | 2021 | | | 2022 | | | Period(a) | | | Ratio | |
| Actual | | $ | 1,000.00 | | | $ | 1,003.40 | | | $ | 6.31 | | | | 1.25 | % |
| Hypothetical(b) | | $ | 1,000.00 | | | $ | 1,018.90 | | | $ | 6.36 | | | | 1.25 | % |
| (a) | Expenses are equal to the Fund’s annualized expense ratios, multiplied by the average account value over the period, multiplied by 184/365 (to reflect the one-half year period). |
| (b) | Hypothetical assumes 5% annual return before expenses. |
Additional Federal Income Tax Information (Unaudited)
The Form 1099-DIV you receive in January 2023 will show the tax status of all distributions paid to your account in calendar year 2022. Shareholders are advised to consult their own tax adviser with respect to the tax consequences of their investment in the Fund. As required by the Internal Revenue Code and/or regulations, shareholders must be notified regarding the status of qualified dividend income for individuals and the dividends received deduction for corporations.
Qualified Dividend Income. The Fund designates approximately 0% or up to the maximum amount of such dividends allowable pursuant to the Internal Revenue Code, as qualified dividend income eligible for a reduced tax rate.
Qualified Business Income. The Fund designates approximately 0% of its ordinary income dividends, or up to the maximum amount of such dividends allowable pursuant to the Internal Revenue Code, as qualified business income.
Dividends Received Deduction. Corporate shareholders are generally entitled to take the dividends received deduction on the portion of the Fund’s dividend distribution that qualifies under tax law. For the Fund’s calendar year 2022 ordinary income dividends, 0% qualifies for the corporate dividends received deduction.
For the year ended January 31, 2022, the Fund designated $4,860,586 as long-term capital gain distributions.
Liquidity Risk Management Program (Unaudited)
Valued Advisers Trust has adopted and implemented a written liquidity risk management program as required by Rule 22e-4 (the “Liquidity Rule”) under the Investment Company Act. The program is reasonably designed to assess and manage the Fund’s liquidity risk, taking into consideration, among other factors, the Fund’s investment strategy and the liquidity of its portfolio investments during normal and reasonably foreseeable stressed conditions; its short and long-term cash flow projections; and its cash holdings and access to other funding sources. The Board of Trustees approved the appointment of a Liquidity Administrator Committee, which includes representatives from Summitry LLC, the Fund’s investment adviser, and Ultimus Fund Solutions, LLC, the Fund’s Administrator. The Liquidity Administrator Committee is responsible for the program’s administration and oversight and for reporting to the Board on at least an annual basis regarding the program’s operation and effectiveness. The Liquidity Administrator Committee updated its assessment of the Fund’s liquidity risk profile, considering additional data gathered during the period June 1, 2020 through May 31, 2021 (the “Review Period”) and the adequacy and effectiveness of the liquidity risk management program’s operations during the Review Period in order to prepare a written report for the Board of Trustees (the “Report”) for consideration at its meeting held on September 1, 2021. The Report noted that during the Review Period the Fund did not experience unusual stress or disruption to its operations related to purchase and redemption activity. It further noted that during the Review Period the Fund held adequate levels of cash and highly liquid investments to meet shareholder redemption activities in accordance with applicable requirements. The Report concluded that (i) the Trust’s liquidity risk management program is reasonably designed to prevent violations of the Liquidity Rule and (ii) the Trust’s liquidity risk management program had been effectively implemented during the Review Period.
Investment Advisory Agreement Approval (Unaudited)
At a meeting held on December 2-3, 2021, the Board of Trustees (the “Board”) considered the renewal of the Investment Advisory Agreement (the “Summitry Agreement”) between Valued Advisers Trust (the “Trust”) and Summitry LLC (“Summitry”) with respect to the Summitry Equity Fund (the “Summitry Fund”). Summitry provided written information to the Board to assist the Board in its considerations.
Counsel reminded the Trustees of their fiduciary duties and responsibilities as summarized in a memorandum from his firm, including the factors to be considered, and the application of those factors to Summitry and the Summitry Agreement. In assessing these factors and reaching its decision, the Board took into consideration information furnished by Summitry and the Trust’s other service providers for the Board’s review and consideration throughout the year, as well as information specifically prepared or presented in connection with the annual renewal process, including: (i) reports regarding the services and support provided to the Summitry Fund by Summitry; (ii) quarterly assessments of the investment performance of the Summitry Fund by personnel of Summitry; (iii) commentary on the reasons for the Summitry Fund’s performance; (iv) presentations by Summitry addressing Summitry’s investment philosophy, investment strategy, personnel, and operations; (v) compliance and audit reports concerning the Summitry Fund and Summitry; (vi) disclosure information contained in the Trust’s registration statement and Summitry’s Form ADV; and (vii) a memorandum from counsel, that summarized the fiduciary duties and responsibilities of the Board in reviewing and approving the Summitry Agreement. The Board also requested and received various informational materials including, without limitation: (a) documents containing information about Summitry, including its financial information, a description of personnel and the services it provides to the Summitry Fund; information on Summitry’s investment advice and performance; summaries of the Summitry Fund’s expenses, compliance program, current legal matters, and other general information; (b) comparative expense and performance information for other mutual funds with strategies similar to the Summitry Fund; and (c) the benefits to be realized by Summitry from its relationship with the Summitry Fund. The Board did not identify any particular information that was most relevant to its consideration of the Summitry Agreement and each Trustee may have afforded different weight to the various Factors.
1. The nature, extent, and quality of the services to be provided by Summitry. In this regard, the Board considered Summitry’s responsibilities under the Summitry Agreement. The Trustees considered the services being provided by Summitry to the Summitry Fund. The Trustees discussed, among other things: the quality of Summitry’s investment advisory services (including research and recommendations with respect to portfolio securities), its process for formulating investment recommendations and assuring compliance with the Summitry Fund’s investment objectives and limitations, its coordination of services for the Summitry Fund among the Summitry Fund’s service providers, and its efforts to promote the Summitry Fund and grow its assets. The Trustees considered Summitry’s continuity of, and commitment to retain, qualified personnel and Summitry’s commitment to maintain and enhance its resources and systems. The Trustees considered Summitry’s personnel, including the education and experience of the personnel. After considering the foregoing information and further information in the Meeting materials provided by Summitry (including Summitry’s Form ADV), the Board concluded that, in light of all the facts and circumstances, the nature, extent, and quality of the services provided by Summitry were satisfactory and adequate for the Summitry Fund.
2. Investment Performance of the Summitry Fund and Summitry. In considering the investment performance of the Summitry Fund and Summitry, the Trustees compared the performance of the Summitry Fund with the performance of funds in the same Morningstar category, as well as
Investment Advisory Agreement Approval (Unaudited) (continued)
with peer group data and the Summitry Fund’s benchmark. The Trustees noted that the Summitry Fund had performed better than its peer group median for the one year period ended September 30, 2021, was equal to the median for the three year and since inception periods, and underperformed for the five year period. They observed that the Summitry Fund performed below its benchmark for the three year, five year, and since inception periods, and outperformed the benchmark for the one year period ended September 30, 2021. The Trustees observed that the Summitry Fund had underperformed compared to its category average and median for the five year, and since inception periods ended September 30, 2021, had performed higher than the average but lower than the median for the three year period, and had performed better than the category average and median for the one year period. The Trustees also considered the consistency of Summitry’s management of the Summitry Fund with its investment objective, strategies, and limitations. The Trustees considered the Summitry Fund’s performance relative to the performance of Summitry’s equity composite and noted that the performance of the Fund was higher for the one year period ended September 30, 2021. They considered Summitry’s explanation regarding the reasons for the difference, and determined that the explanation was reasonable. After reviewing and discussing the investment performance of the Summitry Fund further, Summitry’s experience managing the Summitry Fund, Summitry’s historical performance, and other relevant factors, the Board concluded, in light of all the facts and circumstances, that the investment performance of the Summitry Fund and Summitry was acceptable.
3. The costs of the services to be provided and profits to be realized by Summitry from the relationship with the Summitry Fund. In considering the costs of services to be provided and the profits to be realized by Summitry from the relationship with the Summitry Fund, the Trustees considered: (1) Summitry’s financial condition; (2) the asset level of the Summitry Fund; (3) the overall expenses of the Summitry Fund; and (4) the nature and frequency of advisory fee payments. The Trustees reviewed information provided by Summitry regarding its profits associated with managing the Summitry Fund. The Trustees also considered potential benefits for Summitry in managing the Summitry Fund. The Trustees then compared the fees and expenses of the Summitry Fund (including the management fee) to other comparable mutual funds. The Trustees observed that the Summitry Fund’s advisory fee and net expense ratio were above the average and median of its Morningstar category, but below the maximum in each case. They also noted that the Summitry Fund’s advisory fee and net expense ratio were higher than the average and median of its custom peer group. Based on the foregoing, the Board concluded that the fees to be paid to Summitry by the Summitry Fund and the profits to be realized by Summitry, in light of all the facts and circumstances, were fair and reasonable in relation to the nature and quality of the services provided by Summitry.
4. The extent to which economies of scale would be realized as the Summitry Fund grows and whether advisory fee levels reflect these economies of scale for the benefit of the Summitry Fund’s investors. In this regard, the Board considered the Summitry Fund’s fee arrangements with Summitry. The Board considered that while the management fee remained the same at all asset levels, the Summitry Fund’s shareholders had experienced benefits from the Summitry Fund’s expense limitation arrangement, and that Summitry had agreed to extend that arrangement for another year. They also noted that the Summitry Fund’s shareholders would continue to benefit from the economies of scale under the Trust’s agreements with service providers other than Summitry. In light of the foregoing, the Board determined that the Summitry Fund’s fee arrangements, in light of
Investment Advisory Agreement Approval (Unaudited) (continued)
all the facts and circumstances, were fair and reasonable in relation to the nature and quality of the services provided by Summitry.
5. Possible conflicts of interest and benefits to Summitry. In considering Summitry’s practices regarding conflicts of interest, the Trustees evaluated the potential for conflicts of interest and considered such matters as the experience and ability of the advisory personnel assigned to the Summitry Fund; the basis of decisions to buy or sell securities for the Summitry Fund and/or Summitry’s other accounts; and the substance and administration of Summitry’s code of ethics. The Trustees also considered disclosure in the registration statement of the Trust relating to Summitry’s potential conflicts of interest. The Trustees discussed Summitry’s practices for seeking best execution for the Summitry Fund’s portfolio transactions. In terms of other benefits to Summitry, the Trustees considered Summitry’s perspective that the Summitry Fund provides an investment option for smaller accounts, and that the public nature of the Summitry Fund provides credibility to Summitry’s operations. Based on the foregoing, the Board determined that Summitry’s standards and practices relating to the identification and mitigation of potential conflicts of interest were satisfactory.
After additional consideration of the factors delineated in the memorandum provided by counsel and further discussion among the Board members, the Board determined to approve the continuation of the Summitry Agreement.
| Trustees and Officers (Unaudited) |
The Board of Trustees supervises the business activities of the Trust. Each Trustee serves as a trustee until termination of the Trust unless the Trustee dies, resigns, retires or is removed.
The following table provides information regarding each of the Independent Trustees.
| Name, Address*, (Age), | Principal Occupation During | |
| Position with Trust**, | Past 5 Years and Other | |
| Term of Position with Trust | Directorships | Other Directorships |
Andrea N. Mullins, 54
Independent Trustee
Since December 2013
Chairperson since
March 2017 | Current: Private investor; Independent Contractor, SWM Advisors (since April 2014). | Trustee, Angel Oak Funds Trust (since February 2019) (5 portfolios); Trustee, Angel Oak Strategic Credit Fund (since February 2019); Trustee, Angel Oak Financial Strategies Income Term Trust (since May 2019); Trustee, Angel Oak Dynamic Financial Strategies Income Term Trust (since June 2020); Trustee, Angel Oak Credit Opportunities Term Trust (since January 2021); Trustee and Audit Committee Chair, Cushing Mutual Funds Trust (since November 2021) (2 portfolios); Trustee and Audit Committee Chair, Cushing MLP & Infrastructure Fund (since November 2021). |
| Trustees and Officers (Unaudited) (continued) |
| Name, Address*, (Age), | Principal Occupation During | |
| Position with Trust**, Term | Past 5 Years and Other | |
| of Position with Trust | Directorships | Other Directorships |
Ira P. Cohen, 63
Independent Trustee
Since June 2010 | Current: Independent financial services consultant (since February 2005); Executive Vice President of Asset Management Services, Recognos Financial (since August 2015). | Trustee and Audit Committee Chairman, Griffin Institutional Access Credit Fund (since January 2017); Trustee and Audit Committee Chairman, Griffin Institutional Real Estate Access Fund (since May 2014); Trustee, Angel Oak Funds Trust (since October 2014) (5 portfolios); Trustee, Chairman, and Nominating and Governance Committee Chairman, Angel Oak Strategic Credit Fund (since December 2017); Trustee, U.S. Fixed Income Trust (since March 2019); Trustee and Chairman, Angel Oak Financial Strategies Income Term Trust (since May 2019); Trustee, Angel Oak Dynamic Financial Strategies Income Term Trust (since June 2020); Trustee, Angel Oak Credit Opportunities Term Trust (since January 2021). |
| * | The address for each Trustee is 225 Pictoria Drive, Suite 450, Cincinnati, Ohio 45246. |
| ** | As of the date of this report, the Trust consists of 15 series. |
The following table provides information regarding the Trustee who is considered an “interested person” of the Trust, as that term is defined under the 1940 Act.
| Name, Address*, (Age), | Principal Occupation During | |
| Position with Trust**, | Past 5 Years and Other | |
| Term of Position with Trust | Directorships | Other Directorships |
Mark J. Seger***, 60
Trustee Since March 2017
Interim President
Since December 2021 | Current: Vice Chairman and Co- Founder, Ultimus Fund Solutions, LLC and its subsidiaries (since 1999). | None. |
| * | The address for each Trustee is 225 Pictoria Drive, Suite 450, Cincinnati, Ohio 45246. |
| ** | As of the date of this report, the Trust consists of 15 series. |
| *** | Mr. Seger is considered an “interested person” of the Trust because of his relationship with the Trust’s administrator, transfer agent, and distributor. |
| Trustees and Officers (Unaudited) (continued) |
The following table provides information regarding the Officers of the Trust:
| Name, Address*, (Age), | | |
| Position with Trust**, | Principal Occupation During | |
| Term of Position with Trust | Past 5 Years | Other Directorships |
Mark J. Seger***, 60
Trustee Since March 2017
Interim President
Since December 2021 | Current: Vice Chairman and Co- Founder, Ultimus Fund Solutions, LLC and its subsidiaries (since 1999). | None. |
Kevin J. Patton, 51
Chief Compliance Officer
Since March 2020 | Current: Assistant Vice President, Compliance Officer, Ultimus Fund Solutions, LLC (since January 2020). Previous: Partner and Chief Compliance Officer, Renaissance Investment Management (August 2005 to January 2020). | None. |
Carol J. Highsmith, 57
Vice President Since August
2008
Secretary Since March 2014 | Current: Vice President, Ultimus Fund Solutions, LLC (since December 2015). | None. |
Matt J. Miller, 46
Vice President Since
December 2011 | Current: Assistant Vice President, Relationship Management, Ultimus Fund Solutions, LLC (since December 2015). | None. |
Zachary P. Richmond, 41
Principal Financial Officer
and Treasurer Since
September 2021 | Current: Vice President, Financial Administration, Ultimus Fund Solutions, LLC (since February 2019). Previous: Assistant Vice President, Associate Director of Financial Administration, Ultimus Fund Solutions, LLC (December 2015 to February 2019). | None. |
| Trustees and Officers (Unaudited) (continued) |
| Name, Address*, (Age), | Principal Occupation During | |
| Position with Trust**, Term | Past 5 Years and Other | |
| of Position with Trust | Directorships | Other Directorships |
Stephen L. Preston, 55
AML Officer Since June
2017 | Current: Chief Compliance Officer of Ultimus Fund Distributors, LLC (since June 2011), Vice President, Financial Operations Principal, and Anti- Money Laundering Officer, Ultimus Fund Distributors, LLC (since April 2021), Treasurer, Financial Operations Principal, Chief Compliance Officer, and Anti-Money Laundering Officer, Northern Lights Distributors, LLC (since April 2021). Previous: Chief Compliance Officer, Ultimus Fund Solutions, LLC (June 2011 to August 2019); Chief Compliance Officer, Unified Financial Securities, LLC (April 2018 to December 2019) | None. |
| | | |
| * | The address for each Officer is 225 Pictoria Drive, Suite 450, Cincinnati, Ohio 45246. |
| ** | As of the date of this report, the Trust consists of 15 series. |
| Other Information (Unaudited) |
The Fund’s Statement of Additional Information (“SAI”) includes additional information about the trustees and is available without charge, upon request. You may call toll-free at (866) 954-6682 to request a copy of the SAI or to make shareholder inquiries
| FACTS | WHAT DOES SUMMITRY EQUITY FUND (THE “FUND”) DO WITH YOUR PERSONAL INFORMATION? |
| |
| Why? | Financial companies choose how they share your personal information. Federal law gives consumers the right to limit some but not all sharing. Federal law also requires us to tell you how we collect, share, and protect your personal information. Please read this notice carefully to understand what we do. |
| |
| What? | The types of personal information we collect and share depend on the product or service you have with us. This information can include: |
| | |
| | ■ Social Security number |
| | |
| | ■ account balances and account transactions |
| | |
| | ■ transaction or loss history and purchase history |
| | |
| | ■ checking account information and wire transfer instructions |
| | |
| | When you are no longer our customer, we continue to share your information as described in this notice. |
| |
| How? | All financial companies need to share customers’ personal information to run their everyday business. In the section below, we list the reasons financial companies can share their customers’ personal information; the reasons the Fund chooses to share; and whether you can limit this sharing. |
| Reasons we can share your personal information | Does the Fund share? |
For our everyday business purposes —
such as to process your transactions, maintain your account(s), respond to court orders and legal investigations, or report to credit bureaus | Yes |
For our marketing purposes —
to offer our products and services to you | No |
| For joint marketing with other financial companies | No |
For our affiliates’ everyday business purposes —
information about your transactions and experiences | No |
For our affiliates’ everyday business purposes —
information about your creditworthiness | No |
| For nonaffiliates to market to you | No |
| Questions? | Call (866) 954-6682 |
| Who we are |
| Who is providing this notice? | Summitry Equity Fund
Ultimus Fund Distributors, LLC (Distributor)
Ultimus Fund Solutions, LLC (Administrator) |
| What we do |
| How does the Fund protect my personal information? | To protect your personal information from unauthorized access and use, we use security measures that comply with federal law. These measures include computer safeguards and secured files and buildings. Our service providers are held accountable for adhering to strict policies and procedures to prevent any misuse of your nonpublic personal information. |
| How does the Fund collect my personal information? | We collect your personal information, for example, when you ■ open an account or deposit money ■ buy securities from us or sell securities to us ■ make deposits or withdrawals from your account ■ give us your account information ■ make a wire transfer ■ tell us who receives the money ■ tell us where to send the money ■ show your government-issued ID ■ show your driver’s license |
| Why can’t I limit all sharing? | Federal law gives you the right to limit only ■ sharing for affiliates’ everyday business purposes— information about your creditworthiness ■ affiliates from using your information to market to you ■ sharing for nonaffiliates to market to you State laws and individual companies may give you additional rights to limit sharing. |
| Definitions |
| Affiliates | Companies related by common ownership or control. They can be financial and nonfinancial companies. ■ Summitry LLC, the investment adviser to the Fund, could be deemed to be an affiliate. |
| Nonaffiliates | Companies not related by common ownership or control. They can be financial and nonfinancial companies. ■ The Fund does not share your personal information with nonaffiliates so they can market to you |
| Joint marketing | A formal agreement between nonaffiliated financial companies that together market financial products or services to you. ■ The Fund does not jointly market. |
PROXY VOTING
A description of the policies and procedures that the Fund uses to determine how to vote proxies relating to portfolio securities and information regarding how the Fund voted those proxies during the most recent twelve month period ended June 30, are available (1) without charge upon request by calling the Fund at (866) 954- 6682 and (2) in Fund documents filed with the Securities and Exchange Commission (“SEC”) on the SEC’s website at www.sec.gov.
TRUSTEES Andrea N. Mullins, Chairperson Ira P. Cohen Mark J. Seger OFFICERS Mark J. Seger, Interim Principal Executive Officer and President Zachary P. Richmond, Principal Financial Officer and Treasurer Kevin J. Patton, Chief Compliance Officer Carol J. Highsmith, Vice President and Secretary INVESTMENT ADVISER Summitry LLC 919 Hillsdale Boulevard, Suite 150 Foster City, CA 94404 DISTRIBUTOR UltimusFund Distributors, LLC 225 PictoriaDrive, Suite 450 Cincinnati, OH 45246 | INDEPENDENT REGISTERED PUBLIC ACCOUNTING FIRM Cohen & Company, Ltd. 1350 Euclid Avenue, Suite 800 Cleveland, OH 44115 LEGAL COUNSEL Troutman Pepper Hamilton Sanders LLP 3000 Two Logan Square 18th and Arch Streets Philadelphia, PA 19103 CUSTODIAN Huntington National Bank 41 South High Street Columbus, OH 43215 ADMINISTRATOR, TRANSFER AGENT AND FUND ACCOUNTANT UltimusFund Solutions, LLC 225 PictoriaDrive, Suite 450 Cincinnati, OH 45246 |
This report is intended only for the information of shareholders or those who have received the Fund’s prospectus which contains information about the Fund’s management fee and expenses. Please read the prospectus carefully before investing.
Distributed by Ultimus Fund Distributors, LLC, Member FINRA/SIPC.
Summitry-AR-2022
Item 2. Code of Ethics.
As of the end of the period covered by this report, the registrant has adopted a code of ethics that applies to the registrant’s principal executive officer, principal financial officer, principal accounting officer or controller, or persons performing similar functions, regardless of whether these individuals are employed by the registrant or a third party. Pursuant to Item 13(a)(1), a copy of registrant’s code of ethics is filed as an exhibit to this Form N-CSR. During the period covered by this report, the code of ethics has not been amended, and the registrant has not granted any waivers, including implicit waivers, from the provisions of the code of ethics.
Item 3. Audit Committee Financial Expert.
(a)(1) The registrant’s Board of Trustees has determined that the registrant has at least one audit committee financial expert serving on its audit committee.
(a)(2) The audit committee financial expert is Andrea N. Mullins, who is “independent” for purposes of this Item 3 of Form N-CSR.
Item 4. Principal Accountant Fees and Services.
| Summitry Equity Fund | | | FY 2022 | | | $ | 14,500 | |
| | | | FY 2021 | | | $ | 13,500 | |
| | | | | | | | | |
| Belmont Theta Income Fund | | | FY 2022 | | | $ | 15,500 | |
| | | | FY 2021 | | | $ | 14,500 | |
| | | | | | | | | |
| Channing Intrinsic Value Small-Cap Fund | | | FY 2022 | | | $ | 14,000 | |
| Summitry Equity Fund | | | FY 2022 | | | $ | 0 | |
| | | | FY 2021 | | | $ | 0 | |
| | | | | | | | | |
| Belmont Theta Income Fund | | | FY 2022 | | | $ | 0 | |
| | | | FY 2021 | | | $ | 0 | |
| | | | | | | | | |
| Channing Intrinsic Value Small-Cap Fund | | | FY 2022 | | | $ | 0 | |
| Summitry Equity Fund | | | FY 2022 | | | $ | 3,000 | |
| | | | FY 2021 | | | $ | 3,000 | |
| | | | | | | | | |
| Belmont Theta Income Fund | | | FY 2022 | | | $ | 3,000 | |
| | | | FY 2021 | | | $ | 3,000 | |
| | | | | | | | | |
| Channing Intrinsic Value Small-Cap Fund | | | FY 2022 | | | $ | 3,000 | |
Nature of the fees: Preparation of the 1120 RIC and Excise review
| Summitry Equity Fund | | | FY 2022 | | | $ | 0 | |
| | | | FY 2021 | | | $ | 0 | |
| | | | | | | | | |
| Belmont Theta Income Fund | | | FY 2022 | | | $ | 0 | |
| | | | FY 2021 | | | $ | 0 | |
| | | | | | | | | |
| Channing Intrinsic Value Small-Cap Fund | | | FY 2022 | | | $ | 0 | |
| (e) | (1) Audit Committee’s Pre-Approval Policies |
The Audit Committee Charter requires the Audit Committee to be responsible for the selection, retention or termination of auditors and, in connection therewith, to (i) evaluate the proposed fees and other compensation, if any, to be paid to the auditors, (ii) evaluate the independence of the auditors, (iii) pre-approve all audit services and, when appropriate, any non-audit services provided by the independent auditors to the Trust, (iv) pre-approve, when appropriate, any non-audit services provided by the independent auditors to the Trust's investment adviser, or any entity controlling, controlled by, or under common control with the investment adviser and that provides ongoing services to the Trust if the engagement relates directly to the operations and financial reporting of the Trust, and (v) receive the auditors’ specific representations as to their independence.
| (2) | All of the services described in paragraphs (b) through (d) of Item 4 were pre-approved by the Audit Committee. |
(f) During audit of registrant's financial statements for the most recent fiscal year, less than 50 percent of the hours expended on the principal accountant's engagement were attributed to work performed by persons other than the principal accountant's full-time, permanent employees.
(g) The aggregate non-audit fees billed by the registrant's accountant for services rendered to the registrant, and rendered to the registrant's investment adviser (not including any sub-adviser whose role is primarily portfolio management and is subcontracted with or overseen by another investment adviser), and any entity controlling, controlled by, or under common control with the adviser that provides ongoing services to the registrant:
| | | Registrant | Adviser |
| | FY 2022 | | | $ | 9,000 | | $0 | | |
| | FY 2021 | | | $ | 6,000 | | $0 | | |
(h) Not applicable. The auditor performed no services for the registrant’s investment adviser or any entity controlling, controlled by, or under common control with the investment adviser that provides ongoing services to the registrant.
Item 5. Audit Committee of Listed Companies. NOT APPLICABLE– applies to listed companies only
Item 6. Schedule of Investments. Schedules filed with Item 1.
Item 7. Disclosure of Proxy Voting Policies and Procedures for Closed-End Management Investment Companies. NOT APPLICABLE – applies to closed-end funds only
Item 8. Portfolio Managers of Closed-End Investment Companies. NOT APPLICABLE – applies to closed-end funds only
Item 9. Purchases of Equity Securities by Closed-End Management Investment Company and Affiliated Purchasers. NOT APPLICABLE – applies to closed-end funds only
Item 10. Submission of Matters to a Vote of Security Holders.
The guidelines applicable to shareholders desiring to submit recommendations for nominees to the Registrant's board of trustees are contained in the statement of additional information of the Trust with respect to the Fund(s) for which this Form N-CSR is being filed.
Item 11. Controls and Procedures.
(a) Based on their evaluation of the registrant’s disclosure controls and procedures (as defined in Rule 30a-3(c) under the Investment Company Act of 1940, as amended (the “Act”)) as of a date within 90 days of the filing date of this report, the registrant’s principal executive officer and principal financial officer have concluded that such disclosure controls and procedures are reasonably designed and are operating effectively to ensure that material information relating to the registrant is made known to them by others within those entities, particularly during the period in which this report is being prepared, and that the information required in filings on Form N-CSR is recorded, processed, summarized, and reported on a timely basis.
(b) There were no changes in the registrant’s internal control over financial reporting (as defined in Rule 30a-3(d) under the Investment Company Act of 1940) that occurred during the period covered by this report that have materially affected, or are reasonably likely to materially affect, the registrant’s internal control over financial reporting.
Item 12. Disclosure of Securities Lending Activities for Closed-End Management Investment Companies.
NOT APPLICABLE
Item 13. Exhibits.
(a) (1) Code is filed herewith.
(3) Not applicable
Pursuant to the requirements of the Securities Exchange Act of 1934 and the Investment Company Act of 1940, the registrant has duly caused this report to be signed on its behalf by the undersigned, thereunto duly authorized.
(Registrant) Valued Advisers Trust
By /s/ Matthew J. Miller
Matthew J. Miller, President and Principal Executive Officer
Date 4/7/2022
Pursuant to the requirements of the Securities Exchange Act of 1934 and the Investment Company Act of 1940, this report has been signed below by the following persons on behalf of the registrant and in the capacities and on the dates indicated.
By /s/ Matthew J. Miller
Matthew J. Miller, President and Principal Executive Officer
Date 4/7/2022
By /s/ Zachary P. Richmond
Zachary P. Richmond, Treasurer and Principal Financial Officer
Date 4/7/2022