
• Welcome • Reading of the Minutes • Certify Voting Activity • Vote on Matters of the Proxy Statement • Discussion of Condition of Company » President’s Remarks » Financial Review » Retail Environment • Questions & Answers • Vote Results • Adjournment AGENDA

PRESENTERS • Aaron L. Groff, Jr. » President, CEO and Board Chairman – ENB Financial Corp and Ephrata National Bank • Paul W. Wenger » Vice President and Corporate Secretary – ENB Financial Corp » Senior Vice President and Cashier – Ephrata National Bank • Scott E. Lied » Treasurer – ENB Financial Corp » Senior Vice President and Chief Financial Officer – Ephrata National Bank • Mary E. Leaman » Vice President and Senior Retail Officer – Ephrata National Bank

Presented by: Paul W. Wenger Corporate Secretary - ENB Financial Corp ELECTION CERTIFICATION

• Elect three (3) Class B directors to serve a three - year term • Approve and adopt an amendment to Article 11 of the Corporation’s Articles of Incorporation • Approve and adopt the ENB Financial Corp 2011 Employee Stock Purchase Plan MATTERS OF PROXY

CURRENT DIRECTORS Class B Election (3 Year Term) Willis R. Lefever Judith A. Weaver Donald Z. Musser Continuing Directors – Class A Aaron L. Groff, Jr. J. Harold Summers Paul M. Zimmerman, Jr. Thomas H. Zinn Continuing Directors – Class C Susan Y. Nicholas Mark C. Wagner Paul W. Wenger

VOTING PROCESS Presented by: Paul W. Wenger Corporate Secretary - ENB Financial Corp

Proxy Holders • Janice S. Eaby • John H. Shuey Judges of Election • Richard H. Binner • Roger S. Kline • William M. Rohrbach VOTING PROCESS
Presented by: Aaron L. Groff, Jr. President/CEO - ENB Financial Corp PRESIDENT’S REMARKS

ENRICHING THE FABRIC OF OUR COMMUNITY

» To remain an independent community bank of undisputed integrity, serving the communities of Northern Lancaster County and beyond. » To offer state - of - the - art financial products and services of high quality and value at an affordable price. » To provide unsurpassed personal service, delivered by a highly dedicated professional team. MISSION STATEMENT

• C ourteous • A ccurate • R esponsive • E mpowered WE CARE

• Growth • Market share • Local market dynamics • Main office renovations • Customer survey » Convenience of local bank with good customer service 2011 HIGHLIGHTS

IMPORTANCE OF BRANCHES Non - ENB Customers 1 Branch Locations 13.1% 2 Local bank 13.1% 3 Where my family banks/history/have always banked there 12.7% 4 Convenience 12.5% 5 Customer service/personal attention/friendly 9.6% ENB Customers Top 5 unaided responses to the question “Why did you select your primary financial institution?” 1 Customer service/personal attention/friendly 29.1% 2 Local bank 26.2% 3 Where my family banks/history/have always banked there 17.1% 4 Branch Locations 15.7% 5 Convenience 11.0% Source: 2012 ENB Brand Equity/Positioning Study – Potential Customers; n=511 Source: 2012 ENB Brand Equity/Positioning Study – Current Customers; n=696

Presented by: Scott E. Lied Treasurer - ENB Financial Corp FINANCIAL CONDITION

• Unaudited Financial Information » Some of the following slides do present financial information that is unaudited. Therefore, this information is subject to adjustments that could be necessary upon completion of the annual audit. • Forward Looking Statements » Some of the material and/or language used in this presentation would be considered as a forward looking statement. Management is not obligated to update these forward looking statements. DISCLOSURES

5,063 4,014 4,300 6,345 7,148 0 2,000 4,000 6,000 8,000 2007 2008 2009 2010 2011 Dollars in thousands NET INCOME

SIGNIFICANT ITEMS Annual $ Income Impact Annual % Change Net Interest Income 780,000 3.5 Gains/Loss on Securities 528,000 54.3 Loan Loss Provision 225,000 12.5 Student Loan Portfolio Loss (263,000) NA Operating Expense (103,000) 0.5 Total Income Impact 1,167,000

19.1 20.1 21.0 22.2 23.0 14 15 16 17 18 19 20 21 22 23 24 2007 2008 2009 2010 2011 Dollars in millions NET INTEREST INCOME
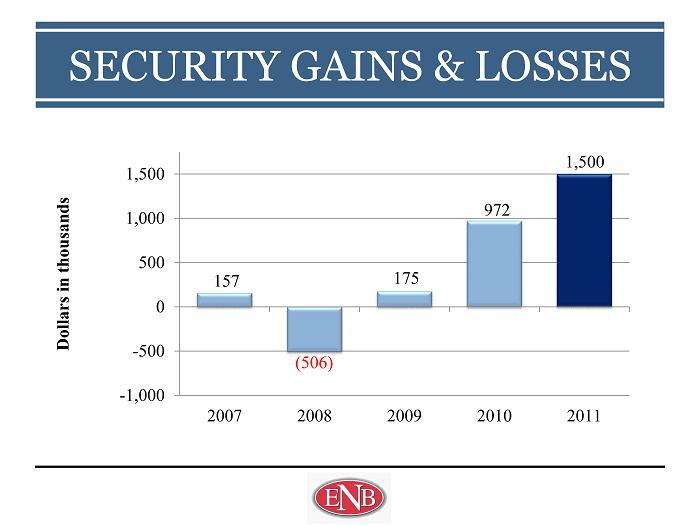
157 (506) 175 972 1,500 -1,000 -500 0 500 1,000 1,500 2007 2008 2009 2010 2011 Dollars in thousands SECURITY GAINS & LOSSES
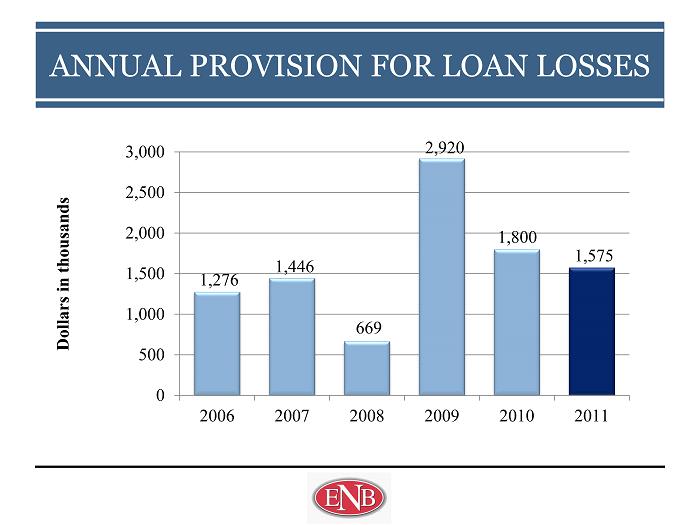
1,276 1,446 669 2,920 1,800 1,575 0 500 1,000 1,500 2,000 2,500 3,000 2006 2007 2008 2009 2010 2011 Dollars in thousands ANNUAL PROVISION FOR LOAN LOSSES

2011 2010 Return on Average Assets 0.95% 0.85% Return on Average Equity 9.22% 8.62% Average Equity Ratio 10.26% 9.85% Net Interest Margin 3.56% 3.50% Efficiency Ratio 65.36% 65.68% PERFORMANCE RATIOS

2011 2010 Earnings Per Share $2.50 $2.23 Dividends Per Share $0.96 $0.96 Dividend Payout Ratio 38.40% 43.05% PER SHARE DATA

0.00 0.25 0.50 0.75 1.00 1.25 2007 2008 2009 2010 2011 Annual Dividend in Dollars ENB Fulton Susq Vist 2.45% 3.31% 1.43% 5 YEAR DIVIDEND COMPARISON 4.52%

0.00 5.00 10.00 15.00 20.00 25.00 30.00 35.00 Stock Price in Dollars ENBP FULT SUSQ VIST | STOCK PRICE
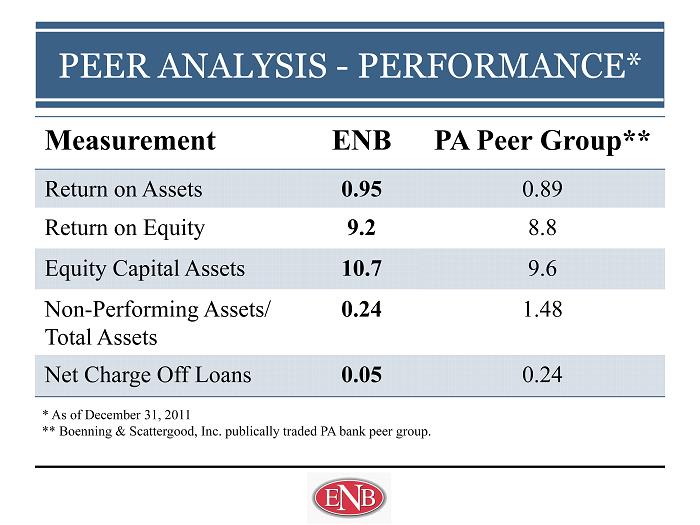
Measurement ENB PA Peer Group ** Return on Assets 0.95 0.89 Return on Equity 9.2 8.8 Equity Capital Assets 10.7 9.6 Non - Performing Assets/ Total Assets 0.24 1.48 Net Charge Off Loans 0.05 0.24 PEER ANALYSIS - PERFORMANCE* * As of December 31, 2011 ** Boenning & Scattergood, Inc. publically traded PA bank peer group.

Measurement ENB PA Peer Group ** Price to Book 0.79 0.92 Price to Earnings 9.1 10.9 Dividend Yield 4.52 3.08 PEER ANALYSIS – STOCK RATIOS* * As of December 31, 2011 ** Boenning & Scattergood, Inc. publically traded PA bank peer group.

619 668 713 747 756 500 600 700 800 900 2007 2008 2009 2010 2011 Dollars in millions AVERAGE ASSETS

377 391 420 429 415 350 370 390 410 430 2007 2008 2009 2010 2011 Dollars in millions AVERAGE LOANS
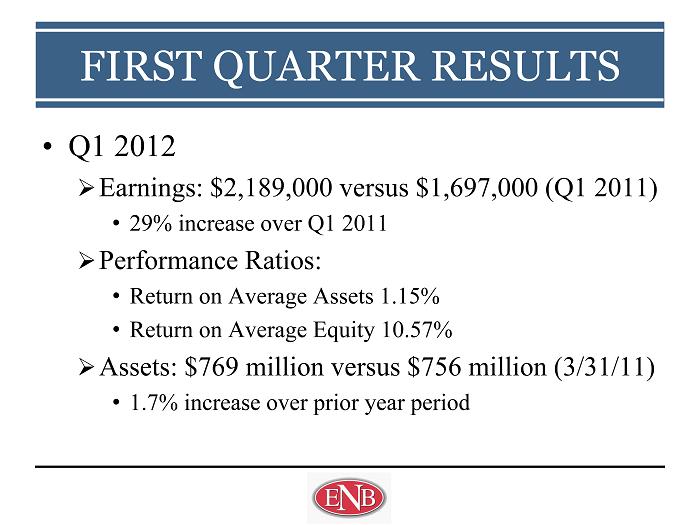
• Q1 2012 » Earnings: $2,189,000 versus $1,697,000 (Q1 2011) • 29% increase over Q1 2011 » Performance Ratios: • Return on Average Assets 1.15% • Return on Average Equity 10.57% » Assets: $769 million versus $756 million (3/31/11) • 1.7% increase over prior year period FIRST QUARTER RESULTS
RETAIL OVERVIEW Presented by: Mary E. Leaman Vice President and Sr. Retail Officer – Ephrata National Bank

ENB BRANCH LOCATIONS Denver Cloister Ephrata Akron Blue Ball Hinkletown Manheim Lititz

0 100 200 300 400 500 600 700 2009 2010 2011 Dollars in millions Ending Deposit Balances Manheim Blue Ball Lititz Akron Denver Hinkletown Cloister Main ENB BRANCH DEPOSIT SUMMARY

0 50 100 150 200 250 300 350 400 450 2009 2010 2011 Dollars in millions Ending Loan Balances Manheim Blue Ball Lititz Akron Denver Hinkletown Cloister Main ENB BRANCH LOAN SUMMARY* * Net of Student Loans

PEER ANALYSIS – AVERAGE BRANCH DEPOSIT SIZE* Ephrata Newtown Jersey Shore Mid Penn Somerset Downingtown Established 1881 1864 1934 1868 1889 1861 Asset Size*** $755 $774 $745 $687 $672 $630 Branches** 8 14 11 13 13 11 County Footprint 1 1 3 4 3 2 Deposits*** $594 $673 $573 $606 $593 $519 Branch Deposit Average*** $74 $48 $52 $47 $46 $47 * As of June 30, 2011. ** Excluding drive - ups, small in - store branches and strip mall locations. *** Amount in millions.

ENRICHING THE FABRIC OF OUR COMMUNITY

QUESTIONS & ANSWERS

Presented by: Paul W. Wenger Corporate Secretary - ENB Financial Corp VOTING RESULTS

• Mission Statement: » To remain an independent community bank of undisputed integrity, serving the communities of Northern Lancaster County and beyond. » To offer state - of - the - art financial products and services of high quality and value at an affordable price. » To provide unsurpassed personal service, delivered by a highly dedicated professional team. ADJOURNMENT