UNITED STATES
SECURITIES AND EXCHANGE COMMISSION
Washington, D.C. 20549
FORM N-CSR
Certified Shareholder Report of
Registered Management Investment Companies
Investment Company Act File Number: 811-22215
International Growth and Income Fund
(Exact Name of Registrant as Specified in Charter)
One Market, Steuart Tower
Suite 2000
San Francisco, California 94105
(Address of Principal Executive Offices)
Registrant's telephone number, including area code: (415) 421-9360
Date of fiscal year end: June 30
Date of reporting period: June 30, 2013
Patrick F. Quan
International Growth and Income Fund
One Market, Steuart Tower
Suite 2000
San Francisco, California 94105
(Name and Address of Agent for Service)
Copies to:
Michael Glazer
Bingham McCutchen LLP
355 South Grand Avenue, Suite 4400
Los Angeles, California 90071
(Counsel for the Registrant)
ITEM 1 – Reports to Stockholders
![]()
Invest in a world
of innovation.
Special feature page 6
 | International Growth and Income FundSM Annual Report for the year ended June 30, 2013 |
International Growth and Income Fund seeks to provide long-term growth of capital with current income by investing primarily in the stocks of larger, well-established companies outside the U.S.
This fund is one of more than 40 offered by one of the nation’s largest mutual fund families, American Funds, from Capital Group. For more than 80 years, Capital has invested with a long-term focus based on thorough research and attention to risk.
Fund results shown in this report, unless otherwise indicated, are for Class A shares at net asset value. If a sales charge (maximum 5.75%) had been deducted, the results would have been lower. Results are for past periods and are not predictive of results for future periods. Current and future results may be lower or higher than those shown. Share prices and returns will vary, so investors may lose money. Investing for short periods makes losses more likely. Investments are not FDIC-insured, nor are they deposits of or guaranteed by a bank or any other entity, so they may lose value. For current information and month-end results, visit americanfunds.com.
Here are the average annual total returns on a $1,000 investment with all distributions reinvested for periods ended June 30, 2013:
| Class A shares | 1 year | 5 years | Lifetime (since 10/1/08) | |||||||||
| Reflecting 5.75% maximum sales charge | 11.59% | — | 7.94% | |||||||||
For other share class results, visit americanfunds.com and americanfundsretirement.com.
The total annual fund operating expense ratio is 0.93% for Class A shares as of the prospectus dated September 1, 2013 (unaudited).
Investment results assume all distributions are reinvested and reflect applicable fees and expenses. When applicable, investment results reflect fee waivers and/or expense reimbursements, without which results would have been lower. Visit americanfunds.com for more information.
The fund’s 30-day yield for Class A shares as of July 31, 2013, reflecting the 5.75% maximum sales charge and calculated in accordance with the U.S. Securities and Exchange Commission formula, was 2.39%.
Investing outside the United States may be subject to risks such as currency fluctuations, periods of illiquidity and price volatility. These risks may be heightened in connection with investments in developing countries. Refer to the prospectus and the Risk Factors section of this report for more information on these and other risks associated with investing in the fund.

For international equity
exposure, invest in well-
established companies
that often pay dividends.
Global equity markets advanced during the fiscal year, supported by aggressive monetary stimulus and improving economic conditions in the United States. Volatility rose in the final three months of the period as investors focused on slowing economic growth in China and the prospect that the U.S. Federal Reserve might begin to taper its asset-purchase program later in the year.
For the 12 months ended June 30, 2013, International Growth and Income Fund produced a robust gain of 18.4%. That result exceeded the 13.6% return of the fund’s primary benchmark, the unmanaged MSCI ACWI (All Country World Index) ex USA. The index measures a broad range of developed- and developing-country stock markets. The fund also bested the 17.9% return of the Lipper International Funds Index, a peer group measure.
The fund aims to provide investors with current income through dividends. Quarterly dividend payments totaled about 85 cents a share for the year. This amounted to an income return of 3.1%.
Results at a glance
For periods ended June 30, 2013, with all distributions reinvested
| Total returns | Average annual total returns | |||||||||||
| 1 year | 3 years | Lifetime (since 10/1/08) | ||||||||||
| International Growth and Income Fund (Class A shares) | 18.41 | % | 11.65 | % | 9.30 | % | ||||||
| MSCI All Country World Index ex USA* | 13.63 | 7.99 | 4.32 | |||||||||
| Lipper International Funds Index | 17.93 | 9.62 | 4.89 | |||||||||
| * | The market index is unmanaged and, therefore, has no expenses. The index reflects dividends net of withholding taxes. |
| International Growth and Income Fund | 1 |
Where the fund’s assets were invested
Percent of net assets by country as of June 30, 2013
| International Growth and Income Fund | MSCI ACWI ex USA* | |||||||
| Europe | ||||||||
| Euro zone† | 26.6 | % | 19.8 | % | ||||
| United Kingdom | 17.3 | 15.3 | ||||||
| Switzerland | 5.8 | 6.5 | ||||||
| Sweden | 1.2 | 2.2 | ||||||
| Denmark | .3 | .8 | ||||||
| Russia | .3 | 1.3 | ||||||
| Other Europe | — | 1.5 | ||||||
| 51.5 | 47.4 | |||||||
| Asia/Pacific | ||||||||
| Japan | 10.1 | 16.0 | ||||||
| Hong Kong | 6.0 | 2.1 | ||||||
| Australia | 4.2 | 5.7 | ||||||
| Taiwan | 3.7 | 2.6 | ||||||
| Thailand | 2.1 | .6 | ||||||
| China | 1.7 | 4.0 | ||||||
| South Korea | .2 | 3.2 | ||||||
| Other Asia/Pacific | 3.0 | 4.6 | ||||||
| 31.0 | 38.8 | |||||||
| The Americas | ||||||||
| Canada | 4.6 | 7.2 | ||||||
| Mexico | 1.2 | 1.2 | ||||||
| United States | .3 | — | ||||||
| Brazil | .1 | 2.5 | ||||||
| Other Americas | .3 | .8 | ||||||
| 6.5 | 11.7 | |||||||
| Other | ||||||||
| South Africa | 1.5 | 1.6 | ||||||
| Other countries | — | .5 | ||||||
| 1.5 | 2.1 | |||||||
| Convertible securities, bonds, notes & other debt instruments, short-term securities & other assets less liabilities | 9.5 | — | ||||||
| Total | 100.0 | % | 100.0 | % | ||||
| * | The MSCI ACWI (All Country World Index) ex USA is weighted by market capitalization. |
| † | Countries using the euro as a common currency: Austria, Belgium, Cyprus, Estonia, Finland, France, Germany, Greece, Ireland, Italy, Luxembourg, Malta, the Netherlands, Portugal, Slovakia, Slovenia and Spain. |
The market environment
The world’s major developed stock markets surged during the fiscal year, generally surpassing returns from developing markets. Japanese stocks produced some of the largest gains of the period, aided by the Bank of Japan’s quantitative easing plans, including a pledge to double the monetary base over two years to achieve a 2% inflation target by 2015. Toward the end of the period, investors grew uncertain over structural reforms proposed by Prime Minister Shinzo Abe, but Japanese shares ended the fiscal year with a 22.2%1 gain in U.S. dollar terms on better-than-expected economic data. Japan’s first-quarter GDP was revised upward to an annual rate of 4.1%, driven partly by higher consumption and surging exports. The Japanese yen declined significantly against the dollar, dampening returns for U.S. investors.
Despite a protracted recession in Europe, returns for most of the region’s stock markets were positive. In the euro zone, first-quarter GDP declined 1.1%, marking the sixth consecutive quarter of recession. Overall unemployment stood at a record-high 12.2%. Nevertheless, the unmanaged MSCI European Union (EU) Index rose 17.2%, aided in part by the European Central Bank’s (ECB) interest rate cut to 0.5% and ECB President Mario Draghi’s declaration that the central bank “stands ready to act if needed.”
Equity returns were mixed in the developing markets, as investors became increasingly concerned about slowing economic growth in China and Latin America, as well as the prospect that the U.S. Federal Reserve may begin to taper
| 1 | Country returns are based on MSCI indexes, expressed in U.S. dollars, and assume the reinvestment of dividends. The indexes reflect dividends net of withholding taxes. |
| 2 | International Growth and Income Fund |
its bond-buying program later in 2013. Leaders in Beijing are seeking a shift toward a more balanced economy driven more by domestic consumption. Despite increased volatility, China’s stock market gained 5.2% for the year. Elsewhere, Brazil (–11.1%) and Russia (–1.0%) declined, while India rose 6.7% in U.S. dollar terms.
Most of the 10 sectors that comprise the MSCI ACWI ex USA advanced, led by the consumer discretionary (26.1%) and health care (25.6%) areas. The only sectors that lost ground were energy (–1.5%) and materials (–7.9%).
A look inside the portfolio
As we have emphasized in the past, the investment professionals who manage International Growth and Income Fund do not invest based on regions, sectors or macroeconomic events. Rather, we rely on careful research of individual companies to identify what we believe are undervalued securities. This approach often leads us to invest in companies that we believe can fare well despite geographic or industry headwinds. For example, amid Europe’s ongoing recession, Hellenic Telecommunications (206.3%), a Greek company, and European media companies Mediaset (115.8%) and ProsiebenSAT.1 (92.5%) experienced sharp price increases. Among holdings of European financial companies, insurers AXA (46.8%) and Prudential (41.1%), the fund’s second- and ninth-largest holdings, respectively, also produced exceptional returns.
Strong stock selection among industrial companies helped the fund’s investments in this area outpace both the sector and the broader market. These included French-based Schneider Electric (30.2%), Japanese heavy equipment maker Kubota (58.2%) and the Irish discount airline Ryanair (69.5%). Solid investment selection and a lighter concentration of materials firms also supported the fund’s strong result.
A number of the fund’s top-10 holdings also contributed meaningfully. In addition to AXA and Prudential, Taiwan Semiconductor Manufacturing (35.3%), pharmaceutical company Novartis (27.4%) and Hong Kong utility Power Assets Holdings (14.9%) all outpaced the broader market.
Among the fund’s investments that lost ground were top holding Royal Dutch Shell (–5.2%), European utility company
| Largest equity holdings | ||||||
| (as of June 30, 2013) | ||||||
| Company | Country | Percent of net assets | ||||
| Royal Dutch Shell | United Kingdom | 2.6 | % | |||
| AXA | France | 2.6 | ||||
| Novartis | Switzerland | 2.6 | ||||
| Taiwan Semiconductor Manufacturing | Taiwan | 2.5 | ||||
| HSBC Holdings | United Kingdom | 2.3 | ||||
| National Grid | United Kingdom | 2.0 | ||||
| TOTAL | France | 2.0 | ||||
| STMicroelectronics | France | 1.9 | ||||
| Prudential | United Kingdom | 1.9 | ||||
| Power Assets Holdings | Hong Kong | 1.6 | ||||
| International Growth and Income Fund | 3 |
GDF SUEZ (–17.9%), telecommunications company KPN (–78.3%) and Quanta Computer (–19.4%), a Taiwan-based maker of notebook computers and other electronic hardware.
An optimistic view
The world’s economy and markets continue to face challenges. China’s growth has slowed markedly while its leadership has revealed itself to tolerate a much lower level of economic expansion than many had expected, and this could have implications for the global economy.
Nevertheless, looking forward we find a number of reasons for optimism. The dramatic shift in policy direction in Japan could bode well for Japanese companies as well as the overall global economy. We are closely following developments in that country. We have seen some early indications that the euro zone is on the mend, and we feel that recent steps taken by European governments and central banks are positive. The U.S. economy continues to strengthen, which could help provide a boost to emerging markets.
As always, we will continue to work hard to seek out individual companies that we believe can contribute to the fund’s long-term objectives regardless of current economic conditions. This year’s feature article, which begins on page 6, highlights a number of innovative companies that the fund has invested in.
We are grateful for your continued support and look forward to reporting back to you in six months.
Cordially,
 |  |
| Steven T. Watson Vice Chairman of the Board | Carl Kawaja President |
August 9, 2013
For current information about the fund, visit americanfunds.com.
| 4 | International Growth and Income Fund |
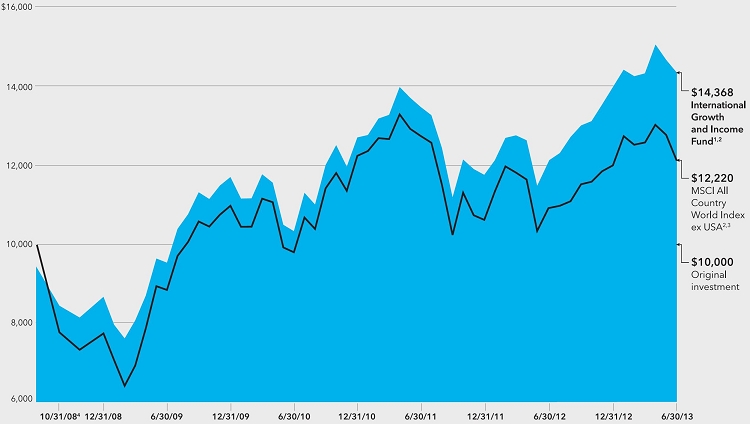
The value of a $10,000 investment
How a $10,000 investment has fared (for the period October 1, 2008, to June 30, 2013, with dividends reinvested)
Fund results shown are for Class A shares and reflect deduction of the maximum sales charge of 5.75% on the $10,000 investment.¹ Thus, the net amount invested was $9,425.² Results are for past periods and are not predictive of results for future periods. Current and future results may be lower or higher than those shown. Share prices and returns will vary, so investors may lose money. For current information and month-end results, visit americanfunds.com.
| 1 | As outlined in the prospectus, the sales charge is reduced for accounts (and aggregated investments) of $25,000 or more and is eliminated for purchases of $1 million or more. There is no sales charge on dividends or capital gain distributions that are reinvested in additional shares. |
| 2 | All results are calculated with dividends and capital gains reinvested. |
| 3 | The market index is unmanaged and, therefore, has no expenses. The index reflects dividends net of withholding taxes. |
| 4 | For the period October 1, 2008 (when the fund began operations), through October 31, 2008. |
Average annual total returns based on a $1,000 investment (for periods ended June 30, 2013)*
| 1 year | 5 years | Lifetime (since 10/1/08) | |||||
| Class A shares | 11.59% | — | 7.94% |
| * | Assumes reinvestment of all distributions and payment of the maximum 5.75% sales charge. |
Investment results assume all distributions are reinvested and reflect applicable fees and expenses. When applicable, investment results reflect fee waivers and/or expense reimbursements, without which results would have been lower. Visit americanfunds.com for more information.
| International Growth and Income Fund | 5 |
Around the world, innovation transforms companies’ prospects — and people’s lives

| 6 | International Growth and Income Fund |
| “The stock market is a problem-solving machine, and ultimately the stock market rewards companies that solve problems. This fund takes a relatively conservative approach to investing, but that doesn’t mean we shouldn’t be investing in innovative, cutting-edge companies — because innovation creates long-term value.” |  Carl |  |
You don’t have to look very far these days to find innovation making an impact on daily life. If you use mobile technology, drive a late-model car, shop online or travel by air, chances are you’re in regular contact with some recent technological advancement.
Whether it’s the latest invention, an alteration to an existing product or simply a new way of doing things, innovation can also play a vital role for companies — potentially driving market share and profitability, or even reordering whole industries and transforming the competitive landscape. Indeed, in today’s highly competitive global marketplace, companies very often must be able to adapt quickly to changing business conditions to attain long-term success.
Guided by its mandate to seek both long-term capital appreciation and current income, International Growth and Income Fund has the flexibility to invest in a diverse mix of companies — mostly based outside the United States. Many of the fund’s holdings are well-established companies that often pay above-average dividends. But the portfolio also includes a number of businesses that the fund’s managers believe represent strong growth potential as a result of innovation.
“I believe that the stock market is a problem-solving machine, and ultimately the stock market rewards companies that solve problems, like: ‘How do I cure cancer?’ or ‘How do I search for oil in new places?’” says Carl Kawaja, president of the fund and a portfolio manager. “This fund takes a relatively conservative approach to investing, but that doesn’t mean we shouldn’t be investing in innovative, cutting-edge companies — because innovation creates long-term value.”
In the following pages, we take a close look at how some of the fund’s holdings are gaining a potential strategic advantage through innovation. We’ll hear from the fund’s investment professionals about how these new ideas can improve people’s lives, boost a company’s profitability and reward long-term investors.
Powering up the mobile revolution
Perhaps more than any other area of the global economy, the semiconductor industry exemplifies rapid innovation. Semiconductors, which are the heart of products ranging from computers and household appliances to cars and aircraft, play an essential role in nearly every facet of modern life. The speed of technological advancement in the industry is captured by Moore’s Law, which observes that computer chip capacity doubles roughly every two years.
Taiwan Semiconductor Manufacturing (TSMC) makes chips that have enabled rapid advances in technology for smartphones, tablets and other mobile devices. Although the company does not design the semiconductors, its advanced production techniques have resulted in increasingly smaller and more efficient chips. “The label ‘manufacturer’ doesn’t connote the design value that this company adds,” says Shailesh Jaitly, an analyst based in Hong Kong. “Through innovative manufacturing, every 18 months or so TSMC has been able to produce more advanced chips that consume less battery power.”
Power consumption is a key concern in mobile technology. As devices have gotten smaller and more advanced, the processing power of the semiconductors that help them function has been increasing at an exponential rate. A few years ago, anticipating rising global demand for mobile technology, TSMC began investing in its factories to help boost the power efficiency of its chips. This early investment has helped TSMC — the fund’s fourth-largest holding — capture about a 70% market share in all the leading-edge processes, says Shailesh. The company has about a 50% share of the broader global foundry market, a share he believes is likely to expand by another 2 to 3 percentage points this year.
With global demand for mobile devices expected to rise — particularly in developing markets — earlier this year TSMC disclosed plans to boost capital expenditures in an effort to extend its technological advantage. Shailesh believes the company’s advantage in leading-edge mobile technologies can help it continue to take market share from rivals and expand
| International Growth and Income Fund | 7 |
 Eric |  | “Novartis stands out as having committed itself early on to a pathway-driven approach to drug discovery.” |
pricing power. “Competitors are working fast to catch up with TSMC, so I expect the pace of innovation in the industry to increase over the next couple of years,” he says. “But because customers typically have to engage a chip manufacturer about two or three years before a design is needed, TSMC’s leading position almost becomes a self-fulfilling prophecy. The company is so dominant, so customers must consider it now as a top source for chips they need in 2015 and 2016.”
All systems go
Swiss drug maker Novartis, the fund’s third-largest holding, also conducts business in an industry where innovation is critical to long-term success — or even survival. Because patent protection for drugs ultimately expires, allowing competitors to sell much cheaper generic versions, pharmaceutical companies must be continuously developing new medicines to maintain sales growth.
Novartis — which last year spent more than $9.1 billion on research and development — is not immune to these challenges. In fact, the company’s stock has been generally out of favor in recent years as a result of manufacturing problems at a U.S. plant and expiring patents for two key blockbuster medications: the high-blood-pressure treatment Diovan, and Zometa, which helps prevent bone fractures in cancer patients. But Eric Keisman, a San Francisco-based pharmaceuticals analyst, says the company has a number of drugs in its development pipeline with strong upside potential. He believes these prospective treatments could help drive long-term earnings growth. “Novartis certainly has its challenges, but I see unappreciated potential in its pipeline,” Eric says.
Take, for example, Serelaxin, a treatment for acute heart failure currently being evaluated for approval by regulators. The drug, intended to treat the immediate effects of heart failure, unexpectedly appeared to demonstrate a mortality benefit during early trials. “In other words, more patients who took the drug were alive six months later than those who didn’t,” explains Eric. “Novartis is now running a mortality trial, which won’t report out for a couple of years, but if that mortality benefit is real, the long-term prospects for the drug shift dramatically. Instead of having limited use the drug might be used widely, even on an ongoing basis, to treat heart failure patients.”
In recent years, the science of drug discovery has shifted from a narrow, focused approach to a broad “systems biology” approach whereby researchers seek to piece together fundamental biological pathways that underlie disease. Such research has linked different diseases with similar underlying causes. This, in turn, has led drug makers including Novartis to try to identify every possible disease for which a drug might be applicable, leveraging its research effort across multiple commercial opportunities. “This approach is widely accepted
| 8 | International Growth and Income Fund |
![]()
across the industry, but Novartis stands out as having committed itself early on to a pathway-driven approach to drug discovery,” Eric notes.
The Novartis pipeline also includes Ilaris, an anti-inflammatory drug approved for the treatment of juvenile rheumatoid arthritis, among other diseases. It is currently in a clinical trial as a treatment to prevent heart attacks in patients who have had one heart attack already. Novartis is also conducting early stage trials for a myostatin receptor antibody, a drug that blocks the regulation of muscle growth in the body. “Think of it like a steroid — but potentially without any of the negative side effects of steroids,” Eric explains. Novartis is pursuing the drug as a treatment to promote muscle growth in patients with cachexia, the degenerative loss of muscle mass associated with diseases like COPD and cancer. The drug may also find broader use, to restore muscle lost in the aging process.
Inventing a new product category in an old-school industry
Innovation, of course, is not limited to the obvious fields of technology and drug discovery. Breakthroughs are also achieved in older, more stable industries. And when they are, often they have the potential to upend an established competitive landscape. James Hardie, which makes home siding out of a proprietary fiber cement, is a case in point. “This company effectively created the fiber cement siding industry,” says New York-based analyst Jason Smith. “It not only produces all of its own products, it also designs, builds and produces all of the equipment to manufacture them.”
The Australian company invested $30 million a year for 30 years developing asbestos-free fiber cement siding — known as HardiePlank — and streamlining its production process. Hardie has a dominant 90% share of the fiber cement siding business in the U.S., a market where it generates 70% of its total revenue. The company makes more U.S. fiber cement products in a month than all of its U.S. competitors combined make in a year. The company’s innovative products, low cost structure and brand recognition — and the inability of competitors to manufacture a similar product — make for steep barriers to entry.
“It sounds prosaic, but this fiber cement product is a remarkable innovation,” says Steve Watson, vice chairman of the fund’s board and a portfolio manager. “It is more durable than wood, it’s easy to cut, it comes pre-colored so you never have to paint the stuff, it’s lightweight and it’s easy to install.”
The company stands to benefit from a gradually improving housing market in Australia and further penetration in European markets, but its primary objective is to boost its share of the U.S.
| International Growth and Income Fund | 9 |

exterior cladding market from 15% of the overall market today to 35% in 2025 by expanding its product range and taking share from vinyl siding makers. In addition, the U.S. housing recovery could serve as a significant tailwind for the company, Jason points out. “If the rebound in U.S. housing gains momentum, then James Hardie’s earnings could grow,” he says.
Making hybrids that make sense for buyers
In the automobile industry, when people talk about innovation they usually mean one thing: fuel economy. Car makers today are advancing a variety of alternative technologies to increase fuel efficiency and lower emissions. The most prominent among these technologies is the hybrid vehicle — typically a combination of an internal combustion engine and an electrical system to power the vehicle.
Toyota, which makes the world’s bestselling hybrid car, the Prius, has been a leader in the development of hybrids. Its system is one of the more advanced on the road today, according to analyst Justin Toner, who is based in Los Angeles. “The whole system — which includes an engine, an electrical system integrated with the drive train, and a regenerative braking system — works together to improve fuel economy meaningfully.”
The Prius was first introduced in Japan in the late-1990s and worldwide in 2001. As of March 2013, Toyota had sold about 2.9 million Prius vehicles worldwide. The company is at work on the fourth-generation of the Prius and is now incorporating its hybrid system into a variety of vehicles across its product line, including the Camry and the Highlander.
Just as Henry Ford made the first car that many middle-class Americans could afford by pioneering assembly line techniques, Toyota — recognized worldwide for its manufacturing efficiency — is working hard to reduce the production costs of its hybrids so they are more attractive to consumers and more profitable for the company. “Toyota has developed its hybrid to the point where it is satisfied with the level of fuel efficiency achieved,” says Justin, “and now the stated company goal is to get to a point where the profitability they earn on a hybrid is the same as the non-hybrid version of that vehicle.” For example, Toyota’s cost to make the current generation of the Prius is about one-third the cost of the original. The company expects the fourth-generation of the vehicle, expected to be available in a couple of years, to cost about one-fourth of the original, according to Justin.
Toyota continues to seek innovative ways to build better cars. This year the company expects to spend 890 billion yen ($8.9 billion) on research and development. “They are doing work on electric vehicles, on hybrids, on hydrogen fuel cells; they are doing work on driverless vehicles,” Justin points out. “When you invest in Toyota you know that there isn’t going to be some new technology coming out of left field that will leave the company in the dust.”
Innovation triggers a rebirth
Just a few short years ago, it seemed as if Canadian oil and gas company Paramount
| 10 | International Growth and Income Fund |
 Justin |  | “Toyota is doing work on electric vehicles, on hybrids, on hydrogen fuel cells; they are doing work on driverless vehicles. When you invest in Toyota you know that there isn’t going to be some new technology coming out of left field that will leave the company in the dust.” |
Resources may be past its prime. After three decades of success exploring for and developing natural gas and petroleum resources across Canada, the company had spun off to investors or sold billions of dollars of its most valuable producing land and other assets. By 2008 it primarily held the “leftovers,” according to San Francisco-based analyst Craig Beacock, including more than a million acres of undeveloped lands.
Then came the advent of combining horizontal drilling technology and multistage fracturing, a breakthrough in oil-and-gas retrieval techniques. These technological achievements allow companies to retrieve natural gas and oil that had previously been considered uneconomical to reach. This has led to a renaissance of sorts for Paramount. While Paramount didn’t invent this technology, it is benefitting greatly from the innovation.
“Combining horizontal drilling and multistage fracturing totally changed the game in energy throughout North America, and it has completely reinvented Paramount’s lands in particular,” Craig notes. “Most of what Paramount is drilling and developing now are lands they’ve owned for a long time. These were slow- or even no-growth assets that weren’t particularly profitable. And now the company is looking at potentially doubling and tripling its output with very attractive economics.”
In 2009 the company’s production had declined to just 12,000 barrels of oil equivalent per day (boe/d). Now, in the midst of a major expansion, production has grown to more than 20,000 boe/d and could reach 60,000 next year, after a major development project comes online and is fully ramped up. Looking further ahead, the company’s management believes it may have the resources to support several additional similarly sized phases over the next decade.
Seeking supremacy in the air
EADS, the makers of Airbus, has long been recognized as an innovator in commercial and defense aviation. The company, which was recently listed among the Top 100 Global Innovators by Thomson Reuters, makes the Airbus A380, the world’s largest passenger airliner. The A380 is a double-deck wide-body plane that can seat more than 500 people in a standard three-class setup.
Because of its fierce competition with rival Boeing, EADS is constantly seeking to improve its products through innovation. The company is moving forward with development of its new Airbus A350, a mid-size jet designed as an alternative to Boeing’s 787 Dreamliner. EADS is working closely with its suppliers to make a plane that is more fuel efficient and more comfortable for passengers. More than half of the twin-engine jet is made of lightweight carbon fiber, which is designed to improve fuel efficiency. The plane has a wider cabin than the Dreamliner and larger seats. “EADS claims its A350 has several advantages over the Dreamliner,” says analyst Jason Smith. “They believe it is 7% to 8% more fuel efficient on a seat basis, has a more advanced engine and its panel-based fuselage is easier to repair.”
Airbus booked 241 orders for new planes in June, including 65 A350s, helped in part by a successful maiden voyage for the A350 and strong sales during the weeklong Paris Air Show. “I believe many investors underestimate the company’s ability to successfully develop new aircraft in a timely fashion and close to budget,” says Jason. “In my view, the value of their massive order book, current and future, is underpriced in the share value.”
Certainly, innovation changes people’s lives. It also can play a key role in a company’s prospects and drive value for investors. For the investment professionals who manage International Growth and Income Fund, the essential question is not whether a company innovates, but whether it can produce value over the long term through innovation or otherwise. “I really just want to invest in companies that I believe are mispriced by the market,” says Steve. “Maybe they are mispriced because of their ability to innovate, and the market just doesn’t give them credit. Or maybe they are not particularly exciting companies but they are just very inexpensive based on their long-term potential.” ■
| International Growth and Income Fund | 11 |
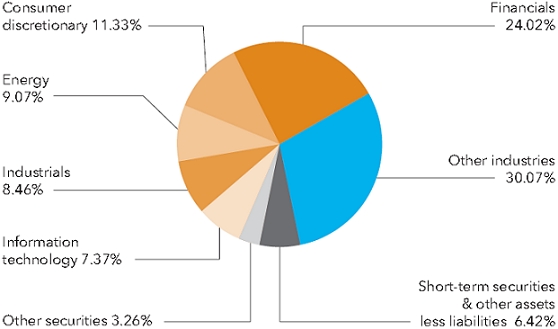
Summary investment portfolio June 30, 2013
The following summary investment portfolio is designed to streamline the report and help investors better focus on the fund’s principal holdings. See the inside back cover for details on how to obtain a complete schedule of portfolio holdings.
| Industry sector diversification | percent of net assets |
| Country diversification | percent of net assets | |||
| Euro zone* | 26.6 | % | ||
| United Kingdom | 17.3 | |||
| Japan | 10.1 | |||
| Hong Kong | 6.0 | |||
| Switzerland | 5.8 | |||
| Canada | 4.6 | |||
| Australia | 4.2 | |||
| Taiwan | 3.7 | |||
| Thailand | 2.1 | |||
| China | 1.7 | |||
| Other countries | 8.4 | |||
| Convertible securities, bonds, notes & other debt instruments, short-term securities & other assets less liabilities | 9.5 | |||
| * | Countries using the euro as a common currency; those represented in the fund’s portfolio are Austria, Belgium, Finland, France, Germany, Greece, Ireland, Italy, the Netherlands, Portugal and Spain. |
| Common stocks 90.32% | Shares | Value (000) | Percent of net assets | |||||||||
| Financials 24.02% | ||||||||||||
| AXA SA | 8,397,200 | $ | 164,992 | 2.60 | % | |||||||
| One of the world’s largest insurance and financial services companies. | ||||||||||||
| HSBC Holdings PLC (United Kingdom) | 7,445,896 | 77,235 | ||||||||||
| HSBC Holdings PLC (Hong Kong) | 5,131,396 | 53,755 | 2.06 | |||||||||
| One of the world’s largest international banking and financial services organizations. | ||||||||||||
| Prudential PLC | 7,274,148 | 118,934 | 1.87 | |||||||||
| Major life insurance and pension provider with operations in the U.S., U.K. and Asia-Pacific region. | ||||||||||||
| Sumitomo Mitsui Financial Group, Inc. | 2,120,000 | 97,258 | 1.53 | |||||||||
| Its companies offer retail, corporate and investment banking and other financial services. | ||||||||||||
| Mizuho Financial Group, Inc. | 36,720,000 | 76,269 | 1.20 | |||||||||
| One of the world’s largest financial services providers. | ||||||||||||
| Shinsei Bank, Ltd. | 30,668,000 | 69,573 | 1.10 | |||||||||
| Japan-based commercial bank. | ||||||||||||
| Link Real Estate Investment Trust | 12,340,000 | 60,697 | .96 | |||||||||
| Invests in retail properties and car park operations in Hong Kong. | ||||||||||||
| BNP Paribas SA | 1,037,530 | 56,687 | .89 | |||||||||
| This major French bank has operations around the globe. | ||||||||||||
| Agricultural Bank of China, Class H | 119,427,000 | 49,273 | .78 | |||||||||
| One of the largest banks in China. | ||||||||||||
| SEGRO PLC | 11,385,000 | 48,346 | .76 | |||||||||
| Industrial property investment and development company. | ||||||||||||
| Sampo Oyj, Class A | 1,235,000 | 48,130 | .76 | |||||||||
| Offers insurance services both in Finland and abroad. | ||||||||||||
| 12 | International Growth and Income Fund |
| Shares | Value (000) | Percent of net assets | ||||||||||
| Grupo Financiero Santander México, SAB de CV, Class B (ADR)1 | 3,360,000 | $ | 47,746 | .75 | % | |||||||
| Mexico-based banking subsidiary of Banco Santander. | ||||||||||||
| Piraeus Bank SA, units1,2 | 21,421,842 | 47,704 | .75 | |||||||||
| Commercial bank in Greece. | ||||||||||||
| Allianz SE | 271,650 | 39,691 | .62 | |||||||||
| One of the world’s largest financial groups. | ||||||||||||
| Other securities | 469,011 | 7.39 | ||||||||||
| 1,525,301 | 24.02 | |||||||||||
| Consumer discretionary 11.33% | ||||||||||||
| ProSiebenSAT.1 Media AG, nonvoting preferred1 | 2,261,000 | 97,179 | 1.53 | |||||||||
| Germany-based media company with stations also in Austria and Switzerland. | ||||||||||||
| Wolters Kluwer NV | 3,456,135 | 73,126 | 1.15 | |||||||||
| Information services and publishing company serving markets around the world. | ||||||||||||
| Bayerische Motoren Werke AG | 738,000 | 64,534 | 1.02 | |||||||||
| One of the world’s leading luxury car manufacturers (BMW). | ||||||||||||
| Honda Motor Co., Ltd. | 1,604,000 | 59,596 | .94 | |||||||||
| Develops, manufactures and sells automobiles, motorcycles and power equipment. | ||||||||||||
| Toyota Motor Corp. | 965,000 | 58,281 | .92 | |||||||||
| One of the world’s largest automotive manufacturers. | ||||||||||||
| SJM Holdings Ltd. | 19,700,000 | 47,904 | .75 | |||||||||
| Hong Kong-based operator of casinos, hotels and casino games in Macau. | ||||||||||||
| Other securities | 318,965 | 5.02 | ||||||||||
| 719,585 | 11.33 | |||||||||||
| Energy 9.07% | ||||||||||||
| Royal Dutch Shell PLC, Class B | 5,034,300 | 166,614 | 2.63 | |||||||||
| A global group of energy and oil companies. | ||||||||||||
| TOTAL SA | 2,578,800 | 125,893 | 1.98 | |||||||||
| One of the world’s leading integrated oil and gas companies. | ||||||||||||
| Enbridge Inc. | 2,184,192 | 91,816 | 1.45 | |||||||||
| Transports crude oil and natural gas via its pipeline network. | ||||||||||||
| Keyera Corp. | 800,000 | 43,024 | .68 | |||||||||
| Natural gas midstream operator in Canada. | ||||||||||||
| Crescent Point Energy Corp. | 1,260,000 | 42,735 | .67 | |||||||||
| Canada-based oil and gas producer. | ||||||||||||
| Other securities | 105,560 | 1.66 | ||||||||||
| 575,642 | 9.07 | |||||||||||
| Industrials 8.46% | ||||||||||||
| Wolseley PLC | 1,073,408 | 49,517 | .78 | |||||||||
| Distributor of plumbing and heating products and a supplier of building materials. | ||||||||||||
| Schneider Electric SA | 649,032 | 47,081 | .74 | |||||||||
| An international supplier of industrial electrical equipment and industrial automation equipment. | ||||||||||||
| Marubeni Corp. | 6,870,000 | 45,925 | .72 | |||||||||
| Japan-based trading company. | ||||||||||||
| Meggitt PLC | 5,053,300 | 39,774 | .63 | |||||||||
| Manufacturer of components and subsystems for the aerospace, defense and energy markets. | ||||||||||||
| International Growth and Income Fund | 13 |
| Common stocks (continued) | Shares | Value (000) | Percent of net assets | |||||||||
| Industrials (continued) | ||||||||||||
| Kubota Corp. | 2,680,000 | $ | 39,127 | .62 | % | |||||||
| Japan-based manufacturer of farm equipment, engines and construction machinery. | ||||||||||||
| Other securities | 315,758 | 4.97 | ||||||||||
| 537,182 | 8.46 | |||||||||||
| Information technology 7.37% | ||||||||||||
| Taiwan Semiconductor Manufacturing Co. Ltd. | 43,391,506 | 160,704 | 2.53 | |||||||||
| One of the world’s largest semiconductor manufacturers. | ||||||||||||
| STMicroelectronics NV | 13,227,000 | 119,158 | 1.88 | |||||||||
| Manufacturer of integrated circuits used in telecommunications, automotive, industrial and computing devices. | ||||||||||||
| Quanta Computer Inc.1 | 34,829,835 | 75,538 | 1.19 | |||||||||
| Designer and manufacturer of notebook computers; also makes servers, monitors and mobile phones. | ||||||||||||
| Other securities | 112,313 | 1.77 | ||||||||||
| 467,713 | 7.37 | |||||||||||
| Health care 6.31% | ||||||||||||
| Novartis AG | 2,313,100 | 164,321 | 2.59 | |||||||||
| One of the world’s largest pharmaceutical companies. | ||||||||||||
| AstraZeneca PLC | 1,475,000 | 69,882 | 1.10 | |||||||||
| This global pharmaceutical company makes drugs for the treatment of gastrointestinal disorders, cardiovascular disease and cancer. | ||||||||||||
| Other securities | 166,660 | 2.62 | ||||||||||
| 400,863 | 6.31 | |||||||||||
| Utilities 6.01% | ||||||||||||
| National Grid PLC | 11,128,270 | 126,264 | 1.99 | |||||||||
| Operates electricity networks in the U.K. and U.S. | ||||||||||||
| Power Assets Holdings Ltd. | 12,028,000 | 103,748 | 1.63 | |||||||||
| Hong Kong-based electric utility and natural gas and coal power company. | ||||||||||||
| GDF SUEZ | 4,862,249 | 95,219 | 1.50 | |||||||||
| Major natural gas and electricity company based in France. | ||||||||||||
| Other securities | 56,458 | .89 | ||||||||||
| 381,689 | 6.01 | |||||||||||
| Telecommunication services 5.90% | ||||||||||||
| Advanced Info Service PCL | 8,720,500 | 79,290 | 1.25 | |||||||||
| Thailand’s largest cellular mobile phone operator. | ||||||||||||
| Vodafone Group PLC | 17,762,052 | 50,748 | .80 | |||||||||
| One of the leading global operators of mobile telephone services. | ||||||||||||
| MTN Group Ltd. | 2,533,000 | 47,149 | .74 | |||||||||
| Major telecommunications provider serving Africa and the Middle East. | ||||||||||||
| Other securities | 197,713 | 3.11 | ||||||||||
| 374,900 | 5.90 | |||||||||||
| Consumer staples 5.19% | ||||||||||||
| British American Tobacco PLC | 1,951,300 | 99,942 | 1.57 | |||||||||
| The world’s second-largest tobacco company. | ||||||||||||
| Imperial Tobacco Group PLC | 1,200,000 | 41,613 | .66 | |||||||||
| Makes cigarettes and other tobacco products under several brand names in the U.K. and Europe. | ||||||||||||
| Nestlé SA | 604,700 | 39,660 | .62 | |||||||||
| Global packaged food and beverage company based in Switzerland. | ||||||||||||
| 14 | International Growth and Income Fund |
| Shares | Value (000) | Percent of net assets | ||||||||||
| Shoprite Holdings Ltd. | 631,000 | $ | 11,841 | .19 | % | |||||||
| Major food retailer in Africa. | ||||||||||||
| Other securities | 136,346 | 2.15 | ||||||||||
| 329,402 | 5.19 | |||||||||||
| Materials 4.79% | ||||||||||||
| L’Air Liquide SA, bonus shares2 | 495,511 | 61,190 | ||||||||||
| L’Air Liquide SA, non-registered shares | 37,000 | 4,569 | 1.03 | |||||||||
| Global supplier of industrial gases. | ||||||||||||
| Amcor Ltd. | 5,125,000 | 47,527 | .75 | |||||||||
| One of the world’s leading packaging companies. | ||||||||||||
| Other securities | 191,180 | 3.01 | ||||||||||
| 304,466 | 4.79 | |||||||||||
| Miscellaneous 1.87% | ||||||||||||
| Other common stocks in initial period of acquisition | 118,875 | 1.87 | ||||||||||
| Total common stocks (cost: $4,993,193,000) | 5,735,618 | 90.32 | ||||||||||
| Preferred stocks 0.20% | ||||||||||||
| Financials 0.20% | ||||||||||||
| HSBC Holdings PLC, Series 2, 8.00% | 472,795 | 12,847 | .20 | |||||||||
| Total preferred stocks (cost: $12,000,000) | 12,847 | .20 | ||||||||||
| Convertible securities 1.05% | Principal amount (000) | |||||||||||
| Consumer staples 0.82% | ||||||||||||
| Shoprite Holdings Ltd. 6.50% convertible notes 2017 | ZAR | 423,482 | 51,837 | .82 | ||||||||
| Financials 0.23% | ||||||||||||
| Other securities | 14,613 | .23 | ||||||||||
| Total convertible securities (cost: $73,750,000) | 66,450 | 1.05 | ||||||||||
| Bonds, notes & other debt instruments 2.01% | ||||||||||||
| Financials 0.32% | ||||||||||||
| SMFG Preferred Capital USD 3 Ltd., junior subordinated 9.50% (undated) 3,4 | $ | 5,410 | 6,681 | .10 | ||||||||
| Other securities | 13,802 | .22 | ||||||||||
| 20,483 | .32 | |||||||||||
| Consumer staples 0.24% | ||||||||||||
| British American Tobacco International Finance PLC 8.125%–9.50% 2013–20183 | 14,159 | 15,155 | .24 | |||||||||
| Other 1.45% | ||||||||||||
| Other securities | 92,279 | 1.45 | ||||||||||
| Total bonds, notes & other debt instruments (cost: $116,464,000) | 127,917 | 2.01 | ||||||||||
| International Growth and Income Fund | 15 |
| Short-term securities 6.29% | Principal amount (000) | Value (000) | Percent of net assets | |||||||||
| Freddie Mac 0.10%–0.112% due 12/9–12/19/2013 | $ | 82,800 | $ | 82,756 | 1.30 | % | ||||||
| Federal Home Loan Bank 0.08%–0.10% due 7/5–12/16/2013 | 80,500 | 80,473 | 1.27 | |||||||||
| Bank of Nova Scotia 0.145% due 7/15/2013 | 44,900 | 44,897 | .71 | |||||||||
| Sumitomo Mitsui Banking Corp. 0.18% due 7/17/20133 | 13,500 | 13,499 | .21 | |||||||||
| Other securities | 177,818 | 2.80 | ||||||||||
| Total short-term securities (cost: $399,441,000) | 399,443 | 6.29 | ||||||||||
| Total investment securities (cost: $5,594,848,000) | 6,342,275 | 99.87 | ||||||||||
| Other assets less liabilities | 8,130 | .13 | ||||||||||
| Net assets | $ | 6,350,405 | 100.00 | % | ||||||||
As permitted by U.S. Securities and Exchange Commission regulations, “Miscellaneous” securities include holdings in their first year of acquisition that have not previously been publicly disclosed.
“Other securities” includes all issues that are not disclosed separately in the summary investment portfolio, including securities which were pledged as collateral for net losses on unsettled forward currency contracts. The total value of pledged collateral was $637,000, which represented .01% of the net assets of the fund.
The descriptions of the companies shown in the summary investment portfolio, which were obtained from published reports and other sources believed to be reliable, are supplemental and are not covered by the Report of Independent Registered Public Accounting Firm.
Forward currency contracts
The fund has entered into forward currency contracts to sell currency as shown in the following table. The open forward currency contracts shown are generally indicative of the level of activity over the prior 12-month period.
| Contract amount | Unrealized appreciation at | ||||||||||||||||
| Settlement date | Counterparty | Receive (000) | Deliver (000) | 6/30/2013 (000) | |||||||||||||
| Sales: | |||||||||||||||||
| Japanese yen | 7/12/2013 | Bank of New York Mellon | $24,282 | ¥2,400,000 | $ | 82 | |||||||||||
| Japanese yen | 7/17/2013 | HSBC Bank | $116,958 | ¥11,372,592 | 2,284 | ||||||||||||
| Japanese yen | 7/31/2013 | Citibank | $7,161 | ¥700,000 | 102 | ||||||||||||
| Japanese yen | 7/31/2013 | UBS AG | $5,087 | ¥496,922 | 76 | ||||||||||||
| $ | 2,544 | ||||||||||||||||
The following footnotes apply to either the individual securities noted or one or more of the securities aggregated and listed as a single line item.
| 1 | Security did not produce income during the last 12 months. |
| 2 | Valued under fair value procedures adopted by authority of the board of trustees. The total value of all such securities was $108,894,000, which represented 1.71% of the net assets of the fund. |
| 3 | Acquired in a transaction exempt from registration under Rule 144A or section 4(2) of the Securities Act of 1933. May be resold in the U.S. in transactions exempt from registration, normally to qualified institutional buyers. The total value of all such securities, including those in “Other securities,” was $161,279,000, which represented 2.54% of the net assets of the fund. |
| 4 | Coupon rate may change periodically. |
Key to abbreviations and symbol
ADR = American Depositary Receipts
¥ = Japanese yen
ZAR = South African rand
See Notes to Financial Statements
| 16 | International Growth and Income Fund |
| Statement of assets and liabilities | ||||||||
| at June 30, 2013 | (dollars in thousands) | |||||||
| Assets: | ||||||||
| Investment securities, at value (cost: $5,594,848) | $ | 6,342,275 | ||||||
| Cash denominated in currencies other than U.S. dollars (cost: $4,875) | 4,867 | |||||||
| Cash | 82 | |||||||
| Unrealized appreciation on open forward currency contracts | 2,544 | |||||||
| Receivables for: | ||||||||
| Sales of investments | $ | 9,447 | ||||||
| Sales of fund’s shares | 14,059 | |||||||
| Dividends and interest | 28,625 | 52,131 | ||||||
| 6,401,899 | ||||||||
| Liabilities: | ||||||||
| Payables for: | ||||||||
| Purchases of investments | 41,108 | |||||||
| Repurchases of fund’s shares | 4,552 | |||||||
| Investment advisory services | 2,661 | |||||||
| Services provided by related parties | 1,766 | |||||||
| Trustees’ deferred compensation | 1,213 | |||||||
| Other | 194 | 51,494 | ||||||
| Net assets at June 30, 2013 | $ | 6,350,405 | ||||||
| Net assets consist of: | ||||||||
| Capital paid in on shares of beneficial interest | $ | 5,383,292 | ||||||
| Distributions in excess of net investment income | (6,399 | ) | ||||||
| Undistributed net realized gain | 223,832 | |||||||
| Net unrealized appreciation | 749,680 | |||||||
| Net assets at June 30, 2013 | $ | 6,350,405 | ||||||
(dollars and shares in thousands, except per share amounts)
Shares of beneficial interest issued and outstanding (no stated par value) —
unlimited shares authorized (198,077 total shares outstanding)
| Net assets | Shares outstanding | Net asset value per share | ||||||||||
| Class A | $ | 3,702,658 | 115,477 | $ | 32.06 | |||||||
| Class B | 17,113 | 534 | 32.04 | |||||||||
| Class C | 225,173 | 7,037 | 32.00 | |||||||||
| Class F-1 | 844,013 | 26,328 | 32.06 | |||||||||
| Class F-2 | 696,946 | 21,730 | 32.07 | |||||||||
| Class 529-A | 92,904 | 2,900 | 32.03 | |||||||||
| Class 529-B | 787 | 24 | 32.01 | |||||||||
| Class 529-C | 23,252 | 729 | 31.91 | |||||||||
| Class 529-E | 3,354 | 105 | 32.03 | |||||||||
| Class 529-F-1 | 6,815 | 212 | 32.07 | |||||||||
| Class R-1 | 5,443 | 170 | 32.01 | |||||||||
| Class R-2 | 39,748 | 1,244 | 31.94 | |||||||||
| Class R-3 | 33,197 | 1,037 | 32.02 | |||||||||
| Class R-4 | 26,017 | 812 | 32.05 | |||||||||
| Class R-5 | 39,903 | 1,240 | 32.19 | |||||||||
| Class R-6 | 593,082 | 18,498 | 32.06 | |||||||||
See Notes to Financial Statements
| International Growth and Income Fund | 17 |
| Statement of operations | ||||||||
| for the year ended June 30, 2013 | (dollars in thousands) | |||||||
| Investment income: | ||||||||
| Income: | ||||||||
| Dividends (net of non-U.S. taxes of $19,664) | $ | 196,274 | ||||||
| Interest | 12,453 | $ | 208,727 | |||||
| Fees and expenses*: | ||||||||
| Investment advisory services | 29,110 | |||||||
| Distribution services | 12,992 | |||||||
| Transfer agent services | 6,504 | |||||||
| Administrative services | 1,432 | |||||||
| Reports to shareholders | 345 | |||||||
| Registration statement and prospectus | 326 | |||||||
| Trustees’ compensation | 660 | |||||||
| Auditing and legal | 160 | |||||||
| Custodian | 1,001 | |||||||
| Other | 188 | 52,718 | ||||||
| Net investment income | 156,009 | |||||||
| Net realized gain and unrealized appreciation on investments, forward currency contracts and currency: | ||||||||
| Net realized gain (loss) on: | ||||||||
| Investments (net of non-U.S. taxes of $26) | 271,506 | |||||||
| Forward currency contracts | (2,333 | ) | ||||||
| Currency transactions | (545 | ) | 268,628 | |||||
| Net unrealized appreciation (depreciation) on: | ||||||||
| Investments | 463,129 | |||||||
| Forward currency contracts | 2,544 | |||||||
| Currency translations | (404 | ) | 465,269 | |||||
| Net realized gain and unrealized appreciation on investments, forward currency contracts and currency | 733,897 | |||||||
| Net increase in net assets resulting from operations | $ | 889,906 | ||||||
*Additional information related to class-specific fees and expenses is included in the Notes to Financial Statements.
See Notes to Financial Statements
| 18 | International Growth and Income Fund |
Statements of changes in net assets
(dollars in thousands)
| Year ended June 30 | ||||||||
| 2013 | 2012 | |||||||
| Operations: | ||||||||
| Net investment income | $ | 156,009 | $ | 136,564 | ||||
| Net realized gain (loss) on investments, forward currency contracts and currency transactions | 268,628 | (46,366 | ) | |||||
| Net unrealized appreciation (depreciation) on investments, forward currency contracts and currency translations | 465,269 | (613,572 | ) | |||||
| Net increase (decrease) in net assets resulting from operations | 889,906 | (523,374 | ) | |||||
| Dividends and distributions paid to shareholders: | ||||||||
| Dividends from net investment income | (159,324 | ) | (143,441 | ) | ||||
| Distributions from net realized gain on investments | — | (82,547 | ) | |||||
| Total dividends and distributions paid to shareholders | (159,324 | ) | (225,988 | ) | ||||
| Net capital share transactions | 728,944 | 512,428 | ||||||
| Total increase (decrease) in net assets | 1,459,526 | (236,934 | ) | |||||
| Net assets: | ||||||||
| Beginning of year | 4,890,879 | 5,127,813 | ||||||
| End of year (including distributions in excess of net investment income: $(6,399) and $(2,316), respectively) | $ | 6,350,405 | $ | 4,890,879 | ||||
See Notes to Financial Statements
| International Growth and Income Fund | 19 |
Notes to financial statements
1. Organization
International Growth and Income Fund (the “fund”) is registered under the Investment Company Act of 1940 as an open-end, diversified management investment company. The fund seeks to provide long-term growth of capital with current income by investing primarily in the stocks of larger, well-established companies domiciled outside the U.S.
The fund has 16 share classes consisting of five retail share classes (Classes A, B and C, as well as two F share classes, F-1 and F-2), five 529 college savings plan share classes (Classes 529-A, 529-B, 529-C, 529-E and 529-F-1) and six retirement plan share classes (Classes R-1, R-2, R-3, R-4, R-5 and R-6). The 529 college savings plan share classes can be used to save for college education. The retirement plan share classes are generally offered only through eligible employer-sponsored retirement plans. The fund’s share classes are further described below:
| Share class | Initial sales charge | Contingent deferred sales charge upon redemption | Conversion feature | |||
| Classes A and 529-A | Up to 5.75% | None (except 1% for certain redemptions within one year of purchase without an initial sales charge) | None | |||
| Classes B and 529-B* | None | Declines from 5% to 0% for redemptions within six years of purchase | Classes B and 529-B convert to Classes A and 529-A, respectively, after eight years | |||
| Class C | None | 1% for redemptions within one year of purchase | Class C converts to Class F-1 after 10 years | |||
| Class 529-C | None | 1% for redemptions within one year of purchase | None | |||
| Class 529-E | None | None | None | |||
| Classes F-1, F-2 and 529-F-1 | None | None | None | |||
| Classes R-1, R-2, R-3, R-4, R-5 and R-6 | None | None | None |
* Class B and 529-B shares of the fund are not available for purchase.
Holders of all share classes have equal pro rata rights to assets, dividends and liquidation proceeds. Each share class has identical voting rights, except for the exclusive right to vote on matters affecting only its class. Share classes have different fees and expenses (“class-specific fees and expenses”), primarily due to different arrangements for distribution, administrative and shareholder services. Differences in class-specific fees and expenses will result in differences in net investment income and, therefore, the payment of different per-share dividends by each share class.
2. Significant accounting policies
The financial statements have been prepared to comply with accounting principles generally accepted in the United States of America. These principles require management to make estimates and assumptions that affect reported amounts and disclosures. Actual results could differ from those estimates. The fund follows the significant accounting policies described below, as well as the valuation policies described in the next section on valuation.
Security transactions and related investment income — Security transactions are recorded by the fund as of the date the trades are executed with brokers. Realized gains and losses from security transactions are determined based on the specific identified cost of the securities. In the event a security is purchased with a delayed payment date, the fund will segregate liquid assets sufficient to meet its payment obligations. Dividend income is recognized on the ex-dividend date and interest income is recognized on an accrual basis. Market discounts, premiums and original issue discounts on fixed-income securities are amortized daily over the expected life of the security.
Class allocations — Income, fees and expenses (other than class-specific fees and expenses) and realized and unrealized gains and losses are allocated daily among the various share classes based on their relative net assets. Class-specific fees and expenses, such as distribution, administrative and shareholder services, are charged directly to the respective share class.
Dividends and distributions to shareholders — Dividends and distributions to shareholders are recorded on the ex-dividend date.
| 20 | International Growth and Income Fund |
Currency translation — Assets and liabilities, including investment securities, denominated in currencies other than U.S. dollars are translated into U.S. dollars at the exchange rates supplied by one or more pricing vendors on the valuation date. Purchases and sales of investment securities and income and expenses are translated into U.S. dollars at the exchange rates on the dates of such transactions. On the accompanying financial statements, the effects of changes in exchange rates on investment securities are included with the net realized gain or loss and net unrealized appreciation or depreciation on investments. The realized gain or loss and unrealized appreciation or depreciation resulting from all other transactions denominated in currencies other than U.S. dollars are disclosed separately.
3. Valuation
Capital Research and Management Company (“CRMC”), the fund’s investment adviser, values the fund’s investments at fair value as defined by accounting principles generally accepted in the United States of America. The net asset value of each share class of the fund is generally determined as of approximately 4:00 p.m. New York time each day the New York Stock Exchange is open.
Methods and inputs — The fund’s investment adviser uses the following methods and inputs to establish the fair value of the fund’s assets and liabilities. Use of particular methods and inputs may vary over time based on availability and relevance as market and economic conditions evolve.
Equity securities are generally valued at the official closing price of, or the last reported sale price on, the exchange or market on which such securities are traded, as of the close of business on the day the securities are being valued or, lacking any sales, at the last available bid price. Prices for each security are taken from the principal exchange or market on which the security trades.
Fixed-income securities, including short-term securities purchased with more than 60 days left to maturity, are generally valued at prices obtained from one or more pricing vendors. Vendors value such securities based on one or more of the inputs described in the following table. The table provides examples of inputs that are commonly relevant for valuing particular classes of fixed-income securities in which the fund is authorized to invest. However, these classifications are not exclusive, and any of the inputs may be used to value any other class of fixed-income security.
| Fixed-income class | Examples of standard inputs | |
| All | Benchmark yields, transactions, bids, offers, quotations from dealers and trading systems, new issues, spreads and other relationships observed in the markets among comparable securities; and proprietary pricing models such as yield measures calculated using factors such as cash flows, financial or collateral performance and other reference data (collectively referred to as “standard inputs”) | |
| Corporate bonds & notes; convertible securities | Standard inputs and underlying equity of the issuer | |
| Bonds & notes of governments & government agencies | Standard inputs and interest rate volatilities | |
| Mortgage-backed; asset-backed obligations | Standard inputs and cash flows, prepayment information, default rates, delinquency and loss assumptions, collateral characteristics, credit enhancements and specific deal information |
When the fund’s investment adviser deems it appropriate to do so (such as when vendor prices are unavailable or not deemed to be representative), fixed-income securities will be valued in good faith at the mean quoted bid and ask prices that are reasonably and timely available (or bid prices, if ask prices are not available) or at prices for securities of comparable maturity, quality and type.
Securities with both fixed-income and equity characteristics, or equity securities traded principally among fixed-income dealers, are generally valued in the manner described above for either equity or fixed-income securities, depending on which method is deemed most appropriate by the fund’s investment adviser. Short-term securities purchased within 60 days to maturity are valued at amortized cost, which approximates fair value. The value of short-term securities originally purchased with maturities greater than 60 days is determined based on an amortized value to par when they reach 60 days. Forward currency contracts are valued at the mean of representative quoted bid and ask prices, generally based on prices supplied by one or more pricing vendors.
Securities and other assets for which representative market quotations are not readily available or are considered unreliable by the fund’s investment adviser are fair valued as determined in good faith under fair valuation guidelines adopted by authority of the fund’s board of trustees as further described below. The investment adviser follows fair valuation guidelines, consistent with U.S. Securities and Exchange Commission rules and guidance, to consider relevant principles and factors when making fair value determinations.
| International Growth and Income Fund | 21 |
The investment adviser considers relevant indications of value that are reasonably and timely available to it in determining the fair value to be assigned to a particular security, such as the type and cost of the security; contractual or legal restrictions on resale of the security; relevant financial or business developments of the issuer; actively traded similar or related securities; conversion or exchange rights on the security; related corporate actions; significant events occurring after the close of trading in the security; and changes in overall market conditions. In addition, the closing prices of equity securities that trade in markets outside U.S. time zones may be adjusted to reflect significant events that occur after the close of local trading but before the net asset value of each share class of the fund is determined. Fair valuations and valuations of investments that are not actively trading involve judgment and may differ materially from valuations that would have been used had greater market activity occurred.
Processes and structure — The fund’s board of trustees has delegated authority to the fund’s investment adviser to make fair value determinations, subject to board oversight. The investment adviser has established a Joint Fair Valuation Committee (the “Fair Valuation Committee”) to administer, implement and oversee the fair valuation process, and to make fair value decisions. The Fair Valuation Committee regularly reviews its own fair value decisions, as well as decisions made under its standing instructions to the investment adviser’s valuation teams. The Fair Valuation Committee reviews changes in fair value measurements from period to period and may, as deemed appropriate, update the fair valuation guidelines to better reflect the results of back testing and address new or evolving issues. The Fair Valuation Committee reports any changes to the fair valuation guidelines to the board of trustees with supplemental information to support the changes. The fund’s board and audit committee also regularly review reports that describe fair value determinations and methods.
The fund’s investment adviser has also established a Fixed-Income Pricing Review Group to administer and oversee the fixed-income valuation process, including the use of fixed-income pricing vendors. This group regularly reviews pricing vendor information and market data. Pricing decisions, processes and controls over security valuation are also subject to additional internal reviews, including an annual control self-evaluation program facilitated by the investment adviser’s compliance group.
Classifications — The fund’s investment adviser classifies the fund’s assets and liabilities into three levels based on the inputs used to value the assets or liabilities. Level 1 values are based on quoted prices in active markets for identical securities. Level 2 values are based on significant observable market inputs, such as quoted prices for similar securities and quoted prices in inactive markets. Certain securities trading outside the U.S. may transfer between Level 1 and Level 2 due to valuation adjustments resulting from significant market movements following the close of local trading. Level 3 values are based on significant unobservable inputs that reflect the investment adviser’s determination of assumptions that market participants might reasonably use in valuing the securities. The valuation levels are not necessarily an indication of the risk or liquidity associated with the underlying investment. For example, U.S. government securities are reflected as Level 2 because the inputs used to determine fair value may not always be quoted prices in an active market. The following tables present the fund’s valuation levels as of June 30, 2013 (dollars in thousands):
| Investment securities | ||||||||||||||||
| Level 1* | Level 2 | Level 3 | Total | |||||||||||||
| Assets: | ||||||||||||||||
| Common stocks: | ||||||||||||||||
| Financials | $ | 1,477,597 | $ | — | $ | 47,704 | $ | 1,525,301 | ||||||||
| Consumer discretionary | 719,585 | — | — | 719,585 | ||||||||||||
| Energy | 575,642 | — | — | 575,642 | ||||||||||||
| Industrials | 537,182 | — | — | 537,182 | ||||||||||||
| Information technology | 467,713 | — | — | 467,713 | ||||||||||||
| Health care | 400,863 | — | — | 400,863 | ||||||||||||
| Utilities | 381,689 | — | — | 381,689 | ||||||||||||
| Telecommunication services | 374,900 | — | — | 374,900 | ||||||||||||
| Consumer staples | 329,402 | — | — | 329,402 | ||||||||||||
| Materials | 243,276 | 61,190 | — | 304,466 | ||||||||||||
| Miscellaneous | 118,875 | — | — | 118,875 | ||||||||||||
| Preferred stocks | — | 12,847 | — | 12,847 | ||||||||||||
| Convertible securities | — | 66,450 | — | 66,450 | ||||||||||||
| Bonds, notes & other debt instruments | — | 127,917 | — | 127,917 | ||||||||||||
| Short-term securities | — | 399,443 | — | 399,443 | ||||||||||||
| Total | $ | 5,626,724 | $ | 667,847 | $ | 47,704 | $ | 6,342,275 | ||||||||
| * | Securities with a market value of $3,994,437,000, which represented 62.90% of the net assets of the fund, transferred from Level 2 to Level 1 since the prior fiscal year-end, primarily due to a lack of significant market movements following the close of local trading. |
| 22 | International Growth and Income Fund |
| Other investments† | ||||||||||||||||
| Level 1 | Level 2 | Level 3 | Total | |||||||||||||
| Assets: | ||||||||||||||||
| Unrealized appreciation on open forward currency contracts | $ | — | $ | 2,544 | $ | — | $ | 2,544 | ||||||||
| † | Forward currency contracts are not included in the investment portfolio. |
4. Risk factors
Investing in the fund may involve certain risks including, but not limited to, those described below.
Market conditions — The prices of, and the income generated by, the common stocks and other securities held by the fund may decline due to market conditions and other factors, including those directly involving the issuers of securities held by the fund.
Investing outside the U.S. — Securities of issuers domiciled outside the U.S., or with significant operations outside the U.S., may lose value because of adverse political, social, economic or market developments in the countries or regions in which the issuers operate. These securities may also lose value due to changes in foreign currency exchange rates against the U.S. dollar and/or currencies of other countries. Securities markets in certain countries may be more volatile and/or less liquid than those in the U.S. Investments outside the U.S. may also be subject to different settlement and accounting practices and different regulatory, legal and reporting standards, and may be more difficult to value, than those in the U.S. The risks of investing outside the U.S. may be heightened in connection with investments in emerging markets.
Investing in emerging markets — Investing in emerging markets may involve risks in addition to and greater than those generally associated with investing in developed countries. For instance, developing countries may have less developed legal and accounting systems than those in developed countries. The governments of these countries may be less stable and more likely to impose capital controls, nationalize a company or industry, place restrictions on foreign ownership and on withdrawing sale proceeds of securities from the country, and/or impose punitive taxes that could adversely affect the prices of securities. In addition, the economies of these countries may be dependent on relatively few industries that are more susceptible to local and global changes. Securities markets in these countries can also be relatively small and have substantially lower trading volumes. As a result, securities issued in these countries may be more volatile and less liquid, and may be more difficult to value, than securities issued in countries with more developed economies and/or markets. Additionally, there may be increased settlement risks for transactions in local securities.
Investing in growth-oriented stocks — Growth-oriented stocks may involve larger price swings and greater potential for loss than other types of investments.
Investing in income-oriented stocks — Income provided by the fund may be reduced by changes in the dividend policies of, and the capital resources available at, the companies in which the fund invests.
Management — The investment adviser to the fund actively manages the fund’s investments. Consequently, the fund is subject to the risk that the methods and analyses employed by the investment adviser in this process may not produce the desired results. This could cause the fund to lose value or its investment results to lag relevant benchmarks or other funds with similar objectives.
| International Growth and Income Fund | 23 |
5. Certain investment techniques
Forward currency contracts — The fund has entered into forward currency contracts, which represent agreements to exchange currencies on specific future dates at predetermined rates. The fund’s investment adviser uses forward currency contracts to manage the fund’s exposure to changes in exchange rates. Upon entering into these contracts, risks may arise from the potential inability of counterparties to meet the terms of their contracts and from possible movements in exchange rates.
On a daily basis, the fund’s investment adviser values forward currency contracts based on the applicable exchange rates and records unrealized appreciation or depreciation for open forward currency contracts in the fund’s statement of assets and liabilities. Realized gains or losses are recorded at the time the forward currency contract is closed or offset by another contract with the same broker for the same settlement date and currency. Closed forward currency contracts that have not reached their settlement date are included in the respective receivables or payables for closed forward currency contracts in the fund’s statement of assets and liabilities. Net realized gains or losses from closed forward currency contracts and net unrealized appreciation or depreciation from open forward currency contracts are recorded in the fund’s statement of operations.
Collateral — To reduce the risk to counterparties of forward currency contracts, the fund has entered into a collateral program with certain counterparties. The program calls for the fund to either receive or pledge collateral based on the net gain or loss on unsettled forward currency contracts by counterparty. The purpose of the collateral is to cover potential losses that could occur in the event that either party cannot meet its contractual obligations.
6. Taxation and distributions
Federal income taxation — The fund complies with the requirements under Subchapter M of the Internal Revenue Code applicable to mutual funds and intends to distribute substantially all of its net taxable income and net capital gains each year. The fund is not subject to income taxes to the extent such distributions are made. Therefore, no federal income tax provision is required.
As of and during the period ended June 30, 2013, the fund did not have a liability for any unrecognized tax benefits. The fund recognizes interest and penalties, if any, related to unrecognized tax benefits as income tax expense in the statement of operations. During the period, the fund did not incur any interest or penalties.
The fund is not subject to examination by U.S. federal tax authorities for tax years before 2009, by state tax authorities for tax years before 2008 and by tax authorities outside the U.S. for tax years before 2011.
Non-U.S. taxation — Dividend and interest income are recorded net of non-U.S. taxes paid. Gains realized by the fund on the sale of securities in certain countries are subject to non-U.S. taxes. The fund records a liability based on unrealized gains to provide for potential non-U.S. taxes payable upon the sale of these securities.
Distributions — Distributions paid to shareholders are based on net investment income and net realized gains determined on a tax basis, which may differ from net investment income and net realized gains for financial reporting purposes. These differences are due primarily to different treatment for items such as currency gains and losses; short-term capital gains and losses; unrealized appreciation of certain investments in securities outside the U.S.; cost of investments sold; and net capital losses. The fiscal year in which amounts are distributed may differ from the year in which the net investment income and net realized gains are recorded by the fund for financial reporting purposes.
During the year ended June 30, 2013, the fund reclassified $752,000 to undistributed net realized gain and $16,000 to capital paid in on shares of beneficial interest from distributions in excess of net investment income to align financial reporting with tax reporting. The fund also utilized capital loss carryforward of $44,542,000.
| 24 | International Growth and Income Fund |
As of June 30, 2013, the tax basis components of distributable earnings, unrealized appreciation (depreciation) and cost of investment securities were as follows (dollars in thousands):
| Undistributed ordinary income | $ | 7,211 | ||
| Undistributed long-term capital gains | 224,838 | |||
| Gross unrealized appreciation on investment securities | 991,883 | |||
| Gross unrealized depreciation on investment securities | (255,956 | ) | ||
| Net unrealized appreciation on investment securities | 735,927 | |||
| Cost of investment securities | 5,606,348 |
The tax character of distributions paid to shareholders was as follows (dollars in thousands):
| Year ended June 30, 2013 | Year ended June 30, 2012 | |||||||||||||||||||||||
| Share class | Ordinary income | Long-term capital gains | Total distributions paid | Ordinary income | Long-term capital gains | Total distributions paid | ||||||||||||||||||
| Class A | $ | 95,896 | $ | — | $ | 95,896 | $ | 95,414 | $ | 56,512 | $ | 151,926 | ||||||||||||
| Class B | 348 | — | 348 | 486 | 425 | 911 | ||||||||||||||||||
| Class C | 4,138 | — | 4,138 | 4,380 | 3,538 | 7,918 | ||||||||||||||||||
| Class F-1 | 18,507 | — | 18,507 | 12,543 | 7,180 | 19,723 | ||||||||||||||||||
| Class F-2 | 18,570 | — | 18,570 | 13,265 | 5,505 | 18,770 | ||||||||||||||||||
| Class 529-A | 2,280 | — | 2,280 | 1,992 | 1,179 | 3,171 | ||||||||||||||||||
| Class 529-B | 15 | — | 15 | 23 | 21 | 44 | ||||||||||||||||||
| Class 529-C | 400 | — | 400 | 359 | 289 | 648 | ||||||||||||||||||
| Class 529-E | 71 | — | 71 | 60 | 38 | 98 | ||||||||||||||||||
| Class 529-F-1 | 160 | — | 160 | 105 | 54 | 159 | ||||||||||||||||||
| Class R-1 | 123 | — | 123 | 102 | 73 | 175 | ||||||||||||||||||
| Class R-2 | 717 | — | 717 | 605 | 452 | 1,057 | ||||||||||||||||||
| Class R-3 | 708 | — | 708 | 585 | 380 | 965 | ||||||||||||||||||
| Class R-4 | 607 | — | 607 | 393 | 209 | 602 | ||||||||||||||||||
| Class R-5 | 1,132 | — | 1,132 | 1,036 | 534 | 1,570 | ||||||||||||||||||
| Class R-6 | 15,652 | — | 15,652 | 12,093 | 6,158 | 18,251 | ||||||||||||||||||
| Total | $ | 159,324 | $ | — | $ | 159,324 | $ | 143,441 | $ | 82,547 | $ | 225,988 | ||||||||||||
7. Fees and transactions with related parties
CRMC, the fund’s investment adviser, is the parent company of American Funds Distributors,® Inc. (“AFD”), the principal underwriter of the fund’s shares, and American Funds Service Company® (“AFS”), the fund’s transfer agent. CRMC, AFD and AFS are considered related parties to the fund.
Investment advisory services — The fund has an investment advisory and service agreement with CRMC that provides for monthly fees accrued daily. These fees are based on a series of decreasing annual rates beginning with 0.690% on the first $500 million of daily net assets and decreasing to 0.460% on such assets in excess of $6.5 billion. For the year ended June 30, 2013, the investment advisory services fee was $29,110,000, which was equivalent to an annualized rate of 0.513% of average daily net assets.
Class-specific fees and expenses — Expenses that are specific to individual share classes are accrued directly to the respective share class. The principal class-specific fees and expenses are described below:
| Distribution services — The fund has plans of distribution for all share classes, except Class F-2, R-5 and R-6 shares. Under the plans, the board of trustees approves certain categories of expenses that are used to finance activities primarily intended to sell fund shares and service existing accounts. The plans provide for payments, based on an annualized percentage of average daily net assets, ranging from 0.30% to 1.00% as noted on the following page. In some cases, the board of trustees has limited the amounts that may be paid to less than the maximum allowed by the plans. All share classes with a plan may use up to 0.25% of average daily net assets to pay service fees, or to compensate AFD for paying service fees, to firms that have entered into agreements with AFD to provide certain shareholder services. The remaining amounts available to be paid under each plan are paid to dealers to compensate them for their sales activities. |
| International Growth and Income Fund | 25 |
| For Class A and 529-A shares, distribution-related expenses include the reimbursement of dealer and wholesaler commissions paid by AFD for certain shares sold without a sales charge. These share classes reimburse AFD for amounts billed within the prior 15 months but only to the extent that the overall annual expense limit of 0.30% is not exceeded. As of June 30, 2013, there were no unreimbursed expenses subject to reimbursement for Class A or 529-A shares. |
| Share class | Currently approved limits | Plan limits | ||||||
| Class A | 0.30 | % | 0.30 | % | ||||
| Class 529-A | 0.30 | 0.50 | ||||||
| Classes B and 529-B | 1.00 | 1.00 | ||||||
| Classes C, 529-C and R-1 | 1.00 | 1.00 | ||||||
| Class R-2 | 0.75 | 1.00 | ||||||
| Classes 529-E and R-3 | 0.50 | 0.75 | ||||||
| Classes F-1, 529-F-1 and R-4 | 0.25 | 0.50 | ||||||
| Transfer agent services — The fund has a shareholder services agreement with AFS under which the fund compensates AFS for providing transfer agent services to each of the fund’s share classes. These services include recordkeeping, shareholder communications and transaction processing. In addition, the fund reimburses AFS for amounts paid to third parties for performing transfer agent services on behalf of fund shareholders. | |
| Administrative services — The fund has an administrative services agreement with CRMC under which the fund compensates CRMC for providing administrative services to Class A, C, F, 529 and R shares. These services include, but are not limited to, coordinating, monitoring, assisting and overseeing third parties that provide services to fund shareholders. Under the agreement, Class A shares pay an annual fee of 0.01% and Class C, F, 529 and R shares pay an annual fee of 0.05% of their respective average daily net assets. | |
| 529 plan services — Each 529 share class is subject to service fees to compensate the Commonwealth of Virginia for the maintenance of the 529 college savings plan. The quarterly fee is based on a series of decreasing annual rates beginning with 0.10% on the first $30 billion of the net assets invested in Class 529 shares of the American Funds and decreasing to 0.06% on such assets between $120 billion and $150 billion. The fee for any given calendar quarter is accrued and calculated on the basis of the average net assets of Class 529 shares of the American Funds for the last month of the prior calendar quarter. The fee is included in other expenses on the accompanying financial statements. The Commonwealth of Virginia is not considered a related party. | |
| For the year ended June 30, 2013, class-specific expenses under the agreements were as follows (dollars in thousands): |
| Share class | Distribution services | Transfer agent services | Administrative services | 529 plan services | |||||||||||
| Class A | $8,309 | $4,433 | $349 | Not applicable | |||||||||||
| Class B | 190 | 25 | Not applicable | Not applicable | |||||||||||
| Class C | 2,126 | 284 | 106 | Not applicable | |||||||||||
| Class F-1 | 1,528 | 652 | 306 | Not applicable | |||||||||||
| Class F-2 | Not applicable | 745 | 307 | Not applicable | |||||||||||
| Class 529-A | 160 | 87 | 42 | $82 | |||||||||||
| Class 529-B | 9 | 1 | 1 | 1 | |||||||||||
| Class 529-C | 204 | 24 | 10 | 20 | |||||||||||
| Class 529-E | 14 | 2 | 1 | 3 | |||||||||||
| Class 529-F-1 | — | 5 | 3 | 5 | |||||||||||
| Class R-1 | 21 | 4 | 2 | Not applicable | |||||||||||
| Class R-2 | 253 | 149 | 18 | Not applicable | |||||||||||
| Class R-3 | 131 | 54 | 14 | Not applicable | |||||||||||
| Class R-4 | 47 | 20 | 10 | Not applicable | |||||||||||
| Class R-5 | Not applicable | 17 | 19 | Not applicable | |||||||||||
| Class R-6 | Not applicable | 2 | 244 | Not applicable | |||||||||||
| Total class-specific expenses | $12,992 | $6,504 | $1,432 | $111 | |||||||||||
Trustees’ deferred compensation — Trustees who are unaffiliated with CRMC may elect to defer the cash payment of part or all of their compensation. These deferred amounts, which remain as liabilities of the fund, are treated as if invested in shares of the fund or other American Funds. These amounts represent general, unsecured liabilities of the fund and vary according to the total returns of the selected funds. Trustees’ compensation of $660,000, shown on the accompanying financial statements, includes $437,000 in current fees (either paid in cash or deferred) and a net increase of $223,000 in the value of the deferred amounts.
| 26 | International Growth and Income Fund |
Affiliated officers and trustees — Officers and certain trustees of the fund are or may be considered to be affiliated with CRMC, AFD and AFS. No affiliated officers or trustees received any compensation directly from the fund.
8. Capital share transactions
Capital share transactions in the fund were as follows (dollars and shares in thousands):
| Sales* | Reinvestments of dividends and distributions | Repurchases* | Net increase (decrease) | |||||||||||||||||||||||||||||
| Share class | Amount | Shares | Amount | Shares | Amount | Shares | Amount | Shares | ||||||||||||||||||||||||
| Year ended June 30, 2013 | ||||||||||||||||||||||||||||||||
| Class A | $ | 540,443 | 17,064 | $ | 93,379 | 2,937 | $ | (534,888 | ) | (17,283 | ) | $ | 98,934 | 2,718 | ||||||||||||||||||
| Class B | 1,631 | 52 | 346 | 11 | (7,681 | ) | (249 | ) | (5,704 | ) | (186 | ) | ||||||||||||||||||||
| Class C | 42,564 | 1,345 | 4,059 | 128 | (44,792 | ) | (1,454 | ) | 1,831 | 19 | ||||||||||||||||||||||
| Class F-1 | 445,243 | 13,830 | 18,262 | 570 | (118,885 | ) | (3,803 | ) | 344,620 | 10,597 | ||||||||||||||||||||||
| Class F-2 | 189,867 | 5,980 | 17,665 | 555 | (101,296 | ) | (3,224 | ) | 106,236 | 3,311 | ||||||||||||||||||||||
| Class 529-A | 21,211 | 673 | 2,279 | 72 | (11,978 | ) | (386 | ) | 11,512 | 359 | ||||||||||||||||||||||
| Class 529-B | 122 | 4 | 15 | — | † | (532 | ) | (17 | ) | (395 | ) | (13 | ) | |||||||||||||||||||
| Class 529-C | 6,260 | 199 | 400 | 12 | (3,567 | ) | (116 | ) | 3,093 | 95 | ||||||||||||||||||||||
| Class 529-E | 1,061 | 33 | 71 | 3 | (410 | ) | (13 | ) | 722 | 23 | ||||||||||||||||||||||
| Class 529-F-1 | 2,915 | 91 | 160 | 5 | (608 | ) | (20 | ) | 2,467 | 76 | ||||||||||||||||||||||
| Class R-1 | 1,743 | 54 | 90 | 3 | (1,101 | ) | (36 | ) | 732 | 21 | ||||||||||||||||||||||
| Class R-2 | 13,640 | 438 | 693 | 21 | (8,354 | ) | (269 | ) | 5,979 | 190 | ||||||||||||||||||||||
| Class R-3 | 14,111 | 444 | 676 | 21 | (7,419 | ) | (237 | ) | 7,368 | 228 | ||||||||||||||||||||||
| Class R-4 | 12,871 | 411 | 573 | 18 | (4,761 | ) | (154 | ) | 8,683 | 275 | ||||||||||||||||||||||
| Class R-5 | 11,378 | 370 | 1,130 | 36 | (10,516 | ) | (339 | ) | 1,992 | 67 | ||||||||||||||||||||||
| Class R-6 | 151,296 | 4,752 | 15,652 | 491 | (26,074 | ) | (846 | ) | 140,874 | 4,397 | ||||||||||||||||||||||
| Total net increase (decrease) | $ | 1,456,356 | 45,740 | $ | 155,450 | 4,883 | $ | (882,862 | ) | (28,446 | ) | $ | 728,944 | 22,177 | ||||||||||||||||||
| Year ended June 30, 2012 | ||||||||||||||||||||||||||||||||
| Class A | $ | 588,644 | 20,553 | $ | 147,415 | 5,362 | $ | (693,180 | ) | (24,314 | ) | $ | 42,879 | 1,601 | ||||||||||||||||||
| Class B | 4,109 | 143 | 902 | 33 | (11,305 | ) | (397 | ) | (6,294 | ) | (221 | ) | ||||||||||||||||||||
| Class C | 45,871 | 1,608 | 7,755 | 283 | (56,072 | ) | (1,974 | ) | (2,446 | ) | (83 | ) | ||||||||||||||||||||
| Class F-1 | 206,182 | 7,249 | 19,474 | 709 | (146,810 | ) | (5,170 | ) | 78,846 | 2,788 | ||||||||||||||||||||||
| Class F-2 | 321,492 | 11,178 | 17,750 | 646 | (84,305 | ) | (2,978 | ) | 254,937 | 8,846 | ||||||||||||||||||||||
| Class 529-A | 20,617 | 723 | 3,170 | 115 | (10,653 | ) | (373 | ) | 13,134 | 465 | ||||||||||||||||||||||
| Class 529-B | 207 | 7 | 44 | 1 | (766 | ) | (27 | ) | (515 | ) | (19 | ) | ||||||||||||||||||||
| Class 529-C | 6,196 | 217 | 647 | 24 | (3,197 | ) | (112 | ) | 3,646 | 129 | ||||||||||||||||||||||
| Class 529-E | 946 | 33 | 97 | 3 | (708 | ) | (25 | ) | 335 | 11 | ||||||||||||||||||||||
| Class 529-F-1 | 1,991 | 70 | 159 | 5 | (511 | ) | (18 | ) | 1,639 | 57 | ||||||||||||||||||||||
| Class R-1 | 890 | 31 | 126 | 5 | (1,006 | ) | (35 | ) | 10 | 1 | ||||||||||||||||||||||
| Class R-2 | 14,319 | 501 | 1,010 | 37 | (7,029 | ) | (247 | ) | 8,300 | 291 | ||||||||||||||||||||||
| Class R-3 | 9,324 | 323 | 916 | 33 | (7,873 | ) | (273 | ) | 2,367 | 83 | ||||||||||||||||||||||
| Class R-4 | 7,621 | 267 | 546 | 20 | (3,027 | ) | (107 | ) | 5,140 | 180 | ||||||||||||||||||||||
| Class R-5 | 13,591 | 454 | 1,560 | 56 | (6,081 | ) | (210 | ) | 9,070 | 300 | ||||||||||||||||||||||
| Class R-6 | 93,065 | 3,295 | 18,251 | 664 | (9,936 | ) | (360 | ) | 101,380 | 3,599 | ||||||||||||||||||||||
| Total net increase (decrease) | $ | 1,335,065 | 46,652 | $ | 219,822 | 7,996 | $ | (1,042,459 | ) | (36,620 | ) | $ | 512,428 | 18,028 | ||||||||||||||||||
| * | Includes exchanges between share classes of the fund. |
| † | Amount less than one thousand. |
9. Investment transactions
The fund made purchases and sales of investment securities, excluding short-term securities and U.S. government obligations, if any, of $2,573,395,000 and $1,955,850,000, respectively, during the year ended June 30, 2013.
| International Growth and Income Fund | 27 |
Financial highlights
| Income (loss) from investment operations1 | Dividends and distributions | |||||||||||||||||||||||||||||||||||||||||||||||||||||
| Net asset value, beginning of period | Net investment income | Net gains (losses) on securities (both realized and unrealized) | Total from investment operations | Dividends (from net investment income) | Distributions (from capital gains) | Total dividends and distributions | Net asset value, end of period | Total return2,3 | Net assets, end of period (in millions) | Ratio of expenses to average net assets before reimbursements/ waivers | Ratio of expenses to average net assets after reimbursements/ waivers3 | Ratio of net income to average net assets3 | ||||||||||||||||||||||||||||||||||||||||||
| Class A: | Year ended 6/30/2013 | $ | 27.81 | $ | .84 | $ | 4.26 | $ | 5.10 | $ | (.85 | ) | $ | — | $ | (.85 | ) | $ | 32.06 | 18.41 | % | $ | 3,703 | .93 | % | .93 | % | 2.70 | % | |||||||||||||||||||||||||
| Year ended 6/30/2012 | 32.48 | .82 | (4.12 | ) | (3.30 | ) | (.86 | ) | (.51 | ) | (1.37 | ) | 27.81 | (10.03 | ) | 3,136 | .93 | .93 | 2.85 | |||||||||||||||||||||||||||||||||||
| Year ended 6/30/2011 | 25.86 | 1.06 | 6.80 | 7.86 | (1.06 | ) | (.18 | ) | (1.24 | ) | 32.48 | 30.64 | 3,611 | .89 | .89 | 3.43 | ||||||||||||||||||||||||||||||||||||||
| Year ended 6/30/2010 | 24.78 | .80 | 1.39 | 2.19 | (.74 | ) | (.37 | ) | (1.11 | ) | 25.86 | 8.44 | 2,515 | .94 | .93 | 2.79 | ||||||||||||||||||||||||||||||||||||||
| Period from 10/1/20084 to 6/30/20095 | 25.00 | .62 | (.39 | ) | .23 | (.45 | ) | — | (.45 | ) | 24.78 | 1.04 | 1,424 | 1.11 | 6 | 1.06 | 6 | 3.73 | 6 | |||||||||||||||||||||||||||||||||||
| Class B: | Year ended 6/30/2013 | 27.78 | .57 | 4.30 | 4.87 | (.61 | ) | — | (.61 | ) | 32.04 | 17.55 | 17 | 1.69 | 1.69 | 1.85 | ||||||||||||||||||||||||||||||||||||||
| Year ended 6/30/2012 | 32.44 | .57 | (4.09 | ) | (3.52 | ) | (.63 | ) | (.51 | ) | (1.14 | ) | 27.78 | (10.75 | ) | 20 | 1.70 | 1.70 | 1.98 | |||||||||||||||||||||||||||||||||||
| Year ended 6/30/2011 | 25.82 | .79 | 6.82 | 7.61 | (.81 | ) | (.18 | ) | (.99 | ) | 32.44 | 29.62 | 31 | 1.68 | 1.68 | 2.56 | ||||||||||||||||||||||||||||||||||||||
| Year ended 6/30/2010 | 24.75 | .56 | 1.40 | 1.96 | (.52 | ) | (.37 | ) | (.89 | ) | 25.82 | 7.60 | 28 | 1.72 | 1.71 | 1.96 | ||||||||||||||||||||||||||||||||||||||
| Period from 10/1/20084 to 6/30/20095 | 25.00 | .53 | (.42 | ) | .11 | (.36 | ) | — | (.36 | ) | 24.75 | .49 | 18 | 1.81 | 6 | 1.77 | 6 | 3.16 | 6 | |||||||||||||||||||||||||||||||||||
| Class C: | Year ended 6/30/2013 | 27.76 | .59 | 4.25 | 4.84 | (.60 | ) | — | (.60 | ) | 32.00 | 17.47 | 225 | 1.74 | 1.74 | 1.89 | ||||||||||||||||||||||||||||||||||||||
| Year ended 6/30/2012 | 32.42 | .58 | (4.10 | ) | (3.52 | ) | (.63 | ) | (.51 | ) | (1.14 | ) | 27.76 | (10.75 | ) | 195 | 1.73 | 1.73 | 2.05 | |||||||||||||||||||||||||||||||||||
| Year ended 6/30/2011 | 25.81 | .80 | 6.79 | 7.59 | (.80 | ) | (.18 | ) | (.98 | ) | 32.42 | 29.57 | 230 | 1.73 | 1.73 | 2.58 | ||||||||||||||||||||||||||||||||||||||
| Year ended 6/30/2010 | 24.75 | .57 | 1.38 | 1.95 | (.52 | ) | (.37 | ) | (.89 | ) | 25.81 | 7.55 | 167 | 1.75 | 1.74 | 2.00 | ||||||||||||||||||||||||||||||||||||||
| Period from 10/1/20084 to 6/30/20095 | 25.00 | .51 | (.41 | ) | .10 | (.35 | ) | — | (.35 | ) | 24.75 | .48 | 87 | 1.84 | 6 | 1.80 | 6 | 3.07 | 6 | |||||||||||||||||||||||||||||||||||
| Class F-1: | Year ended 6/30/2013 | 27.81 | .94 | 4.16 | 5.10 | (.85 | ) | — | (.85 | ) | 32.06 | 18.39 | 844 | .96 | .96 | 2.97 | ||||||||||||||||||||||||||||||||||||||
| Year ended 6/30/2012 | 32.49 | .84 | (4.16 | ) | (3.32 | ) | (.85 | ) | (.51 | ) | (1.36 | ) | 27.81 | (10.05 | ) | 437 | .94 | .94 | 2.92 | |||||||||||||||||||||||||||||||||||
| Year ended 6/30/2011 | 25.86 | 1.06 | 6.79 | 7.85 | (1.04 | ) | (.18 | ) | (1.22 | ) | 32.49 | 30.58 | 420 | .94 | .94 | 3.40 | ||||||||||||||||||||||||||||||||||||||
| Year ended 6/30/2010 | 24.78 | .79 | 1.39 | 2.18 | (.73 | ) | (.37 | ) | (1.10 | ) | 25.86 | 8.41 | 274 | .97 | .96 | 2.76 | ||||||||||||||||||||||||||||||||||||||
| Period from 10/1/20084 to 6/30/20095 | 25.00 | .63 | (.39 | ) | .24 | (.46 | ) | — | (.46 | ) | 24.78 | 1.06 | 164 | 1.07 | 6 | 1.03 | 6 | 3.76 | 6 | |||||||||||||||||||||||||||||||||||
| Class F-2: | Year ended 6/30/2013 | 27.81 | .92 | 4.26 | 5.18 | (.92 | ) | — | (.92 | ) | 32.07 | 18.64 | 697 | .73 | .73 | 2.95 | ||||||||||||||||||||||||||||||||||||||
| Year ended 6/30/2012 | 32.50 | .97 | (4.23 | ) | (3.26 | ) | (.92 | ) | (.51 | ) | (1.43 | ) | 27.81 | (9.82 | ) | 512 | .70 | .70 | 3.40 | |||||||||||||||||||||||||||||||||||
| Year ended 6/30/2011 | 25.87 | 1.13 | 6.79 | 7.92 | (1.11 | ) | (.18 | ) | (1.29 | ) | 32.50 | 30.87 | 311 | .71 | .71 | 3.65 | ||||||||||||||||||||||||||||||||||||||
| Year ended 6/30/2010 | 24.79 | .86 | 1.39 | 2.25 | (.80 | ) | (.37 | ) | (1.17 | ) | 25.87 | 8.69 | 199 | .71 | .70 | 3.02 | ||||||||||||||||||||||||||||||||||||||
| Period from 10/1/20084 to 6/30/20095 | 25.00 | .60 | (.31 | ) | .29 | (.50 | ) | — | (.50 | ) | 24.79 | 1.28 | 119 | .82 | 6 | .76 | 6 | 3.57 | 6 | |||||||||||||||||||||||||||||||||||
| Class 529-A: | Year ended 6/30/2013 | 27.78 | .83 | 4.25 | 5.08 | (.83 | ) | — | (.83 | ) | 32.03 | 18.35 | 93 | 1.00 | 1.00 | 2.66 | ||||||||||||||||||||||||||||||||||||||
| Year ended 6/30/2012 | 32.46 | .81 | (4.14 | ) | (3.33 | ) | (.84 | ) | (.51 | ) | (1.35 | ) | 27.78 | (10.13 | ) | 71 | 1.00 | 1.00 | 2.84 | |||||||||||||||||||||||||||||||||||
| Year ended 6/30/2011 | 25.85 | 1.09 | 6.75 | 7.84 | (1.05 | ) | (.18 | ) | (1.23 | ) | 32.46 | 30.62 | 67 | .94 | .94 | 3.50 | ||||||||||||||||||||||||||||||||||||||
| Year ended 6/30/2010 | 24.77 | .82 | 1.35 | 2.17 | (.72 | ) | (.37 | ) | (1.09 | ) | 25.85 | 8.33 | 35 | .99 | .98 | 2.87 | ||||||||||||||||||||||||||||||||||||||
| Period from 10/1/20084 to 6/30/20095 | 25.00 | .70 | (.49 | ) | .21 | (.44 | ) | — | (.44 | ) | 24.77 | .96 | 9 | 1.20 | 6 | 1.16 | 6 | 4.16 | 6 | |||||||||||||||||||||||||||||||||||
| Class 529-B: | Year ended 6/30/2013 | 27.75 | .52 | 4.30 | 4.82 | (.56 | ) | — | (.56 | ) | 32.01 | 17.38 | 1 | 1.83 | 1.83 | 1.67 | ||||||||||||||||||||||||||||||||||||||
| Year ended 6/30/2012 | 32.39 | .52 | (4.07 | ) | (3.55 | ) | (.58 | ) | (.51 | ) | (1.09 | ) | 27.75 | (10.86 | ) | 1 | 1.83 | 1.83 | 1.81 | |||||||||||||||||||||||||||||||||||
| Year ended 6/30/2011 | 25.80 | .78 | 6.78 | 7.56 | (.79 | ) | (.18 | ) | (.97 | ) | 32.39 | 29.47 | 2 | 1.79 | 1.79 | 2.51 | ||||||||||||||||||||||||||||||||||||||
| Year ended 6/30/2010 | 24.74 | .55 | 1.38 | 1.93 | (.50 | ) | (.37 | ) | (.87 | ) | 25.80 | 7.49 | 1 | 1.82 | 1.81 | 1.94 | ||||||||||||||||||||||||||||||||||||||
| Period from 10/1/20084 to 6/30/20095 | 25.00 | .50 | (.41 | ) | .09 | (.35 | ) | — | (.35 | ) | 24.74 | .43 | — | 7 | 1.93 | 6 | 1.88 | 6 | 3.00 | 6 | ||||||||||||||||||||||||||||||||||
| Class 529-C: | Year ended 6/30/2013 | 27.68 | .58 | 4.23 | 4.81 | (.58 | ) | — | (.58 | ) | 31.91 | 17.42 | 23 | 1.82 | 1.82 | 1.85 | ||||||||||||||||||||||||||||||||||||||
| Year ended 6/30/2012 | 32.35 | .58 | (4.13 | ) | (3.55 | ) | (.61 | ) | (.51 | ) | (1.12 | ) | 27.68 | (10.85 | ) | 18 | 1.82 | 1.82 | 2.02 | |||||||||||||||||||||||||||||||||||
| Year ended 6/30/2011 | 25.77 | .83 | 6.73 | 7.56 | (.80 | ) | (.18 | ) | (.98 | ) | 32.35 | 29.45 | 16 | 1.78 | 1.78 | 2.68 | ||||||||||||||||||||||||||||||||||||||
| Year ended 6/30/2010 | 24.72 | .59 | 1.35 | 1.94 | (.52 | ) | (.37 | ) | (.89 | ) | 25.77 | 7.53 | 8 | 1.81 | 1.80 | 2.08 | ||||||||||||||||||||||||||||||||||||||
| Period from 10/1/20084 to 6/30/20095 | 25.00 | .65 | (.57 | ) | .08 | (.36 | ) | — | (.36 | ) | 24.72 | .41 | 2 | 1.91 | 6 | 1.88 | 6 | 3.81 | 6 | |||||||||||||||||||||||||||||||||||
| Class 529-E: | Year ended 6/30/2013 | 27.79 | .77 | 4.22 | 4.99 | (.75 | ) | — | (.75 | ) | 32.03 | 18.01 | 3 | 1.26 | 1.26 | 2.45 | ||||||||||||||||||||||||||||||||||||||
| Year ended 6/30/2012 | 32.46 | .73 | (4.13 | ) | (3.40 | ) | (.76 | ) | (.51 | ) | (1.27 | ) | 27.79 | (10.34 | ) | 2 | 1.27 | 1.27 | 2.56 | |||||||||||||||||||||||||||||||||||
| Year ended 6/30/2011 | 25.85 | .97 | 6.76 | 7.73 | (.94 | ) | (.18 | ) | (1.12 | ) | 32.46 | 30.18 | 2 | 1.27 | 1.27 | 3.12 | ||||||||||||||||||||||||||||||||||||||
| Year ended 6/30/2010 | 24.78 | .75 | 1.33 | 2.08 | (.64 | ) | (.37 | ) | (1.01 | ) | 25.85 | 8.01 | 1 | 1.30 | 1.29 | 2.64 | ||||||||||||||||||||||||||||||||||||||
| Period from 10/1/20084 to 6/30/20095 | 25.00 | .74 | (.56 | ) | .18 | (.40 | ) | — | (.40 | ) | 24.78 | .82 | — | 7 | 1.39 | 6 | 1.35 | 6 | 4.36 | 6 | ||||||||||||||||||||||||||||||||||
| 28 | International Growth and Income Fund |
| Income (loss) from investment operations1 | Dividends and distributions | |||||||||||||||||||||||||||||||||||||||||||||||||||||
| Net asset value, beginning of period | Net investment income | Net gains (losses) on securities (both realized and unrealized) | Total from investment operations | Dividends (from net investment income) | Distributions (from capital gains) | Total dividends and distributions | Net asset value, end of period | Total return3 | Net assets, end of period (in millions) | Ratio of expenses to average net assets before reimbursements/ waivers | Ratio of expenses to average net assets after reimbursements/ waivers3 | Ratio of net income to average net assets3 | ||||||||||||||||||||||||||||||||||||||||||
| Class 529-F-1: | Year ended 6/30/2013 | $ | 27.81 | $ | .94 | $ | 4.22 | $ | 5.16 | $ | (.90 | ) | $ | — | $ | (.90 | ) | $ | 32.07 | 18.60 | % | $ | 7 | .81 | % | .81 | % | 3.00 | % | |||||||||||||||||||||||||
| Year ended 6/30/2012 | 32.50 | .89 | (4.17 | ) | (3.28 | ) | (.90 | ) | (.51 | ) | (1.41 | ) | 27.81 | (9.94 | ) | 4 | .81 | .81 | 3.11 | |||||||||||||||||||||||||||||||||||
| Year ended 6/30/2011 | 25.87 | 1.25 | 6.66 | 7.91 | (1.10 | ) | (.18 | ) | (1.28 | ) | 32.50 | 30.80 | 3 | .77 | .77 | 3.99 | ||||||||||||||||||||||||||||||||||||||
| Year ended 6/30/2010 | 24.79 | .91 | 1.32 | 2.23 | (.78 | ) | (.37 | ) | (1.15 | ) | 25.87 | 8.60 | 1 | .79 | .78 | 3.18 | ||||||||||||||||||||||||||||||||||||||
| Period from 10/1/20084 to 6/30/20095 | 25.00 | .76 | (.49 | ) | .27 | (.48 | ) | — | (.48 | ) | 24.79 | 1.18 | — | 7 | .90 | 6 | .86 | 6 | 4.48 | 6 | ||||||||||||||||||||||||||||||||||
| Class R-1: | Year ended 6/30/2013 | 27.78 | .77 | 4.27 | 5.04 | (.81 | ) | — | (.81 | ) | 32.01 | 18.19 | 5 | 1.16 | 1.16 | 2.48 | ||||||||||||||||||||||||||||||||||||||
| Year ended 6/30/2012 | 32.43 | .69 | (4.12 | ) | (3.43 | ) | (.71 | ) | (.51 | ) | (1.22 | ) | 27.78 | (10.47 | ) | 4 | 1.39 | 1.39 | 2.40 | |||||||||||||||||||||||||||||||||||
| Year ended 6/30/2011 | 25.82 | .87 | 6.78 | 7.65 | (.86 | ) | (.18 | ) | (1.04 | ) | 32.43 | 29.81 | 5 | 1.54 | 1.54 | 2.80 | ||||||||||||||||||||||||||||||||||||||
| Year ended 6/30/2010 | 24.76 | .59 | 1.37 | 1.96 | (.53 | ) | (.37 | ) | (.90 | ) | 25.82 | 7.58 | 3 | 1.71 | 1.70 | 2.06 | ||||||||||||||||||||||||||||||||||||||
| Period from 10/1/20084 to 6/30/20095 | 25.00 | .45 | (.34 | ) | .11 | (.35 | ) | — | (.35 | ) | 24.76 | .52 | 2 | 1.82 | 6 | 1.77 | 6 | 2.68 | 6 | |||||||||||||||||||||||||||||||||||
| Class R-2: | Year ended 6/30/2013 | 27.71 | .60 | 4.24 | 4.84 | (.61 | ) | — | (.61 | ) | 31.94 | 17.48 | 40 | 1.74 | 1.74 | 1.93 | ||||||||||||||||||||||||||||||||||||||
| Year ended 6/30/2012 | 32.38 | .60 | (4.13 | ) | (3.53 | ) | (.63 | ) | (.51 | ) | (1.14 | ) | 27.71 | (10.80 | ) | 29 | 1.78 | 1.76 | 2.12 | |||||||||||||||||||||||||||||||||||
| Year ended 6/30/2011 | 25.79 | .85 | 6.74 | 7.59 | (.82 | ) | (.18 | ) | (1.00 | ) | 32.38 | 29.60 | 25 | 1.77 | 1.70 | 2.74 | ||||||||||||||||||||||||||||||||||||||
| Year ended 6/30/2010 | 24.74 | .61 | 1.34 | 1.95 | (.53 | ) | (.37 | ) | (.90 | ) | 25.79 | 7.57 | 13 | 1.81 | 1.73 | 2.15 | ||||||||||||||||||||||||||||||||||||||
| Period from 10/1/20084 to 6/30/20095 | 25.00 | .54 | (.44 | ) | .10 | (.36 | ) | — | (.36 | ) | 24.74 | .48 | 3 | 1.88 | 6 | 1.78 | 6 | 3.22 | 6 | |||||||||||||||||||||||||||||||||||
| Class R-3: | Year ended 6/30/2013 | 27.78 | .76 | 4.23 | 4.99 | (.75 | ) | — | (.75 | ) | 32.02 | 18.02 | 33 | 1.27 | 1.27 | 2.43 | ||||||||||||||||||||||||||||||||||||||
| Year ended 6/30/2012 | 32.45 | .72 | (4.13 | ) | (3.41 | ) | (.75 | ) | (.51 | ) | (1.26 | ) | 27.78 | (10.37 | ) | 22 | 1.29 | 1.29 | 2.53 | |||||||||||||||||||||||||||||||||||
| Year ended 6/30/2011 | 25.84 | 1.01 | 6.73 | 7.74 | (.95 | ) | (.18 | ) | (1.13 | ) | 32.45 | 30.16 | 24 | 1.27 | 1.27 | 3.24 | ||||||||||||||||||||||||||||||||||||||
| Year ended 6/30/2010 | 24.78 | .75 | 1.33 | 2.08 | (.65 | ) | (.37 | ) | (1.02 | ) | 25.84 | 8.02 | 10 | 1.30 | 1.29 | 2.65 | ||||||||||||||||||||||||||||||||||||||
| Period from 10/1/20084 to 6/30/20095 | 25.00 | .61 | (.42 | ) | .19 | (.41 | ) | — | (.41 | ) | 24.78 | .85 | 3 | 1.38 | 6 | 1.33 | 6 | 3.64 | 6 | |||||||||||||||||||||||||||||||||||
| Class R-4: | Year ended 6/30/2013 | 27.80 | .88 | 4.23 | 5.11 | (.86 | ) | — | (.86 | ) | 32.05 | 18.43 | 26 | .93 | .93 | 2.82 | ||||||||||||||||||||||||||||||||||||||
| Year ended 6/30/2012 | 32.48 | .85 | (4.16 | ) | (3.31 | ) | (.86 | ) | (.51 | ) | (1.37 | ) | 27.80 | (10.06 | ) | 15 | .94 | .94 | 2.98 | |||||||||||||||||||||||||||||||||||
| Year ended 6/30/2011 | 25.86 | 1.15 | 6.70 | 7.85 | (1.05 | ) | (.18 | ) | (1.23 | ) | 32.48 | 30.60 | 12 | .93 | .93 | 3.69 | ||||||||||||||||||||||||||||||||||||||
| Year ended 6/30/2010 | 24.79 | .84 | 1.33 | 2.17 | (.73 | ) | (.37 | ) | (1.10 | ) | 25.86 | 8.38 | 5 | .98 | .96 | 2.93 | ||||||||||||||||||||||||||||||||||||||
| Period from 10/1/20084 to 6/30/20095 | 25.00 | .61 | (.37 | ) | .24 | (.45 | ) | — | (.45 | ) | 24.79 | 1.09 | 2 | 1.07 | 6 | 1.02 | 6 | 3.63 | 6 | |||||||||||||||||||||||||||||||||||
| Class R-5: | Year ended 6/30/2013 | 27.91 | .94 | 4.28 | 5.22 | (.94 | ) | — | (.94 | ) | 32.19 | 18.77 | 40 | .65 | .65 | 3.00 | ||||||||||||||||||||||||||||||||||||||
| Year ended 6/30/2012 | 32.60 | .91 | (4.15 | ) | (3.24 | ) | (.94 | ) | (.51 | ) | (1.45 | ) | 27.91 | (9.81 | ) | 33 | .66 | .66 | 3.19 | |||||||||||||||||||||||||||||||||||
| Year ended 6/30/2011 | 25.95 | 1.15 | 6.81 | 7.96 | (1.13 | ) | (.18 | ) | (1.31 | ) | 32.60 | 30.94 | 28 | .67 | .67 | 3.71 | ||||||||||||||||||||||||||||||||||||||
| Year ended 6/30/2010 | 24.86 | .85 | 1.41 | 2.26 | (.80 | ) | (.37 | ) | (1.17 | ) | 25.95 | 8.69 | 14 | .72 | .70 | 2.96 | ||||||||||||||||||||||||||||||||||||||
| Period from 10/1/20084 to 6/30/20095 | 25.00 | .76 | (.47 | ) | .29 | (.43 | ) | — | (.43 | ) | 24.86 | 1.28 | 6 | .81 | 6 | .78 | 6 | 4.65 | 6 | |||||||||||||||||||||||||||||||||||
| Class R-6: | Year ended 6/30/2013 | 27.80 | .97 | 4.25 | 5.22 | (.96 | ) | — | (.96 | ) | 32.06 | 18.83 | 593 | .61 | .61 | 3.11 | ||||||||||||||||||||||||||||||||||||||
| Year ended 6/30/2012 | 32.48 | .93 | (4.15 | ) | (3.22 | ) | (.95 | ) | (.51 | ) | (1.46 | ) | 27.80 | (9.78 | ) | 392 | .61 | .61 | 3.26 | |||||||||||||||||||||||||||||||||||
| Year ended 6/30/2011 | 25.86 | 1.17 | 6.77 | 7.94 | (1.14 | ) | (.18 | ) | (1.32 | ) | 32.48 | 30.99 | 341 | .62 | .62 | 3.77 | ||||||||||||||||||||||||||||||||||||||
| Year ended 6/30/2010 | 24.78 | .90 | 1.37 | 2.27 | (.82 | ) | (.37 | ) | (1.19 | ) | 25.86 | 8.74 | 206 | .66 | .65 | 3.16 | ||||||||||||||||||||||||||||||||||||||
| Period from 5/1/2009 to 6/30/20095 | 22.97 | .25 | 1.90 | 2.15 | (.34 | ) | — | (.34 | ) | 24.78 | 9.38 | 64 | .12 | .12 | 1.01 | |||||||||||||||||||||||||||||||||||||||
| Year ended June 30 | For the period 10/1/20084 | |||||||||||||||||||
| 2013 | 2012 | 2011 | 2010 | to 6/30/20095 | ||||||||||||||||
| Portfolio turnover rate for all share classes | 37 | % | 24 | % | 31 | % | 16 | % | 33% | |||||||||||
| 1 | Based on average shares outstanding. |
| 2 | Total returns exclude any applicable sales charges, including contingent deferred sales charges. |
| 3 | This column reflects the impact, if any, of certain reimbursements/waivers from CRMC. During some of the periods shown, CRMC reduced fees for investment advisory services. In addition, during some of the periods shown, CRMC paid a portion of the fund’s transfer agent fees for certain retirement plan share classes. |
| 4 | Commencement of operations. |
| 5 | Based on operations for the period shown and, accordingly, is not representative of a full year. |
| 6 | Annualized. |
| 7 | Amount less than $1 million. |
See Notes to Financial Statements
| International Growth and Income Fund | 29 |
Report of Independent Registered Public Accounting Firm
To the Shareholders and Board of Trustees of International Growth and Income Fund:
We have audited the accompanying statement of assets and liabilities of International Growth and Income Fund (the “Fund”), including the summary investment portfolio, as of June 30, 2013, and the related statement of operations for the year then ended, the statements of changes in net assets for each of the two years in the period then ended, and the financial highlights for each of the periods presented. These financial statements and financial highlights are the responsibility of the Fund’s management. Our responsibility is to express an opinion on these financial statements and financial highlights based on our audits.
We conducted our audits in accordance with the standards of the Public Company Accounting Oversight Board (United States). Those standards require that we plan and perform the audit to obtain reasonable assurance about whether the financial statements and financial highlights are free of material misstatement. The Fund is not required to have, nor were we engaged to perform, an audit of its internal control over financial reporting. Our audits included consideration of internal control over financial reporting as a basis for designing audit procedures that are appropriate in the circumstances, but not for the purpose of expressing an opinion on the effectiveness of the Fund’s internal control over financial reporting. Accordingly, we express no such opinion. An audit also includes examining, on a test basis, evidence supporting the amounts and disclosures in the financial statements, assessing the accounting principles used and significant estimates made by management, as well as evaluating the overall financial statement presentation. Our procedures included confirmation of securities owned as of June 30, 2013, by correspondence with the custodian and brokers; where replies were not received from brokers, we performed other auditing procedures. We believe that our audits provide a reasonable basis for our opinion.
In our opinion, such financial statements and financial highlights referred to above present fairly, in all material respects, the financial position of International Growth and Income Fund as of June 30, 2013, the results of its operations for the year then ended, the changes in its net assets for each of the two years in the period then ended, and the financial highlights for each of the periods presented, in conformity with accounting principles generally accepted in the United States of America.
Deloitte & Touche LLP
Costa Mesa, California
August 9, 2013
| 30 | International Growth and Income Fund |
| Expense example | unaudited |
As a shareholder of the fund, you incur two types of costs: (1) transaction costs, such as initial sales charges on purchase payments and contingent deferred sales charges on redemptions (loads), and (2) ongoing costs, including management fees, distribution and service (12b-1) fees, and other expenses. This example is intended to help you understand your ongoing costs (in dollars) of investing in the fund so you can compare these costs with the ongoing costs of investing in other mutual funds. The example is based on an investment of $1,000 invested at the beginning of the period and held for the entire six-month period (January 1, 2013, through June 30, 2013).
Actual expenses:
The first line of each share class in the table on the next page provides information about actual account values and actual expenses. You may use the information in this line, together with the amount you invested, to estimate the expenses that you paid over the period. Simply divide your account value by $1,000 (for example, an $8,600 account value divided by $1,000 = 8.6), then multiply the result by the number in the first line under the heading entitled “Expenses paid during period” to estimate the expenses you paid on your account during this period.
Hypothetical example for comparison purposes:
The second line of each share class in the table on the next page provides information about hypothetical account values and hypothetical expenses based on the actual expense ratio for the share class and an assumed rate of return of 5.00% per year before expenses, which is not the actual return of the share class. The hypothetical account values and expenses may not be used to estimate the actual ending account balance or expenses you paid for the period. You may use this information to compare the ongoing costs of investing in the fund and other funds. To do so, compare this 5.00% hypothetical example with the 5.00% hypothetical examples that appear in the shareholder reports of the other funds.
Notes:
There are some account fees that are charged to certain types of accounts, such as individual retirement accounts and 529 college savings plan accounts (generally, a $10 fee is charged to set up the account and an additional $10 fee is charged to the account annually), that would increase the amount of expenses paid on your account. In addition, retirement plan participants may be subject to certain fees charged by the plan sponsor, and Class F-1, F-2 and 529-F-1 shareholders may be subject to fees charged by financial intermediaries, typically ranging from 0.75% to 1.50% of assets annually depending on services offered. You can estimate the impact of these fees by adding the amount of the fees to the total estimated expenses you paid on your account during the period as calculated above. In addition, your ending account value would be lower by the amount of these fees.
Note that the expenses shown in the table are meant to highlight your ongoing costs only and do not reflect any transactional costs, such as sales charges (loads). Therefore, the second line of each share class in the table is useful in comparing ongoing costs only and will not help you determine the relative total costs of owning different funds. In addition, if these transactional costs were included, your costs would have been higher.
| International Growth and Income Fund | 31 |
| Beginning account value 1/1/2013 | Ending account value 6/30/2013 | Expenses paid during period* | Annualized expense ratio | |||||||||||||
| Class A — actual return | $ | 1,000.00 | $ | 1,027.88 | $ | 4.68 | .93 | % | ||||||||
| Class A — assumed 5% return | 1,000.00 | 1,020.18 | 4.66 | .93 | ||||||||||||
| Class B — actual return | 1,000.00 | 1,024.19 | 8.48 | 1.69 | ||||||||||||
| Class B — assumed 5% return | 1,000.00 | 1,016.41 | 8.45 | 1.69 | ||||||||||||
| Class C — actual return | 1,000.00 | 1,023.87 | 8.68 | 1.73 | ||||||||||||
| Class C — assumed 5% return | 1,000.00 | 1,016.22 | 8.65 | 1.73 | ||||||||||||
| Class F-1 — actual return | 1,000.00 | 1,027.91 | 4.83 | .96 | ||||||||||||
| Class F-1 — assumed 5% return | 1,000.00 | 1,020.03 | 4.81 | .96 | ||||||||||||
| Class F-2 — actual return | 1,000.00 | 1,028.90 | 3.62 | .72 | ||||||||||||
| Class F-2 — assumed 5% return | 1,000.00 | 1,021.22 | 3.61 | .72 | ||||||||||||
| Class 529-A — actual return | 1,000.00 | 1,027.55 | 5.03 | 1.00 | ||||||||||||
| Class 529-A — assumed 5% return | 1,000.00 | 1,019.84 | 5.01 | 1.00 | ||||||||||||
| Class 529-B — actual return | 1,000.00 | 1,023.39 | 9.13 | 1.82 | ||||||||||||
| Class 529-B — assumed 5% return | 1,000.00 | 1,015.77 | 9.10 | 1.82 | ||||||||||||
| Class 529-C — actual return | 1,000.00 | 1,023.67 | 9.08 | 1.81 | ||||||||||||
| Class 529-C — assumed 5% return | 1,000.00 | 1,015.82 | 9.05 | 1.81 | ||||||||||||
| Class 529-E — actual return | 1,000.00 | 1,026.31 | 6.33 | 1.26 | ||||||||||||
| Class 529-E — assumed 5% return | 1,000.00 | 1,018.55 | 6.31 | 1.26 | ||||||||||||
| Class 529-F-1 — actual return | 1,000.00 | 1,028.55 | 4.02 | .80 | ||||||||||||
| Class 529-F-1 — assumed 5% return | 1,000.00 | 1,020.83 | 4.01 | .80 | ||||||||||||
| Class R-1 — actual return | 1,000.00 | 1,026.69 | 5.83 | 1.16 | ||||||||||||
| Class R-1 — assumed 5% return | 1,000.00 | 1,019.04 | 5.81 | 1.16 | ||||||||||||
| Class R-2 — actual return | 1,000.00 | 1,023.96 | 8.68 | 1.73 | ||||||||||||
| Class R-2 — assumed 5% return | 1,000.00 | 1,016.22 | 8.65 | 1.73 | ||||||||||||
| Class R-3 — actual return | 1,000.00 | 1,025.92 | 6.38 | 1.27 | ||||||||||||
| Class R-3 — assumed 5% return | 1,000.00 | 1,018.50 | 6.36 | 1.27 | ||||||||||||
| Class R-4 — actual return | 1,000.00 | 1,027.88 | 4.73 | .94 | ||||||||||||
| Class R-4 — assumed 5% return | 1,000.00 | 1,020.13 | 4.71 | .94 | ||||||||||||
| Class R-5 — actual return | 1,000.00 | 1,029.47 | 3.27 | .65 | ||||||||||||
| Class R-5 — assumed 5% return | 1,000.00 | 1,021.57 | 3.26 | .65 | ||||||||||||
| Class R-6 — actual return | 1,000.00 | 1,029.54 | 3.02 | .60 | ||||||||||||
| Class R-6 — assumed 5% return | 1,000.00 | 1,021.82 | 3.01 | .60 | ||||||||||||
| * | The “expenses paid during period” are equal to the “annualized expense ratio,” multiplied by the average account value over the period, multiplied by the number of days in the period, and divided by 365 (to reflect the one-half year period). |
| 32 | International Growth and Income Fund |
| Tax information | unaudited |
We are required to advise you of the federal tax status of certain distributions received by shareholders during the fiscal year. The fund hereby designates the following amounts for the fund’s fiscal year ended June 30, 2013:
| Foreign taxes | $0.10 per share | |||
| Foreign source income | $1.14 per share | |||
| Qualified dividend income | 100% | |||
| U.S. government income that may be exempt from state taxation | $94,000 |
Individual shareholders should refer to their Form 1099 or other tax information, which will be mailed in January 2014, to determine the calendar year amounts to be included on their 2013 tax returns. Shareholders should consult their tax advisors.
| International Growth and Income Fund | 33 |
Board of trustees and other officers
“Independent” trustees1
| Name and age | Year first elected a trustee of the fund2 | Principal occupation(s) during past five years | Number of portfolios in fund complex3 overseen by trustee | Other directorships4 held by trustee | ||||
| William H. Baribault, 67 | 2012 | Chairman of the Board and CEO, Oakwood Enterprises (private investment and consulting) | 68 | None | ||||
| Vanessa C. L. Chang, 61 | 2012 | Director, EL & EL Investments (real estate) | 6 | Edison International; Transocean Ltd. | ||||
| Linda Griego, 65 | 2012 | President and CEO, Griego Enterprises, Inc. (business management company); President, Zapgo Entertainment LLC (television production company focused on programming for the Latino market) | 3 | AECOM Technology Corporation; CBS Corporation | ||||
| Leonade D. Jones, 65 | 2008 | Retired; former Treasurer, The Washington Post Company (1987–1996) | 9 | None | ||||
| William D. Jones, 58 | 2008 | Real estate developer/owner, President and CEO, CityLink Investment Corporation (acquires, develops and manages real estate ventures in selected urban communities) and City Scene Management Company (provides commercial asset and property management services) | 7 | Sempra Energy | ||||
| James J. Postl, 67 | 2008 | Retired; former President and CEO, Pennzoil-Quaker State Company (automotive products and services) (1998–2002) | 3 | Pulte, Inc. | ||||
| Margaret Spellings, 55 | 2012 | President, George W. Bush Foundation; President, and CEO, Margaret Spellings & Company (public policy and strategic consulting); President, U.S. Chamber Foundation and Senior Advisor to the President and CEO, U.S. Chamber of Commerce; former U.S. Secretary of Education, U.S. Department of Education | 68 | None | ||||
| Isaac Stein, 66 Chairman of the Board (Independent and Non-Executive) | 2008 | President, Waverley Associates (private investment fund); Chairman Emeritus of the Board of Trustees, Stanford University | 3 | Alexza Pharmaceuticals, Inc.; Maxygen, Inc. |
Robert A. Fox, John M. Lillie and John G. McDonald, trustees of the fund since 2008, have retired from the board. The trustees thank Messrs. Fox and Lillie and Prof. McDonald for their dedication and service to the fund.
“Interested” trustees5,6
| Name, age and position with fund | Year first elected a trustee or officer of the fund2 | Principal occupation(s) during past five years and positions held with affiliated entities or the principal underwriter of the fund | Number of portfolios in fund complex3 overseen by trustee | Other directorships 4 held by trustee | ||||
| Steven T. Watson, 58 Vice Chairman of the Board | 2008 | Director, Capital Research Company;7 Senior Vice President — Capital World Investors, Capital Research Company;7 Senior Vice President — Capital World Investors, Capital Bank and Trust Company7 | 1 | None |
The fund’s statement of additional information includes further details about fund trustees and is available without charge upon request by calling American Funds Service Company at (800) 421-4225 or by visiting the American Funds website at americanfunds.com. The address for all trustees and officers of the fund is 333 South Hope Street, Los Angeles, CA 90071, Attention: Secretary.
| 34 | International Growth and Income Fund |
Other officers6
| Name, age and position with fund | Year first elected an officer of the fund2 | Principal occupation(s) during past five years and positions held with affiliated entities or the principal underwriter of the fund | ||
| Carl M. Kawaja, 49 President | 2008 | Senior Vice President — Capital World Investors, Capital Research and Management Company; Chairman of the Board, Capital International Asset Management (Canada), Inc.;7 Director, The Capital Group Companies, Inc.7 | ||
| Paul F. Roye, 59 Executive Vice President | 2008 | Senior Vice President — Fund Business Management Group, Capital Research and Management Company; Director, American Funds Service Company7 | ||
| Andrew B. Suzman, 46 Senior Vice President | 2008 | Senior Vice President — Capital World Investors, Capital Research Company;7 Senior Vice President — Capital World Investors, Capital Bank and Trust Company;7 Director, American Funds Distributors, Inc.;7 Director, Capital Strategy Research, Inc.7 | ||
| Donald H. Rolfe, 41 Vice President | 2012 | Chief Compliance Officer, Capital Research Company;7 Chief Compliance Officer, Capital Research and Management Company; Vice President and Senior Counsel — Fund Business Management Group, Capital Research and Management Company | ||
| Patrick F. Quan, 55 Secretary | 2008 | Vice President — Fund Business Management Group, Capital Research and Management Company | ||
| Jeffrey P. Regal, 42 Treasurer | 2011 | Vice President — Fund Business Management Group, Capital Research and Management Company | ||
| Julie E. Lawton, 39 Assistant Secretary | 2009 | Assistant Vice President — Fund Business Management Group, Capital Research and Management Company | ||
| Dori Laskin, 62 Assistant Treasurer | 2011 | Vice President — Fund Business Management Group, Capital Research and Management Company | ||
| Ari M. Vinocor, 38 Assistant Treasurer | 2012 | Vice President — Fund Business Management Group, Capital Research and Management Company |
| 1 | The term “independent” trustee refers to a trustee who is not an “interested person” of the fund within the meaning of the Investment Company Act of 1940. |
| 2 | Trustees and officers of the fund serve until their resignation, removal or retirement. |
| 3 | Capital Research and Management Company manages the American Funds. Capital Research and Management Company also manages American Funds Insurance Series,® which is composed of 22 funds and serves as the underlying investment vehicle for certain variable insurance contracts; American Funds Target Date Retirement Series,® which is composed of 10 funds and is available through tax-deferred retirement plans and IRAs; American Funds Portfolio Series,SM which is composed of eight funds; and American Funds College Target Date Series,SM which is composed of seven funds. |
| 4 | This includes all directorships (other than those in the American Funds or other funds managed by Capital Research and Management Company) that are held by each trustee as a trustee or director of a public company or a registered investment company. |
| 5 | “Interested persons” within the meaning of the Investment Company Act of 1940, on the basis of their affiliation with the fund’s investment adviser, Capital Research and Management Company, or affiliated entities (including the fund’s principal underwriter). |
| 6 | All of the officers listed are officers and/or directors/trustees of one or more of the other funds for which Capital Research and Management Company serves as investment adviser. |
| 7 | Company affiliated with Capital Research and Management Company. |
| International Growth and Income Fund | 35 |
Office of the fund
One Market
Steuart Tower, Suite 2000
Mailing address: P.O. Box 7650
San Francisco, CA 94120-7650
Investment adviser
Capital Research and Management Company
333 South Hope Street
Los Angeles, CA 90071-1406
6455 Irvine Center Drive
Irvine, CA 92618
Transfer agent for shareholder accounts
American Funds Service Company
(Write to the address near you.)
P.O. Box 6007
Indianapolis, IN 46206-6007
P.O. Box 2280
Norfolk, VA 23501-2280
Custodian of assets
JPMorgan Chase Bank
270 Park Avenue
New York, NY 10017-2070
Counsel
Bingham McCutchen LLP
355 South Grand Avenue, Suite 4400
Los Angeles, CA 90071-3106
Independent registered public accounting firm
Deloitte & Touche LLP
695 Town Center Drive
Suite 1200
Costa Mesa, CA 92626-7188
Principal underwriter
American Funds Distributors, Inc.
333 South Hope Street
Los Angeles, CA 90071-1406
| 36 | International Growth and Income Fund |
Investors should carefully consider investment objectives, risks, charges and expenses. This and other important information is contained in the fund prospectus and summary prospectus, which can be obtained from your financial professional and should be read carefully before investing. You may also call American Funds Service Company (AFS) at (800) 421-4225 or visit the American Funds website at americanfunds.com.
“American Funds Proxy Voting Procedures and Principles” — which describes how we vote proxies relating to portfolio securities — is available on the American Funds website or upon request by calling AFS. The fund files its proxy voting record with the U.S. Securities and Exchange Commission (SEC) for the 12 months ended June 30 by August 31. The proxy voting record is available free of charge on the SEC website at sec.gov and on the American Funds website.
A complete June 30, 2013, portfolio of International Growth and Income Fund’s investments is available free of charge by calling AFS or visiting the SEC website (where it is part of Form N-CSR).
International Growth and Income Fund files a complete list of its portfolio holdings with the SEC for the first and third quarters of each fiscal year on Form N-Q. This filing is available free of charge on the SEC website. You may also review or, for a fee, copy this filing at the SEC’s Public Reference Room in Washington, D.C. Additional information regarding the operation of the Public Reference Room may be obtained by calling the SEC’s Office of Investor Education and Advocacy at (800) SEC-0330. Additionally, the list of portfolio holdings is available by calling AFS.
This report is for the information of shareholders of International Growth and Income Fund, but it also may be used as sales literature when preceded or accompanied by the current prospectus or summary prospectus, which gives details about charges, expenses, investment objectives and operating policies of the fund. If used as sales material after September 30, 2013, this report must be accompanied by an American Funds statistical update for the most recently completed calendar quarter.
The American Funds Advantage
Since 1931, American Funds, part of Capital Group, has helped investors pursue long-term investment success. Our consistent approach — in combination with The Capital SystemSM — has resulted in a superior long-term track record.
Aligned with investor success
We base our decisions on a long-term perspective, which we believe aligns our goals with the interests of our clients. Our portfolio managers average 25 years of investment experience, including 20 years at our company, reflecting a career commitment to our long-term approach.1
The Capital SystemSM
Our investment process, The Capital System, combines individual accountability with teamwork. Each fund is divided into portions that are managed independently by investment professionals with diverse backgrounds, ages and investment approaches. An extensive global research effort is the backbone of our system.
Superior long-term track record
Our equity funds have beaten their Lipper peer indexes in 90% of 10-year periods and 96% of 20-year periods. Our fixed-income funds have beaten their Lipper indexes in 58% of 10-year periods and 63% of 20-year periods.2 Our fund management fees have been among the lowest in the industry.3
| 1 | Portfolio manager experience as of December 31, 2012. |
| 2 | Based on Class A share results for rolling periods through December 31, 2012. Periods covered are the shorter of the fund’s lifetime or since the comparable Lipper index inception date. |
| 3 | Based on management fees for the 20-year period ended December 31, 2012, versus comparable Lipper categories, excluding funds of funds. |
 | Printed on paper containing 10% post-consumer waste Printed with inks containing soy and/or vegetable oil | |
| Lit No. MFGEARX-034-0813P Litho in USA BAG/UNL/9995-S36820 | ||
ITEM 2 – Code of Ethics
The Registrant has adopted a Code of Ethics that applies to its Principal Executive Officer and Principal Financial Officer. The Registrant undertakes to provide to any person without charge, upon request, a copy of the Code of Ethics. Such request can be made to American Funds Service Company at 800/421-0180 or to the Secretary of the Registrant, One Market, Steuart Tower, Suite 2000, San Francisco, California 94105.
ITEM 3 – Audit Committee Financial Expert
The Registrant’s board has determined that Vanessa C.L. Chang, a member of the Registrant’s audit committee, is an “audit committee financial expert” and "independent," as such terms are defined in this Item. This designation will not increase the designee’s duties, obligations or liability as compared to his or her duties, obligations and liability as a member of the audit committee and of the board, nor will it reduce the responsibility of the other audit committee members. There may be other individuals who, through education or experience, would qualify as "audit committee financial experts" if the board had designated them as such. Most importantly, the board believes each member of the audit committee contributes significantly to the effective oversight of the Registrant’s financial statements and condition.
ITEM 4 – Principal Accountant Fees and Services
| Registrant: | ||||
| a) Audit Fees: | ||||
| 2012 | $85,000 | |||
| 2013 | $91,000 | |||
| b) Audit-Related Fees: | ||||
| 2012 | $2,000 | |||
| 2013 | $1,000 | |||
| The audit-related fees consist of assurance and related services relating to the examination of the Registrant’s investment adviser conducted in accordance with Statement on Standards for Attestation Engagements Number 16 issued by the American Institute of Certified Public Accountants. | ||||
| c) Tax Fees: | ||||
| 2012 | $8,000 | |||
| 2013 | $2,000 | |||
| The tax fees consist of professional services relating to the preparation of the Registrant’s tax returns including returns relating to the Registrant’s investments in non-U.S. jurisdictions. | ||||
| d) All Other Fees: | ||||
| 2012 | None | |||
| 2013 | None | |||
| Adviser and affiliates (includes only fees for non-audit services billed to the adviser and affiliates for engagements that relate directly to the operations and financial reporting of the Registrant and were subject to the pre-approval policies described below): | ||||
| a) Audit Fees: | ||||
| Not Applicable | ||||
| b) Audit-Related Fees: | ||||
| 2012 | $841,000 | |||
| 2013 | $1,240,000 | |||
| The audit-related fees consist of assurance and related services relating to the examination of the Registrant’s transfer agent, principal underwriter and investment adviser conducted in accordance with Statement on Standards for Attestation Engagements Number 16 issued by the American Institute of Certified Public Accountants. | ||||
| c) Tax Fees: | ||||
| 2012 | $42,000 | |||
| 2013 | $28,000 | |||
| The tax fees consist of consulting services relating to the Registrant’s investments. | ||||
| d) All Other Fees: | ||||
| 2012 | $2,000 | |||
| 2013 | $2,000 | |||
| The other fees consist of subscription services related to an accounting research tool. | ||||
All audit and permissible non-audit services that the Registrant’s audit committee considers compatible with maintaining the independent registered public accounting firm’s independence are required to be pre-approved by the committee. The pre-approval requirement will extend to all non-audit services provided to the Registrant, the investment adviser, and any entity controlling, controlled by, or under common control with the investment adviser that provides ongoing services to the Registrant, if the engagement relates directly to the operations and financial reporting of the Registrant. The committee will not delegate its responsibility to pre-approve these services to the investment adviser. The committee may delegate to one or more committee members the authority to review and pre-approve audit and permissible non-audit services. Actions taken under any such delegation will be reported to the full committee at its next meeting. The pre-approval requirement is waived with respect to non-audit services if certain conditions are met. The pre-approval requirement was not waived for any of the non-audit services listed above provided to the Registrant, adviser and affiliates.
Aggregate non-audit fees paid to the Registrant’s auditors, including fees for all services billed to the Registrant, adviser and affiliates that provide ongoing services to the Registrant, were $1,514,000 for fiscal year 2012 and $1,667,000 for fiscal year 2013. The non-audit services represented by these amounts were brought to the attention of the committee and considered to be compatible with maintaining the auditors’ independence.
ITEM 5 – Audit Committee of Listed Registrants
Not applicable to this Registrant, insofar as the Registrant is not a listed issuer as defined in Rule 10A-3 under the Securities Exchange Act of 1934.
ITEM 6 – Schedule of Investments
 | International Growth and Income FundSM One Market, Steuart Tower Suite 2000 San Francisco, California 94105 Phone (415) 421-9360 |
As permitted by U.S. Securities and Exchange Commission regulations, “Miscellaneous” securities include holdings in their first year of acquisition that have not previously been publicly disclosed.
| 1 | Security did not produce income during the last 12 months. |
| 2 | Valued under fair value procedures adopted by authority of the board of trustees. The total value of all such securities was $108,894,000, which represented 1.71% of the net assets of the fund. |
| 3 | A portion of this security was pledged as collateral for net losses on unsettled forward currency contracts. The total value of pledged collateral was $637,000, which represented .01% of the net assets of the fund. |
| 4 | Acquired in a transaction exempt from registration under Rule 144A or section 4(2) of the Securities Act of 1933. May be resold in the U.S. in transactions exempt from registration, normally to qualified institutional buyers. The total value of all such securities was $161,279,000, which represented 2.54% of the net assets of the fund. |
| 5 | Coupon rate may change periodically. |
| 6 | Step bond; coupon rate will increase at a later date. |
Key to abbreviations and symbol
ADR = American Depositary Receipts
CDI = CREST Depository Interest
DVR = Differential Voting Rights
FDR = Fiduciary Depositary Receipts
GDR = Global Depositary Receipts
€ = Euros
ZAR = South African rand
Investments are not FDIC-insured, nor are they deposits of or guaranteed by a bank or any other entity, so they may lose value.
Investors should carefully consider investment objectives, risks, charges and expenses. This and other important information is contained in the fund prospectus and summary prospectus, which can be obtained from your financial professional and should be read carefully before investing. You may also call American Funds Service Company (AFS) at (800) 421-4225 or visit the American Funds website at americanfunds.com.
MFGEFPX-034-0813O-S37647
REPORT OF INDEPENDENT REGISTERED PUBLIC ACCOUNTING FIRM ON INVESTMENT PORTFOLIO
To the Shareholders and Board of Trustees of
International Growth and Income Fund:
We have audited, in accordance with the standards of the Public Company Accounting Oversight Board (United States), the financial statements of International Growth and Income Fund (the “Fund”) as of June 30, 2013, and for the year then ended and have issued our report thereon dated August 9, 2013, which report and financial statements are included in Item 1 of this Certified Shareholder Report on Form N-CSR. Our audit also included the Fund’s investment portfolio (the “Schedule”) as of June 30, 2013, appearing in Item 6 of this Form N-CSR. This Schedule is the responsibility of the Fund’s management. Our responsibility is to express an opinion based on our audit. In our opinion, the Schedule referred to above, when considered in relation to the basic financial statements taken as a whole of the Fund referred to above, presents fairly, in all material respects, the information set forth therein.
DELOITTE & TOUCHE LLP
Costa Mesa, California
August 9, 2013
ITEM 7 – Disclosure of Proxy Voting Policies and Procedures for Closed-End Management Investment Companies
Not applicable to this Registrant, insofar as the Registrant is not a closed-end management investment company.
ITEM 8 – Portfolio Managers of Closed-End Management Investment Companies
Not applicable to this Registrant, insofar as the Registrant is not a closed-end management investment company.
ITEM 9 – Purchases of Equity Securities by Closed-End Management Investment Company and Affiliated Purchasers
Not applicable to this Registrant, insofar as the Registrant is not a closed-end management investment company.
ITEM 10 – Submission of Matters to a Vote of Security Holders
There have been no material changes to the procedures by which shareholders may recommend nominees to the Registrant’s board of trustees since the Registrant last submitted a proxy statement to its shareholders. The procedures are as follows. The Registrant has a nominating and governance committee comprised solely of persons who are not considered ‘‘interested persons’’ of the Registrant within the meaning of the Investment Company Act of 1940, as amended. The committee periodically reviews such issues as the board’s composition, responsibilities, committees, compensation and other relevant issues, and recommends any appropriate changes to the full board of trustees. While the committee normally is able to identify from its own resources an ample number of qualified candidates, it will consider shareholder suggestions of persons to be considered as nominees to fill future vacancies on the board. Such suggestions must be sent in writing to the nominating and governance committee of the Registrant, c/o the Registrant’s Secretary, and must be accompanied by complete biographical and occupational data on the prospective nominee, along with a written consent of the prospective nominee for consideration of his or her name by the nominating and governance committee.
ITEM 11 – Controls and Procedures
| (a) | The Registrant’s Principal Executive Officer and Principal Financial Officer have concluded, based on their evaluation of the Registrant’s disclosure controls and procedures (as such term is defined in Rule 30a-3 under the Investment Company Act of 1940), that such controls and procedures are adequate and reasonably designed to achieve the purposes described in paragraph (c) of such rule. |
| (b) | There were no changes in the Registrant’s internal controls over financial reporting (as defined in Rule 30a-3(d) under the Investment Company Act of 1940) that occurred during the Registrant’s second fiscal quarter of the period covered by this report that has materially affected, or is reasonably likely to materially affect, the Registrant’s internal control over financial reporting. |
ITEM 12 – Exhibits
| (a)(1) | The Code of Ethics that is the subject of the disclosure required by Item 2 is attached as an exhibit hereto. |
| (a)(2) | The certifications required by Rule 30a-2 of the Investment Company Act of 1940 and Sections 302 and 906 of the Sarbanes-Oxley Act of 2002 are attached as exhibits hereto. |
SIGNATURES
Pursuant to the requirements of the Securities Exchange Act of 1934 and the Investment Company Act of 1940, the Registrant has duly caused this report to be signed on its behalf by the undersigned, thereunto duly authorized.
| INTERNATIONAL GROWTH AND INCOME FUND | |
| By /s/ Paul F. Roye | |
Paul F. Roye, Executive Vice President and Principal Executive Officer | |
| Date: August 30, 2013 |
Pursuant to the requirements of the Securities Exchange Act of 1934 and the Investment Company Act of 1940, this report has been signed below by the following persons on behalf of the Registrant and in the capacities and on the dates indicated.
| By /s/ Paul F. Roye |
Paul F. Roye, Executive Vice President and Principal Executive Officer |
| Date: August 30, 2013 |
| By /s/ Jeffrey P. Regal |
Jeffrey P. Regal, Treasurer and Principal Financial Officer |
| Date: August 30, 2013 |