UNITED STATES
SECURITIES AND EXCHANGE COMMISSION
Washington, D.C. 20549
FORM N-CSR
Certified Shareholder Report of
Registered Management Investment Companies
Investment Company Act File Number: 811-22215
International Growth and Income Fund
(Exact Name of Registrant as Specified in Charter)
One Market, Steuart Tower
Suite 2000
San Francisco, California 94105
(Address of Principal Executive Offices)
Registrant's telephone number, including area code: (415) 421-9360
Date of fiscal year end: June 30
Date of reporting period: June 30, 2014
Patrick F. Quan
International Growth and Income Fund
One Market, Steuart Tower
Suite 2000
San Francisco, California 94105
(Name and Address of Agent for Service)
Copies to:
Michael Glazer
Bingham McCutchen LLP
355 South Grand Avenue, Suite 4400
Los Angeles, California 90071
(Counsel for the Registrant)
ITEM 1 – Reports to Stockholders
![]()
Selectivity has
helped us navigate
a complex world.
Special feature page 6
| |
 | International Growth and
Annual report |
International Growth and Income Fund seeks to provide long-term growth of capital with current income by investing primarily in the stocks of larger, well-established companies domiciled outside the U.S.
This fund is one of more than 40 offered by one of the nation’s largest mutual fund families, American Funds, from Capital Group. For more than 80 years, Capital has invested with a long-term focus based on thorough research and attention to risk.
Fund results shown in this report, unless otherwise indicated, are for Class A shares at net asset value. If a sales charge (maximum 5.75%) had been deducted, the results would have been lower. Results are for past periods and are not predictive of results for future periods. Current and future results may be lower or higher than those shown. Share prices and returns will vary, so investors may lose money. Investing for short periods makes losses more likely. Investments are not FDIC-insured, nor are they deposits of or guaranteed by a bank or any other entity, so they may lose value. For current information and month-end results, visit americanfunds.com.
Here are the average annual total returns on a $1,000 investment with all distributions reinvested for periods ended June 30, 2014:
| Class A shares | 1 year | 5 years | Lifetime (since 10/1/08) | |||
| Reflecting 5.75% maximum sales charge | 15.59% | 11.77% | 10.36% |
For other share class results, visit americanfunds.com and americanfundsretirement.com.
The total annual fund operating expense ratio is 0.91% for Class A shares as of the prospectus dated August 29, 2014 (unaudited).
Investment results assume all distributions are reinvested and reflect applicable fees and expenses. When applicable, investment results reflect fee waivers and/or expense reimbursements, without which results would have been lower. Visit americanfunds.com for more information.
The fund’s 30-day yield for Class A shares as of July 31, 2014, reflecting the 5.75% maximum sales charge and calculated in accordance with the U.S. Securities and Exchange Commission formula, was 2.12%.
Investing outside the United States may be subject to risks such as currency fluctuations, periods of illiquidity and price volatility. These risks may be heightened in connection with investments in developing countries. Refer to the fund prospectus and the Risk Factors section of this report for more information on these and other risks associated with investing in the fund.

The fund pursues
international growth
with a dividend focus.
Special feature
| 6 | Navigating a complex world with a selective approach and flexible mandate |
Contents
| 1 | Letter to investors |
| 5 | The value of a $10,000 investment |
| 12 | Summary investment portfolio |
| 16 | Financial statements |
| 34 | Board of trustees and other officers |
International stock markets rallied for the second straight year, supported by ongoing global monetary stimulus and improving economic conditions in Europe, the United States and other key markets.
For the 12 months ended June 30, 2014, shares of International Growth and Income Fund advanced 22.66% for those who reinvested distributions totaling $2.55 a share — a figure that includes, on a per share basis, quarterly dividend payments totaling about $1.18 and a $1.37 capital gain paid in December. This amounts to an income return of 3.8%.
The fund’s total return exceeded the 21.75% return of its primary benchmark, the unmanaged MSCI ACWI (All Country World Index) ex USA. The index measures a broad range of developed- and developing-country stock markets excluding the U.S. The fund also slightly outpaced the 22.28% return of the Lipper International Funds Index, a peer group measure.
The market environment
Most of the world’s stock markets
Results at a glance
For periods ended June 30, 2014, with all distributions reinvested
| Cumulative total returns | Average annual total returns | |||||||||||
| 1 year | 5 years | Lifetime (since 10/1/08) | ||||||||||
| International Growth and Income Fund (Class A shares) | 22.66 | % | 13.11 | % | 11.51 | % | ||||||
| MSCI ACWI ( All Country World Index) ex USA* | 21.75 | 11.11 | 7.16 | |||||||||
| Lipper International Funds Index | 22.28 | 12.02 | 7.73 | |||||||||
| * | The market index is unmanaged and, therefore, has no expenses. The index reflects dividends net of withholding taxes. Investors cannot invest directly in an index. |
| International Growth and Income Fund | 1 |
Where the fund’s assets were invested
Percent of net assets by country as of June 30, 2014
| International Growth and Income Fund | MSCI ACWI ex USA* | |||||||
| Europe | ||||||||
| Euro zone† | 32.1 | % | 22.4 | % | ||||
| United Kingdom | 18.6 | 15.3 | ||||||
| Switzerland | 5.4 | 6.4 | ||||||
| Sweden | 1.5 | 2.2 | ||||||
| Other Europe | 1.2 | 3.6 | ||||||
| 58.8 | 49.9 | |||||||
| Asia/Pacific | ||||||||
| Japan | 8.9 | 14.4 | ||||||
| Hong Kong | 5.4 | 2.0 | ||||||
| China | 3.5 | 3.9 | ||||||
| Taiwan | 3.1 | 2.6 | ||||||
| India | 2.6 | 1.4 | ||||||
| Australia | 2.3 | 5.5 | ||||||
| Other Asia/Pacific | .8 | 6.5 | ||||||
| 26.6 | 36.3 | |||||||
| The Americas | ||||||||
| Canada | 5.4 | 7.6 | ||||||
| Mexico | 1.4 | 1.1 | ||||||
| United States | .3 | — | ||||||
| Other Americas | — | 2.9 | ||||||
| 7.1 | 11.6 | |||||||
| Other | ||||||||
| South Africa | .3 | 1.6 | ||||||
| Other countries | — | .6 | ||||||
| .3 | 2.2 | |||||||
| Convertible securities, bonds, notes & other debt instruments, short-term securities & other assets less liabilities | 7.2 | — | ||||||
| Total | 100.0 | % | 100.0 | % | ||||
| * | The MSCI ACWI (All Country World Index) ex USA is weighted by market capitalization. |
| † | Countries using the euro as a common currency: Austria, Belgium, Cyprus, Estonia, Finland, France, Germany, Greece, Ireland, Italy, Latvia, Luxembourg, Malta, the Netherlands, Portugal, Slovakia, Slovenia and Spain. |
recorded strong positive results for the fiscal year. European stocks notched outstanding returns amid soaring mergers-and-acquisitions activity, particularly in the health care sector. Stocks were bolstered by new stimulus measures initiated by the European Central Bank as it sought to stave off Japan-style deflation. Among other steps, the central bank cut a key interest rate to less than zero to encourage banks to boost lending. Euro-zone GDP rose by an annualized 0.8% in the first quarter of 2014 and inflation stood at 0.5% in May.
A number of Europe’s most economically troubled countries, including Spain (57.17%), Greece (55.08%) and Ireland (34.97%), delivered particularly noteworthy stock market gains. Germany (29.35%) and France (28.07%), the euro zone’s two largest economies, also outpaced the broader market. Overall, the MSCI Europe Index rose 29.28% in U.S. dollar terms.1
Despite considerable volatility, Japanese shares (+9.85%) ended in positive territory. After soaring more than 50%, in local currency terms, in fiscal-year 2013, Japan’s stock market sold off in the early months of 2014, hurt in part by a slowing Chinese economy and worries over the potential impact of a sales tax that took effect in April. However, stocks closed out the fiscal year with gains after revised data showed that the Japanese economy had grown faster in the first quarter than initially reported.
Developing market results were generally positive despite the slowdown in China’s economy and geopolitical strife in some countries. Indian equities advanced 27.40% as investors were cheered by the election
| 1 | Unless otherwise indicated, country and sector returns are based on MSCI indexes and measured in U.S. dollars with net dividends reinvested. |
| 2 | International Growth and Income Fund |
of reform-minded Narendra Modi as prime minister. China’s stock market gained 15.67% for the fiscal year as investors weighed indications that the government would take measured steps against a slowing economy and property market. Elsewhere, shares in Chile (–12.45%) and Indonesia (–11.88%) declined for U.S. investors as both countries’ currencies slid against the U.S. dollar.
All 10 sectors that comprise the MSCI ACWI ex USA posted double-digit returns during the period. Energy stocks (+27.61%) led markets higher as military clashes in Ukraine and Iraq raised fears of potential oil and gas shortages. The information technology (+27.66%) and health care (+26.51%) sectors also recorded outstanding gains.
Solid support from top holdings
The investment professionals who help manage the fund construct the portfolio one company at a time, basing their decisions on fundamental research. While sector and country returns offer a backdrop, individual investment selection plays a primary role in driving the fund’s results.
Seven of the fund’s top-10 holdings outpaced the MSCI ACWI ex USA for the fiscal year, and these positions represent a variety of industries. They included the utility EDP - Energias de Portugal (+62.28%), pharmaceutical companies AstraZeneca (+56.79%) and Novartis (+27.47%); oil companies TOTAL (+48.04%) and Royal Dutch Shell (+31.47%); insurer Prudential (+40.36%); and Imperial Tobacco (+29.79%), the fund’s sixth-largest holding. Elsewhere among the top-10 holdings, French insurer AXA (+21.64%) and Taiwan
| Largest equity holdings (as of June 30, 2014) | ||||||
| Company | Country | Percent of net assets | ||||
| AXA | France | 2.4 | % | |||
| EDP - Energias de Portugal | Portugal | 2.3 | ||||
| Novartis | Switzerland | 2.2 | ||||
| AstraZeneca | United Kingdom | 2.0 | ||||
| Taiwan Semiconductor Manufacturing | Taiwan | 2.0 | ||||
| Imperial Tobacco | United Kingdom | 1.9 | ||||
| Royal Dutch Shell | United Kingdom | 1.9 | ||||
| Prudential | United Kingdom | 1.8 | ||||
| TOTAL | France | 1.8 | ||||
| HSBC Holdings | United Kingdom | 1.8 | ||||

| International Growth and Income Fund | 3 |
Semiconductor Manufacturing (+14.40%) trailed the broader market, while U.K. bank HSBC Holdings (–2.38%) was the only of the top 10 investments to decline.
The fund also received strong contributions from a number of investments in the consumer discretionary sector, a broad category that includes media companies, auto manufacturers and makers of luxury goods. Top contributors in this area included OPAP (+112.68%), German auto manufacturer BMW (+45.03%) and casino operator Wynn Macau (+44.87%).
In addition to HSBC Holdings, a number of other holdings lost ground. They included Japanese banks Sumitomo Mitsui Financial Group (–8.68%) and Shinsei Bank (–0.79%) French industrial conglomerate Vallourec (–11.50%) and South African retailer Shoprite Holdings (–22.84%).
Maintaining a long-term view
Overall, the global economy continues to strengthen. Shortly after the close of the fiscal year, a troubled Portuguese financial institution missed a coupon payment, rekindling investor fears about Europe’s debt crisis. While we believe Europe has stabilized and remains on track toward recovery, the incident serves as a reminder that recoveries generally don’t happen in a straight line.
We continue to watch developments in Asia closely, as Japan seeks to restore normal economic growth through the policies of Prime Minister Shinzo Abe and China’s leaders pursue better balance in its domestic economy. However, rather than invest in economies or countries, our focus is on individual companies. Through intensive research, we continue to find opportunities to invest in what we believe are strong, attractively valued companies in markets across Europe and Asia. To learn more about our selective approach to investing, we invite you to read the feature article beginning on page 6.
We continue to focus on the long term and encourage you to do the same. We thank you for your commitment to International Growth and Income Fund.
Cordially,

Steven T. Watson
Vice Chairman of the Board

Carl Kawaja
President
August 12, 2014
For current information about the fund, visit americanfunds.com.
| 4 | International Growth and Income Fund |
The value of a $10,000 investment
How a $10,000 investment has fared (for the period October 1, 2008, to June 30, 2014, with distributions reinvested)
Fund results shown are for Class A shares and reflect deduction of the maximum sales charge of 5.75% on the $10,000 investment.¹ Thus, the net amount invested was $9,425. Results are for past periods and are not predictive of results for future periods. Current and future results may be lower or higher than those shown. Share prices and returns will vary, so investors may lose money. For current information and month-end results, visit americanfunds.com.

| 1 | As outlined in the prospectus, the sales charge is reduced for accounts (and aggregated investments) of $25,000 or more and is eliminated for purchases of $1 million or more. There is no sales charge on dividends or capital gain distributions that are reinvested in additional shares. |
| 2 | All results are calculated with dividends and capital gains reinvested. |
| 3 | The market index is unmanaged and, therefore, has no expenses. The index reflects dividends net of withholding taxes. Investors cannot invest directly in an index. |
| 4 | For the period October 1, 2008 (when the fund began operations), through October 31, 2008. |
Average annual total returns based on a $1,000 investment (for periods ended June 30, 2014)*
| 1 year | 5 years | Lifetime (since 10/1/08) | ||||||||||
| Class A shares | 15.59 | % | 11.77 | % | 10.36 | % | ||||||
| * | Assumes reinvestment of all distributions and payment of the maximum 5.75% sales charge. |
Investment results assume all distributions are reinvested and reflect applicable fees and expenses. When applicable, investment results reflect fee waivers and/or expense reimbursements, without which results would have been lower. Visit americanfunds.com for more information.
| International Growth and Income Fund | 5 |
Navigating a complex world with a selective approach and flexible mandate
While we launched the fund in the midst of a very significant downturn, shortly afterward we experienced a strong upturn. Thus far the fund has weathered stormy seas and also prospered when the sailing was smoother. If we hit stormy seas again, we believe we can continue to do well.

Carl Kawaja
International Growth and Income Fund pursues a dual objective on behalf of its investors: It seeks to provide both long-term growth of capital and current income. In service of this mission, the fund’s managers focus primarily on well-established companies domiciled outside the U.S. that usually pay dividends.
That focus has served investors well over nearly six years since the fund began operations. From its birth on October 1, 2008, through the close of the most recent fiscal year, the fund has generated an average annual return of 11.51%, outpacing its primary benchmark, the unmanaged MSCI ACWI (All Country World Index) ex USA, by an average of more than 4 percentage points a year. In their pursuit of superior long-term results, the investment professionals who manage the fund don’t focus on particular geographic regions. Rather, they work hard to uncover opportunity at the company level.
In the following pages, we will revisit the premise behind International Growth and Income Fund, look at how the international investing climate has changed since the fund’s founding and explore how highly selective investing — supported by intensive research and a long-term perspective — helps the fund pursue its objectives.
Seeking a sensible approach to international investing
The potential for long-term capital appreciation and diversification long have been recognized as important reasons for investing internationally. Broadly speaking, markets outside the United States represent vast opportunity for long-term investors. As of June 2014, about 51% of world market capitalization came from securities in non-U.S. markets (as represented by the MSCI ACWI Index). Of course, investing beyond U.S. borders does involve some additional risks — currency fluctuations, differing regulations and periods of illiquidity among them.
For a number of years leading up to the introduction of the fund, its investment advisor, Capital Research and Management Company, had been tracking a compelling trend in these markets. More and more companies had been demonstrating a commitment to the idea that a portion of earnings should be returned to investors in the form of regular dividend payments. In October 2008, there were more than 950 dividend-paying companies domiciled in developed markets outside the U.S., as measured by the MSCI EAFE (Europe, Australasia, Far East) Index, many of which had been raising their dividends (see chart on page 8). That figure was significantly higher than the number of dividend payers among U.S. companies.
The fund’s investment professionals believe that this trend provided a compelling long-term opportunity. “When we began the fund, we thought the idea of investing with a focus on dividend-paying companies domiciled outside the U.S. could provide
| 6 | International Growth and Income Fund |

The search for dividends not only provides you with current income, but also with some expectation for lower volatility.

Steve Watson
long-term value for investors,” says portfolio manager Andrew Suzman. “If you look back over the last 100 years, dividends and growth of dividends have been responsible for a very substantial portion of most equity market returns. Dividend-focused investing can go in and out of fashion, but it is intuitively and practically a very sound way to build a portfolio.”
Why are dividends so important? Steady dividend payments over a long period of time often indicate a profitable, well-managed company that’s willing to share its good fortune with shareholders. In other words, dividends are often a hallmark of quality. What’s more, dividends can serve as a cushion against market volatility.
“The search for dividends not only provides you with current income, but also with some expectation for lower volatility because income tends to provide a valuation floor,” says Steve Watson, vice chairman of the fund’s board and a portfolio manager. “But we do not set out to invest solely for dividend income. At the same time, we are looking for stocks whose full value is not recognized by the market, so we are offering investors the prospect of long-term capital appreciation as well.”
Unwavering focus amid a sea of change
This relatively conservative approach was tested early. When the fund opened its doors on October 1, 2008, it was greeted by the worst global financial crisis since the 1930s. In the U.S., financial institutions were confronted with mounting loan losses as housing troubles that had been unfolding since 2007 came to a head. Lehman Brothers, then the fourth-largest
As the world turns: global dividend opportunities then and now
While conditions across global markets have changed considerably since International Growth and Income Fund began, opportunities to invest in dividend paying companies outside the U.S. remain vast.
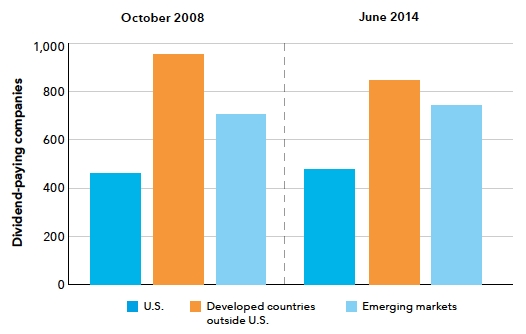
Source: MSCI USA Index, MSCI EAFE Index, MSCI Emerging Markets Index.
| 8 | International Growth and Income Fund |
![]()
investment bank in the U.S., had recently declared bankruptcy. The crisis quickly spread to financial institutions in other markets around the world. Central banks took aggressive action to help keep financial markets functioning.
Unemployment soared — the U.S. alone lost more than 7.5 million jobs as a result of the recession — and export activity around the world declined sharply, helping to push much of the global economy into deep recession. Over the subsequent 24 months, a sovereign debt crisis unfolded in Europe, leaving many investors questioning the viability of the euro currency and economic union. What’s more, China’s economy, which had been a source of strength, began to slow, further unnerving investors.
It is fair to characterize those early days as dark ones. Yet fund managers viewed the market volatility as an opportunity, so they set out to identify companies that could thrive regardless of evolving market and economic conditions. “We really believed the fund had long-term merits, but when we got started I think it is safe to say that we proceeded with great caution,” recalls Andrew. “That being said, it turns out that starting in a difficult moment produced some long-term buying opportunities, which has helped us produce strong returns for investors over the past five years.”
Much has changed, much has not
In recent years, conditions have been decidedly more upbeat. Today, the U.S. stock market is in its fifth year of a bull market. The 18-nation euro zone has pulled out of recession, and the European Central Bank recently instituted a number of stimulus measures, including a negative interest rate for its overnight depositors and special funding arrangements that would benefit banks in peripheral countries, as it seeks to ensure better economic health and growth. Japan is seeking, via the policies of Prime Minister Shinzo Abe, to return to sustainable growth over the long term. China has slowed down, but is seeking a firmer footing for its economy over the long term.
Some things have not changed. As the chart on page 8 shows, international markets continue to represent significant opportunity for dividend-focused investors. And the fund’s managers continue to rely on fundamental research to identify those companies that they believe are well positioned to help the fund meet its growth-and-income objective at any given point in a market cycle.
“Going forward we believe this fund’s mission continues to make sense,” says Carl Kawaja, president of the fund and a portfolio manager. “While we launched the fund in the midst of a very significant downturn, shortly afterward we experienced a strong upturn. Thus far the fund has weathered stormy seas and also prospered when the sailing was smoother. If we hit stormy seas again, we believe we can continue to do well.”
While there have been periods when the fund has trailed the unmanaged MSCI ACWI ex USA, over its lifetime it has generated higher returns than both that benchmark and the Lipper International Funds Index, a measure of its competitors. And it has done so with lower volatility (see chart on page 10).
“With the benefit of hindsight, these five-plus years proved to be a rewarding time for investing in larger companies with a multinational footprint that offered income in the form of dividends,” says Steve. “And it proved to be a good time to seek out companies that, through intensive fundamental analysis, seem undervalued by the market relative to their long-term prospects. Our approach has worked well over the last five years, but I wouldn’t
| International Growth and Income Fund | 9 |
say there is anything special about those years. I believe the fund’s approach is simply a good approach.”
Selectivity driven by deep research
Rather than investing in particular sectors, geographies or categories of stocks, the investment professionals who help manage the fund develop a deep understanding of individual companies and then invest one company at a time, based on whether they believe a particular firm is attractively valued based on its growth potential and business prospects. At the heart of this approach is intensive fundamental research.
Consider that while dividend paying stocks have done well in an international context, investing based on that criterion alone would not have been enough to produce the return that the fund has over its lifetime. During that period, the companies in the MSCI ACWI ex USA that paid the highest dividends — specifically those ranked in the top 40% of the index by weighted dividend yield — generated an average cumulative return of roughly 66%. That compares with an 87% cumulative return for the fund.
“It was also important to invest in the companies that grew their dividends and the companies that were nimble enough to adjust in the midst of a global financial crisis,” says Carl. “Anybody can go find out what the highest yielding stocks are and buy those — a passive, index-based investment could do that. But a passively managed fund can’t figure out which companies are going to grow their dividends over the next five years, or which companies are best able to navigate unexpected developments on the competitive landscape. That only comes from doing the research, understanding the fundamentals and meeting the managements.”
Looking where others don’t
The fund’s managers do not make investment decisions based on short-term market conditions. Rather they decide with the expectation of investing in companies for the long term. This long term investment outlook allows them to invest in what they believe are strong companies when they are overlooked by the market and hold them until the market recognizes their value.
Consider, for example, EDP – Energias de Portugal, a major electricity provider and the fund’s second-largest holding; and Piraeus Bank, a Greek financial institution. The companies are domiciled in countries whose economies have been among the most troubled in Europe in recent years.
“One thing that I have been a little struck by is, who would have guessed that a Portuguese utility company or a Greek bank would end up being among our
Fund results shown are for Class A shares at net asset value. If a sales charge (maximum 5.75%) had been deducted, the results would have been lower. Results are for past periods and are not predictive of results for future periods. Current and future results may be lower or higher than those shown. Share prices and returns will vary, so investors may lose money. For current information and month-end results, visit americanfunds.com.
Return vs volatility (10/31/08–6/30/14)

Superior returns with less volatility
Over its nearly six-year lifetime, International Growth and Income Fund has delivered higher returns than its primary benchmark, the MSCI ACWI ex USA, and other measures.
Source: MSCI, Lipper. Volatility is calculated at net asset value using annualized standard deviation (based on monthly returns). Returns are calculated at net asset value, with all distributions reinvested. Market indexes are unmanaged and, therefore, have no expenses. Investors cannot invest directly in an index. MSCI ACWI (All Country World Index) ex USA is a free-float-adjusted market-capitalization-weighted index that measures equity market results in the global developed and emerging markets, excluding the United States. MSCI World Index ex USA is a free-float-adjusted market-capitalization-weighted index that is designed to measure equity market results of developed markets, excluding the United States. The MSCI indexes reflect dividends net of withholding taxes.
| 10 | International Growth and Income Fund |

significant holdings today?” observes Carl. “It just shows you how quickly the world can change and how important the fund’s flexibility is.”
In the case of EDP, investors had been wary of investing in Portugal for a number of years, as the country confronted substantial debt burden. Many feared that the company would face excessive taxation as the Portuguese government sought revenue to address budget shortfalls. The investment analyst who covers EDP for the fund, however, believed it was a strong company that was undervalued by the market. It has been a holding since the fund’s launch.
“One of the nice things about our long-term approach is sometimes something doesn’t work right away, but rather than abandon the idea and look elsewhere, we may buy more shares at a lower price if we still believe in the thesis behind an investment,” says Steve.
Consider Taiwan Semiconductor Manufacturing (TSMC), the fund’s fifth-largest investment. The company, which also has been in the portfolio since the fund’s launch, makes chips that have enabled rapid advances in technology for smartphones. In the early days of the fund’s life, the world was preoccupied with smartphones, Steve recalls, and Samsung Electronics — a primary competitor of TSMC — was deemed to be the primary beneficiary of that trend. But Shailesh Jaitly, an analyst based in Hong Kong, believed that TSMC’s advantage in leading-edge mobile technologies would help it take market share and expand pricing power. More recently, TSMC has had strong results whereas Samsung Electronics earnings have been disappointing.
“That is an example of our long-term approach and tremendously deep knowledge of a company based on research,” says Steve. “Shailesh has been watching TSMC for more than 15 years and may know that company better than any other analyst in the world.”
Swiss drug maker Novartis, the fund’s third-largest investment, had been out of favor for a number of years due to expiring patents for two key medications and manufacturing problems at a U.S. plant. But analyst Eric Keisman saw potential in the company’s pipeline of drugs in development. The company, which also has been a holding since the fund’s launch, has generated relatively strong results in recent years. To be sure, some of the fund’s long-time holdings — South African mining company Impala Platinum Holdings and Dutch bank ING Groep, for example — have disappointed thus far. But the fund’s managers have the freedom to hold on to investments during challenging periods if they believe the company represents value over the longer term.
Fund objectives inform all decisions
As they seek to identify companies with the potential to do well over time, the fund’s managers rely on a proven process known as The Capital System.SM Under this system, the fund’s three managers are supported by dozens of experienced investment analysts located in markets all across the globe. These professionals work hard to identify those companies that can help the fund meet its mission.
“We had a theory that growth and income investing would be fruitful, and it has been,” says Carl. “We had a theory that there were some non-U.S. companies that would grow their dividends, and they have. And we also had a theory that international investing could be a prudent part of people’s portfolios, and that has been true.”
Whatever conditions arise over the coming years, the fund’s managers will continue to focus on those objectives.
“Thus far we have faced a lot of uncertainty and a lot of volatility,” says Steve. “And yet we’ve managed to generate reasonable returns and reasonable income for our investors, and we believe that by working hard and sticking to our disciplined approach, we can continue to find attractive long-term investment opportunities.” ¢
| International Growth and Income Fund | 11 |
Summary investment portfolio June 30, 2014
| Industry sector diversification | Percent of net assets |

| Country diversification | Percent of net assets | |||
| Euro zone* | 32.1 | % | ||
| United Kingdom | 18.6 | |||
| Japan | 8.9 | |||
| Switzerland | 5.4 | |||
| Hong Kong | 5.4 | |||
| Canada | 5.4 | |||
| China | 3.5 | |||
| Taiwan | 3.1 | |||
| India | 2.6 | |||
| Australia | 2.3 | |||
| Other countries | 5.5 | |||
| Convertible securities, bonds, notes & other debt instruments, short-term securities & other assets less liabilities | 7.2 | |||
| * | Countries using the euro as a common currency; those represented in the fund’s portfolio are Belgium, Finland, France, Germany, Greece, Ireland, Italy, the Netherlands, Portugal and Spain. |
| Common stocks 92.27% | Shares | Value (000) | Percent of net assets | |||||||||
| Financials 27.14% | ||||||||||||
| AXA SA | 9,083,200 | $ | 217,099 | 2.38 | % | |||||||
| Prudential PLC | 7,274,148 | 166,941 | 1.83 | |||||||||
| HSBC Holdings PLC (United Kingdom) | 9,006,896 | 91,392 | ||||||||||
| HSBC Holdings PLC (Hong Kong) | 5,642,396 | 57,222 | 1.63 | |||||||||
| Eurobank Ergasias SA1 | 252,821,128 | 127,743 | 1.40 | |||||||||
| Banco Santander, SA1 | 11,785,376 | 123,131 | 1.35 | |||||||||
| Sumitomo Mitsui Financial Group, Inc. | 2,830,000 | 118,558 | 1.30 | |||||||||
| Bankia, SA1 | 53,300,000 | 103,345 | 1.14 | |||||||||
| Shinsei Bank, Ltd. | 43,088,000 | 96,975 | 1.07 | |||||||||
| Grupo Financiero Santander México, SAB de CV, Class B (ADR) | 7,300,200 | 96,947 | 1.06 | |||||||||
| Svenska Handelsbanken AB, Class A | 1,569,000 | 76,812 | .84 | |||||||||
| Link Real Estate Investment Trust | 13,415,418 | 72,180 | .79 | |||||||||
| BNP Paribas SA | 1,037,530 | 70,388 | .77 | |||||||||
| Sun Hung Kai Properties Ltd. | 4,759,402 | 65,277 | .72 | |||||||||
| Piraeus Bank SA1 | 26,507,881 | 58,802 | .65 | |||||||||
| Other securities | 930,127 | 10.21 | ||||||||||
| 2,472,939 | 27.14 | |||||||||||
| Consumer discretionary 9.84% | ||||||||||||
| OPAP SA | 5,673,200 | 100,988 | 1.11 | |||||||||
| SES SA, Class A (FDR) | 2,175,000 | 82,497 | .91 | |||||||||
| ProSiebenSat.1 Media AG | 1,768,000 | 78,765 | .86 | |||||||||
| Carphone Warehouse Group PLC | 12,010,000 | 66,307 | .73 | |||||||||
| SJM Holdings Ltd. | 24,000,000 | 60,136 | .66 | |||||||||
| Other securities | 507,933 | 5.57 | ||||||||||
| 896,626 | 9.84 | |||||||||||
| Energy 9.22% | ||||||||||||
| Royal Dutch Shell PLC, Class B | 3,908,000 | 170,046 | 1.87 | |||||||||
| TOTAL SA | 2,285,550 | 165,181 | 1.81 | |||||||||
| Enbridge Inc. | 2,220,520 | 105,361 | 1.16 | |||||||||
| China Petroleum & Chemical Corp., Class H | 106,420,000 | 101,471 | 1.11 | |||||||||
| Keyera Corp. | 800,000 | 58,936 | .65 | |||||||||
| Paramount Resources Ltd.1 | 1,050,000 | 58,599 | .64 | |||||||||
| Crescent Point Energy Corp. | 1,260,000 | 55,841 | .61 | |||||||||
| Other securities | 125,125 | 1.37 | ||||||||||
| 840,560 | 9.22 | |||||||||||
| 12 | International Growth and Income Fund |
| Shares | Value (000) | Percent of net assets | ||||||||||
| Industrials 7.75% | ||||||||||||
| Abertis Infraestructuras, SA, Class A | 4,054,050 | $ | 93,288 | 1.02 | % | |||||||
| Adecco SA | 930,000 | 76,556 | .84 | |||||||||
| Meggitt PLC | 8,446,847 | 73,147 | .80 | |||||||||
| Wolseley PLC | 1,112,684 | 60,993 | .67 | |||||||||
| Geberit AG | 170,700 | 59,922 | .66 | |||||||||
| Other securities | 342,654 | 3.76 | ||||||||||
| 706,560 | 7.75 | |||||||||||
| Information technology 7.18% | ||||||||||||
| Taiwan Semiconductor Manufacturing Co. Ltd. | 43,481,506 | 184,219 | 2.02 | |||||||||
| STMicroelectronics NV | 13,793,000 | 123,746 | 1.36 | |||||||||
| Quanta Computer Inc. | 26,454,835 | 77,084 | .85 | |||||||||
| Other securities | 269,052 | 2.95 | ||||||||||
| 654,101 | 7.18 | |||||||||||
| Consumer staples 6.80% | ||||||||||||
| Imperial Tobacco Group PLC | 3,935,000 | 177,114 | 1.94 | |||||||||
| British American Tobacco PLC | 2,670,300 | 158,943 | 1.74 | |||||||||
| Nestlé SA | 774,700 | 60,016 | .66 | |||||||||
| Other securities | 223,923 | 2.46 | ||||||||||
| 619,996 | 6.80 | |||||||||||
| Utilities 6.23% | ||||||||||||
| EDP - Energias de Portugal, SA | 41,172,000 | 206,565 | 2.27 | |||||||||
| Power Assets Holdings Ltd. | 13,985,500 | 122,254 | 1.34 | |||||||||
| Power Grid Corp. of India Ltd. | 36,840,000 | 85,263 | .93 | |||||||||
| National Grid PLC | 4,487,744 | 64,515 | .71 | |||||||||
| Other securities | 88,959 | .98 | ||||||||||
| 567,556 | 6.23 | |||||||||||
| Health care 6.13% | ||||||||||||
| Novartis AG | 2,172,000 | 196,675 | 2.16 | |||||||||
| AstraZeneca PLC | 2,505,000 | 186,080 | 2.04 | |||||||||
| Other securities | 176,190 | 1.93 | ||||||||||
| 558,945 | 6.13 | |||||||||||
| Telecommunication services 4.93% | ||||||||||||
| Orange | 8,380,000 | 132,246 | 1.45 | |||||||||
| KDDI Corp. | 930,000 | 56,725 | .62 | |||||||||
| HKT Trust, units | 48,085,000 | 56,644 | .62 | |||||||||
| Other securities | 204,101 | 2.24 | ||||||||||
| 449,716 | 4.93 | |||||||||||
| Materials 4.80% | ||||||||||||
| L’Air Liquide SA2 | 273,152 | 36,879 | ||||||||||
| L’Air Liquide SA, non-registered shares | 235,612 | 31,811 | .93 | |||||||||
| L’Air Liquide SA, bonus shares2 | 118,891 | 16,052 | ||||||||||
| Potash Corp. of Saskatchewan Inc. | 1,715,400 | 65,117 | .72 | |||||||||
| Other securities | 287,138 | 3.15 | ||||||||||
| 436,997 | 4.80 | |||||||||||
| Miscellaneous 2.25% | ||||||||||||
| Other common stocks in initial period of acquisition | 204,744 | 2.25 | ||||||||||
| Total common stocks (cost: $6,657,107,000) | 8,408,740 | 92.27 | ||||||||||
| Preferred securities 0.15% | ||||||||||||
| Financials 0.14% | ||||||||||||
| HSBC Holdings PLC, Series 2, 8.00% | 472,795 | 12,825 | .14 | |||||||||
| Miscellaneous 0.01% | ||||||||||||
| Other preferred securities in initial period of acquisition | 1,225 | .01 | ||||||||||
| Total preferred securities (cost: $12,739,000) | 14,050 | .15 | ||||||||||
| International Growth and Income Fund | 13 |
| Rights & warrants 0.35% | Value (000) | Percent of net assets | ||||||||||
| Financials 0.32% | ||||||||||||
| Other securities | $ | 28,746 | .32 | % | ||||||||
| Miscellaneous 0.03% | ||||||||||||
| Other rights & warrants in initial period of acquisition | 2,844 | .03 | ||||||||||
| Total rights & warrants (cost: $0) | 31,590 | .35 | ||||||||||
| Convertible securities 0.72% | ||||||||||||
| Other 0.72% | ||||||||||||
| Other securities | 65,400 | .72 | ||||||||||
| Total convertible securities (cost: $77,844,000) | 65,400 | .72 | ||||||||||
| Bonds, notes & other debt instruments 1.80% | Principal amount (000) | |||||||||||
| Corporate bonds & notes 0.97% | ||||||||||||
| Financials 0.38% | ||||||||||||
| SMFG Preferred Capital USD 3 Ltd., junior subordinated 9.50% (undated)3,4 | $ | 5,410 | 6,808 | .08 | ||||||||
| Other securities | 27,720 | .30 | ||||||||||
| 34,528 | .38 | |||||||||||
| Consumer staples 0.03% | ||||||||||||
| British American Tobacco International Finance PLC 9.50% 20183 | 2,000 | 2,601 | .03 | |||||||||
| Other 0.56% | ||||||||||||
| Other securities | 50,749 | .56 | ||||||||||
| Total corporate bonds & notes | 87,878 | .97 | ||||||||||
| U.S. Treasury bonds & notes 0.64% | ||||||||||||
| Other securities | 58,532 | .64 | ||||||||||
| Bonds & notes of governments outside the U.S. 0.19% | ||||||||||||
| Other securities | 17,195 | .19 | ||||||||||
| Total bonds, notes & other debt instruments (cost: $162,400,000) | 163,605 | 1.80 | ||||||||||
| Short-term securities 3.99% | ||||||||||||
| Federal Home Loan Bank 0.075%–0.083% due 8/20–12/5/2014 | 118,800 | 118,784 | 1.30 | |||||||||
| Freddie Mac 0.08%–0.14% due 9/17–12/8/2014 | 56,600 | 56,586 | .62 | |||||||||
| Other securities | 188,173 | 2.07 | ||||||||||
| Total short-term securities (cost: $363,527,000) | 363,543 | 3.99 | ||||||||||
| Total investment securities (cost: $7,273,617,000) | 9,046,928 | 99.28 | ||||||||||
| Other assets less liabilities | 66,140 | .72 | ||||||||||
| Net assets | $ | 9,113,068 | 100.00 | % | ||||||||
This summary investment portfolio is designed to streamline the report and help investors better focus on the fund’s principal holdings. See the inside back cover for details on how to obtain a complete schedule of portfolio holdings.
As permitted by U.S. Securities and Exchange Commission regulations, “Miscellaneous” securities include holdings in their first year of acquisition that have not previously been publicly disclosed.
“Other securities” includes all issues that are not disclosed separately in the summary investment portfolio, including some securities which were pledged as collateral for net losses. The total value of pledged collateral was $724,000, which represented .01% of the net assets of the fund.
| 14 | International Growth and Income Fund |
Forward currency contracts
The fund has entered into forward currency contracts to sell currencies as shown in the following table. The average notional amount of open forward currency contracts was $220,591,000 over the prior 12-month period.
| Unrealized | ||||||||||||
| Contract amount | depreciation | |||||||||||
| Receive | Deliver | at 6/30/2014 | ||||||||||
| Settlement date | Counterparty | (000) | (000) | (000) | ||||||||
| Sales: | ||||||||||||
| Australian dollars | 7/18/2014 | Bank of New York Mellon | $ 30,744 | A$ 33,325 | $(635 | ) | ||||||
| Australian dollars | 9/11/2014 | Bank of America, N.A. | $ 29,475 | A$ 31,800 | (352 | ) | ||||||
| Japanese yen | 7/10/2014 | HSBC Bank | $ 5,399 | ¥ 550,000 | (31 | ) | ||||||
| Japanese yen | 7/14/2014 | HSBC Bank | $ 111,764 | ¥ 11,372,592 | (510 | ) | ||||||
| Japanese yen | 7/18/2014 | UBS AG | $ 14,542 | ¥ 1,490,000 | (168 | ) | ||||||
| Japanese yen | 7/31/2014 | Bank of America, N.A. | $ 8,364 | ¥ 850,000 | (28 | ) | ||||||
| Japanese yen | 8/14/2014 | UBS AG | $ 1,469 | ¥ 150,000 | (12 | ) | ||||||
| Japanese yen | 8/14/2014 | Citibank | $ 16,657 | ¥ 1,700,000 | (130 | ) | ||||||
| Japanese yen | 8/14/2014 | Bank of New York Mellon | $ 23,515 | ¥ 2,400,000 | (184 | ) | ||||||
| Japanese yen | 9/4/2014 | Bank of America, N.A. | $ 5,865 | ¥ 600,000 | (60 | ) | ||||||
| $(2,110 | ) | |||||||||||
The following footnotes apply to either the individual securities noted or one or more of the securities aggregated and listed as a single line item.
| 1 | Security did not produce income during the last 12 months. |
| 2 | Valued under fair value procedures adopted by authority of the board of trustees. The total value of all such securities, including those in “Miscellaneous” and “Other securities,” was $55,488,000, which represented .61% of the net assets of the fund. |
| 3 | Acquired in a transaction exempt from registration under Rule 144A or section 4(2) of the Securities Act of 1933. May be resold in the U.S. in transactions exempt from registration, normally to qualified institutional buyers. The total value of all such securities, including those in “Other securities,” was $173,878,000, which represented 1.91% of the net assets of the fund. |
| 4 | Coupon rate may change periodically. |
Key to abbreviations and symbol
ADR = American Depositary Receipts
FDR = Fiduciary Depositary Receipts
A$ = Australian dollars
¥ = Japanese yen
See Notes to Financial Statements
| International Growth and Income Fund | 15 |
| Statement of assets and liabilities | |
| at June 30, 2014 | (dollars in thousands) |
| Assets: | ||||||||
| Investment securities, at value (cost: $7,273,617) | $ | 9,046,928 | ||||||
| Cash denominated in currencies other than U.S. dollars (cost: $2,511) | 2,513 | |||||||
| Cash | 739 | |||||||
| Receivables for: | ||||||||
| Sales of investments | $ | 54,605 | ||||||
| Sales of fund’s shares | 28,558 | |||||||
| Dividends and interest | 30,619 | 113,782 | ||||||
| 9,163,962 | ||||||||
| Liabilities: | ||||||||
| Unrealized depreciation on open forward currency contracts | 2,110 | |||||||
| Payables for: | ||||||||
| Purchases of investments | 27,062 | |||||||
| Repurchases of fund’s shares | 8,896 | |||||||
| Investment advisory services | 3,676 | |||||||
| Services provided by related parties | 2,377 | |||||||
| Trustees’ deferred compensation | 1,585 | |||||||
| Other | 5,188 | 48,784 | ||||||
| Net assets at June 30, 2014 | $ | 9,113,068 | ||||||
| Net assets consist of: | ||||||||
| Capital paid in on shares of beneficial interest | $ | 7,178,751 | ||||||
| Undistributed net investment income | 10,527 | |||||||
| Undistributed net realized gain | 157,258 | |||||||
| Net unrealized appreciation | 1,766,532 | |||||||
| Net assets at June 30, 2014 | $ | 9,113,068 |
(dollars and shares in thousands, except per-share amounts)
Shares of beneficial interest issued and outstanding (no stated par value) —
unlimited shares authorized (249,312 total shares outstanding)
| Shares | Net asset value | |||||||||||
| Net assets | outstanding | per share | ||||||||||
| Class A | $ | 5,027,032 | 137,509 | $ | 36.56 | |||||||
| Class B | 16,066 | 440 | 36.54 | |||||||||
| Class C | 309,399 | 8,484 | 36.47 | |||||||||
| Class F-1 | 1,225,962 | 33,543 | 36.55 | |||||||||
| Class F-2 | 1,228,459 | 33,593 | 36.57 | |||||||||
| Class 529-A | 129,253 | 3,539 | 36.52 | |||||||||
| Class 529-B | 693 | 19 | 36.51 | |||||||||
| Class 529-C | 32,310 | 889 | 36.36 | |||||||||
| Class 529-E | 4,661 | 128 | 36.52 | |||||||||
| Class 529-F-1 | 10,878 | 297 | 36.57 | |||||||||
| Class R-1 | 9,107 | 249 | 36.49 | |||||||||
| Class R-2 | 53,278 | 1,464 | 36.40 | |||||||||
| Class R-3 | 45,865 | 1,256 | 36.50 | |||||||||
| Class R-4 | 50,782 | 1,390 | 36.54 | |||||||||
| Class R-5 | 20,643 | 562 | 36.72 | |||||||||
| Class R-6 | 948,680 | 25,950 | 36.56 | |||||||||
See Notes to Financial Statements
| 16 | International Growth and Income Fund |
| Statement of operations | |
| for the year ended June 30, 2014 | (dollars in thousands) |
| Investment income: | ||||||||
| Income: | ||||||||
| Dividends (net of non-U.S. taxes of $25,479) | $ | 326,888 | ||||||
| Interest | 16,043 | $ | 342,931 | |||||
| Fees and expenses*: | ||||||||
| Investment advisory services | 38,479 | |||||||
| Distribution services | 17,300 | |||||||
| Transfer agent services | 8,155 | |||||||
| Administrative services | 2,088 | |||||||
| Reports to shareholders | 418 | |||||||
| Registration statement and prospectus | 383 | |||||||
| Trustees’ compensation | 578 | |||||||
| Auditing and legal | 129 | |||||||
| Custodian | 1,277 | |||||||
| Other | 227 | 69,034 | ||||||
| Net investment income | 273,897 | |||||||
| Net realized gain and unrealized appreciation on investments, forward currency contracts and currency: | ||||||||
| Net realized gain (loss) on: | ||||||||
| Investments | 236,798 | |||||||
| Forward currency contracts | 7,221 | |||||||
| Currency transactions | (818 | ) | 243,201 | |||||
| Net unrealized appreciation (depreciation) on: | ||||||||
| Investments (net of non-U.S. taxes of $5,042) | 1,020,842 | |||||||
| Forward currency contracts | (4,654 | ) | ||||||
| Currency translations | 664 | 1,016,852 | ||||||
| Net realized gain and unrealized appreciation on investments, forward currency contracts and currency | 1,260,053 | |||||||
| Net increase in net assets resulting from operations | $ | 1,533,950 |
*Additional information related to class-specific fees and expenses is included in the Notes to Financial Statements.
See Notes to Financial Statements
| International Growth and Income Fund | 17 |
| Statements of changes in net assets | |
| (dollars in thousands) |
| Year ended June 30 | ||||||||
| 2014 | 2013 | |||||||
| Operations: | ||||||||
| Net investment income | $ | 273,897 | $ | 156,009 | ||||
| Net realized gain on investments, forward currency contracts and currency transactions | 243,201 | 268,628 | ||||||
| Net unrealized appreciation on investments, forward currency contracts and currency translations | 1,016,852 | 465,269 | ||||||
| Net increase in net assets resulting from operations | 1,533,950 | 889,906 | ||||||
| Dividends and distributions paid to shareholders: | ||||||||
| Dividends from net investment income | (269,581 | ) | (159,324 | ) | ||||
| Distributions from net realized gain on investments | (291,114 | ) | — | |||||
| Total dividends and distributions paid to shareholders | (560,695 | ) | (159,324 | ) | ||||
| Net capital share transactions | 1,789,408 | 728,944 | ||||||
| Total increase in net assets | 2,762,663 | 1,459,526 | ||||||
| Net assets: | ||||||||
| Beginning of year | 6,350,405 | 4,890,879 | ||||||
| End of year (including undistributed and distributions in excess of net investment income: $10,527 and $(6,399), respectively) | $ | 9,113,068 | $ | 6,350,405 | ||||
See Notes to Financial Statements
| 18 | International Growth and Income Fund |
Notes to financial statements
1. Organization
International Growth and Income Fund (the “fund”) is registered under the Investment Company Act of 1940 as an open-end, diversified management investment company. The fund seeks to provide long-term growth of capital with current income by investing primarily in the stocks of larger, well-established companies domiciled outside the U.S.
The fund has 16 share classes consisting of five retail share classes (Classes A, B and C, as well as two F share classes, F-1 and F-2), five 529 college savings plan share classes (Classes 529-A, 529-B, 529-C, 529-E and 529-F-1) and six retirement plan share classes (Classes R-1, R-2, R-3, R-4, R-5 and R-6). The 529 college savings plan share classes can be used to save for college education. The retirement plan share classes are generally offered only through eligible employer-sponsored retirement plans. The fund’s share classes are described further in the following table:
| Share class | Initial sales charge | Contingent deferred sales charge upon redemption | Conversion feature | |||
| Classes A and 529-A | Up to 5.75% | None (except 1% for certain redemptions within one year of purchase without an initial sales charge) | None | |||
| Classes B and 529-B* | None | Declines from 5% to 0% for redemptions within six years of purchase | Classes B and 529-B convert to Classes A and 529-A, respectively, after eight years | |||
| Class C | None | 1% for redemptions within one year of purchase | Class C converts to Class F-1 after 10 years | |||
| Class 529-C | None | 1% for redemptions within one year of purchase | None | |||
| Class 529-E | None | None | None | |||
| Classes F-1, F-2 and 529-F-1 | None | None | None | |||
| Classes R-1, R-2, R-3, R-4, R-5 and R-6 | None | None | None |
*Class B and 529-B shares of the fund are not available for purchase.
Holders of all share classes have equal pro rata rights to assets, dividends and liquidation proceeds. Each share class has identical voting rights, except for the exclusive right to vote on matters affecting only its class. Share classes have different fees and expenses (“class-specific fees and expenses”), primarily due to different arrangements for distribution, administrative and shareholder services. Differences in class-specific fees and expenses will result in differences in net investment income and, therefore, the payment of different per-share dividends by each share class.
2. Significant accounting policies
The fund is an investment company that applies the accounting and reporting guidance issued in Topic 946 by the U.S. Financial Accounting Standards Board. The fund’s financial statements have been prepared to comply with U.S. generally accepted accounting principles (“U.S. GAAP”). These principles require the fund’s investment adviser to make estimates and assumptions that affect reported amounts and disclosures. Actual results could differ from those estimates. The fund follows the significant accounting policies described in this section, as well as the valuation policies described in the next section on valuation.
Security transactions and related investment income — Security transactions are recorded by the fund as of the date the trades are executed with brokers. Realized gains and losses from security transactions are determined based on the specific identified cost of the securities. In the event a security is purchased with a delayed payment date, the fund will segregate liquid assets sufficient to meet its payment obligations. Dividend income is recognized on the ex-dividend date and interest income is recognized on an accrual basis. Market discounts, premiums and original issue discounts on fixed-income securities are amortized daily over the expected life of the security.
Class allocations — Income, fees and expenses (other than class-specific fees and expenses) and realized and unrealized gains and losses are allocated daily among the various share classes based on their relative net assets. Class-specific fees and expenses, such as distribution, administrative and shareholder services, are charged directly to the respective share class.
| International Growth and Income Fund | 19 |
Dividends and distributions to shareholders — Dividends and distributions to shareholders are recorded on the ex-dividend date.
Currency translation — Assets and liabilities, including investment securities, denominated in currencies other than U.S. dollars are translated into U.S. dollars at the exchange rates supplied by one or more pricing vendors on the valuation date. Purchases and sales of investment securities and income and expenses are translated into U.S. dollars at the exchange rates on the dates of such transactions. The effects of changes in exchange rates on investment securities are included with the net realized gain or loss and net unrealized appreciation or depreciation on investments in the fund’s statement of operations. The realized gain or loss and unrealized appreciation or depreciation resulting from all other transactions denominated in currencies other than U.S. dollars are disclosed separately.
3. Valuation
Capital Research and Management Company (“CRMC”), the fund’s investment adviser, values the fund’s investments at fair value as defined by U.S. GAAP. The net asset value of each share class of the fund is generally determined as of approximately 4:00 p.m. New York time each day the New York Stock Exchange is open.
Methods and inputs — The fund’s investment adviser uses the following methods and inputs to establish the fair value of the fund’s assets and liabilities. Use of particular methods and inputs may vary over time based on availability and relevance as market and economic conditions evolve.
Equity securities are generally valued at the official closing price of, or the last reported sale price on, the exchange or market on which such securities are traded, as of the close of business on the day the securities are being valued or, lacking any sales, at the last available bid price. Prices for each security are taken from the principal exchange or market on which the security trades.
Fixed-income securities, including short-term securities, are generally valued at prices obtained from one or more pricing vendors. Vendors value such securities based on one or more of the inputs described in the following table. The table provides examples of inputs that are commonly relevant for valuing particular classes of fixed-income securities in which the fund is authorized to invest. However, these classifications are not exclusive, and any of the inputs may be used to value any other class of fixed-income security.
| Fixed-income class | Examples of standard inputs | |
| All | Benchmark yields, transactions, bids, offers, quotations from dealers and trading systems, new issues, spreads and other relationships observed in the markets among comparable securities; and proprietary pricing models such as yield measures calculated using factors such as cash flows, financial or collateral performance and other reference data (collectively referred to as “standard inputs”) | |
| Corporate bonds & notes; convertible securities | Standard inputs and underlying equity of the issuer | |
| Bonds & notes of governments & government agencies | Standard inputs and interest rate volatilities | |
| Mortgage-backed; asset-backed obligations | Standard inputs and cash flows, prepayment information, default rates, delinquency and loss assumptions, collateral characteristics, credit enhancements and specific deal information |
When the fund’s investment adviser deems it appropriate to do so (such as when vendor prices are unavailable or not deemed to be representative), fixed-income securities will be valued in good faith at the mean quoted bid and ask prices that are reasonably and timely available (or bid prices, if ask prices are not available) or at prices for securities of comparable maturity, quality and type.
Securities with both fixed-income and equity characteristics, or equity securities traded principally among fixed-income dealers, are generally valued in the manner described for either equity or fixed-income securities, depending on which method is deemed most appropriate by the fund’s investment adviser. Forward currency contracts are valued at the mean of representative quoted bid and ask prices, generally based on prices supplied by one or more pricing vendors.
Securities and other assets for which representative market quotations are not readily available or are considered unreliable by the fund’s investment adviser are fair valued as determined in good faith under fair valuation guidelines adopted by authority of the fund’s board of trustees as further described. The investment adviser follows fair valuation guidelines, consistent with U.S. Securities and Exchange Commission rules and guidance, to consider relevant principles and factors when making fair value determinations. The investment adviser considers relevant indications of value that are reasonably and timely available to it in determining the fair value to
| 20 | International Growth and Income Fund |
be assigned to a particular security, such as the type and cost of the security; contractual or legal restrictions on resale of the security; relevant financial or business developments of the issuer; actively traded similar or related securities; conversion or exchange rights on the security; related corporate actions; significant events occurring after the close of trading in the security; and changes in overall market conditions. In addition, the closing prices of equity securities that trade in markets outside U.S. time zones may be adjusted to reflect significant events that occur after the close of local trading but before the net asset value of each share class of the fund is determined. Fair valuations and valuations of investments that are not actively trading involve judgment and may differ materially from valuations that would have been used had greater market activity occurred.
Processes and structure — The fund’s board of trustees has delegated authority to the fund’s investment adviser to make fair value determinations, subject to board oversight. The investment adviser has established a Joint Fair Valuation Committee (the “Fair Valuation Committee”) to administer, implement and oversee the fair valuation process, and to make fair value decisions. The Fair Valuation Committee regularly reviews its own fair value decisions, as well as decisions made under its standing instructions to the investment adviser’s valuation teams. The Fair Valuation Committee reviews changes in fair value measurements from period to period and may, as deemed appropriate, update the fair valuation guidelines to better reflect the results of back testing and address new or evolving issues. The Fair Valuation Committee reports any changes to the fair valuation guidelines to the board of trustees with supplemental information to support the changes. The fund’s board and audit committee also regularly review reports that describe fair value determinations and methods.
The fund’s investment adviser has also established a Fixed-Income Pricing Review Group to administer and oversee the fixed-income valuation process, including the use of fixed-income pricing vendors. This group regularly reviews pricing vendor information and market data. Pricing decisions, processes and controls over security valuation are also subject to additional internal reviews, including an annual control self-evaluation program facilitated by the investment adviser’s compliance group.
Classifications — The fund’s investment adviser classifies the fund’s assets and liabilities into three levels based on the inputs used to value the assets or liabilities. Level 1 values are based on quoted prices in active markets for identical securities. Level 2 values are based on significant observable market inputs, such as quoted prices for similar securities and quoted prices in inactive markets. Certain securities trading outside the U.S. may transfer between Level 1 and Level 2 due to valuation adjustments resulting from significant market movements following the close of local trading. Level 3 values are based on significant unobservable inputs that reflect the investment adviser’s determination of assumptions that market participants might reasonably use in valuing the securities. The valuation levels are not necessarily an indication of the risk or liquidity associated with the underlying investment. For example, U.S. government securities are reflected as Level 2 because the inputs used to determine fair value may not always be quoted prices in an active market. The following tables present the fund’s valuation levels as of June 30, 2014 (dollars in thousands):
| Investment securities | ||||||||||||||||
| Level 1 | Level 2 | Level 3 | Total | |||||||||||||
| Assets: | ||||||||||||||||
| Common stocks: | ||||||||||||||||
| Financials | $ | 2,472,939 | $ | — | $ | — | $ | 2,472,939 | ||||||||
| Consumer discretionary | 896,626 | — | — | 896,626 | ||||||||||||
| Energy | 840,560 | — | — | 840,560 | ||||||||||||
| Industrials | 706,560 | — | — | 706,560 | ||||||||||||
| Information technology | 654,101 | — | — | 654,101 | ||||||||||||
| Consumer staples | 619,996 | — | — | 619,996 | ||||||||||||
| Utilities | 567,556 | — | — | 567,556 | ||||||||||||
| Health care | 558,945 | — | — | 558,945 | ||||||||||||
| Telecommunication services | 449,716 | — | — | 449,716 | ||||||||||||
| Materials | 384,066 | 52,931 | — | 436,997 | ||||||||||||
| Miscellaneous | 204,744 | — | — | 204,744 | ||||||||||||
| Preferred securities | 1,225 | 12,825 | — | 14,050 | ||||||||||||
| Rights & warrants | 29,033 | 2,557 | — | 31,590 | ||||||||||||
| Convertible securities | — | 65,400 | — | 65,400 | ||||||||||||
| Bonds, notes & other debt instruments | — | 163,605 | — | 163,605 | ||||||||||||
| Short-term securities | — | 363,543 | — | 363,543 | ||||||||||||
| Total | $ | 8,386,067 | $ | 660,861 | $ | — | $ | 9,046,928 | ||||||||
| International Growth and Income Fund | 21 |
| Other investments* | ||||||||||||||||
| Level 1 | Level 2 | Level 3 | Total | |||||||||||||
| Liabilities: | ||||||||||||||||
| Unrealized depreciation on open forward currency contracts | $ | — | $ | (2,110 | ) | $ | — | $ | (2,110 | ) | ||||||
*Forward currency contracts are not included in the investment portfolio.
4. Risk factors
Investing in the fund may involve certain risks including, but not limited to, those described below.
Market conditions — The prices of, and the income generated by, the common stocks and other securities held by the fund may decline — sometimes rapidly or unpredictably — due to various factors, including events or conditions affecting the general economy or particular industries; overall market changes; local, regional or global political, social or economic instability; governmental or governmental agency responses to economic conditions; and currency, interest rate and commodity price fluctuations.
Issuer risks — The values of, and the income generated by, securities held by the fund may also decline in response to various factors directly related to the issuers of such securities, including reduced demand for an issuer’s goods or services, poor management performance and strategic initiatives such as mergers, acquisitions or dispositions and the market response to any such initiative.
Investing outside the U.S. — Securities of issuers domiciled outside the U.S., or with significant operations outside the U.S., may lose value because of adverse political, social, economic or market developments in the countries or regions in which the issuers operate. These securities may also lose value due to changes in foreign currency exchange rates against the U.S. dollar and/or currencies of other countries. Securities markets in certain countries may be more volatile and/or less liquid than those in the U.S. Investments outside the U.S. may also be subject to different accounting practices and different regulatory, legal and reporting standards, and may be more difficult to value, than those in the U.S. In addition, the value of investments outside the U.S. may be reduced by foreign taxes, including foreign withholding taxes on interest and dividends. Further, there may be increased risks of delayed settlement of securities purchased or sold by the fund. The risks of investing outside the U.S. may be heightened in connection with investments in emerging markets.
Investing in emerging markets — Investing in emerging markets may involve risks in addition to and greater than those generally associated with investing in the securities markets of developed countries. For instance, developing countries may have less developed legal and accounting systems than those in developed countries. The governments of these countries may be less stable and more likely to impose capital controls, nationalize a company or industry, place restrictions on foreign ownership and on withdrawing sale proceeds of securities from the country, and/or impose punitive taxes that could adversely affect the prices of securities. In addition, the economies of these countries may be dependent on relatively few industries that are more susceptible to local and global changes. Securities markets in these countries can also be relatively small and have substantially lower trading volumes. As a result, securities issued in these countries may be more volatile and less liquid, and may be more difficult to value, than securities issued in countries with more developed economies and/or markets. Additionally, there may be increased settlement risks for transactions in local securities.
Investing in growth-oriented stocks — Growth-oriented common stocks and other equity-type securities (such as preferred stocks, convertible preferred stocks and convertible bonds) may involve larger price swings and greater potential for loss than other types of investments.
Investing in income-oriented stocks — Income provided by the fund may be reduced by changes in the dividend policies of, and the capital resources available for dividend payments at, the companies in which the fund invests.
Management — The investment adviser to the fund actively manages the fund’s investments. Consequently, the fund is subject to the risk that the methods and analyses employed by the investment adviser in this process may not produce the desired results. This could cause the fund to lose value or its investment results to lag relevant benchmarks or other funds with similar objectives.
| 22 | International Growth and Income Fund |
5. Certain investment techniques
Forward currency contracts — The fund has entered into forward currency contracts, which represent agreements to exchange currencies on specific future dates at predetermined rates. The fund’s investment adviser uses forward currency contracts to manage the fund’s exposure to changes in exchange rates. Upon entering into these contracts, risks may arise from the potential inability of counterparties to meet the terms of their contracts and from possible movements in exchange rates.
On a daily basis, the fund’s investment adviser values forward currency contracts and records unrealized appreciation or depreciation for open forward currency contracts in the fund’s statement of assets and liabilities. Realized gains or losses are recorded at the time the forward currency contract is closed or offset by another contract with the same broker for the same settlement date and currency.
Closed forward currency contracts that have not reached their settlement date are included in the respective receivables or payables for closed forward currency contracts in the fund’s statement of assets and liabilities. Net realized gains or losses from closed forward currency contracts and net unrealized appreciation or depreciation from open forward currency contracts are recorded in the fund’s statement of operations.
The following tables present the financial statement impacts resulting from the fund’s use of forward currency contracts as of June 30, 2014 (dollars in thousands):
| Asset | Liability | ||||||||||||
| Contract | Location on statement of assets and liabilities | Value | Location on statement of assets and liabilities | Value | |||||||||
| Forward currency | Unrealized appreciation on open forward currency contracts | $ | — | Unrealized depreciation on open forward currency contracts | $ | 2,110 | |||||||
| Net realized gain | Net unrealized depreciation | ||||||||||||
| Contract | Location on statement of operations | Value | Location on statement of operations | Value | |||||||||
| Forward currency | Net realized gain on forward currency contracts | $ | 7,221 | Net unrealized depreciation on forward currency contracts | $ | (4,654) | |||||||
Collateral — The fund participates in a collateral program due to its use of forward currency contracts. The program calls for the fund to either receive or pledge collateral based on the net gain or loss on unsettled forward currency contracts by counterparty. The purpose of the collateral is to cover potential losses that could occur in the event that either party cannot meet its contractual obligations.
Rights of offset — The fund has entered into enforceable master netting agreements with certain counterparties for forward currency contracts, where amounts payable by each party to the other in the same currency, with the same settlement date and with the same counterparty are settled net of each party’s payment obligation. For financial reporting purposes, the fund does not offset financial assets and financial liabilities that are subject to netting arrangements in the statement of assets and liabilities.
The following table presents the fund’s forward currency contracts by counterparty, including those that are subject to potential offset on the statement of assets and liabilities as of June 30, 2014 (dollars in thousands):
| Gross amounts recognized in the | Gross amounts not offset in the statement of assets and liabilities and subject to a master netting agreement | |||||||||||||||||||||
| Counterparty | statement of assets and liabilities | Available to offset | Non-cash collateral* | Cash collateral | Net amount | |||||||||||||||||
| Liabilities: | Bank of America, N.A. | $ | 440 | $ | — | $ | (97 | ) | $ | — | $ | 343 | ||||||||||
| Bank of New York Mellon | 819 | — | (629 | ) | — | 190 | ||||||||||||||||
| Citibank | 130 | — | — | — | 130 | |||||||||||||||||
| HSBC Bank | 541 | — | — | — | 541 | |||||||||||||||||
| UBS AG | 180 | — | — | — | 180 | |||||||||||||||||
| $ | 2,110 | $ | — | $ | (726 | ) | $ | — | $ | 1,384 | ||||||||||||
*Non-cash collateral is shown on a settlement basis.
| International Growth and Income Fund | 23 |
6. Taxation and distributions
Federal income taxation — The fund complies with the requirements under Subchapter M of the Internal Revenue Code applicable to mutual funds and intends to distribute substantially all of its net taxable income and net capital gains each year. The fund is not subject to income taxes to the extent such distributions are made. Therefore, no federal income tax provision is required.
As of and during the period ended June 30, 2014, the fund did not have a liability for any unrecognized tax benefits. The fund recognizes interest and penalties, if any, related to unrecognized tax benefits as income tax expense in the statement of operations. During the period, the fund did not incur any interest or penalties.
The fund is not subject to examination by U.S. federal tax authorities for tax years before 2010, by state tax authorities for tax years before 2009 and by tax authorities outside the U.S. for tax years before 2011.
Non-U.S. taxation — Dividend and interest income are recorded net of non-U.S. taxes paid. Gains realized by the fund on the sale of securities in certain countries are subject to non-U.S. taxes. The fund records a liability based on unrealized gains to provide for potential non-U.S. taxes payable upon the sale of these securities.
Distributions — Distributions paid to shareholders are based on net investment income and net realized gains determined on a tax basis, which may differ from net investment income and net realized gains for financial reporting purposes. These differences are due primarily to different treatment for items such as currency gains and losses; short-term capital gains and losses; capital losses related to sales of certain securities within 30 days of purchase; unrealized appreciation of certain investments in securities outside the U.S.; and cost of investments sold. The fiscal year in which amounts are distributed may differ from the year in which the net investment income and net realized gains are recorded by the fund for financial reporting purposes. The fund may also designate a portion of the amount paid to redeeming shareholders as a distribution for tax purposes.
During the year ended June 30, 2014, the fund reclassified $5,000 from undistributed net investment income and $6,046,000 from undistributed net realized gain to capital paid in on shares of beneficial interest and $12,615,000 from undistributed net realized gain to undistributed net investment income to align financial reporting with tax reporting.
As of June 30, 2014, the tax-basis components of distributable earnings, unrealized appreciation (depreciation) and cost of investment securities were as follows (dollars in thousands):
| Undistributed ordinary income | $ | 21,491 | ||
| Undistributed long-term capital gains | 159,852 | |||
| Gross unrealized appreciation on investment securities | 1,890,315 | |||
| Gross unrealized depreciation on investment securities | (132,173 | ) | ||
| Net unrealized appreciation on investment securities | 1,758,142 | |||
| Cost of investment securities | 7,288,786 |
| 24 | International Growth and Income Fund |
The tax character of distributions paid to shareholders was as follows (dollars in thousands):
| Year ended June 30, 2014 | Year ended June 30, 2013 | |||||||||||||||||||||||
| Ordinary | Long-term | Total distributions | Ordinary | Long-term | Total distributions | |||||||||||||||||||
| Share class | income | capital gains | paid | income | capital gains | paid | ||||||||||||||||||
| Class A | $ | 151,235 | $ | 166,941 | $ | 318,176 | $ | 95,896 | $ | — | $ | 95,896 | ||||||||||||
| Class B | 420 | 657 | 1,077 | 348 | — | 348 | ||||||||||||||||||
| Class C | 7,109 | 10,102 | 17,211 | 4,138 | — | 4,138 | ||||||||||||||||||
| Class F-1 | 36,770 | 38,807 | 75,577 | 18,507 | — | 18,507 | ||||||||||||||||||
| Class F-2 | 34,585 | 33,681 | 68,266 | 18,570 | — | 18,570 | ||||||||||||||||||
| Class 529-A | 3,799 | 4,247 | 8,046 | 2,280 | — | 2,280 | ||||||||||||||||||
| Class 529-B | 17 | 28 | 45 | 15 | — | 15 | ||||||||||||||||||
| Class 529-C | 731 | 1,066 | 1,797 | 400 | — | 400 | ||||||||||||||||||
| Class 529-E | 126 | 156 | 282 | 71 | — | 71 | ||||||||||||||||||
| Class 529-F-1 | 318 | 336 | 654 | 160 | — | 160 | ||||||||||||||||||
| Class R-1 | 225 | 242 | 467 | 123 | — | 123 | ||||||||||||||||||
| Class R-2 | 1,226 | 1,746 | 2,972 | 717 | — | 717 | ||||||||||||||||||
| Class R-3 | 1,210 | 1,499 | 2,709 | 708 | — | 708 | ||||||||||||||||||
| Class R-4 | 1,267 | 1,286 | 2,553 | 607 | — | 607 | ||||||||||||||||||
| Class R-5 | 1,447 | 1,877 | 3,324 | 1,132 | — | 1,132 | ||||||||||||||||||
| Class R-6 | 29,096 | 28,443 | 57,539 | 15,652 | — | 15,652 | ||||||||||||||||||
| Total | $ | 269,581 | $ | 291,114 | $ | 560,695 | $ | 159,324 | $ | — | $ | 159,324 | ||||||||||||
7. Fees and transactions with related parties
CRMC, the fund’s investment adviser, is the parent company of American Funds Distributors,® Inc. (“AFD”), the principal underwriter of the fund’s shares, and American Funds Service Company® (“AFS”), the fund’s transfer agent. CRMC, AFD and AFS are considered related parties to the fund.
Investment advisory services — The fund has an investment advisory and service agreement with CRMC that provides for monthly fees accrued daily. These fees are based on a series of decreasing annual rates beginning with 0.690% on the first $500 million of daily net assets and decreasing to 0.460% on such assets in excess of $6.5 billion. For the year ended June 30, 2014, the investment advisory services fee was $38,479,000, which was equivalent to an annualized rate of 0.500% of average daily net assets.
Class-specific fees and expenses — Expenses that are specific to individual share classes are accrued directly to the respective share class. The principal class-specific fees and expenses are further described below:
Distribution services — The fund has plans of distribution for all share classes, except Class F-2, R-5 and R-6 shares. Under the plans, the board of trustees approves certain categories of expenses that are used to finance activities primarily intended to sell fund shares and service existing accounts. The plans provide for payments, based on an annualized percentage of average daily net assets, ranging from 0.30% to 1.00% as noted in this section. In some cases, the board of trustees has limited the amounts that may be paid to less than the maximum allowed by the plans. All share classes with a plan may use up to 0.25% of average daily net assets to pay service fees, or to compensate AFD for paying service fees, to firms that have entered into agreements with AFD to provide certain shareholder services. The remaining amounts available to be paid under each plan are paid to dealers to compensate them for their sales activities.
For Class A and 529-A shares, distribution-related expenses include the reimbursement of dealer and wholesaler commissions paid by AFD for certain shares sold without a sales charge. These share classes reimburse AFD for amounts billed within the prior 15 months but only to the extent that the overall annual expense limit of 0.30% is not exceeded. As of June 30, 2014, there were no unreimbursed expenses subject to reimbursement for Class A or 529-A shares.
| International Growth and Income Fund | 25 |
| Share class | Currently approved limits | Plan limits | ||||||
| Class A | 0.30 | % | 0.30 | % | ||||
| Class 529-A | 0.30 | 0.50 | ||||||
| Classes B and 529-B | 1.00 | 1.00 | ||||||
| Classes C, 529-C and R-1 | 1.00 | 1.00 | ||||||
| Class R-2 | 0.75 | 1.00 | ||||||
| Classes 529-E and R-3 | 0.50 | 0.75 | ||||||
| Classes F-1, 529-F-1 and R-4 | 0.25 | 0.50 | ||||||
Transfer agent services — The fund has a shareholder services agreement with AFS under which the fund compensates AFS for providing transfer agent services to each of the fund’s share classes. These services include recordkeeping, shareholder communications and transaction processing. In addition, the fund reimburses AFS for amounts paid to third parties for performing transfer agent services on behalf of fund shareholders.
Administrative services — The fund has an administrative services agreement with CRMC under which the fund compensates CRMC for providing administrative services to Class A, C, F, 529 and R shares. These services include, but are not limited to, coordinating, monitoring, assisting and overseeing third parties that provide services to fund shareholders. Under the agreement, Class A shares pay an annual fee of 0.01% and Class C, F, 529 and R shares pay an annual fee of 0.05% of their respective average daily net assets.
529 plan services — Each 529 share class is subject to service fees to compensate the Commonwealth of Virginia for the maintenance of the 529 college savings plan. During the period July 1, 2013, to March 31, 2014, the quarterly fee was based on a series of decreasing annual rates beginning with 0.10% on the first $30 billion of the net assets invested in Class 529 shares of the American Funds and decreasing to 0.06% on such assets between $120 billion and $150 billion. Effective April 1, 2014, the quarterly fee was amended to provide for reduced annual rates of 0.07%, 0.06% and 0.05% over $30 billion, $50 billion and $70 billion, respectively, of the net assets invested in Class 529 shares of the American Funds. The fee for any given calendar quarter is accrued and calculated on the basis of the average net assets of Class 529 shares of the American Funds for the last month of the prior calendar quarter. The fee is included in other expenses in the fund’s statement of operations. The Commonwealth of Virginia is not considered a related party.
For the year ended June 30, 2014, class-specific expenses under the agreements were as follows (dollars in thousands):
| Share class | Distribution services | Transfer agent services | Administrative services | 529 plan services | ||||||||||
| Class A | $10,651 | $5,036 | $437 | Not applicable | ||||||||||
| Class B | 169 | 21 | Not applicable | Not applicable | ||||||||||
| Class C | 2,645 | 316 | 132 | Not applicable | ||||||||||
| Class F-1 | 2,643 | 1,284 | 529 | Not applicable | ||||||||||
| Class F-2 | Not applicable | 1,014 | 451 | Not applicable | ||||||||||
| Class 529-A | 225 | 107 | 56 | $106 | ||||||||||
| Class 529-B | 7 | 1 | — | * | 1 | |||||||||
| Class 529-C | 279 | 30 | 14 | 27 | ||||||||||
| Class 529-E | 20 | 2 | 2 | 4 | ||||||||||
| Class 529-F-1 | — | 8 | 4 | 8 | ||||||||||
| Class R-1 | 48 | 6 | 4 | Not applicable | ||||||||||
| Class R-2 | 338 | 198 | 23 | Not applicable | ||||||||||
| Class R-3 | 189 | 73 | 19 | Not applicable | ||||||||||
| Class R-4 | 86 | 36 | 18 | Not applicable | ||||||||||
| Class R-5 | Not applicable | 21 | 22 | Not applicable | ||||||||||
| Class R-6 | Not applicable | 2 | 377 | Not applicable | ||||||||||
| Total class-specific expenses | $17,300 | $8,155 | $2,088 | $146 | ||||||||||
*Amount less than one thousand.
| 26 | International Growth and Income Fund |
Trustees’ deferred compensation — Trustees who are unaffiliated with CRMC may elect to defer the cash payment of part or all of their compensation. These deferred amounts, which remain as liabilities of the fund, are treated as if invested in shares of the fund or other American Funds. These amounts represent general, unsecured liabilities of the fund and vary according to the total returns of the selected funds. Trustees’ compensation of $578,000 in the fund’s statement of operations includes $359,000 in current fees (either paid in cash or deferred) and a net increase of $219,000 in the value of the deferred amounts.
Affiliated officers and trustees — Officers and certain trustees of the fund are or may be considered to be affiliated with CRMC, AFD and AFS. No affiliated officers or trustees received any compensation directly from the fund.
8. Capital share transactions
Capital share transactions in the fund were as follows (dollars and shares in thousands):
| Sales* | Reinvestments of dividends and distributions | Repurchases* | Net increase (decrease) | |||||||||||||||||||||||||||||
| Share class | Amount | Shares | Amount | Shares | Amount | Shares | Amount | Shares | ||||||||||||||||||||||||
| Year ended June 30, 2014 | ||||||||||||||||||||||||||||||||
| Class A | $ | 887,782 | 25,376 | $ | 312,029 | 9,038 | $ | (431,082 | ) | (12,382 | ) | $ | 768,729 | 22,032 | ||||||||||||||||||
| Class B | 1,927 | 56 | 1,073 | 31 | (6,288 | ) | (181 | ) | (3,288 | ) | (94 | ) | ||||||||||||||||||||
| Class C | 79,485 | 2,272 | 16,966 | 493 | (45,816 | ) | (1,318 | ) | 50,635 | 1,447 | ||||||||||||||||||||||
| Class F-1 | 479,068 | 13,658 | 75,015 | 2,174 | (306,543 | ) | (8,617 | ) | 247,540 | 7,215 | ||||||||||||||||||||||
| Class F-2 | 458,094 | 12,919 | 65,112 | 1,883 | (102,577 | ) | (2,939 | ) | 420,629 | 11,863 | ||||||||||||||||||||||
| Class 529-A | 25,542 | 734 | 8,043 | 233 | (11,383 | ) | (328 | ) | 22,202 | 639 | ||||||||||||||||||||||
| Class 529-B | 124 | 4 | 45 | 1 | (364 | ) | (10 | ) | (195 | ) | (5 | ) | ||||||||||||||||||||
| Class 529-C | 7,009 | 203 | 1,797 | 52 | (3,303 | ) | (95 | ) | 5,503 | 160 | ||||||||||||||||||||||
| Class 529-E | 1,007 | 29 | 282 | 8 | (485 | ) | (14 | ) | 804 | 23 | ||||||||||||||||||||||
| Class 529-F-1 | 4,398 | 126 | 646 | 19 | (2,067 | ) | (60 | ) | 2,977 | 85 | ||||||||||||||||||||||
| Class R-1 | 3,170 | 93 | 371 | 11 | (859 | ) | (25 | ) | 2,682 | 79 | ||||||||||||||||||||||
| Class R-2 | 17,578 | 505 | 2,960 | 86 | (12,933 | ) | (371 | ) | 7,605 | 220 | ||||||||||||||||||||||
| Class R-3 | 18,593 | 531 | 2,696 | 78 | (13,536 | ) | (390 | ) | 7,753 | 219 | ||||||||||||||||||||||
| Class R-4 | 26,484 | 750 | 2,542 | 74 | (8,635 | ) | (246 | ) | 20,391 | 578 | ||||||||||||||||||||||
| Class R-5 | 14,061 | 402 | 3,319 | 96 | (42,532 | ) | (1,176 | ) | (25,152 | ) | (678 | ) | ||||||||||||||||||||
| Class R-6 | 229,784 | 6,544 | 57,538 | 1,665 | (26,729 | ) | (757 | ) | 260,593 | 7,452 | ||||||||||||||||||||||
| Total net increase (decrease) | $ | 2,254,106 | 64,202 | $ | 550,434 | 15,942 | $ | (1,015,132 | ) | (28,909 | ) | $ | 1,789,408 | 51,235 | ||||||||||||||||||
| Year ended June 30, 2013 | ||||||||||||||||||||||||||||||||
| Class A | $ | 540,443 | 17,064 | $ | 93,379 | 2,937 | $ | (534,888 | ) | (17,283 | ) | $ | 98,934 | 2,718 | ||||||||||||||||||
| Class B | 1,631 | 52 | 346 | 11 | (7,681 | ) | (249 | ) | (5,704 | ) | (186 | ) | ||||||||||||||||||||
| Class C | 42,564 | 1,345 | 4,059 | 128 | (44,792 | ) | (1,454 | ) | 1,831 | 19 | ||||||||||||||||||||||
| Class F-1 | 445,243 | 13,830 | 18,262 | 570 | (118,885 | ) | (3,803 | ) | 344,620 | 10,597 | ||||||||||||||||||||||
| Class F-2 | 189,867 | 5,980 | 17,665 | 555 | (101,296 | ) | (3,224 | ) | 106,236 | 3,311 | ||||||||||||||||||||||
| Class 529-A | 21,211 | 673 | 2,279 | 72 | (11,978 | ) | (386 | ) | 11,512 | 359 | ||||||||||||||||||||||
| Class 529-B | 122 | 4 | 15 | — | † | (532 | ) | (17 | ) | (395 | ) | (13 | ) | |||||||||||||||||||
| Class 529-C | 6,260 | 199 | 400 | 12 | (3,567 | ) | (116 | ) | 3,093 | 95 | ||||||||||||||||||||||
| Class 529-E | 1,061 | 33 | 71 | 3 | (410 | ) | (13 | ) | 722 | 23 | ||||||||||||||||||||||
| Class 529-F-1 | 2,915 | 91 | 160 | 5 | (608 | ) | (20 | ) | 2,467 | 76 | ||||||||||||||||||||||
| Class R-1 | 1,743 | 54 | 90 | 3 | (1,101 | ) | (36 | ) | 732 | 21 | ||||||||||||||||||||||
| Class R-2 | 13,640 | 438 | 693 | 21 | (8,354 | ) | (269 | ) | 5,979 | 190 | ||||||||||||||||||||||
| Class R-3 | 14,111 | 444 | 676 | 21 | (7,419 | ) | (237 | ) | 7,368 | 228 | ||||||||||||||||||||||
| Class R-4 | 12,871 | 411 | 573 | 18 | (4,761 | ) | (154 | ) | 8,683 | 275 | ||||||||||||||||||||||
| Class R-5 | 11,378 | 370 | 1,130 | 36 | (10,516 | ) | (339 | ) | 1,992 | 67 | ||||||||||||||||||||||
| Class R-6 | 151,296 | 4,752 | 15,652 | 491 | (26,074 | ) | (846 | ) | 140,874 | 4,397 | ||||||||||||||||||||||
| Total net increase (decrease) | $ | 1,456,356 | 45,740 | $ | 155,450 | 4,883 | $ | (882,862 | ) | (28,446 | ) | $ | 728,944 | 22,177 | ||||||||||||||||||
| * | Includes exchanges between share classes of the fund. |
| † | Amount less than one thousand. |
9. Investment transactions
The fund made purchases and sales of investment securities, excluding short-term securities and U.S. government obligations, if any, of $3,546,086,000 and $2,134,420,000, respectively, during the year ended June 30, 2014.
| International Growth and Income Fund | 27 |
Financial highlights
| Income (loss) from investment operations1 | Dividends and distributions | |||||||||||||||||||||||||||||||||||||||||||||||||||
| Net asset value, beginning of year | Net investment income2 | Net gains (losses) on securities (both realized and unrealized) | Total from investment operations | Dividends (from net investment income) | Distributions (from capital gains) | Total dividends and distributions | Net asset value, end of year | Total return3,4 | Net assets, end of year (in millions) | Ratio of expenses to average net assets before reimbursements | Ratio of expenses to average net assets after reimbursements4 | Ratio of net income to average net assets2,4 | ||||||||||||||||||||||||||||||||||||||||
| Class A: | ||||||||||||||||||||||||||||||||||||||||||||||||||||
| Year ended 6/30/2014 | $ | 32.06 | $ | 1.23 | $ | 5.82 | $ | 7.05 | $ | (1.18 | ) | $ | (1.37 | ) | $ | (2.55 | ) | $ | 36.56 | 22.66 | % | $ | 5,027 | .91 | % | .91 | % | 3.54 | % | |||||||||||||||||||||||
| Year ended 6/30/2013 | 27.81 | .84 | 4.26 | 5.10 | (.85 | ) | — | (.85 | ) | 32.06 | 18.41 | 3,703 | .93 | .93 | 2.70 | |||||||||||||||||||||||||||||||||||||
| Year ended 6/30/2012 | 32.48 | .82 | (4.12 | ) | (3.30 | ) | (.86 | ) | (.51 | ) | (1.37 | ) | 27.81 | (10.03 | ) | 3,136 | .93 | .93 | 2.85 | |||||||||||||||||||||||||||||||||
| Year ended 6/30/2011 | 25.86 | 1.06 | 6.80 | 7.86 | (1.06 | ) | (.18 | ) | (1.24 | ) | 32.48 | 30.64 | 3,611 | .89 | .89 | 3.43 | ||||||||||||||||||||||||||||||||||||
| Year ended 6/30/2010 | 24.78 | .80 | 1.39 | 2.19 | (.74 | ) | (.37 | ) | (1.11 | ) | 25.86 | 8.44 | 2,515 | .94 | .93 | 2.79 | ||||||||||||||||||||||||||||||||||||
| Class B: | ||||||||||||||||||||||||||||||||||||||||||||||||||||
| Year ended 6/30/2014 | 32.04 | .92 | 5.85 | 6.77 | (.90 | ) | (1.37 | ) | (2.27 | ) | 36.54 | 21.71 | 16 | 1.66 | 1.66 | 2.66 | ||||||||||||||||||||||||||||||||||||
| Year ended 6/30/2013 | 27.78 | .57 | 4.30 | 4.87 | (.61 | ) | — | (.61 | ) | 32.04 | 17.55 | 17 | 1.69 | 1.69 | 1.85 | |||||||||||||||||||||||||||||||||||||
| Year ended 6/30/2012 | 32.44 | .57 | (4.09 | ) | (3.52 | ) | (.63 | ) | (.51 | ) | (1.14 | ) | 27.78 | (10.75 | ) | 20 | 1.70 | 1.70 | 1.98 | |||||||||||||||||||||||||||||||||
| Year ended 6/30/2011 | 25.82 | .79 | 6.82 | 7.61 | (.81 | ) | (.18 | ) | (.99 | ) | 32.44 | 29.62 | 31 | 1.68 | 1.68 | 2.56 | ||||||||||||||||||||||||||||||||||||
| Year ended 6/30/2010 | 24.75 | .56 | 1.40 | 1.96 | (.52 | ) | (.37 | ) | (.89 | ) | 25.82 | 7.60 | 28 | 1.72 | 1.71 | 1.96 | ||||||||||||||||||||||||||||||||||||
| Class C: | ||||||||||||||||||||||||||||||||||||||||||||||||||||
| Year ended 6/30/2014 | 32.00 | .95 | 5.80 | 6.75 | (.91 | ) | (1.37 | ) | (2.28 | ) | 36.47 | 21.66 | 309 | 1.71 | 1.71 | 2.73 | ||||||||||||||||||||||||||||||||||||
| Year ended 6/30/2013 | 27.76 | .59 | 4.25 | 4.84 | (.60 | ) | — | (.60 | ) | 32.00 | 17.47 | 225 | 1.74 | 1.74 | 1.89 | |||||||||||||||||||||||||||||||||||||
| Year ended 6/30/2012 | 32.42 | .58 | (4.10 | ) | (3.52 | ) | (.63 | ) | (.51 | ) | (1.14 | ) | 27.76 | (10.75 | ) | 195 | 1.73 | 1.73 | 2.05 | |||||||||||||||||||||||||||||||||
| Year ended 6/30/2011 | 25.81 | .80 | 6.79 | 7.59 | (.80 | ) | (.18 | ) | (.98 | ) | 32.42 | 29.57 | 230 | 1.73 | 1.73 | 2.58 | ||||||||||||||||||||||||||||||||||||
| Year ended 6/30/2010 | 24.75 | .57 | 1.38 | 1.95 | (.52 | ) | (.37 | ) | (.89 | ) | 25.81 | 7.55 | 167 | 1.75 | 1.74 | 2.00 | ||||||||||||||||||||||||||||||||||||
| Class F-1: | ||||||||||||||||||||||||||||||||||||||||||||||||||||
| Year ended 6/30/2014 | 32.06 | 1.23 | 5.79 | 7.02 | (1.16 | ) | (1.37 | ) | (2.53 | ) | 36.55 | 22.57 | 1,226 | .96 | .96 | 3.53 | ||||||||||||||||||||||||||||||||||||
| Year ended 6/30/2013 | 27.81 | .94 | 4.16 | 5.10 | (.85 | ) | — | (.85 | ) | 32.06 | 18.39 | 844 | .96 | .96 | 2.97 | |||||||||||||||||||||||||||||||||||||
| Year ended 6/30/2012 | 32.49 | .84 | (4.16 | ) | (3.32 | ) | (.85 | ) | (.51 | ) | (1.36 | ) | 27.81 | (10.05 | ) | 437 | .94 | .94 | 2.92 | |||||||||||||||||||||||||||||||||
| Year ended 6/30/2011 | 25.86 | 1.06 | 6.79 | 7.85 | (1.04 | ) | (.18 | ) | (1.22 | ) | 32.49 | 30.58 | 420 | .94 | .94 | 3.40 | ||||||||||||||||||||||||||||||||||||
| Year ended 6/30/2010 | 24.78 | .79 | 1.39 | 2.18 | (.73 | ) | (.37 | ) | (1.10 | ) | 25.86 | 8.41 | 274 | .97 | .96 | 2.76 | ||||||||||||||||||||||||||||||||||||
| Class F-2: | ||||||||||||||||||||||||||||||||||||||||||||||||||||
| Year ended 6/30/2014 | 32.07 | 1.32 | 5.80 | 7.12 | (1.25 | ) | (1.37 | ) | (2.62 | ) | 36.57 | 22.90 | 1,228 | .70 | .70 | 3.79 | ||||||||||||||||||||||||||||||||||||
| Year ended 6/30/2013 | 27.81 | .92 | 4.26 | 5.18 | (.92 | ) | — | (.92 | ) | 32.07 | 18.64 | 697 | .73 | .73 | 2.95 | |||||||||||||||||||||||||||||||||||||
| Year ended 6/30/2012 | 32.50 | .97 | (4.23 | ) | (3.26 | ) | (.92 | ) | (.51 | ) | (1.43 | ) | 27.81 | (9.82 | ) | 512 | .70 | .70 | 3.40 | |||||||||||||||||||||||||||||||||
| Year ended 6/30/2011 | 25.87 | 1.13 | 6.79 | 7.92 | (1.11 | ) | (.18 | ) | (1.29 | ) | 32.50 | 30.87 | 311 | .71 | .71 | 3.65 | ||||||||||||||||||||||||||||||||||||
| Year ended 6/30/2010 | 24.79 | .86 | 1.39 | 2.25 | (.80 | ) | (.37 | ) | (1.17 | ) | 25.87 | 8.69 | 199 | .71 | .70 | 3.02 | ||||||||||||||||||||||||||||||||||||
| Class 529-A: | ||||||||||||||||||||||||||||||||||||||||||||||||||||
| Year ended 6/30/2014 | 32.03 | 1.21 | 5.80 | 7.01 | (1.15 | ) | (1.37 | ) | (2.52 | ) | 36.52 | 22.56 | 129 | .98 | .98 | 3.48 | ||||||||||||||||||||||||||||||||||||
| Year ended 6/30/2013 | 27.78 | .83 | 4.25 | 5.08 | (.83 | ) | — | (.83 | ) | 32.03 | 18.35 | 93 | 1.00 | 1.00 | 2.66 | |||||||||||||||||||||||||||||||||||||
| Year ended 6/30/2012 | 32.46 | .81 | (4.14 | ) | (3.33 | ) | (.84 | ) | (.51 | ) | (1.35 | ) | 27.78 | (10.13 | ) | 71 | 1.00 | 1.00 | 2.84 | |||||||||||||||||||||||||||||||||
| Year ended 6/30/2011 | 25.85 | 1.09 | 6.75 | 7.84 | (1.05 | ) | (.18 | ) | (1.23 | ) | 32.46 | 30.62 | 67 | .94 | .94 | 3.50 | ||||||||||||||||||||||||||||||||||||
| Year ended 6/30/2010 | 24.77 | .82 | 1.35 | 2.17 | (.72 | ) | (.37 | ) | (1.09 | ) | 25.85 | 8.33 | 35 | .99 | .98 | 2.87 | ||||||||||||||||||||||||||||||||||||
| Class 529-B: | ||||||||||||||||||||||||||||||||||||||||||||||||||||
| Year ended 6/30/2014 | 32.01 | .88 | 5.84 | 6.72 | (.85 | ) | (1.37 | ) | (2.22 | ) | 36.51 | 21.55 | 1 | 1.80 | 1.80 | 2.53 | ||||||||||||||||||||||||||||||||||||
| Year ended 6/30/2013 | 27.75 | .52 | 4.30 | 4.82 | (.56 | ) | — | (.56 | ) | 32.01 | 17.38 | 1 | 1.83 | 1.83 | 1.67 | |||||||||||||||||||||||||||||||||||||
| Year ended 6/30/2012 | 32.39 | .52 | (4.07 | ) | (3.55 | ) | (.58 | ) | (.51 | ) | (1.09 | ) | 27.75 | (10.86 | ) | 1 | 1.83 | 1.83 | 1.81 | |||||||||||||||||||||||||||||||||
| Year ended 6/30/2011 | 25.80 | .78 | 6.78 | 7.56 | (.79 | ) | (.18 | ) | (.97 | ) | 32.39 | 29.47 | 2 | 1.79 | 1.79 | 2.51 | ||||||||||||||||||||||||||||||||||||
| Year ended 6/30/2010 | 24.74 | .55 | 1.38 | 1.93 | (.50 | ) | (.37 | ) | (.87 | ) | 25.80 | 7.49 | 1 | 1.82 | 1.81 | 1.94 | ||||||||||||||||||||||||||||||||||||
| Class 529-C: | ||||||||||||||||||||||||||||||||||||||||||||||||||||
| Year ended 6/30/2014 | 31.91 | .93 | 5.77 | 6.70 | (.88 | ) | (1.37 | ) | (2.25 | ) | 36.36 | 21.56 | 32 | 1.78 | 1.78 | 2.67 | ||||||||||||||||||||||||||||||||||||
| Year ended 6/30/2013 | 27.68 | .58 | 4.23 | 4.81 | (.58 | ) | — | (.58 | ) | 31.91 | 17.42 | 23 | 1.82 | 1.82 | 1.85 | |||||||||||||||||||||||||||||||||||||
| Year ended 6/30/2012 | 32.35 | .58 | (4.13 | ) | (3.55 | ) | (.61 | ) | (.51 | ) | (1.12 | ) | 27.68 | (10.85 | ) | 18 | 1.82 | 1.82 | 2.02 | |||||||||||||||||||||||||||||||||
| Year ended 6/30/2011 | 25.77 | .83 | 6.73 | 7.56 | (.80 | ) | (.18 | ) | (.98 | ) | 32.35 | 29.45 | 16 | 1.78 | 1.78 | 2.68 | ||||||||||||||||||||||||||||||||||||
| Year ended 6/30/2010 | 24.72 | .59 | 1.35 | 1.94 | (.52 | ) | (.37 | ) | (.89 | ) | 25.77 | 7.53 | 8 | 1.81 | 1.80 | 2.08 | ||||||||||||||||||||||||||||||||||||
| Class 529-E: | ||||||||||||||||||||||||||||||||||||||||||||||||||||
| Year ended 6/30/2014 | 32.03 | 1.12 | 5.81 | 6.93 | (1.07 | ) | (1.37 | ) | (2.44 | ) | 36.52 | 22.26 | 5 | 1.23 | 1.23 | 3.21 | ||||||||||||||||||||||||||||||||||||
| Year ended 6/30/2013 | 27.79 | .77 | 4.22 | 4.99 | (.75 | ) | — | (.75 | ) | 32.03 | 18.01 | 3 | 1.26 | 1.26 | 2.45 | |||||||||||||||||||||||||||||||||||||
| Year ended 6/30/2012 | 32.46 | .73 | (4.13 | ) | (3.40 | ) | (.76 | ) | (.51 | ) | (1.27 | ) | 27.79 | (10.34 | ) | 2 | 1.27 | 1.27 | 2.56 | |||||||||||||||||||||||||||||||||
| Year ended 6/30/2011 | 25.85 | .97 | 6.76 | 7.73 | (.94 | ) | (.18 | ) | (1.12 | ) | 32.46 | 30.18 | 2 | 1.27 | 1.27 | 3.12 | ||||||||||||||||||||||||||||||||||||
| Year ended 6/30/2010 | 24.78 | .75 | 1.33 | 2.08 | (.64 | ) | (.37 | ) | (1.01 | ) | 25.85 | 8.01 | 1 | 1.30 | 1.29 | 2.64 | ||||||||||||||||||||||||||||||||||||
| 28 | International Growth and Income Fund |
| Income (loss) from investment operations1 | Dividends and distributions | |||||||||||||||||||||||||||||||||||||||||||||||||||
| Net asset value, beginning of year | Net investment income2 | Net gains (losses) on securities (both realized and unrealized) | Total from investment operations | Dividends (from net investment income) | Distributions (from capital gains) | Total dividends and distributions | Net asset value, end of year | Total return3,4 | Net assets, end of year (in millions) | Ratio of expenses to average net assets before reimbursements | Ratio of expenses to average net assets after reimbursements4 | Ratio of net income to average net assets2,4 | ||||||||||||||||||||||||||||||||||||||||
| Class 529-F-1: | ||||||||||||||||||||||||||||||||||||||||||||||||||||
| Year ended 6/30/2014 | $ | 32.07 | $ | 1.30 | $ | 5.79 | $ | 7.09 | $ | (1.22 | ) | $ | (1.37 | ) | $ | (2.59 | ) | $ | 36.57 | 22.81 | % | $ 11 | .78 | % | .78 | % | 3.72 | % | ||||||||||||||||||||||||
| Year ended 6/30/2013 | 27.81 | .94 | 4.22 | 5.16 | (.90 | ) | — | (.90 | ) | 32.07 | 18.60 | 7 | .81 | .81 | 3.00 | |||||||||||||||||||||||||||||||||||||
| Year ended 6/30/2012 | 32.50 | .89 | (4.17 | ) | (3.28 | ) | (.90 | ) | (.51 | ) | (1.41 | ) | 27.81 | (9.94 | ) | 4 | .81 | .81 | 3.11 | |||||||||||||||||||||||||||||||||
| Year ended 6/30/2011 | 25.87 | 1.25 | 6.66 | 7.91 | (1.10 | ) | (.18 | ) | (1.28 | ) | 32.50 | 30.80 | 3 | .77 | .77 | 3.99 | ||||||||||||||||||||||||||||||||||||
| Year ended 6/30/2010 | 24.79 | .91 | 1.32 | 2.23 | (.78 | ) | (.37 | ) | (1.15 | ) | 25.87 | 8.60 | 1 | .79 | .78 | 3.18 | ||||||||||||||||||||||||||||||||||||
| Class R-1: | ||||||||||||||||||||||||||||||||||||||||||||||||||||
| Year ended 6/30/2014 | 32.01 | 1.14 | 5.74 | 6.88 | (1.03 | ) | (1.37 | ) | (2.40 | ) | 36.49 | 22.07 | 5 | 9 | 1.35 | 5 | 1.35 | 5 | 3.28 | 5 | ||||||||||||||||||||||||||||||||
| Year ended 6/30/2013 | 27.78 | .77 | 4.27 | 5.04 | (.81 | ) | — | (.81 | ) | 32.01 | 18.19 | 5 | 5 | 1.16 | 5 | 1.16 | 5 | 2.48 | 5 | |||||||||||||||||||||||||||||||||
| Year ended 6/30/2012 | 32.43 | .69 | (4.12 | ) | (3.43 | ) | (.71 | ) | (.51 | ) | (1.22 | ) | 27.78 | (10.47 | )5 | 4 | 1.39 | 5 | 1.39 | 5 | 2.40 | 5 | ||||||||||||||||||||||||||||||
| Year ended 6/30/2011 | 25.82 | .87 | 6.78 | 7.65 | (.86 | ) | (.18 | ) | (1.04 | ) | 32.43 | 29.81 | 5 | 5 | 1.54 | 5 | 1.54 | 5 | 2.80 | 5 | ||||||||||||||||||||||||||||||||
| Year ended 6/30/2010 | 24.76 | .59 | 1.37 | 1.96 | (.53 | ) | (.37 | ) | (.90 | ) | 25.82 | 7.58 | 3 | 1.71 | 1.70 | 2.06 | ||||||||||||||||||||||||||||||||||||
| Class R-2: | ||||||||||||||||||||||||||||||||||||||||||||||||||||
| Year ended 6/30/2014 | 31.94 | .93 | 5.79 | 6.72 | (.89 | ) | (1.37 | ) | (2.26 | ) | 36.40 | 21.62 | 53 | 1.74 | 1.74 | 2.69 | ||||||||||||||||||||||||||||||||||||
| Year ended 6/30/2013 | 27.71 | .60 | 4.24 | 4.84 | (.61 | ) | — | (.61 | ) | 31.94 | 17.48 | 40 | 1.74 | 1.74 | 1.93 | |||||||||||||||||||||||||||||||||||||
| Year ended 6/30/2012 | 32.38 | .60 | (4.13 | ) | (3.53 | ) | (.63 | ) | (.51 | ) | (1.14 | ) | 27.71 | (10.80 | ) | 29 | 1.78 | 1.76 | 2.12 | |||||||||||||||||||||||||||||||||
| Year ended 6/30/2011 | 25.79 | .85 | 6.74 | 7.59 | (.82 | ) | (.18 | ) | (1.00 | ) | 32.38 | 29.60 | 25 | 1.77 | 1.70 | 2.74 | ||||||||||||||||||||||||||||||||||||
| Year ended 6/30/2010 | 24.74 | .61 | 1.34 | 1.95 | (.53 | ) | (.37 | ) | (.90 | ) | 25.79 | 7.57 | 13 | 1.81 | 1.73 | 2.15 | ||||||||||||||||||||||||||||||||||||
| Class R-3: | ||||||||||||||||||||||||||||||||||||||||||||||||||||
| Year ended 6/30/2014 | 32.02 | 1.09 | 5.82 | 6.91 | (1.06 | ) | (1.37 | ) | (2.43 | ) | 36.50 | 22.20 | 46 | 1.26 | 1.26 | 3.14 | ||||||||||||||||||||||||||||||||||||
| Year ended 6/30/2013 | 27.78 | .76 | 4.23 | 4.99 | (.75 | ) | — | (.75 | ) | 32.02 | 18.02 | 33 | 1.27 | 1.27 | 2.43 | |||||||||||||||||||||||||||||||||||||
| Year ended 6/30/2012 | 32.45 | .72 | (4.13 | ) | (3.41 | ) | (.75 | ) | (.51 | ) | (1.26 | ) | 27.78 | (10.37 | ) | 22 | 1.29 | 1.29 | 2.53 | |||||||||||||||||||||||||||||||||
| Year ended 6/30/2011 | 25.84 | 1.01 | 6.73 | 7.74 | (.95 | ) | (.18 | ) | (1.13 | ) | 32.45 | 30.16 | 24 | 1.27 | 1.27 | 3.24 | ||||||||||||||||||||||||||||||||||||
| Year ended 6/30/2010 | 24.78 | .75 | 1.33 | 2.08 | (.65 | ) | (.37 | ) | (1.02 | ) | 25.84 | 8.02 | 10 | 1.30 | 1.29 | 2.65 | ||||||||||||||||||||||||||||||||||||
| Class R-4: | ||||||||||||||||||||||||||||||||||||||||||||||||||||
| Year ended 6/30/2014 | 32.05 | 1.26 | 5.77 | 7.03 | (1.17 | ) | (1.37 | ) | (2.54 | ) | 36.54 | 22.61 | 51 | .93 | .93 | 3.62 | ||||||||||||||||||||||||||||||||||||
| Year ended 6/30/2013 | 27.80 | .88 | 4.23 | 5.11 | (.86 | ) | — | (.86 | ) | 32.05 | 18.43 | 26 | .93 | .93 | 2.82 | |||||||||||||||||||||||||||||||||||||
| Year ended 6/30/2012 | 32.48 | .85 | (4.16 | ) | (3.31 | ) | (.86 | ) | (.51 | ) | (1.37 | ) | 27.80 | (10.06 | ) | 15 | .94 | .94 | 2.98 | |||||||||||||||||||||||||||||||||
| Year ended 6/30/2011 | 25.86 | 1.15 | 6.70 | 7.85 | (1.05 | ) | (.18 | ) | (1.23 | ) | 32.48 | 30.60 | 12 | .93 | .93 | 3.69 | ||||||||||||||||||||||||||||||||||||
| Year ended 6/30/2010 | 24.79 | .84 | 1.33 | 2.17 | (.73 | ) | (.37 | ) | (1.10 | ) | 25.86 | 8.38 | 5 | .98 | .96 | 2.93 | ||||||||||||||||||||||||||||||||||||
| Class R-5: | ||||||||||||||||||||||||||||||||||||||||||||||||||||
| Year ended 6/30/2014 | 32.19 | 1.29 | 5.87 | 7.16 | (1.26 | ) | (1.37 | ) | (2.63 | ) | 36.72 | 22.95 | 21 | .63 | .63 | 3.69 | ||||||||||||||||||||||||||||||||||||
| Year ended 6/30/2013 | 27.91 | .94 | 4.28 | 5.22 | (.94 | ) | — | (.94 | ) | 32.19 | 18.77 | 40 | .65 | .65 | 3.00 | |||||||||||||||||||||||||||||||||||||
| Year ended 6/30/2012 | 32.60 | .91 | (4.15 | ) | (3.24 | ) | (.94 | ) | (.51 | ) | (1.45 | ) | 27.91 | (9.81 | ) | 33 | .66 | .66 | 3.19 | |||||||||||||||||||||||||||||||||
| Year ended 6/30/2011 | 25.95 | 1.15 | 6.81 | 7.96 | (1.13 | ) | (.18 | ) | (1.31 | ) | 32.60 | 30.94 | 28 | .67 | .67 | 3.71 | ||||||||||||||||||||||||||||||||||||
| Year ended 6/30/2010 | 24.86 | .85 | 1.41 | 2.26 | (.80 | ) | (.37 | ) | (1.17 | ) | 25.95 | 8.69 | 14 | .72 | .70 | 2.96 | ||||||||||||||||||||||||||||||||||||
| Class R-6: | ||||||||||||||||||||||||||||||||||||||||||||||||||||
| Year ended 6/30/2014 | 32.06 | 1.37 | 5.79 | 7.16 | (1.29 | ) | (1.37 | ) | (2.66 | ) | 36.56 | 23.04 | 949 | .59 | .59 | 3.91 | ||||||||||||||||||||||||||||||||||||
| Year ended 6/30/2013 | 27.80 | .97 | 4.25 | 5.22 | (.96 | ) | — | (.96 | ) | 32.06 | 18.83 | 593 | .61 | .61 | 3.11 | |||||||||||||||||||||||||||||||||||||
| Year ended 6/30/2012 | 32.48 | .93 | (4.15 | ) | (3.22 | ) | (.95 | ) | (.51 | ) | (1.46 | ) | 27.80 | (9.78 | ) | 392 | .61 | .61 | 3.26 | |||||||||||||||||||||||||||||||||
| Year ended 6/30/2011 | 25.86 | 1.17 | 6.77 | 7.94 | (1.14 | ) | (.18 | ) | (1.32 | ) | 32.48 | 30.99 | 341 | .62 | .62 | 3.77 | ||||||||||||||||||||||||||||||||||||
| Year ended 6/30/2010 | 24.78 | .90 | 1.37 | 2.27 | (.82 | ) | (.37 | ) | (1.19 | ) | 25.86 | 8.74 | 206 | .66 | .65 | 3.16 | ||||||||||||||||||||||||||||||||||||
| Year ended June 30 | ||||||||||||||||||||
| 2014 | 2013 | 2012 | 2011 | 2010 | ||||||||||||||||
| Portfolio turnover rate for all share classes | 29% | 37% | 24% | 31% | 16% | |||||||||||||||
| 1 | Based on average shares outstanding. |
| 2 | For the year ended June 30, 2014, this column reflects the impact of a corporate action event that resulted in a one-time increase to net investment income. If the corporate action event had not occurred, the Class A net investment income per share and ratio of net income to average net assets would have been lower by $.28 and .81 percentage points, respectively. The impact to the other share classes would have been similar. |
| 3 | Total returns exclude any applicable sales charges, including contingent deferred sales charges. |
| 4 | This column reflects the impact, if any, of certain reimbursements from CRMC. During one of the years shown, CRMC reimbursed certain expenses during the fund’s start-up period and paid a portion of the fund’s transfer agent fees for certain retirement plan share classes. |
| 5 | Fees for distribution services are not paid by the fund on accounts for which a broker-dealer (or other financial intermediary) has not been assigned, including amounts invested in the fund by CRMC and/or its affiliates. If fees for distribution services were charged on these assets, fund expenses would have been higher and net income and total return would have been lower. |
See Notes to Financial Statements
| International Growth and Income Fund | 29 |
Report of Independent Registered Public Accounting Firm
To the Shareholders and Board of Trustees of International Growth and Income Fund:
We have audited the accompanying statement of assets and liabilities of International Growth and Income Fund (the “Fund”), including the summary investment portfolio, as of June 30, 2014, and the related statement of operations for the year then ended, the statements of changes in net assets for each of the two years in the period then ended, and the financial highlights for each of the five years in the period then ended. These financial statements and financial highlights are the responsibility of the Fund’s management. Our responsibility is to express an opinion on these financial statements and financial highlights based on our audits.
We conducted our audits in accordance with the standards of the Public Company Accounting Oversight Board (United States). Those standards require that we plan and perform the audit to obtain reasonable assurance about whether the financial statements and financial highlights are free of material misstatement. The Fund is not required to have, nor were we engaged to perform, an audit of its internal control over financial reporting. Our audits included consideration of internal control over financial reporting as a basis for designing audit procedures that are appropriate in the circumstances, but not for the purpose of expressing an opinion on the effectiveness of the Fund’s internal control over financial reporting. Accordingly, we express no such opinion. An audit also includes examining, on a test basis, evidence supporting the amounts and disclosures in the financial statements, assessing the accounting principles used and significant estimates made by management, as well as evaluating the overall financial statement presentation. Our procedures included confirmation of securities owned as of June 30, 2014, by correspondence with the custodian and brokers; where replies were not received from brokers, we performed other auditing procedures. We believe that our audits provide a reasonable basis for our opinion.
In our opinion, such financial statements and financial highlights referred to above present fairly, in all material respects, the financial position of International Growth and Income Fund as of June 30, 2014, the results of its operations for the year then ended, the changes in its net assets for each of the two years in the period then ended, and the financial highlights for each of the five years in the period then ended, in conformity with accounting principles generally accepted in the United States of America.
Deloitte & Touche LLP
Costa Mesa, California
August 12, 2014
| 30 | International Growth and Income Fund |
| Expense example | unaudited |
As a fund shareholder, you incur two types of costs: (1) transaction costs, such as initial sales charges on purchase payments and contingent deferred sales charges on redemptions (loads), and (2) ongoing costs, including management fees, distribution and service (12b-1) fees, and other expenses. This example is intended to help you understand your ongoing costs (in dollars) of investing in the fund so you can compare these costs with the ongoing costs of investing in other mutual funds. The example is based on an investment of $1,000 invested at the beginning of the period and held for the entire six-month period (January 1, 2014, through June 30, 2014).
Actual expenses:
The first line of each share class in the table on the following page provides information about actual account values and actual expenses. You may use the information in this line, together with the amount you invested, to estimate the expenses that you paid over the period. Simply divide your account value by $1,000 (for example, an $8,600 account value divided by $1,000 = 8.6), then multiply the result by the number in the first line under the heading entitled “Expenses paid during period” to estimate the expenses you paid on your account during this period.
Hypothetical example for comparison purposes:
The second line of each share class in the table on the following page provides information about hypothetical account values and hypothetical expenses based on the actual expense ratio for the share class and an assumed rate of return of 5.00% per year before expenses, which is not the actual return of the share class. The hypothetical account values and expenses may not be used to estimate the actual ending account balance or expenses you paid for the period. You may use this information to compare the ongoing costs of investing in the fund and other funds. To do so, compare this 5.00% hypothetical example with the 5.00% hypothetical examples that appear in the shareholder reports of the other funds.
Notes:
Retirement plan participants may be subject to certain fees charged by the plan sponsor, and Class F-1, F-2 and 529-F-1 shareholders may be subject to fees charged by financial intermediaries, typically ranging from 0.75% to 1.50% of assets annually depending on services offered. You can estimate the impact of these fees by adding the amount of the fees to the total estimated expenses you paid on your account during the period as calculated above. In addition, your ending account value would be lower by the amount of these fees.
Note that the expenses shown in the table on the following page are meant to highlight your ongoing costs only and do not reflect any transactional costs, such as sales charges (loads). Therefore, the second line of each share class in the table is useful in comparing ongoing costs only and will not help you determine the relative total costs of owning different funds. In addition, if these transactional costs were included, your costs would have been higher.
| International Growth and Income Fund | 31 |
| Beginning account value 1/1/2014 | Ending account value 6/30/2014 | Expenses paid during period* | Annualized expense ratio | |||||||||||||
| Class A — actual return | $ | 1,000.00 | $ | 1,067.26 | $ | 4.61 | .90 | % | ||||||||
| Class A — assumed 5% return | 1,000.00 | 1,020.33 | 4.51 | .90 | ||||||||||||
| Class B — actual return | 1,000.00 | 1,063.39 | 8.44 | 1.65 | ||||||||||||
| Class B — assumed 5% return | 1,000.00 | 1,016.61 | 8.25 | 1.65 | ||||||||||||
| Class C — actual return | 1,000.00 | 1,063.06 | 8.70 | 1.70 | ||||||||||||
| Class C — assumed 5% return | 1,000.00 | 1,016.36 | 8.50 | 1.70 | ||||||||||||
| Class F-1 — actual return | 1,000.00 | 1,067.00 | 4.82 | .94 | ||||||||||||
| Class F-1 — assumed 5% return | 1,000.00 | 1,020.13 | 4.71 | .94 | ||||||||||||
| Class F-2 — actual return | 1,000.00 | 1,068.32 | 3.59 | .70 | ||||||||||||
| Class F-2 — assumed 5% return | 1,000.00 | 1,021.32 | 3.51 | .70 | ||||||||||||
| Class 529-A — actual return | 1,000.00 | 1,066.97 | 4.97 | .97 | ||||||||||||
| Class 529-A — assumed 5% return | 1,000.00 | 1,019.98 | 4.86 | .97 | ||||||||||||
| Class 529-B — actual return | 1,000.00 | 1,062.70 | 9.15 | 1.79 | ||||||||||||
| Class 529-B — assumed 5% return | 1,000.00 | 1,015.92 | 8.95 | 1.79 | ||||||||||||
| Class 529-C — actual return | 1,000.00 | 1,062.84 | 9.05 | 1.77 | ||||||||||||
| Class 529-C — assumed 5% return | 1,000.00 | 1,016.02 | 8.85 | 1.77 | ||||||||||||
| Class 529-E — actual return | 1,000.00 | 1,065.69 | 6.25 | 1.22 | ||||||||||||
| Class 529-E — assumed 5% return | 1,000.00 | 1,018.74 | 6.11 | 1.22 | ||||||||||||
| Class 529-F-1 — actual return | 1,000.00 | 1,068.25 | 3.95 | .77 | ||||||||||||
| Class 529-F-1 — assumed 5% return | 1,000.00 | 1,020.98 | 3.86 | .77 | ||||||||||||
| Class R-1 — actual return | 1,000.00 | 1,064.49 | 7.17 | 1.40 | ||||||||||||
| Class R-1 — assumed 5% return | 1,000.00 | 1,017.85 | 7.00 | 1.40 | ||||||||||||
| Class R-2 — actual return | 1,000.00 | 1,062.84 | 9.00 | 1.76 | ||||||||||||
| Class R-2 — assumed 5% return | 1,000.00 | 1,016.07 | 8.80 | 1.76 | ||||||||||||
| Class R-3 — actual return | 1,000.00 | 1,065.25 | 6.45 | 1.26 | ||||||||||||
| Class R-3 — assumed 5% return | 1,000.00 | 1,018.55 | 6.31 | 1.26 | ||||||||||||
| Class R-4 — actual return | 1,000.00 | 1,067.15 | 4.77 | .93 | ||||||||||||
| Class R-4 — assumed 5% return | 1,000.00 | 1,020.18 | 4.66 | .93 | ||||||||||||
| Class R-5 — actual return | 1,000.00 | 1,068.66 | 3.23 | .63 | ||||||||||||
| Class R-5 — assumed 5% return | 1,000.00 | 1,021.67 | 3.16 | .63 | ||||||||||||
| Class R-6 — actual return | 1,000.00 | 1,069.20 | 2.98 | .58 | ||||||||||||
| Class R-6 — assumed 5% return | 1,000.00 | 1,021.92 | 2.91 | .58 | ||||||||||||
| * | The “expenses paid during period” are equal to the “annualized expense ratio,” multiplied by the average account value over the period, multiplied by the number of days in the period, and divided by 365 (to reflect the one-half year period). |
| 32 | International Growth and Income Fund |
| Tax information | unaudited |
We are required to advise you of the federal tax status of certain distributions received by shareholders during the fiscal year. The fund hereby designates the following amounts for the fund’s fiscal year ended June 30, 2014:
| Long-term capital gains | $297,160,000 |
| Foreign taxes | $0.10 per share |
| Foreign source income | $1.45 per share |
| Qualified dividend income | 100% |
| U.S. government income that may be exempt from state taxation | $147,000 |
Individual shareholders should refer to their Form 1099 or other tax information, which will be mailed in January 2015, to determine the calendar year amounts to be included on their 2014 tax returns. Shareholders should consult their tax advisors.
| International Growth and Income Fund | 33 |
Board of trustees and other officers
| “Independent” trustees1 | ||||||||
| Name and age | Year first elected a trustee of the fund2 | Principal occupation(s) during past five years | Number of portfolios in fund complex overseen by trustee | Other directorships3 held by trustee | ||||
| William H. Baribault, 68 | 2012 | CEO and President, Richard Nixon Foundation; former Chairman of the Board and CEO, Oakwood Enterprises (private investment and consulting) | 70 | None | ||||
| Vanessa C. L. Chang, 62 | 2012 | Director, EL & EL Investments (real estate) | 7 | Edison International; Transocean Ltd. | ||||
| Linda Griego, 66 | 2012 | President and CEO, Griego Enterprises, Inc. (business management company) | 4 | AECOM Technology Corporation; CBS Corporation | ||||
| Leonade D. Jones, 66 | 2008 | Retired; former Treasurer, The Washington Post Company (retired 1996) | 10 | None | ||||
| William D. Jones, 59 | 2008 | Real estate developer/owner, President and CEO, CityLink Investment Corporation (acquires, develops and manages real estate ventures in selected urban communities) and City Scene Management Company (provides commercial asset and property management services) | 8 | Sempra Energy | ||||
| James J. Postl, 68 | 2008 | Retired; former President and CEO, Pennzoil-Quaker State Company (automotive products and services) (retired 2002) | 4 | Pulte, Inc. | ||||
| Margaret Spellings, 56 | 2012 | President, George W. Bush Foundation; former President 70 and CEO, Margaret Spellings & Company (public policy and strategic consulting); former President, U.S. Chamber Foundation and Senior Advisor to the President and CEO, U.S. Chamber of Commerce; former U.S. Secretary of Education, U.S. Department of Education | 70 | None | ||||
| Isaac Stein, 67 Chairman of the Board (Independent and Non-Executive) | 2008 | President, Waverley Associates (private investment fund); Chairman Emeritus of the Board of Trustees, Stanford University | 4 | Alexza Pharmaceuticals, Inc.; Maxygen, Inc. | ||||
“Interested” trustees4,5
| Name, age and position with fund | Year first elected a trustee or officer of the fund2 | Principal occupation(s) during past five years and positions held with affiliated entities or the principal underwriter of the fund | Number of portfolios in fund complex overseen by trustee | Other directorships3 held by trustee | ||||
| Steven T. Watson, 59 Vice Chairman of the Board | 2008 | Director, Capital Research Company;6 Senior Vice President — Capital World Investors, Capital International, Inc.6 | 1 | None |
The fund’s statement of additional information includes further details about fund trustees and is available without charge upon request by calling American Funds Service Company at (800) 421-4225 or by visiting the American Funds website at americanfunds.com. The address for all trustees and officers of the fund is 333 South Hope Street, Los Angeles, CA 90071, Attention: Secretary.
| 34 | International Growth and Income Fund |
Other officers5
| Name, age and position with fund | Year first elected an officer of the fund2 | Principal occupation(s) during past five years and positions held with affiliated entities or the principal underwriter of the fund | ||
| Carl M. Kawaja, 50 President | 2008 | Senior Vice President — Capital World Investors, Capital Research and Management Company; Chairman of the Board, Capital International Asset Management (Canada), Inc.;6 Director, The Capital Group Companies, Inc.6 | ||
| Paul F. Roye, 60 Executive Vice President | 2008 | Senior Vice President — Fund Business Management Group, Capital Research and Management Company; Chief Legal Officer, Capital Research and Management Company; Director, American Funds Service Company6 | ||
| Andrew B. Suzman, 47 Senior Vice President | 2008 | Senior Vice President — Capital World Investors, Capital Research and Management Company; Senior Vice President — Capital World Investors, Capital Bank and Trust Company;6 Director, American Funds Distributors, Inc.;6 Director, Capital Strategy Research, Inc.;6 Director, The Capital Group Companies, Inc.6 | ||
| Donald H. Rolfe, 42 Vice President | 2012 | Chief Compliance Officer, Capital Research Company;6 Chief Compliance Officer, Capital Research and Management Company; Vice President and Senior Counsel — Fund Business Management Group, Capital Research and Management Company | ||
| Patrick F. Quan, 56 Secretary | 2008 | Vice President — Fund Business Management Group, Capital Research and Management Company | ||
| Jeffrey P. Regal, 43 Treasurer | 2011 | Vice President — Investment Operations, Capital Research and Management Company | ||
| Julie E. Lawton, 40 Assistant Secretary | 2009 | Assistant Vice President — Fund Business Management Group, Capital Research and Management Company | ||
| Dori Laskin, 63 Assistant Treasurer | 2011 | Vice President — Investment Operations, Capital Research and Management Company | ||
| Ari M. Vinocor, 39 Assistant Treasurer | 2012 | Vice President — Investment Operations, Capital Research and Management Company |
| 1 | The term “independent” trustee refers to a trustee who is not an “interested person” of the fund within the meaning of the Investment Company Act of 1940. |
| 2 | Trustees and officers of the fund serve until their resignation, removal or retirement. |
| 3 | This includes all directorships (other than those in the American Funds or other funds managed by Capital Research and Management Company or its affiliates) that are held by each trustee as a trustee or director of a public company or a registered investment company. |
| 4 | The term “interested” trustee refers to a trustee who is an “interested person” within the meaning of the Investment Company Act of 1940, on the basis of their affiliation with the fund’s investment adviser, Capital Research and Management Company, or affiliated entities (including the fund’s principal underwriter). |
| 5 | All of the officers listed are officers and/or directors/trustees of one or more of the other funds for which Capital Research and Management Company serves as investment adviser. |
| 6 | Company affiliated with Capital Research and Management Company. |
| International Growth and Income Fund | 35 |
This page was intentionally left blank.
| 36 | International Growth and Income Fund |
Office of the fund
One Market
Steuart Tower, Suite 2000
San Francisco, CA 94105-1409
Investment adviser
Capital Research and Management Company
333 South Hope Street
Los Angeles, CA 90071-1406
6455 Irvine Center Drive
Irvine, CA 92618
Transfer agent for shareholder accounts
American Funds Service Company
(Write to the address near you.)
P.O. Box 6007
Indianapolis, IN 46206-6007
P.O. Box 2280
Norfolk, VA 23501-2280
Custodian of assets
JPMorgan Chase Bank
270 Park Avenue
New York, NY 10017-2070
Counsel
Bingham McCutchen LLP
355 South Grand Avenue, Suite 4400
Los Angeles, CA 90071-3106
Independent registered public accounting firm
Deloitte & Touche LLP
695 Town Center Drive
Suite 1200
Costa Mesa, CA 92626-7188
Principal underwriter
American Funds Distributors, Inc.
333 South Hope Street
Los Angeles, CA 90071-1406
Investors should carefully consider investment objectives, risks, charges and expenses. This and other important information is contained in the fund prospectus and summary prospectus, which can be obtained from your financial professional and should be read carefully before investing. You may also call American Funds Service Company (AFS) at (800) 421-4225 or visit the American Funds website at americanfunds.com.
“American Funds Proxy Voting Procedures and Principles” — which describes how we vote proxies relating to portfolio securities — is available on the American Funds website or upon request by calling AFS. The fund files its proxy voting record with the U.S. Securities and Exchange Commission (SEC) for the 12 months ended June 30 by August 31. The proxy voting record is available free of charge on the SEC website at sec.gov and on the American Funds website.
A complete June 30, 2014, portfolio of International Growth and Income Fund’s investments is available free of charge by calling AFS or visiting the SEC website (where it is part of Form N-CSR).
International Growth and Income Fund files a complete list of its portfolio holdings with the SEC for the first and third quarters of each fiscal year on Form N-Q. This filing is available free of charge on the SEC website. You may also review or, for a fee, copy this filing at the SEC’s Public Reference Room in Washington, D.C. Additional information regarding the operation of the Public Reference Room may be obtained by calling the SEC’s Office of Investor Education and Advocacy at (800) SEC-0330. Additionally, the list of portfolio holdings is available by calling AFS.
This report is for the information of shareholders of International Growth and Income Fund, but it also may be used as sales literature when preceded or accompanied by the current prospectus or summary prospectus, which gives details about charges, expenses, investment objectives and operating policies of the fund. If used as sales material after September 30, 2014, this report must be accompanied by an American Funds statistical update for the most recently completed calendar quarter.
The American Funds Advantage
Since 1931, American Funds, part of Capital Group, has helped investors pursue long-term investment success. Our consistent approach — in combination with The Capital SystemSM — has resulted in a superior long-term track record.
| Aligned with investor success | |
| We base our decisions on a long-term perspective, which we believe aligns our goals with the interests of our clients. Our portfolio managers average 26 years of investment experience, including 21 years at our company, reflecting a career commitment to our long-term approach.1 | |
| The Capital SystemSM | |
| Our investment process, The Capital System, combines individual accountability with teamwork. Each fund is divided into portions that are managed independently by investment professionals with diverse backgrounds, ages and investment approaches. An extensive global research effort is the backbone of our system. | |
| Superior long-term track record | |
| Our equity funds have beaten their Lipper peer indexes in 90% of 10-year periods and 96% of 20-year periods. Our fixed-income funds have beaten their Lipper indexes in 56% of 10-year periods and 57% of 20-year periods.2 Our fund management fees have been among the lowest in the industry.3 |
| 1 | Portfolio manager experience as of December 31, 2013. | |
| 2 | Based on Class A share results for rolling periods through December 31, 2013. Periods covered are the shorter of the fund’s lifetime or since the comparable Lipper index inception date (except SMALLCAP World Fund, for which the Lipper average was used). | |
| 3 | Based on management fees for the 20-year period ended December 31, 2013, versus comparable Lipper categories, excluding funds of funds. |
 | Printed on paper containing 10% post-consumer waste Printed with inks containing soy and/or vegetable oil |
| Lit No. MFGEARX-034-0814P Litho in USA BAG/UNL/9995-S43088 | |
ITEM 2 – Code of Ethics
The Registrant has adopted a Code of Ethics that applies to its Principal Executive Officer and Principal Financial Officer. The Registrant undertakes to provide to any person without charge, upon request, a copy of the Code of Ethics. Such request can be made to American Funds Service Company at 800/421-9225 or to the Secretary of the Registrant, One Market, Steuart Tower, Suite 2000, San Francisco, California 94105.
ITEM 3 – Audit Committee Financial Expert
The Registrant’s board has determined that Vanessa C. L. Chang, a member of the Registrant’s audit committee, is an “audit committee financial expert” and "independent," as such terms are defined in this Item. This designation will not increase the designee’s duties, obligations or liability as compared to his or her duties, obligations and liability as a member of the audit committee and of the board, nor will it reduce the responsibility of the other audit committee members. There may be other individuals who, through education or experience, would qualify as "audit committee financial experts" if the board had designated them as such. Most importantly, the board believes each member of the audit committee contributes significantly to the effective oversight of the Registrant’s financial statements and condition.
ITEM 4 – Principal Accountant Fees and Services
| Registrant: | ||||
| a) Audit Fees: | ||||
| 2013 | $91,000 | |||
| 2014 | $94,000 | |||
| b) Audit-Related Fees: | ||||
| 2013 | $1,000 | |||
| 2014 | $2,000 | |||
| The audit-related fees consist of assurance and related services relating to the examination of the Registrant’s investment adviser conducted in accordance with Statement on Standards for Attestation Engagements Number 16 issued by the American Institute of Certified Public Accountants. | ||||
| c) Tax Fees: | ||||
| 2013 | $2,000 | |||
| 2014 | $11,000 | |||
| The tax fees consist of professional services relating to the preparation of the Registrant’s tax returns including returns relating to the Registrant’s investments in non-U.S. jurisdictions. | ||||
| d) All Other Fees: | ||||
| 2013 | None | |||
| 2014 | None | |||
| Adviser and affiliates (includes only fees for non-audit services billed to the adviser and affiliates for engagements that relate directly to the operations and financial reporting of the Registrant and were subject to the pre-approval policies described below): | ||||
| a) Audit Fees: | ||||
| Not Applicable | ||||
| b) Audit-Related Fees: | ||||
| 2013 | $1,240,000 | |||
| 2014 | $979,000 | |||
| The audit-related fees consist of assurance and related services relating to the examination of the Registrant’s transfer agent, principal underwriter and investment adviser conducted in accordance with Statement on Standards for Attestation Engagements Number 16 issued by the American Institute of Certified Public Accountants. | ||||
| c) Tax Fees: | ||||
| 2013 | $28,000 | |||
| 2014 | $41,000 | |||
| The tax fees consist of consulting services relating to the Registrant’s investments. | ||||
| d) All Other Fees: | ||||
| 2013 | $2,000 | |||
| 2014 | $3,000 | |||
| The other fees consist of subscription services related to an accounting research tool. | ||||
All audit and permissible non-audit services that the Registrant’s audit committee considers compatible with maintaining the independent registered public accounting firm’s independence are required to be pre-approved by the committee. The pre-approval requirement will extend to all non-audit services provided to the Registrant, the investment adviser, and any entity controlling, controlled by, or under common control with the investment adviser that provides ongoing services to the Registrant, if the engagement relates directly to the operations and financial reporting of the Registrant. The committee will not delegate its responsibility to pre-approve these services to the investment adviser. The committee may delegate to one or more committee members the authority to review and pre-approve audit and permissible non-audit services. Actions taken under any such delegation will be reported to the full committee at its next meeting. The pre-approval requirement is waived with respect to non-audit services if certain conditions are met. The pre-approval requirement was not waived for any of the non-audit services listed above provided to the Registrant, adviser and affiliates.
Aggregate non-audit fees paid to the Registrant’s auditors, including fees for all services billed to the Registrant, adviser and affiliates that provide ongoing services to the Registrant, were $1,667,000 for fiscal year 2013 and $1,420,000 for fiscal year 2014. The non-audit services represented by these amounts were brought to the attention of the committee and considered to be compatible with maintaining the auditors’ independence.
ITEM 5 – Audit Committee of Listed Registrants
Not applicable to this Registrant, insofar as the Registrant is not a listed issuer as defined in Rule 10A-3 under the Securities Exchange Act of 1934.
ITEM 6 – Schedule of Investments
 |
International Growth and Income Fund Investment Portfolio June 30, 2014
|
| Common stocks 90.32% | ||
| Value | ||
| Financials 24.02% | Shares | (000) |
| AXA SA | 8,397,200 | $ 164,992 |
| HSBC Holdings PLC (United Kingdom) | 7,445,896 | 77,235 |
| HSBC Holdings PLC (Hong Kong) | 5,131,396 | 53,755 |
| Prudential PLC | 7,274,148 | 118,934 |
| Sumitomo Mitsui Financial Group, Inc. | 2,120,000 | 97,258 |
| Mizuho Financial Group, Inc. | 36,720,000 | 76,269 |
| Shinsei Bank, Ltd. | 30,668,000 | 69,573 |
| Link Real Estate Investment Trust | 12,340,000 | 60,697 |
| BNP Paribas SA | 1,037,530 | 56,687 |
| Agricultural Bank of China, Class H | 119,427,000 | 49,273 |
| SEGRO PLC | 11,385,000 | 48,346 |
| Sampo Oyj, Class A | 1,235,000 | 48,130 |
| Grupo Financiero Santander México, SAB de CV, Class B (ADR)1 | 3,360,000 | 47,746 |
| Piraeus Bank SA, units1,2 | 21,421,842 | 47,704 |
| Allianz SE | 271,650 | 39,691 |
| AEON Financial Service Co., Ltd. | 1,340,000 | 37,952 |
| Toronto-Dominion Bank | 425,600 | 34,183 |
| Sun Hung Kai Properties Ltd. | 2,632,131 | 33,970 |
| Suncorp Group Ltd. | 2,904,270 | 31,661 |
| Tokyo Tatemono Co., Ltd. | 3,475,000 | 28,941 |
| Fairfax Financial Holdings Ltd. | 70,000 | 27,307 |
| Zurich Insurance Group AG | 104,000 | 26,976 |
| Westfield Group | 2,565,000 | 26,836 |
| ICICI Bank Ltd. | 1,385,000 | 24,956 |
| Swedbank AB, Class A | 1,030,000 | 23,622 |
| Mitsubishi Estate Co., Ltd. | 725,000 | 19,306 |
| Industrial and Commercial Bank of China Ltd., Class H | 30,000,000 | 18,914 |
| Bank of the Philippine Islands | 8,000,000 | 17,778 |
| Haitong Securities Co., Ltd., Class H1 | 14,000,000 | 16,967 |
| Bank of Nova Scotia | 300,000 | 16,037 |
| Fibra Uno Administración, SA de CV | 4,750,000 | 15,869 |
| ING Groep NV, depository receipts1 | 1,730,000 | 15,763 |
| Credit Suisse Group AG | 594,146 | 15,757 |
| AIA Group Ltd. | 2,837,600 | 12,018 |
| China Life Insurance Co. Ltd., Class H | 3,800,000 | 9,015 |
| Itaú Unibanco Holding SA, preferred nominative | 603,040 | 7,775 |
| Banco Bilbao Vizcaya Argentaria, SA | 883,076 | 7,408 |
| 1,525,301 | ||
| Consumer discretionary 11.33% | ||
| ProSiebenSAT.1 Media AG, nonvoting preferred1 | 2,261,000 | 97,179 |
| Wolters Kluwer NV | 3,456,135 | 73,126 |
| Bayerische Motoren Werke AG | 738,000 | 64,534 |
| Honda Motor Co., Ltd. | 1,604,000 | 59,596 |
| Common stocks | ||
| Value | ||
| Consumer discretionary (continued) | Shares | (000) |
| Toyota Motor Corp. | 965,000 | $ 58,281 |
| SJM Holdings Ltd. | 19,700,000 | 47,904 |
| OPAP SA | 4,291,200 | 35,916 |
| Nokian Renkaat Oyj | 850,000 | 34,641 |
| SES SA, Class A (FDR) | 1,075,000 | 30,784 |
| Intercontinental Hotels Group PLC | 1,025,733 | 28,206 |
| HUGO BOSS AG | 234,019 | 25,770 |
| H & M Hennes & Mauritz AB, Class B | 735,000 | 24,156 |
| Wynn Macau, Ltd. | 8,558,000 | 23,171 |
| Naspers Ltd., Class N | 300,000 | 22,155 |
| Eutelsat Communications SA | 730,000 | 20,724 |
| MGM China Holdings Ltd. | 7,723,200 | 20,612 |
| Mediaset SpA1 | 4,580,000 | 17,289 |
| Cie. Financière Richemont SA, Class A, non-registered shares | 147,000 | 13,003 |
| Industria de Diseño Textil, SA | 100,000 | 12,345 |
| Christian Dior SA | 61,000 | 9,846 |
| Tata Motors Ltd., Class A (DVR) | 146,245 | 347 |
| 719,585 | ||
| Energy 9.07% | ||
| Royal Dutch Shell PLC, Class B | 5,034,300 | 166,614 |
| TOTAL SA | 2,578,800 | 125,893 |
| Enbridge Inc. | 2,184,192 | 91,816 |
| Keyera Corp. | 800,000 | 43,024 |
| Crescent Point Energy Corp. | 1,260,000 | 42,735 |
| Coal India Ltd. | 7,250,000 | 36,912 |
| Paramount Resources Ltd.1 | 1,050,000 | 35,592 |
| YPF Sociedad Anónima, Class D (ADR) | 1,200,000 | 17,712 |
| Transocean Ltd. | 320,000 | 15,344 |
| 575,642 | ||
| Industrials 8.46% | ||
| Wolseley PLC | 1,073,408 | 49,517 |
| Schneider Electric SA | 649,032 | 47,081 |
| Marubeni Corp. | 6,870,000 | 45,925 |
| Meggitt PLC | 5,053,300 | 39,774 |
| Kubota Corp. | 2,680,000 | 39,127 |
| Singapore Technologies Engineering Ltd | 11,350,000 | 37,520 |
| Vallourec SA | 700,000 | 35,421 |
| Qantas Airways Ltd.1 | 26,011,000 | 32,114 |
| ASSA ABLOY AB, Class B | 783,500 | 30,704 |
| Randstad Holding NV | 683,000 | 28,004 |
| European Aeronautic Defence and Space Co. EADS NV | 500,000 | 26,726 |
| Siemens AG | 248,500 | 25,117 |
| Geberit AG | 100,000 | 24,805 |
| Ryanair Holdings PLC (ADR) | 360,000 | 18,551 |
| Globaltrans Investment PLC (GDR) | 1,348,000 | 18,522 |
| Abertis Infraestructuras, SA, Class A | 1,000,000 | 17,442 |
| Leighton Holdings Ltd. | 900,000 | 12,717 |
| Mitsubishi Corp. | 333,100 | 5,706 |
| Andritz AG | 46,936 | 2,409 |
| 537,182 | ||
| Common stocks | ||
| Value | ||
| Information technology 7.37% | Shares | (000) |
| Taiwan Semiconductor Manufacturing Co. Ltd. | 43,391,506 | $ 160,704 |
| STMicroelectronics NV | 13,227,000 | 119,158 |
| Quanta Computer Inc.1 | 34,829,835 | 75,538 |
| ASM Pacific Technology Ltd. | 2,851,300 | 31,414 |
| Nintendo Co., Ltd. | 244,400 | 28,831 |
| ASML Holding NV | 200,000 | 15,781 |
| Baidu, Inc., Class A (ADR)1 | 165,000 | 15,598 |
| Spectris PLC | 500,000 | 14,525 |
| Infineon Technologies AG | 736,500 | 6,164 |
| 467,713 | ||
| Health care 6.31% | ||
| Novartis AG | 2,313,100 | 164,321 |
| AstraZeneca PLC | 1,475,000 | 69,882 |
| Sonic Healthcare Ltd. | 2,559,801 | 34,671 |
| GlaxoSmithKline PLC | 1,350,000 | 33,838 |
| Sanofi | 306,258 | 31,740 |
| Novo Nordisk A/S, Class B | 130,000 | 20,260 |
| Smith & Nephew PLC | 1,520,000 | 16,992 |
| CSL Ltd. | 300,000 | 16,895 |
| Bayer AG | 115,000 | 12,264 |
| 400,863 | ||
| Utilities 6.01% | ||
| National Grid PLC | 11,128,270 | 126,264 |
| Power Assets Holdings Ltd. | 12,028,000 | 103,748 |
| GDF SUEZ | 4,862,249 | 95,219 |
| Glow Energy PCL | 9,200,000 | 21,283 |
| Enagás, SA | 733,281 | 18,121 |
| CLP Holdings Ltd. | 1,550,000 | 12,540 |
| E.ON SE | 275,000 | 4,514 |
| 381,689 | ||
| Telecommunication services 5.90% | ||
| Advanced Info Service PCL | 8,720,500 | 79,290 |
| Vodafone Group PLC | 17,762,052 | 50,748 |
| MTN Group Ltd. | 2,533,000 | 47,149 |
| HKT Trust, units | 35,095,000 | 33,665 |
| Globe Telecom, Inc. | 847,930 | 31,601 |
| BT Group PLC | 5,779,000 | 27,177 |
| SOFTBANK CORP. | 420,000 | 24,519 |
| Hellenic Telecommunications Organization SA1 | 3,136,200 | 24,493 |
| Swisscom AG | 37,000 | 16,202 |
| Portugal Telecom, SGPS, SA | 3,915,700 | 15,240 |
| France Télécom SA | 1,525,800 | 14,435 |
| Koninklijke KPN NV | 4,993,894 | 10,381 |
| 374,900 | ||
| Consumer staples 5.19% | ||
| British American Tobacco PLC | 1,951,300 | 99,942 |
| Imperial Tobacco Group PLC | 1,200,000 | 41,613 |
| Nestlé SA | 604,700 | 39,660 |
| Casino, Guichard-Perrachon SA | 341,000 | 31,945 |
| Wesfarmers Ltd. | 500,000 | 18,108 |
| Common stocks | ||
| Value | ||
| Consumer staples (continued) | Shares | (000) |
| Unilever NV, depository receipts | 423,000 | $ 16,658 |
| Anheuser-Busch InBev NV | 169,000 | 15,045 |
| Kimberly-Clark de México, SAB de CV, Class A | 4,477,900 | 14,470 |
| AMOREPACIFIC Corp. | 17,600 | 14,101 |
| ITC Ltd. | 2,475,000 | 13,509 |
| Japan Tobacco Inc. | 354,000 | 12,510 |
| Shoprite Holdings Ltd. | 631,000 | 11,841 |
| 329,402 | ||
| Materials 4.79% | ||
| L’Air Liquide SA, bonus shares2 | 495,511 | 61,190 |
| L’Air Liquide SA, non-registered shares | 37,000 | 4,569 |
| Amcor Ltd. | 5,125,000 | 47,527 |
| James Hardie Industries PLC (CDI) | 3,730,000 | 32,032 |
| Syngenta AG | 80,800 | 31,617 |
| PT Semen Indonesia (Persero) Tbk | 12,680,000 | 21,846 |
| Linde AG | 116,646 | 21,765 |
| Givaudan SA | 16,300 | 21,036 |
| BASF SE | 225,000 | 20,100 |
| Orica Ltd. | 880,000 | 16,619 |
| Rio Tinto PLC | 355,000 | 14,486 |
| Impala Platinum Holdings Ltd. | 1,241,352 | 11,679 |
| 304,466 | ||
| Miscellaneous 1.87% | ||
| Other common stocks in initial period of acquisition | 118,875 | |
| Total common stocks (cost: $4,993,193,000) | 5,735,618 | |
| Preferred stocks 0.20% | ||
| Financials 0.20% | ||
| HSBC Holdings PLC, Series 2, 8.00% | 472,795 | 12,847 |
| Total preferred stocks (cost: $12,000,000) | 12,847 | |
| Convertible securities 1.05% | ||
| Principal amount | ||
| Consumer staples 0.82% | (000) | |
| Shoprite Holdings Ltd. 6.50% convertible notes 2017 | ZAR423,482 | 51,837 |
| Financials 0.23% | ||
| Bank of Ireland, convertible notes 10.00% 2016 | €11,000 | 14,613 |
| Total convertible securities (cost: $73,750,000) | 66,450 | |
| Bonds, notes & other debt instruments 2.01% | ||
| U.S. Treasury bonds & notes 0.63% | ||
| U.S. Treasury 0.25% 2015 | $ 6,250 | 6,239 |
| U.S. Treasury 4.00% 20153 | 31,875 | 33,788 |
| 40,027 | ||
| Bonds, notes & other debt instruments | ||
| Principal amount | Value | |
| Telecommunication services 0.47% | (000) | (000) |
| NII Capital Corp. 8.875% 2019 | $ 4,775 | $ 4,083 |
| NII Capital Corp. 11.375% 20194 | 7,200 | 7,740 |
| NII Capital Corp. 7.625% 2021 | 23,025 | 18,132 |
| 29,955 | ||
| Financials 0.32% | ||
| Société Générale, junior subordinated 6.999% (undated)5 | €6,200 | 8,268 |
| SMFG Preferred Capital USD 3 Ltd., junior subordinated 9.50% (undated)4,5 | $5,410 | 6,681 |
| Westfield Capital Corp. Ltd., WT Finance (Australia) Pty Ltd. and WEA Finance LLC 5.125% 20144 | 430 | 457 |
| Westfield Group 5.70% 20164 | 4,540 | 5,077 |
| 20,483 | ||
| Bonds & notes of governments outside the U.S. 0.32% | ||
| Greek Government 2.00%/3.00% 20236 | €1,750 | 1,237 |
| Greek Government 2.00%/3.00% 20246 | 1,750 | 1,155 |
| Greek Government 2.00%/3.00% 20256 | 1,750 | 1,105 |
| Greek Government 2.00%/3.00% 20266 | 1,750 | 1,061 |
| Greek Government 2.00%/3.00% 20276 | 1,750 | 1,039 |
| Greek Government 2.00%/3.00% 20286 | 1,750 | 1,024 |
| Greek Government 2.00%/3.00% 20296 | 1,750 | 1,007 |
| Greek Government 2.00%/3.00% 20306 | 1,750 | 995 |
| Greek Government 2.00%/3.00% 20316 | 1,750 | 983 |
| Greek Government 2.00%/3.00% 20326 | 1,750 | 976 |
| Greek Government 2.00%/3.00% 20336 | 1,750 | 980 |
| Greek Government 2.00%/3.00% 20346 | 1,750 | 983 |
| Greek Government 2.00%/3.00% 20356 | 1,750 | 973 |
| Greek Government 2.00%/3.00% 20366 | 1,750 | 971 |
| Greek Government 2.00%/3.00% 20376 | 1,750 | 973 |
| Greek Government 2.00%/3.00% 20386 | 1,750 | 957 |
| Greek Government 2.00%/3.00% 20396 | 1,750 | 964 |
| Greek Government 2.00%/3.00% 20406 | 1,750 | 957 |
| Greek Government 2.00%/3.00% 20416 | 1,750 | 966 |
| Greek Government 2.00%/3.00% 20426 | 1,750 | 959 |
| 20,265 | ||
| Consumer staples 0.24% | ||
| British American Tobacco International Finance PLC 8.125% 20134 | $12,159 | 12,474 |
| British American Tobacco International Finance PLC 9.50% 20184 | 2,000 | 2,681 |
| 15,155 | ||
| Consumer discretionary 0.03% | ||
| DaimlerChrysler North America Holding Corp. 6.50% 2013 | 1,990 | 2,032 |
| Total bonds, notes & other debt instruments (cost: $116,464,000) | 127,917 | |
| Short-term securities 6.29% | ||
| Freddie Mac 0.10%–0.112% due 12/9–12/19/2013 | 82,800 | 82,756 |
| Federal Home Loan Bank 0.08%–0.10% due 7/5–12/16/2013 | 80,500 | 80,473 |
| Bank of Nova Scotia 0.145% due 7/15/2013 | 44,900 | 44,897 |
| ExxonMobil Corp. 0.07% due 7/1/2013 | 35,000 | 35,000 |
| Fannie Mae 0.11%–0.18% due 7/1–9/16/2013 | 30,150 | 30,148 |
| National Australia Funding (Delaware) Inc. 0.185% due 10/7/20134 | 30,000 | 29,985 |
| Svenska Handelsbanken Inc. 0.145%–0.18% due 8/20–8/26/20134 | 29,100 | 29,093 |
| Principal amount | Value | |
| Short-term securities | (000) | (000) |
| Old Line Funding, LLC 0.19% due 9/23/20134 | $25,000 | $ 24,994 |
| Gotham Funding Corp. 0.16% due 7/19/20134 | 23,200 | 23,198 |
| Sumitomo Mitsui Banking Corp. 0.18% due 7/17/20134 | 13,500 | 13,499 |
| Unilever Capital Corp. 0.08% due 7/22/20134 | 5,400 | 5,400 |
| Total short-term securities (cost: $399,441,000) | 399,443 | |
| Total investment securities (cost: $5,594,848,000) | 6,342,275 | |
| Other assets less liabilities | 8,130 | |
| Net assets | $6,350,405 |
As permitted by U.S. Securities and Exchange Commission regulations, “Miscellaneous” securities include holdings in their first year of acquisition that have not previously been publicly disclosed.
| 1 | Security did not produce income during the last 12 months. |
| 2 | Valued under fair value procedures adopted by authority of the board of trustees. The total value of all such securities was $108,894,000, which represented 1.71% of the net assets of the fund. |
| 3 | A portion of this security was pledged as collateral for net losses on unsettled forward currency contracts. The total value of pledged collateral was $637,000, which represented .01% of the net assets of the fund. |
| 4 | Acquired in a transaction exempt from registration under Rule 144A or section 4(2) of the Securities Act of 1933. May be resold in the U.S. in transactions exempt from registration, normally to qualified institutional buyers. The total value of all such securities was $161,279,000, which represented 2.54% of the net assets of the fund. |
| 5 | Coupon rate may change periodically. |
| 6 | Step bond; coupon rate will increase at a later date. |
Key to abbreviations and symbol
ADR = American Depositary Receipts
CDI = CREST Depository Interest
DVR = Differential Voting Rights
FDR = Fiduciary Depositary Receipts
GDR = Global Depositary Receipts
€ = Euros
ZAR = South African rand
Investments are not FDIC-insured, nor are they deposits of or guaranteed by a bank or any other entity, so they may lose value.
Investors should carefully consider investment objectives, risks, charges and expenses. This and other important information is contained in the fund prospectus and summary prospectus, which can be obtained from your financial professional and should be read carefully before investing. You may also call American Funds Service Company (AFS) at (800) 421-4225 or visit the American Funds website at americanfunds.com.
MFGEFPX-034-0813O-S37647
REPORT OF INDEPENDENT REGISTERED PUBLIC ACCOUNTING FIRM
To the Shareholders and Board of Trustees of
International Growth and Income Fund:
We have audited the accompanying statement of assets and liabilities of International Growth and Income Fund, including the summary schedule of investments, as of June 30, 2014, and the related statements of operations for the year then ended, the statements of changes in net assets for each of the two years in the period then ended (collectively, the “financial statements”), the financial highlights for each of the five years in the period then ended (the financial statements and financial highlights are included in Item 1 of this Form N-CSR), and the schedule of investments in securities as of June 30, 2014 (included in Item 6 of this Form N-CSR). These financial statements, financial highlights, and schedule of investments in securities are the responsibility of the Company’s management. Our responsibility is to express an opinion on these financial statements, financial highlights, and schedule of investments in securities based on our audits.
We conducted our audits in accordance with the standards of the Public Company Accounting Oversight Board (United States). Those standards require that we plan and perform the audit to obtain reasonable assurance about whether the financial statements, financial highlights, and schedule of investments in securities are free of material misstatement. An audit includes examining, on a test basis, evidence supporting the amounts and disclosures in the financial statements and schedule of investments in securities. Our procedures included confirmation of securities owned as of June 30, 2014, by correspondence with the custodian and brokers; where replies were not received from brokers, we performed other auditing procedures. An audit also includes assessing the accounting principles used and significant estimates made by management, as well as evaluating the overall financial statement presentation. We believe that our audits provide a reasonable basis for our opinion.
In our opinion, the financial statements, financial highlights, and schedule of investments in securities referred to above present fairly, in all material respects, the financial position of International Growth and Income Fund as of June 30, 2014, and the results of its operations for the year then ended, the changes in its net assets for each of the two years in the period then ended, and the financial highlights for each of the five years in the period then ended, in conformity with accounting principles generally accepted in the United States of America.
DELOITTE & TOUCHE LLP
Costa Mesa, California
August 12, 2014
ITEM 7 – Disclosure of Proxy Voting Policies and Procedures for Closed-End Management Investment Companies
Not applicable to this Registrant, insofar as the Registrant is not a closed-end management investment company.
ITEM 8 – Portfolio Managers of Closed-End Management Investment Companies
Not applicable to this Registrant, insofar as the Registrant is not a closed-end management investment company.
ITEM 9 – Purchases of Equity Securities by Closed-End Management Investment Company and Affiliated Purchasers
Not applicable to this Registrant, insofar as the Registrant is not a closed-end management investment company.
ITEM 10 – Submission of Matters to a Vote of Security Holders
There have been no material changes to the procedures by which shareholders may recommend nominees to the Registrant’s board of trustees since the Registrant last submitted a proxy statement to its shareholders. The procedures are as follows. The Registrant has a nominating and governance committee comprised solely of persons who are not considered ‘‘interested persons’’ of the Registrant within the meaning of the Investment Company Act of 1940, as amended. The committee periodically reviews such issues as the board’s composition, responsibilities, committees, compensation and other relevant issues, and recommends any appropriate changes to the full board of trustees. While the committee normally is able to identify from its own resources an ample number of qualified candidates, it will consider shareholder suggestions of persons to be considered as nominees to fill future vacancies on the board. Such suggestions must be sent in writing to the nominating and governance committee of the Registrant, c/o the Registrant’s Secretary, and must be accompanied by complete biographical and occupational data on the prospective nominee, along with a written consent of the prospective nominee for consideration of his or her name by the nominating and governance committee.
ITEM 11 – Controls and Procedures
| (a) | The Registrant’s Principal Executive Officer and Principal Financial Officer have concluded, based on their evaluation of the Registrant’s disclosure controls and procedures (as such term is defined in Rule 30a-3 under the Investment Company Act of 1940), that such controls and procedures are adequate and reasonably designed to achieve the purposes described in paragraph (c) of such rule. |
| (b) | There were no changes in the Registrant’s internal controls over financial reporting (as defined in Rule 30a-3(d) under the Investment Company Act of 1940) that occurred during the Registrant’s second fiscal quarter of the period covered by this report that has materially affected, or is reasonably likely to materially affect, the Registrant’s internal control over financial reporting. |
ITEM 12 – Exhibits
| (a)(1) | The Code of Ethics that is the subject of the disclosure required by Item 2 is attached as an exhibit hereto. |
| (a)(2) | The certifications required by Rule 30a-2 of the Investment Company Act of 1940 and Sections 302 and 906 of the Sarbanes-Oxley Act of 2002 are attached as exhibits hereto. |
SIGNATURES
Pursuant to the requirements of the Securities Exchange Act of 1934 and the Investment Company Act of 1940, the Registrant has duly caused this report to be signed on its behalf by the undersigned, thereunto duly authorized.
| INTERNATIONAL GROWTH AND INCOME FUND | |
| By /s/ Paul F. Roye | |
Paul F. Roye, Executive Vice President and Principal Executive Officer | |
| Date: August 29, 2014 |
Pursuant to the requirements of the Securities Exchange Act of 1934 and the Investment Company Act of 1940, this report has been signed below by the following persons on behalf of the Registrant and in the capacities and on the dates indicated.
| By /s/ Paul F. Roye |
Paul F. Roye, Executive Vice President and Principal Executive Officer |
| Date: August 29, 2014 |
| By /s/ Jeffrey P. Regal |
Jeffrey P. Regal, Treasurer and Principal Financial Officer |
| Date: August 29, 2014 |