UNITED STATES
SECURITIES AND EXCHANGE COMMISSION
Washington, D.C. 20549
FORM N-CSR
Certified Shareholder Report of
Registered Management Investment Companies
Investment Company Act File Number: 811-22215
International Growth and Income Fund
(Exact Name of Registrant as Specified in Charter)
6455 Irvine Center Drive
Irvine, California 92618
(Address of Principal Executive Offices)
Registrant's telephone number, including area code: (949) 975-5000
Date of fiscal year end: June 30
Date of reporting period: June 30, 2023
Hong T. Le
International Growth and Income Fund
6455 Irvine Center Drive
Irvine, California 92618
(Name and Address of Agent for Service)
ITEM 1 – Reports to Stockholders
International Growth and
Annual report |

Pursues growth and
income opportunities
across international
markets
International Growth and Income Fund seeks to provide you with long-term growth of capital while providing current income.
This fund is one of more than 40 offered by Capital Group, home of American Funds, one of the nation’s largest mutual fund families. For over 90 years, Capital Group has invested with a long-term focus based on thorough research and attention to risk.
Fund results shown in this report, unless otherwise indicated, are for Class F-2 shares. Class A share results are shown at net asset value unless otherwise indicated. If a sales charge (maximum 5.75%) had been deducted from Class A shares, the results would have been lower. Results are for past periods and are not predictive of results for future periods. Current and future results may be lower or higher than those shown. Prices and returns will vary, so investors may lose money. Investing for short periods makes losses more likely. For current information and month-end results, refer to capitalgroup.com.
Refer to page 4 for Class F-2 and Class A share results with relevant sales charges deducted and fund expenses. For other share class results, refer to capitalgroup.com and americanfundsretirement.com.
Investment results assume all distributions are reinvested and reflect applicable fees and expenses. When applicable, results reflect fee waivers and/or expense reimbursements, without which they would have been lower. Refer to capitalgroup.com for more information.
The fund’s 30-day yield as of June 30, 2023, was 2.73% for Class F-2 shares and 2.32% for Class A shares, calculated in accordance with the U.S. Securities and Exchange Commission formula. The Class A share result reflects the 5.75% maximum sales charge.
Investing outside the United States may be subject to risks, such as currency fluctuations, periods of illiquidity and price volatility. These risks may be heightened in connection with investments in developing countries. Refer to the fund prospectus and the Risk Factors section of this report for more information on these and other risks associated with investing in the fund.
Investments are not FDIC-insured, nor are they deposits of or guaranteed by a bank or any other entity, so they may lose value.
Contents
| 1 | Letter to investors |
| 4 | The value of a long-term perspective |
| 5 | Investment portfolio |
| 12 | Financial statements |
| 34 | Board of trustees and other officers |
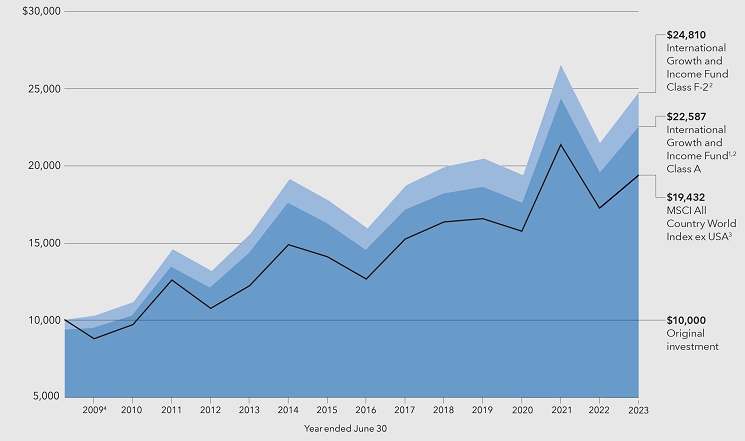
International stock markets advanced during the fund’s fiscal year, bolstered by receding inflation, stronger than expected growth in some markets and signals from central banks in the U.S. and Europe that interest rates might not rise as much as previously anticipated. The fund’s Class F-2 shares gained 15.45% for the 12 months ended June 30, 2023. This total return includes quarterly dividend payments totaling about $1.09 a share for the period and capital gains distributions totaling $0.37.
This result exceeded the 12.72% gain registered by the fund’s primary benchmark, the MSCI All Country World Index (ACWI) ex USA, which reflects the returns of more than 40 developed- and developing-country stock markets. The index is unmanaged and, therefore, has no expenses.
We are pleased with the fund’s strong positive results in both absolute terms and relative to its benchmark. We are also gratified that during the period markets recognized a broadening of opportunity beyond mega-cap U.S. tech companies. As its name indicates, International Growth and Income Fund seeks to invest broadly across non-U.S. markets and in both proven dividend-paying companies as well as companies with strong growth potential — an approach that has helped the fund outpace its benchmark over the fund’s lifetime. Returns for longer time frames are shown below.
Results at a glance
For periods ended June 30, 2023, with all distributions reinvested
| Cumulative total returns | Average annual total returns | |||||||||||||||
| 1 year | 5 years | 10 years | Lifetime* | |||||||||||||
| International Growth and Income Fund (Class F-2 shares) | 15.45 | % | 4.66 | % | 4.88 | % | 6.36 | % | ||||||||
| International Growth and Income Fund (Class A shares) | 15.11 | 4.38 | 4.63 | 6.11 | ||||||||||||
| MSCI All Country World Index (ACWI) ex USA† | 12.72 | 3.52 | 4.75 | 4.61 | ||||||||||||
| Past results are not predictive of results in future periods. | |
| * | Lifetime results are from October 1, 2008, the inception of the fund. |
| † | The index is unmanaged and, therefore, has no expenses. Investors cannot invest directly in an index. There have been periods when the fund has lagged the index. MSCI All Country World Index ex USA is a free-float-adjusted, market-capitalization-weighted index that measures equity market results in global developed and emerging markets, excluding the United States. The index consists of more than 40 developed and emerging market country indexes. Results reflect dividends gross of withholding taxes through December 31, 2000, and dividends net of withholding taxes thereafter. This index is unmanaged, and its results include reinvested dividends and/or distributions but do not reflect the effect of sales charges, commissions, account fees, expenses or U.S. federal income taxes. |
| International Growth and Income Fund | 1 |
Stock markets stage surprise rallies
International markets began the period under pressure from soaring inflation, rising interest rates, the Russia-Ukraine war and widely held expectations of recession. Nevertheless, stocks rose sharply as investors shrugged off these challenges and companies adapted to the changing environment. Through much of the period, investors shifted their attention to old-economy, value-oriented companies, as well as dividend payers. Such companies are a key focus of the fund’s managers. A softening U.S. dollar further boosted returns for U.S. investors in international markets.
European stocks posted the strongest returns of the period amid rising interest rates and signs of weaker growth across the 20-member eurozone. The eurozone economy contracted by 0.1% in the first quarter of 2023 and by the same amount in the fourth quarter of 2022, according to revised estimates from Eurostat. The contraction met a commonly cited definition of a recession, albeit a mild one. However, the region withstood inflation, energy supply challenges and other pressures from the Ukraine war better than many economists had expected. The European Central Bank moved aggressively to curtail inflation, raising interest rates throughout the period. At the end of the 12 months, inflation remained elevated but had declined meaningfully from a record 10.6% in October 2022. For the period, the MSCI Europe Index gained 21.8% in U.S. dollar terms.*
Japanese equities rose as Japan’s economy entered and recovered from a shallow recession. Gross domestic product grew an annualized 2.7% in the first quarter following modest contractions in the last two quarters of 2022. A boost in private and business spending as pandemic-related restrictions were lifted contributed to growth. Despite persistent signs of inflation, the Bank of Japan maintained its accommodative monetary policy, a break with other major central banks. Core inflation, which excludes fresh food, edged down in May to 3.2% from 3.4% the previous month. The yen fell to the lowest level against the U.S. dollar in seven months amid a growing interest rate differential between the U.S. and Japan.
In emerging markets, Chinese equities slid –16.8% amid worries that momentum from the reopening of China’s economy was slowing. Data for business activity and consumer spending suggested waning demand in the closing weeks of the period after a surge earlier in the year. While China’s central bank cut interest rates, top government officials signaled they are preparing more stimulus measures to revive growth. Elsewhere, India and Brazil’s stock markets gained 14.2% and 29.8%, respectively.
Nine of the 11 market sectors turned in positive results, led by industrials and information technology companies. Technology stocks, which had slipped early in the period under the weight of rising interest rates, gained on investor enthusiasm for the advancement of artificial intelligence. Real estate stocks experienced the biggest declines, hurt by worries about the impact of higher interest rates on residential and commercial property markets. Stocks in the communication services sector also recorded modest losses.
Inside the portfolio
Favorable stock selection in the consumer discretionary sector produced some of the portfolio’s strongest returns for the fiscal year. Casino resort developer MGM China Holdings shares soared 106.6% after China ended its zero-COVID policy, fueling hopes for a recovery in gaming and tourism spending in areas such as Macau during 2023. Evolution Gaming, a B2B provider of live casino systems, also posted gains on positive sentiment around the company’s robust financial results in the first half of 2023. Shares of luxury goods maker LVMH rose 54.8% as the company recorded record revenue growth, bolstered by sales momentum in Europe and Japan and a first-quarter rebound in Asia after China’s COVID restrictions were lifted.
Select investments in industrials and information technology companies also supported the fund’s positive results. Shares of Airbus, the fund’s fifth-largest holding, rallied after the company forecast a significant increase in commercial plane deliveries for 2023. Fourth-quarter 2022 results surpassed estimates, with profits and sales rising strongly year over year. Semiconductor maker Broadcom rose after it secured a key agreement with Apple, beat fiscal
| 2 | International Growth and Income Fund |
second-quarter results estimates and said its fiscal third-quarter outlook was improved by growing demand for its products from large-scale AI networks. Top 10 investments Taiwan Semiconductor and ASML also produced double-digit gains.
Holdings of consumer staples companies weighed down the fund’s total returns. Tobacco makers Philip Morris International and British American Tobacco, the fund’s sixth-and ninth-largest holdings, slid on worries over tightening regulation in the vaping space and declining sales of conventional cigarettes. The U.S. Food and Drug Administration signaled it was increasing enforcement efforts as it continued to place the industry under greater scrutiny.
Investments in real estate and materials companies also proved to be a drag on results. Brazilian mining giant Vale fell on softer iron ore prices amid weak sentiment on the outlook for Chinese demand. Longfor Group, a Hong Kong-listed property holding company, declined along with Chinese property stocks in general as worries grew over stalled projects. Confidence in the sector also weakened due to certain property developers defaulting on their debt repayments.
Also among the fund’s top 10 holdings, pharmaceutical giant Novo Nordisk rose on sales of its weight-loss treatment Wegovy. Drug makers AstraZeneca and Sanofi and French oil and gas company TotalEnergies also recorded gains.
Looking ahead
The outlook for international stock markets has brightened over the past year. Despite war and soaring inflation, the European economy has shown surprising resilience. China has taken incremental steps to support growth in its economy. With inflation moderating, central bankers have signaled that they may be approaching the end of monetary policy tightening cycles. Significant challenges, of course, remain, including the ongoing conflict in Ukraine, rising tensions between the U.S. and China, and the possibility that the global economy could still slip into recession.
We have seen a broadening of market opportunity to include old-economy companies that make tangible products, like industrials and materials, as well as leading technology companies. The reopening of economies continues to be a powerful tailwind, driving opportunity for businesses in luxury goods, travel and leisure, and other industries. We believe the fund’s focus on blue-chip companies across industries and geographies positions it well to participate in this broadening of opportunity.
We remain confident that a balanced and well-diversified portfolio that focuses on both income and growth opportunities makes sense in any environment. Given the complexities that investors are confronted with today, it may be more essential than ever. We continue to look for investment opportunities that can reward our shareholders over the long term by focusing on the prospects of individual companies through rigorous fundamental research.
We thank you for your continued support of International Growth and Income Fund, and we look forward to reporting back to you in six months.
Cordially,

Andrew B. Suzman
Co-President

Steven T. Watson
Co-President
August 9, 2023
For current information about the fund, refer to capitalgroup.com.
| * | Unless otherwise noted, country stock returns are based on MSCI indexes, expressed in U.S. dollars and assume the reinvestment of dividends. Results reflect dividends net of withholding taxes. |
| International Growth and Income Fund | 3 |
The value of a long-term perspective
How a hypothetical $10,000 investment has grown (for the period October 1, 2008, to June 30, 2023, with all distributions reinvested)
Fund results shown are for Class F-2 shares and Class A shares. Class A share results reflect deduction of the maximum sales charge of 5.75% on the $10,000 investment¹; thus, the net amount invested was $9,425. Results are for past periods and are not predictive of results for future periods. Current and future results may be lower or higher than those shown. Prices and returns will vary, so investors may lose money. Investing for short periods makes losses more likely. For current information and month-end results, refer to capitalgroup.com.
| 1 | As outlined in the prospectus, the sales charge is reduced for accounts (and aggregated investments) of $25,000 or more and is eliminated for purchases of $1 million or more. There is no sales charge on dividends or capital gain distributions that are reinvested in additional shares. |
| 2 | All results are calculated with dividends and capital gains reinvested. |
| 3 | Source: MSCI. The index is unmanaged and, therefore, has no expenses. The index reflects dividends net of withholding taxes. Investors cannot invest directly in an index. |
| 4 | For the period October 1, 2008 (when the fund began operations), through June 30, 2009. |
Average annual total returns based on a $1,000 investment (for periods ended June 30, 2023)
| 1 year | 5 years | 10 years | ||||||||||
| Class F-2 shares | 15.45 | % | 4.66 | % | 4.88 | % | ||||||
| Class A shares* | 8.50 | 3.15 | 4.01 | |||||||||
| * | Assumes payment of the maximum 5.75% sales charge. |
The total annual fund operating expense ratio is 0.65% for Class F-2 and 0.91% for Class A shares as of the prospectus dated September 1, 2023 (unaudited).
Investment results assume all distributions are reinvested and reflect applicable fees and expenses. When applicable, results reflect fee waivers and/or expense reimbursements, without which they would have been lower. Refer to capitalgroup.com for more information.
| 4 | International Growth and Income Fund |
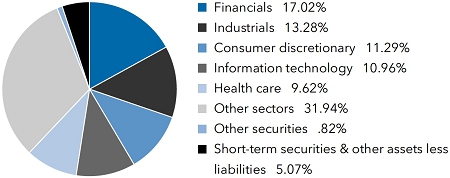
Investment portfolio June 30, 2023
| Sector diversification | Percent of net assets |
| Country diversification by domicile | Percent of net assets | |||
| Eurozone* | 30.06 | % | ||
| United Kingdom | 13.50 | |||
| Japan | 7.89 | |||
| China | 6.28 | |||
| United States | 5.70 | |||
| Hong Kong | 4.16 | |||
| Canada | 3.75 | |||
| Denmark | 3.40 | |||
| Switzerland | 3.36 | |||
| Taiwan | 3.27 | |||
| Other countries | 13.22 | |||
| Bonds, notes & other debt instruments, short-term securities & other assets less liabilities | 5.41 | |||
| * | Countries using the euro as a common currency; those represented in the fund’s portfolio are Austria, Belgium, Finland, France, Germany, Greece, Ireland, Italy, the Netherlands and Spain. |
| Common stocks 94.11% | Shares | Value (000) | ||||||
| Financials 17.02% | ||||||||
| Ping An Insurance (Group) Company of China, Ltd., Class H | 32,786,500 | $ | 210,069 | |||||
| AXA SA | 6,335,878 | 187,184 | ||||||
| AIA Group, Ltd. | 17,288,730 | 176,400 | ||||||
| Edenred SA | 2,290,268 | 153,358 | ||||||
| HDFC Bank, Ltd. | 5,733,530 | 119,124 | ||||||
| Zurich Insurance Group AG | 227,033 | 107,864 | ||||||
| DNB Bank ASA | 5,511,738 | 103,046 | ||||||
| UniCredit SpA | 4,174,788 | 97,357 | ||||||
| Société Générale | 3,390,530 | 88,262 | ||||||
| Resona Holdings, Inc. | 17,726,100 | 84,941 | ||||||
| Hiscox, Ltd. | 5,931,339 | 82,373 | ||||||
| Tokio Marine Holdings, Inc. | 3,326,400 | 76,804 | ||||||
| Euronext NV | 896,501 | 60,978 | ||||||
| Hana Financial Group, Inc. | 1,871,918 | 56,028 | ||||||
| Banco Santander, SA | 13,661,925 | 50,692 | ||||||
| KB Financial Group, Inc. | 1,277,223 | 46,313 | ||||||
| London Stock Exchange Group PLC | 424,924 | 45,028 | ||||||
| Aon PLC, Class A | 129,937 | 44,854 | ||||||
| Bank Hapoalim B.M. | 5,195,948 | 42,614 | ||||||
| Banco Bilbao Vizcaya Argentaria, SA | 4,917,357 | 37,916 | ||||||
| Erste Group Bank AG | 1,052,399 | 36,954 | ||||||
| Hang Seng Bank, Ltd. | 2,563,486 | 36,509 | ||||||
| Prudential PLC | 2,527,905 | 35,649 | ||||||
| Toronto-Dominion Bank (CAD denominated)1 | 568,166 | 35,216 | ||||||
| Grupo Financiero Banorte, SAB de CV, Series O | 4,003,150 | 33,025 | ||||||
| Industrial and Commercial Bank of China, Ltd., Class H | 57,668,000 | 30,778 | ||||||
| HDFC Life Insurance Co., Ltd. | 3,655,613 | 29,032 | ||||||
| DBS Group Holdings, Ltd. | 1,150,824 | 26,909 | ||||||
| China Merchants Bank Co., Ltd., Class H | 5,784,000 | 26,304 | ||||||
| Bank Leumi Le Israel BM | 3,450,373 | 25,852 | ||||||
| Tryg A/S | 1,146,000 | 24,805 | ||||||
| Kotak Mahindra Bank, Ltd. | 948,000 | 21,349 | ||||||
| CaixaBank, SA, non-registered shares | 5,085,002 | 21,092 | ||||||
| Israel Discount Bank, Ltd., Class A | 4,116,297 | 20,465 | ||||||
| Discovery, Ltd.2 | 2,647,620 | 20,459 | ||||||
| XP, Inc., Class A1,2 | 864,800 | 20,288 | ||||||
| Bank Mandiri (Persero) Tbk PT | 53,999,300 | 18,908 | ||||||
| Dai-ichi Life Holdings, Inc. | 943,900 | 18,106 | ||||||
| ICICI Bank, Ltd. (ADR) | 768,052 | 17,727 | ||||||
| Skandinaviska Enskilda Banken AB, Class A | 1,449,622 | 16,039 | ||||||
| ICICI Securities, Ltd. | 2,062,200 | 15,285 | ||||||
| International Growth and Income Fund | 5 |
| Common stocks (continued) | Shares | Value (000) | ||||||
| Financials (continued) | ||||||||
| United Overseas Bank, Ltd. | 717,100 | $ | 14,866 | |||||
| Brookfield Corp., Class A (CAD denominated) | 439,800 | 14,807 | ||||||
| 3i Group PLC | 500,000 | 12,417 | ||||||
| Postal Savings Bank of China Co., Ltd., Class H | 19,759,000 | 12,188 | ||||||
| ING Groep NV | 889,312 | 12,010 | ||||||
| B3 SA - Brasil, Bolsa, Balcao | 3,580,000 | 10,923 | ||||||
| Canara Bank | 2,810,000 | 10,376 | ||||||
| Hong Kong Exchanges and Clearing, Ltd. | 266,800 | 10,146 | ||||||
| Banca Generali SpA | 272,292 | 9,385 | ||||||
| Intesa Sanpaolo SpA | 3,349,070 | 8,802 | ||||||
| ABN AMRO Bank NV | 530,100 | 8,245 | ||||||
| AU Small Finance Bank, Ltd. | 549,500 | 5,051 | ||||||
| Piraeus Financial Holdings SA2 | 727 | 2 | ||||||
| Moscow Exchange MICEX-RTS PJSC3 | 16,180,772 | — | 4 | |||||
| Sberbank of Russia PJSC3 | 22,898,260 | — | 4 | |||||
| 2,531,174 | ||||||||
| Industrials 13.28% | ||||||||
| Airbus SE, non-registered shares | 2,291,298 | 331,219 | ||||||
| BAE Systems PLC | 17,776,157 | 209,740 | ||||||
| CCR SA, ordinary nominative shares | 37,154,931 | 109,024 | ||||||
| ABB, Ltd. | 2,495,334 | 98,187 | ||||||
| Alliance Global Group, Inc. | 350,520,000 | 85,225 | ||||||
| SMC Corp. | 140,000 | 77,812 | ||||||
| Daikin Industries, Ltd. | 366,200 | 74,750 | ||||||
| Ryanair Holdings PLC (ADR)2 | 596,836 | 66,010 | ||||||
| RELX PLC | 1,854,646 | 61,831 | ||||||
| Bunzl PLC | 1,556,352 | 59,255 | ||||||
| InPost SA2 | 5,223,279 | 56,675 | ||||||
| Safran SA | 317,265 | 49,846 | ||||||
| Rheinmetall AG | 167,016 | 45,858 | ||||||
| Brenntag SE | 561,745 | 43,765 | ||||||
| Mitsui & Co., Ltd. | 1,114,100 | 41,920 | ||||||
| LIXIL Corp. | 2,769,755 | 35,176 | ||||||
| Nidec Corp. | 599,400 | 32,947 | ||||||
| Epiroc AB, Class A | 876,290 | 16,599 | ||||||
| Epiroc AB, Class B | 861,596 | 13,935 | ||||||
| Techtronic Industries Co., Ltd. | 2,759,826 | 30,198 | ||||||
| Experian PLC | 784,453 | 30,143 | ||||||
| Caterpillar, Inc. | 102,000 | 25,097 | ||||||
| TFI International, Inc. (CAD denominated) | 219,249 | 24,979 | ||||||
| Canadian Pacific Kansas City, Ltd. (CAD denominated)1 | 307,200 | 24,813 | ||||||
| BELIMO Holding AG | 48,881 | 24,388 | ||||||
| DSV A/S | 107,565 | 22,637 | ||||||
| Interpump Group SpA | 401,700 | 22,342 | ||||||
| Wizz Air Holdings PLC2 | 620,401 | 21,580 | ||||||
| DHL Group | 423,660 | 20,688 | ||||||
| Canadian National Railway Company (CAD denominated) | 162,259 | 19,649 | ||||||
| Siemens AG | 116,427 | 19,379 | ||||||
| SITC International Holdings Co., Ltd. | 10,541,267 | 19,347 | ||||||
| AGC, Inc.1 | 464,200 | 16,707 | ||||||
| Diploma PLC | 400,000 | 15,188 | ||||||
| Adecco Group AG | 463,250 | 15,121 | ||||||
| ITOCHU Corp. | 371,200 | 14,762 | ||||||
| Fluidra, SA, non-registered shares | 698,000 | 13,594 | ||||||
| IMCD NV | 90,000 | 12,946 | ||||||
| ASSA ABLOY AB, Class B | 523,600 | 12,569 | ||||||
| Hitachi, Ltd. | 184,100 | 11,394 | ||||||
| Rentokil Initial PLC | 1,343,810 | 10,496 | ||||||
| Shenzhen Inovance Technology Co., Ltd., Class A | 1,036,200 | 9,170 | ||||||
| Komatsu, Ltd. | 333,800 | 9,032 | ||||||
| Melrose Industries PLC | 1,060,000 | 6,823 | ||||||
| VAT Group AG | 15,000 | 6,213 | ||||||
| Polycab India, Ltd. | 95,000 | 4,113 | ||||||
| Thales SA | 5,620 | 841 | ||||||
| 1,973,983 | ||||||||
| 6 | International Growth and Income Fund |
| Common stocks (continued) | Shares | Value (000) | ||||||
| Consumer discretionary 11.29% | ||||||||
| LVMH Moët Hennessy-Louis Vuitton SE | 251,994 | $ | 237,813 | |||||
| Renault SA | 3,371,440 | 142,254 | ||||||
| Evolution AB | 948,793 | 120,231 | ||||||
| Restaurant Brands International, Inc. (CAD denominated) | 1,127,185 | 87,393 | ||||||
| InterContinental Hotels Group PLC | 1,229,280 | 84,890 | ||||||
| Industria de Diseño Textil, SA | 2,131,858 | 82,828 | ||||||
| Midea Group Co., Ltd., Class A | 8,815,002 | 71,748 | ||||||
| adidas AG | 345,876 | 67,084 | ||||||
| Prosus NV, Class N | 858,172 | 62,799 | ||||||
| B&M European Value Retail SA | 8,806,119 | 62,421 | ||||||
| Sands China, Ltd.2 | 17,996,735 | 61,593 | ||||||
| MGM China Holdings, Ltd.1,2 | 52,175,200 | 61,129 | ||||||
| Sodexo SA | 518,864 | 57,140 | ||||||
| Galaxy Entertainment Group, Ltd.2 | 8,220,000 | 52,462 | ||||||
| Stellantis NV | 2,956,690 | 52,022 | ||||||
| Wynn Macau, Ltd.1,2 | 53,022,400 | 48,284 | ||||||
| Valeo SA, non-registered shares | 1,789,325 | 38,394 | ||||||
| Paltac Corp. | 977,800 | 32,549 | ||||||
| Li Ning Co., Ltd. | 5,474,548 | 29,607 | ||||||
| Cie. Financière Richemont SA, Class A | 164,787 | 27,960 | ||||||
| Alibaba Group Holding, Ltd.2 | 2,466,600 | 25,653 | ||||||
| Trip.com Group, Ltd.2 | 450,000 | 15,743 | ||||||
| Trip.com Group, Ltd. (ADR)2 | 263,000 | 9,205 | ||||||
| Entain PLC | 1,504,741 | 24,437 | ||||||
| Coupang, Inc., Class A2 | 1,307,300 | 22,747 | ||||||
| D’Ieteren Group | 118,566 | 20,968 | ||||||
| Games Workshop Group PLC | 117,000 | 16,259 | ||||||
| Amadeus IT Group SA, Class A, non-registered shares | 209,310 | 15,958 | ||||||
| Kering SA | 25,993 | 14,396 | ||||||
| IDP Education, Ltd. | 502,482 | 7,430 | ||||||
| Pan Pacific International Holdings Corp. | 374,300 | 6,707 | ||||||
| Nitori Holdings Co., Ltd. | 59,300 | 6,635 | ||||||
| MercadoLibre, Inc.2 | 3,895 | 4,614 | ||||||
| Dixon Technologies (India), Ltd.2 | 72,747 | 3,899 | ||||||
| Balkrishna Industries, Ltd. | 113,180 | 3,269 | ||||||
| Meituan, Class B2 | 22,440 | 353 | ||||||
| 1,678,874 | ||||||||
| Information technology 10.96% | ||||||||
| Taiwan Semiconductor Manufacturing Company, Ltd. | 19,336,407 | 360,340 | ||||||
| ASML Holding NV | 488,297 | 353,464 | ||||||
| Tokyo Electron, Ltd. | 1,121,235 | 160,565 | ||||||
| Samsung Electronics Co., Ltd. | 2,025,800 | 111,655 | ||||||
| MediaTek, Inc. | 4,800,400 | 106,555 | ||||||
| Broadcom, Inc. | 120,353 | 104,398 | ||||||
| SAP SE | 652,483 | 89,093 | ||||||
| Keyence Corp. | 119,100 | 56,325 | ||||||
| TDK Corp. | 1,372,675 | 53,152 | ||||||
| Capgemini SE | 278,243 | 52,711 | ||||||
| ASM International NV | 91,500 | 38,913 | ||||||
| Nokia Corp. | 8,275,503 | 34,728 | ||||||
| Kingdee International Software Group Co., Ltd.2 | 20,098,000 | 26,983 | ||||||
| Sage Group PLC | 2,255,118 | 26,491 | ||||||
| Halma PLC | 460,182 | 13,321 | ||||||
| Vanguard International Semiconductor Corp. | 3,731,705 | 10,598 | ||||||
| eMemory Technology, Inc. | 133,000 | 9,515 | ||||||
| NICE, Ltd. (ADR)1,2 | 42,670 | 8,811 | ||||||
| Nomura Research Institute, Ltd. | 236,000 | 6,509 | ||||||
| Fujitsu, Ltd. | 44,300 | 5,711 | ||||||
| 1,629,838 | ||||||||
| Health care 9.62% | ||||||||
| AstraZeneca PLC | 3,280,196 | 469,850 | ||||||
| Novo Nordisk AS, Class B | 2,109,985 | 340,792 | ||||||
| Sanofi | 2,018,425 | 216,381 | ||||||
| EssilorLuxottica SA | 448,779 | 84,930 | ||||||
| Bayer AG | 1,237,188 | 68,399 | ||||||
| Grifols, SA, Class B (ADR)2 | 4,001,900 | 36,657 | ||||||
| International Growth and Income Fund | 7 |
| Common stocks (continued) | Shares | Value (000) | ||||||
| Health care (continued) | ||||||||
| Lonza Group AG | 50,009 | $ | 29,865 | |||||
| HOYA Corp. | 220,800 | 26,339 | ||||||
| Siemens Healthineers AG | 459,602 | 26,012 | ||||||
| Genus PLC | 927,840 | 25,535 | ||||||
| WuXi Biologics (Cayman), Inc.2 | 5,216,000 | 25,133 | ||||||
| Roche Holding AG, nonvoting non-registered shares | 56,408 | 17,238 | ||||||
| Eisai Co., Ltd. | 238,700 | 16,086 | ||||||
| Argenx SE (ADR)2 | 35,903 | 13,993 | ||||||
| Hypera SA, ordinary nominative shares | 1,258,800 | 12,096 | ||||||
| BeiGene, Ltd. (ADR)2 | 51,201 | 9,129 | ||||||
| Innovent Biologics, Inc.2 | 2,183,500 | 8,292 | ||||||
| CanSino Biologics, Inc., Class H | 1,013,200 | 3,397 | ||||||
| EUROAPI2 | 42,790 | 491 | ||||||
| 1,430,615 | ||||||||
| Consumer staples 9.55% | ||||||||
| Philip Morris International, Inc. | 3,359,845 | 327,988 | ||||||
| British American Tobacco PLC | 6,700,052 | 222,284 | ||||||
| Carlsberg A/S, Class B | 732,833 | 117,174 | ||||||
| Nestlé SA | 965,308 | 116,150 | ||||||
| Kweichow Moutai Co., Ltd., Class A | 481,393 | 112,247 | ||||||
| Pernod Ricard SA | 414,497 | 91,579 | ||||||
| Anheuser-Busch InBev SA/NV | 1,203,518 | 68,163 | ||||||
| KT&G Corp. | 916,392 | 57,691 | ||||||
| Arca Continental, SAB de CV | 4,465,089 | 45,895 | ||||||
| Carrefour SA, non-registered shares | 2,130,000 | 40,366 | ||||||
| Japan Tobacco, Inc.1 | 1,586,500 | 34,775 | ||||||
| Asahi Group Holdings, Ltd.1 | 842,300 | 32,650 | ||||||
| Ocado Group PLC2 | 4,424,636 | 31,966 | ||||||
| L’Oréal SA, non-registered shares | 64,996 | 30,332 | ||||||
| Foshan Haitian Flavouring and Food Co., Ltd., Class A | 4,163,670 | 26,853 | ||||||
| Imperial Brands PLC | 1,019,102 | 22,537 | ||||||
| Kimberly-Clark de México, SAB de CV, Class A, ordinary participation certificates | 7,255,300 | 16,136 | ||||||
| Reckitt Benckiser Group PLC | 189,834 | 14,257 | ||||||
| Danone SA | 187,428 | 11,485 | ||||||
| 1,420,528 | ||||||||
| Energy 6.60% | ||||||||
| TotalEnergies SE | 4,584,548 | 262,752 | ||||||
| BP PLC | 29,109,554 | 170,548 | ||||||
| TechnipFMC PLC2 | 6,402,175 | 106,404 | ||||||
| Schlumberger NV | 1,527,916 | 75,051 | ||||||
| Cameco Corp. (CAD denominated) | 2,346,000 | 73,475 | ||||||
| Canadian Natural Resources, Ltd. (CAD denominated) | 1,140,000 | 64,093 | ||||||
| TC Energy Corp. (CAD denominated)1 | 1,298,650 | 52,485 | ||||||
| Woodside Energy Group, Ltd. | 1,432,000 | 33,163 | ||||||
| Reliance Industries, Ltd. | 859,046 | 26,785 | ||||||
| Aker BP ASA | 1,010,066 | 23,669 | ||||||
| Saudi Arabian Oil Co. | 2,658,378 | 22,873 | ||||||
| Gaztransport & Technigaz SA | 209,500 | 21,333 | ||||||
| Tourmaline Oil Corp.1 | 353,000 | 16,633 | ||||||
| INPEX Corp.1 | 1,422,400 | 15,863 | ||||||
| Equinor ASA | 531,500 | 15,440 | ||||||
| Sovcomflot PAO3 | 16,933,870 | — | 4 | |||||
| Gazprom PJSC3 | 33,392,872 | — | 4 | |||||
| LUKOIL Oil Co. PJSC3 | 476,875 | — | 4 | |||||
| 980,567 | ||||||||
| Communication services 5.82% | ||||||||
| Publicis Groupe SA | 1,884,620 | 147,017 | ||||||
| Koninklijke KPN NV | 35,835,844 | 127,930 | ||||||
| Tencent Holdings, Ltd. | 2,174,500 | 92,552 | ||||||
| Nippon Telegraph and Telephone Corp. | 76,067,500 | 90,132 | ||||||
| Telefónica, SA, non-registered shares | 17,875,373 | 72,517 | ||||||
| BT Group PLC | 36,123,548 | 56,203 | ||||||
| SoftBank Corp. | 4,228,700 | 45,239 | ||||||
| América Móvil, SAB de CV, Class B (ADR) | 1,543,650 | 33,405 | ||||||
| Vodafone Group PLC | 33,772,836 | 31,865 | ||||||
| 8 | International Growth and Income Fund |
| Common stocks (continued) | Shares | Value (000) | ||||||
| Communication services (continued) | ||||||||
| MTN Group, Ltd. | 4,094,966 | $ | 30,131 | |||||
| Deutsche Telekom AG | 1,296,820 | 28,267 | ||||||
| Singapore Telecommunications, Ltd. | 14,408,400 | 26,696 | ||||||
| KANZHUN, Ltd., Class A (ADR)2 | 1,504,000 | 22,635 | ||||||
| Indus Towers, Ltd.2 | 10,107,846 | 20,270 | ||||||
| Sea, Ltd., Class A (ADR)2 | 229,678 | 13,331 | ||||||
| NetEase, Inc. | 646,900 | 12,571 | ||||||
| Universal Music Group NV | 398,378 | 8,851 | ||||||
| KT Corp. | 160,000 | 3,626 | ||||||
| Viaplay Group AB, Class B2 | 323,328 | 1,855 | ||||||
| 865,093 | ||||||||
| Materials 5.50% | ||||||||
| Vale SA, ordinary nominative shares | 7,724,772 | 103,606 | ||||||
| Vale SA (ADR), ordinary nominative shares | 2,777,036 | 37,268 | ||||||
| Barrick Gold Corp. | 5,489,422 | 92,936 | ||||||
| Barrick Gold Corp. (CAD denominated) | 608,000 | 10,285 | ||||||
| Linde PLC | 257,063 | 97,962 | ||||||
| Glencore PLC | 13,369,138 | 75,837 | ||||||
| Rio Tinto PLC | 731,249 | 46,456 | ||||||
| Air Liquide SA, non-registered shares | 218,569 | 39,186 | ||||||
| Nutrien, Ltd. (CAD denominated)1 | 643,119 | 37,968 | ||||||
| Sociedad Química y Minera de Chile SA, Class B (ADR)1 | 484,039 | 35,151 | ||||||
| CEMEX, SAB de CV (ADR), ordinary participation certificates, units2 | 4,288,071 | 30,360 | ||||||
| Asahi Kasei Corp. | 4,464,525 | 30,305 | ||||||
| Fortescue Metals Group, Ltd. | 1,908,306 | 28,420 | ||||||
| Holcim, Ltd. | 391,079 | 26,293 | ||||||
| Shin-Etsu Chemical Co., Ltd. | 715,000 | 23,764 | ||||||
| Sika AG | 79,261 | 22,670 | ||||||
| UPM-Kymmene OYJ | 686,000 | 20,444 | ||||||
| Fresnillo PLC | 2,560,608 | 19,846 | ||||||
| Grupo México, SAB de CV, Series B | 4,000,000 | 19,258 | ||||||
| DSM-Firmenich AG | 103,415 | 11,129 | ||||||
| Givaudan SA | 2,359 | 7,826 | ||||||
| Alrosa PJSC3 | 3,661,021 | — | 4 | |||||
| 816,970 | ||||||||
| Utilities 2.69% | ||||||||
| Engie SA | 7,904,888 | 131,483 | ||||||
| ENN Energy Holdings, Ltd. | 5,788,200 | 72,333 | ||||||
| Brookfield Infrastructure Partners, LP | 1,638,032 | 59,871 | ||||||
| Enel SpA | 5,676,053 | 38,236 | ||||||
| Iberdrola, SA, non-registered shares | 2,309,308 | 30,164 | ||||||
| National Grid PLC | 2,000,226 | 26,431 | ||||||
| Veolia Environnement | 813,070 | 25,706 | ||||||
| China Resources Gas Group, Ltd. | 4,758,000 | 16,314 | ||||||
| 400,538 | ||||||||
| Real estate 1.78% | ||||||||
| CK Asset Holdings, Ltd. | 16,194,620 | 89,876 | ||||||
| Prologis Property Mexico, SA de CV, REIT | 12,300,000 | 45,702 | ||||||
| Longfor Group Holdings, Ltd. | 15,686,900 | 38,420 | ||||||
| Mitsubishi Estate Co., Ltd. | 3,014,700 | 35,959 | ||||||
| Link REIT | 5,817,125 | 32,386 | ||||||
| KE Holdings, Inc., Class A (ADR)2 | 1,473,578 | 21,883 | ||||||
| 264,226 | ||||||||
| Total common stocks (cost: $11,268,923,000) | 13,992,406 | |||||||
| Preferred securities 0.45% | ||||||||
| Materials 0.36% | ||||||||
| Gerdau SA, preferred nominative shares | 10,216,053 | 53,489 | ||||||
| International Growth and Income Fund | 9 |
| Preferred securities (continued) | Shares | Value (000) | ||||||
| Information technology 0.09% | ||||||||
| Samsung Electronics Co., Ltd., nonvoting preferred shares | 283,202 | $ | 12,853 | |||||
| Total preferred securities (cost: $48,902,000) | 66,342 | |||||||
| Rights & warrants 0.03% | ||||||||
| Consumer discretionary 0.03% | ||||||||
| Midea Group Co., Ltd., Class A, warrants, expire 2/26/20242,5 | 562,000 | 4,574 | ||||||
| Total rights & warrants (cost: $4,222,000) | 4,574 | |||||||
| Bonds, notes & other debt instruments 0.34% | Principal amount (000) | |||||||
| Bonds & notes of governments & government agencies outside the U.S. 0.34% | ||||||||
| Brazil (Federative Republic of) 10.00% 1/1/2033 | BRL | 250,000 | 50,346 | |||||
| Total bonds, notes & other debt instruments (cost: $43,526,000) | 50,346 | |||||||
| Short-term securities 5.68% | Shares | |||||||
| Money market investments 4.55% | ||||||||
| Capital Group Central Cash Fund 5.15%6,7 | 6,772,916 | 677,360 | ||||||
| Money market investments purchased with collateral from securities on loan 1.13% | ||||||||
| Capital Group Central Cash Fund 5.15%6,7,8 | 399,372 | 39,941 | ||||||
| Invesco Short-Term Investments Trust – Government & Agency Portfolio, Institutional Class 5.05%6,8 | 22,318,981 | 22,319 | ||||||
| Dreyfus Treasury Obligations Cash Management, Institutional Shares 5.00%6,8 | 20,100,000 | 20,100 | ||||||
| Goldman Sachs Financial Square Government Fund, Institutional Shares 5.01%6,8 | 20,100,000 | 20,100 | ||||||
| BlackRock Liquidity Funds – FedFund, Institutional Shares 4.99%6,8 | 16,700,000 | 16,700 | ||||||
| Fidelity Investments Money Market Government Portfolio, Class I 4.99%6,8 | 15,000,000 | 15,000 | ||||||
| State Street Institutional U.S. Government Money Market Fund, Premier Class 5.03%6,8 | 15,000,000 | 15,000 | ||||||
| Morgan Stanley Institutional Liquidity Funds – Government Portfolio, Institutional Class 5.03%6,8 | 13,400,000 | 13,400 | ||||||
| RBC Funds Trust – U.S. Government Money Market Fund, RBC Institutional Class 1 4.99%6,8 | 5,000,000 | 5,000 | ||||||
| 167,560 | ||||||||
| Total short-term securities (cost: $844,756,000) | 844,920 | |||||||
| Total investment securities 100.61% (cost: $12,210,329,000) | 14,958,588 | |||||||
| Other assets less liabilities (0.61)% | (90,071 | ) | ||||||
| Net assets 100.00% | $ | 14,868,517 | ||||||
Investments in affiliates7
| Value of affiliates at 7/1/2022 (000) | Additions (000) | Reductions (000) | Net realized loss (000) | Net unrealized appreciation (000) | Value of affiliates at 6/30/2023 (000) | Dividend income (000) | ||||||||||||||||||||||
| Short-term securities 4.82% | ||||||||||||||||||||||||||||
| Money market investments 4.55% | ||||||||||||||||||||||||||||
| Capital Group Central Cash Fund 5.15%6 | $ | 996,931 | $ | 2,272,582 | $ | 2,592,370 | $ | (117 | ) | $ | 334 | $ | 677,360 | $ | 26,117 | |||||||||||||
| Money market investments purchased with collateral from securities on loan 0.27% | ||||||||||||||||||||||||||||
| Capital Group Central Cash Fund 5.15%6,8 | 42,198 | 2,257 | 9 | 39,941 | — | 10 | ||||||||||||||||||||||
| Total 4.82% | $ | (117 | ) | $ | 334 | $ | 717,301 | $ | 26,117 | |||||||||||||||||||
| 10 | International Growth and Income Fund |
| 1 | All or a portion of this security was on loan. The total value of all such securities was $234,845,000, which represented 1.58% of the net assets of the fund. Refer to Note 5 for more information on securities lending. |
| 2 | Security did not produce income during the last 12 months. |
| 3 | Value determined using significant unobservable inputs. |
| 4 | Amount less than one thousand. |
| 5 | Acquired in a transaction exempt from registration under Rule 144A or, for commercial paper, Section 4(a)(2) of the Securities Act of 1933. May be resold in the U.S. in transactions exempt from registration, normally to qualified institutional buyers. The total value of all such securities was $4,574,000, which represented .03% of the net assets of the fund. |
| 6 | Rate represents the seven-day yield at 6/30/2023. |
| 7 | Part of the same “group of investment companies” as the fund as defined under the Investment Company Act of 1940, as amended. |
| 8 | Security purchased with cash collateral from securities on loan. Refer to Note 5 for more information on securities lending. |
| 9 | Represents net activity. Refer to Note 5 for more information on securities lending. |
| 10 | Dividend income is included with securities lending income in the fund’s statement of operations and is not shown in this table. |
Key to abbreviations
ADR = American Depositary Receipts
BRL = Brazilian reais
CAD = Canadian dollars
REIT = Real Estate Investment Trust
Refer to the notes to financial statements.
| International Growth and Income Fund | 11 |
| Statement of assets and liabilities | |
| at June 30, 2023 | (dollars in thousands) |
| Assets: | ||||||||
| Investment securities, at value (includes $234,845 of investment securities on loan): | ||||||||
| Unaffiliated issuers (cost: $11,493,192) | $ | 14,241,287 | ||||||
| Affiliated issuers (cost: $717,137) | 717,301 | $ | 14,958,588 | |||||
| Cash denominated in currencies other than U.S. dollars (cost: $3,260) | 3,241 | |||||||
| Receivables for: | ||||||||
| Sales of investments | 21,263 | |||||||
| Sales of fund’s shares | 13,933 | |||||||
| Dividends and interest | 74,242 | |||||||
| Other | 465 | 109,903 | ||||||
| 15,071,732 | ||||||||
| Liabilities: | ||||||||
| Collateral for securities on loan | 167,560 | |||||||
| Payables for: | ||||||||
| Purchases of investments | 3,522 | |||||||
| Repurchases of fund’s shares | 14,711 | |||||||
| Investment advisory services | 5,785 | |||||||
| Services provided by related parties | 1,591 | |||||||
| Trustees’ deferred compensation | 1,789 | |||||||
| Bank overdraft | 2 | |||||||
| Non-U.S. taxes | 7,803 | |||||||
| Other | 452 | 35,655 | ||||||
| Net assets at June 30, 2023 | $ | 14,868,517 | ||||||
| Net assets consist of: | ||||||||
| Capital paid in on shares of beneficial interest | $ | 12,364,003 | ||||||
| Total distributable earnings | 2,504,514 | |||||||
| Net assets at June 30, 2023 | $ | 14,868,517 | ||||||
Refer to the notes to financial statements.
| 12 | International Growth and Income Fund |
Financial statements (continued)
| Statement of assets and liabilities at June 30, 2023 (continued) | |
| (dollars and shares in thousands, except per-share amounts) |
Shares of beneficial interest issued and outstanding (no stated par value) —
unlimited shares authorized (430,618 total shares outstanding)
| Net assets | Shares outstanding | Net asset value per share | ||||||||||
| Class A | $ | 4,331,215 | 125,389 | $ | 34.54 | |||||||
| Class C | 77,123 | 2,235 | 34.51 | |||||||||
| Class T | 11 | — | * | 34.52 | ||||||||
| Class F-1 | 137,234 | 3,967 | 34.60 | |||||||||
| Class F-2 | 2,552,206 | 73,880 | 34.55 | |||||||||
| Class F-3 | 2,682,557 | 77,736 | 34.51 | |||||||||
| Class 529-A | 168,764 | 4,894 | 34.49 | |||||||||
| Class 529-C | 5,543 | 161 | 34.37 | |||||||||
| Class 529-E | 4,386 | 127 | 34.50 | |||||||||
| Class 529-T | 14 | — | * | 34.52 | ||||||||
| Class 529-F-1 | 12 | — | * | 34.52 | ||||||||
| Class 529-F-2 | 34,867 | 1,010 | 34.53 | |||||||||
| Class 529-F-3 | 13 | — | * | 34.52 | ||||||||
| Class R-1 | 3,583 | 104 | 34.46 | |||||||||
| Class R-2 | 50,176 | 1,461 | 34.35 | |||||||||
| Class R-2E | 43,046 | 1,254 | 34.33 | |||||||||
| Class R-3 | 93,435 | 2,712 | 34.46 | |||||||||
| Class R-4 | 66,301 | 1,921 | 34.52 | |||||||||
| Class R-5E | 20,862 | 605 | 34.48 | |||||||||
| Class R-5 | 22,736 | 654 | 34.75 | |||||||||
| Class R-6 | 4,574,433 | 132,508 | 34.52 | |||||||||
| * | Amount less than one thousand. |
| Refer to the notes to financial statements. |
| International Growth and Income Fund | 13 |
Financial statements (continued)
| Statement of operations for the year ended June 30, 2023 | (dollars in thousands) |
| Investment income: | ||||||||
| Income: | ||||||||
| Dividends (net of non-U.S. taxes of $29,001; also includes $26,117 from affiliates) | $ | 472,770 | ||||||
| Securities lending income (net of fees) | 2,241 | |||||||
| Interest from unaffiliated issuers | 1,430 | $ | 476,441 | |||||
| Fees and expenses*: | ||||||||
| Investment advisory services | 65,865 | |||||||
| Distribution services | 12,734 | |||||||
| Transfer agent services | 9,313 | |||||||
| Administrative services | 4,134 | |||||||
| 529 plan services | 119 | |||||||
| Reports to shareholders | 520 | |||||||
| Registration statement and prospectus | 365 | |||||||
| Trustees’ compensation | 62 | |||||||
| Auditing and legal | 197 | |||||||
| Custodian | 2,885 | |||||||
| Other | 99 | 96,293 | ||||||
| Net investment income | 380,148 | |||||||
| Net realized loss and unrealized appreciation: | ||||||||
| Net realized loss on: | ||||||||
| Investments (net of non-U.S. taxes of $2,347): | ||||||||
| Unaffiliated issuers | (254,498 | ) | ||||||
| Affiliated issuers | (117 | ) | ||||||
| Forward currency contracts | (2,710 | ) | ||||||
| Currency transactions | (1,637 | ) | (258,962 | ) | ||||
| Net unrealized appreciation on: | ||||||||
| Investments (net of non-U.S. taxes of $2,466): | ||||||||
| Unaffiliated issuers | 1,851,743 | |||||||
| Affiliated issuers | 334 | |||||||
| Forward currency contracts | 318 | |||||||
| Currency translations | 989 | 1,853,384 | ||||||
| Net realized loss and unrealized appreciation | 1,594,422 | |||||||
| Net increase in net assets resulting from operations | $ | 1,974,570 | ||||||
| * | Additional information related to class-specific fees and expenses is included in the notes to financial statements. |
| Statements of changes in net assets | |
| (dollars in thousands) |
| Year ended June 30, | ||||||||
| 2023 | 2022 | |||||||
| Operations: | ||||||||
| Net investment income | $ | 380,148 | $ | 469,963 | ||||
| Net realized (loss) gain | (258,962 | ) | 517,551 | |||||
| Net unrealized appreciation (depreciation) | 1,853,384 | (4,156,849 | ) | |||||
| Net increase (decrease) in net assets resulting from operations | 1,974,570 | (3,169,335 | ) | |||||
| Distributions paid to shareholders | (614,337 | ) | (1,120,883 | ) | ||||
| Net capital share transactions | 307,063 | 756,750 | ||||||
| Total increase (decrease) in net assets | 1,667,296 | (3,533,468 | ) | |||||
| Net assets: | ||||||||
| Beginning of year | 13,201,221 | 16,734,689 | ||||||
| End of year | $ | 14,868,517 | $ | 13,201,221 | ||||
| Refer to the notes to financial statements. |
| 14 | International Growth and Income Fund |
Notes to financial statements
1. Organization
International Growth and Income Fund (the “fund”) is registered under the Investment Company Act of 1940, as amended (the “1940 Act”), as an open-end, diversified management investment company. The fund seeks to provide long-term growth of capital while providing current income.
The fund has 21 share classes consisting of six retail share classes (Classes A, C, T, F-1, F-2 and F-3), seven 529 college savings plan share classes (Classes 529-A, 529-C, 529-E, 529-T, 529-F-1, 529-F-2 and 529-F-3) and eight retirement plan share classes (Classes R-1, R-2, R-2E, R-3, R-4, R-5E, R-5 and R-6). The 529 college savings plan share classes can be used to save for college education. The retirement plan share classes are generally offered only through eligible employer-sponsored retirement plans. The fund’s share classes are described further in the following table:
| Share class | Initial sales charge | Contingent deferred sales charge upon redemption | Conversion feature | |||
| Classes A and 529-A | Up to 5.75% for Class A; up to 3.50% for Class 529-A | None (except 1.00% for certain redemptions within 18 months of purchase without an initial sales charge) | None | |||
| Classes C and 529-C | None | 1.00% for redemptions within one year of purchase | Class C converts to Class A after eight years and Class 529-C converts to Class 529-A after five years | |||
| Class 529-E | None | None | None | |||
| Classes T and 529-T* | Up to 2.50% | None | None | |||
| Classes F-1, F-2, F-3, 529-F-1, 529-F-2 and 529-F-3 | None | None | None | |||
| Classes R-1, R-2, R-2E, R-3, R-4, R-5E, R-5 and R-6 | None | None | None |
| * | Class T and 529-T shares are not available for purchase. |
Holders of all share classes have equal pro rata rights to the assets, dividends and liquidation proceeds of the fund. Each share class has identical voting rights, except for the exclusive right to vote on matters affecting only its class. Share classes have different fees and expenses (“class-specific fees and expenses”), primarily due to different arrangements for distribution, transfer agent and administrative services. Differences in class-specific fees and expenses will result in differences in net investment income and, therefore, the payment of different per-share dividends by each share class.
2. Significant accounting policies
The fund is an investment company that applies the accounting and reporting guidance issued in Topic 946 by the U.S. Financial Accounting Standards Board. The fund’s financial statements have been prepared to comply with U.S. generally accepted accounting principles (“U.S. GAAP”). These principles require the fund’s investment adviser to make estimates and assumptions that affect reported amounts and disclosures. Actual results could differ from those estimates. Subsequent events, if any, have been evaluated through the date of issuance in the preparation of the financial statements. The fund follows the significant accounting policies described in this section, as well as the valuation policies described in the next section on valuation.
Security transactions and related investment income — Security transactions are recorded by the fund as of the date the trades are executed with brokers. Realized gains and losses from security transactions are determined based on the specific identified cost of the securities. In the event a security is purchased with a delayed payment date, the fund will segregate liquid assets sufficient to meet its payment obligations. Dividend income is recognized on the ex-dividend date and interest income is recognized on an accrual basis. Market discounts, premiums and original issue discounts on fixed-income securities are amortized daily over the expected life of the security.
Class allocations — Income, fees and expenses (other than class-specific fees and expenses), realized gains and losses and unrealized appreciation and depreciation are allocated daily among the various share classes based on their relative net assets. Class-specific fees and expenses, such as distribution, transfer agent and administrative services, are charged directly to the respective share class.
Distributions paid to shareholders — Income dividends and capital gain distributions are recorded on the ex-dividend date.
| International Growth and Income Fund | 15 |
Currency translation — Assets and liabilities, including investment securities, denominated in currencies other than U.S. dollars are translated into U.S. dollars at the exchange rates supplied by one or more pricing vendors on the valuation date. Purchases and sales of investment securities and income and expenses are translated into U.S. dollars at the exchange rates on the dates of such transactions. The effects of changes in exchange rates on investment securities are included with the net realized gain or loss and net unrealized appreciation or depreciation on investments in the fund’s statement of operations. The realized gain or loss and unrealized appreciation or depreciation resulting from all other transactions denominated in currencies other than U.S. dollars are disclosed separately.
3. Valuation
Capital Research and Management Company (“CRMC”), the fund’s investment adviser, values the fund’s investments at fair value as defined by U.S. GAAP. The net asset value per share is calculated once daily as of the close of regular trading on the New York Stock Exchange, normally 4 p.m. New York time, each day the New York Stock Exchange is open.
Methods and inputs — The fund’s investment adviser uses the following methods and inputs to establish the fair value of the fund’s assets and liabilities. Use of particular methods and inputs may vary over time based on availability and relevance as market and economic conditions evolve.
Equity securities, including depositary receipts, are generally valued at the official closing price of, or the last reported sale price on, the exchange or market on which such securities are traded, as of the close of business on the day the securities are being valued or, lacking any sales, at the last available bid price. Prices for each security are taken from the principal exchange or market on which the security trades.
Fixed-income securities, including short-term securities, are generally valued at evaluated prices obtained from third-party pricing vendors. Vendors value such securities based on one or more of the inputs described in the following table. The table provides examples of inputs that are commonly relevant for valuing particular classes of fixed-income securities in which the fund is authorized to invest. However, these classifications are not exclusive, and any of the inputs may be used to value any other class of fixed-income security.
| Fixed-income class | Examples of standard inputs | |
| All | Benchmark yields, transactions, bids, offers, quotations from dealers and trading systems, new issues, spreads and other relationships observed in the markets among comparable securities; and proprietary pricing models such as yield measures calculated using factors such as cash flows, financial or collateral performance and other reference data (collectively referred to as “standard inputs”) | |
| Corporate bonds, notes & loans; convertible securities | Standard inputs and underlying equity of the issuer | |
| Bonds & notes of governments & government agencies | Standard inputs and interest rate volatilities | |
| Mortgage-backed; asset-backed obligations | Standard inputs and cash flows, prepayment information, default rates, delinquency and loss assumptions, collateral characteristics, credit enhancements and specific deal information |
Securities with both fixed-income and equity characteristics, or equity securities traded principally among fixed-income dealers, are generally valued in the manner described for either equity or fixed-income securities, depending on which method is deemed most appropriate by the fund’s investment adviser. The Capital Group Central Cash Fund (“CCF”), a fund within the Capital Group Central Fund Series (“Central Funds”), is valued based upon a floating net asset value, which fluctuates with changes in the value of CCF’s portfolio securities. The underlying securities are valued based on the policies and procedures in CCF’s statement of additional information. Forward currency contracts are valued based on the spot and forward exchange rates obtained from a third-party pricing vendor.
| 16 | International Growth and Income Fund |
Securities and other assets for which representative market quotations are not readily available or are considered unreliable by the fund’s investment adviser are fair valued as determined in good faith under fair valuation guidelines adopted by the fund’s investment adviser and approved by the board of trustees as further described. The investment adviser follows fair valuation guidelines, consistent with U.S. Securities and Exchange Commission rules and guidance, to consider relevant principles and factors when making fair value determinations. The investment adviser considers relevant indications of value that are reasonably and timely available to it in determining the fair value to be assigned to a particular security, such as the type and cost of the security, contractual or legal restrictions on resale of the security, relevant financial or business developments of the issuer, actively traded similar or related securities, dealer or broker quotes, conversion or exchange rights on the security, related corporate actions, significant events occurring after the close of trading in the security, and changes in overall market conditions. In addition, the closing prices of equity securities that trade in markets outside U.S. time zones may be adjusted to reflect significant events that occur after the close of local trading but before the net asset value of each share class of the fund is determined. Fair valuations of investments that are not actively trading involve judgment and may differ materially from valuations that would have been used had greater market activity occurred.
Processes and structure — The fund’s board of trustees has designated the fund’s investment adviser to make fair value determinations, subject to board oversight. The investment adviser has established a Joint Fair Valuation Committee (the “Committee”) to administer, implement and oversee the fair valuation process and to make fair value decisions. The Committee regularly reviews its own fair value decisions, as well as decisions made under its standing instructions to the investment adviser’s valuation team. The Committee reviews changes in fair value measurements from period to period, pricing vendor information and market data, and may, as deemed appropriate, update the fair valuation guidelines to better reflect the results of back testing and address new or evolving issues. Pricing decisions, processes and controls over security valuation are also subject to additional internal reviews facilitated by the investment adviser’s global risk management group. The Committee reports changes to the fair valuation guidelines to the board of trustees. The fund’s board and audit committee also regularly review reports that describe fair value determinations and methods.
Classifications — The fund’s investment adviser classifies the fund’s assets and liabilities into three levels based on the inputs used to value the assets or liabilities. Level 1 values are based on quoted prices in active markets for identical securities. Level 2 values are based on significant observable market inputs, such as quoted prices for similar securities and quoted prices in inactive markets. Certain securities trading outside the U.S. may transfer between Level 1 and Level 2 due to valuation adjustments resulting from significant market movements following the close of local trading. Level 3 values are based on significant unobservable inputs that reflect the investment adviser’s determination of assumptions that market participants might reasonably use in valuing the securities. The valuation levels are not necessarily an indication of the risk or liquidity associated with the underlying investment. For example, U.S. government securities are reflected as Level 2 because the inputs used to determine fair value may not always be quoted prices in an active market. The following table presents the fund’s valuation levels as of June 30, 2023 (dollars in thousands):
| Investment securities | ||||||||||||||||
| Level 1 | Level 2 | Level 3 | Total | |||||||||||||
| Assets: | ||||||||||||||||
| Common stocks: | ||||||||||||||||
| Financials | $ | 176,840 | $ | 2,354,334 | — | * | $ | 2,531,174 | ||||||||
| Industrials | 269,572 | 1,704,411 | — | 1,973,983 | ||||||||||||
| Consumer discretionary | 123,959 | 1,554,915 | — | 1,678,874 | ||||||||||||
| Information technology | 113,209 | 1,516,629 | — | 1,629,838 | ||||||||||||
| Health care | 71,875 | 1,358,740 | — | 1,430,615 | ||||||||||||
| Consumer staples | 390,019 | 1,030,509 | — | 1,420,528 | ||||||||||||
| Energy | 388,141 | 592,426 | — | * | 980,567 | |||||||||||
| Communication services | 69,371 | 795,722 | — | 865,093 | ||||||||||||
| Materials | 464,794 | 352,176 | — | * | 816,970 | |||||||||||
| Utilities | 59,871 | 340,667 | — | 400,538 | ||||||||||||
| Real estate | 67,585 | 196,641 | — | 264,226 | ||||||||||||
| Preferred securities | 53,489 | 12,853 | — | 66,342 | ||||||||||||
| Rights & warrants | — | 4,574 | — | 4,574 | ||||||||||||
| Bonds, notes & other debt instruments | — | 50,346 | — | 50,346 | ||||||||||||
| Short-term securities | 844,920 | — | — | 844,920 | ||||||||||||
| Total | $ | 3,093,645 | $ | 11,864,943 | $ | — | * | $ | 14,958,588 | |||||||
| * | Amount less than one thousand. |
| International Growth and Income Fund | 17 |
4. Risk factors
Investing in the fund may involve certain risks including, but not limited to, those described below.
Market conditions — The prices of, and the income generated by, the common stocks and other securities held by the fund may decline —sometimes rapidly or unpredictably — due to various factors, including events or conditions affecting the general economy or particular industries or companies; overall market changes; local, regional or global political, social or economic instability; governmental, governmental agency or central bank responses to economic conditions; changes in inflation rates; and currency exchange rate, interest rate and commodity price fluctuations.
Economies and financial markets throughout the world are highly interconnected. Economic, financial or political events, trading and tariff arrangements, wars, terrorism, cybersecurity events, natural disasters, public health emergencies (such as the spread of infectious disease), bank failures and other circumstances in one country or region, including actions taken by governmental or quasi-governmental authorities in response to any of the foregoing, could have impacts on global economies or markets. As a result, whether or not the fund invests in securities of issuers located in or with significant exposure to the countries affected, the value and liquidity of the fund’s investments may be negatively affected by developments in other countries and regions.
Issuer risks — The prices of, and the income generated by, securities held by the fund may decline in response to various factors directly related to the issuers of such securities, including reduced demand for an issuer’s goods or services, poor management performance, major litigation, investigations or other controversies related to the issuer, changes in the issuer’s financial condition or credit rating, changes in government regulations affecting the issuer or its competitive environment and strategic initiatives such as mergers, acquisitions or dispositions and the market response to any such initiatives. An individual security may also be affected by factors relating to the industry or sector of the issuer or the securities markets as a whole, and conversely an industry or sector or the securities markets may be affected by a change in financial condition or other event affecting a single issuer.
Investing outside the U.S. — Securities of issuers domiciled outside the U.S. or with significant operations or revenues outside the U.S., and securities tied economically to countries outside the U.S. may lose value because of adverse political, social, economic or market developments (including social instability, regional conflicts, terrorism and war) in the countries or regions in which the issuers are domiciled, operate or generate revenue or to which the securities are tied economically. These securities may also lose value due to changes in foreign currency exchange rates against the U.S. dollar and/or currencies of other countries. Issuers of these securities may be more susceptible to actions of foreign governments, such as nationalization, currency blockage or the imposition of price controls, sanctions, or punitive taxes, each of which could adversely impact the value of these securities. Securities markets in certain countries may be more volatile and/or less liquid than those in the U.S. Investments outside the U.S. may also be subject to different regulatory, legal, accounting, auditing, financial reporting and recordkeeping requirements, and may be more difficult to value, than those in the U.S. In addition, the value of investments outside the U.S. may be reduced by foreign taxes, including foreign withholding taxes on interest and dividends. Further, there may be increased risks of delayed settlement of securities purchased or sold by the fund, which could impact the liquidity of the fund’s portfolio. The risks of investing outside the U.S. may be heightened in connection with investments in emerging markets.
Investing in emerging markets — Investing in emerging markets may involve risks in addition to and greater than those generally associated with investing in the securities markets of developed countries. For instance, emerging market countries tend to have less developed political, economic and legal systems than those in developed countries. Accordingly, the governments of these countries may be less stable and more likely to intervene in the market economy, for example, by imposing capital controls, nationalizing a company or industry, placing restrictions on foreign ownership and on withdrawing sale proceeds of securities from the country, and/or imposing punitive taxes that could adversely affect the prices of securities. Information regarding issuers in emerging markets may be limited, incomplete or inaccurate, and such issuers may not be subject to regulatory, accounting, auditing, and financial reporting and recordkeeping standards comparable to those to which issuers in more developed markets are subject. The fund’s rights with respect to its investments in emerging markets, if any, will generally be governed by local law, which may make it difficult or impossible for the fund to pursue legal remedies or to obtain and enforce judgments in local courts. In addition, the economies of these countries may be dependent on relatively few industries, may have limited access to capital and may be more susceptible to changes in local and global trade conditions and downturns in the world economy. Securities markets in these countries can also be relatively small and have substantially lower trading volumes. As a result, securities issued in these countries may be more volatile and less liquid, more vulnerable to market manipulation, and more difficult to value, than securities issued in countries with more developed economies and/or markets. Less certainty with respect to security valuations may lead to additional challenges and risks in calculating the fund’s net asset value. Additionally, emerging markets are more likely to experience problems with the clearing and settling of trades and the holding of securities by banks, agents and depositories that are less established than those in developed countries.
Investing in growth-oriented stocks — Growth-oriented common stocks and other equity-type securities (such as preferred stocks, convertible preferred stocks and convertible bonds) may involve larger price swings and greater potential for loss than other types of investments. These risks may be even greater in the case of smaller capitalization stocks.
| 18 | International Growth and Income Fund |
Investing in income-oriented stocks — The value of the fund’s securities and income provided by the fund may be reduced by changes in the dividend policies of, and the capital resources available for dividend payments at, the companies in which the fund invests.
Management — The investment adviser to the fund actively manages the fund’s investments. Consequently, the fund is subject to the risk that the methods and analyses, including models, tools and data, employed by the investment adviser in this process may be flawed or incorrect and may not produce the desired results. This could cause the fund to lose value or its investment results to lag relevant benchmarks or other funds with similar objectives.
5. Certain investment techniques
Securities lending — The fund has entered into securities lending transactions in which the fund earns income by lending investment securities to brokers, dealers or other institutions. Each transaction involves three parties: the fund, acting as the lender of the securities, a borrower, and a lending agent that acts as an intermediary.
Securities lending transactions are entered into by the fund under a securities lending agent agreement with the lending agent. The lending agent facilitates the exchange of securities between the fund and approved borrowers, ensures that securities loans are properly coordinated and documented, marks-to-market the value of collateral daily, secures additional collateral from a borrower if it falls below preset terms, and may reinvest cash collateral on behalf of the fund according to agreed parameters. The lending agent provides indemnification to the fund against losses resulting from a borrower default. Although risk is mitigated by the collateral and indemnification, the fund could experience a delay in recovering its securities and a potential loss of income or value if a borrower fails to return securities, collateral investments decline in value or the lending agent fails to perform.
The borrower is required to post highly liquid assets, such as cash or U.S. government securities, as collateral for the loan in an amount at least equal to the value of the securities loaned. Investments made with cash collateral are recognized as assets in the fund’s investment portfolio. The same amount is recorded as a liability in the fund’s statement of assets and liabilities. While securities are on loan, the fund will continue to receive the equivalent of the interest, dividends or other distributions paid by the issuer, as well as a portion of the interest on the investment of the collateral. Additionally, although the fund does not have the right to vote on securities while they are on loan, the fund has a right to consent on corporate actions and a right to recall loaned securities to vote. A borrower is obligated to return loaned securities at the conclusion of a loan or, during the pendency of a loan, on demand from the fund.
As of June 30, 2023, the total value of securities on loan was $234,845,000, and the total value of collateral received was $246,809,000. Collateral received includes cash of $167,560,000 and U.S. government securities of $79,249,000. Investment securities purchased from cash collateral are disclosed in the fund’s investment portfolio as short-term securities. Securities received as collateral are not recognized as fund assets. The contractual maturity of cash collateral received under the securities lending agreement is classified as overnight and continuous.
Forward currency contracts — The fund has entered into forward currency contracts, which represent agreements to exchange currencies on specific future dates at predetermined rates. The fund’s investment adviser uses forward currency contracts to manage the fund’s exposure to changes in exchange rates. Upon entering into these contracts, risks may arise from the potential inability of counterparties to meet the terms of their contracts and from possible movements in exchange rates.
On a daily basis, the fund’s investment adviser values forward currency contracts and records unrealized appreciation or depreciation for open forward currency contracts in the fund’s statement of assets and liabilities. Realized gains or losses are recorded at the time the forward currency contract is closed or offset by another contract with the same broker for the same settlement date and currency.
Closed forward currency contracts that have not reached their settlement date are included in the respective receivables or payables for closed forward currency contracts in the fund’s statement of assets and liabilities. Net realized gains or losses from closed forward currency contracts and net unrealized appreciation or depreciation from open forward currency contracts are recorded in the fund’s statement of operations. As of June 30, 2023, the fund did not have any open forward currency contracts. The average month-end notional amount of open forward currency contracts while held was $38,236,000.
The following table identifies the location and effect on the fund’s statement of operations resulting from the fund’s use of forward currency contracts as of, or for the year ended, June 30, 2023 (dollars in thousands):
| Net realized loss | Net unrealized appreciation | |||||||||||||
| Contracts | Risk type | Location on statement of operations | Value | Location on statement of operations | Value | |||||||||
| Forward currency | Currency | Net realized loss on forward currency contracts | $ | (2,710 | ) | Net unrealized appreciation on forward currency contracts | $ | 318 | ||||||
| International Growth and Income Fund | 19 |
Collateral — The fund receives or pledges highly liquid assets, such as cash or U.S. government securities, as collateral due to securities lending and its use of forward currency contracts. For securities lending, the fund receives collateral in exchange for lending investment securities. The lending agent may reinvest cash collateral from securities lending transactions according to agreed parameters. Cash collateral reinvested by the lending agent, if any, is disclosed in the fund’s investment portfolio. For forward currency contracts, the fund either receives or pledges collateral based on the net gain or loss on unsettled contracts by counterparty. The purpose of the collateral is to cover potential losses that could occur in the event that either party cannot meet its contractual obligation. Non-cash collateral pledged by the fund, if any, is disclosed in the fund’s investment portfolio, and cash collateral pledged by the fund, if any, is held in a segregated account with the fund’s custodian, which is reflected as pledged cash collateral in the fund’s statement of assets and liabilities.
6. Taxation and distributions
Federal income taxation — The fund complies with the requirements under Subchapter M of the Internal Revenue Code applicable to regulated investment companies and intends to distribute substantially all of its net taxable income and net capital gains each year. The fund is not subject to income taxes to the extent such distributions are made. Therefore, no federal income tax provision is required.
As of and during the year ended June 30, 2023, the fund did not have a liability for any unrecognized tax benefits. The fund recognizes interest and penalties, if any, related to unrecognized tax benefits as income tax expense in the statement of operations. During the year, the fund did not incur any significant interest or penalties.
The fund’s tax returns are generally not subject to examination by federal, state and, if applicable, non-U.S. tax authorities after the expiration of each jurisdiction’s statute of limitations, which is typically three years after the date of filing but can be extended in certain jurisdictions.
Non-U.S. taxation — Dividend and interest income are recorded net of non-U.S. taxes paid. The fund may file withholding tax reclaims in certain jurisdictions to recover a portion of amounts previously withheld. As a result of rulings from European courts, the fund filed for additional reclaims related to prior years. These reclaims are recorded when the amount is known and there are no significant uncertainties on collectability. During the year ended June 30, 2023, the fund recognized $3,107,000 in reclaims (net of $638,000 in fees and the effect of realized gain or loss from currency translations) and $195,000 in interest related to European court rulings, which is included in dividend income and interest income, respectively, in the fund’s statement of operations. Gains realized by the fund on the sale of securities in certain countries, if any, may be subject to non-U.S. taxes. The fund generally records an estimated deferred tax liability based on unrealized gains to provide for potential non-U.S. taxes payable upon the sale of these securities.
Distributions — Distributions determined on a tax basis may differ from net investment income and net realized gains for financial reporting purposes. These differences are due primarily to different treatment for items such as currency gains and losses; short-term capital gains and losses; capital losses related to sales of certain securities within 30 days of purchase; unrealized appreciation of certain investments in securities outside the U.S.; deferred expenses; cost of investments sold; net capital losses; non-U.S. taxes on capital gains and income on certain investments. The fiscal year in which amounts are distributed may differ from the year in which the net investment income and net realized gains are recorded by the fund for financial reporting purposes.
During the year ended June 30, 2023, the fund reclassified $565,000 from capital paid in on shares of beneficial interest to total distributable earnings to align financial reporting with tax reporting.
As of June 30, 2023, the tax basis components of distributable earnings, unrealized appreciation (depreciation) and cost of investments were as follows (dollars in thousands):
| Undistributed ordinary income | $ | 35,893 | ||
| Capital loss carryforward* | (250,975 | ) | ||
| Gross unrealized appreciation on investments | 3,662,311 | |||
| Gross unrealized depreciation on investments | (938,905 | ) | ||
| Net unrealized appreciation on investments | 2,723,406 | |||
| Cost of investments | 12,235,182 |
| * | The capital loss carryforward will be used to offset any capital gains realized by the fund in future years. The fund will not make distributions from capital gains while a capital loss carryforward remains. |
| 20 | International Growth and Income Fund |
Distributions paid were characterized for tax purposes as follows (dollars in thousands):
| Year ended June 30, 2023 | Year ended June 30, 2022 | |||||||||||||||||||||||
| Share class | Ordinary income | Long-term capital gains | Total distributions paid | Ordinary income | Long-term capital gains | Total distributions paid | ||||||||||||||||||
| Class A | $ | 126,258 | $ | 45,965 | $ | 172,223 | $ | 114,772 | $ | 216,524 | $ | 331,296 | ||||||||||||
| Class C | 1,827 | 913 | 2,740 | 1,832 | 5,325 | 7,157 | ||||||||||||||||||
| Class T | — | † | — | † | — | † | — | † | 1 | 1 | ||||||||||||||
| Class F-1 | 3,856 | 1,352 | 5,208 | 4,399 | 8,762 | 13,161 | ||||||||||||||||||
| Class F-2 | 81,685 | 26,442 | 108,127 | 76,585 | 129,210 | 205,795 | ||||||||||||||||||
| Class F-3 | 86,619 | 28,326 | 114,945 | 88,194 | 154,156 | 242,350 | ||||||||||||||||||
| Class 529-A | 4,782 | 1,776 | 6,558 | 4,189 | 7,937 | 12,126 | ||||||||||||||||||
| Class 529-C | 126 | 63 | 189 | 122 | 358 | 480 | ||||||||||||||||||
| Class 529-E | 115 | 46 | 161 | 103 | 219 | 322 | ||||||||||||||||||
| Class 529-T | — | † | — | † | — | † | — | † | 1 | 1 | ||||||||||||||
| Class 529-F-1 | — | † | — | † | — | † | — | † | 1 | 1 | ||||||||||||||
| Class 529-F-2 | 1,073 | 350 | 1,423 | 868 | 1,439 | 2,307 | ||||||||||||||||||
| Class 529-F-3 | — | † | — | † | — | † | — | † | 1 | 1 | ||||||||||||||
| Class R-1 | 80 | 39 | 119 | 59 | 128 | 187 | ||||||||||||||||||
| Class R-2 | 1,139 | 535 | 1,674 | 899 | 2,433 | 3,332 | ||||||||||||||||||
| Class R-2E | 1,092 | 466 | 1,558 | 893 | 2,054 | 2,947 | ||||||||||||||||||
| Class R-3 | 2,448 | 989 | 3,437 | 2,025 | 4,287 | 6,312 | ||||||||||||||||||
| Class R-4 | 1,959 | 723 | 2,682 | 1,786 | 3,348 | 5,134 | ||||||||||||||||||
| Class R-5E | 633 | 209 | 842 | 512 | 862 | 1,374 | ||||||||||||||||||
| Class R-5 | 736 | 242 | 978 | 1,107 | 2,142 | 3,249 | ||||||||||||||||||
| Class R-6 | 144,787 | 46,686 | 191,473 | 103,072 | 180,278 | 283,350 | ||||||||||||||||||
| Total | $ | 459,215 | $ | 155,122 | $ | 614,337 | $ | 401,417 | $ | 719,466 | $ | 1,120,883 | ||||||||||||
| † | Amount less than one thousand. |
7. Fees and transactions with related parties
CRMC, the fund’s investment adviser, is the parent company of American Funds Distributors®, Inc. (“AFD”), the principal underwriter of the fund’s shares, and American Funds Service Company® (“AFS”), the fund’s transfer agent. CRMC, AFD and AFS are considered related parties to the fund.
Investment advisory services — The fund has an investment advisory and service agreement with CRMC that provides for monthly fees accrued daily. These fees are based on a series of decreasing annual rates beginning with 0.478% on the first $15 billion of daily net assets and decreasing to 0.430% on such assets in excess of $21 billion. For the year ended June 30, 2023, the investment advisory services fees were $65,865,000, which were equivalent to an annualized rate of 0.478% of average daily net assets.
| International Growth and Income Fund | 21 |
Class-specific fees and expenses — Expenses that are specific to individual share classes are accrued directly to the respective share class. The principal class-specific fees and expenses are further described below:
Distribution services — The fund has plans of distribution for all share classes, except Class F-2, F-3, 529-F-2, 529-F-3, R-5E, R-5 and R-6 shares. Under the plans, the board of trustees approves certain categories of expenses that are used to finance activities primarily intended to sell fund shares and service existing accounts. The plans provide for payments, based on an annualized percentage of average daily net assets, ranging from 0.30% to 1.00% as noted in this section. In some cases, the board of trustees has limited the amounts that may be paid to less than the maximum allowed by the plans. All share classes with a plan may use up to 0.25% of average daily net assets to pay service fees, or to compensate AFD for paying service fees, to firms that have entered into agreements with AFD to provide certain shareholder services. The remaining amounts available to be paid under each plan are paid to dealers to compensate them for their sales activities.
| Share class | Currently approved limits | Plan limits | ||||||
| Class A | 0.30 | % | 0.30 | % | ||||
| Class 529-A | 0.30 | 0.50 | ||||||
| Classes C, 529-C and R-1 | 1.00 | 1.00 | ||||||
| Class R-2 | 0.75 | 1.00 | ||||||
| Class R-2E | 0.60 | 0.85 | ||||||
| Classes 529-E and R-3 | 0.50 | 0.75 | ||||||
| Classes T, F-1, 529-T, 529-F-1 and R-4 | 0.25 | 0.50 | ||||||
For Class A and 529-A shares, distribution-related expenses include the reimbursement of dealer and wholesaler commissions paid by AFD for certain shares sold without a sales charge. These share classes reimburse AFD for amounts billed within the prior 15 months but only to the extent that the overall annual expense limits are not exceeded. As of June 30, 2023, there were no unreimbursed expenses subject to reimbursement for Class A or 529-A shares.
Transfer agent services — The fund has a shareholder services agreement with AFS under which the fund compensates AFS for providing transfer agent services to each of the fund’s share classes. These services include recordkeeping, shareholder communications and transaction processing. In addition, the fund reimburses AFS for amounts paid to third parties for performing transfer agent services on behalf of fund shareholders.
Administrative services — The fund has an administrative services agreement with CRMC under which the fund compensates CRMC for providing administrative services to all share classes. Administrative services are provided by CRMC and its affiliates to help assist third parties providing non-distribution services to fund shareholders. These services include providing in-depth information on the fund and market developments that impact fund investments. Administrative services also include, but are not limited to, coordinating, monitoring and overseeing third parties that provide services to fund shareholders. The agreement provides the fund the ability to charge an administrative services fee at the annual rate of 0.05% of the average daily net assets attributable to each share class of the fund. Currently the fund pays CRMC an administrative services fee at the annual rate of 0.03% of the average daily net assets attributable to each share class of the fund for CRMC’s provision of administrative services.
529 plan services — Each 529 share class is subject to service fees to compensate the Virginia College Savings Plan (“Virginia529”) for its oversight and administration of the CollegeAmerica 529 college savings plan. The fees are based on the combined net assets invested in Class 529 and ABLE shares of the American Funds. Class ABLE shares are offered on other American Funds by Virginia529 through ABLEAmerica®, a tax-advantaged savings program for individuals with disabilities. Virginia529 is not considered a related party to the fund.
The quarterly fees are based on a series of decreasing annual rates beginning with 0.09% on the first $20 billion of the combined net assets invested in the American Funds and decreasing to 0.03% on such assets in excess of $75 billion. The fees for any given calendar quarter are accrued and calculated on the basis of the average net assets of Class 529 and ABLE shares of the American Funds for the last month of the prior calendar quarter. For the year ended June 30, 2023, the 529 plan services fees were $119,000, which were equivalent to 0.060% of the average daily net assets of each 529 share class.
| 22 | International Growth and Income Fund |
For the year ended June 30, 2023, class-specific expenses under the agreements were as follows (dollars in thousands):
| Share class | Distribution services | Transfer agent services | Administrative services | 529 plan services | ||||||||||||
| Class A | $9,977 | $5,508 | $1,224 | Not applicable | ||||||||||||
| Class C | 794 | 109 | 24 | Not applicable | ||||||||||||
| Class T | — | — | * | — | * | Not applicable | ||||||||||
| Class F-1 | 319 | 188 | 39 | Not applicable | ||||||||||||
| Class F-2 | Not applicable | 2,720 | 725 | Not applicable | ||||||||||||
| Class F-3 | Not applicable | 37 | 749 | Not applicable | ||||||||||||
| Class 529-A | 356 | 195 | 47 | $94 | ||||||||||||
| Class 529-C | 56 | 7 | 2 | 3 | ||||||||||||
| Class 529-E | 20 | 2 | 1 | 3 | ||||||||||||
| Class 529-T | — | — | * | — | * | — | * | |||||||||
| Class 529-F-1 | — | — | * | — | * | — | * | |||||||||
| Class 529-F-2 | Not applicable | 12 | 9 | 19 | ||||||||||||
| Class 529-F-3 | Not applicable | — | * | — | * | — | * | |||||||||
| Class R-1 | 33 | 4 | 1 | Not applicable | ||||||||||||
| Class R-2 | 352 | 161 | 14 | Not applicable | ||||||||||||
| Class R-2E | 242 | 81 | 12 | Not applicable | ||||||||||||
| Class R-3 | 429 | 129 | 26 | Not applicable | ||||||||||||
| Class R-4 | 156 | 61 | 19 | Not applicable | ||||||||||||
| Class R-5E | Not applicable | 29 | 6 | Not applicable | ||||||||||||
| Class R-5 | Not applicable | 10 | 6 | Not applicable | ||||||||||||
| Class R-6 | Not applicable | 60 | 1,230 | Not applicable | ||||||||||||
| Total class-specific expenses | $12,734 | $9,313 | $4,134 | $119 | ||||||||||||
| * | Amount less than one thousand. |
Trustees’ deferred compensation — Trustees who are unaffiliated with CRMC may elect to defer the cash payment of part or all of their compensation. These deferred amounts, which remain as liabilities of the fund, are treated as if invested in shares of the fund or other American Funds. These amounts represent general, unsecured liabilities of the fund and vary according to the total returns of the selected funds. Trustees’ compensation of $62,000 in the fund’s statement of operations reflects $71,000 in current fees (either paid in cash or deferred) and a net decrease of $9,000 in the value of the deferred amounts.
Affiliated officers and trustees — Officers and certain trustees of the fund are or may be considered to be affiliated with CRMC, AFD and AFS. No affiliated officers or trustees received any compensation directly from the fund.
Investment in CCF — The fund holds shares of CCF, an institutional prime money market fund managed by CRMC. CCF invests in high-quality, short-term money market instruments. CCF is used as the primary investment vehicle for the fund’s short-term instruments. CCF shares are only available for purchase by CRMC, its affiliates, and other funds managed by CRMC or its affiliates, and are not available to the public. CRMC does not receive an investment advisory services fee from CCF.
Security transactions with related funds — The fund purchased investment securities from, and sold investment securities to, other funds managed by CRMC (or funds managed by certain affiliates of CRMC) under procedures adopted by the fund’s board of trustees. The funds involved in such transactions are considered related by virtue of having a common investment adviser (or affiliated investment advisers), common trustees and/or common officers. Each transaction was executed at the current market price of the security and no brokerage commissions or fees were paid in accordance with Rule 17a-7 of the 1940 Act. During the year ended June 30, 2023, the fund engaged in such purchase and sale transactions with related funds in the amounts of $112,421,000 and $131,183,000, respectively, which generated $19,471,000 of net realized gains from such sales.
| International Growth and Income Fund | 23 |
Interfund lending — Pursuant to an exemptive order issued by the SEC, the fund, along with other CRMC-managed funds (or funds managed by certain affiliates of CRMC), may participate in an interfund lending program. The program provides an alternate credit facility that permits the funds to lend or borrow cash for temporary purposes directly to or from one another, subject to the conditions of the exemptive order. The fund did not lend or borrow cash through the interfund lending program at any time during the year ended June 30, 2023.
8. Indemnifications
The fund’s organizational documents provide board members and officers with indemnification against certain liabilities or expenses in connection with the performance of their duties to the fund. In the normal course of business, the fund may also enter into contracts that provide general indemnifications. The fund’s maximum exposure under these arrangements is unknown since it is dependent on future claims that may be made against the fund. The risk of material loss from such claims is considered remote. Insurance policies are also available to the fund’s board members and officers.
9. Capital share transactions
Capital share transactions in the fund were as follows (dollars and shares in thousands):
| Sales* | Reinvestments of distributions | Repurchases* | Net (decrease) increase | |||||||||||||||||||||||||||||
| Share class | Amount | Shares | Amount | Shares | Amount | Shares | Amount | Shares | ||||||||||||||||||||||||
| Year ended June 30, 2023 | ||||||||||||||||||||||||||||||||
| Class A | $ | 365,824 | 11,269 | $ | 168,715 | 5,411 | $ | (664,516 | ) | (20,980 | ) | $ | (129,977 | ) | (4,300 | ) | ||||||||||||||||
| Class C | 9,661 | 296 | 2,722 | 88 | (30,394 | ) | (944 | ) | (18,011 | ) | (560 | ) | ||||||||||||||||||||
| Class T | — | — | — | — | — | — | — | — | ||||||||||||||||||||||||
| Class F-1 | 37,126 | 1,124 | 5,128 | 164 | (55,877 | ) | (1,764 | ) | (13,623 | ) | (476 | ) | ||||||||||||||||||||
| Class F-2 | 575,606 | 17,806 | 104,216 | 3,345 | (819,340 | ) | (26,163 | ) | (139,518 | ) | (5,012 | ) | ||||||||||||||||||||
| Class F-3 | 623,078 | 19,713 | 114,273 | 3,662 | (711,986 | ) | (22,338 | ) | 25,365 | 1,037 | ||||||||||||||||||||||
| Class 529-A | 15,927 | 490 | 6,557 | 210 | (20,774 | ) | (641 | ) | 1,710 | 59 | ||||||||||||||||||||||
| Class 529-C | 1,100 | 34 | 189 | 6 | (2,341 | ) | (73 | ) | (1,052 | ) | (33 | ) | ||||||||||||||||||||
| Class 529-E | 578 | 17 | 161 | 5 | (653 | ) | (20 | ) | 86 | 2 | ||||||||||||||||||||||
| Class 529-T | — | — | 1 | — | † | — | — | 1 | — | † | ||||||||||||||||||||||
| Class 529-F-1 | — | — | — | † | — | † | — | — | — | † | — | † | ||||||||||||||||||||
| Class 529-F-2 | 7,927 | 245 | 1,422 | 46 | (7,013 | ) | (216 | ) | 2,336 | 75 | ||||||||||||||||||||||
| Class 529-F-3 | — | — | 1 | — | † | — | — | 1 | — | † | ||||||||||||||||||||||
| Class R-1 | 1,122 | 34 | 118 | 4 | (1,271 | ) | (39 | ) | (31 | ) | (1 | ) | ||||||||||||||||||||
| Class R-2 | 8,710 | 271 | 1,673 | 54 | (10,825 | ) | (338 | ) | (442 | ) | (13 | ) | ||||||||||||||||||||
| Class R-2E | 4,961 | 157 | 1,558 | 50 | (6,220 | ) | (195 | ) | 299 | 12 | ||||||||||||||||||||||
| Class R-3 | 17,212 | 534 | 3,435 | 110 | (18,319 | ) | (569 | ) | 2,328 | 75 | ||||||||||||||||||||||
| Class R-4 | 10,835 | 340 | 2,679 | 86 | (14,649 | ) | (456 | ) | (1,135 | ) | (30 | ) | ||||||||||||||||||||
| Class R-5E | 4,775 | 148 | 843 | 27 | (4,474 | ) | (141 | ) | 1,144 | 34 | ||||||||||||||||||||||
| Class R-5 | 3,138 | 96 | 966 | 31 | (6,791 | ) | (212 | ) | (2,687 | ) | (85 | ) | ||||||||||||||||||||
| Class R-6 | 864,968 | 26,999 | 190,674 | 6,102 | (475,373 | ) | (14,600 | ) | 580,269 | 18,501 | ||||||||||||||||||||||
| Total net increase (decrease) | $ | 2,552,548 | 79,573 | $ | 605,331 | 19,401 | $ | (2,850,816 | ) | (89,689 | ) | $ | 307,063 | 9,285 | ||||||||||||||||||
Refer to the end of the table for footnotes.
| 24 | International Growth and Income Fund |
| Sales* | Reinvestments of distributions | Repurchases* | Net increase (decrease) | |||||||||||||||||||||||||||||
| Share class | Amount | Shares | Amount | Shares | Amount | Shares | Amount | Shares | ||||||||||||||||||||||||
| Year ended June 30, 2022 | ||||||||||||||||||||||||||||||||
| Class A | $ | 451,225 | 11,819 | $ | 325,678 | 8,660 | $ | (649,172 | ) | (17,216 | ) | $ | 127,731 | 3,263 | ||||||||||||||||||
| Class C | 11,457 | 298 | 7,116 | 188 | (39,197 | ) | (1,041 | ) | (20,624 | ) | (555 | ) | ||||||||||||||||||||
| Class T | — | — | — | — | — | — | — | — | ||||||||||||||||||||||||
| Class F-1 | 27,535 | 711 | 12,841 | 340 | (82,900 | ) | (2,231 | ) | (42,524 | ) | (1,180 | ) | ||||||||||||||||||||
| Class F-2 | 717,911 | 18,968 | 199,065 | 5,302 | (696,998 | ) | (18,860 | ) | 219,978 | 5,410 | ||||||||||||||||||||||
| Class F-3 | 632,994 | 16,625 | 241,491 | 6,411 | (1,507,257 | ) | (40,347 | ) | (632,772 | ) | (17,311 | ) | ||||||||||||||||||||
| Class 529-A | 18,192 | 475 | 12,124 | 323 | (22,901 | ) | (596 | ) | 7,415 | 202 | ||||||||||||||||||||||
| Class 529-C | 1,257 | 33 | 480 | 13 | (3,865 | ) | (100 | ) | (2,128 | ) | (54 | ) | ||||||||||||||||||||
| Class 529-E | 564 | 14 | 322 | 9 | (1,244 | ) | (32 | ) | (358 | ) | (9 | ) | ||||||||||||||||||||
| Class 529-T | — | — | 1 | — | † | — | — | 1 | — | † | ||||||||||||||||||||||
| Class 529-F-1 | — | — | 1 | — | † | — | — | 1 | — | † | ||||||||||||||||||||||
| Class 529-F-2 | 8,260 | 216 | 2,305 | 62 | (5,690 | ) | (146 | ) | 4,875 | 132 | ||||||||||||||||||||||
| Class 529-F-3 | — | — | 1 | — | † | — | — | 1 | — | † | ||||||||||||||||||||||
| Class R-1 | 1,126 | 32 | 186 | 5 | (562 | ) | (15 | ) | 750 | 22 | ||||||||||||||||||||||
| Class R-2 | 10,744 | 285 | 3,331 | 88 | (14,642 | ) | (380 | ) | (567 | ) | (7 | ) | ||||||||||||||||||||
| Class R-2E | 8,013 | 210 | 2,947 | 79 | (6,637 | ) | (178 | ) | 4,323 | 111 | ||||||||||||||||||||||
| Class R-3 | 23,087 | 603 | 6,311 | 168 | (23,912 | ) | (630 | ) | 5,486 | 141 | ||||||||||||||||||||||
| Class R-4 | 12,867 | 337 | 5,133 | 136 | (21,041 | ) | (553 | ) | (3,041 | ) | (80 | ) | ||||||||||||||||||||
| Class R-5E | 5,517 | 143 | 1,373 | 37 | (2,321 | ) | (61 | ) | 4,569 | 119 | ||||||||||||||||||||||
| Class R-5 | 6,897 | 179 | 2,863 | 75 | (26,976 | ) | (760 | ) | (17,216 | ) | (506 | ) | ||||||||||||||||||||
| Class R-6 | 1,469,499 | 37,587 | 283,033 | 7,572 | (651,682 | ) | (16,139 | ) | 1,100,850 | 29,020 | ||||||||||||||||||||||
| Total net increase (decrease) | $ | 3,407,145 | 88,535 | $ | 1,106,602 | 29,468 | $ | (3,756,997 | ) | (99,285 | ) | $ | 756,750 | 18,718 | ||||||||||||||||||
| * | Includes exchanges between share classes of the fund. |
| † | Amount less than one thousand. |
10. Investment transactions
The fund engaged in purchases and sales of investment securities, excluding short-term securities and U.S. government obligations, if any, of $4,328,740,000 and $3,973,146,000, respectively, during the year ended June 30, 2023.
| International Growth and Income Fund | 25 |
Financial highlights
| Income (loss) from investment operations1 | Dividends and distributions | |||||||||||||||||||||||||||||||||||||||||||||||||||
| Year ended | Net asset value, beginning of year | Net investment income | Net gains (losses) on securities (both realized and unrealized) | Total from investment operations | Dividends (from net investment income) | Distributions (from capital gains) | Total dividends and distributions | Net asset value, end of year | Total return2,3 | Net assets, end of year (in millions) | Ratio of expenses to average net assets before reimburse- ments4 | Ratio of expenses to average net assets after reimburse- ments3,4 | Ratio of net income to average net assets3 | |||||||||||||||||||||||||||||||||||||||
| Class A: | ||||||||||||||||||||||||||||||||||||||||||||||||||||
| 6/30/2023 | $ | 31.34 | $ | .82 | $ | 3.76 | $ | 4.58 | $ | (1.01 | ) | $ | (.37 | ) | $ | (1.38 | ) | $ | 34.54 | 15.11 | % | $ | 4,331 | .92 | % | .92 | % | 2.53 | % | |||||||||||||||||||||||
| 6/30/2022 | 41.57 | 1.06 | (8.66 | ) | (7.60 | ) | (.90 | ) | (1.73 | ) | (2.63 | ) | 31.34 | (19.24 | ) | 4,065 | .90 | .90 | 2.77 | |||||||||||||||||||||||||||||||||
| 6/30/2021 | 30.76 | .79 | 10.81 | 11.60 | (.79 | ) | — | (.79 | ) | 41.57 | 37.93 | 5,256 | .91 | .91 | 2.13 | |||||||||||||||||||||||||||||||||||||
| 6/30/2020 | 33.23 | .58 | (2.43 | ) | (1.85 | ) | (.62 | ) | — | (.62 | ) | 30.76 | (5.56 | ) | 3,999 | .92 | .92 | 1.80 | ||||||||||||||||||||||||||||||||||
| 6/30/2019 | 33.25 | .77 | (.02 | ) | .75 | (.77 | ) | — | (.77 | ) | 33.23 | 2.34 | 4,728 | .91 | .91 | 2.41 | ||||||||||||||||||||||||||||||||||||
| Class C: | ||||||||||||||||||||||||||||||||||||||||||||||||||||
| 6/30/2023 | 31.30 | .55 | 3.79 | 4.34 | (.76 | ) | (.37 | ) | (1.13 | ) | 34.51 | 14.26 | 77 | 1.66 | 1.66 | 1.72 | ||||||||||||||||||||||||||||||||||||
| 6/30/2022 | 41.51 | .74 | (8.61 | ) | (7.87 | ) | (.61 | ) | (1.73 | ) | (2.34 | ) | 31.30 | (19.85 | ) | 88 | 1.64 | 1.64 | 1.92 | |||||||||||||||||||||||||||||||||
| 6/30/2021 | 30.71 | .50 | 10.81 | 11.31 | (.51 | ) | — | (.51 | ) | 41.51 | 36.93 | 139 | 1.66 | 1.66 | 1.36 | |||||||||||||||||||||||||||||||||||||
| 6/30/2020 | 33.16 | .34 | (2.42 | ) | (2.08 | ) | (.37 | ) | — | (.37 | ) | 30.71 | (6.29 | ) | 146 | 1.66 | 1.66 | 1.06 | ||||||||||||||||||||||||||||||||||
| 6/30/2019 | 33.16 | .50 | .02 | .52 | (.52 | ) | — | (.52 | ) | 33.16 | 1.59 | 205 | 1.69 | 1.69 | 1.58 | |||||||||||||||||||||||||||||||||||||
| Class T: | ||||||||||||||||||||||||||||||||||||||||||||||||||||
| 6/30/2023 | 31.32 | .90 | 3.76 | 4.66 | (1.09 | ) | (.37 | ) | (1.46 | ) | 34.52 | 15.43 | 5 | — | 6 | .66 | 5 | .66 | 5 | 2.79 | 5 | |||||||||||||||||||||||||||||||
| 6/30/2022 | 41.56 | 1.16 | (8.67 | ) | (7.51 | ) | (1.00 | ) | (1.73 | ) | (2.73 | ) | 31.32 | (19.04 | )5 | — | 6 | .64 | 5 | .64 | 5 | 3.02 | 5 | |||||||||||||||||||||||||||||
| 6/30/2021 | 30.75 | .89 | 10.81 | 11.70 | (.89 | ) | — | (.89 | ) | 41.56 | 38.29 | 5 | — | 6 | .65 | 5 | .65 | 5 | 2.38 | 5 | ||||||||||||||||||||||||||||||||
| 6/30/2020 | 33.23 | .67 | (2.44 | ) | (1.77 | ) | (.71 | ) | — | (.71 | ) | 30.75 | (5.33 | )5 | — | 6 | .66 | 5 | .66 | 5 | 2.07 | 5 | ||||||||||||||||||||||||||||||
| 6/30/2019 | 33.24 | .85 | (.01 | ) | .84 | (.85 | ) | — | (.85 | ) | 33.23 | 2.61 | 5 | — | 6 | .67 | 5 | .67 | 5 | 2.66 | 5 | |||||||||||||||||||||||||||||||
| Class F-1: | ||||||||||||||||||||||||||||||||||||||||||||||||||||
| 6/30/2023 | 31.39 | .82 | 3.76 | 4.58 | (1.00 | ) | (.37 | ) | (1.37 | ) | 34.60 | 15.12 | 137 | .93 | .93 | 2.53 | ||||||||||||||||||||||||||||||||||||
| 6/30/2022 | 41.62 | 1.02 | (8.63 | ) | (7.61 | ) | (.89 | ) | (1.73 | ) | (2.62 | ) | 31.39 | (19.26 | ) | 139 | .92 | .92 | 2.67 | |||||||||||||||||||||||||||||||||
| 6/30/2021 | 30.80 | .77 | 10.84 | 11.61 | (.79 | ) | — | (.79 | ) | 41.62 | 37.89 | 234 | .92 | .92 | 2.07 | |||||||||||||||||||||||||||||||||||||
| 6/30/2020 | 33.27 | .59 | (2.44 | ) | (1.85 | ) | (.62 | ) | — | (.62 | ) | 30.80 | (5.55 | ) | 201 | .92 | .92 | 1.81 | ||||||||||||||||||||||||||||||||||
| 6/30/2019 | 33.29 | .76 | (.02 | ) | .74 | (.76 | ) | — | (.76 | ) | 33.27 | 2.29 | 207 | .95 | .95 | 2.36 | ||||||||||||||||||||||||||||||||||||
| Class F-2: | ||||||||||||||||||||||||||||||||||||||||||||||||||||
| 6/30/2023 | 31.35 | .90 | 3.76 | 4.66 | (1.09 | ) | (.37 | ) | (1.46 | ) | 34.55 | 15.45 | 2,552 | .65 | .65 | 2.80 | ||||||||||||||||||||||||||||||||||||
| 6/30/2022 | 41.58 | 1.17 | (8.67 | ) | (7.50 | ) | (1.00 | ) | (1.73 | ) | (2.73 | ) | 31.35 | (19.04 | ) | 2,473 | .64 | .64 | 3.06 | |||||||||||||||||||||||||||||||||
| 6/30/2021 | 30.77 | .88 | 10.82 | 11.70 | (.89 | ) | — | (.89 | ) | 41.58 | 38.27 | 3,056 | .65 | .65 | 2.38 | |||||||||||||||||||||||||||||||||||||
| 6/30/2020 | 33.25 | .67 | (2.44 | ) | (1.77 | ) | (.71 | ) | — | (.71 | ) | 30.77 | (5.33 | ) | 2,455 | .66 | .66 | 2.06 | ||||||||||||||||||||||||||||||||||
| 6/30/2019 | 33.26 | .85 | (.01 | ) | .84 | (.85 | ) | — | (.85 | ) | 33.25 | 2.61 | 2,879 | .68 | .68 | 2.67 | ||||||||||||||||||||||||||||||||||||
| Class F-3: | ||||||||||||||||||||||||||||||||||||||||||||||||||||
| 6/30/2023 | 31.32 | .94 | 3.75 | 4.69 | (1.13 | ) | (.37 | ) | (1.50 | ) | 34.51 | 15.56 | 2,683 | .54 | .54 | 2.91 | ||||||||||||||||||||||||||||||||||||
| 6/30/2022 | 41.55 | 1.14 | (8.60 | ) | (7.46 | ) | (1.04 | ) | (1.73 | ) | (2.77 | ) | 31.32 | (18.97 | ) | 2,402 | .53 | .53 | 2.97 | |||||||||||||||||||||||||||||||||
| 6/30/2021 | 30.74 | .88 | 10.86 | 11.74 | (.93 | ) | — | (.93 | ) | 41.55 | 38.44 | 3,906 | .55 | .55 | 2.39 | |||||||||||||||||||||||||||||||||||||
| 6/30/2020 | 33.22 | .71 | (2.45 | ) | (1.74 | ) | (.74 | ) | — | (.74 | ) | 30.74 | (5.22 | ) | 3,554 | .55 | .55 | 2.20 | ||||||||||||||||||||||||||||||||||
| 6/30/2019 | 33.23 | .88 | (.01 | ) | .87 | (.88 | ) | — | (.88 | ) | 33.22 | 2.71 | 2,617 | .58 | .58 | 2.77 | ||||||||||||||||||||||||||||||||||||
| Class 529-A: | ||||||||||||||||||||||||||||||||||||||||||||||||||||
| 6/30/2023 | 31.29 | .81 | 3.75 | 4.56 | (.99 | ) | (.37 | ) | (1.36 | ) | 34.49 | 15.09 | 169 | .95 | .95 | 2.51 | ||||||||||||||||||||||||||||||||||||
| 6/30/2022 | 41.52 | 1.05 | (8.65 | ) | (7.60 | ) | (.90 | ) | (1.73 | ) | (2.63 | ) | 31.29 | (19.27 | ) | 151 | .92 | .92 | 2.76 | |||||||||||||||||||||||||||||||||
| 6/30/2021 | 30.72 | .78 | 10.80 | 11.58 | (.78 | ) | — | (.78 | ) | 41.52 | 37.91 | 192 | .94 | .94 | 2.10 | |||||||||||||||||||||||||||||||||||||
| 6/30/2020 | 33.19 | .58 | (2.44 | ) | (1.86 | ) | (.61 | ) | — | (.61 | ) | 30.72 | (5.59 | ) | 133 | .95 | .95 | 1.78 | ||||||||||||||||||||||||||||||||||
| 6/30/2019 | 33.20 | .75 | (.01 | ) | .74 | (.75 | ) | — | (.75 | ) | 33.19 | 2.30 | 148 | .97 | .97 | 2.36 | ||||||||||||||||||||||||||||||||||||
Refer to the end of the table for footnotes.
| 26 | International Growth and Income Fund |
Financial highlights (continued)
| Income (loss) from investment operations1 | Dividends and distributions | |||||||||||||||||||||||||||||||||||||||||||||||||||
| Year ended | Net asset value, beginning of year | Net investment income | Net gains (losses) on securities (both realized and unrealized) | Total from investment operations | Dividends (from net investment income) | Distributions (from capital gains) | Total dividends and distributions | Net asset value, end of year | Total return2,3 | Net assets, end of year (in millions) | Ratio of expenses to average net assets before reimburse- ments4 | Ratio of expenses to average net assets after reimburse- ments3,4 | Ratio of net income to average net assets3 | |||||||||||||||||||||||||||||||||||||||
| Class 529-C: | ||||||||||||||||||||||||||||||||||||||||||||||||||||
| 6/30/2023 | $ | 31.18 | $ | .54 | $ | 3.76 | $ | 4.30 | $ | (.74 | ) | $ | (.37 | ) | $ | (1.11 | ) | $ | 34.37 | 14.19 | % | $ | 6 | 1.72 | % | 1.72 | % | 1.68 | % | |||||||||||||||||||||||
| 6/30/2022 | 41.35 | .72 | (8.57 | ) | (7.85 | ) | (.59 | ) | (1.73 | ) | (2.32 | ) | 31.18 | (19.88 | ) | 6 | 1.69 | 1.69 | 1.87 | |||||||||||||||||||||||||||||||||
| 6/30/2021 | 30.59 | .52 | 10.73 | 11.25 | (.49 | ) | — | (.49 | ) | 41.35 | 36.86 | 10 | 1.69 | 1.69 | 1.41 | |||||||||||||||||||||||||||||||||||||
| 6/30/2020 | 33.03 | .33 | (2.41 | ) | (2.08 | ) | (.36 | ) | — | (.36 | ) | 30.59 | (6.30 | ) | 20 | 1.69 | 1.69 | 1.03 | ||||||||||||||||||||||||||||||||||
| 6/30/2019 | 33.05 | .49 | — | 7 | .49 | (.51 | ) | — | (.51 | ) | 33.03 | 1.51 | 26 | 1.73 | 1.73 | 1.55 | ||||||||||||||||||||||||||||||||||||
| Class 529-E: | ||||||||||||||||||||||||||||||||||||||||||||||||||||
| 6/30/2023 | 31.31 | .75 | 3.74 | 4.49 | (.93 | ) | (.37 | ) | (1.30 | ) | 34.50 | 14.87 | 4 | 1.14 | 1.14 | 2.33 | ||||||||||||||||||||||||||||||||||||
| 6/30/2022 | 41.53 | .95 | (8.63 | ) | (7.68 | ) | (.81 | ) | (1.73 | ) | (2.54 | ) | 31.31 | (19.45 | ) | 4 | 1.13 | 1.13 | 2.49 | |||||||||||||||||||||||||||||||||
| 6/30/2021 | 30.73 | .70 | 10.81 | 11.51 | (.71 | ) | — | (.71 | ) | 41.53 | 37.62 | 6 | 1.14 | 1.14 | 1.88 | |||||||||||||||||||||||||||||||||||||
| 6/30/2020 | 33.19 | .51 | (2.42 | ) | (1.91 | ) | (.55 | ) | — | (.55 | ) | 30.73 | (5.76 | ) | 4 | 1.14 | 1.14 | 1.59 | ||||||||||||||||||||||||||||||||||
| 6/30/2019 | 33.21 | .69 | (.02 | ) | .67 | (.69 | ) | — | (.69 | ) | 33.19 | 2.07 | 5 | 1.17 | 1.17 | 2.17 | ||||||||||||||||||||||||||||||||||||
| Class 529-T: | ||||||||||||||||||||||||||||||||||||||||||||||||||||
| 6/30/2023 | 31.33 | .89 | 3.75 | 4.64 | (1.08 | ) | (.37 | ) | (1.45 | ) | 34.52 | 15.37 | 5 | — | 6 | .70 | 5 | .70 | 5 | 2.76 | 5 | |||||||||||||||||||||||||||||||
| 6/30/2022 | 41.56 | 1.14 | (8.66 | ) | (7.52 | ) | (.98 | ) | (1.73 | ) | (2.71 | ) | 31.33 | (19.09 | )5 | — | 6 | .69 | 5 | .69 | 5 | 3.00 | 5 | |||||||||||||||||||||||||||||
| 6/30/2021 | 30.75 | .87 | 10.81 | 11.68 | (.87 | ) | — | (.87 | ) | 41.56 | 38.22 | 5 | — | 6 | .71 | 5 | .71 | 5 | 2.33 | 5 | ||||||||||||||||||||||||||||||||
| 6/30/2020 | 33.23 | .65 | (2.44 | ) | (1.79 | ) | (.69 | ) | — | (.69 | ) | 30.75 | (5.39 | )5 | — | 6 | .71 | 5 | .71 | 5 | 2.01 | 5 | ||||||||||||||||||||||||||||||
| 6/30/2019 | 33.24 | .83 | (.01 | ) | .82 | (.83 | ) | — | (.83 | ) | 33.23 | 2.54 | 5 | — | 6 | .74 | 5 | .74 | 5 | 2.59 | 5 | |||||||||||||||||||||||||||||||
| Class 529-F-1: | ||||||||||||||||||||||||||||||||||||||||||||||||||||
| 6/30/2023 | 31.33 | .88 | 3.74 | 4.62 | (1.06 | ) | (.37 | ) | (1.43 | ) | 34.52 | 15.28 | 5 | — | 6 | .75 | 5 | .75 | 5 | 2.71 | 5 | |||||||||||||||||||||||||||||||
| 6/30/2022 | 41.56 | 1.13 | (8.66 | ) | (7.53 | ) | (.97 | ) | (1.73 | ) | (2.70 | ) | 31.33 | (19.09 | )5 | — | 6 | .73 | 5 | .73 | 5 | 2.96 | 5 | |||||||||||||||||||||||||||||
| 6/30/2021 | 30.76 | .61 | 11.06 | 11.67 | (.87 | ) | — | (.87 | ) | 41.56 | 38.18 | 5 | — | 6 | .74 | 5 | .74 | 5 | 1.86 | 5 | ||||||||||||||||||||||||||||||||
| 6/30/2020 | 33.24 | .65 | (2.44 | ) | (1.79 | ) | (.69 | ) | — | (.69 | ) | 30.76 | (5.39 | ) | 22 | .72 | .72 | 2.02 | ||||||||||||||||||||||||||||||||||
| 6/30/2019 | 33.25 | .84 | (.02 | ) | .82 | (.83 | ) | — | (.83 | ) | 33.24 | 2.54 | 22 | .74 | .74 | 2.62 | ||||||||||||||||||||||||||||||||||||
| Class 529-F-2: | ||||||||||||||||||||||||||||||||||||||||||||||||||||
| 6/30/2023 | 31.33 | .91 | 3.76 | 4.67 | (1.10 | ) | (.37 | ) | (1.47 | ) | 34.53 | 15.45 | 35 | .64 | .64 | 2.82 | ||||||||||||||||||||||||||||||||||||
| 6/30/2022 | 41.57 | 1.18 | (8.69 | ) | (7.51 | ) | (1.00 | ) | (1.73 | ) | (2.73 | ) | 31.33 | (19.04 | ) | 29 | .64 | .64 | 3.10 | |||||||||||||||||||||||||||||||||
| 6/30/20218,9 | 31.30 | .69 | 10.28 | 10.97 | (.70 | ) | — | (.70 | ) | 41.57 | 35.12 | 10 | 33 | .66 | 11 | .66 | 11 | 2.60 | 11 | |||||||||||||||||||||||||||||||||
| Class 529-F-3: | ||||||||||||||||||||||||||||||||||||||||||||||||||||
| 6/30/2023 | 31.33 | .93 | 3.74 | 4.67 | (1.11 | ) | (.37 | ) | (1.48 | ) | 34.52 | 15.49 | — | 6 | .60 | .60 | 2.86 | |||||||||||||||||||||||||||||||||||
| 6/30/2022 | 41.56 | 1.18 | (8.66 | ) | (7.48 | ) | (1.02 | ) | (1.73 | ) | (2.75 | ) | 31.33 | (19.00 | ) | — | 6 | .59 | .59 | 3.10 | ||||||||||||||||||||||||||||||||
| 6/30/20218,9 | 31.30 | .69 | 10.29 | 10.98 | (.72 | ) | — | (.72 | ) | 41.56 | 35.17 | 10 | — | 6 | .66 | 11 | .59 | 11 | 2.64 | 11 | ||||||||||||||||||||||||||||||||
| Class R-1: | ||||||||||||||||||||||||||||||||||||||||||||||||||||
| 6/30/2023 | 31.27 | .58 | 3.75 | 4.33 | (.77 | ) | (.37 | ) | (1.14 | ) | 34.46 | 14.25 | 4 | 1.65 | 1.65 | 1.80 | ||||||||||||||||||||||||||||||||||||
| 6/30/2022 | 41.50 | .89 | (8.73 | ) | (7.84 | ) | (.66 | ) | (1.73 | ) | (2.39 | ) | 31.27 | (19.81 | ) | 3 | 1.59 | 1.59 | 2.36 | |||||||||||||||||||||||||||||||||
| 6/30/2021 | 30.71 | .53 | 10.79 | 11.32 | (.53 | ) | — | (.53 | ) | 41.50 | 36.99 | 5 | 4 | 1.60 | 5 | 1.60 | 5 | 1.43 | 5 | |||||||||||||||||||||||||||||||||
| 6/30/2020 | 33.16 | .36 | (2.42 | ) | (2.06 | ) | (.39 | ) | — | (.39 | ) | 30.71 | (6.24 | )5 | 3 | 1.63 | 5 | 1.63 | 5 | 1.11 | 5 | |||||||||||||||||||||||||||||||
| 6/30/2019 | 33.16 | .52 | .01 | .53 | (.53 | ) | — | (.53 | ) | 33.16 | 1.62 | 5 | 3 | 1.65 | 5 | 1.65 | 5 | 1.62 | 5 | |||||||||||||||||||||||||||||||||
Refer to the end of the table for footnotes.
| International Growth and Income Fund | 27 |
Financial highlights (continued)
| Income (loss) from investment operations1 | Dividends and distributions | |||||||||||||||||||||||||||||||||||||||||||||||||||
| Year ended | Net asset value, beginning of year | Net investment income | Net gains (losses) on securities (both realized and unrealized) | Total from investment operations | Dividends (from net investment income) | Distributions (from capital gains) | Total dividends and distributions | Net asset value, end of year | Total return2,3 | Net assets, end of year (in millions) | Ratio of expenses to average net assets before reimburse- ments4 | Ratio of expenses to average net assets after reimburse- ments3,4 | Ratio of net income to average net assets3 | |||||||||||||||||||||||||||||||||||||||
| Class R-2: | ||||||||||||||||||||||||||||||||||||||||||||||||||||
| 6/30/2023 | $ | 31.17 | $ | .59 | $ | 3.74 | $ | 4.33 | $ | (.78 | ) | $ | (.37 | ) | $ | (1.15 | ) | $ | 34.35 | 14.31 | % | $ | 50 | 1.63 | % | 1.63 | % | 1.82 | % | |||||||||||||||||||||||
| 6/30/2022 | 41.36 | .78 | (8.62 | ) | (7.84 | ) | (.62 | ) | (1.73 | ) | (2.35 | ) | 31.17 | (19.85 | ) | 46 | 1.63 | 1.63 | 2.05 | |||||||||||||||||||||||||||||||||
| 6/30/2021 | 30.61 | .52 | 10.75 | 11.27 | (.52 | ) | — | (.52 | ) | 41.36 | 36.95 | 61 | 1.64 | 1.64 | 1.40 | |||||||||||||||||||||||||||||||||||||
| 6/30/2020 | 33.06 | .34 | (2.41 | ) | (2.07 | ) | (.38 | ) | — | (.38 | ) | 30.61 | (6.27 | ) | 47 | 1.66 | 1.66 | 1.07 | ||||||||||||||||||||||||||||||||||
| 6/30/2019 | 33.07 | .52 | — | 7 | .52 | (.53 | ) | — | (.53 | ) | 33.06 | 1.60 | 54 | 1.67 | 1.67 | 1.64 | ||||||||||||||||||||||||||||||||||||
| Class R-2E: | ||||||||||||||||||||||||||||||||||||||||||||||||||||
| 6/30/2023 | 31.16 | .68 | 3.73 | 4.41 | (.87 | ) | (.37 | ) | (1.24 | ) | 34.33 | 14.65 | 43 | 1.34 | 1.34 | 2.11 | ||||||||||||||||||||||||||||||||||||
| 6/30/2022 | 41.34 | .89 | (8.60 | ) | (7.71 | ) | (.74 | ) | (1.73 | ) | (2.47 | ) | 31.16 | (19.60 | ) | 39 | 1.34 | 1.34 | 2.35 | |||||||||||||||||||||||||||||||||
| 6/30/2021 | 30.60 | .63 | 10.75 | 11.38 | (.64 | ) | — | (.64 | ) | 41.34 | 37.33 | 47 | 1.34 | 1.34 | 1.70 | |||||||||||||||||||||||||||||||||||||
| 6/30/2020 | 33.09 | .51 | (2.48 | ) | (1.97 | ) | (.52 | ) | — | (.52 | ) | 30.60 | (5.95 | ) | 35 | 1.32 | 1.32 | 1.72 | ||||||||||||||||||||||||||||||||||
| 6/30/2019 | 33.12 | .67 | (.07 | ) | .60 | (.63 | ) | — | (.63 | ) | 33.09 | 1.85 | 5 | 1.39 | 1.39 | 2.09 | ||||||||||||||||||||||||||||||||||||
| Class R-3: | ||||||||||||||||||||||||||||||||||||||||||||||||||||
| 6/30/2023 | 31.27 | .73 | 3.75 | 4.48 | (.92 | ) | (.37 | ) | (1.29 | ) | 34.46 | 14.80 | 94 | 1.19 | 1.19 | 2.27 | ||||||||||||||||||||||||||||||||||||
| 6/30/2022 | 41.48 | .95 | (8.64 | ) | (7.69 | ) | (.79 | ) | (1.73 | ) | (2.52 | ) | 31.27 | (19.46 | ) | 82 | 1.18 | 1.18 | 2.51 | |||||||||||||||||||||||||||||||||
| 6/30/2021 | 30.70 | .68 | 10.79 | 11.47 | (.69 | ) | — | (.69 | ) | 41.48 | 37.52 | 104 | 1.19 | 1.19 | 1.84 | |||||||||||||||||||||||||||||||||||||
| 6/30/2020 | 33.17 | .50 | (2.44 | ) | (1.94 | ) | (.53 | ) | — | (.53 | ) | 30.70 | (5.84 | ) | 78 | 1.20 | 1.20 | 1.57 | ||||||||||||||||||||||||||||||||||
| 6/30/2019 | 33.18 | .67 | (.01 | ) | .66 | (.67 | ) | — | (.67 | ) | 33.17 | 2.04 | 66 | 1.23 | 1.23 | 2.09 | ||||||||||||||||||||||||||||||||||||
| Class R-4: | ||||||||||||||||||||||||||||||||||||||||||||||||||||
| 6/30/2023 | 31.32 | .83 | 3.76 | 4.59 | (1.02 | ) | (.37 | ) | (1.39 | ) | 34.52 | 15.16 | 66 | .89 | .89 | 2.56 | ||||||||||||||||||||||||||||||||||||
| 6/30/2022 | 41.55 | 1.05 | (8.64 | ) | (7.59 | ) | (.91 | ) | (1.73 | ) | (2.64 | ) | 31.32 | (19.24 | ) | 61 | .88 | .88 | 2.75 | |||||||||||||||||||||||||||||||||
| 6/30/2021 | 30.74 | .80 | 10.81 | 11.61 | (.80 | ) | — | (.80 | ) | 41.55 | 37.98 | 84 | .89 | .89 | 2.15 | |||||||||||||||||||||||||||||||||||||
| 6/30/2020 | 33.21 | .59 | (2.43 | ) | (1.84 | ) | (.63 | ) | — | (.63 | ) | 30.74 | (5.54 | ) | 63 | .90 | .90 | 1.84 | ||||||||||||||||||||||||||||||||||
| 6/30/2019 | 33.22 | .75 | — | 7 | .75 | (.76 | ) | — | (.76 | ) | 33.21 | 2.33 | 67 | .92 | .92 | 2.33 | ||||||||||||||||||||||||||||||||||||
| Class R-5E: | ||||||||||||||||||||||||||||||||||||||||||||||||||||
| 6/30/2023 | 31.29 | .90 | 3.74 | 4.64 | (1.08 | ) | (.37 | ) | (1.45 | ) | 34.48 | 15.37 | 21 | .69 | .69 | 2.77 | ||||||||||||||||||||||||||||||||||||
| 6/30/2022 | 41.52 | 1.17 | (8.68 | ) | (7.51 | ) | (.99 | ) | (1.73 | ) | (2.72 | ) | 31.29 | (19.07 | ) | 18 | .68 | .68 | 3.07 | |||||||||||||||||||||||||||||||||
| 6/30/2021 | 30.72 | .87 | 10.80 | 11.67 | (.87 | ) | — | (.87 | ) | 41.52 | 38.24 | 19 | .69 | .69 | 2.33 | |||||||||||||||||||||||||||||||||||||
| 6/30/2020 | 33.20 | .66 | (2.44 | ) | (1.78 | ) | (.70 | ) | — | (.70 | ) | 30.72 | (5.35 | ) | 14 | .69 | .69 | 2.07 | ||||||||||||||||||||||||||||||||||
| 6/30/2019 | 33.22 | .93 | (.11 | ) | .82 | (.84 | ) | — | (.84 | ) | 33.20 | 2.56 | 5 | .71 | .71 | 2.92 | ||||||||||||||||||||||||||||||||||||
| Class R-5: | ||||||||||||||||||||||||||||||||||||||||||||||||||||
| 6/30/2023 | 31.52 | .93 | 3.78 | 4.71 | (1.11 | ) | (.37 | ) | (1.48 | ) | 34.75 | 15.51 | 23 | .58 | .58 | 2.85 | ||||||||||||||||||||||||||||||||||||
| 6/30/2022 | 41.80 | 1.11 | (8.63 | ) | (7.52 | ) | (1.03 | ) | (1.73 | ) | (2.76 | ) | 31.52 | (18.97 | ) | 23 | .55 | .55 | 2.88 | |||||||||||||||||||||||||||||||||
| 6/30/2021 | 30.92 | .97 | 10.83 | 11.80 | (.92 | ) | — | (.92 | ) | 41.80 | 38.42 | 52 | .57 | .57 | 2.55 | |||||||||||||||||||||||||||||||||||||
| 6/30/2020 | 33.41 | .71 | (2.47 | ) | (1.76 | ) | (.73 | ) | — | (.73 | ) | 30.92 | (5.25 | ) | 32 | .58 | .58 | 2.20 | ||||||||||||||||||||||||||||||||||
| 6/30/2019 | 33.42 | .84 | .01 | .85 | (.86 | ) | — | (.86 | ) | 33.41 | 2.64 | 24 | .62 | .62 | 2.60 | |||||||||||||||||||||||||||||||||||||
| Class R-6: | ||||||||||||||||||||||||||||||||||||||||||||||||||||
| 6/30/2023 | 31.33 | .95 | 3.74 | 4.69 | (1.13 | ) | (.37 | ) | (1.50 | ) | 34.52 | 15.56 | 4,574 | .54 | .54 | 2.94 | ||||||||||||||||||||||||||||||||||||
| 6/30/2022 | 41.56 | 1.26 | (8.72 | ) | (7.46 | ) | (1.04 | ) | (1.73 | ) | (2.77 | ) | 31.33 | (18.96 | ) | 3,572 | .53 | .53 | 3.33 | |||||||||||||||||||||||||||||||||
| 6/30/2021 | 30.75 | .83 | 10.91 | 11.74 | (.93 | ) | — | (.93 | ) | 41.56 | 38.43 | 3,532 | .54 | .54 | 2.26 | |||||||||||||||||||||||||||||||||||||
| 6/30/2020 | 33.23 | .71 | (2.44 | ) | (1.73 | ) | (.75 | ) | — | (.75 | ) | 30.75 | (5.21 | ) | 5,016 | .54 | .54 | 2.21 | ||||||||||||||||||||||||||||||||||
| 6/30/2019 | 33.24 | .91 | (.04 | ) | .87 | (.88 | ) | — | (.88 | ) | 33.23 | 2.71 | 4,288 | .57 | .57 | 2.84 | ||||||||||||||||||||||||||||||||||||
Refer to the end of the table for footnotes.
| 28 | International Growth and Income Fund |
Financial highlights (continued)
| Year ended June 30, | ||||||||||||||||||||
| 2023 | 2022 | 2021 | 2020 | 2019 | ||||||||||||||||
| Portfolio turnover rate for all share classes12 | 31 | % | 34 | % | 23 | % | 35 | % | 35 | % | ||||||||||
| 1 | Based on average shares outstanding. |
| 2 | Total returns exclude any applicable sales charges, including contingent deferred sales charges. |
| 3 | This column reflects the impact, if any, of certain reimbursements from CRMC. During one of the years shown, CRMC reimbursed a portion of transfer agent services fees for Class 529-F-3 shares. |
| 4 | Ratios do not include expenses of any Central Funds. The fund indirectly bears its proportionate share of the expenses of any Central Funds. |
| 5 | All or a significant portion of assets in this class consisted of seed capital invested by CRMC and/or its affiliates. Fees for distribution services are not charged or accrued on these seed capital assets. If such fees were paid by the fund on seed capital assets, fund expenses would have been higher and net income and total return would have been lower. |
| 6 | Amount less than $1 million. |
| 7 | Amount less than $.01. |
| 8 | Based on operations for a period that is less than a full year. |
| 9 | Class 529-F-2 and 529-F-3 shares began investment operations on October 30, 2020. |
| 10 | Not annualized. |
| 11 | Annualized. |
| 12 | Rates do not include the fund’s portfolio activity with respect to any Central Funds. |
Refer to the notes to financial statements.
| International Growth and Income Fund | 29 |
Report of Independent Registered Public Accounting Firm
To the Shareholders and Board of Trustees of International Growth and Income Fund:
Opinion on the Financial Statements and Financial Highlights
We have audited the accompanying statement of assets and liabilities of International Growth and Income Fund (the “Fund”), including the investment portfolio, as of June 30, 2023, the related statement of operations for the year then ended, the statements of changes in net assets for each of the two years in the period then ended, the financial highlights for each of the five years in the period then ended, and the related notes. In our opinion, the financial statements and financial highlights present fairly, in all material respects, the financial position of the Fund as of June 30, 2023, and the results of its operations for the year then ended, the changes in its net assets for each of the two years in the period then ended, and the financial highlights for each of the five years in the period then ended, in conformity with accounting principles generally accepted in the United States of America.
Basis for Opinion
These financial statements and financial highlights are the responsibility of the Fund’s management. Our responsibility is to express an opinion on the Fund’s financial statements and financial highlights based on our audits. We are a public accounting firm registered with the Public Company Accounting Oversight Board (United States) (PCAOB) and are required to be independent with respect to the Fund in accordance with the U.S. federal securities laws and the applicable rules and regulations of the Securities and Exchange Commission and the PCAOB.
We conducted our audits in accordance with the standards of the PCAOB. Those standards require that we plan and perform the audit to obtain reasonable assurance about whether the financial statements and financial highlights are free of material misstatement, whether due to error or fraud. The Fund is not required to have, nor were we engaged to perform, an audit of its internal control over financial reporting. As part of our audits we are required to obtain an understanding of internal control over financial reporting but not for the purpose of expressing an opinion on the effectiveness of the Fund’s internal control over financial reporting. Accordingly, we express no such opinion.
Our audits included performing procedures to assess the risks of material misstatement of the financial statements and financial highlights, whether due to error or fraud, and performing procedures that respond to those risks. Such procedures included examining, on a test basis, evidence regarding the amounts and disclosures in the financial statements and financial highlights. Our audits also included evaluating the accounting principles used and significant estimates made by management, as well as evaluating the overall presentation of the financial statements and financial highlights. Our procedures included confirmation of securities owned as of June 30, 2023, by correspondence with the custodian and brokers; when replies were not received from brokers, we performed other auditing procedures. We believe that our audits provide a reasonable basis for our opinion.
Deloitte & Touche LLP
Costa Mesa, California
August 9, 2023
We have served as the auditor of one or more American Funds investment companies since 1956.
| 30 | International Growth and Income Fund |
| Expense example | unaudited |
As a fund shareholder, you incur two types of costs: (1) transaction costs, such as initial sales charges on purchase payments and contingent deferred sales charges on redemptions (loads), and (2) ongoing costs, including management fees, distribution and service (12b-1) fees, and other expenses. This example is intended to help you understand your ongoing costs (in dollars) of investing in the fund so you can compare these costs with the ongoing costs of investing in other mutual funds. The example is based on an investment of $1,000 invested at the beginning of the period and held for the entire six-month period (January 1, 2023, through June 30, 2023).
Actual expenses:
The first line of each share class in the table on the following page provides information about actual account values and actual expenses. You may use the information in this line, together with the amount you invested, to estimate the expenses that you paid over the period. Simply divide your account value by $1,000 (for example, an $8,600 account value divided by $1,000 = 8.6), then multiply the result by the number in the first line under the heading titled “Expenses paid during period” to estimate the expenses you paid on your account during this period.
Hypothetical example for comparison purposes:
The second line of each share class in the table on the following page provides information about hypothetical account values and hypothetical expenses based on the actual expense ratio for the share class and an assumed rate of return of 5.00% per year before expenses, which is not the actual return of the share class. The hypothetical account values and expenses may not be used to estimate the actual ending account balance or expenses you paid for the period. You may use this information to compare the ongoing costs of investing in the fund and other funds. To do so, compare this 5.00% hypothetical example with the 5.00% hypothetical examples that appear in the shareholder reports of the other funds.
Notes:
Retirement plan participants may be subject to certain fees charged by the plan sponsor, and Class F-1, F-2, F-3, 529-F-1, 529-F-2 and 529-F-3 shareholders may be subject to fees charged by financial intermediaries, typically ranging from 0.75% to 1.50% of assets annually depending on services offered. You can estimate the impact of these fees by adding the amount of the fees to the total estimated expenses you paid on your account during the period as calculated above. In addition, your ending account value would be lower by the amount of these fees.
Note that the expenses shown in the table on the following page are meant to highlight your ongoing costs only and do not reflect any transactional costs, such as sales charges (loads). Therefore, the second line of each share class in the table is useful in comparing ongoing costs only and will not help you determine the relative total costs of owning different funds. In addition, if these transactional costs were included, your costs would have been higher.
| International Growth and Income Fund | 31 |
Expense example (continued)
| Beginning account value 1/1/2023 | Ending account value 6/30/2023 | Expenses paid during period* | Annualized expense ratio | ||||||||||
| Class A – actual return | $ | 1,000.00 | $ | 1,099.89 | $ | 4.69 | .90 | % | |||||
| Class A – assumed 5% return | 1,000.00 | 1,020.33 | 4.51 | .90 | |||||||||
| Class C – actual return | 1,000.00 | 1,095.66 | 8.63 | 1.66 | |||||||||
| Class C – assumed 5% return | 1,000.00 | 1,016.56 | 8.30 | 1.66 | |||||||||
| Class T – actual return | 1,000.00 | 1,101.33 | 3.39 | .65 | |||||||||
| Class T – assumed 5% return | 1,000.00 | 1,021.57 | 3.26 | .65 | |||||||||
| Class F-1 – actual return | 1,000.00 | 1,100.07 | 4.74 | .91 | |||||||||
| Class F-1 – assumed 5% return | 1,000.00 | 1,020.28 | 4.56 | .91 | |||||||||
| Class F-2 – actual return | 1,000.00 | 1,101.70 | 3.34 | .64 | |||||||||
| Class F-2 – assumed 5% return | 1,000.00 | 1,021.62 | 3.21 | .64 | |||||||||
| Class F-3 – actual return | 1,000.00 | 1,102.04 | 2.76 | .53 | |||||||||
| Class F-3 – assumed 5% return | 1,000.00 | 1,022.17 | 2.66 | .53 | |||||||||
| Class 529-A – actual return | 1,000.00 | 1,099.85 | 4.89 | .94 | |||||||||
| Class 529-A – assumed 5% return | 1,000.00 | 1,020.13 | 4.71 | .94 | |||||||||
| Class 529-C – actual return | 1,000.00 | 1,095.61 | 8.89 | 1.71 | |||||||||
| Class 529-C – assumed 5% return | 1,000.00 | 1,016.31 | 8.55 | 1.71 | |||||||||
| Class 529-E – actual return | 1,000.00 | 1,098.79 | 5.93 | 1.14 | |||||||||
| Class 529-E – assumed 5% return | 1,000.00 | 1,019.14 | 5.71 | 1.14 | |||||||||
| Class 529-T – actual return | 1,000.00 | 1,101.19 | 3.54 | .68 | |||||||||
| Class 529-T – assumed 5% return | 1,000.00 | 1,021.42 | 3.41 | .68 | |||||||||
| Class 529-F-1 – actual return | 1,000.00 | 1,100.53 | 3.80 | .73 | |||||||||
| Class 529-F-1 – assumed 5% return | 1,000.00 | 1,021.17 | 3.66 | .73 | |||||||||
| Class 529-F-2 – actual return | 1,000.00 | 1,101.51 | 3.23 | .62 | |||||||||
| Class 529-F-2 – assumed 5% return | 1,000.00 | 1,021.72 | 3.11 | .62 | |||||||||
| Class 529-F-3 – actual return | 1,000.00 | 1,101.67 | 3.07 | .59 | |||||||||
| Class 529-F-3 – assumed 5% return | 1,000.00 | 1,021.87 | 2.96 | .59 | |||||||||
| Class R-1 – actual return | 1,000.00 | 1,095.79 | 8.57 | 1.65 | |||||||||
| Class R-1 – assumed 5% return | 1,000.00 | 1,016.61 | 8.25 | 1.65 | |||||||||
| Class R-2 – actual return | 1,000.00 | 1,096.28 | 8.42 | 1.62 | |||||||||
| Class R-2 – assumed 5% return | 1,000.00 | 1,016.76 | 8.10 | 1.62 | |||||||||
| Class R-2E – actual return | 1,000.00 | 1,097.56 | 6.92 | 1.33 | |||||||||
| Class R-2E – assumed 5% return | 1,000.00 | 1,018.20 | 6.66 | 1.33 | |||||||||
| Class R-3 – actual return | 1,000.00 | 1,098.69 | 6.14 | 1.18 | |||||||||
| Class R-3 – assumed 5% return | 1,000.00 | 1,018.94 | 5.91 | 1.18 | |||||||||
| Class R-4 – actual return | 1,000.00 | 1,100.08 | 4.58 | .88 | |||||||||
| Class R-4 – assumed 5% return | 1,000.00 | 1,020.43 | 4.41 | .88 | |||||||||
| Class R-5E – actual return | 1,000.00 | 1,100.98 | 3.54 | .68 | |||||||||
| Class R-5E – assumed 5% return | 1,000.00 | 1,021.42 | 3.41 | .68 | |||||||||
| Class R-5 – actual return | 1,000.00 | 1,101.71 | 3.02 | .58 | |||||||||
| Class R-5 – assumed 5% return | 1,000.00 | 1,021.92 | 2.91 | .58 | |||||||||
| Class R-6 – actual return | 1,000.00 | 1,102.02 | 2.76 | .53 | |||||||||
| Class R-6 – assumed 5% return | 1,000.00 | 1,022.17 | 2.66 | .53 | |||||||||
| * | The “expenses paid during period” are equal to the “annualized expense ratio,” multiplied by the average account value over the period, multiplied by the number of days in the period, and divided by 365 (to reflect the one-half year period). |
| 32 | International Growth and Income Fund |
| Tax information | unaudited |
We are required to advise you of the federal tax status of certain distributions received by shareholders during the fiscal year. The fund hereby designates the following amounts for the fund’s fiscal year ended June 30, 2023:
| Long-term capital gains | $155,043,000 |
| Foreign taxes | $0.06 per share |
| Foreign source income | $1.06 per share |
| Qualified dividend income | 100% |
| Section 163(j) interest dividends | $24,610,000 |
| Corporate dividends received deduction | $20,508,000 |
| U.S. government income that may be exempt from state taxation | $7,354,000 |
Individual shareholders should refer to their Form 1099 or other tax information, which will be mailed in January 2024, to determine the calendar year amounts to be included on their 2023 tax returns. Shareholders should consult their tax advisors.
| International Growth and Income Fund | 33 |
Board of trustees and other officers
Independent trustees1
| Name and year of birth | Year first elected a trustee of the fund2 | Principal occupation(s) during past five years | Number of portfolios in fund complex overseen by trustee3 | Other directorships4 held by trustee | ||||
| Gina F. Adams, 1958 | 2022 | Senior Vice President, Government and Regulatory Affairs, FedEx Corporation (transportation/logistics company) | 5 | Entergy Corporation | ||||
| Michael C. Camuñez, 1969 | 2019 | President and CEO, Monarch Global Strategies LLC; former Assistant Secretary of Commerce, U.S. Department of Commerce | 5 | Edison International/Southern California Edison | ||||
| Vanessa C. L. Chang, 1952 | 2012 | Former Director, EL & EL Investments (real estate) | 21 | Edison International/Southern California Edison; Transocean Ltd. (offshore drilling contractor) | ||||
| Nariman Farvardin, 1956 | 2022 | President, Stevens Institute of Technology | 93 | None | ||||
| William D. Jones, 1955 Chair of the Board (Independent and Non-Executive) | 2008 | Managing Member, CityLink LLC (investing and consulting); former President and CEO, CityLink Investment Corporation (acquires, develops and manages real estate ventures in urban communities) | 24 | None | ||||
| Sharon I. Meers, 1965 | 2021 | Co-Founder and COO, Midi Health, Inc. (a women’s telehealth company) | 7 | None | ||||
| Josette Sheeran, 1954 | 2019 | President and Director, Canoo Inc.; Trustee and former Executive Chair, The McCain Institute; former Professor of Practice, Arizona State University; President Emeritus and former CEO, Asia Society; former United Nations Special Envoy for Haiti | 8 | None | ||||
| Margaret Spellings, 1957 | 2012 | President and CEO, Texas 2036; former President, Margaret Spellings & Company (public policy and strategic consulting); former President, The University of North Carolina | 93 | None |
Interested trustee5,6
| Name, year of birth and position with fund | Year first elected a trustee or officer of the fund2 | Principal occupation(s) during past five years and positions held with affiliated entities or the principal underwriter of the fund | Number of portfolios in fund complex overseen by trustee3 | Other directorships4 held by trustee | ||||
| Hilda L. Applbaum, 1961 Trustee | 2019 | Partner — Capital World Investors, Capital Research and Management Company; Director, The Capital Group Companies, Inc.7 | 4 | None |
The fund’s statement of additional information includes further details about fund trustees and is available without charge upon request by calling American Funds Service Company at (800) 421-4225 or by referring to the Capital Group website at capitalgroup.com. The address for all trustees and officers of the fund is 333 South Hope Street, Los Angeles, CA 90071, Attention: Secretary.
Refer to page 36 for footnotes.
| 34 | International Growth and Income Fund |
| Other officers6 | ||||
| Name, year of birth and position with fund | Year first elected an officer of the fund2 | Principal occupation(s) during past five years and positions held with affiliated entities or the principal underwriter of the fund | ||
| Andrew B. Suzman, 1967 Co-President | 2008 | Partner — Capital World Investors, Capital Research and Management Company; Partner — Capital World Investors, Capital Bank and Trust Company7 | ||
| Steven T. Watson, 1955 Co-President | 2008 | Partner — Capital International Investors, Capital International, Inc.7; Director, Capital International, Inc.7 | ||
| Donald H. Rolfe, 1972 Principal Executive Officer | 2012 | Senior Vice President and Senior Counsel — Fund Business Management Group, Capital Research and Management Company; Secretary, Capital Research and Management Company | ||
| Michael W. Stockton, 1967 Executive Vice President | 2014 | Senior Vice President — Fund Business Management Group, Capital Research and Management Company | ||
| Michael Cohen, 1961 Senior Vice President | 2019 | Partner — Capital World Investors, Capital Bank and Trust Company7; Partner — Capital World Investors, Capital Research Company7; Chairman and Senior Vice President, Capital International Limited7 | ||
| Patrice Collette, 1967 Senior Vice President | 2015 | Partner — Capital World Investors, Capital International, Inc.7 | ||
| Paul Flynn, 1966 Senior Vice President | 2020 | Partner — Capital World Investors, Capital International, Inc.7 | ||
| Leo Hee, 1971 Senior Vice President | 2019 | Partner — Capital World Investors, Capital Group Investment Management Pte. Ltd.7 | ||
| Jason B. Smith, 1972 Senior Vice President | 2015 | Partner — Capital World Investors, Capital Research and Management Company | ||
| Lisa Thompson, 1965 Senior Vice President | 2020 | Partner — Capital International Investors, Capital Research and Management Company | ||
| Courtney R. Taylor, 1975 Secretary | 2018 | Assistant Vice President — Fund Business Management Group, Capital Research and Management Company | ||
| Hong T. Le, 1978 Treasurer | 2016 | Vice President — Investment Operations, Capital Research and Management Company | ||
| Sandra Chuon, 1972 Assistant Treasurer | 2019 | Vice President — Investment Operations, Capital Research and Management Company | ||
| Brian C. Janssen, 1972 Assistant Treasurer | 2016 | Senior Vice President — Investment Operations, Capital Research and Management Company |
| 1 | The term independent trustee refers to a trustee who is not an “interested person” of the fund within the meaning of the Investment Company Act of 1940. |
| 2 | Trustees and officers of the fund serve until their resignation, removal or retirement. |
| 3 | Funds managed by Capital Research and Management Company or its affiliates. |
| 4 | This includes all directorships/trusteeships (other than those in the American Funds or other funds managed by Capital Research and Management Company or its affiliates) that are held by each trustee as a trustee or director of a public company or a registered investment company. |
| 5 | The term interested trustee refers to a trustee who is an “interested person” within the meaning of the Investment Company Act of 1940, on the basis of their affiliation with the fund’s investment adviser, Capital Research and Management Company, or affiliated entities (including the fund’s principal underwriter). |
| 6 | All of the trustees and/or officers listed, with the exception of Jason B. Smith, are officers and/or directors/trustees of one or more of the other funds for which Capital Research and Management Company serves as investment adviser. |
| 7 | Company affiliated with Capital Research and Management Company. |
| International Growth and Income Fund | 35 |
This page was intentionally left blank.
| 36 | International Growth and Income Fund |
Office of the fund
6455 Irvine Center Drive
Irvine, CA 92618-4518
Investment adviser
Capital Research and Management Company
333 South Hope Street
Los Angeles, CA 90071-1406
Transfer agent for shareholder accounts
American Funds Service Company
(Write to the address nearest you.)
P.O. Box 6007
Indianapolis, IN 46206-6007
P.O. Box 2280
Norfolk, VA 23501-2280
Custodian of assets
JPMorgan Chase Bank
270 Park Avenue
New York, NY 10017-2070
Counsel
Morgan, Lewis & Bockius LLP
One Federal Street
Boston, MA 02110-1726
Independent registered public accounting firm
Deloitte & Touche LLP
695 Town Center Drive
Suite 1000
Costa Mesa, CA 92626-7188
Principal underwriter
American Funds Distributors, Inc.
333 South Hope Street
Los Angeles, CA 90071-1406
Investors should carefully consider investment objectives, risks, charges and expenses. This and other important information is contained in the fund prospectus and summary prospectus, which can be obtained from your financial professional and should be read carefully before investing. You may also call American Funds Service Company (AFS) at (800) 421-4225 or refer to the Capital Group website at capitalgroup.com.
“American Funds Proxy Voting Procedures and Principles” — which describes how we vote proxies relating to portfolio securities — is available on our website or upon request by calling AFS. The fund files its proxy voting record with the U.S. Securities and Exchange Commission (SEC) for the 12 months ended June 30 by August 31. The proxy voting record is available free of charge on the SEC website at sec.gov and on our website.
International Growth and Income Fund files a complete list of its portfolio holdings with the SEC for the first and third quarters of each fiscal year on Form NPORT-P. The list of portfolio holdings is available free of charge on the SEC website and on our website.
This report is for the information of shareholders of International Growth and Income Fund, but it also may be used as sales literature when preceded or accompanied by the current prospectus or summary prospectus, which gives details about charges, expenses, investment objectives and operating policies of the fund. If used as sales material after September 30, 2023, this report must be accompanied by an American Funds statistical update for the most recently completed calendar quarter.
MSCI has not approved, reviewed or produced this report, makes no express or implied warranties or representations and is not liable whatsoever for any data in the report. You may not redistribute the MSCI data or use it as a basis for other indices or investment products.
American Funds Distributors, Inc.
The Capital Advantage®
Since 1931, Capital Group, home of American Funds, has helped investors pursue long-term investment success. Our consistent approach — in combination with The Capital SystemTM — has resulted in superior outcomes.
| Aligned with investor success | |
| We base our decisions on a long-term perspective, which we believe aligns our goals with the interests of our clients. Our portfolio managers average 28 years of investment industry experience, including 22 years at our company, reflecting a career commitment to our long-term approach.1 | |
| The Capital System | |
| The Capital System combines individual accountability with teamwork. Funds using The Capital System are divided into portions that are managed independently by investment professionals with diverse backgrounds, ages and investment approaches. An extensive global research effort is the backbone of our system. | |
| American Funds’ superior outcomes | |
| Equity-focused funds have beaten their Lipper peer indexes in 90% of 10-year periods and 99% of 20-year periods.2 Relative to their peers, our fixed income funds have helped investors achieve better diversification through attention to correlation between bonds and equities.3 Fund management fees have been among the lowest in the industry.4 |
| 1 | Investment industry experience as of December 31, 2022. | |
| 2 | Based on Class F-2 share results for rolling monthly 10- and 20-year periods starting with the first 10- or 20-year period after each mutual fund’s inception through December 31, 2022. Periods covered are the shorter of the fund’s lifetime or since the comparable Lipper index inception date (except Capital Income Builder and SMALLCAP World Fund, for which the Lipper average was used). Expenses differ for each share class, so results will vary. Past results are not predictive of results in future periods. | |
| 3 | Based on Class F-2 share results as of December 31, 2022. Sixteen of the 18 fixed income American Funds that have been in existence for the three-year period showed a three-year correlation lower than their respective Morningstar peer group averages. S&P 500 Index was used as an equity market proxy. Correlation based on monthly total returns. Correlation is a statistical measure of how two securities move in relation to each other. A correlation ranges from –1 to 1. | |
| A positive correlation close to 1 implies that as one security moves, either up or down, the other security will move in “lockstep,” in the same direction. A negative correlation close to –1 indicates that the securities have moved in the opposite direction. | ||
| 4 | On average, our mutual fund management fees were in the lowest quintile 62% of the time, based on the 20-year period ended December 31, 2022, versus comparable Lipper categories, excluding funds of funds. |
Class F-2 shares were first offered on August 1, 2008. Class F-2 share results prior to the date of first sale are hypothetical based on the results of the original share class of the fund without a sales charge, adjusted for typical estimated expenses. Results for certain funds with an inception date after August 1, 2008, also include hypothetical returns because those funds’ Class F-2 shares sold after the funds’ date of first offering. Refer to capitalgroup.com for more information on specific expense adjustments and the actual dates of first sale.
All Capital Group trademarks mentioned are owned by The Capital Group Companies, Inc., an affiliated company or fund. All other company and product names mentioned are the property of their respective companies.

ITEM 2 – Code of Ethics
The Registrant has adopted a Code of Ethics that applies to its Principal Executive Officer and Principal Financial Officer. The Registrant undertakes to provide to any person without charge, upon request, a copy of the Code of Ethics. Such request can be made by calling 800/421-4225 or to the Secretary of the Registrant, 6455 Irvine Center Drive, Irvine, California 92618.
ITEM 3 – Audit Committee Financial Expert
The Registrant’s board has determined that Sharon I. Meers, a member of the Registrant’s audit committee, is an “audit committee financial expert” and "independent," as such terms are defined in this Item. This designation will not increase the designee’s duties, obligations or liability as compared to his or her duties, obligations and liability as a member of the audit committee and of the board, nor will it reduce the responsibility of the other audit committee members. There may be other individuals who, through education or experience, would qualify as "audit committee financial experts" if the board had designated them as such. Most importantly, the board believes each member of the audit committee contributes significantly to the effective oversight of the Registrant’s financial statements and condition.
ITEM 4 – Principal Accountant Fees and Services
| IGI | ||
| Registrant: | ||
| a) Audit Fees: | ||
| Audit | 2022 | 108,000 |
| 2023 | 107,000 | |
| b) Audit-Related Fees: | ||
| 2022 | 2,000 | |
| 2023 | 2,000 | |
| c) Tax Fees: | ||
| 2022 | 15,000 | |
| 2023 | 20,000 | |
| The tax fees consist of professional services relating to the preparation of the Registrant’s tax returns. | ||
| d) All Other Fees: | ||
| 2022 | None | |
| 2023 | None | |
| Adviser and affiliates (includes only fees for non-audit services billed to the adviser and affiliates for engagements that relate directly to the operations and financial reporting of the Registrant and were subject to the pre-approval policies described below): | ||
| a) Audit Fees: | ||
| Not Applicable | ||
| b) Audit-Related Fees: | ||
| 2022 | 1,644,000 | |
| 2023 | 2,153,000 | |
| The audit-related fees consist of assurance and related services relating to the examination of the Registrant’s transfer agent, principal underwriter and investment adviser conducted in accordance with Statement on Standards for Attestation Engagements Number 18 issued by the American Institute of Certified Public Accountants. | ||
| c) Tax Fees: |
| 2022 | - | |
| 2023 | 394,000 | |
| The tax fees consist of consulting services relating to the Registrant’s investments. | ||
| d) All Other Fees: | ||
| 2022 | None | |
| 2023 | None | |
| The other fees consist of subscription services related to an accounting research tool. | ||
| All audit and permissible non-audit services that the Registrant’s audit committee considers compatible with maintaining the independent registered public accounting firm’s independence are required to be pre-approved by the committee. The pre-approval requirement will extend to all non-audit services provided to the Registrant, the investment adviser, and any entity controlling, controlled by, or under common control with the investment adviser that provides ongoing services to the Registrant, if the engagement relates directly to the operations and financial reporting of the Registrant. The committee will not delegate its responsibility to pre-approve these services to the investment adviser. The committee may delegate to one or more committee members the authority to review and pre-approve audit and permissible non-audit services. Actions taken under any such delegation will be reported to the full committee at its next meeting. The pre-approval requirement is waived with respect to non-audit services if certain conditions are met. The pre-approval requirement was not waived for any of the non-audit services listed above provided to the Registrant, adviser and affiliates. | ||
| Aggregate non-audit fees paid to the Registrant’s auditors, including fees for all services billed to the Registrant, adviser and affiliates that provide ongoing services to the Registrant, were $1,662,000 for fiscal year 2022 and $2,570,000 for fiscal year 2023. The non-audit services represented by these amounts were brought to the attention of the committee and considered to be compatible with maintaining the auditors’ independence. |
ITEM 5 – Audit Committee of Listed Registrants
Not applicable to this Registrant, insofar as the Registrant is not a listed issuer as defined in Rule 10A-3 under the Securities Exchange Act of 1934.
ITEM 6 – Schedule of Investments
Not applicable, insofar as the schedule is included as part of the report to shareholders filed under Item 1 of this Form.
ITEM 7 – Disclosure of Proxy Voting Policies and Procedures for Closed-End Management Investment Companies
Not applicable to this Registrant, insofar as the Registrant is not a closed-end management investment company.
ITEM 8 – Portfolio Managers of Closed-End Management Investment Companies
Not applicable to this Registrant, insofar as the Registrant is not a closed-end management investment company.
ITEM 9 – Purchases of Equity Securities by Closed-End Management Investment Company and Affiliated Purchasers
Not applicable to this Registrant, insofar as the Registrant is not a closed-end management investment company.
ITEM 10 – Submission of Matters to a Vote of Security Holders
There have been no material changes to the procedures by which shareholders may recommend nominees to the Registrant’s board of trustees since the Registrant last submitted a proxy statement to its shareholders. The procedures are as follows. The Registrant has a nominating and governance committee comprised solely of persons who are not considered ‘‘interested persons’’ of the Registrant within the meaning of the Investment Company Act of 1940, as amended. The committee periodically reviews such issues as the board’s composition, responsibilities, committees, compensation and other relevant issues, and recommends any appropriate changes to the full board of trustees. While the committee normally is able to identify from its own resources an ample number of qualified candidates, it will consider shareholder suggestions of persons to be considered as nominees to fill future vacancies on the board. Such suggestions must be sent in writing to the nominating and governance committee of the Registrant, c/o the Registrant’s Secretary, and must be accompanied by complete biographical and occupational data on the prospective nominee, along with a written consent of the prospective nominee for consideration of his or her name by the nominating and governance committee.
ITEM 11 – Controls and Procedures
| (a) | The Registrant’s Principal Executive Officer and Principal Financial Officer have concluded, based on their evaluation of the Registrant’s disclosure controls and procedures (as such term is defined in Rule 30a-3 under the Investment Company Act of 1940), that such controls and procedures are adequate and reasonably designed to achieve the purposes described in paragraph (c) of such rule. |
| (b) | There were no changes in the Registrant’s internal controls over financial reporting (as defined in Rule 30a-3(d) under the Investment Company Act of 1940) that occurred during the Registrant’s semi-annual period covered by this report that has materially affected, or is reasonably likely to materially affect, the Registrant’s internal control over financial reporting.
|
ITEM 12 – Exhibits
| (a)(1) | The Code of Ethics that is the subject of the disclosure required by Item 2 is attached as an exhibit hereto. |
| (a)(2) | The certifications required by Rule 30a-2 of the Investment Company Act of 1940 and Sections 302 and 906 of the Sarbanes-Oxley Act of 2002 are attached as exhibits hereto. |
SIGNATURES
Pursuant to the requirements of the Securities Exchange Act of 1934 and the Investment Company Act of 1940, the Registrant has duly caused this report to be signed on its behalf by the undersigned, thereunto duly authorized.
| INTERNATIONAL GROWTH AND INCOME FUND | |
| By __/s/ Donald H. Rolfe________________ | |
Donald H. Rolfe, Principal Executive Officer | |
| Date: August 31, 2023 |
Pursuant to the requirements of the Securities Exchange Act of 1934 and the Investment Company Act of 1940, this report has been signed below by the following persons on behalf of the Registrant and in the capacities and on the dates indicated.
| By _ /s/ Donald H. Rolfe_____________ |
Donald H. Rolfe, Principal Executive Officer |
| Date: August 31, 2023 |
| By ___/s/ Hong T. Le__________________ |
Hong T. Le, Treasurer and Principal Financial Officer |
| Date: August 31, 2023 |