Exhibit 99.1
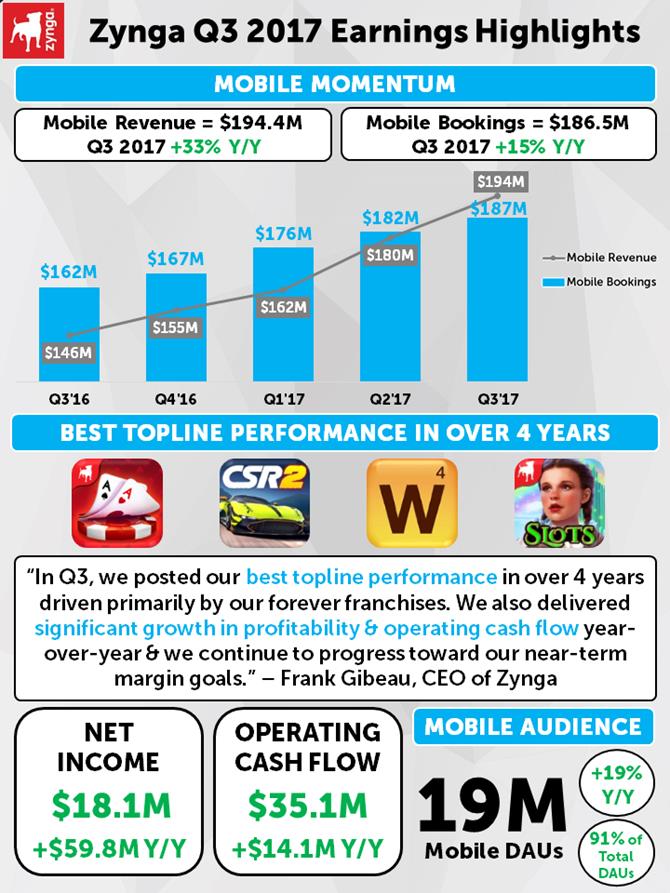
BEST TOPLINE PERFORMANCE IN OVER 4 YEARS Zynga Q3 2017 Earnings Highlights Mobile Revenue = $194.4M Q3 2017 +33% Y/Y Mobile Bookings = $186.5M Q3 2017 +15% Y/Y Mobile Momentum $162M $167M $176M $182M $187M $146M $155M $162M $180M $194M4M Q3'16 Q4'16 Q1'17 Q2'17 Q3'17 BEST TOPLINE PERFORMANCE IN OVER 4 YEARS OBILE “In Q3, we posted our best topline performance in over 4 years driven primarily by our forever franchises. We also delivered significant growth in profitability & operating cash flow year-over-year & we continue to progress toward our near-term margin goals.” – Frank Gibeau, CEO of Zynga 19M Mobile DAUs 91% of Total DAUs +19% Y/Y NET INCOME $18.1M +$59.8M Y/Y OPERATING CASH FLOW $35.1M +$14.1M Y/Y Mobile Revenue Mobile Bookings

ZYNGA – Q3 2017 QUARTERLY EARNINGS LETTER
November 7, 2017
Dear Shareholders,
We look forward to discussing our Q3 results during today’s earnings call at 2:30 p.m. PT. Below, you’ll find our quarterly letter which details our performance over the last quarter, progress in our turnaround, as well as our outlook for Q4 and key areas of focus for the remainder of 2017 and beyond. Please note that we manage our business based on topline measures including revenue, which is comprised of deferred revenue and bookings. Revenue and deferred revenue are both directly affected by bookings results, and management utilizes bookings as a primary topline measure to help inform their decisions.
HIGHLIGHTS
We continue to make strong progress in our turnaround, and in Q3, we delivered another quarter of growth across revenue and bookings, as well as a marked year-over-year improvement in profitability.
Highlights include:
| • | We delivered our best revenue and bookings performance in over four years. |
| • | This strong performance was driven primarily by our forever franchises, in particular Zynga Poker, Words With Friends and CSR2. |
| • | Mobile revenue in the quarter was up 33% year-over-year and mobile bookings were up 15% year-over-year. In Q3, mobile represented 87% of our total revenue and bookings. |
| • | Mobile audience for the quarter was 19 million average daily active users (DAUs), up 19% year-over-year. |
| • | GAAP operating expenses for the quarter were 62% of revenue – down from 91% of revenue in Q3 2016 – and non-GAAP operating expenses were 57% of bookings – down from 64% of bookings a year ago. |
| • | We delivered significant growth in profitability in the quarter – achieving net income of $18.1 million – as we continue to progress towards our near-term margin goals. |
| • | We generated operating cash flow of $35.1 million in the quarter, up $14.1 million year-over-year. |
| • | This week, we’ll launch Words With Friends 2 to global audiences. The new game builds on the 8-year history of this popular forever franchise with new features inspired by our players as well as a more modern look and feel. |
| • | Today, we’re announcing that we’ve entered into an agreement to acquire the mobile card game studio of Peak Games which – upon closing – will give Zynga the largest casual card game portfolio in the world when combined with Zynga Poker and Solitaire. |
EXECUTIVE SUMMARY
(in millions) | Q3'17
Actuals | | | Q3'16 Actuals | | | Variance $ (Y/Y) | | | Variance % (Y/Y) | | | Q3'17 Guidance | | | Variance $ (Guidance) | | | Variance % (Guidance) | |
Revenue | $ | | 224.6 | | | $ | | 182.4 | | | $ | | 42.2 | | | | 23 | % | | $ | | 210.0 | | | $ | | 14.6 | | | | 7 | % |
Net income (loss) | $ | | 18.1 | | | $ | | (41.7 | ) | | $ | | 59.8 | | | NM | | | $ | | 7.0 | | | $ | | 11.1 | | | NM | |
| | | | | | | | | | | | | | | | | | | | | | | | | | | | | | | | |
Bookings | $ | | 213.5 | | | $ | | 196.7 | | | $ | | 16.8 | | | | 9 | % | | $ | | 205.0 | | | $ | | 8.5 | | | | 4 | % |
Adjusted EBITDA | $ | | 44.6 | | | $ | | 3.6 | | | $ | | 41.0 | | | NM | | | $ | | 30.0 | | | $ | | 14.6 | | | | 49 | % |
| | | | | | | | | | | | | | | | | | | | | | | | | | | | | | | | |
Change in deferred revenue | $ | | (11.1 | ) | | $ | | 14.3 | | | $ | | (25.4 | ) | | NM | | | $ | | (5.0 | ) | | $ | | (6.1 | ) | | NM | |
In Q3, revenue was $224.6 million, above our guidance by $14.6 million and up 23% year-over-year. We achieved net income of $18.1 million, better than our guidance by $11.1 million and an improvement of $59.8 million year-over-year. Our teams delivered $213.5 million in bookings, beating our guidance by $8.5 million and up 9% year-over-year. This represents our best revenue and bookings performance in over four years. Our stronger than expected performance in the quarter was driven by our live services portfolio, particularly our forever franchises including Zynga Poker, CSR2 and Words With Friends. We had a net release of deferred revenue of $11.1 million versus our guidance of a net release of deferred revenue of $5.0 million. Our Adjusted EBITDA was $44.6 million, above our guidance by $14.6 million, and an increase of $41.0 million year-over-year. We delivered operating cash flow of $35.1 million, up $14.1 million year-over-year.
We’re seeing strong trends on the mobile front, achieving record mobile revenue and bookings, with revenue up 33% year-over-year and bookings up 15% year-over-year. Mobile revenue now represents 87% of total revenue, up from 80% a year ago, and mobile bookings represents 87% of our total bookings, up from 83% a year ago. Mobile online game – or user pay – revenue was up 44% year-over-year, and mobile user pay bookings were up 20% year-over-year – representing the strongest quarterly mobile user pay in Zynga’s history. Mobile audience for the quarter was 19 million average DAUs, up 19% year-over-year.
Our quarterly performance was anchored by the continued strength of our live services, particularly our forever franchises including Zynga Poker, CSR2 and Words With Friends. In Q3, Zynga Poker delivered its highest quarterly mobile performance in franchise history, with mobile revenue up 78% year-over-year and mobile bookings up 81% year-over-year. The game’s performance was driven by the team’s continued focus on innovating on two of Zynga Poker’s most popular features, Challenges and Leagues.
CSR2 had another great quarter with a compelling series of bold beats and exclusive events for players. CSR2 grew sequentially in Q3, with mobile revenue up 8% and mobile bookings up 12%. The performance was driven primarily by our latest Fast & Furious event in partnership with Universal Brand Development, which featured the Dodge Demon from the The Fate of the Furious film. The team also marked Ferrari’s 70th anniversary in CSR2 with six supercars developed exclusively by Ferrari for the occasion.
Words With Friends, which celebrated its 8th anniversary in Q3, delivered strong performance with mobile revenue up 9% and mobile bookings up 10% sequentially. This past quarter, we introduced a new bold beat in the game with the launch of the Words With Friends Social Dictionary, which added 50,000 new words to this popular mobile word game. Inspired by players and the latest pop culture phrases, the new dictionary introduced a timely way to play this iconic favorite. Since launch, the new words in our Social Dictionary have been played more than 33 million times.
We’ve made substantial progress in growing the company and have seen a marked year-over-year improvement in our profitability and operating cash flow. Year-to-date, we’ve grown our revenue and bookings by 14% driven primarily by our live services. In that same period, our GAAP operating expenses have declined by 8%, or $38.3 million, and our non-GAAP operating expenses have dropped by 1%, or $5.0 million; reflecting our focus on sharpening our operating model. This contributed to a year-to-date net income of $13.7 million, an improvement of $86.5 million year-over-year and cash flow from operations of $68.2 million, up $35.9 million or 111% compared to a year ago. We remain on track to deliver our improved margin goals by the end of 2018.
As we look forward to 2018 and beyond, we expect to grow Zynga in four ways.
First, we’ll continue to focus on growing our mobile live services through our innovative bold beat strategy. Zynga utilizes a unique combination of art and science to develop new content and features designed to increase long-term engagement and expand our audiences. We believe this commitment to growth in live services will provide a more predictable and recurring revenue stream for Zynga over the long-term. In any given year, the vast majority of revenue and bookings comes from our live services.
Second, we plan to build on our strong foundation of live services through new game introductions with the goal of creating new forever franchises. Our approach to development will combine strong game teams with new intellectual properties, reinvigorated Zynga brands or new strategic licenses designed to appeal to the global mobile audience. We’re taking a rigorous approach to how we’re developing new games with extensive consumer and soft launch testing to ensure that we’re engineering hits.
We’re excited to announce that this week, we’re launching Words With Friends 2 to global audiences. This is a new game that builds on the 8-year history of this popular franchise by adding some of the most requested features by our players. We’ve also enhanced the look and feel of this forever franchise that has become a daily part of millions of people’s lives around the world. We anticipate Words With Friends 2 will steadily ramp in the months following its launch and our team is planning an ambitious bold beat strategy to keep the game fresh and fun for players for years to come.
In addition, we’re actively developing new games in Action Strategy, Casual and Invest Express, and expect to launch new titles in some or all of these categories in the second half of 2018.
Third, we’re investing in new emerging gaming platforms on mobile like chat and augmented reality (AR). We believe chat platforms like Facebook Instant Games and Apple’s iMessage have the potential to reshape the accessibility and social nature of mobile gaming and are ideal for our social mission of “connecting the world through games.” With respect to AR, we’re excited by how it’s captured the imagination of gamers around the world. Apple’s ARKit and Google’s ARCore will allow the teams at Zynga to create innovative new augmented reality experiences. Later this month, we’ll be launching a bold beat in CSR2 that leverages Apple’s ARKit to bring player’s in-game car collections to life by blending virtual cars with real world environments.
Fourth, we intend to use the strength of our balance sheet and positive cash flow from operations to explore M&A opportunities that accelerate our genre leadership, drive audience growth and enhance value for shareholders. Our goal is to bring talented teams and proven franchises into Zynga that align with our strategic direction.
Today, we’re pleased to announce that we’ve entered into an agreement to acquire the mobile card game studio of Peak Games to strengthen our casual card game portfolio. This studio will add successful games such as Spades Plus and Gin Rummy Plus – the largest spade and rummy mobile games in the world – as well as popular local Turkish titles 101 Okey Plus and Okey Plus to our portfolio. We’re excited to welcome this talented, Istanbul-based development team to the Zynga family. Combined with the recent growth of Zynga Poker and our Solitaire titles, at closing, the addition of Peak Games’ mobile card games will give Zynga the world’s largest portfolio of casual card games. These games have broad, evergreen appeal to millions of people around the world and they build on our strategy to continue growing our card portfolio over the long-term. These additions will enhance our card-based audience – adding millions of DAU – and will be accretive to our near-term margin goals. The total consideration for the acquisition of Peak Games’ mobile card studio is $100 million in cash, and the transaction is expected to close in late Q4 2017 subject to customary closing conditions.
As we approach the end of the year, we’re happy with our turnaround progress but we still have more work to do. We’re excited about our growth potential and our ability to create shareholder value. We remain committed to achieving margins more in-line with our peers over the long-term.
Q3 PERFORMANCE OVERVIEW
Q3 Financial Highlights
| • | Revenue of $224.6 million; above our guidance and up 23% year-over-year |
| • | GAAP operating expenses of $138.7 million; down 16% year-over-year |
| • | Net income of $18.1 million; above our guidance and an improvement of $59.8 million year-over-year. |
| • | Net release of deferred revenue of $11.1 million; versus our guidance of a net release of deferred revenue of $5.0 million |
| • | Bookings of $213.5 million; above our guidance; up 9% year-over-year |
| • | Non-GAAP operating expenses of $121.3 million; down 4% year-over-year |
| • | Adjusted EBITDA of $44.6 million; above our guidance and an increase of $41.0 million year-over-year |
| • | Operating cash flow of $35.1 million; up $14.1 million year-over-year |
Q3 Mobile Highlights
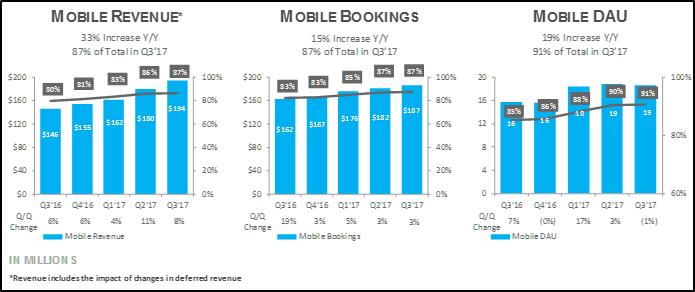
| • | Mobile revenue of $194.4 million; up 33% year-over-year |
| • | Mobile bookings of $186.5 million; up 15% year-over-year |
| • | Average mobile DAUs of 19 million; up 19% year-over-year |
| • | Mobile user pay revenue was up 44% year-over-year, and mobile user pay bookings were up 20% year-over-year |
Q3 Advertising Highlights
| • | Advertising revenue of $46.4 million and advertising bookings of $45.6 million were down 1% and 6% year-over-year, respectively |
| • | Sequentially, advertising revenue and bookings grew 4% and 5%, respectively, driven by positive seasonality on mobile and higher quality mix of advertising products |
| • | Advertising now represents 21% of both total revenue and bookings as compared to 26% of total revenue and 25% of total bookings a year ago |
| • | We continue to expect full year 2017 advertising to decline slightly year-over-year. This is primarily driven by web declines as well as softer pricing in the mobile gaming advertising market |
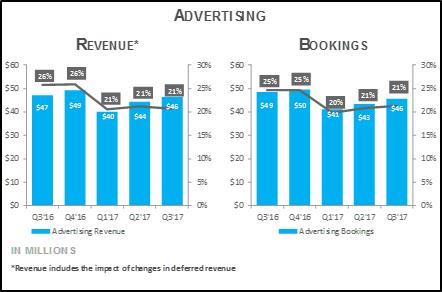
16 16 85% 18 19 19 86% 88% 90% 91% 60% 80% 100% 0 4 8 12 16 20 Q3'16 Q4'16 Q1'17 Q2'17 Q3'17 Millions Mobile DAU (1%) $162 $167 $176 $182 $187 83% 83% 85% 87% 87% 0% 20% 40% 60% 80% 100% $0 $40 $80 $120 $160 $200 Q3'16 Q4'16 Q1'17 Q2'17 Q3'17 Mobile Bookings 3% 15% Increase Y/Y 87% of Total in Q3’17 19% Increase Y/Y 91% of Total in Q3’17 Q/Q Change 19% 3% 5% 3% Q/Q Change 7% (0%) 17% 3% $146 $155 $162 $180 $194 80% 81% 83% 86% 87% 0% 20% 40% 60% 80% 100% $0 $40 $80 $120 $160 $200 Q3'16 Q4'16 Q1'17 Q2'17 Q3'17 Mobile Revenue 8% 33% Increase Y/Y 87% of Total in Q3’17 Q/Q Change 6% 6% 4% 11% *Revenue includes the impact of changes in deferred revenue MOBILE REVENUE* MOBILE BOOKINGS MOBILE DAU IN MILLIONS *Revenue includes the impact of changes in deferred revenue $49 $50 $41 $43 $46 25% 25% 20% 21% 21% 0% 5% 10% 15% 20% 25% 30% $0 $10 $20 $30 $40 $50 $60 Q3'16 Q4'16 Q1'17 Q2'17 Q3'17 Advertising Bookings $47 $49 $40 $44 $46 26% 26% 21% 21% 21% 0% 5% 10% 15% 20% 25% 30% $0 $10 $20 $30 $40 $50 $60 Q3'16 Q4'16 Q1'17 Q2'17 Q3'17 Advertising Revenue ADVERTISING REVENUE* BOOKINGS IN MILLIONS
Player Metrics (users and payers in millions)
| | Three Months Ended | | | | | | | | | |
| | September 30, | | | June 30, | | | September 30, | | | Q3'17 | | | Q3'17 | |
| | 2017 | | | 2017 | | | 2016 | | | Q/Q | | | Y/Y | |
Average daily active users (DAUs) (1) | | | 21 | | | | 21 | | | | 18 | | | | (2 | )% | | | 12 | % |
Average mobile DAUs (1) | | | 19 | | | | 19 | | | | 16 | | | | (1 | )% | | | 19 | % |
Average web DAUs (1) | | | 2 | | | | 2 | | | | 2 | | | | (11 | )% | | | (29 | )% |
| | | | | | | | | | | | | | | | | | | | |
Average monthly active user (MAUs) (1) | | | 80 | | | | 80 | | | | 66 | | | | 0 | % | | | 22 | % |
Average mobile MAUs (1) | | | 72 | | | | 71 | | | | 56 | | | | 1 | % | | | 30 | % |
Average web MAUs (1) | | | 8 | | | | 9 | | | | 10 | | | | (8 | )% | | | (19 | )% |
| | | | | | | | | | | | | | | | | | | | |
Average daily bookings per average DAU (ABPU) | | $ | 0.113 | | | $ | 0.109 | | | $ | 0.116 | | | | 3 | % | | | (3 | )% |
Average monthly unique users (MUUs) (2) | | | 51 | | | | 52 | | | | 57 | | | | (1 | )% | | | (10 | )% |
Average monthly unique payers (MUPs) (2) | | | 1.2 | | | | 1.2 | | | | 1.3 | | | | 1 | % | | | (6 | )% |
Payer conversion (2) | | | 2.4 | % | | | 2.3 | % | | | 2.3 | % | | | 2 | % | | | 5 | % |
| (1) | Daily Celebrity Crossword, our Solitaire games and our Facebook Messenger games are included incrementally in DAU and MAU because we do not have the third party network login data to link an individual who has played under multiple user accounts. As such, actual DAU and MAU may be lower than reported due to the potential duplication of these individuals. |
| (2) | For the three months ended September 30, 2017 and June 30, 2017, MUUs and MUPs exclude Daily Celebrity Crossword, our Solitaire games, and our Facebook Messenger games. For the three months ended September 30, 2016, MUUs and MUPs exclude Daily Celebrity Crossword and Vegas Diamond Slots. These games are excluded to avoid potential double counting of MUUs and MUPs as our systems are unable to distinguish whether a player of these games is also a player of the Company’s other games during the applicable time periods. |
FINANCIAL GUIDANCE
Q4 Guidance
| • | Net release of deferred revenue of $5 million |
| • | Bookings of $210 million |
| • | Net income of $13 million |
| • | Adjusted EBITDA of $35 million |
There are several factors to consider in our Q4 guidance as we continue to progress through our turnaround. On a year-over-year basis, we anticipate user pay and advertising both to grow, driven by our mobile live services. The sequential growth of advertising will be more than offset by declines in our web and older mobile games. In addition, Q3 also benefited from some one-time revenue and bookings related to the close out of our NaturalMotion third-party technology licensing business. We expect gross margins in Q4 to be in-line with our performance in Q3, and we expect our operating expenses to be down year-over-year in absolute and percentage terms. Our pending acquisition of the mobile card game studio of Peak Games is not included in our Q4 guidance.
OUR PRODUCTS
Social Casino
Zynga Poker – In Q3, we continued to deliver a strong performance from our 10-year forever franchise, Zynga Poker. The team achieved its highest quarterly mobile performance in franchise history, with mobile revenue up 78% year-over-year and mobile bookings up 81% year-over-year. This performance was due to the team’s continued focus on innovating on two of Zynga Poker’s most popular in-game features, Challenges and Leagues. The team is currently ramping its latest bold beat, Jackpots, which is designed to deliver players an experience that brings to life the thrill of an unexpected big win.
Social Slots – Within Slots, the team’s focus on increasing engagement and player monetization through innovative bold beats continues to be a top priority. While mobile revenue for our Social Slots franchise was down 2% and mobile bookings were flat sequentially, we saw an increase in monetization in our Social Slots portfolio. In Q3, we added an exclusive Hit It Rich! Slots Max Voltage lobby featuring beloved slots brands and content from Ainsworth Gaming Technology, a leader in real-world slots. In Wizard of Oz Slots, we launched the Yellow Brick Road social bold beat, which helped deliver monetization improvements on a sequential basis. Looking ahead, the team continues to develop a steady roadmap of bold beats across our Social Slots portfolio, in addition to creating a more connected VIP network across our products to better reward and retain our players over time.
Casual
Words With Friends – Words With Friends delivered a strong performance in Q3 with mobile revenue up 9% and mobile bookings up 10% sequentially. This past quarter, we introduced a new bold beat in the game with the launch of the Words With Friends Social Dictionary, which added 50,000 new words into this popular mobile word game. Inspired by players and the latest pop culture phrases, Social Dictionary introduced a timely new way to play this iconic favorite.
Over the last year, we’ve also been testing a new Words With Friends experience for fans of this forever franchise and this week, we’ll be launching a robust sequel, Words With Friends 2, to global audiences. The new game builds on the 8-year history of this popular franchise by adding the most in-demand features requested by our global players. We’ve also enhanced the look and feel of this forever franchise that has become a daily part of millions of people’s lives around the world. We anticipate that Words With Friends 2 will steadily ramp in the months following its launch and our team is planning an ambitious bold beat strategy to keep the game fresh and fun for players for years to come.
Action Strategy
CSR2 – CSR2 had another strong quarter, anchored by a series of bold beats and exclusive events for players. CSR2 grew sequentially in Q3, with mobile revenue up 8% and mobile bookings up 12%. The performance was driven primarily by the latest Fast & Furious event in partnership with Universal Brand Development, which featured the Dodge Demon from The Fate of the Furious film. In Q3, the team also marked Ferrari’s 70th anniversary in CSR2 with six supercars developed exclusively by Ferrari for the celebration.
For the remainder of the year, the team is continuing to focus on delivering immersive experiences for our players, including an additional Fast & Furious event that will feature a new Siberia-themed racetrack based on the film and the introduction of relay races. We’re also continuing to explore innovative and engaging ways to entertain consumers on emerging gaming platforms, such as AR. Leveraging Apple’s ARKit, we’re excited to deliver CSR2 fans a brand-new way to bring their dream car collection off the mobile screen and virtually into their own driveway. CSR2’s AR mode will be available on iOS later this month.
Dawn of Titans – In Q3, the team focused on deepening the game’s elder play features, while also working to simplify the first-time user experience for new players. In Q4, we plan to introduce a new bold beat – The Throne War, formerly known as Alliance vs. Alliance – which creates stronger social interactions between players by amplifying their desire to collaborate and win as a team. We’re also adding to the strategic depth and breadth of the Titans in the game, to increase the unique value each Titan presents to players.
Invest Express
FarmVille: Tropic Escape – In Q3, we began the transition of FarmVille: Tropic Escape to our Zynga India studio. The team is executing against a seasonal event roadmap for the remainder of the year, including a recently launched Halloween bold beat. The team is also readying an event system – Cruise Ships – which will launch later this month. Cruise Ships delivers a new quest-based experience that enables players to further engage with FarmVille: Tropic Escape game characters, as well as other players in the game.
CLOSING
In summary, we’re proud of our strong performance in Q3 and we’re pleased with our turnaround progress. As we look forward to 2018 and beyond, we expect to grow the company in four ways. First, we’ll continue to focus on growing our mobile live services as a top priority, leveraging our competitive advantage of innovation through bold beats within our forever franchises. Second, we plan to further enhance our company’s growth potential with new game introductions including this week’s worldwide launch of Words With Friends 2. In addition, we’re actively developing new games in Action Strategy, Casual and Invest Express and expect to launch new titles in some or all of these categories in the second half of 2018. Third, we’re continuing to experiment with emerging new gaming platforms like chat and AR where we see opportunities to provide players with immersive, social experiences. Fourth, to accelerate these efforts, we expect to use the strength of our balance sheet and positive cash flow from operations to explore M&A opportunities that accelerate our genre leadership, drive audience growth and enhance shareholder value. Overall, we remain on track to deliver our improved margin goals by the end of 2018. Over the long-term, we’re focused on achieving margins in-line with our peers.
Sincerely,
| |

| 
|
Frank Gibeau | Ger Griffin |
Chief Executive Officer | Chief Financial Officer |
CONTACTS
Rebecca Lau
Director, Investor Relations & Corporate Finance
relau@zynga.com
Dani Dudeck
Chief Communications Officer
dani@zynga.com
FORWARD-LOOKING STATEMENTS
This letter contains forward-looking statements, including those statements relating to our outlook for the fourth quarter of 2017 under the heading "FINANCIAL GUIDANCE" and statements relating to, among other things: our operational performance and progress in our turnaround; our operational strategy, including relating to live services, our continued investment in game innovations, our plans to acquire additional games and IP assets; our expectations regarding customer adoption; our ability to successfully launch new games and enhance existing games, including for our forever franchises; the success of new product and feature launches, including the worldwide launch of Words with Friends 2, Zynga Poker Jackpots, CSR2 Fast & Furious events and AR mode, Dawn of Titans’ The Throne War, the Farmville: Tropic Escape Cruise Ships event system, and other special events; the prospect of emerging game platforms and features, such as augmented reality and chat features; our expectations regarding the advertising market, including anticipated trends in that market; our expectations in the mobile game industry, including anticipated trends in that market; our expectations regarding the acquisition of the mobile card game studio of Peak Games, including our expectations regarding the closing of the transaction, our ability to successfully integrate the acquired games and other assets into our business and operations, and our belief that we will have the largest casual game portfolio in the world; and our ability to achieve financial projections, including revenue, bookings, income and margin goals.
Forward-looking statements often include words such as "outlook," "projected," "intends," "will," "anticipate," "believe," "target," "expect," and statements in the future tense are generally forward-looking. The achievement or success of the matters covered by such forward-looking statements involves significant risks, uncertainties, and assumptions. Our actual results could differ materially from those predicted or implied and reported results should not be considered as an indication of our future performance. Undue reliance should not be placed on such forward-looking statements, which are based on information available to us on the date hereof. We assume no obligation to update such statements. More information about factors that could affect our operating results are described in greater detail in our public filings with the Securities and Exchange Commission (the “SEC”), copies of which may be obtained by visiting our Investor Relations web site at http://investor.zynga.com or the SEC's web site at www.sec.gov.
In addition, the preliminary financial results set forth in this letter are estimates based on information currently available to us. While we believe these estimates are meaningful, they could differ from the actual amounts that we ultimately report in our Quarterly Report on Form 10-Q for the quarter ended September 30, 2017. We assume no obligation and do not intend to update these estimates prior to filing our Quarterly Report on Form 10-Q for the quarter ended September 30, 2017.
NON-GAAP FINANCIAL MEASURES
We have provided in this letter certain non-GAAP financial measures to supplement our consolidated financial statements prepared in accordance with GAAP (our “GAAP financial statements”). Management uses non-GAAP financial measures internally in analyzing our financial results to assess operational performance and liquidity. Our non-GAAP financial measures may be different from non-GAAP financial measures used by other companies.
The presentation of our non-GAAP financial measures is not intended to be considered in isolation or as a substitute for, or superior to, our GAAP financial statements. We believe that both management and investors benefit from referring to our non-GAAP financial measures in assessing our performance and when planning, forecasting and analyzing future periods. We believe our non-GAAP financial measures are useful to investors because they allow for greater transparency with respect to key financial measures we use in making operating decisions and because our investors and analysts use them to help assess the health of our business.
We have provided reconciliations of our non-GAAP financial measures used in this letter to the most directly comparable GAAP financial measures in the following tables. Because of the following limitations of our non-GAAP financial measures, you should consider the non-GAAP financial measures presented in this letter with our GAAP financial statements.
Key limitations of our non-GAAP financial measures include:
| • | Bookings does not reflect that we defer and recognize online game revenue and revenue from certain advertising transactions over the estimated average life of durable virtual goods or as virtual goods are consumed; |
| • | Adjusted EBITDA does not include the impact of stock-based expense, acquisition-related transaction expenses, contingent consideration fair value adjustments, impairment of intangible assets, and restructuring expense; |
| • | Adjusted EBITDA does not reflect provisions for or benefits from income taxes and does not include other income (expense) net, which includes foreign exchange gains and losses, and interest income; |
| • | Adjusted EBITDA excludes depreciation and amortization of tangible and intangible assets. Although depreciation and amortization are non-cash charges, the assets being depreciated and amortized may have to be replaced in the future; and |
| • | Free cash flow is derived from net cash provided by operating activities less cash spent on capital expenditures. |
ZYNGA INC.
CONSOLIDATED BALANCE SHEETS
(In thousands, unaudited)
| | September 30, | | | December 31, | |
| | 2017 | | | 2016 | |
Assets | | | | | | | | |
Current assets: | | | | | | | | |
Cash and cash equivalents | | $ | 517,257 | | | $ | 852,467 | |
Marketable securities | | | 254,972 | | | | — | |
Accounts receivable, net of allowance of $0 at September 30, 2017 and December 31, 2016 | | | 89,410 | | | | 77,260 | |
Income tax receivable | | | 231 | | | | 296 | |
Restricted cash | | | 8,682 | | | | 6,199 | |
Prepaid expenses and other current assets | | | 30,718 | | | | 29,254 | |
Total current assets | | | 901,270 | | | | 965,476 | |
Goodwill | | | 660,871 | | | | 613,335 | |
Other intangible assets, net | | | 40,517 | | | | 25,430 | |
Property and equipment, net | | | 266,121 | | | | 269,439 | |
Restricted cash | | | 250 | | | | 3,050 | |
Prepaid expenses and other non-current assets | | | 59,273 | | | | 29,119 | |
Total assets | | $ | 1,928,302 | | | $ | 1,905,849 | |
Liabilities and stockholders’ equity | | | | | | | | |
Current liabilities: | | | | | | | | |
Accounts payable | | $ | 16,593 | | | $ | 23,999 | |
Income tax payable | | | 3,892 | | | | 1,889 | |
Other current liabilities | | | 77,768 | | | | 75,754 | |
Deferred revenue | | | 143,907 | | | | 141,998 | |
Total current liabilities | | | 242,160 | | | | 243,640 | |
Deferred revenue | | | 162 | | | | 158 | |
Deferred tax liabilities, net | | | 6,945 | | | | 5,791 | |
Other non-current liabilities | | | 48,907 | | | | 75,596 | |
Total liabilities | | | 298,174 | | | | 325,185 | |
Stockholders’ equity: | | | | | | | | |
Common stock and additional paid in capital | | | 3,410,816 | | | | 3,349,714 | |
Accumulated other comprehensive income (loss) | | | (91,223 | ) | | | (128,694 | ) |
Accumulated deficit | | | (1,689,465 | ) | | | (1,640,356 | ) |
Total stockholders’ equity | | | 1,630,128 | | | | 1,580,664 | |
Total liabilities and stockholders’ equity | | $ | 1,928,302 | | | $ | 1,905,849 | |
ZYNGA INC.
CONSOLIDATED STATEMENTS OF OPERATIONS
(In thousands, except per share data, unaudited)
| | Three Months Ended | | | Nine Months Ended | |
| | September 30, 2017 | | | June 30, 2017 | | | September 30, 2016 | | | September 30, 2017 | | | September 30, 2016 | |
Revenue: | | | | | | | | | | | | | | | | | | | | |
Online game | | $ | 175,253 | | | $ | 163,745 | | | $ | 134,254 | | | $ | 492,479 | | | $ | 407,134 | |
Advertising and other | | | 49,342 | | | | 45,486 | | | | 48,170 | | | | 135,631 | | | | 143,746 | |
Total revenue | | | 224,595 | | | | 209,231 | | | | 182,424 | | | | 628,110 | | | | 550,880 | |
Costs and expenses: | | | | | | | | | | | | | | | | | | | | |
Cost of revenue | | | 65,907 | | | | 64,172 | | | | 62,675 | | | | 194,956 | | | | 175,917 | |
Research and development | | | 60,966 | | | | 64,615 | | | | 73,913 | | | | 194,783 | | | | 227,883 | |
Sales and marketing | | | 53,944 | | | | 51,201 | | | | 49,802 | | | | 151,765 | | | | 136,777 | |
General and administrative | | | 23,826 | | | | 23,551 | | | | 21,656 | | | | 69,942 | | | | 69,414 | |
Impairment of intangible assets | | | — | | | | — | | | | 20,677 | | | | — | | | | 20,677 | |
Total costs and expenses | | | 204,643 | | | | 203,539 | | | | 228,723 | | | | 611,446 | | | | 630,668 | |
Income (loss) from operations | | | 19,952 | | | | 5,692 | | | | (46,299 | ) | | | 16,664 | | | | (79,788 | ) |
Interest income | | | 1,502 | | | | 1,109 | | | | 800 | | | | 3,548 | | | | 2,266 | |
Other income (expense), net | | | 1,181 | | | | 1,614 | | | | 980 | | | | 4,231 | | | | 4,985 | |
Income (loss) before income taxes | | | 22,635 | | | | 8,415 | | | | (44,519 | ) | | | 24,443 | | | | (72,537 | ) |
Provision for (benefit from) income taxes | | | 4,544 | | | | 3,322 | | | | (2,782 | ) | | | 10,733 | | | | 204 | |
Net income (loss) | | $ | 18,091 | | | $ | 5,093 | | | $ | (41,737 | ) | | $ | 13,710 | | | $ | (72,741 | ) |
| | | | | | | | | | | | | | | | | | | | |
Net income (loss) per share attributable to common stockholders: | | | | | | | | | | | | | | | | | | | | |
Basic | | $ | 0.02 | | | $ | 0.01 | | | $ | (0.05 | ) | | $ | 0.02 | | | $ | (0.08 | ) |
Diluted | | $ | 0.02 | | | $ | 0.01 | | | $ | (0.05 | ) | | $ | 0.02 | | | $ | (0.08 | ) |
| | | | | | | | | | | | | | | | | | | | |
Weighted average common shares used to compute net income (loss) per share attributable to common stockholders: | | | | | | | | | | | | | | | | | | | | |
Basic | | | 867,377 | | | | 863,125 | | | | 882,408 | | | | 868,707 | | | | 875,656 | |
Diluted | | | 893,684 | | | | 887,991 | | | | 882,408 | | | | 895,207 | | | | 875,656 | |
| | | | | | | | | | | | | | | | | | | | |
Stock-based compensation expense included in the above line items: | | | | | | | | | | | | | | | | | | | | |
Cost of revenue | | $ | 435 | | | $ | 371 | | | $ | 1,049 | | | $ | 1,425 | | | $ | 2,825 | |
Research and development | | | 10,097 | | | | 10,483 | | | | 18,662 | | | | 32,293 | | | | 63,078 | |
Sales and marketing | | | 1,891 | | | | 1,751 | | | | 1,541 | | | | 5,429 | | | | 5,738 | |
General and administrative | | | 3,166 | | | | 3,627 | | | | 3,223 | | | | 10,199 | | | | 9,341 | |
Total stock-based compensation expense | | $ | 15,589 | | | $ | 16,232 | | | $ | 24,475 | | | $ | 49,346 | | | $ | 80,982 | |
ZYNGA INC.
CONSOLIDATED STATEMENTS OF CASH FLOWS
(In thousands, unaudited)
| | Three Months Ended | | | Nine Months Ended | |
| | September 30, 2017 | | | June 30, 2017 | | | September 30, 2016 | | | September 30, 2017 | | | September 30, 2016 | |
Cash flows from operating activities: | | | | | | | | | | | | | | | | | | | | |
Net income (loss) | | $ | 18,091 | | | $ | 5,093 | | | $ | (41,737 | ) | | $ | 13,710 | | | $ | (72,741 | ) |
Adjustments to reconcile net income (loss) to net cash provided by (used in) operating activities: | | | | | | | | | | | | | | | | | | | | |
Depreciation and amortization | | | 7,610 | | | | 7,398 | | | | 10,511 | | | | 23,889 | | | | 32,158 | |
Stock-based compensation expense | | | 15,589 | | | | 16,232 | | | | 24,475 | | | | 49,346 | | | | 80,982 | |
(Gain) loss from sales of investments, assets and other, net | | | (23 | ) | | | (222 | ) | | | (82 | ) | | | (206 | ) | | | 160 | |
Accretion and amortization on marketable securities | | | (172 | ) | | | — | | | | 11 | | | | (172 | ) | | | 322 | |
Change in deferred income taxes and other | | | 1,955 | | | | 1,193 | | | | (4,304 | ) | | | 4,222 | | | | (2,734 | ) |
Impairment of intangible assets | | | — | | | | — | | | | 20,677 | | | | — | | | | 20,677 | |
Changes in operating assets and liabilities: | | | | | | | | | | | | | | | | | | | | |
Accounts receivable, net | | | (4,182 | ) | | | 996 | | | | (5,793 | ) | | | (12,150 | ) | | | 8,743 | |
Income tax receivable | | | 18 | | | | 27 | | | | 939 | | | | 65 | | | | 1,711 | |
Other assets | | | 2,935 | | | | 3,282 | | | | 1,923 | | | | 294 | | | | (2,519 | ) |
Accounts payable | | | 2,329 | | | | 461 | | | | 4,145 | | | | (6,012 | ) | | | (10,171 | ) |
Deferred revenue | | | (11,108 | ) | | | (53 | ) | | | 14,299 | | | | 1,913 | | | | 2,121 | |
Income tax payable | | | (746 | ) | | | 1,497 | | | | — | | | | 2,003 | | | | — | |
Other liabilities | | | 2,791 | | | | 1,926 | | | | (4,032 | ) | | | (8,705 | ) | | | (26,436 | ) |
Net cash provided by (used in) operating activities | | | 35,087 | | | | 37,830 | | | | 21,032 | | | | 68,197 | | | | 32,273 | |
| | | | | | | | | | | | | | | | | | | | |
Cash flows from investing activities: | | | | | | | | | | | | | | | | | | | | |
Purchases of marketable securities | | | (255,301 | ) | | | — | | | | — | | | | (255,301 | ) | | | — | |
Sales and maturities of marketable securities | | | — | | | | — | | | | 35,535 | | | | — | | | | 240,337 | |
Acquisition of property and equipment | | | (2,737 | ) | | | (1,856 | ) | | | (2,674 | ) | | | (6,878 | ) | | | (6,621 | ) |
Business acquisitions, net of cash acquired | | | — | | | | — | | | | (19,410 | ) | | | (35,081 | ) | | | (33,630 | ) |
Proceeds from sale of property and equipment | | | 73 | | | | 133 | | | | 1,458 | | | | 221 | | | | 3,035 | |
Other investing activities, net | | | — | | | | 165 | | | | — | | | | (7,225 | ) | | | — | |
Net cash provided by (used in) investing activities | | | (257,965 | ) | | | (1,558 | ) | | | 14,909 | | | | (304,264 | ) | | | 203,121 | |
| | | | | | | | | | | | | | | | | | | | |
Cash flows from financing activities: | | | | | | | | | | | | | | | | | | | | |
Taxes paid related to net share settlement of stockholders' equity awards | | | (5,153 | ) | | | (9,008 | ) | | | (498 | ) | | | (14,576 | ) | | | (2,163 | ) |
Repurchases of common stock | | | — | | | | (10,760 | ) | | | — | | | | (96,924 | ) | | | (112,392 | ) |
Proceeds from issuance of common stock | | | 4,231 | | | | 865 | | | | 2,685 | | | | 8,249 | | | | 5,570 | |
Net cash provided by (used in) financing activities | | | (922 | ) | | | (18,903 | ) | | | 2,187 | | | | (103,251 | ) | | | (108,985 | ) |
| | | | | | | | | | | | | | | | | | | | |
Effect of exchange rate changes on cash and cash equivalents | | | 2,082 | | | | 1,169 | | | | (197 | ) | | | 4,108 | | | | (2,307 | ) |
| | | | | | | | | | | | | | | | | | | | |
Net increase (decrease) in cash and cash equivalents | | | (221,718 | ) | | | 18,538 | | | | 37,931 | | | | (335,210 | ) | | | 124,102 | |
Cash and cash equivalents, beginning of period | | | 738,975 | | | | 720,437 | | | | 828,388 | | | | 852,467 | | | | 742,217 | |
Cash and cash equivalents, end of period | | $ | 517,257 | | | $ | 738,975 | | | $ | 866,319 | | | $ | 517,257 | | | $ | 866,319 | |
ZYNGA INC.
RECONCILIATION OF GAAP TO NON-GAAP RESULTS
(In thousands, except per share data, unaudited)
| | Three Months Ended | | | Nine Months Ended | |
| | September 30, 2017 | | | June 30, 2017 | | | September 30, 2016 | | | September 30, 2017 | | | September 30, 2016 | |
Reconciliation of Revenue to Bookings | | | | | | | | | | | | | | | | | | | | |
Revenue | | $ | 224,595 | | | $ | 209,231 | | | $ | 182,424 | | | $ | 628,110 | | | $ | 550,880 | |
Change in deferred revenue | | | (11,108 | ) | | | (53 | ) | | | 14,299 | | | | 1,913 | | | | 2,121 | |
Bookings | | $ | 213,487 | | | $ | 209,178 | | | $ | 196,723 | | | $ | 630,023 | | | $ | 553,001 | |
| | | | | | | | | | | | | | | | | | | | |
Reconciliation of Revenue to Bookings: Mobile | | | | | | | | | | | | | | | | | | | | |
Revenue | | $ | 194,390 | | | $ | 179,868 | | | $ | 145,906 | | | $ | 535,871 | | | $ | 419,697 | |
Change in deferred revenue | | | (7,848 | ) | | | 1,755 | | | | 16,413 | | | | 8,416 | | | | 18,017 | |
Bookings: Mobile | | $ | 186,542 | | | $ | 181,623 | | | $ | 162,319 | | | $ | 544,287 | | | $ | 437,714 | |
| | | | | | | | | | | | | | | | | | | | |
Reconciliation of Revenue to Bookings: Advertising | | | | | | | | | | | | | | | | | | | | |
Revenue | | $ | 46,352 | | | $ | 44,430 | | | $ | 47,004 | | | $ | 130,836 | | | $ | 139,154 | |
Change in deferred revenue | | | (773 | ) | | | (1,006 | ) | | | 1,583 | | | | (726 | ) | | | (1,964) | |
Bookings: Advertising | | $ | 45,579 | | | $ | 43,424 | | | $ | 48,587 | | | $ | 130,110 | | | $ | 137,190 | |
| | | | | | | | | | | | | | | | | | | | |
Reconciliation of Net Income (Loss) to Adjusted EBITDA | | | | | | | | | | | | | | | | | | | | |
Net income (loss) | | $ | 18,091 | | | $ | 5,093 | | | $ | (41,737 | ) | | $ | 13,710 | | | $ | (72,741 | ) |
Provision for (benefit from) income taxes | | | 4,544 | | | | 3,322 | | | | (2,782 | ) | | | 10,733 | | | | 204 | |
Other income (expense), net | | | (1,181 | ) | | | (1,614 | ) | | | (980 | ) | | | (4,231 | ) | | | (4,985 | ) |
Interest income | | | (1,502 | ) | | | (1,109 | ) | | | (800 | ) | | | (3,548 | ) | | | (2,266 | ) |
Restructuring expense, net | | | 995 | | | | 1,422 | | | | (49 | ) | | | 1,572 | | | | 2,129 | |
Depreciation and amortization | | | 7,610 | | | | 7,398 | | | | 10,511 | | | | 23,889 | | | | 32,158 | |
Acquisition-related transaction expenses | | | 443 | | | | — | | | | 75 | | | | 630 | | | | 274 | |
Contingent consideration fair value adjustment | | | — | | | | (807 | ) | | | (5,810 | ) | | | (901 | ) | | | (18,170 | ) |
Impairment of intangible assets | | | — | | | | — | | | | 20,677 | | | | — | | | | 20,677 | |
Stock-based compensation expense | | | 15,589 | | | | 16,232 | | | | 24,475 | | | | 49,346 | | | | 80,982 | |
Adjusted EBITDA | | $ | 44,589 | | | $ | 29,937 | | | $ | 3,580 | | | $ | 91,200 | | | $ | 38,262 | |
| | | | | | | | | | | | | | | | | | | | |
Reconciliation of GAAP operating expense to Non-GAAP operating expense | | | | | | | | | | | | | | | | | | | | |
GAAP operating expense | | $ | 138,736 | | | $ | 139,367 | | | $ | 166,048 | | | $ | 416,490 | | | $ | 454,751 | |
Restructuring expense, net | | | (995 | ) | | | (1,422 | ) | | | 49 | | | | (1,572 | ) | | | (2,129 | ) |
Amortization of intangible assets from acquisition | | | (814 | ) | | | (1,397 | ) | | | (1,257 | ) | | | (3,272 | ) | | | (2,737 | ) |
Acquisition-related transaction expenses | | | (443 | ) | | | — | | | | (75 | ) | | | (630 | ) | | | (274 | ) |
Contingent consideration fair value adjustment | | | — | | | | 807 | | | | 5,810 | | | | 901 | | | | 18,170 | |
Impairment of intangible assets | | | — | | | | — | | | | (20,677 | ) | | | — | | | | (20,677 | ) |
Stock-based compensation expense | | | (15,154 | ) | | | (15,861 | ) | | | (23,426 | ) | | | (47,921 | ) | | | (78,157 | ) |
Non-GAAP operating expense | | $ | 121,330 | | | $ | 121,494 | | | $ | 126,472 | | | $ | 363,996 | | | $ | 368,947 | |
| | | | | | | | | | | | | | | | | | | | |
Reconciliation of Cash provided by operating activities to free cash flow | | | | | | | | | | | | | | | | | | | | |
Net cash provided by (used in) operating activities | | | 35,087 | | | | 37,830 | | | | 21,032 | | | | 68,197 | | | | 32,273 | |
Acquisition of property and equipment | | | (2,737 | ) | | | (1,856 | ) | | | (2,674 | ) | | | (6,878 | ) | | | (6,621 | ) |
Free cash flow | | $ | 32,350 | | | $ | 35,974 | | | $ | 18,358 | | | $ | 61,319 | | | $ | 25,652 | |
ZYNGA INC.
RECONCILIATION OF GAAP TO NON-GAAP FOURTH QUARTER 2017 GUIDANCE
(In thousands, except per share data, unaudited)
| | Fourth Quarter 2017 | |
Reconciliation of Revenue to Bookings | | | | |
Revenue | $ | | 215,000 | |
Change in deferred revenue | | | (5,000) | |
Bookings | $ | | 210,000 | |
| | | | |
Reconciliation of Net Income to Adjusted EBITDA | | | | |
Net income | $ | | 13,000 | |
Provision for income taxes | | | 5,000 | |
Other income, net | | | (2,000) | |
Interest income | | | (2,000) | |
Depreciation and amortization | | | 6,000 | |
Stock-based compensation expense | | | 15,000 | |
Adjusted EBITDA | $ | | 35,000 | |
| | | | |
GAAP diluted shares | | | 900,000 | |
Diluted net income per share | $ | | 0.01 | |