Exhibit 99.2
Zynga Announces Third Quarter 2017 Financial Results
SAN FRANCISCO, November 7, 2017 – Zynga Inc. (Nasdaq: ZNGA) has released its third quarter 2017 financial results by posting management’s Q3 2017 Quarterly Earnings Letter on its website. Please visit http://investor.zynga.com/results.cfm to view the letter.
Zynga management will also host a Q&A session at 2:30 p.m. Pacific Time (5:30 p.m. Eastern Time) to discuss Zynga’s third quarter 2017 performance. Questions may be asked on the call, and Zynga will respond to as many questions as possible.
The live Q&A session can be accessed at http://investor.zynga.com – a replay of which will be available through the website after the call – or via the below conference dial-in number:
| • | Toll-Free Dial-In Number: (800) 537-0745 |
| • | International Dial-In Number: (253) 237-1142 |
Statement from Zynga’s Chief Executive Officer Frank Gibeau
“We had a strong Q3, delivering our best revenue and bookings performance in over four years. This past quarter, revenue was $224.6 million, above our guidance by $14.6 million and up 23% year-over-year. Bookings were $213.5 million, above our guidance by $8.5 million, and up 9% year-over-year. Our mobile user pay hit an all-time high for both revenue and bookings, up 44% and 20% year-over-year, respectively. Mobile now represents 87% of our total revenue and bookings,” said Frank Gibeau, CEO of Zynga. “We delivered significant growth in profitability in the quarter achieving net income of $18.1 million. This represents the first time since we went public that Zynga has delivered two consecutive quarters of net income. Our year-to-date cash flow from operations has more than doubled to $68.2 million, up from $32.3 million a year ago. We remain on track to deliver our improved margin goals by the end of 2018 and, over the long-term, we’re focused on achieving margins in-line with our peers.”
About Zynga Inc.
Since its founding in 2007, Zynga’s mission has been to connect the world through games. To date, more than 1 billion people have played Zynga’s games across web and mobile, including FarmVille, Zynga Poker, Words With Friends, Hit it Rich! Slots and CSR Racing. Zynga’s games are available on a number of global platforms including Apple iOS, Google Android, Facebook and Zynga.com. The company is headquartered in San Francisco, Calif., and has additional offices in the U.S., Canada, U.K., Ireland, India and Finland. Learn more about Zynga at https://companyblogdotzynga.com/ or follow us on Twitter and Facebook.
Contacts
Investor Relations Contact
Rebecca Lau
investors@zynga.com
Press Contact
Stephanie Hess
shess@zynga.com
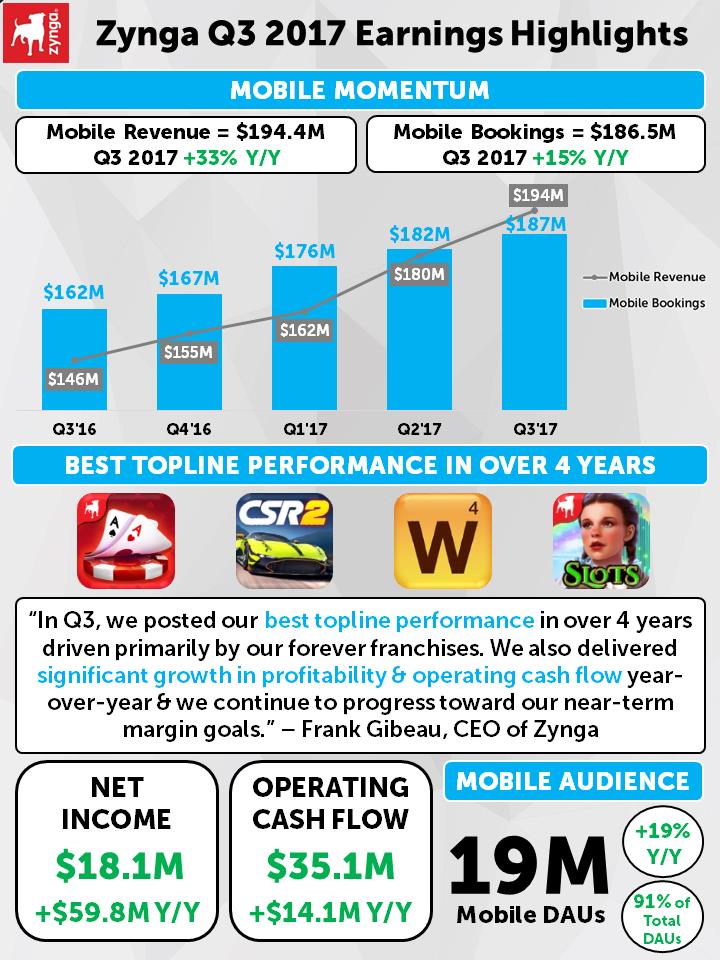
BEST TOPLINE PERFORMANCE IN OVER 4 YEARS Zynga Q3 2017 Earnings Highlights Mobile Revenue = $194.4M Q3 2017 +33% Y/Y Mobile Bookings = $186.5M Q3 2017 +15% Y/Y Mobile Momentum $162M $167M $176M $182M $187M $146M $155M $162M $180M $194M4M Q3'16 Q4'16 Q1'17 Q2'17 Q3'17 BEST TOPLINE PERFORMANCE IN OVER 4 YEARS OBILE “In Q3, we posted our best topline performance in over 4 years driven primarily by our forever franchises. We also delivered significant growth in profitability & operating cash flow year-over-year & we continue to progress toward our near-term margin goals.” – Frank Gibeau, CEO of Zynga 19M Mobile DAUs 91% of Total DAUs +19% Y/Y NET INCOME $18.1M +$59.8M Y/Y OPERATING CASH FLOW $35.1M +$14.1M Y/Y Mobile Revenue Mobile Bookings
Cautionary Statements/Non-GAAP Financial Measures
The preliminary financial results set forth in this press release are estimates based on information currently available to us. While we believe these estimates are meaningful, they could differ from the actual amounts that we ultimately report in our Quarterly Report on Form 10-Q for the quarter ended September 30, 2017. We assume no obligation and do not intend to update these estimates prior to filing our Quarterly Report on Form 10-Q for the quarter ended September 30, 2017.
We have provided in this press release certain non-GAAP financial measures to supplement our consolidated financial statements prepared in accordance with GAAP (our “GAAP financial statements”). Management uses non-GAAP financial measures internally in analyzing our financial results to assess operational performance and liquidity. Our non-GAAP financial measures may be different from non-GAAP financial measures used by other companies.
The presentation of our non-GAAP financial measures is not intended to be considered in isolation of, as a substitute for, or as superior to, our GAAP financial statements. We believe that both management and investors benefit from referring to our non-GAAP financial measures in assessing our performance and when planning, forecasting and analyzing future periods. We believe our non-GAAP financial measures are useful to investors because they allow for greater transparency with respect to key financial measures we use in making operating decisions and because our investors and analysts use them to help assess the health of our business.
We have provided reconciliations of our non-GAAP financial measures used in this press release to the most directly comparable GAAP financial measures in the following tables. Because of the following limitations of our non-GAAP financial measures, you should consider the non-GAAP financial measures presented in this press release with our GAAP financial statements.
Key limitations of our non-GAAP financial measures include:
| • | Bookings does not reflect that we defer and recognize online game revenue and revenue from certain advertising transactions over the estimated average life of durable virtual goods or as virtual goods are consumed. |
| | Three Months Ended | |
| | September 30, 2017 | |
Reconciliation of Revenue to Bookings | | | | |
Revenue | | $ | 224,595 | |
Change in deferred revenue | | | (11,108 | ) |
Bookings | | $ | 213,487 | |
| | Three Months Ended | |
| | September 30, 2017 | | | June 30, 2017 | | | March 31, 2017 | | | December 31, 2016 | | | September 30, 2016 | |
Reconciliation of Revenue to Bookings: Mobile | | | | | | | | | | | | | | | | | | | | |
Revenue | | $ | 194,390 | | | $ | 179,868 | | | $ | 161,613 | | | $ | 154,674 | | | $ | 145,906 | |
Change in deferred revenue | | | (7,848 | ) | | | 1,755 | | | | 14,508 | | | | 12,387 | | | | 16,413 | |
Bookings: Mobile | | $ | 186,542 | | | $ | 181,623 | | | $ | 176,121 | | | $ | 167,061 | | | $ | 162,319 | |