Exhibit 99.1

Dear Shareholders,
We look forward to discussing our Q2 2020 results during today’s earnings call at 2:00 p.m. PT. This letter details our Q2 performance, as well as our outlook for Q3 and growth opportunities in 2020 and beyond. Please note that we manage our business based on topline measures including revenue, which is comprised of the change in deferred revenue and bookings. Revenue and the change in deferred revenue are both directly affected by bookings results, and management utilizes bookings as a primary topline measure to help inform its decisions.
Executive Summary
We are living in unprecedented times and more people than ever before are turning to games for entertainment and a sense of community. With so many of us staying at home, we saw heightened levels of player engagement, social connection and monetization in our portfolio. In Q2, we delivered exceptional results with live services driving new revenue and bookings records and our best operating cash flow in more than eight years. We also executed our transformational acquisition of Peak and are entering Q3 with eight forever franchises, adding significant scale to our live services foundation. Our new game pipeline is progressing well and we expect to begin releasing new titles later this year.
In the quarter, our live services drove our best revenue and bookings results ever with revenue of $452 million, up 47% year-over-year, and bookings of $518 million, up 38% year-over-year. We achieved many new performance records in our forever franchises, Social Slots and Casual Cards portfolios as more people turned to our deeply social game experiences while sheltering-in-place and as players enjoyed our robust lineup of bold beats. This greater than expected topline performance, coupled with lower than anticipated marketing investments, drove strong operating leverage and our best operating cash flow in more than eight years of $145 million, up 47% year-over-year.
On July 1, 2020, we closed our acquisition of Peak, one of the world’s best mobile puzzle game makers. Peak brings an extremely creative, passionate team to the Zynga family along with two chart topping forever franchises, Toon Blast and Toy Blast, to our live services portfolio. Our integration of Peak is off to a great start, and our teams are well positioned to grow faster together.
We are also making good progress on our three new games in soft launch – FarmVille 3, Harry Potter: Puzzles & Spells and Puzzle Combat. We have introduced new features to provide players with more content, quests and ways to customize their gaming experiences and have expanded into additional soft launch territories to continue gathering player feedback. We expect to begin releasing new titles later this year and steadily scale these games over time.
Today, we are raising our full year 2020 guidance to $1.8 billion in revenue, up $110 million versus our prior guidance and 36% year-over-year, and $2.2 billion in bookings, up $360 million versus our prior guidance and 41% year-over-year. Strength in our live services portfolio including a full 2H 2020 contribution from Peak are the drivers of our increased outlook. We continue to expect the vast majority of our 2020 performance to be driven by our live services.
Additionally, we are announcing that we have entered into an agreement to acquire Istanbul-based Rollic, developer and publisher of a portfolio of popular hyper-casual games that have collectively been downloaded more than 250 million times. Eight of Rollic’s games have reached #1 or #2 top free downloaded games in the U.S. App Store, and their latest releases, Go Knots 3D and Tangle Master 3D, were the top two most downloaded games in the U.S. App Store in Q2 2020. With this acquisition, we are excited to enter the hyper-casual market, one of the largest and fastest-growing mobile gaming categories, while adding a highly talented team with an extensive network of external developers. Following the anticipated close of this transaction on October 1, 2020, Rollic will meaningfully increase our audience and grow our advertising business. Our guidance does not currently include any contributions from Rollic.
In summary, we remain incredibly excited by the growth and innovation ahead for interactive entertainment as more people around the world come together to connect and socialize through gaming experiences. As the industry continues to expand and evolve, Zynga is uniquely well positioned as a leading mobile-first, free-to-play, live services game company on the largest and fastest-growing gaming platform. We remain confident in the execution of our multi-year growth strategy and our potential to drive topline growth and margin expansion over the coming years.
| | |
 | | 1 |
Q2 Highlights
| • | Highest revenue and bookings performances in Zynga history, driven by outstanding live services performance. |
| • | Record revenue of $452 million, up 47% year-over-year, and bookings of $518 million, up 38% year-over-year. |
| • | Record online game – or user pay – revenue of $388 million, up 61% year-over-year, and user pay bookings of $455 million, up 47% year-over-year. |
| • | Generated operating cash flow of $145 million, our best performance since Q4 2011, up 47% year-over-year. |
| • | Empires & Puzzles, Merge Dragons!, Merge Magic! and Game of ThronesTM Slots Casino were the largest drivers of year-over-year topline growth. |
| • | All Zynga employees continued to work from home seamlessly, while delivering on a robust lineup of bold beats including new ‘Battle Pass’ mechanics within Empires & Puzzles, Merge Magic! and Hit it Rich! Slots, as well as the featuring of Fast & Furious™ within CSR2, Rick and Morty™ within Merge Dragons! and a new ‘Dragons of Westeros’ feature in Game of ThronesTM Slots Casino. |
| • | Our Small Giant Games and Gram Games acquisitions continue to perform ahead of expectations. |
| • | Completed our acquisition of Peak on July 1, 2020, bringing a creative and passionate team to Zynga and expanding our live services portfolio to include chart-topping forever franchises Toon Blast and Toy Blast. |
| • | Continued to experiment with new gaming platforms – launched Bumped Out, our second title on the Snap Games platform, and Word Pop, our first voice-based game exclusively for Amazon’s Alexa. |
| • | Produced our first 2-hour livestream event on Twitch for Words With Friends in collaboration with Garth Brooks, Trisha Yearwood and Amazon Prime – reaching over 3 million total viewers and 13 million minutes watched. |
| • | Announced our commitment to contribute $25 million over the next five years toward diversity and inclusion initiatives at Zynga and in the games industry. |

Zynga poker words with friends 2 csr2 merge dragons! Empires & puzzles merge magic toon blast! Toy blast!
Zynga’s Live Services Portfolio is Anchored by Eight Forever Franchises
| | |
| | 2 |
Financials
In Q2, we delivered our highest quarterly revenue and bookings, with revenue of $452 million, above our raised guidance by $22 million and up $145 million or 47% year-over-year, and bookings of $518 million, beating our raised guidance by $18 million and up $142 million or 38% year-over-year. Live services drove our record results, with stronger than anticipated performances from our Social Slots portfolio, Words With Friends, CSR2 and Empires & Puzzles driving our beat above our raised topline guidance.
We generated record user pay revenue of $388 million, up 61% year-over-year, and user pay bookings of $455 million, up 47% year-over-year. Advertising revenue and bookings were $63 million, down 3% and 5% year-over-year, respectively as we lapped prior year advertising network optimizations. During the quarter, we experienced lower advertising yields due to lower demand in the current environment; however, this was partially offset by strong player engagement in our titles.
Our net increase in deferred revenue was $66 million versus both our raised guidance and Q2 2019 net increase of $70 million. The primary drivers of the net increase in deferred revenue were bookings from Empires & Puzzles and Merge Dragons!. We ended Q2 with a deferred revenue balance of $523 million versus $358 million a year ago.
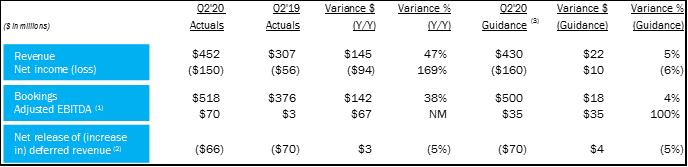
($in millions) q2’20 actuals q2’19 actuals variance $ (y/y) variance % (y/y) q2’20 guidance variance $ (guidance) variance % (guidance) revenue $452 $307 $145 47% $430 $22 5% Net income (loss) ($150) ($56) ($94) 169% ($160) $10 (6%) bookings $518 $376 $142 38% $500 $18 4% adjusted ebitda (1) $70 $3 $67 NM $35 $35 100% net release of (increase in) deferred revenue (2) ($66) ($70) $3 (5%) ($70) $4 (5%)
Note: Certain measures as presented differ due to the impact of rounding. NM - not meaningful.
(1) | Adjusted EBITDA includes the net release of (increase in) deferred revenue. |
(2) | For clarity, a net release of deferred revenue results in revenue being higher than bookings and is a positive impact to Adjusted EBITDA as reported; a net increase in deferred revenue results in revenue being lower than bookings and is a negative impact to Adjusted EBITDA as reported. |
(3) | Updated guidance as communicated on June 1, 2020. |
GAAP gross margins were 60% of revenue, marginally up from 59% in Q2 2019. GAAP operating expenses increased to 89% of revenue from 79% in Q2 2019 primarily due to a material year-over-year increase in contingent consideration expense. Non-GAAP operating expenses decreased to 43% of bookings from 52% a year ago on greater operating leverage across all operating expense line items.
We had a net loss of $150 million, $10 million better than guidance primarily driven by our stronger operating performance, partially offset by a higher increase in contingent consideration expense. On a year-over-year basis, our net loss grew by $94 million, primarily due to increased contingent consideration and income tax expense, partially offset by our improved operating performance. The increase in contingent consideration expense is a function of Small Giant Games and Gram Games continuing to perform ahead of expectations.
Adjusted EBITDA was $70 million, above our raised guidance by $35 million, primarily due to our higher than expected topline performance as well as lower than anticipated marketing investments. On a year-over-year basis, Adjusted EBITDA increased $67 million driven by our improved operating performance.
We generated operating cash flow of $145 million, our best performance since Q4 2011, up 47% year-over-year.
In Q2, we saw our highest mobile daily active users (DAUs) in April and early May as more people sheltered-in-place. Toward the latter half of the quarter, our mobile DAUs started to return to levels consistent with Q1 2020. Overall, Q2 average mobile DAUs were 22 million, up 4% year-over-year and our mobile monthly active users (MAUs) were 70 million, flat year-over-year. For Q2, audience engagement was strong with mobile average bookings per mobile DAU (ABPU) of $0.248, up 32% year-over-year.
| | |
| | 3 |
Product
Increased player engagement in our live services drove our tremendous Q2 results. Within our forever franchises, Social Slots and Casual Cards portfolios, we achieved many new records as more people turned to our deeply social game experiences while sheltering-in-place and as players enjoyed our robust lineup of bold beats. As we enter Q3, we’re continuing to execute on an exciting slate of bold beats across our portfolio to connect and entertain our players.
CSR2 had an especially strong Q2 that included the successful return of Fast & FuriousTM to the game as well as an extension to our Elite Customs feature with a new Sport Cars content pack featuring the latest 2020 Chevrolet Corvette Stingray Convertible. In Q3, CSR2 will celebrate its fourth anniversary as well as the best of American car culture with a new Roadtrip event series that takes players virtually across the country to unlock unique cars created in partnership with renowned American car manufacturers. We will also complete the first of two Fast & FuriousTM finale events.
Empires & Puzzles outperformed once again, delivering its best revenue and bookings quarter driven by an exciting content calendar. Q2 started off with our revamped Easter event Springvale, which provided new levels, challenges and heroes to the game, followed by Tavern of Legends, a new event where players were able to test their strategic skills while summoning past fan favorite heroes of the month. In the quarter, we also launched two Path of Valor seasons, which have been well received by players, and introduced a series of new hero costumes within our Wardrobe feature. As we entered Q3, we released a new summer event, Sand Empires, which featured new heroes and power-ups alongside new quest stages with varied difficulties. Looking ahead, we expect to build upon Empires & Puzzles’ tremendous momentum by offering more events and challenges.
Merge Dragons! delivered record Q2 revenue and bookings as players enjoyed Pets, Greek, Summer and Rick and Morty™ themed events featuring unique items and special dragons. We will begin Q3 by celebrating Merge Dragons!’ third anniversary with a special dessert themed event and will also begin testing a Season Pass feature within the game.
Merge Magic! had a strong Q2. During the quarter, we released well-received Easter Eggstravaganza, Golden Spirits, Medieval Magic and Mermaid Islands events, while also launching Season Pass worldwide, a new feature rewarding players for higher engagement. In Q3, we will provide more themed events and game updates for our player base.
Our Social Slots portfolio achieved another all-time record revenue and bookings quarter driven by strong features and updates across each title. Hit It Rich! Slots introduced ‘Rich Pass’, a new take on the popular battle pass mechanic from other genres, while Wizard of Oz Slots players continued to enjoy Daily Challenges Deluxe – our update to the player favorite Daily Challenges. Within Game of ThronesTM Slots Casino, we released a new feature – ‘Dragons of Westeros’, which allows players to raise their own dragons to capture greater in-game rewards and perks. Willy Wonka Slots players also engaged with ‘Daily Wrappers’, another twist on the popular daily challenge mechanic. In Q3, we will introduce more innovative features and content to surprise and entertain our Social Slots players.
Words With Friends also achieved record Q2 revenue and bookings. In Q2, we updated our Solo Challenge feature to provide players with more opportunities to engage with an experience they love, while also introducing new quick-play events such as Duels, which gives players a new social competitive game mode to access whenever they choose. We also began our collaboration with Amazon to feature free content such as mystery boxes and special tile styles exclusively for Prime subscribers in Words With Friends 2. Looking ahead, we will further enhance and add to our quick-play events feature, while also making updates to our goal systems.
Zynga Poker completed its best revenue and bookings quarter since Q3 2018 as players responded positively to our newly introduced quick chat feature, which enabled players to socialize without missing any action, as well as Watches, a new collectibles system focused on driving long-term engagement. In Q3, in addition to launching more events, we expect to roll out Rings – a progression system designed to reward players for tournament play with extravagant rings and unique chip prizes.
| | |
| | 4 |
Multi-Year Growth Strategy
We have great momentum across our multi-year growth strategy of: (1) growing our live services, (2) adding new forever franchises to our portfolio and (3) investing in new platforms, markets and technology. Additionally, we see opportunities to enhance each of these growth pillars through more acquisitions.
First, our strength in live services is the foundation of our multi-year growth strategy. Zynga has a highly diversified live services portfolio anchored by our forever franchises as well as our Social Slots and Casual Cards portfolios. While working from home, our teams are delivering a steady cadence of innovative bold beats to engage our players and drive strong, recurring growth from our live services. We recently introduced ‘Battle Pass’ features within Empires & Puzzles, Merge Magic! and Hit it Rich! Slots, which have been well received by players and are proving to be positive drivers of engagement and monetization. We are also continuing to integrate and expand popular brands within our live services including Fast & Furious™ in CSR2, Rick and Morty™ in Merge Dragons! and a new ‘Dragons of Westeros’ feature in Game of ThronesTM Slots Casino. All of this is fueled by our proven and scalable live services capabilities comprised of best-in-class product management, data science, user acquisition, advertising and platform relationships.
Second, our goal is to add new forever franchises to our live services portfolio. Our recent acquisition of Peak brings one of the world’s best puzzle game makers to Zynga and their two top charting games, Toon Blast and Toy Blast. These titles expand our live services to include eight forever franchises, increasing the scale and resiliency of our portfolio. We are also making good progress on our three games in soft launch – FarmVille 3, Harry Potter: Puzzles & Spells and Puzzle Combat. We have introduced new features to provide players with more content, quests and ways to customize their gaming experiences and have expanded into additional soft launch territories to continue gathering player feedback. Our soft launch process includes careful testing and iteration of game features with the goal of delivering long-term retention. We expect to begin introducing new games later this year and anticipate these titles will steadily scale over time.
Third, mobile is continuously evolving and we are investing in new platforms, markets and technology that could drive further growth across interactive entertainment. Today, we announced our agreement to acquire Rollic, a developer and publisher of popular hyper-casual games based in Istanbul, Turkey. Hyper-casual is one of the largest and fastest growing mobile gaming categories that leads the top downloaded games charts across Android and iOS. The growth of this category is fueled by advertising-driven games that are highly accessible and appeal to a broad audience globally. In addition, we are driving strong growth internationally with Q2 revenue and bookings up 56% and 34% year-over-year, respectively. With Toon Blast and Toy Blast, we will further increase our international business, especially in Japan. In terms of new platform investments, we released Bumped Out, our second title on the Snap Games platform as part of a new multi-game partnership. Additionally, we launched the interactive Word Pop game on Amazon Alexa and created a streaming entertainment format with Amazon Twitch Prime live for Words With Friends. While our investments in these and other initiatives are still in early stages, we believe they have the potential to increase our growth over the long term.
Last, we continue to see opportunities to acquire talented teams and franchises to further accelerate our growth. The talent base for mobile gaming is global, and the mobile platform is vast and constantly evolving with new innovations emerging every year. To date, our acquisitions have delivered strong contribution to our live services, added multiple new forever franchises to our portfolio, expanded our new game pipeline and provided entry into a new exciting category on mobile. Our proven integration model enables teams to maintain their unique development cultures while leveraging Zynga’s highly scalable studio operations and publishing platform so we can collectively grow faster together.
 Zynga naturalmotion games gram games small giant peak rollic
| | |
| | 5 |
Forward Outlook
Our Q3 and Full Year 2020 Guidance have been developed based on the information available as of August 5, 2020 and a similar methodology to prior quarters. Given the higher level of continued uncertainty around the COVID-19 crisis, there is the potential for a wider range of outcomes – both positive and negative – as it relates to our ultimate business results.
Q3 Guidance
| • | Net increase in deferred revenue of $175 million |
| • | Bookings of $620 million |
| • | Net loss of $160 million |
| • | Adjusted EBITDA loss of $45 million |
In Q3, we expect revenue of $445 million, up $100 million or 29% year-over-year, and bookings of $620 million, up $225 million or 57% year-over-year. Live services will drive the vast majority of our topline performance, led by our forever franchises, including full quarter contributions from Toon Blast, Toy Blast and Merge Magic!. This overall momentum will be partially offset by year-over-year declines in older mobile and web titles. We also expect year-over-year user pay growth to more than offset declines in advertising yields.
With our acquisition of Peak, we have added two forever franchises, Toon Blast and Toy Blast, to our portfolio. As these titles are new to Zynga, consistent with standard accounting practices, we expect a material net increase in deferred revenue as the majority of the initial bookings associated with these titles will be deferred for recognition as revenue in future quarters. Accordingly, in Q3, we expect a material net increase in deferred revenue of $175 million. This represents the largest quarterly increase in deferred revenue in Zynga history and compares to a net increase of $50 million in Q3 2019. The year-over-year change in this GAAP revenue deferral is a meaningful factor in year-over-year comparability as it represents a $125 million year-over-year decrease in revenue, gross profit, net income and Adjusted EBITDA.
Due to a higher net increase in deferred revenue, amortization of acquired intangibles and user pay mix in Q3 2020 versus Q3 2019, we expect gross margins to be significantly down year-over-year. We also anticipate our GAAP operating expenses as a percentage of revenue to increase year-over-year with the impact of the higher net increase in deferred revenue, partially offset by lower contingent consideration expense year-over-year.
Outside of these factors, we anticipate year-over-year improvements in operating leverage in R&D and G&A, partially offset by higher marketing investments across our live services portfolio and new game pipeline.
We expect a net loss of $160 million versus net income of $230 million in Q3 2019, which included a one-time gain of $314 million related to the sale of our San Francisco headquarters building. Other key drivers of the year-over-year change are the higher net increase in deferred revenue, amortization of acquired intangibles and stock based compensation, partially offset by our improved operating performance and lower contingent consideration expense.
We expect an Adjusted EBITDA loss of $45 million in Q3 2020 versus Adjusted EBITDA of $28 million in Q3 2019. This year-over-year change is primarily driven by the $125 million year-over-year growth in the net increase in deferred revenue, partially offset by our improved operating performance.
| | |
| | 6 |
2020 & Beyond
| • | Net increase in deferred revenue of $400 million |
| • | Bookings of $2.2 billion |
| • | Net loss of $550 million |
| • | Adjusted EBITDA of $85 million |
We are raising our full year 2020 guidance to $1.8 billion in revenue, up 36% year-over-year, and $2.2 billion in bookings, up 41% year-over-year. This represents an increase of $110 million in revenue and $360 million of bookings versus our prior guidance. Our guidance assumes that live services will deliver the vast majority of our topline performance driven by our forever franchises, including full 2H 2020 contributions from the recently acquired Toon Blast and Toy Blast franchises, as well as initial contributions from new games that we expect to launch later this year. We also expect year-over-year user pay growth to more than offset declines in advertising yields.
While we expect the acquisition of Rollic to close on October 1, 2020, our guidance for 2020 does not currently include any contributions from Rollic.
We anticipate a net increase in deferred revenue of $400 million, an increase of $250 million versus our prior guidance primarily due to the deferral of the majority of initial bookings from our recently acquired franchises, Toon Blast and Toy Blast. The year-over-year change in this GAAP revenue deferral is a meaningful factor in year-over-year comparability as it represents a $158 million year-over-year decrease in revenue, gross profit, net income and Adjusted EBITDA.
Due to a higher net increase in deferred revenue, additional amortization of acquired intangibles and user pay mix in 2020 versus 2019, we expect gross margins to be significantly down year-over-year. Given the higher net increase in deferred revenue and contingent consideration expense in 2020 versus 2019, we also expect GAAP operating expenses as a percentage of revenue to increase year-over-year.
Outside of these factors, we anticipate improvement in operating leverage from R&D and G&A, which should be partially offset by increased marketing investments in both our live services and new game launches. Operating leverage will ultimately be a function of our live services performance, user pay versus advertising mix, timing of new game launches and level of marketing invested into scaling our live services and new titles.
In 2020, we expect a net loss of $550 million, $200 million higher than our prior guidance of $350 million, primarily due to the acquisition of Peak and its resulting impact on the net increase in deferred revenue, amortization of acquired intangibles and stock based compensation, partially offset by income tax benefits and operating contribution from the acquired titles.
This compares to net income of $42 million in 2019 which included a one-time gain of $314 million related to the sale of our San Francisco headquarters building. The other primary drivers of the year-over-year change are the higher net increase in deferred revenue and contingent consideration expense, with our improved operating performance offsetting the year-over-year dilutive changes in other GAAP to Non-GAAP reconciliation items.
We expect Adjusted EBITDA of $85 million, down $138 million versus our prior guidance as our stronger operating performance will be more than offset by the additional $250 million net in increase deferred revenue. On a year-over-year basis, we anticipate Adjusted EBITDA will be down $2 million as the $158 million year-over-year growth in the net increase in deferred revenue is largely offset by our improved operating performance.
Our strong execution in 2020 should position Zynga for continued growth in 2021 where we expect double-digit topline growth, the potential for further margin expansion and positive operating cash flow.
| | |
| | 7 |
Earnings Call
We will host our Q2 2020 earnings conference call today, Wednesday, August 5, at 2:00 p.m. PT (5:00 p.m. ET). The call can be accessed at http://investor.zynga.com or via the below conference dial-in number:
| • | Toll-Free Dial-In Number: (800) 537-0745 |
| • | International Dial-In Number: (253) 237-1142 |
Sincerely,
| | |

| | 
|
Frank Gibeau Chief Executive Officer | | Ger Griffin Chief Financial Officer |
| | |
| | 8 |
Forward-Looking Statements
This letter contains forward-looking statements, including those statements relating to our outlook for the full year and third quarter of 2020, including under the headings “Executive Summary,” “Financials,” “Product,” “Multi-Year Growth Strategy,” “Forward Outlook,” “Q3 Guidance” and “2020 & Beyond” and statements relating to, among other things: our operational performance and strategy, including our focus on live services, growth projections relating to our forever franchises, expectation to launch new titles later in 2020 and scale them over time, continued execution of our multi-year growth strategy which includes investing in new platforms and other initiatives, markets and technology, such as our entry into the hyper-casual market through the anticipated acquisition of Rollic Games Oyun Yazılım ve Pazarlama Anonim Şirketi (“Rollic”) on October 1, 2020, and our plans to enhance existing games with new events, features and updates, scale existing games and increase marketing investments for both our live services portfolio and new game launches; our ability to achieve the intended benefits of our acquisitions of Peak Oyun Yazılım ve Pazarlama Anonim Şirketin (“Peak”) and Rollic, including expanding and diversifying our global audience, growing our average mobile DAU and MAU, integration of our teams, and updates to our expected and future financial performance; potential to drive topline growth and steady margin expansion over the coming years; the growth of interactive entertainment and our positioning within the industry; our performance expectations regarding our live services, forever franchises, older mobile and web titles, new game launches and advertising business, including the expected increase in audience and enhancement to our advertising business from the anticipated acquisition of Rollic; our expectation for growth in user pay; our opportunities to grow through additional acquisitions; an increase in our international business; our commitment to fund diversity & inclusion initiatives; and our ability to achieve and expectations related to financial projections, including revenue, deferred revenue, bookings, income, adjusted EBITDA, contingent consideration accruals, operating expenses, operating leverage, operating results, operating cash flow and margins.
Forward-looking statements often include words such as “outlook,” “projected,” “intend,” “will,” “anticipate,” “believe,” “target,” “expect,” “positioned,” and statements in the future tense are generally forward-looking. The achievement or success of the matters covered by such forward-looking statements involves significant risks, uncertainties and assumptions, including risks, uncertainty and assumptions relating to the COVID-19 pandemic, shelter-in-place rules and effects on business and economic conditions. Our actual results could differ materially from those predicted or implied and reported results should not be considered as an indication of our future performance. Undue reliance should not be placed on such forward-looking statements, which are based on information available to us on the date hereof. We assume no obligation to update such statements. More information about factors that could affect our operating results are described in greater detail in our public filings with the Securities and Exchange Commission (the “SEC”), copies of which may be obtained by visiting our Investor Relations web site at http://investor.zynga.com or the SEC's website at www.sec.gov.
In addition, the preliminary financial results set forth in this letter are estimates based on information currently available to us. While we believe these estimates are meaningful, they could differ from the actual amounts that we ultimately report in our Quarterly Report on Form 10-Q for the quarter ended June 30, 2020. We assume no obligation and do not intend to update these estimates prior to filing our Quarterly Report on Form 10-Q.
| | |
| | 9 |
Key Operating Metrics
We manage our business by tracking several operating metrics: “Mobile DAUs,” which measure daily active users of our mobile games, “Mobile MAUs,” which measure monthly active users of our mobile games, and “Mobile ABPU,” which measures our average daily mobile bookings per average Mobile DAU, each of which is recorded and estimated by our internal analytics systems. We determine these operating metrics by using internal company data based on tracking of user account activity. We also use information provided by third parties, including third party network logins provided by platform providers, to help us track whether a player logged in under two or more different user accounts is the same individual. Overall, we believe that the amounts are reasonable estimates of our user base for the applicable period of measurement and that the methodologies we employ and update from time-to-time are reasonably based on our efforts to identify trends in player behavior. However, factors relating to user activity and systems and our ability to identify and detect attempts to replicate legitimate player activity may impact these numbers.
Mobile DAUs. We define Mobile DAUs as the number of individuals who played one of our mobile games during a particular day. Average Mobile DAUs for a particular period is the average of the Mobile DAUs for each day during that period. Under this metric, an individual who plays two different mobile games on the same day is counted as two DAUs. We use information provided by third parties to help us identify individuals who play the same game to reduce this duplication. However, because we do not always have the third party network login data to link an individual who has played under multiple user accounts, a player may be counted as multiple Mobile DAUs. Specifically, Mobile DAUs incrementally include Merge Magic! and the games acquired from Gram Games in May 2018 and Small Giant Games in January 2019 and, accordingly, actual Mobile DAUs may be lower than reported due to the potential duplication of these individuals. We use Mobile DAUs as a measure of audience engagement.
Mobile MAUs. We define Mobile MAUs as the number of individuals who played one of our mobile games in the 30-day period ending with the measurement date. Average Mobile MAUs for a particular period is the average of the Mobile MAUs at each month-end during that period. Under this metric, an individual who plays two different mobile games in the same 30-day period is counted as two Mobile MAUs. We use information provided by third parties to help us identify individuals who play the same game to reduce this duplication. However, because we do not always have the third party network login data to link an individual who has played under multiple user accounts, a player may be counted as multiple Mobile MAUs. Specifically, Mobile MAUs incrementally include Merge Magic! and the games acquired from Gram Games in May 2018 and Small Giant Games in January 2019 and, accordingly, actual Mobile MAUs may be lower than reported due to the potential duplication of these individuals. We use Mobile MAUs as a measure of total game audience size.
Mobile ABPU. We define Mobile ABPU as our total mobile bookings in a given period, divided by the number of days in that period, divided by the average Mobile DAUs during the period. We believe that Mobile ABPU provides useful information to investors and others in understanding and evaluating our results in the same manner as management. We use Mobile ABPU as a measure of overall monetization across all of our players through the sale of virtual items and advertising.
Our business model around our social games is designed so that, as more players play our games, social interactions increase and the more valuable our games and our business become. All engaged players of our games help drive our bookings and, consequently, both online game revenue and advertising revenue. Virtual items are purchased by players who are socializing with, competing against or collaborating with other players, most of whom do not buy virtual items. Accordingly, we primarily focus on Mobile DAUs, Mobile MAUs and Mobile ABPU, which we believe collectively best reflect key audience metrics.
| | |
| | 10 |
Non-GAAP Financial Measures
We have provided in this letter certain non-GAAP financial measures to supplement our consolidated financial statements prepared in accordance with U.S. GAAP (our “GAAP financial statements”). Management uses non-GAAP financial measures internally in analyzing our financial results to assess operational performance and liquidity. Our non-GAAP financial measures may be different from non-GAAP financial measures used by other companies.
The presentation of our non-GAAP financial measures is not intended to be considered in isolation or as a substitute for, or superior to, our GAAP financial statements. We believe that both management and investors benefit from referring to our non-GAAP financial measures in assessing our performance and when planning, forecasting and analyzing future periods. We believe our non-GAAP financial measures are useful to investors because they allow for greater transparency with respect to key financial measures we use in making operating decisions and because our investors and analysts use them to help assess the health of our business.
We have provided reconciliations of our non-GAAP financial measures used in this letter to the most directly comparable GAAP financial measures in the following tables. Because of the following limitations of our non-GAAP financial measures, you should consider the non-GAAP financial measures presented in this letter with our GAAP financial statements.
Key limitations of our non-GAAP financial measures include:
| • | Bookings does not reflect that we defer and recognize online game revenue and revenue from certain advertising transactions over the estimated average playing period of payers for durable virtual items or as consumed for consumable virtual items; |
| • | Adjusted EBITDA does not include the impact of stock-based compensation expense, acquisition-related transaction expenses, contingent consideration fair value adjustments and legal settlements and related legal expense; |
| • | Adjusted EBITDA does not reflect provisions for or benefits from income taxes and does not include other income (expense) net, which includes foreign exchange and asset disposition gains and losses, interest expense and interest income; |
| • | Adjusted EBITDA excludes depreciation and amortization of tangible and intangible assets. Although depreciation and amortization are non-cash charges, the assets being depreciated and amortized may have to be replaced in the future; |
| • | Free cash flow is derived from net cash provided by operating activities less cash spent on capital expenditures; and |
| • | Non-GAAP Operating Expenses do not include the impact of stock-based compensation expense, acquisition-related transaction expenses, contingent consideration fair value adjustments, legal settlements and related legal expense or amortization of intangible assets from acquisitions. |
| | |
| | 11 |
ZYNGA INC.
CONSOLIDATED BALANCE SHEETS
(In thousands, unaudited)
| | June 30, | | | December 31, | |
| | 2020 | | | 2019 | |
Assets | | | | | | | | |
Current assets: | | | | | | | | |
Cash and cash equivalents | | $ | 1,339,619 | | | $ | 423,323 | |
Short-term investments | | | 216,595 | | | | 938,173 | |
Accounts receivable, net of allowance of $400 at June 30, 2020 and $0 at December 31, 2019 | | | 184,388 | | | | 140,078 | |
Restricted cash | | | 30,006 | | | | 30,006 | |
Prepaid expenses | | | 27,077 | | | | 27,533 | |
Other current assets | | | 14,544 | | | | 16,557 | |
Total current assets | | | 1,812,229 | | | | 1,575,670 | |
Long-term investments | | | 15,356 | | | | 175,300 | |
Goodwill | | | 1,449,135 | | | | 1,460,933 | |
Intangible assets, net | | | 201,507 | | | | 233,005 | |
Property and equipment, net | | | 31,567 | | | | 25,826 | |
Right-of-use assets | | | 128,686 | | | | 136,972 | |
Prepaid expenses | | | 28,985 | | | | 37,815 | |
Other non-current assets | | | 16,137 | | | | 15,093 | |
Total assets | | $ | 3,683,602 | | | $ | 3,660,614 | |
Liabilities and stockholders’ equity | | | | | | | | |
Current liabilities: | | | | | | | | |
Accounts payable | | $ | 24,249 | | | $ | 27,799 | |
Income tax payable | | | 6,276 | | | | 649 | |
Deferred revenue | | | 521,314 | | | | 432,962 | |
Operating lease liabilities | | | 16,053 | | | | 15,753 | |
Other current liabilities | | | 415,876 | | | | 314,805 | |
Total current liabilities | | | 983,768 | | | | 791,968 | |
Convertible senior notes, net | | | 582,939 | | | | 570,456 | |
Deferred revenue | | | 1,732 | | | | 567 | |
Deferred tax liabilities, net | | | 43,415 | | | | 33,479 | |
Non-current operating lease liabilities | | | 122,077 | | | | 130,301 | |
Other non-current liabilities | | | 213,438 | | | | 158,413 | |
Total liabilities | | | 1,947,369 | | | | 1,685,184 | |
Stockholders’ equity: | | | | | | | | |
Common stock and additional paid-in capital | | | 3,955,501 | | | | 3,898,695 | |
Accumulated other comprehensive income (loss) | | | (138,206 | ) | | | (125,935 | ) |
Accumulated deficit | | | (2,081,062 | ) | | | (1,797,330 | ) |
Total stockholders’ equity | | | 1,736,233 | | | | 1,975,430 | |
Total liabilities and stockholders’ equity | | $ | 3,683,602 | | | $ | 3,660,614 | |
| | |
| | 12 |
ZYNGA INC.
CONSOLIDATED STATEMENTS OF OPERATIONS
(In thousands, except per share data, unaudited)
| | Three Months Ended | | | Six Months Ended | |
| | June 30, 2020 | | | March 31, 2020 | | | June 30, 2019 | | | June 30, 2020 | | | June 30, 2019 | |
Revenue: | | | | | | | | | | | | | | | | | | | | |
Online game | | $ | 388,181 | | | $ | 344,360 | | | $ | 240,708 | | | $ | 732,541 | | | $ | 440,872 | |
Advertising and other | | | 63,507 | | | | 59,407 | | | | 65,792 | | | | 122,914 | | | | 131,031 | |
Total revenue | | | 451,688 | | | | 403,767 | | | | 306,500 | | | | 855,455 | | | | 571,903 | |
Costs and expenses: | | | | | | | | | | | | | | | | | | | | |
Cost of revenue | | | 179,208 | | | | 146,202 | | | | 126,872 | | | | 325,410 | | | | 248,515 | |
Research and development | | | 227,952 | | | | 197,845 | | | | 102,094 | | | | 425,797 | | | | 263,974 | |
Sales and marketing | | | 134,652 | | | | 123,171 | | | | 113,529 | | | | 257,823 | | | | 215,540 | |
General and administrative | | | 39,195 | | | | 28,203 | | | | 25,239 | | | | 67,398 | | | | 46,743 | |
Total costs and expenses | | | 581,007 | | | | 495,421 | | | | 367,734 | | | | 1,076,428 | | | | 774,772 | |
Income (loss) from operations | | | (129,319 | ) | | | (91,654 | ) | | | (61,234 | ) | | | (220,973 | ) | | | (202,869 | ) |
Interest income | | | 3,598 | | | | 5,525 | | | | 889 | | | | 9,123 | | | | 1,332 | |
Interest expense | | | (6,961 | ) | | | (6,955 | ) | | | (2,167 | ) | | | (13,916 | ) | | | (3,430 | ) |
Other income (expense), net | | | 571 | | | | (2,330 | ) | | | 3,877 | | | | (1,759 | ) | | | 7,252 | |
Income (loss) before income taxes | | | (132,111 | ) | | | (95,414 | ) | | | (58,635 | ) | | | (227,525 | ) | | | (197,715 | ) |
Provision for (benefit from) income taxes | | | 18,189 | | | | 8,511 | | | | (2,805 | ) | | | 26,700 | | | | (13,057 | ) |
Net income (loss) | | $ | (150,300 | ) | | $ | (103,925 | ) | | $ | (55,830 | ) | | $ | (254,225 | ) | | $ | (184,658 | ) |
| | | | | | | | | | | | | | | | | | | | |
Net income (loss) per share attributable to common stockholders: | | | | | | | | | | | | | | | | | | | | |
Basic | | $ | (0.16 | ) | | $ | (0.11 | ) | | $ | (0.06 | ) | | $ | (0.27 | ) | | $ | (0.20 | ) |
Diluted | | $ | (0.16 | ) | | $ | (0.11 | ) | | $ | (0.06 | ) | | $ | (0.27 | ) | | $ | (0.20 | ) |
| | | | | | | | | | | | | | | | | | | | |
Weighted-average common shares used to compute net income (loss) per share attributable to common stockholders: | | | | | | | | | | | | | | | | | | | | |
Basic | | | 956,854 | | | | 952,502 | | | | 937,334 | | | | 954,678 | | | | 931,813 | |
Diluted | | | 956,854 | | | | 952,502 | | | | 937,334 | | | | 954,678 | | | | 931,813 | |
| | | | | | | | | | | | | | | | | | | | |
Stock-based compensation expense included in the above line items: | | | | | | | | | | | | | | | | | | | | |
Cost of revenue | | $ | 544 | | | $ | 438 | | | $ | 397 | | | $ | 982 | | | $ | 681 | |
Research and development | | | 12,511 | | | | 10,703 | | | | 12,238 | | | | 23,215 | | | | 23,953 | |
Sales and marketing | | | 3,940 | | | | 3,063 | | | | 2,920 | | | | 7,003 | | | | 5,407 | |
General and administrative | | | 8,678 | | | | 6,261 | | | | 5,800 | | | | 14,938 | | | | 10,087 | |
Total stock-based compensation expense | | $ | 25,673 | | | $ | 20,465 | | | $ | 21,355 | | | $ | 46,138 | | | $ | 40,128 | |
| | |
| | 13 |
ZYNGA INC.
CONSOLIDATED STATEMENTS OF CASH FLOWS
(In thousands, unaudited)
| | Three Months Ended | | | Six Months Ended | |
| | June 30, 2020 | | | March 31, 2020 | | | June 30, 2019 | | | June 30, 2020 | | | June 30, 2019 | |
Cash flows from operating activities: | | | | | | | | | | | | | | | | | | | | |
Net income (loss) | | $ | (150,300 | ) | | $ | (103,925 | ) | | $ | (55,830 | ) | | $ | (254,225 | ) | | $ | (184,658 | ) |
Adjustments to reconcile net income (loss) to net cash provided by (used in) operating activities: | | | | | | | | | | | | | | | | | | | | |
Depreciation and amortization | | | 19,033 | | | | 18,862 | | | | 19,669 | | | | 37,895 | | | | 40,749 | |
Stock-based compensation expense | | | 25,673 | | | | 20,465 | | | | 21,355 | | | | 46,138 | | | | 40,128 | |
(Gain) loss from investments, foreign currency and sale of assets, net | | | (1,646 | ) | | | 923 | | | | (539 | ) | | | (723 | ) | | | (385 | ) |
(Accretion) amortization on marketable debt securities, net | | | (415 | ) | | | (1,900 | ) | | | (232 | ) | | | (2,315 | ) | | | (385 | ) |
Noncash lease expense | | | 3,442 | | | | 4,188 | | | | 1,712 | | | | 7,631 | | | | 3,161 | |
Noncash interest expense | | | 6,274 | | | | 6,210 | | | | 1,008 | | | | 12,483 | | | | 1,008 | |
Change in deferred income taxes and other | | | 12,151 | | | | 5,353 | | | | (13,657 | ) | | | 17,504 | | | | (34,031 | ) |
Changes in operating assets and liabilities: | | | | | | | | | | | | | | | | | | | | |
Accounts receivable, net | | | (16,281 | ) | | | (27,294 | ) | | | 3,491 | | | | (43,575 | ) | | | (26,510 | ) |
Prepaid expenses and other assets | | | 9,742 | | | | 1,362 | | | | 3,842 | | | | 11,104 | | | | 7,160 | |
Accounts payable | | | 5,613 | | | | (8,971 | ) | | | 7,005 | | | | (3,358 | ) | | | (7,288 | ) |
Deferred revenue | | | 65,730 | | | | 20,713 | | | | 69,515 | | | | 86,443 | | | | 155,989 | |
Income tax payable | | | 3,328 | | | | 2,459 | | | | 5,421 | | | | 5,787 | | | | 60 | |
Operating lease and other liabilities | | | 162,814 | | | | 26,369 | | | | 35,857 | | | | 189,183 | | | | 105,166 | |
Net cash provided by (used in) operating activities | | | 145,158 | | | | (35,186 | ) | | | 98,617 | | | | 109,972 | | | | 100,164 | |
Cash flows from investing activities: | | | | | | | | | | | | | | | | | | | | |
Purchases of investments | | | (77,353 | ) | | | (471,025 | ) | | | (94,335 | ) | | | (548,378 | ) | | | (124,091 | ) |
Maturities of investments | | | 317,915 | | | | 605,444 | | | | 8,000 | | | | 923,359 | | | | 16,500 | |
Sales of investments | | | 413,380 | | | | 96,808 | | | | — | | | | 510,188 | | | | 4,987 | |
Acquisition of property and equipment | | | (2,955 | ) | | | (8,546 | ) | | | (4,900 | ) | | | (11,501 | ) | | | (9,958 | ) |
Proceeds from sale of property and equipment, net | | | — | | | | 26 | | | | 44 | | | | 26 | | | | 90 | |
Business acquisitions, net of cash acquired and restricted cash held in escrow | | | — | | | | — | | | | — | | | | — | | | | (299,357 | ) |
Release of restricted cash escrow from business combinations | | | — | | | | — | | | | (10,000 | ) | | | — | | | | (10,000 | ) |
Other investing activities, net | | | — | | | | (1,045 | ) | | | — | | | | (1,045 | ) | | | — | |
Net cash provided by (used in) investing activities | | | 650,987 | | | | 221,662 | | | | (101,191 | ) | | | 872,649 | | | | (421,829 | ) |
Cash flows from financing activities: | | | | | | | | | | | | | | | | | | | | |
Proceeds from issuance of debt, net | | | — | | | | — | | | | 672,682 | | | | — | | | | 672,682 | |
Purchase of capped calls | | | — | | | | — | | | | (73,830 | ) | | | — | | | | (73,830 | ) |
Taxes paid related to net share settlement of stockholders' equity awards | | | (14,270 | ) | | | (14,836 | ) | | | (16,610 | ) | | | (29,106 | ) | | | (27,620 | ) |
Proceeds from issuance of common stock | | | 1,866 | | | | 8,802 | | | | 2,092 | | | | 10,668 | | | | 7,031 | |
Repayment of debt | | | — | | | | — | | | | (100,000 | ) | | | — | | | | (101,364 | ) |
Acquisition-related contingent consideration payment | | | — | | | | (48,100 | ) | | | — | | | | (48,100 | ) | | | — | |
Other financing activities, net | | | — | | | | — | | | | (1 | ) | | | — | | | | (327 | ) |
Net cash provided by (used in) financing activities | | | (12,404 | ) | | | (54,134 | ) | | | 484,333 | | | | (66,538 | ) | | | 476,572 | |
| | | | | | | | | | | | | | | | | | | | |
Effect of exchange rate changes on cash, cash equivalents and restricted cash | | | 3,457 | | | | (3,244 | ) | | | (159 | ) | | | 213 | | | | 11,446 | |
| | | | | | | | | | | | | | | | | | | | |
Net change in cash, cash equivalents and restricted cash | | | 787,198 | | | | 129,098 | | | | 481,600 | | | | 916,296 | | | | 166,353 | |
Cash, cash equivalents and restricted cash, beginning of period | | | 582,427 | | | | 453,329 | | | | 264,749 | | | | 453,329 | | | | 579,996 | |
Cash, cash equivalents and restricted cash, end of period | | $ | 1,369,625 | | | $ | 582,427 | | | $ | 746,349 | | | $ | 1,369,625 | | | $ | 746,349 | |
| | |
| | 14 |
ZYNGA INC.
RECONCILIATION OF GAAP TO NON-GAAP RESULTS
(In thousands, unaudited)
| | Three Months Ended | | | Six Months Ended | |
| | June 30, 2020 | | | March 31, 2020 | | | June 30, 2019 | | | June 30, 2020 | | | June 30, 2019 | |
Reconciliation of Revenue to Bookings: Total | | | | | | | | | | | | | | | | | | | | |
Revenue | | $ | 451,688 | | | $ | 403,767 | | | $ | 306,500 | | | $ | 855,455 | | | $ | 571,903 | |
Change in deferred revenue | | | 66,445 | | | | 21,108 | | | | 69,873 | | | | 87,553 | | | | 163,955 | |
Bookings: Total | | $ | 518,133 | | | $ | 424,875 | | | $ | 376,373 | | | $ | 943,008 | | | $ | 735,858 | |
| | | | | | | | | | | | | | | | | | | | |
Reconciliation of Revenue to Bookings: Mobile | | | | | | | | | | | | | | | | | | | | |
Revenue | | $ | 432,634 | | | $ | 386,989 | | | $ | 287,442 | | | $ | 819,623 | | | $ | 533,535 | |
Change in deferred revenue | | | 65,646 | | | | 21,510 | | | | 70,855 | | | | 87,156 | | | | 166,160 | |
Bookings: Mobile | | $ | 498,280 | | | $ | 408,499 | | | $ | 358,297 | | | $ | 906,779 | | | $ | 699,695 | |
| | | | | | | | | | | | | | | | | | | | |
Reconciliation of Revenue to Bookings: Advertising | | | | | | | | | | | | | | | | | | | | |
Revenue | | $ | 63,465 | | | $ | 59,290 | | | $ | 65,649 | | | $ | 122,755 | | | $ | 130,844 | |
Change in deferred revenue | | | (495 | ) | | | (30 | ) | | | 383 | | | | (525 | ) | | | 117 | |
Bookings: Advertising | | $ | 62,970 | | | $ | 59,260 | | | $ | 66,032 | | | $ | 122,230 | | | $ | 130,961 | |
| | | | | | | | | | | | | | | | | | | | |
Reconciliation of Net Income (Loss) to Adjusted EBITDA | | | | | | | | | | | | | | | | | | | | |
Net income (loss) | | $ | (150,300 | ) | | $ | (103,925 | ) | | $ | (55,830 | ) | | $ | (254,225 | ) | | $ | (184,658 | ) |
Provision for (benefit from) income taxes | | | 18,189 | | | | 8,511 | | | | (2,805 | ) | | | 26,700 | | | | (13,057 | ) |
Other expense (income), net | | | (571 | ) | | | 2,330 | | | | (3,877 | ) | | | 1,759 | | | | (7,252 | ) |
Interest income | | | (3,598 | ) | | | (5,525 | ) | | | (889 | ) | | | (9,123 | ) | | | (1,332 | ) |
Interest expense | | | 6,961 | | | | 6,955 | | | | 2,167 | | | | 13,916 | | | | 3,430 | |
Depreciation and amortization | | | 19,033 | | | | 18,862 | | | | 19,669 | | | | 37,895 | | | | 40,749 | |
Acquisition-related transaction expenses | | | 5,741 | | | | 787 | | | | 232 | | | | 6,528 | | | | 7,588 | |
Contingent consideration fair value adjustment | | | 148,904 | | | | 120,000 | | | | 23,900 | | | | 268,904 | | | | 109,400 | |
Gain on legal settlements and related legal expense | | | — | | | | — | | | | (1,037 | ) | | | — | | | | (10,664 | ) |
Stock-based compensation expense | | | 25,673 | | | | 20,465 | | | | 21,355 | | | | 46,138 | | | | 40,128 | |
Adjusted EBITDA | | $ | 70,032 | | | $ | 68,460 | | | $ | 2,885 | | | $ | 138,492 | | | $ | (15,668 | ) |
| | | | | | | | | | | | | | | | | | | | |
Reconciliation of GAAP Operating Expense to Non-GAAP Operating Expense | | | | | | | | | | | | | | | | | | | | |
GAAP operating expense | | $ | 401,799 | | | $ | 349,219 | | | $ | 240,862 | | | $ | 751,018 | | | $ | 526,257 | |
Amortization of intangible assets from acquisition | | | — | | | | — | | | | — | | | | — | | | | (291 | ) |
Acquisition-related transaction expenses | | | (5,741 | ) | | | (787 | ) | | | (232 | ) | | | (6,528 | ) | | | (7,588 | ) |
Contingent consideration fair value adjustment | | | (148,904 | ) | | | (120,000 | ) | | | (23,900 | ) | | | (268,904 | ) | | | (109,400 | ) |
Gain on legal settlements and related legal expense | | | — | | | | — | | | | 1,037 | | | | — | | | | 10,664 | |
Stock-based compensation expense | | | (25,129 | ) | | | (20,027 | ) | | | (20,958 | ) | | | (45,156 | ) | | | (39,447 | ) |
Non-GAAP operating expense | | $ | 222,025 | | | $ | 208,405 | | | $ | 196,809 | | | $ | 430,430 | | | $ | 380,195 | |
| | | | | | | | | | | | | | | | | | | | |
Reconciliation of Cash Provided by Operating Activities to Free Cash Flow | | | | | | | | | | | | | | | | | | | | |
Net cash provided by (used in) operating activities | | $ | 145,158 | | | $ | (35,186 | ) | | $ | 98,617 | | | $ | 109,972 | | | $ | 100,164 | |
Acquisition of property and equipment | | | (2,955 | ) | | | (8,546 | ) | | | (4,900 | ) | | | (11,501 | ) | | | (9,958 | ) |
Free cash flow | | $ | 142,203 | | | $ | (43,732 | ) | | $ | 93,717 | | | $ | 98,471 | | | $ | 90,206 | |
| | |
| | 15 |
ZYNGA INC.
RECONCILIATION OF GAAP TO NON-GAAP THIRD QUARTER 2020 GUIDANCE
(In thousands, except per share data, unaudited)
| | Third Quarter 2020 Guidance | | | Third Quarter 2019 Actual | | | Variance | |
Reconciliation of Revenue to Bookings | | | | | | | | | | | | |
Revenue | $ | | 445,000 | | $ | | 345,293 | | $ | | 99,707 | |
Change in deferred revenue | | | 175,000 | | | | 49,513 | | | | 125,487 | |
Bookings | $ | | 620,000 | | $ | | 394,806 | | $ | | 225,194 | |
| | | | | | | | | | | | |
Reconciliation of Net (Loss) Income to Adjusted EBITDA | | | | | | | | | | | | |
Net (loss) income | $ | | (160,000 | ) | $ | | 230,083 | | $ | | (390,083 | ) |
Provision for (benefit from) income taxes | | | (10,000 | ) | | | 9,880 | | | | (19,880 | ) |
Other expense, net | | | — | | | | 490 | | | | (490 | ) |
Interest income | | | (1,000 | ) | | | (6,597 | ) | | | 5,597 | |
Interest expense | | | 8,000 | | | | 6,728 | | | | 1,272 | |
Depreciation and amortization | | | 48,000 | | | | 19,069 | | | | 28,931 | |
Acquisition-related transaction expenses | | | 5,000 | | | | — | | | | 5,000 | |
Contingent consideration fair value adjustment | | | 25,000 | | | | 60,764 | | | | (35,764 | ) |
Gain on sale of building, net of transfer tax(1) | | | — | | | | (314,247 | ) | | | 314,247 | |
Stock-based compensation expense | | | 40,000 | | | | 21,339 | | | | 18,661 | |
Adjusted EBITDA | $ | | (45,000 | ) | $ | | 27,509 | | $ | | (72,509 | ) |
| | | | | | | | | | | | |
Basic net (loss) income per share | $ | | (0.15 | ) | $ | | 0.24 | | $ | | (0.39 | ) |
Diluted net (loss) income per share | $ | | (0.15 | ) | $ | | 0.24 | | $ | | (0.39 | ) |
| | | | | | | | | | | | |
GAAP basic shares | | | 1,080,000 | | | | 943,350 | | | | 136,650 | |
GAAP diluted shares | | | 1,080,000 | | | | 973,830 | | | | 106,170 | |
(1) | The gain on the sale of the building, net of transfer tax, was recorded within “Other income (expense), net” in our consolidated statement of operations for the three months ended September 30, 2019. |
| | |
| | 16 |
ZYNGA INC.
RECONCILIATION OF GAAP TO NON-GAAP REVISED FISCAL YEAR 2020 GUIDANCE
(In thousands, unaudited)
| | Revised Fiscal Year 2020 Guidance | | | Fiscal Year 2019 Actual | | | Variance | |
Reconciliation of Revenue to Bookings | | | | | | | | | | | | |
Revenue | $ | | 1,800,000 | | $ | | 1,321,659 | | $ | | 478,341 | |
Change in deferred revenue | | | 400,000 | | | | 242,402 | | | | 157,598 | |
Bookings | $ | | 2,200,000 | | $ | | 1,564,061 | | $ | | 635,939 | |
| | | | | | | | | | | | |
Reconciliation of Net Income (Loss) to Adjusted EBITDA | | | | | | | | | | | | |
Net income (loss) | $ | | (550,000 | ) | $ | | 41,925 | | $ | | (591,925 | ) |
Provision for income taxes | | | 5,000 | | | | 5,410 | | | | (410 | ) |
Other expense (income), net | | | 2,000 | | | | (8,220 | ) | | | 10,220 | |
Interest income | | | (10,000 | ) | | | (14,039 | ) | | | 4,039 | |
Interest expense | | | 30,000 | | | | 16,971 | | | | 13,029 | |
Depreciation and amortization | | | 140,000 | | | | 79,445 | | | | 60,555 | |
Acquisition-related transaction expenses | | | 13,000 | | | | 7,588 | | | | 5,412 | |
Contingent consideration fair value adjustment | | | 325,000 | | | | 201,564 | | | | 123,436 | |
Gain on legal settlements and related legal expense | | | — | | | | (10,664 | ) | | | 10,664 | |
Gain on sale of building, net of transfer tax(1) | | | — | | | | (314,247 | ) | | | 314,247 | |
Stock-based compensation expense | | | 130,000 | | | | 81,482 | | | | 48,518 | |
Adjusted EBITDA | $ | | 85,000 | | $ | | 87,215 | | $ | | (2,215 | ) |
| | | | | | | | | | | | |
Basic net (loss) income per share | $ | | (0.54 | ) | $ | | 0.04 | | $ | | (0.58 | ) |
Diluted net (loss) income per share | $ | | (0.54 | ) | $ | | 0.04 | | $ | | (0.58 | ) |
| | | | | | | | | | | | |
GAAP basic shares | | | 1,020,000 | | | | 938,709 | | | | 81,291 | |
GAAP diluted shares | | | 1,020,000 | | | | 974,020 | | | | 45,980 | |
(1) | The gain on the sale of the building, net of transfer tax, was recorded within “Other income (expense), net” in our consolidated statement of operations for the twelve months ended December 31, 2019. |
| | |
| | 17 |