Exhibit 99.1

Zynga Q3 2020 Letter to Shareholders November 4, 2020
Zynga q3 2020 letter to shareholders November 4, 2020

Dear Shareholders,
We look forward to discussing our Q3 2020 results during today’s earnings call at 2:00 p.m. PT. This letter details our Q3 performance, as well as our outlook for Q4, fiscal year 2020 and growth opportunities in 2021 and beyond. Please note that we manage our business based on topline measures including revenue, which is comprised of the change in deferred revenue and bookings. Revenue and the change in deferred revenue are both directly affected by bookings results, and management utilizes bookings as a primary topline measure to help inform its decisions.
Executive Summary
We delivered strong Q3 results, ahead of guidance across all key financial measures, including our highest ever quarterly revenue and bookings as well as our best Q3 operating cash flow. While we continue to live in unprecedented times, the execution of our multi-year growth strategy has driven our tremendous results to date and generated positive momentum across our business. Today, we are raising our full year 2020 guidance and are uniquely positioned to be an interactive entertainment growth leader in 2021 and beyond.
Strength in live services is the foundation of our multi-year growth strategy. By delivering a steady cadence of innovative bold beats, we are able to drive recurring growth collectively across our highly diversified portfolio of Forever Franchises as well as our Social Slots and Casual Cards portfolios. In Q3, live services drove our best revenue and bookings results ever with revenue of $503 million, up 46% year-over-year, and bookings of $628 million, up 59% year-over-year. In particular, our Social Slots portfolio marked its best revenue and bookings quarter in Zynga history, in addition to record Q3 performances from Words With Friends, CSR2 and our Casual Cards portfolio. Toon Blast and Toy Blast also performed well in their first full quarter at Zynga and were key drivers of our year-over-year topline growth alongside Empires & Puzzles and Merge Magic!. Our strong live services results once again generated greater than expected operating leverage and our best Q3 operating cash flow of $113 million, up 65% year-over-year.
We also have an exciting multi-year pipeline of new games to further expand our live services portfolio. This includes multiple titles that have the potential to become new Forever Franchises, as well as fast-to-market games developed using a rapid prototyping approach. On September 23, 2020, we launched one of our key new franchises worldwide – Harry Potter: Puzzles & Spells – which is off to a great start with positive player feedback as well as 4.8 average star ratings on both the Apple App Store and Google Play. Building upon its positive launch momentum, we expect the game to steadily scale over the coming quarters and be a meaningful growth driver for Zynga in 2021. FarmVille 3 and Puzzle Combat are also progressing well in soft launch as both titles rigorously test new feature sets designed to deliver long-term engagement and monetization. Over the coming years, we plan to release additional titles that are currently in development including games based on CityVille, Star WarsTM and more new intellectual properties.
We remain incredibly excited by the growth and innovation ahead for interactive entertainment as more people around the world come together to connect and socialize through gaming experiences. As the industry continues to expand and evolve, we are investing in new markets, categories, platforms and technologies that have the ability to increase Zynga’s total addressable market and further accelerate our growth over the long term. Specifically, in Q3, we made great progress on growing our international audience and on October 1, 2020, entered the high-growth hyper-casual games category with our acquisition of Rollic.
In the quarter, we grew our international revenue and bookings by 44% and 49% year-over-year, respectively. In Asia, the addition of Toon Blast and our steady investments in Empires & Puzzles drove user pay revenue and bookings up 70% and 88% year-over-year, respectively. For Harry Potter: Puzzles & Spells, we are partnering with LINE, a leading social network in Japan, to promote the title and connect players in the game.
We recently closed our acquisition of Istanbul-based Rollic – marking our entry into hyper-casual, one of the largest and fastest growing mobile game categories. In addition to its incredibly talented team and community of external developers, Rollic brings a portfolio of popular hyper-casual games and a robust prototyping approach to new game development that meaningfully expands our audience base and advertising business. Rollic’s large and diversified audience base will be valuable to Zynga as the mobile games industry and advertising landscape continue to evolve and grow. Over the next few years, we expect to scale in this exciting growth category and build out Zynga’s audience network, which will unlock more cross-promotion opportunities as well as new potential advertising capabilities.
As we look ahead, we continue to see more opportunities to acquire talented teams and franchises to further expand our capabilities and accelerate our growth. To date, our acquisitions have delivered strong contributions to our live services, added multiple new Forever Franchises to our portfolio, expanded our new game pipeline and provided entry into new categories on mobile. Our proven integration model enables teams to maintain their unique development cultures while leveraging Zynga’s highly scalable studio operations and publishing platform so we can collectively grow faster together.
Building on our strong live services performance to date and the addition of Rollic, we are raising our full year 2020 guidance to $1.93 billion in revenue, up $129 million versus our prior guidance and 46% year-over-year, and $2.24 billion in bookings, up $41 million versus our prior guidance and 43% year-over-year. Our raised guidance has us on track to deliver Zynga’s highest ever annual revenue and bookings, in addition to being one of the fastest growing public gaming companies this year.
Q3 Highlights
| • | Highest revenue and bookings performances in Zynga history with revenue of $503 million, up 46% year-over-year, and bookings of $628 million, up 59% year-over-year. |
| • | Record online game – or user pay – revenue of $436 million, up 55% year-over-year, and user pay bookings of $561 million, up 69% year-over-year. |
| • | Record international revenue of $191 million, up 44% year-over-year, and international bookings of $241 million, up 49% year-over-year. |
| • | Highest revenue and bookings quarter for our Social Slots portfolio, in addition to record Q3 revenue and bookings performances by Words With Friends, CSR2 and our Casual Cards portfolio. |
| • | Toon Blast and Toy Blast performed well in their first full quarter at Zynga and were key drivers of our year-over-year topline growth alongside Empires & Puzzles and Merge Magic!. |
| • | Launched Harry Potter: Puzzles & Spells in late September, which is off to a great start with positive player feedback and strong initial player engagement. |
| • | Best average mobile daily active users (DAUs) and average mobile monthly active users (MAUs) in more than six years with mobile DAUs of 31 million, up 53% year-over-year, and mobile MAUs of 83 million, up 23% year-over-year. |
| • | Generated operating cash flow of $113 million, our best Q3 performance and up 65% year-over-year. |
| • | Completed our acquisition of Rollic on October 1, 2020, marking our entry into the fast-growing hyper-casual market and bringing a highly talented team with an extensive network of external developers to Zynga. |
| • | All Zynga employees continued to work from home seamlessly while delivering on a robust lineup of bold beats across our live services portfolio as well as the launch of Harry Potter: Puzzles & Spells. |
 portkey games harry potter puzzles & spells
Financials
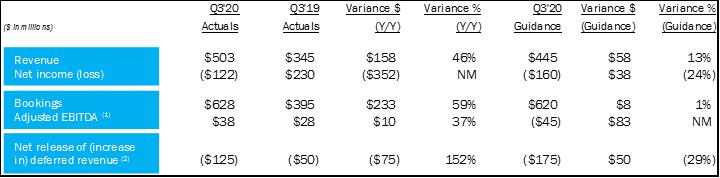
In Q3, we delivered our highest quarterly revenue and bookings, with revenue of $503 million, above our guidance by $58 million and up $158 million or 46% year-over-year, and bookings of $628 million, beating our guidance by $8 million and up $233 million or 59% year-over-year. Live services drove our record results, with stronger than anticipated performances from Words With Friends, our Social Slots portfolio and CSR2 driving our topline beat versus guidance.
We generated record user pay revenue of $436 million, up 55% year-over-year, and user pay bookings of $561 million, up 69% year-over-year. Advertising revenue and bookings were $67 million, up 6% and 5% year-over-year, respectively. In the quarter, we experienced steady sequential growth in advertising yields primarily driven by strong advertiser demand.
Our net increase in deferred revenue was $125 million versus our guidance of $175 million and Q3 2019 net increase of $50 million. The primary driver of the year-over-year net increase in deferred revenue was the deferral of initial bookings from Toon Blast and Toy Blast consistent with standard accounting practices for newly acquired games. We ended Q3 with a deferred revenue balance of $655 million versus $403 million a year ago.
 (
(
(In millions) q3’20 actuals q3’19 actuals variance $ (Y/y) variance % (y/y) q3’20 guidance variance $ (guidance) variance % (guidance) revenue $503 $345 $158 46% $445 $58 13% net income (loss) ($122) $230 ($352) NM ($160) $38 (24%) bookings $628 $395 $233 59% $620 $8 1% adjusted ebitda (1) $38 $28 $10 37% ($45) $83 NM net release of (increase in) deferrred revenue (2) ($125) ($50) ($75) 152% ($175) $50 (29%)
Note: Certain measures as presented differ due to the impact of rounding. NM - not meaningful.
(1) | Adjusted EBITDA includes the net release of (increase in) deferred revenue. |
(2) | For clarity, a net release of deferred revenue results in revenue being higher than bookings and is a positive impact to Adjusted EBITDA as reported; a net increase in deferred revenue results in revenue being lower than bookings and is a negative impact to Adjusted EBITDA as reported. |
GAAP gross margins decreased to 53% of revenue from 61% in Q3 2019 primarily due to a higher net increase in deferred revenue, amortization of acquired intangible assets and user pay mix. GAAP operating expenses decreased to 77% of revenue from 83% in Q3 2019 driven by stronger operating leverage primarily from R&D and partially offset by higher marketing investments year-over-year. Non-GAAP operating expenses decreased to 44% of bookings from 52% a year ago due to greater operating leverage primarily from R&D and G&A operating expense line items.
We had a net loss of $122 million, $38 million better than guidance primarily driven by our lower than expected net increase in deferred revenue and stronger operating performance, partially offset by a higher than anticipated increase in contingent consideration expense. On a year-over-year basis, when excluding the $314 million one-time gain related to the sale of our San Francisco building in Q3 2019, our net loss grew by $38 million primarily due to the higher net increase in deferred revenue, amortization of acquired intangibles and stock-based compensation, partially offset by our improved operating performance.
Adjusted EBITDA was $38 million, above our guidance by $83 million, primarily due to our lower than expected net increase in deferred revenue and improved operating performance. On a year-over-year basis, Adjusted EBITDA increased $10 million driven by improved operating performance, partially offset by a higher net increase in deferred revenue.
We generated operating cash flow of $113 million, our best Q3 performance and up 65% year-over-year.
We achieved our best average mobile DAUs and average mobile MAUs in more than six years – with mobile DAUs of 31 million, up 53% year-over-year, and mobile MAUs of 83 million, up 23% year-over-year. This growth was primarily driven by the first full quarter additions of Toon Blast and Toy Blast. During the period, audience engagement was strong and mobile average bookings per mobile DAU (ABPU) of $0.213 were up 5% year-over-year.
Product
We have a highly diversified live services portfolio of Forever Franchises as well as our Social Slots and Casual Cards portfolios. In any given quarter, we expect that the performance of individual titles may vary, with our collective portfolio delivering recurring growth and the vast majority of our overall performance. Our live services performed well in Q3 and we are excited for the bold beats we have planned for Q4 and beyond.
CSR2 had a record Q3, marking its highest revenue quarter ever and second highest bookings quarter. The American Road Trip event series took players virtually across the country while unlocking unique cars created in partnership with renowned American builders. For the finale event, we also worked with NASCAR to release the Chevrolet Camaro ZL1 1LE race car. In Q4, Fast & FuriousTM returns to CSR2 for an event series that features 10 new franchise cars, and we also expect to launch Elite Tuners, which provides enhanced customization of tires, body kits, spoilers and more.
Empires & Puzzles kicked off a strong Q3 with a new summer event, Sand Empires, followed by a new feature, Goblin Balloon, which enables players to claim additional in-game items after completing Wanted Missions. In additional events throughout the quarter, we also introduced six new legendary heroes including Lady Loki and Frigg. Looking to Q4, we have more exciting events planned for the title, including a brand-new Ninja Tower experience and a ‘Return to Morlovia’ Halloween celebration.
Harry Potter: Puzzles & Spells, the only Match-3 mobile game based on the original Harry PotterTM books and movies, launched in late September and is off to a fantastic start with positive player feedback and strong initial player engagement. In the game, players enter a Match-3 adventure brimming with the spells, humor, color and characters of the Wizarding World. In support of the game’s debut, popstar Zayn Malik joined Zynga in igniting social media globally.
Merge Dragons! was a core contributor in Q3 as players enjoyed Anniversary, Friendship, Egyptian and Underwater themed events featuring unique items and special dragons. In Q4, we will globally launch our Royal Pass feature and run our first Camp & Chill event as well as other seasonal events for Halloween, Thanksgiving and Christmas.
Merge Magic! released Arcane Forest, Fiery Elements, Thunder Mountains and Golden Spirits events in Q3, in addition to ongoing launches of Season Pass. In Q4, we plan on rolling out a new Season Vault feature, which will release additional content to players who have completed Season Pass early. Across both Merge Dragons! and Merge Magic!, we are also continuing to test new features to amplify the long-term player experience.
Our Social Slots portfolio achieved yet another all-time record revenue and bookings quarter in Q3 driven by new features and content. Hit It Rich! Slots introduced Elite, a new exclusive in-app club with amazing benefits. Wizard of Oz Slots released Rainbow Rush, a new solo-player league experience. Game of ThronesTM Slots Casino featured exciting quests as well as a new 7 Gifts event filled with more ways for players to win additional coins. Willy Wonka Slots released Wonka Slots Club, which brought exclusive benefits to players who gained entrance to the club. In Q4, we look forward to introducing more innovative features and events through the upcoming holiday season.
Toon Blast performed well in its first full quarter as a part of Zynga. In Q3, we rigorously tested a new Cooper’s Rally event within the game, which matches small teams in a high-intensity, fast-paced competition. As we look to Q4, we expect to introduce Cooper’s Rally to our full player base while also testing more new events and feature sets.
Toy Blast also completed a successful first full quarter at Zynga. In the quarter, we updated the title’s beloved cubes to a more modern look, which has been universally well-received. Additionally, we tested a new Hoop Shot event that is expected to launch in Q4 and enables players to compete in a variety of fun challenges to win exciting in-game rewards.
Words With Friends achieved record Q3 revenue and bookings driven by strong player engagement and advertising yields. We also released Stickers, a brand new way for players to express themselves with every move they send. Looking ahead to Q4, we expect to introduce Word Rivals, the second mini-game in our arsenal of quick play events. In October, we also partnered with the American Cancer Society to host our second annual #WordsWithHope initiative supporting Breast Cancer Awareness Month, in addition to a partnership with Born This Way Foundation, co-founded by Lady Gaga and her mother, Cynthia Germanotta, to support World Mental Health Day on October 12 with the special word of the day, ‘stay’.
Zynga Poker delivered a solid Q3. Building upon our introduction of Watches in Q2, we introduced Rings in Q3 – a new collectibles system focused on driving long-term engagement in tournaments by rewarding players with extravagant rings and unique chip prizes. In Q4, we expect to roll out both limited edition Rings and Watches through new events.
Forward Outlook
Our Q4 and full year 2020 guidance have been developed based on information available as of November 4, 2020 and a similar methodology to prior quarters. Given the level of continued volatility and uncertainty around the COVID-19 pandemic, there is the potential for a wider range of outcomes – both positive and negative – as it relates to our ultimate business results.
Q4 Guidance
| • | Net increase in deferred revenue of $100 million |
| • | Bookings of $670 million |
| • | Adjusted EBITDA of $35 million |
In Q4, we expect revenue of $570 million, up $166 million or 41% year-over-year, and bookings of $670 million, up $237 million or 55% year-over-year. Live services, including full quarter contributions from Toon Blast, Toy Blast and Rollic’s hyper-casual games portfolio, will drive the vast majority of our topline growth. We also expect initial contributions from Harry Potter: Puzzles & Spells, which launched at the end of Q3 and is expected to scale steadily in Q4 and into 2021. This overall momentum will be partially offset by year-over-year declines in older mobile and web titles. Our topline guidance does not assume the launch of additional new titles in Q4.
Due to a higher net increase in deferred revenue, amortization of acquired intangibles and user pay mix, we expect gross margins to be down significantly year-over-year. We also anticipate our GAAP operating expenses as a percentage of revenue to increase year-over-year primarily driven by the significantly higher net increase in deferred revenue and increase in stock-based compensation, partially offset by lower contingent consideration expense.
Outside of these factors, we anticipate year-over-year operating leverage improvements in R&D and G&A, which will be more than offset by higher marketing investments across our live services including full quarter investments in Toon Blast, Toy Blast and Rollic’s hyper-casual portfolio. Additionally, building upon Harry Potter: Puzzles & Spells’ successful launch momentum, we plan to invest meaningful marketing dollars to steadily scale the title in Q4 and into 2021.
We expect a net loss of $92 million in Q4 2020 versus a net loss of $4 million in Q4 2019. We expect key drivers of the year-over-year change to be the significantly higher net increase in deferred revenue, as well as increases in amortization of acquired intangibles and stock-based compensation. This will be partially offset by our improved operating performance, lower contingent consideration expense and a benefit from income taxes.
We expect Adjusted EBITDA of $35 million in Q4 2020 versus Adjusted EBITDA of $75 million in Q4 2019. This year-over-year change is primarily driven by the $71 million year-over-year growth in the net increase in deferred revenue, partially offset by our improved operating performance.
2020 & Beyond
| • | Revenue of $1.93 billion |
| • | Net increase in deferred revenue of $312 million |
| • | Bookings of $2.24 billion |
| • | Net loss of $468 million |
| • | Adjusted EBITDA of $211 million |
While we continue to live in unprecedented times, the execution of our multi-year growth strategy has driven our tremendous performance to date and generated positive momentum across our business. Today, we are raising our full year 2020 guidance for revenue to $1.93 billion, up $129 million versus our prior guidance and 46% year-over-year. This is comprised of a net increase in deferred revenue of $312 million, down $88 million versus our prior guidance and up 29% year-over-year, and bookings of $2.24 billion, up $41 million versus our prior guidance and 43% year-over-year. The primary drivers of our increased outlook include the first full quarter addition of Rollic as well as continued strength in our live services portfolio.
For full year 2020, we expect to deliver our best annual revenue and bookings in Zynga history. We also expect to drive stronger year-over-year operating leverage across R&D and G&A expense line items, which should outweigh pressure from higher marketing investments and slightly lower gross margins from a higher net increase in deferred revenue, amortization of acquired intangibles and user pay mix.
Overall, execution of our multi-year growth strategy has driven our tremendous results to date and generated positive momentum across our business. We are uniquely positioned to be an interactive entertainment growth leader in 2021, where we continue to expect double-digit topline growth, as well as the potential for further margin expansion and positive operating cash flow.
Earnings Call
We will host our Q3 2020 earnings conference call today, Wednesday, November 4, at 2:00 p.m. PT (5:00 p.m. ET). The call can be accessed at http://investor.zynga.com or via the below conference dial-in number:
| • | Toll-Free Dial-In Number: (800) 537-0745 |
| • | International Dial-In Number: (253) 237-1142 |
Sincerely,
| | |

| | 
|
Frank Gibeau Chief Executive Officer | | Ger Griffin Chief Financial Officer |
Forward-Looking Statements
This letter contains forward-looking statements, including those statements relating to our outlook for the full year and fourth quarter of 2020, including under the headings “Executive Summary,” “Product,” “Forward Outlook,” “Q4 Guidance” and “2020 & Beyond” and statements relating to, among other things: our operational performance and strategy, including our focus on live services, growth projections relating to our Forever Franchises, expectation to launch new titles that have the potential to become Forever Franchises or that are fast-to-market games, including games currently in development based on CityVille, Star WarsTM, and more new intellectual properties, continued execution of our multi-year growth strategy which includes investing in new markets, categories, platforms and technologies, such as scaling in the hyper-casual category over the next few years, and our plans to enhance existing games with new events, features and updates, scale existing games and increase marketing investments for both our live services portfolio and new game launches; our ability to achieve the intended benefits of our acquisitions of Peak and Rollic, including expanding and diversifying our global audience and contributing to our expected and future financial performance; potential to drive topline growth, further margin expansion, and positive operating cash flow in 2021; our positioning to be an interactive entertainment growth leader; our performance expectations regarding our live services, Forever Franchises, older mobile and web titles, new game launches and advertising business, including contributions from Toon Blast, Toy Blast, Rollic’s hyper-casual portfolio, and Harry Potter: Puzzles & Spells; our opportunities to grow through additional acquisitions and by expanding our international audience; and our ability to achieve and expectations related to financial projections, including revenue, deferred revenue, bookings, income, adjusted EBITDA, contingent consideration accruals, amortization of acquired intangibles, user pay mix, stock-based compensation, marketing investments, income taxes, operating expenses, operating leverage, operating results, operating cash flow and margins.
Forward-looking statements often include words such as “outlook,” “projected,” “intend,” “will,” “anticipate,” “believe,” “target,” “expect,” “positioned,” and statements in the future tense are generally forward-looking. The achievement or success of the matters covered by such forward-looking statements involves significant risks, uncertainties and assumptions, including risks, uncertainty and assumptions relating to the COVID-19 pandemic, shelter-in-place rules and effects on business and economic conditions. Our actual results could differ materially from those predicted or implied and reported results should not be considered as an indication of our future performance. Undue reliance should not be placed on such forward-looking statements, which are based on information available to us on the date hereof. We assume no obligation to update such statements. More information about factors that could affect our operating results are described in greater detail in our public filings with the Securities and Exchange Commission (the “SEC”), copies of which may be obtained by visiting our Investor Relations web site at http://investor.zynga.com or the SEC's website at www.sec.gov.
In addition, the preliminary financial results set forth in this letter are estimates based on information currently available to us. While we believe these estimates are meaningful, they could differ from the actual amounts that we ultimately report in our Quarterly Report on Form 10-Q for the quarter ended September 30, 2020. We assume no obligation and do not intend to update these estimates prior to filing our Quarterly Report on Form 10-Q.
Key Operating Metrics
We manage our business by tracking several operating metrics: “Mobile DAUs,” which measure daily active users of our mobile games, “Mobile MAUs,” which measure monthly active users of our mobile games, and “Mobile ABPU,” which measures our average daily mobile bookings per average Mobile DAU, each of which is recorded and estimated by our internal analytics systems. We determine these operating metrics by using internal company data based on tracking of user account activity. We also use information provided by third parties, including third party network logins provided by platform providers, to help us track whether a player logged in under two or more different user accounts is the same individual. Overall, we believe that the amounts are reasonable estimates of our user base for the applicable period of measurement and that the methodologies we employ and update from time-to-time are reasonably based on our efforts to identify trends in player behavior. However, factors relating to user activity and systems and our ability to identify and detect attempts to replicate legitimate player activity may impact these numbers.
Mobile DAUs. We define Mobile DAUs as the number of individuals who played one of our mobile games during a particular day. Average Mobile DAUs for a particular period is the average of the Mobile DAUs for each day during that period. Under this metric, an individual who plays two different mobile games on the same day is counted as two DAUs. We use information provided by third parties to help us identify individuals who play the same game to reduce this duplication. However, we do not have the third party network login data to link an individual who has played under multiple user accounts for our mobile messenger games, Merge Magic! and games acquired from Gram Games in May 2018, Small Giant in January 2019 and Peak in July 2020 and accordingly, actual Mobile DAUs may be lower than reported due to the potential duplication of these individuals. We use Mobile DAUs as a measure of audience engagement.
Mobile MAUs. We define Mobile MAUs as the number of individuals who played one of our mobile games in the 30-day period ending with the measurement date. Average Mobile MAUs for a particular period is the average of the Mobile MAUs at each month-end during that period. Under this metric, an individual who plays two different mobile games in the same 30-day period is counted as two Mobile MAUs. We use information provided by third parties to help us identify individuals who play the same game to reduce this duplication. However, we do not have the third party network login data to link an individual who has played under multiple user accounts for our mobile messenger games, Merge Magic! and games acquired from Gram Games in May 2018, Small Giant in January 2019 and Peak in July 2020 and accordingly, actual Mobile MAUs may be lower than reported due to the potential duplication of these individuals. We use Mobile MAUs as a measure of total game audience size.
Mobile ABPU. We define Mobile ABPU as our total mobile bookings in a given period, divided by the number of days in that period, divided by the average Mobile DAUs during the period. We believe that Mobile ABPU provides useful information to investors and others in understanding and evaluating our results in the same manner as management. We use Mobile ABPU as a measure of overall monetization across all of our players through the sale of virtual items and advertising.
Our business model around our social games is designed so that, as more players play our games, social interactions increase and the more valuable our games and our business become. All engaged players of our games help drive our bookings and, consequently, both online game revenue and advertising revenue. Virtual items are purchased by players who are socializing with, competing against or collaborating with other players, most of whom do not buy virtual items. Accordingly, we primarily focus on Mobile DAUs, Mobile MAUs and Mobile ABPU, which we believe collectively best reflect key audience metrics.
Non-GAAP Financial Measures
We have provided in this letter certain non-GAAP financial measures to supplement our consolidated financial statements prepared in accordance with U.S. GAAP (our “GAAP financial statements”). Management uses non-GAAP financial measures internally in analyzing our financial results to assess operational performance and liquidity. Our non-GAAP financial measures may be different from non-GAAP financial measures used by other companies.
The presentation of our non-GAAP financial measures is not intended to be considered in isolation or as a substitute for, or superior to, our GAAP financial statements. We believe that both management and investors benefit from referring to our non-GAAP financial measures in assessing our performance and when planning, forecasting and analyzing future periods. We believe our non-GAAP financial measures are useful to investors because they allow for greater transparency with respect to key financial measures we use in making operating decisions and because our investors and analysts use them to help assess the health of our business.
We have provided reconciliations of our non-GAAP financial measures used in this letter to the most directly comparable GAAP financial measures in the following tables. Because of the following limitations of our non-GAAP financial measures, you should consider the non-GAAP financial measures presented in this letter with our GAAP financial statements.
Key limitations of our non-GAAP financial measures include:
| • | Bookings does not reflect that we defer and recognize online game revenue and revenue from certain advertising transactions over the estimated average playing period of payers for durable virtual items or as consumed for consumable virtual items; |
| • | Adjusted EBITDA does not include the impact of stock-based compensation expense, acquisition-related transaction expenses, contingent consideration fair value adjustments and legal settlements and related legal expense; |
| • | Adjusted EBITDA does not reflect provisions for or benefits from income taxes and does not include other income (expense) net, which includes foreign exchange and asset disposition gains and losses, interest expense and interest income; |
| • | Adjusted EBITDA excludes depreciation and amortization of tangible and intangible assets. Although depreciation and amortization are non-cash charges, the assets being depreciated and amortized may have to be replaced in the future; |
| • | Free cash flow is derived from net cash provided by operating activities less cash spent on capital expenditures; and |
| • | Non-GAAP Operating Expenses do not include the impact of stock-based compensation expense, acquisition-related transaction expenses, contingent consideration fair value adjustments, legal settlements and related legal expense or amortization of intangible assets from acquisitions. |
ZYNGA INC.
CONSOLIDATED BALANCE SHEETS
(In thousands, unaudited)
| | September 30, | | | December 31, | |
| | 2020 | | | 2019 | |
Assets | | | | | | | | |
Current assets: | | | | | | | | |
Cash and cash equivalents | | $ | 653,454 | | | $ | 423,323 | |
Short-term investments | | | 101,971 | | | | 938,173 | |
Accounts receivable, net of allowance of $400 at September 30, 2020 and $0 at December 31, 2019 | | | 233,768 | | | | 140,078 | |
Restricted cash | | | 6 | | | | 30,006 | |
Prepaid expenses | | | 28,052 | | | | 27,533 | |
Other current assets | | | 27,735 | | | | 16,557 | |
Total current assets | | | 1,044,986 | | | | 1,575,670 | |
Long-term investments | | | 2,540 | | | | 175,300 | |
Goodwill | | | 2,986,876 | | | | 1,460,933 | |
Intangible assets, net | | | 774,866 | | | | 233,005 | |
Property and equipment, net | | | 39,859 | | | | 25,826 | |
Right-of-use assets | | | 134,618 | | | | 136,972 | |
Restricted cash | | | 120,000 | | | | — | |
Prepaid expenses | | | 33,126 | | | | 37,815 | |
Other non-current assets | | | 14,376 | | | | 15,093 | |
Total assets | | $ | 5,151,247 | | | $ | 3,660,614 | |
Liabilities and stockholders’ equity | | | | | | | | |
Current liabilities: | | | | | | | | |
Accounts payable | | $ | 37,562 | | | $ | 27,799 | |
Income tax payable | | | 19,677 | | | | 649 | |
Deferred revenue | | | 654,283 | | | | 432,962 | |
Operating lease liabilities | | | 18,332 | | | | 15,753 | |
Other current liabilities | | | 424,878 | | | | 314,805 | |
Total current liabilities | | | 1,154,732 | | | | 791,968 | |
Convertible senior notes, net | | | 589,277 | | | | 570,456 | |
Deferred revenue | | | 912 | | | | 567 | |
Deferred tax liabilities, net | | | 124,528 | | | | 33,479 | |
Non-current operating lease liabilities | | | 125,356 | | | | 130,301 | |
Other non-current liabilities | | | 343,056 | | | | 158,413 | |
Total liabilities | | | 2,337,861 | | | | 1,685,184 | |
Stockholders’ equity: | | | | | | | | |
Common stock and additional paid-in capital | | | 5,137,360 | | | | 3,898,695 | |
Accumulated other comprehensive income (loss) | | | (106,878 | ) | | | (125,935 | ) |
Accumulated deficit | | | (2,217,096 | ) | | | (1,797,330 | ) |
Total stockholders’ equity | | | 2,813,386 | | | | 1,975,430 | |
Total liabilities and stockholders’ equity | | $ | 5,151,247 | | | $ | 3,660,614 | |
ZYNGA INC.
CONSOLIDATED STATEMENTS OF OPERATIONS
(In thousands, except per share data, unaudited)
| | Three Months Ended | | | Nine Months Ended | |
| | September 30, 2020 | | | June 30, 2020 | | | September 30, 2019 | | | September 30, 2020 | | | September 30, 2019 | |
Revenue: | | | | | | | | | | | | | | | | | | | | |
Online game | | $ | 436,011 | | | $ | 388,181 | | | $ | 281,651 | | | $ | 1,168,552 | | | $ | 722,523 | |
Advertising and other | | | 67,321 | | | | 63,507 | | | | 63,642 | | | | 190,235 | | | | 194,673 | |
Total revenue | | | 503,332 | | | | 451,688 | | | | 345,293 | | | | 1,358,787 | | | | 917,196 | |
Costs and expenses: | | | | | | | | | | | | | | | | | | | | |
Cost of revenue | | | 235,940 | | | | 179,208 | | | | 133,859 | | | | 561,350 | | | | 382,374 | |
Research and development | | | 165,947 | | | | 227,952 | | | | 137,487 | | | | 591,744 | | | | 401,461 | |
Sales and marketing | | | 186,999 | | | | 134,652 | | | | 120,836 | | | | 444,822 | | | | 336,376 | |
General and administrative | | | 36,081 | | | | 39,195 | | | | 26,774 | | | | 103,479 | | | | 73,517 | |
Total costs and expenses | | | 624,967 | | | | 581,007 | | | | 418,956 | | | | 1,701,395 | | | | 1,193,728 | |
Income (loss) from operations | | | (121,635 | ) | | | (129,319 | ) | | | (73,663 | ) | | | (342,608 | ) | | | (276,532 | ) |
Interest income | | | 1,029 | | | | 3,598 | | | | 6,597 | | | | 10,152 | | | | 7,929 | |
Interest expense | | | (7,322 | ) | | | (6,961 | ) | | | (6,728 | ) | | | (21,238 | ) | | | (10,158 | ) |
Other income (expense), net | | | (3,051 | ) | | | 571 | | | | 313,757 | | | | (4,810 | ) | | | 321,009 | |
Income (loss) before income taxes | | | (130,979 | ) | | | (132,111 | ) | | | 239,963 | | | | (358,504 | ) | | | 42,248 | |
Provision for (benefit from) income taxes | | | (8,773 | ) | | | 18,189 | | | | 9,880 | | | | 17,927 | | | | (3,177 | ) |
Net income (loss) | | $ | (122,206 | ) | | $ | (150,300 | ) | | $ | 230,083 | | | $ | (376,431 | ) | | $ | 45,425 | |
| | | | | | | | | | | | | | | | | | | | |
Net income (loss) per share attributable to common stockholders: | | | | | | | | | | | | | | | | | | | | |
Basic | | $ | (0.11 | ) | | $ | (0.16 | ) | | $ | 0.24 | | | $ | (0.38 | ) | | $ | 0.05 | |
Diluted | | $ | (0.11 | ) | | $ | (0.16 | ) | | $ | 0.24 | | | $ | (0.38 | ) | | $ | 0.05 | |
| | | | | | | | | | | | | | | | | | | | |
Weighted-average common shares used to compute net income (loss) per share attributable to common stockholders: | | | | | | | | | | | | | | | | | | | | |
Basic | | | 1,076,680 | | | | 956,854 | | | | 943,350 | | | | 995,642 | | | | 935,701 | |
Diluted | | | 1,076,680 | | | | 956,854 | | | | 973,830 | | | | 995,642 | | | | 970,801 | |
| | | | | | | | | | | | | | | | | | | | |
Stock-based compensation expense included in the above line items: | | | | | | | | | | | | | | | | | | | | |
Cost of revenue | | $ | 566 | | | $ | 544 | | | $ | 407 | | | $ | 1,548 | | | $ | 1,088 | |
Research and development | | | 25,380 | | | | 12,511 | | | | 12,029 | | | | 48,595 | | | | 35,982 | |
Sales and marketing | | | 3,957 | | | | 3,940 | | | | 3,046 | | | | 10,960 | | | | 8,453 | |
General and administrative | | | 8,821 | | | | 8,678 | | | | 5,857 | | | | 23,759 | | | | 15,944 | |
Total stock-based compensation expense | | $ | 38,724 | | | $ | 25,673 | | | $ | 21,339 | | | $ | 84,862 | | | $ | 61,467 | |
ZYNGA INC.
CONSOLIDATED STATEMENTS OF CASH FLOWS
(In thousands, unaudited)
| | Three Months Ended | | | Nine Months Ended | |
| | September 30, 2020 | | | June 30, 2020 | | | September 30, 2019 | | | September 30, 2020 | | | September 30, 2019 | |
Cash flows from operating activities: | | | | | | | | | | | | | | | | | | | | |
Net income (loss) | | $ | (122,206 | ) | | $ | (150,300 | ) | | $ | 230,083 | | | $ | (376,431 | ) | | $ | 45,425 | |
Adjustments to reconcile net income (loss) to net cash provided by (used in) operating activities: | | | | | | | | | | | | | | | | | | | | |
Depreciation and amortization | | | 49,191 | | | | 19,033 | | | | 19,069 | | | | 87,087 | | | | 59,818 | |
Stock-based compensation expense | | | 38,724 | | | | 25,673 | | | | 21,339 | | | | 84,862 | | | | 61,467 | |
(Gain) loss from sale of building, investments and other assets and foreign currency, net | | | 3,221 | | | | (1,646 | ) | | | (313,708 | ) | | | 2,498 | | | | (314,093 | ) |
(Accretion) amortization on marketable debt securities, net | | | 66 | | | | (415 | ) | | | (1,846 | ) | | | (2,249 | ) | | | (2,231 | ) |
Noncash lease expense | | | 4,145 | | | | 3,442 | | | | 3,612 | | | | 11,776 | | | | 6,773 | |
Noncash interest expense | | | 6,337 | | | | 6,274 | | | | 6,086 | | | | 18,821 | | | | 7,094 | |
Change in deferred income taxes and other | | | (28,620 | ) | | | 12,151 | | | | 11,864 | | | | (11,116 | ) | | | (22,167 | ) |
Changes in operating assets and liabilities: | | | | | | | | | | | | | | | | | | | | |
Accounts receivable, net | | | 15,101 | | | | (16,281 | ) | | | (5,926 | ) | | | (28,474 | ) | | | (32,436 | ) |
Prepaid expenses and other assets | | | (4,636 | ) | | | 9,742 | | | | (3,651 | ) | | | 6,468 | | | | 3,509 | |
Accounts payable | | | (1,298 | ) | | | 5,613 | | | | 4,449 | | | | (4,656 | ) | | | (2,839 | ) |
Deferred revenue | | | 123,795 | | | | 65,730 | | | | 50,165 | | | | 210,238 | | | | 206,154 | |
Income tax payable | | | 13,544 | | | | 3,328 | | | | (5,202 | ) | | | 19,331 | | | | (5,142 | ) |
Operating lease and other liabilities | | | 15,929 | | | | 162,814 | | | | 52,281 | | | | 205,108 | | | | 157,447 | |
Net cash provided by (used in) operating activities | | | 113,293 | | | | 145,158 | | | | 68,615 | | | | 223,263 | | | | 168,779 | |
Cash flows from investing activities: | | | | | | | | | | | | | | | | | | | | |
Purchases of investments | | | (11,632 | ) | | | (77,353 | ) | | | (749,533 | ) | | | (560,010 | ) | | | (873,624 | ) |
Maturities of investments | | | 101,209 | | | | 317,915 | | | | 24,000 | | | | 1,024,568 | | | | 40,500 | |
Sales of investments | | | 39,721 | | | | 413,380 | | | | 9,941 | | | | 549,909 | | | | 14,928 | |
Acquisition of property and equipment | | | (4,573 | ) | | | (2,955 | ) | | | (8,841 | ) | | | (16,074 | ) | | | (18,799 | ) |
Proceeds from sale of building and other property and equipment, net | | | 1 | | | | — | | | | 580,536 | | | | 27 | | | | 580,626 | |
Business acquisitions, net of cash acquired and restricted cash held in escrow | | | (791,096 | ) | | | — | | | | (2,459 | ) | | | (791,096 | ) | | | (301,816 | ) |
Release of restricted cash escrow from business combinations | | | (30,000 | ) | | | — | | | | — | | | | (30,000 | ) | | | (10,000 | ) |
Other investing activities, net | | | (411 | ) | | | — | | | | — | | | | (1,456 | ) | | | — | |
Net cash provided by (used in) investing activities | | | (696,781 | ) | | | 650,987 | | | | (146,356 | ) | | | 175,868 | | | | (568,185 | ) |
Cash flows from financing activities: | | | | | | | | | | | | | | | | | | | | |
Proceeds from issuance of debt, net | | | — | | | | — | | | | (530 | ) | | | — | | | | 672,152 | |
Purchase of capped calls | | | — | | | | — | | | | — | | | | — | | | | (73,830 | ) |
Taxes paid related to net share settlement of stockholders' equity awards | | | (13,829 | ) | | | (14,270 | ) | | | (10,808 | ) | | | (42,934 | ) | | | (38,428 | ) |
Proceeds from issuance of common stock | | | 5,460 | | | | 1,866 | | | | 5,490 | | | | 16,129 | | | | 12,521 | |
Repayment of debt | | | — | | | | — | | | | — | | | | — | | | | (101,364 | ) |
Acquisition-related contingent consideration payments | | | (15,500 | ) | | | — | | | | (12,900 | ) | | | (63,600 | ) | | | (12,900 | ) |
Other financing activities, net | | | — | | | | — | | | | — | | | | — | | | | (324 | ) |
Net cash provided by (used in) financing activities | | | (23,869 | ) | | | (12,404 | ) | | | (18,748 | ) | | | (90,405 | ) | | | 457,827 | |
| | | | | | | | | | | | | | | | | | | | |
Effect of exchange rate changes on cash, cash equivalents and restricted cash | | | 11,192 | | | | 3,457 | | | | (5,408 | ) | | | 11,405 | | | | 6,035 | |
| | | | | | | | | | | | | | | | | | | | |
Net change in cash, cash equivalents and restricted cash | | | (596,165 | ) | | | 787,198 | | | | (101,897 | ) | | | 320,131 | | | | 64,456 | |
Cash, cash equivalents and restricted cash, beginning of period | | | 1,369,625 | | | | 582,427 | | | | 746,349 | | | | 453,329 | | | | 579,996 | |
Cash, cash equivalents and restricted cash, end of period | | $ | 773,460 | | | $ | 1,369,625 | | | $ | 644,452 | | | $ | 773,460 | | | $ | 644,452 | |
ZYNGA INC.
RECONCILIATION OF GAAP TO NON-GAAP RESULTS
(In thousands, unaudited)
| | Three Months Ended | | | Nine Months Ended | |
| | September 30, 2020 | | | June 30, 2020 | | | September 30, 2019 | | | September 30, 2020 | | | September 30, 2019 | |
Reconciliation of Revenue to Bookings: Total | | | | | | | | | | | | | | | | | | | | |
Revenue | | $ | 503,332 | | | $ | 451,688 | | | $ | 345,293 | | | $ | 1,358,787 | | | $ | 917,196 | |
Change in deferred revenue | | | 124,631 | | | | 66,445 | | | | 49,513 | | | | 212,184 | | | | 213,468 | |
Bookings: Total | | $ | 627,963 | | | $ | 518,133 | | | $ | 394,806 | | | $ | 1,570,971 | | | $ | 1,130,664 | |
| | | | | | | | | | | | | | | | | | | | |
Reconciliation of Revenue to Bookings: Mobile | | | | | | | | | | | | | | | | | | | | |
Revenue | | $ | 484,182 | | | $ | 432,634 | | | $ | 327,578 | | | $ | 1,303,805 | | | $ | 861,114 | |
Change in deferred revenue | | | 124,819 | | | | 65,646 | | | | 49,983 | | | | 211,975 | | | | 216,143 | |
Bookings: Mobile | | $ | 609,001 | | | $ | 498,280 | | | $ | 377,561 | | | $ | 1,515,780 | | | $ | 1,077,257 | |
| | | | | | | | | | | | | | | | | | | | |
Reconciliation of Revenue to Bookings: Advertising | | | | | | | | | | | | | | | | | | | | |
Revenue | | $ | 67,280 | | | $ | 63,465 | | | $ | 63,599 | | | $ | 190,035 | | | $ | 194,443 | |
Change in deferred revenue | | | (296 | ) | | | (495 | ) | | | 155 | | | | (821 | ) | | | 272 | |
Bookings: Advertising | | $ | 66,984 | | | $ | 62,970 | | | $ | 63,754 | | | $ | 189,214 | | | $ | 194,715 | |
| | | | | | | | | | | | | | | | | | | | |
Reconciliation of Net Income (Loss) to Adjusted EBITDA | | | | | | | | | | | | | | | | | | | | |
Net income (loss) | | $ | (122,206 | ) | | $ | (150,300 | ) | | $ | 230,083 | | | $ | (376,431 | ) | | $ | 45,425 | |
Provision for (benefit from) income taxes | | | (8,773 | ) | | | 18,189 | | | | 9,880 | | | | 17,927 | | | | (3,177 | ) |
Other expense (income), net | | | 3,051 | | | | (571 | ) | | | 490 | | | | 4,810 | | | | (6,762 | ) |
Interest income | | | (1,029 | ) | | | (3,598 | ) | | | (6,597 | ) | | | (10,152 | ) | | | (7,929 | ) |
Interest expense | | | 7,322 | | | | 6,961 | | | | 6,728 | | | | 21,238 | | | | 10,158 | |
Depreciation and amortization | | | 49,191 | | | | 19,033 | | | | 19,069 | | | | 87,087 | | | | 59,818 | |
Acquisition-related transaction expenses | | | 4,642 | | | | 5,741 | | | | — | | | | 11,170 | | | | 7,588 | |
Contingent consideration fair value adjustment | | | 66,800 | | | | 148,904 | | | | 60,764 | | | | 335,704 | | | | 170,164 | |
Gain on legal settlements and related legal expense | | | — | | | | — | | | | — | | | | — | | | | (10,664 | ) |
Gain on sale of building, net of transfer tax(1) | | | — | | | | — | | | | (314,247 | ) | | | — | | | | (314,247 | ) |
Impairment of intangible assets | | | — | | | | — | | | | — | | | | — | | | | — | |
Stock-based compensation expense | | | 38,724 | | | | 25,673 | | | | 21,339 | | | | 84,862 | | | | 61,467 | |
Adjusted EBITDA | | $ | 37,722 | | | $ | 70,032 | | | $ | 27,509 | | | $ | 176,215 | | | $ | 11,841 | |
| | | | | | | | | | | | | | | | | | | | |
Reconciliation of GAAP Operating Expense to Non-GAAP Operating Expense | | | | | | | | | | | | | | | | | | | | |
GAAP operating expense | | $ | 389,027 | | | $ | 401,799 | | | $ | 285,097 | | | $ | 1,140,045 | | | $ | 811,354 | |
Amortization of intangible assets from acquisition | | | — | | | | — | | | | — | | | | — | | | | (291 | ) |
Acquisition-related transaction expenses | | | (4,642 | ) | | | (5,741 | ) | | | — | | | | (11,170 | ) | | | (7,588 | ) |
Contingent consideration fair value adjustment | | | (66,800 | ) | | | (148,904 | ) | | | (60,764 | ) | | | (335,704 | ) | | | (170,164 | ) |
Gain on legal settlements and related legal expense | | | — | | | | — | | | | — | | | | — | | | | 10,664 | |
Stock-based compensation expense | | | (38,158 | ) | | | (25,129 | ) | | | (20,932 | ) | | | (83,314 | ) | | | (60,379 | ) |
Non-GAAP operating expense | | $ | 279,427 | | | $ | 222,025 | | | $ | 203,401 | | | $ | 709,857 | | | $ | 583,596 | |
| | | | | | | | | | | | | | | | | | | | |
Reconciliation of Cash Provided by Operating Activities to Free Cash Flow | | | | | | | | | | | | | | | | | | | | |
Net cash provided by (used in) operating activities | | $ | 113,293 | | | $ | 145,158 | | | $ | 68,615 | | | $ | 223,263 | | | $ | 168,779 | |
Acquisition of property and equipment | | | (4,573 | ) | | | (2,955 | ) | | | (8,841 | ) | | | (16,074 | ) | | | (18,799 | ) |
Free cash flow | | $ | 108,720 | | | $ | 142,203 | | | $ | 59,774 | | | $ | 207,189 | | | $ | 149,980 | |
(1) | The gain on the sale of the building, net of transfer tax, was recorded within “Other income (expense), net” in our consolidated statement of operations for the three and nine months ended September 30, 2019. |
ZYNGA INC.
RECONCILIATION OF GAAP TO NON-GAAP FOURTH QUARTER 2020 GUIDANCE
(In thousands, except per share data, unaudited)
| | Fourth Quarter 2020 Guidance | | | Fourth Quarter 2019 Actual | | | Variance | |
Reconciliation of Revenue to Bookings | | | | | | | | | | | | |
Revenue | $ | | 570,000 | | $ | | 404,463 | | $ | | 165,537 | |
Change in deferred revenue | | | 100,000 | | | | 28,934 | | | | 71,066 | |
Bookings | $ | | 670,000 | | $ | | 433,397 | | $ | | 236,603 | |
| | | | | | | | | | | | |
Reconciliation of Net (Loss) Income to Adjusted EBITDA | | | | | | | | | | | | |
Net (loss) income | $ | | (92,000 | ) | $ | | (3,500 | ) | $ | | (88,500 | ) |
Provision for (benefit from) income taxes | | | (2,000 | ) | | | 8,587 | | | | (10,587 | ) |
Other (income) expense, net | | | — | | | | (1,458 | ) | | | 1,458 | |
Interest income | | | (1,000 | ) | | | (6,110 | ) | | | 5,110 | |
Interest expense | | | 8,000 | | | | 6,813 | | | | 1,187 | |
Depreciation and amortization | | | 55,000 | | | | 19,627 | | | | 35,373 | |
Acquisition-related transaction expenses | | | 2,000 | | | | — | | | | 2,000 | |
Contingent consideration fair value adjustment | | | 20,000 | | | | 31,400 | | | | (11,400 | ) |
Stock-based compensation expense | | | 45,000 | | | | 20,015 | | | | 24,985 | |
Adjusted EBITDA | $ | | 35,000 | | $ | | 75,374 | | $ | | (40,374 | ) |
| | | | | | | | | | | | |
Basic and diluted net (loss) income per share | $ | | (0.09 | ) | $ | | (0.00) | | $ | | (0.09 | ) |
| | | | | | | | | | | | |
GAAP basic and diluted shares | | | 1,080,000 | | | | 947,633 | | | | 132,367 | |
ZYNGA INC.
RECONCILIATION OF GAAP TO NON-GAAP RAISED FISCAL YEAR 2020 GUIDANCE
(In thousands, except per share data, unaudited)
| | Raised Fiscal Year 2020 Guidance | | | Fiscal Year 2019 Actual | | | Variance | |
Reconciliation of Revenue to Bookings | | | | | | | | | | | | |
Revenue | $ | | 1,928,786 | | $ | | 1,321,659 | | $ | | 607,127 | |
Change in deferred revenue | | | 312,184 | | | | 242,402 | | | | 69,782 | |
Bookings | $ | | 2,240,970 | | $ | | 1,564,061 | | $ | | 676,909 | |
| | | | | | | | | | | | |
Reconciliation of Net Income (Loss) to Adjusted EBITDA | | | | | | | | | | | | |
Net income (loss) | $ | | (468,431 | ) | $ | | 41,925 | | $ | | (510,356 | ) |
Provision for (benefit from) income taxes | | | 15,927 | | | | 5,410 | | | | 10,517 | |
Other (income) expense, net | | | 4,810 | | | | (8,220 | ) | | | 13,030 | |
Interest income | | | (11,153 | ) | | | (14,039 | ) | | | 2,886 | |
Interest expense | | | 29,238 | | | | 16,971 | | | | 12,267 | |
Depreciation and amortization | | | 142,087 | | | | 79,445 | | | | 62,642 | |
Acquisition-related transaction expenses | | | 13,169 | | | | 7,588 | | | | 5,581 | |
Contingent consideration fair value adjustment | | | 355,703 | | | | 201,564 | | | | 154,139 | |
Gain on legal settlements and related legal expense | | | — | | | | (10,664 | ) | | | 10,664 | |
Gain on sale of building, net of transfer tax(1) | | | — | | | | (314,247 | ) | | | 314,247 | |
Stock-based compensation expense | | | 129,866 | | | | 81,482 | | | | 48,384 | |
Adjusted EBITDA | $ | | 211,216 | | $ | | 87,215 | | $ | | 124,001 | |
| | | | | | | | | | | | |
Basic net (loss) income per share | $ | | (0.46 | ) | $ | | 0.04 | | $ | | (0.50 | ) |
Diluted net (loss) income per share | $ | | (0.46 | ) | $ | | 0.04 | | $ | | (0.50 | ) |
| | | | | | | | | | | | |
GAAP basic shares | | | 1,020,000 | | | | 938,709 | | | | 81,291 | |
GAAP diluted shares | | | 1,020,000 | | | | 974,020 | | | | 45,980 | |
(1) | The gain on the sale of the building, net of transfer tax, was recorded within “Other income (expense), net” in our consolidated statement of operations for the twelve months ended December 31, 2019. |