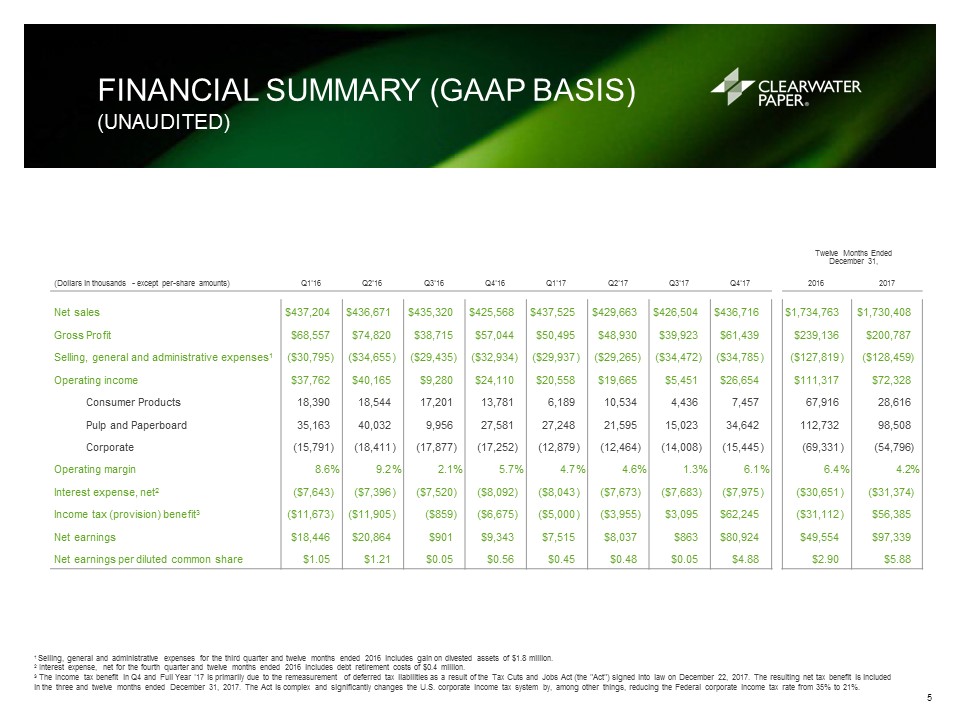
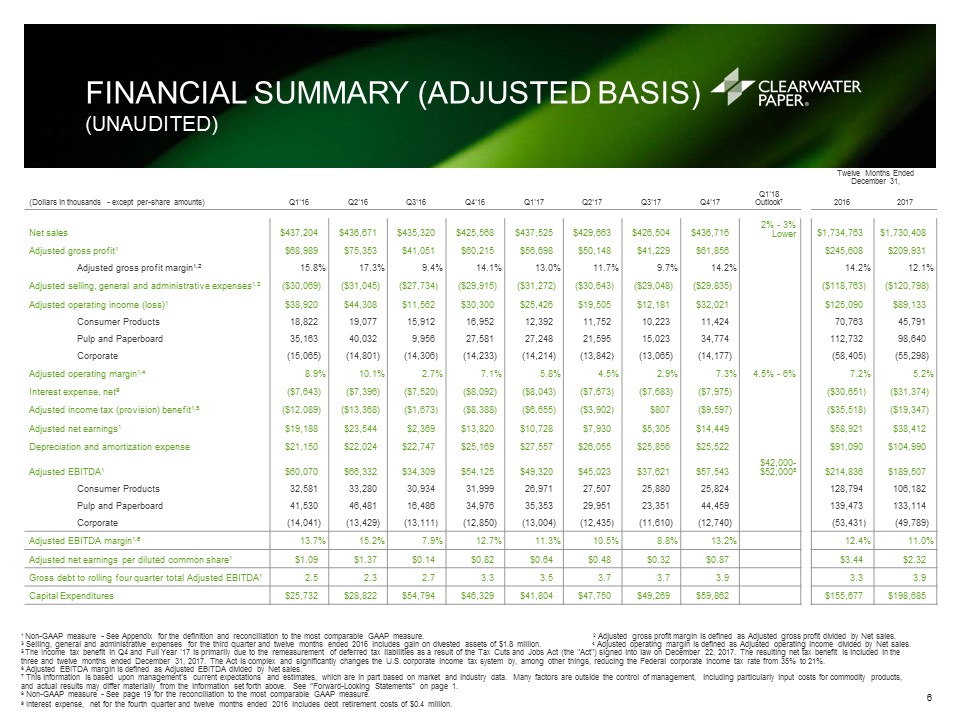
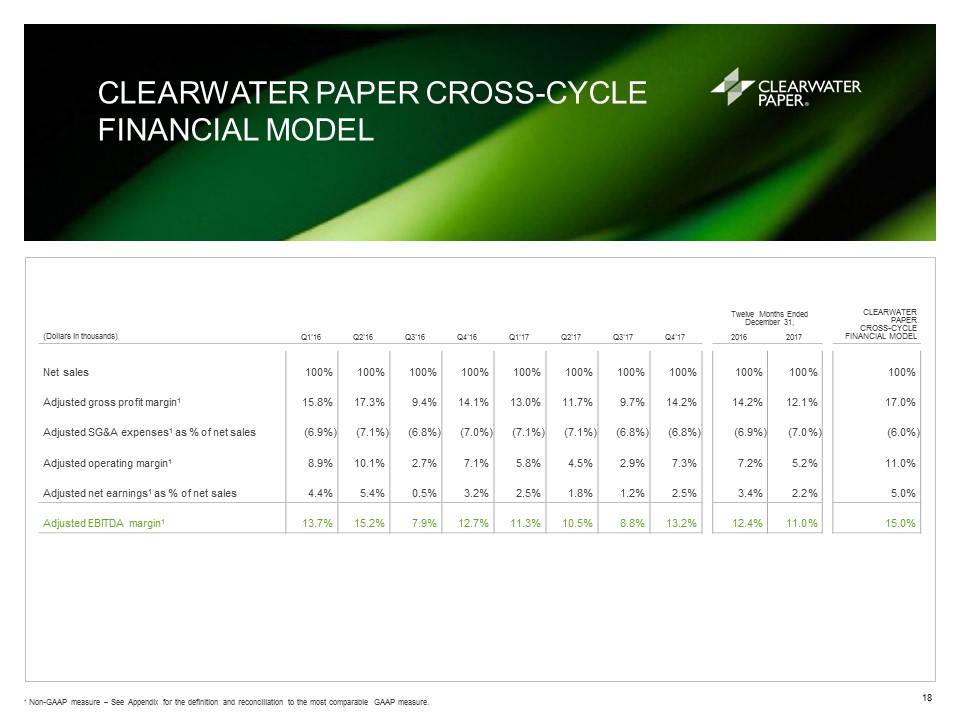
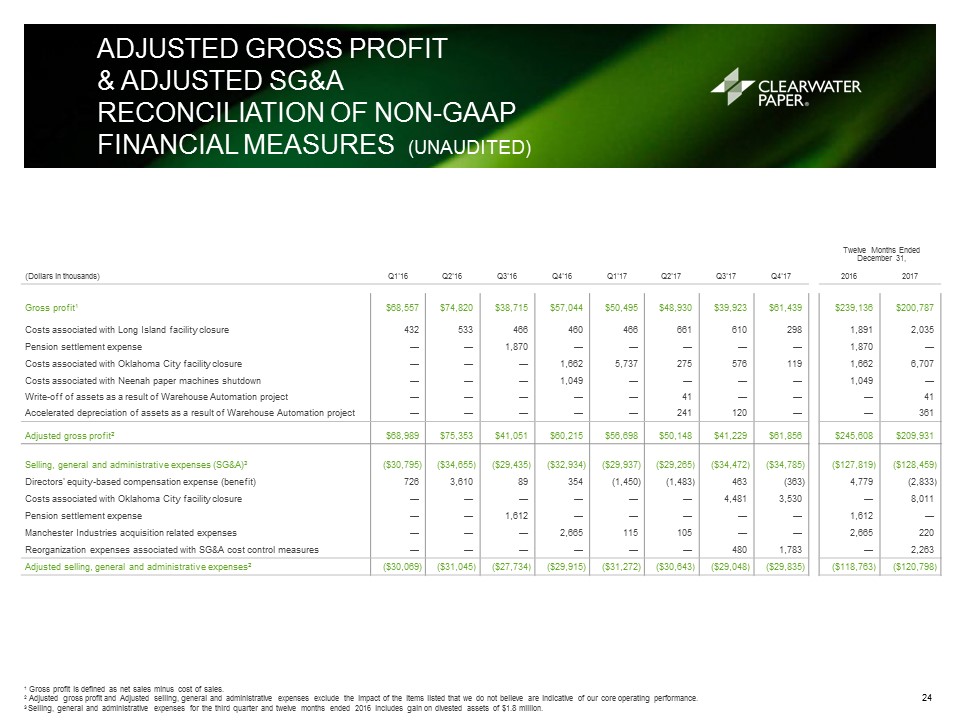
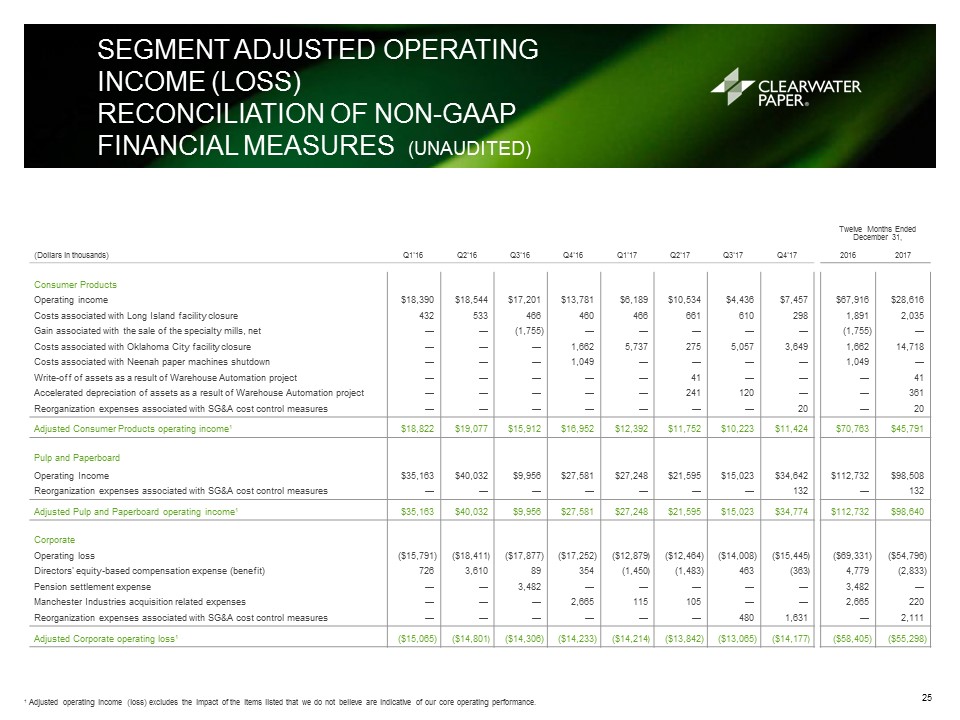
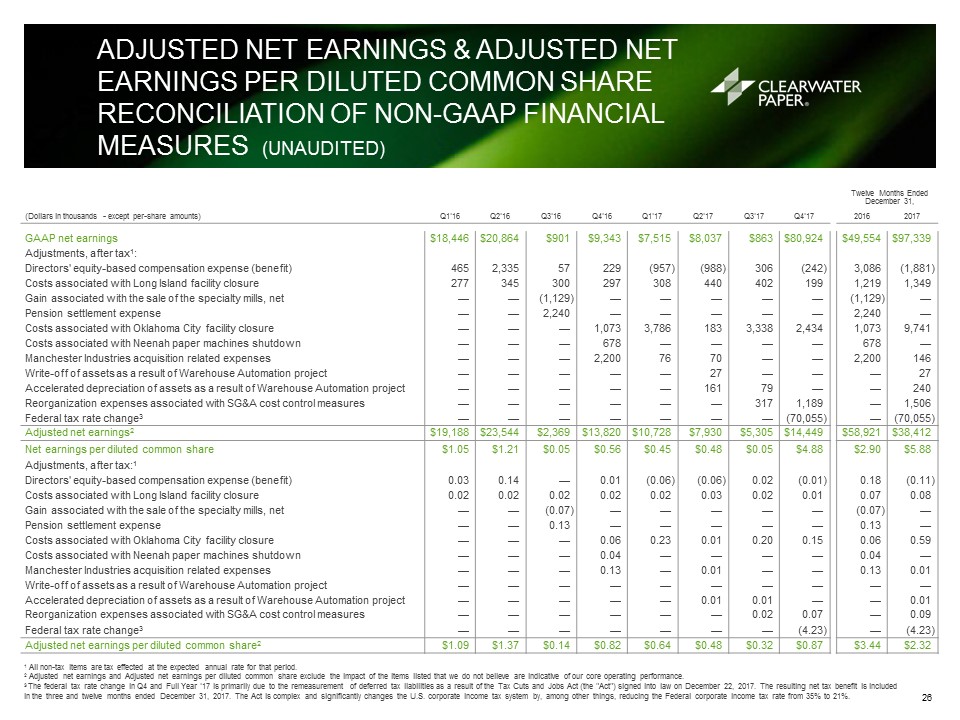
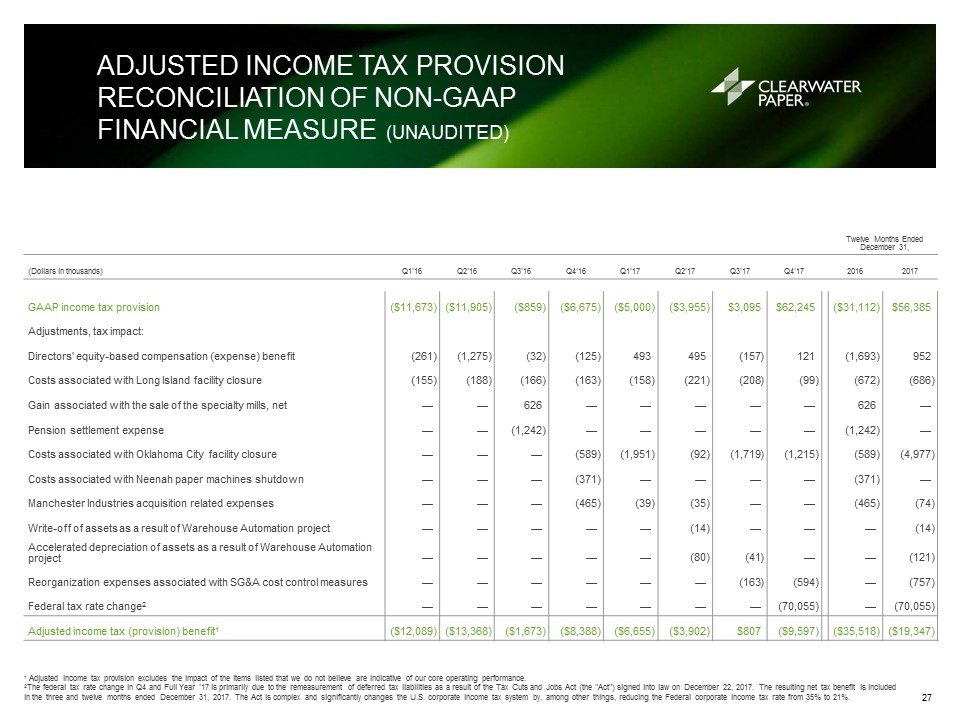
FINANCIAL SUMMARY (ADJUSTED BASIS)(UNAUDITED) 1 Non-GAAP measure - See Appendix for the definition and reconciliation to the most comparable GAAP measure. 2 Adjusted gross profit margin is defined as Adjusted gross profit divided by Net sales.3 Selling, general and administrative expenses for the third quarter and twelve months ended 2016 includes gain on divested assets of $1.8 million. 4 Adjusted operating margin is defined as Adjusted operating income divided by Net sales.5 The Income tax benefit in Q4 and Full Year '17 is primarily due to the remeasurement of deferred tax liabilities as a result of the Tax Cuts and Jobs Act (the "Act") signed into law on December 22, 2017. The resulting net tax benefit is included in the three and twelve months ended December 31, 2017. The Act is complex and significantly changes the U.S. corporate income tax system by, among other things, reducing the Federal corporate income tax rate from 35% to 21%.6 Adjusted EBITDA margin is defined as Adjusted EBITDA divided by Net sales.7 This information is based upon management’s current expectations and estimates, which are in part based on market and industry data. Many factors are outside the control of management, including particularly input costs for commodity products, and actual results may differ materially from the information set forth above. See “Forward-Looking Statements” on page 1.8 Non-GAAP measure - See page 19 for the reconciliation to the most comparable GAAP measure.9 Interest expense, net for the fourth quarter and twelve months ended 2016 includes debt retirement costs of $0.4 million. Twelve Months Ended December 31, (Dollars in thousands - except per-share amounts) Q1'16 Q2'16 Q3'16 Q4'16 Q1'17 Q2'17 Q3'17 Q4'17 Q1'18 Outlook7 2016 2017 Net sales $437,204 $436,671 $435,320 $425,568 $437,525 $429,663 $426,504 $436,716 2% - 3% Lower $1,734,763 $1,730,408 Adjusted gross profit1 $68,989 $75,353 $41,051 $60,215 $56,698 $50,148 $41,229 $61,856 $245,608 $209,931 Adjusted gross profit margin1,2 15.8 % 17.3 % 9.4 % 14.1 % 13.0 % 11.7 % 9.7 % 14.2 % 14.2 % 12.1 % Adjusted selling, general and administrative expenses1,3 ($30,069 ) ($31,045 ) ($27,734 ) ($29,915 ) ($31,272 ) ($30,643 ) ($29,048 ) ($29,835 ) ($118,763 ) ($120,798 ) Adjusted operating income (loss)1 $38,920 $44,308 $11,562 $30,300 $25,426 $19,505 $12,181 $32,021 $125,090 $89,133 Consumer Products 18,822 19,077 15,912 16,952 12,392 11,752 10,223 11,424 70,763 45,791 Pulp and Paperboard 35,163 40,032 9,956 27,581 27,248 21,595 15,023 34,774 112,732 98,640 Corporate (15,065 ) (14,801 ) (14,306 ) (14,233 ) (14,214 ) (13,842 ) (13,065 ) (14,177 ) (58,405 ) (55,298 ) Adjusted operating margin1,4 8.9 % 10.1 % 2.7 % 7.1 % 5.8 % 4.5 % 2.9 % 7.3 % 4.5% - 6% 7.2 % 5.2 % Interest expense, net9 ($7,643 ) ($7,396 ) ($7,520 ) ($8,092 ) ($8,043 ) ($7,673 ) ($7,683 ) ($7,975 ) ($30,651 ) ($31,374 ) Adjusted income tax (provision) benefit1,5 ($12,089 ) ($13,368 ) ($1,673 ) ($8,388 ) ($6,655 ) ($3,902 ) $807 ($9,597 ) ($35,518 ) ($19,347 ) Adjusted net earnings1 $19,188 $23,544 $2,369 $13,820 $10,728 $7,930 $5,305 $14,449 $58,921 $38,412 Depreciation and amortization expense $21,150 $22,024 $22,747 $25,169 $27,557 $26,055 $25,856 $25,522 $91,090 $104,990 Adjusted EBITDA1 $60,070 $66,332 $34,309 $54,125 $49,320 $45,023 $37,621 $57,543 $42,000-$52,0008 $214,836 $189,507 Consumer Products 32,581 33,280 30,934 31,999 26,971 27,507 25,880 25,824 128,794 106,182 Pulp and Paperboard 41,530 46,481 16,486 34,976 35,353 29,951 23,351 44,459 139,473 133,114 Corporate (14,041 ) (13,429 ) (13,111 ) (12,850 ) (13,004 ) (12,435 ) (11,610 ) (12,740 ) (53,431 ) (49,789 ) Adjusted EBITDA margin1,6 13.7 % 15.2 % 7.9 % 12.7 % 11.3 % 10.5 % 8.8 % 13.2 % 12.4 % 11.0 % Adjusted net earnings per diluted common share1 $1.09 $1.37 $0.14 $0.82 $0.64 $0.48 $0.32 $0.87 $3.44 $2.32 Gross debt to rolling four quarter total Adjusted EBITDA1 2.5 2.3 2.7 3.3 3.5 3.7 3.7 3.9 3.3 3.9 Capital Expenditures $25,732 $28,822 $54,794 $46,329 $41,804 $47,750 $49,269 $59,862 $155,677 $198,685 6