 - CONFIDENTIAL - December 3, 2012 Project Galaxy Confidential Discussion Materials for the Special Committee of the Board of Directors of Comet Exhibit (c)(3) |
 1 - CONFIDENTIAL - Disclaimer This presentation has been prepared by Centerview Partners LLC (“Centerview”) for use solely by the Special Committee of the Board of Directors (the “Committee”) of Comet (the “Company”) in connection with its evaluation of the proposed transaction and the Company’s strategic alternatives and for no other purpose. The information contained herein is based upon information supplied by the Company and publicly-available information, and portions of the information contained herein may be based upon statements, estimates and forecasts provided by the Company. We have relied upon the accuracy and completeness of the foregoing information, and have not assumed any responsibility for any independent verification of such information or for any independent evaluation or appraisal of any of the assets or liabilities (contingent or otherwise) of the Company or any other entity, or concerning solvency or fair value of the Company, its assets or any other entity. With respect to financial forecasts, including with respect to estimates of potential synergies, we have assumed that such forecasts have been reasonably prepared on bases reflecting the best currently available estimates and judgments of the management of the Company as to the future financial performance of the Company, and at your direction we have relied upon such forecasts, as provided by the Company’s management, with respect to the Company and Saturn, including as to expected synergies. We assume no responsibility for and express no view as to such forecasts or the assumptions on which they are based. The information set forth herein is based upon economic, monetary, market and other conditions as in effect on, and the information made available to us as of, the date hereof, unless indicated otherwise. The financial analysis in this presentation is complex and is not necessarily susceptible to a partial analysis or summary description. In performing this financial analysis, Centerview has considered the results of its analysis as a whole and did not necessarily attribute a particular weight to any particular portion of the analysis considered. Furthermore, selecting any portion of Centerview's analysis, without considering the analysis as a whole, would create an incomplete view of the process underlying its financial analysis. Centerview may have deemed various assumptions more or less probable than other assumptions, so the reference ranges resulting from any particular portion of the analysis described above should not be taken to be Centerview’s view of the actual value of the Company. These materials and the information contained herein are confidential, were not prepared with a view toward public disclosure, and may not be disclosed publicly or made available to third parties without the prior written consent of Centerview. These materials and any other advice, written or oral, rendered by Centerview is intended solely for the benefit and use of the Committee (in its capacity as such) in its consideration of the proposed transaction, and are not for the benefit of, and do not convey any rights or remedies for any holder of securities of the Company or any other person. Centerview will not be responsible for and has not provided any tax, accounting, actuarial, legal or other specialist advice. This presentation is not a fairness opinion, recommendation, valuation or opinion of any kind, and is necessarily incomplete and should be viewed solely in conjunction with the oral presentation provided by Centerview. |
 2 - CONFIDENTIAL - Table of Contents SECTION 1 .................................................................................................................... Situation Analysis SECTION 2 ............................................................................................ Preliminary Valuation Analyses APPENDIX A ....................................................................................................... Supporting Information |
 - CONFIDENTIAL - Situation Analysis Section 1 |
 4 - CONFIDENTIAL - Centerview has been engaged by the Special Committee of the Board of Directors of Comet to advise it on matters related to a potential sale or other strategic transaction Over the past several years, the Company has expended significant time and energy in exploring a range of potential transactions: – Sourcing additional large-scale wholesale customer agreements – Partnerships / change-of-control transactions (including multiple prior conversations with Saturn) – “Excess” spectrum sales – Financing transactions – Restructuring alternatives Above-referenced activities included members of Comet’s senior management team, Board of Directors and various financial advisors / lending sources, but pre-dated Centerview’s involvement Situation Overview Source: Comet management, public disclosures and Company filings. |
 5 - CONFIDENTIAL - During this same period, Comet has: – Signed several smaller wholesale arrangements, including with Leap Wireless, FreedomPop, etc. – Raised more than $1 billion in equity and debt capital – Renegotiated Sprint MVNO – Funded more than $4.5bn in capital expenditures since 2009 to complete WiMax network and begin LTE upgrades – Continued cost-saving initiatives, including maximizing the profitability of retail operations – Taken leadership position in driving global support for harmonized 2.5GHz usage and policies Notwithstanding the Company’s above-referenced progress, several threshold issues persist: – Management has indicated that the Company’s governance and ownership structure has impeded its ability to win new wholesale customers • Impact of Saturn/Parent transaction is unknown, and may exacerbate issue – Spectrum needs of domestic carriers have not yet become acute enough to force a strategic relationship or transaction with Comet – Company has insufficient resources to fund its plan, with a $2bn+ funding gap through FCF-positive • Plan assumes significant new wholesale volume, which to date the Company has been unable to secure • Without additional wholesale customers, funding gap grows to almost $4bn Situation Overview (cont’d.) Source: Comet management, public disclosures and Company filings. |
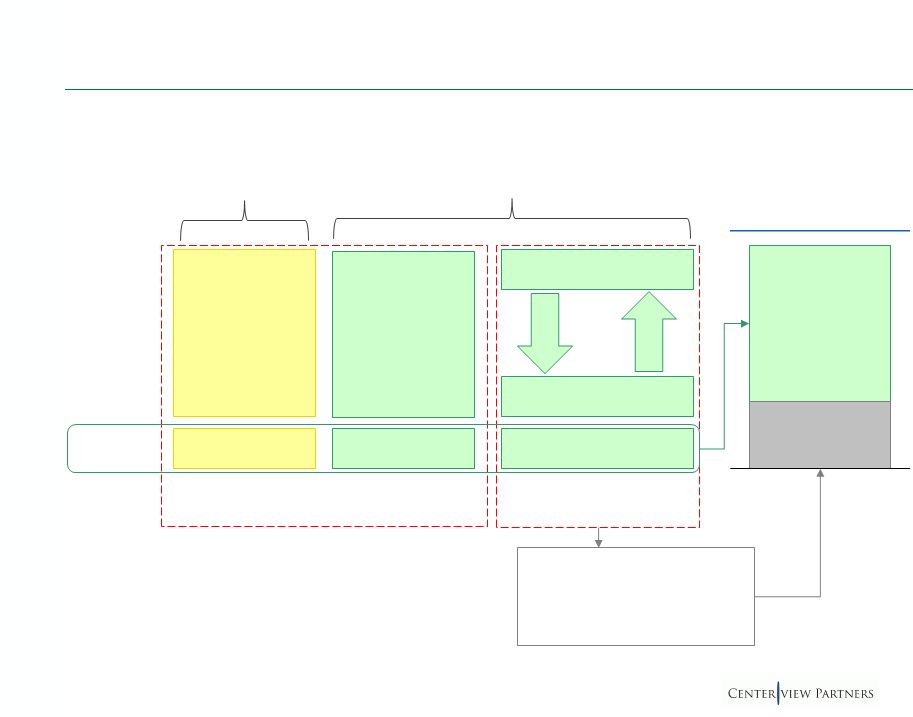
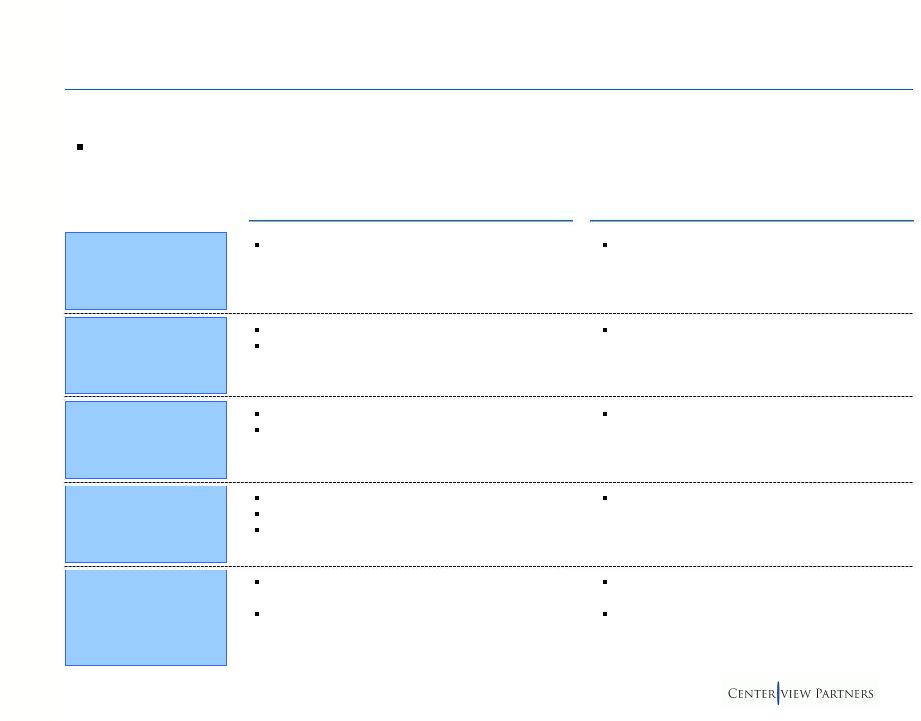
 6 - CONFIDENTIAL - Overview of Alternatives for Consideration Realizable value Saturn assumes obligations Upon completion, eliminates key risks Interim funding Conditionality Impact if transaction does not close SIGs’ support Net proceeds help address funding gap and provide time Likely permits refinancing at improved terms Dipper’s intended use of spectrum is unclear Saturn’s reaction/response Centerview’s analysis focuses on three key alternatives available to the Company Addresses capital structure issues Potential ability to address key governance issues, uneconomic leases, etc. Highly-uncertain outcome Equity recovery uncertain Sale or liquidation of spectrum may be required Saturn and Dipper have ability to influence process outcome SIGs’ reaction/response (however, provides addt’l time) I. Sale to Saturn II. Sale of Spectrum to Dipper III. Chapter 11 Restructuring Benefits Considerations Wholesale Customers Governance / Ownership Liquidity Solution to Key Comet Issues? |
 7 - CONFIDENTIAL - I. Summary of Saturn Proposal Key Terms | Received November 21, 2012 Consideration Conditions to Sign - General $2.60/share in cash for 100% of equity interests it does not already own Approval of Comet and Saturn Boards of Directors Approval of Parent Implies ~$0.20/MHz-pop Structure Reverse triangular merger Conditions to Sign - SIGs Voting agreements in favor of the transaction Equityholders’ Agreement is terminated MVNO agreement is terminated Saturn standstill is waived Agreement to sell shares to Saturn irrespective of transaction outcome (pursuant to RoFO) Conditions to Close Comet shareholder vote Closing of Saturn/Parent transaction No MAE on Comet No Comet dissenting shares in excess of specified percentage (percentage not specified) Regulatory approval and other standard closing conditions Expectation is that other than with respect to existing exchangeable debt, transaction would not trigger change of control of existing debt Requires affirmative vote of 75% of all shares and possibly majority of minority (non-Saturn shareholders) Parent has ability to terminate its transaction with Saturn if it has not received financing by the drop- dead date (October 2013) Interim Financing $600mm total availability, subject to network milestones 1.00% Senior Exchangeable Notes due 2018 Exchangeable at $1.25/share (vs. $2.32 current) Non-call life Matching right on spectrum sale if transaction does not close Pari passu with existing exchangeable debt Requires shareholder approval to increase authorized shares Proposal Comments |
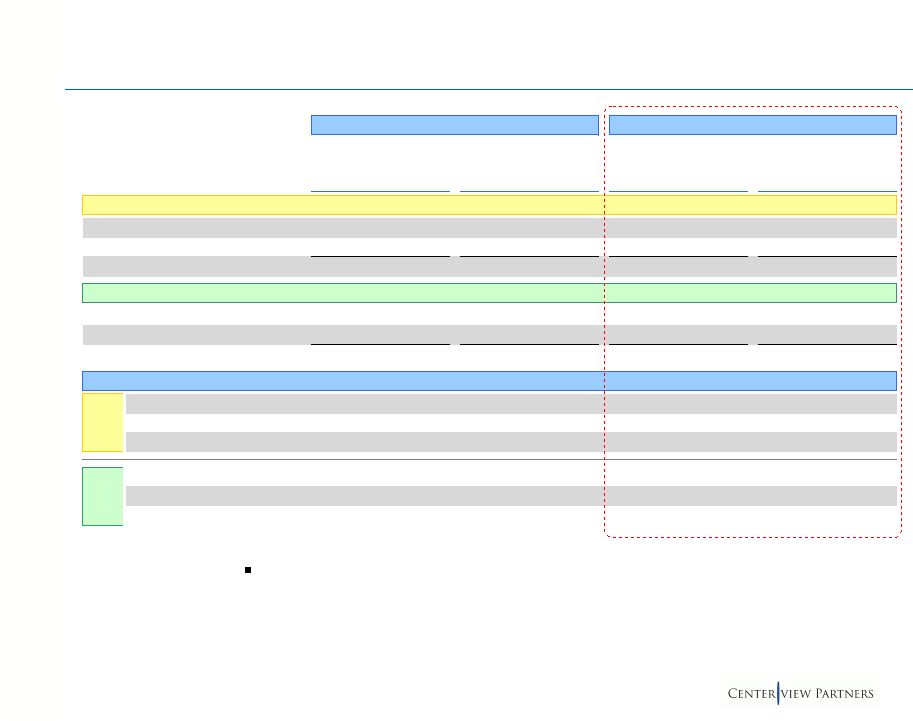
 8 - CONFIDENTIAL - I. Summary of Saturn Proposal Key Financial Statistics Source: Comet management, Company filings and FactSet, as of November 30, 2012. (1) Based on 47.0bn MHz-pops. Current Proposal Earth $2.32 $2.60 $2.97 $3.00 $3.25 Incremental Value vs. Preliminary Proposal – – $279 $302 $491 Premia vs. Spot Prices Relative to Current - 11/30/12 ($2.32) – 12.1% 28.0% 29.3% 40.1% 1-Day Prior to Receipt of Proposal - 11/20/12 ($2.12) 9.4% 22.6% 40.1% 41.5% 53.3% 1-Day Prior to Annc. of Saturn/Parent Txn - 10/10/12 ($1.30) 78.5% 100.0% 128.5% 130.8% 150.0% Premia vs. Trading Averages 4-Weeks Prior to Current ($2.19) 5.8% 18.5% 35.4% 36.8% 48.2% 4-Weeks Prior to Receipt of Proposal ($2.11) 9.7% 23.0% 40.5% 41.9% 53.7% 4-Weeks Prior to Annc. of Saturn/Parent Txn ($1.44) 60.9% 80.3% 106.0% 108.1% 125.4% EV / MHz-pop (1) $0.190 $0.199 $0.210 $0.211 $0.219 |
 9 - CONFIDENTIAL - I. Shareholder Considerations Source: Comet management and Company filings. Note: Shares in millions. Based on basic shares outstanding. (1) Pro forma for Saturn acquisition of shares from Earth. (2) Includes Highbridge, Sirios, Chesapeake, Vanguard and Glenview. (3) Assuming majority of minority vote. Current Share Register (1) Current Share Register (1) Monitoring Saturn’s “agreement to acquire outright control” via acquisition of Earth shares Board has obligation to insure Company has cash to fund build-out and not allow only alternative to be sale to Saturn at distressed price Advocates sale of excess spectrum – AT&T’s purchase of NextWave spectrum implies Comet value of $0.38/MHz-pop – Sale of excess Comet spectrum could yield gross process of $6 - $9bn – Suggests hiring banker to auction spectrum; Saturn to be prohibited from participating Saturn should stop buying stock and relinquish Board seats, or make offer for 100% of Company Any Saturn/Comet transaction should be subject to vote of non-Saturn shareholders Crest Crest Mt. Kellett Mt. Kellett Generally agree with the contents of Mt. Kellet’s letter Saturn/Parent merger may not be in best interest of Company’s minority shareholders Comet should raise capital through sale of spectrum and/or sale of common stock Believe differential consideration paid in Earth transaction unfairly benefits Class B shareholders at the expense of Class A shareholders Board should take a variety of steps to mitigate Saturn’s actions, with particular focus on standstill in Equityholders’ Agreement Our understanding is that all members of Comet’s Board received copies of the Mt. Kellett and Crest letters when they were filed Key Points in Mt. Kellett / Crest Correspondence Shares Total Class A and Class B Shares Outstanding 1,465.0 (Less): Shares Held By Saturn (739.0) "Minority" Shares 726.0 Percentage of Minority Required to Approve Merger (3) 50.1% Minority Shares Required to Approve Merger 363.7 % of Shares Non-Saturn Comcast 88.5 12.2% Bright House 8.5 1.2% Intel 94.1 13.0% Subtotal SIGs 191.1 26.3% Mt. Kellet and Crest 99.0 13.6% Next Five (2) 179.1 24.7% Other Public 256.8 35.4% Total Non-Saturn 726.0 100.0% |
 10 - CONFIDENTIAL - 2,000 2,500 3,000 3,500 4,000 Nov-10 Feb-11 May-11 Aug-11 Nov-11 Feb-12 May-12 Aug-12 Nov-12 Parent Nikkei 225 - Indexed I. Overview of Saturn Parent Japanese holding company with operating subsidiaries across Internet, telecom & technology – Fixed-Line Telecom – Internet (Yahoo Japan) – Investments / affiliates include Renren & Alibaba #3 Japanese wireless provider, with ~39mm subscribers – PF for Saturn, will be #3 globally by mobile revenue Parent has held an investment grade rating since 2011 Founder, Chairman & CEO Masayoshi Son holds a 21% stake in Parent JPY 3,090 $37.47 +6.6% -4.9% Source: Saturn filings, Wall Street research and FactSet, as of November 30, 2012. Note: U.S. dollars in millions, converted at spot exchange rate. (1) Pro forma for issuance of $3.1bn convertible note to Saturn. (2) Minority interests reflects Yahoo Japan marked-to-market. Stock Price $37.47 DSOs 1,105 Equity Value $41,410 Plus: Debt (1) 31,226 Plus: Minority Interest (2) 11,076 (Less): Cash & Equivalents (1) (10,743) (Less): Unconsolidated Investments (12,200) Enterprise Value $60,769 Trading Multiples EV / Revenue EV / EBITDA P/E CY2012E 1.50x 4.5x 10.3x CY2013E 1.42 4.0 9.2 Forward Metrics Revenue EBITDA EPS CY2012E $40,602 $13,577 $3.65 CY2013E 42,794 15,032 4.07 – Mobile Comm. – Broadband Infr. Business Description Public Markets Overview Two Year Stock Price Performance |
 11 - CONFIDENTIAL - On October 15, 2012, Parent announced that it would acquire a 70% interest in Saturn in a series of transactions Step 1 Parent % Ownership (3) Closed At Transaction Close $8.0 billion cash to Saturn balance sheet $12.1 billion cash to Saturn shareholders $12.1bn Cash 1.7bn Shares Step 2A Step 2B I. Overview of Saturn / Parent Transaction New Saturn Ownership Parent invests $3.1bn in Convertible Debt at $5.25 per share (1) Parent invests $4.9bn in newly issued shares at $5.25 per share (2) Parent 70% Parent Saturn Shareholders 16% 33% 70% Saturn Shareholders may elect to receive either $7.30 in cash or 1 share in New Saturn, subject to proration (55% Cash / 45% Stock) 30% Existing Saturn Shareholders (1) Converts into equity immediately prior to closing of steps 2A and 2B. (2) In addition, Parent receives five-year warrant to purchase 54.6 million shares in Saturn at $5.25 per share for total additional consideration of $287 million. (3) Reflects percentage ownership based on share count pro forma for all share issuance. Source: Saturn SEC filings. |
 12 - CONFIDENTIAL - Standalone Pro Forma (A) + (B) (A) (B) Saturn w/ Additional Saturn (1) Comet (2) $4.9bn from Parent (3) (A) + (B) Current 9/2012PF Capital Structure Gross Debt $24.5 $4.5 $25.8 $28.9 (Less): Cash (8.8) (1.2) (12.7) (7.8) Net Debt 15.6 3.3 13.2 21.2 Illustrative 6/2013 Capital Structure Gross Debt 24.4 4.4 25.8 28.9 (Less): Cash (6.3) (0.2) (9.1) (4.2) Net Debt 18.1 4.2 16.6 24.6 Illustrative Leverage Statistics Gross Debt / LTM EBITDA 5.1x nm 5.5x 6.2x Net Debt / LTM EBITDA 3.3 nm 2.8 4.5 LTM (9/2012) EBITDA $4.8 ($0.1) $4.7 $4.7 Gross Debt / Proj. LTM EBITDA 4.8x nm 5.3x 5.9x Net Debt / Proj. LTM EBITDA 3.5 nm 3.4 5.0 Proj. LTM EBITDA $5.1 ($0.2) $4.9 $4.9 Does not reflect impact of synergies; see following page for detail I. Illustrative Consolidation Math 9/12PF 6/13E Source: Comet management, Company filings and Wall Street research. Note: For illustrative purposes assumes Comet acquisition at $3.00 / share. (1) Current capital structure is pro forma for $3.1bn convertible note issuance, purchase of Earth stake in Comet, purchase of U.S. Cellular spectrum and consent solicitation fee. 6/2013 capital structure reflects Wall Street estimates. (2) Debt excludes spectrum leases for purposes of leverage analysis. (3) Pro forma for conversion of $3.1bn convertible note to equity. |
 13 - CONFIDENTIAL - I. Illustrative Synergy Analysis Source: Comet management. Note: U.S. dollars in millions. 2013E 2014E 2015E 2016E 2017E Operating Expense Synergies Comet ($5) $258 $35 $932 $932 Saturn 75 225 300 300 300 Total $70 $483 $335 $1,232 $1,232 Capital Expenditure Synergies Comet $178 $169 $97 $97 $97 Saturn 710 710 – – – Total $888 $879 $97 $97 $97 On a preliminary basis, Comet management has presented to Saturn the potential to realize up to $1.2bn in annual operating savings, and more than $1.6bn in aggregate near-term CapEx savings Saturn may not necessarily agree with these amounts |
 14 - CONFIDENTIAL - II. Overview of Dipper Provides basic and pay-TV content, digital receiver systems, online video streaming and home movie rental subscription services Delivers movie and television content through direct broadcast satellite (“DBS”) pay-TV – ~14mm U.S. subscribers In recent years, Dipper has made significant investments in spectrum – $718mm to acquire certain 700MHz wireless licenses – $2.8 billion total to acquire DBSD and Terrestar, including MSS spectrum holdings (pending FCC approval) Dipper has a large position across all of Comet’s debt tranches – Holds $490mm Sr. Secured Notes, $189mm Second Lien Notes and $162mm Exchangeable Notes Stock Price $37.04 DSOs 455 Equity Value $16,853 Plus: Debt 10,391 (Less): Cash & Equivalents (6,400) Enterprise Value $20,844 Trading Multiples EV / Revenue (1) EV / EBITDA (1) P/E CY2012E 0.94x 4.5x 23.6x CY2013E 0.91 4.2 15.6 Forward Metrics Revenue EBITDA EPS CY2012E 14,275 $2,971 $1.57 CY2013E 14,708 3,181 2.37 Business Description Public Market Overview $10.00 $20.00 $30.00 $40.00 Nov-10 Feb-11 May -11 Aug -11 Nov-11 Feb-12 May -12 Aug -12 Nov-12 Two Year Stock Price Performance Two Year Stock Price Performance $37.04 +101.4% +20.0% S&P – Indexed Dipper Source: Saturn filings, Wall Street research and FactSet, as of November 30, 2012. Note: U.S. dollars in millions. (1) Enterprise value multiples exclude estimated value of spectrum holdings as per Wall Street estimates. |
 15 - CONFIDENTIAL - II. Summary of Expected Dipper Proposal Spectrum Adjustments ~40MHz contiguous spectrum in LTE Band 41 11,367 total MHz-pops – 9,528 MHz-pops Owned – 1,839 MHz-pops Leased ~$177mm NPV of spectrum lease payments ~$200 - $600mm tax liability Revised from original verbal interest in ~63MHz Gross Value ~$0.214/MHz-pop $2.4 billion gross proceeds Net Value ~$0.181/MHz-pop (1) ~$1.7bn - $2.1bn in aggregate Tax liability dependent on Sprint decision regarding use of NOLs (if available) vs. conversion to Class A shares Other Dipper has expressed willingness to consider using acquired Comet debt as partial consideration Liquidity Impact Source: Comet management. (1) Assumes $200 million tax liability. Debt agreements restrict use of proceeds from asset sale – Baskets allow for funding of (i) up to one year of capex and (ii) operating expenses up to 25% of proceeds (less amounts used to fund capex) – Remainder must be used to tender for first lien debt If holders do not tender debt, Comet’s use of proceeds is not restricted – Current trading levels suggest debtholders may not tender N/A Proposal Comments |
 16 - CONFIDENTIAL - Comet Current MHz-pops 47,000 Less: MHz-pops Sold to Dipper (11,367) Pro Forma MHz-pops 35,633 Illustrative Value of Remaining Spectrum ($ / MHz-pop) $0.180 $0.200 $0.214 $0.220 $0.250 Implied Total Enterprise Value $6,414 $7,127 $7,625 $7,839 $8,908 Less: Total Debt (1) ($4,486) (4,486) (4,486) (4,486) (4,486) Less: NPV of Spectrum Leases (2) (1,623) (1,623) (1,623) (1,623) (1,623) Plus: Cash (3) 2,884 2,884 2,884 2,884 2,884 Implied Equity Value $3,189 $3,902 $4,401 $4,615 $5,684 Implied Share Price (4) $2.14 $2.61 $2.95 $3.09 $3.81 II. Illustrative Valuation Impact of Potential Dipper Transaction Source: Comet management. Note: U.S. dollars in millions. (1) Projected year-end 2012 balance. (2) Comet management estimate. (3) Pro forma for Dipper proceeds. (4) Based on 1,494 million diluted shares outstanding. In addition to its financial impact, a spectrum sale to Dipper must be evaluated relative to its potential strategic impact, which is currently uncertain |
 17 - CONFIDENTIAL - II. Potential Dipper Transaction May Enhance Financing Options Comet has been an active participant in the capital markets – Has maintained a regular dialogue with key financing sources Stand-alone financing options may be available to Comet but are incremental and do not satisfy Comet’s funding gap – Moreover, pursuit of such options at this juncture may send an unintended signal to the market and impair Comet’s future negotiating leverage with Saturn Without another substantial wholesale customer, Comet’s funding gap remains at least $2bn post- spectrum sale (see page 34) While Spectrum sale will validate asset value, and may lead to enhanced shareholder interest, availability of funding will remain an issue – Equity constrained by authorized shares and Saturn pre-emptive rights – Limited / no senior capacity – Limited junior availability / unattractive cost of capital Observations |
 18 - CONFIDENTIAL - We believe chapter 11 is a viable fall-back option should the current Saturn discussions fail – We have discussed same with Blackstone, Comet’s restructuring advisor, and are in agreement Chapter 11 not typically an offensive, equity value-maximizing strategy – Difficult to expect greater equity value than Saturn proposal Key stakeholders will pursue their own value-maximizing goals, including: – Saturn: Equity ownership will give it significant influence on ultimate resolution • Can defease or assume all financial indebtedness and, again, become fulcrum and controlling stakeholder – Dipper: May seek to pursue conversion of debt securities into controlling equity position • Will have standing to influence process and has expertise in chapter 11 spectrum deals (e.g., DBSD, Terrestar); has resources to aggressively pursue investment – SIGs/public : Will fight to maximize equity value using existing strategic proposals as benchmarks • Will aggressively prosecute their position in chapter 11; could pursue litigation strategy Due to disparate valuation perspectives, full marketing process may be required to determine spectrum FMV Sale of entire portfolio would be largest-ever spectrum sale by a significant margin III. Chapter 11 Considerations |
 19 - CONFIDENTIAL - III. Chapter 11 Considerations Restructuring plan agreed with key creditors prior to filing Court process used to confirm plan Company files without a pre-negotiated exit plan Court process provides protection to Company and stakeholders Enhances negotiating leverage with key constituencies Reduces uncertainty and time to resolution Addresses liquidity needs Minimizes liquidation risk Available option if pre-arranged filing is not possible (e.g., unable to build consensus, liquidity deteriorates, etc.) Will be a key party—at least initially—to any negotiations May pursue spectrum acquisition Potential for cooperation with Dipper Will seek to protect existing MVNO agreements Potential stalking horse in asset sale(s) May require Debtor in Possession financing to fund liquidity needs during case We understand that the Company is in the process of exploring—as a fall-back—various restructuring alternatives Capital structure positions makes Dipper a key constituency Will be focused on acquiring spectrum Could offer to swap debt for equity and/or new financing Concerned about cram-up Potential for cooperation with Saturn Same as at left Pre-Arranged Chapter 11 Filing Non Pre-Arranged Chapter 11 Filing Description Benefits Saturn Considerations Dipper Considerations |
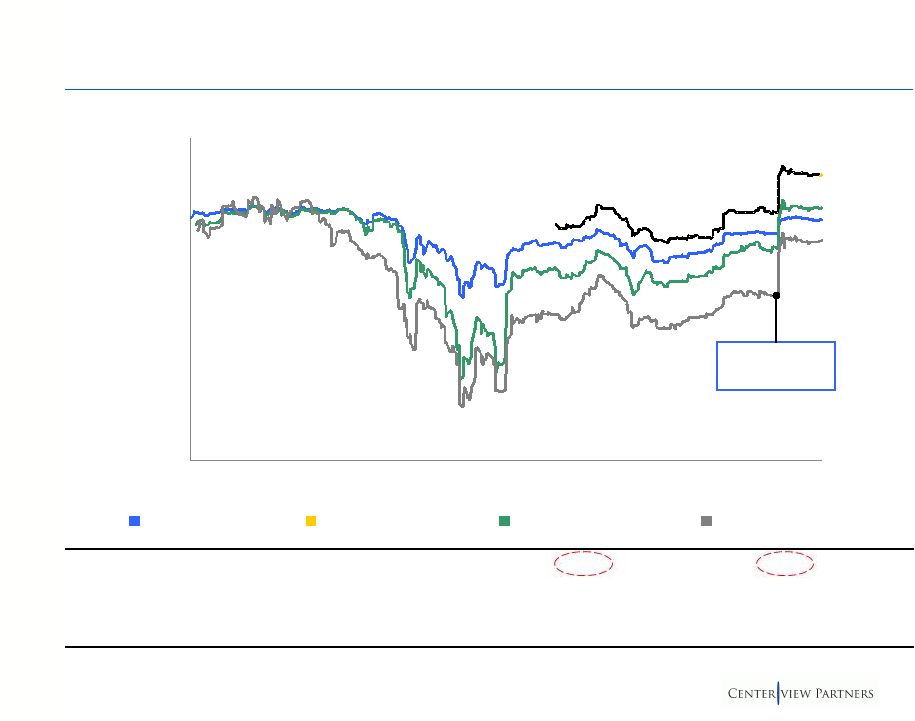   20 - CONFIDENTIAL - 0.0% 20.0% 40.0% 60.0% 80.0% 100.0% 120.0% 140.0% Nov-10 Feb-11 May-11 Aug-11 Nov-11 Feb-12 May-12 Aug-12 Nov-12 III. Chapter 11 Considerations 14.75% Senior Secured Notes due 2016 12% Second Priority Secured Debt due 2017 8.25% Exchangeable Notes due 2040 124.125% 109.625% 104.875% (1) 95.625% Low 70.6% 94.6% 35.6% 23.5% High 110.7% 128.4% 113.6% 114.6% Average 98.1% 106.4% 89.7% 76.8% Oct 10, 2012 (2) 98.8% 107.9% 92.1% 72.5% 12% Senior Secured Notes due 2015 (1) Oct-12: Saturn- Parent transaction announced Source: Advantage Data. Historical Debt Trading Levels (1) Reflects weighted average of two largest tranches of 2015 senior secured notes. (2) One day prior to Saturn-Parent transaction announcement. |
 - CONFIDENTIAL - Preliminary Valuation Analysis Section 2 |
 22 - CONFIDENTIAL - Centerview’s valuation analysis includes a number of different valuation methodologies, each with its own particular considerations: Overview of Valuation Methodologies Employed Historical Trading Ranges Precedent Transactions Relevant to consider Comet trading levels both before and since the announcement of the Saturn/Parent transaction All cash transactions Minority squeeze-outs Each transaction is situation-specific Analyst Price Targets Wide range of expectations and assumptions Generally based on per-MHz-pop valuations and DCF Precedent Spectrum Acquisitions Recent strategic acquisitions of material spectrum blocks Each transaction is situation-specific Discounted Cash Flow Analysis Intrinsic value based on projected future free cash flow profile Analysis is impacted by assumptions around future wholesale customers $0.90 - $2.69 52-week range (based on closing prices) Median of both cash transactions overall and minority squeeze-outs is in the ~30% range $2.00 - $4.00 range (excluding high/low) Most-similar spectrum has traded in the $0.18 - $0.26 / MHz-pop range Very wide range of outcomes depending on assumptions Management plans require significant additional funding to realize DCF value which may not be achievable Comments Observations |
 23 - CONFIDENTIAL - Analysis at Various Prices Source: Comet management, Company filings and FactSet, as of November 30, 2012. Note: U.S. dollars in millions, except per MHz-pop and per share amounts. Date ranges reflect calendar ranges (e.g., 30 days reflects 30 calendar days). (1) Based on 1,494 million diluted shares outstanding. (2) Comet management estimate. (3) Based on 47.0bn MHz-pops. Current Proposal Earth Impl. Dipper $2.32 $2.60 $2.80 $2.97 $3.00 $3.08 $3.25 $3.50 Aggregate Equity Value (1) $3,465 $3,883 $4,182 $4,436 $4,481 $4,601 $4,854 $5,228 Plus: Debt 4,486 4,486 4,486 4,486 4,486 4,486 4,486 4,486 Plus: NPV of Spectrum Leases (2) 1,800 1,800 1,800 1,800 1,800 1,800 1,800 1,800 (Less): Cash & S-T Investments (828) (828) (828) (828) (828) (828) (828) (828) Aggregate Enterprise Value $8,922 $9,340 $9,639 $9,893 $9,938 $10,058 $10,311 $10,685 Transaction Highlights Value of Non-Saturn Equity 1,750 1,962 2,113 2,241 2,264 2,324 2,452 2,641 Incremental Value vs. Preliminary Proposal - - 151 279 302 363 491 679 % Increase vs. Preliminary Proposal - - 7.7% 14.2% 15.4% 18.5% 25.0% 34.6% Premia Spot Prices Relative to Current ($2.32) - 12.1% 20.7% 28.0% 29.3% 32.8% 40.1% 50.9% 1-Day ($2.12) 9.4% 22.6% 32.1% 40.1% 41.5% 45.3% 53.3% 65.1% 1-Week ($2.16) 7.7% 20.6% 29.9% 37.8% 39.2% 42.9% 50.8% 62.4% 4-Weeks ($1.87) 24.1% 39.0% 49.7% 58.8% 60.4% 64.7% 73.8% 87.2% 1-Day Prior to Annc. of Saturn/Parent Txn ($1.30) 78.5% 100.0% 115.4% 128.5% 130.8% 137.0% 150.0% 169.2% Relative to 52-Wk. High ($2.69) (13.8%) (3.3%) 4.1% 10.4% 11.5% 14.5% 20.8% 30.1% Trading Averages 4-Weeks to Current ($2.19) 5.8% 18.5% 27.6% 35.4% 36.8% 40.4% 48.2% 59.6% 4-Weeks ($2.11) 9.7% 23.0% 32.5% 40.5% 41.9% 45.7% 53.7% 65.6% 3-Mos. ($1.79) 29.3% 44.9% 56.0% 65.5% 67.2% 71.7% 81.1% 95.0% 6-Mos. ($1.51) 53.3% 71.8% 85.0% 96.2% 98.2% 103.5% 114.7% 131.2% 4-Weeks Prior to Annc. of Saturn/Parent Txn ($1.44) 60.9% 80.3% 94.2% 106.0% 108.1% 113.7% 125.4% 142.8% 3-Mos. Prior to Annc. of Saturn/Parent Txn ($1.43) 62.4% 82.0% 96.0% 107.9% 110.0% 115.7% 127.5% 145.0% EV / MHz-pop (3) $0.190 $0.199 $0.205 $0.210 $0.211 $0.214 $0.219 $0.227 |
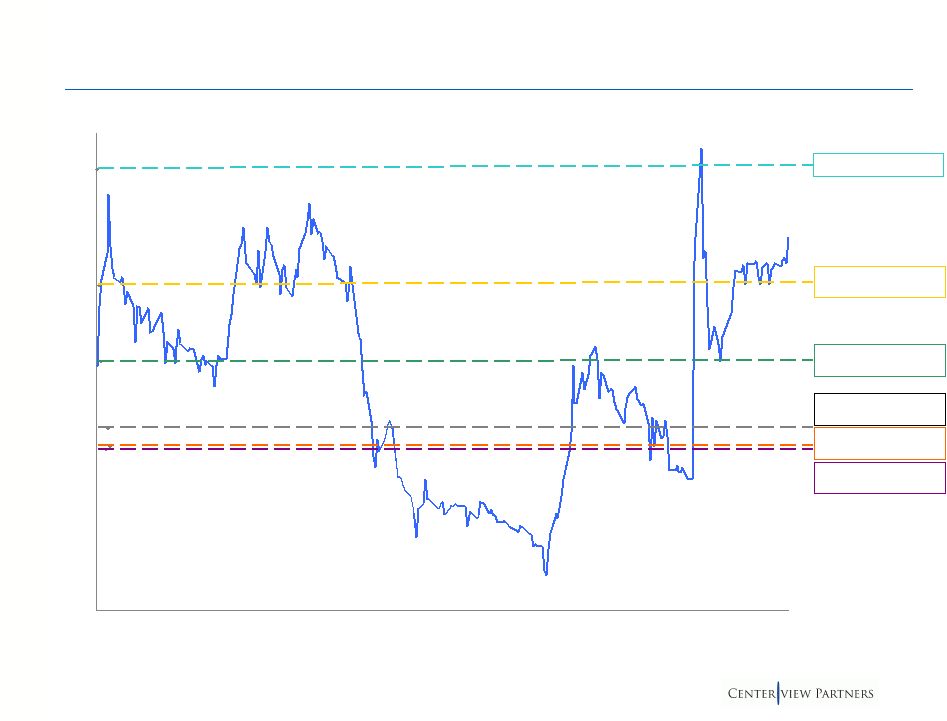 24 - CONFIDENTIAL - $0.75 $1.25 $1.75 $2.25 $2.75 Nov-11 Jan-12 Mar-12 May-12 Jul-12 Sep-12 Nov-12 Recent Share Price Performance 4-Weeks Avg. Prior to Receipt of Proposal: $2.11 3-Mos. Avg. Prior to Receipt of Proposal: $1.79 6-Mos. Avg. Prior to Receipt of Proposal: $1.51 3-Mos. Avg. Prior to Annc. of Saturn/Parent Txn: $1.43 Source: FactSet, as of November 30, 2012. 4-Weeks Avg. Prior to Annc. of Saturn/Parent Txn: $1.44 Saturn Proposal: $2.60 |
 25 - CONFIDENTIAL - Source: Wall Street research and FactSet, as of November 30, 2012. Excludes analysts for whom price target is not available. (1) Reflects standardized text, as per ThomsonOne. (2) Reflects near-term price target, as per analyst research. Analyst Price Targets Price Report Valuation Analyst Rating (1) Target (2) Date Methodology Zachary Buy $5.00 Oct-12 not provided BofA Merrill Lynch Buy 4.00 Oct-12 $0.15-$0.30 / MHz-pop Wells Fargo Buy 3.75 Jul-12 $0.17-$0.19 / MHz-pop Davidson Buy 3.00 Oct-12 not provided Guggenheim Buy 3.00 Oct-12 not provided JANCO Buy 2.75 Aug-12 not provided Macquarie Hold 2.75 Nov-12 DCF "Scenario Analysis" RBC Hold 2.50 Nov-12 $0.25 / MHz-pop Jefferies Hold 2.00 Oct-12 DCF / Spectrum-based Evercore Hold 1.75 Oct-12 Spectrum-based UBS Hold 1.75 Oct-12 DCF-based |
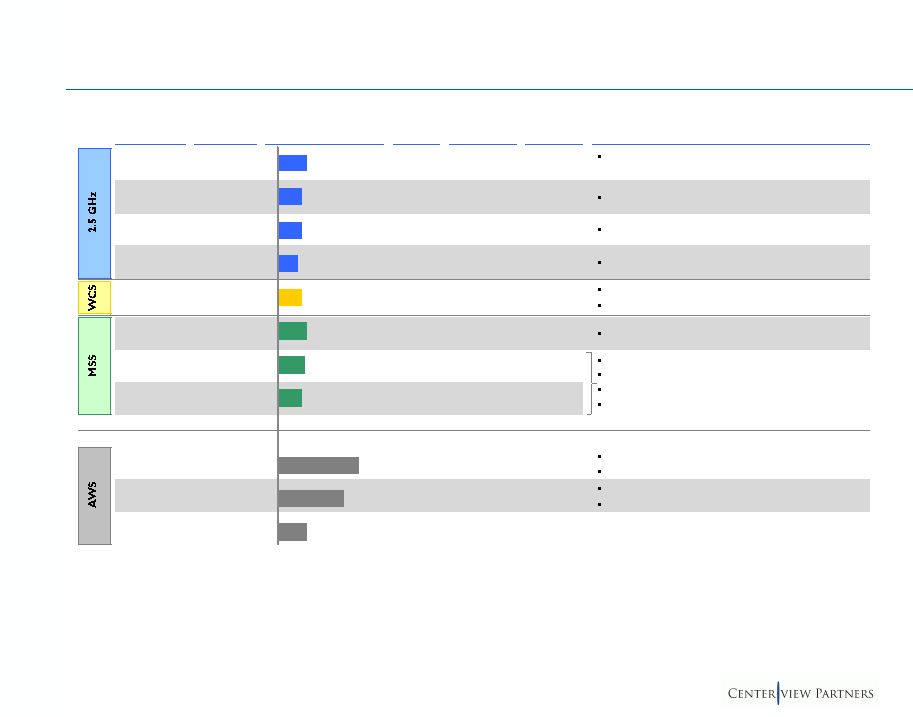 26 - CONFIDENTIAL - Date Txn Total Acquiror Target $ / MHz-pop Annc. Value MHz-pop Comment Comet Saturn Spectrum 5/7/08 $7,400 28,989 Reflects price for spectrum contributed by Saturn for stake in Comet Dipper Comet NA $2,433 11,367 Preliminary Dipper proposal to Comet Saturn Earth 10/17/12 9,893 47,000 Based on $2.97/share Comet BellSouth 2/15/07 300 1,700 Regulatory divestiture in connection with AT&T/BellSouth AT&T NextWave 8/2/12 600 2,846 Price includes guard bands; ex. yields $0.37 / MHz-pop Subject to FCC approval of AT&T / Sirius plan Harbinger (LightSquared) SkyTerra 9/23/09 1,849 7,500 Regulatory requirement for significant build-out Dipper DBSD 2/1/11 1,364 6,000 Transactions included satellites Required $114mm payment to Saturn Dipper Terrestar 6/14/11 1,382 6,600 FCC approval required prior to terrestrial use Distressed sale Verizon SpectrumCo 12/2/11 3,600 5,180 Contiguous with holdings / able to immediately deploy Part of larger agreement with Cable Companies Verizon Cox 12/16/11 315 560 Contiguous with holdings / able to immediately deploy Complementary to SpectrumCo Acquisition Various Nextwave Spectrum 7/17/08 150 593 $0.253 $0.563 $0.695 $0.209 $0.227 $0.247 $0.211 $0.176 $0.210 $0.214 $0.255 Precedent Spectrum Acquisitions (3) (4) (2) (5) (5) (1) (6) Source: Company filings, FCC reports and Wall Street research. Note: Figures in millions, except $ / MHz-pop. (1) Reflects total transaction size at headline “target” price of $20 / share (price after post-closing adjustments to be within $17-$23 range). (2) Reflects Sprint spectrum to be contributed, as of 4/30/08. Merger agreement specifies a minimum of 27,540 MHz-pops at closing. (3) Transaction was primarily WCS but also included AWS spectrum. (4) Includes C/D blocks not immediately usable due to requirement for “guard bands.” 1,607 MHz-pops excluding C/D blocks. (5) Final closing prices as per Q1’12 10-Q. (6) Divestiture included both 10 and 20 MHz blocks; assumes average of 15 MHz, as per Wall Street research. |
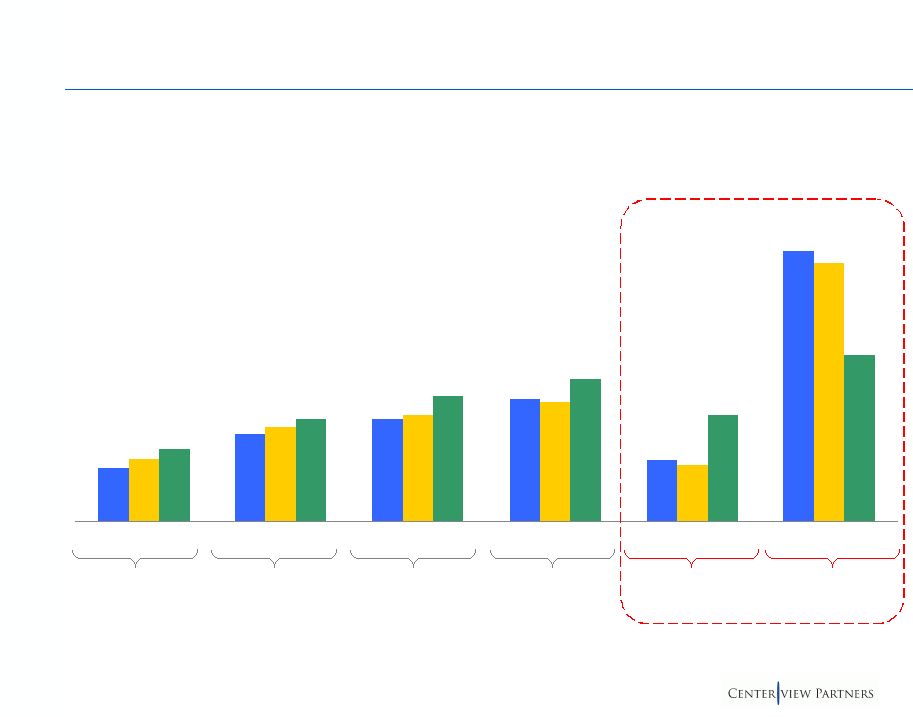 27 - CONFIDENTIAL - 20% 32% 38% 45% 23% 100% 23% 35% 39% 44% 21% 95% 27% 38% 46% 53% 39% 61% 1-Day 1-Week 4-Weeks 1-Day 1-Week 4-Weeks 1-Day 1-Week 4-Weeks 1-Day 1-Week 4-Weeks 1-Day 1-Week 4-Weeks 1-Day 1-Week 4-Weeks Precedent Premiums Paid in Recent Cash Transactions Source: Thomson SDC. (1) Includes 106 cash-only transactions announced since January 1, 2009 with non-financial, non-real estate public U.S. targets. 25 th Percentile Median Mean 75 th Percentile Preliminary Saturn Proposal Selected All-Cash Transactions with Equity Values between $1.0-$5.0 billion (1) Relative to Receipt of Proposal Prior to Parent-Saturn Announcement |
 28 - CONFIDENTIAL - Initial Offer Final Offer Date Ownership Txn Premium Price Annc. Closed Target Acquiror % Prior % Acq. % PF Value (1) Price Prem. (2) Price 1-Day 1-Week 4-Week Increase (3) 6/2/10 8/30/10 Gerdau Ameristeel Gerdau Steel N. America 66.3% 33.7% 100.0% $1.6 $11.00 53.4% $11.00 53.4% 57.1% 56.9% - 9/4/09 10/28/09 Odyssey Re Holdings Fairfax Financial Holdings 72.6% 27.4% 100.0% 1.0 60.00 20.0% 65.00 30.0% 29.9% 39.9% 8.3% 8/12/08 11/5/08 UnionBanCal Bank of Tokyo- MUFJ 65.4% 34.6% 100.0% 3.7 63.00 9.1% 73.50 27.2% 29.5% 104.4% 16.7% 7/21/08 3/26/09 Genentech Roche Holdings AG 55.7% 44.3% 100.0% 46.8 89.00 8.8% 95.00 16.1% 26.0% 28.1% 6.7% 3/10/08 1/2/09 Nationwide Financial Nationwide Mutual Insurance 66.3% 33.7% 100.0% 2.5 47.20 26.7% 52.25 40.2% 31.0% 31.0% 10.7% 11/20/06 4/20/07 TD Banknorth TD Bank Financial Group 57.0% 43.0% 100.0% 3.2 32.33 7.3% 32.33 7.3% 9.1% 8.6% - 2/6/06 5/16/06 Lafarge North America Lafarge S.A. 53.2% 46.8% 100.0% 2.9 75.00 17.4% 85.50 33.8% 34.4% 40.5% 14.0% 9/1/05 11/8/05 7-Eleven Seven & I Holdings 72.7% 27.3% 100.0% 1.3 32.50 14.7% 37.50 32.3% 31.0% 14.1% 15.4% 8/2/04 12/8/04 Cox Communications Cox Enterprises 62.2% 37.8% 100.0% 8.5 32.00 16.0% 34.75 26.0% 24.6% 25.2% 8.6% Min 7.3% 7.3% 9.1% 8.6% - Mean 19.3% 29.6% 30.3% 38.8% 8.9% Median 16.0% 30.0% 29.9% 31.0% 8.6% Max 53.4% 53.4% 57.1% 104.4% 16.7% Mean 11.5% Median 10.7% Precedent Minority Squeeze-Out Transactions Selected Cash Transactions Greater than $1.0 billion Source: Company filings, Thomson SDC, Bloomberg and Capital IQ. Note: Date ranges reflect calendar ranges (e.g., 30 days reflects 30 calendar days). (1) Reflects value of equity acquired. U.S. dollars in billions. (2) Premium to target’s stock price 1-day prior to initial announcement. (3) Initial to final. All Transactions Transactions with Price Increases |
 29 - CONFIDENTIAL - Management has provided Centerview with two sets of financial projections, differing primarily with respect to the Company’s assumed wholesale customer base: – Multi-Customer Case (“MCC”) assumes substantial non-Saturn LTE network traffic beginning in 2014 (~70% of total revenue by 2015) – Single-Customer Case (“SCC”) assumes Saturn remains Comet’s only wholesale customer Both cases assume ongoing LTE upgrades and retail strategy consistent with announced plans In evaluating the feasibility and value of these plans, we note the following: – Despite a concerted effort over the past several years, Comet has yet to attract another meaningful wholesale customer other than Saturn • Given an estimated nine-month lead time to put traffic on-net, the MCC implies one or more very significant new-customer win(s) in the immediate future – Both the MCC and the SCC contemplate substantial funding gaps (~$2bn and ~$4bn, respectively) to reach free cash flow positive • Potential sources of funds include capital markets solutions and/or spectrum sales, but uncertainty around the timing and amount of available funding impacts the feasibility of these plans Management Plan Overview Centerview Observations Source: Comet management. |
 30 - CONFIDENTIAL - 12 -'20 2011A 2012E 2013E 2014E 2015E 2016E 2017E 2018E 2019E 2020E CAGR MCC Revenue $1,253 $1,262 $1,207 $1,082 $2,351 $3,905 $5,098 $6,145 $7,141 $7,447 24.8% Adjusted EBITDA (1) ($305) ($168) ($280) ($482) $748 $2,275 $3,696 $4,871 $5,763 $5,940 NM % Margin -24.3% -13.3% -23.2% -44.5% 31.8% 58.3% 72.5% 79.3% 80.7% 79.8% Capital Expenditures (220) (157) (327) (294) (235) (390) (510) (614) (714) (745) 21.5% Interest Expense (477) (514) (512) (511) (511) (510) (510) (510) (510) (510) -0.1% Free Cash Flow (1,368) (624) (1,113) (1,269) (389) 1,200 2,524 2,184 2,600 2,768 NM Cash Balance / (Deficit) $1,108 $828 ($350) ($1,654) ($898) $1,596 $3,743 $6,306 $9,036 SCC Revenue $1,253 $1,262 $1,191 $839 $1,211 $1,714 $2,101 $2,434 $2,749 $2,904 11.0% Adjusted EBITDA (1) ($305) ($168) ($267) ($717) ($387) $106 $745 $1,287 $1,554 $1,640 NM % Margin -24.3% -13.3% -22.4% -85.4% -32.0% 6.2% 35.5% 52.9% 56.5% 56.5% Capital Expenditures (220) (157) (293) (317) (154) (171) (238) (243) (279) (298) 8.4% Interest Expense (477) (514) (512) (511) (511) (510) (510) (510) (510) (510) -0.1% Free Cash Flow (1,368) (624) (1,065) (1,545) (1,267) (641) (57) 487 725 812 NM Cash Balance / (Deficit) $1,108 $828 ($301) ($1,882) ($3,181) ($3,845) ($3,481) ($2,794) ($2,021) Management Plan Overview Source: Financial projections per Comet management. Note: U.S. dollars in millions. (1) Adjusted EBITDA excludes non-cash charges per Comet management calculation. Financial Summary Indicates Maximum Funding Gap ($2,075) ($3,932) |
 31 - CONFIDENTIAL - Management Plans vs. Street Estimates '12 -'15 2012E 2013E 2014E 2015E CAGR Revenue Consensus Estimate (1) $1,266 $1,344 $1,353 $1,579 5.7% MCC $1,262 $1,207 $1,082 $2,351 16.8% MCC vs. Consensus (0.3%) (10.2%) (20.0%) 48.9% SCC $1,262 $1,191 $839 $1,211 -1.0% SCC vs. Consensus (0.3%) (11.4%) (38.0%) (23.3%) # Analysts 16 15 6 2 Adjusted EBITDA Consensus Estimate (1) ($164) ($152) ($42) $189 NM MCC ($168) ($280) ($482) $748 NM SCC ($168) ($267) ($717) ($387) NM # Analysts 16 15 6 2 Source: Financial projections per Comet management, ThomsonOne and Wall Street research. Note: U.S. dollars in millions. (1) Based on mean of forecasts. |
 32 - CONFIDENTIAL - Illustrative DCF Value Source: Financial projections per Comet management. Note: Includes present value of NOLs per management. MCC – Equity Value / Share MCC – Equity Value / Share SCC – Equity Value / Share SCC – Equity Value / Share Plan requires ~$2.0 billion additional funding to achieve forecast Plan requires ~$4.0 billion additional funding to achieve forecast SCC – Implied Terminal Value Multiple MCC – Implied Terminal Value Multiple Perpetuity Growth Rate e ($1.4) 0% 1% 2% 3% 12.5% ($1.33) ($1.17) ($0.98) ($0.74) 15.0% (1.91) (1.81) (1.71) (1.58) 17.5% (2.29) (2.23) (2.17) (2.09) Perpetuity Growth Rate e $6.7 0% 1% 2% 3% 12.5% $7.30 $7.92 $8.66 $9.55 15.0% 4.89 5.25 5.67 6.16 17.5% 3.22 3.45 3.71 4.00 Perpetuity Growth Rate 4.5x 0% 1% 2% 3% 12.5% 3.8x 4.2x 4.7x 5.2x 15.0% 3.2 3.5 3.8 4.1 17.5% 2.7 2.9 3.2 3.4 Perpetuity Growth Rate 4.8x 0% 1% 2% 3% 12.5% 4.1x 4.5x 5.0x 5.5x 15.0% 3.4 3.7 4.0 4.4 17.5% 2.9 3.1 3.4 3.6 |
 - CONFIDENTIAL - Supporting Information Appendix A |
 34 - CONFIDENTIAL - Illustrative Cash Flow Impact of Potential Dipper Transaction Source: Financial projections per Comet management. Note: U.S. dollars in millions. (1) Based on weighted average interest rate of 12.25% on Senior Secured Notes. Refinancing of Senior Secured Notes could help address funding gap Multiple Carrier Case Single Carrier Case Gross Proceeds to Comet $2,433 $2,433 Less: NPV of Spectrum Leases (177) (177) Less: Cash Taxes (200) (200) Less: 2013E CapEx Spend (a) (327) (293) Less: 25% of Proceeds after CapEx Reserve (b) (432) (441) Proceeds to be Used to Tender for Debt $1,296 $1,322 2013E 2014E 2015E 2016E 2017E 2013E 2014E 2015E 2016E 2017E Memo: Status Quo Cash Balance ($350) ($1,654) ($2,075) ($898) $1,596 ($301) ($1,882) ($3,181) ($3,845) ($3,932) Status Quo Period Cash Flow ($1,178) ($1,305) ($420) $1,176 $2,494 ($1,130) ($1,581) ($1,298) ($665) ($87) Net Proceeds from Spectrum Sale (after Tender) 1,296 - - - - 1,322 - - - - Proceeds Reserved for CapEx / General (a+b) 759 - - - - 734 - - - - Annual Interest Savings (1) - - - - - - - - - - Pro Forma Ending Cash Balance $1,706 $401 ($19) $1,157 $3,651 $1,754 $173 ($1,125) ($1,790) ($1,877) Status Quo Period Cash Flow ($1,178) ($1,305) ($420) $1,176 $2,494 ($1,130) ($1,581) ($1,298) ($665) ($87) Net Proceeds from Spectrum Sale (after Tender) - - - - - - - - - - Proceeds Reserved for CapEx / General (a+b) 759 - - - - 734 - - - - Annual Interest Savings (1) 159 159 159 159 159 162 162 162 162 162 Pro Forma Ending Cash Balance $568 ($578) ($839) $496 $3,149 $594 ($825) ($1,961) ($2,464) ($2,389) Assuming No Holders Tender Assuming 100% of Holders Tender |
 35 - CONFIDENTIAL - Shares Issued (MM) 360 360 360 360 Issue Price $2.20 $2.00 $1.80 $1.60 Implied Discount - -9.1% -18.2% -27.3% Gross Proceeds ($MM) $790 $718 $646 $574 Dilution 19.7% 19.7% 19.7% 19.7% Financing Considerations Source: Comet management and SEC filings. (1) Assumes refinancing of Senior Secured Notes at 8.5% annual interest rate. Senior Debt Lenders have indicated potential ability to refinance a portion of $3.2bn Senior Secured Notes Issuance upsized to include 6% call premium 8.00% - 9.00% coupon on new debt versus 12.00%- 14.75% current coupon Potential annual interest savings of $22 million for each $1 billion refinanced (1) No upfront cash to Comet’s balance sheet; interest savings would not satisfy funding gap Investors will demand call protection on new debt, limiting Saturn’s ability to refinance post-merger Market perception of likelihood of strategic transaction may impact pricing / terms Junior Debt Most-aggressive proposal indicated ability to refinance $500mm Second Priority Notes Market appetite for new issue likely limited and expensive No upfront cash to Comet’s balance sheet; interest savings would not satisfy funding gap Coupon not specified Equity Received indicative proposal for committed equity offering of $200mm - $500mm Mt. Kellett provided term sheet in Spring 2012 for structured equity investment; however, proposal was not fully committed Execution may be challenged by uncertainty around committed equity offering Company only has 360mm available authorized shares (increase would require shareholder vote) Saturn pre-emptive rights Likelihood of significant dilution: Comments Illustrative Impact Analysis |
 36 - CONFIDENTIAL - Illustrative WACC Analysis Source: Bloomberg, Ibbotson and Advantage Data. (1) Based on yield-to-worst of currently outstanding traded notes. Illustrative WACC Over Time Max Debt Yields Prior to S-P Annc. Current (10/11/11) (10/10/12) (11/30/12) Cost of Equity 14.3% 14.5% 12.9% Cost of Debt – At Par Wtd Avg. Cost of Debt (Incl. Leases) – At Par 11.1% 11.1% 11.1% (Less): Taxes @ 38% (4.2%) (4.2%) (4.2%) After-Tax Cost of Debt – At Par 6.9% 6.9% 6.9% WACC – At Par 9.1% 9.2% 9.5% Cost of Debt – Based on Traded Notes Yield-to-Worst Weighted Avg. Yield-to-Worst (1) 27.4% 12.5% 9.2% (Less): Taxes @ 38% (10.4%) (4.8%) (3.5%) After-Tax Cost of Debt – At Yield-to-Worst 17.0% 7.8% 5.7% WACC – At Yield-to-Worst 16.2% 9.8% 8.8% |