As filed with the Securities and Exchange Commission on July 15, 2011
UNITED STATESSECURITIES AND EXCHANGE COMMISSION
Washington, D.C. 20549
Form 20-F
ANNUAL REPORT PURSUANT TO SECTION 13 OF THE SECURITIES EXCHANGE ACT OF 1934
For the fiscal year ended December 31, 2010
Commission file number: 001-34175
ECOPETROL S.A.
(Exact name of Registrant as specified in its charter)
N/A
(Translation of Registrant’s name into English)
REPUBLIC OF COLOMBIA
(Jurisdiction of incorporation or organization)
Carrera 13 No. 36 – 24
BOGOTA – COLOMBIA
(Address of principal executive offices)
Alejandro Giraldo
Investor Relations Officer
investors@ecopetrol.com.co
Tel. (571) 234 5190
Fax. (571) 234 5628
Carrera 13 N.36-24 Piso 8
Bogota, Colombia
(Name, Telephone, E-Mail and/or Facsimile number and Address of Company Contact Person)
Securities registered or to be registered pursuant to Section 12(b) of the Act.
| Title of each class | | Name of each exchange on which registered: |
| American Depository Shares (as evidenced by American Depository Receipts), each representing 20 common shares par value Ps$250 per share | | New York Stock Exchange |
| Ecopetrol common shares par value Ps$250 per share | | New York Stock Exchange (for listing purposes only) |
| 7.625% Notes due 2019 | | New York Stock Exchange |
Securities registered or to be registered pursuant to Section 12(g) of the Act: None
Securities for which there is a reporting obligation pursuant to Section 15(d) of the Act: None
Indicate the number of outstanding shares of each of the issuer’s classes of capital or common stock as of the close of the period covered by the annual report.
40,472,512,588 Ecopetrol common shares, par value Ps$250 per share
Indicate by check mark if the registrant is a well-known seasoned issuer, as defined in Rule 405 of the Securities Act.
xYes ¨No
If this report is an annual or transition report, indicate by check mark if the registrant is not required to file reports pursuant to Section 13 or 15(d) of the Securities Exchange Act of 1934.
¨Yes xNo
Indicate by check mark whether the registrant (1) has filed all reports required to be filed by Section 13 or 15(d) of the Securities Exchange Act of 1934 during the preceding 12 months (or for such shorter period that the registrant was required to file such reports), and (2) has been subject to such filing requirements for the past 90 days.
xYes ¨No
Indicate by check mark whether the registrant has submitted electronically and posted on its corporate Web site, if any, every Interactive Data File required to be submitted and posted pursuant to Rule 405 of Regulation S-T (§232.405 of this chapter) during the preceding 12 months (or for such shorter period that the registrant was required to submit and post such files). N/A
¨Yes ¨No
Indicate by check mark whether the registrant is a large accelerated filer, an accelerated filer, or a non-accelerated filer. See definition of “accelerated filer and large accelerated filer” in Rule 12b-2 of the Exchange Act. (Check one):
Large accelerated filer x Accelerated filer ¨ Non-accelerated filer ¨
Indicate by check mark which basis of accounting the registrant has used to prepare the financial statements included in this filing:
¨ U.S. GAAP | ¨ International Financial Reporting Standards as issued by the International Accounting Standards Board | x Other |
If “Other” has been checked in response to the previous question, indicate by check mark which financial statement item the registrant has elected to follow:
¨ Item 17 x Item 18
If this is an annual report, indicate by check mark whether the registrant is a shell company (as defined in Rule 12b-2 of the Exchange Act).
¨Yes xNo
| | | | | Page | |
| | | Forward-Looking Statements | | | 1 | |
| | | Enforcement of Civil Liabilities | | | 2 | |
| | | Presentation of Financial Information | | | 2 | |
| | | Presentation Of Abbreviations | | | 3 | |
| | | Presentation Of The Nation And Government Of Colombia | | | 4 | |
| | | Presentation Of Information Concerning Reserves | | | 4 | |
| ITEM 1. | | Identity of Directors, Senior Management and Advisors | | | 5 | |
| ITEM 2. | | Offer Statistics and Expected Timetable | | | 5 | |
| ITEM 3. | | Key Information | | | 5 | |
| | | Selected Financial Data | | | 5 | |
| | | Exchange Rate Information | | | 7 | |
| | | Risk Factors | | | 8 | |
| ITEM 4. | | Information on the Company | | | 20 | |
| | | The Company | | | 20 | |
| | | Overview By Business Segment | | | 24 | |
| | | Transportation Infrastructure | | | 48 | |
| | | Property, Plant And Equipment | | | 63 | |
| ITEM 4A. | | Unresolved Staff Comments | | | 63 | |
| ITEM 5. | | Operating and Financial Review and Prospects | | | 63 | |
| | | Operating Results | | | 70 | |
| | | Liquidity and Capital Resources | | | 83 | |
| | | Research and Development, Patents and Licenses, etc. | | | 85 | |
| | | Off-Balance Sheet Arrangements | | | 86 | |
| | | Tabular Disclosure of Contractual Obligations | | | 86 | |
| ITEM 6. | | Directors, Senior Management and Employees | | | 86 | |
| | | Directors and Senior Management | | | 86 | |
| | | Compensation | | | 90 | |
| | | Share Ownership | | | 90 | |
| | | Board Practices | | | 90 | |
| | | Employees | | | 92 | |
| ITEM 7. | | Major Shareholders and Related Party Transactions | | | 96 | |
| | | Major Shareholders | | | 96 | |
| | | Related Party Transactions | | | 96 | |
| ITEM 8. | | Financial Information | | | 99 | |
| | | Consolidated Statements And Other Financial Information | | | 99 | |
| | | Legal Proceedings | | | 99 | |
| | | Dividends | | | 100 | |
| | | Significant Changes | | | 100 | |
| ITEM 9. | | The Offer and Listing | | | 100 | |
| | | Trading Markets | | | 100 | |
| | | Trading On The Bolsa De Valores De Colombia | | | 102 | |
| ITEM 10. | | Additional Information | | | 102 | |
| | | Bylaws | | | 102 | |
| | | Material Contracts | | | 105 | |
| | | Exchange Controls | | | 106 | |
| | | Taxation | | | 107 | |
| | | Documents On Display | | | 111 | |
| ITEM 11. | | Quantitative and Qualitative Disclosures About Market Risk | | | 111 | |
| ITEM 12. | | Description of Securities Other than Equity Securities | | | 113 | |
| ITEM 12A. | | Debt Securities | | | 113 | |
| ITEM 12B. | | Warrants and Rights | | | 113 | |
| ITEM 12C. | | Other Securities | | | 113 | |
| ITEM 12D. | | American Depositary Shares | | | 113 | |
| ITEM 13. | | Defaults, Dividend Arrearages and Delinquencies | | | 114 | |
| ITEM 14. | | Material Modifications to the Rights of Security Holders and Use of Proceeds | | | 115 | |
| ITEM 15. | | Controls and Procedures | | | 115 | |
| ITEM 16. | | [Reserved] | | | 117 | |
| ITEM 16A. | | Audit Committee Financial Expert | | | 117 | |
| ITEM 16B. | | Code of Ethics | | | 117 | |
| ITEM 16C. | | Principal Accountant Fees and Services | | | 117 | |
| ITEM 16D. | | Exemptions from the Listing Standards for Audit Committees | | | 118 | |
| ITEM 16E. | | Purchases of Equity Securities by the Issuer and Affiliated Purchasers | | | 118 | |
| ITEM 16F. | | Change in Registrant’s Certifying Accountant | | | 118 | |
| ITEM 16G. | | Corporate Governance | | | 118 | |
| ITEM 17. | | Financial Statements | | | 120 | |
| ITEM 18. | | Financial Statements | | | 120 | |
| ITEM 19. | | Exhibits | | | 121 | |
| | | SIGNATURES | | | 122 | |
FORWARD-LOOKING STATEMENTS
This annual report on Form 20-F contains forward-looking statements within the meaning of the safe harbor provisions of the U.S. Private Securities Litigation Reform Act of 1995. These statements are not based on historical facts and reflect our expectations for future events and results. Most facts are uncertain because of their nature. Words such as “anticipate,” “believe,” “could,” “estimate,” “expect,” “should,” “plan,” “potential,” “predicts,” “prognosticate,” and “achieve,” among other similar expressions, are understood as forward-looking statements. These factors may include the following:
| | · | drilling and exploration activities; |
| | · | future production rates; |
| | · | import and export activities; |
| | · | liquidity, cash flow and uses of cash flow; |
| | · | projected capital expenditures; |
| | · | dates by which certain areas will be developed or will come on-stream; and |
| | · | allocation of capital expenditures to exploration and production activities. |
Actual results are subject to certain factors out of the control of the Company and may differ materially from the anticipated results. These factors may include the following:
| | · | changes in international crude oil and natural gas prices; |
| | · | limitations on our access to sources of financing; |
| | · | significant political, economic and social developments in Colombia and other countries where we do business; |
| | · | military operations, terrorist acts, wars or embargoes; |
| | · | regulatory developments, including regulations related to climate change; |
| | · | technical difficulties; and |
| | · | other factors discussed in this document as “Risk Factors.” |
Most of these statements are subject to risks and uncertainties that are difficult to predict. Therefore, our actual results could differ materially from projected results. Accordingly, readers should not place undue reliance on the forward-looking statements contained in this annual report.
ENFORCEMENT OF CIVIL LIABILITIES
We are a Colombian company, most of our Directors and executive officers and certain of the experts named in this annual report reside outside the United States. All or a substantial portion of our assets and the assets of these persons are located outside of the United States. As a result, it may not be possible for you to effect service of process within the United States upon us or these persons or to enforce against us or them judgments in U.S. courts obtained in such courts predicated upon the civil liability provisions of the U.S. federal securities laws. Colombian courts determine whether to enforce a U.S. judgment predicated on the U.S. securities laws through a procedural system known as exequatur. Colombian courts will enforce a foreign judgment, without reconsideration of the merits, only if the judgment satisfies the following requirements:
| | · | a treaty exists between Colombia and the country where the judgment was granted or there is reciprocity in the recognition of foreign judgments between the courts of the relevant jurisdiction and the courts of Colombia; |
| | · | the foreign judgment does not relate to “in rem rights” vested in assets that were located in Colombia at the time the suit was filed and does not contravene or conflict with Colombian laws relating to public order other than those governing judicial procedures; |
| | · | the foreign judgment, in accordance with the laws of the country where it was rendered, is final and is not subject to appeal and a duly certified and authenticated copy of the judgment has been presented to a competent court in Colombia; |
| | · | the foreign judgment does not refer to any matter upon which Colombian courts have exclusive jurisdiction; |
| | · | no proceeding is pending in Colombia with respect to the same cause of action, and no final judgment has been awarded in any proceeding in Colombia on the same subject matter and between the same parties; and |
| | · | in the proceeding commenced in the foreign court that issued the judgment, the defendant was served in accordance with the law of such jurisdiction and in a manner reasonably designated to give the defendant an opportunity to defend against the action. |
The United States and Colombia do not have a bilateral treaty providing for automatic reciprocal recognition and enforcement of judgments in civil and commercial matters. The Colombian Supreme Court has in the past accepted that reciprocity exists when it has been proven that either a U.S. court has enforced a Colombian judgment or that a U.S. court would enforce a foreign judgment, including a judgment issued by a Colombian court. However, such enforceability decisions are considered by Colombian courts on a case-by-case basis.
We reserve our right to plead sovereign immunity under the United States Foreign Sovereign Immunities Act of 1976 with respect to actions brought against us under United States federal securities laws or any state securities laws.
PRESENTATION OF FINANCIAL INFORMATION
Unless the context otherwise requires, the terms “Ecopetrol”, “we”, “us”, “our,” the “Company” or the “Corporate Group” are used in this annual report to refer to Ecopetrol S.A. and its subsidiaries on a consolidated basis.
In this annual report, references to “US$” or “U.S. dollars” are to United States dollars and references to “$,” “Ps$,” “Peso” or “Pesos” are to Colombian Pesos, the functional currency under which we prepare our financial statements. Certain figures shown in this annual report have been subject to rounding adjustments and, accordingly, certain totals may therefore not precisely equal the sum of the numbers presented. In this annual report a billion is equal to one with nine zeros.
The accompanying audited consolidated financial statements of Ecopetrol and our consolidated subsidiaries for the years ended December 31, 2010, 2009 and 2008 have been prepared from accounting records, which are maintained under the historical cost convention as modified in 1992, to comply with the legal provisions of the Colombian National Accounting Office (Contaduría General de la Nación), or CGN, to recognize the effect of inflation on non-monetary balance sheet accounts, including shareholders’ equity, until December 31, 2001. The CGN eliminated the use of inflation adjustments for accounting purposes for state-owned companies starting on January 1, 2002. However, our consolidated financial statements recognize the effect of inflation on non-monetary balance sheet accounts for an extended period from January 1, 1992 until December 31, 2006 for Propilco S.A., COMAI Compounding and Masterbatching Industry Ltda., Hocol Petroleum Limited, or Hocol, Oleoducto de Colombia S.A., or ODC, and Oleoducto Central S.A., or Ocensa, because, prior to our acquisition of these companies, they were subject to the accounting rules applicable to Colombian privately-owned entities. Under such rules, the effect of inflation on non-monetary balance sheet accounts was required to be recognized until December 31, 2006.
Our consolidated financial statements are prepared in accordance with accounting principles for Colombian state-owned entities issued by the CGN and other applicable legal provisions. The CGN adopted new accounting principles for Colombian state-owned entities in September 2007. These accounting principles are known as the Regime of Public Accounting (Régimen de Contabilidad Pública), or RCP. Pursuant to CGN Communication No. 0079-101345 of September 28, 2007, RCP became effective for Ecopetrol beginning with fiscal year ended December 31, 2008. Our consolidated financial statements at and for the years ended December 31, 2010, 2009 and 2008 have been prepared under RCP. Our consolidated financial statements for all prior years were prepared under the General Governmental Accounting Plan (Plan General de Contabilidad Pública), or PGCP, the former accounting principles issued by the CGN for Colombian state-owned entities. RCP differ in certain respects from PGCP. See Note 1 to our consolidated financial statements “Principal Accounting Policies and Practices.” We refer to both RCP and PGCP as Colombian Government Entity GAAP. Colombian Government Entity GAAP differs in certain significant respects from generally accepted accounting principles in the United States, or U.S. GAAP. Note 32 to our consolidated financial statements included in this annual report provides a description of the principal differences between Colombian Government Entity GAAP and U.S. GAAP as they relate to our audited consolidated financial statements and provides a reconciliation of net income and shareholders’ equity for the years and dates indicated therein. As a state-owned company, our consolidated financial statements are periodically reviewed by the CGN. However, the review of our accounts by the CGN does not constitute an audit.
On July 1, 2011, we filed a current report on Form 6-K (which was subsequently amended and restated to add further details by a current report on Form 6-K/A filed on July 6, 2011) explaining that, as noted in Note 32 to the accompanying consolidated annual financial statements, the financial statements as of and for the year ended December 31, 2009 that were previously issued in the 2009 Form 20-F, contained errors and should no longer be relied upon. We made this determination in accordance with the review performed in conjunction with the action plan to remediate the material weakness in our internal control over financial reporting and disclosure controls and procedures related to the process of preparation and analysis of the differences existing between Colombian Government Entity GAAP and U.S. GAAP included in the 2009 Form 20-F. The significant error related to the determination of the amount of unrealized gains and losses of health, education and pension bond employee benefit plans and resulted from a misinterpretation of the U.S. GAAP impact of the re-allocation of these employee benefit fund assets. As such, we recorded excess amortization expense under U.S. GAAP during 2009. This error led to an understatement of our consolidated net income in 2009 reconciled to U.S. GAAP of Ps$1,178,563 million (US$576,532 million at the exchange rate of Ps$2,044.23 to US$1.00, which was the representative market exchange rate at December 31, 2009). Other errors that were identified in the 2009 U.S. GAAP financial information are corrected in the restated 2009 financial statements, although such errors are not considered material, individually or in the aggregate. The restated 2009 financial statements, including PricewaterhouseCoopers Ltda.’s opinion thereon, are included in this annual report. This restatement only affects the financial information reported under U.S. GAAP. This restatement does not affect the financial information under Colombian Government Entity GAAP and therefore there is no impact on dividends declared and paid under the 2009 financial results, which are declared on the basis of the Colombian Government Entity GAAP financial statements.
Our consolidated financial statements include the financial results for Black Gold Re Ltd., Oleo é Gas Do Brasil Ltda., Ecopetrol del Perú S.A., Ecopetrol America Inc., Andean Chemicals Ltd., Propilco S.A., Ecopetrol Global Energy, Ecopetrol Transportation Company Limited, Ecopetrol Pipelines International Limited, Refinería de Cartagena S. A., or Reficar, COMAI Compounding and Masterbatching Industry Ltda., Hocol Petroleum Limited, Ecopetrol Transportation Investment Ltd and Ecopetrol Capital AG, which are wholly owned by us. Our consolidated financial statements also include the financial results of Bioenergy S.A., ODL Finance, Ocensa, ODC and Oleoducto Bicentenario de Colombia SAS of which at December 31, 2010 we had a 88.6%, 65%, 60%, 66% and 56% interest, respectively. Black Gold Re Ltd., Oleo é Gas Do Brasil Ltda., Ecopetrol del Perú S.A., Ecopetrol America Inc., Andean Chemicals Ltd., Propilco S.A., COMAI Compounding and Masterbatching Industry Ltda., Bioenergy S.A. and ODL Finance are included in our consolidated financial statements for the years ended December 31, 2010, 2009 and 2008. Ecopetrol Global Energy, Ecopetrol Transportation Company Limited, Reficar, Hocol, Ocensa and ODC are included in our consolidated financial statements for the years ended December 31, 2010 and 2009. Ecopetrol Transportation Investment Ltd, Ecopetrol Capital AG and Oleoducto Bicentenario de Colombia SAS are included in our consolidated financial statements for the year ended December 31, 2010. These financial statements were consolidated line by line and all transactions and significant balances between affiliates have been eliminated.
This annual report translates certain Peso amounts into U.S. dollars at specified rates solely for the convenience of the reader. Unless otherwise indicated, such Peso amounts have been translated at the rate of Ps$1,913.98 per US$1.00, which corresponds to the Tasa Representativa del Mercado or Representative Market Rate for December 31, 2010. The Representative Market Rate is computed and certified by the Superintendencia Financiera or Superintendency of Finance, the Colombian banking and securities regulator, on a daily basis and represents the weighted average of the buy and sell foreign exchange rates negotiated on the previous day by certain financial institutions authorized to engage in foreign exchange transactions. The Superintendency of Finance also calculates the Representative Market Rate for each month for purposes of preparing financial statements and converting amounts in foreign currency to Pesos. Such conversion should not be construed as a representation that the Peso amounts correspond to, or have been or could be converted into, U.S. dollars at that rate or any other rate. On July 15, 2011, the Representative Market Rate was Ps$1,748.41 per US$1.00.
PRESENTATION OF ABBREVIATIONS
The following is a list of crude oil and natural gas measurement abbreviations commonly used throughout this annual report.
| bpd | Barrels per day |
| boe | Barrels of oil equivalent |
| btu | British thermal units |
| cf | Cubic feet |
| cfpd | Cubic feet per day |
| mcf | Million cubic feet |
| mcfpd | Million cubic feet per day |
| mbtu | Million British thermal units |
| gbtu | Giga British thermal units |
| gbtud | Giga British thermal units per day |
| bcf | |
PRESENTATION OF THE NATION AND GOVERNMENT OF COLOMBIA
References to the Nation in this annual report relate to the Republic of Colombia, our controlling shareholder. References made to the Government of Colombia or the Government corresponds to the executive branch including the President of Colombia, the ministries and other governmental agencies responsible for regulating our business.
PRESENTATION OF INFORMATION CONCERNING RESERVES
Information concerning the technical definitions used for the estimated proved reserves is included in this annual report. Our hydrocarbon net proved reserves have been audited in 2010 by Ryder Scott Company L.P., DeGolyer and MacNaughton and Gaffney, Cline & Associates Inc., which we refer to collectively as the External Engineers, and their reserves reports are included as exhibits herein. See “Item 4. Information on the Company—Overview by Business Segment—Exploration and Production—Reserves” for additional information on our reserves estimates.
The following table sets forth the percentage of our estimated net proved reserves audited by External Engineers and the percentage calculated internally for the years ended December 31, 2010, 2009 and 2008.
| | | Estimated proved reserves for the year ended December 31, | |
| | | | | | | | | | |
| | | 2010 | | | 2009 | | | 2008 | |
| | | | | | | | | | |
Net proved reserves audited by Externals Engineers (2) | | | 99 | %(1) | | | 97 | %(1) | | | 89 | % |
| | | | | | | | | | | | | |
Net proved reserves estimates on our own calculations (2) | | | 1 | % | | | 3 | % | | | 11 | % |
| | (1) | Process conducted in definitions and rules accordance of Rule 4-10(a) of Regulation S-X and the disclosure guidelines contained in the SEC’s “Modernization of Oil and Gas Reporting” final rule dated December 31, 2008 and effective as of January 1, 2010. |
| | (2) | Process conducted under SEC definitions and rules. |
On December 31, 2008, the SEC issued a final rule revising disclosure requirements relating to oil and gas reserves. The principal impact of the adoption of the rule change to us, effective as of January 1, 2010, was related to the prices used to estimate our reserves. In relation to crude oil and natural gas prices, under the new SEC rule, reserves are required to be estimated by applying (x) the arithmetic average of the first-day-of-the-month price for each month within the year to (y) year-end quantities of proved reserves, or the SEC average price methodology. Our proved reserves as of December 31, 2010 and 2009 are based on the SEC average price methodology for purposes of both Colombian Government Entity GAAP and U.S. GAAP. Prior to the 2009 revision, the SEC required reserves to be estimated by applying (x) the year-end price to (y) year-end quantities of proved reserves or the SEC year-end price methodology. Our proved reserves as of December 31, 2008 are based on the SEC year-end price methodology for purposes of both Colombian Government Entity GAAP and U.S. GAAP. All reserve estimates involve some degree of uncertainty. See “Item 3. Key Information—Risk Factors—Risks related to our business” for a description of the risks relation to our reserves and our reserve estimates.
We are required, as are all oil companies undertaking exploratory and production activities in Colombia, to pay a percentage of our production to the Government as royalties. The oil and gas reserve figures included in this annual report are net of such royalties.
| ITEM 1. | Identity of Directors, Senior Management and Advisors |
Not applicable.
| ITEM 2. | Offer Statistics and Expected Timetable |
Not applicable.
SELECTED FINANCIAL DATA
The following table sets forth, for the periods and at the dates indicated, our summary historical financial data, which have been derived from our consolidated financial statements, presented in Pesos. Our consolidated financial statements for the years ended December 31, 2010, 2009 and 2008 were audited by PricewaterhouseCoopers Ltda. and our consolidated financial statements for the years ended December 31, 2007 and 2006 were audited by Ernst & Young Audit Ltda. The information included below and elsewhere in this annual report is not necessarily indicative of our future performance. The tables set forth below are derived from, and should be read in conjunction with, our consolidated financial statements and accompanying Notes included in this annual report. See also “Item 5. Operating and Financial Review and Prospects” in this annual report. The selected U.S. GAAP financial information for 2009 presented in the table below has been derived from our restated 2009 financial statements. See “Item 5. Operating and Financial Review and Prospects—Effects of 2009 U.S. GAAP Restatement” and Note 32 to the accompanying consolidated financial statements.
| | | BALANCE SHEET | |
| | | For the year ended December 31, | |
| | | 2010(1) | | | 2010 | | | 2009 | | | 2008 | | | 2007 | | | 2006 | |
| | | (Pesos in millions and US$ in thousands except for common share and dividends per share amounts) | |
| | | | | | | | | | | | | | | | | | | |
| Total assets | | | 35,930,029 | | | | 68,769,356 | | | | 55,559,517 | | | | 48,702,412 | | | | 48,112,080 | | | | 42,137,722 | |
| Shareholders’ Equity | | | 21,592,797 | | | | 41,328,181 | | | | 32,569,957 | | | | 34,619,717 | | | | 26,808,467 | | | | 20,835,746 | |
| Subscribed capital | | | 5,286,434 | | | | 10,118,128 | | | | 10,118,128 | | | | 10,118,128 | | | | 10,118,128 | | | | 9,096,197 | |
Number of common shares(3) | | | 40,472,512,588 | | | | 40,472,512,588 | | | | 40,472,512,588 | | | | 40,472,512,588 | | | | 40,472,512,588 | (2) | | | 36,384,788,817 | |
| Dividends declared per share: | | | 0.05 | | | | 91.0 | (4) | | | 220.0 | (4) | | | 115.0 | (4) | | | 123.0 | (5) | | | 55.0 | |
| Amounts in accordance with U.S. GAAP | | | | | | | | | | | | | | | | | | | | | | | | |
| Total Assets | | | 27,342,056 | | | | 52,332,148 | | | | 42,624,352 | (6) | | | 40,244,452 | | | | 29,698,528 | | | | 26,517,482 | |
| Ecopetrol Shareholders’ Equity | | | 14,198,312 | | | | 27,175,285 | | | | 22,383,712 | (6) | | | 27,425,735 | | | | 20,991,031 | | | | 18,015,386 | |
Number of common shares(3) | | | 40,472,512,588 | | | | 40,472,512,588 | | | | 40,472,512,588 | | | | 40,472,512,588 | | | | 40,472,512,588 | | | | 36,384,788,817 | |
| Dividends declared per share: | | | 0.05 | | | | 91.0 | | | | 220.0 | | | | 115.0 | | | | 123.0 | | | | 55.0 | |
| (1) | Amounts stated in U.S. dollars have been translated for the convenience of the reader at the rate of Ps$1,913.98 to US$1.00, which is the Representative Market Rate at December 31, 2010, as reported and certified by the Superintendency of Finance. |
| (2) | Includes 48,512,147 new shares, before the 1 to 400 split, issued to the Nation on April 27, 2007, representing in-kind contributions of developed reserves in accordance with Decree 2625 of 2000. |
| (3) | Number of common shares includes (i) 48,512,147 shares issued to the Nation on April 2007, representing in-kind contributions, (ii) a 1 to 400 stock split in July 2007, which for purposes of comparability and dividends per share has been applied as if it had occurred in 2006 and (iii) 4,087,723,771 shares issued to the public in connection with our initial offering of shares in Colombia in November 2007. |
| (4) | Represents payments made in 2010, 2009 and 2008 based on net income and retained earnings for the years ended December 31, 2009, 2008 and 2007, respectively. |
| (5) | In 2007 dividends were declared and paid on 36,384,788,817 shares. In the same year, dividend payments to the Nation amounted to Ps$4,475,399 million of which Ps$3,052,236 million corresponded to net income and Ps$1,423,163 million to retained earnings paid prior to our initial public offering in the fourth quarter of 2007. See “Item 5. Operating and Financial Review and Prospects—Transformation from a wholly state-owned entity.” |
| (6) | Restated figures. See Note 32 to our consolidated financial statements. |
Colombian Government Entity GAAP differs in certain significant respects from U.S. GAAP. For a description of the principal differences between Colombian Government Entity GAAP and U.S. GAAP as they relate to us, a reconciliation to U.S. GAAP of net income and shareholders’ equity, and condensed financial statements under U.S. GAAP, see Note 32 to our consolidated financial statements and “Item 5. Operating and Financial Review and Prospects—Principal Differences between Colombian Government Entity GAAP and U.S. GAAP.”
| | | | |
| | | For the year ended December 31, | |
| | | | | | | | | | | | | | | | | | | |
| | | (US$ in thousands except for net income per share and average number of shares amounts) | | | (Pesos in millions except for net income per share and average number of shares amounts) | |
| | | | |
| Total revenue | | | 21,927,246 | | | | 41,968,311 | | | | 30,404,390 | | | | 33,896,669 | | | | 22,332,320 | | | | 18,389,965 | |
| Operating income | | | 6,728,828 | | | | 12,878,842 | | | | 7,873,339 | | | | 12,657,358 | | | | 8,959,138 | | | | 4,798,437 | |
| Net operating income per share | | | 0.17 | | | | 318 | | | | 195 | | | | 313 | | | | 292 | | | | 113,038 | |
| Income before income tax | | | 6,004,565 | | | | 11,492,617 | | | | 7,250,844 | | | | 16,011,204 | | | | 7,065,304 | | | | 4,891,142 | |
| Net income | | | 4,256,299 | | | | 8,146,471 | | | | 5,132,054 | | | | 11,629,677 | | | | 5,179,792 | | | | 3,391,373 | |
Weighted average number of shares outstanding(2) | | | 40,472,512,588 | | | | 40,472,512,588 | | | | 40,472,512,588 | | | | 40,472,512,588 | | | | 30,702,164,870 | | | | 42,449,825 | |
Net income per share(3) | | | 0.11 | | | | 201 | | | | 127 | | | | 287 | | | | 169 | | | | 79,891 | |
| Amounts in accordance with U.S. GAAP | | | | | | | | | | | | | | | | | | | | | | | | |
| Total revenue | | | 21,358,282 | | | | 40,879,324 | | | | 29,551,574 | | | | 33,849,213 | | | | 22,784,694 | | | | 19,461,739 | |
| Operating income | | | 7,251,128 | | | | 13,878,514 | | | | 8,055,213 | (4) | | | 9,840,311 | | | | 8,455,099 | | | | 7,245,976 | |
| Net operating income per share | | | 0.18 | | | | 343 | | | | 199 | (4) | | | 243 | | | | 229 | | | | 199 | |
| Income before income tax and non-controlling interest | | | 6,708.91 | | | | 12,840,721 | | | | 8,768,383 | (4) | | | 13,427,443 | | | | 8,710,648 | | | | 7,765,863 | |
| Net income attributable to Ecopetrol | | | 4,290,032 | | | | 8,211,035 | | | | 5,718,304 | (4) | | | 8,841,883 | | | | 6,144,685 | | | | 6,636,424 | |
| Net income per share | | | 0.11 | | | | 203 | | | | 141 | (4) | | | 218 | | | | 166 | | | | 182 | |
Average numberof shares outstanding(5) | | | 40,472,512,588 | | | | 40,472,512,588 | | | | 40,472,512,588 | | | | 40,472,512,588 | | | | 36,922,352,491 | | | | 36,384,788,817 | |
| (1) | Amounts stated in U.S. dollars have been translated for the convenience of the reader at the rate of Ps$1,913.98 to US$1.00, which was the Representative Market Rate at December 31, 2010, the last business day of the year, as reported and certified by the Superintendency of Finance. |
| (2) | The weighted average number of common shares outstanding during 2007 was 30,702,164,870 as a result of the application of the 1 to 400 stock split, capitalization of reserves by the Nation and initial public offering in Colombia, which represents a net income per share of Ps$169, compared to Ps$79,891 during 2006 when the average number of shares outstanding was 42,449,825. |
| (3) | Net income per share is calculated using the weighted-average number of outstanding shares at December 31 of each year, adjusted for a 1 to 400 stock split and the contribution to equity from the Nation. |
| (4) | Restated figures. See Note 32 to our consolidated financial statements. |
| (5) | Calculated in accordance with U.S. GAAP, which differs in certain respects with the calculation of weighted average number of shares pursuant to Colombian Government Entity GAAP. |
EXCHANGE RATE INFORMATION
On July 15, 2011, the Representative Market Rate was Ps$1,748.41 per US$1.00. The Federal Reserve Bank of New York does not report a noon-buying rate for Colombian Pesos. The Superintendency of Finance calculates the Representative Market Rate based on the weighted averages of the buy/sell foreign exchange rates quoted daily by foreign exchange rate market intermediaries including financial institutions for the purchase and sale of U.S. dollars.
The following table sets forth the high, low, average and period-end exchange rate for Pesos/U.S. dollar Representative Market Rate for each of the last five years and for the last six months.
| | | | |
| | | | | | | | | | | | | |
| Year ended December 31, | | | | | | | | | | | | |
| | | | | | | | | | | | | |
| 2006 | | | 2,634.06 | | | | 2,225.44 | | | | 2,357.98 | | | | 2,238.79 | |
| 2007 | | | 2,261.22 | | | | 1,877.88 | | | | 2,078.35 | | | | 2,014.76 | |
| 2008 | | | 2,392.28 | | | | 1,652.41 | | | | 1,966.26 | | | | 2,243.59 | |
| 2009 | | | 2,596.37 | | | | 1,825.68 | | | | 2,156.29 | | | | 2,044.23 | |
| 2010 | | | 2,044.23 | | | | 1,786.20 | | | | 1,897.89 | | | | 1,913.98 | |
| 2011: | | | | | | | | | | | | | | | | |
| January | | | 1,913.98 | | | | 1,838.94 | | | | 1,866.64 | | | | 1,857.98 | |
| February | | | 1,907.69 | | | | 1,852.67 | | | | 1,882.61 | | | | 1,895.56 | |
| March | | | 1,916.05 | | | | 1,865.11 | | | | 1,884.38 | | | | 1,879.47 | |
| April | | | 1,870.60 | | | | 1,767.54 | | | | 1,812.77 | | | | 1,767.54 | |
| May | | | 1,831.58 | | | | 1,763.12 | | | | 1,801.65 | | | | 1,817.34 | |
| June | | | 1,797.83 | | | | 1,769.83 | | | | 1,782.54 | | | | 1,780.16 | |
| Source: | Superintendency of Finance for historical data. Banco de la República, or the Colombian Central Bank, for averages. |
RISK FACTORS
Risks relating to Colombia’s political and regional environment
Colombia has experienced internal security issues that have had or could have in the future a negative effect on the Colombian economy and on us.
Colombia has experienced internal security issues, primarily due to the activities of guerrillas, paramilitary groups, drug cartels and criminal bands, known as Bacrim. In the past, guerrillas have targeted the crude oil pipelines, including the Oleoducto Transandino, Caño Limón-Coveñas and Ocensa pipelines, and other related infrastructure disrupting our activities and those of our business partners. On several occasions guerilla attacks have resulted in unscheduled shut-downs of transportation systems in order to repair damaged sections and undertake clean-up activities as well as in deferral of production in certain fields. These activities, their possible escalation and the effects associated with them have had and may have in the future a negative impact on the Colombian economy or on us, which may affect our customers, employees or assets. In the context of this situation, allegations and court judgments have been levied against members of the Congress of Colombia and on Government officials for possible ties with illegal groups. This situation may have a negative impact on the credibility of the Colombian Government which could in turn have a negative impact on the Colombian economy or on us in the future.
There have been certain events in Colombia and abroad, which have resulted in political tension between Colombia and some of its neighboring countries.
Events such as the Colombian government-sponsored attacks on a Revolutionary Armed Forces of Colombia, or FARC, camp in Ecuador in 2008, which resulted in the death of one of the members of the FARC’s Secretariat, and the signing in 2009 of a military treaty between Colombia and the United States (which was not ratified by the Colombian Constitutional Court in an August 2010 decision) have made the diplomatic relations between Colombia and some of its neighboring countries, in particular Ecuador and Venezuela, very tense. This political tension was heightened by the Colombian Government’s allegations that neighboring countries are supporting the guerilla groups. On other occasions allegations have been made by Venezuela that the Colombian army has entered foreign soil while in pursuit of FARC members. The Colombian army and air force continue to combat FARC members throughout Colombia, including Colombia’s borders. Although relations with neighboring countries have stabilized recently, there can be no assurance that similar events could occur and result in new and heightened tensions with Colombia’s neighbors, which has had in the past, and could have in the future, a negative impact on Colombia’s economy and general security situation.
Companies operating in Colombia, including us, are subject to prevailing economic conditions and the investment climate in Colombia, which may be less stable than prevailing economic conditions and the investment climate in developed countries.
Market prices of securities issued by Colombian companies, including us, are subject to the prevailing economic conditions in Colombia. A large portion of our assets and operations are located in Colombia, and most of our sales are currently derived from our crude oil and natural gas production and production of our refineries located in Colombia. In the past, economic growth in Colombia has been negatively affected by lower foreign direct investment and high inflation rates and the perception of political instability.
The Colombian government has changed monetary, fiscal, taxation, labor and other policies over time and has thus influenced the performance of the Colombian economy. We have no control over the extent and timing of government intervention and policies.
Juan Manuel Santos was elected President of Colombia on June 20, 2010. The investment and security climate in the country will be tied to how this government and the application of its economic, security and social policies are perceived by foreign investors. In 2010, Colombia’s gross domestic product increased by 4.3% notwithstanding a 5.3% decrease in foreign direct investment, which itself has demonstrated an improvement during the first four months of 2011, increasing by 55% when compared to the same period in 2010.
If the perception of improved overall security in Colombia deteriorates or if foreign direct investment declines, the Colombian economy may face a downturn, which could negatively affect our financial condition and results of operation. Furthermore, the market price of our shares and American Depositary Shares, or ADSs, may be adversely affected by changes in governmental policies, particularly those affecting economic growth, exchange rates, interest rates, inflation and taxes.
Developments and the perception of risk in other countries, especially emerging market countries, may adversely affect the market price of Colombian securities, including our ADSs.
Securities issued by Colombian companies may be affected by economic and market conditions in other countries, including other Latin American and emerging market countries. Securities issued by Colombian issuers are also likely to be affected by economic and political conditions in Colombia’s neighbors: Venezuela, Ecuador, Perú, Brazil and Panama. Although economic conditions in such Latin American and other emerging market countries may differ significantly from economic conditions in Colombia, investors’ reactions to developments in these other countries may have an adverse effect on the market value of securities of Colombian issuers.
Due to crises in several emerging market countries (such as the Asian financial crisis of 1997, the Russian financial crisis of 1998 and the Argentine financial crisis of 2001), and the recent world financial crisis, investors may view investments in emerging markets with heightened caution. As a result of the crisis in other countries, flows of investments into Colombia were reduced. Crises in other emerging market countries may hamper investor enthusiasm for securities of Colombian issuers. If Latin America experiences a new slow-down or if the price for securities of Latin American issuers falls, the price for our ADSs could follow this trend and could be adversely affected. A new financial crisis or an expansion of the current crisis could also make it more difficult for us and our subsidiaries to access the international capital markets and finance our operations and capital expenditures in the future on acceptable terms.
Our controlling shareholder’s interests may be different from minority shareholders.
The Republic of Colombia, or the Nation, is our largest shareholder controlling 89.9% of our outstanding capital stock. Colombian law requires the Nation to maintain the majority of our outstanding capital stock, thus holding the right to elect the majority of the members of our Board of Directors. In the future, the Nation, as our controlling shareholder, may undertake projects, make decisions or announcements about its intentions related to its holding of our capital stock, which may not be in our best interest or in the best interest of our minority shareholders, including holders of our ADSs, and could impact the price of our shares or ADSs.
Additionally, the Nation through its majority voting right, may approve dividends at the ordinary general shareholders’ meeting, notwithstanding the interests of minority shareholders, in an amount that results in us having to reduce our capital expenditures, thereby negatively affecting our prospects, results of operations and financial condition. See “Item 8. Financial Information—Dividends.”
Our operations are subject to extensive regulation.
The Colombian hydrocarbons industry is subject to extensive regulation and supervision by the Government in matters including the award of exploration and production blocks by the National Hydrocarbon Agency (Agencia Nacional de Hidrocarburos), or ANH, the imposition of specific drilling and exploration obligations, restrictions on production, price controls, capital expenditures and required divestments. Existing regulation applies to virtually all aspects of our operations in Colombia and abroad. See “Item 4. Information on the Company—Overview by Business Segment—Regulation.”
The terms and conditions of the agreements with the ANH under which we explore and produce crude oil and natural gas generally reflect negotiations with the ANH and other governmental authorities and may vary by fields, basins and hydrocarbons discovered.
We are required, as are all oil companies undertaking exploratory and production activities in Colombia, to pay a percentage of our production to the Government as royalties. The oil and gas reserve figures included in this annual report are net of such royalties. The Government has modified the royalty program for crude oil and natural gas production several times in the last 20 years, as it has modified the regime regulating new contracts entered into with the Government. The royalty regime for contracts being entered into today for crude oil is tied to a scale starting at 8% for production of up to 5,000 barrels per day, or bpd, and increases up to 25% for production above 600,000 bpd. Royalties for natural gas production are also subject to a sliding scale depending on whether the field is on or off-shore and range between 8% and 25%.
In the future, the Government may once again amend royalty payment levels for new contracts and such changes could have an adverse effect on our future exploration and production contracts in Colombia.
The Government may delay the reimbursement of the gasoline and diesel fuel price differentials.
The Government regulates domestic prices of liquid fuels according to international market conditions in order to align domestic prices with trends in international prices, with a one-month lag. When domestic prices of liquid fuels are lower than international parity prices, the Government is responsible for reimbursing importers or refiners for the difference, which difference is called the fuel price differential, pursuant to Law 1151 of 2007. The fuel price differential is calculated on a monthly basis and reported on a quarterly basis, with the corresponding cash payment to be made during the next subsequent quarter. In cases of payment delays, refiners are entitled to receive interest on past due amounts.
Historically, when domestic prices of liquid fuels were higher than international parity prices, the Government lowered domestic prices. However, towards the end of 2008 as international prices decreased, the Government decided not to lower domestic prices. Instead, the Government kept domestic prices high and allocated the positive difference between domestic fuel prices and the international parity prices to a Fuels Stabilization Fund (Fondo de Estabilización de Precios de los Combustibles), or FEPC. Similar to the approach followed by other countries, the FEPC is funded with these excess payments when international prices are low and depleted when international prices are high in order to mitigate domestic price volatility.
During 2008, refiners, including us, were entitled to fuel price differential payments based on trends in international prices. However, the payment by the Government of the 2008 fuel price differential was delayed and the Ministry of Mines and Energy issued a resolution by which it established a payment schedule relating to the 2008 fuel price differential. Under this payment schedule, the 2008 fuel price differential was paid in three installments in April, August and December 2009 and the Government paid additional interest with respect to these amounts.
During 2010, refiners, including us, were once again entitled to fuel price differential payments corresponding to the first, second and fourth quarters of the year. However, the fuel price differential for the fourth quarter of 2010 equal to Ps$73.5 billion had not been timely paid in the first quarter of 2011.
Based on these past delays, we are unable to determine when we will collect the amount of any fuel price differentials that become due in the future. Any material delay in payment of these fuel price differentials by the Government or a significant amendment to Law 1151 of 2007 imposing on us additional responsibilities with respect to fuel price differentials could have a negative impact on our financial condition and results of operations. Currently, the Congress of Colombia is discussing a bill to introduce a new methodology to calculate fuel price differentials, determine the maximum retail price of gasoline and diesel and the mechanisms to operate the FEPC.
New or higher taxes resulting from changes in tax regulations or the interpretation thereof in Colombia could adversely affect our results of operations and financial condition.
New tax laws and regulations, and uncertainties with respect to future tax policies, pose risks to us. In recent years, Colombian tax authorities have imposed additional taxes in a variety of areas, such as taxes on financial transactions and other taxes on net worth. Changes in tax-related laws and regulations, and interpretations thereof, can affect tax burdens by increasing tax rates and fees, creating new taxes, limiting tax deductions, and eliminating tax-based incentives and non-taxed income. In addition, tax authorities or courts may interpret tax regulations differently than we do, which could result in tax litigation and associated costs and penalties. In order to avoid double taxation, our subsidiaries usually distribute dividends from profits that have already been subject to income tax. These dividends are usually not taxable for Ecopetrol in Colombia, and dividends paid by Ecopetrol to our shareholders in Colombia from these sources of income also are usually not taxable, in each case provided that such profits have been taxed at the subsidiary level. This tax treatment may not be maintained in the future, and any change could have an adverse effect on our results of operations and financial condition.
Risks related to our business
Our crude oil and natural gas reserve estimates involve some degree of uncertainty and may prove to be incorrect over time, which could adversely affect our ability to generate revenue.
Historical reserves estimates are prepared by the use of generally accepted geological and engineering and evaluation methods and procedures. Estimates are based on geological, topographic and engineering facts. Actual reserves and production may vary materially from estimates shown in this annual report, which could affect our results of operation.
Our business depends substantially on international prices for crude oil and refined products, and prices for these products are volatile. A sharp decrease in such prices could adversely affect our business prospects and results of operations.
Crude oil prices have traditionally fluctuated as a result of a variety of factors including, among others, the following:
| | · | changes in international prices of natural gas and refined products; |
| | · | long-term changes in the demand for crude oil, natural gas and refined products; |
| | · | increase in the cost of capital; |
| | · | adverse economic conditions; |
| | · | development of new technologies; |
| | · | economic and political events, especially in the Middle East and elsewhere with high levels of crude oil production; |
| | · | the willingness and ability of the Organization of the Petroleum Exporting Countries, or OPEC, and its members to set production levels and prices; |
| | · | local and global demand and supply; |
| | · | development of alternative fuels; |
| | · | terrorism and global conflict. |
As of December 2010, nearly 95% of our revenues came from sales of crude oil, natural gas and refined products. Most prices for products developed and sold by us are quoted in U.S. dollars and fluctuations in the U.S. dollar/Peso exchange rate have a direct effect on our Peso-denominated financial statements.
A significant and sustained decrease in crude oil prices could have a negative impact on our results of operations and financial condition. In addition, a reduction of international crude oil prices could result in a delay in our capital expenditure plan, in particular delaying exploration and development activities, thereby delaying the development of reserves and affecting future cash flows.
We are exposed to the credit risks of our customers and any material nonpayment or nonperformance by our key customers could adversely affect our cash flow and results of operations.
Some of our customers may experience financial problems that could have a significant negative effect on their creditworthiness. Severe financial problems encountered by our customers could limit our ability to collect amounts owed to us, or to enforce the performance of obligations owed to us under contractual arrangements. In addition, many of our customers finance their activities through their cash flows from operations, the incurrence of debt or the issuance of equity.
The combination of declining cash flows as a result of declines in commodity prices, a reduction in borrowing bases under reserve-based credit facilities and the lack of availability of debt or equity financing may result in a significant reduction of our customers’ liquidity and limit their ability to make payments or perform on their obligations to us. In addition, some of our customers may be highly leveraged and subjected to their own operating expenses, and as such, the risk we face in doing business with these customers may increase. Other customers may be subjected to regulatory changes, which could increase the risk that they may default on their obligations to us. For example, due to a Venezuelan government constraint imposed on foreign currency transactions, PDVSA Gas has delayed payments to its providers, including us. Financial problems experienced by our customers could result in the impairment of our assets, a decrease in our operating cash flows and may also reduce or curtail our customers’ future use of our products and services, which may have an adverse effect on our revenues.
Achieving our long-term growth prospects depends on our ability to execute our Strategic Plan, in particular discovering additional reserves and successfully developing them.
The ability to achieve our long-term growth objectives depends on discovering or acquiring new reserves as well as successfully developing them. Our exploration activities expose us to the inherent risks of drilling, including the risk that we will not discover commercially productive crude oil or natural gas reserves. The costs associated with drilling wells are often uncertain, and numerous factors beyond our control may cause drilling operations to be curtailed, delayed or cancelled.
If we are unable to conduct successful exploration and development of our exploration activities, or if we do not acquire properties having proved reserves, our level of proved reserves will decline. Failure to secure additional reserves may impede us from achieving our growth targets and production targets, and may have a negative effect on our results of operations and financial condition.
Our participation in deep water drilling in conjunction with our business partners involves certain risks and costs, which may be outside of our control.
We, in association with our business partners, have undertaken deep water exploratory drilling in two wells in the Gulf of Mexico and two blocks in Brazil. Additionally, we are acting as operators in six off-shore exploratory blocks in Colombia. In association with our business partners, we are also planning on undertaking deep water drilling in one of the blocks in Colombia, two wells in the Gulf of Mexico, and three blocks in Brazil. These deep water drilling activities entail new and heightened risks as reserves are located at greater distances underneath the seabed. The heightened risks and costs associated with deep water drilling may have a negative effect on our results of operations and financial condition.
As a result of the oil spill in the Macondo field in the Gulf of Mexico beginning in April 2010, significant concerns regarding the safety of deep water drilling had been raised and the U.S. government had declared a six-month moratorium on drilling new deep-water wells in the Gulf of Mexico. In 2010 we, in association with our business partners which were to act as operators, had planned the drilling of four exploratory wells in the Gulf of Mexico. Since we have no control over these types of foreign government regulations, they may negatively impact the timing of our deep water drilling operations and consequently our results of operations and financial condition.
Our drilling activities are capital intensive and may not be productive.
Drilling for crude oil and natural gas involves numerous risks, including the risk that we will not encounter commercially productive crude oil or natural gas reservoirs. The costs of drilling, completing and operating wells may be high or uncertain, and drilling operations may be curtailed, delayed or canceled as a result of a variety of factors, including:
| | · | unexpected drilling conditions; |
| | · | pressure or irregularities in formations; |
| | · | equipment failures or accidents; |
| | · | fires, explosions, blow-outs and surface cratering; |
| | · | other adverse weather conditions and natural disasters; and |
| | · | shortages or delays in the availability or in the delivery of equipment. |
Certain of our future drilling activities may not be successful and, if unsuccessful, this failure could reduce the ratio at which we replace our reserves, which could have an adverse effect on our results of operations and financial condition. While all drilling, whether developmental or exploratory, involves risks, exploratory drilling involves greater risks of dry holes or failure to find commercial quantities of hydrocarbons. Because of the percentage of our capital budget devoted to higher-risk exploratory projects, it is likely that we may in the future experience significant exploration and dry hole expenses.
Increased competition from local and foreign crude oil companies may have a negative impact on our ability to gain access to additional crude oil and natural gas reserves in Colombia.
The ANH is the governmental entity responsible for promoting oil and gas investments in Colombia, establishing terms of reference for exploration rounds and assigning exploration blocks to oil and gas companies. Prior to the enactment of Decree Law 1760 of 2003, we had an automatic right to explore any territory in Colombia and to enter into joint venture agreements with foreign and local oil companies. Under current regulations, we are entitled to bid for any exploration blocks offered for exploration by the ANH and we compete under the same conditions as other domestic and foreign oil and gas companies, receiving no special treatment. We may also request the ANH to assign us exploration blocks which have not been previously reserved by that Agency. Our ability to obtain access to potential production fields also depends on our ability to evaluate and select potential hydrocarbon-producing fields and to adequately bid for these exploration fields.
Our strategies include international expansion where we may face competition from local market players and international oil companies that have experience exploring in other countries.
If we are unable to adequately compete with local and foreign oil companies, or if we cannot enter into joint ventures with market players with properties where we could potentially find additional reserves, we may be conducting exploration activities in less attractive blocks, and we could reduce our market share participation. If we fail to maintain our current market position in Colombia, our results of operations and financial conditions may be adversely affected.
Our future performance depends on the successful development and deployment of new technologies.
Technology and innovation are essential to us, especially for improvement in the production of heavy crude oil and the exploitation of mature fields. If we do not develop the right technology, do not have access to it or do not deploy it effectively, the execution of our strategic plans, our profitability and our earnings may be adversely affected.
We may be subject to substantial risks relating to our development of exploration activities outside Colombia.
We began exploration activities outside Colombia in 2006 through our Brazilian subsidiary, Oleo é Gas Do Brasil Ltda. Our foreign subsidiaries have subsequently entered into a number of joint venture exploration agreements with regional and international oil companies to explore blocks in Perú, Brazil and the U.S. Gulf of Mexico. The results of operations and financial condition of our subsidiaries in these countries may be adversely affected by fluctuations in their local economies, political instability and government actions.
We have limited experience exploring outside Colombia, where we are the incumbent operator. We may face new and unexpected risks involving environmental requirements that exceed those currently faced by us. Additionally, we may be exposed to legal disputes with foreign regulators. For example, we were awarded block Tucano-156 in Brazil in the 8th round of 2006. However, our award is currently suspended as a result of a governmental injunction against the 8th round award process. According to official publications, Brazil’s National Petroleum, Natural Gas and Biofuels Agency (Agência Nacional de Petróleo, Gás Natural e Biocombustíveis), or ANP, removed all blocks that did not receive offers during the 8th round. However, the publications do not specify what will be the result with respect to the 38 blocks which did receive winning offers, including Tucano-156. According to our consultations with the Superintendency of Promotion of Licensing Rounds (Superintendência de Promoção de Licitações), or SPL, the awarding process has not yet been defined and the ANP is still waiting for further instructions from the Brazilian government. We may also experience the imposition of restrictions on hydrocarbon exploration and export, or increases in export tax or income tax rates for crude oil and natural gas.
If one or more of these risks described above were to materialize, we may not achieve the strategic objectives in our international operations, which may negatively affect our results of operations and financial condition.
We may incur losses and spend time and money defending pending lawsuits and arbitrations.
We are currently a party to several legal proceedings filed against us. We are also subject to labor-related lawsuits filed by current and former employees in connection with pension plans and retirement benefits. At December 31, 2010, we were a party to 1,953 legal proceedings relating to civil, administrative, environmental, tax, and labor claims filed against us of which 726 met the accounting threshold for an accrual provision. We allocate substantial amounts of money and time to defend these claims. These claims involve substantial sums of money as well as other remedies. See Notes 17 and 29 to our consolidated financial statements and Item 8. “Financial Information—Legal Proceedings.”
Our operations may not be able to keep pace with the increasing demand for natural gas.
The demand for natural gas in Colombia has grown significantly in recent years. As a result of this growth, future demand for natural gas could exceed production capacity, resulting in possible supply shortages. When production shortages occur, we are required to compensate some clients with whom we have supply contracts by paying penalties and other compensatory expenses detailed in the supply contracts.
Internal demand for natural gas has experienced strong growth during the last decade as a result of national campaigns for cleaner energy and more competitive tariffs for retail customers. During 2009 and 2010, growth in demand was mainly driven by the natural weather phenomenon known as “El Niño,” which led to an increase in the demand for natural gas during certain months. This resulted in supply shortages and led the Ministry of Mines and Energy to ration natural gas, giving priority to natural gas delivery to certain areas of consumption regardless of supply contracts we had with our clients, forcing us to pay penalties and other compensatory expenses to certain of our clients whose demand was cut. During 2009 and 2010, the penalties paid were Ps$ 27.8 billion (approximately US$14.5 million) and Ps$ 85.2 billion (approximately US$44.5 million), respectively.
We have long-term contracts to supply power utilities and other large customers. In 2007, we signed an agreement with PDVSA Gas to supply natural gas to Venezuela through 2011, when it is expected that Venezuela will supply us with natural gas; however, it is uncertain whether Venezuela will be able to begin supplying us with natural gas by 2012.
In the long term, we may not be able to keep up with local demand and industrial commitments if demand outpaces the rate of new gas developments and discoveries. Additionally, if our current expansion projects or new projects are delayed, we may be required to compensate our long-term contract customers for our failure to supply natural gas, which may negatively impact our financial condition and results of operation.
We are not permitted by law to own more than 25% of a natural gas transportation company, which may not allow us to transport new natural gas reserves to distribution points and to our customers.
We discovered natural gas reserves in the Cusiana and Cupiagua fields for which limited transportation capacity currently exists. New natural gas transportation infrastructure may not be available to transport natural gas from new or existing fields to consumption areas. Furthermore, we are prohibited by law from holding more than 25% of the equity of any natural gas transportation company and we cannot determine whether the necessary transportation capacity will be built by third parties to transport natural gas. We may be required to enter into agreements with natural gas transportation companies on terms that are not favorable to us.
We currently have long-term supply contracts with gas-fired power plants that require us to deliver natural gas in Barrancabermeja and at the La Guajira fields. Our ability to deliver the natural gas to these clients at the delivery point is limited by the transportation capacity of the Ballena-Barranca pipeline. If we are unable to acquire the necessary transportation, we may be unable to meet our obligation with power generators, which could result in us having to pay fines.
If we are unable to transport natural gas discoveries to our customers or to regions where natural gas is needed, we may not be able to develop these reserves, which may result in impairment of the related assets and would not allow us to recover the capital expenditures invested to make these natural gas discoveries.
Results could be affected by conflicts with the labor unions.
In the past, we have been affected by strikes and work stoppages promoted by our labor unions. These strikes have been both politically and contract-related, especially during collective bargaining negotiations. In April, 2009, we entered into an agreement with the Unión Sindical Obrera de la Industria del Petróleo, or USO, one of our industry labor unions, to restore trust between USO and us with open communication and transparency as the main principles. Additionally, on August 22, 2009, as a result of consensual negotiations, we entered into a new five-year collective bargaining agreement with three of our most significant industry labor unions: USO, Asociación de Directivos Profesionales, Técnicos y Trabajadores de las Empresas de la Rama de Actividad Económica del Recurso Natural del Petróleo y sus Derivados de Colombia, or ADECO, and Sindicato Nacional de Trabajadores de Empresas Operadoras, Contratistas, Subcontratistas de Servicios y Actividades de la Industria del Petróleo y Similares, or SINDISPETROL. The new collective bargaining agreement was effective as of July 1, 2009 and covers salaries, healthcare, education, housing, transport, meals, cultural activities, union rights and guarantees, among other aspects. We consider reaching this agreement during consensual negotiations as a significant step towards the development of improved relations with our labor unions. Sindicato Nacional de Trabajadores de Empresas Operadoras, or SINCOPETROL, our company’s labor union, neither presented any list of claims to us nor objected to the bargaining agreement, and as a result, we do not have a labor conflict with SINCOPETROL. See “Item 6. Directors, Senior Management and Employees—Employees.”
However, we cannot assure you that we will not experience labor unrest in the future. In the event relations with our labor unions deteriorate, which could result in industry wide strikes, work stoppages or even sabotage, our results of operations and financial condition could be negatively affected.
We may not be able to achieve our corporate goals if we face difficulty in finding competent successors to our current management and employees.
Our growth strategy and the successful achievement of our corporate goals depend on the competence of our management and employees. Due to the expiration of retirement benefits, some of our managers and employees left the Company in 2010 to avoid losing those retirement benefits. As a result, we faced difficulty in finding successors to our current managers and employees with the required competence and leadership. We may face difficulty in keeping our key managers and employees because of the high levels of competition for human talent with experience and knowledge in the oil and gas market. Additionally, we may not be able to acquire or develop the right set of human talent competencies required to reach and sustain our performance under international standards. These difficulties, in turn, may negatively affect our results. See “Item 6. Directors, Senior Management and Employees—Employees.”
Our activities may be interrupted by external factors.
We are exposed to several risks that may partially interrupt our activities. These risks include, among others, fire disasters, explosions, natural disasters such as earthquakes, volcanic eruptions, tropical storms, hurricanes and floods, malfunction of pipelines and emission of toxic substances. As a result of the occurrence of any of the above, our operational activities could be significantly affected or paralyzed. These risks could result in property damage, loss of revenue, cost of human lives, pollution and harm to the environment, among others. If any of these occur, we may be exposed to economic sanctions, fines or penalties.
We conduct exploration and production activities in areas classified as indigenous reserves and afro-colombian lands.
We carry out and plan to carry out exploration and production activities in areas classified by the Government as indigenous reserves (resguardos) and afro-colombian lands (territorios colectivos). We may not begin to explore for or produce hydrocarbons in these regions until we reach an agreement with the indigenous or afro-colombian communities living on these lands. Generally these consultations last between four and six months, but may be significantly delayed if we cannot reach an agreement. For example, we conduct operations in areas of the Northeastern region, which are inhabited by the U’wa community. Commencement of operations on two blocks in this region have been delayed for 18 years and nine years, respectively, and as of December 2010, we have not received approval to undertake activities in these two blocks by the indigenous authorities. Similarly, some of our exploration operations in the Southern region have been delayed for two years as a result of the presence of the Kofan community who oppose our presence and activities in the reservation. If our activities endanger the conservation and preservation of these cultural minorities or their identities or beliefs, we may not be able to explore regions with good prospects. We may face similar risks in other jurisdictions where we have initiated exploration activities, which could have a negative effect on our operations.
Currency fluctuations and an appreciation of the Peso against the U.S. dollar could have an adverse effect on our financial condition and results of operations because approximately 57% of our revenues are derived from foreign sales.
Approximately 57% of our sales are made in the international markets. The impact of fluctuations in exchange rates, especially the Peso/U.S. dollar rate on our operations has been and may continue to be material. In addition, a substantial share of our liquid assets are held in U.S. dollars or indexed to foreign currencies and gain value when the Peso depreciates against the U.S. dollar and lose value when Peso appreciates against the U.S. dollar. We use forwards, swaps or futures contracts to partially mitigate the impact of currency fluctuations in order to be able to balance our U.S. dollar denominated assets and liabilities as our foreign currency indebtedness increases. Since 2009, our net exchange exposure has reduced, as we have incurred U.S dollar-denominated indebtedness.
The Peso appreciated 12% on average against the U.S. dollar in 2010. When the Peso appreciates against the U.S. dollar, our revenues from exports, when translated into Pesos, decrease. However, imported goods, oil services and interest on external debt denominated in U.S. dollars become less expensive for us. When the Peso depreciates against the U.S. dollar, our revenues from exports, when translated into Pesos, increase, and our imports become more expensive.
Our ability to access the credit and capital markets on favorable terms to obtain funding for our capital projects may be limited due to the deterioration of these markets and the authorizations we need before incurring any financial indebtedness.
We expect to make significant expenditures to reach the corporate goals established by our 2011 – 2020 Strategic Plan. See “Item 4. Information on the Company—The Company—Strategic Plan.” Our ability to fund these expenditures is dependent on our ability to access the capital necessary to finance the construction of these facilities. In recent years, domestic and global financial markets and economic conditions have been weak and volatile and contributed significantly to a substantial deterioration in the credit and capital markets. These conditions, along with significant write-offs in the financial services sector and the re-pricing of credit risk can make it difficult for us to obtain funding for our capital needs on favorable terms. As a result, we may be forced to revise the timing and scope of these projects as necessary to adapt to existing markets and economic conditions.
In addition, as the Nation is our controlling shareholder, before us, or any of our Colombian subsidiaries, can issue any debt in the international and local capital markets or incur any other type of indebtedness, the Government, through the Ministry of Finance and Public Credit, must authorize the issuance of such debt. However, this restriction is not applicable to our foreign subsidiaries which have branch offices in Colombia, such as our subsidiaries Hocol or ODL. We cannot assure you that if we were to seek such an authorization, the Nation would issue it in a timely fashion or at all.
We may be exposed to increases in interest rates, thereby increasing our financial costs.
As a result of our initial public offering in 2007, we became a sociedad de economía mixta, or mixed economy company, and can now incur debt locally and in the international capital markets and, consequently, may be affected by changes in prevailing interest rates. If market interest rates increase, our financing expenses may increase, which could have an adverse effect on our results of operations and financial condition.
During recent periods, the cost of raising funds in debt and equity capital markets has increased while the availability of funds from those markets diminished. Although financial markets have shown signs of recovery from the recent global economic crisis, if recovery falters, the cost of raising funds in debt and equity capital markets may increase and impair our ability to obtain capital on terms acceptable to us.
We are subject to extensive environmental regulations in Colombia and in the other countries in which we operate.
Our operations are subject to extensive national, state and local environmental regulations in Colombia. Environmental rules and regulations are applicable to our exploration, production, refining, transportation, supply and marketing activities, as well as the biofuels we produce. These regulations establish, among others, quality standards for hydrocarbon products, air emissions, water discharges and waste disposal, environmental standards for abandoned crude oil wells, remedies for soil, water pollution and the general storage, handling, transportation and treatment of hydrocarbons in Colombia. Currently, all exploratory projects drilling in areas that do not yet have a license must have an environmental impact assessment and must receive an environmental license from the Ministry of the Environment. The Ministry of the Environment routinely inspects our crude oil fields, refineries and other production sites and may decide to open investigations which may result in fines, restrictions on operations or other sanctions in connection with potential non-compliance with environmental laws.
We are also subject to regional environmental regulations issued by the corporaciones autonomas regionales, or regional environmental authorities, which oversee compliance with each region’s environmental laws and regulations. If we fail to comply with any of these national or regional environmental regulations, we could be subject to administrative and criminal penalties, including warnings, fines and closure orders of our facilities. See “Item 4. Information on the Company—Overview by Business Segment—Environmental Matters.”
Environmental compliance has become more stringent in Colombia in recent years and as a result we have allocated a greater percentage of our expenditures for compliance with these laws and regulations. If environmental laws continue to impose additional costs and expenses on us, and as new laws and regulations relating to climate change become applicable to us, we may need to reduce our investments on strategic projects in order to allocate funds to environmental compliance. These additional costs may have a negative impact on the profitability of the projects we intend to undertake or may make them economically unattractive, in turn having a negative impact on our results of operations and financial condition.
We are subject to foreign environmental regulations for the exploratory activities conducted by us outside Colombia. Failure to comply with foreign environmental regulations may result in investigations by foreign regulators, which could lead to fines, warnings or temporary suspensions of our operations, which could have a negative impact on our financial condition and results of operations.
Our investments in Peru are exposed to Peruvian political risk.
We own investments in Peru through our subsidiary Ecopetrol del Perú S.A. and our interest in Savia Peru, and accordingly, our business, financial condition or results of operations could be affected by changes in economic or other policies of the Peruvian government or other political, regulatory or economic developments in Peru.
As a result of the recent election of Ollanta Humala as President, it is uncertain whether the Peruvian government will continue to pursue business-friendly and open-market economic policies or policies that promote private investment, stimulate economic growth and social stability. In addition, we cannot predict future Peruvian government positions on the oil and gas industry, land tenure, protection of private property, environmental regulation or taxation or assure you that future governments in Peru will maintain a generally favorable business climate and economic policies. Any changes in the Peruvian government’s economic policies or regulations may adversely affect our business, financial condition and results of operations.
Our activities face operational risks that may affect the health and safety of our workforce.
Some of our operations are developed in remote and dangerous locations which involve health and safety risks that could affect our workforce. Under Colombian law and industrial safety regulations we are required to have health and safety practices that minimize risks and health issues faced by our workforce. Failure to comply with health and safety regulations may derive investigations by health officials which could result in lawsuits or fines.
We may be required to incur additional costs and expenses to allocate funds to industrial safety and health compliance under Colombian law and industrial safety regulations. These additional costs may have a negative impact on the profitability of the projects we may decide to undertake.
In addition, we may be subject to foreign health and safety regulations for our exploratory activities conducted outside Colombia. Foreign health and safety regulations may be more severe than those established under Colombian law and, therefore, we may be required to make additional investments to comply with those regulations.
We have made significant investments in acquisitions and we may not realize the value expected.
We have acquired interests in several companies in Colombia and abroad. See “Item 4. Information on the Company.” Obtaining the expected benefits of the acquisitions will depend, in part, on our ability to (i) obtain the expected operational and financial results from these acquisitions and (ii) manage disparate operations and to integrate distinct corporate cultures. These efforts may not succeed or may distract our management from operating our existing business. Our failure to successfully obtain the expected results from our recent acquisitions could adversely affect our financial condition and results of operations.
Our Strategic Plan contemplates the expansion of operations outside of Colombia where we will be subject to risks associated with investments in new countries.
As part of our Strategic Plan, we have begun to operate through business partners, subsidiaries or affiliates outside of Colombia. As of the date hereof, we have investments and subsidiaries incorporated in Peru, Brazil, Bermuda, Panama, the United Kingdom, Spain and the United States, and we are analyzing investments in other countries. In connection with making investments, we are and will be subject to risks relating to unstable economic and political conditions, governmental economic actions, such as exchange or price controls or limits on the activities to be performed by us, increases in tax rates, contractual changes, and social and environmental challenges. Such factors that our international activities may encounter, including tax regulations in foreign countries, could adversely affect our results of operations in those countries and decrease the value of our investments.
Our subsidiary Reficar is currently negotiating a project financing and construction, which if delayed, could affect our operating results and financial condition.
Reficar has entered into negotiations to raise approximately US$3.5 billion through a limited-recourse project financing. We will act as sponsor and will provide a guarantee to the project lenders. We are targeting obtaining the financing in July 2011. If for any reason the closing of the transaction is delayed, the targeted final completion of the project could also be delayed, which would result in higher capital expenditure requirements for Reficar and a decrease in our profitability. Additionally, if the start up of the upgraded refinery is delayed because of operational problems in the development of the project, or if the upgraded refinery does not reach the expected performance level in terms of the quality of products and/or volumes produced, the project lenders could request that we act on the guarantee and assume the payment obligations of Reficar, which would affect our operating results and financial condition.
Our results may be affected by the performance of our business partners, as many of our operations are executed under association and joint venture agreements with business partners.
Many of our operations are executed through associations, joint ventures and other agreements with our business partners, and consequently, we depend on the performance of our business partners. The poor performance of any of our business partners, especially in those projects in which we do not act as operators, could negatively impact our operational results and financial.
Risks relating to our ADSs
Holders of our ADSs may encounter difficulties in exercising their voting rights.
Holders of our common shares are entitled to vote on shareholder matters. However, holders of our ADSs may encounter difficulties in exercising some of the rights of shareholders if they hold our ADSs rather than the underlying common shares. For example, holders of our ADSs are not entitled to attend shareholders’ meetings, and can only vote by giving timely instructions to the Depositary in advance of a shareholders’ meeting. Under Colombian law, we are not required to solicit proxies from our existing shareholders and, therefore, you may not receive notice in time to instruct the depositary to vote the shares.
We believe that the holders of the ADSs should be able to direct the depositary to vote the common shares separately in accordance with their individual instructions, particularly as this is the current interpretation of the Superintendency of Corporations (Superintendencia de Sociedades); this issue has been the subject of differing regulatory interpretations in the past and may be subject to differing interpretations in the future. Under prior regulatory interpretations, the depositary could be required to vote the underlying common shares in a single block (presumably reflecting the majority vote of the ADS holders). In the future, the Colombian regulatory authorities may change their interpretation as to how voting rights should be exercised by ADSs holders, and if this were to occur any such limitation or loss could adversely affect the value of such common shares and your ADSs.
Our ADSs holders may be subject to restrictions on foreign investment in Colombia.
Colombia’s International Investment statute regulates the manner in which non-Colombian residents can invest in Colombia and participate in the Colombian securities market. Among other requirements, Colombian law requires foreign investors to register certain foreign exchange transactions with the Colombian Central Bank and outlines the necessary procedures to authorize certain types of foreign investments. Colombian law requires that certain foreign exchange transactions, including international investment in foreign currency between Colombian residents and non-Colombian residents, must be made through authorized foreign exchange market participants. Any income or expenses under our American Depositary Receipt, or ADR, program must be made through the foreign exchange market.
Investors acquiring our ADRs are not required to register with the Colombian Central Bank. Investors in ADRs who choose to surrender their ADRs and withdraw common shares would have to register their investment in the common shares as a foreign direct investment, in the event the investor does not own a portfolio of investments in Colombia, or as a portfolio investment, in the event the investor delivers such shares to a registered foreign capital investment fund. Non-Colombian residents cannot directly hold portfolio investments in Colombia, but are able to do so through a registered foreign capital investment fund. Investors would only be allowed to transfer dividends abroad after their foreign investment registration procedure with the Colombian Central Bank has been completed. Investors withdrawing common shares may incur expenses and/or suffer delays in the application process. The failure of a non-resident investor to report or register foreign exchange transactions with the Colombian Central Bank relating to investments in Colombia on a timely basis may prevent the investor from remitting dividends, or initiate an investigation that may result in a fine. In the future, the Government, the Congress of Colombia or the Colombian Central Bank may amend Colombia’s International Investment Statute or the foreign investment rules, which could result in more restrictive rules and could negatively affect trading of our ADSs.
Additionally, Colombia currently has a free exchange rate system; however, other restrictive rules for the exchange rate system could be implemented in the future. In the event that a more restrictive exchange rate system is implemented, the depositary may experience difficulties converting Peso amounts into U.S. dollars to remit dividend payments.
Holders of our ADSs are not able to effect service of process on us, our directors or executive officers within the United States, which may limit your recovery in any foreign judgment you obtain against us.
We are a mixed economy company organized under the laws of Colombia. In addition, most of our Directors and executive officers reside outside the United States. All or a substantial portion of our assets and the assets of these persons are located outside of the United States. As a result, it may not be possible for you to effect service of process within the United States upon us or these persons or to enforce against us or them judgments in U.S. courts obtained in such courts predicated upon the civil liability provisions of the U.S. federal securities laws. Colombian courts determine whether to enforce a U.S. judgment predicated on the U.S. securities laws through a procedural system known as exequatur. For a description of these limitations, see “Enforcement of Civil Liabilities.”
We may claim immunity under the Foreign Sovereign Immunities Act of 1976 with respect to actions brought against us under the US securities laws and your ability to sue or recover may be limited.
We reserve the right to plead sovereign immunity under the United States Foreign Sovereign Immunities Act of 1976 with respect to actions brought against us under United States federal securities laws or any state securities laws. Accordingly, you may not be able to obtain a judgment in a U.S. court against us unless the U.S. court determines that we are not entitled to sovereign immunity with respect to that action. Moreover, you may not be able to enforce a judgment against us in the United States except under the limited circumstances specified in the Foreign Sovereign Immunities Act of 1976.
The protections afforded to minority shareholders in Colombia are different from those in the United States, and may be difficult to enforce.
Under Colombian law, the protections afforded to minority shareholders are different from those in the United States. In particular, the legal framework with respect to shareholder disputes is less developed under Colombian law than U.S. law and there are different procedural requirements for commencing shareholder lawsuits, such as shareholder derivative suits. As a result, it may be more difficult for our minority shareholders to enforce their rights against us or our Directors or controlling shareholder than it would be for shareholders of a U.S. company.
ADRs do not have the same tax benefits as other equity investments in Colombia.
Although ADRs represent Ecopetrol’s common shares, they are held through a fund of foreign capital in Colombia which is subject to a specific tax regulation regime. Accordingly, the tax benefits applicable in Colombia to equity investments, in particular, those relating to dividends and profits from sale, are not applicable to ADRs, including our ADRs. For more information see “Item 10. Additional Information—Taxation—Colombian Tax Considerations.”
The relative volatility and illiquidity of the Colombian securities markets may substantially limit our investors’ ability to sell our ADSs at the price and time they desire.
Investing in securities that are traded in emerging markets, such as Colombia, often involves greater risk when compared to other world markets, and these investments are generally considered to be more speculative in nature.
The Colombian securities market is substantially smaller, less liquid, more concentrated and can be more volatile than other securities markets. For example, the Colombian Stock Exchange (Bolsa de Valores de Colombia), or BVC, had a market capitalization of approximately Ps$417,870 billion (US$218.33 billion using the closing rate for 2010) as of December 31, 2010, a 45.6% increase when compared with the amount at the end of 2009, and an average trading volume of approximately Ps$151,260 million (US$79.7 million, using the average exchange rate for 2010), a 32.2% increase when compared to the volume in 2009. In contrast, the New York Stock Exchange, or NYSE, had a market capitalization of US$13.4 trillion as of December 31, 2010, and a daily trading volume of approximately US$70.6 billion in 2010.
As of December 31, 2010, our shares represented the second highest market capitalization of the BVC with 39.7% of the total. In addition, they had the second highest trading volume in the BVC averaging Ps$29,463 million traded per day. Our shares represent 18% of the Índice General de la Bolsa de Valores de Colombia, or IGBC, stock market index, 10.5% of the COL20, a stock market index that includes the top 20 traded stocks in the BVC, and 20% of the COLCAP, a stock price volatility index, in the last quarter of 2010.
Given the current ownership structure of our shares, it may be difficult for you to purchase large quantities of shares from a single shareholder. We cannot assure you that a liquid trading market for our ADSs will develop or, if developed, will be maintained following this offering, which could substantially limit the ability of investors in our ADSs to sell them at the price and time you desire.
We are not required to disclose as much information to investors as a U.S. issuer is required to disclose.
We are subject to the reporting requirements of the Superintendency of Finance and the BVC. The corporate disclosure requirements that apply to us may not be equivalent to the disclosure requirements that apply to a U.S. issuer and, as a result, you may receive less interim information about us than you would receive from a U.S. issuer.
| ITEM 4. | Information on the Company |
THE COMPANY
We are a vertically integrated oil company with presence in Colombia, Peru, Brazil and the U.S. Gulf Coast. We divide our operations into four business segments: exploration and production; transportation; refining and petrochemicals; and marketing and supply. We are the largest corporation in Colombia, as measured by revenues, profits, assets, shareholders’ equity, sales, net income and net worth, and we play a key role in the local hydrocarbon market. Our operation does not include natural gas transportation activities due to legal restrictions.
Corporate History
Ecopetrol is a mixed economy company, organized on August 25, 1951, and existing under the laws of Colombia. We have an unlimited duration. Our legal name is Ecopetrol S.A. Our principal executive offices are located at Carrera 13 No. 36-24 Bogota, Colombia and our telephone number is +571 234 4000.
We were incorporated as the Empresa Colombiana de Petróleos as a result of the reversion of the De Mares concession to the Government by the Tropical Oil Company in 1921. We began our operations as a governmental industrial and commercial company, responsible for administering Colombia’s hydrocarbon resources.
We began operating the crude oil fields at Cira-Infantas and the pipeline that connected that field with the Barrancabermeja refinery and the port of Cartagena. Three years later, the first national seismic study was performed under the De Mares concession which led to the discovery of the Llanito crude oil field in 1960.
In 1961, we assumed the direct operation of the Barrancabermeja refinery and continued its transformation into an industrial complex. International Petroleum Colombia Limited or Intercol began the construction of a new facility in Mamonal, Cartagena, where the pipeline terminal of the Andean National Corporation was already located and which also included a loading port. In December 1957, the Cartagena refinery began operations, and in 1974 it was acquired by us.
In 1970, we adopted our first bylaws that transformed us into a governmental industrial and commercial company, linked to the Ministry of Mines and Energy. Decree Law 1760 of June 26, 2003 transformed us from an industrial and commercial company into a state-owned corporation by shares linked to the Ministry of Mines and Energy and renamed us Ecopetrol S.A. in order to make us more competitive. Prior to our reorganization our capital expenditures program and access to the credit markets were limited by the Government, which was making its decisions based on its budgetary needs and not on our growth prospects.
In 2006, the Congress of Colombia authorized us to issue up to 20% of our voting capital stock in Colombia, subject to the condition that the Nation control at least 80% of our voting capital stock. On November 13, 2007, we placed 4,087,723,771 shares in the Colombian Stock Exchange (Bolsa de Valores de Colombia), or BVC, trading under the symbol “ECOPETROL,” which resulted in 482,941 new shareholders and raised approximately Ps$5,723 billion for the sale of 10.1% of our capital stock. Since September 18, 2008, our American Depositary Shares, or ADSs, have been trading on the NYSE under the symbol “EC.” On December 4, 2009, our ADSs began trading on the Lima Stock Exchange under the symbol “EC.” In addition, on August 13, 2010, our ADSs began trading on the Toronto Stock Exchange under the symbol “ECP.” Each ADS represents 20 common shares of the Company.
The following table sets forth the acquisitions made between 2008 and 2009.
| Company | | Date | | Participation acquired in transaction | | Sector | | Price(1) |
| Polipropileno del Caribe S.A. (Propilco) | | April 2008 | | 100% | | Petrochemicals | | US$690 million |
| | | | | | | | | |
| Offshore International Group Inc. (OIG) | | February 2009 | | 50%(2) | | Exploration and Production | | US$646 million |
| | | | | | | | | |
| Oleoducto Central S.A. (Ocensa) | | March 2009 | | 24.7%(3) | | Transportation | | US$418 million |
| | | | | | | | | |
| Hocol Petroleum Limited | | March 2009 | | 100%(4) | | Exploration and Production | | US$807 million |
| | | | | | | | | |
| Refinería de Cartagena S.A. (Reficar) | | May 2009 | | 51%(5) | | Refining | | US$544 million |
| | | | | | | | | |
| | | | | | | | | |
| | (1) | Includes amounts of adjustment on transaction prices. |
| | (2) | U.S. parent of Savia Perú (formerly Petrotech Peruana S.A.). |
| | (3) | As a result of this transaction, our ownership of Ocensa increased to 60%. |
| | (4) | We acquired 100% of Maurel el Prom’s interest in Hocol Petroleum Limited, whose most important assets are Hocol and Homcol. As a result of the acquisition, our ownership in Oleoducto de Colombia, increased from 43.85% to 65.57%. |
| | (5) | As a result of this transaction, we became the sole indirect owner of Reficar. |
In August 2010, we entered in into a memorandum of understanding with Talisman Colombia Holdco Limited, or Talisman, a Canadian oil and gas company, to acquire BP Exploration Company Limited, a British Petroleum subsidiary operating in Colombia. After obtaining required authorizations, we completed the acquisition on January 24, 2011, which includes assets in gas and oil exploration and production as well as oil transportation and gas marketing, for US$1.64 billion after working capital adjustments, resulting in a 51% ownership by Ecopetrol and 49% by Talisman. The company’s new name is Equion Energía Limited. As a result of this acquisition, we increased our participation in the ownership of Ocensa from 60.00% to 72.65%, in Oleoducto de Colombia, or ODC, from 65.57% to 73.00% and in Oleoducto del Alto Magdalena asset agreement, or OAM from 83.00% to 85.12%. We also obtained a 10.2% interest in Transgas de Occidente.
In August 2010, we incorporated Oleoducto Bicentenario de Colombia S.A.S., a new company to build and operate a private pipeline, which will run from the Casanare Department to the port of Coveñas. The new pipeline will facilitate oil exports from the Llanos region. We have, directly and indirectly, a 55% ownership of the company and six other shareholders have the remaining 45%.
In January 2011, we increased our participation in Invercolsa S.A., a holding company with investments in natural gas transportation and distribution companies in Colombia, to 43.35% from 31.76% based on a final judgment of a court, which ordered Fernando Londoño, who had been the legal representative of Invercolsa, to return to us approximately 145 million shares of Invercolsa he had bought in 1997 as part of the restructuring of natural gas investments belonging to us.
The transactions described above were funded mainly through cash on hand and cash flow from our operations.
Significant Subsidiaries
We are a mixed economy company and have a number of subsidiaries both in Colombia and abroad. Our subsidiaries are either directly owned by us or indirectly owned by us through one of our other subsidiaries. At March 31, 2011, we had 21 subsidiaries directly owned by us, of which 10 were incorporated in Colombia and 11 were incorporated abroad, and 17 subsidiaries indirectly owned by us. Some of our subsidiaries have subsidiaries of their own.
The following table sets forth some of our significant operating subsidiaries, their respective countries of incorporation, our percentage ownership in each (both directly and indirectly through other subsidiaries) and our voting percentage in each as of March 31, 2011:
| COMPANY | | COUNTRY OF INCORPORATION | | OWNERSHIP AND VOTING % | |
| Exploration and Production | | | | | | |
| Ecopetrol Oleo e Gas do Brasil Ltda* | | Brazil | | | 100.00 | |
| Ecopetrol del Perú S.A.* | | Peru | | | 100.00 | |
| Ecopetrol America Inc.* | | United States | | | 100.00 | |
| Hocol Petroleum Limited | | Bermuda | | | 100.00 | |
| Equion Energía Limited | | United Kingdom | | | 51.00 | |
| Transportation | | | | | | |
| Oleoducto de los Llanos Orientales S.A. (ODL)** | | Panama | | | 65.00 | |
| Oleoducto de Colombia S.A.* | | Colombia | | | 73.00 | |
| Oleoducto Central S.A.* | | Colombia | | | 72.60 | |
| Oleoducto Bicentenario de Colombia S.A.S.* (OBC) | | Colombia | | | 55.97 | |
| Refining and Petrochemicals | | | | | | |
| Refinería de Cartagena S.A.* | | Colombia | | | 100.00 | |
| Propilco S.A.* | | Colombia | | | 100.00 | |
| Compounding and Masterbatching Industry Ltda. (COMAI)** | | Colombia | | | 100.00 | |
| Biofuels | | | | | | |
| Bioenergy S.A.** | | Colombia | | | 88.60 | |
| Other | | | | | | |
| Black Gold Re | | Bermuda | | | 100.00 | |
* Direct and indirect participation.
** Solely indirect participation through other Subsidiaries or Affiliates.
See Exhibit 8.1 to this annual report for a complete list of our subsidiaries, their respective countries of incorporation, our percentage ownership in each (both directly and indirectly through our other subsidiaries) and our voting ownership in each.
Strategic Plan
In 2010, we extended our strategic plan to 2020. Our 2011-2020 Strategic Plan considers Ecopetrol to be an integrated Corporate Group composed of Ecopetrol S.A. and its subsidiaries and affiliates located in Colombia and abroad focused on oil, natural gas, petrochemicals and alternative fuels. We intend to develop as a key player and become one of the 30 main companies in the global oil industry, recognized for international positioning, innovation and commitment to sustainable development.
Our strategic plan provides detailed strategies for each one of our business segments. Our main objective is to achieve a daily output of approximately 1 million gross barrels of clean crude equivalent per day by 2015 and 1.3 million gross barrels of clean crude equivalent per day by 2020, working in three areas: economic, environmental and social, and we intend to obtain a profitability measured by return on capital employed (ROCE) of 17% as a Corporate Group. We use the term “clean barrels” to refer to the production of crude oil without accidents or environmental incidents and in harmony with our stakeholders. Our strategic plan also includes a goal of continuing to develop the skills of our employees.
We are also planning to consolidate our strategy for our downstream operations by adding value to products and services from the Corporate Group and/or third parties, with a clear orientation toward the market and clients. In addition, we intend to be leaders in refining in Latin America by producing more clean and valuable products, taking advantage of synergies and ensuring profitability, increasing our petrochemical production, developing and consolidating the Corporate Group’s basket of products through alternative energy and by strengthening the domestic market for natural gas and developing the business in the region.
We expect to fund our strategic initiatives through cash on hand and cash flow from operating activities. We also expect to access the local and international capital markets to fund part of our expansion. We believe that we will be able to access local and international markets when the need arises. See “Item 5. Operating and Financial Review and Prospects—Liquidity and Capital Resources.” We are also authorized by law 1118 of 2006 to sell an additional 9.9% of our equity, which could be used to complete funding our strategic plan.
We expect to achieve our strategy together with our joint venture partners with whom we have built long-term relationships. We are also working with foreign governmental authorities in countries where we already have operations or where we intend to develop operations.
We also maintain strategic initiatives with respect to each of our different segments:
Exploration and Production
Become an international player with the capacity to incorporate reserves and increase production of oil and natural gas in a sustainable way
We intend to continue the expansion of our exploration and production activities and selectively enter into new joint ventures with major international and regional crude oil companies to bid for new exploration and production blocks on-shore and off-shore within and outside Colombia to further develop our business. In line with our 2011-2020 development strategy, we intend to increase our average daily production of hydrocarbons to 1.0 million boe per day by the year 2015 and 1.3 million boe per day by 2020. We estimate our total investment in exploration activities at US$20 billion and in production activities (exploiting new reserves, maximizing production in conventional fields, increasing production and development of heavy crude oil, and developing unconventional hydrocarbons and natural gas fields) at US$44 billion for a total of US$64 billion in Colombia and abroad.
In 2010, our capital expenditures in our exploration and production segment were Ps$5.88 trillion (approximately US$3.1 billion). During the same period, we increased our proved reserves by 365 million boe and we produced a daily average of 579 thousand boe per day, representing an increase of 16% compared to 2009. As a Corporate Group, we produced 615.9 thousand boe per day, representing an increase of 18.2% compared to 2009.
Refining and Petrochemicals
Produce cleaner and more valuable products, ensuring profitability through synergies, and take advantage of market opportunities by adding greater value to the refining flows and increasing production of petrochemicals
We intend to be one of the leaders in refining in Latin America, by continuing with the modernization of our refineries in Barrancabermeja and Cartagena (Reficar) in order to reach a 95% conversion rate, increasing the load of heavy crude oil, and producing more distillate media and gasoline. In the refining and petrochemicals area, we have established a goal under the 2011-2020 Strategic Plan to achieve profitability of 11% ROCE by 2020. We also expect that the implementation of these initiatives will enable us to increase production of refined products and improve efficiency, while upgrading existing facilities in order to reach higher margins. Our 2011-2020 Strategic Plan contemplates the investment of approximately US $5.5 billion, focusing also on operational excellence and growing profitability, and to increase our production of petrochemicals and reach 2.7 million tons per year by 2020, including the production of polypropylene produced by Polipropileno del Caribe S.A. (Propilco).
Those investments are subject to market analysis, conceptual engineering and financial feasibility.
In 2010, our capital expenditures in our refining and petrochemical segment were Ps$2,085 billion (approximately US$1,098 million), mainly for modernization projects of our refineries in Barrancabermeja and Cartagena (Reficar) as part of our commitment to provide cleaner fuels, and we broke ground on a petrochemical infrastructure project.
Transportation
Grow in a profitable way and make development viable across the entire value chain
We plan to implement a transportation infrastructure program along with the participation of other companies in the sector, focused on the construction of crude oil pipelines and multipurpose transportation systems to assure our transportation capacity. We intend to invest approximately US$5 billion between 2011 and 2020 in the construction and upgrading of our transportation infrastructure to meet our future requirements and in the conversion of existing crude oil pipelines for the transportation of heavy crude oil. For 2010, capital expenditures in our transportation segment were Ps$2,352 billion (approximately US$1,239 million), including what we consider our most representative achievement, the creation, with six business partners, of Oleoducto Bicentenario de Colombia S.A.S., which is expected at the beginning of operations to evacuate 120 thousand barrels per day.
Marketing and Supply
Focus on the importance of the market and clients, and define key products and markets for the Corporate Group
Our 2011-2020 Strategic Plan sets out guidelines for sales and marketing that cut across our operational areas and focus us on the importance of our markets and clients and the need to define key products and markets for the Group. Our strategy is focused on supplying the local market and exporting crude oil, refined products, biofuels, petrochemical products and natural gas to end-users, including refineries and wholesalers, in order to improve our margins. We are also focused on increasing our market participation in crude oil and refined products in the Far East, Latin America and Europe. We are currently opening new markets for our products, such as China, India, Nigeria and Angola.
Our principal export market in 2010 was the U.S. market. Currently, we maintain an agreement to supply natural gas to PDVSA. Based on our natural gas production growth projections, we expect to increase our sales by focusing on deliveries of compressed natural gas for motor vehicles and industrial users, for which there is a high demand.
Develop and consolidate the Group’s basket of products through alternative energy
We intend to participate with local investors in the Colombian renewable energy market, with whom we have undertaken the development of a refinery to process sugar cane for biofuels. We plan to focus on consolidating in the local market in a profitable way, seeking international markets with high potential and strengthening our ability to compete in the bio-fuels value chain.
In mid-2010, we initiated the production of biodiesel with Ecodiesel, in which we have a 50% share. Our 2011-2020 Strategic Plan contemplates the investment in these initiatives mainly through Bioenergy S.A., an ethanol production subsidiary. See “—Overview by Business Segment—Environmental Matters.”
OVERVIEW BY BUSINESS SEGMENT
Exploration and Production
Summary
Our exploration and production business segment includes exploration, development and production activities in Colombia and abroad. We began local exploration in 1955 and international exploration in 2006. We conduct exploration and production activities directly and through joint ventures with third parties. At December 31, 2010, we were the largest producer of crude oil and natural gas, the largest operator, and we maintained the most acreage under exploration in Colombia.
According to the National Hydrocarbon Agency (Agencia Nacional de Hidrocarburos), or ANH, Colombia has 24 sedimentary basins, and at December 31, 2010, we had exploratory activities in 15 of them. The following map shows the basins where we conduct exploratory activities.
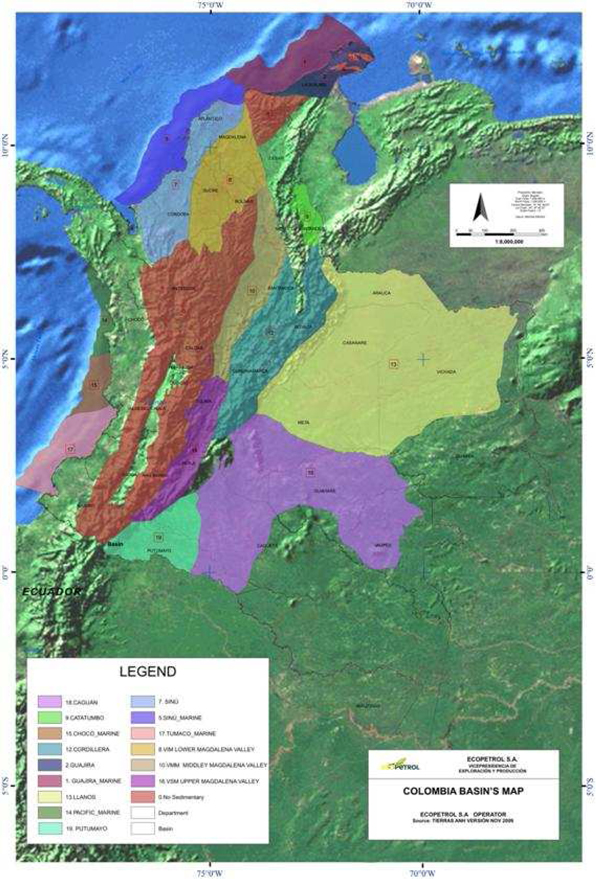
We have organized Ecopetrol S.A. production activities in Colombia into five administrative regions. The administrative regions, and their respective 2010 results, are:
Northeastern Region – The Northeastern region is comprised of two areas, one located in the north of Colombia along the Atlantic coast and the other located in the Piedemonte Llanero. The Northeastern region covers approximately 541,404 acres and includes the natural gas fields located at La Guajira and the crude oil and natural gas fields located in Cusiana-Cupiagua. In 2010, the Northeastern region had a total production of approximately 41.2 thousand bpd of crude oil and 523.4 million cubic feet per day or mcfpd of natural gas.
Mid-Magdalena Valley Region – The Mid-Magdalena Valley region runs along the Magdalena river valley and covers approximately 835,702 acres. The Mid-Magdalena Valley region includes the crude oil fields located in the Santander department and part of the Antioquia, Cesar and Boyacá departments near the Barrancabermeja refinery. The Mid-Magdalena Valley region has a total production of approximately 83.5 thousand bpd of heavy and light crude oil and 21.4 mcfpd of natural gas.
Central Region – The Central region is located in Colombia’s central region and includes the Meta department and part of the Casanare department. The Central region covers approximately 785,202 acres and has a total production of approximately 218.7 thousand bpd of heavy and medium crude oil and 1.0 mcfpd of natural gas.
Catatumbo-Orinoquía Region – The Catatumbo-Orinoquía region is located in the eastern part of Colombia and runs along the border with Venezuela covering approximately 1,187,073 acres. The Catatumbo-Orinoquía region includes the Caño Limón crude oil field and the Gibraltar natural gas field, with a total production of approximately 63.6 thousand bpd of crude oil and 0.8 mcfpd.
Southern Region – The Southern region is located on the southwestern region of Colombia and covers approximately 939,170 acres. The Southern region includes the Orito, Guando and Neiva fields located mainly in the Cundinamarca, Huila and Putumayo departments. The Southern region has a total production of approximately 62 thousand bpd of crude oil and 6.3 mcfpd of natural gas.
In addition to the administrative regions mentioned above, we have established a Minor Fields Area that covers some of our small fields throughout the country. The main purpose of this Minor Fields Area is to establish strategies adequate enough to improve efficiency in the production of reserves from these small fields. The total production of the Minor Fields Area during 2010 was 12.7 thousand bpd of crude oil and 3.3 mcfpd of natural gas. This production corresponds to fields located in Mid-Magdalena Valley, Central, Catatumbo-Orinoquía and the Southern regions.
The map below indicates the location of our operations in Colombia.
Exploration
Our exploration plan in Colombia is focused on exploration of existing production sites in close proximity, exploration of currently producing basins and exploration of frontier areas, including off-shore areas primarily operated by our business partners, which we believe have the potential for large findings. Our exploration strategy outside of Colombia is focused on locating prospects and establishing joint ventures with experienced operators.
During 2010, we drilled 28 exploratory wells, 22 in Colombia and six abroad. Additionally Savia Perú, our 50% owned affiliate, drilled one exploratory well. We had five wells declared as productive wells, four in Colombia and one in Brazil.
Exploration Activities in Colombia
We conduct exploration in Colombia on our own and through joint ventures with regional and international oil and gas companies. We also benefit from sole risk contracts when commercial reserves are found. In the case of sole risk contracts, we do not take any exploration risk. See “—Overview of Exploration and Production Contractual Arrangements.”
In 2010, we acquired 6,491 equivalent kilometers of seismic in Colombia, including 1,676 equivalent kilometers acquired by Hocol, Ecopetrol S.A. acquired 4,815 equivalent kilometers, corresponding to 4,203 kilometers of 2D seismic and 612 equivalent kilometers of 3D seismic. Ecopetrol directly acquired 1,965 of those kilometers of seismic and 2,850 were acquired by our business partners.
In January 2011, Ecopetrol S.A. and Petrobras Colombia Limited entered into an agreement for the exploration of the Tayrona block in the Colombian Carribbean Ocean with Repsol Exploración Colombia. Ecopetrol S.A. has a 30% interest in the block. Ecopetrol also has confirmed the presence of hydrocarbons in the Tinkhana-1 well in the Putumayo region.
In February 2011, we acquired from Shell its interest in the Caño Sur block, increasing our participation to 100% from 50%.
Exploration Activities Outside of Colombia
Our international exploration strategy is focused on securing blocks available for exploration and entering into joint ventures with international and regional oil companies. Exploring outside Colombia will allow us to diversify our risk and improve the possibilities for increasing our crude oil and natural gas reserves.
In 2010, we drilled six exploratory wells through our subsidiaries and partners. Ecopetrol America, our subsidiary with operations in the U.S. Gulf Coast, has participation in a variety of gross areas totaling 2,683.5 square kilometers principally in deep-water blocks. In addition, Ecopetrol America drilled three exploratory wells in 2010, while two more were postponed as a result of the Macondo field oil spill in the Gulf of Mexico in 2010. See “Item 3. Key Information—Risk Factors—Risks related to our business—Our participation in deep water drilling in conjunction with our business partners involves certain risks and costs, which may be outside of our control.” Ecopetrol America controls an interest or has the right to acquire an interest in more than 100 leases in the Gulf of Mexico. Ecopetrol Brasil drilled two exploratory wells in Espiritu Santo and Campos basins. Ecopetrol Brasil has participation in ten exploratory blocks. Ecopetrol del Peru drilled one exploratory well and has participation in five exploratory blocks.
As of December 31, 2010, we acquired 11,146 kilometers of additional seismic equivalent: 10,024 kilometers in the U.S. Gulf Coast, 764 kilometers in Brazil and 358 kilometers in Peru, an increase of 131% compared with seismic data as of December 31, 2009. These figures do not include 7,483 kilometers of net seismic equivalent acquired by Savia Peru.
In January 2011, Ecopetrol also obtained a 13% interest in the BM-S-73 and BM-S-74 blocks in Brazil.
Exploratory Wells
The following table sets forth the number of gross and net productive and dry exploratory wells drilled by us and our joint venture partners, and the exploratory wells drilled by third parties under a sole risk contract for the years ended December 31, 2010, 2009 and 2008.
| | | For the year ended December 31, | |
| | | | | | | | | | |
| COLOMBIA | | | | | | | | | |
| Ecopetrol | | | | | | | | | |
| Gross Exploratory Wells | | | | | | | | | |
| Owned and operated by Ecopetrol | | | | | | | | | |
Productive(1) | | 2 | | | 2 | | | 4 | |
Dry(2) | | 4 | | | 7 | | | 6 | |
| Total | | 6 | | | 9 | | | 10 | |
| Operated by Ecopetrol in Joint Venture | | | | | | | | | |
Productive(1) | | 1 | | | - | | | 1 | |
Dry(2) | | 2 | | | - | | | 0 | |
| Total | | 3 | | | - | | | 1 | |
| Operated by Partner in Joint Venture | | | | | | | | | |
Productive(1) | | 3 | | | 3 | | | 1 | |
Dry(2) | | 1 | | | 3 | | | 1 | |
| Total | | 4 | | | 6 | | | 2 | |
Net Exploratory Wells(3) | | | | | | | | | |
Productive(1) | | 3.15 | | | 3.2 | | | 5 | |
Dry(2) | | 5.60 | | | 8.2 | | | 6.4 | |
| Total | | 8.75 | | | 11.4 | | | 11.4 | |
Sole Risk(4) | | | | | | | | | |
Productive(1) | | 7 | | | 4 | | | 8 | |
Dry(2) | | 11 | | | 5 | | | 12 | |
| Total | | 18 | | | 9 | | | 20 | |
| Hocol | | | | | | | | | |
| Gross Exploratory Wells | | | | | | | | | |
Productive(1) | | - | | | 1 | | | - | |
Dry(2) | | 9 | | | 2 | | | - | |
| Total | | 9 | | | 3 | | | - | |
Net Exploratory Wells(3) | | | | | | | | | |
Productive(1) | | 0 | | | 0.2 | | | - | |
Dry(2) | | 5 | | | 2 | | | - | |
| Total | | 5 | | | 2.2 | | | - | |
| INTERNATIONAL | | | | | | | | | |
| Ecopetrol America Inc. | | | | | | | | | |
| Gross Exploratory Wells | | | | | | | | | |
Productive(1) | | - | | | - | | | - | |
Dry(2) | | 3 | | | 2 | | | 1 | |
| Total | | 3 | | | 2 | | | 1 | |
Net Exploratory Wells(3) | | | | | | | | | |
Productive(1) | | - | | | - | | | - | |
Dry(2) | | 0.9 | | | 0.4 | | | 0.3 | |
| Total | | 0.9 | | | 0.4 | | | 0.3 | |
| Ecopetrol Oleo e Gas do Brasil | | | | | | | | | |
| Gross Exploratory Wells | | | | | | | | | |
Productive(1) | | 1 | | | 0 | | | - | |
Dry(2) | | 1 | | | 1 | | | - | |
| Total | | 2 | | | 1 | | | - | |
Net Exploratory Wells(3) | | | | | | | | | |
Productive(1) | | 0.5 | | | - | | | - | |
Dry(2) | | 0.3 | | | 0.3 | | | - | |
| Total | | 0.8 | | | 0.3 | | | - | |
| Ecopetrol del Perú | | | | | | | | | |
| Gross Exploratory Wells | | | | | | | | | |
Productive(1) | | - | | | - | | | - | |
Dry(2) | | 1 | | | - | | | 1 | |
| Total | | 1 | | | - | | | 1 | |
Net Exploratory Wells(3) | | | | | | | | | |
Productive(1) | | - | | | - | | | - | |
Dry(2) | | 0.3 | | | - | | | 0.5 | |
| Total | | 0.3 | | | - | | | 0.5 | |
| Savia Perú | | | | | | | | | |
| Gross Exploratory Wells | | | | | | | | | |
Productive(1) | | 1 | | | 1 | | | - | |
Dry(2) | | 0 | | | 1 | | | - | |
| Total | | 1 | | | 2 | | | - | |
Net Exploratory Wells(3) | | | | | | | | | |
Productive(1) | | 0.5 | | | 0.5 | | | - | |
Dry(2) | | 0 | | | 0.5 | | | - | |
| Total | | 0.5 | | | 1 | | | - | |
| (1) | A productive well is an exploratory well that is not a dry well. |
| (2) | A dry well or hole is an exploratory well found to be incapable of producing either crude oil or natural gas in sufficient quantities to justify completion as a crude oil or natural gas well. |
| (3) | Net exploratory wells are calculated according to our percentage of ownership in these wells. |
| (4) | We do not take any risk in sole risk contracts but we benefit from successful exploratory efforts. See “—Overview of Exploration and Production Contractual Arrangements.” |
Production
Our total average consolidated daily production of hydrocarbons in 2010, prior to deducting royalties, totaled 615.9 thousand boe per day, of which 515.9 thousand bpd corresponded to crude oil and 100 thousand boe per day corresponded to natural gas. This production includes the production of our subsidiaries and affiliates, Hocol S.A., Ecopetrol America Inc. and Savia Perú S.A. on the basis of our participation.
As part of our Strategic Plan, we also consider the increase of primary recovery through the development of fields, including fields that were discovered more than 20 years ago, to increase our average daily production of hydrocarbons and reserves. We continue to focus our efforts on improving the productivity ratio of several such directly operated fields and other fields currently held through joint ventures with other oil companies
During 2010, we produced 606.5 thousand boe per day in Colombia through Ecopetrol S.A. and Hocol, of which 507.8 thousand bpd corresponded to crude oil and 98.7 thousand boe per day corresponded to natural gas. In 2010, Ecopetrol S.A. (on a stand-alone basis) production amounted to 94.1% of total consolidated production, Hocol 4.4%, Savia 1.2% and Ecopetrol America 0.3%.
During 2009, our consolidated average daily production of hydrocarbons totaled 520.6 thousand boe per day, of which 426 thousand bpd corresponded to crude oil and 94.6 thousand boe per day corresponded to natural gas. Our average daily production of hydrocarbons in 2008 was 447 thousand boe per day, of which 362 thousand bpd corresponded to crude oil and 85 thousand boe per day to natural gas.
Ecopetrol S.A. (on a stand-alone basis) crude oil production during 2010 consisted of approximately 56% light and medium crudes (between 16º and 35º American Petroleum Institute, or API gravity) and 44% of heavy crudes, with a gravity lower than 15° API. In 2009, crude oil production consisted of approximately 63.8% light and medium crudes and 36.2% of heavy crudes. During 2008, production consisted of approximately 69.5% light and medium crudes and 30.5% of heavy crudes.
At December 31, 2010, we were the largest participant in the Colombian hydrocarbons industry, with approximately 64.7% of crude oil production and approximately 51.6% of natural gas production. Our production volume in Colombia includes Ecopetrol S.A. and Holcol’s production in 2010.
We undertook development drilling in the producing regions and applied new technologies, allowing us to drill 234 gross development wells operated by us in Colombia in 2010, 69 more than in 2009 and 88 more than in 2008. Of the total gross development wells drilled in 2010, three were dry wells in the Southern Region. We did not have any other dry development wells in 2010. There were two dry development wells in 2009, one in the Southern Region and one in the Catatumbo-Orinoquía Region. In 2008, there were seven dry development wells, three in the Central Region, two in the Southern Region, one in the Catatumbo-Oriniquia Region and one in the Mid-Magdalena Region.
Relevant operational activities
The following table sets forth the number of gross and net productive and dry development wells drilled exclusively by us and in joint ventures for the years ended December 31, 2010, 2009 and 2008.
| | | For the year ended December 31, | |
| | | | | | | | | | |
| COLOMBIA | | | | | | | | | |
| Ecopetrol | | | | | | | | | |
| Northeastern Region: | | | | | | | | | |
| Gross wells owned and operated by Ecopetrol | | | – | | | | – | | | | – | |
| Gross wells in Joint Ventures | | | 5 | | | | 6 | | | | 1 | |
Net Wells(1) | | | 3 | | | | 3 | | | | 1 | |
| Mid-Magdalena Valley Region: | | | | | | | | | | | | |
| Gross wells owned and operated by Ecopetrol | | | 58 | | | | 100 | | | | 90 | |
| Gross wells in Joint Ventures | | | 322 | | | | 249 | | | | 344 | |
Net Wells(1) | | | 217 | | | | 227 | | | | 285 | |
| Central Region: | | | | | | | | | | | | |
| Gross wells owned and operated by Ecopetrol | | | 121 | | | | 46 | | | | 41 | |
| Gross wells in Joint Ventures | | | 200 | | | | 115 | | | | 66 | |
Net Wells(1) | | | 213 | | | | 113 | | | | 79 | |
| Catatumbo-Orinoquía Region: | | | | | | | | | | | | |
| Gross wells owned and operated by Ecopetrol | | | – | | | | 4 | | | | 5 | |
| Gross wells in Joint Ventures | | | 23 | | | | 12 | | | | 59 | |
Net Wells(1) | | | 9 | | | | 10 | | | | 36 | |
| Southern Region: | | | | | | | | | | | | |
| Gross wells owned and operated by Ecopetrol | | | 12 | | | | 7 | | | | 10 | |
| Gross wells in Joint Ventures | | | 40 | | | | 48 | | | | 36 | |
Net Wells(1) | | | 17 | | | | 23 | | | | 27 | |
| Hocol | | | | | | | | | | | | |
| Gross wells owned and operated by Hocol | | | 43 | | | | 8 | | | | – | |
| Gross wells in Joint Ventures | | | – | | | | 1 | | | | – | |
Net Wells(1) | | | 34 | | | | 8 | | | | – | |
| Total Gross wells owned and operated in Colombia | | | 234 | | | | 165 | | | | 146 | |
| Total Gross wells in Joint Ventures in Colombia | | | 590 | | | | 431 | | | | 506 | |
| Total Net Wells (Colombia) | | | 493 | | | | 384 | | | | 428 | |
| INTERNATIONAL | | | | | | | | | | | | |
| Savia Perú | | | | | | | | | | | | |
| Gross wells | | | 14 | | | | 5 | | | | – | |
Net Wells(1) | | | 7 | | | | 2.5 | | | | – | |
| Ecopetrol America Inc. | | | | | | | | | | | | |
| Gross wells | | | – | | | | 1 | | | | 1 | |
Net Wells(1) | | | – | | | | 0.1 | | | | 0.1 | |
| Total Gross Wells (International) | | | 14 | | | | 6 | | | | 1 | |
| Total Net Wells (International) | | | 7 | | | | 2.6 | | | | 0.1 | |
| (1) | Net wells correspond to the sum of wells entirely owned by us and our ownership percentage of wells owned in joint ventures with our partners. |
Production Activities in Colombia
Our average daily production of crude oil in Colombia reached 507.8 thousand bpd in 2010, a 20.9% increase compared to 2009. The increase in our average daily production is due to an 11.0% increase in production from fields developed with our business partners, which totaled 237.5 thousand bpd in 2010 from 213.9 thousand bpd in 2009, and a 31.3% increase from fields operated by us, which totaled a 270.4 thousand bpd in 2010 compared to 205.9 thousand bpd in 2009. Our average daily production of crude oil was 419.8 thousand bpd in 2009, a 16% increase compared to 2008. This increase in our average daily production was due to a 12.6% increase in production from fields developed with our business partners, which totaled 213.9 thousand bpd in 2009 from 189.9 thousand bpd in 2008, and a 19.9% increase from fields operated by us, which totaled a 205.9 thousand bpd in 2009 compared to 171.7 thousand bpd in 2008.
The following table sets forth our average daily crude oil production, prior to deducting royalties, for the years ended December 31, 2010, 2009 and 2008.
| | | For the Year ended December 31 | |
| | | | | | | | | | |
| | | (thousand bpd) | |
| COLOMBIA | | | | | | | | | |
| Ecopetrol | | | | | | | | | |
| Northeastern region: | | | | | | | | | |
| Joint venture operation | | | 28.8 | | | | 36.9 | | | | 40.4 | |
| Direct operation | | | 12.4 | | | | — | | | | — | |
| Total Northeastern region | | | 41.2 | | | | 36.9 | | | | 40.4 | |
| Mid-Magdalena Valley region: | | | | | | | | | | | | |
| Joint venture operation | | | 18.5 | | | | 16.9 | | | | 15.1 | |
| Direct operation | | | 65.0 | | | | 56.6 | | | | 50.7 | |
| Total Mid-Magdalena Valley region | | | 83.5 | | | | 73.4 | | | | 65.8 | |
| Central region: | | | | | | | | | | | | |
| Joint venture operation | | | 78.4 | | | | 44.5 | | | | 28.6 | |
| Direct operation | | | 140.3 | | | | 111.5 | | | | 93.7 | |
| Total Central region | | | 218.7 | | | | 156.0 | | | | 122.3 | |
| Catatumbo-Orinoquía region: | | | | | | | | | | | | |
| Joint venture operation | | | 60.3 | | | | 67.1 | | | | 70.9 | |
| Direct operation | | | 3.3 | | | | 2.9 | | | | 3.0 | |
| Total Catatumbo-Orinoquia region | | | 63.6 | | | | 70.0 | | | | 73.9 | |
| Southern region: | | | | | | | | | | | | |
| Joint venture operation | | | 35.5 | | | | 35.4 | | | | 33.6 | |
| Direct operation | | | 26.5 | | | | 26.6 | | | | 24.3 | |
| Total Southern region | | | 62.0 | | | | 62.0 | | | | 57.9 | |
| Minor Fields: | | | | | | | | | | | | |
| Joint venture operation | | | 12.2 | | | | 6.6 | | | | — | |
| Direct operation | | | 0.6 | | | | 0.5 | | | | — | |
| Total Minor Fields | | | 12.7 | | | | 7.2 | | | | — | |
Hocol S.A(1) | | | | | | | | | | | | |
| Joint venture operation | | | 3.6 | | | | 6.3 | | | | — | |
| Direct operation | | | 22.3 | | | | 7.8 | | | | — | |
| Total Hocol | | | 25.9 | | | | 14.1 | | | | — | |
| Production Tests | | | 0.2 | | | | 0.3 | | | | 1.3 | |
| Total Average Daily Crude Oil Production (Colombia) | | | 507.8 | | | | 419.8 | | | | 361.6 | |
| INTERNATIONAL | | | | | | | | | | | | |
| Savia Perú | | | 6.4 | | | | 5.3 | | | | — | |
| Ecopetrol America | | | 1.7 | | | | 0.9 | | | | 0.3 | |
| Total Average Daily Crude Oil Production (International) | | | 8.1 | | | | 6.2 | | | | 0.3 | |
| TOTAL AVERAGE DAILY CRUDE OIL PRODUCTION | | | 515.9 | | | | 426.0 | | | | 361.9 | |
| (1) | Hocol and Savia Perú production figures correspond to their equivalent daily productions since their respective months of acquisition. |
The following table sets forth our developed and undeveloped gross and net acreage of crude oil and natural gas production by region for the year ended December 31, 2010.
| | | Production Acreage at December 31, 2010 | | | Average crude oil and natural gas production for the year ended December 31, 2010(1) | |
| | | | | | | | | | |
| | | | | | | | | | | | | | | | |
| | | (in acres) | | | (thousands boe | |
| | | | | | | | | | | | | | | per day) | |
| COLOMBIA | | | | | | | | | | | | | | | |
| Ecopetrol | | | | | | | | | | | | | | | |
| Northeastern region | | | 79,729 | | | | 39,297 | | | | 461,675 | | | | 281,320 | | | | 133 | |
| Mid-Magdalena Valley region | | | 40,858 | | | | 29,415 | | | | 794,844 | | | | 726,302 | | | | 87 | |
| Central region | | | 42,909 | | | | 27,405 | | | | 742,293 | | | | 346,806 | | | | 219 | |
| Catatumbo-Orinoquía region | | | 51,899 | | | | 41,359 | | | | 1,135,174 | | | | 639,857 | | | | 64 | |
| Southern region | | | 28,977 | | | | 23,721 | | | | 910,193 | | | | 608,613 | | | | 63 | |
| Minor Fields | | | 8,476 | | | | 3,724 | | | | 412,547 | | | | 142,234 | | | | 13 | |
| Hocol | | | 19,309 | | | | 5,609 | | | | 1,139 | | | | 270 | | | | 27 | |
| Total (Colombia) | | | 272,157 | | | | 170,530 | | | | 4,457,865 | | | | 2,745,402 | | | | 606.3 | |
| INTERNATIONAL | | | | | | | | | | | | | | | | | | | | |
| Savia Perú | | | 78,531 | | | | 78,531 | | | | 10,160 | | | | 5,080 | | | | 7.5 | |
Ecopetrol America Inc. | | | 800 | | | | 74 | | | | 25,840 | | | | 2,380 | | | | 1.9 | |
| Total (International) | | | 79,331 | | | | 78,605 | | | | 36,000 | | | | 7,460 | | | | 9.4 | |
| TOTAL | | | 351,488 | | | | 249,135 | | | | 4,493,865 | | | | 2,752,862 | | | | 615.7 | |
| (1) | Does not include 0.2 thousand bpd of production from exploratory activities. |
The following table sets forth our total gross and net productive wells by region for the year ended December 31, 2010.
| | | | |
| | | | | | | | | | |
| | | | | | | | | | | | | | | | | | | |
| COLOMBIA | | | | | | | | | | | | | | | | | | |
| Ecopetrol | | | | | | | | | | | | | | | | | | |
| Northeastern region | | | — | | | | — | | | | 28 | | | | 16 | | | | 66 | | | | 50 | |
| Mid-Magdalena Valley region | | | 2,807 | | | | 1,873 | | | | 4 | | | | 4 | | | | 0 | | | | 0 | |
| Central region | | | 738 | | | | 524 | | | | 0 | | | | 0 | | | | 0 | | | | 0 | |
| Catatumbo-Orinoquía region | | | 667 | �� | | | 417 | | | | 1 | | | | 1 | | | | 0 | | | | 0 | |
| Southern region | | | 899 | | | | 531 | | | | 3 | | | | 1.4 | | | | 0 | | | | 0 | |
| Minor fields | | | 112 | | | | 56 | | | | 6 | | | | 2 | | | | 5 | | | | 4 | |
| Hocol | | | 276 | | | | 152 | | | | 2 | | | | 2 | | | | 0 | | | | 0 | |
| Total (Colombia) | | | 5,499 | | | | 3,553 | | | | 44 | | | | 26 | | | | 71 | | | | 54 | |
| INTERNATIONAL | | | | | | | | | | | | | | | | | | | | | | | | |
| Savia Perú | | | — | | | | — | | | | — | | | | — | | | | 633 | | | | 316 | |
Ecopetrol America Inc. | | | — | | | | — | | | | — | | | | — | | | | 8 | | | | 1 | |
| Total (International) | | | — | | | | — | | | | — | | | | — | | | | 641 | | | | 317 | |
| TOTAL | | | 5,499 | | | | 3,553 | | | | 44 | | | | 26 | | | | 712 | | | | 317 | |
Crude Oil
Volume of crude oil purchased
The table below sets forth the volumes of crude oil purchased from our business partners and volumes of crude oil purchased from the ANH corresponding to royalties that have been received by the ANH in-kind from producers for the years ended December 31, 2010, 2009 and 2008.
| | | For the year ended December 31, | |
| | | | | | | | | | |
| | | (million barrels) | |
| Ecopetrol | | | | | | | | | |
| Crude oil purchased from the ANH | | | 40.5 | | | | 35.1 | | | | 32.6 | |
| Crude oil purchased from our Business partners | | | 23.1 | | | | 26.4 | | | | 18.8 | |
| Hocol | | | | | | | | | | | | |
| Crude oil purchased from our Business partners | | | 9.1 | | | | 4.8 | | | | — | |
| Total | | | 72.7 | | | | 66.3 | | | | 51.4 | |
Light crude oil
Light crude oil has API gravity 35º or higher and tends to have a higher sales price in the international market. We develop and produce light crude oil in the Cravo Norte joint venture and in the Cusiana and Cupiagua fields. During 2010, our production of light crude oil (on a stand-alone basis) was 48 thousand bpd, an 8.4% increase compared to 44 thousand bpd produced in 2009. During 2009, our production of light crude oil decreased 7.2% compared to 47.4 thousand bpd in 2008.
Heavy crude oil
We consider heavy crudes as those with API gravity below 15º. We (on a stand-alone basis) develop, upgrade and produce heavy crude in the Central and Mid-Magdalena Valley regions. Our production of heavy crude oil increased from 24 thousand bpd in 2000 to 210 thousand bpd in 2010. Our production of heavy crudes in 2010 reached 210 thousand bpd, a 43.8% increase when compared to 2009 as a result of the development of the Rubiales, Castilla and Chichimene fields, in the San Fernando Region. In 2009, our production of heavy crudes amounted to 146 thousand bpd, compared to 109 thousand bpd in 2008, mainly as a result of the development of the same fields. We are committed to developing our heavy crude reserves as they are an integral part of our growth strategy.
Our most important heavy crude oil projects are:
| | · | Cubarral. The Cubarral block is located in the Central region and is composed of the Castilla and Chichimene fields. Together, these fields in 2010 produced during 2010 approximately 117.6 thousand bpd, a 28.7% increase compared with 2009 production. |
| | · | Rubiales - Quifa. The Rubiales and Quifa fields are located in the Central region and are developed in joint venture with Metapetroleum. The Rubiales and Quifa fields increased our production from 38 thousand bpd in 2009 to 71.8 thousand bpd in 2010. In March 2011, we, along with Pacific Rubiales Energy Corp., announced the Synchronized Thermal Additional Recovery (STAR) technology pilot project in the Quifa field to begin to test the use of in-situ combustion-based technology which is expected to increase the recovery factor in Colombia’s heavy oil fields. |
| | · | Nare-Teca. The Nare-Teca fields are located in the Mid-Magdalena Valley region developed in a joint venture with Mansarovar, a joint venture between Sinopec from China and Oil and Natural Gas Corporation Ltd. from India. Our production reached 13.2 thousand bpd in 2010, a 23.8% increase from 2009. We expect our production share to increase to reach a maximum of 32 thousand bpd by 2014. |
Purchase Commitments with our business partners
We have entered into a number of crude oil purchase contracts with certain of our business partners. Crude oil purchased from our business partners is either processed in our refineries or exported. The purchase price is calculated based on international market prices. Consequently, our total financial exposure depends on the international prices of oil and volumes produced. We believe that the risk of such exposure is hedged because we either export the crude oil at international market prices or sell refined products at prices which are correlated with international market prices. During 2010, the total volumes of crude oil we purchased from our business partners amounted to 24% of our total crude oil sales.
Under most of our existing contracts, we are obligated to purchase 100% of our partner’s production in the specific field. During the first three months of 2011, purchases of crude oil by Ecopetrol S.A. on an unconsolidated basis under these commitments amounted to 171.9 thousand bpd of crude oil.
The term of some of our purchase contracts is linked to the term of the joint venture agreements signed with our business partners. Other clauses of the contracts such as price and place of delivery may be subject to renegotiation during the term of the contract. Other purchase contracts not linked to joint venture agreements may be extended and renegotiated by the parties.
Natural Gas
In 2010, our average daily production of natural gas in Colombia reached 562.3 mcfpd, a 5.38% increase when compared to 2009 production; production in 2009 represented a 9.59% increase when compared to 2008 natural gas production.
The following table sets forth our average daily natural gas production, prior to deducting royalties, for the years ended December 31, 2010, 2009 and 2008.
| | | For the year ended December 31, | |
| | | | | | | | | | |
| | | (mcfpd) | |
| COLOMBIA | | | | | | | | | |
| Ecopetrol | | | | | | | | | |
| Northeastern region: | | | | | | | | | |
| Joint Venture | | | 523.3 | | | | 494.4 | | | | 451.8 | |
| Direct Operation | | | 0.1 | | | | — | | | | — | |
| Total Northeastern region | | | 523.4 | | | | 494.4 | | | | 451.8 | |
| Mid-Magdalena Valley region: | | | | | | | | | | | | |
| Joint Venture | | | 3.4 | | | | 4.0 | | | | 6.0 | |
| Direct Operation | | | 18.0 | | | | 19.4 | | | | 21.4 | |
| Total Mid-Magdalena | | | | | | | | | | | | |
| Total Valley region | | | 21.4 | | | | 23.3 | | | | 27.4 | |
| Central region: | | | | | | | | | | | | |
| Joint Venture | | | — | | | | — | | | | — | |
| Direct Operation | | | 1.0 | | | | 3.9 | | | | 1.7 | |
| Total Central region | | | 1.0 | | | | 3.9 | | | | 1.7 | |
| Catatumbo-Orinoquía region: | | | | | | | | | | | | |
| Joint Venture | | | — | | | | 0.2 | | | | 1.0 | |
| Direct Operation | | | 0.8 | | | | 0.5 | | | | — | |
| Total Catatumbo-Orinoquía region | | | 0.8 | | | | 0.7 | | | | 1.0 | |
| Southern region: | | | | | | | | | | | | |
| Joint Venture | | | 3.7 | | | | 3.4 | | | | 2.8 | |
| Direct Operation | | | 2.7 | | | | 1.7 | | | | 2.2 | |
| Total Southern region | | | 6.3 | | | | 5.2 | | | | 5.0 | |
| Minor Fields: | | | | | | | | | | | | |
| Joint venture operation | | | 3.3 | | | | 1.9 | | | | — | |
| Direct operation | | | — | | | | — | | | | — | |
| Total Minor Fields | | | 3.3 | | | | 1.9 | | | | — | |
Hocol(1) | | | | | | | | | | | | |
| Joint venture operation | | | 1.8 | | | | 4.0 | | | | — | |
| Direct operation | | | 4.2 | | | | — | | | | — | |
| Total Hocol | | | 6.0 | | | | 4.0 | | | | — | |
| Production Tests | | | — | | | | 0.2 | | | | | |
| Total Natural Gas Production (Colombia) | | | 562.3 | | | | 533.6 | | | | 486.9 | |
| INTERNATIONAL | | | | | | | | | | | | |
Savia Perú(1) | | | 5.7 | | | | 5.3 | | | | | |
| Ecopetrol America | | | 1.1 | | | | 0.4 | | | | | |
| Total Natural Gas Production (International) | | | 6.8 | | | | 5.7 | | | | — | |
| TOTAL NATURAL GAS PRODUCTION | | | 569.1 | | | | 539.2 | | | | 486.9 | |
| (1) | Hocol and Savia Perú production figures correspond to their equivalent daily productions since their respective months of acquisition. |
Northeastern region
The largest production of natural gas in Colombia is located in the Northeastern region, which we develop primarily under joint venture contracts. We develop the Guajira natural gas reserves with our partner Chevron. The Cusiana and Cupiagua reserves are developed in partnership with Equion and Total; however, the first joint venture agreement with British Petroleum (now Equion) and Total under which we produce crude oil and natural gas in these fields expired in June 2010 related to the Cupiaga fields and the production rights reverted to us at no additional cost.
Natural gas production in the Northeastern region averaged 523.4 mcfpd in 2010. The natural gas produced from these fields is used to supply our local demand and to meet our commitments to supply natural gas to Venezuela. We are continuing to re-inject natural gas in the Cusiana and the Cupiagua fields in order to increase our recovery ratio. This production outcome was leveraged by Chuchupa and Ballena assets operated by Chevron, which represented a production of 387.3 mcfpd. During 2010, we increased gas volume capacity for sales with the LTO II plant, with a capacity of 70 mcfpd, and Gibraltar, with a capacity of 36 mcfpd. We expect these volumes to be commercialized during 2011.
Lifting and production costs
Our consolidated average production costs on a Peso basis decreased to Ps$18,940 during 2010 from Ps$19,523 during 2009, mainly due to an 18% increase in production volumes compared to 2009, partially offset by (i) an increase in costs as a result of the expansion of our production facilities and maintenance expenses, (ii) increased costs from joint ventures and (iii) an increase in workovers to maintain our increasing production levels. Our consolidated average lifting costs on a dollar basis increased to US$9.98 in 2010 from US$9.05 in 2009 as a result of the above mentioned factors, which result was more than offset by the 12% appreciation of the average exchange rate of the Peso against the U.S. dollar.
Our consolidated average lifting costs differ from our consolidated average production costs because our lifting costs do not include costs related to self-consumption of hydrocarbons included in the production process, such as by our small refineries and natural gas liquid plants.
The following table sets forth our crude oil and natural gas average sales price, average lifting costs and average production costs for the years ended December 31, 2010, 2009 and 2008.
| | | For the year ended December 31, | |
| | | | | | | | | | |
| Crude Oil Average Sales Price | | | | | | | | | |
(U.S. dollars per barrel)(1) | | | 72.42 | | | | 60.86 | | | | 85.30 | |
| Crude Oil Average Sales Price | | | | | | | | | | | | |
(Ps$ per barrel)(1) | | | 137,493 | | | | 130,986 | | | | 163,273 | |
| Natural Gas Average Sales Price | | | | | | | | | | | | |
(U.S. dollars per thousand cf)(1) | | | 3.42 | | | | 2.94 | | | | 3.47 | |
| Natural Gas Average Sales Price | | | | | | | | | | | | |
(Ps$ per thousand cf)(1) | | | 6,487 | | | | 6,321 | | | | 6,818 | |
| Aggregate Average Unit Production Costs | | | | | | | | | | | | |
(U.S. dollars per boe)(3) | | | 9.98 | | | | 9.05 | | | | 15.01 | |
| Aggregate Average Unit Production Cost | | | | | | | | | | | | |
(Ps$ per boe)(3) | | | 18,940 | | | | 19,523 | | | | 29,519 | |
| Aggregate Average Lifting Costs | | | | | | | | | | | | |
(U.S. dollars per boe)(2)(4) | | | 9.83 | | | | 9.04 | | | | 10.59 | |
| Aggregate Average Lifting Costs | | | | | | | | | | | | |
(Ps$ per boe)(2)(4) | | | 18,652 | | | | 19,499 | | | | 20,823 | |
| (1) | Corresponds to our average sales price on a consolidated basis. |
| (2) | Lifting costs per barrel are calculated based on total production, which are net of royalties, and correspond to our lifting costs on a consolidated basis. |
| (3) | Unit production costs correspond to consolidate average costs on total production volumes net of royalties. Production costs do not include costs related to transport, commercialization and administrative expenses. |
| (4) | During 2010, we modified our methodology for calculating our aggregate average lifting cost as follows: we now calculate this cost by taking our production cost and dividing it by our produced volumes net of royalties as the denominator. Our 2009 and 2008 aggregate average lifting costs have been restated under the new methodology. |
Reserves
Our proved reserves of crude oil and natural gas, net of royalties to the Nation, at December 31, 2010, totaled 1,714.0 million boe, which represents an 11.4% increase from the 1,538.2 million boe registered in 2009. Our crude oil proved reserves in 2010 increased to 1,236.4 million barrels of crude oil from 1,123.3 million barrels of crude oil in 2009 and our natural gas proved reserves increased to 2,722.6 billion cubic feet, or bcf, from 2,329.4 bcf of reserves in 2009. In 2009, our proved reserves increased 35.0% from the 1,137.0 million boe registered in 2008. The increase in our reserves in 2010 is mainly due to (i) a 191 million boe increase corresponding to revisions of previous estimates, (ii) a 47 million boe increase corresponding to improved recovery, (iii) a 126 million boe increase corresponding to extensions and discoveries and (iv) a 189 million boe decrease corresponding to production.
Hydrocarbon reserves were calculated in accordance with SEC regulations and the requirements of the Financial Accounting Standards Board, or FASB. Ecopetrol’s reserves process is supervised and coordinated by the Director of Reserves Control, a petroleum engineer, with a financial graduate degree and a Masters in petroleum engineering and who has 18 years of experience in several companies in reservoir engineering, field development, reservoir management and estimation and reporting of reserves. The Director of Reserves Control reports to the Chief Financial Officer. The reserves group is comprised of reserves coordinators, petroleum engineers and geologists with experience of more than 15 years in reservoir characterization, field development, estimation and reporting of reserves and having supervision and supporting responsibilities with the professionals involved in the estimation and reporting process.
Reserves are initially estimated internally, supervised and coordinated by the corporate manager of reservoirs, a geologist who holds a masters degree in geology and has more than 20 years of experience in projects associated with reservoir characterization and development, estimation and reporting of reserves. The employees involved in the reserves process meet the Society of Petroleum Engineers-SPE qualifications for reserves estimators. Internally estimated reserves are submitted to an external audit process, which was done in 2010 by Ryder Scott, DeGolyer and MacNaughton and Gaffney, Cline & Associates (collectively which we refer to as the External Engineers). These firms have audited 99% of our total net proved reserves for 2010. According to our corporate policy, we report the reserves values obtained from the External Engineers. The reserves process ends with the consolidation and results presentation for approval to the Reserves Committee, consisting of the Chief Financial Officer, the Exploration and Production Executive Vice-President and the Vice-President of Strategy. Decisions of the Reserves Committee have to be unanimous. Finally, results are presented to the Audit Committee of the Board of Directors and the Board of Directors.
The external audit process was conducted in accordance with SEC definitions and rules set forth in Rule 4-10(a) of Regulation S-X and the disclosure guidelines contained in the SEC’s Modernization of Oil and Gas Reporting final rule dated December 31, 2008 and effective as of January 1, 2010. The information presented below and elsewhere in this annual report referring to our 2010 net proved reserves estimates is based on those reports and on our own calculations for the remaining 1% of our hydrocarbon net proved reserves. Our 2010 crude oil and natural gas net proved reserves include reserves from our subsidiaries located in the United States (Gulf of Mexico), Peru and Hocol’s assets in Colombia.
The information regarding 2009 net proved reserves is based on the external audit of 97% of our total reserves, prepared by the External Engineers under SEC definitions and rules. The remaining 3% corresponds to estimations made by us internally using SEC definitions and rules. The information regarding 2008 net proved reserves is based on the 2008 audited reserve reports for 89% of our total reserves prepared by the External Engineers under SEC definitions and rules. The remaining 11% corresponds to estimations made by us internally using SEC definitions and rules.
The reserve information presented in this section is based on the SEC’s definitions and rules used for U.S. GAAP purposes. See “Item 5. Operating and Financial Review and Prospects—Principal differences between Colombian Government Entity GAAP and U.S. GAAP” and Note 32 to our consolidated financial statements.
The following table sets forth our estimated net proved reserves (developed and undeveloped) of crude oil and gas by region and for the years ended December 31, 2010, 2009 and 2008.
| | | | |
| | | | | | | | | | |
| | | Crude Oil (million barrels) | | | | | | Crude Oil (million barrels) | | | | | | Crude Oil (million barrels) | | | | |
| PROVED DEVELOPED RESERVES | | | | | | | | | | | | | | | | | | |
| Colombia | | | | | | | | | | | | | | | | | | |
| Ecopetrol S.A. | | | | | | | | | | | | | | | | | | |
| Northeastern region | | | 88.6 | | | | 2187.8 | | | | 65.2 | | | | 1674.9 | | | | 66.3 | | | | 680.0 | |
| Mid-Magdalena Valley region | | | 194.8 | | | | 32.6 | | | | 148.0 | | | | 24.4 | | | | 134.2 | | | | 33.3 | |
| Central region | | | 258.4 | | | | 0.0 | | | | 196.2 | | | | 0.0 | | | | 137.3 | | | | 0.0 | |
| Catatumbo – Orinoquía region | | | 75.1 | | | | 7.2 | | | | 68.6 | | | | 0.0 | | | | 76.5 | | | | 0.0 | |
| Southern region | | | 109.1 | | | | 3.0 | | | | 97.5 | | | | 3.8 | | | | 92.4 | | | | 4.9 | |
| Minor Fields | | | 13.3 | | | | 2.6 | | | | 6.6 | | | | 0.8 | | | | 10.9 | | | | 2.0 | |
| Hocol | | | 41.5 | | | | 1.5 | | | | 29.7 | | | | 3.1 | | | | — | | | | — | |
| Total (Colombia) | | | 780.7 | | | | 2,234.6 | | | | 611.6 | | | | 1,707.0 | | | | 517.6 | | | | 720.1 | |
| International | | | | | | | | | | | | | | | | | | | | | | | | |
| Savia Perú | | | 15.9 | | | | 24.8 | | | | 14.2 | | | | 23.0 | | | | — | | | | — | |
| Ecopetrol America | | | 4.1 | | | | 2.3 | | | | 4.7 | | | | 2.6 | | | | 0.8 | | | | 0.5 | |
| Total (International) | | | 20.0 | | | | 27.0 | | | | 18.8 | | | | 25.6 | | | | 0.8 | | | | 0.5 | |
| TOTAL PROVED DEVELOPED RESERVES | | | 800.7 | | | | 2,261.7 | | | | 630.5 | | | | 1,732.6 | | | | 518.4 | | | | 720.6 | |
| | | | | | | | | | | | | | | | | | | | | | | | | |
| PROVED UNDEVELOPED RESERVES | | | | | | | | | | | | | | | | | | | | | | | | |
| Colombia | | | | | | | | | | | | | | | | | | | | | | | | |
| Ecopetrol S.A. | | | | | | | | | | | | | | | | | | | | | | | | |
| Northeastern region | | | 38.2 | | | | 431.8 | | | | 75.8 | | | | 584.7 | | | | 41.5 | | | | 1,173.0 | |
| Mid-Magdalena Valley region | | | 78.8 | | | | 15.7 | | | | 99.1 | | | | 7.5 | | | | 77.2 | | | | 5.3 | |
| Central region | | | 270.3 | | | | 0.0 | | | | 242.5 | | | | 0.0 | | | | 126.2 | | | | 0.0 | |
| Catatumbo – Orinoquía region | | | 17.8 | | | | 13.4 | | | | 25.7 | | | | 0.0 | | | | 20.1 | | | | 0.0 | |
| Southern region | | | 4.6 | | | | 0.0 | | | | 14.6 | | | | 0.4 | | | | 13.8 | | | | 0.0 | |
| Minor Fields | | | 3.3 | | | | 0.0 | | | | 1.0 | | | | 0.0 | | | | 1.7 | | | | 0.0 | |
| Hocol | | | 8.5 | | | | 0.0 | | | | 19.3 | | | | 0.4 | | | | — | | | | — | |
| Total (Colombia) | | | 421.3 | | | | 460.9 | | | | 478.0 | | | | 593.0 | | | | 280.5 | | | | 1,178.3 | |
| International | | | | | | | | | | | | | | | | | | | | | | | | |
| Savia Perú | | | 14.3 | | | | 0.0 | | | | 14.9 | | | | 3.8 | | | | — | | | | — | |
| Ecopetrol America | | | 0.0 | | | | 0.0 | | | | 0.0 | | | | 0.0 | | | | 0.0 | | | | 0.0 | |
| Total (International) | | | 14.3 | | | | 0.0 | | | | 14.9 | | | | 3.8 | | | | 0.0 | | | | 0.0 | |
| TOTAL PROVED UNDEVELOPED RESERVES | | | 435.7 | | | | 460.9 | | | | 492.8 | | | | 596.9 | | | | 280.5 | | | | 1,178.3 | |
| | | | | | | | | | | | | | | | | | | | | | | | | |
| TOTAL PROVED RESERVES (DEVELOPED AND UNDEVELOPED) | | | 1,236.4 | | | | 2,722.6 | | | | 1,123.3 | | | | 2,329.4 | | | | 798.9 | | | | 1,898.9 | |
The following table sets forth our estimated consolidated net proved developed and undeveloped reserves of crude oil and natural gas at December 31, 2010, 2009 and 2008.
| | | Net proved developed and undeveloped Reserves | |
| | | Crude Oil (million barrels) | | | | | | | |
| | | | | | | | | | |
| Reserves at December 31, 2008 | | | 798.9 | | | | 1,898.9 | | | | 1,137.0 | |
| Revisions of previous estimates | | | 246.0 | | | | 537.2 | | | | 341.6 | |
| Improved recovery | | | 0.0 | | | | 0.0 | | | | 0.0 | |
| Purchases of minerals in place | | | 84.2 | | | | 33.2 | | | | 90.1 | |
| Extensions and discoveries | | | 126.1 | | | | 16.8 | | | | 129.1 | |
| Production | | | (131.9 | ) | | | (156.6 | ) | | | (159.7 | ) |
| Reserves at December 31, 2009 | | | 1,123.3 | | | | 2,329.4 | | | | 1,538.2 | |
| Revisions | | | 99.1 | | | | 558.7 | | | | 190.9 | |
| Improved recovery | | | 47.4 | | | | 0.0 | | | | 47.4 | |
| Purchases of minerals in place | | | 0.0 | | | | 0.0 | | | | 0.0 | |
| Extensions and discoveries | | | 126.3 | | | | 0.3 | | | | 126.5 | |
| Production | | | (159.8 | ) | | | (165.9 | ) | | | (188.9 | ) |
| Reserves at December 31, 2010 | | | 1,236.4 | | | | 2,722.6 | | | | 1,714.0 | |
| | | | | | | | | | | | | |
| Net proved developed reserves | | | | | | | | | | | | |
| At December 31, 2008 | | | 518.4 | | | | 720.6 | | | | 646.7 | |
| At December 31, 2009 | | | 630.5 | | | | 1,732.6 | | | | 939.0 | |
| At December 31, 2010 | | | 800.7 | | | | 2,261.7 | | | | 1,197.5 | |
The above-referenced reserve amounts, net of royalty payments to the Nation, are the same amounts used to reconcile Note 32 to our consolidated financial statements under FASB ASC 932.
The Company’s revisions, on a consolidated basis, during 2010 amounted to 191 million boe, corresponding primarily to the following:
| | · | Cusiana Field: new gas sales agreements (38 million boe). |
| | · | Rubiales Field: the reservoir has demonstrated a better production performance (lower decline rates) and a more favorable economic limit (35 million boe). |
| | · | Chuchupa Field: the reservoir has demonstrated a better performance resulting from the compression project (27 million boe). |
| | · | Cupiagua Field: the Company signed an internal gas sales agreement to Barrancabermeja Refinery (20 million boe); |
The revisions described above represented 73% of the additions to reserves revisions in 2010, while the revisions with respect to the remaining 71 million boe resulted from varying increases and decreases from a variety of fields.
The Company’s improved recovery during 2010 amounted to 47.4 million boe, which corresponded mainly to better production results amounting to 35 million boe in the secondary performance of the Casabe field, which at the same time allowed for updating of the development plan.
Yariguí-Cantagallo, San Francisco, La Cira, Infantas, Cusiana and Cupiagua fields accounted for the remaining addition by improved recovery.
The Company’s extensions and discoveries during 2010 amounted to 126 million boe, which corresponded to 21 million boe of newly discovered fields and 106 million boe of extensions of proved acreage. The newly discovered fields corresponded mainly to Quifa Suroeste and Casabe Sur fields, representing 90% of the additions. In terms of extensions of proved acreage, 80% of the 106 million boe was associated with Rubiales Field (85 million boe), where the Company has created an improved development plan, covering new proved areas, which supports additional future drilling activities. The remaining 20% is distributed in smaller changes in several fields like, Chichimene, Castilla, Provincia, Sardinata and others.
In terms of proved undeveloped reserves, during 2010, the company added approximately 169 million boe and converted 251 million boe. Total proved undeveloped reserves decreased by 82.7 million boe to 516.5 million boe at December 31, 2010 from 599.2 million boe at December 31, 2009. At December 31, 2010, 84% of our total proved undeveloped reserves corresponded to crude oil. The additions in the Company’s proved undeveloped reserves in 2010 is a result of (i) 56 million boe corresponding to revisions of previous estimates and (ii) 21 million boe increase corresponding to improved recovery (iii) 91 million boe increase corresponding to extensions and discoveries.
In terms of proved undeveloped reserves, changes associated with revisions of previous estimates corresponds primarily to variations in economic factors, adjustments based on production behavior and updated development plans in several fields, mainly in Chuchupa (56 mboe), Cupiagua (20 mboe), Rubiales (20 mboe) and smaller changes, positive and negative in several fields. The increases by improved recovery are associated mainly with the waterflood project of the Casabe field, as described above (20 million boe, 93% of the total). The Company’s extensions and discoveries relates mainly to extensions of proved acreage, corresponding to projects previously described in the Rubiales field (71 mboe) and new discovered (11 mboe) fields, together representing 90% of the additions in this category.
Of the total amount of proved undeveloped reserves that we had at the end of 2009 (599 million boe), we converted approximately 251 million boe, or 42%, to proved developed reserves during 2010, which resulted mainly from (i) natural gas projects in the Northeastern region, primarily associated with additional natural gas treatment capacity and sales contracts in the Pauto, Gibraltar and Cusiana fields, which represented 52% of the total conversion and (ii) crude oil projects, primarily associated with the development of heavy crude oil fields in Rubiales, Castilla and Chichimene in the Central region, which represented approximately 24% of the total conversion. The remaining 24% is associated with development plans in secondary recovery of the Casabe field and development execution in other fields. The amount of investment made during 2010 to convert the proved undeveloped reserves to the proved developed reserves was Ps$3,832 billion.
Present Activities
As of March 31, 2011, we completed drilling nine gross exploratory wells thus: five in Colombia, three in Peru and one in Brasil. In Colombia one well showed the presence of hydrocarbons, two are being evaluated and two were dry wells. Savia drilled three exploratory wells in Peru, of which two are being evaluated and one showed the presence of hydrocarbons. Anadarko finished drilling the Itauna well on block BM-C- 29 in which Ecopetrol Oleo & Gas do Brasil has a 50% interest. This well has a four-year evaluation period. Ecopetrol S.A. also signed eight exploration and production contracts with the ANH in the first quarter of 2011 corresponding to blocks awarded to the Company in the Colombia Open Round 2010. The eight blocks cover a total area of more than 840 thousand hectares and are located in the Llanos (provinces of Arauca, Casanare and Meta), Valle Medio del Magdalena (Cundinamarca and Caldas) and Sinu-San Jacinto (Antioquia and Cordoba) basins, and the Pacific offshore. Ecopetrol has a 100% stake in six of the contracts. In the SSJS 1 contract, Ecopetrol S.A.’s stake is 70%, and in the VMM 32 contract, Ecopetrol S.A. holds a 51% stake. Ecopetrol S.A. was also awarded a 50% stake in the Cayos 1 and Cayos 5 blocks in the Colombia Open Round 2010, of which we have a 50% stake in each. Contracts associated with the Cayos 1 and Cayos 5 blocks are expected to be signed with the ANH once environmental review has been completed. In addition, Hocol signed five exploration and production contracts with the ANH corresponding to blocks awarded in the Colombia Open Round 2010. These blocks are located in Llanos region and Magdalena Valley region and cover a total area of approximately 604 thousand hectares.
During the first quarter of 2011, our consolidated average production of crude oil was 686.2 thousand boe per day, a 17.1% increase when compared to the same period in 2010. Ecopetrol S.A.’s production represented 92.3% of consolidated production; Hocol represented 4.6%, Equion represented 1.7%, Savia represented 1.1% and Ecopetrol America represented 0.3%.
Our average production of natural gas during the same period was 594.5 million cubic feet per day, which represents a 2.2% increase when compared to the same period in 2010 mainly due to natural gas production of Equion since January 2011.
Ecopetrol S.A. (on a stand-alone basis) drilled 271 gross development wells in Colombia during the first quarter of 2011, of which 84 corresponded to direct activity operated by us.
The following table sets forth the number of gross and net productive and dry development wells drilled exclusively by us and through joint ventures during the first quarter of 2011:
| | | For the three months ended March 31, 2011 | |
| COLOMBIA | | | |
| Ecopetrol | | | |
| Northeastern Region: | | | |
| Gross wells owned and operated by Ecopetrol | | | 1 | |
| Gross wells in Joint Ventures | | | 3 | |
Net Wells(1) | | | 3 | |
| Mid-Magdalena Valley Region: | | | | |
| Gross wells owned and operated by Ecopetrol | | | 33 | |
| Gross wells in Joint Ventures | | | 100 | |
Net Wells(1) | | | 81 | |
| Central Region: | | | | |
| Gross wells owned and operated by Ecopetrol | | | 48 | |
| Gross wells in Joint Ventures | | | 63 | |
Net Wells(1) | | | 76 | |
| Catatumbo-Orinoquía Region: | | | | |
| Gross wells owned and operated by Ecopetrol | | | 1 | |
| Gross wells in Joint Ventures | | | 13 | |
Net Wells(1) | | | 7 | |
| Southern Region: | | | | |
| Gross wells owned and operated by Ecopetrol | | | 1 | |
| Gross wells in Joint Ventures | | | 8 | |
Net Wells(1) | | | 3 | |
| | (1) | Net wells correspond to the sum of wells entirely owned by us and our ownership percentage of wells owned in joint ventures with our partners. |
Overview of Exploration and Production Contractual Arrangements
Contractual Arrangements for the exploration and production of crude oil and natural gas in Colombia
To address the country’s exploration and production needs, Colombia has modified the contractual regime governing the exploration, development and production of hydrocarbons several times since its introduction in 1970. The exploration and production contracts entered into by our business partners and us provide for the production split, the length of the exploration and production terms and royalty payments.
Under Colombian law, an existing contract cannot be modified because of a change to the contractual regime, except in the cases of public order regulations. As a result, contracts that were executed prior to the issuance of a new contractual regime remain in full force and are not affected by the new regime put in place subsequently. At December 31, 2010, we were party to 114 agreements with partners and 15 exploration and production agreements with the ANH in which we do not have any partners.
Under joint venture contracts entered into before March 1994, which include the Cusiana and Cupiagua crude oil fields, the private investor explored a previously agreed upon area at its own risk and expense. Thereafter, we had the option to become a joint venture partner by reimbursing the investor 50% of the exploration costs of oil wells within commercially viable fields and 50% of all future development costs related to those fields. Once we became a partner, we had a 50% interest in the production of the field.
If we decided not to become a joint venture partner within a certain period of time, the private investor had the right to enter into a sole risk contract for the field’s crude oil production until it had recovered 200% of its investment and a 100% of its total costs. Thereafter, we could participate in the development of the field and all future costs and expenses would be automatically shared with our partner as if we had elected to become a joint venture partner in the field.
Beginning in 1994, modifications were made to standard joint venture contracts to maintain the private investor’s share of production at 50% until aggregate production exceeded 60 million barrels. Thereafter, our share increased gradually, up to a maximum of 70% of production. In 1995, further modifications to the standard joint venture contracts required us to pay for half of the exploration costs, not only for wells that ultimately proved to be productive, but also for dry wells, stratigraphic wells and seismic exploration in fields that became commercially viable. The modifications also provided for competitive bidding for the right to explore and develop marginal fields (defined according to certain technical, financial and operational criteria). In the bidding process, private companies presented bids based on percentages of production they would pay us in exchange for the rights to develop these fields. Winning bidders were responsible for all future investment and operating costs related to the field.
The standard joint venture contract was once again modified in 1997 to promote private sector activity in the development of inactive areas and small fields and in the exploration for natural gas. These modifications extended the exploration periods, increased the levels of reimbursement for private companies’ exploration costs and provided for the reimbursement of exploration costs in real terms and denominated in U.S. dollars.
In 1999, the Government adopted two additional modifications to the standard terms of the joint venture contracts, applicable to new joint venture contracts:
| | · | Reduction of Our Initial Participation. In an effort to attract foreign investment, the Government reduced our initial participation under the joint venture contracts from 50% to 30%. At December 31, 2010, we had 35 joint venture contracts outstanding in which our participation was greater than or equal to 50%, and 30 joint venture agreements are outstanding where our participation was 30% or below. |
| | · | Modified R-Factor. The Government modified the formula used to determine the increase in our share of total production, or the R-Factor. The R-Factor is calculated by dividing accumulated revenues in cash by investments and costs. If the R-Factor increases above a certain profitability threshold, then our share of production increases above the initial 30%. Pursuant to the 1999 modifications, we raised the profitability threshold at which the R-Factor triggers an increase in our share from 1.0 to 1.5. Additionally, the R-Factor was calculated in constant U.S. dollars. The new calculation method was designed to prevent inflation from causing an increase in the R-Factor and a corresponding increase in our share. |
We also have entered into various types of arrangements in connection with our own crude oil and natural gas exploration and production projects. These arrangements included risk participation contracts, incremental production agreements, shared-risk production contracts, risk services production contracts, discovered undeveloped fields contracts and sole risk contracts.
| | · | Risk Participation Contracts. Under these contracts, we assume 20% of the exploration costs and risks at the beginning of the second year in exchange for a larger participation in the future production and equal representation on the executive committee of the joint venture. At December 31, 2010, we had three risk participation contracts in effect. |
| | · | Incremental Production Agreements. We currently have two types of incremental production agreements: the standard incremental production agreements, or SIPA, and the development of incremental production project agreements, or DIPA. |
Under the SIPA, we calculate the total number of proved developed reserves available in a specific field or well and then establish a base production curve for the reserves. Any future production exceeding the curve, which we refer to as incremental production, results from extracting proved undeveloped reserves or probable reserves which require additional investments funded by our partners under the SIPA. We have the right to a previously specified percentage of the incremental production. Our percentage participation varies depending on the total amount invested by our partners and on the R-Factor, which cannot be lower than 1.5. The volume produced under the production curve is not shared with our partners. At December 31, 2010, we had five SIPAs in effect. Additionally, in 2008, a modification was made to the Cicuco Boquete contract, which used to be a SIPA but became a contract in which we receive a 21% overriding royalty; nevertheless, this contract is suspended and nearing termination because the field has not been in production for some time.
Under the DIPA, we file a request with the Ministry of Mines and Energy to approve an incremental production project for a field that we directly operate. If the project is approved, we agreed with our partners to develop the field and we determine mandatory investment thresholds for our partners. We are not required to fund any investment. The production from the field is distributed to us, and our partners receive a percentage of the total production from the field which varies depending on the invested amount. Once the mandatory investment stage expires, we agree with our partners on the percentage of production, total costs and additional investments to be paid by each party. We pay 20% royalties to the Nation on the base production curve and variable royalties on any incremental production. Additionally, in the event of higher prices and large volumes, we have adjustment clauses to increase our share in the production. At December 31, 2010, we had one DIPA in effect.
| | · | Shared-Risk Production Contracts. Under these contracts, we remain as operators of the field and assume responsibility for 50% of all investments and costs. Private oil companies submit bids to enter into agreements with us based upon the production percentage they will assign to us. The successful bidder has the right to enter into the shared-risk contracts with us. At December 31, 2010, we had two shared-risk production contracts outstanding. |
| | · | Risk Service Production Contracts. We began using the risk service production contract in January 1998 to increase production through the use of new technologies in crude oil fields then operated by our partners. All investments in new technologies were made by our partners who received a tariff payment based on a formula that took into account the incremental production resulting from the technological and operative investments. At December 31, 2010, we had two risk service contracts outstanding for the development of the Valdivia-Almagro field and the Rancho Hermoso field located in the Mirador formation. |
| | · | Discovered Undeveloped Fields Contracts. We have entered into discovered undeveloped fields contracts to promote exploration by private companies of both undeveloped and inactive fields. Under this agreement, the contracting party assumes all costs and expenses for the development and operation of a field in exchange for a previously specified fee per barrel, which varies depending on the production level. At December 31, 2010, we had 18 discovered undeveloped fields contracts outstanding, of which two contracts are nearing termination because the fields have not been in production for some time. |
| | · | Sole Risk Contracts. After 2000, the party deciding to enter in a sole risk contract has the right to recover 100% of its investment and costs. Thereafter, we can participate in the development of the field sharing all new investment and costs. At December 31, 2010, we had 18 sole risk contracts outstanding. |
At December 31, 2010 we also have certain other agreements outstanding, including:
| | · | One Service and Technical Cooperation Contract with Universidad Industrial de Santander. Pursuant to this agreement, research can be conducted as part of the development of the Colorado field. |
| | · | One Technical Alliance Agreement with a service company to support the operation of the Casabe field in which Ecopetrol maintains operation and ownership of 100% reserves. |
Current Joint Venture Contractual Regime
In 2004, the authority to enter into exploration and production contracts was assigned to the ANH under a different exploration and production contractual scheme. We became an operator like any other company, competing with all other regional and international oil companies in Colombia for exploration and production opportunities under the same conditions and without any special rights. Decree Law 1760 gave us the ability to maintain in effect all contracts we had entered into prior to January 1, 2004, as well as to have absolute discretion as to whether or not such contracts would be extended after their stated termination date. If we decide not to extend the contracts, the production rights will revert to us and we would have the right, at no additional costs to us, to exploit the associated reserves indefinitely. Contracts entered into by us after January 1, 2004, which are not extended by the ANH, will revert to the ANH and not to us.
The ANH introduced two new model contracts at the end of 2003 to replace the previously used joint venture contracts: the exploration and production contract and the technical evaluation agreement.
| | · | Exploration and Production Contract. Under the exploration and production contracts, the contractor, including us, assumes all exploration and production activities. The contractor also assumes all risks and costs of exploration and is the sole owner of all production and assets involved in the exploration and production activities for the term of the contract. There is no partnership or joint venture between the contractor and the ANH. |
| | · | Technical Evaluation Agreements. The scope of the technical evaluation agreement is limited to exploration activities. Under this agreement, the contractor can evaluate a specific area and decide whether or not it will enter into an exploration and production contract. The contractor assumes all risks and costs of the activities and operations. The agreement may be entered into for an 18-month period for on-shore areas and up to a 24-month period for off-shore areas. |
In June 2010, the Santiago de las Atalayas Contract, one of the most significant exploration and production contracts based on crude oil and natural gas output and reserves expired. Pursuant to the terms of the agreement, the right to develop and commercialize the existing crude oil and natural gas reserves reverted back to us.
We have entered into a number of exploration and production contracts with regional and international oil companies. Annex I presents a list of our contracts still in effect at June 10, 2011, with a complete description of their main characteristics.
Management of crude oil and natural gas joint ventures
Every crude oil and natural gas joint venture development has an executive committee, which makes all technical, financial and operational decisions. All major decisions are made unanimously, including for those projects where we have less than a 50% economic interest. Although we do not operate a number of these joint ventures under development, we do have an active role in the decision making process and development of the projects. As a result, we have direct control over the development of joint ventures, even for those joint ventures where we have less than a majority economic interest.
Refining and Petrochemicals
Summary
There are two main refineries in Colombia: the Barrancabermeja refinery, which we own and operate, and Reficar, a wholly-owned subsidiary. We also own and operate two other minor refineries, Orito and Apiay. Our refineries produce a full range of refined products including gasoline, diesel, jet fuel, liquefied petroleum gas, or LPG, and heavy fuel oils among others.
During 2010, refining and petrochemicals investments amounted to Ps$1.17 trillion. These investments comprised 61 different projects, including re-conversion, upgrading, equipment replacement and environmental projects.
The following table sets forth our daily average installed and actual refinery capacity for each of the last three years.
| | | For the year ended December 31, | |
| | | | | | | | | | |
| | | | | | | | | | | | | | | | | | | | | | | | | | | | |
| | | (bpd) | |
| | | | | | | | | | | | | | | | | | | | | | | | | | | | |
| Barrancabermeja | | | 250,000 | | | | 225,259 | | | | 90 | % | | | 250,000 | | | | 216,970 | | | | 87 | % | | | 250,000 | | | | 232,052 | | | | 93 | % |
| Reficar | | | 80,000 | | | | 67,674 | | | | 84 | % | | | 80,000 | | | | 78,920 | | | | 99 | % | | | 80,000 | | | | 78,028 | | | | 98 | % |
| Apiay | | | 2,500 | | | | 1,631 | | | | 65 | % | | | 2,500 | | | | 1,525 | | | | 61 | % | | | 2,500 | | | | 1,314 | | | | 53 | % |
| Orito | | | 2,500 | | | | 1,480 | | | | 59 | % | | | 2,500 | | | | 1,495 | | | | 60 | % | | | 2,500 | | | | 1,176 | | | | 47 | % |
| Total | | | 335,000 | | | | 296,044 | | | | 88 | % | | | 335,000 | | | | 298,910 | | | | 89 | % | | | 335,000 | | | | 312,570 | | | | 93 | % |
The average conversion ratio for Barrancabermeja and Reficar during 2010 was 78.0%. In 2010, these two refineries supplied the local demand for fuels and produced a surplus of certain refined products for export. Over the last three years, we have maintained the conversion ratios of these two refineries at similar rates: 78.0% in 2010, 79.3% in 2009 and 78.1% in 2008.
The gross refining margin increased from US$4.41 per barrel in 2009 to US$7.70 per barrel in 2010 for Barrancabermeja and Reficar mainly due to better margins in “crack spread” (difference between the prices of refined products and the prices of crude oil), and lower feed cost that resulted from maximizing heavy and sour crude feedstock in both refineries, especially in Barrancabermeja with the start up of the Diesel and gasoline Hydrotreating Units.
Barrancabermeja
At Barrancabermeja, we produce a variety of fuels, such as regular and premium unleaded gasoline, diesel fuel, kerosene, jet fuel, aviation fuel, LPG, fuel oil and sulfur. We also produce petrochemicals, including, paraffin waxes, lube base oils, low-density polyethylene, aromatics, asphalts, alkylates, cyclohexane and aliphatic solvents, and refinery grade propylene.
Barrancabermeja is currently undergoing a modernization process to convert it into a deep conversion refinery, allowing it to process heavy and extra-heavy crudes produced at local fields and increase production of mid-distillates for the local market, as well as to produce fuels that meet international sulfur content standards. This project is expected to be in operation by 2015.
The following table sets forth the production of refined products of Barrancabermeja for the years ended December 31, 2010, 2009 and 2008.
| | | For the year ended December 31, | |
| | | | | | | | | | |
| | | (bpd) | |
| LPG, propylene and Butane | | | 15,140 | | | | 17,122 | | | | 18,227 | |
| Gasoline Fuels and naphtha | | | 76,542 | | | | 75,174 | | | | 77,110 | |
| Diesel | | | 52,801 | | | | 52,413 | | | | 60,633 | |
| Jet Fuel and Kerosene | | | 18,324 | | | | 15,375 | | | | 15,861 | |
| Fuel Oil | | | 49,570 | | | | 44,390 | | | | 48,747 | |
| Lube Base Oils and Waxes | | | 2,216 | | | | 2,288 | | | | 2,031 | |
| Aromatics and solvents | | | 2,739 | | | | 3,301 | | | | 2,893 | |
| Asphalts and Aromatic Tar | | | 6,759 | | | | 7,547 | | | | 6,862 | |
| Intermediates | | | 707 | | | | 881 | | | | 998 | |
| Total | | | 224,799 | | | | 218,491 | | | | 233,363 | |
| Difference between Inventory of Intermediate Products | | | 716 | | | | 236 | | | | 1,897 | |
| Total Production | | | 225,515 | | | | 218,727 | | | | 235,259 | |
During 2010, we commissioned the Fuels Hydrotreatment Plant at Barrancabermeja, which is currently producing 60,000 bpd of hydrotreated gasoline (of 300 parts per million sulfur content) and 56,000 bpd of hydrotreated diesel (of 50 parts per million sulfur content) to meet existing fuel quality standards and to improve the refining margin.
Reficar
As part of our Strategic Plan, we expect to increase the competitiveness and profitability of Reficar through the modernization of its facilities and processes and improve the reliability of its units. We plan to increase the refinery’s production capacity to 165 thousand bpd by 2013 and improve refining margins by processing cheaper heavy crude oils, raising the conversion ratio, and producing a higher quality product slate. We also expect to satisfy existing environmental regulations for fuels by reducing sulfur content in gasoline and diesel fuel, thus complying with national and international fuel standards.
The following table sets forth the production of refined products of Reficar for the years ended December 31, 2010, 2009 and 2008.
| | | For the year ended December 31,(1) | |
| | | | | | | | | | |
| | | (bpd) | |
| LPG, Propylene and Butane | | | 4,056 | | | | 5,255 | | | | 4,869 | |
| Motor Fuels | | | 23,826 | | | | 26,847 | | | | 24,577 | |
| Diesel | | | 16,516 | | | | 20,742 | | | | 20,260 | |
| Jet Fuel and Kerosene | | | 6,252 | | | | 8,098 | | | | 6,969 | |
| Fuel Oil | | | 14,907 | | | | 16,710 | | | | 18,495 | |
| Aromatic Tar | | | 1,252 | | | | 945 | | | | 820 | |
| Other Products | | | 42 | | | | 40 | | | | 33 | |
| Total | | | 66,852 | | | | 78,636 | | | | 76,024 | |
| Difference between Inventory of Intermediate Products | | | 1,722 | | | | 1,619 | | | | 2,176 | |
| Total Production | | | 68,573 | | | | 80,255 | | | | 78,200 | |
| (1) | The table shows the entire production of Reficar. |
In 2010, production by Reficar was 67.0 thousand bpd, a decrease compared with 80.3 thousand bpd in 2009 due to unplanned production stoppages in October and November associated with the maintenance of the crude and visbreaker units, and a technical stoppage in the cracking unit, respectively.
In addition to our product slate, in 2009 we have started to purchase low-sulfur diesel and biodiesel to improve the quality of the diesel produced at Barrancabermeja and Reficar. Reficar is currently purchasing biodiesel fuel in the local market and mixing it with its production of diesel to reduce sulfur content to meet local specifications.
Petrochemicals and other products
We own and operate four petrochemical plants located within Barrancabermeja, producing a variety of products including aromatics, cyclohexane, paraffin waxes, lube base oils, polyethylene and solvents.
In 2008, we invested US$54 million to improve our polyethylene production capacity in the Barrancabermeja refinery. As a result of this investment, during 2009, we increased our low-density polyethylene production capacity at Barrancabermeja by 10,695 tons per year, representing an increase of 19%. In 2010, our production of low density polyethylene was 33,705 tons.
Propilco
The following table sets forth Propilco’s average capacity and throughput for each of the last three years.
| | | For the year ended December 31, | |
| | | | | | | | | | |
| | | | | | (Metric Tons) | | | | |
| | | | | | | | | | |
| Average capacity | | | 475,278 | | | | 455,000 | | | | 405,000 | |
| Throughput | | | 407,411 | | | | 384,858 | | | | 383,874 | |
| % Use | | | 86 | % | | | 85 | % | | | 95 | % |
During 2010, Propilco’s production totaled 403 thousand tons of petrochemical products, a 3.3% and 6.6% increase when compared to the 390 thousand tons produced in 2009 and 378 thousand tons in 2008, respectively. The gross margin in 2010 was 7.32% higher than in 2009, an increase from US$232 in 2009 to US$249 per ton in 2010. In the last quarter of 2010, we expanded Propilco’s production facilities to increase its production capacity to 500 thousand tons.
Transportation
Summary
Our transportation segment includes the transportation of crude oil, motor fuels, fuel oil and other refined products, excluding natural gas due to legal restrictions. Beginning in 2009, our transportation segment also includes the transportation of the mixture of diesel and palm oil.
At December 31, 2010, we, directly or in joint venture with private sector participants, owned, operated and maintained an extensive network of crude oil and refined products pipelines connecting our and third-party production centers and terminals to refineries, major distribution points and export facilities. We directly own 45% of the total crude oil pipeline shipping capacity and 99% of the total product pipeline shipping capacity in Colombia. When aggregated with the crude oil pipelines in which we own an interest, we have 77% of the oil pipeline shipping capacity in Colombia.
At December 31, 2010, our network of crude oil and multi-purpose pipelines extended approximately 8,591 kilometers in length. The transportation network we own directly and in partnership with our joint venture partners consists of approximately 5,182 kilometers of main crude oil pipeline networks connecting various fields to the Barrancabermeja refinery and Reficar, as well as to export facilities. We directly own 3,003 kilometers of crude oil pipeline and an additional 2,178 kilometers of crude oil pipeline with our business partners. We also own 3,017 kilometers of multi-purpose pipelines for transportation of refined products from the Barrancabermeja refinery and from Reficar to wholesale distribution points, a decrease of approximately 600 kilometers over the total length of pipelines calculated in 2009 mainly due to the conversion of the Ayacucho – Galán (8”) product line to a crude oil line and the obsolescence in the use of the Ayacucho – Coveñas (12’’) line.
During 2010, we met our customer satisfaction index goal, and we maintained our ISO 9001:2008, ISO 14001 and OHSAS 18001 certifications for all of our transportation processes, which provide standards for hydrocarbons reception, storage, dispatch by pipes and pipelines and the import and export facilities of our docks.
We are currently developing our transportation infrastructure in order to meet our increased transportation needs in Colombia and any additional needs which may result from new discoveries.
The map below shows the main transportation networks owned by our business partners and us.
TRANSPORTATION INFRASTRUCTURE
Pipelines
In 2010, pipelines in which we own an interest transported a total of 770.9 thousand bpd of crude oil and 264.9 thousand bpd of refined products for a total of 1.03 million bpd in 2010, a 29.6% increase when compared to 2009. In 2009 pipelines transported a total of 799.5 thousand bpd of crude oil and refined products compared to 751.8 thousand bpd in 2008.
The following table sets forth our main pipelines and the main pipelines in which we own an interest by name, kilometers covered, type of product transported, origin, destination and our ownership percentage as of December 31, 2010.
| | | | | | | | | | | |
| | | | | | | | | | | | |
| Caño Limón-Coveñas | | | 770.6 | | Crude Oil | | Caño Limón | | Coveñas | | | 100.00 | % |
| Oleoducto del Alto Magdalena | | | 396.5 | | Crude Oil | | Tenay | | Vasconia | | | 85.12 | % |
| Oleoducto de Colombia (ODC) | | | 480.8 | | Crude Oil | | Vasconia | | Coveñas | | | 65.57 | %(2) |
| Oleoducto Central (Ocensa) | | | 834.5 | | Crude Oil | | Cupiagua | | Coveñas | | | 60.00 | %(2) |
| Oleoducto Transandino | | | 304.9 | | Crude Oil | | Southern fields | | Tumaco Port | | | 100.00 | % |
| Oleoducto de los Llanos (ODL) | | | 262.0 | | Crude Oil | | East fields | | Monterrey Cusiana | | | 65.00 | % |
Oleoducto Bicentenario de Colombia(1) | | | – | | Crude Oil | | Araguaney | | Banadia | | | 55.97 | % |
| | (1) | Oleoducto Bicentenario de Colombia was incorporated by us in late 2010. The construction of Phase 1 and the entry into operation is planned for late 2011. |
| | (2) | Since January 2011, our participation in the ownership of Ocensa and ODC increased to 72.5% and 73%, respectively, after acquisition of 51% of BP Exploration Company Limited (now Equion Energia Limited). |
During the second half of 2010, Oleoducto Bicentenario de Colombia was incorporated by us, with a 55% interest, and six other companies. This crude oil pipeline is expected to permit the evacuation of 120,000 bpd when its first phase, the line connecting Araguaney to Banadía, has been finished.
The pipeline will be the largest of its kind in Colombia and will be developed in four phases. The first phase, which will join the Araguaney station in Casanare with Banadia in Arauca, will comprise an investment of US$1.03 billion, of which 70% will come from a credit facility to be capitalized by the seven shareholders and 30% from equity contributions. The total pipeline investment is estimated to be US$4.2 billion and all phases are expected to be completed by the second half of 2014.
Within our strategy of crude oil infrastructure growth, in January 2011 we and Talisman completed the acquisition of 51% of BP Exploration Company Limited that increased our interest in Ocensa by 12.6%, ODC by 7.4% and the Oleoducto del Alto Magdalena (OAM) asset by 2.16%.
The operation of our pipelines follows international standards and industry practices, such as remote operation, integral management, automatic ticket transfer, health, safety and environmental policies and a high customer satisfaction index.
The table below sets forth the volumes of crude oil and refined products transported through the crude oil pipelines and multipurpose pipelines owned by us.
| | | For the year ended December 31, | |
| | | | | | | | | | |
| | | (thousand bpd) | |
| Crude oil transport | | | 770.9 | | | | 576.2 | | | | 542.3 | |
| Refined products transport | | | 264.9 | | | | 223.3 | | | | 209.5 | |
| Total | | | 1,035.8 | | | | 799.5 | | | | 751.8 | |
At December 31, 2010, we owned 58 stations, 23 of them located in crude oil pipelines and 35 of them in refined products pipelines with a nominal storage capacity of 19 million barrels of crude oil and 6 million barrels of refined products. We also sell storage capacity to third parties in our Pozos Colorados and Mansilla facilities and in the Coveñas port. We do not own any tankers.
Theft of hydrocarbons
Hydrocarbon theft, which reached a peak of 7,270 bpd in 2002, was reduced to 132 bpd in 2010, as a result of the comprehensive strategy developed in coordination with different law-enforcement agencies and governmental authorities. Theft of fuel in 2010, when compared to 2009, was reduced by 32.6% and 98% when compared to 2002. We continue to evaluate alternatives to improve the efficiency of our transportation system, including improvements to the monitoring and control systems through new supervisory activities and data collection systems.
Other transportation facilities
We also enter into transportation agreements with tanker trucks and barge companies to transport crude oil from production locations that currently do not have pipeline connection to the refineries and our export facilities. Production of refined products for which we currently have no pipeline capacity and cannot be transported in the tanker trucks is transported by barges. During 2010, 22.4 million barrels of crude oil and refined products were transported by tanker trucks and 7.34 million barrels of crude oil and refined products were transported by barges.
Export and import facilities
We currently own five docks for export of crude oil and refined products. Our crude oil loading facilities can load tankers of up to 145 thousand deadweight tonnage (DWT). Adjacent to these loading facilities we also have crude oil storage facilities which are capable of storing 7.5 million barrels. Our docks used for import and export of refined products can load tankers of up to 70 thousand DWT. Additionally, these facilities have storage capacity of up to 1 million barrels.
New transportation projects
Oil Evacuation Program
In 2010, we enhanced the strategy to evacuate the oil production through the 2010-2013 Oil Evacuation Program in which short, medium and long-term projects were structured to develop the required infrastructure to increase oil transportation capacity up to 1.4 million bpd, based on the production forecasts calculated from data provided by the Colombian oil producers. Some of the projects that are part of this program completed during 2010 include:
| | · | increasing the capacity of the Castilla-Apiay, Apiay-Monterrey, Caño Limón-Coveñas, Ayacucho-Coveñas, Araguaney-Porvenir, Monterrey-Porvenir, Vasconia-Barrancabermeja pipelines, and the second and third segments of Ocensa; |
| | · | mechanic finishing of the El Viento-Cusiana (ODL) pipeline (24”); |
| | · | increasing the export capacity in the Coveñas Port; and |
| | · | increasing the storage capacity in Vasconia and Altos del Porvenir. |
Increase the capacity of the Pozos Colorados-Galán multi-purpose pipeline
We increased pumping capacity of the Pozos Colorados-Galán multi-purpose pipeline by connecting and commencing the operation of 87 km of product pipeline that was replaced in the Ayacucho area, as well as the initiation of the installation of the underwater line in Pozos Colorados. Through this expansion, we aim to (i) increase our multi-purpose transportation capacity to 60 bpd and (ii) transport imported diluents and diesel to the Barrancabermeja refinery.
Heavy Crude Oil Castilla Pipeline Project
We completed 80 km of construction of the multipurpose pipeline with respect to the 132 km planned from the Sutamarchán pumping station to El Porvenir. We also obtained the required approvals from different government entities for this project.
New Business Development
We completed a number of significant deals in 2010, including, among others, an agreement with Oleoducto de los Llanos (ODL) for the operation and maintenance of the pipeline between the Rubiales and Monterrey stations.
Marketing and Supply
Summary
We market a full range of refined and feed stock products locally including regular and high octane gasoline, diesel fuel, jet fuel, natural gas and petrochemical products. Local sales of regular gasoline, LPG, jet fuel and diesel fuel as well as natural gas from the Guajira field are subject to Government price regulation with reference to international benchmarks for fuel oil.
We are the main producer and supplier of fuel and refined products in Colombia. For regulated products, the Ministry of Mines and Energy establishes maximum prices producers can charge and retail prices for these products pursuant to resolutions. The Ministry also establishes maximum wholesale and retail margins. In terms of LPG, the Energy and Gas Regulatory Commission establishes maximum prices as well as wholesale and retail margins.
Our crude oil export sales are made in the spot market and through long-term contracts, primarily to U.S. Gulf Coast refineries, the U.S. West Coast, Caribbean and Chinese refineries.
Crude oil supply commitments
As part of our transfer of assets to Reficar in April 2007, we extended a commercial offer to Reficar for the supply of crude oil. The commercial offer has been periodically renewed and it is still in effect. Pursuant to the terms of the offer, Reficar has the option to purchase from us up to 85 thousand bpd of crude oil from our Caño Limón, Vasconia Blend, Cusiana and Castilla production. As we continue to operate Reficar, our operations committee evaluates and decides on a monthly basis the refinery’s crude oil mix needs, including the need for foreign crudes which we may import to meet our commitments. The purchase price for the delivered volumes is equal to an international benchmark index, subject to certain adjustments.
Import of Ultra Low Sulfur Diesel Fuels and Diluents
We are reducing sulfur emissions from fuels produced by us through the import of ultra low sulfur diesel to be mixed with our local production in order to protect the environment. Since July 2008 (the date we began to import this ultra low sulfur diesel) through December 2010, we managed to keep sulfur diesel levels under 50 ppm (parts per million) in Bogota and reduced sulfur diesel levels from 2,500 ppm to 500 ppm in the rest of the country. We expect that the quality of our diesel (sulfur levels) will continue to improve in 2011 according to our results and international standards.
We have also increased imports of natural gasoline, used as a diluent to allow our heavy crudes to be pumped through the pipelines. In 2010, we imported 18.3 thousand bpd of natural gasoline and 30.9 thousand bpd between January and March 2011.
Natural Gas Distribution
Summary
Development of natural gas reserves began in the 1970s with the discovery of the Guajira fields in the Northeastern region. Additional natural gas reserves were discovered in the Piedemonte Llanero. In Colombia we have been selling natural gas to local distribution companies, power generators and large customers and have also been exporting natural gas to Venezuela. In 1986, we introduced a program known as “Natural Gas for Change,” which sought to increase local consumption. In 1993, the Government developed a regulatory framework for the distribution and marketing of natural gas. Between 1995 and 1997, we connected our natural gas production fields with distribution points and major cities. In 1997, we transferred all of our natural gas transportation assets to a newly created company, Empresa Colombiana de Gas, or Ecogas. Ecogas had spun off from us in 1998. Thereafter, Ecogas transferred all of its assets to a new company, incorporated for such purpose, named Transportadora de Gas Internacional S.A. E.S.P., or TGI, formerly, Transportadora de Gas del Interior S.A.E.S.P., which is owned by Empresa de Energía Eléctrica de Bogotá.
Marketing of Natural Gas
Currently, there are more than 20 natural gas distribution companies with operations in Colombia. As a result of the growth of the natural gas demand from Venezuela and the increase in the domestic consumption of the gas-power plants in recent years, the total demand for natural gas, including natural gas exports, has increased by 2.5% in 2010 to 1.061 giga British thermal units per day (gbtud), from 1,035.1 gbtud in 2009 and by 17% from 907 gbtud in 2008. We sell natural gas to distribution companies through take-or-pay or swing contracts.
Compressed Natural Gas
Demand for compressed natural gas increased by 5.95% in 2010 as compared to 2009 as a result of (i) an increase in natural gas price competitiveness against gasoline prices, (ii) an increase in the benefit/cost ratio due to lower costs associated with new conversion technologies and (iii) better supply in principal cities.
During 2010, we signed two new agreements for the supply of compressed natural gas in (i) Bogotá and Medellin and (ii) in the Coffee Region. In 2010, 22,151 vehicles in Colombia were converted to utilize natural gas, for a total of 324,134 natural gas vehicles converted by the end of 2010.
Natural gas sales to the power and industrial sector
We market and sell natural gas to the industrial sector and to gas-fired and combined cycle power plants. We have a number of long-term supply contracts with power generators under which such companies have entered into take-or-pay contracts and purchase and supply obligations for the supply of natural gas. Pursuant to the terms of these agreements if we do not ship the contracted natural gas amounts we must pay a fine to our customers. Long-term supply contracts establish a pricing formula that depends on international reference prices.
We have subscribed long-term take or pay contracts for eight of the 14 gas-fired and combined cycle power plants. During 2010, gas sales increased in the industrial sector due to the South Pacific natural weather phenomenon known as “El Niño.”
The following table sets forth our local deliveries of natural gas including deliveries to our refineries, during 2010, 2009 and 2008.
| | | For the year ended December 31, | |
| | | | | | | | | | |
| | | (gbtud) | |
| Gas-fired power plants | | | 158.8 | | | | 153.7 | | | | 73.5 | |
| Refineries | | | 98.5 | | | | 87.2 | | | | 88.3 | |
| Petrochemical | | | 3.7 | | | | 3.1 | | | | 4.2 | |
| Industrial | | | 67.8 | | | | 65.7 | | | | 64.7 | |
Distributors(1) | | | 167.6 | | | | 172.2 | | | | 192.2 | |
| Compressed Natural Gas | | | 41.9 | | | | 36.2 | | | | 31.6 | |
Producers(2) | | | 106.5 | | | | 30.3 | | | | 36.1 | |
| Total Deliveries | | | 644.9 | | | | 548.4 | | | | 490.5 | |
| (1) | Deliveries to distributors include deliveries to industrial clients who are required to purchase natural gas from distributors. |
| (2) | In 2010, agreements with producers for local deliveries of natural gas increased principally due to sales to PDVSA Gas and sales of non-firm gas through the producer agreement with Chevron between January and September 2010. |
Natural Gas Exports
In 2007, we and Chevron entered into a long-term natural gas supply contract with PDVSA through the end of 2011. Pursuant to the terms of the agreement, we have agreed to deliver the following quantities of natural gas to Venezuela:
| | | For the year ended December 31, | |
| | | | | | | | | | | | | |
| | | (gbtud) | |
| Volume commitments | | | 50 | | | | 150 | | | | 150 | | | | 100 | |
In 2010, we and our partner Chevron delivered 154.9 gbtud, exceeding the quantity of natural gas we agreed to supply in our gas export contract with PDVSA. In 2009 and 2008, we and Chevron delivered 179.1 gbtud and 146.9 gbtud respectively. Of the total volume of gas delivered in 2010, 57% came from us and 43% came from Chevron.
Natural gas delivery commitments
The table below sets forth the commitments we have in firm contracts with local natural gas distribution companies, local industries, gas fired power generators, international companies, including PDVSA in Venezuela, and internal agreements with our refineries and fields:
| | | For the year ended December 31, | |
| | | | | | | | | | | | | | | | | | | | | | |
| | | (gbtud) | |
Volume Commitments(1) | | | 730 | | | | 373 | | | | 271 | | | | 324 | | | | 271 | | | | 256 | | | | 257 | |
| (1) | Includes royalty volumes that are managed by Ecopetrol through 2011. |
We have natural gas delivery commitments with local natural gas distribution companies, local industry, gas-fired power generators, international companies (PDVSA) and internal agreements with refineries and fields. Pursuant to long-term supply contracts and other agreements, we must supply natural gas to these parties, and failure to deliver the agreed amounts could result in penalties under the contracts. In 2010, Ecopetrol S.A. had to pay Ps$85.2 billion in compensation for non-delivery of natural gas resulting from weather disruptions associated with the El Niño phenomenon. In order to meet our natural gas delivery commitments, we have four main natural gas production fields, the Guajira fields, the Cusiana and Cupiagua fields, the Piedemonte fields and the Gibraltar fields. The Guajira, Cusiana and Cupiagua and Piedemonte fields are productive fields. The Gibraltar field has production capacity and is expected to begin production in the second half 2011 as the pipeline between Gibraltar to Bucaramanga is finished by Transoriente, which is building the pipeline. Of our total natural gas production at December 31, 2010, 66.3% was supplied by the Guajira production, 22.6% from the Cusiana and Cupiagua fields and the remaining 5.1% from fields located in other regions. Our participation in the Colombian natural gas market in 2010, including export volumes, was 64.5 %, a slight increase compared with a 64.4% market participation in 2009.
The following table sets forth the estimated production of our productive fields which is available to meet our firm delivery commitments of natural gas for the years ended December 31, 2011 to 2015.
| | | For the year ended December 31, | |
| | | | | | | | | | | | | | | | |
| | | (gbtud) | |
| Guajira Fields | | | 450.0 | | | | 409.5 | | | | 347.7 | | | | 315.0 | | | | 274.8 | |
| Cusiana and Cupiagua Fields | | | 243.2 | | | | 190.1 | | | | 190.1 | | | | 190.1 | | | | 176.9 | |
| Other Fields | | | 74.2 | | | | 63.9 | | | | 60.5 | | | | 55.6 | | | | 52.4 | |
| Imports | | | 0.0 | | | | 39.0 | | | | 85.0 | | | | 127.0 | | | | 144 | |
| Total | | | 767.38 | | | | 702.46 | | | | 683.31 | | | | 687.74 | | | | 648.1 | |
Price controls on the La Guajira natural gas production
The Ministry of Mines and Energy through the Colombian Commission for the Regulation of Energy and Gas, or CREG, establishes the maximum price we are allowed to charge customers that consume less than 100 thousand cfpd from La Guajira field under take-or-pay contracts. Maximum prices we can charge to these “regulated customers” are determined with reference to the average export price for fuel oil for the prior six months.
Priorities for delivery of natural gas
The Ministry of Mines and Energy established distribution priorities in the event of a shortfall of reserves or production of natural gas. Residential consumers with existing supply contracts, small businesses and distributors of compressed natural gas have the first priority for delivery. Contracts for export of natural gas have the same priority under the firm commitments as other users such as industrial consumers and power generators. The agreements that are not firm commitments and contemplate delivery of natural gas “as available” have priority over customers on the spot market. We may enter into natural gas export contracts if the ratio of reserves to production exceeds seven years.
The Ministry of Mines and Energy also establishes distribution priorities in the event of a natural gas shortfall derived from supply or infrastructure issues. This order of priority is based on the type of contract, with firm supply contracts having priority over swing supply contracts.
Regulation
The principal authorities that regulate our activities in Colombia are the Ministry of Mines and Energy, the National Hydrocarbons Agency, or ANH, and the Regulatory Commission of Energy and Gas, or CREG.
Ministry of Mines and Energy
The Ministry of Mines and Energy is responsible for managing and regulating Colombia’s nonrenewable natural resources assuring their optimal utilization by defining and adopting national policies regarding exploration, production, transportation, refining and distribution of minerals and hydrocarbons.
National Hydrocarbons Agency – ANH
The ANH was created in 2003 and is responsible for the administration of Colombia’s hydrocarbon reserves. The ANH’s objective is to manage the hydrocarbon reserves owned by the Nation through the design, promotion and negotiation of the exploration and production agreements in areas where hydrocarbons are found. The ANH is also responsible for creating and maintaining attractive conditions for private investments in the hydrocarbon sector and for designing bidding rounds for exploration blocks.
CREG
Laws 142 and 143 of 1994 created the CREG, a special administrative unit of the Ministry of Mines and Energy, responsible for regulating and establishing the standards for the exploitation and use of energy and natural gas, fostering the development of the energy services industry, promoting competition and responding to consumer and industry needs.
Control Entities
Superintendency of Domiciliary Public Services
Under Colombian regulations, the distribution and marketing of natural gas is considered a public service. As such, this activity is regulated by Law 142 of 1994 and supervised by the Superintendency of Domiciliary Public Services.
Superintendency of Corporations
We are subject to the supervision of the Superintendency of Corporations, the governmental body responsible for supervising corporations domiciled in Colombia.
Superintendency of Finance
The Superintendency of Finance is responsible for monitoring, promoting and regulating the publicly traded securities market, registered issuers, broker-dealers, mutual funds and any other participants in the public market including the BVC.
We are a registered issuer and our debt and equity securities are publicly traded. The Superintendency of Finance is responsible for the supervision of any activity we undertake that may affect the market for our securities. We are required to inform the Superintendency of Finance of any material event and provide periodic reports of our financial condition.
Superintendency of Ports and Transport
The Superintendency of Ports and Transport has exclusive control and regulates us in matters related to ports concession contracts, in which we act as contractor.
National Superintendency of Health
Since we provide health benefits to our employees and their families, the National Superintendency of Health has exclusive control and regulates us in matters related to the inspection, supervision and control of the Social Security Health System.
Hydrocarbon Resources Administrator
National Hydrocarbons Agency – ANH
Any oil company selected by the ANH to explore a specific block must execute an exploration and production contract with the ANH. All royalty payments in connection with the production of hydrocarbons are made to the ANH in-kind unless the ANH grants a specific waiver to make royalty payments in cash. Any oil company working in Colombia, must present to the ANH periodical reports on the evolution of their exploratory and production activities.
Regulatory Framework
Regulation of Exploration and Production Activities
Pursuant to Colombian law, the Nation is the exclusive owner of all hydrocarbon resources located in Colombia and has full authority to determine the rights, royalties or compensation to be paid by private investors for the exploration or production of any hydrocarbon reserves. The Ministry of Mines and Energy is the authority responsible for regulating all activities related to the exploration and production of hydrocarbons in Colombia.
Decree Law 1056 of 1953, or the Petroleum Code, establishes the general procedures and requirements that must be completed by a private investor prior to commencing hydrocarbon exploration or production activities. The Petroleum Code sets forth general guidelines, obligations and disclosure procedures that need to be followed during the performance of these activities.
Prior to 2003, all activities regarding the exploration and production of hydrocarbons were governed by Decree 231 of 1974. Consequently, during such period all of our activities were outlined and regulated by this decree. Decree 231 was replaced by Decree Law 1760 of 2003, but all agreements entered into by us prior to 2003 with other oil companies are still regulated by Decree 2310.
Decree Law 1760 of 2003 introduced Colombia’s new contractual regime for hydrocarbons and granted the ANH full and exclusive authority to regulate and oversee the exploration and production of hydrocarbon reserves. Decree Law 1760 was complemented by Decree 2288 of 2004, which regulates all aspects related to the reversion of reserves and infrastructure under the joint venture agreements executed by us before 2004. Accord 008 of 2004 issued by the Directive Council of the ANH sets forth the necessary steps for entering into exploration and production contracts with the ANH. Resolution 18-1495 of 2009 establishes a series of regulations regarding hydrocarbon exploration and production.
Pursuant to Colombian law we are obligated to pay a percentage of our production to the ANH as royalties. Each production contract has its own royalty arrangement. In 1999, a modification to the royalty system established a sliding scale for royalty payments linked to the production level of crude oil and natural gas fields discovered after July 29, 1999, whether the production is crude oil or natural gas, and the quality of the crude oil produced. Since 2002 the royalties system has ranged from 8% for fields producing up to 5,000 bpd to 25% for fields producing in excess of 600,000 bpd. Changes in royalty programs only apply to new discoveries and do not alter for fields already in their production stage. Producing fields pay royalties in accordance with the applicable royalty program at the time of the discovery. Our contracts specify that royalties are to be paid in physical product (oil and gas) to the ANH.
We currently purchase all physical product delivered by producers of crude oil and natural gas as royalty payments to the ANH at prices set forth in Law 756 of 2002 and Resolution 18-1709 of 2003. The purchase price is calculated on a reference price for crude oil and natural gas at the wellhead and varies depending on prevailing international prices. We have an interagency agreement, or Convenio, with the ANH, whereby we collect all in kind and cash royalties owed to the ANH by the oil and gas companies in Colombia. The ANH may extend offers to sell such physical product and we, at our option, may accept such offers to purchase the royalty volume. We sell the physical product purchased from the ANH as part of our ordinary business.
Regulation of Refining and Petrochemical Activities
Refining and petrochemical activities are considered a public utility activity and are subject to governmental regulation. Article 58 of the Petroleum Code establishes that oil refining activities can be developed throughout Colombia. Oil refineries must comply with the technical characteristics and requirements established by the existing regulations.
The Ministry of Mines and Energy is responsible for regulating, supervising and overseeing all activities related to the refining of crude oil, import of refined products, storage, transport and distribution.
Decree 2657 of 1964 regulated the oil refining activities and created the Oil Refining Planning Committee which is responsible for studying industry problems and implementing short and long-term refining planning policies. The Committee is also responsible for evaluating and reviewing new refining projects or expansion of existing infrastructure. Prior to deciding on a new project, the Committee must take into account the significance of the project and the economic impact, the sources of financing, profitability, social contribution, the effects on Colombia’s balance of payments and the price structure of the refined products.
Pursuant to Resolution 18-0966 of 2006 issued by the Ministry of Mines and Energy and Article 58 of the Petroleum Code, any refining company operating in Colombia must provide a portion or, if needed, the total of its production to supply local demand prior to exporting any production. If the regulated production income, the principal item in the price formula, becomes lower than the export parity price, the price paid for the refined products will be equivalent to the price for those products in the U.S. Gulf Coast market. If there is a need of local demand for imported crudes, the refining company may charge additional transportation costs in proportion to the crudes delivered to the refinery.
The Ministry of Mines and Energy establishes the safety standards for LPG, storage equipment, maintenance and distribution. Regulations issued in 1992 established that every local, commercial and industrial facility with a storage capacity of LPG greater than 420 pounds must receive an authorization for operations from the General of Hydrocarbons of the Ministry of Mines and Energy.
Regulation of Transportation Activities
Hydrocarbon transportation activity is considered a public utility activity in Colombia and therefore is under governmental supervision and control. Transportation and distribution of crude oil, natural gas and refined products must comply with the Petroleum Code.
Notwithstanding the general rules for hydrocarbon transportation in Colombia, natural gas transportation has specific regulations, due to the categorization of natural gas distribution as a public utility activity under Colombian laws. Therefore, natural gas distribution transportation is governed by specific regulation, issued by the CREG, which seeks to primarily satisfy the needs of the population.
Transport systems, classified as crude oil pipelines and multipurpose pipelines, can be owned by private parties. The building, operation and maintenance of pipelines must comply with environmental, social, technical and economic requirements under national and international standards. Transportation networks must follow specific conditions regarding design and specifications, while complying with the quality standards demanded by the oil and gas industry.
According to Law 681 of 2001, multipurpose pipelines owned by us must be open to third-party use and we must offer their capacity on the basis of equal access to all.
Hydrocarbon transport activity may be developed by third parties and must meet all requirements established by law.
The Ministry of Mines and Energy is responsible for:
| | · | studying and approving the design and blueprints of all pipelines; |
| | · | mediation of rates between parties or establishing the hydrocarbon transport rates based on information furnished by the service provider; |
| | · | issuing hydrocarbon transport regulations; |
| | · | verifying the calculation and payment of transport-related taxes; and |
| | · | managing the information system for the oil product distribution chain. |
The construction of transportation systems requires Government licenses and local permits awarded by the Ministry of the Environment as well as licenses from the regional environmental authorities.
Regulation on selling, distributing, transporting and marketing of natural gas
The Colombian natural gas market is divided into two types of markets: (i) the regulated price market and (ii) the free price market. Colombian regulation has established that natural gas sold from Guajira Field must be sold under a regulated price, calculated using by a specific formula included in CREG Resolution 119 of 2005. Currently, other fields that produce natural gas are able to determine the price to be offered to the market. Colombian regulation provides that producers, distributors, non-regulated consumers (consumers that burn or use more than 100,000 cfpd.) and marketers are able to commercialize natural gas in the Colombian market. The distribution of natural gas and its by-products is considered a public utility activity and therefore is subject to Government regulation. Notwithstanding that transportation and marketing of natural gas is not classified as a public utility activity, they are considered complementary activities to the distribution service and therefore, are also governed by Law 142 of 1994. In addition, each of these activities is governed by specific regulations established by the CREG and the Ministry of Mines and Energy.
CREG’s Resolution 057 of 1996 delineates and separates the different activities related to the natural gas market. It defines transportation as an independent activity. As such, transporters of natural gas are not allowed to (i) perform production, commercialization or distribution activities or (ii) participate in companies whose main purpose is to perform one of these activities. Transporters also cannot have an economic interest in electricity generating companies.
Decree 2730 of 2010, amended by Decree 2807 of 2010, restructured the Colombian gas market. These Decrees establish that producers that intend to sell natural gas in Colombia are divided in two main groups: (i) producers that exploit and develop fields that are able to produce in excess of 50 mcfpd of natural gas, and (ii) producers that exploit and develop fields that produce less than 50 mcfpd of natural gas. The first group of producers must offer the natural gas produced to the market through an auction process. The second group of producers may offer and negotiate sales of natural gas produced under the conditions that such producers determine, so long as they comply with the existing natural gas marketing regulation.
The CREG will design the auction process, including the guidelines for these auctions, set forth by Decree 2730 of 2010 and its amendments. Until final rules are issued, producers must apply the existing regulation related to sales of natural gas, including Decrees 2687, 2670 of 2008 and Resolution 095 of 2008, issued by the CREG.
CREG Resolution 093 of 2006, as modified by CREG Resolution 095 of 2008, establishes that partners to a natural gas field are not allowed to jointly commercialize their product without the prior authorization of the CREG, except for commercialization in the form of auctions by the seller.
The CREG also regulates the type of agreements that can be used for the marketing, production, distribution and transportation of natural gas. CREG’s Resolutions 070 of 2006 and 095 of 2008, as amended, provide three types of contracts that can be used:
| | · | Take-or-Pay Agreements. The buyer agrees to purchase a specific amount or percentage of production of natural gas and the producer guarantees the availability of 100% of the agreed amount. If the buyer does not have a need for the natural gas, the buyer must pay the producer the agreed quantity anyway. |
| | · | Optional Purchase Agreements. The buyer agrees to pay a premium for its right to take a fixed amount of natural gas and agrees to pay an exercise price for the amount of natural gas made available. The producer guarantees to have available 100% of the agreed-on amount. |
| | · | Interruptible Supply Agreements. The parties determine on a daily basis if the quantity of natural gas specified in the agreement is requested and has been supplied. |
Decree 2730 of 2010 provides that the CREG must draft and distribute a model contract for each of the abovementioned agreements, including at least the minimal requirements provided by Decree 2730 of 2010. Until CREG drafts and distributes the model contract, all the agreements executed after the issuance of Decree 2730 of 2010 must be adjusted to meet the conditions established in the applicable model.
The export of natural gas is not considered a public utility activity under Colombian law and therefore is not subject to Law 142 of 1994. Nevertheless, the internal supply of natural gas is a priority for the Colombian Government. This policy is included in Decree 2730 of 2010, providing that in the event the supply of natural gas is reduced or halted as a result of a shortage of this hydrocarbon, the Colombian Government has the right to suspend the supply of natural gas to foreign customers.
Decree 2730 of 2010 establishes the necessary procedure to obtain the authorization of the Colombian Ministry of Mines and Energy to export natural gas to foreign customers. This procedure includes the obligation to file the necessary paperwork by the natural gas producer that intends to export natural gas abroad. The filing is reviewed by a competent authority to determine if the internal demand of natural gas is and will be satisfied. In the event such internal demand is or will not be satisfied, the Colombian authority may deny the authorization to export natural gas.
The Colombian Ministry of Mines and Energy may also intervene in the distribution of gas, as it did during November and December of 2010 when it imposed rationing of the distribution of gas, due, in part, to impact on supply resulting from the activities related to the expansion of the natural gas production capacity at the Cusiana field.
Regulation of selling, distributing, transporting and marketing of liquefied petroleum gas (LPG)
Wholesale marketing, transport, distribution and retail marketing of LPG are mainly regulated by Resolution CREG 074 of 1996, and subsequent resolutions. LPG in Colombia is primarily obtained from our refineries and our own imports. The gas must meet minimum quality standards to be marketed. LPG price is regulated by Resolutions CREG 066 of 2007 and CREG 059 of 2008.
Regulation of sales of liquid fuels
According to section 212 of the Petroleum Code and Law 39 of 1987, distribution of liquid fuels and their derivatives is considered a public utility activity. Consquently, individuals or entities that engage in these activities are subject to regulations issued by the government in the interest of Colombian citizens. The government has the power to determine quality standards, measurement and control of fuel oil and its derivatives, and establish penalties that may apply to dealers who do not observe such rules.
The Ministry of Mines and Energy is the entity that controls and exercises technical supervision over the distribution of liquid fuels derived from petroleum, including the refining, import, storage, transport and distribution in the country. Law 812 of 2003 identified the agents of the supply chain of petroleum-derived liquid fuels.
The distribution of liquid fuels, except liquid gas, is regulated by Decree 4299 of 2005, as modified by Decrees 1333 and 1717 of 2007 and 2008, respectively, which establish the requirements, obligations and penalties applicable to agents of the supply chain of fuel oil and its derivatives, in the distribution, refining, import, storage, wholesale, transport, retail sale and consumption.
Decrees 283 and 1521 of 1990 and 1998, respectively, each with its respective modifications, establish minimum technical requirements for the construction of storage plants and service stations and regulate the distribution of liquid fuels, establishing the minimum requirements for distributors and the activities and types of agreements permitted for these agents. The Ministry of Mines and Energy also regulates the types of liquid fuels that can be sold and purchased and the penalties for noncompliance with governmental regulations.
The Ministry of Mines and Energy fixes the price that we can charge for the sale of gasoline and fuel oil to wholesalers. The Ministry of Mines and Energy issues periodic price adjustments and each municipality imposes additional surcharges applicable to the price.
The price of gasoline and fuel oil is determined taking in account freight costs, volume conversion ratios, import and export tariffs, transportation tariffs and income tax, among others. These items are adjusted periodically depending on the fuel oil and gasoline market. Each municipality may impose additional surcharges depending on economic needs.
The distribution of fuels in areas near Colombian borders is subject to specific regulations that impose stringent control procedures and requirements.
Regulation of biofuel and related activities
The sale and distribution of biofuels is regulated by the Ministry of Mines and Energy. Regulations establish the quality and pricing standards for biofuels and impose minimum requirements for mixing ethanol with gasoline and biodiesel with diesel.
Environmental Matters
Regulation
The Ministry of Environment is the highest environmental authority in Colombia and is in charge of issuing Nation-wide environmental regulations, policies, and programs. At the regional level, regional environmental authorities such as the Corporaciones Autónomas Regionales, are the highest environmental authorities of the region and are in charge of executing and overseeing all regulations, policies and programs issued by the Ministry of Environment.
Law 99 of 1993 imposes on any company, including crude oil and natural gas companies, the obligation to obtain an environmental license prior to undertaking any activity that could negatively impact the environment. Crude oil companies must file an environmental plan with the Ministry of Environment which includes, among others, an environmental impact assessment, and mechanisms established to prevent, mitigate, correct and compensate any activity that may harm the environment. The number of licenses required for a crude oil or natural gas field may vary depending on the particular facts related to the field and the number of wells. In certain cases, the Ministry of Environment will require a license for each well and in other cases will require only one license per field. Obtaining a license may take between 90 and 145 business days depending on whether the Ministry of Environment requires the applicant to file additional information.
The use of natural resources is also regulated. Companies that use large amounts of water for consumption, that discharge industrial wastes into the coastlines or rivers, that exploit forests reserves or that produce atmospheric emissions of gases must obtain a permit from the regional environmental authorities. Decree 1900 of 2006 provides that any company that uses water resources and that requires an environmental license for the use of such resources must assign 1% of its investment to the recovery, conservation, preservation and supervision of the water resources used.
The Ministry of Environment is also responsible for establishing guidelines regarding climate change policies for the hydrocarbon sector in Colombia. We are in compliance with those guidelines. To date, the Ministry of Environment has not proposed any specific steps for the implementation of the Kyoto Accords as regarding our operations. We continously monitor climate change requirements that could be applicable to us.
A company that does not comply with applicable environmental regulations, does not follow the environmental plan filed with the Ministry of Environment or that ignores the requirements imposed by an environmental license may be subject to an administrative procedure initiated by the Ministry of Environment or the regional environmental authorities, as it may be the case, which may result in oral or written warnings, penalties, license revocation or even temporary or permanent suspension of the activity being undertaken.
As of April 30, 2011, we were party to 81 environmental administrative proceedings, of which four were opened during 2011. During 2010, 20 proceedings were opened and 12 proceedings were closed, for which we were subject to monetary fines. It is not possible for us to determine the material effect of the open proceedings. The largest fine imposed in 2010 amounted Ps$ 1,538 million (approximately US$813.3 thousand).
Environmental Practices
We have implemented aggressive environmental practices and standards for all of the activities performed by us and our workforce. During 2010, we invested Ps$988,284 million in environmental programs to increase our environmental compliance levels. These investments include investments made through our business partners in the sum of Ps$60,003 million. Such programs include:
| | · | Compliance. The purpose of this program is to guarantee knowledge, assessment, disclosure and compliance with all laws, regulations and requirements imposed by the Ministry of Environment and other regulatory bodies. We undertake environmental impact assessments and constantly review our environmental plan. |
| | · | Contingency Planning. This program focuses on implementing preventative actions in our operative areas in order to diminish the impact of oil spills and establish the steps that need to be followed in case of an emergency. |
| | · | Eco-Efficiency. This program is designed to minimize the environmental impacts resulting from our (i) use of natural resources through activities such as water uptake and forest exploitation and (ii) waste generation through liquid emissions and the creation of hazardous waste. |
| | · | Biodiversity. This program implements initiatives to preserve endangered species in areas where our activities have strong influence. |
| | · | Environmental Culture. This program seeks to promote an environmental culture in our organization, activities, and daily life. We initiated several environmental campaigns to educate our work force in areas such as occupational health and friendly environmental practices. |
| | · | Alternative Energy Sources. This program is designed to develop alternative energy sources, such as biodiesel and ethanol projects. As of today, we have invested approximately US$50 million in Bioenergy S.A. a company organized in Colombia, of which we currently own 86% of its capital , and which is expected to produce 92.75 million liters per year of ethanol. In 2010, the technology to be used in the plant was selected and the sugarcane plantation has been developed and covers 1,130 hectares. The plant is expected to begin operations during the third quarter of 2012. In addition, Ecodiesel Colombia S.A., a biodiesel plant in Barrancabermeja, of which we currently own 50% of its equity, began commercial operations during the second half of 2010, and it sold 44,000 tons of biodiesel, representing approximately US$48 million in sales in 2010. |
In 2010, an energy consumption analysis was conducted according to ISO 50001-Energy Management Systems in three demonstration areas: Puerto Salgar Pipeline Station, Barrancabermeja Refinery, and Apiay Oil Field. As a result, gap analysis and energy performance indicators were developed in order to accomplish our environmental strategic framework.
We have implemented projects under our Clean Development Mechanism (Mecanismo de Desarrollo Limpio, or MDL). Through MDLs, we can sell certificates corresponding to the production of greenhouse gasses to other countries. The Gibraltar Project (natural gas production) was developed based on this mechanism and we are developing the Atmospheric Emission Management System (Sistema de Gestión de Emisiones Atmosfericas), which is used to measure greenhouse gasses and other gas emissions for managing our emissions. We have also developed the Corporate Guideline for Electrical Safety Practices in order to close gaps and mitigate electrical hazards.
As part of our continued effort to diversify the sources for our energy, in 2010, we built our first vertical axis wind generator to supply the Coveñas seaport energy demands (8 kilo Watts) and initiated solar energy generation for our telecommunications equipment in 21 oil fields and 17 regulating valves in various pipelines. Additionally, two self-generation projects began operations in Tibú and Tello Oil Fields, which led to a decrease of 77 boe daily and US$1.6 million in cost savings. Total energy consumption in 2010 was decreased by 715 boe per day. In 2011, seven energy optimization projects are expected to be established to reduce consumption of an additional 2,349 boe per day.
Finally, two studies were concluded, one of Pipeline Potential Energy in the plants located in Vasconia and Tocancipa, with a generation capacity of 1.5 Megawatts (MW) and the second of Low Enthalpy Geothermal Energy in the Apiay oil field with a projected generation capacity of 250 kW, both in an effort to determine energy usage and minimize energy requirements.
In the case of an oil spill or leak from our operations, we must follow contingency plans in accordance with internal guidelines, and procedures designed in line with our HSE programs in compliance with best practices to prevent oil spill events from happening and to mitigate the environmental impact. In addition, we must comply with Colombian regulation decree 321 of 1999 and the National Contingency Plan, which are a set of guidelines that must be followed by oil and gas companies in Colombia to prevent, and react in case of, operational events that could impact the environment. For offshore joint ventures, the operator partner has the responsibility of designing and implementing remediation plans and procedures to deal with operational emergencies in accordance with best practices and local environmental regulations.
Health, Safety and the Environment
We are devoted to improving our health, safety and the environment, or HSE, practices. We have several programs in place to increase our industrial safety, minimize the number of accidents of our workforce or our contractors and minimize catastrophic incidents. The frequency of accidents taking place within our premises has declined significantly since 2005, to 1.60 accidents per million of hours worked in 2010 from 5.77 accidents per million of hours worked in 2005, representing a 72% reduction. Additionally, since 2009 we are working on “Process Safety Management,” a system aimed at the continuous improvement and minimization of operational incidents, such as fire, explosion, loss of primary containment and multiple fatalities. We also employ Technological Risk Analysis and a System of Command Incidents (SCI) and continue the process of standardization of HSE protocols and procedures, drafting safety manuals, compliance with existing regulations and the study of HSE benchmarks among oil companies. Our HSE programs are comprised of the following six pillars: (i) culture and leadership, (ii) HSE competences in our employees and contractors, (iii) safe design, (iv) safe operation, (v) prevention and response to emergencies and (vi) performance and audits.
In the area of occupational health, our goal is to control the workplace hazards that can affect the health and productivity of our workforce. One of the ways we aim to reach this goal is by monitoring the health of each one of our employees and providing the support and mentorship necessary to ensure their integrity and acclamation to the work. Furthermore, we also actively promote industrial hygiene and ergonomics and seek to address the psychosocial effects of our work environment.
In 2010, we recorded 41 environmental incidents as compared to the 116 recorded in 2009 and 56 recorded in 2008. Oil spills also declined from 7,533 barrels in 2009 to 5,107 barrels in 2010.
Human Rights Initiatives
We have a strong commitment for the protection of human rights in the areas where we operate and use a set of security and human rights principles, or Principios Voluntarios en Seguridad y Derechos Humanos, as basis for a risk analysis of our company and the communities where we operate. We use this set of principles to interact with local communities and strengthen their relationship with local authorities, our third party contractors and us. In particular, under the Colombian Constitution and legal framework, we are required to enter into formal consultations with indigenous communities whenever we are making plans to commence projects or operations in lands under their control.
In addition, as part of our commitment to human rights, in 2009, we approved our Human Rights Policy and joined the United Nations Global Compact. To manage and ensure compliance with the policy and principles of the Global Compact, in 2010 we created the following:
| | · | Tactical Plan on Human Rights; and |
| | · | Compliance indicator for Corporate Human Rights Program. |
Insurance
We have a clear and defined corporate policy based on risk financing guidelines that summarize the company risk transference and retention alternatives and also provides support and guidance for all the insurance-related issues of all of our affiliated and subsidiary companies.
During the second half of 2010, a new insurance program strategy was developed to improve our corporate insurance policies and coverages (onshore and offshore), organizing them into two programs according to our core business operations: upstream, midstream and downstream. All of our reinsurers must comply with a credit risk rating of A- by Duff & Phelps, or equivalent.
In the following tables, we set forth our insurance programs and the companies covered, along with limits and coverage details.
World Wide Umbrella Program. In place as of May 1, 2011. This insurance program has been developed to provide catastrophic coverage for Ecopetrol and all of its affiliates and subsidiaries in excess of their local insurance programs. Coverage includes all risk physical damage, sabotage and terrorism, general liability, directors and officers, crime and marine cargo.
| | Limit (eel/agg) | | Deductible | | Insured |
| Policies | Onshore | | Offshore | | Onshore | | Offshore | | ECP | | | ECP | | | | | | | | | |
| | (in million US$) | | Downstream | Reficar | Propilco | Upstream | Equion | Hocol | America | Brazil | Peru | Ocensa | ODL | ODC | OBC |
| Property all risk | 200 | | | | 5 - 10 | | | | X | X | X | | | | | | | | | | |
| Sabotage and terrorism | 600 | | | | 5 | | | | X | X | X | | | | | | | | | | |
| Third Party Liability | 500 | | 100 - 400 | | 1 - 5 | | | | X | X | X | X | X | X | X | X | X | X | X | X | X |
| Sabotage and terrorism Bgre | 5 | | 0.4 | | | | X | X | X | X | X | X | X | X | X | | | | |
| Crime | 50 | | Underlying limit | | | | X | X | X | X | X | X | X | X | X | X | X | X | X |
| Directors and Officers | 200 | | | | | | X | X | X | X | X | X | X | X | X | X | X | X | X |
| Cargo | 100 | | | | | | X | X | X | X | X | X | X | X | X | X | X | X | X |
Global Energy Package. In place as of May 1, 2011. This program has been developed to focus on Ecopetrol and all of its upstream affiliate and subsidiary companies, including: all risk physical damage, sabotage and terrorism, general liability and control of wells.
| | Limit (eel/agg) | | Deductible | | Insured |
| Policies | Onshore | | Offshore | | Onshore | | Offshore | | ECP | | | ECP | | | | | | | | | |
| | (in million US$) | | Downstream | Reficar | Propilco | Upstream | Equion | Hocol | America | Brazil | Peru | Ocensa | ODL | ODC | OBC |
| Third Party Liability | | | 100 | | 0.25 | | | | X | X | X | X | X | X | X | X | X | | | | |
| Sabotage and terrorism | 25 | | | | | | | | | X | X | X | X | X | X | | | | |
| Control of wells | 25 | | 400 | | 0.25 - 0.50 | | 5 | | | | | X | X | X | X | X | X | | | | |
| Property All Risk | 400 | | 0.25 | | | | | | | X | X | X | X | X | X | | | | |
Savia has an independent corporate insurance program in Peru, as follows:
| Policies | Limit (eel/agg) | | Deductible |
| Onshore | | Offshore | | Onshore | | Offshore |
| (in million US$) |
| Third Party Liability | 10 | | 0.10 | | |
| Third Party Liability XS Umbrella | 25 | | | | |
| BI | 25 | | 60 days / 45 PEPSA and Cryonegic plant |
| Control of wells | 20 | | 0.10 - 0.25 | | 0.25 - 0.50 |
| Property All Risk | 50 | | | | |
Local Insurance Program. In place as of May 1, 2011. This program has been designed to address local insurance requirements and primary coverage for property all risk sabotage and terrorism, crime, director and officer, general liability and other minor policies in each country of operation.
Our third party liability insurance policies cover Ecopetrol and its subsidiaries and affiliates in excess of local underlying policy limits for claims made against them by third parties. Our commercial general liability, umbrella liability and excess liability coverages will pay on behalf of or indemnify amounts for which an insured becomes legally obligated to pay, including damages in respect of bodily injury, property and copyright. Coverage of bodily injury and property damage is subject to a coverage territory during the policy period.
Ecopetrol is not the operator of any offshore operations, although it is involved in certain offshore joint ventures. With respect to offshore operations in the U.S. Gulf Coast, Ecopetrol America Inc. is party to Unit Operating Agreements (UOAs) that include customary conditions and which contain similar terms and conditions to those in the American Association of Professional Landman (AAPL) contracts. In general, pursuant to these UOAs, the contract parties are liable for all operations covered by the UOAs and, consequently, such parties share in all costs and expenses related to such operations. The only exception is when any damages result from an operator’s gross negligence or willful misconduct, and, in that case, the operator would be 100% responsible for damages. With respect to a third party claim based upon damages sustained as a result of UOA operations, the operators are financially responsible for the claim, provided that the parties to the UOA contribute according to their participation interest. The agreements also provide that, in case of damage caused by an operator’s gross negligence or willful misconduct, any financial liability falling upon non-operators for whatever reason shall be reimbursed by the operator. Finally, operators must obtain insurance as required by the UOA and have a HSE practices in place and be in compliance therewith.
Ecopetrol Oleo e Gas do Brasil Ltd. and Ecopetrol S.A. are parties to contracts based on the Association of International Petroleum Negotiators (AIPN) model. Liability is generally the same as described for the UOAs above, with the following variations:
| | · | If claims arise from third parties as part of a case not involving an operator’s gross negligence or willful misconduct, and the operator pays such claims, all parties must concur and reimburse such claim amounts. |
| | · | In certain contracts, all environmental damages are distributed according the parties’ participation interest, regardless of whether the damages were caused by an operator’s gross negligence or willful misconduct. |
| | · | In certain cases, non-operators may intervene and directly verify compliance of with an operator’s HSE programs. |
PROPERTY, PLANT AND EQUIPMENT
Under Colombian law, the Nation owns all crude oil and natural gas reserves within Colombia and we have certain rights to explore and produce those reserves in areas awarded by the ANH after public bidding. Most of our property, consisting of refineries and storage, production and transportation facilities, is located in Colombia. Our main assets consist of our wells, refining facilities and our pipelines. See “—Overview by Business Segment—Reserves” for a description of our reserves, sources of crude oil and natural gas, main tangible assets and material plans for expansion and improvements in our facilities. See “Item 5. Operating and Financial Review and Prospects—Liquidity and Capital Resources—Use of Funds—Capital expenditures.”
| ITEM 4A. | Unresolved Staff Comments |
None.
| ITEM 5. | Operating and Financial Review and Prospects |
The following discussion presents our financial results and prospects as well as factors that affect our results of operation under Colombian Government Entity GAAP, unless otherwise indicated.
Transformation from a wholly state-owned entity
We have been undergoing a two-step transformation process since 2003, first from a wholly state-owned entity to a state-owned entity characterized by shares, and then with our initial public offering in November 2007, to a mixed economy company, which incorporates private capital. This two-step process has resulted in a substantial change in the legal framework to which we are subject and in the nature of our relationship to the Nation, including a number of changes that have had a significant effect on our results of operations. The most important changes are described below.
Gasoline and diesel price differentials
We charge the domestic prices established by the Government to wholesalers and, at the same time, we accrue the amount of any fuel price differential due pursuant to Law 1151 as revenues and record an account receivable from the Government.
During 2008, refiners, including us, were entitled to fuel price differential payments based on trends in international prices. However, the payment by the Government of the 2008 fuel price differential was delayed and the Ministry of Mines and Energy issued a resolution by which it established a payment schedule relating to the 2008 fuel price differential. Under this payment schedule, the 2008 fuel price differential was paid in three installments in April, August and December 2009 and the Government paid additional interest with respect to these amounts.
During the first and second quarters of 2009, refiners, including us, were not entitled to fuel price differential payments based. Instead, refiners, including us, were required to allocate the difference between high domestic prices and low international prices into the FEPC. During the third and fourth quarters of 2009, refiners, including us, were entitled to fuel price differential payments due to high international prices. Thus, the government depleted the FEPC in order to pay refiners, including us, the corresponding fuel price differential payments. The aggregate amount due to us for both quarters totaled Ps$226 billion and was effectively paid in February 2010.
During 2010, refiners, including us, were entitled to fuel price differential payments corresponding to the first, second and fourth quarters of the year. However, the fuel price differential for the fourth quarter of 2010 equal to Ps$73.5 billion had not been timely paid in the first quarter of 2011, and we expect this payment in the second half of 2011.
Development of Our Strategic Plan
In 2010, the Board of Directors of Ecopetrol approved the strategic plan of the companies comprising the Ecopetrol Corporate Group for the period 2011-2020. The plan was prepared from the perspective of new business targets, with a focus on sustainable development and a clear market orientation, resulting in profit-linked value goals. According to our 2011-2020 Strategic Plan, the Corporate Group will operate in accordance with profitable growth strategic guidelines. During 2010, we increased our net proved developed and undeveloped reserves of crude oil and natural gas by 11.43% compared to 2009, a reserve replacement ratio of 193%. See “Item 4. Information on the Company—The Company—Strategic Plan.”
In connection with our 2011-2020 Strategic Plan, our main objective is to achieve a daily output of approximately 1 million gross barrels of clean crude equivalent per day by 2015 and 1.3 million gross barrels of clean crude equivalent per day by 2020, and we also expect to achieve a ROCE of 17% as a Corporate Group.
Effects of Acquisitions
Our most significant recent acquisitions are listed below, together with the effective date as of which each has been reflected in our financial statements. These acquisitions were funded mainly through cash on hand and cash flow from our operations.
| | · | Offshore International Group Inc. (OIG) (February 2009) – 50% ownership. The main asset of OIG is Savia Peru, which has 8.6 million hectares of exploration and production offshore areas, a gross production of 14.84 thousand boe per day in 2010 and net proved developed reserves of 15.9 million barrels of crude oil and 24.8 billion cubic feet of gas. |
| | · | Ocensa (March 2009) – 60% ownership. With this acquisition we increased our participation in a key oil transport system in Colombia, which transports approximately 47% of total crude oil production and we believe has been profitable due to synergies between this company and Ecopetrol. Ocensa has developed a project to increase its volume capacity to 560 thousand barrels per day. During 2010, Ecopetrol used, on average, 80% of the total capacity of this system. |
| | · | Reficar (May 2009). After increasing our participation in Reficar, we continue developing the proposed expansion and modernization of the Cartagena refinery, increasing our capital expenditures. We believe the upgrades will allow us to produce more valuable products and use more heavy and acid crude oils at a lower price, improving our profitability. |
| | | Hocol and Homcol (May 2009). The principal asset is Hocol S.A., which has exploration and production activities in Colombia. This operation contributed to increase our hydrocarbon reserves and production. In 2010, Hocol contributed proved developed reserves of 41.5 million barrels of crude oil, a gross production of 27 thousand boe per day and five exploratory blocks. |
BP Exploration Company Limited was acquired by us and Talisman Colombia Holdco Limited in January 2011, and later renamed Equion Energía Limited. We hold a 51% interest in Equion, which will be reflected in our financial statements as from January 2011. During the first quarter of 2011, Equion contributed a production of 6.4 thousand barrels per day of crude oil and 5.1 thousand boe per day of natural gas. During 2010, Equion produced 27 thousand boe per day and had reserves (proven and probable) of 94 million barrels before royalties.
For more information related to our acquisitions, see “Item 4. Information on the Company.”
Payments of tariffs of the build, operate, maintain and transfer contracts, or BOMTs, transferred to Ecogas as part of its spin-off from us or BOMTs
As a result of Law 401 of 1997, in 1998, we were required to spin-off all of our natural gas transportation assets to Ecogas, a newly created natural gas transportation company. Prior to the spin-off of the natural gas transportation assets, we had entered into a number of build, operate, maintain and transfer, or BOMT, contracts for the construction, operation, maintenance and transfer of the gas pipelines. As part of the spin-off we were required to transfer all rights under the BOMT contracts to Ecogas, while remaining obliged for 100% of the tariffs. Nevertheless, pursuant to Decree 958 of 1998, Ecogas was responsible for reimbursing us for 70% of the tariffs.
During 2007, in connection with the sale by the Government of Ecogas to Empresa de Energía de Bogotá, Ecogas’ obligation was cancelled. We made a calculation of the present value of the future tariff payments corresponding to Ecogas’ 70% reimbursement obligation, and the Government delivered to us the future tariff payments in cash to cover these future BOMT obligations which totaled Ps$729,588 million at December 31, 2007. We recorded this payment as deferred income and, as we make payments under the BOMTs, we record an expense and a reduction in the related deferred income liability. We will make all future tariff payments under the BOMT contracts until their expiration. This arrangement should not have a negative effect on our operating expenses, as the 70% expense which was previously compensated by Ecogas’ reimbursement, is offset by our recording the deferred income arising from the lump-sum payment.
During 2010, the BOMT contracts of Centragas and Gases de Boyacá expired. We entered into a new BOMT contract in 2010 for a term of eight years, relating to the gas treatment plant located in the Dina-Tello field, with an estimated value of construction of US$28 million. This BOMT is treated as a capital lease in accordance with ASC 840-10.
Effect of 2009 U.S. GAAP Restatement
On July 1, 2011, we filed a current report on Form 6-K (which was subsequently amended and restated to add further details by a current report on Form 6-K/A filed on July 6, 2011) explaining that, as noted in Note 32 to the accompanying consolidated annual financial statements, the financial statements as of and for the year ended December 31, 2009 that were previously issued in the 2009 Form 20-F, contained errors and should no longer be relied upon. We made this determination in accordance with the review performed in conjunction with the action plan to remediate the material weakness in our internal control over financial reporting and disclosure controls and procedures related to the process of preparation and analysis of the differences existing between Colombian Government Entity GAAP and U.S. GAAP included in the 2009 Form 20-F. The significant error related to the determination of the amount of unrealized gains and losses of health, education and pension bond employee benefit plans and resulted from a misinterpretation of the U.S. GAAP impact of the re-allocation of these employee benefit fund assets. As such, we recorded excess amortization expense under U.S. GAAP during 2009. This error led to an understatement of our consolidated net income in 2009 reconciled to U.S. GAAP of Ps$1,178,563 million (US$576,532 million at the exchange rate of Ps$2,044.23 to US$1.00, which was the representative market exchange rate at December 31, 2009). Other errors that were identified in the 2009 U.S. GAAP financial information are corrected in the restated 2009 financial statements, although such errors are not considered material, individually or in the aggregate. The restated 2009 financial statements, including PricewaterhouseCoopers Ltda.’s opinion thereon, are included in this annual report. This restatement only affects the financial information reported under U.S. GAAP. This restatement does not affect the financial information under Colombian Government Entity GAAP and therefore there is no impact on dividends declared and paid under the 2009 financial results, which are declared on the basis of the Colombian Government Entity GAAP financial statements.
Below is a summary of the errors in the 2009 U.S. GAAP financial information and the quantified effects of such errors:
Employee Benefit Error. We made an incorrect determination of the amount of unrealized gains and losses of health, education and pension bond employee benefit plans. Due to the incorrect determination of gains and losses, we amortized an excess amount of actuarial losses. As such, this error led to an understatement of the our consolidated net income reconciled to U.S. GAAP in 2009 of Ps$1,178,563 million and an overstatement of Other Comprehensive Income reconciled to U.S. GAAP by the same amount. To correct this error we reversed the incorrect amortization expense and decreased OCI reconciled to U.S. GAAP.
Other Errors. Separately, we also corrected certain errors in the 2009 U.S. GAAP reconciliation, which individually and in the aggregate, were considered not to be material to our consolidated financial information reconciled to U.S. GAAP. These adjustments led to an overstatement of our consolidated net income reconciled to U.S. GAAP of Ps$38,727 million.
Additional Factors Affecting our Operating Results
Our operating results are affected by international prices for crude oil and natural gas, production volumes and product mix. Higher crude oil and natural gas prices have a positive impact on our results of operations in both our exploration and production segments due to our export revenues increasing. Results from our refining activities are also affected by conversion ratios, utilization rates, refining capacity and operating costs, all of which affect our refining margins. Currently, we have relatively low, although improving, conversion ratios in our refineries which results in us producing and selling refined products, particularly fuel oil, below costs. Finally, changes in the value of foreign currencies, particularly the U.S. dollar against the Peso, have a significant effect on our financial statements.
Sales volumes and prices
Our exploration and production segments’ results depend on production levels and average local and international prices for crude oil and natural gas that we market and sell to our customers locally and abroad. Additionally, sales volumes depend on our purchases of crude oil and natural gas from our business partners and the ANH.
We sell crude oil in the international market. In addition, we process crude oil at Barrancabermeja and Reficar. We also sell refined products in the local and international markets. Currently, production and sale prices of crude oil and refined products are the main drivers of our financial performance.
Local sales and prices
We have a number of crude oil and natural gas long-term supply contracts with local customers, including Reficar and gas-fired power plants. Local sale prices are determined in accordance with existing regulations, contractual arrangements and the spot market linked to international benchmarks. In May 2009, we started recording as revenues the refined products sales of Reficar and stopped recording as revenues our sales of crude oil to Reficar.
International sales and prices
We export crude oil and refined products at prices which are set by reference to international benchmarks and negotiation with our buyers from our Trading Room, using the best international practices. However, we export any crude oil and refined products surplus only after we have fulfilled our supply commitments with our refineries and local buyers.
Our commercial strategy has led us to the Far East, and we are currently selling to China, India, Singapore, Spain, Italy, Nigeria and Angola. Additionally, we have started to trade some volume out of the Colombian supply chain by purchasing refined products from an international third party and selling such products to another international third party.
During the last three years we have significantly increased our international sales on a “delivered” basis to the Caribbean, Central America and United States markets, giving us more chartering experience and thus affording us more operational flexibility and the ability to increase prices.
Exploration costs
We account for exploratory drilling using the successful effort method whereby all costs associated with the exploration and drilling of productive wells are capitalized, while costs incurred in exploring and drilling of dry wells are expensed in the period and accounted for under operating expenses—studies and projects. Consequently, the number of exploratory wells we declared as dry negatively affects our results. As such, the significant expansion of our drilling program, which we are currently undertaking, will likely result in higher dry well expenses and may lead to material changes or volatility in our operating expenses.
Royalties
We are required by law to pay a percentage of our production to the ANH as royalties. Each production contract has its own royalty arrangement. In 1999, a modification to the royalty system established a sliding scale for royalty payments linked to the production level of crude oil and natural gas fields discovered after July 29, 1999 depending on whether the production is crude oil or natural gas, and on the quality of the crude oil produced. Since 2002 the royalties system has ranged from 8% for fields producing up to 5,000 bpd to 25% for fields producing in excess of 600 thousand bpd. Changes in royalty programs only apply to new discoveries and do not alter fields already in their production stage. Producing fields pay royalties in accordance with the applicable royalty program at the time of the discovery. Our contracts specify that royalties are to be paid in physical product (crude oil or natural gas).
Purchases of hydrocarbons from the ANH
We currently purchase all physical product delivered by producers of crude oil and natural gas as royalty payments to the ANH at prices set forth in a crude oil offer letter from the ANH dated May 16, 2011, and a natural gas offer letter from ANH dated June 17, 2009. For crude oil, the purchase price is calculated according to a formula that includes a reference price for crude oil (WTI), a quality adjustment for API gravity and sulfur content, the transportation rates from the wellhead to Coveñas port and a marketing fee. We have an interagency agreement or Convenio with the ANH, whereby we collect all in kind and cash royalties owed to the ANH by the oil and gas companies in Colombia. The ANH may extend offers to sell such physical product and we, at our option, may accept such offers to purchase the royalty volume. We sell the physical product purchased from the ANH as part of our ordinary business.
Import of products for transportation and blending
During 2010, Ecopetrol S.A. increased the volume of naphtha imported to 6.4 million barrels from 1.02 million barrels in 2009 for blending in order to transport heavy crude oil. In addition, in order to meet local environmental regulations for sulfur content in diesel, Ecopetrol S.A. imported 14.5 million barrels of ultra low sulfur diesel for blending with our local production until Barrancabermeja’s hydrotrating units were operative. Consequently, our variable costs have increased and we are affected by available volumes of these products and their prices, affecting our operating results.
Effect of taxes and exchange rate variation on our income
Income tax
We are subject to tax on our income at statutory rate of 33%, the standard corporate rate in Colombia since 2008.
Exchange rate variation
Since 1999, the Government has allowed the Peso to float freely against all major currencies, including the U.S. dollar. A strong depreciation or revaluation of the Peso, particularly against the U.S. dollar, has multiple effects on our financial results. Our results are reported in Pesos, and we maintain our financial records in Pesos. During 2010, 2009 and 2008, the Peso has appreciated (depreciated) on average 12.0%, (9.7%), and 5.4% respectively against the U.S. dollar.
Almost all of our exports of crude oil, natural gas and refined products are made in U.S. dollars at prices determined by reference to international benchmarks. If the Peso depreciates against the U.S. dollar, our revenues from exports increase when expressed in Pesos. Imported goods, however, including imported services denominated in U.S. dollars, will by the same token increase.
The opposite effect occurs when the Peso appreciates against the U.S. dollar as was the case in 2008 and 2010 based on average exchange rates. Our revenues from exports of crude oil and natural gas were reduced in Pesos as a result of the appreciation of the Peso. The appreciation of the Peso also results in lower cost of products, services supplied and contracted abroad as these are denominated in U.S. dollars.
During 2008, most of our financial investments were denominated in U.S. dollars, and we had no debt. Thus, the volatility of the Peso against the U.S. dollar during 2008 resulted in substantial net exchange gains in 2008.
In 2009, we began to incur U.S. dollar-denominated long-term debt while at the same time reducing our financial investments denominated in U.S. dollars, which previously formed part of our investment plan. This strategy allowed us to maintain a balance between our U.S. dollar assets and liabilities. As a result, the net exchange gain/loss of our investments and liabilities denominated in U.S. dollars was essentially balanced at year-end.
We did not incur any additional U.S. dollar-denominated debt in 2010.
New Accounting Pronouncements
In January 2010, the FASB issued ASU 2010-03, Oil and Gas Reserve Estimation and Disclosures. This ASU aligns the oil and gas reserve estimation and disclosure requirements of FASB ASC Topic 932, Extractive Activities—Oil and Gas, with the requirements in the SEC rule, Modernization of the Oil and Gas Reporting Requirements, which was issued on December 31, 2008 (SAB-113). The amendments to FASB ASC Topic 932 are effective for annual reporting periods ending on or after December 31, 2009 and should be accounted for as a change in accounting principle inseparable from a change in estimate; this accounting standard update was applied since December 31, 2009 at Ecopetrol. See Note 32 to our consolidated financial statements.
Through Resolution 1555 of July 30, 2010, the Superintendency of Finance replaced the mortality tables used to prepare actuarial calculations and stipulated that the effects from such change could be recognized gradually. Subsequently, Decree 4565 of December 7, 2010, modified the accounting standards for amortization of the actuarial calculation, which were in force up to that date. Pursuant to the new Decree, companies that had amortized 100% of their actuarial calculation at December 31, 2009 may gradually amortize up to the 2029 the increase in the actuarial calculation for 2010 estimated by using the new mortality tables.
Critical accounting policies and estimates
The following discussion sets forth our critical accounting policies. Critical accounting policies are those policies that require us to exercise the most judgment or involve a higher degree of complexity in the application of the accounting policies that currently affect our financial condition and results of operations. The accounting estimates we make in these contexts require us to calculate variables and make assumptions about matters that are highly uncertain. In each case, if we had made other estimates, or if changes in the estimates occur from period to period, our financial condition and results of operations could be materially affected. This information should be read together with Note 1 to our consolidated financial statements for a summary of the economic entity and principal accounting policies and practices. There are many other areas in which we use estimates about uncertain matters, but the reasonably likely effect of changed or different estimates is not material to our financial presentation.
Oil and gas reserves
When accounting for our reserves we use the internationally recognized “successful efforts” method of accounting for investments in exploration and production areas. These investments are amortized using the technical units-of-production method on the basis of proved developed reserves by field. The reserves are based on technical studies prepared internally by our Department of Reservoirs and approved by our reserves committee, which follow estimation methodologies recommended by international organizations of specialists in hydrocarbon reserves and that in accordance with their certification meet the guidelines set by the SEC. Reserves reported are audited by specialized independent international firms.
The estimation of hydrocarbon reserves is subject to several uncertainties inherent to the determination of proved reserves, production recovery rates, the timeliness with which investments are made to develop the reservoirs and the degree of maturity of the fields.
Crude oil prices have traditionally fluctuated as a result of a variety of factors such as changes in international prices of natural gas and refined products, long term changes in the demand for crude oil, natural gas and refined products, regulatory changes, inventory levels, increase in the cost of capital, economic conditions, development of new technologies, economic and political events, and local and global demand and supply. Revisions to proved reserves estimates of crude oil and gas and the effect of such price variations are presented in Note 32 to our consolidated financial statements. Changes in the crude oil price may affect our estimates in the future. A decrease in our estimated proved reserves due to pricing may result in the impairment of oil and gas properties.
The calculation of units-of-production depreciation and depletion is a critical accounting estimate that measures the depreciation and depletion of upstream assets. The units of production are equal to the ratio of actual volumes produced to total proved developed reserves (those proved reserves recoverable through existing wells with existing equipment and operating methods) and applied to our asset cost.
Financial derivative instruments
We enter into hedging agreements to protect our exposure from the fluctuations of international crude prices. The difference between amounts paid and income received under hedging operations is recognized as financial income/expense. We do not enter into hedging contracts for speculative purposes.
Under Colombian Government Entity GAAP, our estimates are based on current spot prices subject to market variations.
Under U.S. GAAP, we use fair values to measure our financial derivative instruments. Fair values were based on market quotes. There have not been material variations between fair values that have impacted significantly our financial condition or operating performance in recent years.
Pension plans and other retirement benefits
The determination of the expense and liability relating to our pension and other retirement benefits require us to use judgment in the determination of actuarial assumptions. These include active employees with indefinite term contracts, retirees and their heirs, pension benefits, healthcare and education expenses; number of temporary employees who will remain with us until retirement, voluntary retirement plans and pension bonuses. The calculation of retirement bonds posted by us to meet our pension obligations is regulated by Decrees 1748 of 1995, 1474 of 1997 and 876 of 1998, as well as Law 100 of 1993 and its regulatory decree.
These actuarial assumptions include estimates of future mortality, withdrawal, changes in compensation and discount rate to reflect the time value of money as well as the rate of return on pension bonds and other plan assets. These assumptions are reviewed at least annually and may differ materially from actual results due to changing market and economic conditions, regulatory events, judicial rulings, higher or lower withdrawal rates or longer or shorter life spans of participants.
Most of our assumptions have been based on historical trends. Actuarial gains and losses, a result of differences between estimates and actual calculations and differences between Colombian Government Entity GAAP and U.S. GAAP are disclosed in Note 32 to our consolidated financial statements. Changes in interest rates and amendments to plan conditions have affected prior estimates. We believe that the assumptions used in recording our obligations under the plans are reasonable based on our experience and market conditions. See Note 32 of our consolidated financial statements for an analysis of the sensitivity in assumed health care cost trend rates of a one percentage point change.
Pension payments and bonds
By virtue of Legislative Act 01 of 2005, enacted by Congress, the pension regimes excluded from the General Social Security System in Colombia expired on July 31, 2010. In accordance with provisions therein, the decision of the Ministry of Social Protection and the analyses conducted by the labor advisers of Ecopetrol, it was concluded that those workers who complied with the age and continuous or discontinuous service time requirements of the law, the Collective Bargaining Agreement currently in force and/or Agreement 01 of 1977, prior to August 1, 2010, consolidated their right to pension, while for other workers who were not covered, it is mandatory to be affiliate with the General Pension System. The agency responsible for paying the respective pension will be the pension administrator chosen by the worker (either the Social Security Institute or private pension funds).
In accordance with Decree 4505 of 2010 applicable in Colombian Government Entity GAAP, due to the change in the mortality rates used in the 2010 actuarial study, the Company will amortize the increase in the pension obligation calculated as of December 31, 2010 using a five-year term. Through 2009, the yearly change in the pension obligation was recorded as an expense.
Litigation and tax assessments
We are subject to claims for substantial amounts, regulatory and arbitration proceedings, tax assessment and other claims arising in the normal course of business. Management and legal counsel evaluate these situations based on their nature, the likelihood that they materialize, and the amounts involved, to decide on any changes to the amounts accrued and/or disclosed. This analysis includes current legal processes against the Company and claims not yet initiated. In accordance with management’s evaluation and guidance provided by Colombian Government Entity GAAP, we created reserves to meet these costs when it is probable that a liability has been incurred and reasonable estimates of the liability can be made. On December 31, 2010, Ecopetrol S.A. had created a provision of Ps$663,932 million for litigation contingencies. We also maintain insurance policies to cover specific operational risks and asset protection.
Estimates are based on legal counsel’s evaluation of the cases and management’s judgment. In the past our estimates have been accurate and have not varied substantially compared to final judgments. We believe that payments required to settle the amounts related to the claims, in case of loss, will not vary significantly from the estimated costs, and thus will not have a material adverse effect on our financial statements taken as a whole. Litigation and tax assessment differences between Colombian Government Entity GAAP and U.S. GAAP are disclosed in Note 32 to our consolidated financial statements.
Income taxes are accounted for under the assets and liability method. Deferred tax assets and liabilities are recognized for the future tax consequences attributable to differences between the carrying amounts of existing assets and liabilities in the financial statements and their respective tax base. Deferred taxes on assets and liabilities are calculated based on statutory tax rates that we believe will be applied to our taxable income during the years in which temporary differences between the carrying amounts are expected to be recovered.
Abandonment of fields
We are required by law to remove equipment and restore the land or seabed at the end of operations at production sites. To estimate this obligation, we include plugging costs and abandonment of wells, dismantling of facilities and environmental recovery of areas and wells. Changes resulting from new estimates of the liability for abandonment can occur as a result of changes in economic conditions. We accrue the estimated discounted costs of dismantling and removing these facilities at the time of installation of the assets. The related liability is estimated in foreign currency and is adjusted for exchange difference at the end of each year.
We use economic factors from different sources and develop our own internal estimates of future inflation rates and discount rates. There have not been significant disparities between estimates and asset retirement costs paid. We believe that the assumptions used in recording our asset retirement costs and obligations are reasonable based on our experience and market conditions. The related liability is estimated in local currency and does not require adjustment for exchange difference at the end of each year as a greater or lesser value of assets.
Differences between Colombian Government Entity GAAP and U.S. GAAP are disclosed in Note 32 to our consolidated financial statements.
Recognition and measurement of assets recognized and liabilities assumed upon business combinations
Under U.S. GAAP, we account for businesses acquired using the purchase method of accounting which requires that the assets acquired and liabilities assumed be recorded at the date of acquisition at their respective fair values. The application of the purchase method requires certain estimates and assumptions especially concerning the determination of the fair values of the acquired intangible assets, property, plant and equipment as well as the liabilities assumed at the date of the acquisition. In addition, the useful lives of the acquired intangible assets, property, plant and equipment have to be determined. The judgments made in the context of the purchase price allocation can materially impact our future results of operations. Accordingly, for significant acquisitions, we obtain assistance from third-party valuation specialists. The valuations are based on information available at the acquisition date and different methodologies are used for each intangible identified above.
Goodwill
Under U.S. GAAP, Ecopetrol tests goodwill for impairment at least annually using a two-step process that begins with an estimation of the fair value of a reporting unit. The first step is a screen for potential impairment and the second step measures the amount of impairment, if any. However, if certain criteria are met, the requirement to test goodwill for impairment annually can be satisfied without a re-measurement of the fair value of a reporting unit. Fair value is determined by reference to market value, if available, or by a qualified evaluator or pricing model. Determination of a fair value by a qualified evaluator or pricing model requires management to make assumptions and use estimates. Management believes that the assumptions and estimates used are reasonable and supportable in the existing market environment and commensurate with the risk profile of the assets valued. However, different assumptions and estimates could be used which would lead to different results. In 2009, the most significant amounts of goodwill related to the acquisitions of Reficar and OIG. The valuation models used to determine the fair value of these companies are sensitive to changes in the underlying assumptions. For example, the prices and volumes of product sales to be achieved and the prices which will be paid for the purchase of raw materials are assumptions which may vary in the future. Adverse changes in any of these assumptions could lead us to record a goodwill impairment charge. During 2010, Ecopetrol conducted an impairment test of goodwill, which showed that goodwill of OIG had been impaired. See Notes 12 and 32 to our consolidated financial statements.
Under Colombian Government Entity GAAP, goodwill corresponds to the difference between the acquisition price and the book value of the acquired company. This amount is amortized during the period in which the Company expects to receive future benefits. Additionally, under Colombian Government Entity GAAP, goodwill is not subject to impairment tests.
Operating Results
The following discussion is based on information contained in our audited consolidated financial statements and should be read in conjunction therewith. Our consolidated financial statements have been prepared in accordance with Colombian Government Entity GAAP, which differs in certain significant respects from U.S. GAAP. See Note 32 to our consolidated financial statements for a description of the principal differences.
Results of operations for the year ended December 31, 2010, compared to the year ended December 31, 2009, and compared to the year ended December 31, 2008.
The following table sets forth components of our income statement for the years ended December 31, 2010, 2009, and 2008.
| | | For the Year ended December 31, | | | 2010/2009 | | | For the Year ended | | | 2009/2008 | |
| | | | | | | | | | | | | | | | |
| | | (Pesos in millions) | | | | | | (Pesos in millions) | | | | |
| | | | | | | | | | | | | | | | |
| Revenues: | | | | | | | | | | | | | | | |
| | | | | | | | | | | | | | | | |
| Total Revenue | | | 41,968,311 | | | | 30,404,390 | | | | 38 | % | | | 33,896,669 | | | | (10 | )% |
| | | | | | | | | | | | | | | | | | | | | |
| Cost of Sales | | | 25,959,001 | | | | 19,906,073 | | | | 30 | % | | | 19,084,436 | | | | 4 | % |
| Gross Profit | | | 16,009,310 | | | | 10,498,317 | | | | 52 | % | | | 14,812,233 | | | | (29 | )% |
| | | | | | | | | | | | | | | | | | | | | |
| Operating Expenses: | | | 3,130,468 | | | | 2,624,978 | | | | 19 | % | | | 2,154,875 | | | | 22 | % |
| Operating Income | | | 12,878,842 | | | | 7,873,339 | | | | 64 | % | | | 12,657,358 | | | | (38 | )% |
| | | | | | | | | | | | | | | | | | | | | |
| Non-operating income | | | | | | | | | | | | | | | | | | | | |
| (expenses): | | | (1,386,225 | ) | | | (622,495 | ) | | | 123 | % | | | 3,353,846 | | | | n.m. | |
| Income before income tax | | | 11,492,617 | | | | 7,250,844 | | | | 59 | % | | | 16,011,204 | | | | (55 | )% |
| | | | | | | | | | | | | | | | | | | | | |
| Income tax: | | | 3,238,650 | | | | 2,114,029 | | | | 53 | % | | | 4,381,982 | | | | (52 | )% |
| Non.controlling interest: | | | (107,496 | ) | | | (4,761 | ) | | | n.m. | | | | (455 | ) | | | n.m. | |
| | | | | | | | | | | | | | | | | | | | | |
| Net Income | | | 8,146,471 | | | | 5,132,054 | | | | 59 | % | | | 11,629,677 | | | | (56 | )% |
Total Revenues
Methodology
In 2010, the Company’s management modified the methodology used to analyze financial information by business segment in order to obtain a better measure of the Company’s operations. Under the new methodology (i) oil and gas sales to customers by our exploration and production segment are recorded at market price, whereas previously, revenues were valued at a transfer price at the field of production; (ii) income from fields to the point of sale to final customers is recorded in the market and supply segment along with all associated marketing costs; (iii) transactions between segments are reported considering each business as a separate entity; (iv) prices between segments are established by reference to those that could be obtained in arms-length transactions with third parties; (v) each segment bears the costs and expenses incurred for product use or marketing; and (vi) each segment assumes administrative expenses and all non-operational transactions related to their activity. The segment information for 2009 and 2008 has been revised for comparison purposes. See Note 32 to our consolidated financial statements.
Additionally, we now report our information in four segments: Exploration and Production, Refining and Petrochemicals, Transportation; and Market and Supply. Until 2009 we also reported our financial information for the corporate segment, but under the new methodology, all financial information associated with the corporate segment is distributed among the four business segments:
| | · | Exploration and Production — includes our oil and gas exploration and production activities. Revenue is derived from the sale of crude oil and natural gas to inter-company segments, at market prices, and to third parties. Revenue is derived from local sales of crude oil, regulated fuels, non-regulated fuels and natural gas. Sales are made to local and foreign distributors. Costs include those costs incurred in production. Expenses include all exploration costs that are not capitalized. |
| | · | Refining and Petrochemicals – includes our refining activities. Goods sold, both internally and to third parties, include refined products such as motor fuels, fuel oils and petrochemicals at market prices. This segment also includes sales of industrial services to third parties. |
| | · | Transportation – includes the Company’s sales and costs associated with our pipelines and other transport activities. |
| | · | Market and Supply – includes our revenues, costs and expenses associated with distribution, including distribution of purchases from third parties and the ANH. |
The following table sets forth our principal sources of revenue by business segment for the years ended December 31, 2010, 2009 and 2008.
| | | For the Year ended December 31, | | | 2010/2009 | | | For the Year ended | | | 2009/2008 | |
| | | | | | | | | | | | | | | | |
| | | (Pesos in millions) | | | | | | (Pesos in millions) | | | | |
| Exploration and Production segment: | | | | | | | | | | | | | | | |
| Crude oil: | | | | | | | | | | | | | | | |
| Local sales | | | 123,797 | | | | 1,943,410 | | | | (93.6 | )% | | | 2,312,950 | | | | (16.0 | )% |
| Export sales | | | 13,515,877 | | | | 6,613,961 | | | | 104.4 | % | | | 4,658,337 | | | | 42.0 | % |
| Total sales of crude oil | | | 13,639,674 | | | | 8,557,371 | | | | 59.4 | % | | | 6,971,287 | | | | 22.8 | % |
| Natural gas: | | | | | | | | | | | | | | | | | | | | |
| Local sales | | | 854,427 | | | | 691,930 | | | | 23.5 | % | | | 603,973 | | | | 14.6 | % |
| Other income from local sales of natural gas | | | 142,018 | | | | 155,469 | | | | (8.7 | )% | | | 127,481 | | | | 22.0 | % |
| Export sales | | | 101,363 | | | | 214,091 | | | | (52.7 | )% | | | 215,312 | | | | (0.6 | )%. |
| Total sales of natural gas | | | 1,097,808 | | | | 1,061,490 | | | | 3.4 | % | | | 946,766 | | | | 12.1 | % |
Other income from Production segment(1) | | | 193,991 | | | | 85,401 | | | | 127.2 | % | | | 191,276 | | | | (55.3 | )% |
| Total production segment sales | | | 14,931473 | | | | 9,704,262 | | | | 53.9 | % | | | 8,109,329 | | | | 19.7 | % |
| Production segment eliminations in consolidation | | | (2,859,175 | ) | | | (1,957,156 | ) | | | 46 | % | | | — | | | n.m. | |
| Total production segment sales to third parties | | | 12,072,298 | | | | 7,747,106 | | | | 55.8 | % | | | 8,109,329 | | | | (4.7 | )% |
| Refining and Petrochemicals segment: | | | | | | | | | | | | | | | | | | | | |
| Refined products: | | | | | | | | | | | | | | | | | | | | |
Local sales(2) | | | 14,360,357 | | | | 11,910,770 | | | | 20.6 | % | | | 14,638,917 | | | | (18.6 | )% |
Sales of refined products allocated to our production segment(3) | | | (226,701 | ) | | | (154,816 | ) | | | 46.4 | % | | | (209,487 | ) | | | (26.1 | )% |
Other income from local sales of refined products(4) | | | 32,546 | | | | 82,616 | | | | (60.6 | )% | | | 70,912 | | | | 16.5 | % |
| Export sales | | | 5,641,545 | | | | 4,196,143 | | | | 34.4 | % | | | 3,273,018 | | | | 28.2 | % |
| Total Refining and Petrochemicals segment sales: | | | 19,807,747 | | | | 16,034,713 | | | | 23.5 | % | | | 17,773,360 | | | | (9.8 | )% |
| Refining and Petrochemicals segment eliminations in consolidation | | | (22,337 | ) | | | - | | | n.m. | | | | - | | | n.m. | |
| Total Refining and Petrochemicals segments sales to third parties | | | 19,785,410 | | | | 16,034,713 | | | | 23.4 | % | | | 17,773,360 | | | | (9.8 | )% |
| Market and supply segment: | | | | | | | | | | | | | | | | | | | | |
| Crude oil sales: | | | | | | | | | | | | | | | | | | | | |
| Local sales | | | - | | | | 1,692,832 | | | | (100 | )% | | | 2,461,451 | | | | (31.2 | )% |
| Export sales | | | 8,108,425 | | | | 5,201,551 | | | | 55.9 | % | | | 4,037,945 | | | | 28.9 | % |
| Total crude oil sales | | | 8,108,425 | | | | 6,894,383 | | | | 17.6 | % | | | 6,499,396 | | | | 6.1 | % |
| Natural gas sales: | | | | | | | | | | | | | | | | | | | | |
| Local sales | | | 378,939 | | | | 336,366 | | | | 12.6 | % | | | 297,441 | | | | 13.1 | % |
| Other income from local sales of natural gas | | | 2,536 | | | | 24,473 | | | | (89.6 | )% | | | 26,185 | | | | (6.5 | )% |
| Export sales | | | 44,700 | | | | 97,643 | | | | (54.2 | )% | | | 98,036 | | | | (0.4 | )% |
| Total natural gas sales | | | 426,175 | | | | 458,482 | | | | (7.1 | )% | | | 421,662 | | | | 8.7 | % |
| Refined products sales: | | | | | | | | | | | | | | | | | | | | |
| Local sales | | | 522,145 | | | | 15,978 | | | n.m. | | | | 361,615 | | | | (95.6 | )% |
| Export sales | | | 10,246 | | | | 10,900 | | | | (6.0 | )%. | | | 257 | | | n.m. | |
| Other income from local sales | | | 51,956 | | | | 13,811 | | | n.m. | | | | 13,627 | | | | 1.4 | % |
| Total Market and Supply segment sales | | | 9,118,947 | | | | 7,393,554 | | | | 23.3 | % | | | 7,296,557 | | | | 1.3 | % |
| Market and Supply segment eliminations in consolidation | | | (772,502 | ) | | | (1,688,671 | ) | | | (54.3 | )% | | | - | | | n.m. | |
| Total Market and Supply segment sales to third parties | | | 8,346,445 | | | | 5,704,883 | | | | 46.3 | % | | | 7,296,557 | | | | (21.8 | )% |
| Transportation segment: | | | | | | | | | | | | | | | | | | | | |
| Transportation sales | | | 1,465,973 | | | | 888,783 | | | | 64.9 | % | | | 669,309 | | | | 32.8 | % |
| Other income transportation services | | | 353,869 | | | | 76,247 | | | | 364.1 | % | | | 48,114 | | | | 58.5 | % |
| Total transportation sales | | | 1,819,842 | | | | 965,030 | | | | 88.6 | % | | | 717,423 | | | | 34.5 | % |
| Transportation segment eliminations in consolidation | | | (55,684 | ) | | | (47,341 | ) | | | 17.6 | % | | | - | | | n.m. | |
| Total Transportation segment sales to third parties | | | 1,764,158 | | | | 917,689 | | | | 92.2 | % | | | 717,423 | | | | 27.9 | % |
| Total sales | | | 41,968,311 | | | | 30,404,390 | | | | 38.0 | % | | | 33,896,669 | | | | (10.3 | )% |
| (1) | Corresponds to sales of refined products, transportation services and industrial services allocated to our production segment. |
| (2) | Includes motor fuel price differential reimbursements by the Government amounting to, Ps$3,070,479 million in 2008, Ps$196,533 million in 2009 and Ps$740,682 million in 2010. |
| (3) | Corresponds to sales of refined products from our Apiay and Orito refineries allocated to our production segment. |
| (4) | Corresponds to sales of transportation services and industrial services allocated to our refining and petrochemicals segment. |
In 2010, total revenues increased by 38% as compared to 2009, mainly due to the higher average prices of crude oil and an increase in the total volumes sold. The 10.3% decrease in total revenues in 2009 compared to 2008 was due to a lower average price of crude oil and refined products offset in part by an increase in volume of crude oil sold.
The following table sets forth our total export and local sales of crude oil, natural gas and refined products for the years ended December 31, 2010, 2009 and 2008.
| | | For the Year ended December 31, | | | 2010/2009 | | | For the Year ended December 31, | | | 2009/2008 | |
| | | | | | | | | | | | | | | | |
| Crude oil: | | | | | | | | | | | | | | | |
Local sales (barrels)(1) | | | 1,086,090 | | | | 455,895 | | | | 138.2 | % | | | 26,981,442 | | | | (98.3 | )% |
Export sales (barrels) (2) | | | 131,316,387 | | | | 92,921,245 | | | | 41.3 | % | | | 54,592,797 | | | | 70.2 | % |
Average price per local barrel (in U.S. dollars) (3) | | | 56.85 | | | | 67.77 | | | | (16.1 | )% | | | 89.95 | | | | (24.7 | )% |
Average price per export barrel (in U.S. dollars) (4) | | | 72.55 | | | | 60.83 | | | | 19.3 | % | | | 83.00 | | | | (26.7 | )% |
| Weighted average price per local and export barrel (in U.S. dollars) | | | 72.42 | | | | 60.86 | | | | 19.0 | % | | | 85.30 | | | | (28.7 | )% |
| | | | | | | | | | | | | | | | | | | | | |
| Natural gas: | | | | | | | | | | | | | | | | | | | | |
| Local sales (mbtu) | | | 188,681,680 | | | | 167,095,380 | | | | 12.9 | % | | | 146,955,743 | | | | 13.7 | % |
Export sales (mbtu)(5) | | | 19,701,959 | | | | 43,568,928 | | | | (54.8 | )% | | | 35,491,468 | | | | 22.8 | % |
Average local price (mbtu) (in U.S. dollars) (3) | | | 3.24 | | | | 2.72 | | | | 18.9 | % | | | 3.12 | | | | (12.7 | )% |
Average export price (mbtu) (in U.S. dollars) (4) | | | 3.93 | | | | 3.27 | | | | 19.9 | % | | | 4.30 | | | | (23.9 | )% |
| | | | | | | | | | | | | | | | | | | | | |
| Refined products: | | | | | | | | | | | | | | | | | | | | |
| Product local sales (barrels) | | | 87,271,761 | | | | 86,211,706 | | | | 1.2 | % | | | 69,312,065 | | | | 24.4 | % |
| Export sales (barrels) | | | 37,746,666 | | | | 34,368,558 | | | | 9.8 | % | | | 18,380,770 | | | | 87.0 | % |
Average local price per barrel (U.S. dollars) (3) | | | 84.42 | | | | 67.18 | | | | 25.7 | % | | | 106.02 | | | | (36.6 | )% |
Average export price per barrel (U.S. dollars) (4) | | | 78.90 | | | | 69.25 | | | | 13.9 | % | | | 72.63 | | | | (4.7 | )% |
| (1) | Starting in May 2009, no longer includes sales to Reficar. |
| (2) | Since 2010, the free trade zone sales are considering exports for local purposes. Includes sales of Hocol since May 2009. |
| (3) | Corresponds to average price per local barrel translated at an average exchange rate of 1,897.89 for 2010, 2,156.29 for 2009 and 1,966.26 for 2008. |
| (4) | Corresponds to the average of the actual prices at which we sold our crude oil in the international markets. |
| (5) | We initiated exports of natural gas to Venezuela in the third quarter of 2007. However, during the period of February to September 2010, we suspended the exports because Venezuela failed the payments due to politic conflicts between Colombia and Venezuela. |
Exploration & Production segment sales
Crude oil
Local Sales
In January 2010, Reficar was declared a special free trade zone, and since then crude oil sold to this company is accounted for in export sales. For this reason, revenues from crude oil local sales decreased by 93.6% as compared to 2009. In 2009, our local sales decreased 16% compared to 2008 mainly due to a decrease in the average sales price. In 2010, our total volume of local sales increased 138% as result of an increase in sales of heavy or acid crude oil from the Teca Nare and Moriche fields.
Export sales
In 2010, our revenues from exports of crude oil increased by 104.4% as compared to 2009, mainly due to an 41.3% increase in the volume of crude oil exported, primarily Castilla and South blends, to new markets, such as China and India, and a 19.3% increase in our average crude oil export prices, partially offset by an appreciation in the average exchange rate of the Peso against the U.S. dollar. In 2009, export sales increased by 42% as compared to 2008, resulting from an increase in our production level and an approximate 9.7% depreciation in the average exchange rate for the Peso against the U.S. dollar, which were partially offset by a decrease in the average sales price.
Natural gas
Local sales
In 2010, our production segment local sales of natural gas increased by 23.5% as compared to 2009, mainly due to a 12.9% increase in volumes of natural gas sold and an 18.9% increase in the average sale price, both of which resulted from increased electricity demand during the occurrence of the El Niño phenomenon in the first half of 2010. Our production segment local sales of natural gas increased by 14.6% in 2009 as compared to 2008 mainly due to a 13.7% increase in volumes sold, which was partially offset by a 12.7% decrease in the average sale price.
Export sales
Export sales of natural gas decreased by 52.7% in 2010 as compared to 2009, mainly due to a 55% decrease in the exported volumes resulting from the restrictions on exports imposed by the Government to meet increasing national demand during the occurrence of the El Niño phenomenon in the first half of 2010, partially offset by higher average export price, which increased by 19.9%. In 2009, export sales of natural gas decreased 0.6% as compared to 2008, mainly due to lower average export price, which decreased 23.9%, partially offset by a 22.8% increase of exported volumes. Export sales of natural gas for 2008 reflect the first complete year of our sales of natural gas to Venezuela.
Production segment sales to third parties
Our total production segment sales to third parties increased by 55.8% in 2010 as compared to 2009, as a result of the increase in our produced volumes and the implementation of best practices and methods by our international trading desk to increase our export sales to new markets, which were partially offset by a decline in the average sales prices. In 2009, our total production segment sales to third parties decreased by 4.7 % as compared to 2008, as a result of a decline in the average sales prices, partially offset by the increase in our volumes produced. Our higher production resulted from our investments in developing our fields to increase our primary recovery in them as part of our investment plan. We were affected positively by a general increase in market prices of crude oil and natural gas as a consequence of an increasing demand for these products in Far East.
Refining and Petrochemicals segment sales
Local sales
Local sales of refined products increased 20.6% in 2010 as compared to 2009 as a result of higher average sales prices, which increased 25.7% as a result of the higher import volumes of products for blending to meet local environmental regulations for sulfur content, an increase of vehicles using diesel and the severe rain season in the second half of 2010 that restricted ethanol supply, which consequently increased local gasoline sales. Revenue from local sales of refined products decreased by 18.6% in 2009 as compared to 2008 as a result of lower average sales prices, which decreased 36.6%, partially offset by a 24.4% increase in the volumes sold resulting from the consolidation of the results of Reficar into our results of operations.
Export sales
Export sales of refined products increased 34.4% in 2010 as compared to 2009 mainly as a result of an increase of 13.9% in the average export price and an increase of 9.8% in our exported volumes mainly due to an increase in our high sulfur diesel export sales from Reficar. The increase in revenues from exports of refined products in 2009 as compared to 2008 was due to the consolidation of the results of Reficar into our results of operations.
Refining and Petrochemicals segment sales to third parties
Our total refining and petrochemicals segment sales to third parties increased 23.4% in 2010 as compared to 2009 as a result of an increase in the average sales prices of refined products and a 9.8% increase in our volumes exported. Our total refining and petrochemicals segment sales to third parties decreased 9.8% in 2009 as compared to 2008 as a result of a decrease in the average sales prices of refined products.
Market and Supply segment sales
Crude Oil
Local sales
Since January 2010, crude oil sold to Reficar is accounted for in export sales after which it is declared special free trade zone sales. For this reason, revenues from crude oil local sales decreased 100% in local sales allocated to our market and supply segment during 2010 compared to 2009. In 2009, our local sales allocated to our market and supply segment decreased 31.2% as a result of a lower volume of sales allocated to this segment based on the methodology described above in “—Total Revenues—Methodology.”
Export Sales
Exports of crude oil allocated to our market and supply segment increased by 55.9% in 2010 as compared to 2009 as a result of a 19.3% increase in the average export price of crude oil and an increase in our exported volumes allocated to this segment by sales to Reficar. Revenues from exports of crude oil allocated to this segment decreased 31.2% in 2009 as compared to 2008 as a result of a decrease in the exported volumes allocated to this segment and a 26.7% decrease in the average export price of crude oil.
Natural Gas
Local Sales
Revenues from local sales of natural gas allocated to our market and supply segment increased by 12.6% in 2010 as compared to 2009, mainly as a result of an 11.6% increase in the volumes sold in this segment and by the higher average sales price of natural gas. Revenues from local sales of natural gas allocated to our market and supply segment increased by 13.1% in 2009 as compared to 2008, mainly as a result of a 17.6% increase in the volumes sold in this segment, partially offset by the lower average sales price of natural gas.
Market and Supply segment sales to third parties
Our total market and supply segment sales to third parties increased by 46.3% in 2010 compared to 2009, mainly as a result of higher volumes of refined products allocated to this segment, partially offset by a decrease in sales of crude oil by elimination in consolidation of sales to Reficar. Our total market and supply segment sales to third parties decreased by 21.8% in 2009 compared to 2008, mainly as a result of the elimination in consolidation of our crude oil sales to Reficar. We are continuously working to improve our marketing strategy in an effort to increase the value of our products to obtain a higher customer satisfaction and, we believe, to increase sales.
Transportation segment sales
Our total transportation segment sales increased by 88.6% in 2010 as compared to 2009, mainly due to higher volumes of crude oil and refined products transported, which in turn resulted from (i) our consolidation of the results of operations of Ocensa and ODC, (ii) the commencement of operations of the second phase of ODL and (iii) the expansion of our transportation infrastructure. Transportation segment sales in 2009 increased by 34.5%, compared to 2008, as a result of higher volumes transported and the consolidation of the results of operations of Ocensa and ODC.
Transportation segment sales to third parties
As a result of the above mentioned increase in volumes and after giving effect to eliminations in consolidation of the transportation services provided by us to our subsidiaries, our transportation segment sales to third parties increased by 92.2% in 2010 compared to 2009, and 27.9% in 2009 compared to 2008.
Cost and Expenses
The following table sets forth elements of our cost of sales, operating expenses and operating income for the years ended December 31, 2010, 2009 and 2008.
| | | For the Year ended December 31, | | | 2010/2009 | | | For the Year ended December 31, | | | 2009/2008 | |
| | | | | | | | | | | | 2008 | | | | |
| | | (Pesos in millions) | | | | | | | (Pesos in millions) | | | | | |
| Cost of sales | | | 25,959,001 | | | | 19,906,073 | | | | 30 | % | | | 19,084,436 | | | | 4 | % |
| | | | | | | | | | | | | | | | | | | | | |
| Operating expenses | | | 3,130,468 | | | | 2,624,978 | | | | 19 | % | | | 2,154,875 | | | | 22 | % |
| | | | | | | | | | | | | | | | | | | | | |
| Operating Income | | | 12,878,842 | | | | 7,873,339 | | | | 64 | % | | | 12,657,358 | | | | (38 | )% |
Cost of sales—consolidated
As a result of the increase in international prices for crude oil, our costs of sales have been affected by a number of factors. The most important factors are described below:
| | · | Purchases of hydrocarbons from the ANH in 2010 increased 26% to Ps$5,500,921 million compared to 2009, mainly as a result of higher average prices and an increase in the volumes purchased. Purchases of hydrocarbons from the ANH in 2009 decreased 22% to Ps$4,358,408 million as compared to 2008 mainly as a result of lower average prices, partially offset by an increase in the volumes purchased. |
| | · | Purchases of crude oil from our business partners in 2010 increased by 10% to Ps$4,548,193 million compared to 2009 mainly due to higher average crude oil prices of purchased crude oil production from our business partners increased. Purchases of crude oil from our business partners in 2009 increased 29% to Ps$4,130,116 million as compared to 2008 mainly due to higher volumes purchased as crude oil production from our business partners increased. |
| | · | Purchases of imported products in 2010 increased 107% to Ps$5,680,601 million compared to 2009 as a result of higher volumes purchased for blending naphtha with heavy crude oil in order to transport it and of products for blending to meet local environmental regulations for sulfur content, and higher average prices. Purchases of imported products in 2009 decreased to Ps$2,739,681 million compared to 2008 mainly as a result of lower average prices. |
| | · | Services contracted with associations, which are pro rata expenses for our joint ventures, increased by 13.9% in 2010 to Ps$1,469,586 million compared to 2009, mainly as a result of an increase in production activities. Services contracted with associations in 2009 increased 8.6% to Ps$1,290,177 million compared to 2008 due to an increase in production activities. |
| | · | Maintenance costs increased by 8.6% to Ps$1,384,088 million compared to 2009, mainly due to an increase in tariffs and an increase in our production activities. Maintenance costs increased by 53% to Ps$1,274,618 million in 2009 as compared to 2008, mainly due to the consolidation of the maintenance costs of Ocensa and Hocol into our results of operations. |
| | · | Depreciation costs increased by 24.9% to Ps$1,548,797 million compared to 2009, mainly due to the consolidation of Ocensa’s depreciation into our results of operations. Depreciation costs increased by 85% to Ps$1,239,846 million in 2009 as compared to 2008, mainly due to the consolidation of Ocensa’s depreciation into our results of operations. |
| | · | Labor costs in 2010 increased 18% to Ps$1,084,149 million compared to 2009 as a result of a 2.43% increase in our total number employees in response to an increase in our projects activities. Labor costs increased 22% in 2009 as compared to 2008 as a result of a 9.26% increase in our total number of employees in response to the increase in the exploration and production activities, and an adjustment in wages which has been progressively implemented among all of our employees. |
Principal elements of our cost of sales by business segments are as follows:
Production segment’s cost of sales
Cost of sales affecting our production segment are mainly related to the amortization and depletion of our production assets, services contracted with outside vendors, maintenance costs, project expenses and labor costs related to this segment.
In 2010, cost of sales for this segment increased by 27.3%, mainly due to (i) the increase by 43.2% of heavy crude oil production, which required increased purchases of imported naphtha to dilute and transport heavy crude oil and (ii) costs for services contracted with certain business associations with respect to increasing in our participation in some of our association contracts, such as Teca-Nare contract. For 2009 cost of sales increased by 16%, due mainly to greater costs for maintenance services, crude oil and natural gas transport and the purchases of imported naphtha.
Refining and petrochemicals segment’s cost of sales
Cost of sales affecting our refining and petrochemicals segment are primarily for the purchase of crude oil and natural gas to upload and feed the refineries, to import products for the refining process, to feed stock transportation services, for services contracted for the maintenance of the refineries, and for the amortization and depreciation of refining assets.
Cost of sales for this segment increased by 23.7% during 2010, mainly due to (i) an increase in the volumes and prices of crude oil purchased from third parties, the ANH and from our production segment and (ii) an increase in the volumes imported of diesel extra (low sulfur diesel) used to comply with sulfur content requirements for fuels before the completion of the Fuels Hydrotreatment Plant at Barrancabermeja. In 2009, cost of sales decreased by 8% due to the lower cost of crude oil purchased from third parties, the ANH and from our production segment, based on lower international prices.
Market and supply segment’s cost of sales
Cost of sales affecting our market and supply segment are mainly related to the costs associated with purchases of crude oil and natural gas volumes from the ANH and from our business partners. Cost of sales for our market and supply segment increased by 10.6% in 2010 and 5% in 2009, due in each year to the increase in volumes purchased from the ANH and third parties.
Transportation segment’s cost of sales
Cost of sales affecting our transportation segment are: depreciation and amortization of our transportation assets and project costs, which relate to costs associated with the maintenance of transportation networks and construction and conversion of existing pipelines to the transportation of heavy crude oil. Due to the consolidation of Ocensa and ODC, our transportation costs have increased as we now include the total costs of sales of these subsidiaries into our cost of sales.
In 2010, cost of sales of transportation activities increased by 14.8% mainly due to greater volumes of crude oil and refined products transported, as a result of increased production of crude oil in the country. In 2009, cost of sales of transportation activities increased by 21.8% due mainly to increased maintenance costs.
Operating expenses
Our operating expenses increased in 2010 compared to 2009 as well as in 2009 compared to 2008, mainly as a result of the following factors:
| | · | Studies and projects in 2010 compared to 2009 increased by 28% as a result of an increase in the number of seismic studies and exploration activities conducted. Studies and projects in 2009 increased by 53% compared to 2008, as a result of an increase in the number of seismic studies and production projects conducted. |
| | · | Non-capitalized projects expenses including licensing, advisory, infrastructure, research services and expenses related to the Barrancabermeja project. |
Our operating expenses by business segments increased in 2010, compared to 2009, and increased in 2009, compared to 2008. Such expenses by business segment are described below. Under the modification to the methodology employed by the Company in 2010 to analyze financial information by business segment, each segment bears the costs and expenses incurred for product use or marketing and each segment assumes administrative expenses and all non-operational transactions related to their activity.
Exploration and production segment’s operating expenses
Operating expenses affecting our exploration and production segment are primarily for studies and projects, which correspond to expensing dry wells, the amortization of the goodwill from our acquisitions assigned to this segment and administrative expenses assigned to this segment. These expenses increased by 19% in 2010 and 37% in 2009.
Refining and petrochemicals segment’s operating expenses
Operating expenses affecting our refining and petrochemicals segment are primarily for the amortization of goodwill from our acquisitions assigned to this segment, projects and administrative expenses assigned to this segment. In 2010 and 2009, expenses related to this segment increased by 8% and 6%, respectively, mainly due to non-capitalized projects expenses.
Market and supply segment’s operating expenses
Operating expenses affecting our market and supply segment are primarily for the administrative expenses related to selling the crude oil and natural gas assigned to this segment. In 2010 and 2009 these expenses increased by 12% and 34% respectively, mainly due to projects expenses.
Transportation segment’s operating expenses
Operating expenses affecting our transportation segment are primarily for the amortization of the goodwill from our acquisitions assigned to this segment and for tariffs paid in connection with crude oil transportation. During 2010, operating expenses assigned to this segment increased by 10% mainly due to projects expenses. During 2009, such expenses decreased by 116% due to the elimination in consolidation of commercial expenses of Ocensa.
Non-operating income (expenses)
The following table sets forth our non-operating income (expenses) for the years ended December 31, 2010, 2009 and 2008.
| | | | | | 2010/2009 | | | | | | 2009/2008 | |
| | | | | | | | | | | | 2008 | | | | |
| Non-operating income (expenses): | | (Pesos in millions) | | | | | | | (Pesos in millions) | | | | | |
| Financial income, net | | | 37,789 | | | | 495,833 | | | | (92.4 | )% | | | 4,101,252 | | | | (87.9 | )% |
| Pension expenses | | | (377,626 | ) | | | (595,157 | ) | | | (36.6 | )% | | | (1,144,925 | ) | | | (48.0 | )% |
| Inflation gain | | | 22,030 | | | | 22,355 | | | | (1.5 | )% | | | 30,473 | | | | (26.6 | )% |
| Other income (expenses), net | | | (1,068,418 | ) | | | (545,526 | ) | | | 95.9 | % | | | 367,046 | | | | (248.6 | )% |
Financial income, net. Financial income, net includes foreign exchange gains, valuation of investments, dividends received and profit from sale of investments. Financial income, net decreased by 92.4% in 2010 compared to 2009 mainly due to (i) a decrease in our net exchange difference gain (loss) as a result of a slight unbalance in our investments and liabilities denominated in U.S. dollars in favor of liabilities due to the net effect of the 12% appreciation of the Peso against the U.S. dollar; and (ii) an increase in interest received from our investment portfolios as we utilized some of our financial investments to fund our investment plan. Financial income, net decreased 87.9% in 2009 compared with 2008 mainly due to (i) a decrease in our net exchange difference gain (loss) due to the net effect of the 9.7% depreciation of the Peso against the U.S. dollar; (ii) a decrease in our income on valuation of investment portfolios; and (iii) a decrease in interest received from our investment portfolios as we utilized some of our financial investments to fund our investment plan.
Pension expenses. Pension expenses decreased by 36.5% in 2010 when compared to 2009 mainly as a result of a change of the health pension actuarial calculation. The decrease in the education pension actuarial calculation in 2010 is the result of new mortality tables. Pension expenses decreased by 48% in 2009 compared to 2008 mainly as a result of not registering an amortization of the pension actuarial calculation because the current yield of this portfolio covers the increase in liability.
Other income (expenses), net. Other income includes recovery of provisions, other revenues and other recoveries. Other expenses include BOMT contracts related expenses, legal and other provisions and taxes unrelated to income.
Other income (expenses) increased 95.9% in 2010 compared to 2009, mainly due to a decrease in recovery of exploratory expenses, an increase in losses of OIG’s goodwill and to losses in the recovery of provisions for legal proceedings and to lower provision expenses in 2008. Other income (expenses) decreased in 2009 compared to 2008, mainly due to a lower recovery of legal provisions and an increase in legal provisions and taxes unrelated to income.
Income before income tax
Income before income tax increased by 58.5% in 2010 when compared to 2009, mainly due to higher revenues as a result of the higher average price of crude oil and in increase in the volume of crude oil sold. Income before income tax decreased by 54.7% in 2009, compared to 2008, as a result of the lower average price of crude oil.
Income tax
The effective income tax rate for 2010 was 28.18% compared to 29.16% in 2009 and 27.30% in 2008. Our effective tax rates were lower than the statutory rate as a result of tax benefits mainly related to (i) an income tax deduction applicable to productive fixed assets investments, equal to 40% of these investments for 2008 and 2009 and equal to 30% for 2010, and (ii) exempt net income on asphalt sales. Starting in January 2011, income tax deductions from investments in productive fixed assets will no longer be available.
Net Income
As a result of the foregoing, net income increased by 59% in 2010 compared to 2009 and decreased by 56% in 2009 compared to 2008.
Principal differences between Colombian Government Entity GAAP and U.S. GAAP
We prepare our financial statements in accordance with Colombian Government Entity GAAP. The accounting principles and regulations under Colombian Government Entity GAAP differ in certain significant respects from U.S. GAAP. The following is a description of the most relevant differences between Colombian Government Entity GAAP and U.S. GAAP. Note 32 to our consolidated financial statements presents reconciliations of net income and shareholders’ equity determined under Colombian Government Entity GAAP to those same amounts as determined according to U.S. GAAP, as well as a complete description of the differences between the two accounting standards. The principal differences between Colombian Government Entity GAAP and U.S. GAAP are as follows:
Advances received from Ecogas for BOMT Contracts (Build, Operate, Maintain and Transfer)
Under Colombian Government Entity GAAP, payment obligations under the BOMT contracts were treated as equivalent to an operating lease. Under U.S. GAAP, the obligations were treated as capital leases, and an asset and liability were recognized and payments under the BOMT contracts serve to reduce the liability and the asset is depreciated. Subsequently, we subleased the same asset to Ecogas, with the corresponding treatment of the payments receivable from Ecogas as direct financing lease for U.S. GAAP purposes.
Reversal of concessions
Under Colombian Government Entity GAAP, we recorded an asset for the contributions of the Nation of crude oil and natural gas reserves deriving from the reversal of concessions of oilfield areas in favor of the Nation, given before the effectiveness of Decree 1760 of 2003. Reserves were valued by means of the technical-economic model where the value per barrel resulted from the relation of the net present value obtained at a discount rate and the total proved reserves on the contribution date. For U.S. GAAP purposes, these reversions were considered a transfer of assets between entities under common control. Ecopetrol as the entity that received the net assets, should have initially recognized the assets transferred at their carrying amounts in the accounts of the transferring entity at the date of transfer, which in this case is zero as the transferring entity did not recognize a carrying value.
Effects of inflation on financial information
The accompanying consolidated financial statements have been prepared from the accounting records, which are maintained under the historical cost convention, modified since 1992 to comply with the legal provisions of the CGN to recognize the effect of inflation on non-monetary balance sheet accounts until December 31, 2001, including equity. The CGN eliminated the use of inflation adjustments for accounting purposes for state-owned companies starting on January 1, 2002. However, our consolidated financial statements recognize the effect of inflation on non-monetary balance sheet accounts for an extended period from January 1, 1992 until December 31, 2006 for Propilco S.A., COMAI – Compounding and Masterbatching Industry Ltda, Hocol, Oleoducto de Colombia S.A. and Ocensa because, prior to our acquisition of these companies, they were subject to the accounting rules applicable to Colombian privately-owned entities. Under such rules, the effect of inflation on non-monetary balance sheet accounts was required to be recognized until December 31, 2006. The accumulated inflation adjustments were eliminated in the process of reconciling our financial statements to U.S. GAAP.
Valuation surplus
Under Colombian Government Entity GAAP, property, plant and equipment are revalued every three years in accordance with market value and the investments in unconsolidated investees are revalued by using the equity intrinsic value (percentage of ownership of the Company in the equity of the investee). The excess of these amounts over the carrying amount is treated as valuation surplus with a corresponding amount in equity (valuation surplus). Revaluation of these assets is not done for purposes of U.S. GAAP.
Variable interest entity
Under Colombian Government Entity GAAP consolidation with significant subsidiaries is required when there is control by having more than 50% ownership or majority of the voting rights in the subsidiary. Under U.S. GAAP (FIN 46(R)) if an entity has variable interests whereby one party absorbs losses or benefits from net profits in excess of its ownership interest then those variable interests must be evaluated. Ocensa was not consolidated under Colombian Government Entity GAAP until March 2009 since Ocensa was a variable interest entity under the rules of ASC 810 and included in our consolidated results pursuant thereto until March 2009. Thereafter, Ocensa was consolidated under both Colombian Government Entity GAAP and U.S. GAAP, when we acquired voting control. See Note 32 to our consolidated financial statements for a description of our analysis.
Equity method accounting
Under Colombian Government Entity GAAP as in effect for fiscal year 2010, 2009 and 2008, the equity method is applied for investments where significant influence exists but the investment is not controlled. However, unlike U.S. GAAP, there is no 20% ownership requirement.
Employee benefit plans
There are significant differences in the measurement of expense and balance sheet amounts for employee benefit plans between Colombian Government Entity GAAP and U.S. GAAP. See “—Critical accounting policies and estimates—Pension payments and bonds” and Note 32 to our consolidated financial statements.
Investment securities
There are significant differences in the measurement of expense and balance sheet amounts for investments between Colombian Government Entity GAAP and U.S. GAAP. See Note 32 to our consolidated financial statements.
Provisions - allowances and contingences
There are significant differences in the measurement of expense and balance sheet amounts for provisions - allowances and contingences between Colombian Government Entity GAAP and U.S. GAAP. See Note 32 to our consolidated financial statements.
Cumulative Translation Adjustment
Under Colombian Government Entity GAAP, foreign currency investments held in a currency other than U.S. dollars must be remeasured to U.S. dollars prior to translating such financial information to Colombian pesos as the reporting currency. Any impact as a result of the translation process is recognized in equity as cumulative translation adjustments.
Under U.S. GAAP, investments in foreign currency must be remeasured to the functional currency with the effects recorded in the income statement and then translate them to the reporting currency with the effects recognized in equity as cumulative translation adjustments.
Liquidity and Capital Resources
Our principal sources of liquidity in 2010 were cash flows from operations amounting to Ps$14,356,812 million, and a Ps$1,000,000 million bond issuance. Our principal uses of liquidity in 2010 were Ps$10,319,975 million in capital expenditures, which included investments in natural and environmental resources and reserves, additions to our property, plant and equipment and dividend payments for the fiscal year 2010 amounting to Ps$3,789,828 million. We believe that our financial performance driven by high production and favorable prices has resulted in cash generation sufficient to fund our operational activities and our investment and other plans and has enabled us to make investments in other companies without incurring additional indebtedness.
At December 31, 2010, we had consolidated indebtedness of Ps$8,912,884 million, which corresponded mainly to:
| | · | A Ps$2.2 trillion (approximately US$1 billion) syndicated loan facility with a syndicate of local banks in May 2009. This loan facility has a term of seven years with a two year grace period. The interest rate under the facility equals the fixed term deposit rate (DTF) plus an additional 4% (the anticipated quarterly interest rate). Amortization is bi-annual under the loan. In addition, as guarantee for the loan, we pledged our direct stock in Reficar (which was 49% of the total shares at the time of the loan), Ocensa and Propileno del Caribe (Propilco). We used the proceeds from this loan to finance our strategic plan. |
| | · | An issuance of US$1,500 million aggregate principal amounts of 7.625% Notes Due 2019 (the “Original Notes”) on July 23, 2009. The Original Notes were issued pursuant to Rule 144A/ Regulation S with registration rights with the SEC. The Original Notes were subsequently registered with the SEC on September 3, 2009 (the “Registered Notes”). Concurrently with this registration, we commenced an exchange offer to exchange up to U.S.$1.5 billion aggregate principal amount of the Registered Notes for an equal principal amount of our outstanding Original Notes under the terms and subject to the conditions set forth in a prospectus dated September 3, 2009. The exchange offer was carried out in compliance with the obligations acquired by us under the Registration Rights Agreement referred to in the prospectus. The exchange offer expired on October 2, 2009. Bonds exchange requests were received in an aggregate amount of US$1,492,541,000. On October 7, 2009, we issued an aggregate amount of US$1,492,541,000 in Registered Notes and cancelled an aggregate amount of US$1,492,541,000 in Original Notes. The Registered Notes were listed on the NYSE. |
| | · | Four treasury loans of Ps$385,000 million (approximately US$203 million) in four disbursements between October and November 2010, with an interest rate of DTF plus an additional rate between 1.3% and 1.5% (the anticipated quarterly interest rate). The facility has a one year bullet amortization and bi-annual payments of interest. We used the proceeds from these loans to finance working capital in Reficar. |
| | · | A local issuance of Ps$1.0 trillion (approximately US$ 500 million) notes on December 1, 2010. The notes were issued in four tranches with maturities of 5, 7, 10 and 30 years and with variable interest rate based on the Consumer Price Index (IPC) plus additional spreads of 2.80%, 3.30%, 3.94%, 4.90% respectively. The notes have bi-annual payments of interest and bullet amortization. We used the proceeds from the offering of these notes to finance our capital expenditures in 2010. |
ODL, our indirect Panamanian subsidiary, through its Colombian branch office, Oleoducto de los Llanos Orientales Sucursal Colombia, entered into a Ps$520,000 million (approximately US$200 million) loan facility with Banco de Bogota S.A., Banco de Occidente S.A., Banco Popular S.A. and Banco AV Villas S.A., which together comprise the Grupo Aval, in March 2009. This loan facility (which has been paid in full) had a term of five years, including a one-year grace period, and its proceeds were used to finance part of the Rubiales pipeline described in “Item 4. Information on the Company—Overview by Business Segment—Transportation—Pipelines—Oleoducto de los Llanos Orientales.” The interest rate under the facility equaled the fixed term deposit rate (DTF) plus an additional 5% (the anticipated quarterly interest rate). In October 2009 Oleoducto de los Llanos Orientales Sucursal Colombia also placed a series of notes in an aggregate principal amount equal to Ps$500,000 million (approximately US$260 million) through a Dutch auction; the notes have a maturity of seven years and a variable interest rate based on the consumer price index plus an additional spread of 4.88%. In May 2010 Oleoducto de los Llanos Orientales Sucursal Colombia entered into a second Ps$800,000 million (approximately US$406 million) loan facility with Grupo Aval. The interest rate under the new facility equals the fixed term deposit rate (DTF) plus an additional 4% (the anticipated quarterly interest rate). This loan facility has a term of seven years with a two-year grace period and the principal amount will be amortized in 20 equal quarterly payments. As guarantee for the second loan, Oleoducto de los Llanos Orientales Sucursal Colombia pledged its economic rights to certain finance tariffs it is entitled to receive under its Ship-or-Pay Contracts. The proceeds from this second credit facility were used to fully pay the first credit facility with Grupo Aval and any remaining amount was allocated to finance part of the Rubiales pipeline. See “Item 4. Information on the Company—Overview by Business Segment—Transportation—Pipelines— Oleoducto de los Llanos Orientales.”
Ocensa entered into a Ps$1,200,000 million (approximately US$631 million) loan facility with a syndicate of local banks, comprised of Bancolombia S.A., Banco de Bogota S.A., Banco de Occidente S.A., Banco Popular S.A., Banco AV Villas S.A., Banco Davivienda S.A., Banco Bilbao Vizcaya Argentaria Colombia (BBVA) S.A., Banco Agrario de Colombia S.A., Banco Santander S.A. and Helm Bank S.A., in March 2010. This loan facility has a term of seven years and its proceeds were used to (i) increase Ocensa’s transportation capacity and (ii) return equity to Ocensa’s shareholders. The interest rate under the facility equals the fixed term deposit rate (DTF) plus an additional 4%.
In December 2010, we incorporated a wholly-owned subsidiary to serve as an investment vehicle for the Corporate Group, Ecopetrol Capital AG, with principle domicile in Zurich, Switzerland.
Use of Funds
Capital expenditures
The following table sets forth our consolidated capital expenditures for each of our business segments for 2010, 2009 and 2008.
| | | For the Year ended December 31, | |
| | | | | | | | | | |
| | | (Pesos in millions) | |
| Exploration & production | | | 5,878,246 | | | | 5,564,438 | | | | 4,911,487 | |
| Refining and Petrochemicals | | | 2,084,554 | | | | 2,710,526 | (1) | | | 776,080 | |
| Transportation | | | 2,351,662 | | | | 2,269,540 | (2) | | | 939,996 | |
| Corporate | | | - | | | | 197,237 | | | | 69,483 | |
| Marketing and Supply | | | 5,513 | | | | 8,455 | | | | 7,549 | |
| Total | | | 10,319,975 | | | | 10,750,197 | | | | 6,704,595 | |
| (1) | Does not include Ps$868,053 million corresponding to our initial share ownership in Reficar. |
| (2) | Does not include (i) Ps$636,832 million corresponding to non-controlling interest capital expenditures and Ps$528,207 million corresponding to our initial share ownership in Ocensa and (ii) Ps$31,087 million corresponding to non-controlling interest capital expenditures and Ps$36,287 million corresponding to our initial share ownership in ODC. |
The budget for our 2011-2020 capital expenditures is approximately US$80 billion distributed by business segment. See “Item 4. Information on the Company��The Company—Strategic Plan.”
The Ecopetrol S.A. investment plan (unconsolidated) for 2011 includes approved expenditures in the amount of US$6,738 million as well as a contingent budget in the amount of US$1,807 million for projects still in the development stage, for which approval by our Board of Directors may take place on a project-by-project basis. Of the possible US$8,545 million investment for 2011, US$1,512 million is designated for intercompany contributions and loans to the Company’s subsidiaries and does not include funds for possible acquisitions. 95% of investments will be made in Colombia and the remaining 5% for exploration and production projects along the U.S. Gulf Coast, Brazil and Peru. As in prior years, the majority of investments (60%) are intended for exploration and production. An additional US$4,239 million is expected to be invested by our subsidiaries, Reficar (47%), OBC (24%), Ecopetrol America Inc (8%) and Savia (8%) through the cash generation of the individual companies, commercial financing and third party or partner contributions in addition to the US$1,512 million contributed by Ecopetrol S.A. Consequently, on a consolidated basis, we will invest US$10,618 million in 2011, of which 66% of the investment is for Ecopetrol S.A. and the remaining 34% will be invested through subsidiaries and affiliates. The Ecopetrol S.A. 2011 investment plan would require a financing of US$6,060 million at the Ecopetrol S.A. level (unconsolidated) and an estimated financing of US$1,458 million for our subsidiaries and affiliates.
Based on the current price of oil, we expect our existing and anticipated working capital, capital expenditure requirements and declared dividend payments to be met from our cash flows from operations and cash in hand. We may also access local and international financial markets to fund part of our capital expenditures. We believe such funding will be available and that we will be able to fund our investment plan. See “Item 3—Key Information—Risk Factors—Risks related to our business.” Furthermore, we may decide to access the equity markets through the issuance of an additional 9.9% of our common stock as authorized by law 1118 of 2006, or through credit facilities with commercial banks, export development credits, and sale of shares in non-strategic assets. The schedule for carrying out the 2011 investment plan will depend on our cash generating activities, capital market conditions, execution of the investment budget in the various business areas and possible acquisitions. Our investment plan for 2011 and anticipated capital expenditures in future years may change based on market and other conditions and our results of operations and financial resources.
Cash from operating activities
Net cash provided by operating activities increased by 54% in 2010 compared to 2009 as a result of an increase in the average price of crude oil and natural gas, which resulted in a 38% increase in our total revenues. Net cash provided by operating activities decreased by 10.4% in 2009 compared to 2008 as a result of a decrease in the average price of crude oil and natural gas, which resulted in a 10.3% decrease in our total revenues.
Cash used in investing activities
Net cash used in investing activities increased in 2010 compared to 2009 mainly as a result of (i) increases in our investments as contemplated in our Strategic Plan, (ii) decreases in our redemption and sale of investments and (iii) payments made for the acquisition of BP Exploration Company Limited (now Equion Energia Limited). These investments were partially funded by cash provided by our portfolio investments, which totaled PS$11,809 billion.
Net cash used in investing activities decreased in 2009 compared to 2008 mainly as a result of (i) decreases in our purchases of investments and our redemption and sale of our investments and (ii) increases in our investments in natural and environmental resources.
Cash used in financing activities
Net cash used in financing activities decreased in 2010 compared to 2009 mainly due to the decrease in payments of our dividends, partially offset by the decrease in our financial obligations as a result of less incurrence of indebtedness. See “—Liquidity and Capital Resources.” Net cash used in financing activities decreased in 2009 compared to 2008 mainly due to the increase in our financial obligations as a result of our incurrence of indebtedness in 2009.
Dividends
In 2010, we paid dividends of Ps$3,789,828 million to our shareholders, including the Nation. On March 24, 2011, our shareholders at the ordinary general shareholders’ meeting approved dividends for the fiscal year ended December 31, 2010, amounting to Ps$5,868,514 million, or Ps$145.00 per share, based on the number of outstanding shares at December 31, 2010. Dividends declared will be paid in three installments. The first payment was made in April, and the second and third payments will be made in July and October 2011, respectively.
Research and Development, Patents and Licenses, etc.
Our research and development activities are conducted by the Instituto Colombiano del Petróleo (ICP) or the Institute, our research and development unit. Our activities are focused on developing technology solutions for us and the Colombian oil industry. Each year, we present to the Instituto Colombiano para el Desarrollo de la Ciencia y la Tecnología (COLCIENCIAS) our research and development projects in order to get a certification for our investment in science and technology. In 2010, 2009 and 2008, COLCIENCIAS recognized investments of US$46.5 million, US$50.8 million and US$31.6 million respectively in science and technology projects. Our total investment in science and technology during 2010 was approximately US$69.1 million, of which approximately US$28.59 million corresponded to ten projects in research and development related to air injection in fields, exploration processes in offshore exploration biofuels and petrochemicals. In 2009 we invested approximately US$63 million, and in 2008 we invested approximately US$46.5 million.
We currently own 22 patents in Colombia, the United States, Venezuela, Ecuador, Brazil and Nigeria; of the four patents granted in 2010, two were granted by the government of Nigeria. In 2010, we filed for 21 new patents in various countries, including Colombia. One of our most significant patents for which we filed in 2009, when we filed 39 applications, is an anti-theft patent which allowed us to reduce fuel oil and crude oil theft by 50% in 2009 compared to 2008. Most of our patents will expire between 2015 and 2017. In first half 2011, we obtained one additional patent.
During 2010, nine new commercial brands were granted to us. In 2009, we were also granted 12 new commercial brands, adding to the eight brands we had previously (which existing brands have been renewed for an additional ten-year period). In 2011, we have granted two new brands, and we have in total 33 brands.
In 2010, the ICP’s Technical Information Center became one of the first specialized information units in the oil and gas sector in Latin America to receive the certification in the System of Information Security Management under the NTC/ISO 27001:2005, standard granted by the Instituto Colombiano de Normas Tecnicas, or ICONTEC, a Colombian National Standards organization.
Off-Balance Sheet Arrangements
Under Colombian Government Entity GAAP we do not have any off-balance sheet arrangements.
Tabular Disclosure of Contractual Obligations
Contractual Obligations
We enter into various commitments and contractual obligations that may require future cash payments. The following table summarizes our contractual obligations at December 31, 2010.
| | | | |
| | | | | | | | | | | | | | | | |
| | | (Pesos in millions) | |
| Contractual Obligations: | | | | | | | | | | | | | | | |
| Pension Plan Obligations | | | 17,966,975 | | | | 650,333 | | | | 1,392,797 | | | | 1,481,017 | | | | 14,442,828 | |
| Contract Service Obligations | | | 1,912,454 | | | | 838,161 | | | | 939,130 | | | | 38,792 | | | | 96,372 | |
| Operating Lease Obligations | | | 8,773 | | | | 8,773 | | | | — | | | | — | | | | — | |
| Natural Gas Supply Agreements | | | 1,096,862 | | | | 69,261 | | | | 318,702 | | | | 236,702 | | | | 472,196 | |
| Purchase Obligations | | | 508,172 | | | | 305,328 | | | | 202,844 | | | | — | | | | — | |
| Energy Supply Agreements | | | 629,999 | | | | 248,427 | | | | 324,525 | | | | 43,163 | | | | 13,885 | |
| Capital expenditures | | | 1,992,007 | | | | 1,314,863 | | | | 674,750 | | | | 2,394 | | | | — | |
| Build, Operate, Maintain and Transfer Contracts (BOMT) | | | 274,221 | | | | 43,259 | | | | 80,077 | | | | 80,379 | | | | 70,506 | |
| Capital (Finance) Lease Obligations | | | 56,007 | | | | 21,800 | | | | 26,257 | | | | 7,950 | | | | — | |
| Financial Sector Debt | | | 8,366,955 | | | | 1,073,756 | | | | 4,543,266 | | | | 2,488,377 | | | | 261,556 | |
| Bonds | | | 6,962,653 | | | | 290,718 | | | | 872,356 | | | | 672,924 | | | | 5,126,655 | |
| Total | | | 39,775,078 | | | | 4,864,680 | | | | 9,374,703 | | | | 5,051,697 | | | | 20,483,998 | |
| ITEM 6. | Directors, Senior Management and Employees |
Directors and Senior Management
The information below sets forth the names and business experience of each of our Directors, executive officers and senior management, as of the date hereof:
Directors of Ecopetrol
The following are our current Directors as elected at the shareholders’ meeting held on March 24, 2011. On June 19, 2011, David Rojas passed away. A substitute to take his place may be determined by our shareholders at an extraordinary meeting. Mr. Rojas was member of our Audit, Compensation and Nomination, and Corporate Governance and Sustainability Committees.
Minister of Mines and Energy of Colombia, Carlos Rodado (67) has been a member of our Board of Directors since August 24, 2010. Mr. Rodado has a degree in civil engineering from the Universidad Nacional de Colombia. He also earned a masters degree in Economics from Universidad de los Andes in 1969 and a Ph.D. in Economics from the University of Michigan in 1973. Mr. Rodado occupied the post of Minister of Mines and Energy for the first time in 1981. Between 1982 and 1986, he worked as an economic consultant and constructor. Later, in 1986, he was elected Chamber Representative by the Department of Atlántico. In 1991 he was part of the National Constituent Assembly. In 1998 Carlos Rodado was appointed as President of Ecopetrol S.A. until 1999, when he accepted the post of Principal of the Colombian School of Engineering. In 2004 he was elected Governor of the Department of Atlántico. Four years after, he was given the Ambassador of Colombia to Spain. Furthermore, he has been a member of various Boards of Directors of important Colombian companies, such as: Ecopetrol, Carbocol, ISA, Ingeominas and FEN, among others. Mr. Rodado has been distinguished with some important awards. He has published various economic treatises, and more than 300 articles, in some of the most important diaries and magazines of Colombia. Mr. Rodado was nominated as a director by the Nation.
Minister of Finance and Public Credit of Colombia, Juan C. Echeverry (48) has been a member of our Board of Directors since August 24, 2010. Mr. Echeverry is a Macroeconomist and university professor experienced in economic and political analysis of Colombia and Latin America. He has worked as an advisor of international banks and financial institutions while working for Latin Source, a New York based consultancy, and Econcept, a Bogotá based consultancy. Mr. Echeverry is an expert witness in international and Colombian litigations in topics of infrastructure concessions and finance. He has published papers in different fields of economics, in specialized journals, and a book about the Colombian economy. He has been a member of the Board of Directors of Mazda Colombia, Holcim and Interbolsa. Mr. Echeverry is a weekly editorialist of CNN en Español (Atlanta) and El Tiempo newspaper (Bogotá). He was Minister of Economic Planning of Colombia and Dean of Economics at Universidad de los Andes. Mr. Echeverry earned a degree in economics from los Andes University, Bogotá – Colombia, a master’s degree in International Economic Policy from Economic World Institute, Kiel - Germany, and later obtained a Ph. D. in economics from New York University. He also earned a degree in Philosophy from Universidad Complutense, Madrid – España. He has earned several awards and academic distinctions, such as Cruz de Boyacá, Gran Caballero, which is the highest award of the Colombian Government; Best professor of Universidad de los Andes; Best Lecturer, New York University, Economics Department; a Scholarship, awarded by the Central Bank of Colombia for studies at New York University; and a Scholarship awarded by Deutsche Ausland Austausch Dienst, for studies in Germany, among others. Mr. Echeverry was nominated as a director by the Nation.
Director of the National Planning Agency of Colombia, Hernando J. Gómez (54) has been a member of our Board of Directors since August 2010. Mr. Gómez has served as Director of the National Planning Agency of Colombia since August, 2010. Mr. Gómez has been Colombian Minister of Economic Planning and President of the Colombian Council of Competitiveness. He was Chief Negotiator for the Andean Free Trade Agreement. Mr. Gómez has professional experience in central banking, public organizations and Policy Making. He has had main responsibilities in macroeconomic programming, and in the design and implementation of economic and price stabilization programs, financial, coffee and housing sector policies. From April 2000 to December 2003, he participated in the mission of Colombia at the World Trade Organization (WTO), as Ambassador. Mr. Gómez was the Head of mission and negotiations for Colombia at the WTO. He has participated in launching the multilateral trade negotiation in Doha and was chair of several committees of the WTO. Mr. Gómez has served as a member of several private and public institutions’ board of directors. He earned degrees in economics from Yale University including a M. Phil. and M.A. in Economics. Mr. Gómez was nominated as a director by the Nation.
Fabio Echeverri (78) has been a member of our Board of Directors since September 16, 2002. From 1957 to 1962, Mr. Echeverri worked as the President of Banco de Colombia and Banco Comercial Antioqueño. Since then, he has held various positions in the private and public sectors, serving as President of Siderurgica de Medellin, Director of the National Association of Industries (ANDI), the Latin American Association of Industries (AILA), and the Andean Confederation of Industries (CONANDI), and as a member of the Inter-American Council of Commerce and Production, a position that he held for over 18 years. Mr. Echeverri is currently a member of the Board of Directors of the Shaio Clinic, Telecom-Colombia and Frigoríficos Ganaderos de Colombia S.A. During his career, Mr. Echeverri has been a chairman of the Board of Directors of Fondo Ganadero de Antioquia; and chairman of the Board of Directors of Siemens S.A., among others. Mr. Echeverri earned degrees in economics from Universidad Jorge Tadeo Lozano. Mr. Echeverri was nominated as an independent director by the Nation.
Joaquin Moreno (62) has been a member of our Board of Directors since March 27, 2008. Mr. Moreno worked for 33 years for the Royal Dutch/Shell Group. He held various positions such as Project Manager in Colombia; Project and Operations Manager and Marketing and Operations Manager of Shell Química de Venezuela; Director of Marketing for agrochemical products and Global Marketing Manager for petrochemical products at Shell Centre–Shell International Chemicals Company in London; Director of Shell Venezuela S.A.; Director of Shell Colombia S.A. and Director of Cerromatoso S.A., and Strategic Planning Director for Exploration and Production in Europe and the Middle East at the Shell offices in the Netherlands. Mr. Moreno has also served as Country Chairman and President for Shell in Mexico, Colombia and Venezuela. Mr. Moreno has been a member of various Boards of Directors of local and international companies. Mr. Moreno earned a degree in civil engineering from Universidad Industrial de Santander and completed a program in advanced management at Harvard University. He was nominated as an independent director by the Nation.
Federico Rengifo (57) has been a member of our board of directors since March 24, 2011. Mr. Rengifo has been Acting Vice-minister in the Ministry of Finance and in the Ministry of Mines and Energy of Colombia. He has also served as Executive President of Banco de Colombia, President of Compañia Financiera Internacional S.A., and he has been member of the Council of Cali, a city in the Valle del Cauca region of Colombia, among others. Mr. Rengifo has participated in several boards of directors of the financial and public sectors. Mr. Rengifo is a member of the Board of Directors of the Autorregulador del Mercado de Valores de Colombia – AMV, Finesa S.A., Banasan S.A., and Frutesa S.A. He is also member of the Investors’ Committee of the Titularizadora Colombiana S.A., and the Consejo Gremial Nacional. Mr. Rengifo has been the President of the Trustee Association of Colombia (Asociación de Fiduciarias de Colombia) since 2002. He earned a degree as Lawyer of Javeriana University and a master´s degree in Social - Economic Sciences. Mr. Rengifo was nominated as an independent director by the Nation.
Henry Medina (37) has been a member of our board of directors since March 24, 2011. Mr. Medina has worked for over 15 years at BP where he held various international positions including CEO of the Andean Business (Colombia and Venezuela), Commercial & Financial Vice-President for the Andean Business, Planning and Performance Manager for the Russia SPU based in Houston, Commercial Manager for the Southern North Sea Performance Unit based in Aberdeen, UK. Executive Assistant to Group Vice President of Latin America & the Caribbean in Buenos Aires, Argentina and London, UK; among others. Mr. Medina was lead negotiator for the sale of BP’s interests in Colombia during 2010 and also was the Operations Lead for the re-structuring of BP’s E&P global business (2009-2010). Mr. Medina has served as a member of the Board of Directors of Oleoducto Central S.A. and Transgas de Occidente, he was member of the Phoenix Institute between 1995 and 1996 and Founder and Manager of an Agro-Industrial Business between 1995 and 2000. He earned a degree in Industrial Engineering in 1997 from Universidad de los Andes and later obtained a degree in Economics and Economic Law from Universidad Externado de Colombia. Mr. Medina was nominated as an independent director by the Nation.
Mauricio Cárdenas (49) has been a member of our Board of Directors since March 27, 2008. Mr. Cárdenas is also a Director of the Latin America Brooking Institution; he has served as the executive director of Fundación para la Educación Superior y el Desarrollo, or FEDESARROLLO. Mr. Cárdenas served as President of Empresa de Energía de Bogota, Minister of Economic Development of Colombia, Minister of Transportation and Director of the National Planning Agency of Colombia. Mr. Cárdenas was also a visiting professor for the Center of International Development at Harvard University from March to June 2001 and has held several positions as a researcher and a professor at various universities. Mr. Cárdenas earned a degree and a master’s degree in economics from Universidad de los Andes and later obtained a Ph.D. in economics from the University of California, Berkeley. In accordance with the Declaration of the Nation dated July 26, 2007, Mr. Cárdenas was nominated by the Nation as an independent director representing the ten largest minority shareholders.
Officers and Senior Management of Ecopetrol
The following presents information concerning our executive officers and senior management.
Javier Gutiérrez (60) has served as our President and Chief Executive Officer since January 22, 2007. Prior to becoming our CEO, Mr. Gutiérrez served as CEO of Empresa de Interconexión Eléctrica S.A. ESP (ISA) since 1992 where he started in the planning department in 1975. Mr. Gutiérrez also worked as Vice-President of the Colombian Commission for Regional Electric Integration from 1995 to 1997. In 2002, Mr. Gutiérrez received an award from the Portafolio economic journal as the “Best Enterprise Leader in Colombia”. In 2005 the América Economía Journal granted Mr. Gutiérrez an award of excellence and in the same year La República, a renowned financial journal in Colombia, ranked Mr. Gutiérrez among Colombia’s top 10 executives. In 2008, Mr. Gutiérrez was recognized as the enterprise leader with the best reputation in Colombia by the Spanish Monitor of Corporate Reputation (MERCO). Mr. Gutiérrez earned a degree in civil engineering, a master’s degree in industrial engineering from Universidad de los Andes and a specialization degree in finance from Universidad EAFIT. Mr. Gutierrez has worked as a part-time professor of statistics and research at Universidad de los Andes and as a professor of operational research at Universidad EAFIT.
Adriana Echeverri (41) joined us in 1994, and has served as our Chief Financial Officer since September 2006. Prior to being appointed as our CFO, Mrs. Echeverri worked as Chief of the Finance and Treasury Unit from September 2003 to September 2006. She earned a degree in finance and foreign affairs and an MBA from Universidad Externado de Colombia.
Margarita Obregon (54) joined Ecopetrol in 2000 and has served as the Secretary of the Board of Directors and as Chief to the Support Office of the Chief Executive Officer since 2008. Prior to joining us, Mrs. Obregon worked in the supply department of Previsora S.A: Compañía de Seguros and as legal advisor of lands for British Petroleum Company – BP in Alvaro Rengifo y Cia. Mrs. Obregon also served as the head of the Business and Administration department of the Fiduciaria del Estado. Mrs. Obregon earned a law degree from Colegio Mayor de Nuestra Señora del Rosario with specialization degrees in financial law and administration law.
Hector Manosalva (49) is a petroleum engineer, graduated from the Fundacion Universidad de America, and completed post-graduate studies in Finance at the Universidad EAFIT and in Executive Management at the Universidad de los Andes. Mr. Manosalva joined Ecopetrol in 1986. Over the course of his career at Ecopetrol, Mr. Manosalva has served as Chief of Production, Head of the Division of Planning, Production Manager of the South Region, Director of Corporate Social Responsibility, Advisor to the Office of the President of the Republic for the Protection of Energy Infrastructure, Production Manager of the Central Region and, most recently, as Vice President of Production. He was appointed second alternate president of the Company in 2010.
Pedro Rosales (47) joined us in 1989, and has served as our Downstream Executive Vice-President since February 2008. Mr. Rosales is responsible for the following businesses: refining, petrochemicals, transportation and logistics, marketing and distribution, biofuels and gas. Mr. Rosales has held several positions in the Company within the areas of maintenance, operations, projects, planning and administration. Prior to becoming our Downstream Executive Vice-President, Mr. Rosales served as our Vice-President of Transportation since January 2003 and as our Chief Operation Officer since 2006. Mr. Rosales is a member of the board of directors of Refinería de Cartagena S.A. (Reficar), Oleoducto Central S.A. (Ocensa), Propileno del Caribe (Propilco) and Empresa de Energía de Bogotá (EEB). Mr. Rosales earned a degree in mechanical engineering and an MBA from Universidad de los Andes.
Hector Castaño (49) joined us in 1988 and has served as our Production Vice-President since 2011. Mr. Castaño earned a degree in petroleum engineering from Universidad Nacional and a specialization degree in management from Universidad Sur Colombiana de Neiva. He has held a number of positions in Ecopetrol, including Director of Production in the Central region, in the Southern region and in the Mid-Magdalena Valley region.
Enrique Velasquez (58) joined us in June 2008 and has served as our Exploration Vice-President since September 2010. Mr. Velasquez earned a degree in geology from Universidad Nacional, a specialization degree in financial management from Universidad EAN and a specialization degree in high management from Universidad de los Andes. In his 32 years of labor experience, he has held a number of positions in oil and gas companies, such as Oxy, Hocol, Sipetrol, Texaco, Exxon and Halliburton. He has served as our International Exploration Manager and National Exploration Manager.
Camilo Marulanda (32) joined us in 2003 and has served as our Vice-President of Strategy since 2009. Mr. Marulanda earned a degree in economics, a specialization degree in marketing and an MBA from Universidad de los Andes. He worked for Procter & Gamble Colombia from August 2001 to February 2003 as Category Manager. Prior to becoming our Vice-President of Strategy, Mr. Marulanda served as Chief of the Marketing Department since September 2003, Director of the National Commercialization unit since December 2004 and Vice-President of Supply and Marketing since December 2005.
Federico Maya (46) has served as our Vice-President of Refining and Petrochemicals since December 2005. Mr. Maya has held various positions at Ecopetrol over the last 20 years, including Marketing and Contract Coordinator for Ecopetrol’s Gas Department, member of the Corporate Planning Directory, and Chief of Supply and Marketing. Mr. Maya earned a degree in chemical engineering from Pontificia Universidad Bolivariana and a specialization degree in marketing from Universidad EAFIT.
Claudia Castellanos (47) has served as our Vice-President of Supply and Marketing since 2009. Mrs. Castellanos earned a degree in chemical engineering from Universidad Industrial de Santander and a specialization degree in energy resources management from Universidad Autónoma de Bucaramanga. She has worked in Ecopetrol for over 22 years as a process engineer at Reficar, where she also worked in the Finance Department. Prior to becoming our Vice-President of Supply and Marketing, Mrs. Castellanos was chief of our Gas Department for six years, where her focus was in the domestic and international commercialization of natural gas.
Alvaro Castañeda (48) has served as our Vice-President of Transportation since 2009. Mr. Castañeda earned a degree in metallurgical engineering, a specialization degree in international management of oil and gas and a master’s degree in administration from Universidad Autonoma de Bucaramanga and Instituto Tecnologico de Monterrey. He has worked for Ecopetrol for the last 20 years, and has held various positions within the company, including Plant Coordinator, Director of the Operations Department, Chief of the Centralized Operations Department and Director of Multipurpose Pipelines.
Martha Cecilia Castaño (42) joined us in 2004 and has served as our Vice-President of Human Resources since 2008. Prior to becoming our Human Resources Vice-President, Mrs. Castaño worked as Coordinator of Organizational Culture, Chief of the Leadership, Internal Communications and Cultural Unit and was also in charge of the Labor Relations Department. Mrs. Castaño earned a degree in social communications and a specialization degree in economics from Universidad de la Sabana. She has also worked in Acopi, El Tiempo, Uniandinos and Empresa de Telecomunicaciones de Bogotá (ETB), in several areas such as human resources management, corporate communications and labor relations.
Oscar Villadiego (46) joined us in 1986, and has served as Vice-President of Services and Technology since February 2008. He has held several positions in the Production Vice-Presidency in such areas as the crude oil reserves, development and human resources unit. He served as manager for the Central region for a period of 2.5 years, and as Technical Manager for the production Vice-Presidency for four years. Mr. Villadiego earned a degree in Petroleum Engineering from Universidad America in 1987.
Mauricio Echeverry (54) joined us in November 1999, and has served as our General Counsel since then. Mr. Echeverry held the positions of Dean, Associate Dean and Professor at Universidad de los Andes Law School. He was also Colombia’s Deputy General Prosecutor and Plenipotentiary Minister for Colombia’s Embassy in the U.S. Mr. Echeverry earned a law degree and a specialization degree in commercial law from Universidad de los Andes.
None of our Directors or executive officers has any familial relationship with any other director or executive officer.
Compensation
The total compensation paid to our Directors, executive officers and senior management during 2010 amounted to Ps$9,060 million.
Based on a resolution adopted at our 2008 annual shareholders’ meeting, board compensation for Board and/or committee meetings in person is set at the equivalent of four minimum monthly wage salaries, which totals approximately Ps$2,060,000 for 2010 and Ps$2,142,400 for 2011, minus VAT and Industry and Commerce taxes. Fees for attendance at virtual meetings are set at 50% of the in-person meeting fees.
Our Directors are not eligible to receive pension and retirement benefits from us. The total amount set aside to provide pension and retirement benefits to our eligible executive officers totals Ps$3,654,041,010.
Share Ownership
No individual Director or executive officer beneficially owns more than 1% of our outstanding shares.
Board Practices
Our Board of Directors is composed of nine members and is responsible for, among other things, establishing our general business policies. According to Colombian law, the members of the Board of Directors must be elected at the annual shareholders’ meeting for one-year terms in accordance with a proportional representation system similar to cumulative voting (through an electoral quota voting system – number of votes required to fill each position is calculated by dividing the number of possible votes by the number of open board positions) and may be reelected indefinitely. The members of the Board of Directors may be elected without an electoral quota voting system when there is unanimity. Pursuant to our bylaws, the Board of Directors’ positions are filled either by person or by position. Currently, we have three members appointed by their position: the Minister of Finance and Public Credit, the Minister of Mines and Energy and the Director of the National Planning Agency. Our current Directors were elected on March 24, 2011, although in connection with the election of the new president of Colombia in July 2010, the Minister of Finance and Public Credit, the Minister of Mines and Energy and the Director of the National Planning Agency were appointed to their respective decisions and initially appointed to the Board of Directors during an ordinary meeting of the Board of Directors in August 2010. Directors may be removed without cause at any moment by a majority of the shareholders present at a general shareholders’ meeting. Our executive officers are appointed by our Board of Directors.
The compensation of our Directors is set annually and exclusively by the general shareholders’ meeting. Colombian law prohibits Directors from receiving corporate loans. Directors are compensated for attending board meetings and committee meetings. A Board meeting requires a quorum of at least five members and decisions are approved with a majority of the members present. None of the service contracts of any of our Directors contain provisions for benefits upon termination of such director’s services.
Under Colombian law, a director or executive officer must disclose any transaction involving a conflict of interest to the general shareholders’ meeting. The general shareholders’ meeting may approve or reject the transaction giving rise to the conflict with the vote of the majority of the shares present at the shareholders’ meeting. If the director or executive officer with a conflict is a shareholder, his or her vote will be excluded. We disclose conflicts of interest of our employees, executive officers and directors in the annual report presented at the shareholders’ annual meeting in our Corporate Governance Report and the Board of Directors Report.
Neither our bylaws nor our code of corporate governance provide a minimum retirement age for our Directors. Under our bylaws there is no requirement for a person to have a minimum number of shares to be considered as a director. Colombian law provides that Directors willing to sell or purchase shares in our company require a prior authorization of the Board of Directors. Colombian law does not impose any limitation as to the number of shares that may be acquired by a director.
Pursuant to our bylaws, our Board of Directors has four committees (Audit Committee, Corporate Governance and Sustainability Committee, Nomination and Compensation Committee and Business Committee), which establish guidelines, set specific actions and evaluate and submit proposals designed to improve performances in the areas under their supervision and control. These committees are comprised of at least three members of the Board of Directors who are appointed by the Board of Directors. In addition to applicable regulations, the committees also have their own specific regulations that establish their purposes, duties and responsibilities.
The following table sets forth the current members of our committees:
| | Compensation and Nomination Committee(2) | | Corporate Governance and Sustainability Committee |
| Joaquin Moreno | | Henry Medina | | Joaquin Moreno |
| Mauricio Cárdenas | | Fabio Echeverri | | Henry Medina |
| Federico Rengifo | | | | Minister of Finance and Public Credit |
| Henry Medina | | | | |
| | | | | |
| | | | |
| Joaquin Moreno | | | | |
| Mauricio Cárdenas | | | | |
| Federico Rengifo | | | | |
| Henry Medina | | | | |
| Director of the National Planning Agency | | | | |
| (1) | All members of our audit committee must be independent. |
| (2) | On June 19, 2011, David Rojas, who was member of our Audit, Compensation and Nomination, and Corporate Governance and Sustainability Committees, passed away. The Board of Directors will determine, in a meeting to take place in July 2011, the new member of our Compensation and Nomination Committee so that the committee has a minimum of three members. |
Audit Committee
Our audit committee, comprised of four independent Directors, is the highest internal control body of our Company and provides support to our Board of Directors in accounting and financial matters. It is in charge of guaranteeing the design, implementation and supervision of our internal control over financial reporting. It also supervises the reserves certification process, approves the Hydrocarbons Reserves Report and provides support for the Board in analyzing topics related to financial matters, risks, control environment and assessment of the Company’s internal and external auditors.
All committee members are required to be knowledgeable in accounting matters and at least one of them is required to be an expert in financial and accounting matters.
Compensation and Nomination Committee
Our compensation and nominating committee, comprised of three members, including at least one independent director, provides general guidelines for selection and compensation of our executive officers and employees. Since each committee of our Board of Directors must have a minimum of three members, a replacement for Mr. David Rojas, who passed away on June 19, 2011, will be appointed by the Board of Directors at a meeting to take place in July 2011.
Corporate Governance and Sustainability Committee
Our corporate governance and sustainability committee, comprised of three members, including at least one independent director, makes corporate governance proposals to our Board to ensure and supervise the fulfillment of the good corporate governance practices of the Company according to the Company’s Code of Good Corporate Governance.
Business Committee
Our business committee, comprised of five members, including at least one independent director, was created to assist the Board in analyzing potential business ventures. Based on its delegation of power, the committee studies, analyzes and approves capital expenditure policies, major investment projects, strategy, new business and other matters which would help the Company move forward in its efforts towards the consolidation of its strategy. The primary criteria used in the committee’s decision-making are the optimization of the Company’s portfolio and the proper allocation of its resources.
Employees
At December 31, 2010, we had 6,744 employees. The collective bargaining agreement entered into between us and our three main labor unions governs the labor relations of our unionized employees, which was 2,116 employees on December 31, 2010. Agreement 01 of 1977 governs the labor relations of our employees devoted to technical and trustworthy activities, which numbered 4,628 employees on December 31, 2010. The collective bargaining agreement and Agreement 01 of 1977 do not vary significantly in benefits or economic benefits. Employees hired before January 29, 2003, have a special retirement plan and those hired after January 29, 2003, are subject to Law 100 with respect to their retirement scheme.
Most of our employees are located in Colombia. To support our corporate growth strategy, we increased the total number of Ecopetrol S.A. employees by 0.73% from 6,695 in 2009 to 6,744 in 2010. The table below presents the number of Ecopetrol S.A.’s employees (unconsolidated) and the average number of employees by business segments for the years ended December 31, 2010, 2009 and 2008:
December 2010(a) | | Direct Employees (full time) | | | Direct Employees average(2) | | | Temporary Employees | |
| Exploration and Production | | | | | | | | | |
| Exploration | | | 133 | | | | 133 | | | | - | |
| Production | | | 1,460 | | | | 1,439 | | | | 46 | |
| Others | | | 283 | | | | 276 | | | | 8 | |
| Total Exploration and Production | | | 1,876 | | | | 1,848 | | | | 54 | |
| Downstream | | | | | | | | | | | | |
| Refining | | | 2,000 | | | | 2,070 | | | | 137 | |
| Transport | | | 856 | | | | 861 | | | | 67 | |
| Marketing | | | 159 | | | | 157 | | | | 3 | |
| Others | | | 17 | | | | 17 | | | | - | |
| Total Downstream | | | 3,032 | | | | 3,105 | | | | 207 | |
| Corporate | | | 1,836 | | | | 1,862 | | | | 118 | |
TOTAL(1) | | | 6,744 | | | | 6,815 | | | | 379 | |
| | | | | | | | | | | | | |
December 2009(b) | | Direct Employees (full time) | | | Direct Employees average(2) | | | Temporary Employees | |
| Exploration and Production | | | | | | | | | | | | |
| Exploration | | | 130 | | | | 123 | | | | - | |
| Production | | | 1,369 | | | | 1,372 | | | | 57 | |
| Others | | | 240 | | | | 238 | | | | - | |
| Total Exploration and Production | | | 1,739 | | | | 1,733 | | | | 57 | |
| Downstream | | | | | | | | | | | | |
| Refining | | | 2,080 | | | | 2,073 | | | | 220 | |
| Transport | | | 869 | | | | 858 | | | | 72 | |
| Marketing | | | 150 | | | | 147 | | | | 1 | |
| Others | | | 18 | | | | 18 | | | | - | |
| Total Downstream | | | 3,117 | | | | 3,096 | | | | 293 | |
| Corporate | | | 1,839 | | | | 1,849 | | | | 117 | |
TOTAL(1) | | | 6,695 | | | | 6,678 | | | | 467 | |
December 2008(c) | | Direct Employees (full time) | | | Direct Employees average(2) | | | Temporary Employees | |
| Exploration and Production | | | | | | | | | |
| Exploration | | | 108 | | | | 100 | | | | - | |
| Production | | | 1343 | | | | 1,305 | | | | 94 | |
| Others | | | 215 | | | | 124 | | | | - | |
| Total Exploration and Production | | | 1666 | | | | 1,529 | | | | 94 | |
| Downstream | | | | | | | | | | | | |
| Refining | | | 2,056 | | | | 1,991 | | | | 212 | |
| Transport | | | 580 | | | | 812 | | | | 65 | |
| Marketing | | | 141 | | | | 123 | | | | 0 | |
| Others | | | 14 | | | | 9 | | | | 0 | |
| Total Downstream | | | 3,061 | | | | 2,935 | | | | 277 | |
| Corporate | | | 1,790 | | | | 1,700 | | | | 130 | |
TOTAL(1) | | | 6,517 | | | | 6,164 | | | | 501 | |
| (1) | Totals are as of the last day of each month. |
| (2) | Averages are calculated on a monthly basis from January to December of each year. |
| (a) | 592 persons employed by us during 2010 were not included in our 2010 employee statistics as they were involved in intermittent, non-regular activities and do not classify as temporary employees. |
| (b) | 279 persons employed by us during 2009 were not included in our 2009 employee statistics as they were involved in intermittent, non-regular activities and do not classify as temporary employees. |
| (c) | 60 persons employed by us during 2008 were not included in our 2008 employee statistics as they were involved in intermittent, non-regular activities and do not classify as temporary employees. |
The following table sets forth the number of employees of each of our subsidiaries for the years ended December 31, 2010, 2009 and 2008:
| December 2010 | | Direct Employees (full time) | |
| Ecopetrol America Inc. | | | 10 | |
| Bioenergy S.A. | | | 83 | |
| Bioenergy Zona Franca S.A.S | | | 19 | |
| Hocol S.A. | | | 192 | |
| Oleoducto Central S.A. | | | 133 | |
| Oleoducto de Colombia S.A. | | | 1 | |
Oleoducto de los Llanos S.A.(1) | | | 17 | |
| Ecopetrol del Perú S.A. | | | 6 | |
| Refinería de Cartagena S.A. | | | 122 | |
| Ecopetrol Oleo e Gas do Brasil Ltda. | | | 3 | |
| Propilco S.A. | | | 245 | |
TOTAL SUBSIDIARIES(2) | | | 831 | |
| December 2009 | | Direct Employees (full time) | |
| Ecopetrol America Inc. | | | - | |
| Bioenergy S.A. | | | 62 | |
| Hocol S.A. | | | 152 | |
| Oleoducto Central S.A. | | | 130 | |
| Oleoducto de Colombia S.A. | | | 2 | |
| Oleoducto de los Llanos S.A. | | | 9 | |
| Ecopetrol del Perú S.A. | | | 4 | |
| Refinería de Cartagena S.A. | | | 106 | |
| Ecopetrol Oleo e Gas do Brasil Ltda. | | | 4 | |
| Propilco S.A. | | | 231 | |
TOTAL SUBSIDIARIES(1) | | | 700 | |
| December 2008 | | Direct Employees (full time) | |
| Ecopetrol America Inc. | | | - | |
| Bioenergy S.A. | | | 28 | |
| Hocol S.A. | | | - | |
| Oleoducto Central S.A. | | | - | |
| Oleoducto de Colombia S.A. | | | - | |
| Oleoducto de los Llanos S.A. | | | - | |
| Ecopetrol del Perú S.A. | | | - | |
| Refinería de Cartagena S.A. | | | - | |
| Ecopetrol Oleo e Gas do Brasil Ltda. | | | - | |
| Propilco S.A. | | | 223 | |
TOTAL SUBSIDIARIES(1) | | | 251 | |
| (2) | Totals are as of the last day of each month. |
Labor Unions
We currently have three industry-wide labor unions and one company labor union:
| | · | Unión Sindical Obrera de la Industria del Petróleo — USO (Industry labor union) |
| | · | Asociación de Directivos Profesionales, Técnicos y Trabajadores de las Empresas de la Rama de Actividad Económica del Recurso Natural del Petróleo y sus Derivados de Colombia — ADECO (Industry labor union) |
| | · | Sindicato Nacional de Trabajadores de Empresas Operadoras, Contratistas, Subcontratistas de Servicios y Actividades de la Industria del Petróleo y Similares — SINDISPETROL (Industry labor union) |
| | · | Sindicato Nacional de Trabajadores de Ecopetrol — SINCOPETROL (Company labor union) |
Our employees and any employee working for a company in the oil and gas industry may join the USO, ADECO or Sindispetrol. Sincopetrol may only be joined by our employees.
On August 22, 2009, as a result of consensual negotiations, we entered into a five-year collective bargaining agreement with USO, ADECO and Sindispetrol.
The following are the key terms of the agreement currently in effect since 2009 until 2014:
| | · | Transportation Subsidy. Monthly transportation subsidy depends on the employee’s location and ranges between Ps$1,213 and Ps$130,000; |
| | · | Food Subsidy. Monthly food subsidy ranges between Ps$195,600 and Ps$245,850 depending on the employee’s location; |
| | · | Lodging Subsidy. Monthly lodging subsidy to employees ranges between Ps$190,739 and $405,000; |
| | · | Subsidy for Education. Subsidy that covers 90% of tuition and board expenses and fixed amounts of transportation and textbooks for our employees and their children; |
| | · | Health Benefits. Ecopetrol pays 100% of medical expenses for workers and their families. The health benefits include integral basic attention, programs in prevention of diseases, the supply of medicines and others. |
| | · | Stability Clause. Employees who as of December 1, 2004 had worked over 16 months cannot be fired without just cause; |
| | · | Retirement plan for employees. Employees hired after January 29, 2003 are not covered by our retirement scheme and are covered by the general social security system; |
| | · | Five-year bonus. A cash benefit bonus accrued on a yearly basis and paid for every 5-year period worked in the Company according to the following scale: |
| | 5 years worked: | Bonus equivalent to 9 days of basic payment plus Ps$180,000 |
| | 10 years worked: | Bonus equivalent to 14 days of basic payment plus Ps$180,000 |
| | 15 years worked: | Bonus equivalent to 19 days of basic payment plus Ps$180,000 |
| | 20 years worked: | Bonus equivalent to 24 days of basic payment plus Ps$180,000 |
| | 25 years worked: | Bonus equivalent to 29 days of basic payment plus Ps$180,000 |
| | 30 years worked: | Bonus equivalent to 34 days of basic payment plus Ps$180,000 |
Labor Relations
As part of our goal to improve workplace morale, in 2010 we implemented a number of initiatives to maintain high-trust relations with our employees, guarantee competitive wages, strengthen our corporate principles and culture, provide opportunities for personal development and improve the general welfare of our employees. Our initiatives also sought to strengthen communication processes, and start performance-based compensation.
To improve the quality of life of our employees, we extended various types of loans to our employees, including home loans and loans for computers. In 2010, we extended 1,113 home loans to our employees for a total of Ps$97,034 million and 1,339 loans for computers for a total of Ps$7,324 million. We also provided on-site and external training and development courses to our employees. At December 31, 2010, our investments in employees’ development amounted to Ps$ 24 billion and we extended a total of Ps$54.6 billion in subsidies for education.
We provided on-site and external training and development courses to our employees. At December 31, 2010, our investments in employees’ development amounted Ps$ 24 billion.
Labor Regulation
As of November 13, 2007, all of our employees are official employees as a result of our transformation into a mixed economy company. Therefore, our employees have been governed by the provisions of the Colombian Labor Code since that time.
| ITEM 7. | Major Shareholders and Related Party Transactions |
MAJOR SHAREHOLDERS
The following table sets forth the names of our major shareholders, and the number of shares and the percentage of outstanding shares owned by them at March 31, 2011.
| | | | |
| | | | | | |
| Nation | | | 36,384,788,817 | | | | 89.9 | % |
| Public float | | | 4,087,723,771 | | | | 10.1 | % |
| Total | | | 40,472,512,588 | | | | 100.0 | % |
All our common shares have identical voting rights.
The Nation has announced its intention to sell 10% of its ownership of our capital stock. See “Item 10. Additional Information—Bylaws—Changes in the Capital of the Company.”
As of April 29, 2011, 0.77% of our common shares were held of record in the form of American Depository Shares. As of April 29, 2011, we had approximately 124 record holders of common shares, or ADSs representing common shares, in the United States.
RELATED PARTY TRANSACTIONS
Agreements
We engage in a variety of transactions with related parties in the ordinary course of business. Set forth below is a description of material related party transactions. For additional information about transactions with related parties, see Note 14 to our consolidated financial statements.
Ocensa
As of December 31, 2010, we had entered into the following agreements with Ocensa, a company in which we acquired a have a 60% equity interest since March 2009:
| | · | In March 1995, we entered into an agreement for the transportation of crude oil through the Ocensa pipeline. Pursuant to the terms of the agreement, we are required to make monthly payments that vary depending on the volumes of crude oil we transport through the pipeline and a tariff calculated by Ocensa on the basis of Ocensa’s financial projections and their expected volumes of crude oil. In 2010, payments made by us under this agreement amounted to US$271.63 million. This agreement expires in December 2093 or upon liquidation of Ocensa. |
| | · | In December 1995, we leased the Porvenir and Miraflores terminals to Ocensa. Pursuant to the terms of the agreement we receive monthly payments of approximately US$4,590,000 plus applicable taxes. The duration of this agreement is indefinite. |
| | · | In November 1996, we leased the Cravo Norte dock to Ocensa. Pursuant to the terms of the agreement we receive monthly payments of US$25,000, plus applicable taxes. The duration of this agreement is indefinite. |
| | · | In September 1999, we entered into a joint operation agreement for the TLU-3 Coveñas buoy with Ocensa, Oleoducto de Colombia S.A., a company in which we have a 65.57% equity interest. Pursuant to the terms of the agreement we are required to make monthly payments of a fixed amount of US$75,000 plus a variable amount depending of the volumes exported through the buoy. There have not been variable payments in the last three years. The duration of this agreement is indefinite. |
| | · | In December 1999, we entered into an operation and maintenance agreement for the Porvenir, Miraflores and Vasconia pumping stations. Pursuant to the terms of the agreement, we receive monthly payments of approximately US$354,000 plus applicable taxes and variable costs. This agreement was renewed for a five-year term on April 1, 2011. |
| | · | In December 2004, we entered into a natural gas supply contract. Pursuant to the terms of the contract, we receive variable monthly payments based on the volumes of natural gas delivered and a fixed tariff. In June 2008, this contract was renewed for an additional two years, and has been extended on a semi-annual basis through October 2011. During 2010, we received monthly payments of approximately US$491,151 under this contract. |
Oleoducto de Colombia S.A.
We entered into the following agreements with ODC, a company in which we have a 73.00% equity interest since January 2011:
| | · | In July 1992, we entered into a take-and-pay agreement for the transportation of hydrocarbons. Pursuant to the agreement, we must pay a previously agreed tariff over the volume of hydrocarbons transported. The duration of this agreement is indefinite. |
| | · | In August 1992, we entered into an operation and maintenance agreement for the Vasconia and Coveñas terminals. Pursuant to the terms of the agreement, ODC is required to make monthly payments amounting to approximately US$1.5 million per year plus any other expenses incurred by us in the performance of the agreement, including a variable surcharge between 5% and 12% on such expenses, plus any applicable taxes. The duration of this agreement is indefinite. |
| | · | In July 2006, we entered into an operation and maintenance agreement for the Caucasia Station and the Vasconia-Coveñas pipeline system. Since 2010, the agreement is only in effect for the operation of the Caucasia Station. Pursuant to the terms of the agreement, ODC is required to make monthly payments of US$751,531 per year, plus any other expenses incurred by us in the performance of the agreement, including a variable surcharge of between 5% and 12% on such expenses, plus any applicable taxes. The duration of this agreement is indefinite. |
| | · | In March 2007, we entered into a services agreement to guarantee the protection and safety of the Cusiana-Coveñas and Vasconia-Coveñas pipeline systems. Under the terms of the agreement, ODC paid us Ps$51 million per year. This agreement expired on December 31, 2011. |
Refinería de Cartagena S.A.
In conjunction with our transfer of Reficar’s assets in April 2007, we entered into a maintenance and administration agreement with Reficar, which we wholly own as of May 2009. Pursuant to the terms of the agreement, we provide them with maintenance and administration services and Reficar pays us a monthly fee equal to Ps$2.9 billion and a variable annual fee that may not exceed Ps$6.96 billion. This agreement expired in April 2011, but has been extended through the term of our negotiations for a new operation and maintenance contract, which we expect to be finalized in the second half of 2011.
Also, as part of the transfer, we extended a ten-month commercial offer to Reficar for the supply of crude oil. The commercial offer was renewed in January 2010 for an additional six-month period. Pursuant to the terms of the offer, Reficar has the option to purchase from us up to 85 thousand bpd of crude oil from our Caño Limón, Vasconia Blend, Ayacucho Blend, Cusiana and Castilla production. As we continue to operate Reficar, our operations committee evaluates and decides on a monthly basis the refinery’s crude oil mix needs including the need for foreign crudes which we import from West Africa, the North Sea and the Caribbean. Since May 2009, as a result of our acquisition of Reficar from Glencore, amounts of crude oil sold to Reficar has been eliminated in our consolidated results.
On November 29, 2010, we entered into a loan facility with Reficar in the aggregate principal amount of US$1 billion for capital expenditures and the construction costs in connection with the project to modernize the refinery. Disbursements under this subordinated loan agreement are expected to be made between December 2010 and July 2011 and are considered to be a capital contribution to the project. In December 2010, we disbursed US$200 million of this facility to Reficar. We also have granted treasury loans to Reficar for the operation of the refinery in the amount of approximately US$200 million.
Oleoducto de los Llanos Orientales S.A.
We entered into two ship-or-pay agreements with Oleoducto de los Llanos Orientales S.A., or ODL, a company in which we have a 65% equity interest.
The first agreement was entered into in March 2009 and establishes a financing tariff used to pay ODL’s indebtedness to Grupo Aval for five years. This agreement was superseded by a new contract executed in May 2010, with a seven-year term, to reflect new conditions agreed with Grupo Aval. This financing tariff is collected through a trust fund, which in turn is responsible for making the debt service payments to Grupo Aval.
The second agreement was entered into in September 2009 and establishes a financing tariff that is collected through a trust fund that in turn is responsible for making debt service payments to security holders.
Under the agreement used to pay Grupo Aval indebtedness, ODL has committed to transport 75,000 barrels of oil a day during the two-year grace period of the facility and 90,000 barrels of oil a day during the remaining five years. Under the second agreement, ODL has committed to transport 19,500 barrels of oil a day during the first phase of the ODL project (which began operations in September 2009) and 39,000 barrels of oil a day upon commencement of the second phase of the ODL project, which occurred in the first quarter of 2010.
Andean Chemicals Ltd
In May 2009 we granted a loan to our subsidiary, Andean Chemicals Limited, for the acquisition from Glencore International A.G. of its 51% interest in Refinería de Cartagena S.A., in the amount of US$541 million for a five year term. The interest rate for each year is the fixed term deposit rate (DTF) applicable at December 31 of the previous year.
Other Agreements
We entered into a supply agreement with Ecodiesel Colombia S.A., or Ecodiesel, a company in which we have a 50% equity interest. This agreement has been operative since August 1, 2010. Pursuant to the terms of this agreement, Ecodiesel must deliver to us and we must purchase from Ecodiesel at least 80% of Ecodiesel’s biodiesel production each month. Payments vary depending on the purchased volumes of biodiesel. This agreement expires on December 31, 2017.
In 2010, we renewed the service agreement with Sociedad Colombiana de Servicios Portuarios S.A., or Serviport, a company in which we have a 44.76% equity interest. Pursuant to the terms of this agreement, Serviport assists us in our maritime operations in Coveñas port. This agreement expires on May 27, 2019.
Transactions with other state-controlled entities
We are a state-owned oil and gas company and operate in an industry regulated by Governmental authorities, agencies and other organizations.
In the ordinary course of business we enter into transactions with other state-owned entities which include but are not limited to the following:
| | · | selling and purchasing goods, properties and other assets; |
| | · | rendering and receiving services; |
| | · | depositing and borrowing money; and |
These transactions are conducted in the ordinary course of business on terms comparable to the terms of transactions with private parties. We have also established procurement policies and approval processes for purchases of products and services, which do not depend on whether the counterparties are state-owned entities or not.
Loans to our Employees
We extend loans to all of our employees as part of our compensation scheme. We grant loans for housing and computers. Housing loans are approved by a housing loans committee composed of the Human Resources and Strategy vice presidents, and the Compensation manager. The principal amount of the loan depends on the applicant’s tenure and cannot exceed 59 times the applicant’s monthly salary. We do not guarantee any loans made by third parties.
Other than maintaining housing loans to executive officers which were in place prior to the Company registering its ADSs, since it registered its ADSs, neither it nor any of its subsidiaries have provided loans (including housing loans), extended or maintained credit, arranged for the extension of credit, or renewed an extension of credit, in the form of a personal loan to or for any executive officer of the Company. The Company has not materially modified any term of any such extension of credit or renewed any such extension of credit, in each case including the aforementioned housing loans, since its ADSs were registered.
In addition, other than the housing loans referred to below, neither the Company, nor any of its subsidiaries will provide loans (including housing loans), extend or maintain credit, arrange for the extension of credit, or renew an extension of credit, in the form of a personal loan to or for any executive officer of the Company in the future. In addition, the Company will not materially modify any term of any such extension of credit or renew any such extension of credit, in each case including the aforementioned housing loans, in the future.
We do not extend loans to Directors.
The following table sets forth a description of the loans outstanding to our executive officers at December 31, 2010.
| | Nature of the Loan and Date of Disbursement | | Principal Amount of the Loan | | | Amount Outstanding at December 31, 2010 | | | Largest Amount Outstanding during period | | | | |
| | | | | (Pesos in millions) | | | (Pesos in millions) | | | (Pesos in millions) | | | | |
| | | | | | | | | | | | | | | |
Javier G. Gutiérrez | | Housing, June 2008 | | | 729 | | | | 628.4 | | | | 729 | | June 2028 | | UVR(1) |
| | | | | | | | | | | | | | | | | | |
| Adriana M. Echeverri | | Housing, June 2002 | | | 37.5 | | | | 40.7 | | | | 45.1 | | October 2018 | | UVR(1) |
| | | | | | | | | | | | | | | | | | |
| Pedro A. Rosales | | Housing, April 1997 and September 2003 | | | 279.2 | | | | 177.0 | | | | 247.5 | | September 2018 | | UVR(1) |
| | | | | | | | | | | | | | | | | | |
| | (1) | As the regulatory entity for these purposes, the Central Bank of Colombia (Banco de la República) defines the term “UVR” as Unidad de Valor Real (Real Value Unit), an accounting unit which reflects purchasing power based exclusively on the consumer price index variation certified by the National Statistics Department of Colombia (DANE). The UVR is used to calculate the cost of housing credits in Colombia. This accounting unit allows financial entities to adjust credit values to the cost of living increase in Colombia. |
| ITEM 8. | Financial Information |
CONSOLIDATED STATEMENTS AND OTHER FINANCIAL INFORMATION
Our Annual Consolidated Financial Statements are filed as part of this annual report starting on page F-1.
LEGAL PROCEEDINGS
We are party to various legal proceedings in the ordinary course of business. Other than as disclosed in this annual report, we are not currently involved in any litigation or arbitration proceeding, including any proceeding that is pending or threatened of which we are aware, which we believe will have a material adverse effect on our company. Other legal proceedings that are pending against or involve us and our subsidiaries are incidental to the conduct of our and their business. We believe that the ultimate disposition of such other proceedings individually or in an aggregate basis will not have a material adverse effect on our consolidated financial condition or results of operations.
At December 31, 2010, we were a party to 1,953 legal proceedings relating to civil, administrative, environmental, tax and labor claims filed against us in the Colombian courts and arbitration tribunals of which 726 had an accrual provision. We allocate substantial amounts of money and time to defend these claims. Historically, we have been successful in defending lawsuits filed against us. Based on the advice of our legal advisors it is reasonable to assume that the litigation procedures brought against us will not materially affect our financial position or solvency regardless of the outcome. See Note 29 to our annual consolidated financial statements included in this annual report for a discussion of our legal proceedings.
In December 2010, Llanos Oil Exploration Ltd., or Llanos Oil, filed a lawsuit against us in a district court of the Netherlands, which if decided against us, could materially affect our financial condition. The complaint alleges early termination by us of the following exploration activity contracts: the 1997 Las Nieves Association Contract and the 2002 Guatapuri Association Contract. These contracts were terminated because of the default by Llanos Oil on July 28, 2000, and July 23, 2003, respectively, in accordance with the provisions of the contracts. We have not created a provision for this claim because our legal counsel in The Hague considers there to be a remote probability of success for Llanos Oil.
Foncoeco
An association of former employees known by the acronym Foncoeco brought an action against us in connection with a company profit-sharing plan offered in 1962 that expired in 1975. The plaintiffs claim that our Board of Directors had set aside a specific amount under the profit sharing plan, which was not entirely distributed to employees eligible under the plan. The court of first instance on June 25, 2002, ruled in our favor and rejected the plaintiffs’ arguments. The plaintiffs appealed the ruling to the Bogota Higher Tribunal, which ordered us to present a rendición de cuentas (an accounting action) to the first instance judge based on the amounts allocated by our Board of Directors. Based on the judge’s conclusion with respect to our accounting and the expert testimony of a witness presented by the plaintiffs who we maintain included amounts never allocated by our Board of Directors to the profit sharing plan, the first instance judge on December 16, 2005, ordered us to pay Ps$541,833 million, or approximately US$260 million. We appealed the decision by the first instance judge to the Bogota Higher Tribunal and on June 22, 2011, the court ruled in our favor and reduced the amount we must pay to Ps$6.6 million, or approximately US$3,707.
DIVIDENDS
We do not have a dividend policy. Pursuant to Colombian law, the Company may distribute dividends to its shareholders. The Board of Directors may propose a dividend, which declaration, amount and payment per share is subject to approval by a simple majority of the shareholders. In 2008, 2009 and 2010m the shareholders approved the distribution of 89.9%, 76.6%, and 71.8%% of 2007, 2008 and 2009 of net income, respectively. On March 24, 2011, our shareholders at the ordinary general shareholders’ meeting approved dividends of 70.31% of net income for the fiscal year ended December 31, 2010. See “Item 5. Operating and Financial Review and Prospects—Liquity and Capital Resources—Use of Funds—Dividends.”
SIGNIFICANT CHANGES
There have not been any significant changes since the date of our Annual Consolidated Financial Statements for the year ended December 31, 2010.
| ITEM 9. | The Offer and Listing |
In November 2007, we conducted an initial public offering of 10.1% of our common shares in Colombia. As a result of such offering, our common shares trade on the Colombian Stock Exchange (Bolsa de Valores de Colombia), or BVC, under the symbol, “ECOPETROL.” Our American Depositary Shares, or ADSs, representing 20 common shares, have been traded on the NYSE under the symbol “EC” since September 2008. JPMorgan Chase Bank, N.A., serves as depositary for our ADSs.
In December, 2009, our ADSs have been traded on the Lima Stock Exchange under the symbol “EC”.
Since August 2010, our ADSs have been traded on the Toronto Stock Exchange under the symbol “ECP.”
The following table sets forth reported high and low closing prices in Pesos for our shares and the reported average daily trading volume of our shares on the BVC for the periods indicated. The table also sets forth information on the trading price of our shares in Pesos and U.S. dollars, as well as the average trading volume.
| | | | |
| | | | | | U.S. dollars per share(1) | | | Average number of shares traded | |
| | | | | | | | | | | | | | | | |
| 2008 | | | 2,895 | | | | 1,575 | | | | 1.6638 | | | | 0.7647 | | | | 21,063,806 | |
| 2009 | | | 2,815 | | | | 1,990 | | | | 1.4707 | | | | 0.7833 | | | | 10,245,002 | |
| 2010 | | | 4,660 | | | | 2,370 | | | | 2.5582 | | | | 1.1958 | | | | 8,764,023 | |
| | | | | | | | | | | | | | | | | | | | | |
| Most recent quarters | | | | | | | | | | | | | | | | | | | | |
| | | | | | | | | | | | | | | | | | | | | |
| First quarter 2009 | | | 2,150 | | | | 1,990 | | | | 0.9384 | | | | 0.7833 | | | | 10,121,571 | |
| Second quarter 2009 | | | 2,580 | | | | 2,085 | | | | 1.2363 | | | | 0.8431 | | | | 10,952,758 | |
| Third quarter 2009 | | | 2,815 | | | | 2,505 | | | | 1.4208 | | | | 1.1856 | | | | 12,083,692 | |
| Fourth quarter 2009 | | | 2,715 | | | | 2,425 | | | | 1.4707 | | | | 1.1806 | | | | 7,714,689 | |
| First quarter 2010 | | | 2,710 | | | | 2,370 | | | | 1.4313 | | | | 1.1958 | | | | 7,013,937 | |
| Second quarter 2010 | | | 2,790 | | | | 2,630 | | | | 1.4634 | | | | 1.3035 | | | | 6,314,608 | |
| Third quarter 2010 | | | 3,370 | | | | 2,725 | | | | 2.0910 | | | | 1.4296 | | | | 9,924,828 | |
| Fourth quarter 2010 | | | 4,660 | | | | 3,725 | | | | 2.5582 | | | | 1.9904 | | | | 11,953,966 | |
| First quarter 2011 | | | 4,060 | | | | 3,750 | | | | 2.1774 | | | | 1.9805 | | | | 5,983,470 | |
| Second quarter 2011 | | | 4,045 | | | | 3,605 | | | | 2.2823 | | | | 1.9964 | | | | 5,769,997 | |
| | | | | | | | | | | | | | | | | | | | | |
| Most recent six months | | | | | | | | | | | | | | | | | | | | |
| | | | | | | | | | | | | | | | | | | | | |
| January 2011 | | | 4,050 | | | | 3,805 | | | | 2.1774 | | | | 2.0081 | | | | 4,838,637 | |
| February 2011 | | | 3,990 | | | | 3,750 | | | | 2.1367 | | | | 1.9805 | | | | 6,391,515 | |
| March 2011 | | | 4,060 | | | | 3,780 | | | | 2.1452 | | | | 2.0025 | | | | 6,641,897 | |
| April 2011 | | | 3,895 | | | | 3,605 | | | | 2.1579 | | | | 1.9964 | | | | 3.827.480 | |
| May 2011 | | | 4,045 | | | | 3,720 | | | | 2.2258 | | | | 2.1095 | | | | 6,479,926 | |
| June 2011 | | | 4,040 | | | | 3,775 | | | | 2.2823 | | | | 2.1143 | | | | 6,967,090 | |
| (1) | U.S. dollars per common share translated at the Representative Market Rate for each period. |
The following table sets forth reported high and low closing prices in U.S. dollars for our ADSs and the reported average daily trading volume of our ADSs on the NYSE for the periods indicated. The table also sets forth information on the trading price of our ADSs in U.S. dollars, as well as the average trading volume.
| | | | |
| | | | | | | |
| | | | | | | | | | |
| 2008 | | | 27.25 | | | | 15.04 | | | | 42,074 | |
| 2009 | | | 29.99 | | | | 15.31 | | | | 48,289 | |
| 2010 | | | 51.92 | | | | 23.60 | | | | 163,749 | |
| | | | | | | | | | | | | |
| Most recent quarters | | | | | | | | | | | | |
| | | | | | | | | | | | | |
| First quarter 2009 | | | 19.50 | | | | 15.31 | | | | 42,277 | |
| Second quarter 2009 | | | 24.89 | | | | 17.24 | | | | 47,985 | |
| Third quarter 2009 | | | 28.77 | | | | 23.64 | | | | 48,341 | |
| Fourth quarter 2009 | | | 29.99 | | | | 23.96 | | | | 54,960 | |
| First quarter 2010 | | | 28.73 | | | | 23.60 | | | | 64,272 | |
| Second quarter 2010 | | | 29.58 | | | | 26.00 | | | | 65,182 | |
| Third quarter 2010 | | | 42.36 | | | | 28.84 | | | | 216,042 | |
| Fourth quarter 2010 | | | 51.92 | | | | 40.17 | | | | 315,881 | |
| First quarter 2011 | | | 43.81 | | | | 39.54 | | | | 289,293 | |
| Second quarter 2011 | | | 46.00 | | | | 39.66 | | | | 337,737 | |
| | | | |
| | | | | | | |
| | | | | | | | | | |
| Most recent six months | | | | | | | | | |
| | | | | | | | | | |
| January 2011 | | | 43.81 | | | | 40.81 | | | | 231,071 | |
| February 2011 | | | 43.10 | | | | 39.73 | | | | 306,101 | |
| March 2011 | | | 43.19 | | | | 39.54 | | | | 326,035 | |
| April 2011 | | | 43.87 | | | | 39.66 | | | | 243,426 | |
| May 2011 | | | 45.47 | | | | 42.14 | | | | 366,747 | |
| June 2011 | | | 46.00 | | | | 42.30 | | | | 401,587 | |
| (1) | Each ADS represents the right to receive 20 of our common shares. |
TRADING ON THE BOLSA DE VALORES DE COLOMBIA
The BVC is the largest stock exchange in Colombia for trading securities and derivatives. The BVC has over 500 shareholders and is a member of the World Federation of Exchanges and the Federación Iberoamericana de Bolsas.
The BVC is the only exchange where our common shares trade in Colombia. The table below sets forth the reported aggregate market capitalization of the BVC, as of December 31, 2010.
| | | Aggregate Market Capitalization of the BVC | |
| | | Market Capitalization | | | Market Capitalization | |
| | | | | | | |
| | | | | | | |
| December 31, 2010 | | | 417,870 | | | | 218.33 | |
| (1) | Representative Market Rate at December 31, 2010. |
Transfer and Registration of Shares
In general, the following transfers do not need to be effected through the BVC: transfers between shareholders having the same beneficial owner; transfers of shares owned by financial institutions that are in process of liquidation under the control and supervision of the Superintendency of Finance; repurchase of shares; transfers of shares made by the Nation; transfers of shares issued abroad by Colombian companies, provided they take place outside Colombia; transfers of shares issued abroad by foreign companies, provided they take place outside Colombia; and any other transaction authorized to be effected outside the BVC by the Superintendence of Finance.
Pursuant to Colombian law, purchases of 25% or more of the outstanding shares with voting rights (including ADSs) of a listed company, or the purchase of 5% or more of the outstanding shares with voting rights (including ADSs) by an existing shareholder or group of shareholders beneficially owning 25% or more of the outstanding capital stock of a listed company, must be made pursuant to a public tender offer.
Certain exemptions apply to tender offer rules including, transfers made through an auction on the BVC as a result of privatization procedures; transfers authorized in writing by 100% of the shareholders; repurchase of shares by the issuer in open market transactions; transfers by virtue of law including donations, liquidation processes, judicial decisions, among others. In any case, the Superintendency of Finance must be notified of any transfer that is deemed to be an hecho relevante or a significant event, under Colombian law.
Under Colombian law, shares may be traded either in physical form or electronic form. Transfers of shares are subject to a registry system, which differs depending on whether the shares are evidenced by electronic form or physical form. Transfers of shares evidenced by electronic certificates must first be registered with Depósito Centralizado de Valores, or DECEVAL, through the relevant stockbroker. DECEVAL’s main purpose is to receive, safeguard and manage share certificates issued by corporations in order to keep a record of the transactions undertaken over such securities, including but not limited to transfers, pledges and withdrawals. Accordingly, DECEVAL is not allowed to hold, invest or otherwise use the securities held under its custody.
Transfer of shares evidenced by electronic and physical certificates must be registered on the issuer’s stock ledger. Only those holders registered on the stock ledger are recognized by us and third parties as shareholders. Registration requires endorsement of the certificates or a written instruction from the holder. In the case of electronic certificates, DECEVAL notifies us regarding the transfer of shares after registering it in its system.
Transfer of shares do not give rise to any fee for us but they may be subject to certain taxes, stamp duties or other governmental charges which the shareholder may be required to pay.
| ITEM 10. | Additional Information |
BYLAWS
The following is a summary of the material provisions of our bylaws. The last amendment of our bylaws was approved on March 24, 2011, by the shareholders. This description does not purport to be complete and is qualified by reference to our bylaws, which are filed as an exhibit to this annual report. For a description of the provisions of our bylaws relating to our Board of Directors and its committees, see “Item 6. Directors, Senior Management and Employees.”
Organization and Register
Ecopetrol was organized on August 25, 1951, existing under the laws of Colombia. Since November 13, 2007, Ecopetrol has been a mixed economy company. We are registered in the Chamber of Commerce of Bogota (Camara de Comercio de Bogota) under registry number 899.999.068-1.
Corporate Purpose
Pursuant to Article 4 of our bylaws, we may engage in the exploration, production, refining, transportation, storage, distribution and commercialization of crude oil and its by-products in Colombia and abroad, and to support, promote and manage democratization programs and sales of its equity in accordance with applicable norms. Our bylaws also authorize us to perform activities for the exploration and production of crude oil in areas that prior to January 1, 2004 were operated by us directly or were subject to agreements subscribed by us; to directly or indirectly explore and produce crude oil in areas assigned to us by the National Hydrocarbon Agency (Agencia Nacional de Hidrocarburos), or ANH; to directly or indirectly explore and produce crude oil in areas assigned to us by a foreign regulatory entity; to buy, sell, import, export, store, blend, or distribute hydrocarbons and its by-products in Colombia or abroad; to undertake research for developing and commercializing alternative energy sources; and in general, to undertake any other activity instrumental or required to develop our corporate purpose. Our corporate purpose includes administering and managing all properties that were formerly part of the De Mares concession.
Additionally, pursuant to Article 5 of our bylaws, we may enter into all acts, contracts and legal business and activities which may be required for us to adequately fulfill our corporate purpose.
Preference Rights and Restrictions Attaching to Our Shares
We have only one class of stock without special rights or restrictions. Our shareholders do not have any type of preemptive rights.
Under Colombian law, our shareholders have the following economic privileges and voting rights:
| | · | to participate and vote on the decisions of the general shareholders meeting; |
| | · | to receive dividends based on the financial performance of the Company in proportion to their share ownership; |
| | · | to transfer and sell shares according to our bylaws and Colombian law; |
| | · | to inspect corporate books and records 15 business days prior to the ordinary shareholders’ meeting where the year-end financial statements are to be approved; |
| | · | upon liquidation, to receive a proportional amount of the corporate assets after the payment of external liabilities; and |
| | · | to sell the shares, known as derecho de retiro, if a corporate restructuring affects the economic or voting rights of the shareholders in the terms and conditions established under Colombian law. |
Our bylaws and corporate governance code provide additional rights to our minority shareholders. These rights include:
| | · | Sale of Assets. For a ten-year period counted from the date of adoption of our bylaws or until the Nation loses its status as majority shareholder, the Nation guarantees that any sale of 15% or more of our assets requires the approval of the general shareholders’ meeting and that the Nation would only be allowed to vote its shares in favor of the proposal if 2% or more of our minority shareholders accept the proposal. |
| | · | Candidate List. Pursuant to our bylaws and law 1118 of 2006, the Nation will include in its candidate list for election of members of the Board of Directors one member selected by the departments that produce hydrocarbons. In addition, pursuant to the declaration of the Nation dated July 26, 2007, the Nation will include in its candidate list for election of members of the Board of Directors one member selected by the ten largest minority shareholders. The minority shareholders’ right to select a candidate loses its effect when minority shareholders, according to their share participation, name a member to our Board of Directors. |
| | · | Extraordinary Meetings. Our bylaws and corporate governance code provide that the entity exercising permanent control over Ecopetrol must instruct the Company’s CEO or Statutory Auditor to call an extraordinary meeting of the Company’s shareholders when so requested by a or plurality of shareholders holding at least 5% of the total number of shares outstanding. Such requests shall be made in writing and must clearly indicate the purpose of the meeting. |
| | · | Office for the Attention of Shareholders. We created an office for the attention of shareholders, our specialized unit responsible for receiving complaints from our shareholders. Pursuant to our bylaws, shareholders holding at least 5% of the total number of shares outstanding may request that the office for the attention of shareholders conduct a special audit of the following documents: the income statement; the proposal for the distribution of profits; the report of the Board of Directors as to the economic and financial status of our Company; the report from our general counsel as to the legal status of our Company; and the report from the independent auditors. Special audits cannot be made of documents that contain scientific, technological or statistical information of our Company, or agreement that gives us competitive and economic advantages over our competitors, or in respect of any document related to intellectual property. Shareholders also have the right to propose good corporate governance recommendations to the office for the protection of investors. |
| | · | Others. Pursuant to our bylaws, shareholders holding at least 5% of the total number of shares outstanding may propose recommendations to our Board of Directors pertaining to the management of our Company. Any shareholder may file a written petition to our Board of Directors to investigate corporate governance violations that the shareholder believes to have been committed. |
Amendments to Rights and Restrictions to Shares
The rights and restrictions given to our shareholders may only be modified through an amendment to our bylaws. The general shareholders’ meeting has full and exclusive authority to modify or amend our bylaws.
General Shareholders’ Meeting
Shareholders’ meetings may be ordinary or extraordinary. Ordinary meetings will take place in our legal domicile located in Bogota, Colombia, within the first three months following the end of each fiscal year, on the day and at the time set forth in the notice for the general shareholders’ meeting. The call for the general shareholders’ meeting may be made electronically or by written communication sent to each shareholder. In both cases the call must be published in a newspaper of wide circulation 20 business days prior to the date on which the meeting will take place.
In the ordinary general shareholders’ meeting, our Board of Directors and the external auditor are appointed and our annual financial statements, profit distribution, audit and management reports and any other matter provided under applicable law or our corporate bylaws are approved.
Extraordinary meetings of shareholders may be called by our Board of Directors, by our president or chief executive officer, by our external auditor, or by shareholders holding at least 5% of the shares outstanding. Calls to extraordinary meetings should be made at least eight days prior to the date of the meeting, and may be made electronically or by written communication to each shareholder or be published in a newspaper of wide circulation. The meeting notice must specify the agenda for the meeting.
The required quorum for both ordinary and extraordinary meetings is 50% plus one share entitled to vote and decisions are approved with a majority of the members present. This quorum is exempted in the case of “second-call meetings,” which may take place when a meeting fails to obtain the required quorum and is called within a period between 10 business days and 30 business days from the first date, in which case decisions may be adopted by a majority of the shares present regardless of the number represented.
Unless Colombian law requires a super majority, decisions made at the shareholders’ meeting must be approved by a majority of the shares present. Colombian law requires super majorities in the following cases:
| | · | the vote of at least 70% of the shares present and entitled to vote at the ordinary shareholders’ meeting is required to approve the issuance of stock not subject to preemptive rights; |
| | · | the vote of at least 78% of the shares represented entitled to vote is required to approve the distribution of less than 50% of the annual net profits. If the sum of all legal reserves (statutory, legal and optional) exceeds the amount of the outstanding capital, the Company must distribute at least 70% of the annual net profits; |
| | · | the vote of at least 80% of the shares represented is required to approve the payment of dividends in shares; and |
| | · | the vote of 100% of the outstanding and issued shares is required to replace a vacancy on the Board of Directors without applying the electoral quotient system. |
Shareholders may be represented by proxies provided that the proxy: (i) is in writing (faxes and electronic documents are valid), (ii) specifies the name of the representative, (iii) specifies the date or time of the meeting for which the proxy is given and (iv) other specified by the applicable law. Proxies granted abroad do not require legalization or an apostille.
During our annual shareholders’ meeting, our employees and Directors are only allowed to represent their own shares.
Limitations to the Rights to Hold Securities
There are no limitations in our bylaws or Colombian law on the rights of Colombian residents or foreign investors to own the shares of our Company, or on the right to hold or exercise voting rights with respect to those shares.
Restrictions on Change of Control Mergers, Acquisitions or Corporate Restructuring of the Company
Under Colombian law and our bylaws, the general shareholders’ meeting has full authority to approve any corporate restructuring including, any mergers, acquisitions or spin-offs. Corporate restructurings are also subject to the requirement that the Nation must hold a minimum of 80% of our common stock at all times. While Law 1118 of 2006 is in effect, there cannot be any restructuring that results in a change of control of our Company.
Ownership Threshold Requiring Public Disclosure
Our corporate governance code provides that we must disclose periodically on our web page, the names of the shareholders of our Company, indicating at least, the 20 shareholders with the greatest number of shares. We must also disclose this information to the Superintendency of Finance at the end of each fiscal year.
Colombian securities regulations set forth the obligation to disclose any material event or hecho relevante. Any transfer of shares equal or greater than 5% of our capital stock or any person acquiring a percentage of shares that would make him the beneficial owner of 5% or more of our capital stock, is a material event, and therefore, must be disclosed to the Superintendency of Finance.
Changes in the Capital of the Company
There are no conditions in our bylaws governing changes in our capital stock that are more stringent than those required under Colombian law, with the exception that the Nation must hold a minimum of 80% of our capital stock at all times. The Government has noted its intention to make a proposal to the Colombian Congress that would allow the Nation to hold 70% of the capital stock of the Company. We do not know whether the Government will make such a proposal or if Congress will approve any such law.
Statutory Auditor
Pursuant to our bylaws as amended on March 24, 2011, our statutory auditor may be appointed for a maximum five-year term. At the ordinary general shareholders’ meeting on March 24, 2011, the shareholders appointed KPMG Ltda. as statutory auditor of Ecopetrol and its subsidiaries.
MATERIAL CONTRACTS
Transportation Agreement between Ecopetrol and Empresa Colombiana de gas ESP/Transportadora de gas del Interior S.A. ESP
On October 6, 2006, we entered into a natural gas transportation agreement with Empresa Colombiana de gas ESP, or Ecogas, for the transportation of natural gas from the Ballena terminal located in the La Guajira fields to the Barrancabermeja terminal. The agreement is set to expire in November 30, 2012. Pursuant to the terms of the agreement, Ecogas will transport natural gas produced by us upon our request, up to the available capacity set forth in the agreement. According to the agreement, Ecogas should undertake two overhauling stages to expand the pipeline’s capacity. After its first capacity expansion completed in June 2007 the pipeline’s capacity was increased to 190,000 thousand cfpd expanding our transportation capacity to 134,066 thousand cfpd. Once Ecogas executes the second expansion to 262,000 thousand cfpd we will have transportation availability of up to 175,000 thousand cfpd.
In February 27, 2007, Ecogas transferred the rights and obligations under this agreement to Transportadora de Gas del Interior S.A. ESP, currently operating as Transportadora de Gas Internacional S.A. ESP, or TGI. On October 1, 2008, Ecopetrol and TGI signed a new natural gas transportation agreement for the transportation of 116,500 thousand cfpd from 2013 to 2020 of natural gas from the Ballena terminal located in the La Guajira fields to Barrancabermeja.
Pursuant to the terms of the agreement, we pay TGI a regulated transportation tariff composed of a fixed fee, a variable fee depending on transported volumes and an administration, operation and maintenance fee. Payments for transported volume are made in Pesos. During 2010, we paid Ps$148,837 billion for the transportation services provided to us by TGI.
Transportation Agreement between Ecopetrol and Ocensa
On March 31, 1995 we entered into a crude oil transportation agreement with Ocensa. See “Item 7. Major Shareholders and Related Party Transactions—Related Party Transactions—Agreements—Ocensa.”
EXCHANGE CONTROLS
Payments in foreign currency with respect to certain foreign exchange transactions including international investments between Colombian residents and non-Colombian residents must by law be conducted through the commercial exchange market. Therefore, any foreign currency income or expenses under the American Depositary Receipts, or ADRs, must be channeled through that market. Transactions conducted through the commercial exchange market are made at market rates freely negotiated with authorized intermediaries (banks, financial corporations and others).
Colombian law provides that the Colombian Central Bank may intervene in the foreign exchange market if the value of the Colombian Peso experiences significant volatility. Likewise the Colombian government introduces from time to time amendments to the International Investment Statute. For example, on May 23, 2007, the Colombian government introduced a new deposit requirement related to portfolio investments made by foreign investors. Decrees 1801 of 2007 and 1888 and 3264 of 2008 required foreign investors making portfolio investments in securities other than shares or mandatory convertible bonds to make a non-interest bearing deposit with the Colombian Central Bank for a term of six months from the date of such investment, for an amount equivalent to 40% of the value of investment converted at the representative market rate then in effect. Nevertheless, since June 29, 2007, when the Colombian government issued Decree 2466 of 2007 setting forth that portfolio investments made pursuant to ADR programs were exempt from the deposit requirement, ADRs were not affected by the requirement of Decree 1801 of 2007. As a result, neither Ecopetrol nor the purchasers of ADRs had to comply with the 40% deposit requirement. Furthermore, in 2008, pursuant to Decree 3913 of October 8, 2008, the Colombian government eliminated the 40% deposit requirement for all investors. See “Item 3. Key Information—Risk Factors—Risks relating to the ADRs.”
The Colombian Central Bank may also limit the remittance of dividends and/or investments of foreign currency received by Colombian residents whenever the international reserves fall below an amount equal to three months of imports. Since the creation of the current foreign exchange regime in 1991, the Colombian Central Bank has never taken such action. However, we cannot assure you that the Colombian Central Bank will not intervene in the future. See “Item 3. Key Information—Risk Factors—Risks Relating to Colombia’s political and regional environment.”
Registration of foreign investment represented in underlying shares
Colombia’s International Investment Statute, which has been amended from time to time through related decrees and regulations, regulates the manner in which non-Colombian resident entities and individuals can invest in Colombia and participate in the Colombian securities markets. Among other requirements, the statute mandates registration of certain foreign exchange transactions with the Colombian Central Bank and specifies procedures to authorize and administer certain types of foreign investments. Additionally, pertinent information must be updated yearly.
Under these foreign investment regulations, the failure of a foreign investor to report or register with the Colombian Central Bank foreign exchange transactions relating to investments in Colombia on a timely basis may prevent the investor from obtaining remittance rights, constitute an exchange control infraction and result in a fine.
Foreign investors who acquire ADRs are not required to register before Colombian authorities. Holders of ADRs will benefit from the registration to be obtained by the custodian for our common shares underlying the ADRs in Colombia, which permits the custodian to convert dividends and other distributions with respect to the common shares into foreign currency and remit the proceeds abroad. If investors in ADRs choose to surrender their ADRs and withdraw common shares, they must register their investment in the common shares as a foreign direct investment, provided that the investor wishes to maintain ownership of the shares on a permanent basis. If the investor wishes to maintain ownership of the shares only for speculative purpose, that is, as a portfolio investment, no further registration is required. Non-Colombian residents cannot directly hold portfolio investments in Colombia, but are able to do so through an “administrator,” such as a stock broker, trust company or an investment management company, duly authorized by Colombian Finance Superintendency.
In obtaining its own foreign investment registration, an investor who surrenders its ADRs and withdraws common shares may incur expenses and/or suffer delays in the application process. Investors would only be allowed to transfer dividends abroad or transfer funds received as distributions relating to our common shares after their foreign investment registration procedure with the Colombian Central Bank has been completed. In addition, the depositary’s foreign investment registration may also be adversely affected by future legislative changes, but its rights to transfer dividends abroad or profits arising from distributions relating to our common shares must be maintained according to Colombian law and foreign investment treaties entered into by Colombia, except when the Colombian international reserves fall below an amount equivalent to three months worth of imports.
TAXATION
Colombian Tax Considerations
The following is a description of the Colombian tax considerations for investments in common shares in Colombia or for the purchase of American Depositary Shares, or ADSs, in a foreign securities market. This description is based on the applicable law in effect as of the date of this annual report. Prospective purchasers of common shares or ADSs should consult their own tax advisors for a detailed analysis of the tax consequences resulting from the acquisition, ownership and disposition of common shares or ADSs.
General Considerations
Income tax and complementary taxes are considered a single tax with two components: income and sporadic earnings. Taxes are accrued on a calendar basis.
Pursuant to the Colombian Tax Code, Colombian corporations and public entities are subject to Colombian taxes on income earned in Colombia and worldwide; while foreign entities are liable only for income earned in Colombia.
Tax Treatment of a Non-Resident of Colombia who Purchases an ADR in a Foreign Securities Market
Dividends
In general, dividends paid to foreign companies or other foreign entities, non-Colombian residents or successors of non-Colombian residents are subject to Colombian income tax.
To avoid double taxation, corporate and branch profits are taxed at the corporate or branch level. If the accounting earnings and profits of a Colombian corporation exceed the tax profits subject to income tax, the excess is subject to income tax at the shareholder level. If the shareholder is a non-resident, the applicable tax rate is 33%.
Therefore, provided all distributions, including the payment of dividends, are made by us to non-resident holders of ADRs through the Depositary, such payments will be exempted from income, withholding and remittance tax in Colombia. This exception would not apply in the case of distributions paid out of non-taxed earnings made by us which would be subject to income tax at the 33% rate.
Dividends paid to foreign investment capital funds are subject to a 33% withholding income tax.
Taxation on Capital Gains for the sale of ADRs
Under Colombian law, capital from the sale of ADRs is not subject to income tax in Colombia as they are considered foreign sourced income.
Similarly, capital gains earned by foreign capital investment funds arising from the purchase or sale of securities are not subject to income taxes in Colombia. The remittance of capital gains to the Depositary is not subject to income tax in Colombia.
Tax Treatment in Colombia of Non-Residents who Purchase Ecopetrol’s shares in Colombia’s securities market
Dividends
Dividends paid to foreign companies, other foreign entities, non-Colombian residents or successors of non-Colombian residents are subject to Colombian income tax.
To avoid double taxation, corporate and branch profits are taxed at the corporate or branch level. If the accounting earnings and profits of a Colombian corporation exceed the tax profits subject to income tax, the excess is subject to income tax at the shareholder level. If the shareholder is a non-Colombian resident, the applicable tax rate is 33%.
Therefore, all distributions, including the payment of dividends, made by us to shareholders not resident in Colombia, will be exempted from income, withholding and remittance taxes. This exception would not apply in the case of distributions paid out of non-taxed earnings made by us which would be subject to the 33% income tax rate.
Taxation on Capital Gains for the sale of shares
Capital gains obtained in the sale of shares listed on the Colombian Stock Exchange (Bolsa de Valores de Colombia), or BVC, and owned by the same beneficial owner, are not subject to income tax in Colombia, provided that the shares sold during the taxable year do not represent more than 10% of the outstanding shares of the listed company. However, a seller of shares must file an income tax return for each transaction involving a sale of shares within the month following the sale, even when such sale is not subject to any tax.
Tax treatment by Non-Residents who purchase Ecopetrol’s shares in the BVC market and exchange them for ADRs
Dividends
Dividends paid to ADRs are not subject to income, withholding or remittance taxes. In the event that we distribute dividends from such taxes, the dividends are paid to the Depositary of ADRs. In any case, the Depositary of ADRs is only subject to income tax or complementary taxes and non-taxed earnings. The dividend payments would be taxed at the 33% rate.
U.S. Federal Income Tax Consequences
This summary describes the principal U.S. federal income tax consequences of the ownership and disposition of common shares or ADSs, but it does not purport to be a comprehensive description of all of the U.S. tax consequences that may be relevant to a decision to hold or dispose of common shares or ADSs. This summary applies only to purchasers of common shares or ADSs who will hold the common shares or ADSs as capital assets and does not apply to special classes of holders such as dealers in securities or currencies, holders whose functional currency is not the U.S. dollar, holders of ten percent or more of our shares (taking into account shares held directly or through depositary arrangements), tax-exempt organizations, financial institutions, holders liable for the alternative minimum tax, securities traders who elect to account for their investment in common shares or ADSs on a mark-to-market basis, partnerships or other pass-through entities, insurance companies, U.S. expatriates, and persons holding common shares or ADSs in a hedging transaction or as part of a straddle, conversion or other integrated transaction for U.S. federal income tax purposes. The statements regarding U.S. tax law set forth in this summary are based on U.S. law as in force on the date of this annual report, and changes to such law subsequent to the date of this annual report may affect the tax consequences described herein (possibly with retroactive effect). This summary is also based in part on the representations of the Depositary and the assumption that each obligation in the deposit agreement and any related agreement will be performed in accordance with its terms.
Each holder is encouraged to consult such holder’s tax advisor concerning the overall tax consequences to it, including the consequences under laws other than U.S. federal income tax laws, of an investment in common shares or ADSs.
In this discussion, references to a “U.S. Holder” are to a beneficial holder of a common share or an ADS (i) that is a citizen or resident of the United States of America, (ii) that is a corporation, or any other entity taxable as a corporation, organized under the laws of the United States of America, any state thereof or the District of Columbia, or (iii) that is otherwise subject to U.S. federal income taxation on a net basis with respect to the common shares or ADS.
For purposes of the U.S. Internal Revenue Code of 1986, as amended, which we call the “Code,” holders of ADSs will generally be treated as owners of the common shares represented by such ADSs.
This discussion does not address U.S. federal estate and gift tax or the alternative minimum tax consequences of holding common shares or ADSs. In addition, this discussion does not address the state, local and non-U.S. tax consequences of holding our common shares or ADSs.
Distributions on Common Shares or ADSs
A distribution to U.S. Holders made by us of cash or property with respect to common shares or ADSs generally will be treated as a dividend for U.S. federal income tax purposes to the extent paid out of our current or accumulated earnings and profits (as determined under U.S. federal income tax principles). A U.S. Holder of common shares or ADSs generally will be taxed on such dividend as ordinary income. Distributions in excess of our current or accumulated earnings and profits will be treated first as a tax-free return of capital reducing such U.S. Holder’s adjusted tax basis in the common shares or ADSs. Any distribution in excess of such adjusted tax basis will be treated as capital gain and will be either long-term or short-term capital gain depending upon whether the U.S. Holder held the common shares or ADSs for more than one year. Distributions of additional common shares or ADSs to U.S. Holders that are part of a pro rata distribution to all of our shareholders generally will not be subject to U.S. federal income tax. We do not maintain calculations of our earnings and profits under U.S. federal income tax principles, and, therefore, U.S. Holders should expect that any distributions generally will be reported as dividends for U.S. federal income tax purposes. As used below, the term “dividend” means a distribution that constitutes a dividend for U.S. federal income tax purposes.
The amount of any distribution will include the amount of Colombian tax withheld on the amount distributed, and the amount of a distribution paid in Pesos will be measured by reference to the exchange rate for converting Pesos into U.S. dollars in effect on the date the distribution is received by the Depositary (or by a U.S. Holder in the case of a holder of common shares). If the Depositary (or U.S. Holder in the case of a holder of common shares) does not convert such Pesos into U.S. dollars on the date it receives them, it is possible that the U.S. Holder will recognize foreign currency loss or gain, which would be ordinary loss or gain, when the Pesos are converted into U.S. dollars. Dividends paid by us will not be eligible for the dividends received deduction allowed to corporations under the Code.
Subject to certain exceptions for short-term and hedged positions, the dividends received by an individual prior to January 1, 2013 with respect to the ADSs will be subject to taxation at a maximum rate of 15.0% if the dividends are “qualified dividends.” Dividends paid on the ADSs will be treated as qualified dividends if (i) the ADSs are readily tradable on an established securities market in the United States and (ii) we were not, in the year prior to the year in which the dividend was paid, and are not, in the year in which the dividend is paid, a passive foreign investment company (“PFIC”). The ADSs are listed on the New York Stock Exchange, and will qualify as readily tradable on an established securities market in the United States so long as they are so listed. Based on our audited financial statements and relevant market and shareholder data, we believe that we were not treated as a PFIC for U.S. federal income tax purposes with respect to our 2010 taxable year. In addition, based on our audited financial statements and our current expectations regarding the value and nature of our assets, the sources and nature of our income, and relevant market and shareholder data, we do not anticipate becoming a PFIC for the 2011 taxable year. Based on existing guidance, it is not clear whether dividends received with respect to the common shares will be treated as qualified dividends. In addition, the U.S. Treasury has announced its intention to promulgate rules pursuant to which holders of ADSs or common shares and intermediaries through whom such securities are held will be permitted to rely on certifications from issuers to treat dividends as qualified for tax reporting purposes. Because such procedures have not yet been issued, it is not clear whether we will be able to comply with them. Holders of ADSs and common shares should consult their own tax advisers regarding the availability of the reduced dividend tax rate in the light of the considerations discussed above and their own particular circumstances.
A U.S. Holder will be entitled, subject to a number of complex limitations and conditions, to claim a U.S. foreign tax credit in respect of any Colombian income taxes withheld on dividends received on common shares or ADSs. U.S. Holders who do not elect to claim a credit for any foreign income taxes paid during the taxable year may instead claim a deduction in respect of such Colombian income taxes provided the U.S. Holder elects to deduct (rather than credit) all foreign income taxes for that year. Dividends received with respect to the common shares or ADSs will be treated as foreign source income, subject to various classifications and other limitations. For the purposes of the U.S. foreign tax credit limitations, the dividends paid with respect our common shares or ADSs should generally constitute “passive category income”. The rules relating to computing foreign tax credits or deducting foreign income taxes are extremely complex, and U.S. Holders are urged to consult their own independent tax advisors regarding the availability of foreign tax credits with respect to any Colombian income taxes withheld.
Sale, Exchange or Other Taxable Dispositions of Common Shares or ADSs
A U.S. Holder generally will recognize capital gain or loss upon the sale, exchange or other taxable disposition of common shares or ADSs in an amount equal to the difference between the amount realized on the sale, exchange or other taxable disposition of the common shares or ADSs and the U.S. Holder’s adjusted tax basis in the common shares or ADSs. Any gain or loss will be long-term capital gain or loss if the common shares or ADSs have been held for more than one year. Certain non-corporate U.S. Holders (including individuals) may be eligible for preferential rates of U.S. federal income tax in respect of long-term capital gains. The deductibility of capital losses is subject to limitations under the Code.
If you are a U.S. Holder of common shares or ADSs, the initial tax basis of your common shares or ADSs will be the U.S. dollar value of the Peso-denominated purchase price determined on the date of purchase. If the common shares or ADSs are treated as traded on an “established securities market,” a cash basis U.S. Holder, or, if it elects, an accrual basis U.S. Holder, will determine the dollar value of the cost of such common shares or ADSs by translating the amount paid at the spot rate of exchange on the settlement date of the purchase. If you convert U.S. dollars to Pesos and immediately use that currency to purchase common shares or ADSs, such conversion generally will not result in taxable gain or loss to you.
With respect to the sale or exchange of common shares or ADSs, the amount realized generally will be the U.S. dollar value of the payment received determined on (i) the date of receipt of payment in the case of a cash basis U.S. Holder and (ii) the date of disposition in the case of an accrual basis U.S. Holder. If the common shares or ADSs are treated as traded on an “established securities market,” a cash basis taxpayer, or, if it elects, an accrual basis taxpayer, will determine the U.S. dollar value of the amount realized by translating the amount received at the spot rate of exchange on the settlement date of the sale.
If a Colombian income tax is withheld or otherwise imposed on the sale, exchange or other taxable disposition of common shares or ADSs, the amount realized by a U.S. Holder will include the gross amount of the proceeds of that sale or other disposition before deduction of the Colombian income tax. Capital gain or loss, if any, realized by a U.S. Holder on the sale, exchange or other taxable disposition of common shares or ADSs generally will be treated as U.S. source income or loss for U.S. foreign tax credit purposes. Consequently, in the case of a disposition of a common share or ADS that is subject to Colombian income tax imposed on the gain, the U.S. Holder may not be able to benefit from the foreign tax credit for the Colombian income tax (because the income or loss on the disposition would be U.S. sourced), unless the U.S. Holder can apply the credit against U.S. federal income tax payable on other income from foreign sources. Alternatively, the U.S. Holder may take a deduction for the Colombian income tax if it does not elect to claim a foreign tax credit for any foreign income taxes paid or accrued during the taxable year.
Deposits and withdrawals of common shares in exchange for ADSs will not result in the realization of gain or loss for U.S. federal income tax purposes.
Backup Withholding and Information Reporting
In general, dividends on common shares or ADSs, and payments of the proceeds of a sale, exchange or other taxable disposition of common shares or ADSs, paid within the United States, by a U.S. payor through certain U.S.-related financial intermediaries to a U.S. Holder are subject to information reporting and may be subject to backup withholding at a current rate of 28% unless the holder (i) establishes that it is a corporation or other exempt recipient or (ii) with respect to backup withholding, provides an accurate taxpayer identification number and certifies that it is a U.S. person and that no loss of exemption from backup withholding has occurred.
Backup withholding is not an additional tax. The amount of any backup withholding tax from a payment to a U.S. Holder will be allowed as a credit against the U.S. Holder’s U.S. federal income tax liability, provided that the required information is timely furnished to the IRS. A U.S. Holder generally may obtain a refund of any amounts withheld under the backup withholding rules that exceed its U.S. federal income tax liability by timely filing a refund claim with the IRS.
U.S. Tax Considerations for Non-U.S. Holders
A holder or beneficial owner of common shares or ADSs that is not a U.S. Holder for U.S. federal income tax purposes (a “non-U.S. Holder”) generally will not be subject to U.S. federal income or withholding tax on dividends received on common shares or ADSs.
A non-U.S. Holder of common shares or ADSs will not be subject to U.S. federal income or withholding tax on gain realized on the sale of common shares or ADSs, unless, in the case of gain realized by an individual non-U.S. Holder, the non-U.S. Holder is present in the United States for 183 days or more in the taxable year of the sale and certain other conditions are met.
Although non-U.S. Holders generally are exempt from backup withholding, a non-U.S. Holder may be required to comply with certification and identification procedures in order to establish its exemption from information reporting and backup withholding.
We file reports, including annual reports on Form 20-F, and other information with the SEC pursuant to the rules and regulations of the SEC that apply to foreign private issuers. You may read and copy any materials filed with the SEC in the SEC’s public reference room at 100 F. Street, NE, Washington, D.C. 20549. Please call the SEC at 1-800-SEC-0330 for further information on the operation of the public reference room. Any filings we make are also available to the public over the Internet at the SEC’s website at www.sec.gov and at our website at www.ecopetrol.com.co. (This URL is intended to be an inactive textual reference only. It is not intended to be an active hyperlink to our website. The information on our website, which might be accessible through a hyperlink resulting from this URL, is not and shall not be deemed to be incorporated into this annual report.)
| ITEM 11. | Quantitative and Qualitative Disclosures About Market Risk |
Risk Management and Financial Instruments
We are subject to a number of risks. The most important risk we face is crude oil price volatility. Other exposures include currency and interest rate risk as we hold in our treasury investment portfolios a number of foreign currency-denominated instruments.
Oil price risk results from our day-to-day operations as we export and import crude oil and refined products.
Currently we manage our exposure to oil price variation risk using the cash flow at risk methodology. Through this tool our exposure to oil prices fluctuations is measured based on the impact that such variations have over the liquidity of the company.
Currency risk is mainly an accounting risk as we have to report our financial statements in Pesos whereas 50% of our operations are denominated in U.S. dollars. We manage our currency risk by maintaining funds in U.S. dollars and in Pesos. We use our U.S. dollar funds to meet our U.S. dollar denominated expenses and liabilities and our Peso funds to meet our Peso denominated expenses. Also, as the Company had been increasing its indebtedness, it balances its financial assets and liabilities in U.S. dollars so that the net balance is differently affected for a weaker or stronger Peso. As of 2010, the balance was positive so that when the Peso is devaluated in the aggregated Ecopetrol has financial assets.
Interest rate risk results from our exposure value of our floating-rate investments held in our investment portfolio and from the exposure of the credits we have in floating rate. As interest rates vary, the value of our floating-rate investments and credits can experience fluctuations as a result of market movements.
With respect to active interest rate risk, the effective duration of our fixed income portfolio in U.S. dollars vary between +/- 25% versus the portfolio’s benchmark.
Since 2007 we have been using a financial model based on key rate durations to measure our portfolio’s sensitivity to interest rate changes from each segment of the curve.
Through this model, risk managers try to recognize the fact that yield curve movements are caused by multiple market factors and do not depend on a curve equilibrium model. Also, the model allows us to calculate value at risk versus a previously defined benchmark.
We do not have any off-balance sheet debt. As a result of this, our exposure to passive interest rate is only marginal.
From time to time we enter into derivative contracts as we deem necessary to hedge our exposure to oil price, exchange rate and interest rate risks.
Investment Guidelines
Following Decree 2550 of 2008, our management established investment guidelines for our investment portfolios. In general terms, our guidelines determine that we should invest our excess cash in fixed-income securities of issuers rated A+ or higher according to the rating issued by a recognized rating agency. We have no limitation to invest in securities issued or guaranteed by the U.S. government and we may invest in securities issued by Organization for Economic Cooperation and Development, or OECD, member countries so long as they are rated A+ or higher.
Our investment portfolio in U.S. dollars is segmented in four tranches, each one matching our liquidity needs. Working capital is calculated taking into account our cash flow needs for the next 60 days. The liquidity tranche is calculated as the contingent cash flow needs over the working capital taking into account the development of capital expenditure projects. The asset liability tranche is built to match our off-balance sheet debt. Finally, the investment tranche is composed of the remaining resources from the total portfolio after deducting the above mentioned tranches.
Sensitivity Analysis
The following table provides information about our financial statements as of December 31, 2010 that may be sensitive to changes in West Texas Intermediate, or WTI, prices and exchange rates:
| | | | | | Income Statement Case WTI(1) + US$1 | | | Difference Between Real 2010 and Case WTI | | | Income Statement Case TRM(2) - 1% | | | Difference Between Real 2010 and Case TRM | |
| | | (Pesos in billions) | |
| Local Revenue | | | 18,084.43 | | | | 18,227.84 | | | | 143.42 | | | | 17,950.34 | | | | (134.08 | ) |
| Export Revenue | | | 23,883.89 | | | | 23,908.09 | | | | 24.20 | | | | 23,717.57 | | | | (166.32 | ) |
| Total Revenue | | | 41,968.31 | | | | 42,135.93 | | | | 167.62 | | | | 41,667.91 | | | | (300.40 | ) |
| Cost of Sales | | | 25,959.00 | | | | 25,963.50 | | | | 4.50 | | | | 25,959.64 | | | | (4.36 | ) |
| Selling Operating Expenses | | | 2,526.95 | | | | 2,526.95 | | | | 0.00 | | | | 2,526.91 | | | | 0.00 | |
| Administrative Operating Expenses | | | 603.52 | | | | 603.52 | | | | 0.00 | | | | 603.52 | | | | 0.00 | |
| Operating Profit | | | 12,878.84 | | | | 13,042.00 | | | | 163.16 | | | | 12,745.96 | | | | (296.00 | ) |
| Non-Operating Income (Expenses) | | | (1,386.23 | ) | | | (1,386.23 | ) | | | 0.00 | | | | (1,386.23 | ) | | | 0.00 | |
| Profit before Income Tax | | | 11,492.62 | | | | 11,655.78 | | | | 163.16 | | | | 11,192.11 | | | | (296.00 | ) |
| Income Tax | | | 3,346.15 | | | | 3,387.78 | | | | 41.63 | | | | 3,312.22 | | | | (33.93 | ) |
| Net Income | | | 8,146.47 | | | | 8,267.99 | | | | 121.53 | | | | 7,879.89 | | | | (262.08 | ) |
WTI= West Texas Intermediate.
| (1) | Average WTI for 2010 was US$79.54 for barrel. |
| (2) | Average Market Representative Rate for 2010 was $1,898.68 per US$1 on a calendar day basis |
Assumptions for the sensitivity analysis of Financial Statements
| | · | The base scenario on which our sensitivity analysis is made corresponds to the Consolidated Statements of Financial, Economic and Social Activity or Income Statement for 2010 as presented elsewhere in this annual report. |
| | · | The sensitivity of the WTI price index is the increase of one dollar per barrel of crude oil in the average WTI reference price based on a 365-day year for 2010. Prices assumed correspond to real prices for crude oil, natural gas and refined products for 2010, adjusted to account for the differences between such real prices and the WTI reference price. |
| | · | The sensitivity of our results to changes in the exchange rates is the decrease by 1% on the average exchange rate for 2010 on a calendar day basis. Prices assumed correspond to real prices of crude oil, natural gas and refined products in 2010, proportionally adjusted to account for differences between such real prices and the monthly average exchange rate. |
The table below sets forth the line items that are being affected by the variation on the reference prices or the average exchange rate.
| VARIATION ON WTI REFERENCE PRICE | VARIATION ON AVERAGE EXCHANGE RATE |
| OPERATING INCOME |
| Local Sales | Local Sales |
| Crude Oil | Crude Oil |
| Refined products | Refined products |
| Natural gas | Natural gas |
| | |
| Exports | Exports |
| Crude Oil | Crude Oil |
| Refined products | Refined products |
| Natural gas | Natural gas |
| COST OF SALES |
| Local purchases | Local purchases |
| Purchases from business partners | Purchases from business partners |
| Purchases of hydrocarbons from the ANH | Purchases of hydrocarbons from the ANH |
| Purchases of Natural gas | Purchases of Natural gas |
| Imports | Imports |
| Crude Oil | Crude Oil |
| Products | Products |
| NON-OPERATING INCOME |
| | Exchange income |
| | Exchange loss |
| ITEM 12. | Description of Securities Other than Equity Securities |
Not applicable.
| ITEM 12B. | Warrants and Rights |
Not applicable.
| ITEM 12C. | Other Securities |
Not applicable.
| ITEM 12D. | American Depositary Shares |
Fees and charges that a holder of our ADSs may have to pay, either directly or indirectly
JPMorgan Chase Bank, N.A., our Depositary, may charge each person to whom, American Depositary Shares, or ADSs, are issued, including, without limitation, issuances against deposits of shares, issuances in respect of share distributions, rights and other distributions, issuances pursuant to a stock dividend or stock split declared by us or issuances pursuant to a merger, exchange of securities or any other transaction or event affecting the ADSs or deposited securities, and each person surrendering ADSs for withdrawal of deposited securities in any manner permitted by the deposit agreement or whose American Depositary Receipts, or ADRs, are cancelled or reduced for any other reason, US$5.00 for each 100 ADSs (or any portion thereof) issued, delivered, reduced, cancelled or surrendered, as the case may be. The Depositary may sell (by public or private sale) sufficient securities and property received in respect of a share distribution, rights and/or other distribution prior to such deposit to pay such charge.
The Depositary collects its fees for issuance and cancellation of ADSs directly from investors depositing shares or surrendering ADSs for the purpose of withdrawal or from intermediaries acting for them. The Depositary collects fees for making distributions to investors by deducting those fees from the amounts distributed or by selling a portion of distributable property to pay the fees. The Depositary may collect its annual fee for Depositary services by deduction from cash distributions, or by directly billing investors, or by charging the book-entry system accounts of participants acting for them. The Depositary may generally refuse to provide services to any holder until the fees and expenses owing by such holder for those services or otherwise are paid.
The following additional charges shall be incurred by ADS holders, by any party depositing or withdrawing shares or by any party surrendering ADSs or to whom ADSs are issued (including, without limitation, issuance pursuant to a stock dividend or stock split declared by us or an exchange of stock regarding the ADRs or the deposited securities or a distribution of ADSs), whichever is applicable:
| | · | a fee of US$1.50 per ADR or ADRs for transfers of certificated or direct registration ADRs; |
| | · | a fee of up to US$0.05 per ADS for any cash distribution made pursuant to the deposit agreement; |
| | · | a fee of US$0.05 per ADS per calendar year (or portion thereof) for services performed by the Depositary in administering our ADR program (which fee may be charged on a periodic basis during each calendar year and shall be assessed against holders of ADRs as of the record date or record dates set by the Depositary during each calendar year and shall be payable in the manner described in the next succeeding provision); |
| | · | any other charge payable by any of the Depositary, any of the Depositary’s agents, including, without limitation, the custodian, or the agents of the Depositary’s agents in connection with the servicing of our shares or other deposited securities (which charge shall be assessed against registered holders of our ADRs as of the record date or dates set by the Depositary and shall be payable at the sole discretion of the Depositary by billing such registered holders or by deducting such charge from one or more cash dividends or other cash distributions); |
| | · | a fee for the distribution of securities (or the sale of securities in connection with a distribution), such fee being in an amount equal to the fee for the execution and delivery of ADSs which would have been charged as a result of the deposit of such securities (treating all such securities as if they were shares) but which securities or the net cash proceeds from the sale thereof are instead distributed by the Depositary to those holders entitled thereto; |
| | · | stock transfer or other taxes and other governmental charges; |
| | · | cable, telex and facsimile transmission and delivery charges incurred at the ADS holder’s request; |
| | · | transfer or registration fees for the registration of transfer of deposited securities on any applicable register in connection with the deposit or withdrawal of deposited securities; |
| | · | expenses of the Depositary in connection with the conversion of foreign currency into U.S. dollars; and |
| | · | such fees and expenses as are incurred by the Depositary (including, without limitation, expenses incurred in connection with compliance with foreign exchange control regulations or any law or regulation relating to foreign investment) in delivery of deposited securities or otherwise in connection with the Depositary’s or its custodian’s compliance with applicable laws, rules or regulations. |
We will pay all other charges and expenses of the Depositary and any agent of the Depositary (except the custodian) pursuant to agreements from time to time between us and the Depositary. The fees described above may be amended from time to time.
Fees and other direct and indirect payments made by the Depositary to us
Our Depositary has agreed to reimburse us for certain expenses we incur that are related to establishment and maintenance of the ADR program, including investor relations expenses and exchange application and listing fees. In 2010, the Depositary made direct payments and reimbursements to us in the amount of approximately US$73,000 for expenses related to investor relations expenses.
| ITEM 13. | Defaults, Dividend Arrearages and Delinquencies |
None.
| ITEM 14. | Material Modifications to the Rights of Security Holders and Use of Proceeds |
None.
| ITEM 15. | Controls and Procedures |
Disclosure Controls and Procedures
As required by Rules 13a-15(e) and 15d-15(e) under the Securities Exchange Act of 1934, for the fiscal year ending as of December 31, 2010, we evaluated the design and effectiveness of our financial disclosure controls and procedures under the supervision and participation of our management, including our Chief Executive Officer and Chief Financial Officer. There are inherent limitations to the effectiveness of any system of disclosure controls and procedures, including the possibility of human error and the circumvention or overriding of the controls and procedures. Accordingly, even if effective, disclosure controls and procedures can only provide reasonable assurance of achieving their control objectives.
Based upon this evaluation, our Chief Executive Officer and Chief Financial Officer concluded that as of the end of the period covered by this annual report, our disclosure controls and procedures were effective to provide reasonable assurance that the information required to be disclosed in the reports that we file and submit under the Securities Exchange Act of 1934 is recorded, summarized and reported as and when required and is accumulated and communicated to our management, including our Chief Executive Officer and Chief Financial Officer, or persons performing similar functions, as appropriate to allow timely decisions regarding required disclosure.
Disclosure Controls and Procedures Remediation for Fiscal Year Ended December 31, 2009
In connection with the Commission’s review process of our Form 20-F, the Company concluded that, as a result of the material weakness in the Company’s internal control over financial reporting relating to the preparation and analysis of the differences existing between Colombian Government Entity GAAP and US GAAP, its disclosure controls and procedures were ineffective as of the period covered by the Form 20-F for the fiscal ended on December 31, 2009.
During 2010, the Company designed and initiated the implementation and development of a remediation plan to address the mentioned material weakness in the Internal Control over Financial Reporting, which included actions to improve the Company’s disclosure controls and procedures. For further detail on these actions, please refer to the following section: “Management´s Annual Report on Internal Control over Financial Reporting.”
Management’s Annual Report on Internal Control over Financial Reporting
Our management is responsible for establishing and maintaining adequate internal control over financial reporting as defined in Rules 13a-15(f) and 15 (d)-15(f) under the Securities Exchange Act of 1934. Our internal control over financial reporting is a process designed under the supervision of our Chief Executive Officer and Chief Financial Officer, and effected by our board of directors, management and other personnel, to provide reasonable assurance regarding the reliability of financial reporting and the preparation of our financial statements for external reporting purposes, in accordance with generally accepted accounting principles, and it includes those policies and procedures that:
| | · | pertain to the maintenance of records that, in reasonable detail, accurately and fairly reflect transactions and dispositions of our assets; |
| | · | provide reasonable assurance that transactions are recorded as necessary to permit preparation of financial statements in accordance with generally accepted accounting principles, and that receipts and expenditures are being made only in accordance with authorization of our management and directors; and |
| | · | provide reasonable assurance regarding prevention or timely detection of unauthorized acquisition, use or disposition of our assets that could have a material effect on our financial statements. |
Because of its inherent limitations, internal control over financial reporting may not prevent or detect misstatements. Therefore, effective control over financial reporting cannot, and does not, provide absolute assurance of achieving our control objectives. Also, projection of any evaluation of the effectiveness of the internal controls to future periods is subject to the risk that controls may become inadequate because of changes in conditions or that the degree of compliance with the policies or procedures may deteriorate.
As of the year ended December 31, 2010, our management conducted an assessment of the effectiveness of our internal control over financial reporting in accordance with the criteria established in the publication “Internal Control—Integrated Framework,” issued by the Treadway Commission’s Committee of Sponsoring Organizations (COSO), as well as the rules prescribed by the SEC in its Final Rule “Management's Report on Internal Control Over Financial Reporting and Certification of Disclosure in Exchange Act Periodic Reports.”
Based on the assessment performed, management concluded that our internal control over financial reporting was effective as of the end of the period covered by this annual report.
The effectiveness of our internal control over financial reporting has been audited by PricewaterhouseCoopers Ltda., an independent registered public accounting firm, as stated in their audit report accompanying our consolidated financial statements.
Remediation Plan in Respect of Material Weakness Identified in Internal Control over Financial Reporting for the Fiscal Year Ended December 31, 2009
As reported in our annual report on Form 20-F for the fiscal year ended on December 31, 2009, management identified a material weakness in our process relating to the preparation and analysis of the differences existing between Colombian Government Entity GAAP and U.S. GAAP.
The Company designed and implemented a remediation plan to address the material weakness, which included steps to improve the Company’s internal control over financial reporting. Main Company’s remedial actions included:
| | 1. | During the third quarter of 2010, a U.S. GAAP assurance team was integrated as part of the VP Finance organization structure. This team has the responsibility to plan, coordinate, oversee and review the entire process of the reconciliation of Colombian Government Entity GAAP to U.S. GAAP for Ecopetrol and its subsidiaries. In addition, an external advisor was engaged to support the reconciliation process. |
| | 2. | During the third quarter of 2010, a SAP module was implemented to enhance information technology support of the process of preparing and analyzing the differences between Colombian Government Entity GAAP and U.S. GAAP. |
| | 3. | During the fourth quarter of 2010, a training plan was designed and implemented for accounting personnel at both the Company and its subsidiaries in order to improve knowledge concerning U.S.GAAP and SEC requirements. External personnel with relevant experience were also hired to reinforce the capabilities of the assurance team. |
| | 4. | During the second half of 2010, the process to prepare and analyze the differences between Colombian Government Entity GAAP and U.S. GAAP was redesigned to address control deficiencies, as well as to involve the Company’s subsidiaries in this process. As part of this process, the Company has: |
| | o | established a formal procedure to review new regulations under U.S. GAAP or promulgated by the SEC that might apply to the Company and its subsidiaries; |
| | o | updated internal control procedures, as well as risk and control matrices; |
| | o | improved and implemented monitoring activities through the definition of a formal review performed by the accounting and finance personnel involve in the process; and |
| | o | designed and implemented templates to collect information required to analyze the differences between Colombian Government Entity GAAP and U.S. GAAP and prepare the reconciliation. |
| | 5. | As of September 30, 2010, the Company conducted a reconciliation process in order to test controls and procedures designed, as well as to identify areas of improvement. |
| | 6. | Controls and process deficiencies identified in 2009 were considered to improve the reconciliation process and disclosure controls and procedures as of December 31, 2010. Further, a quality assurance review was performed by the U.S. GAAP assurance team for the closing and disclosure procedures as of December 31, 2010. |
| | 7. | Prior to the submission of this report, a monitoring process was developed to assist the Disclosure Committee members focus on key aspects of this annual report on Form 20-F. |
During the process to prepare and analyze differences between Colombian Government Entity GAAP and U.S. GAAP of the financial statements ended on December 31, 2010, the Company, through the operation of its controls implemented in response to the material weakness as of December 31, 2009, identified an adjustment to the financial statements for the year ended December 31, 2009, related to the determination of the amount of unrealized gains and losses of health, education and pension bond employee benefit plans, which resulted in the restatement of the financial statements as of and for the year ended December 31, 2009. See "Management's Consideration of the Restatement" below.
Management believes that the controls and procedures implemented during 2010, including improvement of monitoring controls, engagement of related advisory services, and review of the information provided by the Actuary, have enhanced our reconciliation process and disclosure procedures to address root causes of the material weakness disclosed in our 20-F Annual Report for fiscal year ended on December 31, 2009 and accordingly, the material weakness has been remediated as of December 31, 2010.
Attestation Report of the Registered Public Accounting Firm
PricewaterhouseCoopers Ltda.’s attestation report on our internal control over financial reporting is included in their audit report accompanying our consolidated financial statements. See our consolidated financial statements.
Management’s Consideration of the Restatement
In connection with the restatement of the Company’s 2009 financial statements set forth in this Form 20-F, management evaluated if the inappropriate determination of the amount of unrealized gains and losses of health, education and pension bond employee benefit plans during the year ended December 31, 2009 under U.S. GAAP was indicative of a deficiency in internal control over financial reporting for 2010. While a material weakness relating to the preparation and analysis of the differences between Colombian Government Entity GAAP and U.S. GAAP existed as of December 31, 2009, management of the Company concluded that a deficiency in internal control over financial reporting for the year ended on December 31, 2010 did not exist. In reaching this conclusion, management considered the results of its overall assessment of the Company’s financial reporting process and controls, including controls implemented in 2010 for the U.S. GAAP reconciliation which identified and corrected 2009 errors, as well as the specific remedial actions mentioned above.
Changes in Internal Control over Financial Reporting
As discussed under the sections “Disclosure controls and procedures remediation” and “Remediation of Material Weakness in Internal Control over Financial Reporting”, there were changes in our internal control over financial reporting during the fourth quarter of 2010.
| ITEM 16A. | Audit Committee Financial Expert |
On May 12, 2011 our Board of Directors determined that Henry Medina Gonzalez, a member of our Audit Committee, meets the requirements of an “audit committee financial expert” within the meaning of this Item 16A. See “Item 6. Directors, Senior Management and Employees—Audit Committee.”
We have adopted a code of ethics within the meaning of this Item 16B of Form 20-F, which complies with applicable U.S. and Colombian law. Our code of ethics applies to our chief executive officer, chief financial officer, principal accounting officer, persons performing similar functions and other personnel. Our code of ethics is available on our website at http://www.ecopetrol.com.co/english/especiales/Ethics_Code2010_English/index_eng.html. If we amend the provisions of our code of ethics that apply to our chief executive officer, our chief financial officer, our principal accounting officer and persons performing similar functions, or if we grant any waiver of such provisions, we will disclose such amendment or waiver on our website at the same address.
| ITEM 16C. | Principal Accountant Fees and Services |
Audit and Non-Audit Fees
Our consolidated financial statements for fiscal years ended December 31, 2010 and 2009 were audited by PwC. The following table sets forth the fees billed to us by PricewaterhouseCoopers, during fiscal years ended December 31, 2010 and 2009:
| | | At December 31, | |
| | | 2010 | | | 2009 | |
| | | (in millions of pesos, excluding 16% value added tax) | |
| Audit fees | | | 6,021 | | | | 4,435 | |
| Audit-related fees | | | 792 | | | | 1,306 | |
| | | | | | | | | |
| Total | | | 6,813 | | | | 5,741 | |
Audit Fees. The audit fees listed in the table above are the aggregated fees billed by PricewaterhouseCoopers in connection with its audits of our annual consolidated financial statements (under Colombian Government Entity GAAP and U.S. GAAP), interim consolidated financial statements (under Colombian Government Entity GAAP), subsidiary audits (under local GAAP) and review of periodic documents filed with the SEC. In addition, these audit fees include fees related to our independent auditors’ audits of our internal controls over financial reporting.
Audit-related Fees. The audit–related fees listed in the table above are the fees billed by PricewaterhouseCoopers in connection with its audit of our variable compensation bonus system.
For the years ended December 31, 2010 and 2009, there were no tax fees or other fees billed by PricewaterhouseCoopers.
Audit Committee Approval Policies and Procedures
Our audit committee has not established pre-approval policies and procedures for the engagement of our independent auditors for services. Our audit committee expressly approves on a case-by-case basis any engagement of our independent auditors for audit and non-audit services provided to us.
| ITEM 16D. | Exemptions from the Listing Standards for Audit Committees |
| ITEM 16E. | Purchases of Equity Securities by the Issuer and Affiliated Purchasers |
| ITEM 16F. | Change in Registrant’s Certifying Accountant |
Pursuant to our bylaws, before they were amended on March 24, 2011, the service of any independent external auditor for the Company was limited to a term of three years, PricewaterhouseCoopers Ltda. served as our independent registered public accounting firm for the fiscal years ended December 31, 2010, 2009 and 2008. At the ordinary shareholders’ meeting held on March 24, 2011, the shareholders approved the appointment of KPMG Ltda., as recommended by the Company’s Audit Committee as the new independent registered public accounting firm to replace PricewaterhouseCoopers Ltda. On May 2, 2011, the Company engaged KPMG Ltda. as the Company’s new independent registered public accounting firm to audit the Company’s consolidated financial statements and internal control over financial reporting for the fiscal year ending December 31, 2011.
The audit reports of PricewaterhouseCoopers Ltda on the Company’s consolidated financial statements as of and for the years ended December 31, 2010 and 2009 contained no adverse opinion or disclaimer of opinion and were not qualified or modified as to uncertainty, audit scope or accounting principle.
During the Company’s two most recent fiscal years ended December 31, 2010 and 2009 and subsequent interim periods through July 15, 2011, there were no disagreements with PricewaterhouseCoopers Ltda. on any matter of accounting principles or practices, financial statement disclosure, or auditing scope or procedure, which disagreements if not resolved to the satisfaction of PricewaterhouseCoopers Ltda. would have caused them to make reference thereto in their reports on the consolidated financial statements for such periods.
During the Company’s two most recent fiscal years ended December 31, 2010 and 2009 and the subsequent periods through July 15, 2011, there have been no reportable events (as defined in Item 304(a)(1)(v)) of Regulation S-K), except as disclosed in Item 15 of the Company's Form 20-F for the year ended December 31, 2009, the Company reported a material weakness in the process relating to the preparation and analysis of the differences existing between Colombian Government Entity GAAP and U.S. generally accepted accounting principles (U.S. GAAP). The material weakness was the result of the aggregation of control deficiencies due to our lack of sufficient accounting personnel competent in the application of U.S. GAAP to ensure:
(1) appropriate interpretation of U.S. GAAP to determine the differences existing in terms of non-recurring transactions such as business combinations, including the measurement and financial statement presentation of goodwill, non-controlling (minority) interest, additional paid in capital, contingent considerations and deferred income tax; and timely review of adjustments to fair value on the acquisition date for validity and accuracy;
(2) appropriate interpretation of U.S. GAAP to estimate the differences existing in terms of recurring transactions including changes in the lives of fixed assets; analysis of conditions used to estimate contingent liabilities; and the completeness and accuracy of (i) the basis, both for income tax and financial reporting purposes, used to compute the deferred income tax over consolidated assets and liabilities, and (ii) journal entries to record the differences; and
(3) that entries relating to U.S. GAAP differences and financial statements reconciled to U.S. GAAP were analyzed, reviewed and monitored on a timely basis to provide reasonable assurance of their validity, accuracy and completeness.
The Company's Audit Committee discussed this matter with PricewaterhouseCoopers Ltda. and has authorized PricewaterhouseCoopers Ltda. to respond fully to the inquiries of KPMG Ltda. concerning this matter.
We have provided a copy of this disclosure to PricewaterhouseCoopers Ltda. and requested that PricewaterhouseCoopers Ltda. furnish us with a letter addressed to the SEC stating whether or not it agrees with the above statements. A copy of such letter, dated July 15, 2011, is filed as an exhibit to this Form 20F.
| ITEM 16G. | Corporate Governance |
Pursuant to the requirements of Section 303A.11 of the NYSE’s Listed Company Manual, the following is a summary of the significant differences between our corporate governance practices and those required for U.S. companies under the NYSE listing standards.
The following discloses the significant differences between our corporate governance practices and the NYSE standards.
| NYSE Standards | | Our Corporate Governance Practices |
| Director Independence |
| |
| The majority of board of directors must be independent. §303A.01. “Controlled companies,” which would include Ecopetrol if we were a U.S. issuer, are exempt from this requirement. A controlled company is one in which more than 50% of the voting power is held by an individual, group or another company, rather than the public. §303A.00. | | Law No. 964/2005 establishes that (i) the board of directors of listed companies must be comprised of a minimum of five directors and a maximum of ten directors and (ii) at least 25% of board members must be independent. Under our corporate governance guidelines, our board of directors must be comprised of nine directors, of which at least three must be independent. As of the date of this annual report, we have six independent directors. |
| | | |
| Executive Sessions |
| |
| The non-management directors of each listed company must meet at regularly scheduled executive sessions without management. §303A.03. | | A comparable rule does not exist under Colombian law. Except for our Audit Committee, our Board of Directors does not meet without management. |
| | | |
| Nominating/Corporate Governance and Sustainability Committee |
| |
| A nominating/corporate governance and sustainability committee composed entirely of independent directors is required. The committee must have a charter specifying the purpose, duties and evaluation procedures of the committee. §303A.04. “Controlled companies” are exempt from these requirements. §303A.00. | | Colombian law does not require the establishment of a nominating/corporate governance and sustainability committee composed entirely of independent directors. Pursuant to our bylaws, we have a three-member corporate governance and sustainability committee comprised of at least one independent director which acts pursuant to a written charter. |
| | | |
| Compensation Committee |
| |
| A compensation committee composed entirely of independent directors is required, which must evaluate and approve executive officer compensation. The committee must have a charter specifying the purpose, duties and evaluation procedures of the committee. §303A.05. “Controlled companies” are exempt from this requirement. §303A.00. | | Colombian law does not require the establishment of a compensation committee composed entirely of independent directors. Pursuant to our bylaws, we have a three member nomination and compensation committee comprised of at least one independent director which acts pursuant to a written charter. |
| | | |
| Audit Committee |
| |
| An audit committee with a minimum of three independent directors satisfying the independence and other requirements of Rule 10A-3 under the Exchange Act and the more stringent requirements under the NYSE standards is required. §303A.06, §303A.07. | | According to Law No. 964/2005, Colombian companies that are authorized to issue securities by the Superintendency of Finance must have an audit committee that satisfies the requirements of Law No. 964/2005, including its minimum number of members, independence criteria and audit related duties. Our audit committee is composed by Joaquin Moreno, Mauricio Cárdenas, Federico Rengifo and Henry Medina, all of whom are independent directors, and the committee meets the requirements of Law No. 964/2005 and Rule 10A 3 under the Exchange Act. |
| Equity Compensation Plans |
| |
| Equity compensation plans and all material revisions thereto require shareholder approval, subject to limited exemptions. §§303A.08 and 312.03. | | Under Colombian law, no similar right to vote on equity compensation plans and material revisions thereto is given to shareholders. We do not give our shareholders the right to vote on equity compensation plans and material revisions thereto. |
| | | |
| Corporate Governance Guidelines |
| |
| Listed companies must adopt and disclose corporate governance guidelines. §303A.09. | | The Superintendency of Finance does recommend the adoption of corporate governance guidelines. However, according to Superintendency of Finance Circular No. 056/2007, the adoption of corporate governance guidelines is voluntary. Listed companies must annually publish a corporate governance survey comparing their corporate governance standards with those recommended by the Superintendency of Finance. Our corporate governance guidelines are listed on our website at http://www.ecopetrol.com.co. |
| | | |
| Code of Ethics for Directors, Officers and Employees |
| |
| Corporate governance guidelines and a code of business conduct and ethics is required, with disclosure of any waiver for directors or executive officers. The code must contain compliance standards and procedures that will facilitate the effective operation of the code. §303A.10. | | We have adopted a code of ethics which complies with applicable U.S. and Colombian law. Our code of ethics applies to our chief executive officer, chief financial officer, principal accounting officer, persons performing similar functions and other personnel. Our code of ethics is available on our website at: http://www.ecopetrol.com.co/english/especiales /Ethics_Code2010_English/index_eng.html |
| ITEM 17. | Financial Statements |
Not applicable.
| ITEM 18. | Financial Statements |
See our audited consolidated financial statements beginning on page F-1, incorporated herein by reference.
Exhibit No. | | Description |
| | | |
| 1.1 | | Bylaws of Ecopetrol S.A. dated November 6, 2007 as recorded under Public Deed No. 5314 of November 14, 2007 (incorporated by reference to Exhibit 1.1 on Form 20-F filed with the U.S. Securities and Exchange Commission on September 12, 2008 (File No. 001-34175)). |
| | | |
| 1.2 | | Amended and Restated Bylaws of Ecopetrol S.A., dated March 24, 2011, as recorded under Public Deed No. 560 of May 23, 2011. |
| | | |
| 4.1 | | Transportation Agreement between Ecopetrol S.A. and Oleoducto Central S.A., dated March 31, 1995 (incorporated by reference to Exhibit 4.1 on Form 20-F filed with the U.S. Securities and Exchange Commission on September 12, 2008 (File No. 001-34175)). |
| | | |
| 4.2 | | Natural Gas Transportation Agreement between Ecopetrol S.A. and Empresa Colombiana de Gas-Ecogas, dated October 6, 2006 (incorporated by reference to Exhibit 4.2 on Form 20-F filed with the U.S. Securities and Exchange Commission on September 12, 2008 (File No. 001-34175)). |
| | | |
| 4.3 | | Indenture, dated as of July 23, 2009, between the Company and The Bank of New York Mellon, as trustee (incorporated by reference to Exhibit 4.2 to the Company’s Form F-4 filed with the U.S. Securities and Exchange Commission on July 31, 2009 (File No. 333-160965)). |
| | | |
| 8.1 | | List of subsidiaries of Ecopetrol S.A. |
| | | |
| 12.1 | | Section 302 Certification of the Chief Executive Officer. |
| | | |
| 12.2 | | Section 302 Certification of the Chief Financial Officer. |
| | | |
| 13.1 | | Section 906 Officer Certification. |
| | | |
| 16.1 | | Letter dated July 15, 2011 of PricewaterhouseCoopers Ltda. as required by Item 16F of Form 20-F. |
| | | |
| 23.1 | | Consent of PricewaterhouseCoopers Ltda. |
| | | |
| 23.2 | | Consent of Ryder Scott. |
| | | |
| 23.3 | | Consent of Gaffney, Cline & Associates. |
| | | |
| 23.4 | | Consent of DeGolyer and MacNaughton. |
| | | |
| 99.1 | | Third Party Reserve Report of Ryder Scott. |
| | | |
| 99.2 | | Third Party Reserve Report of Gaffney, Cline & Associates. |
| | | |
| 99.3 | | Third Party Reserve Report of DeGolyer and MacNaughton. |
ANNEX I
DESCRIPTION OF EXPLORATION AND PRODUCTION CONTRACTS
| Region | Contract Name | Type of Agreement | Purpose | Operator | Partners | Ownership Percentage | Partnership Percentage | Term of Contract | Expiration Date | Right of Reversion Upon Termination | Royalty |
| Southern | Abanico | Joint Venture | E&P | Pacific Stratuss Energy | Pacific Stratuss Energy | 50% | | 28 years | October 10, 2024 | Yes | 5% to 25% |
| Minor Fields | Alcaravan | Joint Venture- Sole Risk | E&P | Colombia Energy Development Co. | Colombia Energy Development Co. | 0% | Columbia Energy Development Co. 100% | 28 years | February 13, 2021 | Yes | 20% - 5% |
| Minor Fields | Arjona | Discovered Undeveloped Field | CDND/I | Vetra- Suroco Consortium | Vetra- Suroco Consortium | 40% | Consorcio Vetra – Suroco 60% Volumen A (Escalonada) | 10 years | March 9, 2017 | Yes | 8% to 25% |
| Southern | Ambrosia | Joint Venture | E&P | Interoil | Interoil | 30% | Interoil Colombia E&P 70% | 25 years | December 27, 2027 | Yes | 8% to 25% |
| Minor Fields | Barranca Lebrija | Discovered Undeveloped Field | CDND/I | Union Temporal Mocam SAS | Union Temporal Mocam SAS (Aser Ingenieria Ing S.A., Conequipos Ing LTDA. Move S.A. Montecz S.A.) | 19% | Unión Temporal Mocam S.A.S. 80% | 10 years | December 29, 2013 | Yes | 20% |
| Minor Fields | Bocachico | Joint Venture- Sole Risk | E&P | Colombia Energy Development Co.( antes Harken) | Colombia Energy Development Co.( antes Harken) | 0% | Columbia Energy Development Co. 100% | 28 years | March 7, 2022 | Yes | 20% |
| Southern | Armero | Joint Venture | E&P | Interoil | Interoil | 50% | Interoil Colombia E&P 70% | 28 years | December 31, 2010 | Yes | 20% |
| Minor Fields | Bolivar | Joint Venture- Sole Risk | E&P | Colombia Energy Development Co.( antes Harken) | Colombia Energy Development Co.( antes Harken) | 0% | Columbia Energy Development Co. 100% | 28 years | June 12, 2024 | Yes | 20% |
| Minor Fields | Camoa | Discovered Undeveloped Field | CDND/I | Drilling and Workover Services Ltda. | Drilling and Workover Services Ltda. | 20% | Drilling and Workover Services Ltda. 80% | 10 years | December 28, 2013 | Yes | 6% |
| Minor Fields | Capachos | Joint Venture | E&P | Repsol YPF | Repsol YPF | 50% | Repsol YPF 50% | 28 years | September 15, 2025 | Yes | 5% to 8% |
| Minor Fields | Carbonera la Silla | Discovered Undeveloped Field | CDND/I | Mompos Oil Company Inc. | Mompos Oil Company Inc. | 6% | Mompos Oil Company Inc. 94% | 10 years | October 25, 2014 | Yes | 20% |
| Southern | Boqueron | Joint Venture | E&P | Petrobras | Petrobras/Nexen | 50% (actualmente 75% por factor R) | Petrobras Colombia Ltd. 15% Nexen Petroleum Colombia Ltd. 10% | 28 years | September 30, 2023 | Yes | 5% to 25% |
| Minor Fields | Cerrito | Joint Venture | E&P | Pacific Stratus Energy | Pacific Stratus Energy | 30% | Pacific Stratus Energy 70% | 27.5 years | August 17, 2029 | Yes | 20% |
| Southern | Caguan | Joint Venture | E&P | Petrobras | Petrobras/ Pacific Stratus Energy | 50% | Petrobras Iternational Braspero BV 22.7268% Pacific Stratus Energy 27.2732% | 28 years | December 31, 2011 | Yes | 20% Crudo Rio Ceibas 8% Crudo Espino 6.4% Gas Espino |
| Minor Fields | Chaparral | Joint Venture | E&P | Vetra Exploracion y Produccion Colombia | Vetra Exploracion y Produccion Colombia | 50% | Vetra Exploración u Producción Colombia S.A.S. 50% | 28 years | October 4, 2015 | Yes | 8% |
| Region | Contract Name | Type of Agreement | Purpose | Operator | Partners | Ownership Percentage | Partnership Percentage | Term of Contract | Expiration Date | Right of Reversion Upon Termination | Royalty |
| Minor Fields | Chenche | Discovered Undeveloped Field | CDND/I | Vetra Exploracion y Produccion Colombia | Vetra Exploracion y Produccion Colombia | 70% | Vetra Exploración u Producción Colombia S.A.S. 30% | 10 years | December 28, 2013 | Yes | 8% |
| Catatumbo-Orinoquía | Campo Rico | Joint Venture | E&P | Emerald Energy PLC Sucursal Colombia | Emerald Energy PLC Sucursal Colombia | 50% | Emerald Energy PLC Sucursal Colombia 50% minus R factor | 25 years | May 24, 2027 | Yes | 8% |
| Minor Fields | Chipalo | Joint Venture- Sole Risk | E&P | Pacific Stratus Energy | Pacific Stratus Energy | 0% | Pacific Stratus Energy 100% | 28 years | February 27, 2026 | Yes | 6% |
| Minor Fields | Dindal | Joint Venture- Sole Risk | E&P | Pacific Stratus Energy | Pacific Stratus Energy | 0% | Pacific Stratus Energy 100% | 28 years | March 22, 2021 | Yes | 20% |
| Minor Fields | Entrerrios | Discovered Undeveloped Field | CDND/I | Union Temporal Andina | Union Temporal Andina | 61% Pozos desde superficie hasta 9000 pies. Pozos mayor a 9000 pies, 40% más clausula de Precios altos | Unión Temporal Andina 39% Pozos desde superficie hasta 9000 pies. Pozos mayor a 9000 pies, 60% más clausula de Precios altos | 10 years | December 28, 2013 | Yes | 8% to 25% |
| Central | Caracara | Joint Venture | E&P | CEPCOLSA | CEPCOLSA | 30% | Cepcolsa 70% | 28 years | April 8, 2029 | Yes | 8% to 25% |
| Mid – Magdalena Valley | Carare las Monas | Joint Venture | E&P | Petrosantander | Petrosantander | 30% (Pozos Payoa West-ST y Corazón 09 se encuentran en solo riesgo 100% a cargo de la Asociada | Petrosantander Colombia Inc. 70% | Until economic limit | Until economic limit | Yes | 8% to 20% |
| Minor Fields | Guachiria | Joint Venture | E&P | Lewis Energy | Lewis Energy | 13% | Lewis Energy 87% | 28 years | September 30, 2031 | Yes | 8% |
| Minor Fields | Guarimena | Discovered Undeveloped Field | CDND/I | Vetra Exploracion y Produccion Colombia | Vetra Exploracion y Produccion Colombia | 81% | Vetra Exploracion y Produccion Colombia S.A.S. 19% | 10 years | January 17, 2018 | Yes | 20% |
| Catatumbo-Orinoquía | Casanare | Joint Venture | E&P | Perenco | Perenco - Hocol and Homcol | 64% 60% para WTI <28 USD/bl y 64% WTI >= 28USD/bl | Hocol 7.2% Homcol 7.2% Perenco 25.6% | Until economic limit | Until economic limit | Yes | 20% |
| Minor Fields | La Punta | Discovered Undeveloped Field | CDND/I | Vetra Exploracion y Produccion Colombia | Vetra Exploracion y Produccion Colombia | 70% | Vetra Exploración y Producción Colombia S.A.S. Volumen de Desarrollo 30% | 10 years | December 28, 2013 (Amendment 2 August 3, 2020) | Yes | 8% |
| Minor Fields | Las Quinchas | Joint Venture- Sole Risk | E&P | Pacific Stratus Energy | Pacific Stratus Energy | 0% | Pacific Stratus Energy 100% | 28 years | February 19, 2024 | Yes | 6% |
| Minor Fields | Lebrija | Joint Venture- Sole Risk | E&P | Petroleos del Norte S.A. | Petroleos del Norte S.A. | 0% | Petroleos del Norte S.A. 100% | 28 years | July 19, 2014 | Yes | 20% |
| Minor Fields | Magangué | Joint Venture | E&P | Solana Petroleum Exploration (Colombia Limited) | Solana Petroleum Exploration (Colombia Limited) | 58% | Solana Petroleum Exploration (Colombia Limited) 42% | 28 years | December 31/2017 | Yes | 20% |
| Minor Fields | Maracas | Joint Venture- Sole Risk | E&P | Texican Oil Ltd. | Texican Oil Ltd. | 0% | Texican Oil Ltd. 100% | 28 years | March 5, 2024 | Yes | 20% |
| Region | Contract Name | Type of Agreement | Purpose | Operator | Partners | Ownership Percentage | Partnership Percentage | Term of Contract | Expiration Date | Right of Reversion Upon Termination | Royalty |
| Catatumbo-Orinoquía | Chipiron | Joint Venture | E&P | Occidental de Colombia Inc. | Occidental de Colombia Inc. and Occidental Andina | 30% JIBA UNIFICADO : 34.14 + 0.1657 * (%PAP de ACN) | Occidental de Colombia 35% Occidental Andina 35% Minus PAP Promedio | 25 years | February 13, 2028 | Yes | Variable from 8% |
| Minor Fields | Nancy-Burdine- Maxine | Discovered Undeveloped Field | CDND/I | Union Temporal II&B | Union Temporal II&B | 41% | Unión Temporal II&B 59% | 10 years | September 2, 2015 | Yes | 20% |
| Minor Fields | Opon | Joint Venture | E&P | Compañía Operadora Petrocolombia SAS | Compañía Operadora Petrocolombia SAS | 50% | Compañía Operadora Petrocolombia SAS 50% | 28 years | July 14, 2015 | Yes | 20% |
| Opon-6 | Joint Venture- Sole Risk | 0% |
| Catatumbo-Orinoquía | Corocora | Joint Venture | E&P | Perenco | Hocol S.A - Perenco | 56% | Hocol S.A 27.91% Perenco 16.09% | Until economic limit | Until economic limit | Yes | 8% and 20% |
| Catatumbo-Orinoquía | Cosecha | Joint Venture | E&P | Occidental de Colombia Inc. | Occidental de Colombia Inc. | 30% | Occidental de Colombia Inc. 70% | 28 years | December 30, 2030 | Yes | Variable from 8% |
| Minor Fields | Pavas- Cachira | Discovered Undeveloped Field | CDND/I | Unión Temporal Ismocol, Joshi - Parko | Unión Temporal Ismocol, Joshi - Parko | 7% | Unión Temporal I.J.P. 93% | 10 years | December 29, 2013 | Yes | 20% |
| Southern | CPR Santana | Risk participation contract | E&P | Gran Tierra Colombia | Gran Tierra Colombia | 65% | Gran Tierra Colombia 35% | 28 years | July 27, 2015 | Yes | 20% |
| Minor Fields | Playon | Discovered Undeveloped Field | CDND/I | Serinpet | Serinpet, DYAS COLOMBIA BV | 53% | Serinpet 9.4% Dyas Colombia BV 37.6% | 10 years | July 12, 2015 | Yes | 8% |
| Catatumbo-Orinoquía | Cravo Norte | Joint Venture | E&P | Occidental de Colombia Inc. | Occidental de Colombia Inc. and Occidental Andina, LLC | 68.94% 55% más % PAP Real promedio año 2010. | Occidental de Colombia 22.5% Occidental Andina 22.5% minus PAP Promedio | Until economic limit | Until economic limit | Yes | 5% - 20% |
| Minor Fields | Puerto Barco | Discovered Undeveloped Field | CDND/I | Avante Ltd. | Vetra Exploracion y Produccion Colombia - Avante Ltd. | 6% | Vetra Exploración y Producción Colombia S.A.S. 47% Avante Ltd. 47% | 10 years | December 29, 2013 | Yes | 20% |
| Minor Fields | Quebrada Roja | Discovered Undeveloped Field | CDND/I | Campos de Producción Consortium | Campos de Producción Consortium | 54% | Campos de Producción Consortium 46% | 10 years | October 15, 2016 | Yes | 8% |
| Minor Fields | Rio de Oro | Discovered Undeveloped Field | CDND/I | Avante Ltd. | Vetra Exploracion y Produccion Colombia - Avante Ltd. | 12% | Vetra Exploración y Producción Colombia S.A.S. 44% Avante Ltd. 44% | 10 years | December 29, 2013 | Yes | 20% |
| Southern | Espinal | Risk participation contract | E&P | Petrobras | Petrobras / Cepsa | 55% | Petrobras Colombia Ltd. 30% Cepcolsa 15% | 28 years | October 19, 2015 | Yes | 20% |
| Minor Fields | La Rompida | Discovered Undeveloped Field | CDND/I | Vetra Exploracion y Produccion Colombia | Vetra Exploración y Producción Colombia | 12% | Vetra Exploración y Producción Colombia S.A.S. 88% | 10 years | December 30, 2013 (amendment Area No.2 until December 30, 2023) | Yes | 6% |
| Catatumbo-Orinoquía | Estero | Joint Venture | E&P | Perenco | Perenco - Hocol and Homcol | 89% | Perenco 4.02% Hocol 5% Homcol 4.32% | Until economic limit | Until economic limit | yes | 20% |
| Minor Fields | San Luis | Joint Venture | E&P | Vetra Exploracion y Produccion Colombia | Vetra Exploración y Producción Colombia | 50% | Vetra Exploración y Producción Colombia S.A.S. 50% | 28 years | May 8, 2014 | Yes | 20% |
| Region | Contract Name | Type of Agreement | Purpose | Operator | Partners | Ownership Percentage | Partnership Percentage | Term of Contract | Expiration Date | Right of Reversion Upon Termination | Royalty |
| Catatumbo-Orinoquía | Garcero | Joint Venture | E&P | Perenco | Perenco - Hocol and Homcol | 76% | Perenco 8.78% Hocol 10.9% Homcol 4.32% | Until economic limit | Until economic limit | Yes | 5%, 8% and 20% |
| Minor Fields | Tambaqui | Joint Venture | E&P | Hupecol | Hupecol | 50% | Hupecol 50% | 28 years | February 28, 2026 | Yes | 20% |
| Joint Venture- Sole Risk | 0% |
| Minor Fields | Tapir | Joint Venture- Sole Risk | E&P | Petrolco S.A. | Petrolco S.A. and Doreal Energy | 0% | Petrolco S.A. and Doreal Energy 100% | 28 years | February 5, 2023 | Yes | 20% |
| Northeastern | Guajira | Joint Venture | E&P | Chevron Petroleum Company | Chevron Petroleum Company | 57% | Chevron Petroleum Company 43% | Until economic limit | Until economic limit | Yes | 20% |
| Minor Fields | Toca | Discovered Undeveloped Field | CDND/I | Campos de Producción Consortium | Campos de Producción Consortium | 58% | Campos de Producción Consortium 42% | 10 years | March 12, 2015 | Yes | 8% |
| Minor Fields | Tolima B | Joint Venture | E&P | Vetra Exploracion y Produccion Colombia | Vetra Exploracion y Produccion Colombia | 50% | Vetra Exploración y Producción Colombia 50% | 28 years | June 12, 2014 | Yes | 20% |
| Joint Venture- Sole Risk | 0% |
| Southern | Guayuyaco | Joint Venture | E&P | Gran Tierra Colombia | Gran Tierra Colombia | 30% | Gran Tierra Colombia 70% | 27.5 years (oil). 39.5 years (gas). | March 31, 2030 (oil), March 31, 2042 (gas) | Yes | 8% to 25% |
| Minor Fields | Colorado | Services and Technical Cooperation | Production | Universidad Industrial de Santander | Universidad Industrial de Santander | 100% | Universidad Industrial de Santander 0% | 10 Years | June 30, 2016 | Yes | 20% |
| Minor Fields | El Piñal | Joint Venture- Sole Risk | E&P | Petrosantander | Petrosantander | 0% | Petrosantander Colombia Inc. 100% | 28 years | July 28, 2018 | Yes | 20% |
| Southern | Hobo | Joint Venture | E&P | Petrobras | Petrobras | 50% | Petrobras International Braspetro BV 50% | 28 years | December 31, 2011 | Yes | 20% |
| Minor Fields | Fortuna | Joint Venture- Sole Risk | E&P | Emerald Energy PLC Sucursal Colombia | Emerald Energy PLC Sucursal Colombia | 5% | Emerald Energy PLC Sucursal Colombia 95% | 28 years | December 18, 2031 | Yes | 6% to 20% |
| Mid – Magdalena Valley | La Cira | Business Cooperation | E&P | Ecopetrol S.A. | Occidental de Colombia and Ecopetrol S.A. | 52% Actualmente 63% por Precios altos | Occidental Andina 48% Actualmente 37% por precios altos | Until economic limit | Until economic limit | Yes | 8% to 20% |
| Minor Fields | Buganviles | Joint Venture- Sole Risk | E&P | Pacific Stratus Energy | Pacific Stratus Energy | 0% | Pacific Stratus Energy 100% | 28 años | November 17, 2028 | Yes | 8% to 25% |
| Minor Fields | Mugrosa | Discovered Undeveloped Field | CDND/I | Cosacol S.A. | Cosacol S.A. | 75% | Cosacol S.A. 25% | 10 years | July 12, 2015 | Yes | 8% |
| Minor Fields | Valdivia - Almagro | SPBR | SPBR | Vetra Exploración y Producción Colombia | N/A | 100% | Vetra Exploración y Producción Colombia S.A.S. 0% | Until economic limit | Until economic limit | Yes | 20% |
| Southern | Mana | Joint Venture | E&P | Interoil | Interoil | 30% | Interoil Colombia E&P 70% | 25 years | November 11, 2028 (oil), November 11, 2040 (gas) | Yes | 8% to 25% |
| Minor Fields | Hato Nuevo | Discovered Undeveloped Field | CDND/I | EMPESA - NTC Consortium | EMPESA -NTC Consortium | 41% | EMPESA -NTC Consortium 59% | 10 years | May 17, 2017 | Yes | 5% |
| Southern | Matambo | Joint Venture | E&P | Emerald Energy PLC Sucursal Colombia | Emerald Energy PLC Sucursal Colombia | 50% | Emerald Energy PLC Sucursal Colombia 50% | 28 years | November 29, 2024 | Yes | 20% |
| Catatumbo-Orinoquía | Ranchohermoso | SPBR | SPBR | CANACOL | N/A | 100% | N/A | Until economic limit | Until economic limit | Yes | 20% |
| Catatumbo-Orinoquía | Ranchohermoso | Operation Agreement | Operation Agreement | CANACOL | CANACOL | 70% más % PA por clausula de precios altos | CANACOL 30% | Until economic limit | Until economic limit | Yes | 8% |
| Region | Contract Name | Type of Agreement | Purpose | Operator | Partners | Ownership Percentage | Partnership Percentage | Term of Contract | Expiration Date | Right of Reversion Upon Termination | Royalty |
| Mid – Magdalena Valley | Nare | Joint Venture | E&P | Mansarovar Energy Colombia Ltd. | Mansarovar Energy Colombia Ltd. | 50% (Pozo Jazmin R05 en solo riesgo 100% a cargo de la Asociada | Mansarovar Energy Colombia 50% | 28 years | November 5, 2021 | Yes | 20% - 6% |
| Southern | Neiva | Incremental Production | E&P | Ecopetrol S.A. | Petrominerales | 31% | Petrominerales 69% | 22 years | June 5, 2023 | Yes | 8% to 25% |
| Southern | Orito | Incremental Production | E&P | Ecopetrol S.A. | Petrominerales | 21% | Petrominerales 79% | 22 years | June 5, 2023 | Yes | 8% to 25% |
| Catatumbo-Orinoquía | Orocue | Joint Venture | E&P | Perenco | Perenco and Hocol | 63% | Perenco 13.53% Hocol 23.7% | Until economic limit | Until economic limit | Yes | 20% |
| Southern | Ortega | Incremental Production | E&P | Ecopetrol S.A. | Hocol S.A. | 31% | Hocol S.A. 69% (Producción Incremental) | 22 years | February 28, 2023 | Yes | 8% incremental, 20% base |
| Mid – Magdalena Valley | Palagua | Incremental Production | E&P | Union Temporal IJP | Union Temporal Ismocol, Joshi- Parko | 34% | Unión Temporal I.J.P. 66% | 22 years | July 14, 2023 | Yes | 20% |
| Southern | Palermo | Joint Venture | E&P | Hocol S.A. | Hocol S.A. | 50% | Hocol S.A. 50% | 28 years | April 30, 2012 | Yes | 20% |
| Northeastern | Piedemonte | Joint Venture | E&P | BP | BP | 50% | Equion 50% | 28 years | February 29, 2020 | Yes | 20% |
| Central | Piriri | Joint Venture | E&P | Metapetroleum | Metapetroleum Corp. And Tethys Petroleum Company Limited | 50% | Metapetroleum Corp. Tethys Petroleum Company Limited 50% | 28 years | June 30, 2016 | Yes | 20% |
| Southern | Puli | Joint Venture | E&P | Interoil | Interoil | 50% | Interoil Colombia E&P 50% | 28 years | February 29, 2012 | Yes | 20% |
| Northeastern | Recetor | Joint Venture | E&P | BP | BP Explotarion Co (Colombia) Ltd. - BP Santiago | 50% | Equion 40% Santiago Oil Company 10% | 28 years | May 29, 2017 | Yes | 20% |
| Northeastern | Rio Chitamena | Joint Venture | E&P | BP | BP Explotarion Co (Colombia) Ltd. - BP Santiago - Total | 50% | Equion 19% Santiago Oil 12% Total 19% | 28 years | January 31, 2019 | Yes | 20% |
| Southern | Rio Opia | Joint Venture | E&P | Interoil | Interoil | 30% | Interoil Colombia E&P 70% | 28 years | June 23, 2030 | Yes | 8% to 25% |
| Catatumbo-Orinoquía | Rondon | Joint Venture | E&P | Occidental de Colombia Inc. | Occidental de Colombia Inc. and Occidental Andina, LLC | 50% | Occidental de Colombia 25% Occidental Andina 25% | 28 years | January 8, 2023 | Yes | Variable desde el 8% |
| Central | Rubiales | Risk participation contract | E&P | Metapetroleum | Metapetroleum Corp. And Tethys Petroleum Company Limited | 60% | Metapetroleum Corp. Tethys Petroleum Company Limited 40% | 28 years | June 30, 2016 | Yes | 20% |
| Southern | San Jacinto (La Cañada Norte) | Joint Venture | E&P | Hocol S.A. | Hocol S.A. Petrobras Cepsa | 50% | Hocol S.A. 18.335% Petrobras 15% Cepsa 16.665% | 28 years | December 22, 2024 | Yes | 8% La Cañada Norte |
| Southern | Suroriente | Incremental Production | E&P | Vetra Colombia Exploración y Producción | Consorcio Colombia Energy (Vetra Colombia Exploración y Producción y Suroco) | 48% | Vetra Exploración y Producción Colombia S.A.S. 52% | 22 years | June 11, 2024 | Yes | 8% to 25% |
| Region | Contract Name | Type of Agreement | Purpose | Operator | Partners | Ownership Percentage | Partnership Percentage | Term of Contract | Expiration Date | Right of Reversion Upon Termination | Royalty |
| Northeastern | Tauramena | Joint Venture | E&P | BP | BP Explotarion Co (Colombia) Ltd. - BP Santiago - Total | 50% | Equion 19% Santiago Oil 12% Total 19% | 28 years | July 3, 2016 | Yes | 20% |
| Mid – Magdalena Valley | Tisquirama | Joint Venture | E&P | Petroleos del Norte S.A. | Petroleos del Norte S.A – Petrosantander | 60% | Petrosantander Colombia Inc. 40% | Until economic limit | Until economic limit | Yes | 20% |
| Central | Upia B | Joint Venture | E&P | Petrobras | PETROBRAS | 50% | Petrobras 50% | 28 years | February 29, 2012 | Yes | 20% |
| Southern | Doima | Joint Venture | E&P | Hocol S.A. | Hocol S.A | 39% | Hocol S.A. 61% | 28 years (oil), 40 years (gas) | February 16, 2029 February 16, 2041 | Yes | 6.4% Gas |
| Mid – Magdalena Valley | CRC-2004-01 (Guariquies) | Risk participation contract exploration and productions (CRC) | E&P | Ecopetrol S.A. | Ramshorn | 55% and R Factor | Ramshorn 45% | 25 years | May 24, 2029 | Yes | 8% to 20% |
| Minor Fields | Cicuco- Boquete | Overriding | E&P | Consorcio Mompox | Consorcio Mompox | 21% Oil - 10% Gas | Consorcio Mompox Oil 79% - Gas – 90% | Until economic limit | Until economic limit | Yes | 8% |
| Southern | Río Paez (La Hocha) | Joint Venture - Sole risk | E&P | Hocol S.A. | Hocol S.A. | 50% (Campo La Hocha en solo riesgo 100% a cargo de la Asociada) | Hocol S.A. 18.335% Petrobras 15% Cepsa 16.665% | 25 years | April 27,2026 | Yes | 5% La Hocha |
| Minor Fields | Río Seco | Joint Venture - Sole Risk | E&P | Pacific Stratus Energy | Pacific Stratus Energy | 0% | Pacific Stratus Energy 100% | 28 years | August 22, 2023 | Yes | 20% |
| Mid – Magdalena Valley | Alianza Tecnológica Casabe | Technological Alliance agreement | E&P | Ecopetrol S.A. | Schlumberger | 100% | Schlumberger 0% | 16 years | April 26, 2020 | Yes | 8% to 20% |
Ecopetrol S.A. and Subsidiaries
Consolidated Financial Statements
Years ended December 31, 2010, 2009 and 2008
Ecopetrol S.A. and Subsidiaries
Consolidated Financial Statements
Years ended December 31, 2010, 2009 and 2008
Contents
| Report of Independent Registered Public Accounting Firm | F-3 |
| | |
| Consolidated Balance Sheets | F-5 |
| | |
| Consolidated Statements of Financial, Economic, Social and Environmental Activities | F-6 |
| | |
| Consolidated Statements of Changes in Shareholders’ Equity | F-7 |
| | |
| Consolidated Statements of Cash Flows | F-8 |
| | |
| Notes to Consolidated Financial Statements | F-10 |

Report of Independent Registered Public Accounting Firm
To the Board of Directors
and Shareholders of Ecopetrol S. A.
In our opinion, the accompanying consolidated balance sheets and the related consolidated statements of financial, economic, social and environmental activities, of changes in shareholders´s equity and of cash flows present fairly, in all material respects, the financial position of Ecopetrol S. A. and its subsidiaries (the “Company”) at December 31, 2010 and 2009, and the results of their operations and their cash flows for each of the three years in the period ended December 31, 2010 in conformity with generally accepted accounting principles for Colombian Government Entities issued by the Contaduría General de la Nación. Also in our opinion, the Company maintained, in all material respects, effective internal control over financial reporting as of December 31, 2010, based on criteria established in Internal Control - Integrated Framework issued by the Committee of Sponsoring Organizations of the Treadway Commission (COSO). The Company's management is responsible for these financial statements, for maintaining effective internal control over financial reporting and for its assessment of the effectiveness of internal control over financial reporting, included in Management´s Report on Internal Control over Financial Reporting. Our responsibility is to express opinions on these financial statements and on the Company's internal control over financial reporting based on our integrated audits. We conducted our audits in accordance with generally accepted auditing standards in Colombia and the standards of the Public Company Accounting Oversight Board (United States). Those standards require that we plan and perform the audits to obtain reasonable assurance about whether the financial statements are free of material misstatement and whether effective internal control over financial reporting was maintained in all material respects. Our audits of the financial statements included examining, on a test basis, evidence supporting the amounts and disclosures in the financial statements, assessing the accounting principles used and significant estimates made by management, and evaluating the overall financial statement presentation. Our audit of internal control over financial reporting included obtaining an understanding of internal control over financial reporting, assessing the risk that a material weakness exists, and testing and evaluating the design and operating effectiveness of internal control based on the assessed risk. Our audits also included performing such other procedures as we considered necessary in the circumstances. We believe that our audits provide a reasonable basis for our opinions.
Accounting principles generally accepted for Colombian Government Entities vary in certain significant respects from accounting principles generally accepted in the United States of America. Information relating to the nature and effects of such differences is presented in Note 32 to the consolidated financial statements.
As discussed in Note 32, the Company has restated its 2009 consolidated financial statements reconciled to accounting principles generally accepted in the United States of America to correct some errors.
PricewaterhouseCoopers Ltda., Calle 100 No. 11A-35, Bogotá, Colombia
Tel: (57-1) 634 0555, Fax: (57-1) 218 8544, www.pwc.com/co
To the Board of Directors
and Shareholders of Ecopetrol S. A.
A company’s internal control over financial reporting is a process designed to provide reasonable assurance regarding the reliability of financial reporting and the preparation of financial statements for external purposes in accordance with generally accepted accounting principles. A company’s internal control over financial reporting includes those policies and procedures that (i) pertain to the maintenance of records that, in reasonable detail, accurately and fairly reflect the transactions and dispositions of the assets of the company; (ii) provide reasonable assurance that transactions are recorded as necessary to permit preparation of financial statements in accordance with generally accepted accounting principles, and that receipts and expenditures of the company are being made only in accordance with authorizations of management and directors of the company; and (iii) provide reasonable assurance regarding prevention or timely detection of unauthorized acquisition, use, or disposition of the company’s assets that could have a material effect on the financial statements.
Because of its inherent limitations, internal control over financial reporting may not prevent or detect misstatements. Also, projections of any evaluation of effectiveness to future periods are subject to the risk that controls may become inadequate because of changes in conditions, or that the degree of compliance with the policies or procedures may deteriorate.
/s/ PricewaterhouseCoopers Ltda.
Bogotá, Colombia
July 15, 2011
Ecopetrol S.A. and Subsidiaries
Consolidated Balance Sheets
| | | December 31, | |
| | | 2010 | | | 2009 | |
| | | (In millions of Colombian pesos) | |
| Assets | | | | | | |
| Current Assets | | | | | | |
Cash and cash equivalents (Notes 2 and 3) | | $ | 3,726,778 | | | $ | 3,562,119 | |
Investments (Notes 2 and 4) | | | 327,782 | | | | 462,258 | |
Accounts and notes receivable, net (Notes 2 and 5) | | | 2,736,592 | | | | 2,969,120 | |
Inventories, net (Note 6) | | | 2,192,088 | | | | 2,042,697 | |
Advances and deposits (Notes 2 and 7) | | | 3,620,317 | | | | 3,018,779 | |
| Deferred tax assets | | | 4,134 | | | | - | |
Prepaid expenses (Note 8) | | | 21,947 | | | | 62,815 | |
| Total current assets | | | 12,629,638 | | | | 12,117,788 | |
| Non-current assets | | | | | | | | |
Investments (Notes 2 and 4) | | | 5,177,491 | | | | 3,710,739 | |
Accounts and notes receivable, net (Note 5) | | | 372,273 | | | | 226,781 | |
Advances and deposits (Note 7) | | | 288,735 | | | | 253,681 | |
Property, plant and equipment, net (Note 9) | | | 22,266,258 | | | | 16,782,503 | |
| Natural and environmental resources, net (Note 10) | | | 11,774,539 | | | | 11,155,381 | |
Deferred charges (Note 11) | | | 2,040,140 | | | | 1,886,529 | |
Other assets (Note 12) | | | 3,151,606 | | | | 3,034,698 | |
Revaluations (Note 4 and 9) | | | 11,068,676 | | | | 6,391,417 | |
| Total assets | | $ | 68,769,356 | | | $ | 55,559,517 | |
| | | | | | | | | |
| Liabilities and Shareholders’ Equity | | | | | | | | |
| Current liabilities | | | | | | | | |
Financial obligations (Note 2 and 13) | | $ | 1,079,169 | | | $ | 437,081 | |
Accounts payable (Notes 2 and 14) | | | 4,062,602 | | | | 3,280,232 | |
Taxes payable (Note 15) | | | 3,589,263 | | | | 2,433,022 | |
Labor and pension plan obligations (Note 16) | | | 160,247 | | | | 165,463 | |
Estimated liabilities and provisions (Notes 2 and 16) | | | 1,151,297 | | | | 1,154,415 | |
| Total current liabilities | | | 10,042,578 | | | | 7,470,213 | |
| Long-term liabilities | | | | | | | | |
Financial obligations (Notes 2 and 13) | | | 7,833,715 | | | | 5,714,354 | |
Accounts payable (Note 14) | | | 504,046 | | | | 51,154 | |
Labor and pension plan obligations (Note 16) | | | 2,814,021 | | | | 2,669,331 | |
Estimated liabilities and provisions (Notes 2 and 17) | | | 3,398,603 | | | | 3,411,977 | |
Other long-term liabilities (Notes 2 and 18) | | | 2,362,261 | | | | 2,731,220 | |
| Total liabilities | | | 26,955,224 | | | | 22,048,249 | |
| | | | | | | | | |
Non-controlling interest (Note 19) | | | 485,951 | | | | 941,311 | |
Shareholders’ equity (Note 20 and see accompanying statement) | | | 41,328,181 | | | | 32,569,957 | |
| Total liabilities and shareholders’ equity | | $ | 68,769,356 | | | $ | 55,559,517 | |
| | | | | | | | | |
Memorandum accounts (Note 21) | | $ | 216,020,618 | | | $ | 138,884,829 | |
The accompanying notes are an integral part of these financial statements.
Ecopetrol S.A. and Subsidiaries
Consolidated Statements of Financial, Economic, Social and Environmental Activities
| | | Years ended December 31, | |
| | | 2010 | | | 2009 | | | 2008 | |
| | | (In millions of Colombian pesos, except for net income per share expressed in pesos) | |
| | | | | | | | | | |
Revenue (Note 22) | | | | | | | | | |
| Local Sales | | $ | 18,084,425 | | | $ | 14,058,534 | | | $ | 21,597,999 | |
| Foreign Sales | | | 23,883,886 | | | | 16,345,856 | | | | 12,298,670 | |
| Total Revenues | | | 41,968,311 | | | | 30,404,390 | | | | 33,896,669 | |
| | | | | | | | | | | | | |
Cost of Sales (Note 23) | | | 25,959,001 | | | | 19,906,073 | | | | 19,084,436 | |
| | | | 16,009,310 | | | | 10,498,317 | | | | 14,812,233 | |
Operating Expenses (Note 24) | | | | | | | | | | | | |
| Administration | | | 603,523 | | | | 662,336 | | | | 382,101 | |
| Selling and projects | | | 2,526,945 | | | | 1,962,642 | | | | 1,772,774 | |
| Operating Income | | | 12,878,842 | | | | 7,873,339 | | | | 12,657,358 | |
| | | | | | | | | | | | | |
| Non-Operating Income (Expenses): | | | | | | | | | | | | |
Financial income, net (Note 25) | | | 37,789 | | | | 495,833 | | | | 4,101,252 | |
Pension expenses (Notes 16 and 26) | | | (377,626 | ) | | | (595,157 | ) | | | (1,144,925 | ) |
Inflation gain (Note 27) | | | 22,030 | | | | 22,355 | | | | 30,473 | |
Other expenses, net (Note 28) | | | (1,068,418 | ) | | | (545,526 | ) | | | 367,046 | |
| Income before income tax | | | 11,492,617 | | | | 7,250,844 | | | | 16,011,204 | |
Income tax (Note 15) | | | | | | | | | | | | |
| Current | | | 3,201,041 | | | | 1,948,819 | | | | 3,611,020 | |
| Deferred tax | | | 37,609 | | | | 165,210 | | | | 770,962 | |
| | | | 3,238,650 | | | | 2,114,029 | | | | 4,381,982 | |
| Non-controlling interest | | | (107,496 | ) | | | (4,761 | ) | | | 455 | |
| Net income | | $ | 8,146,471 | | | $ | 5,132,054 | | | $ | 11,629,677 | |
| Net income per share | | $ | 201.28 | | | $ | 126.80 | | | $ | 287.35 | |
The accompanying notes are an integral part of these financial statements.
Ecopetrol S.A. and Subsidiaries
Consolidated Statements of Changes in Shareholders’ Equity
(In millions of Colombian pesos, except for the dividend per share)
For de years ended on December 31, 2010, 2009 and 2008
| | | Subscribed and paid-in capital | | | Additional paid-in capital | | | Legal and other reserves | | | Incorporated Institutional equity and other | | | Surplus from equity method | | | Surplus from revaluations | | | Public Accounting Application Effect | | | Retained earnings | | | Total Equity | |
| Balance as of December 31, 2008 | | $ | 10,117,791 | | | $ | 4,679,276 | | | $ | 2,432,740 | | | $ | 112,179 | | | $ | 1,481,103 | | | $ | 5,179,961 | | | $ | (1,013,010 | ) | | $ | 11,629,677 | | | $ | 34,619,717 | |
| Distribution of dividends ($220 per share) | | | - | | | | - | | | | - | | | | - | | | | - | | | | - | | | | - | | | | (8,903,953 | ) | | | (8,903,953 | ) |
| Unpaid subscribed capital and additional paid-in capital | | | - | | | | 24,324 | | | | - | | | | - | | | | - | | | | - | | | | - | | | | - | | | | 24,324 | |
| Addition to paid-in capital – Execution of warranties | | | - | | | | 16,720 | | | | - | | | | - | | | | - | | | | - | | | | - | | | | - | | | | 16,720 | |
| Surplus from revaluations | | | - | | | | - | | | | - | | | | - | | | | - | | | | 1,211,456 | | | | - | | | | - | | | | 1,211,456 | |
| Devaluation in property, plant and equipment | | | - | | | | - | | | | - | | | | - | | | | - | | | | - | | | | 714,205 | | | | - | | | | 714,205 | |
| Adjustment in translation of foreign subsidiaries | | | - | | | | - | | | | - | | | | - | | | | (288,956 | ) | | | - | | | | - | | | | - | | | | (288,956 | ) |
| Appropriation to legal reserve | | | - | | | | - | | | | 1,163,072 | | | | - | | | | - | | | | - | | | | - | | | | (1,163,072 | ) | | | - | |
| Appropriation to investment programs reserves | | | - | | | | - | | | | 1,563,692 | | | | - | | | | - | | | | - | | | | - | | | | (1,563,692 | ) | | | - | |
| Addition to incorporated institutional equity | | | - | | | | - | | | | - | | | | 43,350 | | | | - | | | | - | | | | - | | | | - | | | | 43,350 | |
| Unrealized income | | | - | | | | - | | | | - | | | | - | | | | - | | | | - | | | | - | | | | 1,040 | | | | 1,040 | |
| Net income | | | - | | | | - | | | | - | | | | - | | | | - | | | | - | | | | - | | | | 5,132,054 | | | | 5,132,054 | |
| Balance as of December 31, 2009 | | | 10,117,791 | | | | 4,720,320 | | | | 5,159,504 | | | | 155,529 | | | | 1,192,147 | | | | 6,391,417 | | | | (298,805 | ) | | | 5,132,054 | | | | 32,569,957 | |
| Distribution of dividends ($91 per share) | | | - | | | | - | | | | - | | | | - | | | | - | | | | - | | | | - | | | | (3,682,998 | ) | | | (3,682,998 | ) |
| Unpaid subscribed capital and additional paid-in capital | | | 337 | | | | 243 | | | | - | | | | - | | | | - | | | | - | | | | - | | | | - | | | | 580 | |
| Additional receivable paid-in capital | | | - | | | | (55 | ) | | | - | | | | - | | | | - | | | | - | | | | - | | | | - | | | | (55 | ) |
| Surplus from revaluations | | | - | | | | - | | | | - | | | | - | | | | - | | | | 4,677,259 | | | | - | | | | - | | | | 4,677,259 | |
| Devaluation in property, plant and equipment | | | - | | | | - | | | | - | | | | - | | | | - | | | | - | | | | (403,670 | ) | | | - | | | | (403,670 | ) |
| Appropriation to legal reserve | | | - | | | | - | | | | 525,624 | | | | - | | | | - | | | | - | | | | - | | | | (525,624 | ) | | | - | |
| Appropriation to investment programs reserves | | | - | | | | - | | | | 1,047,610 | | | | - | | | | - | | | | - | | | | - | | | | (1,047,610 | ) | | | - | |
| Addition to incorporated institutional equity | | | - | | | | - | | | | - | | | | 1,823 | | | | - | | | | - | | | | - | | | | - | | | | 1,823 | |
| Adjustment for effect of difference in change in surplus equity method | | | - | | | | - | | | | - | | | | - | | | | (105,364 | ) | | | - | | | | - | | | | - | | | | (105,364 | ) |
| Unrealized income | | | - | | | | - | | | | - | | | | - | | | | - | | | | - | | | | - | | | | 124,178 | | | | 124,178 | |
| Net income | | | - | | | | - | | | | - | | | | - | | | | - | | | | - | | | | - | | | | 8,146,471 | | | | 8,146,471 | |
| Balance as of December 31, 2010 | | $ | 10,118,128 | | | $ | 4,720,508 | | | $ | 6,732,738 | | | $ | 157,352 | | | $ | 1,086,783 | | | $ | 11,068,676 | | | $ | (702,475 | ) | | $ | 8,146,471 | | | $ | 41,328,181 | |
The accompanying notes are an integral part of these financial statements.
Ecopetrol S.A. and Subsidiaries
Consolidated Statements of Cash Flows
| | | Year Ended December 31, | |
| | | 2010 | | | 2009 | | | 2008 | |
| | | (In million of Colombian pesos) | |
| Cash flows from operating activities | | | | | | | | | |
| Net income | | $ | 8,146,471 | | | $ | 5,132,054 | | | $ | 11,629,677 | |
| Adjustments to reconcile net income to cash provided by operating activities | | | | | | | | | | | | |
| Deferred Income tax, net | | | 37,609 | | | | 165,210 | | | | 770,962 | |
| Depreciation of property, plant and equipment | | | 1,624,009 | | | | 1,262,643 | | | | 691,488 | |
| Amortizations: | | | | | | | | | | | | |
| Natural resources | | | 2,003,771 | | | | 1,274,979 | | | | 947,788 | |
| Abandonment of installations | | | 241,842 | | | | 199,939 | | | | 139,795 | |
| Health and education pension liabilities | | | 166,211 | | | | 502,665 | | | | 645,770 | |
| Intangibles | | | 189,261 | | | | 152,235 | | | | 37,496 | |
| Deferred charges | | | 107,422 | | | | 94,288 | | | | 73,343 | |
| Deferred monetary correction, net | | | (22,030 | ) | | | (22,355 | ) | | | (30,473 | ) |
| Provisions: | | | | | | | | | | | | |
| Accounts receivable | | | 169,789 | | | | 30,734 | | | | 2,275 | |
| Inventories | | | 9,743 | | | | 33,161 | | | | 49,380 | |
| Property, plant and equipment | | | 227,266 | | | | 127,826 | | | | - | |
| Legal proceedings | | | 125,888 | | | | 271,091 | | | | 62,380 | |
| Other | | | 19,834 | | | | - | | | | 103,062 | |
| Recovery of provisions: | | | | | | | | | | | | |
| Accounts receivable | | | (68,772 | ) | | | - | | | | - | |
| Inventories | | | (29,481 | ) | | | (118,652 | ) | | | (8,711 | ) |
| Property, plant and equipment | | | (55,717 | ) | | | (17,091 | ) | | | (18,813 | ) |
| Legal Proceedings | | | (80,237 | ) | | | (83,258 | ) | | | (832,788 | ) |
| Other | | | (138,397 | ) | | | (5,564 | ) | | | (139,554 | ) |
| Write-off of property, plant and equipment | | | 3,395 | | | | - | | | | - | |
| Retirement loss of property, plant and equipment | | | 38,945 | | | | - | | | | - | |
| Write-off of natural and environmental resources | | | 39,668 | | | | - | | | | - | |
| Write-off of other assets | | | 287,918 | | | | - | | | | - | |
| Gain in equity method | | | (82,772 | ) | | | (55,143 | ) | | | - | |
| Net changes in operating assets and liabilities: | | | | | | | | | | | | |
| Decrease (increase) Debtors | | | 794,512 | | | | 2,030,376 | | | | 5,946,536 | |
| Decrease (increase) Inventories | | | (129,823 | ) | | | (291,819 | ) | | | (237,710 | ) |
| Decrease (increase) Deferred and other assets | | | 698,423 | | | | (1,408,834 | ) | | | (865,556 | ) |
| (Decrease) increase Accounts payable | | | 1,248,736 | | | | 1,536,580 | | | | 423,182 | |
| (Decrease) increase Taxes payable | | | (618,440 | ) | | | (1,473,446 | ) | | | 988,828 | |
| (Decrease) increase Labor obligations | | | (26,737 | ) | | | 37,684 | | | | (9,246,210 | ) |
| (Decrease) increase Estimated liabilities and provisions | | | (64,028 | ) | | | (24,809 | ) | | | (697,407 | ) |
| (Decrease) increase Other long term liabilities | | | (507,467 | ) | | | - | | | | - | |
| Net cash provided by operating activities | | | 14,356,812 | | | | 9,350,494 | | | | 10,434,740 | |
| Cash flows from investing activities: | | | | | | | | | | | | |
| Payments and advances in acquisition of companies | | | (1,163,131 | ) | | | - | | | | - | |
| Payments in acquisition of companies, net of cash acquired | | | - | | | | (1,082,580 | ) | | | (1,275,049 | ) |
| Purchase of investments | | | (11,808,784 | ) | | | (7,939,870 | ) | | | (27,801,568 | ) |
| Investments redemption and sale | | | 10,578,200 | | | | 15,972,339 | | | | 27,054,516 | |
| Proceeds from sales of property and equipment | | | 4,751 | | | | 1,927 | | | | - | |
| Investments in natural and environmental resources | | | (3,874,824 | ) | | | (3,613,355 | ) | | | (1,844,917 | ) |
| Additions to properties, plant and equipment | | | (6,445,151 | ) | | | (9,239,234 | ) | | | (4,861,067 | ) |
| Net cash used in investment activities | | | (12,708,939 | ) | | | (5,900,775 | ) | | | (8,728,085 | ) |
| | | | | | | | | | | | | |
| Cash flows from financing activities | | | | | | | | | | | | |
| Non-controlling interest | | | (455,360 | ) | | | 698,360 | | | | 242,950 | |
| Financial obligations | | | 2,761,449 | | | | 6,161,793 | | | | 235,720 | |
| Received from associates - Capitalizations | | | 525 | | | | 41,044 | | | | 832,919 | |
| Payment of dividends | | | (3,789,828 | ) | | | (8,902,602 | ) | | | (4,654,340 | ) |
| Net cash used in financing activities | | | (1,483,214 | ) | | | (2,001,405 | ) | | | (3,342,751 | ) |
| | | | | | | | | | | | | |
| Net increase in cash and cash equivalents | | | 164,659 | | | | 1,448,316 | | | | (1,636,096 | ) |
| Cash and cash equivalents at beginning of year | | | 3,562,119 | | | | 2,113,803 | | | | 3,749,899 | |
| Cash and cash equivalents at end of year | | $ | 3,726,778 | | | $ | 3,562,119 | | | $ | 2,113,803 | |
The accompanying notes are an integral part of these financial statements.
Ecopetrol S.A. and Subsidiaries
Notes to the Consolidated Financial Statements
Years ended December 31, 2010, 2009 and 2008
| | | | | | | | | | |
| Attachment 1 – Cash and cash equivalents detail | | | | | | | | | |
| Cash | | $ | 470 | | | $ | 82 | | | $ | 408 | |
| Banks and savings entities | | | 2,124,461 | | | | 1,508,846 | | | | 1,395,199 | |
| Special and in-transit funds | | | 555,716 | | | | 1,690,815 | | | | 703,577 | |
| Temporary investments | | | 1,046,131 | | | | 362,376 | | | | 14,619 | |
| Total cash and cash equivalents | | $ | 3,726,778 | | | $ | 3,562,119 | | | $ | 2,113,803 | |
Ecopetrol S.A. and Subsidiaries
Notes to the Consolidated Financial Statements
Years ended December 31, 2010, 2009 and 2008
(Amounts are expressed in millions of Colombian pesos, except amounts stated in other
currencies, exchange rates and income per share, which are expressed in Colombian pesos – throughout these
financial statements pesos or Ps refer to Colombian pesos and U.S. Dollar refers to United States dollars)
| 1. | Economic Entity and Principal Accounting Policies and Practices |
Reporting Entity
ECOPETROL S.A. and subsidiaries (hereinafter Ecopetrol or the Company) was organized by Law 165 of 1948 and transformed through Extraordinary Decree 1760 of 2003 (added by Decree 409 of 2006) and Law 1118 of 2006 into a state-owned company by shares and then into a mixed economy entity of a commercial character, at national level, related to the Ministry of Mines and Energy, for an indefinite period. Ecopetrol’s corporate purpose is the development, in Colombia or abroad, of commercial or industrial activities corresponding to or related with exploration, production, refining, transportation, storage, distribution, and selling of hydrocarbons, their by-products and associated products, and of subsidiary operations, connected or complementary to these activities in accordance with applicable regulations. Ecopetrol’s principal domicile is Bogotá, D.C. and it may establish subsidiaries, branches and agencies in Colombia or abroad.
By means of the Transformation Decree 1760 of June 27, 2003, the integral administration of the hydrocarbon reserves owned by the Colombian Nation (the Nation), and the administration of non-strategic assets, represented by shares and the participation in companies were separated from Ecopetrol. In addition, Ecopetrol’s basic structure was changed and two entities were created: a) the Agencia Nacional de Hidrocarburos (ANH) was created to hereinafter issue and develop the Colombian petroleum policy (formerly the responsibility of Ecopetrol), and b) Sociedad Promotora de Energía de Colombia S.A., which received the non-strategic assets owned by Ecopetrol.
Law 1118 of December 27, 2006 changed the legal nature of Ecopetrol S.A., and authorized the Company to issue shares to be placed in the equity market and acquired by Colombian individuals or legal entities. Once the shares were issued and placed, corresponding to 10.1% of the authorized capital, at the end of 2007, the Company became a Mixed Economy Entity of a commercial nature, at a national level, controlled by the Ministry of Mines and Energy.
Ecopetrol entered into a deposit agreement with JP Morgan Chase Bank, N.A., as depositary, for the issuance of ADRs evidencing ADSs. Each of the ADSs represents 20 common shares.
On September 12, 2008, Ecopetrol submitted to the Securities and Exchange Commission of the United States (SEC) an application to register and list the Company’s ADSs evidenced by ADRs on the New York Stock Exchange (NYSE). The Company’s ADSs began trading on the NYSE under the symbol “EC” on September 18, 2008.
On December 3, 2009, the National Commission for the Surveillance of Companies and Securities of Peru – CONASEV approved the listing of Ecopetrol’s ADSs on the Lima Stock Exchange and registration of such securities with the Public Registry of the Securities Market. The ADSs began trading on the Lima Stock Exchange on December 4, 2009 in the Peruvian market under the “EC” symbol.
On August 13, 2010, Ecopetrol began trading its Company’s ADSs in the Toronto Stock Exchange - Canada. Ecopetrol became the first Colombian company to list in the Toronto Stock Exchange.
On February 13, 2008, Ecopetrol S. A., as parent company, announced the registration of documentation evidencing the existence of a Corporate Group (Grupo Empresarial, the term which under Colombian law describes when a company acquires subsidiaries) considering its controlling acquisition of the following subsidiaries: Black Gold Re Limited, Ecopetrol Oleo é Gas do Brazil Ltda., Ecopetrol del Perú S.A. and Ecopetrol America Inc. Subsequently, Andean Chemicals Ltd., parent company of Bioenergy and investor in Propilco S. A., which in turn is the parent company of Compounding and Masterbatching Industry Ltda. (“Comai”), was incorporated into the Corporate Group.
Ecopetrol S.A. and Subsidiaries
Notes to the Consolidated Financial Statements
Years ended December 31, 2010, 2009 and 2008
Likewise, in 2009 the companies ODL Finance, parent Company of ODL; Hocol Petroleum Limited, parent company of Homcol Cayman Inc. and Hocol Limited, which branch in Colombia is Hocol S.A.; Ecopetrol Transportation Company, parent company of Ecopetrol Pipelines International Ltd.; Ecopetrol Global Energy, and Refinería de Cartagena S.A., were all incorporated into the Corporate Group.
On September 20, 2010, Ecopetrol S.A. incorporated its subsidiary company Oleoducto Bicentenario de Colombia S.A.S into the Corporate Group.
By the end of 2010, the subsidiaries Ecopetrol Transportation Investment Ltd. and Ecopetrol Capital AG were established for the purpose of improving the use of the financial resources of the Corporate Group.
The companies consolidated by Ecopetrol in its financial statements as of December 31, 2010, 2009 and 2008 are:
| | Percentage of Ownership % | | Activity | | Subsidiaries |
| 2010 | | 2009 | | 2008 | | | | |
| Ecopetrol Oleo é Gas do Brasil Ltda. | 100 | | 100 | | 100 | | Hydrocarbon exploration and exploitation. | | - |
| Ecopetrol del Perú S. A. | 100 | | 100 | | 100 | | | | - |
| Ecopetrol America Inc. | 100 | | 100 | | 100 | | | | - |
| Black Gold Re Ltd. | 100 | | 100 | | 100 | | Reinsurance Company of Ecopetrol and its subsidiaries. | | - |
| Andean Chemicals Ltd. | 100 | | 100 | | 100 | | Investment vehicle. | | Bioenergy S. A., Refinería de Cartagena and Propileno del Caribe |
| ODL Finance S. A. | 65 | | 65 | | 65 | | Crude oil Transportation through pipelines. | | ODL S. A. ODL - Colombian Branch Office |
| Propileno del Caribe. Propilco S. A. | 100 | | 100 | | 100 | | Production and selling of polypropylene resin. | | Comai S. A. |
| Bioenergy S. A. | 88.6 | | 80 | | 79.14 | | Bio-fuel production. | | - |
| Ecopetrol Global Energy | 100 | | 100 | | - | | Investment vehicle. | | Ecopetrol America Inc. |
| Ecopetrol Transportation Company Limited | 100 | | 100 | | - | | Investment vehicle. | | Ecopetrol Pipelines International Limited, Ecopetrol Transportation Investment Ltd |
| Ecopetrol Pipelines International Limited | 100 | | 100 | | - | | Investment vehicle. | | Ecopetrol Transportation Investment |
| Oleoducto Central S. A. - Ocensa | 60 | | 60 | | 35.29 | | Crude oil transportation through pipelines. | | - |
COMAI - Compounding and Masterbatching Industry Ltda. | 100 | | 100 | | 100 | | Manufacture of polypropylene compounds and master batches. | | - |
| Refineria de Cartagena S. A. | 100 | | 100 | | 49 | | Hydrocarbon refining, selling and distribution. | | - |
| Hocol Petroleum Limited | 100 | | 100 | | - | | Investment vehicle. | | Hocol Limited, Hocol S. A., Homcol Cayman Inc. |
| Oleoducto de Colombia S. A. – ODC | 66 | | 66 | | 43.85 | | Crude oil transportation through pipelines. | | |
| Oleoducto Bicentenario de Colombia SAS | 55.97 | | - | | - | | Crude oil transportation through pipelines. | | - |
| Ecopetrol Transportation Investment Ltd. | 100 | | - | | - | | Investment vehicle. | | - |
| Ecopetrol Capital AG | 100 | | - | | - | | Financing, liquidation of financing of group companies or any other type of company and all activities related thereto. | | - |
Ecopetrol and certain of its subsidiaries develop exploration and production (“E&P”) operations through E&P, Technical Evaluation Agreements (“TEA”) and Agreements entered into with the ANH, and through Association Contracts of diverse contractual terms, with the following characteristics at December 31, 2010 closing:
Ecopetrol S.A. and Subsidiaries
Notes to the Consolidated Financial Statements
Years ended December 31, 2010, 2009 and 2008
| | | Number of Contracts | |
| Contract Type | | Ecopetrol S. A. | | | Hocol Petroleum Ltd. | | | Ecopetrol Oleo é Gas do Brasil Ltda. | | | Ecopetrol America Inc. | | | Ecopetrol del Perú S. A. | |
| Exploration | | | | | | | | | | | | | | | |
| E&P Contracts –ANH | | | 27 | | | | 9 | | | | - | | | | - | | | | - | |
| E&P Agreements-ANH | | | 6 | | | | - | | | | - | | | | - | | | | - | |
| TEA’s – ANH | | | 3 | | | | - | | | | - | | | | - | | | | - | |
| Association Contracts | | | 7 | | | | 4 | | | | 10 | | | | 44 | | | | 5 | |
| Production | | | | | | | | | | | | | | | | | | | | |
| Association | | | 58 | | | | 8 | | | | - | | | | 1 | | | | - | |
| Discovered undeveloped and inactive fields | | | 18 | | | | - | | | | - | | | | - | | | | - | |
| Sole risk | | | - | | | | 2 | | | | - | | | | - | | | | - | |
| Incremental production | | | 6 | | | | 2 | | | | - | | | | - | | | | - | |
| Risk participation | | | 3 | | | | - | | | | - | | | | - | | | | - | |
| Technological alliance | | | 1 | | | | - | | | | - | | | | - | | | | - | |
| Business collaboration | | | 1 | | | | - | | | | - | | | | - | | | | - | |
| Technical services and cooperation | | | 1 | | | | - | | | | - | | | | - | | | | - | |
| Shared risk participation | | | 1 | | | | - | | | | - | | | | - | | | | - | |
| Production services with risk | | | 2 | | | | - | | | | - | | | | - | | | | - | |
| Operation | | | 1 | | | | - | | | | - | | | | - | | | | - | |
| | | | 135 | | | | 25 | | | | 10 | | | | 45 | | | | 5 | |
Principal accounting policies and practices
The Contaduría General de la Nación or CGN adopted new accounting principles for Colombian state-owned entities in September of 2007. These accounting principles are known as the Regimen de Contabilidad Pública (Regime of Public Accounting or RCP). Pursuant to CGN Communication No. 20079-101345 of September 28, 2007, RCP became effective for Ecopetrol beginning with the fiscal year ended December 31, 2008. RCP is referred to herein as Colombian Government Entity GAAP.
Principles of Consolidation
The consolidated financial statements have been prepared pursuant to the provisions of Article 27 of the Commerce Code and Articles 23 and 122 of Decree 2649 / 1993. The latter article states that the economic entity that holds more than 50% of the capital of other economic entities is required to provide, along with its basic financial statements, the consolidated financial statements and the accompanying notes. The Full Integration consolidation method established in External Circular No. 005 issued on April 6, 2000 by the Superintendence of Companies was used herein.
Presentation Basis
The preparation of the financial statements was carried out under Colombian Government Entity GAAP standards and principles issued by the CGN and other legal provisions. These principles may differ in certain aspects from those established by other standards and other control authorities, and the opinions on specific matters issued by CGN prevail over other regulations.
In accordance with the rules for the inspection, supervision, and/or control of Ecopetrol and the companies that apply Colombian Government Entity GAAP to record operations at the level of source documents or for purposes of standardization, a structure was established to define the accounting treatment of operations not envisioned by the CGN, which is as follows: i) Principal and permanent inspection, supervision, and control: Superintendency of Domiciliary Public Services; ii) Residual control: Superintendency of Corporations and iii) Concurrent control: Superintendency of Finance, on the activities of the Company in its capacity as issuer in the stock market. International Financial Reporting Standards (IFRS) are applied when accounting guidance under Colombian Government Entity GAAP do not address specific accounting issues applicable to the Company, while accounting standards under accounting principles generally accepted in the United States (US GAAP) are applied for accounting issues related to crude oil and natural gas reserves.
Ecopetrol S.A. and Subsidiaries
Notes to the Consolidated Financial Statements
Years ended December 31, 2010, 2009 and 2008
The accrual method was applied for the accounting recognition of financial, economic, environmental and social facts aspects.
The consolidated financial statements include the accounts of the companies in which the Company holds, either directly or indirectly, more than 50% of their voting capital, or over which it has a significant influence although it is not the majority shareholder. All intercompany transactions and balances have been eliminated. The financial statements attached hereto consolidate the assets, liabilities, equity and income of the Ecopetrol subsidiaries.
Certain reclassifications have been made to prior years’ financial information to conform to the December 31, 2010 presentation.
Materiality Concept
An economic fact is material when, due to its nature and amount and the circumstances that surround it, its knowledge or ignorance can significantly alter the economic decisions of the users of the financial information.
The consolidated financial statements include specific headings in accordance with legal requirements, or those representing 5% or more of total assets, current assets, total liabilities, current liabilities, working capital, equity and results of operations, as appropriate. In addition, lower amounts are shown when they are deemed to contribute to a better interpretation of financial information.
Use of Estimates
The preparation of the consolidated financial statements requires that management make estimates and assumptions that could affect the recorded amounts of assets, liabilities, results of activities and the attached notes. These estimates are carried out in accordance with technical criteria pursuant to regulations and current legal provisions. Actual or market values could differ from such estimates.
Transactions in Foreign Currency
Transactions in foreign currency are entered into in accordance with applicable regulations and they are recorded at appropriate exchange rates on the transaction date. Balances denominated in foreign currency are reflected in Colombian pesos at the representative market exchange rates at the end of each period.
The adjustment for exchange differences generated by assets and liabilities denominated in a foreign currency is recorded against results of operations, except when such adjustment is charged to capital investments in controlled entities, in which case the equity is accounted.
The financing costs, including the exchange difference associated with assets purchased under construction, form part of the overall cost of these assets until they are ready for use.
The Company and its subsidiaries associated to crude oil exploration and production activities can freely deal in foreign currency provided that it complies with the provisions of the exchange regime.
With respect to those subsidiaries whose financial statements were originally presented in a currency other than the Colombian pesos, the financial statements were first converted into US dollars and then into Colombian pesos. Market exchange rates at December 31, 2010 were used to convert the balance sheet accounts, weighted average exchange rates were used to translate income statement accounts and historical exchange rates were used to translate equity statement accounts.
Ecopetrol S.A. and Subsidiaries
Notes to the Consolidated Financial Statements
Years ended December 31, 2010, 2009 and 2008
Joint Operation Contracts
Joint venture or common-interest operation contracts are entered into between Ecopetrol or the Corporate Group and third parties in order to share the risk, secure capital, maximize operating efficiency and optimize the recovery of reserves. In these joint ventures, one party is designated as the operator and each party takes its share of the crude oil production according to its agreed participation. When any of the corporate group companies participates as non-operator party, it records these assets, revenues, costs and expenses on a timely basis based on information reported by the operators. When any of the corporate group companies directly operates the facilities, it records assets, revenues, costs and expenses at the same time the accounts receivable to the third party are recognized.
Cash and Cash Equivalents
Cash and cash equivalents are represented by highly liquid investments which have maturities of less than ninety (90) days as of their original acquisition date.
Cash from operations with joint operations partners corresponds to advances from both Ecopetrol and its joint operations partners in the agreed upon participation percentages set for in the relevant joint venture contract, which will be managed in a joint exclusive-use bank account.
Financial Derivative Instruments
The Company enters into hedging agreements to hedge against fluctuations of international crude oil prices and exchange rates. The difference between amounts paid and income received under hedging operations is recognized as financial income or expense in the statements of financial, economic, social and environmental activities. Ecopetrol does not use these financial instruments for speculative purposes.
Hedging operations are carried out with banks and other counterparties with a credit risk rating higher than or equal to A+.
The Company makes periodic evaluations based on the market risk of hedging operations and, together with the Board of Directors and management, determines the need for extension or early termination of the subscribed contracts, when the result is ineffective vis-à-vis the hedged items. In the event of settlement, the financial and contractual effects are recognized in the results of the period.
Investments
The Investments are classified as: i) Liquidity Management Investments, ii) Investments for Policy Purposes and, iii) Equity Investments.
Liquidity management investments correspond to resources invested in debt and equity securities with the objective of obtaining profits through short term price fluctuations. Their initial recording corresponds to their historical cost and they are updated based upon valuation methodologies issued by the Colombian Superintendency of Finance.
Policy purpose investments are made up of debt securities of national or foreign entities, acquired in compliance with macroeconomic or internal policies of the entity, which include investments held through their maturity date and those available for sale, the former being those which are kept for at least one (1) year, as of the first day on which they were classified for the first time, or when they were reclassified.
Investments held to maturity are updated based on the Internal Rate of Return (IRR) included in the methodologies adopted by the Superintendency of Finance and the investments for the purpose of macroeconomic policy and available for sale should be updated based on methodologies adopted by the Superintendency of Finance for tradable investments.
Equity investments in controlled entities where the Company exerts significant influence are recorded using the equity method.
Ecopetrol S.A. and Subsidiaries
Notes to the Consolidated Financial Statements
Years ended December 31, 2010, 2009 and 2008
Significant influence is defined as the power that the entity has, regardless if the percentage of ownership is less than or equal to 50%, to participate in the setting and overseeing of financing and operational policies of another entity for the purpose of obtaining profits from that entity.
Significant influence may be present in one or more of the following aspects:
| · | Representation on the Board of Directors or equivalent regulatory organ of the associated entity, |
| · | Participation in policy-making processes, |
| · | Significant transactions between the investor and the associated entity, |
| · | Secondment of officers, or |
| · | Supply of essential technical information. |
Equity investments in noncontrolled entities include shares of low or minimum liquidity or shares without any trading on an exchange which do not permit any type of control or the exertion of significant influence and are recognized at historical cost; changes in value arise from the periodic comparison of the cost of the investment to its net book value or its value in the stock market.
Equity variances generated by adjustments in conversion of the controlled entity are recognized as surplus under the equity method, without prejudice to the subaccount with a debit balance, in agreement with Resolution 193 of July 27, 2010, issued by the CGN Office.
Investments made in foreign currency are recognized by applying the Representative Market Exchange Rate (TRM, per its Spanish acronym) of the transaction date. The value shall be re-expressed periodically based on the TRM, as long as this is not considered by the updating methodology. For foreign subsidiaries, the equity method shall be applied in Colombian pesos, following the translation of the foreign currency-expressed financial statements.
Receivables and Provisions for Doubtful Accounts
Receivables of the corporate group companies are recognized at their original amount or at the amount accepted by the debtor, which is subject to periodic updating in accordance with current legal provisions or agreed contractual terms.
The provision for doubtful accounts is reviewed and updated periodically in accordance with the aged analysis of balances and the evaluation of the recoverability of individual accounts. The Company carries out the necessary administrative and legal procedures to recover delinquent accounts receivable as well as the collection of interest from customers that do not comply with payment policies.
It is only possible to write-off accounts and notes receivable against the provisions for doubtful accounts when there is reasonable legal or material certainty of the total or partial loss of the assets.
Inventories
Inventories include assets extracted, in production process, transformed and acquired for any reason, to be sold, intended for transformation and consumed in the production process, or as a part of services rendered. Ecopetrol uses the perpetual inventory system.
Inventories are recorded at historical cost or at purchase cost, which includes direct and indirect charges incurred to prepare the inventory for sale or production conditions.
The valuation of inventories is measured using the weighted average method, considering the following parameters:
| · | Crude oil and natural gas inventories for the Company’s own production, at production cost. |
| · | Crude oil purchases, at acquisition costs, including transportation and delivery costs incurred. |
Ecopetrol S.A. and Subsidiaries
Notes to the Consolidated Financial Statements
Years ended December 31, 2010, 2009 and 2008
| · | Finished goods inventory, at total production costs. |
| · | Work in progress inventory, at production costs. |
| · | Raw material inventory, at weighted average cost. |
Raw Materials and supplies in joint ventures are controlled by the operator and reported in a joint account at acquisition costs (recorded in the original currency at average costs). Inventory consumptions are charged to the joint venture as expense or investment, as appropriate.
Additionally, inventories are valued at the lower of market value and average cost, and at the actual cost incurred for in-transit inventories. At the end of the year, provisions are calculated to recognize impairment, obsolescence, excess, slow-moving or loss of market value.
Property, Plant and Equipment and Depreciation
Property, plant and equipment are recorded at the historical cost, adjusted for inflation until 2001, which includes financial expenses and exchange differences from acquisition costs in foreign currency until the asset is put into operation, and the financial revenues corresponding to the still unused portion of financial obligations acquired to finance investment projects. When an asset is sold or retired, the adjusted cost and accumulated depreciation are written off and any gain or loss is recognized in results of operations.
Depreciation is calculated on the total acquisition cost using the straight-line method, based on the assets useful life. Annual depreciation rates used are:
| | | % | |
| Buildings and pipelines | | | 5 | |
| Plant and equipment | | | 10 | |
| Transportation equipment | | | 20 | |
| Computers | | | 33.3 | |
Regular disbursements for maintenance and repairs are included as a part of expenses. Significant expenditures which improve efficiency or extend asset’s useful life are capitalized as an increased in the value of the respective asset.
The value of property, plant and equipment is subject to periodic update by comparing the net book value with the value determined through technical appraisals. When the value of the asset's technical appraisal is greater than its net book value, the difference is recorded as asset reappraisal credited to the surplus on reappraisals account in equity; otherwise, it is recorded as provision for devaluations charged to results.
Upon termination of an association contract, Ecopetrol S. A. receives, at no cost, the property, plant and equipment, materials and the amortizable oil investments owned by the associate company. This transaction does not affect the Company's results. The results of the technical appraisal of the properties, plant and equipment are recognized as reappraisal in the respective assets and equity accounts.
The residual value is considered only for the valuation of property, plant and equipment and only in case the assets are either fully depreciated or not in operating condition. In general, 5% of the cost on average is applied, in accordance with the practice of the Company’s industry. Such criterion is not applicable to assets classified as piping and buildings, as recoverable costs are considered equivalent to the removal and transportation for their retirement. Assets are depreciated at 100% of their historical cost, adjusted for inflation.
Ecopetrol S.A. and Subsidiaries
Notes to the Consolidated Financial Statements
Years ended December 31, 2010, 2009 and 2008
Natural and Environmental Resources
The Company applies the successful efforts method of accounting for investments in exploration and production areas. The geological and geophysical seismic information is expensed as incurred, before the discovery of proved reserves. Acquisition and exploration costs are capitalized until the time in which it is determined that exploration drilling was successful. If exploration drilling results are unsuccessful, all incurred costs are expensed. When a project is authorized for development, the accumulated acquisition and exploration costs are transferred to the oil investments account. Costs capitalized also include the cost of asset retirement costs. Asset and liability balances related to asset retirement costs are updated annually. Production and support equipment are accounted for on a cost basis and are part of the Property, Plant and Equipment subject to depreciation.
Oil investments are amortized using the technical units-of-production method on the basis of royalty-free proven developed reserves per field, estimated as of December 31 of the immediately preceding year. The amortization charged to results is adjusted at the close of December, recalculating the DD&A (Depletion, Depreciation and Amortization) as of January 1 of every year, based on the reserve study updated at the end of the current year.
The reserves technical studies are prepared internally by the Company’s reservoirs superintendence and audited by internationally recognized external consultants, approved by the Company Reserves Committee of Ecopetrol and the Boards of Directors of each subsidiary, as applicable. Proved reserves consist of estimated quantities of crude oil and natural gas which geological and engineering data demonstrate with reasonable certainty to be recoverable in future years from known reservoirs under existing economic and operating conditions, that is, prices and costs as of the date the estimate is made.
Since Ecopetrol became an issuer on the Colombia Stock Exchange (Bolsa de Valores de Colombia - BVC) and the New York Stock Exchange (NYSE), the Company has used the methodology approved by the SEC (Securities Exchange Commission) for the calculation of natural gas and crude oil reserves. As per such methodology, the reference price is the arithmetical average of the WTI crude oil price over the last twelve (12) months.
When it is determined that a well located in an exploration zone has no proven reserves, it is considered a dry or not commercial well and accumulated costs are expensed in the same period this is known.
The estimation of hydrocarbon reserves is subject to several uncertainties inherent in the determination of the proved reserves, production recovery rates, the timeliness in which investments are made to develop the reservoirs and the degree of maturity of the fields.
In accordance with that established in Resolution 494 of December 22, 2009, issued by the National Hydrocarbon Agency (ANH) Ecopetrol complies with the delivery of information to the ANH using the SPE-PRMS, Petroleum Resources Management System, methodology. Reserves included in the reports are audited by three independent specialized firms.
Deferred Charges
Deferred charges include deferred income tax, which results from the temporary differences arising due to the different ways of determining book profit and taxable income at the end of each period.
Other Assets
Other assets include goodwill, which corresponds to the difference between the value of purchase of the equity investments in controlled entities and their intrinsic value, which reflects the economic benefits expected to be achieved from the investment, originating in goodwill, specialized personnel, reputation of privileged credit, prestige due to sale of better products and services, favorable location and expectations of new businesses, among others.
Ecopetrol S.A. and Subsidiaries
Notes to the Consolidated Financial Statements
Years ended December 31, 2010, 2009 and 2008
Goodwill is amortized based on methodologies of acknowledged technical value over the term in which recovery of the investment is expected. At the close of each accounting period, goodwill shall be assessed to determine if the conditions for generation of future economic benefits still exist; otherwise, the asset shall be retired. If the book value of equity investment, plus the book value of goodwill which includes its historical cost added to all price adjustments and amortizations, is greater than the implied value, the asset shall, as a result of such difference, be retired in the related period with charge to results, and the reasons on which such decision was based shall be disclosed.
Software, licenses and patents are recognized at their cost of purchase, development or production. Intangible assets are amortized through the straight-line method during the periods when it is expected to receive the benefits from the incurred costs and expenses, or during the term of the legal or contractual coverage of the granted rights.
Advances received from Ecogas to cover Build, Operate, Maintain and Transfer (BOMT) obligations
As a result of the sale of Ecogas by the National Government, and following specific instructions from CGN, the Company recognized as deferred income the net present value of the future payments scheme, in connection with Ecopetrol´s liability related to BOMT contractors. These liabilities are due in 2017, the year when the contractual obligations end.
Revaluations
Revaluations correspond to the difference between the net book value and the intrinsic value or the price quoted on a stock exchange.
| b. | Property, Plant and Equipment |
Valorizations and valorization surplus of property, plant and equipment correspond to the difference between net book value and the market value for real estate or the current value in use (VAU as per its acronym in Spanish) for plant and equipment, determined by specialists registered with the Colombian Real Estate Association or by suitable technical personnel, respectively.
The methodology used to appraise plant and equipment is the current value of the assets in use by going businesses (VAU) for economic valuation of assets, considering current facilities condition and their useful lives in terms of production capability and ability to generate income.
For office equipment, the historical value to the appraisal value adjustment is not mandatory when the historical value is lower than 35 current monthly legal minimum wages or when the property, plant and equipment is located in high risk areas.
Public credit operations, as controlled by the state of Colombia, correspond to any action or contract which, in compliance with legal regulations on public credit, are addressed to supply the Company with resources, goods and services under specific payment terms such as loans, issue and placement of bonds and public credit securities, and vendors’ credit.
With respect to loans, public credit operations must be recorded for the actual disbursed amount while bonds and securities placed are recorded at their nominal amount. Placement costs are booked directly under expenses.
Accounts Payable – Suppliers
Accounts payable correspond to obligations incurred by Ecopetrol with third parties in order to comply with its corporate purpose.
Ecopetrol S.A. and Subsidiaries
Notes to the Consolidated Financial Statements
Years ended December 31, 2010, 2009 and 2008
Income Tax
The provision for income tax at year end was calculated by applying to the accounting profit before taxes the effective tax rate determined through the reconciliation of income before income tax and taxable income. The effect of timing differences involving the payment of a lower or higher income tax in the current year is recorded as a deferred tax liability or asset, as applicable, provided that a reasonable expectation exists that such differences will reverse and in the case of the deferred tax asset, that sufficient taxable income will be generated to recover the asset. The deferred tax balance was calculated at the 33% applicable rate.
Labor and Pension Obligations
The system for salaries and fringe benefits for Ecopetrol personnel is governed by the Collective Labor Agreement 01 of 1977, and in the absence thereof, by the Labor Code. In addition to fringe benefits, Ecopetrol employees are entitled to receive additional benefits covered by previous regulations that depend on the place, type of work, length of service, and basic salary. Annual interest of 12% is paid on accumulated severance amounts in favor of each employee and the payment of indemnities is provided for when special circumstances arise that result in the non-voluntary termination of the contract, and in periods other than the qualifying period.
The actuarial calculation includes active employees with indefinite term contract, pensioners and heirs, for pension, health care and education plan; it likewise includes pensions bonds for temporary employees, active employees and voluntary retirements.
All social benefits of employees who joined the Company before 1990 are the direct responsibility of Ecopetrol, without the involvement of the Colombian social security entity or institution. The cost of health services of the employee and his/her relatives registered with the Company is determined by means of the morbidity table, prepared on the basis of facts occurring during 2009. Likewise, the experience of Ecopetrol is considered for the calculation of educational allowances, based on the annual average cost of each business segment, subdivided in accordance with the class of studies: pre-school, primary, high school and university.
For employees who joined the Company subsequent to the enactment of Law 50 of 1990, the Company makes periodic contributions for severance, pensions and labor related injuries to the respective funds that assume all these obligations. Likewise, Law 797 of January 29 of 2003 determined that Ecopetrol employees who joined the Company as of January 29, 2003 will be subject to the provisions of the General Pension Regime.
By virtue of Legislative Act 01 of 2005, enacted by Congress, the pension regimes excluded from the General Social Security System in Colombia expired on July 31, 2010. In accordance with provisions therein, the decision of the Ministry of Social Protection and the analyses conducted by the labor advisers of Ecopetrol, it was concluded that those workers who complied with the age and continuous or discontinuous service time requirements of the law, the Collective Bargaining Agreement currently in force and/or Agreement 01 of 1977, prior to August 1, 2010, consolidated their right to pension, while for other workers who were not covered, it is mandatory to be affiliate with the General Pension System. The agency responsible for paying the respective pension will be the pension administrator chosen by the worker (either the Social Security Institute or private pension funds).
Pursuant to Decree 941 of 2002, once the actuarial calculation was approved by the Ministry of Finance in October 2008 and the mechanism for transfer (“commutation”) of the corresponding liability was approved by the Ministry of Social Protection on December 29, 2008, Ecopetrol, as of December 31, 2008 partially transferred (“commuted”) the amounts corresponding to payments from its pension liability, to autonomous pension trust funds (PAP, per its Spanish acronym). The amounts transferred, as well as their yield, cannot be used for other purposes nor may they be reimbursed to the Company until all pension obligations have been fulfilled.
Ecopetrol S.A. and Subsidiaries
Notes to the Consolidated Financial Statements
Years ended December 31, 2010, 2009 and 2008
The transferred liability corresponds only to pension payments; the portion relating to health care and education services remains Ecopetrol’s direct pension obligations.
In case the yields of the autonomous equity are not sufficient to cover 100% of the actuarial calculation as updated every year, Ecopetrol shall draw the resources to complete funding of the pension liabilities, since Ecopetrol remains liable for payment of pension liabilities transferred.
Through Resolution 1555 of July 30, 2010, the Superintendency of Finance replaced the Mortality Tables used to prepare actuarial calculations and stipulated that the effects from such change could be recognized gradually. Subsequently, Decree 4565 of December 7, 2010 modified the accounting standards for amortization of the actuarial calculation which were in force up to that date. Pursuant to the new Decree, the companies that had amortized 100% of their actuarial calculation at December 31, 2009 may gradually amortize up to the 2029 the increase in the actuarial calculation for 2010 estimated by using the new Mortality Tables.
In view of the foregoing, Ecopetrol modified its accounting policy for amortization of the actuarial calculation of monthly pension payments, pension quotas, parts and bonds (transferred liabilities) and health bonds, and adopted a 5-year term as of 2010 to amortize the increase in the 2010 actuarial calculation. Up to 2009, the yearly increase in the actuarial calculation was recorded as expense of the period, considering that the actuarial calculation was 100% amortized.
Purchase of Hydrocarbons
Ecopetrol purchases hydrocarbons from the ANH that it receives from all of the production in Colombia, at prices established according to section four of Law 756 of 2002 and Resolution 18-1709 of 2003 of the Ministry of Mines and Energy, considering the international reference prices.
Additionally, it purchases hydrocarbons both from partners as well as from other hydrocarbon producers in Colombia and abroad to meet the needs and operating plans of the Company.
Recognition of Income
Income from crude oil and natural gas sales is recognized at the time of transfer of title to the buyer, including its risks and benefits. In the case of refined and petrochemical products, income is recognized when products are shipped by the refinery; subsequently, they are adjusted in accordance with the volumes actually delivered. Income from transportation services is recognized when products are transported and delivered to the buyer in accordance with sale terms. In other cases, income is recognized at the time it is earned and a true, probable and quantifiable right to demand its payment arises.
Late payment interest income on the collection of accounts receivable is recognized following the prudence and realization principles.
By virtue of the current regulations, Ecopetrol and Reficar sell at a regulated price and the Government provides the companies with a subsidy on regular motor gasoline and A.C.P.M, granted to local consumers, which is generated by adding the differences, for every day of the month, between the producer's regulated revenues and the daily price equivalent to the U.S. Gulf reference market price, calculated as per its origin, times the volumes sold per diem. Resolution 182439 and Decree 4839 of December 2008 establish the procedure for recognizing subsidies in the event of which these should be negative (negative value between parity and regulated prices).
In March 2010 the Ministry of Mines and Energy issued Resolution No. 180522 which revoked all provisions contrary to Resolutions 181496 of September 2008, 182439 of December 30, 2008 and 180219 of February 13, 2009 and modifies the formula for calculating the gasoline and diesel international reference prices.
Ecopetrol S.A. and Subsidiaries
Notes to the Consolidated Financial Statements
Years ended December 31, 2010, 2009 and 2008
Costs of Sale and Expenses
Costs are recognized at their historical value both for goods purchased for sale and for accumulated production costs of goods produced and services rendered. Costs are disclosed according to the operation which generates them.
Expenses correspond to amounts required for the development of the ordinary activity and include those caused by extraordinary events. Expenses are disclosed in accordance with their nature and the occurrence of extraordinary events.
Costs and expenses are recognized upon transfer receipt of goods or services or when there is certainty of the occurrence of the economic fact. Fuel shortages and losses due to thefts and explosions are recorded as non- operating expenses.
Abandonment of Fields
The Company recognizes the liability for future environmental obligations and its corresponding entry is capitalized as the greater value between natural and environmental resources assets. The estimation includes plugging costs and abandonment of wells, dismantling of facilities and environmental recovery of areas and wells. Amortization expense is recorded as production costs, using the technical units-of-production method based on proved developed reserves. Changes resulting from new estimates of the liability for abandonment and environmental restoration are capitalized to the respective asset.
Since the extension of certain association contracts, the abandonment costs are assumed by the associates in the percentages of participation established in each contract. Ecopetrol has not allocated funds in order to cover these obligations, with the exception of association contracts Casanare, Guajira, Tisquirama, Cravo Norte and Cravo Norte Pipeline. However, to the extent that activities are generated which are related to abandonment, these will be covered by the Company.
In 2010, the policy for estimating the portion of abandonment/retirement obligations, which are due in U.S. dollars, was changed to Colombian pesos as most payments (greater than 70%) are made in Colombian pesos.
Accounting for Contingencies
As of the date of these consolidated financial statements, conditions that result in losses for the Company might exist, which will only be known if future specific circumstances arise. Management, the legal Vice Presidency and legal counsel evaluate these situations based on their nature, the likelihood that they will materialize, and the amounts involved, to decide on any changes to the amounts accrued and/or disclosed. This analysis includes current legal proceedings against the Company.
The methodology applied to assess current legal proceedings and any contingent obligation is based on the credit system of the Nation, which is used by the Ministry of the Interior and of Justice.
A provision is allocated for legal proceedings when there is a first instance conviction or the risk assessment results are “Likely to lose”.
Risks and Uncertainties
The Company is subject to certain operational risks which are customary to this industry in Colombia and abroad, such as terrorism, product theft, crude oil international price changes, environmental damages, and variations in the estimations of hydrocarbon reserves.
Ecopetrol S.A. and Subsidiaries
Notes to the Consolidated Financial Statements
Years ended December 31, 2010, 2009 and 2008
Memorandum Accounts
Creditor and Debtor Memorandum Accounts represent the estimation of facts or circumstances from which rights or obligations could affect the Company’s financial, economic, social and environmental position. They also disclose the value of goods, rights and obligations that must be controlled and include, additionally, the differences between the accounting information and the information used for tax purposes.
These accounts are not included in the Company’s balance.
Earnings per Share
Earnings per share are calculated based in the annual weighted average of outstanding issued shares.
| 2. | Assets And Liabilities Denominated In Foreign Currency |
Transactions and balances in foreign currency are translated into Colombian pesos at the market exchange rate certified by the Superintendency of Finance of Colombia.
At December 31, 2010 and 2009 the consolidated financial statements of Ecopetrol include the following assets and liabilities denominated in foreign currency (which are translated into Colombian pesos at the closing exchange rates of $1,913.98 and $2,044.23 for US$1, for 2010 and 2009 respectively).
| | | 2010 | | | 2009 | |
| | | Thousands of US$ | | | Equivalent millions of COP | | | Thousands of US$ | | | Equivalent millions of COP | |
| Assets | | | | | | | | | | | | |
| Cash and cash equivalents | | | 822,496 | | | $ | 1,574,241 | | | | 1,133,720 | | | $ | 2,317,585 | |
| Investments | | | 2,400,833 | | | | 4,595,146 | | | | 1,602,179 | | | | 3,275,223 | |
| Accounts and notes receivables | | | 766,604 | | | | 1,467,265 | | | | 792,713 | | | | 1,620,487 | |
| Advances and deposits | | | 681,508 | | | | 1,304,393 | | | | 120,923 | | | | 247,194 | |
| Other assets | | | 47,498 | | | | 90,910 | | | | 713,950 | | | | 1,459,478 | |
| | | | 4,718,939 | | | $ | 9,031,955 | | | | 4,363,485 | | | $ | 8,919,967 | |
| Liabilities: | | | | | | | | | | | | | | | | |
| Financial obligations | | | 1,668,906 | | | | 3,194,252 | | | | 1,601,090 | | | | 3,272,996 | |
| Estimated liabilities and provisions | | | 55,081 | | | | 105,423 | | | | 1,519,417 | | | | 3,106,037 | |
| Accounts payable | | | 757,365 | | | | 1,449,581 | | | | 607,508 | | | | 1,241,886 | |
| Other liabilities | | | 422,251 | | | | 808,180 | | | | 503,388 | | | | 1,029,041 | |
| | | | 2,903,603 | | | $ | 5,557,436 | | | | 4,231,403 | | | $ | 8,649,960 | |
| Net Asset Position | | | 1,815,336 | | | $ | 3,474,519 | | | | 132,082 | | | $ | 270,007 | |
| 3. | Cash and Cash Equivalents |
| | | 2010 | | | 2009 | |
| Banks and saving entities | | $ | 2,124,461 | | | $ | 1,508,846 | |
| Sight investments (1) | | | 1,046,131 | | | | 362,376 | |
| Special Funds (2) | | | 555,716 | | | | 1,690,815 | |
| Cash | | | 470 | | | | 82 | |
| | | $ | 3,726,778 | | | $ | 3,562,119 | |
| (1) | Represented by trust rights and Time Deposits TDs (CDT), primarily of: $478,498 Ecopetrol S.A., $416,687 Ocensa, $63,460 Hocol, and $59,949 Refinería de Cartagena. |
| (2) | Includes investments in overnight operations of $154,899 (2009 - $34), and savings in special funds in pesos and foreign currency of $400,795 (2009 - $1,690,661). |
Ecopetrol S.A. and Subsidiaries
Notes to the Consolidated Financial Statements
Years ended December 31, 2010, 2009 and 2008
Restrictions on banks and corporations
Payment made by Ecopetrol to the Neuro Science Center of Cuba for US$98,447 is currently withheld by the ABN bank, Miami Agency (Now Banco Itau Internacional) as part of the embargo of the United States of America to Cuba following OFAC (Office of Foreign Assets Control) regulations.
| | | 2010 | | | 2009 | |
| Current: | | | | | | |
| Fixed yield: | | | | | | |
| Investment funds administered by third parties | | $ | 188,461 | | | $ | 197,485 | |
| Bonds and securities of private or foreign entities | | | 132,261 | | | | 60,330 | |
| Trust funds | | | 5,597 | | | | 77,929 | |
| Treasury Securities – TES | | | 1,463 | | | | - | |
| Bonds issued by the Colombian Government | | | - | | | | 126,375 | |
| Hedge instruments | | | - | | | | 139 | |
| Total current | | $ | 327,782 | | | $ | 462,258 | |
| Long-Term: | | | | | | | | |
Variable yield - Shares (2) | | $ | 830,170 | | | $ | 777,503 | |
| Fixed yield | | | | | | | | |
| Bonds and securities or foreign entities | | | 2,275,466 | | | | 1,834,779 | |
| Treasury Securities – TES | | | 1,067,799 | | | | 94,252 | |
| Bonds issued by the Colombian Government | | | 642,449 | | | | 602,039 | |
| Specific destination Funds – Legal contingencies | | | 361,607 | | | | 380,463 | |
| Other investments (1) | | | - | | | | 21,703 | |
| Total long-term | | $ | 5,177,491 | | | $ | 3,710,739 | |
| (1) | Corresponds to the redemption of securities of remaining resources derived from production of the Teca field – Cocorná Association Contract, which were incorporated into the portfolio, in accordance with the verdict issued in favor of Ecopetrol S. A. by the Arbitration Court, on the date of expiration of the association contract operated by Mansarovar Energy Colombia LTD. |
| (2) | Variable Income - Stock |
A summary of long-term investments of variable yield as of December 31, 2010 valued under the cost method is set forth below:
| | | Number of shares and/or quotas | | | Participation percentage | | Valuation month in 2010 | | Historical Cost | | | Intrinsic / Market Value | | | Revaluations (provisions) | |
| | | | | | | | | | | | | | | | | |
| STRATEGIC | | | | | | | | | | | | | | | | |
| Sociedad Portuaria de Olefinas | | | 249,992 | | | | 50 | | December | | $ | 333 | | | $ | 390 | | | $ | 57 | |
| Zona Franca de Cartagena S. A. | | | 290 | | | | 10 | | November | | | 393 | | | | 745 | | | | 352 | |
| Sociedad Portuaria del Dique | | | 200 | | | | 0.5 | | November | | | 5 | | | | 5 | | | | - | |
| Total strategic | | | | | | | | | | | $ | 731 | | | $ | 1,140 | | | $ | 409 | |
| | | | | | | | | | | | | | | | | | | | | | |
| NON STRATEGIC | | | | | | | | | | | | | | | | | | | | | |
| Empresa de Energía de Bogotá | | | 6,310,980 | | | | 7.35 | | December | | $ | 169,421 | | | $ | 1,101,266 | | | $ | 931,845 | |
| Interconexión Eléctrica S.A | | | 58,925,480 | | | | 5.32 | | December | | | 69,550 | | | | 830,850 | | | | 761,300 | |
| Total non-strategic | | | | | | | | | | | $ | 238,971 | | | $ | 1,932,116 | | | $ | 1,693,553 | |
Ecopetrol S.A. and Subsidiaries
Notes to the Consolidated Financial Statements
Years ended December 31, 2010, 2009 and 2008
A summary of variable yield long-term investments, valued under the equity method, is set forth below:
| Equity Share | | Number of shares and/or quotas | | | Participation percentage | | Valuation month in 2010 | | Historical cost | | | Adjusted cost | | | Equity method effect | |
| Significant Influence | | | | | | | | | | | | | | | | |
| Offshore International Group | | | 250 | | | | 50 | | December | | $ | 404,664 | | | $ | 390,479 | | | $ | (14,185 | ) |
| Invercolsa S. A. (1) | | | 889,410,047 | | | | 31.76 | | November | | | 60,282 | | | | 170,523 | | | | 110,241 | |
| Ecodiesel Colombia S. A. | | | 7,750,000,000 | | | | 50 | | November | | | 10,500 | | | | 11,706 | | | | 1,206 | |
| Serviport S. A. | | | 53,714,116 | | | | 49 | | November | | | 2,081 | | | | 7,182 | | | | 5,101 | |
| Amadine Holding(2) | | | 500 | | | | 100 | | March | | | 6,657 | | | | 6,658 | | | | 1 | |
| Arces Group(2) | | | 10,001 | | | | 100 | | March | | | 6,000 | | | | 3,920 | | | | (2,080 | ) |
| Total | | | | | | | | | | | $ | 490,184 | | | $ | 590,468 | | | $ | 100,284 | |
Restrictions over long-term investments – Variable income:
| (1) | The 28th Bogota Civil Court issued a decision on February 8, 2007 under which Mr. Fernando Londoño was condemned to return to Ecopetrol the Inversiones de Gases de Colombia S.A. (Invercolsa) shares that he acquired, as well as the amount of dividends he was paid on those shares. This decision was confirmed by the Civil Decision Room of the High Court of Justice (Civil Court), on January 11, 2011, notified through edict dated January 17, 2011. Consequently, this decision has not been entirely finalized and is susceptible to a request for clarification or supplementary information, as well as appealed is for annulment by the defendant. |
In addition, the Council of State ruled in favor of Ecopetrol in a popular lawsuit and ordered the return of the shares and its dividends received from these shares to Ecopetrol, a decision which was the object of a writ for constitutional action. Upon review of the popular legal action by the Constitutional Court, the ruling of the State Council was confirmed, except as related to the dividends received by Arrendadora Financiera Bolivariana Internacional S.A. (AFIB), which the same Council had ordered to be returned to Ecopetrol; such dividends are subject to the provisions in the aforementioned civil justice rulings in accordance to which they must be returned entirely to ECOPETROL.
In addition, on September 10, 2009, the Administrative Court of Cundinamarca issued an order requiring the legal representative of Invercolsa to cancel the record of a pledge existing on some shares, in favor of Arrendadora Financiera Bolivariana Internacional S.A. (AFIB), after which such shares should be registered in the name of Ecopetrol. The pledge was cancelled, but the registration of the shares in Ecopetrol’s name is pending, as it was prevented by a seizure warrant and, even though the decision to release such seizure warrant by the 27th Civil Court of the Bogota Circuit currently stands, the Court has not yet notified Invercolsa officially.
| (2) | As of December 31, of 2010 these companies were undergoing liquidation proceedings. |
A summary of the balances of Ecopetrol’s consolidated subsidiaries as of December 31, 2010 is set forth below:
| Company | | Assets | | | Liabilities | | | Equity | | | Results of the period | |
| Bioenergy S.A. | | $ | 120,502 | | | $ | 19,208 | | | $ | 101,294 | | | $ | (3,536 | ) |
| Black Gold Re Ltd | | | 236,143 | | | | 12,928 | | | | 223,215 | | | | 12,215 | |
| Compounding and Masterbatching Industry Ltda – COMAI | | | 110,107 | | | | 39,527 | | | | 70,580 | | | | 43,243 | |
| Ecopetrol America Inc | | | 950,578 | | | | 27,140 | | | | 923,438 | | | | (543,198 | ) |
| Ecopetrol Capital AG | | | 254,095 | | | | 253,890 | | | | 205 | | | | - | |
| Ecopetrol del Perú S. A. | | | 68,031 | | | | 22,274 | | | | 45,757 | | | | (94,920 | ) |
| Ecopetrol Oleo é Gas do Brasil Ltda. | | | 153,490 | | | | 33,957 | | | | 119,533 | | | | (211,460 | ) |
| Ecopetrol Transportation Investments | | | 681,468 | | | | 18 | | | | 681,450 | | | | (18 | ) |
| Hocol Petroleum Limited | | | 2,348,365 | | | | 712,051 | | | | 1,636,314 | | | | 232,762 | |
| ODL Finance S. A. | | | 1,854,165 | | | | 1,414,707 | | | | 439,458 | | | | 18,553 | |
| Oleoducto Bicentenario de Colombia S.A.S. | | | 271,960 | | | | 1,105 | | | | 270,855 | | | | (16,615 | ) |
| Oleoducto Central S.A. | | | 2,140,871 | | | | 1,560,321 | | | | 580,550 | | | | 277,468 | |
| Oleoducto de Colombia S.A. | | | 333,934 | | | | 55,526 | | | | 278,408 | | | | (6,052 | ) |
| Polipropileno del Caribe S.A. | | | 1,062,360 | | | | 426,305 | | | | 636,055 | | | | 65,439 | |
| Refineria de Cartagena | | | 4,201,911 | | | | 1,475,395 | | | | 2,726,516 | | | | (305,187 | ) |
Ecopetrol S.A. and Subsidiaries
Notes to the Consolidated Financial Statements
Years ended December 31, 2010, 2009 and 2008
A summary of the balances of Ecopetrol’s consolidated subsidiaries as of December 31, 2009 is set forth below:
| Company | | Assets | | | Liabilities | | | Equity | | | Results of the period | |
| Bioenergy S.A. | | $ | 64,928 | | | $ | 6,593 | | | $ | 58,335 | | | $ | (2,476 | ) |
| Black Gold Re Ltd | | | 230,652 | | | | 5,384 | | | | 225,268 | | | | 14,705 | |
| Compounding and Masterbatching Industry Ltda – COMAI. | | | 76,539 | | | | 28,516 | | | | 48,023 | | | | 27,114 | |
| Ecopetrol America Inc | | | 1,249,328 | | | | 12,880 | | | | 1,236,448 | | | | (318,609 | ) |
| Ecopetrol del Perú S.A. | | | 81,228 | | | | 10,450 | | | | 70,778 | | | | (3,347 | ) |
| Ecopetrol Oleo é Gas do Brasil Ltda. | | | 31,340 | | | | 10,928 | | | | 20,412 | | | | (139,743 | ) |
| Hocol Petroleum Limited | | | 1,901,317 | | | | 608,693 | | | | 1,292,624 | | | | 330,590 | |
| ODL Finance S.A. | | | 1,381,021 | | | | 959,245 | | | | 421,776 | | | | 12,419 | |
| Oleoducto Central | | | 1,773,783 | | | | 63,824 | | | | 1,709,959 | | | | - | |
| Oleoducto de Colombia | | | 311,550 | | | | 27,090 | | | | 284,460 | | | | (22,027 | ) |
| Polipropileno del Caribe S.A. | | | 983,246 | | | | 354,652 | | | | 628,594 | | | | 47,712 | |
| Refinería de Cartagena | | | 3,046,293 | | | | 572,520 | | | | 2,473,773 | | | | (127,854 | ) |
The economic activity and the net income for companies in which Ecopetrol has investments for 2010 and 2009 are set forth below:
| Company | | Economic Activity | | Net Result 2010 | | | Net Result 2009 | |
| Interconexión Eléctrica S. A. (3) | | Operation, maintenance, transmission and sale of electrical energy power. | | $ | 305,496 | | | $ | 371,996 | |
| Empresa de Energía de Bogotá S. A. E.S.P (1) | | Electric power transmission | | $ | 1,074,394 | | | $ | 786,888 | |
| Invercolsa S. A. (3) | | Investments in energy sector companies including activities inherent to the industry and commerce of hydrocarbons and mining. | | $ | 87,755 | | | $ | 71,903 | |
| Serviport S. A. (3) | | Provision of support services for loading and unloading of crude oil ships, supply of equipment for the same purpose, load inspections measurements. | | $ | (1,637 | ) | | $ | 941 | |
| Ecodiesel Colombia S. A. (3) | | Production, sale and distribution of bio-fuels and oleo-chemicals. | | $ | 2,073 | | | $ | 336 | |
| Offshore International Group (1) (2) | | Exploration, development, production and processing of hydrocarbons | | $ | 109,283 | | | $ | 69,845 | |
| (1) | Information as of December 2010 |
| (2) | Calculated based on the average market exchange rate (TRM) for each month. |
| (3) | Information as of November 2010 |
The classification of treasury investments depends on the use of the funds, their destination and maturity. Investments whose maturity or realization is shorter than one year are classified as current.
A summary of the non current fixed yield investments as of December 31, 2010 is set forth below:
| Maturity | | 1 - 3 Years | | | 3 - 5 Years | | | > 5 Years | | | Total | |
| Bonds and securities of foreign entities | | $ | 1,968,578 | | | $ | 306,888 | | | $ | - | | | $ | 2,275,466 | |
| Bonds and securities issued by the Colombian Government | | | 473,358 | | | | 123,532 | | | | 45,560 | | | | 642,450 | |
| Treasury Securities – TES | | | 485,038 | | | | 217,793 | | | | 364,968 | | | | 1,067,799 | |
| Specific destination fund | | | 144,035 | | | | 11,872 | | | | 205,699 | | | | 361,606 | |
| | | $ | 3,071,009 | | | $ | 660,085 | | | $ | 616,227 | | | $ | 4,347,321 | |
Ecopetrol S.A. and Subsidiaries
Notes to the Consolidated Financial Statements
Years ended December 31, 2010, 2009 and 2008
A summary of the non current fixed yield investments as of December 31, 2009 is set forth below:
| Maturity | | 1 - 3 Years | | | 3 - 5 Years | | | > 5 Years | | | Total | |
| Bonds and securities of foreign entities | | $ | 1,681,593 | | | $ | 101,843 | | | $ | 51,343 | | | $ | 1,834,779 | |
| Bonds and securities issued by the Colombian Government | | | 311,367 | | | | 290,672 | | | | - | | | | 602,039 | |
| Fund for legal contingencies | | | 61,227 | | | | 139,009 | | | | 180,227 | | | | 380,463 | |
| Treasury Securities – TES | | | 36,149 | | | | 45,905 | | | | 12,198 | | | | 94,252 | |
| Other investments | | | 21,703 | | | | - | | | | - | | | | 21,703 | |
| | | $ | 2,112,039 | | | $ | 577,429 | | | $ | 243,768 | | | $ | 2,933,236 | |
| 5. | Accounts and Notes Receivable |
| | | 2010 | | | 2009 | |
| Current portion | | | | | | |
| Customers | | | | | | |
| Local | | $ | 868,238 | | | $ | 975,743 | |
| Foreign | | | 1,282,132 | | | | 1,202,517 | |
| Other debtors | | | 287,594 | | | | 300,586 | |
| Price differential to be received from the Ministry of Mines and Energy (1) | | | 163,386 | | | | 263,513 | |
| Reimbursements and investment yields (2) | | | 3,141 | | | | 99,798 | |
| Doubtful accounts | | | 100,218 | | | | 62,038 | |
| Associations contracts – Joint operations | | | 60,026 | | | | 85,582 | |
| Industrial service customers | | | 26,241 | | | | 11,965 | |
| Accounts receivable from employees | | | 33,171 | | | | 16,780 | |
| Notes receivable | | | 13,845 | | | | 14,661 | |
| Total | | | 2,837,992 | | | | 3,033,183 | |
| Less allowance for doubtful accounts | | | (101,400 | ) | | | (64,063 | ) |
| Total current portion | | $ | 2,736,592 | | | $ | 2,969,120 | |
| Long-term portion | | | | | | | | |
| Cavipetrol - Loans to employees (3) | | $ | 245,824 | | | $ | 204,647 | |
| Credit portfolio (4) | | | 20,156 | | | | 22,129 | |
| Others | | | 106,293 | | | | 5 | |
| Total Long-term portion | | $ | 372,273 | | | $ | 226,781 | |
The aging determination and classification of the accounts receivable to customers as of December 31 2010, pursuant to maturity is set forth below:
| | | Maturity in days | |
| | | 0 – 180 | | | 181 – 360 | | | More than 361* | |
| Current accounts receivable | | $ | 1,950,537 | | | $ | 33 | | | $ | - | |
| Past Due accounts receivable | | | 92,043 | | | | 99,872 | | | | 7,885 | |
| | | $ | 1,990,684 | | | $ | 99,905 | | | $ | 7,885 | |
| | | | | | | | | | | | | |
| Local customers | | | 866,684 | | | | 138 | | | | 1,416 | |
| Foreign customers | | | 1,175,896 | | | | 99,767 | | | | 6,469 | |
| | | $ | 2,042,580 | | | $ | 99,905 | | | $ | 7,885 | |
Ecopetrol S.A. and Subsidiaries
Notes to the Consolidated Financial Statements
Years ended December 31, 2010, 2009 and 2008
The aging determination and classification of the accounts receivable to customers at December 31, 2009, pursuant to maturity is set forth below:
| | | Maturity in days | |
| | | 0 – 180 | | | 181 – 360 | | | More than 361* | |
| Current accounts receivable | | $ | 2,037,815 | | | $ | - | | | $ | - | |
| Past Due accounts receivable | | | 127,899 | | | | 5,777 | | | | 6,769 | |
| | | $ | 2,165,714 | | | $ | 5,777 | | | $ | 6,769 | |
| | | | | | | | | | | | | |
| Local customers | | | 974,241 | | | | 75 | | | | 1,427 | |
| Foreign customers | | | 1,191,473 | | | | 5,702 | | | | 5,342 | |
| | | $ | 2,165,714 | | | $ | 5,777 | | | $ | 6,769 | |
* Customer receivables included in doubtful accounts.
The changes in the allowance for doubtful accounts are set forth below:
| | | 2010 | | | 2009 | | | 2008 | |
| Initial balance | | $ | 64,063 | | | $ | 33,679 | | | $ | 28,665 | |
| Additions (New provisions) | | | 169,789 | | | | 34,608 | | | | 3,100 | |
| Recoveries | | | (68,772 | ) | | | (779 | ) | | | (405 | ) |
| Receivables write-off | | | (60,866 | ) | | | - | | | | - | |
| Adjustment to existing allowance | | | (2,814 | ) | | | (3,445 | ) | | | 2,319 | |
| Ending Balance | | $ | 101,400 | | | $ | 64,063 | | | $ | 33,679 | |
| (1) | Correspond to accounts receivable from the Ministry of Finance and Public Credit for a total amount of $198,490 regarding the calculation of the regular motor gasoline and Diesel price differential pursuant to Resolution 180522 issued on March 29 of 2010. As of December 31, 2009the balance comprises $228,762 corresponding to the opportunity cost and $34,751 corresponding to price differences of the regular motor gasoline and Diesel. |
| (2) | Includes dividends receivable from Interconexión Eléctrica S. A. – ISA for an amount of $2,357 and $2,117 in 2010 and 2009 respectively. In addition, includes $96,669 as a return and yield of investments receivable at December 31, 2009. |
| (3) | By means of Leg contracts 058-80 of 1980 and 4008928 of 2006, the administration, management and control of loans granted to employees by the Company were given to Cavipetrol. In its capacity as administrator, Cavipetrol acts as custodian in its database and financial system of the detail by employee of said loans and their respective conditions. |
The future collections of accounts receivable from Cavipetrol, as of December 31, 2010 are as follows:
| Year | | Amount | |
| 2012 | | $ | 26,795 | |
| 2013 | | | 23,338 | |
| 2014 | | | 20,647 | |
| 2015 and following | | | 175,044 | |
| | | $ | 245,824 | |
There are no other important restrictions to the recovery of accounts and notes receivables’ recovery.
| (4) | A summary of the long-term recovery credit portfolio for each of the following five years is provided below: |
| Applicable interest rate | | Year 1 | | | Year 2 | | | Year 3 | | | Year 4 | | | Year 5 | |
| | | Dec-11 to Nov-12 | | | Dec-12 to Nov-13 | | | Dec-13 to Nov-14 | | | Dec-14 to Nov-15 | | | Dec-15 to Nov-16 | |
| DTF previous month | | $ | 57 | | | $ | - | | | $ | - | | | $ | - | | | $ | - | |
| CPI + 6 | | | 110 | | | | 70 | | | | 8 | | | | - | | | | - | |
| CPI | | | 37 | | | | 19 | | | | 19 | | | | 19 | | | | 97 | |
| ECP opportunity rate -Bank Average | | | 285 | | | | - | | | | - | | | | - | | | | - | |
| DTF + 6 points | | | 10 | | | | - | | | | - | | | | - | | | | - | |
| Greater between 6% EA and PCI for semester starting July 2009 | | | 6,500 | | | | 6,500 | | | | - | | | | - | | | | - | |
| DTF + 6.25% T.A. percent points in its equivalent to E.A, beginning on March 30, 2011 | | | 6,425 | | | | - | | | | - | | | | - | | | | - | |
| Total annual recovery | | $ | 13,424 | | | $ | 6,589 | | | $ | 27 | | | $ | 19 | | | $ | 97 | |
Ecopetrol S.A. and Subsidiaries
Notes to the Consolidated Financial Statements
Years ended December 31, 2010, 2009 and 2008
| DTF: | Average of interest rates for fixed term deposits, promulgated by the Superintendency of Finance. |
| CPI: | Consumer Price Index, as indicated by the Colombian Government. |
No other significant restrictions exist for the recovery of accounts and notes receivable.
| | | 2010 | | | 2009 | |
| Finished Products: | | | | | | |
| Crude Oil | | $ | 772,405 | | | $ | 763,800 | |
| Fuels | | | 491,565 | | | | 555,359 | |
| Petrochemicals | | | 103,007 | | | | 101,302 | |
| Purchased Products: | | | | | | | | |
| Fuel | | | 165,067 | | | | 84,189 | |
| Crude oil | | | 91,696 | | | | 23,212 | |
| Petrochemicals | | | 4,081 | | | | 5,704 | |
| Raw Materials: | | | | | | | | |
| Crude oil | | | 157,390 | | | | 74,343 | |
| Petrochemicals | | | 21,753 | | | | 29,045 | |
| In-process Products: | | | | | | | | |
| Fuels | | | 335,613 | | | | 316,129 | |
| Petrochemicals | | | 10,398 | | | | 19,458 | |
| Materials for the production of goods | | | 53,252 | | | | 93,298 | |
| In transit materials | | | 5,158 | | | | 21,870 | |
| Total | | | 2,211,385 | | | | 2,087,709 | |
| Less allowance for inventories | | | (19,297 | ) | | | (45,012 | ) |
| Total | | $ | 2,192,088 | | | $ | 2,042,697 | |
Below are the adjustments made to the allowance for inventories for the years ended December 31 2010, 2009 and 2008:
| | | 2010 | | | 2009 | | | 2008 | |
| Initial balance | | $ | 45,012 | | | $ | 127,464 | | | $ | 80,971 | |
| Adjustments to allowance, net | | | (25,715 | ) | | | (82,452 | ) | | | 46,493 | |
| Ending balance | | $ | 19,297 | | | $ | 45,012 | | | $ | 127,464 | |
Ecopetrol S.A. and Subsidiaries
Notes to the Consolidated Financial Statements
Years ended December 31, 2010, 2009 and 2008
| | | 2010 | | | 2009 | |
| Short-Term | | | | | | |
| Official entities (1) | | $ | 1,674,428 | | | $ | 2,350,646 | |
| Advances to investment projects (2) | | | 1,163,132 | | | | - | |
| Partners in joint operations (3) | | | 562,779 | | | | 474,920 | |
| Custom agents | | | 37,824 | | | | 12,611 | |
| Advances to contractors | | | 65,245 | | | | 27,907 | |
| Agreements (4) | | | 18,733 | | | | 19,364 | |
| Advances to employees | | | 968 | | | | 1,053 | |
| Advances to suppliers | | | 97,208 | | | | 132,278 | |
| Total short term | | | 3,620,317 | | | | 3,018,779 | |
| Long-term | | | | | | | | |
| Advances and deposits | | | 288,735 | | | | 253,681 | |
| Total | | $ | 3,909,052 | | | $ | 3,272,460 | |
| (1) | Includes transactions with the National Tax and Customs Administration - DIAN for advance income tax for 2010 in the amount totaling $1,096,649 (2009 - $1,889,555), self-withholdings, and others in the amount of $577,779 (2009 - $461,091). |
| (2) | Advances to investment project for the purchase of BP Exploration Company Colombia Limited for US$637.5 million. The Ecopetrol participation in this transaction was 51% while Talisman participated in 49%. |
| | 2010 | | 2009 |
| Contracts in which Ecopetrol is not the operator: | | | | | |
| Meta Petroleum Ltd. | $ | 287,853 | | $ | 73,450 |
| Chevron Petroleum Company | | 81,171 | | | 76,693 |
| Other operations | | 22,046 | | | 61,253 |
| Occidental de Colombia Inc. | | 14,721 | | | 10,864 |
| Petrobras Colombia Limited | | 12,507 | | | 33,877 |
| BP Exploration Company Colombia | | 11,204 | | | 25,845 |
| Perenco Colombia Limited | | 13,122 | | | 1,262 |
| CEPSA Colombia S. A. | | 4,337 | | | 7,258 |
| Mansarovar Energy Colombia Ltd. | | 3,753 | | | 3,712 |
| Petrobras Internacional Braspetro B.V. | | 2,321 | | | 5,042 |
| Occidental Andina LLC | | - | | | 21,386 |
| BHP Billiton Petroleum Colombia | | - | | | 5,111 |
| Kappa Resources Colombia Ltd. | | - | | | 1,694 |
| Talisman Perú BV, Sucursal del Perú | | 19,200 | | | - |
| Anadarko Petroleum Corporation | | - | | | 2,495 |
| Petróleo Brasileiro S.A. Petrobras | | 10 | | | 120 |
| Petrobras Energía Perú S.A. | | 3,815 | | | - |
| HESS BRASIL | | 3,142 | | | - |
| Contracts in which Ecopetrol is the operator: | | | | | |
| Oleoducto Caño Limón | | 47,429 | | | 55,931 |
| Other operations | | 15,951 | | | 24,992 |
| JOA Caño Sur | | 14,816 | | | 6,135 |
| La Cira | | 5,381 | | | 51,415 |
| Shared risk Catleya | | - | | | 706 |
| Tibú | | - | | | 4,120 |
| CRC 2004 – 01 | | - | | | 1,559 |
| Total | $ | 562,779 | | $ | 474,920 |
| (1) | Represents the amounts delivered to personnel as advances under the personnel educational plan. |
Ecopetrol S.A. and Subsidiaries
Notes to the Consolidated Financial Statements
Years ended December 31, 2010, 2009 and 2008
| | | 2010 | | | 2009 | |
| Insurance (1) | | $ | 16,514 | | | $ | 20,199 | |
| Others (2) | | | 5,434 | | | | 42,616 | |
| Total | | $ | 21,947 | | | $ | 62,815 | |
| (1) | Out of the insurance policies contracted, $11,614 correspond to Ecopetrol S.A and are effective until April 2011, comprising: i) operating, with a cost of $44,258 and amortization for $33,793 as of December 31, 2010, and ii) administrative expense for $5,061 and amortization of $3,912 at the same date. |
| (2) | Includes mainly $2,490 of Hocol as an advance payment related to connection and access of the regional transmission facilities to EMSA, in Puerto Gaitán; $881 as resources for acquisition and maintenance of the vehicles assigned to top officers of Ecopetrol through a leasing handled pursuant to Contract No. 5201716 by Cavipetrol. |
| 9. | Property, Plant And Equipment, Net |
| | | 2010 | | | 2009 | |
| Plant and equipment | | $ | 15,916,349 | | | $ | 13,438,144 | |
| Construction in progress (1) | | | 6,955,251 | | | | 6,487,411 | |
| Agricultural plantations | | | 16,145 | | | | - | |
| Pipelines, networks and lines | | | 15,388,663 | | | | 13,171,399 | |
| Buildings | | | 3,362,595 | | | | 2,184,484 | |
| Equipment on deposit and in transit | | | 1,240,606 | | | | 1,221,822 | |
| Computer equipment | | | 343,633 | | | | 313,891 | |
| Transportation equipment and other fixed assets | | | 1,556,915 | | | | 389,728 | |
| Operating materials | | | 63,896 | | | | - | |
| Lands | | | 354,601 | | | | 302,420 | |
| Total | | | 45,198,654 | | | | 37,509,299 | |
| Accumulated depreciation | | | (21,868,192 | ) | | | (20,226,621 | ) |
| Provision for devaluation of property, plant and equipment (2) | | | (1,064,204 | ) | | | (500,175 | ) |
| Total | | $ | 22,266,258 | | | $ | 16,782,503 | |
| (1) | The representative amounts correspond to projects of Ecopetrol S.A such as the Castilla development; drilling projects of the Apiay and Yarigui wells – Direct Operation; drilling projects in the Rubiales field – Joint Operation; construction of the Chichimene Station; construction of the Pozos Colorados-Galan system, and the heavy crude oil transportation infrastructure. In the year 2010 costs were capitalized for $4,380,042, and the project for modernization of Cartagena Refinery for $1,995,138. |
Interest derived from payments of the syndicated loan and payable bonds destined for investment projects, net of financial revenues generated by the portion of pending disbursements, adding up to $179,156 and $194,787, respectively, were capitalized during 2010; Ocensa S.A capitalized $19,646.
| (2) | The provision for devaluation of property, plant and equipment is made up mainly by $890,607 of Ecopetrol S.A and $168,829 of the Cartagena Refinery, as the result of the appraisal performed on fixed assets. |
Below is the activity of the allowance for property, plant and equipment in each of the years ended December 31, 2010, 2009 and 2008:
| | | 2010 | | | 2009 | | | 2008 | |
| | | | | | | | | | |
| Initial balance | | $ | 500,175 | | | $ | 1,093,458 | | | $ | 105,118 | |
| Additions (new provisions) | | | 222,435 | | | | 144,431 | | | | 1,013,116 | |
| Provision from business combination | | | - | | | | - | | | | 770 | |
| Adjustment of existing provisions | | | (171 | ) | | | (714,605 | ) | | | (6,733 | ) |
| Reversal of prior years provision | | | (7,089 | ) | | | - | | | | - | |
| Recoveries | | | (54,816 | ) | | | (23,109 | ) | | | (18,813 | ) |
| Devaluation of assets before 2006 | | | 403,670 | | | | - | | | | - | |
| Ending balance | | $ | 1,064,204 | | | $ | 500,175 | | | $ | 1,093,458 | |
Ecopetrol S.A. and Subsidiaries
Notes to the Consolidated Financial Statements
Years ended December 31, 2010, 2009 and 2008
Summary of property, plant and equipment at December 31, 2010 is set forth below:
Type of asset | | Adjusted cost | | | Accumulated depreciation | | | Revaluations | | | Allowances | |
| Plant and equipment | | $ | 15,916,349 | | | $ | 9,774,126 | | | $ | 4,308,464 | | | $ | (408,265 | ) |
| Pipelines, networks and lines | | | 15,388,663 | | | | 9,946,601 | | | | 1,234,652 | | | | (353,284 | ) |
| Construction in progress | | | 6,955,251 | | | | - | | | | - | | | | - | |
| Agricultural Plantations | | | 16,145 | | | | | | | | | | | | | |
| Buildings | | | 3,362,595 | | | | 1,277,854 | | | | 1,544,947 | | | | (122,037 | ) |
| Equipment on deposit and in transit | | | 1,240,606 | | | | - | | | | - | | | | - | |
| Computer equipment | | | 343,633 | | | | 252,714 | | | | 39,448 | | | | (13,357 | ) |
| Transportation equipment and other fixed assets | | | 1,556,915 | | | | 616,897 | | | | 414,596 | | | | (165,542 | ) |
| Operating materials | | | 63,895 | | | | | | | | | | | | (1,574 | ) |
| Land | | | 354,601 | | | | - | | | | 1,833,015 | | | | (145 | ) |
| Total | | $ | 45,198,653 | | | $ | 21,868,192 | | | $ | 9,375,123 | | | $ | (1,064,204 | ) |
Summary of property, plant and equipment as of December 31, 2009:
Type of asset | | Adjusted cost | | | Accumulated depreciation | | | Revaluations | | | Allowances | |
| | | | | | | | | | | | | |
| Plants and equipment | | $ | 13,438,144 | | | $ | 9,410,022 | | | $ | 3,506,575 | | | $ | (347,839 | ) |
| Pipelines, networks and lines | | | 13,171,399 | | | | 9,373,243 | | | | 787,908 | | | | (71,262 | ) |
| Construction in progress | | | 6,487,411 | | | | - | | | | - | | | | - | |
| Buildings | | | 2,184,484 | | | | 966,755 | | | | 777,504 | | | | (67,442 | ) |
| Equipment on deposit and in transit | | | 1,221,822 | | | | - | | | | - | | | | - | |
| Computer equipment | | | 313,892 | | | | 239,540 | | | | 30,425 | | | | (5,636 | ) |
| Transportation equipment and other fixed assets | | | 389,727 | | | | 237,061 | | | | 96,802 | | | | (7,996 | ) |
| Land | | | 302,420 | | | | - | | | | 162,760 | | | | - | |
| Total | | $ | 37,509,299 | | | $ | 20,226,621 | | | $ | 5,361,974 | | | $ | (500,175 | ) |
There are no restrictions, pledges or bonds over these assets.
| 10. | Natural and Environmental Resources, Net |
| | | 2010 | | | 2009 | |
| Amortizable crude oil investments | | $ | 20,245,470 | | | $ | 16,574,494 | |
| Less: Accumulated amortization | | | (10,574,904 | ) | | | (8,756,267 | ) |
| | | | 9,670,566 | | | | 7,818,227 | |
| Plugging and abandonment, dismantling of facilities and environmental recovery costs | | | 3,074,552 | | | | 2,942,370 | |
| Less: Accumulated amortization | | | (1,443,451 | ) | | | (1,247,047 | ) |
| | | | 1,631,101 | | | | 1,695,323 | |
| Reservoirs and appraisals (1) | | | 701,590 | | | | 701,590 | |
| Less: Accumulated depletion | | | (612,310 | ) | | | (598,330 | ) |
| | | | 89,280 | | | | 103,260 | |
| Exploration in progress | | | 383,592 | | | | 1,538,571 | |
| Total (2) | | $ | 11,774,539 | | | $ | 11,155,381 | |
| (1) | These reserves were received from the reversals of concession contracts for $520,218 currently administered by Gerencia Sur and $181,372 by Magdalena Medio respectively. |
| (2) | The variance is affected by the developed reserves updated as of 2010 by recalculating the amortization of oil investments and abandonment costs, particularly in Rubiales, Cusiana, Guatiquía, Castilla, Petrólea and Pauto. |
Ecopetrol S.A. and Subsidiaries
Notes to the Consolidated Financial Statements
Years ended December 31, 2010, 2009 and 2008
| | | 2010 | | | 2009 | |
| Deferred income tax | | $ | 1,492,942 | | | $ | 1,408,659 | |
| Other deferred charges, net (1) | | | 497,826 | | | | 419,342 | |
| Charges of deferred monetary correction, net | | | 49,372 | | | | 58,528 | |
| | | $ | 2,040,140 | | | $ | 1,886,529 | |
| (1) | Includes the investments made in execution of the Business Cooperation Contract entered into by Ecopetrol and Schlumberger, the purpose of which is to obtain incremental production in the Casabe field; such investments are amortized based on the field's technical production units. |
| | | 2010 | | | 2009 | |
| Goodwill (1) | | $ | 2,508,402 | | | $ | 2,507,552 | |
| Deposits held in trust | | | 294,899 | | | | 258,745 | |
| Intangibles: Trademarks, licenses, patents, software | | | 129,610 | | | | 96,027 | |
| Trust funds (2) | | | 80,490 | | | | 83,342 | |
| National Royalties Fund (3) | | | 79,653 | | | | 76,185 | |
| Other assets (4) | | | 58,552 | | | | 12,847 | |
| | | $ | 3,151,606 | | | $ | 3,034,698 | |
| (1) | Goodwill corresponds to Ecopetrol S.A. and is comprised by: |
| | i) | $582,280 (2009 - $621,099) to the net amount between goodwill paid and the monthly amortization as of December 31, 2010 of $103,335 (2009 - $64,516), relating to the acquisition of Andean Chemicals Ltd and Polipropileno del Caribe S. A., with an estimated amortization term of 17 years and 8 months determined based on the net present value of the investment reduced by the amount of the estimated future cash flows from the time of acquisition. |
| | ii) | $711,667 (2009 - $773,492) to the purchase of Offshore International Group, which is subject to the adjustments that may arise to the purchase price, with an estimated term for amortization of 14 years, determined based of the valuation of the reserves in block Z2B, the only block from the time of acquisition. |
| | At December 31, 2010, the amount payable for $284,583 (equivalent to US$148.7 million) estimated for the contractually established adjustments in the purchase price based on the WTI crude oil average price, recognized as the greater value of the goodwill. |
| | Amortization accumulated as of December 31, 2010, amounts to $76,376 (2009 - $48,502). |
As a result of the commercial credit analysis conducted by Offshore International Group Inc. as of December 31, 2010, Ecopetrol recorded, with charge to results, $287.7 billion as goodwill impairment.
| | iii) | $471,449 (2009 - $507,255) generated as a result of the purchase of IPL Enterprises (now Ecopetrol Transportation Company) with an estimated term for amortization of 15 years determined based on Ocensa’s outstanding contractual agreements as of the date of the negotiation. The cumulative amortization as of December 31, 2010 amounts to $65,645 (2009 - $29,839). |
| | iv) | $743,006 (2009 - $605,706) corresponding to the acquisition of Hocol Petroleum Limited with an estimated term for amortization of 16 years determined based on the net present value of the estimated future cash flows from the time of acquisition |
| | As of December 31, 2010, the contractually established adjustments in the purchase price based on the WTI crude oil average price and on the exploratory results of the Huron well, for $176,590, were recognized as the greater value of the goodwill. |
The amortization accumulated as of December 31, 2010 amounts to $62,039 (2009 - $22,750)
| (2) | Includes (i) Contributions and share in amount of $66,853 into the National Hydrocarbons Fund created to support future hydrocarbon investment, exploration and production contracts in minor fields, projects managed by the private equity fund of Hydrocarbons of Colombia, (ii) Contributions of $4,099 to the Procuraduria Fund created for general benefit projects in municipalities near the Cicuco field under the Company’s direct operation: Cicuco, Mompox and Talaigua Nueva (the objective of the fund is to disburse the amounts according to each project development, which will be carried out by the municipalities through agreements with Incoder and the Ministry of Environment) and (iii) Contributions of $9,538 to the Colpet, Condor and Sagoc Fund for possible contingencies in the liquidation of these former subsidiaries. |
Ecopetrol S.A. and Subsidiaries
Notes to the Consolidated Financial Statements
Years ended December 31, 2010, 2009 and 2008
| (3) | Corresponds to the FAEP deposits to the National Royalties Fund in favor of Ecopetrol. Its sole purpose is the payment of debts and financing for development projects and programs in hydrocarbon producing and non-producing municipalities and departments. Ecopetrol disburses amounts after the Ministry of Finance issues the corresponding approvals. |
| (4) | Includes restricted funds in amount of $37,304 (2009 - $11,815) mainly represented by legal deposits destined to attend labor, civil and tax claims. |
Financial obligations at December 31, 2010 are composed of:
| | | 2010 | | | 2009 | |
| Short-term | | | | | | |
| Foreign currency debt | | $ | 226,726 | | | $ | 101,968 | |
| Issued bonds | | | 133,285 | | | | - | |
| Local currency debt (1) | | | 719,158 | | | | 335,113 | |
| Total Short-term | | | 1,079,169 | | | | 437,081 | |
| Long-term | | | | | | | | |
| Local currency debt (1) | | | 3,962,745 | | | | 2,648,009 | |
| Issued bonds (3) | | | 1,000,000 | | | | 3,052,500 | |
| Foreign currency debt(2) | | | 2,870,970 | | | | 13,845 | |
| Total Long-term | | | 7,833,715 | | | | 5,714,354 | |
| Total | | $ | 8,912,884 | | | $ | 6,151,435 | |
| (1) | Includes mainly the syndicated loan with eleven local banks for an initial amount of $2,220,200, destined to finance investment programs of Ecopetrol S. A. The conditions applicable to this loan are the following: |
Term: 7 years, including a 2 year grace period.
Payment of interest: Starting November 2009
Rate: DTF + 4% (anticipated quarterly rate)
Amortization: Every six months
Guarantee: Ecopetrol granted a closed security over the stock shares owned either directly or indirectly on the following companies, thus reaching a 120% coverage of the credit amount. The value of the stock shares for each entity is as follows:
| Company | | Amount | |
| Oleoducto Central S.A. | | $ | 1,110,035 | |
| Refinería de Cartagena S.A. | | | 1,274,796 | |
| Polipropileno del Caribe S.A. | | | 279,409 | |
| Total | | $ | 2,664,240 | |
The only debt covenant, which requires that the book value of the stock shares be greater than $2,220,200, was met.
| (2) | On July 23, 2009, the Company issued pursuant to Rule 144A/Regulation S US$ 1.5 billion, of 7.625% unsecured and unsubordinated notes, due in 2019 with registration rights. The notes were later registered and listed on the New York Stock Exchange with the Securities and Exchange Commission of the United States. |
The terms of the notes are follows:
Coupon interest rate: 7.625%
Make whole on optional redemption: 50 basis point over equivalent U.S. Treasury Securities. Interest payment dates: July 23 and January 23 of each year, starting January 23, 2010. Maturity date: July 23, 2019
Denomination: US$1,000 / US$1,000
Ecopetrol S.A. and Subsidiaries
Notes to the Consolidated Financial Statements
Years ended December 31, 2010, 2009 and 2008
Likewise, the company is obliged to comply will covenants among which are the due and timely payment of principal and interests; the restriction on the creation of collateral guaranties by part of Ecopetrol and its subsidiaries with the exception of certain collateral guaranties duly authorized, and the obligation for presenting a purchase offer for the bonds in the event of a repurchase situation due to change of control, pursuant to the definitions of the issue documents.
| (3) | Through Resolution No. 3150 of October 20, 2010, Ecopetrol S. A. was authorized by the Ministry of Finance and Public Credit to issue, subscribe and place internal government debt bonds for up to one billion pesos, aimed at financing the Investment Plan of Ecopetrol in 2010. Subsequently, through Resolution No. 2176 of November 11, 2010, the Company obtained authorization from the Superintendency of Finance to register its internal government debt bonds with the National Register of Securities and Issuing Agencies and to place its public offering. |
Results of the issuing and placing of internal government debt bonds:
Placed sum : 1 billion pesos
Amortization: upon maturity
Date of issue: December 1, 2010
Series A: Bonds in pesos with a CPI-based variable rate
| | |
| Redemption Term | | 5 years | | | 7 years | | | 10 years | | | 30 years | |
| Rate | | IPC + 2.80 | % | | IPC + 3.30 | % | | IPC + 3.94 | % | | IPC + 4.90 | % |
| Sum (millions) | | $ | 97,100 | | | $ | 138,700 | | | $ | 479,900 | | | $ | 284,300 | |
| 14. | Accounts Payable and Transactions with Related Parties |
| Short-term | | 2010 | | | 2009 | |
| Suppliers | | $ | 1,762,461 | | | $ | 1,207,724 | |
| Advances from Partners | | | 713,405 | | | | 555,620 | |
| Purchase of hydrocarbons from the Agencia Nacional de Hidrocarburos-ANH | | | 554,381 | | | | 441,533 | |
| Deposits received from third parties | | | 521,781 | | | | 817,937 | |
| Other payables | | | 442,115 | | | | 109,952 | |
| Reimbursement of exploratory costs | | | 65,028 | | | | 141,775 | |
| Dividends payable (1) | | | 3,431 | | | | 3,510 | |
| Insurance and reinsurance payable | | | - | | | | 2,181 | |
| Total Short-term | | $ | 4,062,602 | | | $ | 3,280,232 | |
| Long-term | | | | | | | | |
| Other payable (2) | | | 504,046 | | | | 51,154 | |
| Total Long-term | | $ | 504,046 | | | $ | 51,154 | |
| (1) | Corresponds to dividends payable to shareholders whose installment payment for the purchase of their stock are in arrears and whose economic and political rights have been suspended, pursuant to Article 397 of the Commercial Code, and will be restored once the installment payments are brought up to date. |
| (2) | Corresponds to Fiduciary Duty for ODL Finance in order to complete the funds required to leverage expansion projects. |
| | | | | | | |
| | | 2010 | | | 2009 | |
| Income tax and other taxes | | $ | 3,175,500 | | | $ | 1,940,756 | |
| Income and VAT withholdings | | | 197,294 | | | | 194,217 | |
| Special tax and surcharge on gasoline (1) | | | 110,128 | | | | 124,667 | |
| Sales tax payable | | | 47,418 | | | | 49,675 | |
| Industry and commerce and other minor taxes | | | 58,923 | | | | 123,707 | |
| Total | | $ | 3,589,263 | | | $ | 2,433,022 | |
| (1) | This tax is levied on sales and/or consumption of regular and premium gasoline and diesel. The funds collected for this tax are paid to the National Treasury Office of the Ministry of Finance and/or regional entities. The special tax is paid on the basis of the percentage participation of each beneficiary in the national monthly consumption of regular and premium gasoline. |
Ecopetrol S.A. and Subsidiaries
Notes to the Consolidated Financial Statements
Years ended December 31, 2010, 2009 and 2008
Income tax provision
| | | 2010 | | | 2009 | | | 2008 | |
Current income tax | | $ | 3,201,041 | | | $ | 1,948,819 | | | $ | 3,611,020 | |
| Deferred tax: | | | | | | | | | | | | |
| Asset | | | (100,899 | ) | | | (69,230 | ) | | | 494,757 | |
| Liability | | | 138,508 | | | | 234,440 | | | | 276,205 | |
| | | $ | 37,609 | | | $ | 165,210 | | | $ | 770,962 | |
| | | $ | 3,238,650 | | | $ | 2,114,029 | | | $ | 4,381,982 | |
The deferred tax asset arises mainly from timing differences between the accounting balances and the amounts accepted for tax purposes. The deferred tax asset is calculated based on the value of accounting provisions not accepted for tax purposes which are deductible at the time of their utilization, and the value of asset inflation adjustments originated from 2004 to 2006. The deferred tax liability results from the differences in the policy for amortization of crude oil investments which for accounting purposes are amortized by technical units of production whereas for tax purposes are amortized through the straight-line method; from the difference in the method of valuation of fixed income investment, which for accounting purposes are valued at the market price, while for tax purposes are valued by the straight-line method; and from the difference in the amortized value of the goodwill that for tax purposes was accelerated in 2010.
Income tax returns may be reviewed by the tax authorities within two years of their filing date. At this date, the terms of filings for the years 2008 and 2009 are open for review.
Currently, differences exist with the National Tax and Customs Administration (DIAN) regarding the calculation and payment method of the first installment of the 2004 income tax returns because in the opinion of the DIAN the surtax of such years should have been included in the base. The result of this proceeding will not affect the Company’s cash flow since the amounts under discussion have been directly compensated by the DIAN by positively adjusting the Company’s balances with adjustments the Company had previously requested in unrelated cases.
The balance of the deferred tax asset and liability is as follows:
| | | 2010 | | | 2009 | |
| Deferred tax asset: | | | | | | |
| Initial balance | | $ | 1,408,659 | | | $ | 1,285,648 | |
| Additions (*) | | | 88,417 | | | | 69,230 | |
| Incorporated subsidiaries balance | | | - | | | | 53,781 | |
| Final balance | | $ | 1,497,076 | | | $ | 1,408,659 | |
| Deferred tax liability: | | | | | | | | |
| Initial balance | | $ | 1,194,848 | | | $ | 944,816 | |
| | | 138,508 | | | | 234,438 | |
| Incorporated subsidiaries balance | | | - | | | | 15,594 | |
| Final balance | | $ | 1,333,356 | | | $ | 1,194,848 | |
(*) The difference between the increase noted for 2010 for deferred tax assets and the value recorded in the income statement as deferred tax expense (income), is due to a correction recorded by Ecopetrol del Peru for an error detected in the previous year income tax adjustments.
The reconciliation between the accounting income and the net taxable income which is the basis for the income tax is shown below for illustrative purposes since Colombian regulations do not either require or allow filing an income tax return on a consolidated basis:
Ecopetrol S.A. and Subsidiaries
Notes to the Consolidated Financial Statements
Years ended December 31, 2010, 2009 and 2008
| | | 2010 | | | 2009 | | | 2008 | |
| Income before income taxes | | $ | 11,492,617 | | | $ | 7,250,844 | | | $ | 16,011,204 | |
| Monetary correction gain | | | (1,921 | ) | | | (3,471 | ) | | | 25,300 | |
| Effect of tax inflation adjustment | | | (99,527 | ) | | | 108,615 | | | | (87,788 | ) |
| Non deductible costs and expenses | | | 2,184,555 | | | | 1,256,081 | | | | 813,248 | |
| Special deductions and deductible tax expenses | | | (3,796,230 | ) | | | (3,291,472 | ) | | | (2,837,230 | ) |
| Other taxable income | | | 158,949 | | | | 182,199 | | | | 1,085,307 | |
| Income not constituting income or capital gains | | | (160,600 | ) | | | (126,460 | ) | | | (907,847 | ) |
| Non taxable income | | | (1,037,204 | ) | | | (727,029 | ) | | | (1,185,857 | ) |
| Non deductible provisions | | | 681,644 | | | | 574,403 | | | | 243,623 | |
| Income pension trusts | | | (96,695 | ) | | | - | | | | - | |
| Non taxable trust funds yields | | | 1,001,082 | | | | (250,265 | ) | | | (890,538 | ) |
| Net exempt income | | | (199,949 | ) | | | (29,540 | ) | | | (1,372,083 | ) |
| Excess of presumptive over ordinary income | | | 65,578 | | | | 403,226 | | | | - | |
| Net effect of consolidation of taxable income | | | (814,687 | ) | | | (443,949 | ) | | | 75,269 | |
| Net taxable income | | $ | 9,377,612 | | | $ | 4,932,722 | | | $ | 10,972,608 | |
| Net current income tax | | $ | 3,201,041 | | | $ | 1,948,819 | | | $ | 3,611,020 | |
The 2010 effective consolidated tax rate was 28.2% (2009 – 29.2%). The difference between net taxable income and accounting income is mostly affected by the benefit from special deductions on investment in real productive fixed assets, which is equivalent to 30% of the actual investment made during the fiscal year (40% up to 2009). It is important to clarify that if such assets are transferred or no longer used in the income producing activity prior to the maturity of their use lives, it shall be mandatory for the Company to reimburse the proportional value of the deduction requested in the income tax return, in the respective year of occurrence of such event.
As of 2004, income tax payers performing transactions with foreign related or associated parties and / or residents in countries considered tax havens, shall be obliged, for income tax purposes, to determine their ordinary and extraordinary revenues, their costs and deductions, and their assets and liabilities considering for these transactions the market prices and profit margins.
Based on the opinion of the external advisors of the Company, no significant changes are foreseen for taxable year 2010 regarding compliance with the full free competition principle stated in Article 260-1 of the Tax Statute, neither adjustments are expected for the determination of the Company's income tax expense in such year.
| | | 2010 | | | 2009 | |
| Short-term | | | | | | |
| Vacations | | $ | 63,217 | | | $ | 47,061 | |
| Bonuses and allowances(1) | | | 26,487 | | | | 57,022 | |
| Severance | | | 39,828 | | | | 42,598 | |
| Salaries and pensions payable | | | 24,712 | | | | 13,078 | |
| Interest on severance | | | 3,884 | | | | 3,347 | |
| Others | | | 2,119 | | | | 2,357 | |
| Total short-term | | | 160,247 | | | | 165,463 | |
| Long-term | | | | | | | | |
| Health and education actuarial liabilities (2) | | | 2,729,318 | | | | 2,583,117 | |
| Retirement pensions joint operations | | | 76,725 | | | | 77,826 | |
| Others | | | 7,978 | | | | 8,388 | |
| Total Long-term | | | 2,814,021 | | | | 2,669,331 | |
| Total | | $ | 2,974,268 | | | $ | 2,834,794 | |
| (1) | The reduction effect in some fringe benefits is derived from payment of the termination benefits to 685 active employees who retired in 2010, using the $4.5 billion retirement bonus provision. The 2009 balance included a $30 billion provision for payment of the variable compensation bonus to employees in 2010. At December 31, 2010, this provision was not recorded, as the targets to obtain the benefit were not met. |
Ecopetrol S.A. and Subsidiaries
Notes to the Consolidated Financial Statements
Years ended December 31, 2010, 2009 and 2008
| (2) | The health and education actuarial calculations were based on the new Mortality Tables replaced in 2010. As a result of the change in the amortization accounting principle, the increase in the health actuarial obligation calculation amounted to $806,807, which will be amortized over 5 years as of 2010. Up to 2009, the annual increase was recorded as period expense as the actuarial calculation was 100% amortized. The education actuarial liability is 100% amortized and its reduction in 2010 was recorded as income for the period. |
The amortized health actuarial liability is indicated below:
| | Item | | 2010 | | | 2009 | |
| | Health obligation actuarial calculation | | $ | 2,884,559 | | | $ | 2,077,752 | |
| | Less – Actuarial calculation pending amortization | | | (645,445 | ) | | | - | |
| | Amortized actuarial liabilities | | $ | 2,239,114 | | | $ | 2,077,752 | |
The health and education actuarial calculations were prepared using a 4.8% technical interest rate. The variations in the amortized actuarial liability are described below:
| | | 2010 | | | 2009 | | | Variation | |
| Health | | | | | | | | | |
| Active personnel | | $ | 302,553 | | | $ | 287,909 | | | $ | 14,644 | |
| Pensioned retirees | | | 1,936,560 | | | | 1,789,843 | | | | 146,717 | |
| Education | | | | | | | | | | | | |
| Active personnel | | | 104,606 | | | | 104,951 | | | | (345 | ) |
| Pensioned retirees | | | 385,599 | | | | 400,414 | | | | (14,815 | ) |
| Totals | | $ | 2,729,318 | | | $ | 2,583,117 | | | $ | 146,201 | |
A summary of personnel covered by the actuarial calculation for 2010 and 2009 is set below:
| | | Headcount | |
| | | 2010 | | | 2009 | |
| Health care and education reserve (active and pensioned retirees) | | $ | 18,337 | | | $ | 17,901 | |
| 17. | Estimated Liabilities and Provisions |
| | | 2010 | | | 2009 | |
| Short-term | | | | | | |
| Provision for legal proceedings (1) (See Note 30) | | $ | 663,932 | | | $ | 680,022 | |
| Other provisions | | | 206,179 | | | | 192,631 | |
| Provision for pension obligations (2) | | | 102,478 | | | | 180,797 | |
| Provisions for contingencies (3) | | | 39,602 | | | | 96,859 | |
| Provision for abandonment costs (4) | | | 139,106 | | | | 4,106 | |
| Short-term Total | | $ | 1,151,297 | | | $ | 1,154,415 | |
| Long- term | | | | | | | | |
| Provision for abandonment, dismantling of facilities and environmental recovery costs (4) | | | 2,995,281 | | | | 3,013,097 | |
| Provision for royalties (5) | | | 391,021 | | | | 380,933 | |
| Other provisions | | | 12,301 | | | | 17,947 | |
| Long-term Total | | | 3,398,603 | | | | 3,411,977 | |
| Total | | $ | 4,549,900 | | | $ | 4,566,392 | |
| (1) | The movement of the provisions for legal proceedings is the following during the years 2009 and 2010 : |
| | | Number of cases | | | Provisions amount | |
| Initial balance as of December 2008 | | | 603 | | | $ | 547,942 | |
| Additions (new provision) | | | 252 | | | | 36,714 | |
| Adjustments to existing provisions | | | (135 | ) | | | 122,691 | |
| Recoveries | | | (29 | ) | | | (27,325 | ) |
| Initial balance as of December 2009 | | | 691 | | | | 680,022 | |
| Additions (new provisions) | | | 235 | | | | 63,020 | |
| Adjustments to existing provisions | | | - | | | | 19,320 | |
| Reincorporation for transfer of processes | | | 76 | | | | 43,548 | |
| Finished processes | | | (141 | ) | | | (80,237 | ) |
| Transfer of processes | | | (39 | ) | | | (61,741 | ) |
| Ending balance as of December 2010 | | | 822 | | | $ | 663,932 | |
Ecopetrol S.A. and Subsidiaries
Notes to the Consolidated Financial Statements
Years ended December 31, 2010, 2009 and 2008
| (2) | Corresponds to the estimated pending pension contributions of employees who joined Ecopetrol after January 29, 2003 (Law 797 of 2003) and until the first quarter of 2004, who were covered by the General Pension Regulations. In addition the provision for the contingency of losing legal actions for the protection of labor related rights. |
| (3) | It is comprised by $22,973 for probable payment claims from PDVSA for the cleaning and decontamination tasks at Maracaibo lake in Venezuela ; $14,850, related to spillages with environmental impact; $500 related to the retirement bonus for Hocol S.A. personnel, still in process; $560 related to the success commission payable to the attorney in law attending the suit filed by Industrias Crizasa against Ecopetrol S. A., and $719 related to potential liabilities in arbitration decisions. |
| (4) | The Production Vice-Presidency of Ecopetrol carried out the update to June 2010 of the estimated costs of abandonment, dismantling of facilities and environmental recovery. Variation in regard to December 2009 for $160,454 includes the effect from foreign currency exchange in the amount of $818; and the use of liabilities related to the abandonment of wells in the amount of $32,131. Within these, the most representative fields are: Casabe $9,966; Tibú $5,944, Lisama $3,525 and Cusiana $3,237. |
Below are the movements of the provisions for the abandonment cost, facility dismantling, and environmental recovery costs; the balance is shared by Ecopetrol S.A $3,068 billion, Hocol $52 billion, and Ecopetrol America Inc. $14 billion for the years 2010, 2009 and 2008:
| | | 2010 | | | 2009 | | | 2008 | |
| Initial Balance | | $ | 3,017,203 | | | $ | 1,964,756 | | | $ | 1,528,374 | |
| Retirements and other | | | (27,414 | ) | | | (21,964 | ) | | | (2,853 | ) |
| Additions | | | 282,229 | | | | 1,188,670 | | | | 54,418 | |
| Changes in estimation | | | - | | | | 80,243 | | | | 208,131 | |
| Transfer to short term | | | (136,151 | ) | | | - | | | | - | |
| Exchange rate effect | | | (1,480 | ) | | | (194,502 | ) | | | 176,686 | |
| Final Balance | | $ | 3,134,387 | | | $ | 3,017,203 | | | $ | 1,964,756 | |
* For 2010, the policy for recording liabilities related to abandonment costs, which was made in dollars, was changed to recognition in Colombian pesos, since most of the scheduled payments (above 70%) are in pesos. Had the dollar recording process continued, the “estimated” effect of the exchange difference for 2010 would have been a reduction of $186.9 billion (representing 6%, of total estimated liabilities) and $27 billion in results as an effect of less amortization, which represents 14.5% of total amortized abandonment costs and 0.3% of net income.
| (5) | Includes the provision to cover the claim from the Community of Santiago de las Atalayas and Pueblo Viejo of Cusiana, originated in Royalties Contracts N. 15, 15ª and 16 and 16ª executed with Ecopetrol, but declared null and void by the Council of State. From said amount, $90,752 corresponds to the amount initially recognized by Ecopetrol, together with the valuation of the fund where the amounts are invested and $300,269 of interest generated. The ruling on the extraordinary appeal presented by the Community is pending. |
| 18. | Other Long-Term Liabilities |
| | | 2010 | | | 2009 | |
| Deferred income tax liability | | $ | 1,333,356 | | | $ | 1,194,848 | |
| Advances received from Ecogas for BOMT obligations | | | 799,950 | | | | 996,787 | |
| Credit for deferred monetary correction | | | 169,048 | | | | 200,230 | |
| Other liabilities (1) | | | 59,907 | | | | 339,355 | |
| Total | | $ | 2,362,261 | | | $ | 2,731,220 | |
| | (1) | Includes $42,118 from Hocol for remittance tax. |
Ecopetrol S.A. and Subsidiaries
Notes to the Consolidated Financial Statements
Years ended December 31, 2010, 2009 and 2008
| 19. | Non-Controlling Interest |
| | | 2010 | | | 2009 | | | % of other shareholders 2010 | |
| Oleoducto Central S.A. | | $ | 232,244 | | | $ | 684,054 | | | | 40 | |
| ODL Finance S.A. | | | 153,810 | | | | 147,621 | | | | 35 | |
| Oleoducto de Colombia | | | 95,856 | | | | 97,940 | | | | 34.43 | |
| Bioenergy S.A. | | | 11,550 | | | | 11,696 | | | | 11.4 | |
| Oleoducto Bicentenario S.A.S | | | (7,509 | ) | | | - | | | | 44 | |
| Total | | $ | 485,951 | | | $ | 941,311 | | | | | |
| | | 2010 | | | 2009 | |
| Authorized capital | | $ | 15,000,000 | | | $ | 15,000,000 | |
| Capital to be subscribed | | | (4,881,872 | ) | | | (4,881,872 | ) |
| Subscribed Capital | | | 10,118,128 | | | | 10,118,128 | |
| Subscribed capital pending payment | | | - | | | | (337 | ) |
| Subscribed and paid-in capital | | | 10,118,128 | | | | 10,117,791 | |
| Additional paid-in capital | | | 4,721,700 | | | | 4,721,457 | |
| Additional paid-in capital receivable | | | (1,192 | ) | | | (1,137 | ) |
| Additional paid-in capital | | | 4,720,508 | | | | 4,720,320 | |
| Surplus from revaluations | | | 11,068,676 | | | | 6,391,417 | |
| Devaluation of assets | | | (701,694 | ) | | | (298,024 | ) |
| Responsibilities from pending rulings | | | (781 | ) | | | (781 | ) |
| Effects of RCP application | | | (702,475 | ) | | | (298,805 | ) |
| Net income | | | 8,146,471 | | | | 5,132,054 | |
| Legal reserve | | | 4,117,020 | | | | 3,591,397 | |
| Appropriation for investment programs | | | 2,615,718 | | | | 1,568,107 | |
| Accounting clearance | | | 17,804 | | | | 17,804 | |
| Surplus from equity method | | | 1,377,240 | | | | 1,287,118 | |
| Incorporated institutional equity | | | 139,548 | | | | 137,725 | |
| Foreign exchange conversion adjustment | | | (290,457 | ) | | | (94,971 | ) |
| Total equity | | $ | 41,328,181 | | | $ | 32,569,957 | |
Subscribed and Paid-in-Capital
The authorized capital of Ecopetrol is $15,000,000 divided into 60,000,000,000 common shares, with $250 par value each, of which 40,472,512,588 shares have been subscribed, represented by 10.1% held by private shareholders and 89.9% held in Colombia. The value of shares under reserve amounts to $4,881,872, represented by 19,527,487,412 common shares.
Additional paid-in capital
Additional paid-in capital corresponds to (i) the excess over par value in the sale of shares during the 2007 initial public offering for $4,700,882 and (ii) to the value resulting in the new shares offering for the secondary market equal to $20,817 which resulted from foreclosing of guarantees of delinquent debtors pursuant to Article 397 of the Commerce Code.
Effects of RCP application
Corresponds to the transfer of negative balances originated from the devaluation of property, plant and equipment required by RCP since 2008.
This line-item also includes responsibilities from pending rulings related to inventory losses, as required by RCP.
Ecopetrol S.A. and Subsidiaries
Notes to the Consolidated Financial Statements
Years ended December 31, 2010, 2009 and 2008
Legal Reserve
The legal reserve is set up with 10% of net income and it may be used to absorb losses or to be distributed at the liquidation of the Company.
The Company’s 2009 financial results were available at the General Shareholders’ Meeting which took place on March 25, 2010. The Company’s Shareholders decided to increase the legal reserve by $525,624 to $4,117,020.
The reserves also include $609,334 in occasional reserves for new explorations and $438,276 in reserves for profits not realized from Ecopetrol’s subsidiaries.
Incorporated Institutional Equity
Incorporated Institutional Equity corresponds primarily to the commerciality of Nare, Matambo, Garcero, Corocora, Estero, Caracara, for the Sardinas 6, Remache Norte 3, Abejas 3, Jaguar T5 and T6, Orocué, Guarilaque 7 wells, Campo Rico for the Candalay, Jordan 5, Remache Norte 2 and 5, Abejas 2 and Vigia Wells, and the incorporation of the Cocorná material warehouse.
| | | 2010 | | | 2009 | |
| Debtor / Rights | | | | | | |
| Exploitation Rights - Decree 727 of 2007 (1) | | $ | 72,619,793 | | | $ | 46,503,863 | |
| Other contingent rights and debtor accounts (2) | | | 15,562,589 | | | | 11,480,671 | |
| Costs and expenses (deductible and non-deductible) | | | 14,027,907 | | | | 14,736,354 | |
| Pension Trust funds (3) | | | 11,202,556 | | | | 10,971,723 | |
| Securities given in custody and guarantee | | | 4,290,149 | | | | 3,045,181 | |
| Execution of investment projects | | | 751,827 | | | | 780,040 | |
| Legal proceedings | | | 584,774 | | | | 441,675 | |
| Total | | | 119,039,595 | | | | 87,959,507 | |
| Creditor / Obligations | | | | | | | | |
| Legal proceedings | | | 32,228,241 | | | | 2,283,219 | |
| Goods received in custody (4) | | | 17,981,352 | | | | 7,949,960 | |
| Contractual guarantees (5) | | | 14,864,210 | | | | 12,420,129 | |
| Pension trust funds | | | 10,861,969 | | | | 10,899,026 | |
| Non-tax liabilities | | | 6,817,853 | | | | 5,205,671 | |
| Other contingent obligations (6) | | | 7,096,874 | | | | 3,403,368 | |
| Potential obligation – pension liabilities (7) | | | 1,603,998 | | | | - | |
| Non-taxable income | | | 1,555,073 | | | | 5,826,947 | |
| Mandate contracts (8) | | | 1,433,804 | | | | 1,460,073 | |
| Assets and rights received in guarantee (9) | | | 1,220,162 | | | | - | |
| Administration Funds - Dec 1939 of 2001 and 2652 of 2002 | | | 964,872 | | | | 972,641 | |
| Future BOMT payments | | | 352,615 | | | | 504,288 | |
| Total | | | 96,981,023 | | | | 50,925,322 | |
| | | $ | 216,020,618 | | | $ | 138,884,829 | |
| (1) | This value corresponds to Ecopetrol´s exploration and production rights, recognized in accordance with Decree 727 of 2007, valued as of December 31, 2010 and 2009 based on the volumes of the audited reserves study and applying the average price determined in accordance with the SEC methodology. |
| (2) | Balance of the tax memorandum accounts groups the differences between the values of both equity and results accounts taken from the tax return for 2009 and the accounting balances. Differences correspond to concepts such as revaluations and provisions not accepted by tax regulations, the difference in the method for amortization of crude oil investments which for accounting purposes is made by production units and for tax purposes by the straight-line method, and the effect of the generated inflation adjustment, among others. |
| (3) | Reflects the contingent right (debt account) for resources allocated to the Pension Autonomous Equity, for payment of the commuted pension liability, in order to control the existence of liquid resources in the autonomous equity. The commuted value (transferred) as of December 31, 2010, amounts to $11,202,556 (on commuting date at December 31, 2008 - $10,092,528), corresponds to the pension liability by pension monthly payments, parties installments and pension bonuses; health and education related items are within the pension liability of Ecopetrol. The destination of commuted resources, as well as their yield, cannot be changed, nor returned to the Company before complying in full with all pension liabilities. |
Ecopetrol S.A. and Subsidiaries
Notes to the Consolidated Financial Statements
Years ended December 31, 2010, 2009 and 2008
A detail of the trust funds is set forth below:
| | | 2010 | | | 2009 | |
| Consorcio Fiducafé - Fiduprevisora - Fidupetrol | | $ | 2,349,054 | | | $ | 2,299,552 | |
| Consorcio Fiducolombia - Santander Investment | | | 2,206,364 | | | | 1,622,860 | |
| Consorcio Fidupopular - Fiduoccidente | | | 2,061,664 | | | | 2,032,621 | |
| Consorcio BBVA - Fidubogotá - Corficolombiana | | | 1,929,035 | | | | 1,331,711 | |
| Consorcio Fidubogotá - Fiducolpatria | | | 1,328,292 | | | | 2,378,039 | |
| Consorcio Fiduagraria - Fiducoldex - Helm Trust | | | 1,328,147 | | | | 1,306,940 | |
| Total | | $ | 11,202,556 | | | $ | 10,971,723 | |
| (4) | Comprises royalties corresponding to the balance of Ecopetrol reserves of $17,912 billion, calculated at SEC prices. In addition, the balance is represented by the inventory of products sold, the delivery of which is pending, in the amount of $68.3 billion, and inventory of materials on consignment for own consumption at the various plants, in the amount of $293. |
On March 7, 2007, Decree 727 to replace Decree 2625 of 2000 was issued, which includes regulations related to the valuation of reserves and the posting of State owned hydrocarbon reserves in the Financial Statements of the Company. Furthermore, the decree stipulates the posting of hydrocarbon exploration or production rights owned. This is posted under Memorandum Accounts pursuant to the opinion given by the CGN; nonetheless, the Memorandum Accounts are not part of the Company’s Balance Sheet.
| (5) | Comprises contracts ending execution and entered into in pesos, dollars and Euros, updated to the market representative rate as of December 31, 2010 for $14,223,368; stand-by letters of credit, which guarantee the contracts subscribed to by Ecopetrol in the amount of $433,469, and documentary letters for $203,890. |
| (6) | Includes mainly the closed pledge for $2,664,240 on the shares owned by Ecopetrol S.A., directly or indirectly, in Oleoducto Central, Refinería de Cartagena S. A. and Polipropileno del Caribe S. A., guaranteeing 120% of the amount of the syndicated loan granted by the local banks. (See Note 14). |
| (7) | Comprises the actuarial calculation value of monthly pension payments, pension quotas, parts and bonuses as of December 31, 2009, plus the amortized portion of the increase in the 2010 actuarial calculation. As a result of the change in the amortization accounting principle under Colombian GAAP in 2010, the $2,004 billion increase of the actuarial calculation will be amortized over 5 years as of 2010. |
The balance of the amortized actuarial liability is comprised as follows:
| | Item | | 2010 | | | 2009 | |
| | Actuarial calculation of monthly pension payments and bonuses | | $ | 12,465,967 | | | $ | 10,899,026 | |
| | Less – Actuarial calculation pending amortization | | | (1,603,998 | ) | | | - | |
| | Amortized actuarial liabilities | | $ | 10,861,969 | | | $ | 10,899,026 | |
The balance of pension autonomous equity funds as of December 31, 2010 exceeds the total amortized actuarial calculation as of December 31, 2010 by $340,587. Therefore, the Company did not record costs for monthly pension payments and bonuses, neither was it necessary to make additional fund transfers during 2010.
The balance of pension autonomous equity, the value of the actuarial calculation and the amortized value of pension liability by monthly payment is included in memorandum accounts.
The actuarial calculation was prepared using a 4% technical interest rate. The growth of salaries, pensions in cash and pensions in kind was calculated using the inflation average rate calculated by DANE, the National Statistics Administrative Department, during the three-year period preceding the year of calculation.
Breakdown of personnel covered in the actuarial calculation updated as of December 31, 2010:
| | Item | | Number of people | |
| | Bonus reserve – retired personnel | | | 9,845 | |
| | Bonus reserve – personnel to be retired after 2010 | | | 2,967 | |
| | Pension reserve (active and retirees) | | | 13,357 | |
Ecopetrol S.A. and Subsidiaries
Notes to the Consolidated Financial Statements
Years ended December 31, 2010, 2009 and 2008
| (1) | Includes the value of assets received in custody from Refinería de Cartagena S. A., to fulfill obligations acquired by virtue of the mandate agreement subscribed to between the Company and this corporation for the operation of the refinery. |
| (2) | Corresponds to the guarantees given by BP Exploration Company resulting from the purchase transaction with this company in August 2010 for US$ 637.5 million. |
| | | 2010 | | | 2009 | | | 2008 | |
| Local sales | | | | | | | | | |
| Medium distillates | | $ | 7,099,176 | | | $ | 5,738,586 | | | $ | 5,914,627 | |
| Gasoline | | | 4,302,282 | | | | 4,374,781 | | | | 3,644,345 | |
| Services | | | 1,947,829 | | | | 1,113,075 | | | | 921,652 | |
| Other products | | | 1,763,927 | | | | 833,067 | | | | 1,367,766 | |
| Natural gas | | | 1,159,245 | | | | 1,000,517 | | | | 901,414 | |
| LPG and propane | | | 627,361 | | | | 469,551 | | | | 612,771 | |
| Asphalts | | | 326,737 | | | | 314,230 | | | | 390,544 | |
| Crude Oils | | | 117,186 | | | | 18,194 | | | | 4,774,401 | |
| | | | 17,343,743 | | | | 13,862,001 | | | | 18,527,520 | |
| Recognition of price differential (1) | | | 740,682 | | | | 196,533 | | | | 3,070,479 | |
| | | | 18,084,425 | | | | 14,058,534 | | | | 21,597,999 | |
| Foreign sales | | | | | | | | | | | | |
| Crude oil | | | 18,073,357 | | | | 11,815,512 | | | | 8,696,282 | |
| Fuel Oil | | | 2,377,266 | | | | 2,325,507 | | | | 2,093,012 | |
| Diesel | | | 1,638,044 | | | | 551,263 | | | | 246,158 | |
| Other products | | | 831,129 | | | | 642,877 | | | | 747,650 | |
| Gasoline | | | 698,068 | | | | 687,206 | | | | 186,197 | |
| Natural gas | | | 146,063 | | | | 311,734 | | | | 313,348 | |
| Propylene | | | 109,271 | | | | - | | | | - | |
| | | | 23,873,198 | | | | 16,334,099 | | | | 12,282,647 | |
| Premium income, net | | | 10,688 | | | | 11,757 | | | | 16,023 | |
| | | | 23,883,886 | | | | 16,345,856 | | | | 12,298,670 | |
| | | $ | 41,968,311 | | | $ | 30,404,390 | | | $ | 33,896,669 | |
| (1) | Corresponds to Decree 4839 applied beginning in December 2008 which determines the price differential (value generated between the parity price and the regulated price, which may either be negative or positive). |
| | | 2010 | | | 2009 | | | 2008 | |
| Variable Cost | | | | | | | | | |
| Purchase of hydrocarbons from the ANH (1) | | $ | 5,500,921 | | | $ | 4,358,408 | | | $ | 5,584,474 | |
| Imported products | | | 5,680,601 | | | | 2,739,681 | | | | 3,470,987 | |
| Purchase of crude oil in association and concession | | | 4,548,193 | | | | 4,130,116 | | | | 3,193,690 | |
| Amortization and depletion | | | 2,245,613 | | | | 1,474,918 | | | | 1,087,583 | |
| Transportation services for hydrocarbon | | | 540,555 | | | | 637,029 | | | | 581,945 | |
| Purchase of natural gas and other products | | | 316,192 | | | | 57,335 | | | | 230,977 | |
| Electrical power | | | 205,102 | | | | 156,405 | | | | 112,355 | |
| Materials in process | | | 146,941 | | | | 180,602 | | | | 113,427 | |
| Initial and final inventory | | | (251,431 | ) | | | (55,042 | ) | | | (239,033 | ) |
| Insurance premium cost, net | | | 2,825 | | | | 554 | | | | 1,898 | |
| Depreciation by production units | | | 55,473 | | | | 48,834 | | | | - | |
| Adjustment in volumes and other assignments | | | (377,307 | ) | | | (334,658 | ) | | | (132,040 | ) |
| | | | 18,613,678 | | | | 13,394,182 | | | | 14,006,263 | |
| Fixed Cost | | | | | | | | | | | | |
| Services contracted with associations | | | 1,469,586 | | | | 1,290,177 | | | | 1,188,294 | |
| Maintenance | | | 1,384,088 | | | | 1,274,618 | | | | 831,553 | |
| Labor costs | | | 1,084,149 | | | | 918,188 | | | | 751,826 | |
| Depreciation | | | 1,548,797 | | | | 1,239,846 | | | | 670,279 | |
| Contracted services | | | 482,728 | | | | 451,165 | | | | 294,351 | |
| Project expenses not capitalized | | | 413,692 | | | | 524,441 | | | | 571,941 | |
| Materials and operations supplies | | | 345,326 | | | | 302,534 | | | | 266,134 | |
| Taxes | | | 254,489 | | | | 326,767 | | | | 199,175 | |
| Amortization of deferred charges, intangibles and | | | | | | | | | | | | |
| insurance premiums | | | 107,422 | | | | 94,288 | | | | 73,343 | |
| General costs | | | 236,604 | | | | 7,055 | | | | 23,914 | |
| Amortization of actuarial liability | | | 18,442 | | | | 82,812 | | | | 207,363 | |
| | | | 7,345,323 | | | | 6,511,891 | | | | 5,078,173 | |
| | | $ | 25,959,001 | | | $ | 19,906,073 | | | $ | 19,084,436 | |
Ecopetrol S.A. and Subsidiaries
Notes to the Consolidated Financial Statements
Years ended December 31, 2010, 2009 and 2008
| (1) | Corresponds to the crude oil and natural gas purchases of Ecopetrol from the Agencia Nacional de Hidrocarburos derived from national production, both under the Company’s direct operation and under the operation of third parties. |
| | | 2010 | | | 2009 | | | 2008 | |
| Administration | | | | | | | | | |
| Labor | | $ | 213,739 | | | $ | 281,123 | | | $ | 189,757 | |
| Amortization (1) | | | 209,000 | | | | 175,032 | | | | 58,705 | |
| General expenses | | | 149,772 | | | | 149,644 | | | | 65,087 | |
| Taxes | | | 19,363 | | | | 9,084 | | | | 3,046 | |
| Rental and lease cost | | | 7,986 | | | | 17,322 | | | | 10,156 | |
| Maintenance | | | 2,611 | | | | 17,361 | | | | 11,295 | |
| Active personnel amortization of pension actuarial liability | | | 1,052 | | | | 12,770 | | | | 44,055 | |
| | | | 603,523 | | | | 662,336 | | | | 382,101 | |
| Selling and Projects | | | | | | | | | | | | |
| Exploration expenses (2) | | | 1,465,537 | | | | 1,099,837 | | | | 826,615 | |
| Project expenses (3) | | | 321,580 | | | | 296,645 | | | | 86,136 | |
| General expenses | | | 300,837 | | | | 166,480 | | | | 113,024 | |
| Taxes | | | 155,662 | | | | 181,109 | | | | 182,886 | |
| Pipeline transportation | | | 125,376 | | | | 141,889 | | | | 102,862 | |
| Non-compliance gas delivery charges | | | 85,222 | | | | 27,851 | | | | - | |
| Labor expenses | | | 69,490 | | | | 43,495 | | | | 26,759 | |
| Maintenance | | | 1,786 | | | | 5,336 | | | | 5,090 | |
| Pipeline transportation | | | 1,455 | | | | - | | | | 422,697 | |
| Active personnel amortization of pension actuarial liability | | | - | | | | - | | | | 6,705 | |
| | | | 2,526,945 | | | | 1,962,642 | | | | 1,772,774 | |
| | | $ | 3,130,468 | | | $ | 2,624,978 | | | $ | 2,154,875 | |
| (1) | Corresponds to the amortization of goodwill in 2010 adding up to $172,660, (2009 - $139,909) |
| (2) | The balance for 2010 is mainly due to Ecopetrol’s exploratory activities for $182,311, unsuccessful exploration, and seismic data acquisition and studies for $268,198. Likewise, as well as Hocol’s seismic acquisition and other projects for $257,227 (including $179,000 in unsuccessful exploration), Ecopetrol Oleo e Gas do Brazil for $214,152 (including unsuccessful exploration in Malbec), Ecopetrol America Inc. for $482,915 (including $380,000 in unsuccessful exploration) and Ecopetrol de Peru $60,734 (including unsuccessful exploration mainly in Runtusapa). |
The balance for 2009 corresponds to Ecopetrol’s seismic and exploratory activities for $620,982, Ecopetrol Oleo e Gas Do Brazil $138,421, Ecopetrol America Inc. $220,132, Hocol $117,856 and Ecopetrol de Peru $2,446.
| (3) | Mainly due to non-capitalized expenses of Ecopetrol S.A. projects for $297,825, the most relevant of which are for: $35 (licensing services, consulting, per diem, socialization services and selection processes) Infrastructure $43 (Management, administration and inventory), ICP $67 (Support for investigation and laboratory services), $44 (Integrated management and Naftaductos), $47 (Recovery factor studies and minor fields characterization studies) and $43 (2010 Modernization of Barrancabermeja refinery and leading projects); Hocol $23,755. |
Ecopetrol S.A. and Subsidiaries
Notes to the Consolidated Financial Statements
Years ended December 31, 2010, 2009 and 2008
| | | 2010 | | | 2009 | | | 2008 | |
| Income | | | | | | | | | |
| Exchange difference gain | | $ | 4,265,882 | | | $ | 6,517,914 | | | $ | 10,863,242 | |
| Interest and monetary correction(1) | | | 156,336 | | | | 479,694 | | | | 682,542 | |
| Equity Method Investment Gain | | | 83,574 | | | | 55,143 | | | | 110,824 | |
| Income on valuation of derivates (2) | | | 80,445 | | | | 159,245 | | | | 4,782 | |
| Income on valuation of investment portfolio | | | 80,111 | | | | 168,442 | | | | 1,640,338 | |
| Dividends in cash | | | 30,941 | | | | 31,687 | | | | 39,472 | |
| Other | | | 9,202 | | | | 1,802 | | | | - | |
| | | | 4,706,491 | | | | 7,413,927 | | | | 13,341,200 | |
| Expense | | | | | | | | | | | | |
| Exchange difference loss | | | (4,412,224 | ) | | | (6,643,557 | ) | | | (8,901,184 | ) |
| Interest | | | (145,910 | ) | | | (138,801 | ) | | | (19,376 | ) |
| Hedging operations (2) | | | (99,139 | ) | | | (84,492 | ) | | | (74,685 | ) |
| Other minor | | | (10,101 | ) | | | (27,806 | ) | | | (6,820 | ) |
| Equity method loss | | | (802 | ) | | | - | | | | (185,606 | ) |
| Administration and securities issuance | | | (526 | ) | | | (23,438 | ) | | | (52,277 | ) |
| | | | (4,668,702 | ) | | | (6,918,094 | ) | | | (9,239,948 | ) |
| Net | | $ | 37,789 | | | $ | 495,833 | | | $ | 4,101,252 | |
| (1) | In 2010 there were no opportunity cost recognized at Ecopetrol S.A. |
| (2) | A total of $11,909 in net losses on asphalt hedging were reported for 2010 at Ecopetrol S.A., along with a net refining margin of $9,971, net profit on WTI $389 and others for $1,529. Similarly, the Cartagena Refinery reported net profit on hedging for $1,268. |
| | | 2010 | | | 2009 | | | 2008 | |
| Amortization of pension actuarial calculation (1) | | $ | 146,717 | | | $ | 407,083 | | | $ | 986,565 | |
| Health care services | | | 171,636 | | | | 132,322 | | | | 107,213 | |
| Education services | | | 59,273 | | | | 55,752 | | | | 51,147 | |
| | | $ | 377,626 | | | $ | 595,157 | | | $ | 1,144,925 | |
| (1) | The reduction in expenses is derived from the change of the accounting policy for amortization of the health actuarial calculation in accordance with change in Colombian GAAP in 2010. The reduction in the education actuarial calculation of 2010, resulting from application of the new Mortality Rates of $15,161 was accounted for as income for the year. |
In 2010 the inflation gain corresponds to the net amortization of the deferred monetary correction for $22,030 ($22,335 in 2009) and ($30,473 in 2008).
| 28. | Other Income (Expenses), Net |
| | | 2010 | | | 2009 | | | 2008 | |
| Other income | | | | | | | | | |
| Recovery of provisions (1) | | $ | 365,515 | | | $ | 224,565 | | | $ | 999,866 | |
| Long-term crude oil testing | | | 104,970 | | | | - | | | | - | |
| Expense recovery | | | 99,900 | | | | 61,972 | | | | 7,459 | |
| Recovery of exploration costs | | | 40,336 | | | | 148,996 | | | | - | |
| Income for services | | | 28,779 | | | | 48,878 | | | | 3,605 | |
| Income from undeveloped discovered fields | | | 28,097 | | | | 19,257 | | | | 1,228 | |
| Income from transferred rights | | | 19,222 | | | | 28,116 | | | | - | |
| Income on sale of materials and plant property and equipment | | | 18,837 | | | | 3,579 | | | | 10,435 | |
| Recovery from services to associates | | | 15,535 | | | | 14,219 | | | | 22,840 | |
| Indemnities received | | | 9,253 | | | | 16,305 | | | | 6,367 | |
| Other minor income | | | 81,716 | | | | 134,885 | | | | 23,003 | |
| | | | 812,160 | | | | 700,772 | | | | 1,074,803 | |
Ecopetrol S.A. and Subsidiaries
Notes to the Consolidated Financial Statements
Years ended December 31, 2010, 2009 and 2008
| | | 2010 | | | 2009 | | | 2008 | |
| Other expenses | | | | | | | | | |
| Provisions (2) | | | (552,520 | ) | | | (462,812 | ) | | | (114,035 | ) |
| Taxes | | | (343,128 | ) | | | (352,459 | ) | | | (299,673 | ) |
| Write off of goodwill (3) | | | (287,662 | ) | | | - | | | | - | |
| Gas pipelines availability from Bomt contracts | | | (63,947 | ) | | | (89,906 | ) | | | (95,505 | ) |
| Other minor expenses | | | (413,532 | ) | | | (151,034 | ) | | | (26,135 | ) |
| Fuel losses | | | (140,153 | ) | | | (99,771 | ) | | | (93,854 | ) |
| Inspection quota | | | (49,435 | ) | | | (26,986 | ) | | | (25,811 | ) |
| Contributions and donations | | | (23,906 | ) | | | (40,497 | ) | | | (35,293 | ) |
| Loss on sale of fixed assets | | | (6,295 | ) | | | 193 | | | | (1,399 | ) |
| Surveillance and security | | | - | | | | (23,026 | ) | | | (16,052 | ) |
| | | | (1,880,578 | ) | | | (1,246,298 | ) | | | (707,757 | ) |
| | | $ | (1,068,418 | ) | | $ | (545,526 | ) | | $ | 367,046 | |
| (1) | Details of recovery of provisions are as following: |
| | | 2010 | | | 2009 | | | 2008 | |
| Legal proceedings | | $ | 80,237 | | | $ | 83,258 | | | $ | 832,788 | |
| Property, plant and equipment | | | 55,717 | | | | 17,091 | | | | 18,813 | |
| Accounts receivable Recovery | | | 68,772 | | | | - | | | | - | |
| Other recoveries * | | | 131,308 | | | | 5,564 | | | | 139,554 | |
| Products and materials inventories | | | 29,481 | | | | 118,652 | | | | 8,711 | |
| | | $ | 365,515 | | | $ | 224,565 | | | $ | 999,866 | |
* The main recoveries were: Recovery of the allowance for pension liabilities $77,116 million, ruling in favor of the Teca Field proceedings $17,946 million, recovery of the education reserve $15,161 million, allowance for payroll expenses $6,396 million and $5,859 million on the Cocorna Agreement.
| (2) | The detail of provisions is as follows: |
| | | 2010 | | | 2009 | | | 2008 | |
| Property, plant and equipment | | $ | 227,266 | | | $ | 127,826 | | | $ | - | |
| Accounts receivable | | | 169,789 | | | | 30,734 | | | | 2,275 | |
| Legal proceedings | | | 125,888 | | | | 271,091 | | | | 59,305 | |
| Products and materials inventories | | | 9,743 | | | | 33,161 | | | | 49,379 | |
| Other provisions | | | 19,834 | | | | - | | | | 3,076 | |
| | | $ | 552,520 | | | $ | 462,812 | | | $ | 114,035 | |
| (3) | Debit to earnings due to write off of goodwill Offshore International Inc. for $287.7 billion. |
Ecopetrol has recognized provisions corresponding to reasonable estimates intended to cover future situations deriving from loss contingencies or the occurrence of future events that could affect its financial position and results of operations.
The methodology used by the Legal Vice Presidency is based on the credit system of the Nation, which is used by the Ministry of Interior and Justice and includes an analysis of factors such as procedural risk, strength of the claim, proof of the claim, strength of the response, proof of the response, level of jurisprudence and results of first instance decision.
A summary of the most significant proceedings with amounts of claims greater than $10,000 for which provisions have been recognized according to the evaluations of the internal and external attorneys of the Company, as of December 31, 2010, is set forth below:
Ecopetrol S.A. and Subsidiaries
Notes to the Consolidated Financial Statements
Years ended December 31, 2010, 2009 and 2008
| Proceeding | | Claim | | Provision Amount Dec. 2010 | | Provision Amount Dec 2009 |
| Foncoeco (1) | | Profit participation fund of the employees and ex-employees of Ecopetrol S.A. | | 143,692 | | 139,933 |
| Municipio de Aguazul, Tauramena | | Class Action. Contributions to the solidarity and redistribution of income fund as a consequence of the generation of electricity, according to the Law 142 of 1994. | | 139,688 | | 139,688 |
| Municipio de Arauca | | Class Action. Contributions to the solidarity and redistribution of income fund as a consequence of the generation of electricity, according to the Law 142 of 1994 | | 121,051 | | 121,051 |
| Departamento del Tolima | | Class Action for the recalculation of royalties with 20% specified in Law 141 of 1994. | | 82,287 | | 82,287 |
| Consorcio Protécnica Ltda (Winding-up) - Constructora Kepler S. A. De C.V. | | Time over run in construction said to be Ecopetrol’s fault that altered the economic and financial equilibrium of the contract against the contracting consortium. | | 10,000 | | 10,000 |
As of December 31, 2010, the balance of the provision for legal proceedings amounts to $663,932 (2009 - $680,022).
| (1) | Advisor report of 2005 calculated in $542,000 the damages owed by Ecopetrol in the Ordinary Civil Action filed by Foncoeco which claims that Ecopetrol must pay principal and interest on the profit participation fund for the employees of the Company which was established by the Board of Directors. It is the opinion of the Company’s management and its legal advisors that there are sufficient arguments to demonstrate that this lawsuit will not proceed, particularly because the basis of the report includes amounts not authorized by the Board of Directors, therefore, at December 2010 closing date a provision in amount of $143,692 was recorded for this proceeding. |
Natural Gas Supply Contracts
In addition to existing contracts, the Company has entered into new natural gas sale or supply contracts with third parties, including Gecelca, Gases del Caribe, Gas Natural S. A. E.S.P., Transportadora de Gas Internacional E.S.P., among others. As of December 31, 2010, Ecopetrol sold an average 585.96 GBTUD for COP $1,344,231 million (including exports).
During the first half of the year, the so called “El Niño” phenomenon caused a high generation of gas thermoelectricity countrywide and, as a consequence, such fuel sales exceeded historic levels. Additionally, pursuant to government provisions, in order to increase thermal generation levels, the Company supplied throughout the first half of 2010 an average of 2.43 KBD of diesel.
Options
Hedge description
Hedging operations were performed by means of the acquisition of put options. By means of this strategy, Ecopetrol S. A. protects itself from price increase risks on the reference index. In particular, it covers variation in the crude oil price, based on WTI Nymex reference rates.
Hedge instruments
Represent positions in Put Options over WTI Nymex.
Put Options
Effective date in 2011 | | Expiration date in 2011 | | Volume | | Strike Price | | | Call Price | |
| January 1 | | December 31 | | 2.000.004 Bls. | | US$ | 82 | | | | 3.69 | |
Ecopetrol S.A. and Subsidiaries
Notes to the Consolidated Financial Statements
Years ended December 31, 2010, 2009 and 2008
Swap-Spread
Hedge description
A Swap-Spread hedge was performed over the price difference between valuation indexes. Through this derivative portfolio competitive refining margins and discount factors are guaranteed for the Company on crude oil and refined products trading.
Hedge instruments
Swap instruments with long and short positions.
Effective date in 2011 | | Expiration date in 2011 | | Volume | | Fixed spread | |
| January 1 | | January 31 | | 500.000 Bls. | | US$ | 6.2 | |
| January 1 | | January 31 | | 100.000 Bls. | | US$ | 7.6 | |
| January 1 | | January 31 | | 100.000 Bls. | | US$ | 8.3 | |
| January 1 | | January 31 | | 140.000 Bls. | | US$ | 9.0 | |
| January 1 | | January 31 | | 500.000 Bls. | | US$ | 6.1 | |
| January 1 | | January 31 | | 100.000 Bls. | | US$ | 9.0 | |
Earn outs in acquired companies
As part of the Company’s acquisition of Hocol Petroleum Ltd. and Offshore International Group (OIG), the Company took over future commitments, called “earn outs”, which must be recognized by the buyer to the seller, depending on the behavior of variables such as the crude oil price and the reserves.
Hocol Petroleum Ltd.
| 1. | An additional amount might have to be paid in January 2011 depending on the behavior of the crude oil average price per barrel. Below is a summary of the additional amount to be paid depending on the actual recorded WTI crude barrel price between January 1, 2010 and December 31, 2010: |
Below US$55, the amount to be paid is zero.
Higher than US$55 and less than US$60, the amount to be paid is US$25 million.
Higher than US$60 and less than US$65, the amount to be paid is US$40 million.
Higher than US$65, the amount to be paid is US$65 million.
This commitment was fulfilled on January 24, 2011, through a wire transfer from Ecopetrol S.A. to Maurel & Prom in the amount of US$65 million.
| 2. | Depending of the exploration results of the Huron well and for a period of up to two years (December 2012), 2P (proven plus probable) certified results were multiplied by a percentage (between 8% and 6%) of the WTI average period for a given period; the resulting value, up to a maximum US$50 million would be paid in the first quarter of 2013. |
As of December 2010, an equivalent in pesos of US$65 million was recognized as an increase in goodwill due to the behavior of the average price of crude oil by barrel and an adjustment of US$27.3 million due to for the exploration results of the Huron well.
Offshore International Group (OIG)
The commitment implies that if during years following the date of acquisition of the company (i.e., February 6, 2009) the crude oil average price exceeds US$60 per barrel, but is less than or equal to US$70 per barrel, US$200 million shall be paid and should the average price be greater than US$70 per barrel, the payable value amounts to US$300 million. Ecopetrol would be bound to pay 50% of the commitment.
As of December 31, 2010, the pesos currency equivalent of US$148.7 million was recognized as greater value of commercial credit. The payable amount in February amounts to US$150 million.
Ecopetrol S.A. and Subsidiaries
Notes to the Consolidated Financial Statements
Years ended December 31, 2010, 2009 and 2008
Ship or Pay Contracts
Ecopetrol S.A. and ODL Finance S.A. have entered into two contracts (Ship or pay): i) The first supports the debt (Financing Tariff) to “Grupo Aval” for 7 years and is collected through a trust fund in charge of paying the debt amortization payments, and ii) the second supports the securitization (Autonomous Equity Titles) with a validity of 7 years. From the issuance date of the titles, they shall be managed by an equity fund structured for that purpose and to which equity rights for invoicing, collecting and paying to title holders, have been transferred. Under the agreement used to pay Grupo Aval indebtedness, ODL has committed to transport 75,000 barrels of oil a day during the two-year grace period of the facility and 90,000 barrels of oil a day during the remaining five years. Under the second agreement, ODL has committed to transport 19,500 barrels of oil a day during the first phase and 39,000 barrels of oil a day during the second phase.
Ecopetrol and Talisman acquired BP Exploration Company Colombia Limited
On January 24, 2011, after obtaining the respective governmental authorizations, Ecopetrol S. A. and Talisman Colombia Holdco Limited concluded the acquisition of BP Exploration Company Colombia Limited, the value of which amounted to US$1,750 million. Ecopetrol has a 51% interest in the new corporation and Talisman holds the remaining 49%.
The shareholders announced that the new corporate name will be Equión Energía Limited. The corporation will maintain the property of the assets and the business that the BP affiliate used to hold in Colombia. EQUIÓN currently produces and operates nearly 90 thousand oil equivalent barrels per day (Boe). Equion’s operation includes the holdings that BP had in the association contracts of the Llanos Foothills. These contracts are Piedemonte, Rio Chitamena, Tauramena and Recetor, which cover the fields of Cusiana, Cupiagua in Recetor, Pauto and Floreña.
In addition to the above assets, the holdings in exploration and production contracts, RC4 and RC5, are added; these contracts entered into with Agencia Nacional de Hidrocarburos, are located in the Atlantic Coast in Colombia. Furthermore, the Company operates the Cusiana gas plant, where 200 million cubic feet per day of gas are processed to meet the demand from the inner part of the country.
EQUION also assumes the holding that BP had in Oleoducto Central S. A.-Ocensa (24.8%), Oleoducto de Colombia (14.57%) and in the Alto Magdalena pipeline (4.25%), as well as 20% in Transgas de Occidente and the holding in the Casanare gas plants.
Ecopetrol established Ecopetrol Global Capital SL
Ecopetrol S. A. established Ecopetrol Global Capital SL., in January 2011, where it holds 100% of the equity shares, with an initial equity amounting to 3,100 Euros. The company was incorporated in Madrid, Spain, and will operate as a foreign security holder in Spain.
Ecopetrol increases its share in the exploration of the Caño Sur Block
Ecopetrol S. A. and Shell Exploration and Production Colombia Caño Sur entered into an agreement whereby Ecopetrol acquires the entire holding currently held by Shell in the exploration of the Caño Sur block located in the Llanos Orientales basin.
This agreement is subject to the approval of this holding assignment by the Agencia Nacional de Hidrocarburos, ANH.
According to Law 1370 of 2009, for the year 2011, the Property Tax will be the responsibility of companies, individuals and de facto corporations, who are income tax payers. This law stipulated that the equity tax shall be effective on January 1, 2011, only once and it is to be paid in eight equal installments during the years 2011, 2012, 2013 and 2014, within the terms established by the Colombian Government.
Ecopetrol S.A. and Subsidiaries
Notes to the Consolidated Financial Statements
Years ended December 31, 2010, 2009 and 2008
On February 16, 2010, the Ministry of Finance and Public Credit issued Decree 514 applicable to accounting matters, which partially amends Decree 2649 of 1993 (which regulates General Accounting and issues accounting principles or regulations generally accepted in Colombia).
Decree 514 of 2010 establishes a provisional paragraph addressing two fundamental aspects:
| 1. | The taxpayers may, once a year, charge against the equity revaluation account the value of payable installments in the respective equity tax that is set forth in Law 1370 of 2009. |
| 2. | When the equity revaluation account does not have any balance or it is insufficient to charge the equity tax thereto, the taxpayers can then post in the annual income statements the value of the required installments in the respective period. |
| 3. | In accordance with the foregoing and as support of Decree 2649 regarding the accounting recognition of the economic facts, the Superintendence of Corporations issued Writ 115-009819 dated January 26, concluding that the property tax is generated by the possession of the wealth on a specific date (January 1, 2011) and it must be paid in eight equal installments during the years 2011, 2012, 2013 and 2014, recognizing the operation from an accounting standpoint in accordance with that provided for in Decree 514 of 2010. |
Based on the foregoing standards, Ecopetrol will recognize as of January 1, 2011 and up to January 1, 2014 the payable equity tax payable and the respective charge to results equivalent to 25% of the total payable value calculated on January 1, 2011. The outstanding balance shall be recognized in memorandum accounts.
Total annual value of equity tax and expense corresponding to payable installments, are the following:
| | | Total Tax | | | Year Expense | |
| Ecopetrol | | $ | 1,894,488 | | | $ | 473,622 | |
| Ocensa | | | 31,916 | | | | 7,979 | |
| ODC | | | 4,598 | | | | 1,149 | |
| Bioenergy | | | 5,856 | | | | 1,464 | |
| ODL | | | 26,493 | | | | 6,623 | |
| Comai | | | 4,184 | | | | 1,046 | |
| Propilco | | | 27,304 | | | | 6,826 | |
| Reficar | | | 142,334 | | | | 35,583 | |
| Hocol | | | 59,593 | | | | 14,898 | |
| OBC | | | 13,780 | | | | 3,445 | |
| Equion | | | 37,540 | | | | 9,385 | |
| Total | | $ | 2,248,084 | | | $ | 562,021 | |
Hocol S.A.
By Resolution 130 of January 18, 2011, the National Hydrocarbon Agency approved the partial assignment of 50% of the interests, rights and obligations of Hocol S.A. Lewis Energy Colombia Inc., on the exploration and production contract Clarinero, being distributed participation in this contract as follows: 50% Hocol S.A. and 50% Lewis Energy Colombia Inc.
Ecopetrol Oleo e Gas Do Brasil
In BM EN 29, the Malbec well drilling proved unsuccessful (it was fully expensed in 2010). The first period of the exploration phase fully complied with the Minimum Exploration Program. In April and May, the partners decided not to continue drilling in the following period and instead, returned the block to ANP (Brazilian ANH). Therefore, the bond value is being expensed in May 2011.
Ecopetrol S.A. and Subsidiaries
Notes to the Consolidated Financial Statements
Years ended December 31, 2010, 2009 and 2008
Ecopetrol S.A.
| 1. | According to the second instance decision issued by the Superior Tribunal of Bogotá in January 2011, the return of 324 million shares of Invercolsa to Ecopetrol was confirmed. |
After the ruling, Fernando Londoño and Arrendadora Financiera Internacional Boliviariana S.A. (AFIB) requested an appeal before the Supreme Court and AFIB offered a bond to guarantee payment of the damages that may be can caused to Ecopetrol if the sentence is not executed the sentence.
| 2. | The Board meeting of January 21, 2011, approved that Ecopetrol S.A. exercise the preferential right to purchase 50% of the shares of Shell Exploration & Production Caño Sur Colombia. According to the above, we made a request for the authorization of the transaction to the National Hydrocarbons Agency, who determined to perform the negotiation. |
| 3. | Having obtained the respective licenses Ecopetrol S.A. and Talisman Colombia Holdco Limited completed in January 24, 2011 the acquisition of BP Exploration Company Colombia Limited - Today Equión Energy Limited. |
In February 2011, the Puerto dry well was recognized, while in March, the Kaxan Norte dry well was recognized. The capitalized costs associated with these two exploration activities as of December 31, 2010, were $2,132 and $3,208, respectively, which were expensed as of December 31, 2010 for U.S. GAAP purposes.
It also was announced in the Press Release of the first quarter of 2011, two dry wells known stratigraphic, Zircon-1 and Amber-3
| 4. | Impact on tax reform 2010 on Ecopetrol |
Once the 1430 Act of 2010 "Tax Reform" was approved, management analyzed the effects that this law generated for the Company and its subsidiaries in the development of its activities. The following describes the impact that these modifications had for Ecopetrol only:
Deduction for investment in real productive assets: The special deduction for investment in real productive assets was eliminated beginning in 2011, a standard that previously made possible a large number of company projects that were planned in the long-term.
Ecopetrol, based on the paragraph of Article 1 of the Act, upon signing the legal stability agreement with the National Government, may obtain legal stability for the deduction for up to a period not to exceed three (3) years.
Net Worth Tax (includes amendment introduced in the emergency decrees enacted under the state of emergency): Amends the estate tax base for tax years 2011, 2012, 2013 and 2014 that was created by the Act 1370 of 2009. The rate is 4.8% plus a surcharge established in the economic emergency decrees of 25% tax. Therefore, the real rate is 6%
The comprehensive tax reform had a significant impact on the finances of ECOPETROL S.A. and its Corporate Group and affects the profitability of investors for the effects of higher taxes.
Tax on financial movements, gradual elimination of GMF: The tax on financial transactions will be removed gradually from 2014. Beginning in 2014, the rate will be 2 per thousand and will gradually decrease to 1 per thousand in 2016 and 0 per thousand in 2018, at which time the tax disappears and the provisions regulating the application of same legal system.
Ecopetrol S.A. and Subsidiaries
Notes to the Consolidated Financial Statements
Years ended December 31, 2010, 2009 and 2008
| 5. | The Civil Division of Judicial Superior Court District of Bogotá revised the decision issued by the Civil Circuit Court 23 of Bogota, which on December 16, 2005 ordered us to pay $541,833 million, or approximately US$260 million to a former employees association known by the acronym Foncoeco, for the Company’s profit-sharing plan offered in 1962 that expired in 1975. |
As of December 31, 2010, the associated estimated loss was $146,811, based on the facts and circumstances of the probable loss available on such date.
Instead, on June 22, 2011, the Bogota Higher Tribunal of second instance, ruled in our favor and reduced the amount we must pay to $6.6 million, or approximately US$3,707. Since this is not considered the final ruling in this case, this had no effect on the related provision as of December 31, 2010.
| Differences between Colombian Governmental Entity accounting principles and U.S. GAAP |
The Company's financial statements are prepared in accordance with Colombian Government Entity GAAP (RCP). These principles and regulations differ in certain significant respects from accounting principles generally accepted in the United States of America (U.S. GAAP), and therefore this note presents reconciliations of net income and shareholders’ equity determined under RCP to those same amounts as determined according to U.S. GAAP. Also presented in this note are those disclosures required under U.S. GAAP but not required under RCP.
Restatement of previously issued financial statements
In connection with the preparation of the 2010 fiscal year-end consolidated financial statements, management concluded that for purpose of its reconciliation of Colombian Government Entity GAAP to U.S. GAAP, a material error regarding the accounting of employee benefit plans was identified in the previously issued consolidated U.S. GAAP financial information and related disclosures for the year ended December 31, 2009. Therefore, such U.S. GAAP financial information for 2009 has been restated. This restatement does not affect the financial information under Colombian Government Entity GAAP as of and for the year ended December 31, 2009, nor 2010 or any other prior periods, and therefore there is no impact on dividends declared and paid under the 2009 financial results, which are declared on the basis of the Colombian Government Entity GAAP financial statements.
Employee Benefit Error
This error was due to the incorrect determination of the amount of unrealized gains and losses of health, education and pension bond employee benefit plans. Due to the incorrect determination of gains and losses, the Company amortized an excess amount of actuarial losses. As such, this error led to an understatement of the Company's consolidated net income in 2009 of $1,178,563 and an overstatement of the Other Comprehensive Income - OCI by the same amount. To correct this error the Company reversed the incorrect amortization expense and decreased OCI.
Ecopetrol S.A. and Subsidiaries
Notes to the Consolidated Financial Statements
Years ended December 31, 2010, 2009 and 2008
Other Errors
Separately, the Company’s management also corrected certain errors in the 2009 U.S. GAAP reconciliation, including errors previously identified which individually and in the aggregate, were considered not to be material to the Company’s consolidated financial information reconciled to U.S. GAAP. These adjustments led to an overstatement of the Company´s consolidated net income reconciled to U.S. GAAP of $38,727. Below is a detail of these errors.
Purchase Price Allocation Errors - Certain errors were identified in the recording of the purchase price allocations relating to 2009 acquisitions. All of these adjustments are individually not material. Included in these purchase price allocation errors are the following:
| | · | Deferred taxes were not recorded in the purchase price allocation process relating to the fair value step up of assets. Therefore, an additional deferred tax liability was recorded. |
| | · | Depreciation and amortization was not calculated correctly for the stepped up portion of assets relating to the Oleoducto de Colombia and Propilco acquisitions. As such, an adjustment was made to increase depreciation and amortization expense. |
| | · | The investment in OIG is accounted for under the equity method. However, the Company mistakenly presented goodwill and the foreign currency translation adjustment separate from the investment in equity method investee account. As such, the goodwill balance and foreign currency translation adjustment relating to OIG is now presented as part of re-investment in equity investee. |
| | · | In connection with the OIG acquisition, certain contingent consideration liabilities were recorded. Subsequent to initial recording, these amounts were adjusted to fair value. This adjustment was recorded as an expense in the income statement. However, given that these amounts were not settled as of December 31, 2009, and that OIG is accounted for under the equity method, these amounts should have been recorded as an increase to the investment in equity method investee’s account. As such, the expenses recorded in the income statement were reversed and the investment in equity method account on the balance sheet was increased. |
Asset Retirement Obligation Errors - Two errors were identified in the Asset Retirement Obligation (ARO) calculation. First, it was determined that the useful lives used in the formula to determine the obligation were incorrect. Second, the 2009 amortization expense under U.S. GAAP was incorrectly booked. The adjustment to correct the first error is a decrease in the ARO liability and a corresponding decrease in the amount capitalized as part of the asset value. The adjustment to correct the second error is a decrease in amortization expense and a decrease in the corresponding asset value.
Fixed Assets Errors - Errors in the fixed asset balances and related depreciation expense were identified. There are certain GAAP differences in the capitalization rules between RCP and U.S. GAAP. As such, as part of the U.S. GAAP process, fixed asset and depreciation amounts are adjusted. During 2009, for certain fixed assets, the Company mistakenly duplicated these GAAP adjustments. The correction of this error resulted in an increase to fixed asset balances and a decrease to depreciation expense.
Foreign Currency Translation Adjustment Errors - The foreign currency translation process for the subsidiary Reficar was applied incorrectly under U.S. GAAP. As such, the adjustment to CTA was incorrect, as well as the individual translated line items of the balance sheet that include Reficar amounts. The Company corrected this error by correctly applying the foreign currency translation methodology as required by U.S. GAAP. This resulted in an increase to the CTA account, and a decrease in individual asset and liability line items.
Ecopetrol S.A. and Subsidiaries
Notes to the Consolidated Financial Statements
Years ended December 31, 2010, 2009 and 2008
Deferred Tax Errors - Certain errors were identified in the calculation of deferred taxes. The Company incorrectly calculated the deferred tax effect of the mark-to- market adjustments of available-for-sale securities. In addition, included in this category are the deferred tax effects of certain of the previously discussed errors.
Classification Errors - Certain transactions included within individual line items of the 2009 balance sheet and income statement were re-classified due to classification errors. These classification errors include the following:
| | · | The Company had previously included employee benefit plan expense as a non-operating expense. This expense has now been classified as an administrative expense to appropriately reflect the nature of the amount under U.S. GAAP. |
| | · | The Company mistakenly booked certain prepaid expenses and accounts receivable balances to the short term deposits and advances line item. |
| | · | Certain assets were inappropriately recorded in the long-term available-for-sale investments accounts. These amounts have been presented in the appropriate other assets account. |
| | · | Certain provisions and other operating expenses were mistakenly classified as non-operating expenses in the 2009 income statement. These amounts have been re-classed to operating expenses. |
Non-Controlling Interest Errors - The non-controlling interest balance was adjusted to reflect the non-controlling interest effect of the above discussed errors.
Ecopetrol S.A. and Subsidiaries
Notes to the Consolidated Financial Statements
Years ended December 31, 2010, 2009 and 2008
Supplemental consolidated U.S. GAAP restated balance sheet as of December 31, 2009:
| | | 2009 | |
| | | Previously reported | | | Adjustments | | | Restated | |
| Assets | | | | | | | | | |
| Current assets: | | | | | | | | | |
| Cash and cash equivalents | | $ | 3,861,532 | | | $ | (23,862 | ) | | $ | 3,837,670 | (1) |
| Investments | | | | | | | | | | | | |
| Available for sale | | | 178,832 | | | | - | | | | 178,832 | |
| Held to maturity | | | 7,876 | | | | - | | | | 7,876 | |
| Accounts and notes receivable, net | | | 2,530,379 | | | | 317,322 | | | | 2,847,701 | (2) |
| Inventories | | | 1,929,977 | | | | 15,679 | | | | 1,945,656 | (1) |
| Advances and deposits | | | 1,200,682 | | | | (856,740 | ) | | | 343,942 | (2) |
| Prepaid expenses and other assets | | | 62,759 | | | | 532,515 | | | | 595,274 | (2) |
| Deferred income taxes | | | 1,015,488 | | | | (205,570 | ) | | | 807,918 | (1) |
| Total current assets | | | 10,787,525 | | | | (220,656 | ) | | | 10,566,869 | |
| Investments | | | | | | | | | | | | |
| Available for sale | | | 4,118,555 | | | | (931,477 | ) | | | 3,187,078 | (3) |
| Held to maturity | | | 130,740 | | | | (312 | ) | | | 130,428 | |
| Equity Method | | | - | | | | 1,154,193 | | | | 1,154,193 | (4) |
| Accounts and notes receivable, net | | | 226,781 | | | | 379,994 | | | | 606,775 | (3) |
| Restricted assets | | | 380,463 | | | | 469 | | | | 380,932 | (1) |
| Property, plant and equipment, net | | | 13,098,446 | | | | (499,883 | ) | | | 12,598,563 | (5)(6)(11) |
| Natural and environmental resources, net | | | 9,431,458 | | | | (11,096 | ) | | | 9,420,362 | (1) |
| Goodwill | | | 2,385,113 | | | | (953,939 | ) | | | 1,431,174 | (4) (11) |
| Deferred charges and other assets | | | 1,280,359 | | | | 117,831 | | | | 1,398,190 | (3) |
| Deferred income taxes | | | 1,475,559 | | | | 254,970 | | | | 1,730,529 | (8) |
| Direct finance lease long-term | | | 19,254 | | | | - | | | | 19,254 | |
| Total Assets | | $ | 43,334,253 | | | $ | (709,902 | ) | | $ | 42,624,352 | |
| Liabilities and shareholders’ equity | | | | | | | | | | | | |
| Current liabilities: | | | | | | | | | | | | |
| Financial obligations | | $ | 437,111 | | | $ | (30 | ) | | $ | 437,081 | (1) |
| Accounts payable and related parties | | | 3,571,680 | | | | (13,100 | ) | | | 3,558,580 | (1) |
| Capital lease liability | | | 82,356 | | | | - | | | | 82,356 | (1) |
| Taxes payable | | | 567,271 | | | | 632 | | | | 567,903 | (1) |
| Labor and pension plan obligations | | | 165,472 | | | | (9 | ) | | | 165,463 | (1) |
| Estimated liabilities and provisions | | | 1,122,409 | | | | (12,864 | ) | | | 1,109,545 | (1) |
| Total current liabilities | | | 5,946,299 | | | | (25,371 | ) | | | 5,920,928 | |
| Financial obligations, long-term | | | 5,725,099 | | | | - | | | | 5,725,099 | |
| Accounts payable, long-term | | | 248,571 | | | | - | | | | 248,571 | |
| Capital lease liability | | | 278,594 | | | | - | | | | 278,594 | |
| Pension plan obligation and other labor obligations, long-term | | | 4,359,751 | | | | (6,827 | ) | | | 4,352,924 | (1) |
| Estimated liabilities and provisions | | | 2,841,371 | | | | (570,558 | ) | | | 2,270,813 | (6) |
| Other long-term liabilities | | | 809,334 | | | | (341 | ) | | | 808,993 | (1) |
| Total non-current liabilities | | | 14,262,720 | | | | (570,899 | ) | | | 13,684,994 | |
| Total liabilities | | | 20,209,019 | | | | (596,269 | ) | | | 19,605,922 | |
| Shareholders’ equity of Ecopetrol | | | | | | | | | | | | |
| Share par value | | | 10,117,791 | | | | - | | | | 10,117,791 | |
| Additional paid-in-capital | | | 4,044,669 | | | | - | | | | 4,044,669 | |
| Retained Earnings | | | 8,107,416 | | | | 1,138,788 | | | | 9,246,204 | |
| Accumulated Other Comprehensive income (loss) | | | 272,045 | | | | (1,296,988 | ) | | | (1,024,953 | ) (4)(7)(8)(10) |
| Total Shareholders’ equity of Ecopetrol | | | 22,541,921 | | | | (158,210 | ) | | | 22,383,711 | |
| Non-controlling interest | | | 583,313 | | | | 51,405 | | | | 634,718 | (9) |
| Total equity | | | 23,125,234 | | | | (106,805 | ) | | | 23,018,429 | |
| Total liabilities and shareholders’ equity | | $ | 43,334,253 | | | $ | (709,901 | ) | | $ | 42,624,351 | |
| (1) | Represents the correction of immaterial errors identified in the preparation of U.S. GAAP reconciliation. |
| Primarily represents re-classification of amounts incorrectly booked to the advances and deposits line item. See above discussion on classification errors. |
Ecopetrol S.A. and Subsidiaries
Notes to the Consolidated Financial Statements
Years ended December 31, 2010, 2009 and 2008
| (3) | Primarily represents re-classification of amounts incorrectly booked to available-for-sale investments. See above discussion on classification errors. |
| (4) | This adjustment primarily consists of the OIG re-class of goodwill to the Investment in equity method investee, $726,764, as well as the adjustment of OIG contingent consideration, $165,332, increasing the investment balance and non-operating income. The equity method investment account was also decreased $128,985 by the cumulative translation adjustment. See above discussion on purchase price allocation errors. |
| (5) | This adjustment includes the duplicate U.S. GAAP fixed asset adjustments. This caused fixed assets to increase by $221,194 and a decrease in depreciation expense by the same amount. See discussion on fixed assets errors above. |
| (6) | This adjustment primarily relates to the Asset Retirement Obligation error. This adjustment caused a decrease in fixed assets of $674,551, a decrease of Estimated liabilities and provisions of $570,558 and a decrease in cost of sales of $103,993. See discussion on asset retirement obligations. |
| (7) | A portion of this adjustment represents the employee benefit plan error. This resulted in a decrease in operating expenses of $1,759,049 and a decrease in OCI of the same amount. See discussion on employee benefit plans above. |
| (8) | This represents the adjustment to deferred taxes as a result of the above discussed errors. In addition, it includes the adjustment to deferred taxes of $211,444 relating to the error in calculating the deferred tax effect of available-for-sale securities. A portion of the total deferred tax adjustment was recorded in the income statement and a portion in OCI. See discussion on deferred tax errors above. |
| (9) | Represents the non-controlling interest effect of the above discussed adjustments. |
| (10) | This adjustment relates to foreign currency translation error. Assets and liabilities have been adjusted by not material amounts as a result of this error, with a corresponding adjustment to cumulative translation gain/loss included within OCI. See discussion on foreign currency translation adjustment errors above. |
| (11) | This adjustment includes some minor increases to fixed asset and decreases to goodwill due to the recording of the purchase price step up of those assets. See discussion on purchase price allocation errors above. |
Ecopetrol S.A. and Subsidiaries
Notes to the Consolidated Financial Statements
Years ended December 31, 2010, 2009 and 2008
Supplemental consolidated U.S. GAAP restated statement of income for the year ended December 31, 2009:
| | | 2009 | |
| | | Previously reported | | | Adjustments | | | Restated | |
| Revenue: | | | | | | | | | |
| Local sales | | $ | 13,808,720 | | | $ | - | | | $ | 13,808,720 | |
| Foreign sales | | | 15,742,854 | | | | - | | | | 15,742,854 | |
| Total revenue | | | 29,551,574 | | | | - | | | | 29,551,574 | |
| | | | | | | | | | | | | |
| Cost of sales | | | 19,136,478 | | | | (485,291 | ) | | | 18,651,187 | (5) (6) |
| | | | 10,415,096 | | | | 485,291 | | | | 10,900,387 | |
| | | | | | | | | | | | | |
| Operating expenses: | | | | | | | | | | | | |
| Administration | | | 1,990,603 | | | | (963,572 | ) | | | 1,027,031 | (7) (12) |
| Selling and projects | | | 1,967,139 | | | | (148,996 | ) | | | 1,818,143 | (1) |
| Operating income | | | 6,457,354 | | | | 1,597,859 | | | | 8,055,213 | |
| | | | | | | | | | | | | |
| Non-operating income, net | | | 549,981 | | | | 163,189 | | | | 713,170 | (4)(12) |
| Income before income tax | | | 7,007,335 | | | | 1,761,048 | | | | 8,768,383 | |
| | | | | | | | | | | | | |
| Income tax: | | | | | | | | | | | | |
| Current income tax | | | 1,948,819 | | | | - | | | | 1,948,819 | |
| Deferred income tax | | | 375,329 | | | | 569,815 | | | | 945,144 | (8) |
| | | | 2,324,148 | | | | 569,815 | | | | 2,893,963 | |
| Net income | | | 4,683,187 | | | | 1,191,233 | | | | 5,874,420 | |
| Less: Net (income) attributable to Non-controlling interest | | | (104,719 | ) | | | (51,397 | ) | | | (156,116 | ) (9) |
| Net Income attributable to Ecopetrol S.A. | | $ | 4,578,468 | | | $ | 1,139,836 | | | $ | 5,718,304 | |
| Earnings per share (Basic and diluted) attributable to Ecopetrol common shareholders | | $ | 113.13 | | | $ | 28.16 | | | $ | 141.29 | |
| Weighted-average shares outstanding (Basic and diluted) | | | 40,472,512,588 | | | | - | | | | 40,472,512,588 | |
| (1) | Represents the correction of immaterial errors identified in the preparation of U.S. GAAP reconciliation. |
| (4) | This adjustment primarily consists of the OIG adjustment of the contingent consideration, $165,332, increasing the investment balance and non-operating income. See the discussion on purchase price allocation errors for more detail. |
| (5) | This adjustment includes the duplicate U.S. GAAP fixed asset adjustments. This caused fixed assets to increase by $221,195 and a decrease in depreciation expense by the same amount. See fixed assets errors discussion above for details. |
| (6) | This adjustment primarily relates to the Asset Retirement Obligation error. This adjustment caused a decrease in cost of sales of $103,993. See the asset retirement obligation discussion above for detail. |
| (7) | A portion of this adjustment represents the employee benefit plan error. This resulted in a decrease in operating expenses of $1,173,990 and a decrease in OCI of the same amount. See the employee benefit plan discussion for details. |
| (8) | This represents the adjustment to deferred taxes as a result of the above discussed errors. In addition, it includes the adjustment to deferred taxes of $211,444 relating to the error in calculating the deferred tax effect of available-for-sale securities. A portion of the total deferred tax adjustment was recorded in the income statement and a portion in OCI. See deferred tax errors discussion above for detail. |
| (9) | Represents the non-controlling interest effect of the above discussed adjustments. |
| (12) | Included in this adjustment is the re-classification of employee benefit expense and other operating expenses, $595,000, from non-operating to operating expenses. In addition, it was offset by the incorrect calculation of the bargain purchase gain on the purchase of Hocol, resulting in a decrease in the gain and a decrease in deferred taxes of $285,000. |
| (13) | Represents re-classification of certain operating expenses that were incorrectly classified as non-operating expenses. |
Supplemental consolidated U.S. GAAP restated statement of cash flows for the year ended December 31, 2009:
Ecopetrol S.A. and Subsidiaries
Notes to the Consolidated Financial Statements
Years ended December 31, 2010, 2009 and 2008
The adjustment related to employee benefit plans did not have an impact on the 2009 U.S. GAAP statement of cash flows. The net effect of the other not material adjustments resulted in a decrease in U.S. GAAP operating cash flow of Ps$ 47,723. There was no adjustment to the investing and financing sections of the U.S. GAAP cash flow statement.
A) Reconciliation of net income attributable to Ecopetrol S.A.:
The following table presents the reconciliation of net income under Colombian Government Entity GAAP to net income under U.S. GAAP attributable to Ecopetrol S.A. for the years ended December 31, 2010, 2009 and 2008:
| | | | 2010 | | | 2009 | | | 2008 | |
| | | | | | | Restated | | | | |
| | Consolidated net income under Colombian Government Entity GAAP | | $ | 8,146,471 | | | $ | 5,132,054 | (*) | | $ | 11,629,677 | |
| i. | Investment securities: | | | | | | | | | | | | |
| | a. Unrealized gain (loss) | | | 63,545 | | | | 702,876 | | | | (924,715 | ) |
| | b. Impairment | | | (36,818 | ) | | | 28,083 | | | | 163,902 | |
| ii. | Investments in non-marketable securities: | | | | | | | | | | | | |
| | a. Equity method | | | (25,063 | ) | | | (181,991 | ) | | | 164,734 | |
| | b. Variable Interest Entity (VIE) | | | (13 | ) | | | 320,600 | | | | (367,743 | ) |
| | c. Impairment | | | (61,371 | ) | | | (4,810 | ) | | | - | |
| iii. | Derivatives | | | (24,736 | ) | | | 20,521 | | | | - | |
| iv. | Exchange of non-monetary assets | | | 23,640 | | | | 23,640 | | | | 55,623 | |
| v. | Deferred charges | | | (7,167 | ) | | | (35,702 | ) | | | (228 | ) |
| vi. | Employee benefit plans | | | 336,276 | | | | 342,451 | | | | (1,451,179 | ) |
| vii. | Provisions, allowances and contingencies | | | 67,629 | | | | 12,779 | | | | 1,082,434 | |
| viii. | Deferred income taxes | | | (1,159,147 | ) | | | (779,934 | ) | | | (159,891 | ) |
| ix. | Revenue recognition: | | | | | | | | | | | | |
| | a. Cost of sales – over and under | | | 158,609 | | | | (110,087 | ) | | | (8,887 | ) |
| | b. Other income | | | (11,685 | ) | | | 8,906 | | | | - | |
| x. | Inflation adjustment | | | 320,374 | | | | 177,300 | | | | 128,837 | |
| xi. | Inventories | | | (87,797 | ) | | | 16,853 | | | | 10,274 | |
| xii. | Lease accounting | | | (36,298 | ) | | | (43,163 | ) | | | 39,744 | |
| xiii. | Property, plant and equipment: | | | | | | | | | | | | |
| | a. Interest | | | (168,527 | ) | | | (63,779 | ) | | | - | |
| | b. Impairment | | | (157,446 | ) | | | (248,765 | ) | | | (121,296 | ) |
| | c. Capitalized expenses | | | 38,751 | | | | (118,376 | ) | | | 76,167 | |
| | d. Exchange difference | | | - | | | | (16,028 | ) | | | - | |
| xiv. | Depreciation, Depletion and Amortization | | | 702,527 | | | | 563,145 | | | | (1,478,851 | ) |
| xv. | Asset retirement obligations | | | 140,959 | | | | 297,702 | | | | (70,014 | ) |
| xvi. | Equity contributions: | | | | | | | | | | | | |
| | a. Incorporated institutional equity | | | 20,281 | | | | 20,692 | | | | 21,217 | |
| | b. Reversal of concession rights contributed as capital | | | 81,058 | | | | 18,199 | | | | 24,117 | |
| xvii. | Indebtedness cost | | | (1,670 | ) | | | 8,800 | | | | - | |
| xviii. | Business combinations: | | | | | | | | | | | | |
| | a. Goodwill | | | 172,660 | | | | 139,909 | | | | 27,512 | |
| | b. Fair value adjustments to assets and liabilities acquired | | | (176,590 | ) | | | (362,216 | ) | | | 449 | |
| xix. | Non-controlling interest | | | (124,394 | ) | | | (151,355 | ) | | | - | |
| xx. | Cumulative Translation Adjustment | | | 16,977 | | | | - | | | | - | |
| | Consolidated net income under U.S. GAAP attributable to Ecopetrol S.A. | | $ | 8,211,035 | | | $ | 5,718,304 | | | $ | 8,841,883 | |
(*)This restatement does not affect the financial information under Colombian Government Entity GAAP.
Ecopetrol S.A. and Subsidiaries
Notes to the Consolidated Financial Statements
Years ended December 31, 2010, 2009 and 2008
B) Reconciliation of Shareholders’ equity attributable to Ecopetrol S.A.:
The following table presents the reconciliation of Ecopetrol shareholders’ equity under Colombian Government Entity GAAP to Ecopetrol shareholders’ equity under U.S. GAAP attributable to Ecopetrol S.A for the years ended December 31, 2010 and 2009:
| | | | 2010 | | | 2009 | |
| | | | | | | Restated | |
| | Consolidated shareholders’ equity under Colombian Government Entity GAAP | | $ | 41,328,181 | | | $ | 32,569,957 | (*) |
| i. | Investment securities: | | | | | | | | |
| | a. Unrealized gain | | | 1,660,975 | | | | 645,644 | |
| ii. | Investments in non-marketable securities: | | | | | | | | |
| | a. Equity method | | | (1,496,057 | ) | | | (1,507,097 | ) |
| | b. Valuation surplus | | | (1,693,553 | ) | | | (1,029,443 | ) |
| | c. Variable Interest Entity (VIE) | | | 320,587 | | | | 320,600 | |
| | d. Impairment | | | (66,182 | ) | | | (4,810 | ) |
| iii. | Derivatives | | | 769 | | | | 25,505 | |
| iv. | Exchange of non-monetary assets | | | 709,654 | | | | 686,014 | |
| v. | Deferred charges | | | 17,026 | | | | 24,193 | |
| vi. | Employee benefit plans | | | (1,795,081 | ) | | | (1,504,997 | ) |
| vii. | Provisions – allowance and contingencies | | | 121,718 | | | | 54,089 | |
| viii. | Deferred income taxes | | | (2,039,099 | ) | | | (1,086,406 | ) |
| ix. | Revenue recognition: | | | | | | | | |
| | a. Cost of sales – over and under | | | (63,690 | ) | | | (98,121 | ) |
| | b. Other income | | | (1,128 | ) | | | 2,599 | |
| x. | Inflation adjustment | | | (3,515,570 | ) | | | (3,835,943 | ) |
| xi. | Inventories | | | (114,868 | ) | | | (27,103 | ) |
| xii. | Lease accounting | | | 363,315 | | | | 399,734 | |
| xiii. | Property, plant and equipment: | | | | | | | | |
| | a. Interest | | | (192,538 | ) | | | (24,011 | ) |
| | b. Revaluation of property, plant and equipment and public accounting effect | | | (9,375,123 | ) | | | (5,361,974 | ) |
| | c. Impairment | | | (1,870 | ) | | | (248,095 | ) |
| | d. Capitalized expenses | | | (577,976 | ) | | | (613,984 | ) |
| | e. Exchange difference | | | (233,563 | ) | | | (233,563 | ) |
| xiv. | Depreciation, Depletion and Amortization | | | 4,342,688 | | | | 3,616,158 | |
| xv. | Asset retirement obligations | | | 460,668 | | | | 321,358 | |
| xvi. | Equity contributions: | | | | | | | | |
| | a. Incorporated institutional equity | | | (64,412 | ) | | | (82,870 | ) |
| | b. Reversal of concession rights contributed as capital | | | (22,202 | ) | | | (103,260 | ) |
| xvii. | Indebtedness cost | | | 7,130 | | | | 8,800 | |
| xviii. | Business combinations: | | | | | | | | |
| | a. Goodwill | | | 142,611 | | | | 19,020 | |
| | b. Fair value adjustments to assets and liabilities acquired | | | (772,416 | ) | | | (595,826 | ) |
| xix. | Non-controlling interest | | | 206,626 | | | | 336,619 | |
| xx. | Cumulative Translation Adjustment | | | (481,336 | ) | | | (289,075 | ) |
| | Consolidated Ecopetrol shareholders’ equity under U.S. GAAP | | $ | 27,175,285 | | | $ | 22,383,712 | |
(*)This restatement does not affect the financial information under Colombian Government Entity GAAP.
Ecopetrol S.A. and Subsidiaries
Notes to the Consolidated Financial Statements
Years ended December 31, 2010, 2009 and 2008
C) Supplemental condensed financial statements under U.S. GAAP
C) 1. Supplemental consolidated balance sheets The condensed balance sheets of the Company as of December 31, 2010 and 2009 under U.S. GAAP are presented below:
| | | 2010 | | | 2009 | |
| | | | | | Restated | |
| Assets | | | | | | |
| Current assets: | | | | | | |
| Cash and cash equivalents | | $ | 3,910,745 | | | $ | 3,837,670 | |
| Investments | | | | | | | | |
| Available for sale | | | 58,935 | | | | 178,832 | |
| Held to maturity | | | 17,369 | | | | 7,876 | |
| Accounts and notes receivable, net | | | 2,971,109 | | | | 2,847,701 | |
| Inventories | | | 2,055,736 | | | | 1,945,656 | |
| Advances and deposits | | | 277,937 | | | | 343,942 | |
| Prepaid expenses and other assets | | | 491,762 | | | | 595,274 | |
| Deferred income taxes, net | | | 1,438,988 | | | | 809,918 | |
| Total current assets | | | 11,222,581 | | | | 10,566,869 | |
| Investments | | | | | | | | |
| Available for sale | | | 5,807,075 | | | | 3,187,078 | |
| Held to maturity | | | 110,755 | | | | 130,428 | |
| Equity Method | | | 932,721 | | | | 1,154,193 | |
| Accounts and notes receivable, net | | | 1,538,450 | | | | 606,775 | |
| Restricted assets | | | 391,021 | | | | 380,932 | |
| Property, plant and equipment, net | | | 17,744,665 | | | | 12,598,563 | |
| Natural and environmental resources, net | | | 10,191,727 | | | | 9,420,362 | |
| Goodwill | | | 1,380,632 | | | | 1,431,174 | |
| Deferred charges and other assets | | | 1,590,565 | | | | 1,398,190 | |
| Deferred income taxes, net | | | 1,405,987 | | | | 1,730,534 | |
| Direct finance lease long-term | | | 15,969 | | | | 19,254 | |
| Total Assets | | $ | 52,332,148 | | | $ | 42,624,352 | |
| Liabilities and shareholders’ equity | | | | | | | | |
| Current liabilities: | | | | | | | | |
| Financial obligations | | $ | 1,091,079 | | | $ | 437,081 | |
| Accounts payable and related parties | | | 4,344,528 | | | | 3,558,580 | |
| Capital lease liability | | | 74,681 | | | | 82,356 | |
| Taxes payable | | | 2,222,073 | | | | 567,903 | |
| Labor and pension plan obligations | | | 160,248 | | | | 165,463 | |
| Estimated liabilities and provisions | | | 1,173,401 | | | | 1,109,545 | |
| Total current liabilities | | | 9,066,010 | | | | 5,920,928 | |
| Financial obligations, long-term | | | 7,830,812 | | | | 5,725,099 | |
| Accounts payable, long-term | | | 651,692 | | | | 248,571 | |
| Capital lease liability | | | 242,592 | | | | 278,594 | |
| Pension plan obligation and other labor obligations, long-term | | | 4,787,698 | | | | 4,352,924 | |
| Estimated liabilities and provisions | | | 1,783,282 | | | | 2,270,813 | |
| Other long-term liabilities | | | 485,426 | | | | 808,993 | |
| Total non-current liabilities | | | 15,781,502 | | | | 13,684,994 | |
| Total liabilities | | | 24,847,512 | | | | 19,605,922 | |
| Shareholders’ equity of Ecopetrol | | | 27,175,285 | | | | 22,383,712 | |
| Non-controlling interest | | | 309,351 | | | | 634,718 | |
| Total equity | | | 27,484,636 | | | | 23,018,430 | |
| Total liabilities and shareholders’ equity | | $ | 52,332,148 | | | $ | 42,624,352 | |
Ecopetrol S.A. and Subsidiaries
Notes to the Consolidated Financial Statements
Years ended December 31, 2010, 2009 and 2008
C) 2. Supplemental consolidated statements of income
The statements of income of the Company for the years ended December 31, 2010, 2009 and 2008 under U.S. GAAP are presented below:
| | | 2010 | | | 2009 | | | 2008 | |
| | | | | | Restated | | | | |
| Revenue: | | | | | | | | | |
| Local sales | | $ | 18,291,606 | | | $ | 13,808,720 | | | $ | 21,550,543 | |
| Foreign sales | | | 22,587,718 | | | | 15,742,854 | | | | 12,298,670 | |
| Total revenue | | | 40,879,324 | | | | 29,551,574 | | | | 33,849,213 | |
| | | | | | | | | | | | | |
| Cost of sales | | | 24,059,620 | | | | 18,651,187 | | | | 17,927,991 | |
| | | | 16,819,704 | | | | 10,900,387 | | | | 15,921,222 | |
| | | | | | | | | | | | | |
| Operating expenses: | | | | | | | | | | | | |
| Administration | | | 856,880 | | | | 1,027,031 | | | | 4,246,426 | |
| Selling and projects | | | 2,084,310 | | | | 1,818,143 | | | | 1,834,485 | |
| Operating income | | | 13,878,514 | | | | 8,055,213 | | | | 9,840,311 | |
| | | | | | | | | | | | | |
| Non-operating income, net | | | 1,037,793 | | | | 713,170 | | | | 3,587,132 | |
| Income before income tax | | | 12,840,721 | | | | 8,768,383 | | | | 13,427,443 | |
| | | | | | | | | | | | | |
| Income tax: | | | | | | | | | | | | |
| Current income tax | | | 3,201,040 | | | | 1,948,819 | | | | 3,648,451 | |
| Deferred income tax | | | 1,196,757 | | | | 945,144 | | | | 930,853 | |
| | | | 4,397,797 | | | | 2,893,963 | | | | 4,579,304 | |
| Net income | | | 8,442,924 | | | | 5,874,420 | | | | 8,848,139 | |
| Less: Net (income) attributable to Non-controlling interest | | | (231,889 | ) | | | (156,116 | ) | | | (6,256 | ) |
| Net Income attributable to Ecopetrol S.A. | | $ | 8,211,035 | | | $ | 5,718,304 | | | $ | 8,841,883 | |
| Earnings per share (Basic and diluted) attributable to Ecopetrol common shareholders | | $ | 202.88 | | | $ | 141.29 | | | $ | 218.47 | |
| Weighted-average shares outstanding (Basic and diluted) | | | 40,472,512,588 | | | | 40,472,512,588 | | | | 40,472,512,588 | |
Ecopetrol S.A. and Subsidiaries
Notes to the Consolidated Financial Statements
Years ended December 31, 2010, 2009 and 2008
C) 3. Supplemental consolidated statements of cash flows
The statements of cash flows of the Company for the years ended December 31, 2010, 2009 and 2008 under U.S. GAAP are presented below:
| | | 2010 | | | 2009 | | | 2008 | |
| | | | | | Restated | | | | |
| Cash flows provided by operating activities: | | | | | | | | | |
| Net income | | $ | 8,442,924 | | | $ | 5,874,420 | | | $ | 8,848,139 | |
| Adjustments to reconcile net income to cash provided by operating activities: | | | | | | | | | | | | |
| Equity method in non-marketable securities | | | 25,063 | | | | 40,635 | | | | (106,845 | ) |
| Depreciation, depletion and amortization | | | 3,608,292 | | | | 4,106,221 | | | | 3,177,935 | |
| Impairment | | | 157,446 | | | | 399,854 | | | | 113,087 | |
| Provisions | | | (141,038 | ) | | | 362,424 | | | | (569,969 | ) |
| Deferred income tax | | | 1,196,757 | | | | 945,144 | | | | 930,853 | |
| Exchange (loss) gain | | | (137,054 | ) | | | (544,622 | ) | | | (1,390,953 | ) |
| Loss (gain) on retirement of property, plant and equipment | | | 42,340 | | | | - | | | | - | |
| Losses in retirement of investment in natural and environmental resources | | | 39,668 | | | | - | | | | - | |
| Other asset write-offs | | | 359,981 | | | | 4,810 | | | | - | |
| Net changes in operating assets and liabilities: | | | | | | | | | | | | |
| Accounts and notes receivable | | | 7,910 | | | | 3,730,221 | | | | (2,383,061 | ) |
| Inventories | | | (90,512 | ) | | | (45,289 | ) | | | (255,090 | ) |
| Deferred charges and other assets | | | (520,175 | ) | | | 171,413 | | | | (245,528 | ) |
| Accounts payable and related parties | | | 1,294,450 | | | | 1,398,162 | | | | 326,967 | |
| Taxes payable | | | 553,613 | | | | (4,384,524 | ) | | | 1,374,621 | |
| Labor obligations | | | (369,839 | ) | | | 304,686 | | | | 401,445 | |
| Estimated liabilities and provisions | | | (639,758 | ) | | | 121,387 | | | | 668,220 | |
| Bargain purchase gain | | | - | | | | (264,085 | ) | | | - | |
| Fair value of pre-existing participation of business combination | | | - | | | | 107,545 | | | | - | |
| Net cash provided by operating activities | | | 13,830,068 | | | | 12,177,313 | | | | 10,889,822 | |
| Cash flows from investing activities: | | | | | | | | | | | | |
| Payments in advance in acquisition of companies | | | (1,163,131 | ) | | | - | | | | - | |
| Payment for purchase of companies, net of cash acquired | | | - | | | | (4,061,289 | ) | | | (1,274,751 | ) |
| Purchase of investment securities | | | (11,808,784 | ) | | | (7,921,615 | ) | | | (27,814,744 | ) |
| Redemption of investment securities | | | 9,952,542 | | | | 12,250,387 | | | | 25,975,418 | |
| Proceeds from sales of property, plant and equipment | | | 4,751 | | | | 1,927 | | | | - | |
| Investment in natural and environmental resources | | | (3,759,410 | ) | | | (2,934,666 | ) | | | (3,574,418 | ) |
| Additions to property, plant and equipment | | | (5,946,298 | ) | | | (6,419,783 | ) | | | (3,869,577 | ) |
| Net cash used in investing activities | | | (12,720,330 | ) | | | (9,085,049 | ) | | | (10,558,072 | ) |
| Cash flows from financing activities: | | | | | | | | | | | | |
| Non-controlling interest obligations | | | (325,367 | ) | | | (340,178 | ) | | | 240,918 | |
| Repayment of financial obligations | | | (43,677 | ) | | | (310,420 | ) | | | (99,888 | ) |
| Proceeds from financial obligations | | | 2,959,345 | | | | 6,152,400 | | | | 235,720 | |
| Proceeds from issuance of shares | | | 525 | | | | 41,044 | | | | 832,919 | |
| Cash paid to acquire a non-controlling interest | | | - | | | | (998,903 | ) | | | - | |
| Dividends paid | | | (3,782,966 | ) | | | (8,902,602 | ) | | | (4,652,182 | ) |
| Net cash used in financing activities | | | (1,192,140 | ) | | | (4,358,659 | ) | | | (3,442,513 | ) |
| | | | | | | | | | | | | |
| Effect of exchange rate changes on cash | | | (155,476 | ) | | | (291,470 | ) | | | 83,923 | |
| Net increase (decrease) in cash and cash equivalents | | | 73,075 | | | | (974,925 | ) | | | (3,194,687 | ) |
| Cash and cash equivalents at beginning of year | | | 3,837,670 | | | | 4,812,595 | | | | 8,007,282 | |
| Cash and cash equivalents at end of year | | $ | 3,910,745 | | | $ | 3,837,670 | | | $ | 4,812,595 | |
Ecopetrol S.A. and Subsidiaries
Notes to the Consolidated Financial Statements
Years ended December 31, 2010, 2009 and 2008
| | | 2010 | | | 2009 | | | 2008 | |
| Supplemental cash flows information | | | | | | | | | |
| Cash paid during the year | | | | | | | | | |
| Interest | | $ | 404,708 | | | $ | 107,343 | | | $ | 9,874 | |
| Income taxes | | $ | 982,783 | | | $ | 3,934,441 | | | $ | 1,869,475 | |
| | | | | | | | | | | | | |
| Non-cash transactions | | | | | | | | | | | | |
| Liabilities assumed in business combinations | | $ | - | | | $ | 891,239 | | | $ | 184,807 | |
| Assets acquired through leasing contracts | | $ | - | | | $ | - | | | $ | 12,659 | |
| Increase of natural and environmental resources through asset retirement obligations | | $ | 779,913 | | | $ | 96,766 | | | $ | 137,903 | |
Under Colombian Government Entity GAAP as in effect for 2007, some deposits with banks were considered as short-term investments since they produce yields and the Company has defined them to be used for specific purposes. Under U.S. GAAP, these deposits are considered cash and cash equivalents. The amounts reclassified as of December 31, 2010, 2009 and 2008 were $183,967, $275,552 and $2,404,159. These deposits are valued at fair value.
Ecopetrol S.A. and Subsidiaries
Notes to the Consolidated Financial Statements
Years ended December 31, 2010, 2009 and 2008
C) 4. Supplemental consolidated statements of shareholders’ equity
The statements of shareholders’ equity of the Company for the years ended December 31, 2010, 2009 and 2008 under U.S. GAAP follows:
| | | Common Stock | | | | | | | | | | | | | | | | | | | | | | |
| | | Millions of shares | | | Value | | | Additional paid- in-capital | | | Comprehensive Income | | | Retained earnings | | | Accumulated Other Comprehensive income (loss) | | | Ecopetrol’s Equity | | | Non- Controlling Interest | | | Total Equity | |
| Balance at January 1, 2008 | | | 40,473 | | | | 10,113,334 | | | | 3,607,929 | | | | - | | | | 8,269,100 | | | | (999,332 | ) | | | 20,991,031 | | | | 571,597 | | | | 21,562,628 | |
| Business combination | | | | | | | | | | | | | | | | | | | | | | | | | | | | | | | 8,718 | | | | 8,718 | |
| Issuance of company shares | | | - | | | | 4,457 | | | | 828,462 | | | | - | | | | - | | | | - | | | | 832,919 | | | | 217,378 | | | | 1,050,297 | |
| Distribution of dividends | | | - | | | | - | | | | - | | | | - | | | | (4,654,340 | ) | | | - | | | | (4,654,340 | ) | | | (141,634 | ) | | | (4,795,974 | ) |
| Other contributions | | | - | | | | - | | | | - | | | | - | | | | (23,742 | ) | | | - | | | | (23,742 | ) | | | 139,566 | | | | 115,824 | |
| Comprehensive income: | | | - | | | | - | | | | - | | | | - | | | | - | | | | - | | | | - | | | | - | | | | - | |
| Net income | | | - | | | | - | | | | - | | | $ | 8,848,139 | | | | 8,841,883 | | | | - | | | | 8,841,883 | | | | 6,256 | | | | 8,848,139 | |
| Other Comprehensive income, net of tax: | | | | | | | | | | | | | | | | | | | | | | | | | | | | | | | | | | | | |
| Unrealized earnings on investment securities, net of tax effect of $(236,974) | | | - | | | | - | | | | - | | | | 524,729 | | | | - | | | | - | | | | 524,729 | | | | - | | | | 524,729 | |
| Actuarial gain (loss), net of tax effect of $(302,050) | | | - | | | | - | | | | - | | | | 613,251 | | | | - | | | | - | | | | 613,251 | | | | - | | | | 613,251 | |
| Translation adjustment | | | - | | | | - | | | | - | | | | 316,895 | | | | - | | | | - | | | | 300,004 | | | | 16,891 | | | | 316,895 | |
| Total other comprehensive income | | | - | | | | - | | | | - | | | | 1,454,875 | | | | - | | | | 1,437,984 | | | | - | | | | - | | | | - | |
| Comprehensive income | | | - | | | | - | | | | - | | | $ | 10,303,014 | | | | - | | | | - | | | | - | | | | - | | | | - | |
| Balance at December 31, 2008 | | | 40,473 | | | | 10,117,791 | | | | 4,436,391 | | | | | | | | 12,432,901 | | | | 438,652 | | | | 27,425,735 | | | | 818,772 | | | | 28,244,507 | |
| Business combination | | | - | | | | - | | | | - | | | | - | | | | - | | | | - | | | | - | | | | 21,530 | | | | 21,530 | |
| Acquired non-controlling interest | | | - | | | | - | | | | (432,766 | ) | | | - | | | | - | | | | - | | | | (432,766 | ) | | | (281,692 | ) | | | (714,458 | ) |
| Other non-controlling interest | | | - | | | | - | | | | - | | | | - | | | | - | | | | - | | | | - | | | | 22,767 | | | | 22,767 | |
| Issuance of company shares | | | - | | | | - | | | | 41,044 | | | | - | | | | - | | | | - | | | | 41,044 | | | | - | | | | 41,044 | |
| Distribution of dividends | | | - | | | | - | | | | - | | | | - | | | | (8,903,953 | ) | | | - | | | | (8,903,953 | ) | | | (89,736 | ) | | | (8,993,689 | ) |
| Comprehensive income: | | | - | | | | - | | | | - | | | | - | | | | - | | | | - | | | | - | | | | - | | | | - | |
| Net income | | | - | | | | - | | | | - | | | $ | 5,874,420 | | | | 5,718,304 | | | | - | | | | 5,718,304 | | | | 156,116 | | | | 5,874,420 | |
| Other Comprehensive income, net of tax: | | | | | | | | | | | | | | | | | | | | | | | | | | | | | | | | | | | | |
| Unrealized earnings on investment securities, net of tax effect of $226,832 | | | - | | | | - | | | | - | | | | 136,600 | | | | - | | | | - | | | | 136,600 | | | | - | | | | 136,600 | |
| Actuarial gain (loss), net of tax effect of $482,535 | | | - | | | | - | | | | - | | | | (979,694 | ) | | | - | | | | - | | | | (979,694 | ) | | | - | | | | (979,694 | ) |
| Translation adjustment | | | - | | | | - | | | | - | | | | (634,606 | ) | | | - | | | | - | | | | (621,559 | ) | | | (13,047 | ) | | | (634,606 | ) |
| Total other comprehensive income | | | - | | | | - | | | | - | | | | (1,477,700 | ) | | | - | | | | (1,464,653 | ) | | | - | | | | - | | | | - | |
| Comprehensive income | | | - | | | | - | | | | - | | | $ | 4,396,720 | | | | - | | | | - | | | | - | | | | - | | | | - | |
| Balance at December 31, 2009 | | | 40,473 | | | | 10,117,791 | | | | 4,044,669 | | | | | | | | 9,247,252 | | | | (1,026,001 | ) | | | 22,383,712 | | | | 634,718 | | | | 23,018,430 | |
| Acquired non-controlling interest | | | - | | | | - | | | | (804 | ) | | | - | | | | - | | | | - | | | | (804 | ) | | | 804 | | | | - | |
| Other non-controlling interest | | | - | | | | - | | | | - | | | | - | | | | - | | | | - | | | | - | | | | 4,444 | | | | 3,902 | |
| Issuance of company shares | | | - | | | | 337 | | | | 188 | | | | - | | | | - | | | | - | | | | 525 | | | | - | | | | 525 | |
| Distribution of dividends | | | - | | | | - | | | | - | | | | - | | | | (3,682,998 | ) | | | - | | | | (3,682,998 | ) | | | (418,558 | ) | | | (4,101,556 | ) |
| Return of Capital due to a Spin-Off | | | - | | | | - | | | | - | | | | - | | | | - | | | | - | | | | - | | | | (144,251 | ) | | | (144,251 | ) |
| Comprehensive income: | | | - | | | | - | | | | - | | | | - | | | | - | | | | - | | | | - | | | | - | | | | - | |
| Net income | | | - | | | | - | | | | - | | | $ | 8,442,925 | | | | 8,211,035 | | | | - | | | | 8,211,035 | | | | 231,889 | | | | 8,442,925 | |
| Other Comprehensive income, net of tax: | | | | | | | | | | | | | | | | | | | | | | | | | | | | | | | | | | | | |
| Unrealized earnings on investment securities, net of tax effect of $ 8,819 | | | - | | | | - | | | | - | | | | 997,425 | | | | - | | | | - | | | | 997,425 | | | | - | | | | 997,425 | |
| Actuarial gain (loss), net of tax effect of $ 206,699 | | | - | | | | - | | | | - | | | | (419,661 | ) | | | - | | | | - | | | | (419,661 | ) | | | - | | | | (419,661 | ) |
| Translation adjustment | | | - | | | | - | | | | - | | | | (313,642 | ) | | | - | | | | - | | | | (313,947 | ) | | | 305 | | | | (313,642 | ) |
| Total other comprehensive income | | | - | | | | - | | | | - | | | | 264,122 | | | | - | | | | 263,817 | | | | - | | | | - | | | | - | |
| Comprehensive income | | | - | | | | - | | | | - | | | $ | 8,707,047 | | | | - | | | | - | | | | - | | | | - | | | | - | |
| Balance at December 31, 2010 | | | 40,473 | | | $ | 10,118,128 | | | $ | 4,044,053 | | | | | | | $ | 13,775,291 | | | $ | (762,184 | ) | | $ | 27,175,285 | | | $ | 309,351 | | | $ | 27,484,636 | |
Ecopetrol S.A. and Subsidiaries
Notes to the Consolidated Financial Statements
Years ended December 31, 2010, 2009 and 2008
C) 5. Supplemental consolidated Comprehensive Income
| | | 2010 | | | 2009 | | | 2008 | |
| | | | | | | | | | |
| Net Income | | $ | 8,442,925 | | | $ | 5,874,420 | | | $ | 8,848,139 | |
| Other Comprehensive income, net of tax: | | | | | | | | | | | | |
| Unrealized earnings on investment securities, net of tax: | | | 997,425 | | | | 136,600 | | | | 524,729 | |
| Unrealized actuarial gain (loss), net of tax | | | (419,661 | ) | | | (979,694 | ) | | | 613,251 | |
| Translation adjustment | | | (313,642 | ) | | | (634,606 | ) | | | 316,895 | |
| Total other comprehensive income | | | 264,122 | | | | (1,477,700 | ) | | | 1,454,875 | |
| Comprehensive income | | | 8,707,047 | | | | 4,396,720 | | | | 10,303,014 | |
| Comprehensive (income) loss attributable to the non-controlling interest | | | (232,194 | ) | | | (143,069 | ) | | | (23,147 | ) |
| Comprehensive income attributable to Ecopetrol | | $ | 8,474,853 | | | $ | 4,253,651 | | | $ | 10,279,867 | |
A detail of accumulated other comprehensive income attributable to Ecopetrol, including the related income tax effects, is presented below:
| | | 2010 | |
| | | Before-Income Tax | | | (Income Tax Expense) | | | Net of Income Tax | |
| | | Amount | | | or Benefit | | | Amount | |
| | | | | | | | | | |
| Unrealized gain (loss) on securities available for sale | | $ | 1,734,255 | | | $ | (25,802 | ) | | $ | 1,708,453 | |
| Pension liability - net unamortized actuarial gain (loss) | | | (2,639,033 | ) | | | 870,881 | | | | (1,768,152 | ) |
| Cumulative translation adjustment | | | (702,485 | ) | | | - | | | | (702,485 | ) |
| Other comprehensive income (loss) | | $ | (1,607,263 | ) | | $ | 845,079 | | | $ | (762,184 | ) |
| | | 2009 | |
| | | Before-Income Tax | | | (Income Tax Expense) | | | Net of Income Tax | |
| | | Amount | | | or Benefit | | | Amount | |
| | | | | | | | | | |
| Unrealized gain (loss) on securities available for sale | | $ | 745,649 | | | $ | (34,621 | ) | | $ | 711,028 | |
| Pension liability - net unamortized actuarial gain (loss) | | | (2,012,673 | ) | | | 664,182 | | | | (1,348,491 | ) |
| Cumulative translation adjustment | | | (388,538 | ) | | | - | | | | (388,538 | ) |
| Other comprehensive income (loss) | | $ | (1,655,562 | ) | | $ | 629,561 | | | $ | (1,026,001 | ) |
| | | 2008 | |
| | | Before-Income Tax | | | (Income Tax Expense) | | | Net of Income Tax | |
| | | Amount | | | or Benefit | | | Amount | |
| Unrealized gain (loss) on securities available for sale | | $ | 835,882 | | | $ | (261,454 | ) | | $ | 574,428 | |
| Pension liability - net unamortized actuarial gain (loss) | | | (550,443 | ) | | | 181,646 | | | | (368,797 | ) |
| Cumulative translation adjustment | | | 233,021 | | | | - | | | | 233,021 | |
| Other comprehensive income (loss) | | $ | 518,460 | | | $ | (79,808 | ) | | $ | 438,652 | |
Ecopetrol S.A. and Subsidiaries
Notes to the Consolidated Financial Statements
Years ended December 31, 2010, 2009 and 2008
D) Summary of significant differences between Colombian Government Entity GAAP and U.S. GAAP and required U.S. GAAP disclosures
The Company’s investments include both marketable securities and non-marketable securities. Under RCP, the Company classifies investment securities based on the form of their investment return, either as fixed-yield investment or as variable-yield investments. Fixed-yield investments generally represent debt securities and are initially recorded at cost with subsequent adjustments to fair value recorded in the income statement. Variable-yield investments generally represent equity securities or interests in other entities and are initially recorded at cost. Subsequent adjustments to fair value are made with increases in fair value resulting in an increase to equity, while decreases in fair value are charged to the income statement. Fair values are determined using quoted market prices, if and when available. In the absence of quoted market prices, these investments are recorded at Management’s estimate of fair value using discounted cash flow techniques.
Under U.S. GAAP, the Company has classified its investment securities as held to maturity or available for sale, as defined in ASC Sub-topic 320-10-25, Accounting for Certain Investments in Debt and Equity Securities. Debt security investments for which the Company has demonstrated its positive ability and intent to hold until maturity are classified as held-to-maturity. Such investments are reported at amortized cost. Investments classified as available-for-sale are reported at fair value, with unrealized gains and losses reported, net of taxes, as a component of other comprehensive income.
In the event any other than temporary impairment of the values of the investments occurs, the impairment loss is recorded in income.
Ecopetrol S.A. and Subsidiaries
Notes to the Consolidated Financial Statements
Years ended December 31, 2010, 2009 and 2008
The Company’s short-term and long-term investments at December 31, 2010, December 31, 2009, and 2008 consist of the following:
| As of December 31, 2010 | | Aggregated Fair Value | | | Gross Unrealized Holding Gains | | | Gross Unrealized Holding Losses | | | Gross Recognized Losses | | | Cost Basis | |
| Short-term Investments - Available for Sale Securities: | | | | | | | | | | | | | | | |
| Securities issued or secured by Colombian government | | $ | 19,527 | | | $ | 255 | | | $ | - | | | $ | - | | | $ | 19,272 | |
| Securities issued or secured by financial entities | | | 39,408 | | | | - | | | | (1,338 | ) | | | (156 | ) | | | 40,902 | |
| Total Short-term Investments Classified as Available for Sale | | | 58,935 | | | | 255 | | | | (1,338 | ) | | | (156 | ) | | | 60,174 | |
| Long-term Investments - Available for Sale Securities: | | | | | | | | | | | | | | | | | | | | |
| Securities issued or secured by Colombian government | | | 1,622,809 | | | | 35,723 | | | | (5,546 | ) | | | (19,654 | ) | | | 1,612,286 | |
| Securities issued or secured by government sponsored enterprise (GSEs) | | | 1,498,957 | | | | 33,141 | | | | (1,021 | ) | | | (21,382 | ) | | | 1,488,219 | |
| Securities issued or secured by financial entities | | | 80,636 | | | | 201 | | | | (458 | ) | | | (1,430 | ) | | | 82,323 | |
| Securities issued or secured by government USA | | | 642,974 | | | | 9,061 | | | | (1,924 | ) | | | - | | | | 635,837 | |
| Other debt securities | | | 29,585 | | | | 459 | | | | - | | | | (136 | ) | | | 29,262 | |
| Securities issued by mixed- economy governmental entities | | | 1,932,115 | | | | 1,656,071 | | | | - | | | | - | | | | 276,044 | |
| Total Long-term Investments Classified as Available for Sale | | | 5,807,075 | | | | 1,734,656 | | | | (8,949 | ) | | | (42,602 | ) | | | 4,123,971 | |
| Total Available for Sale | | $ | 5,866,011 | | | $ | 1,734,911 | | | $ | (10,287 | ) | | $ | (42,758 | ) | | $ | 4,184,145 | |
| | | | | | | | | | | | | | | | | | | | | |
| | | Aggregated Fair Value | | | Gross Unrealized Holding Gains | | | Gross Unrealized Holding Losses | | | Net Carrying Amount | | | | | |
| Short-term Investments - Held to Maturity Securities: | | | | | | | | | | | | | | | | | | | | |
| Other debt securities | | $ | 7,700 | | | $ | - | | | $ | - | | | $ | 7,700 | | | | | |
| Securities issued or secured by government USA | | | 9,867 | | | | 199 | | | | - | | | | 9,669 | | | | | |
| Total Short-term Investments Classified as Held to Maturity | | | 17,567 | | | | 199 | | | | - | | | | 17,369 | | | | | |
| | | | | | | | | | | | | | | | | | | | | |
| Long-term Investments- Held to Maturity Securities: | | | | | | | | | | | | | | | | | | | | |
| Securities issued or secured by Colombian government | | | 120,322 | | | | 9,567 | | | | - | | | | 110,755 | | | | | |
| Total Long-term Investments Classified as Held to Maturity | | | 120,322 | | | | 9,567 | | | | - | | | | 110,755 | | | | | |
| Total Held to Maturity | | $ | 137,889 | | | $ | 9,766 | | | $ | - | | | $ | 128,124 | | | | | |
Ecopetrol S.A. and Subsidiaries
Notes to the Consolidated Financial Statements
Years ended December 31, 2010, 2009 and 2008
| As of December 31, 2009 | | Aggregated Fair Value | | | Gross Unrealized Holding Gains | | | Gross Unrealized Holding Losses | �� | | Gross Recognized Losses | | | Cost Basis | |
| Short-term Investments - Available for Sale Securities: | | | | | | | | | | | | | | | |
| Securities issued or secured by Colombian government | | $ | 126,376 | | | $ | 5,472 | | | $ | (965 | ) | | $ | (6,813 | ) | | $ | 128,682 | |
| Securities issued or secured by government sponsored enterprise (GSEs) | | | 41,863 | | | | 4,472 | | | | - | | | | - | | | | 37,391 | |
| Securities issued or secured by financial entities | | | 10,593 | | | | 1,093 | | | | - | | | | - | | | | 9,500 | |
| Total Short-term Investments Classified as Available for Sale | | | 178,832 | | | | 11,037 | | | | (965 | ) | | | (6,813 | ) | | | 175,573 | |
| Long-term Investments - Available for Sale Securities: | | | | | | | | | | | | | | | | | | | | |
| Securities issued or secured by Colombian government | | | 597,761 | | | | 51,997 | | | | (375 | ) | | | (5,001 | ) | | | 551,140 | |
| Securities issued or secured by government sponsored enterprise (GSEs) | | | 1,670,687 | | | | 48,476 | | | | - | | | | - | | | | 1,622,211 | |
| Securities issued or secured by financial entities | | | 592 | | | | - | | | | (412 | ) | | | - | | | | 1,004 | |
| Securities issued or secured by government USA | | | 153,186 | | | | - | | | | (20,667 | ) | | | - | | | | 173,852 | |
| Securities issued by mixed- economy governmental entities | | | 764,853 | | | | 640,740 | | | | - | | | | - | | | | 124,113 | |
| Total Long-term Investments Classified as Available for Sale | | | 3,187,078 | | | | 741,213 | | | | (21,454 | ) | | | (5,001 | ) | | | 2,472,320 | |
| Total Available for Sale | | $ | 3,365,910 | | | $ | 752,250 | | | $ | (22,419 | ) | | $ | (11,814 | ) | | $ | 2,647,893 | |
| | | | | | | | | | | | | | | | | | | | | |
| | | Aggregated Fair Value | | | Gross Unrealized Holding Gains | | | Gross Unrealized Holding Losses | | | Net Carrying Amount | | | | | |
| Short-term Investments - Held to Maturity Securities: | | | | | | | | | | | | | | | | | | | | |
| Other debt securities | | $ | 8,280 | | | $ | 404 | | | $ | - | | | $ | 7,876 | | | | | |
| Total Short-term Investments Classified as Held to Maturity | | | 8,280 | | | | 404 | | | | - | | | | 7,876 | | | | | |
| | | | | | | | | | | | | | | | | | | | | |
| Long-term Investments- Held to Maturity Securities: | | | | | | | | | | | | | | | | | | | | |
| Securities issued or secured by Colombian government | | | 129,769 | | | | 9,655 | | | | - | | | | 120,114 | | | | | |
| Securities issued or secured by government USA | | | 10,950 | | | | 636 | | | | - | | | | 10,314 | | | | | |
| Total Long-term Investments Classified as Held to Maturity | | | 140,719 | | | | 10,291 | | | | - | | | | 130,428 | | | | | |
| Total Held to Maturity | | $ | 148,999 | | | $ | 10,695 | | | $ | - | | | $ | 138,304 | | | | | |
Ecopetrol S.A. and Subsidiaries
Notes to the Consolidated Financial Statements
Years ended December 31, 2010, 2009 and 2008
| | | Aggregated Fair Value | | | Gross Unrealized Holding Gains | | | Gross Unrealized Holding Losses | | | Gross Recognized Losses | | | Cost Basis | |
| As of December 31, 2008 | | | | | | | | | | | | | | | |
| | | | | | | | | | | | | | | | |
| Short-term Investments - Available for Sale Securities: | | | | | | | | | | | | | | | |
| Securities issued or secured by Colombian government | | $ | 239,819 | | | $ | 17,825 | | | $ | (5,559 | ) | | $ | - | | | $ | 227,553 | |
| Securities issued or secured by government sponsored enterprise | | | 989,949 | | | | 148,808 | | | | (4,158 | ) | | | - | | | | 845,299 | |
| Securities issued or secured by financial entities | | | 92,535 | | | | 13,026 | | | | - | | | | - | | | | 79,509 | |
| Other debt securities | | | 23,457 | | | | 3,175 | | | | - | | | | - | | | | 20,282 | |
| Total Short-term Investments classified as Available for Sale | | | 1,345,760 | | | | 182,834 | | | | (9,717 | ) | | | - | | | | 1,172,643 | |
| | | | | | | | | | | | | | | | | | | | | |
| Long-term Investments - Available for Sale Securities: | | | | | | | | | | | | | | | | | | | | |
| Securities issued or secured by Colombian government | | | 821,342 | | | | 123,957 | | | | (6,259 | ) | | | - | | | | 724,733 | |
| Securities issued or secured by government sponsored enterprise | | | 2,515,761 | | | | 427,156 | | | | (215 | ) | | | (390 | ) | | | 2,110,413 | |
| Securities issued or secured by financial entities | | | 596,792 | | | | 110,263 | | | | (64 | ) | | | - | | | | 487,898 | |
| Securities issued or secured by government USA | | | 2,169,197 | | | | 35,436 | | | | (27,653 | ) | | | - | | | | 2,161,414 | |
| Other debt securities | | | 1,452 | | | | 144 | | | | - | | | | (95 | ) | | | 1,403 | |
| Total Long-term Investments classified as Available for Sale | | | 6,104,544 | | | | 696,956 | | | | (34,191 | ) | | | (485 | ) | | | 5,485,861 | |
| Total Available for Sale | | $ | 7,450,304 | | | $ | 879,790 | | | $ | (43,908 | ) | | $ | (485 | ) | | $ | 6,658,504 | |
| | | | | | | | | | | | | | | | | | | | | |
| | | Aggregated Fair Value | | | Gross Unrecognized Holding Gains | | | Gross Unrecognized Holding Losses | | | Net Carrying Amount | | | | | |
| Long-term Investments- Held to Maturity Securities | | | | | | | | | | | | | | | | | | | | |
| Securities issued or secured by Colombian government | | $ | 132,133 | | | $ | 993 | | | $ | (2,533 | ) | | $ | 133,693 | | | | | |
| Securities issued or secured by government USA | | | 12,436 | | | | 1,129 | | | | - | | | | 11,307 | | | | | |
| Other debt securities | | | 35,829 | | | | 1,733 | | | | - | | | | 34,096 | | | | | |
| Total Long-term Investments Classified as Held to Maturity | | $ | 180,398 | | | $ | 3,855 | | | $ | (2,533 | ) | | $ | 179,096 | | | | | |
Ecopetrol S.A. and Subsidiaries
Notes to the Consolidated Financial Statements
Years ended December 31, 2010, 2009 and 2008
The maturities of fixed-income investments at December 31, 2010, and December 31, 2009 are as follows:
| As of December 31, 2010 | |
| | | Available for Sale | | | Held to Maturity | |
| | | Cost Basis | | | Fair Value | | | Cost Basis | | | Fair Value | |
| | | | | | | | | | | | | |
| Due in one year or less | | $ | 60,174 | | | $ | 58,935 | | | $ | 17,369 | | | $ | 17,567 | |
| Due in one year to five years | | | 3,719,718 | | | | 5,396,547 | | | | 110,755 | | | | 120,322 | |
| Due in five years to ten years | | | 404,253 | | | | 410,529 | | | | - | | | | - | |
| Total | | $ | 4,184,145 | | | $ | 5,866,011 | | | $ | 128,124 | | | $ | 137,889 | |
| | | | | | | | | | | | | | | | | |
| As of December 31, 2009 | |
| | | Available for Sale | | | Held to Maturity | |
| | | Cost Basis | | | Fair Value | | | Cost Basis | | | Fair Value | |
| | | | | | | | | | | | | | | | | |
| Due in one year or less | | $ | 175,573 | | | $ | 178,832 | | | $ | 7,876 | | | $ | 8,280 | |
| Due in one year to five years | | | 2,397,956 | | | | 3,123,537 | | | | 130,428 | | | | 140,719 | |
| Due in five years to ten years | | | 74,364 | | | | 63,541 | | | | - | | | | - | |
| Total | | $ | 2,647,893 | | | $ | 3,365,910 | | | $ | 138,304 | | | $ | 148,999 | |
Amounts recorded in OCI in prior years realized on securities available for sale sold at December 31, 2010, 2009 and 2008 were:
| | | 2010 | | | 2009 | | | 2008 | |
| | | | | | | | | | |
| Losses | | $ | 67,225 | | | $ | 727,697 | | | $ | 188,060 | |
| Gains | | $ | 24,322 | | | $ | 38,539 | | | $ | 48,108 | |
Foreign Exchange Gains and Losses on Securities Available for Sale
Under RCP, changes in account balances resulting from variations in foreign currency exchange rates are reflected in the company’s net income. Under U.S. GAAP, any change in value of available-for-sale debt securities as a result of changes in foreign currency exchange rates is reflected in equity as required under the guidance in ASC subtopic 320-10-35. The amount reclassified from earnings under RCP purposes to other comprehensive income for U.S. GAAP purposes includes $18,931, $88,278 and $635,430 in 2010, 2009 and 2008, respectively that correspond to exchange rate differences.
Ecopetrol S.A. and Subsidiaries
Notes to the Consolidated Financial Statements
Years ended December 31, 2010, 2009 and 2008
Unrealized loss
Available-for-sale securities in an unrealized loss position as of December 31, 2010 and 2009 are as follows:
| 2010 | |
| | | Less Than 12 months | | | 12 Months of Greater | | | Total | |
| Descriptions of Securities | | Fair Value | | | Unrealized Losses | | | Fair Value | | | Unrealized Losses | | | Fair Value | | | Unrealized Losses | |
| Securities issued or secured by Colombian government | | | 346,690 | | | | 5,432 | | | | 6,483 | | | | 115 | | | | 353,173 | | | | 5,547 | |
| Securities issued or secured by financial entities | | | 69,756 | | | | 912 | | | | 121 | | | | 883 | | | | 69,877 | | | | 1,795 | |
| Securities issued or secured by government sponsored enterprise (GSEs) | | | 149,485 | | | | 1,021 | | | | 0 | | | | 0 | | | | 149,485 | | | | 1,021 | |
| Securities issued or secured by government USA | | | 186,224 | | | | 1,924 | | | | 0 | | | | 0 | | | | 186,224 | | | | 1,924 | |
| Total | | | 752,155 | | | | 9,289 | | | | 6,604 | | | | 998 | | | | 758,759 | | | | 10,287 | |
| 2009 | |
| | | Less Than 12 months | | | 12 Months of Greater | | | Total | |
| Descriptions of Securities | | Fair Value | | | Unrealized Losses | | | Fair Value | | | Unrealized Losses | | | Fair Value | | | Unrealized Losses | |
| Securities issued or secured by Colombian government | | | 18,608 | | | | 375 | | | | 27,013 | | | | 965 | | | | 45,620 | | | | 1,341 | |
| Securities issued or secured by financial entities | | | 0 | | | | 0 | | | | 592 | | | | 412 | | | | 592 | | | | 412 | |
| Securities issued or secured by government USA | | | 153,186 | | | | 20,667 | | | | 0 | | | | 0 | | | | 153,186 | | | | 20,667 | |
| Total | | | 171,793 | | | | 21,042 | | | | 27,605 | | | | 1,377 | | | | 199,398 | | | | 22,419 | |
The unrealized losses on Ecopetrol investments in debt securities were caused by interest rate increases. Because Ecopetrol does not intend to sell the investments and it is not more likely than not that Ecopetrol will be required to sell the investments before recovery of their amortized cost bases, which may be maturity, Ecopetrol does not consider those investments to be other-than-temporarily impaired at December 31, 2010 and 2009.
Restricted Assets
Under US GAAP the Company classifies Santiago de las Atalayas securities as restricted assets because its availability depends on a court decision.
These securities are represented in the chart below:
| 2010 | |
| Concept | | Amount | |
| Investments available for sale | | | 361,607 | |
| Investment fund * | | | 1,251 | |
| Cash | | | 28,164 | |
| Total | | | 391,022 | |
| 2009 | |
| Concept | | Amount | |
| Investments available for sale | | | 380,463 | |
| Investment fund * | | | 469 | |
| Total | | | 380,932 | |
*This fund receives the coupons and principal payments of the Santiago de las Atalayas investments in US dollars.
Ecopetrol S.A. and Subsidiaries
Notes to the Consolidated Financial Statements
Years ended December 31, 2010, 2009 and 2008
The investments related to Santiago de las Atalayas at December 31, 2010 consist of the following:
| As of December 31, 2010 | | Aggregated Fair Value | | | Gross Unrealized Holding Gains | | | Gross Unrealized Holding Losses | | | Gross Recognized Losses | | | Cost Basis | |
| Long-term Investments - Available for Sale Securities: | | | | | | | | | | | | | | | |
| Securities issued or secured by Colombian government | | $ | 201,172 | | | $ | 7,835 | | | $ | (2,126 | ) | | $ | (10,062 | ) | | $ | 205,525 | |
| Securities issued or secured by government USA | | | 160,435 | | | | 3,920 | | | | - | | | | - | | | | 156,515 | |
| Total Long-term Investments Classified as Available for Sale | | $ | 361,607 | | | $ | 11,755 | | | $ | (2,126 | ) | | $ | (10,062 | ) | | $ | 362,040 | |
| As of December 31, 2009 | | Aggregated Fair Value | | | Gross Unrealized Holding Gains | | | Gross Unrealized Holding Losses | | | Gross Recognized Losses | | | Cost Basis | |
| Long-term Investments - Available for Sale Securities: | | | | | | | | | | | | | | | |
| Securities issued or secured by Colombian government | | $ | 281,723 | | | $ | 18,481 | | | $ | (88 | ) | | $ | (4,188 | ) | | $ | 267,518 | |
| Securities issued or secured by government USA | | | 98,740 | | | | - | | | | (2,574 | | | | - | | | | 101,314 | |
| Total Long-term Investments Classified as Available for Sale | | $ | 380,463 | | | $ | 18,481 | | | $ | (2,662 | ) | | $ | (4,188 | ) | | $ | 368,832 | |
The unrealized gains and losses of the restricted assets are recognized in Other Comprehensive Income
Impairment of investment securities are reported differently under RCP and U.S. GAAP. Under RCP, impairment is also charged to earnings in the current period, but recoveries in value can be recorded up to the amount that was originally impaired. Under U.S. GAAP, other-than-temporary impairment should be charged to earnings in the current period and a new cost basis for the security is established. Subsequent increases in the cost basis of an impaired investment as a result of a recovery in fair value are included in Other Comprehensive Income.
The Company has a policy under which they conduct periodic reviews of marketable securities to assess whether other-than-temporary impairment exists. A number of factors are considered in performing an impairment analysis of securities. Those factors include:
| a) | the length of time and the extent to which the market value of the security has been less than cost; |
| b) | the financial condition and near-term prospects of the issuer, including any specific events which influence the operations of the issuer (such as changes in technology that may impair the earnings potential of the investment, or the discontinuance of a segment of a business that may affect the future earnings potential); and |
| c) | carry out the analysis as instructed in ASC paragraph 320-10-65-1 which includes the comparison of the fair value and the amortized cost, evaluates the intention to sell the security and if it is more-likely-than-not that the company will be required to sell the security prior to recovery, including the existence of a credit loss. |
The Company also takes into account changes in global and regional economic conditions and changes related to specific issuers or industries that could adversely affect these values.
Ecopetrol’s marketable security portfolio consists only of debt securities, such as treasury investments, bonds, and commercial papers. For this reason, the Company has an internal policy to limit the ratings of their investments and issuers to the following ratings:
| Credit Rating Agency | | Short-term Credit Rating | | Long-Term Credit Rating | |
| Standard & Poor’s | | A-1 | | A | |
| Moody’s Investors Services | | P-1 | | A2 | |
| Fitch Ratings | | F-1 | | A | |
Ecopetrol S.A. and Subsidiaries
Notes to the Consolidated Financial Statements
Years ended December 31, 2010, 2009 and 2008
The Company recognized impairment on its investment securities amounting to $44,851, $5,724 and $485 in 2010, 2009 and 2008, respectively.
| ii. | INVESTMENTS IN NON-MARKETABLE SECURITIES |
| a. | Equity Method and Valuation Surplus |
Under RCP, equity securities for which prices are unquoted, or for which trading volume is minimal, and the Company does not control the investee, are accounted for under the cost method and subsequently are valued by the shareholders' equity comparison method. Under the equity comparison method, the Company accounts for the difference between its proportionate share of shareholders' equity of the investee and its acquisition cost, adjusted for inflation through 2001, in a separate valuation account in the assets and equity (valuation surplus), if the proportionate share of shareholders’ equity of the investee is higher than its cost or as an allowance for losses, affecting net income, if the cost is higher than the proportionate share of shareholders’ equity of the investee. The proportionate share of shareholder’s equity is considered as the market value for this purpose and is known as book value. Under this method, the Company only records dividends as income when received. From 2008 the RCP incorporated the concept of significant influence for the recognition of investments in associated entities and established the equity method to update these investments.
Under U.S. GAAP, an investment in a non-marketable equity security is recorded using the equity method when the investor can exercise significant influence over the investee, or the cost method when significant influence cannot be exercised. Under the equity method of accounting for U.S. GAAP the carrying value of such an investment is adjusted to reflect (1) the Company’s proportionate share of earnings or losses from the investee and (2) additional investments and distributions of dividends. The Company’s proportionate share of income or loss is reported in earnings but any dividends or additional investments are reported only as an adjustment of the carrying amount of the investment.
The differences between the application of the cost and the equity method under U.S. GAAP were:Reversal of valuations and allowances for losses recorded under RCP
| · | Reversal of inflation adjustments recorded under RCP |
| · | Reversal of Goodwill amortization and impairment |
| · | Inclusion of share of earnings or losses under U.S. GAAP, net of intercompany eliminations. |
| · | Inclusion of share in Other Comprehensive Income under U.S. GAAP. |
The summary of the investments valued by the equity method for U.S. GAAP purposes is shown in the following table:
For the Year Ended December 31, 2010
| Company | | Percentage Of Voting Interest | | | Equity Calculated under U.S. GAAP | | | Equity Under Colombian GAAP | | | Assets Under Colombian GAAP | | | Liabilities Under Colombian GAAP | | | Net Income (Loss) Under Colombian GAAP | | | Investment Under U.S. GAAP Equity Method | | | Equity Method Accounting Adj (*) | | | Total Equity Method Investment | |
| | | | | | | | | | | | | | | | | | | | | | | | | | | | |
| Invercolsa S.A. | | | 32 | % | | $ | 312,711 | | | $ | 536,744 | | | $ | 537,319 | | | $ | 575 | | | $ | 87,755 | | | $ | 99,348 | | | $ | - | | | $ | 99,348 | |
| Serviport S.A. | | | 49 | % | | | 3,111 | | | | 14,656 | | | | 17,312 | | | | 2,656 | | | | (1,637 | ) | | | 1,524 | | | | - | | | | 1,524 | |
| Offshore International Group | | | 50 | % | | | 712,375 | | | | 780,957 | | | | 1,187,267 | | | | 406,310 | | | | 109,283 | | | | 356,188 | | | | 469,851 | | | | 826,039 | |
| Ecodiesel S.A. | | | 50 | % | | | 11,191 | | | | 23,411 | | | | 132,028 | | | | 108,617 | | | | 2,073 | | | | 5,596 | | | | - | | | | 5,596 | |
| Sociedad Portuaria de Olefinas | | | 50 | % | | | 427 | | | | 780 | | | | 1,022 | | | | 242 | | | | 33 | | | | 213 | | | | - | | | | 213 | |
| | | | | | | | | | | | | | | | | | | | | | | | | | | $ | 462,869 | | | $ | 469,851 | | | $ | 932,720 | |
Ecopetrol S.A. and Subsidiaries
Notes to the Consolidated Financial Statements
Years ended December 31, 2010, 2009 and 2008
For the Year Ended December 31, 2009
| Company | | Percentage Of Voting Interest | | | Equity Calculated under U.S. GAAP | | | Equity Under Colombian GAAP | | | Assets Under Colombian GAAP | | | Liabilities Under Colombian GAAP | | | Net Income (Loss) Under Colombian GAAP | | | Investment Under U.S. GAAP Equity Method | | | Equity Method Accounting Adj (*) | | | Total Equity Method Investment | |
| | | | | | | | | | | | | | | | | | | | | | | | | | | | |
| Invercolsa S.A. | | | 32 | % | | $ | 230,058 | | | $ | 468,507 | | | $ | 479,104 | | | $ | 10,597 | | | $ | 71,903 | | | $ | 73,078 | | | $ | - | | | $ | 73,078 | |
| Serviport S.A. | | | 49 | % | | | 4,742 | | | | 15,170 | | | | 17,557 | | | | 2,387 | | | | 941 | | | | 2,324 | | | | - | | | | 2,324 | |
| Offshore International Group | | | 50 | % | | | 640,866 | | | | 726,398 | | | | 860,151 | | | | 133,753 | | | | 69,845 | | | | 320,433 | | | | 754,875 | | | | 1,075,307 | |
| Ecodiesel S.A. | | | 50 | % | | | 5,985 | | | | 15,842 | | | | 91,641 | | | | 75,799 | | | | 336 | | | | 2,992 | | | | - | | | | 2,992 | |
| Sociedad Portuaria de Olefinas | | | 50 | % | | | 982 | | | | 834 | | | | 1,106 | | | | 272 | | | | (134 | ) | | | 491 | | | | - | | | | 491 | |
| | | | | | | | | | | | | | | | | | | | | | | | | | | $ | 399,318 | | | $ | 754,875 | | | $ | 1,154,193 | |
(*) Represents the purchase price allocation adjustments to Offshore International Group assets and liabilities as a result of the 2009 acquistion.
| | Concept | | 2010 | | | 2009 | |
| | Fair Value of Property, Plant and Equipment | | $ | 3,665 | | | $ | 4,236 | |
| | Goodwill net of Taxes | | | 466,186 | | | | 750,638 | |
| | Total | | $ | 469,851 | | | $ | 754,875 | |
The number of shares which the Company owns with respect to its investment in Invercolsa S.A. has been subject to a legal dispute with another Invercolsa shareholder. Lower court decisions had ruled in favor of both the Company and the other shareholder and a final court decision in January 2011 determined that 324 million shares, equivalent to 11.58% of the capital stock of Invercolsa should be returned to Ecopetrol. As a result Ecopetrol controls 43.35%. The dividends paid in respect of the shares returned to Ecopetrol are still in dispute, as well as the ownership of shares constituting 8.53% of Invercolsa. The resolution of these matters is still pending.
Because the court decision was issued in January 2011, and the registration of the shares on behalf of Ecopetrol was completed in February 2011, Ecopetrol recognized the investment under the equity method, applying the percentage owned as of December 31, 2010 (31.76%) as the transaction represents a contingency gain. As such, the amount of the Company’s investment is adjusted only for its proportionate share of Invercolsa’s net income or loss and any dividends received or additional investments made, and no adjustment is made for changes in Invercolsa’s participation.
| b. | Variable Interest Entity (VIE) |
Under U.S. GAAP, ASC paragraph 810-10-15-13 requires that consolidated financial statements include subsidiaries in which the Company has a controlling financial interest, i.e., a majority voting interest. However, application of the majority voting interest requirement to certain types of entities may not identify the party with a controlling financial interest because that interest may be achieved through other arrangements. Thus, the U.S. GAAP rules also require a Company to consolidate a variable interest entity if that company has a primary beneficiary that has the power to direct the activities of the VIE that most significantly affect the entity’s economic performance and will absorb a majority of the entity’s expected losses, receive a majority of the entity’s expected residual returns, or both. In determining whether it is a primary beneficiary of a variable interest entity, a company shall treat variable interests in that same entity held by the Company’s related parties as its own interest. Under RCP, consolidated financial statements only include subsidiaries in which the Company has the majority voting interest.
Ecopetrol owned 35.29% of Oleoducto Central S.A. (hereinafter “Ocensa”) and was consolidated considering that it was considered the primary beneficiary based on its variable interests in Ocensa. In addition, in March 2009, through a direct transaction with Enbridge Inc., Ecopetrol acquired an additional 24.71% ownership interest for $998,903 in cash. As of such date, Ecopetrol’s participation in Ocensa became 60%. Until March 2009, Ocensa was valued at cost under RCP.
According to Colombian Government Entity GAAP, the acquisition of the 24.71% of the non-controlling interest is accounted for as an increase in investment and goodwill; under U.S. GAAP, the ownership interest increase in a subsidiary is an equity transaction , Non-controlling Interests in Consolidated Financial Statements (ASC Subtopic 810-10, Consolidation - Overall) is accounted for as an equity transaction which decreases additional paid-in-capital in by the difference between the non-controlling interest carrying amount and the consideration paid. Under U.S. GAAP, the additional paid-in capital effect of the transaction was $610,007. A corresponding deferred income tax effect of $177,241 was recorded, resulting in a net effect of $432,766.
Ecopetrol S.A. and Subsidiaries
Notes to the Consolidated Financial Statements
Years ended December 31, 2010, 2009 and 2008
The summary of Ocensa’s financial information under U.S. GAAP as of and for the years ended December 31, 2009, and 2008, are as follows:
| | | 2009 | | | 2008 | |
| | | | | | | |
| Assets | | $ | 1,268,681 | | | $ | 1,000,110 | |
| Liabilities | | | (61,566 | ) | | | (106,447 | ) |
| Equity | | | 1,207,115 | | | | 893,663 | |
| Net income | | $ | 497,471 | | | $ | 10,284 | |
In October 2009, the subsidiary Oleducto de los Llanos Orientales (hereinafter “ODL”) assigned its rights under a "Ship or Pay” contract for the completion of a securitization for the purpose of obtaining the funds required to finish the second phase of the project, the refund of capital to the associates, and maintain the capital structure initially agreed. The structure of this issuance was made through an assets of a trust fund (hereinafter “Fideicomiso P.A. ODL - ECOPETROL”) administered by Corficolombiana S.A., who have to pay the security holder on the due dates. Additionally, each month, the trust company must report to ODL income and expenses that are generated in this process and that are paid, if applicable, to ODL as advances.
Based on the ASC 810 definition, ODL determined that since they are responsible for the entire operation of the Fideicomiso P. A. ODL - ECOPETROL, it qualified as a Variable Interest Entity and therefore consolidated its financial statements for U.S. GAAP purposes.
The summary of Fideicomiso P. A. ODL - ECOPETROL financial information under USGAAP as of and for the years ended December 31, 2010 and 2009, are as follows:
| | | 2010 | | | 2009 | |
| | | | | | | |
| Assets | | $ | 522,342 | | | $ | 514,484 | |
| Liabilities | | | (509,288 | ) | | | (512,271 | ) |
| Equity | | $ | 13,054 | | | $ | 2,213 | |
| Net income | | $ | 13,052 | | | $ | 2,212 | |
Under Colombian Government Entity GAAP it is not mandatory to perform impairment tests of the Equity Method Investments unless positive evidence is identified. For the year 2010, the investment in Offshore International Group was evaluated for impairment resulting in a loss of $287,662.
The impairment under U.S. GAAP ASC paragraph 325-20-35 1A and 2, assets held at cost, including non-marketable equity investments, should be evaluated for impairment if the Company is aware of any events or changes in circumstances that may have significant adverse effects on the fair value of the investment. If the Company believes such circumstances exist, the Company would estimate the asset’s fair value and compare that to cost to determine if any impairment is necessary. During 2010 the Company evaluated its investments and concluded there was an impairment in Offshore International Group “OIG” under both Colombian Government Entity GAAP and U.S. GAAP. This 2010 impairment loss under U.S.GAAP equaled $349,033. For the year 2009 the Company experienced a U.S. GAAP impairment loss of $4,810.
Ecopetrol S.A. and Subsidiaries
Notes to the Consolidated Financial Statements
Years ended December 31, 2010, 2009 and 2008
Ecopetrol is exposed to market risk from changes in foreign currency exchange rates, interest rate risk of its financial obligations and to commodity price risk, resulting from the fluctuations of international crude oil prices which affect its earnings, cash flows and financial condition. Ecopetrol manages its exposure to these market risks through its regular operating and financial activities and, when appropriate, through the use of derivative financial instruments. Ecopetrol has established a control to assess, approve and monitor derivative financial instrument activities. Ecopetrol does not buy, hold or sell derivative financial instruments for trading purposes. Ecopetrol's primary foreign currency exposures relate to the U.S. dollar; however, Ecopetrol manages its foreign currency risk position internally, using non-deliverable forwards, according to the size of the mismatches between its asset-liability position in U.S. Dollars and its asset-liability position in Colombian pesos. If no mismatches occur Ecopetrol has a perfect natural hedge. Ecopetrol also utilizes other derivative agreements to mitigate changes in the fair value of commodities. None of the derivatives were designated or documented for hedge accounting.
The Company periodically enters into call and put option contracts to cover the price risk associated with fluctuations in market prices of asphalt. The option contracts limit the unfavorable effect that the price increase will have on asphalt. The maximum term over which the Company is managing its exposures to the variability for commodity price risk is 12 months.
As of December 31, 2009, the Company had entered into four (4) commodity call options with an effective date of January 1, 2010 and a termination date of December 31, 2010. Under these call options, Ecopetrol had the right to purchase 2.040.000 bls. equivalent of asphalt.
As of December 31, 2010, the Company had entered into a commodity put option with an effective date of January 1, 2011 and a termination date of December 31, 2011. Under these put options, Ecopetrol has the right to sell 2.000.004 bls. equivalent of crude oil.
The subsidiary Refineria de Cartagena has 41 foreign currency delivery forward transactions outstanding to cover the exchange rate exposure created by the purchase of property plant and equipment in Euros. The purchased equipment is part of the new refinery under construction.
Total results recognized related to derivative activities during the periods are as follows:
| | | 2010 | | | 2009 | | | 2008 | |
| | | Realized | | | Unrealized | | | Realized | | | Unrealized | | | Realized | | | Unrealized | |
| Options (1) | | $ | (13,175 | ) | | $ | (1,474 | ) | | $ | 66,889 | | | $ | 25,943 | | | $ | - | | | $ | - | |
| Swaps | | | (7,031 | ) | | | 2,242 | | | | (23,757 | ) | | | (438 | ) | | | (45,024 | ) | | | - | |
| Forwards | | | 245 | | | | 107 | | | | 5,862 | | | | - | | | | (24,879 | ) | | | - | |
| Total | | $ | (19,962 | ) | | $ | 875 | | | $ | 48,994 | | | $ | 25,505 | | | $ | (69,903 | ) | | $ | - | |
| (1) | Amounts include premiums paid |
Under RCP, each derivative has its own accounting treatment depending on the type of derivative. Option premiums paid are recorded as deferred charges and amortized to the income statement as financial expense in a straight line basis over the life of the contract, the option contract is recognized in memo accounts unless it is likely to be exercised, the gain is recognized as an investment. Swap and forward contracts net result is recorded as an investment. In all cases, gains and losses are recognized in earnings as financial income or expense. Amounts receivable or payable upon maturity resulting from net payments are recorded using current rates for the period.
U.S. GAAP requires that all derivative instruments be recorded on the balance sheet at fair value. Changes in the fair value of derivatives are recorded each period in current earnings. See note xxvii for amounts recorded on the balance sheet relating to derivative instruments. The fair value of derivatives instruments is recorded other assets and other liabilities.
Ecopetrol S.A. and Subsidiaries
Notes to the Consolidated Financial Statements
Years ended December 31, 2010, 2009 and 2008
Under U.S. GAAP, embedded derivative instruments shall be separated from the host contract, and accounted for using different measurement attributes, if certain conditions are met. In the case of the Company, some contracts to which the Company is counterparty include embedded foreign exchange derivatives. According to ASC paragraph 815-15-15-10 through 13 these contracts do not require separate accounting for the embedded derivative and the host contract because contract payments are made in the functional currency of a party to the contract or contract payments are made in a currency in which the price of the good or service delivered is routinely denominated in international commerce.
Gas imbalance agreements were evaluated to identify if they were derivatives. Management concluded these agreements are not derivatives since they do not contain fixed notional amounts.
| iv. | EXCHANGE OF NON-MONETARY ASSETS |
During 2007, the Company exchanged a refinery business with a book value of $234,371 for a 49% interest in Refinería de Cartagena S.A. The Company estimated the fair value of the 49% investment as $1,369,546. Under RCP, this difference between the cost of the assets given and the fair value of the assets received was recorded as an increase to asset revaluation and equity. However, under ASC Subtopic 845-10-30, 51% of the difference between the book value of the Refinery and the fair value of the assets received, which the Company determined to be a more reliable indicator of the value of the exchange since the fair value of the investment was greater, was recorded in the results of operations as a gain in the amount of $578,939. The remaining 49% of the difference, equivalent to $556,236 is to be amortized over the useful life of the equipment. The reconciliation includes $23,640 in 2010 and 2009 and $55,623 in 2008 corresponding to the amortization of the deferred gain.
Under RCP, the Company deferred certain pre-operating expenses and other deferred charges, which are expensed as incurred under U.S. GAAP. These charges include research studies and projects in the research and development phase. Normal recurring maintenance is also included in this category. Under U.S. GAAP, the mentioned deferred charges are not applicable and must be reclassified or reversed.
| vi. | EMPLOYEE BENEFIT PLANS |
Under Colombian Government Entity GAAP, the Company estimates the net present value of its actuarial liability for all pension and other post-retirement obligations. Annually, the Company estimates the net present value of the actuarial liability and adjusts the recorded liability accordingly. The amount of the adjustment is reflected in the Company’s net income.
For other post-retirement benefits, the payments are made according to seniority and the salary at the time of retirement, as stipulated in the Collective Labor Agreement and the Agreement No. 01.
Under the post-retirement benefits plan for Ecopetrol personnel, the Company covers 90% of educational expenses for children of employees, including enrollment fees, tuition and other associated costs. A fixed annual sum, depending on grade level, is also provided for the acquisition of textbooks. Educational coverage includes kindergarten, elementary school, high school and college. Ecopetrol´s financial statements must also show the cost of post-retirement educational benefits for children of retired employees, since benefits continue irrespective of retirement or death.
According to the Collective Labor Agreement and Agreement No. 01, the Company will pay for health services for employees and enrolled family members. Health services include: office visits and required laboratory services, drugs, diagnostic examinations, ambulatory treatment, hospitalization due to illness or accident, surgery due to illness or accident, maternity and rehabilitation treatments and orthopedic parts. Therefore, such post-retirement health benefit costs are recorded in the RCP Ecopetrol financial statements, since retired workers and enrolled family members continue to receive full medical coverage. The same is true for deceased non-retired employees.
Ecopetrol S.A. and Subsidiaries
Notes to the Consolidated Financial Statements
Years ended December 31, 2010, 2009 and 2008
U.S. GAAP requires the recognition of pension, health care and education plans costs based on actuarial computations under a prescribed methodology which differs from that used under RCP. For purposes of U.S. GAAP reconciliation, the transition obligation is calculated at the date the Company adopted the ASC Topic 420, 715, 805, 835, 958 and 980 Employers Accounting for Pensions and is being amortized from January 1, 1989. The transition obligation for the education and medical plan is being amortized from January 1, 1995.
Under Colombian law, employees are entitled to one month salary for each year of service. This benefit is known as the “severance obligation” or “cesantias”. This benefit accumulates during the time of employment and is paid to employees upon their termination or retirement from Ecopetrol. However, employees may request advanced benefit payments at any time. In 1990, the Colombian government revised its labor regulations to permit companies, subject to employee approval, to pay the severance obligation to their employees on a current basis. Law 50 of 1990 also enabled each employee to freely choose yearly which trust fund would manage the amount accrued during each year in which they are eligible for severance payments. This amount must be transferred by the company to the trust fund no later than the next subsequent year.
In addition, the Company under Colombian law must pay pension bonds for certain employees when they leave Ecopetrol. And those bonds payable accrue interest at the DTF rate, which rate averaged 5.6% for 2009, and 6.27% for 2010.
The economic assumptions used in the determination of pension obligations under U.S. GAAP differ from those used under RCP because the latter are established annually by the Colombian regulations.
The combined costs for the above mentioned benefit plans, determined using U.S. GAAP, for the years ended December 31, 2010, 2009 and 2008 are summarized below: (all obligations were measured at the year-end)
| | | 2010 | | | 2009 | | | 2008 | |
Components of net periodic benefit costs: | | Pension | | | Other Benefits (*) | | | Total | | | Pension | | | Other Benefits (*) | | | Total | | | Pension | | | Other Benefits (*) | | | Total | |
| Service cost | | $ | 46,686 | | | $ | 32,840 | | | $ | 79,526 | | | $ | 21,126 | | | $ | 40,279 | | | $ | 61,405 | | | $ | 57,957 | | | $ | 20,549 | | | $ | 78,506 | |
| Interest cost | | | 845,144 | | | | 386,159 | | | | 1,231,303 | | | | 1,037,577 | | | | 446,502 | | | | 1,484,079 | | | | 861,042 | | | | 787,838 | | | | 1,648,880 | |
| Expected Return on plan assets | | | (1,303,018 | ) | | | (290,075 | ) | | | (1,593,093 | ) | | | (1,013,399 | ) | | | (238,744 | ) | | | (1,252,143 | ) | | | (366,541 | ) | | | (78,806 | ) | | | (445,347 | ) |
| Amortization of net (gain) or loss | | | 22,977 | | | | 41,293 | | | | 64,270 | | | | | | | | 10,009 | | | | 10,009 | | | | 270,231 | | | | 143,337 | | | | 413,568 | |
| Net periodic pension cost under U.S. GAAP - (gain) or loss | | | (388,211 | ) | | | 170,217 | | | | (217,994 | ) | | | 45,304 | | | | 258,046 | | | | 303,350 | | | | 822,689 | | | | 872,918 | | | | 1,695,607 | |
| Net periodic pension cost under Colombian GAAP (gain) or loss | | | 264,693 | | | | 146,411 | | | | 118,282 | | | | 118,677 | | | | 527,124 | | | | 645,801 | | | | 608,473 | | | | 852,901 | | | | 244,428 | |
| Difference to be recognized under U.S. GAAP (income) loss | | $ | (652,904 | ) | | $ | 316,628 | | | $ | (336,276 | ) | | $ | (73,373 | ) | | $ | (269,078 | ) | | $ | (342,451 | ) | | $ | 1,431,162 | | | $ | 20,017 | | | $ | 1,451,179 | |
(*) Other benefits include education, health, pension bonds and accrued severance.
Ecopetrol S.A. and Subsidiaries
Notes to the Consolidated Financial Statements
Years ended December 31, 2010, 2009 and 2008
The changes in the benefit obligations and in plan assets for the above mentioned benefit plans, determined using U.S. GAAP, for the years ended December 31, 2010 and 2009, are summarized below:
| | | Pension Plans | | | Other Benefits | |
| | | 2010 | | | 2009 | | | 2010 | | | 2009 | |
| Reconciliation of project benefit obligation: | | | | | | | | | | | | |
| Project benefit obligation as of January 1 | | $ | (10,338,890 | ) | | $ | (8,910,139 | ) | | $ | (4,844,216 | ) | | $ | (3,838,042 | ) |
| Cost of service | | | (46,686 | ) | | | (21,126 | ) | | | (32,840 | ) | | | (40,279 | ) |
| Cost of interest | | | (845,144 | ) | | | (1,037,577 | ) | | | (386,159 | ) | | | (446,502 | ) |
| Actuarial (gain) loss | | | (58,216 | ) | | | (920,726 | ) | | | 120,377 | | | | (729,243 | ) |
| Benefit payments | | | 602,693 | | | | 550,678 | | | | 254,017 | | | | 209,850 | |
| Projected benefit obligation as of December 31 | | | (10,686,243 | ) | | | (10,338,890 | ) | | | (4,888,821 | ) | | | (4,844,216 | ) |
Reconciliation of plan assets: | | | | | | | | | | | | | | | | |
| Fair value of plan assets as of January 1 | | | 8,973,955 | | | | 8,501,667 | | | | 1,997,767 | | | | 1,671,124 | |
| Fund Contribution | | | - | | | | - | | | | - | | | | 80,264 | |
| Expected return on plan assets | | | 1,303,018 | | | | 1,013,399 | | | | 290,075 | | | | 238,744 | |
| Benefits paid | | | (602,693 | ) | | | (550,678 | ) | | | (6,776 | ) | | | - | |
| Actuarial (gain) loss on plan assets | | | (569,101 | ) | | | 9,567 | | | | (183,690 | ) | | | 168,163 | |
| Fair value of plan assets as of December 31 | | | 9,105,179 | | | | 8,973,955 | | | | 2,097,376 | | | | 1,997,767 | |
| | | | | | | | | | | | | | | | | |
| Projected benefit obligation, as of December 31 | | | 80,142 | | | | (308,069 | ) | | | (1,813,618 | ) | | | (1,890,642 | ) |
| Amounts recognized in other comprehensive (income) loss | | | (1,661,206 | ) | | | (1,056,866 | ) | | | (977,827 | ) | | | (955,807 | ) |
| | | | | | | | | | | | | | | | | |
| Net liability | | | (1,581,064 | ) | | | (1,364,935 | ) | | | (2,791,445 | ) | | | (2,846,449 | ) |
| Net liability under RCP | | | 383,380 | | | | 118,676 | | | | 2,194,048 | | | | 2,587,711 | |
| Net effect under pension plan and other benefits | | $ | (1,197,684 | ) | | $ | (1,246,259 | ) | | $ | (597,397 | ) | | $ | (258,738 | ) |
Net liability of employee benefit plans is classified as follows:
| | | Pension Plans | | | Other Benefits | | | TOTAL | |
| | | 2010 | | | 2009 | | | 2010 | | | 2009 | | | 2010 | | | 2009 | |
| Current portion | | - | | | - | | | | (468,350 | ) | | | (246,881 | ) | | | (468,350 | ) | | | (246,881 | ) |
| Long-term portion | | | (1,581,064 | ) | | | (1,364,935 | ) | | | (2,323,095 | ) | | | (2,599,568 | ) | | | (3,904,159 | ) | | | (3,964,503 | ) |
| Net liability | | | (1,581,064 | ) | | | (1,364,935 | ) | | | (2,791,445 | ) | | | (2,846,449 | ) | | | (4,372,509 | ) | | | (4,211,384 | ) |
The decrease in the asset related to the health fund in 2009 amounting to 80,264, treated as a contribution, was originated in the remaining asset once the partial transfer “conmutación” was completed in 2008.
Under U.S. GAAP, the Company applies the provisions of Statement on ASC Topic 420, 715, 805, 835, 958 and 980, as amended by Statement on ASC Topic No. 450 and 715, Employers Disclosure about Pension and Other Post-retirement Benefits, an amendment to ASC Topic No. 420, 715, 805, 835, 980, 712 and 710. The Company adopted Statement on ASC Topic No. 715 and 958 Employers Accounting for Defined Benefit Pension and Other Postretirement Plans effective January 1, 2006, in respect of its defined benefits pension, health and education plans. Accordingly, the Company recognizes the overfunded and underfunded status of each of its defined benefit pension and other postretirement benefit plans as an asset or liability and to reflect changes in the funded status through Accumulated Other Comprehensive Income, as a separate component of shareholders’ equity. The actuarial calculations are estimated at year-end dates.
Ecopetrol S.A. and Subsidiaries
Notes to the Consolidated Financial Statements
Years ended December 31, 2010, 2009 and 2008
As of December 31, 2010 and 2009, net obligation amounts recognized in the balance sheet related to pension, health, education, bonds and severance obligations consist of:
| | | 2010 | | | 2009 | |
| Long-term liability | | | | | | |
| Pension | | $ | (1,581,064 | ) | | $ | (1,364,935 | ) |
| Health | | | (2,799,628 | ) | | | (2,343,212 | ) |
| Education | | | (413,241 | ) | | | (437,424 | ) |
| Bonds | | | 899,400 | | | | 191,319 | |
| Severance | | | (9,626 | ) | | | (10,251 | ) |
| Total long-term liability | | $ | (3,904,159 | ) | | $ | (3,964,503 | ) |
As of December 31, 2010 and 2009, the amounts recognized in accumulated other comprehensive loss, related to pension, health and education obligations consist of:
| | | 2010 | | | 2009 | | | 2008 | |
| Other comprehensive income | | | | | | | | | |
| | | | | | | | | | |
| Pension | | $ | (1,661,206 | ) | | $ | (1,056,866 | ) | | $ | (145,707 | ) |
| Health | | | (1,373,096 | ) | | | (951,590 | ) | | | (343,811 | ) |
| Education | | | (139,445 | ) | | | (144,247 | ) | | | (60,925 | ) |
| Bonds | | | 534,714 | | | | 140,030 | | | | | |
| Total other comprehensive income | | | (2,639,033 | ) | | | (2,012,673 | ) | | | (550,443 | ) |
| Deferred income tax effect | | | 870,881 | | | | 664,182 | | | | 181,646 | |
| Total | | $ | (1,768,152 | ) | | $ | (1,348,491 | ) | | $ | (368,797 | ) |
The significant variation in the other comprehensive income 2009 compared to the year 2008, of pension plans and health are due to the impact they had retained product actuarial losses of the applicability of the mortality table, for pension plan was $920,726 and for pension medical was $616,837.
The Company expects the following amounts in other comprehensive income to be recognized as components of net periodic pension cost during 2011:
| | | Years for Amortization | | | Amortization | |
| Pension | | | 0.67 | | | $ | 592,582 | |
| Bonds | | | 13.03 | | | $ | 24,941 | |
| Health | | | 19.24 | | | $ | 49,898 | |
| Education | | | 19.24 | | | $ | 4,100 | |
As of December 31, 2010 and 2009, the amounts of liability for gains and losses related with pension, health, education and bonds consist of:
| | | 2010 | | | 2009 | |
| | | | | | | | | | | | | |
| | | Gain (loss) | | | Cumulative Gain (loss) | | | Gain (loss) | | | Cumulative Gain (loss) | |
| | | | | | | | | | | | | |
| Pension | | | (58,216 | ) | | | (1,661,206 | ) | | | (920,726 | ) | | | (1,056,866 | ) |
| Health | | | (457,941 | ) | | | (1,373,096 | ) | | | (616,837 | ) | | | (951,590 | ) |
| Education | | | (56 | ) | | | (139,445 | ) | | | (84,273 | ) | | | (144,247 | ) |
| Bonds | | | 578,374 | | | | 534,714 | | | | (28,133 | ) | | | 140,030 | |
Ecopetrol S.A. and Subsidiaries
Notes to the Consolidated Financial Statements
Years ended December 31, 2010, 2009 and 2008
The economic assumptions adopted are shown below in nominal terms. Those assumptions used in determining the actuarial present value of the pension obligation and the projected pension obligations for the plan years were as follows:
| | | 2010 | | | 2009 | |
| | | Pension | | | Health | | | Education | | | Bonds | | | Severance | | | Pension | | | Health | | | Education | | | Bonds | | | Severance | |
| Discount rate | | | 8.00 | % | | | 8.50 | % | | | 8.00 | % | | | 8.00 | % | | | 8.00 | % | | | 8.50 | % | | | 8.50 | % | | | 8.50 | % | | | - | | | | - | |
| Rate of compensation and pension increases | | | 3.48 | % | | | 3.48 | % | | | 3.48 | % | | | 3.48 | % | | | 3.48 | % | | | 5.06 | % | | | 4.00 | % | | | 4.00 | % | | | - | | | | - | |
| Expected rate of return | | | 4.37 | % | | | - | | | | - | | | | 4,37 | % | | | - | | | | 4.33 | % | | | - | | | | - | | | | 4,33 | % | | | - | |
| Mortality table | | | * | | | | * | | | | * | | | | * | | | | * | | | | * | | | | * | | | | * | | | | * | | | | * | |
* Colombian Mortality Table ISS, male and female, 2005-2008.
The Superintendency of Finance concluded a mortality study based on the experience of the affiliated workers to the pension funds and to the Social Security Institute ISS, during the years 2005-2008. The resulting mortality table from such study reflects the current mortality of the Colombian workers. As it was expected, the new table shows a lower mortality rate compared with those of the actual mortality table, ISS, experience 1981-1989. For such reason, the new table was applied for purposes of executing the different actuarial calculations included in this valuation in 2009.
The rate of return of the plan assets during 2010 was 7.85%. We have considered the rate corresponding to the government bonds, TES, at December 31 2010 of 8.0%, and an expected inflation rate equal to 3.48% with a real discount rate of 4.37%.
Estimated future benefit payments
The benefit payments, which reflect expected future service, as appropriate, are expected to be paid as follows:
| Period | | Pension Benefits | | | Health Care Benefits | | | Education Benefits | | | Bonds Pension Plan | | | Severance Plan | |
| 2011 | | $ | 612,222 | | | $ | 204,843 | | | $ | 80,018 | | | $ | 177,190 | | | $ | 6,299 | |
| 2012 | | | 614,638 | | | | 196,196 | | | | 66,353 | | | | 22,906 | | | | 53 | |
| 2013 | | | 604,529 | | | | 191,731 | | | | 62,690 | | | | 25,203 | | | | 74 | |
| 2014 | | | 594,230 | | | | 186,675 | | | | 57,059 | | | | 29,963 | | | | 97 | |
| 2015 | | | 583,766 | | | | 181,609 | | | | 52,138 | | | | 26,707 | | | | 125 | |
| Years 2016 – 2021 | | $ | 4,376,510 | | | $ | 1,299,362 | | | $ | 205,643 | | | $ | 683,030 | | | $ | 13,816 | |
All of the benefits estimated in the table above are to be paid from plan assets. The Company does not have any insurance policies that are intended to cover benefits that plan participants are to receive in the future.
Furthermore, currently the Company does not intend to contribute to the fund in the upcoming fiscal year. Management believes that the plan assets will provide for a sufficient return to cover any payments that are necessary to be made in the upcoming year.
Assumed health care cost trend rates have an effect on the amounts reported for the health care plans. A one percentage point change in assumed health care cost trend rates would have the following effects:
| | | 1% Percentage Point | |
| | | Increase | | | Decrease | |
| Effect on total of service and interest cost | | $ | 264,539 | | | $ | 207,387 | |
| Effect on postretirement benefit obligation | | $ | 3,409,159 | | | $ | 2,694,759 | |
Ecopetrol S.A. and Subsidiaries
Notes to the Consolidated Financial Statements
Years ended December 31, 2010, 2009 and 2008
Plan assets
Pension and pension bonds are covered by assets in a single fund with the following investment allocation:
| | | 2010 | | | 2009 | |
| Government securities | | | 50 | % | | | 51 | % |
| Private bonds | | | 29 | % | | | 24 | % |
| Foreign currency | | | 2 | % | | | 3 | % |
| Other | | | 18 | % | | | 22 | % |
| | | | 100 | % | | | 100 | % |
The plan assets do not contain any shares of stock of Ecopetrol or any of its related parties.
In 2007, the Company outsourced administration of its pension plan to a third party (known as a partial transfer). As a result, on October 28, 2008, the Ministry of Finance and Public Credit approved the partial transfer (“commutation”) of the pension obligation of the Company, which was then approved by the Ministry of Social Security, according to the actuarial calculation at December 31, 2008 of $10,092,528. Since Ecopetrol continues to be financially responsible for the transferred pension liability, this amount continues being considered in the calculations for U.S. GAAP purposes.
| vii. | PROVISIONS, ALLOWANCES AND CONTINGENCES |
The amount at which the provision is valued under RCP is the estimated amount of the loss at year end. In 2008, the modification of the methodology generated a net decrease (recoveries and new provisions) of $425,376, recorded in December 2008. In addition, in 2009, the modification of the methodology generated a net decrease (recoveries and new provisions) of $142,452, recorded in December 2009. In 2010, the Company used the same methodology of 2009 and recorded a net decrease (Recoveries and new provision) of $127,706.
For U.S. GAAP, Accounting for Contingencies (ASC 450), provides the guidance for recording contingencies. Under ASC 450, there are three levels of assessment of contingent events – probable, reasonably possible and remote. The term probable in ASC 450 is defined as “the future event or events that are likely to occur”. The term reasonably possible is defined as “the chance of the future event or events occurring is more than remote but less than likely”. While the term remote is defined as “the chance of the future event or events occurring is slight”.
Under ASC 450, an estimated loss related to a contingent event is to be accrued by a charge to income if both of the following conditions are met:
| • | Information available prior to issuance of the financial statements indicates that it is probable that an asset had been impaired or a liability had been incurred at the date of the financial statements. |
| • | The amount of loss can be reasonably estimated. |
The amount recorded is an estimate of the amount of loss at the date of the financial statements. If the contingent event is evaluated to be reasonably possible, no provision for the contingent event may be made, but disclosure of the event is required.
As a result of the difference in the definition of “probable” between RCP and U.S. GAAP, and the general interpretation of the definition in practice in Colombia, there is a difference in the amount of the provision for legal proceedings. In 2010, 2009 and 2008, there was a difference in the amount at which the provision for loss is recorded, as described above.
Ecopetrol S.A. and Subsidiaries
Notes to the Consolidated Financial Statements
Years ended December 31, 2010, 2009 and 2008
| viii. | DEFERRED INCOME TAXES |
Under RCP (Colombian Government Entity GAAP), deferred income taxes are recognized only for temporary differences using the liability method. Under U.S. GAAP, deferred tax must be recorded for all temporary differences between the financial and tax basis of assets and liabilities.
Under RCP, deferred income tax asset is recorded to the extent the Company expects to generate taxable income tax to recover that amount. Under U.S. GAAP, a valuation allowance is provided for deferred tax assets to the extent that it is more likely than not that they will not be realized.
Under RCP, deferred income taxes are calculated using the current statutory tax rate. Under U.S. GAAP, deferred income taxes are calculated based on rates and tax laws enacted at the reporting date considering the future tax rate that will apply when the deferred income tax difference will be realized.
Under RCP, since 2009, goodwill is deductable and does not generate differences between tax laws and the RCP, except by the difference in the time of amortization. Under U.S. GAAP, the goodwill is not amortizable and generates a temporary difference, as a result it is necessary to compute and recognize deferred income taxes for differences originated by deductions since the acquisition date.
Under RCP, the fair value of the assets is not recorded, the difference between this value (zero) and the value recorded under U.S. GAAP generates deferred tax calculated under ASC 740.
The Company and its subsidiaries file separate income tax returns since tax regulations do not allow consolidated income tax returns. There are no requirements to file tax returns by segments. Tax returns are required for each legal entity.
The following information regarding income taxes has been prepared under U.S. GAAP:
Income Taxes
Total income taxes for the years ended December 31, 2010, 2009 and 2008 were comprised as follows:
| | | 2010 | | | 2009 | | | 2008 | |
| Income tax expense | | $ | 4,397,797 | | | $ | 2,893,963 | | | $ | 4,579,304 | |
| Income tax effects based on items of Other Comprehensive Income: | | | | | | | | | | | | |
| Pension Plan Liability | | | 206,699 | | | | 482,535 | | | | (302,050 | ) |
| Available-for-sale securities | | | 8,819 | | | | 226,833 | | | | (236,974 | ) |
| Additional paid in capital | | | - | | | | 177,241 | | | | - | |
| | | $ | 4,613,315 | | | $ | 3,780,572 | | | $ | 4,040,280 | |
Income tax expense attributable to income from continuing operations consists of:
| | | 2010 | | | 2009 | | | 2008 | |
| Current provision | | $ | 3,201,040 | | | $ | 1,948,819 | | | $ | 3,648,451 | |
| Deferred tax | | | 1,196,757 | | | | 945,144 | | | | 930,853 | |
| | | $ | 4,397,797 | | | $ | 2,893,963 | | | $ | 4,579,304 | |
In 2010, 2009 and 2008, subsidiaries in foreign countries have not generated taxable income and, consequently, they have not incurred income tax expense. In the countries that are accepted the carry forward under fiscal losses they recorded differed tax asset less a valuation allowance in the case that applies. In other countries the current tax rate is 0% or they considered exempt income, also, the companies were not recorded current tax provision.
Ecopetrol S.A. and Subsidiaries
Notes to the Consolidated Financial Statements
Years ended December 31, 2010, 2009 and 2008
Tax Rate Reconciliation
Income tax expense attributable to income from continuing operations was $4,397,797 , $2,893,963, and $4,579,304 for the years ended December 31, 2010, 2009 and 2008, respectively, and differed from the amounts computed by applying the statutory income tax rate for Colombian entities that is 33% in 2010, 2009 and 2008 to pretax income from continuing operations as follows:
| | | 2010 | | | 2009 | | | 2008 | |
| Statutory income tax | | | 33.00 | % | | | 33.00 | % | | | 33.00 | % |
| Non – taxable income | | | (2.37 | )% | | | 1.39 | % | | | (1.09 | )% |
| Non – deductible expenses | | | 4.64 | % | | | (1.91 | )% | | | 3.56 | % |
| Others | | | (0.45 | )% | | | 0.26 | % | | | 1.94 | % |
| Exempt revenue | | | (0.52 | )% | | | (0.11 | )% | | | (3.29 | )% |
| Effect of foreign profit taxed at other rate | | | (0.05 | )% | | | 0.02 | % | | | (0.02 | )% |
| Business combination | | | - | | | | 0.35 | % | | | - | |
| Effective income tax under U.S. GAAP | | | 34.25 | % | | | 33.00 | % | | | 34.10 | % |
Deferred Taxes
The significant components of deferred income tax expense attributable to income from continuing operations for the years ended December 31, 2010, 2009 and 2008 are as follows:
| | | 2010 | | | 2009 | | | 2008 | |
| Deferred income tax expense (exclusive of the effects of other components below): | | | | | | | | | |
| Accounts payable | | $ | (6,586 | ) | | $ | (21,075 | ) | | $ | 8,192 | |
| Inventories | | | (6,949 | ) | | | 52,705 | | | | (14,554 | ) |
| Property, plant and equipment, principally due to DD&A | | | (1,223,111 | ) | | | (666,473 | ) | | | 521,649 | |
| Deferred charges | | | 92,747 | | | | (845 | ) | | | (70,630 | ) |
| Prepaid expenses | | | (52,613 | ) | | | 55,679 | | | | - | |
| Capital lease asset | | | 11,597 | | | | 43,120 | | | | 10,488 | |
| Monetary correction and other | | | 212,482 | | | | (103,012 | ) | | | (39,573 | ) |
| DD&A and inflation adjustments | | | 890,348 | | | | 295,638 | | | | - | |
| Investment | | | (111,530 | ) | | | 125,899 | | | | 655,164 | |
| Estimated liabilities and provisions | | | 87,423 | | | | (178,468 | ) | | | (106,139 | ) |
| Accounts and notes receivable | | | (3,734 | ) | | | 13,375 | | | | (19,110 | ) |
| Carry forward loss | | | 16,652 | | | | (42,681 | ) | | | - | |
| Labor obligations | | | (98,280 | ) | | | (360,488 | ) | | | 51,299 | |
| Deferred income | | | 7,811 | | | | 8,052 | | | | (156,470 | ) |
| Natural and environmental resources capitalized expenses | | | 23,841 | | | | 241,725 | | | | (11,979 | ) |
| Valuation allowance | | | 91,712 | | | | (11,475 | ) | | | 4,126 | |
Additional tax discount on the acquisition of productive assets according to ASC 740 (1) | | | 1,276,705 | | | | 1,107,934 | | | | 637,418 | |
| Excess in presumptive income tax | | | (217,577 | ) | | | (106,437 | ) | | | - | |
| Other | | | 5,654 | | | | 369 | | | | (4 | ) |
| Amortization of actuarial loss recorded in OCI | | | 206,699 | | | | 482,535 | | | | (302,050 | ) |
| Unrealized loss in available for sale securities | | | 8,819 | | | | 226,835 | | | | (236,974 | ) |
| Amortization of fiscal goodwill according to (ASC 830) | | | (15,353 | ) | | | (217,768 | ) | | | - | |
| | | $ | 1,196,757 | | | $ | 945,144 | | | $ | 930,853 | |
| (1) | This value corresponds to the deferred tax generated by the calculation of ASC 740, due to the implementation of the special deduction for investment in real productive assets. |
Ecopetrol S.A. and Subsidiaries
Notes to the Consolidated Financial Statements
Years ended December 31, 2010, 2009 and 2008
The tax effects of temporary differences that give rise to significant portions of the deferred tax assets and deferred tax liabilities at December 31, 2010 and 2009 are presented below:
| | | 2010 | | | 2009 | |
| Deferred income tax assets and liabilities | | | | | | |
| Deferred income tax assets: | | | | | | |
| Inventories | | $ | 69,145 | | | $ | 62,196 | |
| Investments | | | 1,048,991 | | | | 333,719 | |
| Accounts and notes receivable | | | 3,039 | | | | (695 | ) |
| Deferred income | | | 140,422 | | | | 148,233 | |
| Property, plant and equipment, principally due to DD&A | | | 3,032,395 | | | | 1,809,284 | |
| Deferred charges | | | 16,583 | | | | 109,330 | |
| Prepaid expenses | | | 63,024 | | | | 10,411 | |
| Financial obligation, principally due to capitalized leasing | | | 107,517 | | | | 119,114 | |
| Pension obligations | | | 657,008 | | | | 558,728 | |
| Accounts payable | | | 141,253 | | | | 134,667 | |
Carry forward loss (1) | | | 130,280 | | | | 146,932 | |
Excess in presumptive income tax (2) | | | 332,320 | | | | 114,743 | |
| Other | | | 1,585 | | | | 5,672 | |
| Amortization of fiscal goodwill according to ASC 830 | | | 472,536 | | | | 457,183 | |
Estimated liabilities and provisions (3) | | | 786,153 | | | | 873,576 | |
| Total gross deferred income tax assets | | | 7,002,241 | | | | 4,883,093 | |
| Less valuation allowance | | | (195,139 | ) | | | (103,427 | ) |
| Deferred income tax assets | | | 6,807,182 | | | | 4,779,666 | |
| Deferred income tax liabilities | | | | | | | | |
| Natural and environmental properties due to the difference between the methods of amortization | | | 464,335 | | | | 440,494 | |
| Monetary correction and other | | | 630,480 | | | | 425,488 | |
| DD&A and inflation adjustments | | | 1,185,986 | | | | 295,638 | |
| Investments | | | 1,681,325 | | | | 1,077,594 | |
| Deferred income tax liabilities | | | 3,962,126 | | | | 2,239,214 | |
Net deferred income tax assets (4) | | $ | 2,844,976 | | | $ | 2,540,452 | |
| | (1) | Carry forward looses are generated by subsidiaries and according to local tax laws, these losses do not expire. |
| | (2) | The excess in presumptive income tax are generated by subsidiaries and will expire in 5 years. |
| | (3) | Includes in 2009, $14,364 from Ecopetrol del Perú that are calculated an 29% income tax rate that is the income tax rate in this company. |
| | (4) | The Company does not intend to withdraw the dividends originated from subsidiaries in a foreign country in the short-term, for that reason the deferred income taxes just include the deferred income taxes recognized by the subsidiaries. |
ASC 740 “Income Taxes” (formerly FIN No. 48) prescribes a comprehensive model for the recognition, measurement, financial statement presentation and disclosure of uncertain tax positions taken or expected to be taken in a tax return. This standard does not have any effect on the financial position or result of operations of the Company.
The Company classifies income tax related interest and penalties as income taxes in the consolidated financial statements. See note 15 for the years remain open to examination.
ix. REVENUE RECOGNITION
a.1 Natural Gas Imbalance
For U.S. GAAP purposes, the Company utilizes the entitlement method of accounting for natural gas balancing arrangements by which the amount of natural gas sold is based on its shared interests in the properties. The Company’s natural gas imbalance positions at December 31, 2010 and 2009 were $ 13,187 and $539 in favor, equivalent to 1.733.334 MBTU and 147.903 MBTU, respectively. Under RCP, natural gas imbalances are settled with a purchase or sale to the partner that are accounted for at the end of each period.
a.2 Over and Under
Under RCP, the Company recognizes receivables from or payables to partners based on the cost of the inventory.
Ecopetrol S.A. and Subsidiaries
Notes to the Consolidated Financial Statements
Years ended December 31, 2010, 2009 and 2008
For U.S. GAAP purposes, the Company utilizes the entitlement method of accounting for over and under positions by which the amount of crude oil sold is based on its shared interest in the properties, and revenue is recognized based on market prices. The Company’s crude oil over and under balance position at December 31, 2010 was $28,836 and at December 31, 2009 was $227,900 equivalent to 193,411 and 1,674,479 barrels, respectively.
a.3 Cost of Sales
Under U.S. GAAP, the related cost of sale for over and under transactions described at a.2 above amounted to $158,609 $(110,087) and $(8,887) during 2010, 2009 and 2008, respectively, in comparison with the amount recognized under RCP.
x. INFLATION ADJUSTMENTS
The RCP consolidated financial statements were adjusted for inflation based on the variation in the IPC (Colombia’s equivalent to the consumer price index in the United States) for middle income-earners from January 1, 1992 to December 31, 2001 for Ecopetrol S.A. and from January 1, 1992 to December 31, 2006 for Oleoducto de Colombia S.A. (“ODC”), Hocol S.A., Oleoducto Central S.A. (“Ocensa”) and Reficar S.A. The adjustment was applied monthly to non-monetary assets, equity (except for the valuation surplus) and memorandum accounts.
Under U.S. GAAP, the aforementioned adjustments under RCP are not applicable and must be reversed.
xi. INVENTORIES
Under RCP, inventories are valued at the lower of average cost or sale price. Under U.S. GAAP, inventories are valued at the lower of average cost or market value, the determination of which can be made using several different methods acceptable under U.S. GAAP. An adjustment has been recorded to reflect the difference in the method used to determine the valuation of inventories that arises from using sale price instead of market value, as defined by U.S. GAAP. The effects of this adjustment (loss)/gain in the reconciliation of income were $(87,797) $16,853, $10,274, in December 2010, December 2009 and 2008, respectively.
Inventories are also affected by the effect of adjustments to cost of sales included in this reconciliation. These adjustments relate to depreciation, expenses capitalized in property, plant and equipment, asset retirement cost and impairment of long lived assets. The effects of these adjustments in the reconciliation of equity and the corresponding effect in inventory were $(114,868) and $(27,103) in December 2010 and 2009, respectively.
xii. LEASE ACCOUNTING
Under both RCP and U.S. GAAP, lessee accounting for capital leases and operating leases is identical. However, the tests used to determine if a lease is a capital or an operating lease differs between RCP and U.S. GAAP. In applying the tests in accordance with RCP, the Company has determined that all leases are operating leases. Under U.S. GAAP some of these leases should be accounted for as capital leases in accordance with ASC 840-10. As a result, adjustments were recorded to reflect the related assets and liabilities, and to recognize interest expense and de-recognize operating expenses associated with the lease payments.
Embedded Leasing
Under RCP, there is no requirement to identify whether the arrangements or contracts contain leases.
Under U.S. GAAP, an arrangement contains a lease if both of the following two criteria are met:
| 1. | The arrangement depends on a specific fixed asset, either identified contractually or implicitly identified as no alternative item could feasibly be used. |
Ecopetrol S.A. and Subsidiaries
Notes to the Consolidated Financial Statements
Years ended December 31, 2010, 2009 and 2008
| 2. | The purchaser has the right to control the use of the underlying fixed asset, such control demonstrated by the existence of any of the following qualitative conditions: |
| | a) | The purchaser can operate the asset or direct others to operate the asset while obtaining or controlling more than a minor amount of the asset’s output; |
| | b) | The purchaser can control physical access to asset while obtaining or controlling more than a minor amount of the asset’s output; or |
| | c) | Probability is remote that another party will get more than minor amount of the asset’s output and the price is not fixed per unit. |
Under U.S. GAAP, if the arrangement contains a lease, ASC 840 is applied by both purchaser and supplier for recognition, measurement, classification and disclosure purposes.
Build, Operate, Maintain and Transfer (BOMT)
| | | BOMT | | | | |
| | | Ecogas (1) | | | Hocol (2) | | | Dina – Tello (3) | | | Transmetano (4) | |
| Year | | USD (million) | | | Pesos | | | USD (million) | | | Pesos | | | USD (million) | | | Pesos | | | USD (million) | | | Pesos | |
| 2011 | | | 20 | | | $ | 38,420 | | | $ | 1,083 | | | $ | 2,072 | | | | 2,5 | | | $ | 4,840 | | | $ | 9,220 | | | $ | 17,647 | |
| 2012 | | | 18 | | | | 35,098 | | | $ | 1,181 | | | | 2,261 | | | | 2,9 | | | | 5,549 | | | | 10,709 | | | | 20,498 | |
| 2013 | | | 17 | | | | 33,098 | | | $ | 1,289 | | | | 2,467 | | | | 3,3 | | | | 6,332 | | | | - | | | | - | |
| 2014 | | | 17 | | | | 32,513 | | | $ | 1,345 | | | | 2,575 | | | | 3,8 | | | | 7,199 | | | | - | | | | - | |
| 2015 | | | 17 | | | | 32,513 | | | | - | | | | - | | | | 4,3 | | | | 8,155 | | | | - | | | | - | |
| Payments after 2015 | | | 27 | | | | 50,920 | | | | - | | | | - | | | | 10,2 | | | | 19,586 | | | | - | | | | - | |
| | | | 116 | | | $ | 222,561 | | | $ | 4,899 | | | $ | 9,376 | | | | 27,0 | | | $ | 51,660 | | | | 19, 929 | | | $ | 38,145 | |
The outstanding amount of rentals, excluding operation and maintenance, payable under the BOMT obligations that were not relieved during future years are as follows for these leases:
At December 31, 2010 and 2009, the capitalized amount and the related liability are as follows:
| | | BOMT – Hocol (2) | | | Transmetano (4) | |
| | | 2010 | | | 2009 | | | 2010 | | | 2009 | |
| Assets | | | | | | | | | | | | |
| Property, plant and equipment (Building offices) | | $ | 8,733 | | | $ | 9,326 | | | $ | 83,245 | | | $ | 83,245 | |
| Land | | | 503 | | | | 538 | | | | - | | | | - | |
| Equipment F&F | | | 1,051 | | | | 1,122 | | | | - | | | | - | |
| Accumulated depreciation | | | (1,783 | ) | | | (1,481 | ) | | | (72,147 | ) | | | (66,596 | ) |
| Net book value | | | 8,504 | | | | 9,506 | | | | 11,098 | | | $ | 16,649 | |
| Liabilities: | | | | | | | | | | | | | | | | |
| Financial obligations | | $ | 9,376 | | | $ | 11,258 | | | $ | 38,145 | | | $ | 56,903 | |
| | (1) | Three original leases that were accounted for as capital leases under U.S. GAAP are BOMT contracts, the use of which are specifically required under Colombian law for projects that involve the building, operating, maintaining and transferring of natural gas pipelines for the transportation of natural gas. These contracts had original terms of 20 years, no renewal provisions, and a purchase option. The rights to the leased assets were subsequently transferred to a related Company (ECOGAS) that was sold, but Ecopetrol was not relieved of the primary obligation under the original lease. This transfer was considered a sublease accounted for as a direct finance lease. In 2007, Ecopetrol received a prepayment of all amounts to be received during the term of the sublease contract. |
Ecopetrol S.A. and Subsidiaries
Notes to the Consolidated Financial Statements
Years ended December 31, 2010, 2009 and 2008
| | (2) | The subsidiary Hocol has another BOMT contract, which is accounted like an operating lease under Colombian Government Entity GAAP. Under U.S. GAAP, this BOMT is accounted for as capital leases in accordance with ASC 840-10. As a result, adjustments were recorded to reflect the related assets and liabilities. |
| | (3) | In 2010, we entered in a new BOMT, corresponding to the gas treatment plant located in the Dina-tello field with an estimated value of construction US$28 million. This BOMT is accounted as capital lease in accordance with ASC 840 such as the contracts described previously, this contract had original term of 8 years, ending in 2017. |
| | (4) | In the case of the Company, it was determined that there were leases included in various contracts. The most significant embedded lease was determined to exist in Contract DIJ 970 (Transmetano), Natural gas transportation - Sebastopol – Medellín pipeline. |
The contractor is entitled to receive natural gas at the designated point, and it is also obligated along with the Company to transport the product throughout the pipeline and bring it to the delivery point (conducting up to 67 million cubic feet per day). The contract has a duration of 15 years, and could be extended for periods of one year, for a period no longer than 10 years. Lease payments include the costs of transportation, administration, operation and pipeline maintenance.
This contract meets the criteria of Emerging Issues Task Force 01-08, Determining Whether an Arrangement Contains a Lease ASC 840 in order to be considered a lease agreement. Similarly, according to ASC 840, the contract meets the criteria to be recognized as a capital lease.
xiii. PROPERTY, PLANT AND EQUIPMENT
Under RCP, property, plant and equipment are recorded at cost and were adjusted for inflation until 2001. Costs include administrative expenses until 2004, financial expenses, asset retirement costs and exchange differences from foreign currency financing until the asset is placed in service. Normal disbursements for maintenance and repairs are charged to expense and those significant costs that improve efficiency or extend the useful life are capitalized. Under U.S. GAAP, cost includes expenditures until the asset is placed in service such as installation cost, freight, interest, retirement cost; construction cost and other direct expenses are capitalized, with exception of adjustment for inflation and foreign currency loss that generate a reconciling item since assets do include adjustments for these concepts under RCP. For U.S. GAAP purposes, administrative expenses capitalized, inflation adjustments and exchange difference were eliminated from property, plant and equipment. In addition, a deferred income tax asset resulted from the application of the provisions of ASC 740 SEC Staff Guidance Accounting for Acquired Temporary Differences in Certain Purchase Transactions that are not Accounted for as Business Combinations, since the investment in productive assets creates an additional tax deduction of 30% in 2010 and 40% in 2009 and 2008.
The following table reflects the net changes in capitalized exploratory wells during 2010, 2009 and 2008 and does not include amounts that were capitalized and subsequently expensed during the same period.
| | | 2010 | | | 2009 | | | 2008 | |
| Beginning balance at January 1 | | $ | 363,922 | | | $ | 218,413 | | | $ | 206,300 | |
| Additions from business combination | | | - | | | | 143,541 | | | | - | |
| Additions to capitalized exploratory well costs | | | 1,029,203 | | | | 349,162 | | | | 268,041 | |
| Reclassifications to wells, facilities and equipment based on the determination of proved reserves | | | (132,672 | ) | | | (149,130 | ) | | | (163,817 | ) |
| Capitalized exploratory well costs charged to expense* | | | (841,713 | ) | | | (198,064 | ) | | | (92,111 | ) |
| Ending balance at December 31 | | $ | 418,740 | | | $ | 363,922 | | | $ | 218,413 | |
* Includes $7,514 and $32,351 of capitalized exploratory well costs at December 31, 2010 and 2009, respectively, which were declared as dry wells during 2011 and 2010 (see subsequent events note), respectively.
Ecopetrol S.A. and Subsidiaries
Notes to the Consolidated Financial Statements
Years ended December 31, 2010, 2009 and 2008
The balances at December 31, 2010, 2009 and 2008 correspond to well costs capitalized during the years ended at those dates. The increase along time is explained by the growing of exploratory activities in recent years.
a. Interest
Under RCP, all interest paid net of interest income is subject to capitalization regardless of the utilization of the funds. Exchange rate differential is also capitalized as part of the asset.
The Company´s assessment of the methodology followed to determine the capitalization amount under US GAAP considered more detailed information available to estimate the interest to be capitalized. Previously, the calculations were made based on the average monthly disbursements, as an improvement, the Company obtained a detail of the assets associated to the debt and was able to apply the analysis and calculations based on each project, providing further detail of interest capitalized. The impact was recognized during the period as it was considered a change in an accounting estimate per ASC 250-10-45-17 and 18, Change in Accounting Estimates.
The total interest capitalized during 2010 under RCP was $319,326 and the total interest capitalized under U.S. GAAP was $150,800. The effect of this adjustment in the reconciliation of income was $168,527. The total interest capitalized during 2009 under RCP was $127,026 and the total interest capitalized under U.S. GAAP was $63,247. The effect of this adjustment in the reconciliation of income was $63,779. There is not interest capitalized during 2008.
b. Revaluation of property, plant and equipment and public accounting effect
Valuation surplus of property, plant and equipment and the public accounting effect correspond to the difference between net book value and the market value for real estate or the current value in use for plant and equipment, determined by specialists. These accounts are reflected as Valuations and as Valuation Surplus from reappraisals of assets and the public accounting effect (components of equity) in the Company’s consolidated balances sheets. The last valuation was in December 2009. The effects of the valuation were recorded in 2010. Technical appraisals are valid for three years.
Under U.S. GAAP valuation, valuation surplus of assets and the public accounting effect are not permitted.
c. Impairment
Under RCP, technical appraisals for property, plant and equipment are performed at least every three years. If the technical study is lower than the carrying value, the difference is recorded in equity as a reduction of the property, plant and equipment carrying value even if it reduces the valuation surplus below zero. Under U.S. GAAP, in accordance with ASC 360-10, Property, Plant, and Equipment - Impairment or Disposal of Long-Lived Assets (ASC 360-10), property, plant, and equipment are reviewed for impairment whenever events or changes in circumstances indicate that the carrying amount of an asset may not be recoverable. If circumstances require a long-lived asset to be tested for possible impairment, the Company first compares undiscounted cash flows expected to be generated by the asset to the carrying value of the asset. If the carrying value of the long-lived asset is not recoverable on an undiscounted cash flow basis, impairment is recognized to the extent that the carrying value exceeds its fair value. Fair value is determined through various valuation techniques including discounted cash flow models, quoted market values and third-party independent appraisals, as considered necessary. For U.S. GAAP purposes, the Company reviewed property, plant and equipment for impairment as of December 31, 2010, 2009, 2008, and recorded impairment losses when required. For U.S. GAAP purposes, the Company recorded in 2010, 2009 and 2008, $135,469, $395,044, and $121,765, respectively, as additional impairment charges to reduce the net book value of certain wells and pipelines to their estimated values.
xiv. DEPRECIATION, DEPLETION AND AMORTIZATION
Under RCP, all tangible equipments, including those used in the production of crude oil and natural gas, are depreciated on a straight-line basis over the related estimated useful lives. Intangible crude oil and natural gas assets reflected on the Company’s consolidated balance sheets as natural and environmental resources are depleted on a units-of-production basis. Under U.S. GAAP, all assets, including tangible equipment, used in crude oil and natural gas producing activities are required to be depreciated or depleted using a units-of-production method, using proved reserves calculated in accordance with U.S. GAAP requirements. Therefore, an adjustment to net income per U.S. GAAP has been recorded to account for the difference in depreciation, depletion and amortization expense based on the above-described differences in the methods used.
Ecopetrol S.A. and Subsidiaries
Notes to the Consolidated Financial Statements
Years ended December 31, 2010, 2009 and 2008
xv. ASSET RETIREMENT OBLIGATIONS
Under RCP, the Company annually updates an analysis of the estimated liability for future asset retirement obligations as of each balance sheet date. The liability is adjusted to the current value and an offsetting amount is recorded as an adjustment to the asset cost. Until 2009 the elements of the liability originated in U.S. dollars, changes in the foreign currency rates are included in the adjustment to the liability and the related asset, the component of the asset cost resulting from this liability is included in the depreciable base of the related asset. In addition, as explained in the Principal Accounting Policies and Practices, we eliminated the exchange rate effect during 2010 that represents an amount close to ($170,590).
For purposes of U.S. GAAP reporting, the Company follows the provisions of Accounting Standards Codification (ASC) 410-20 Asset Retirement Obligations. ASC 410-20 requires the Company to recognize a liability for the present value of all legal obligations associated with the retirement of tangible, long-lived assets as of the date the related asset was placed into service, and capitalize an equal amount as an asset retirement cost (asset). Each period the liability is accreted using an effective interest rate method. The accretion is included as an operating expense. The cost associated with the abandonment obligation, is included in the computation of depreciation, depletion and amortization.
An adjustment has been recorded in the consolidated financial statements to reflect accretion expense, and the related obligation and assets in accordance with ASC 410-20.
It is not possible at this time to reasonably estimate the amount of any obligation for Asset Retirement Obligation related to refineries because the company undergoes major renovations. In addition, the Company believes that there is not sufficient information available to estimate the fair value of the asset retirement obligation because the settlement date or the range of potential settlement dates has not been specified by others and information is not available to apply an expected present value technique.
The following table presents the changes in abandonment obligations for December 2010 and 2009 as is required by ASC 410-20.
| | | 2010 | | | 2009 | |
| Balance at beginning of period | | $ | 1,904,096 | | | $ | 1,320,058 | |
| Liabilities incurred in the current period | | | 30,748 | | | | 6,857 | |
| Abandonment Cost from Business combination | | | - | | | | 58,143 | |
| Revisions in estimated cash flows | | | (237,906 | ) | | | 562,453 | |
| Liabilities settled in the current period | | | (30,663 | ) | | | (17,435 | ) |
| Accretion expense | | | 151,516 | | | | (25,980 | ) |
| Balance at end of period | | $ | 1,817,791 | | | $ | 1,904,096 | |
xvi. EQUITY CONTRIBUTIONS
| a. | Incorporated Institutional Equity |
At the end of association contracts that were signed prior to January 1, 2004, private companies are required to transfer, without cost, to Ecopetrol, all producing wells, facilities and other real estate and assets acquired in executing the contracts. Under RCP, the Company accounts for the receipt, using the relinquishing company’s reported historical cost, by recording an increase to assets and equity. The assets are then depreciated in accordance with the Company’s previously disclosed accounting policies. For U.S. GAAP reporting purposes, these balances and their related impacts on accumulated depreciation, depletion and amortization, and cost of production have been removed from the financial statements, based on the fact that the cost of these assets is zero. The adjustment to conform to U.S. GAAP in 2010 was a reduction in equity of $64,412 (original value of $137,010 net of $74,418 of accumulated depreciation of the assets received) and hold materials of $1,881. The adjustment to conform to U.S. GAAP in 2009 was a reduction in equity of $82,870 (original value of $137,068 net of $54,198 of accumulated depreciation of the assets received).
Ecopetrol S.A. and Subsidiaries
Notes to the Consolidated Financial Statements
Years ended December 31, 2010, 2009 and 2008
| b. | Reversal of Concession Rights Contributed as Capital |
Under RCP, prior to the effectiveness of Decree 1760 of 2003, the Company recorded the total amount of all crude oil and natural gas reserves that were returned to the nation as a result of expire concessions that were previously issued to third parties. Reserves were valued by means of the technical-economic model where the value per barrel resulted from the relation of the net present value obtained at a discount rate and the total proved reserves on the contribution date.
For U.S. GAAP purposes, these reversals were considered a transfer of assets between entities under common control. Ecopetrol, the entity that received the net assets, recognized the assets transferred at their carrying amounts in the accounts of the transferring entity at the date of transfer which was zero value. The unamortized value of the reverted reserves at December 31, 2010 and 2009 was $89,280 and $103,260, respectively.
xvii. INDEBTEDNESS COST
Under RCP, the borrowing costs correspond to interest paid, lender commissions and other costs related to the debt transactions, the exchange difference for the interest rate to be paid, the amortization of premiums and discounts in the placement of bonds and securities, and any income results earned on the temporary investment of such loans.
Under U.S. GAAP, the borrowing costs correspond to interest payable, lender commissions and other costs related to the debt transactions, the amortization of premiums and discounts in the placement of bonds and securities, should not offset interest expense with interest income, unless the financing transaction involves restricted, tax-exempt borrowings. Unlike RCP, the cost of borrowing does not include the exchange difference for the interest rate to be paid, unless such difference forms part of the negotiation of the interest rate for the transaction.
The total indebtedness cost incurred during 2010 under RCP was $519,697 and the total indebtedness cost incurred under U.S. GAAP was $521,367. The effects of this adjustment in the reconciliation of income were $1,670. The total indebtedness cost incurred during 2009 under RCP was $ 210,362 and the total indebtedness cost incurred under U.S. GAAP was $201,562.The effects of this adjustment in the reconciliation of income were $8,800. There were no indebtedness costs incurred during 2008.
xviii. BUSINESS COMBINATIONS
Under Colombian Government Entity GAAP, goodwill corresponds to the difference between the acquisition price and the book value of the acquired company recognized as an intangible asset, separate intangibles are not identified under RCP nor are assets stepped up to fair values as a result of acquisitions; if the book value is higher than the acquisition price, the resulting difference is recorded as a gain. The amount recognized as goodwill is amortized during the period in which the Company expects to receive future benefits; in addition, it is subject to annual impairment test
Under U.S. GAAP, goodwill is not amortized, but it is subject to an annual impairment test.
Ecopetrol S.A. and Subsidiaries
Notes to the Consolidated Financial Statements
Years ended December 31, 2010, 2009 and 2008
The following table shows, by company, the goodwill balance at the end of 2010, 2009 and 2008, net of the amount of deferred income tax on goodwill and assets recognized at the purchase date, (indicating the impact of paragraphs 262 and 263 of ASC 805), and the translation adjustment:
| Company | | Balance 2008 | | | Goodwill acquired during 2009 | | | Exchange Rate Effect | | | Balance before tax 2009 | | | Deferred income tax | | | Balance 2009 | |
| Propilco - Andean Chemicals | | $ | 652,948 | | | $ | - | | | $ | - | | | $ | 652,948 | | | $ | (899 | ) | | $ | 652,049 | |
| Refineria de Cartagena S.A. | | | - | | | | 834,048 | | | | (63,916 | ) | | | 770,132 | | | | - | | | | 770,132 | |
| Bioenergy | | | 8,993 | | | | - | | | | - | | | | 8,993 | | | | - | | | | 8,993 | |
| Hocol | | | - | | | | 185,624 | | | | - | | | | 185,624 | | | | (185,624 | ) | | | - | |
| Total | | $ | 661,941 | | | $ | 1,019,672 | | | $ | (63,916 | ) | | $ | 1,617,697 | | | $ | (186,523 | ) | | $ | 1,431,174 | |
| Company | | Balance 2009 | | | Goodwill acquired during 2010 | | | Exchange Rate Effect | | | Balance before tax 2010 | | | Deferred income tax | | | Balance 2010 | |
| Propilco - Andean Chemicals | | $ | 652,049 | | | $ | - | | | $ | - | | | $ | 652,049 | | | $ | (1,472 | ) | | $ | 650,577 | |
| Refineria de Cartagena S.A. | | | 770,132 | | | | - | | | | (49,070 | ) | | | 721,062 | | | | - | | | | 721,062 | |
| Bioenergy | | | 8,993 | | | | - | | | | - | | | | 8,993 | | | | - | | | | 8,993 | |
| Total | | $ | 1,431,174 | | | $ | - | | | $ | (49,070 | ) | | $ | 1,383,004 | | | $ | (1,472 | ) | | $ | 1,380,632 | |
Under RCP, the following table shows the amounts deductible for income tax purposes for 2009 and 2010.
| | | 2010 | |
| Company | | Goodwill | | | Accumulated Amortization | | | Balance | | | Net Effect | | | Remaining time-years | |
| Andean Chemicals Ltd | | $ | 357,629 | | | $ | (53,903 | ) | | $ | 303,726 | | | $ | 100,230 | | | | 16.8 | |
| Offshore International Group – “OIG” | | | 788,043 | | | | (76,376 | ) | | | 711,667 | | | | 234,850 | | | | 13.0 | |
| Hocol | | | 805,045 | | | | (62,039 | ) | | | 743,007 | | | | 245,192 | | | | 15.0 | |
| Total | | $ | 1,950,718 | | | $ | (192,318 | ) | | $ | 1,758,400 | | | $ | 580,272 | | | | | |
| | | 2009 | |
| Company | | Goodwill | | | Accumulated Amortization | | | Balance | | | Net Effect | | | Remaining time-years | |
| Andean Chemicals Ltd | | $ | 357,629 | | | $ | (33,655 | ) | | $ | 323,974 | | | $ | 106,911 | | | | 17.8 | |
| Offshore International Group – “OIG” | | | 821,994 | | | | (48,502 | ) | | | 773,492 | | | | 255,252 | | | | 14.0 | |
| Hocol | | | 628,456 | | | | (22,750 | ) | | | 605,706 | | | | 199,883 | | | | 16.0 | |
| Total | | $ | 1,808,079 | | | $ | (104,907 | ) | | $ | 1,703,172 | | | $ | 562,046 | | | | | |
Under RCP in 2010 and 2009, $172,660 and $139,909 were amortized in regard to goodwill acquired from OIG, Ecopetrol Transportation Company, Hocol, and Andean Chemicals. The amortization in the table above represents the accumulated amortization of the companies that could be deductible for income tax purposes. Under U.S. GAAP, goodwill acquired from OIG, which is recognized by the equity method, is included in the investment.
Under U.S. GAAP, Ecopetrol tests goodwill for impairment at least annually using a two step process that begins with an estimation of the fair value of a reporting unit. The first step is a screen for potential impairment and the second step measures the amount of impairment.
Fair value is determined by reference to market value, if available, or by a qualified evaluator or pricing model. Determination of a fair value by a qualified evaluator or pricing model requires management to make assumptions and use estimates. Management believes that the assumptions and estimates used are reasonable and supportable in the existing market environment and commensurate with the risk profile of the assets valued. However, different assumptions and estimates could be used which would lead to different results. The valuation models used to determine the fair value of these companies are sensitive to changes in the underlying assumptions. For example, the prices and volumes of product sales to be achieved and the prices which will be paid for the purchase of raw materials are assumptions which may vary in the future. Adverse changes in any of these assumptions could lead the Company to record a goodwill impairment charge. During 2010, Ecopetrol conducted an impairment test of goodwill which showed that no goodwill had been impaired.
Ecopetrol S.A. and Subsidiaries
Notes to the Consolidated Financial Statements
Years ended December 31, 2010, 2009 and 2008
| b. | Business Acquisition Subsequent to year-end |
In August 2010, we entered in into a memorandum of understanding with Talisman Colombia Holdco Limited, or Talisman, a Canadian oil and gas company, to acquire BP Exploration Company (Colombia) Limited, a subsidiary of British Petroleum operating in Colombia. After obtaining the necessary governmental authorizations, we completed the acquisition, in January 2011, which includes assets in gas and oil exploration and production as well as oil transportation and gas marketing, for US$1,642 billion net, plus an additional US$145 million return of equity to Ocensa’s shareholders, resulting in a 51% ownership by Ecopetrol and 49% by Talisman. The company’s new name is Equion Energia Limited. As a result of this acquisition, we increased our participation in Ocensa from 60.00% to 72.65%, in ODC from 66% to 73% and in Oleoducto del Alto Magdalena, or OAM assets, from 83.00% to 85.12%. We also acquired a 10.20% interest in Transgas de Occidente.
With this acquisition, Ecopetrol aims towards the fulfillment of its strategic objectives with an immediate increase in the reserves and current production representing 5% of Ecopetrol’s consolidated production; the exploratory opportunities contribute to the achievement of the 1,000,000 gross barrels of clean crude equivalent per day production expected for the year 2015.
The total purchase price was US$1,750 million with a negative price adjustment of US$108 million to bring the transaction to a net purchase price of US$1,642 million, of which US$837 represents the 51% share paid by Ecopetrol. The following table details the purchase price calculation (USD in millions) as well as the Colombian peso equivalent (in billions) of the transaction using the effective exchange rate on the dates of the payments.
| | | Amount USD | |
| Purchase Price | | | 1,750,000 | |
| Less: Purchase Price Adjustment | | | (108,389 | ) |
| Adjusted Purchase Price | | | 1,641,611 | |
| Participation (%) | | | 51 | % |
| Ecopetrol Purchase Price | | | 837,222 | |
The proceeds were paid in cash by Ecopetrol on two separate dates, as follows:
| | | Date | | Amount USD | | | Amount COP | |
| Earnest Money Deposit | | August 5, 2010 | | | 637,500 | | | $ | 1,163,132 | |
| Closing of Transaction | | January 24, 2011 | | | 199,722 | | | | 367,276 | |
| Total Purchase Price | | | | | 837,222 | | | $ | 1,530,408 | |
The Share Sale Agreement established that after the closing date, the seller has a 120-day period to review the price adjustments, including working capital adjustments, based on the financial statements at the closing date. The buyers then have an additional 60 days to complete the review of the price adjustments in order to consider the final purchase price. Adjustments to the price can result from the review, therefore, the final purchase price and information required to prepare the initial accounting for the business combination will be available during the second half of 2011. Therefore, disclosures related to fair value measurements, goodwill/intangible recognition, assets and liabilities recognized and effects of the business combination in the financial statement will be available in the 2011 year-end filing.
xix. NON-CONTROLLING INTEREST
To determine the attributable non-controlling interest at December 31, 2010, 2009 and 2008, Ecopetrol used the net equity from all subsidiaries at the beginning of the period and considered all activity (net income, retained earnings, non-controlling interest, distribution of dividends, purchase price allocation, translation adjustments, and others) for purposes of calculating the carrying amount of total equity (net assets) attributable to the non-controlling interest at the end of 2010, 2009 and 2008.
In August 2010 Ecopetrol incorporated with a participation of 54.80% of the company Oleoducto Bicentenario de Colombia S.A. (hereinafter “OBC”), in which we have a total participation of 55.97% interest.
Ecopetrol S.A. and Subsidiaries
Notes to the Consolidated Financial Statements
Years ended December 31, 2010, 2009 and 2008
The following table sets the information for Ecopetrol’s non-controlling interests in 2010, 2009 and 2008, respectively.
| | | OCENSA | | | BRAZIL | | | PERU | | | ODC | | | ODL | | | BIOENERGY | | | OBC | | | TOTAL | |
| Balance 2007 | | $ | 571,074 | | | $ | 49 | | | $ | 474 | | | $ | - | | | $ | - | | | $ | - | | | $ | - | | | $ | 571,597 | |
| Issuance of company shares | | | - | | | | - | | | | - | | | | - | | | | 217,378 | | | | - | | | | - | | | | 217,378 | |
| Other Non-Controlling Interest | | | - | | | | (45 | ) | | | (484 | ) | | | - | | | | - | | | | - | | | | - | | | | (529 | ) |
| Net income (loss) | | | 8,716 | | | | - | | | | - | | | | - | | | | - | | | | (2,460 | ) | | | - | | | | 6,256 | |
| Distribution of dividends | | | (141,634 | ) | | | - | | | | - | | | | - | | | | - | | | | - | | | | - | | | | (141,634 | ) |
| Retained Earnings | | | 140,095 | | | | - | | | | - | | | | - | | | | - | | | | - | | | | - | | | | 140,095 | |
| Purchase Price Allocation | | | - | | | | - | | | | - | | | | - | | | | - | | | | 8,718 | | | | - | | | | 8,718 | |
| Translation Adjustments | | | - | | | | (4 | ) | | | 10 | | | | - | | | | 16,885 | | | | - | | | | - | | | | 16,891 | |
| Balance 2008 | | | 578,251 | | | | - | | | | - | | | | - | | | | 234,263 | | | | 6,258 | | | | - | | | | 818,772 | |
| Acquired Non Controlling Interest | | | (300,377 | )* | | | - | | | | - | | | | 21,495 | | | | - | | | | (2,810 | ) | | | - | | | | (281,692 | ) |
| Other Non Controlling Interest | | | - | | | | - | | | | - | | | | - | | | | (78,405 | ) | | | - | | | | - | | | | (78,405 | ) |
| Net income (loss), restated | | | 198,968 | | | | - | | | | - | | | | (26,691 | ) | | | (15,325 | ) | | | (836 | ) | | | - | | | | 156,116 | |
| Distribution of dividends | | | (89,736 | ) | | | - | | | | - | | | | - | | | | - | | | | - | | | | - | | | | (89,736 | ) |
| Retained Earnings | | | 95,790 | | | | - | | | | - | | | | (2,142 | ) | | | 991 | | | | 6,541 | | | | - | | | | 101,180 | |
| Purchase Price Allocation | | | - | | | | - | | | | - | | | | 21,530 | | | | - | | | | - | | | | - | | | | 21,530 | |
| Translation Adjustments | | | - | | | | | | | | - | | | | - | | | | (13,047 | ) | | | - | | | | - | | | | (13,047 | ) |
Balance 2009, restated | | | 482,896 | | | | - | | | | - | | | | 14,192 | | | | 128,477 | | | | 9,153 | | | | - | | | | 634,718 | |
| Other Non Controlling Interest | | | - | | | | - | | | | - | | | | 3,902 | | | | - | | | | - | | | | - | | | | 3,902 | |
| Net income (loss) | | | 223,403 | | | | - | | | | - | | | | (7,173 | ) | | | 21,676 | | | | (975 | ) | | | (5,042 | ) | | | 231,889 | |
| Distribution of dividends | | | (99,888 | ) | | | - | | | | - | | | | - | | | | - | | | | - | | | | - | | | | (99,888 | ) |
| Return of capital through and due to Spin-Off | | | (144,251 | ) | | | - | | | | - | | | | - | | | | - | | | | - | | | | - | | | | (144,251 | ) |
| Dividends for Spin-Off | | | (318,670 | ) | | | - | | | | - | | | | - | | | | - | | | | - | | | | - | | | | (318,670 | ) |
| Translation Adjustments | | | - | | | | | | | | - | | | | - | | | | 305 | | | | - | | | | - | | | | 305 | |
| Balance 2010 | | $ | 143,490 | | | $ | - | | | $ | - | | | $ | 10,921 | | | $ | 150,458 | | | $ | 9,524 | | | $ | ( 5,042 | ) | | $ | 309,351 | |
* Corresponds to acquisition of an additional 24.71% ownership interest in Ocensa for $998,903 in cash. The difference of $610,007 was registered as an additional paid in capital net of income tax in an amount of $171,241 as a result of the difference between local deductible goodwill.
| xx. | CUMULATIVE TRANSLATION ADJUSTMENT |
Under RCP, the companies domiciled outside of the country, regardless of its functional currency, must report in USD and then translated to Colombian pesos with the impact recorded as cumulative translation adjustment.
For U.S. GAAP, the company must prepared its financial information in the functional currency and then translate it to the reporting currency. This difference in methodology results in a difference in the translated amounts recorded in the financial statements.
As such an adjustment is made to appropriately reflect amounts under translated U.S.GAAP.
xxi. EARNINGS PER SHARE
Under RCP, earnings per share ("EPS") are calculated by dividing net income by the weighted average of both common and preferred shares outstanding for each period presented. However, although the Company has presented EPS under RCP for informational purposes, the presentation of EPS is not required for financial statements issued under RCP. The Company does not have any issued or outstanding preferred shares.
U.S. GAAP requires dual presentation of basic and diluted EPS for entities with complex capital structures, as well as a reconciliation of the basic EPS calculation with the diluted EPS calculation. Basic EPS is calculated by dividing net income available to common shareholders by the weighted average of common shares outstanding for the corresponding period.
Diluted EPS assumes the issuance of common shares for all dilutive potential common shares outstanding during the reporting period. For the years ended December 31, 2010, 2009 and 2008, the Company had a simple capital structure. There are no stock compensation plans or any other compensation plan involving shares. Therefore, the Company is not required to present diluted EPS for these years.
Ecopetrol S.A. and Subsidiaries
Notes to the Consolidated Financial Statements
Years ended December 31, 2010, 2009 and 2008
xxii. CONCENTRATIONS
At December 31 2010, 2009 and 2008, 31%, 32% and 33%, respectively, of the Company’s employees belong to unions. Management believes that the Company’s relationships with labor unions are good. The current labor agreement with the union was renewed on September 10, 2009 that will expire in 2014.
In 2010, one customer of the refining segment accounted for 11.4% of total sales. No other customers accounted for more than 10% of total sales in 2010. In 2009, one customer of the refining segment accounted for 13.1% of total sales. No other customers accounted for more than 10% of total sales in 2009. In 2008, one customer of the production segment accounted for 14.2% and one customer of the refinery segment accounted for 11.7% of the total sales. No other customers accounted for more than 10% of total sales in 2008. There is no exposure that affects the financial position of Ecopetrol if the Company were to lose a client.
The significant majority of the Company’s assets and activities are located in Colombia. The financial position and results of operations of those subsidiaries located outside of Colombia are not material to the Company.
xxiii. RECENT U.S. ADOPTED ACCOUNTING STANDARDS AND U.S. GAAP PRONOUNCEMENTS
In January 2010, the Financial Accounting Standards Board (“FASB”) issued Accounting Standards Codification (“ASU”) 2010-03, Oil and Gas Reserve Estimation and Disclosures. This ASU aligns the oil and gas reserve estimation and disclosure requirements of FASB ASC Topic 932, Extractive Activities—Oil and Gas, with the requirements in the SEC Rule, Modernization of the Oil and Gas Reporting Requirements, which was issued on December 31, 2008 (SAB-113). The amendments to Topic 932 are effective for annual reporting periods ending on or after December 31, 2009 and should be accounted for as a change in accounting principle inseparable from a change in estimate; this accounting standard update was applied since December 31, 2009 at Ecopetrol. The adoption of this guidance had an impact on the disclosures of the company. Refer to Note xxviii for more information regarding such impact.
In January 2010, the FASB issued ASU 2010-04, Accounting for Various Topics—Technical Corrections to SEC Paragraphs (SEC Update), this accounting standard update represents technical corrections to SEC paragraphs, this accounting standard update had been applied by Ecopetrol as of December 2010. The adoption of this guidance did not have a significant impact on our consolidated financial statements and related disclosures.
In January 2010, the FASB issued ASU No. 2010-06 - Fair Value Measurements and Disclosures (Topic 820): Improving Disclosures about Fair Value Measurements (“ASU 2010-06”). ASU 2010-06 requires new and revised disclosures for recurring or non-recurring fair value measurements, specifically related to significant transfers into and out of Levels 1 and 2, and for purchases, sales, issuances, and settlements in the rollforward of activity for Level 3 fair value measurements. ASU 2010-06 also clarifies existing disclosures related to the level of disaggregation and the inputs and valuation techniques used for fair value measurements. The new disclosures and clarifications of existing disclosures about fair value measurements were effective on January 1, 2010, except for the disclosures about activity in Level 3 fair value measurements, which are effective for fiscal years beginning after December 15, 2010, and for interim periods within those fiscal years. This accounting standard update was applied by Ecopetrol at December 2010. Refer to Note xxvii for more information regarding such impact.
Also in February 2010, the FASB issued ASU 2010-09 Subsequent Event (Topic 855) in order to clarify questions about the requirements to disclose the date that the financial statements are issued potentially conflict with some of the Securities and Exchange Commission’s (SEC) guidance. All of the amendments in this update are effective upon issuance of the final update, except for the use of the issued date for conduit debt obligors. That amendment is effective for interim or annual periods ending after June 15, 2010. Ecopetrol adopted this standard at December 2010. Refer to Note 31 for more information regarding such impact.
In April 2010, the FASB issued ASU 2010-14 Accounting for Extractive Activities—Oil & Gas—Amendments to Paragraph 932-10-S99-1 (SEC Update), modernization of Oil & Gas Reporting, the amendments was adopted by Ecopetrol at December 2010. The adoption of this guidance had an impact on the disclosures of the Company. Refer to Note xxviii for more information regarding such impact.
Ecopetrol S.A. and Subsidiaries
Notes to the Consolidated Financial Statements
Years ended December 31, 2010, 2009 and 2008
In February 2010, the FASB issued ASU 2010-08, Technical corrections to various topics, by eliminating the inconsistencies and outdated provisions and providing the needed clarifications to make ASC easier to understand and apply, the amendments in this update are effective for the first reporting period beginning after issuance, in August 2010, the FASB issued ASU 2010-21 Accounting for Technical Amendments to Various SEC Rules and Schedules Amendments to SEC Paragraphs Pursuant to Release No. 33-9026: Technical Amendments to Rules, Forms, Schedules and Codification of Financial Reporting Policies (SEC Update), and ASU 2010-22 Accounting for various topics, Technical corrections to SEC paragraphs, an announcement made by the staff of the US Securities and Exchange Commission. The amendments were adopted by Ecopetrol at December 2010.
xxiv. RECENTLY ISSUED ACCOUNTING STANDARDS AND U.S. GAAP PRONOUNCEMENTS
In December 2010, the FASB issued ASU No. 2010-29 Business Combination (Topic 805) - Disclosure of Suplementary pro-forma information for Business Combination, to address diversity in practice about the interpretation of the pro-forma revenue and earnings disclosure requirements for business combinations. This amendment is effective prospectively for business combinations for which the acquisition date is on or after the beginning of the first annual reporting period beginning on or after December 15, 2010. Ecopetrol will be adopting this standard at December 2011, The adoption of this guidance is not expected to have a significant impact on our consolidated financial statements and related disclosures.
In May 2011, the FASB issued ASU 2011-04, Amendments to Achieve Common Fair Value Measurement and Disclosure Requirements in U.S. GAAP and IFRSs in order to ensure that fair value has the same meaning in U.S. GAAP and in IFRSs and that their respective fair value measurement and disclosure requirements are the same (except for minor differences in wording and style). The Boards concluded that the amendments in this Update will improve the comparability of fair value measurements presented and disclosed in financial statements prepared in accordance with U.S. GAAP and IFRSs. Ecopetrol will be adopting this standard beginning in January 2012. Ecopetrol is evaluating the impact of the adoption of this guidance on the disclosures of the Company.
In June 2011, the FASB issued ASU 2011-05, Presentation of Comprehensive Income, in order to improve the comparability, consistency, and transparency of financial reporting and to increase the prominence of ítems reported in other comprehensive income. The FASB decided to eliminate the option to present components of other comprehensive income as part of the statement of changes in stockholders’ equity, among other amendments in this Update. Ecopetrol is evaluating the impact of the adoption of this guidance on the disclosures of the company.
xxv. SEGMENT INFORMATION
The following segment information has been prepared in accordance with ASC 280, Disclosure about Segments of an Enterprise and Related Information. Financial information by business segment is reported in accordance with the internal reporting system under RCP and shows internal segment information that is used by the chief operating decision maker to manage and measure the performance of Ecopetrol.
In 2010, the Company’s management modified the methodology used to analyze financial information by business segment in order to obtain a better measure of the Company's operations. Specifically, since the year 2010 the Exploration and Production segment sells to customers at market price, while, until the year 2009 revenues were valued at a transfer price at the field of production. This change did not result in a material adjustment in the income from the field to the point of sale to final customers was recorded in the Market & Supply segment along with all associated marketing costs.
Ecopetrol S.A. and Subsidiaries
Notes to the Consolidated Financial Statements
Years ended December 31, 2010, 2009 and 2008
In 2010, the Company reports its information in four segments: Exploration & Production, Refining, Transportation and Market and Supply. Until 2009 a Corporate segment was reported. The Corporate segment in the new methodology is assigned to the four segments.
The financial information between segments is reported considering each business as a separate entity. Prices between segments are established by referencing those that can be earned in transactions with third parties or unrelated parties. Each segment should bear the costs and expenses required to put the product in terms of use or marketing. Each segment assumes its administrative expense and all non-operational transactions related to their activity.
The structure of the Company’s internal organizations was not modified. The segment information for 2009 and 2008 included herein has been updated for comparison purposes.
The Company operates under the following segments, which are described as follows:
Exploration and Production — this segment includes the Company’s oil & gas exploration and production activities. Revenue is derived from the sale of crude oil and natural gas to inter-company segments and to third parties, at market prices. Revenue is derived from local sales of crude oil, regulated fuels, non-regulated fuels and natural gas. Sales are made to local and foreign distributors. Costs include those costs incurred in production. Expenses include all exploration costs that are not capitalized.
Refining – this segment includes the Company’s refining activities. Goods sold, both internally and to third parties, include refined products such as motor fuels, fuel oils and petrochemicals at market prices. This segment also includes sales of industrial services to third parties.
Transportation – this segment includes the Company’s sales and costs associated with the Company’s pipelines and other transportation activities.
Market and Supply – this segment includes the Company’s revenues, costs and expenses associated with sales of crude and gas purchased from third parties and the ANH (Agencia Nacional de Hidrocarburos), and with sales of imported products to broader areas. It also includes revenues generated for products trading operations.
These functions have been defined as the operating segments of the Company since these are the segments (a) that engage in business activities from which revenues are earned and expenses are incurred; (b) whose operating results are regularly reviewed by the Company's chief operating decision maker to allocate resources to the segments and assess their performance; and (c) for which discrete financial information is available. Internal transfers represent sales to intercompany segments and are recorded and presented at market prices.
The following presents the Company’s balance sheet by segment in accordance with RCP:
Ecopetrol S.A. and Subsidiaries
Notes to the Consolidated Financial Statements
Years ended December 31, 2010, 2009 and 2008
| | | As of December 31, 2010 | |
| | | Exploration & Production | | | Refining Activities | | | Transporting | | | Market and Supply | | | Eliminations | | | Total | |
| Current assets | | | | | | | | | | | | | | | | | | |
| Cash and cash equivalents | | $ | 2,319,046 | | | $ | 150,236 | | | $ | 1,239,258 | | | $ | 18,238 | | | $ | - | | | $ | 3,726,778 | |
| Accounts and notes receivable | | | 1,485,854 | | | | 1,126,737 | | | | 559,147 | | | | 565,442 | | | | (1,000,588 | ) | | | 2,736,592 | |
| Inventories | | | 1,083,572 | | | | 1,105,022 | | | | 4,669 | | | | 173,906 | | | | (175,081 | ) | | | 2,192,088 | |
| Investments | | | 243,000 | | | | 57,419 | | | | 24,086 | | | | 3,277 | | | | - | | | | 327,782 | |
| Other current assets | | | 2,588,375 | | | | 807,608 | | | | 208,294 | | | | 42,121 | | | | - | | | | 3,646,398 | |
| | | | 7,719,847 | | | | 3,247,022 | | | | 2,035,454 | | | | 802,984 | | | | (1,175,669 | ) | | | 12,629,638 | |
| Investments in non-consolidated companies | | | 773,821 | | | | 11,309 | | | | 29,167 | | | | 15,873 | | | | - | | | | 830,170 | |
| Property, plant and equipment, net | | | 20,104,180 | | | | 7,511,806 | | | | 6,322,588 | | | | 120,843 | | | | (18,620 | ) | | | 34,040,797 | |
| Other non-current assets | | | 12,350,678 | | | | 5,773,967 | | | | 3,564,576 | | | | 272,258 | | | | (692,728 | ) | | | 21,268,751 | |
| Non Current assets | | | 33,228,679 | | | | 13,297,082 | | | | 9,916,331 | | | | 408,974 | | | | (711,348 | ) | | | 56,139,718 | |
| Total assets | | $ | 40,948,526 | | | $ | 16,544,104 | | | $ | 11,951,785 | | | $ | 1,211,958 | | | $ | (1,887,017 | ) | | $ | 68,769,356 | |
| | | | | | | | | | | | | | | | | | | | | | | | | |
| Accounts payable | | $ | (2,663,441 | ) | | $ | (920,862 | ) | | $ | (513,038 | ) | | $ | (855,040 | ) | | $ | 889,779 | | | $ | (4,062,602 | ) |
| Financial obligations (short-term) | | | (555,665 | ) | | | (709,968 | ) | | | (195,578 | ) | | | (2,958 | ) | | | 385,000 | | | | (1,079,169 | ) |
| Other Current Liabilities | | | (2,938,090 | ) | | | (1,367,859 | ) | | | (538,577 | ) | | | (64,437 | ) | | | 8,156 | | | | (4,900,807 | ) |
| Current Liabilities | | | (6,157,196 | ) | | | (2,998,689 | ) | | | (1,247,193 | ) | | | (922,435 | ) | | | 1,282,935 | | | | (10,042,578 | ) |
| Financial obligations (long-term) | | | (3,638,479 | ) | | | (1,912,991 | ) | | | (2,667,276 | ) | | | (40 | ) | | | 385,071 | | | | (7,833,715 | ) |
| Other non Current Liabilities | | | (6,539,180 | ) | | | (1,299,702 | ) | | | (1,002,119 | ) | | | (260,467 | ) | | | 22,537 | | | | (9,078,931 | ) |
| Non-current liabilities | | | (10,177,659 | ) | | | (3,212,693 | ) | | | (3,669,395 | ) | | | (260,507 | ) | | | 407,608 | | | | (16,912,646 | ) |
| Total Liabilities | | | (16,334,855 | ) | | | (6,211,382 | ) | | | (4,916,588 | ) | | | (1,182,942 | ) | | | 1,690,543 | | | | (26,955,224 | ) |
| Non-controlling interest | | | - | | | | (11,550 | ) | | | (474,401 | ) | | | - | | | | - | | | | (485,951 | ) |
| Shareholders’ equity of Ecopetrol | | | (24,613,671 | ) | | | (10,321,172 | ) | | | (6,560,796 | ) | | | (29,016 | ) | | | 196,474 | | | | (41,328,181 | ) |
| Total Equity | | | (24,613,671 | ) | | | (10,332,722 | ) | | | (7,035,197 | ) | | | (29,016 | ) | | | 196,474 | | | | (41,814,132 | ) |
| Total liabilities and equity | | $ | (40,948,526 | ) | | $ | (16,544,104 | ) | | $ | (11,951,785 | ) | | $ | (1,211,958 | ) | | $ | 1,887,017 | | | $ | (68,769,356 | ) |
| Capital expenditures | | $ | 5,878,246 | | | $ | 2,084,554 | | | $ | 2,351,662 | | | $ | 5,513 | | | $ | - | | | $ | 10,319,975 | |
| Goodwill | | $ | 1,423,801 | | | $ | 613,152 | | | $ | 471,449 | | | $ | - | | | $ | - | | | $ | 2,508,402 | |
| | | As of December 31, 2009 | |
| | | Exploration & Production | | | Refining Activities | | | Transporting | | | Market and Supply | | | Eliminations | | | Total | |
| Current assets | | | | | | | | | | | | | | | | | | |
| Cash and cash equivalents | | $ | 2,621,304 | | | $ | 476,518 | | | $ | 441,505 | | | $ | 22,791 | | | $ | - | | | $ | 3,562,119 | |
| Accounts and notes receivable | | | 1,878,701 | | | | 752,130 | | | | 185,046 | | | | 157,580 | | | | (4,337 | ) | | | 2,969,120 | |
| Inventories | | | 761,501 | | | | 1,133,913 | | | | 38,168 | | | | 229,608 | | | | (120,492 | ) | | | 2,042,697 | |
| Investments | | | 352,997 | | | | - | | | | 104,787 | | | | 4,473 | | | | - | | | | 462,258 | |
| Other current assets | | | 1,959,128 | | | | 884,055 | | | | 206,585 | | | | 31,827 | | | | - | | | | 3,081,595 | |
| | | | 7,573,631 | | | | 3,246,617 | | | | 976,090 | | | | 446,278 | | | | (124,829 | ) | | | 12,117,788 | |
| Investments in non-consolidated companies | | | 734,748 | | | | 11,135 | | | | 27,667 | | | | 3,952 | | | | - | | | | 777,503 | |
| Property, plant and equipment, net | | | 17,077,895 | | | | 5,792,130 | | | | 5,050,438 | | | | 17,421 | | | | - | | | | 27,937,884 | |
| Other non-current assets | | | 8,153,792 | | | | 3,778,164 | | | | 2,560,488 | | | | 254,696 | | | | (20,799 | ) | | | 14,726,341 | |
| Non-Current assets | | | 25,966,435 | | | | 9,581,430 | | | | 7,638,593 | | | | 276,069 | | | | (20,799 | ) | | | 43,441,729 | |
| Total assets | | $ | 33,540,067 | | | $ | 12,828,047 | | | $ | 8,614,683 | | | $ | 722,348 | | | $ | (145,627 | ) | | $ | 55,559,517 | |
| | | | | | | | | | | | | | | | | | | | | | | | | |
| Accounts payable | | $ | (1,852,745 | ) | | $ | (386,400 | ) | | $ | (259,115 | ) | | $ | (791,505 | ) | | $ | 9,533 | | | $ | (3,280,232 | ) |
| Financial obligations (short-term) | | | (83,316 | ) | | | (246,093 | ) | | | (107,671 | ) | | | - | | | | - | | | | (437,081 | ) |
| Other Current Liabilities | | | (1,730,724 | ) | | | (1,543,690 | ) | | | (434,626 | ) | | | (43,861 | ) | | | - | | | | (3,752,901 | ) |
| Current Liabilities | | | (3,666,785 | ) | | | (2,176,183 | ) | | | (801,412 | ) | | | (835,366 | ) | | | 9,533 | | | | (7,470,213 | ) |
| Financial obligations (long-term) | | | (3,220,265 | ) | | | (1,452,892 | ) | | | (1,041,198 | ) | | | - | | | | - | | | | (5,714,354 | ) |
| Other non-Current Liabilities | | | (6,218,381 | ) | | | (1,307,492 | ) | | | (1,130,167 | ) | | | (223,244 | ) | | | 15,602 | | | | (8,863,682 | ) |
| Non-current liabilities | | | (9,438,646 | ) | | | (2,760,384 | ) | | | (2,171,365 | ) | | | (223,244 | ) | | | 15,602 | | | | (14,578,036 | ) |
| Total Liabilities | | | (13,105,431 | ) | | | (4,936,567 | ) | | | (2,972,777 | ) | | | (1,058,610 | ) | | | 25,136 | | | | (22,048,249 | ) |
| Non-controlling interest | | | - | | | | (11,696 | ) | | | (929,615 | ) | | | - | | | | - | | | | (941,311 | ) |
| Shareholders’ equity of Ecopetrol | | | (20,434,636 | ) | | | (7,879,784 | ) | | | (4,712,291 | ) | | | 336,262 | | | | 120,492 | | | | (32,569,957 | ) |
| Total Equity | | | (20,434,636 | ) | | | (7,891,480 | ) | | | (5,641,906 | ) | | | 336,262 | | | | 120,492 | | | | (33,511,268 | ) |
| Total liabilities and equity | | $ | (33,540,067 | ) | | $ | (12,828,047 | ) | | $ | (8,614,683 | ) | | $ | (722,348 | ) | | $ | 145,627 | | | $ | (55,559,517 | ) |
| Capital expenditures | | $ | 5,652,330 | | | $ | 3,634,939 | | | $ | 3,556,733 | | | $ | 8,587 | | | $ | - | | | $ | 12,852,589 | |
| Goodwill | | $ | 1,393,705 | | | $ | 603,193 | | | $ | 510,654 | | | $ | - | | | $ | - | | | $ | 2,507,552 | |
Ecopetrol S.A. and Subsidiaries
Notes to the Consolidated Financial Statements
Years ended December 31, 2010, 2009 and 2008
The Company’s statement of net income by segment is as follows in accordance with RCP:
| | | Year ended December 31, 2010 | |
| | | Exploration & Production | | | Refining Activities | | | Transportation | | | Market and Supply | | | Eliminations | | | Total | |
| | | | | | | | | | | | | | | | | | | |
| Revenues: | | | | | | | | | | | | | | | | | | |
| Local sales | | $ | 1,302,275 | | | $ | 14,166,202 | | | $ | 1,819,125 | | | $ | 955,576 | | | $ | (158,753 | ) | | $ | 18,084,425 | |
| Foreign sales, net | | | 13,629,198 | | | | 5,641,545 | | | | 717 | | | | 8,163,371 | | | | (3,550,945 | ) | | | 23,883,886 | |
| Inter-segment net operating revenues | | | 9,032,898 | | | | 1,024,563 | | | | 1,876,594 | | | | 47,061 | | | | (11,981,116 | ) | | | - | |
| Total Revenue | | | 23,964,371 | | | | 20,832,310 | | | | 3,696,436 | | | | 9,166,008 | | | | (15,690,814 | ) | | | 41,968,311 | |
| Cost of sales | | | 6,990,223 | | | | 20,421,756 | | | | 1,538,713 | | | | 8,542,971 | | | | (15,510,409 | ) | | | 21,983,254 | |
| Depreciation, depletion and amortization | | | 2,759,835 | | | | 487,911 | | | | 727,970 | | | | 31 | | | | - | | | | 3,975,747 | |
| Selling and projects | | | 2,014,600 | | | | 338,349 | | | | 91,512 | | | | 82,484 | | | | - | | | | 2,526,945 | |
| Administration expenses | | | 242,717 | | | | 184,420 | | | | 164,985 | | | | 11,401 | | | | - | | | | 603,523 | |
| Costs and expenses | | | 12,007,375 | | | | 21,432,436 | | | | 2,523,180 | | | | 8,636,887 | | | | (15,510,409 | ) | | | 29,089,469 | |
| Operating income | | | 11,956,996 | | | | (600,126 | ) | | | 1,173,256 | | | | 529,121 | | | | (180,405 | ) | | | 12,878,842 | |
| Financial income (expenses), net | | | 115,361 | | | | (55,244 | ) | | | 983 | | | | (7,242 | ) | | | (16,069 | ) | | | 37,789 | |
| Pension expenses | | | (157,035 | ) | | | (171,547 | ) | | | (48,706 | ) | | | (338 | ) | | | - | | | | (377,626 | ) |
| Other non-operating income (expenses) | | | (443,165 | ) | | | (230,956 | ) | | | (178,391 | ) | | | (193,876 | ) | | | - | | | | (1,046,388 | ) |
| Other expenses, net | | | (484,839 | ) | | | (457,747 | ) | | | (226,114 | ) | | | (201,456 | ) | | | (16,069 | ) | | | (1,386,225 | ) |
| Income before income taxes and non-controlling | | | 11,472,157 | | | | (1,057,873 | ) | | | 947,142 | | | | 327,665 | | | | (196,474 | ) | | | 11,492,617 | |
| Income tax benefit (expense) | | | (3,127,944 | ) | | | 266,997 | | | | (294,616 | ) | | | (83,087 | ) | | | - | | | | (3,238,650 | ) |
| Non-Controlling interest | | | - | | | | 403 | | | | (107,899 | ) | | | - | | | | - | | | | (107,496 | ) |
| Net income for the year attributable to Ecopetrol | | $ | 8,344,213 | | | $ | (790,473 | ) | | $ | 544,627 | | | $ | 244,578 | | | $ | (196,474 | ) | | $ | 8,146,471 | |
| | | Year ended December 31, 2009 | |
| | | Exploration & Production | | | Refining Activities | | | Transportation | | | Market and Supply | | | Eliminations | | | Total | |
| | | | | | | | | | | | | | | | | | | |
| Revenues: | | | | | | | | | | | | | | | | | | |
| Local sales | | $ | 2,865,478 | | | $ | 11,838,570 | | | $ | 964,194 | | | $ | 2,083,460 | | | $ | (3,693,168 | ) | | $ | 14,058,534 | |
| Foreign sales, net | | | 6,838,783 | | | | 4,196,143 | | | | 836 | | | | 5,310,094 | | | | - | | | | 16,345,856 | |
| Inter-segment net operating revenues | | | 7,801,225 | | | | 958,026 | | | | 1,703,915 | | | | 67,607 | | | | (10,530,773 | ) | | | - | |
| Total Revenue | | | 17,505,486 | | | | 16,992,739 | | | | 2,668,945 | | | | 7,461,161 | | | | (14,223,941 | ) | | | 30,404,390 | |
| Cost of sales | | | 5,490,208 | | | | 16,512,052 | | | | 1,340,638 | | | | 7,725,926 | | | | (14,103,449 | ) | | | 16,965,375 | |
| Depreciation, depletion and amortization | | | 1,893,936 | | | | 411,512 | | | | 635,186 | | | | 64 | | | | - | | | | 2,940,698 | |
| Selling and projects | | | 1,569,576 | | | | 250,862 | | | | 69,927 | | | | 72,277 | | | | - | | | | 1,962,642 | |
| Administration expenses | | | 260,901 | | | | 231,497 | | | | 161,344 | | | | 10,122 | | | | (1,528 | ) | | | 662,336 | |
| Costs and expenses | | | 9,214,621 | | | | 17,405,923 | | | | 2,207,095 | | | | 7,808,389 | | | | (14,104,977 | ) | | | 22,531,051 | |
| Operating income | | | 8,290,865 | | | | (413,184 | ) | | | 461,850 | | | | (347,228 | ) | | | (118,964 | ) | | | 7,873,339 | |
| Financial income (expenses), net | | | 530,074 | | | | (79,891 | ) | | | (2,802 | ) | | | 48,452 | | | | - | | | | 495,833 | |
| Pension expenses | | | (249,252 | ) | | | (272,284 | ) | | | (73,085 | ) | | | (536 | ) | | | - | | | | (595,157 | ) |
| Other non-operating income (expenses) | | | (256,842 | ) | | | (8,364 | ) | | | (159,406 | ) | | | (97,031 | ) | | | (1,528 | ) | | | (523,171 | ) |
| Other expenses, net | | | 23,980 | | | | (360,539 | ) | | | (235,293 | ) | | | (49,115 | ) | | | (1,528 | ) | | | (622,495 | ) |
| Income before income taxes and non-controlling interest | | | 8,314,845 | | | | (773,723 | ) | | | 226,557 | | | | (396,343 | ) | | | (120,492 | ) | | | 7,250,844 | |
| Income tax benefit (expense) | | | (2,330,443 | ) | | | 183,019 | | | | (77,441 | ) | | | 110,836 | | | | - | | | | (2,114,029 | ) |
| Non-controlling interest | | | (39,270 | ) | | | 31,272 | | | | 3,237 | | | | - | | | | - | | | | (4,761 | ) |
| Net income for the year attributable to Ecopetrol | | $ | 5,945,132 | | | $ | (559,432 | ) | | $ | 152,353 | | | $ | (285,507 | ) | | $ | (120,492 | ) | | $ | 5,132,054 | |
Ecopetrol S.A. and Subsidiaries
Notes to the Consolidated Financial Statements
Years ended December 31, 2010, 2009 and 2008
| | | Year ended December 31, 2008 | |
| | | Exploration & Production | | | Refining Activities | | | Transportation | | | Market and Supply | | | Eliminations | | | Total | |
| | | | | | | | | | | | | | | | | | | |
| Revenues: | | | | | | | | | | | | | | | | | | |
| Local sales | | $ | 3,221,054 | | | $ | 14,500,342 | | | $ | 716,284 | | | $ | 3,160,319 | | | $ | - | | | $ | 21,597,999 | |
| Foreign sales, net | | | 4,888,275 | | | | 3,273,018 | | | | 1,139 | | | | 4,136,238 | | | | - | | | | 12,298,670 | |
| Inter-segment net operating revenues | | | 11,644,466 | | | | 828,629 | | | | 1,436,763 | | | | 62,938 | | | | (13,972,796 | ) | | | - | |
| Total Revenue | | | 19,753,795 | | | | 18,601,989 | | | | 2,154,186 | | | | 7,359,495 | | | | (13,972,796 | ) | | | 33,896,669 | |
| Cost of sales | | | 4,649,150 | | | | 17,898,231 | | | | 1,101,136 | | | | 7,370,147 | | | | (13,972,796 | ) | | | 17,045,868 | |
| Depreciation, depletion and amortization | | | 1,538,320 | | | | 302,534 | | | | 197,345 | | | | 369 | | | | - | | | | 2,038,568 | |
| Selling and projects | | | 991,203 | | | | 300,188 | | | | 431,576 | | | | 49,807 | | | | - | | | | 1,772,774 | |
| Administration expenses | | | 131,546 | | | | 161,223 | | | | 85,093 | | | | 4,239 | | | | - | | | | 382,101 | |
| Costs and expenses | | | 7,310,219 | | | | 18,662,176 | | | | 1,815,150 | | | | 7,424,562 | | | | (13,972,796 | ) | | | 21,239,311 | |
| Operating income | | | 12,443,576 | | | | (60,187 | ) | | | 339,036 | | | | (65,067 | ) | | | - | | | | 12,657,358 | |
| Financial income (expenses), net | | | 3,717,490 | | | | 87,440 | | | | 104,502 | | | | 191,820 | | | | - | | | | 4,101,252 | |
| Pension expenses | | | (479,495 | ) | | | (523,803 | ) | | | (140,597 | ) | | | (1,030 | ) | | | - | | | | (1,144,925 | ) |
| Other non-operating income (expenses) | | | 162,097 | | | | 143,400 | | | | 151,486 | | | | (59,464 | ) | | | - | | | | 397,519 | |
| Other expenses, net | | | 3,400,092 | | | | (292,963 | ) | | | 115,391 | | | | 131,326 | | | | - | | | | 3,353,846 | |
| Income before income taxes and non-controlling | | | 15,843,668 | | | | (353,150 | ) | | | 454,427 | | | | 66,259 | | | | - | | | | 16,011,204 | |
| Income tax benefit (expense) | | | (4,330,126 | ) | | | 90,574 | | | | (124,321 | ) | | | (18,109 | ) | | | - | | | | (4,381,982 | ) |
| Net income | | | 11,513,542 | | | | (262,576 | ) | | | 330,106 | | | | 48,150 | | | | - | | | | 11,629,222 | |
| Less: Net loss (income) attributable to Non-controlling interest | | | - | | | | - | | | | 455 | | | | - | | | | - | | | | 455 | |
| Net income for the year attributable to Ecopetrol S.A. | | $ | 11,513,542 | | | $ | (262,576 | ) | | $ | 330,561 | | | $ | 48,150 | | | $ | - | | | $ | 11,629,677 | |
The following tables illustrate sales by geographic zones:
Sales by Geographic Zones for the year ended December 31, 2010
| Zone | | Products | | Value | | | Participation | |
| Colombia* | | Crude oil, Refined, Petrochemicals and natural gas | | $ | 18,229,158 | | | | 43.4 | % |
| United States of America | | Crude oil, Refined and Petrochemicals | | | 14,965,911 | | | | 35.7 | % |
| Asia | | Crude oil, Refined and Petrochemicals | | | 3,952,186 | | | | 9.4 | % |
| South America (excluding Colombia) | | Crude oil, Refined, Petrochemicals and natural gas | | | 1,031,808 | | | | 2.5 | % |
| Central America and Caribbean | | Crude oil, Refined and Petrochemicals | | | 2,311,529 | | | | 5.5 | % |
| Europe | | Crude oil, Refined and Petrochemicals | | | 1,431,301 | | | | 3.4 | % |
| Other | | Petrochemicals | | | 46,418 | | | | 0.1 | % |
| | | | | $ | 41,968,311 | | | | 100.0 | % |
*Includes sales to free trade zone sales of $144,734 (The sales of Natural gas $34,904 and $109 of petrochemicals as a part of sales to free trade zone)
Sales by Geographic Zones for the year ended December 31, 2009
| Zone | | Products | | Value | | | Participation | |
| Colombia* | | Crude oil, Refined, Petrochemicals and natural gas | | $ | 14,134,884 | | | | 46.5 | % |
| United States of America | | Crude oil, Refined and Petrochemicals | | | 10,875,221 | | | | 35.8 | % |
| Asia | | Crude oil, Refined and Petrochemicals | | | 2,151,854 | | | | 7,1 | % |
| South America | | Crude oil, Refined, Petrochemicals and natural gas | | | 561,221 | | | | 1.8 | % |
| Central America and Caribbean | | Crude oil, Refined and Petrochemicals | | | 1,473,225 | | | | 4.8 | % |
| Europe | | Crude oil, Refined and Petrochemicals | | | 1,207,367 | | | | 4.0 | % |
| Other | | Petrochemicals | | | 618 | | | | 0.0 | % |
| | | | | $ | 30,404,390 | | | | 100.0 | % |
*Includes sales to free trade zone of $76,350
Ecopetrol S.A. and Subsidiaries
Notes to the Consolidated Financial Statements
Years ended December 31, 2010, 2009 and 2008
Sales by Geographic Zones for the year ended December 31, 2008
| Zone | | Products | | Value | | | Participation | |
| Colombia | | Crude oil, Refined, Petrochemicals and natural gas | | $ | 21,597,999 | | | | 63.7 | % |
| United States of America | | Crude oil, Refined and Petrochemicals | | | 7,847,375 | | | | 23.2 | % |
| Asia | | Crude oil, Refined and Petrochemicals | | | 1,516,946 | | | | 4.5 | % |
| South America | | Crude oil, Refined, Petrochemicals and natural gas | | | 1,024,709 | | | | 3.0 | % |
| Central America and Caribbean | | Crude oil, Refined and Petrochemicals | | | 1,188,904 | | | | 3.5 | % |
| Europe | | Crude oil, Refined and Petrochemicals | | | 605,655 | | | | 1.8 | % |
| Other | | Petrochemicals | | | 115,081 | | | | 0.3 | % |
| | | | | $ | 33,896,669 | | | | 100.0 | % |
Sales of products by Segment for the year ended December 31, 2010
| Local Sales | | Exploration & Production | | | Refining Activities | | | Transportation | | | Market and Supply | | | Eliminations | | | Total | |
| Medium distillates | | $ | 5,058 | | | $ | 6,588,097 | | | $ | - | | | $ | 506,021 | | | $ | - | | | $ | 7,099,176 | |
| Gasolines | | | - | | | | 4,324,551 | | | | - | | | | - | | | | (22,269 | ) | | | 4,302,282 | |
| Crude Oil | | | 123,797 | | | | - | | | | - | | | | - | | | | (6,611 | ) | | | 117,186 | |
| Other products | | | 189,833 | | | | 1,214,831 | | | | - | | | | 16,124 | | | | (68 | ) | | | 1,420,720 | |
| Services | | | 97,350 | | | | 32,546 | | | | 1,819,125 | | | | 54,492 | | | | (55,684 | ) | | | 1,947,829 | |
| Natural Gas | | | 854,427 | | | | - | | | | - | | | | 378,939 | | | | (74,121 | ) | | | 1,159,245 | |
| L.P.G. | | | 31,810 | | | | 595,551 | | | | - | | | | - | | | | - | | | | 627,361 | |
| Diesel and gasoline price differentials | | | - | | | | 740,682 | | | | - | | | | - | | | | - | | | | 740,682 | |
| Plastic and rubber | | | - | | | | 669,944 | | | | - | | | | - | | | | - | | | | 669,944 | |
| Total local sales | | $ | 1,302,275 | | | $ | 14,166,202 | | | $ | 1,819,125 | | | $ | 955,576 | | | $ | (158,753 | ) | | $ | 18,084,425 | |
The following tables illustrate sales of products by Segment:
Sales of products by Segment for the year ended December 31, 2010
| Foreign Sales | | Exploration & Production | | | Refining | | | Transportation | | | Market and Supply | | | Eliminations | | | Total | |
| | | | | | | | | | | | | | | | | | | |
| Crude oil | | $ | 13,515,877 | | | $ | - | | | $ | - | | | $ | 8,108,425 | | | $ | (3,550,945 | ) | | $ | 18,073,357 | |
| Fuel oil | | | - | | | | 2,377,266 | | | | - | | | | - | | | | - | | | | 2,377,266 | |
| Gasoline | | | - | | | | 687,984 | | | | - | | | | 10,084 | | | | - | | | | 698,068 | |
| Diesel | | | - | | | | 1,638,044 | | | | - | | | | - | | | | - | | | | 1,638,044 | |
| Natural Gas | | | 101,363 | | | | - | | | | - | | | | 44,700 | | | | - | | | | 1,638,044 | |
| Plastic and rubber | | | - | | | | 673,574 | | | | - | | | | - | | | | - | | | | 673,574 | |
| Other products | | | 11,958 | | | | 264,677 | | | | 717 | | | | 162 | | | | - | | | | 277,514 | |
| Total foreign sales | | $ | 13,629,198 | | | $ | 5,641,545 | | | $ | 717 | | | $ | 8,163,371 | | | $ | (3,550,945 | ) | | $ | 23,883,886 | |
Sales of products by Segment for the year ended December 31, 2009
| Local Sales | | Exploration & Production | | | Refining | | | Transportation | | | Market and Supply | | | Eliminations | | | Total | |
| Medium distillates | | $ | 9,808 | | | $ | 5,087,659 | | | $ | - | | | $ | - | | | $ | - | | | $ | 5,097,467 | |
| Gasolines | | | - | | | | 5,001,527 | | | | - | | | | 14,373 | | | | - | | | | 5,015,900 | |
| Crude Oil | | | 1,943,410 | | | | - | | | | - | | | | 1,692,832 | | | | (3,618,048 | ) | | | 18,194 | |
| Other products | | | 128,038 | | | | 446,647 | | | | - | | | | 1,605 | | | | - | | | | 576,290 | |
| Services | | | 75,322 | | | | 82,616 | | | | 964,194 | | | | 38,284 | | | | (47,341 | ) | | | 1,113,075 | |
| Natural Gas | | | 691,930 | | | | - | | | | - | | | | 336,366 | | | | (27,779 | ) | | | 1,000,517 | |
| L.P.G. | | | 16,970 | | | | 452,581 | | | | - | | | | - | | | | - | | | | 469,551 | |
| Diesel and gasoline price differentials | | | - | | | | 196,533 | | | | - | | | | - | | | | - | | | | 196,533 | |
| Plastic and rubber | | | - | | | | 571,007 | | | | - | | | | - | | | | - | | | | 571,007 | |
| Total local sales | | $ | 2,865,478 | | | $ | 11,838,570 | | | $ | 964,194 | | | $ | 2,083,460 | | | $ | (3,693,168 | ) | | $ | 14,058,534 | |
Ecopetrol S.A. and Subsidiaries
Notes to the Consolidated Financial Statements
Years ended December 31, 2010, 2009 and 2008
Sales of products by Segment for the year ended December 31, 2009
| Foreign Sales | | Exploration & Production | | | Refining | | | Transportation | | | Market and Supply | | | Eliminations | | | Total | |
| Crude oil | | $ | 6,613,961 | | | $ | - | | | $ | - | | | $ | 5,201,551 | | | $ | - | | | $ | 11,815,512 | |
| Fuel oil | | | - | | | | 1,660,911 | | | | - | | | | - | | | | - | | | | 1,660,911 | |
| Gasoline | | | - | | | | 1,713,823 | | | | - | | | | 10,712 | | | | - | | | | 1,724,535 | |
| Natural Gas | | | 214,091 | | | | - | | | | - | | | | 97,643 | | | | - | | | | 311,734 | |
| Plastic and rubber | | | - | | | | 544,912 | | | | - | | | | - | | | | - | | | | 544,912 | |
| Other products | | | 10,731 | | | | 276,497 | | | | 836 | | | | 188 | | | | - | | | | 288,252 | |
| Total foreign sales | | $ | 6,838,783 | | | $ | 4,196,143 | | | $ | 836 | | | $ | 5,310,094 | | | $ | - | | | $ | 16,345,856 | |
Sales of products by Segment for the year ended December 31, 2008
| Local Sales | | Exploration & Production | | | Refining Activities | | | Transportation | | | Market and Supply | | | Eliminations | | | Total | |
| Medium distillates | | $ | 11,312 | | | $ | 5,587,435 | | | $ | - | | | $ | 315,880 | | | $ | - | | | $ | 5,914,627 | |
| Gasolines | | | 41 | | | | 3,635,254 | | | | - | | | | 9,050 | | | | | | | | 3,644,345 | |
| Crude Oil | | | 2,312,950 | | | | - | | | | - | | | | 2,461,451 | | | | - | | | | 4,774,401 | |
| Other products | | | 178,233 | | | | 1,160,873 | | | | - | | | | 36,685 | | | | - | | | | 1,375,791 | |
| Services | | | 94,644 | | | | 70,912 | | | | 716,284 | | | | 39,812 | | | | - | | | | 921,652 | |
| Natural Gas | | | 603,973 | | | | - | | | | - | | | | 297,441 | | | | - | | | | 901,414 | |
| L.P.G. | | | 19,901 | | | | 592,870 | | | | - | | | | - | | | | - | | | | 612,771 | |
| Diesel and gasoline price differentials | | | - | | | | 3,070,479 | | | | - | | | | - | | | | - | | | | 3,070,479 | |
| Plastic and rubber | | | - | | | | 382,519 | | | | - | | | | - | | | | - | | | | 382,519 | |
| Total local sales | | $ | 3,221,054 | | | $ | 14,500,342 | | | $ | 716,284 | | | $ | 3,160,319 | | | $ | - | | | $ | 21,597,999 | |
Sales of products by Segment for the year ended December 31, 2008
| Foreign Sales | | Exploration & Production | | | Refining | | | Transportation | | | Market and Supply | | | Eliminations | | | Total | |
| | | | | | | | | | | | | | | | | | | |
| Crude oil | | $ | 4,658,337 | | | $ | - | | | $ | - | | | $ | 4,037,945 | | | $ | - | | | $ | 8,696,282 | |
| Fuel oil | | | - | | | | 2,093,012 | | | | - | | | | - | | | | - | | | | 2,093,012 | |
| Gasoline | | | - | | | | 186,197 | | | | - | | | | - | | | | - | | | | 186,197 | |
| Natural Gas | | | 215,312 | | | | - | | | | - | | | | 98,036 | | | | - | | | | 313,348 | |
| Plastic and rubber | | | - | | | | 704,034 | | | | - | | | | - | | | | - | | | | 704,034 | |
| Other products | | | 14,626 | | | | 289,775 | | | | 1,139 | | | | 257 | | | | - | | | | 305,797 | |
| Total foreign sales | | $ | 4,888,275 | | | $ | 3,273,018 | | | $ | 1,139 | | | $ | 4,136,238 | | | $ | - | | | $ | 12,298,670 | |
xxvi. RELATED PARTIES
In addition to the transactions disclosed in Note 14, Ecopetrol is controlled by the Colombian Government which owns a majority stake in the Company. Therefore Ecopetrol has numerous transactions with other government entities as well as state-owned companies in the ordinary course of its business. The most significant of these transactions are disclosed below:
Price differentials: Ecopetrol sell prices are regulated and the National Government pays to Ecopetrol the amount of the benefit price for the refined products generated between the income of the regulated producer and the equivalent price quoted in the international market . The amount of price differential included in revenue in 2010, 2009 and 2008 were $740,682, $196,533 and $3,070,479, respectively. Additionally, in 2010, 2009 and 2008, the Company recognized interests amounting to $929, $235,704 and $93,218, respectively, which corresponds to the price differentials recorded.
Purchases of hydrocarbons from ANH – The Company purchases the physical product that the ANH receives from all producers in Colombia at prices set forth in the Law 756 of 2002 and Resolution 18 1709 of 2003, which reference international prices. For more information on this transaction, please see Notes 1 and 24. (Consolidated Financial Statements).
Ecopetrol S.A. and Subsidiaries
Notes to the Consolidated Financial Statements
Years ended December 31, 2010, 2009 and 2008
The following table presents accounts receivable and payable with related parties as of December 31, 2010 and 2009:
| | | 2010 | | | 2009 | |
| | | Assets | | | Liabilities | | | Assets | | | Liabilities | |
| Ministerio de Hacienda y Crédito Público | | $ | 1,930,947 | | | $ | 332 | | | $ | 1,015,691 | | | $ | 130,668 | |
| Ministerio de Minas y Energía | | | - | | | | - | | | | 37,228 | | | | - | |
| U.A.E. Agencia Nacional de Hidrocarburos | | | 66,913 | | | | - | | | | 134,108 | | | | 9,093 | |
| E.S.P. Empresa de Energía de Bogotá S.A. | | | 1,101,455 | | | | - | | | | 503,217 | | | | - | |
| E.S.P. Generadora de Energía del Caribe S.A. | | | 37,219 | | | | - | | | | 54,337 | | | | 23,735 | |
| Interconexión Eléctrica S.A. – ESP | | | 833,206 | | | | 74 | | | | 766,969 | | | | - | |
| Entidades Territoriales (Departamentos, Municipios) | | | 37,232 | | | | 24,099 | | | | 17,438 | | | | 7,399 | |
| Empresas Públicas de Medellín S.A. – ESP | | | 8,568 | | | | 113 | | | | 33,038 | | | | 62 | |
| Isagen S.A. | | | 199 | | | | 23 | | | | 8,306 | | | | 45 | |
| E.S.P. Transportadora de Gas del Interior S.A. | | | 3,982 | | | | 434 | | | | 4,666 | | | | - | |
| Empresa Colombiana de Gas | | | - | | | | - | | | | - | | | | - | |
| E.S.P. Termoemcali S.A. | | | - | | | | - | | | | 34,001 | | | | - | |
| E.S.P. Gestión Energética S.A. | | | - | | | | - | | | | 600 | | | | - | |
| Central Hidroeléctrica de Caldas S.A. E.S.P | | | - | | | | 937 | | | | 529 | | | | - | |
| Universidad Industrial de Santander U.I.S. | | | 11 | | | | - | | | | 18 | | | | - | |
| Dirección de Impuestos y Aduanas Nacionales DIAN | | | 1,341,223 | | | | 3,288,780 | | | | 11,961 | | | | 2,023,516 | |
| Others | | | 1,498 | | | | 5,124 | | | | 484 | | | | 3,855 | |
| | | $ | 5,362,455 | | | $ | 3,319,915 | | | $ | 2,622,591 | | | $ | 2,198,373 | |
Other transactions with related parties during 2010, 2009 and 2008 are:
| | | 2010 | | | 2009 | | | 2008 | |
| | | Income | | | Expenses | | | Income | | | Expenses | | | Income | | | Expenses | |
| Ministerio de Minas y Energía | | $ | - | | | $ | - | | | $ | - | | | $ | - | | | $ | 3,870,348 | | | $ | - | |
| Dirección de Impuestos y Aduanas Nacionales DIAN | | | 1 | | | | 3,523,700 | | | | 19 | | | | 4,295,093 | | | | - | | | | 4,855,718 | |
| Entidades Territoriales (Departamentos, Municipios) | | | 1,328 | | | | 30,986 | | | | 15 | | | | 121,396 | | | | - | | | | 133,346 | |
| Contraloría General de la República | | | - | | | | 52,876 | | | | - | | | | 33,106 | | | | - | | | | 25,811 | |
| Ministerio de Defensa Nacional | | | 124 | | | | - | | | | - | | | | 12,128 | | | | - | | | | 15,774 | |
| Ministerio de Transporte | | | - | | | | - | | | | - | | | | - | | | | - | | | | 13,922 | |
| Inversiones de Gases de Colombia S.A. - Invercolsa | | | - | | | | - | | | | - | | | | - | | | | 9,231 | | | | - | |
| Unidad de Planeación Minero Energética | | | - | | | | 2,557 | | | | - | | | | 2,308 | | | | - | | | | 2,206 | |
| Others | | | 376,712 | | | | 49,347 | | | | 745 | | | | 19,526 | | | | 1,653 | | | | 7,311 | |
| | | $ | 378,165 | | | $ | 3,659,494 | | | $ | 779 | | | $ | 2,533,369 | | | $ | 3,881,232 | | | $ | 5,054,088 | |
Material Related Party Agreements
Set forth below is a description of the Company's material related party agreements:
We entered into a supply agreement with Ecodiesel Colombia S.A., or Ecodiesel, a company in which we have a 50% equity interest. This agreement has been operative since August 1, 2010. Pursuant to the terms of this agreement, Ecodiesel must deliver to us and we must purchase from Ecodiesel at least the guaranteed amount of 48.100 bls of Ecodiesel's biodiesel production each month. Payments vary depending on the purchased volumes of biodiesel. This agreement expires on December 31, 2017.
In 2010, we renewed the service agreement with Sociedad Colombiana de Servicios Portuarios S.A. or Serviport S.A., a company in which we have 49% equity interest. Pursuant to the terms of the agreement, Serviport assists the Company in its maritime operations in the Coveñas port. This agreement expires on May 27, 2019.
The Technical Service Agreement signed between SAVIA and us consists of management, administration, technical and business advice in order to implement all the necessary operations of several offshore oil and gas concessions in Peru, the Technical Services shall be implemented in Peru and will mainly concentrate on the following matters: Technical, Geological, Drilling, Operation, HSE, Administration, Legal, Human Resources, and Information Technology. Ecopetrol has a 50% equity interest in Offshore International Group which owns SAVIA Peru S.A. The Technical Service Agreement is worth US$ 1,000,000 per year.
Ecopetrol S.A. and Subsidiaries
Notes to the Consolidated Financial Statements
Years ended December 31, 2010, 2009 and 2008
xxvii. FAIR VALUE
Accounting standards for fair value measurement (ASC 820) establish a framework for measuring fair value and stipulate disclosures about fair value measurements. The standards apply to recurring and nonrecurring financial and nonfinancial assets and liabilities that require or permit fair-value measurements. Among the required disclosures is the fair-value hierarchy of inputs the company uses to value an asset or a liability. The three levels of the fair-value hierarchy are described as follows:
Level 1: Quoted prices (unadjusted) in active markets for identical assets and liabilities. For the Company, Level 1 inputs include marketable securities that are actively traded.
Level 2: Inputs other than Level 1 that is observable, either directly or indirectly. For the Company, Level 2 inputs include quoted prices for similar assets, prices obtained through third-party broker quotes, and prices that can be corroborated with other observable inputs for substantially the complete term of a contract.
Level 3: Unobservable inputs. The Company does not use Level 3 inputs for any of its recurring fair-value measurements. Level 3 inputs may be required for the determination of fair value associated with certain nonrecurring measurements of nonfinancial assets and liabilities. In 2010, the Company used Level 3 inputs to determine the fair value of certain nonrecurring nonfinancial assets.
The fair value hierarchy for recurring assets measured at fair value at December 31, 2010, and December 31, 2009, is as follows:
| | | | | Fair Value at Reporting Date Using | | | | Fair Value at Reporting Date Using | |
| | | | | Quoted Price in Active Markets for Identical Assets | | Significant Other Observable Inputs | | Significant Unobservable Inputs | | | | Quoted Price in Active Markets for Identical Assets | | Significant Other Observable Inputs | | Significant Unobservable Inputs | |
| Description | | 2010 | | (Level 1) | | (Level 2) | | (Level 3) | | 2009 | | (Level 1) | | (Level 2) | | (Level 3) | |
| ASSETS | | | | | | | | | | | | | | | | | |
| Available for sale debt securities | | | | | | | | | | | | | | | | | |
| Securities issued by mixed – economy governmental entities | | $ | 1,932,115 | | $ | 1,932,115 | | $ | - | | $ | - | | $ | 764,853 | | $ | 764,853 | | | - | | | - | |
| Securities issued or secured by Colombian government | | | 1,642,336 | | | 1,642,336 | | | - | | | - | | | 724,137 | | | 724,137 | | | - | | | - | |
| Securities issued or secured by government sponsored enterprise (GSEs) | | | 1,498,957 | | | 1,498,957 | | | - | | | - | | | 1,712,550 | | | 1,712,550 | | | - | | | - | |
| Securities issued or secured by financial entities | | | 120,044 | | | 120,044 | | | - | | | - | | | 11,185 | | | 11,185 | | | - | | | - | |
| Other debt securities | | | 29,585 | | | 29,585 | | | - | | | - | | | - | | | - | | | - | | | - | |
| Securities issued or secured by USA government | | | 642,974 | | | 642,974 | | | - | | | - | | | 153,186 | | | 153,186 | | | - | | | - | |
| Total available for sale debt securities | | | 5,866,011 | | | 5,866,011 | | | - | | | - | | | 3,365,910 | | | 3,365,910 | | | - | | | - | |
| Derivatives | | | | | | | | | | | | | | | | | | | | | | | | | |
| Option | | | 12,651 | | | - | | | 12,651 | | | - | | | 66,099 | | | - | | | 66,099 | | | - | |
| Swap | | | 21,191 | | | - | | | 21,191 | | | - | | | 184 | | | - | | | 184 | | | - | |
| FX Forward | | | 107 | | | - | | | 107 | | | - | | | - | | | - | | | | | | - | |
| Total derivatives | | | 33,949 | | | - | | | 33,949 | | | - | | | 66,283 | | | - | | | 66,283 | | | - | |
| Total Recurring Assets at fair value | | $ | 5,899,960 | | $ | 5,866,010 | | $ | 33,949 | | $ | - | | $ | 3,432,193 | | $ | 3,365,910 | | $ | 66,283 | | $ | - | |
Ecopetrol S.A. and Subsidiaries
Notes to the Consolidated Financial Statements
Years ended December 31, 2010, 2009 and 2008
Marketable Securities: The Company calculates fair value for its marketable securities based on quoted market prices for identical assets and liabilities. The fair values reflect the cash that would have been received if the instruments were sold at December 31, 2010.
Derivatives: The Company records its derivative instruments on the Consolidated Balance Sheet at fair value, with the offsetting amount to the Consolidated Statement of Income. For derivatives with identical or similar provisions as contracts that are publicly traded on a regular basis, the company uses the market values of the publicly traded instruments as an input for fair-value calculations.
The company’s derivative instruments principally include foreign exchange and refined-product (asphalt) swaps, options and forward contracts, principally with financial institutions and other oil and gas companies, the fair values for which are obtained from third-party broker quotes, industry pricing services and exchanges.
The company obtains multiple sources of pricing information for the Level 2 instruments. Since this pricing information is generated from observable market data, it has historically been very consistent. The company does not materially adjust this information.
The fair value hierarchy for non-recurring assets measured at fair value at December 31, 2010 is as follows:
| | | | | | Fair Value Measurements Using | | | | |
| Description | | 2010 | | | Quoted Price in Active Markets for Identical Assets Level 1 | | | Significant Other Observable Inputs Level 2 | | | Significant Unobservable Inputs Level 3 | | | Total Gains (Losses) | | | 2009 | |
| Equity Method Investment | | $ | 826,039 | | | $ | - | | | $ | - | | | $ | 826,039 | | | $ | 349,033 | | | $ | 1,075,308 | |
| Production fixed assets with impairment | | | 93,069 | | | | - | | | | - | | | | 93,069 | | | | 134,604 | | | | 338,158 | |
| Transportation fixed assets with impairment (*) | | | - | | | | - | | | | - | | | | - | | | | 865 | | | | 19,888 | |
| Other fixed assets | | | 11,609,275 | | | | - | | | | - | | | | 11,609,275 | | | | - | | | | 8,382,912 | |
| Total Fixed Assets | | $ | 11,702,344 | | | $ | - | | | $ | - | | | $ | 11,702,344 | | | $ | 135,469 | | | $ | 8,740,959 | |
| Total Non-Recurring Assets | | $ | 12,528,383 | | | $ | - | | | $ | - | | | $ | 12,528,383 | | | $ | 484,502 | | | $ | 9,816,267 | |
* Transportation fixed assets were written down to their fair value of $0, resulting in an impairment charge of ($865). Under U.S. GAAP in 2010 two transport systems were measured at fair value, in 2009 four transportation systems were measured at fair value.
Impairment of “Equity Method Investment”- During 2010 and in accordance with the accounting standard for Investments – Equity Method and Joint Ventures (ASC 323), the acquired participation in Offshore International Group with a carrying amount of $1,175,073 was written down to a fair value of $826,039, resulting in a before-tax loss of $359,981. The fair value was determined from internal cash-flow models, using discount rates consistent with those used by the company to evaluate cash flows of other assets of a similar nature.
Impairment of “Properties, plant and equipment”- During 2010 and in accordance with the accounting standard for the impairment or disposal of long-lived assets (ASC 360), long-lived assets “held and used” with a carrying amount of $12,232,611 were written down to a fair value of $11,702,344, resulting in a before-tax loss of $134,469. The fair values were determined from internal cash-flow models, using discount rates consistent with those used by the Company to evaluate cash flows of other assets of a similar nature. The respective long-lived assets were reviewed for impairment on a well-by-well basis.
Assets and Liabilities Not Required to Be Measured at Fair Value
Ecopetrol S.A. and Subsidiaries
Notes to the Consolidated Financial Statements
Years ended December 31, 2010, 2009 and 2008
The Company holds cash and cash equivalents. The instruments held are primarily time deposits and money market funds. The fair values reflect the cash that would have been received or paid if the instruments were settled at year-end. Cash equivalents had carrying/fair values of $3,910,745 and $3,837,670 at December 31, 2010 and 2009, respectively. Fair values of other financial instruments at the end of 2010 and 2009 were not material.
xxviii. SUPPLEMENTAL INFORMATION ON OIL AND GAS PRODUCING ACTIVITIES (UNAUDITED)
In accordance with the requirements of the United States Securities and Exchange Commission (SEC), Accounting Standards Codification 932 and the ASU- 2010-03 “Oil and Gas reserve Estimation and Disclosures” Rule, this section provides supplemental information on oil and gas exploration and producing activities of the Company. The information included in items (i) through (iii) provides historical cost information pertaining to costs incurred in exploration, property acquisitions and development, capitalized costs and results of operations. The information included in items (iv) and (v) presents information on Ecopetrol’s estimated net proved reserve quantities, standardized measure of estimated discounted future net cash flows related to proved reserves, and changes in estimated discounted future net cash flows.
The following information prepared under U.S. GAAP corresponds to Ecopetrol’s oil and gas producing activities at December 31 of 2010, 2009 and 2008 in direct and joint operations.
Under the new SEC final rule optional disclosure of possible and probable reserves is allowed, but the Company opted not to do so. Ecopetrol estimated its reserves without considering non-traditional resources.
Table i – Capitalized costs relating to oil and gas producing activities
| | | Year ended December 31 | |
| Consolidated Companies | | 2010 | | | 2009 | | | 2008 | |
| Natural and environmental properties – proved properties | | $ | 16,977,248 | | | $ | 12,188,806 | | | $ | 8,657,429 | |
| Wells, equipment and facilities – property, plant and equipment | | | 6,564,590 | | | | 5,359,419 | | | | 4,112,318 | |
| Construction in progress | | | 2,490,365 | | | | 2,321,427 | | | | 1,828,945 | |
| Accumulated depreciation, depletion and amortization | | | (11,864,137 | ) | | | (9,883,704 | ) | | | (7,637,750 | ) |
| Net capitalized costs | | $ | 14,168,065 | | | $ | 9,985,947 | | | $ | 6,960,942 | |
It includes information of the subsidiary companies of the sector of E & P.
There are no capitalized costs associated with unproved oil and gas properties for the periods reported.
In accordance with ASC 410-20, Asset Retirement Obligations, during 2010, 2009 and 2008 were added $30,748, $6,857 and $25,902, respectively, to the cost basis of oil and gas wells for wells drilled.
Table ii – Costs incurred in oil and gas exploration and development activities
Costs incurred are summarized below and include both amounts expensed and capitalized in the corresponding period.
| | | Year ended December 31 | |
| | | 2010 | | | 2009 | | | 2008 | |
| Acquisition of Proved Properties | | $ | - | | | $ | 2,879,233 | | | $ | 1,049,402 | |
| Exploration costs | | | 1,307,379 | | | | 1,258,827 | | | | 941,369 | |
| Development costs | | | 5,835,141 | | | | 4,717,550 | | | | 3,109,011 | |
| Total costs incurred | | $ | 7,142,520 | | | $ | 8,855,610 | | | $ | 4,799,659 | |
It includes information of the subsidiary companies of the sector of E & P.
Ecopetrol S.A. and Subsidiaries
Notes to the Consolidated Financial Statements
Years ended December 31, 2010, 2009 and 2008
Table iii - Results of operations for oil and gas producing activities
| | | 2010 | | | 2009 | | | 2008 | |
| Net revenues | | | | | | | | | |
| Sales | | $ | 15,245,110 | | | $ | 9,957,793 | | | $ | 8,109,328 | |
| Transfers | | | 9,032,898 | | | | 7,801,224 | | | | 11,644,467 | |
| Total | | $ | 24,278,008 | | | $ | 17,759,017 | | | $ | 19,753,795 | |
| | | | | | | | | | | | | |
| Production cost (1) | | | 3,577,780 | | | | 3,117,872 | | | | 3,990,929 | |
| Depreciation, depletion and amortization (2) | | | 1,856,118 | | | | 1,184,584 | | | | 884,372 | |
| Other costs (3) | | | 3,554,315 | | | | 2,533,031 | | | | 691,002 | |
| Exploration expenses (4) | | | 1,696,383 | | | | 1,357,147 | | | | 871,619 | |
| Other expenses (5) | | | 593,257 | | | | 535,494 | | | | 368,231 | |
| Total | | | 11,277,854 | | | | 8,728,129 | | | | 6,806,154 | |
| Income before income tax | | | 13,000,155 | | | | 9,030,889 | | | | 12,947,641 | |
| Income Tax expenses | | | (4,290,051 | ) | | | (2,980,193 | ) | | | (4,272,722 | ) |
| Results of operations for producing activities | | $ | 8,710,104 | | | $ | 6,050,695 | | | $ | 8,674,919 | |
Note: Effects of naphtha addition are included into results of operations in the table above. During 2010, 2009 and 2008 the additional total barrels (million boe) were 12.2; 8.5 and 5.4.
| (1) | Production costs are lifting costs incurred to operate and maintain productive wells and related equipment and facilities, including such costs as operating labor, materials, supplies, and fuel consumed in operations and the costs of operating natural gas liquids plants. In addition it also include accretion expense related to asset retirement obligations that were recognized during 2010, 2009 and 2008 in production costs which were approximately $ 151,516, $(25,980) and $195,191, respectively. The Company’s results of operations from oil and gas producing activities for the years ending December 31, 2010, 2009 and 2008 are shown above |
| (2) | In accordance with ASC 410-20, the expenses related to asset retirement obligations that were recognized during 2010, 2009 and 2008 in depreciation, depletion and amortization were approximately $180,484, 69,371 and $16,352 respectively. |
| (3) | Relate to transportation costs and naphtha that do not form part of the company´s lifting cost. |
| (4) | Exploration expenses include the costs of geological and geophysical activities and non-productive exploratory wells. |
| (5) | Correspond to administration expenses and marketing expenses. |
The Company transferred approximately 37%, 44% and 59% of its crude oil and gas production; (percentages are based on the sales value in Colombian pesos) to inter-company business units in 2010, 2009 and 2008, respectively. Using volumes, those transfers were 47%, 57%, and 69% respectively (included Reficar), in 2010, 2009 and 2008. The inter-company transfers were recorded at values equal to the Company’s market prices.
In 2010 the Company reports its information in four segments: Exploration & Production, Refining Activities, Transportation and Market and Supply. Until 2009 a Corporate segment was reported. The Corporate segment in the new methodology is assigned to the four segments as detailed in note xxv.
The information for 2009 and 2008 included herein has been updated for comparison purposes in accordance with the methodology used during 2010.
Table iv – Reserve information
The reserve information presented in this section is based on the definitions and rules used for U.S. GAAP purposes. The estimates for proved oil and gas reserves used in the preparation of the consolidated financial statements were prepared by Ecopetrol’s engineers, audited in a 99% by the “external engineers” and approved by the Company’s reserves committee, consisting of the Chief Financial Officer, the Exploration and Production Executive Vice-President and the Vice-President of Strategy. Decisions of the Reserves Committee have to be unanimous. Finally, results are presented to the Audit Committee of the Board of Directors and the Board of Directors.
Ecopetrol S.A. and Subsidiaries
Notes to the Consolidated Financial Statements
Years ended December 31, 2010, 2009 and 2008
Information concerning the technical definitions used for the estimated proved reserves is included in this annual report. The information provided in this annual report about our 2010 net proved reserves is based on the 2010 audited reserve reports for 99% of our total reserves prepared by experts under the SEC definitions and rules. The remaining 1% corresponds to calculations made by us internally using SEC definitions and rules set forth in Rule 4-10(a) of Regulation S-X and the disclosure guidelines contained in the SEC’s “Modernization of Oil and Gas Reporting” final rule dated December 31, 2008 and effective as of January 1, 2010.
Reserves were audited by Ryder Scott, DeGolyer and MacNaughton and Gaffney, Cline & Associates (collectively, the “External Engineers”). By corporate definition, Ecopetrol reports the reserves values obtained from the External Engineers. Our 2010 crude oil and natural gas net proved reserves include reserves from production assets located in the United States, Perú and Hocol’s assets in Colombia.
The Company’s proved reserves as of December 31, 2010 and 2009 are based on the SEC average price methodology for U.S. GAAP purposes, which mirrors the average price methodology used by the Company in Colombia during this period. The Company’s proved reserves as of December 31, 2008 are based on the SEC year end price methodology for purposes of U.S. GAAP which mirrors the year-end price methodology used by the Company in Colombia during this period.
Future development, abandonment and production costs were computed by estimating the expenditures to be incurred in developing, producing, and abandoning proved oil and gas reserves at the end of the year, based on year-end costs. Future income taxes were computed by applying statutory tax rates to the estimated net pre-tax cash flows after consideration of tax basis and tax credits and carry forwards. Discounted future net cash flows are calculated using 10% mid period discount factors. This discounting requires a year-by-year estimate of when the future expenditures will be incurred and when the reserves will be produced.
The arbitrary valuation methodology prescribed under ASU 2010-03 and ASU-2010-14 requires assumptions as to the timing and amount of future development and production costs. The calculations are made as of December 31 each year and should not be relied upon as an indication of the Company’s future cash flows or the value of its oil and gas reserves.
Ecopetrol used deterministic methods that are commonly used internationally to estimate reserves. These methods have some uncertainty in degradation, and thus, the estimates should not be interpreted as being exact amounts. However, the technology used to estimate reserves is considered reliable.
Estimates of reserves were prepared by geological and engineering methods commonly used in the oil industry. The method or combination of methods used in the analysis of each reserve was adopted from experience with similar reserves, stage of development, quality and completeness of basic data and production history.
The majority of the producing proved reserves were estimated by applying appropriate decline curves or other performance relationships. In analyzing decline curves, reserves were estimated by calculating economic limits that are based on current economic conditions. In certain cases, where the methods previously employed could not be used, reserves were estimated by analogy with similar reserves where more complete data was available.
Most of the Company’s activities and reserves are located in Colombia. The Colombian Nation is the owner of all mineral interests located in Colombia. The Company and, by extension of joint association contracts, its partners, are given the right to explore, develop, produce and sell those reserves, but do not own them. The reserve quantities and their standardized measure, presented in the following tables, represent those reserves and their estimated value that the Company has the right to extract and sell.
The table below sets forth the Company’s total proved oil and gas reserves together with their changes therein as of and for the years ended December 31, 2010, 2009 and 2008. The estimates (oil in million barrels, gas in billion cf, gas converted to million barrels at 5.7 billion cf per million barrels) using the SEC rules in effect for each respective year. In 2010 Hocol and Savia increased the Company’s total reserves of oil and gas by 9.5 million boe, 3 million boe, respectively. The Company did not consider these additional reserves as significant to be disclosed separately.
Ecopetrol S.A. and Subsidiaries
Notes to the Consolidated Financial Statements
Years ended December 31, 2010, 2009 and 2008
| | | 2010 | | 2009 | | 2008 | |
| | | Oil | | Gas | | Total | | Oil | | Gas | | Total | | Oil | | Gas | | Total | |
| | | million barrels | | billion cf | | million boe | | million barrels | | billion cf | | million boe | | million barrels | | billion cf | | million boe | |
| Proved Reserves: | | | | | | | | | | | | | | | | | | | |
| Beginning of year | | | 1,123.3 | | | 2,329.4 | | | 1,538.2 | | | 798.9 | | | 1,898.9 | | | 1,137.0 | | | 857.4 | | | 1,979.6 | | | 1,209.9 | |
Revisions of previous estimates (1) | | | 99.1 | | | 558.7 | | | 190.9 | | | 246.0 | | | 537.2 | | | 341.6 | | | 44.2 | | | 54.5 | | | 53.9 | |
| Improved recovery | | | 47.4 | | | - | | | 47.4 | | | - | | | - | | | - | | | - | | | - | | | - | |
| Purchases of minerals in place | | | - | | | - | | | - | | | 84.2 | | | 33.2 | | | 90.1 | | | 0.8 | | | 0.5 | | | 0.9 | |
| Extensions and discoveries | | | 126.3 | | | 0.3 | | | 126.5 | | | 126.1 | | | 16.8 | | | 129.1 | | | 7.5 | | | 0.4 | | | 7.6 | |
| Production | | | (159.8 | ) | | (165.9 | ) | | (188.9 | ) | | (131.9 | ) | | (156.6 | ) | | (159.7 | ) | | (111.0 | ) | | (136.0 | ) | | (135.2 | ) |
| End of year | | | 1,236.4 | | | 2,722.6 | | | 1,714.0 | | | 1,123.3 | | | 2,329.4 | | | 1,538.2 | | | 798.9 | | | 1,898.9 | | | 1,137.0 | |
| | | | | | | | | | | | | | | | | | | | | | | | | | | | | |
| Proved developed reserves: | | | | | | | | | | | | | | | | | | | | | | | | | | | | |
| Beginning of year | | | 630.5 | | | 1,732.6 | | | 939.0 | | | 518.4 | | | 720.6 | | | 646.7 | | | 651.3 | | | 1,210.5 | | | 866.9 | |
| End of year | | | 800.7 | | | 2,261.7 | | | 1,197.5 | | | 630.5 | | | 1,732.6 | | | 939.0 | | | 518.4 | | | 720.6 | | | 646.7 | |
| Proved undeveloped reserves: | | | | | | | | | | | | | | | | | | | | | | | | | | | | |
| Beginning of year | | | 492.8 | | | 596.9 | | | 599.2 | | | 280.5 | | | 1,178.3 | | | 490.3 | | | 206.1 | | | 769.1 | | | 343.0 | |
| End of year | | | 435.7 | | | 460.9 | | | 516.5 | | | 492.8 | | | 596.9 | | | 599.2 | | | 280.5 | | | 1,178.3 | | | 490.3 | |
(1) Includes enhanced oil recovery component for years 2009 and 2008
The Company’s revisions during 2010 amounted to 191 million boe, corresponding primarily to the following activities:
| · | Rubiales Field: the reservoir has demonstrated a better production performance (lower decline rates) and a more favorable economic limit (35 million boe); Chuchupa Field: the reservoir has demonstrated a better performance resulting from the compression project (27 million boe). |
| · | Cusiana Field: New gas sales agreements (38 million boe); |
| · | Cupiagua Field: The Company signed an internal gas sales agreement to Barrancabermeja Refinery (20 million boe); |
| · | Pauto Field: The Company has updated the field development plan (additional wells and optimization for gas injection strategy) (10 million boe). |
The activities described above represented 68% of the additions to reserves revisions in 2010; the remaining 61 million boe resulted from varying increases and decreases from a variety of fields.
The Company’s improved recovery during 2010 amounted to 47 million boe, which corresponded mainly to better production results amounting to in the secondary performance of the Casabe field, which at the same time allowed for updating of the development plan, (35 million boe), which represented 74% of the Company’s additions by improved recovery. The remaining 12 million boe are distributed in Yariguí-Cantagallo, San Francisco, La Cira, Infantas, Cusiana and Cupiagua fields.
Ecopetrol S.A. and Subsidiaries
Notes to the Consolidated Financial Statements
Years ended December 31, 2010, 2009 and 2008
The Company’s extensions and discoveries during 2010 amounted to 126 million boe, which corresponded to 21 million boe of newly discovered fields and 106 million boe of extensions of proved acreage. The newly discovered fields corresponded mainly to Quifa Suroeste and Casabe Sur fields, representing 90% of the additions. In terms of extensions of proved acreage, 80% of the 106 million boe was associated with Rubiales Field (85 million boe), where the Company has created an improved development plan, covering existing and new proved areas, which supports additional future drilling activities. The remaining 20% is distributed in smaller changes in several fields like, Chichimene, Castilla, Provincia, Sardinata and others.
| Table v – | Standardized measure of discounted future net cash flows relating to proved oil and gas quantities and changes therein |
The standardized measure of discounted future net cash flows, related to the above proved crude oil and natural gas reserves, is calculated in accordance with the requirements of ASU 2010-03. Estimated future cash inflows from production under U.S. GAAP are computed by applying unweighted arithmetic average of the first-day-of-the-month for oil and gas price to year-end quantities of estimated net proved reserves.
| | | 2010 | | | 2009 | | | 2008 | |
| Future cash inflows | | $ | 186,295,426 | | | $ | 137,518,875 | | | $ | 91,719,056 | |
| Future production and development costs | | | (57,267,518 | ) | | | (52,670,688 | ) | | | (40,753,567 | ) |
| Future income tax expenses | | | (36,783,230 | ) | | | (27,574,537 | ) | | | (18,409,888 | ) |
| Future net cash flow | | | 92,244,678 | | | | 57,273,650 | | | | 32,555,601 | |
| 10% annual discount for estimated timing of cash flows | | | (36,690,043 | ) | | | (21,813,763 | ) | | | (13,897,290 | ) |
| Standardized measure of discounted future net cash flows | | $ | 55,554,635 | | | $ | 35,459,887 | | | $ | 18,658,311 | |
The following are the principal sources of change in the standardized measure of discounted net cash flows:
| | | 2010 | | | 2009 | | | 2008 | |
| | | | | | | | | | |
| Net change in sales and transfer prices and in production (lifting) cost related to future production | | $ | 23,136,538 | | | $ | 11,522,615 | | | $ | (20,440,064 | ) |
| Changes in estimated future development costs | | | (2,936,160 | ) | | | (4,585,987 | ) | | | (3,920,730 | ) |
| Sales and transfer of oil and gas produced during the period | | | (24,278,008 | ) | | | (17,759,017 | ) | | | (19,753,794 | ) |
| Net change due to extension discoveries | | | 4,102,951 | | | | 1,129,590 | | | | 137,845 | |
| Net change due to purchase and sales of minerals in place | | | - | | | | 2,387,443 | | | | 53,468 | |
| Net change due to revisions in quantity estimates | | | 10,577,037 | | | | 13,532,916 | | | | 1,758,941 | |
| Previously estimated development costs incurred during the period | | | 4,352,080 | | | | 3,369,970 | | | | 2,934,497 | |
| Accretion of discount | | | 3,545,989 | | | | 1,865,831 | | | | 4,251,867 | |
| Other – unspecified | | | 6,674,884 | | | | 11,859,363 | | | | 3,059,763 | |
| Net change in income taxes | | | (5,080,563 | ) | | | (6,521,148 | ) | | | 8,057,853 | |
| Aggregate change in the Standardized measure of discounted future net cash flows for the year | | $ | 20,094,747 | | | $ | 16,801,576 | | | $ | (23,860,354 | ) |
SIGNATURES
The registrant hereby certifies that it meets all of the requirements for filing on Form 20-F and that it has duly caused and authorized the undersigned to sign this annual report on its behalf.
| | ECOPETROL S.A. |
| | |
| | By: | /s/ Adriana M. Echeverri | |
| | | Name: Adriana M. Echeverri | |
| | | Title: Chief Financial Officer | |
| | | | |
| | By: | /s/ Javier G. Gutiérrez | |
| | | Name: Javier G. Gutiérrez | |
| | | Title: Chief Executive Officer | |
Date: July 15, 2011