As filed with the Securities and Exchange Commission on april 29, 2013
UNITED STATES
SECURITIES AND EXCHANGE COMMISSION
Washington, D.C. 20549
Form 20-F
ANNUAL REPORT PURSUANT TO SECTION 13 OR 15(d) OF THE SECURITIES EXCHANGE ACT OF 1934
For the fiscal year ended December 31, 2012
Commission file number: 001-34175
ECOPETROL S.A.
(Exact name of Registrant as specified in its charter)
N/A
(Translation of Registrant’s name into English)
REPUBLIC OF COLOMBIA
(Jurisdiction of incorporation or organization)
Carrera 13 No. 36 – 24
BOGOTA – COLOMBIA
(Address of principal executive offices)
Alejandro Giraldo
Investor Relations Officer
investors@ecopetrol.com.co
Tel. (571) 234 5190
Fax. (571) 234 5628
Carrera 13 N.36-24 Piso 8
Bogota, Colombia
(Name, Telephone, E-Mail and/or Facsimile number and Address of Company Contact Person)
Securities registered or to be registered pursuant to Section 12(b) of the Act.
| Title of each class | Name of each exchange on which registered: |
| American Depository Shares (as evidenced by American Depository Receipts), each representing 20 common shares par value Ps$250 per share | New York Stock Exchange |
| Ecopetrol common shares par value Ps$250 per share | New York Stock Exchange (for listing purposes only) |
| 7.625% Notes due 2019 | New York Stock Exchange |
Securities registered or to be registered pursuant to Section 12(g) of the Act: None
Securities for which there is a reporting obligation pursuant to Section 15(d) of the Act: None
Indicate the number of outstanding shares of each of the issuer’s classes of capital or common stock as of the close of the period covered by the annual report.
41,116,698,456 Ecopetrol common shares, par value Ps$250 per share
Indicate by check mark if the registrant is a well-known seasoned issuer, as defined in Rule 405 of the Securities Act.
xYes¨No
If this report is an annual or transition report, indicate by check mark if the registrant is not required to file reports pursuant to Section 13 or 15(d) of the Securities Exchange Act of 1934.
¨YesxNo
Indicate by check mark whether the registrant (1) has filed all reports required to be filed by Section 13 or 15(d) of the Securities Exchange Act of 1934 during the preceding 12 months (or for such shorter period that the registrant was required to file such reports), and (2) has been subject to such filing requirements for the past 90 days.
xYes¨No
Indicate by check mark whether the registrant has submitted electronically and posted on its corporate Web site, if any, every Interactive Data File required to be submitted 28576 submit and post such files).
N/A
Indicate by check mark whether the registrant is a large accelerated filer, an accelerated filer, or a non-accelerated filer. See definition of “accelerated filer and large accelerated filer” in Rule 12b-2 of the Exchange Act. (Check one):
| Large accelerated filerx | Accelerated filer¨ | Non-accelerated filer¨ |
Indicate by check mark which basis of accounting the registrant has used to prepare the financial statements included in this filing:
| ¨ U.S. GAAP | ¨ International Financial Reporting Standards as issued by the International Accounting Standards Board | x Other |
If “Other” has been checked in response to the previous question, indicate by check mark which financial statement item the registrant has elected to follow:
¨ Item 17 x Item 18
If this is an annual report, indicate by check mark whether the registrant is a shell company (as defined in Rule 12b-2 of the Exchange Act).
¨YesxNo
TABLE OF CONTENTS
| | | Page |
| | | |
| | Forward-Looking Statements | 1 |
| | Enforcement of Civil Liabilities | 1 |
| | Presentation of Financial Information | 2 |
| | Presentation of Abbreviations | 4 |
| | Presentation of The Nation and Government of Colombia | 4 |
| | Presentation of Information Concerning Reserves | 4 |
| ITEM 1. | Identity of Directors, Senior Management and Advisors | 5 |
| ITEM 2. | Offer Statistics and Expected Timetable | 5 |
| ITEM 3. | Key Information | 5 |
| | Selected Financial Data | 5 |
| | Exchange Rate Information | 7 |
| | Risk Factors | 8 |
| ITEM 4. | Information on the Company | 24 |
| | The Company | 24 |
| | Overview By Business Segment | 29 |
| | Transportation Infrastructure | 53 |
| | Property, Plant and Equipment | 74 |
| ITEM 4A. | Unresolved Staff Comments | 74 |
| ITEM 5. | Operating and Financial Review and Prospects | 75 |
| | Operating Results | 81 |
| | Liquidity and Capital Resources | 93 |
| | Research and Development, Patents and Licenses, etc. | 95 |
| | Off-Balance Sheet Arrangements | 96 |
| | Tabular Disclosure of Contractual Obligations | 97 |
| ITEM 6. | Directors, Senior Management and Employees | 98 |
| | Directors and Senior Management | 98 |
| | Compensation | 102 |
| | Share Ownership | 102 |
| | Board Practices | 102 |
| | Employees | 104 |
| ITEM 7. | Major Shareholders and Related Party Transactions | 107 |
| | Major Shareholders | 107 |
| | Related Party Transactions | 107 |
| ITEM 8. | Financial Information | 113 |
| | Consolidated Statements And Other Financial Information | 113 |
| | Legal Proceedings | 113 |
| | Dividends | 114 |
| | Significant Changes | 114 |
| ITEM 9. | The Offer and Listing | 115 |
| | Trading Markets | 115 |
| | Trading On The Bolsa De Valores De Colombia | 116 |
| ITEM 10. | Additional Information | 118 |
| | Bylaws | 118 |
| | Material Contracts | 121 |
| | Taxation | 122 |
| | Documents On Display | 128 |
| ITEM 11. | Quantitative and Qualitative Disclosures About Market Risk | 128 |
| ITEM 12. | Description of Securities Other than Equity Securities | 131 |
| ITEM 12A. | Debt Securities | 131 |
| ITEM 12B. | Warrants and Rights | 131 |
| ITEM 12C. | Other Securities | 131 |
| ITEM 12D. | American Depositary Shares | 131 |
| ITEM 13. | Defaults, Dividend Arrearages and Delinquencies | 132 |
| ITEM 14. | Material Modifications to the Rights of Security Holders and Use of Proceeds | 133 |
| ITEM 15. | Controls and Procedures | 133 |
| ITEM 16. | [Reserved] | 134 |
| ITEM 16A. | Audit Committee Financial Expert | 134 |
| ITEM 16B. | Code of Ethics | 134 |
| ITEM 16C. | Principal Accountant Fees and Services | 134 |
| | Audit and Non-Audit Fees | 134 |
| ITEM 16D. | Exemptions from the Listing Standards for Audit Committees | 135 |
| ITEM 16E. | Purchases of Equity Securities by the Issuer and Affiliated Purchasers | 135 |
| ITEM 16F. | Change in Registrant’s Certifying Accountant | 135 |
| ITEM 16G. | Corporate Governance | 136 |
| ITEM 16H. | Mine Safety Disclosure | 137 |
| ITEM 17. | Financial Statements | 137 |
| ITEM 18. | Financial Statements | 137 |
| ITEM 19. | Exhibits | 138 |
Forward-Looking Statements
This annual report on Form 20-F contains forward-looking statements within the meaning of the safe harbor provisions of the U.S. Private Securities Litigation Reform Act of 1995. These statements are not based on historical facts and reflect our expectations for future events and results. Most facts are uncertain because of their nature. Words such as “anticipate,” “believe,” “could,” “estimate,” “expect,” “should,” “plan,” “potential,” “predicts,” “prognosticate,” “project,” “target,” “achieve” and “intend,” among other similar expressions, are understood as forward-looking statements. These factors may include the following:
| · | drilling and exploration activities; |
| · | future production rates; |
| · | import and export activities; |
| · | liquidity, cash flow and uses of cash flow; |
| · | projected capital expenditures; |
| · | dates by which certain areas will be developed or will come on-stream; and |
| · | allocation of capital expenditures to exploration and production activities. |
Actual results are subject to certain factors out of the control of the Company and may differ materially from the anticipated results. These factors may include the following:
| · | changes in international crude oil and natural gas prices; |
| · | limitations on our access to sources of financing; |
| · | significant political, economic and social developments in Colombia and other countries where we do business; |
| · | military operations, terrorist acts, wars or embargoes; |
| · | regulatory developments, including regulations related to climate change; |
| · | technical difficulties; and |
| · | other factors discussed in this document as “Risk Factors.” |
Most of these statements are subject to risks and uncertainties that are difficult to predict. Therefore, our actual results could differ materially from projected results. Accordingly, readers should not place undue reliance on the forward-looking statements contained in this annual report.
Enforcement of Civil Liabilities
We are a Colombian company, all of our Directors and executive officers and some of the experts named in this annual report reside outside the United States. All or a substantial portion of our assets and the assets of these persons are located outside of the United States. As a result, it may not be possible for you to effect service of process within the United States upon us or these persons or to enforce against us or them judgments in U.S. courts obtained in such courts predicated upon the civil liability provisions of the U.S. federal securities laws. Colombian courts will determine whether to enforce a U.S. judgment predicated on the U.S. securities laws through a proceeding known asexequatur. The Colombian Supreme Court will enforce a foreign judgment, without reconsideration of the merits only if the judgment satisfies the following requirements:
| · | a treaty exists between Colombia and the country where the judgment was granted or there is reciprocity in the recognition of foreign judgments between the courts of the relevant jurisdiction and the courts of Colombia; |
| · | the foreign judgment does not relate to“in rem rights” vested in assets that were located in Colombia at the time the suit was filed and does not contravene or conflict with Colombian laws relating to public order other than those governing judicial procedures; |
| · | the foreign judgment, in accordance with the laws of the country where it was rendered, is final and is not subject to appeal and a duly certified and authenticated copy of the judgment has been presented to a competent court in Colombia; |
| · | the foreign judgment does not refer to any matter upon which Colombian courts have exclusive jurisdiction; |
| · | no proceeding is pending in Colombia with respect to the same cause of action, and no final judgment has been awarded in any proceeding in Colombia on the same subject matter and between the same parties; and |
| · | in the proceeding commenced in the foreign court that issued the judgment, the defendant is served in accordance with the laws of such jurisdiction and in a manner reasonably designated to give the defendant an opportunity to defend against the action. |
The United States and Colombia do not have a bilateral treaty providing for automatic reciprocal recognition and enforcement of judgments in civil and commercial matters. The Colombian Supreme Court has in the past accepted that reciprocity exists when it has been proven that either a U.S. court has enforced a Colombian judgment or that a U.S. court would enforce a foreign judgment, including a judgment issued by a Colombian court. However, such enforceability decisions are considered by Colombian courts on a case-by-case basis.
Presentation of Financial Information
Unless the context otherwise requires, the terms “Ecopetrol,” “we,” “us,” “our,” the “Company” or the “Corporate Group” are used in this annual report to refer to Ecopetrol S.A. and its subsidiaries on a consolidated basis.
In this annual report, references to “US$” or “U.S. dollars” are to United States dollars and references to “Ps$,” “Peso” or “Pesos” are to Colombian Pesos, the functional currency under which we prepare our financial statements. Certain figures shown in this annual report have been subject to rounding adjustments and, accordingly, certain totals may therefore not precisely equal the sum of the numbers presented. In this annual report a billion is equal to one with nine zeros.
Our consolidated financial statements are prepared in accordance with accounting principles for Colombian state-owned entities issued by the Colombian National Accounting Office (Contaduría General de la Nación), or CGN, and other applicable legal provisions.
Our consolidated financial statements at and for the years ended December 31, 2012, 2011 and 2010 and the selected financial data at and for the years ended December 31, 2012, 2011, 2010, 2009 and 2008 have been prepared under Public Accounting Regime (Régimen de Contabilidad Pública), or RCP, as adopted by the CGN in September, 2007 and applicable to Ecopetrol beginning with the fiscal year ended December 31, 2008. See Note 1 to our consolidated financial statements. We refer to RCP as Colombian Government Entity GAAP. Colombian Government Entity GAAP differs in certain significant respects from generally accepted accounting principles in the United States, or U.S. GAAP. Note 35 to our consolidated financial statements included in this annual report provides a description of the principal differences between Colombian Government Entity GAAP and U.S. GAAP as they relate to our audited consolidated financial statements and provides a reconciliation of net income and shareholders’ equity for the years and dates indicated therein. As a state-owned company, our consolidated financial statements are periodically reviewed by the CGN. However, the review of our accounts by the CGN does not constitute an audit.
The accompanying audited consolidated financial statements of Ecopetrol and our consolidated subsidiaries for the years ended December 31, 2012, 2011 and 2010 have been prepared from accounting records, which are maintained under the historical cost convention as modified in 1992, to comply with the legal provisions of the CGN.
Certain line items from our consolidated financial statements as of December 31, 2011 and 2010 related to the presentation of the consolidated Balance Sheet and the Consolidated Statement of Financial, Economic, Social and Environmental Activities have been reclassified in order to make the presentation of such financial statements comparable to that of the financial statements as of December 31, 2012. The main reclassifications were under cost of sales, marketing and projects, accounts payable and related parties, Taxes, contributions and duties payable, Deposits held in trust and Other assets. See Note 34 to our consolidated financial statements for a description of the principal differences.
Our consolidated financial statements were consolidated line by line and all transactions and significant balances between affiliates have been eliminated. These financial statements include the financial results of the following companies:
| COMPANY | | OWNERSHIP % | | | Included in
consolidated
Financial Statements
for the year ended | |
| | | | | | 2012 | | | 2011 | | | 2010 | |
| | | | | | | | | | | | | |
| Black Gold Re Ltd. | | | 100.00 | | | | X | | | | X | | | | X | |
| Ecopetrol Oleo é Gas Do Brasil Ltda. | | | 100.00 | | | | X | | | | X | | | | X | |
| Ecopetrol del Perú S.A. | | | 100.00 | | | | X | | | | X | | | | X | |
| Ecopetrol America Inc. | | | 100.00 | | | | X | | | | X | | | | X | |
| Andean Chemicals Ltd. | | | 100.00 | | | | X | | | | X | | | | X | |
| Polipropileno del Caribe S.A. (Propilco) | | | 100.00 | | | | X | | | | X | | | | X | |
| Ecopetrol Global Energy SLU | | | 100.00 | | | | X | | | | X | | | | X | |
| Refinería de Cartagena S.A. (Reficar) | | | 100.00 | | | | X | | | | X | | | | X | |
| COMAI Compounding and Masterbatching Industry Ltda. | | | 100.00 | | | | X | | | | X | | | | X | |
| Hocol Petroleum Ltd. | | | 100.00 | | | | X | | | | X | | | | X | |
| Ecopetrol Capital AG | | | 100.00 | | | | X | | | | X | | | | X | |
| Ecopetrol Pipelines International Limited | | | 100.00 | | | | X | | | | X | | | | X | |
| Ecopetrol Global Capital SL | | | 100.00 | | | | X | | | | X | | | | | |
| Cenit Transporte y Logistica de Hidrocarburos S.A.S. | | | 100.00 | | | | X | | | | | | | | | |
| Ecopetrol Transportation Company Ltd. | | | 100.00 | | | | | | | | X | | | | X | |
| Ecopetrol Transportation Investment Ltd | | | 100.00 | | | | | | | | X | | | | X | |
| Bioenergy S.A. | | | 91.43 | | | | X | | | | X | | | | X | |
| ODL Finance S.A. | | | 65.00 | | | | X | | | | X | | | | X | |
| Oleoducto Central S.A. (Ocensa) | | | 72.65 | | | | X | | | | X | | | | X | |
| Oleoducto de Colombia (ODC) | | | 73.00 | | | | X | | | | X | | | | X | |
| Equion Energía Ltd. (Equion) | | | 51.00 | | | | X | | | | X | | | | | |
| Oleoducto Bicentenario de Colombia S.A.S. | | | 55.97 | | | | X | | | | X | | | | X | |
This annual report translates certain Peso amounts into U.S. dollars at specified rates solely for the convenience of the reader. Unless otherwise indicated, such Peso amounts have been translated at the rate of Ps$1,768.23 per US$1.00, which corresponds to theTasa Representativa del Mercado, or Representative Market Exchange Rate, for December 31, 2012. The Representative Market Exchange Rate is computed and certified by theSuperintendencia Financiera,or Superintendency of Finance, the Colombian banking and securities regulator, on a daily basis and represents the weighted average of the buy and sell foreign exchange rates negotiated on the previous day by financial institutions authorized to engage in foreign exchange transactions. The Superintendency of Finance also calculates the Representative Market Exchange Rate for each month for purposes of preparing financial statements and converting amounts in foreign currency to Pesos. Such conversion should not be construed as a representation that the Peso amounts correspond to, or have been or could be converted into, U.S. dollars at that rate or any other rate. On April 26, 2013, the Representative Market Exchange Rate was Ps$1,830.84 per US$1.00.
Presentation Of Abbreviations
The following is a list of crude oil and natural gas measurement abbreviations commonly used throughout this annual report.
| bpd | Barrels per day |
| boe | Barrels of oil equivalent |
| boepd | Barrels of oil equivalent per day |
| btu | British thermal units |
| cf | Cubic feet |
| cfpd | Cubic feet per day |
| mcf | Million cubic feet |
| mcfpd | Million cubic feet per day |
| mbtu | Million British thermal units |
| gbtu | Giga British thermal units |
| gbtud | Giga British thermal units per day |
| bcf | Billion Cubic feet |
Presentation Of The Nation And Government Of Colombia
References to the Nation in this annual report relate to the Republic of Colombia, our controlling shareholder. References made to the Government of Colombia or the Government correspond to the executive branch including the President of Colombia, the ministries and other governmental agencies responsible for regulating our business.
Presentation Of Information Concerning Reserves
The estimates of our proved reserves of crude oil and natural gas included in this annual report have been calculated according to the technical definitions required by the U.S. Securities and Exchange Commission, or SEC. Our hydrocarbon net proved reserves have been audited in 2012 by Ryder Scott Company L.P., DeGolyer and MacNaughton and Gaffney, Cline & Associates Inc., which we refer to collectively as the External Engineers, and their reserves reports are included as exhibits herein. All reserve estimates involve some degree of uncertainty. See “Item 4. Information on the Company—Overview by Business Segment—Exploration and Production—Reserves” for additional information on our reserves estimates.
The following table sets forth the percentage of our estimated net proved reserves audited by External Engineers and the percentage calculated internally for the years ended December 31, 2012, 2011 and 2010. Our proved reserves as of December 31, 2012, 2011 and 2010 are based on the SEC average price methodology for purposes of both Colombian Government Entity GAAP and U.S. GAAP. See “Item 3. Key Information—Risk Factors—Risks related to our business” for a description of the risks’ relating to our reserves and our reserve estimates.
| | | Estimated proved reserves for the year ended
December 31, | |
| | | 2012 | | | 2011 | | | 2010 | |
| Net proved reserves audited by External Engineers | | | 99 | % | | | 99 | % | | | 99 | % |
| Net proved reserves estimates on our own calculations | | | 1 | % | | | 1 | % | | | 1 | % |
We are required, as are all oil companies undertaking exploratory and production activities in Colombia, to pay a percentage of our production to the Government as royalties. The oil and gas reserve figures included in this annual report are net of such royalties.
| ITEM 1. | Identity of Directors, Senior Management and Advisors |
Not applicable.
| ITEM 2. | Offer Statistics and Expected Timetable |
Not applicable.
Selected Financial Data
The following table sets forth, for the periods and at the dates indicated, our selected historical financial data, which have been derived from and should be read in conjunction with, and are qualified in their entirety by reference to, our consolidated financial statements and accompanying Notes included in this annual report, presented in Pesos. KPMG Ltda. audited our consolidated financial statements for the years ended December 31, 2012 and 2011. Our consolidated financial statements for the years ended December 31, 2010, 2009 and 2008 were audited by PricewaterhouseCoopers Ltda. The information included below and elsewhere in this annual report is not necessarily indicative of our future performance. See also “Item 5. Operating and Financial Review and Prospects” in this annual report.
Colombian Government Entity GAAP differs in certain significant respects from U.S. GAAP. For a description of the principal differences between Colombian Government Entity GAAP and U.S. GAAP as they relate to us, a reconciliation to U.S. GAAP of net income and shareholders’ equity, and financial statements under U.S. GAAP, see Note 35 to our consolidated financial statements and “Item 5. Operating and Financial Review and Prospects—Principal Differences Between Colombian Government Entity GAAP and U.S. GAAP.”
| | | BALANCE SHEET | |
| | | For the year ended December 31, | |
| | | 2012(1) | | | 2012 | | | 2011 | | | 2010 | | | 2009 | | | 2008 | |
| | | (US$ in thousands
except for common
share and dividends
per share amounts) | | | (Pesos in millions except for common share and dividends per share amounts) | |
| | | | | | | |
| Total assets | | | 64,403,148 | | | | 113,879,578 | | | | 92,277,386 | | | | 68,769,356 | | | | 55,559,517 | | | | 48,702,412 | |
| Shareholders’ Equity | | | 36,613,382 | | | | 64,740,881 | | | | 54,688,855 | | | | 41,328,181 | | | | 32,569,957 | | | | 34,619,717 | |
| Subscribed capital | | | 5,813,257 | | | | 10,279,175 | | | | 10,279,175 | | | | 10,118,128 | | | | 10,118,128 | | | | 10,118,128 | |
| Number of common shares | | | 41,116,698,456 | (2) | | | 41,116,698,456 | (2) | | | 41,116,698,456 | (2) | | | 40,472,512,588 | | | | 40,472,512,588 | | | | 40,472,512,588 | |
| Dividends declared per share(3) | | | 0.17 | | | | 300 | | | | 145 | | | | 91.0 | | | | 220.0 | | | | 115.0 | |
| Amounts in accordance with U.S. GAAP | | | | | | | | | | | | | | | | | | | | | | | | |
| Total Assets | | | 46,102,222 | | | | 81,519,332 | | | | 70,909,079 | | | | 52,332,148 | | | | 42,624,352 | | | | 40,244,452 | |
| Shareholders’ Equity | | | 21,291,547 | | | | 37,648,352 | | | | 36,055,173 | | | | 27,175,285 | | | | 22,383,712 | | | | 27,425,735 | |
| Number of common shares | | | 41,116,698,456 | (2) | | | 41,116,698,456 | (2) | | | 41,116,698,456 | (2) | | | 40,472,512,588 | | | | 40,472,512,588 | | | | 40,472,512,588 | |
| Dividends declared per share(3) | | | 0.17 | | | | 300 | | | | 145 | | | | 91.0 | | | | 220.0 | | | | 115.0 | |
| (1) | Amounts stated in U.S. dollars have been translated for the convenience of the reader at the rate of Ps$1,768.23 to US$1.00, which is the Representative Market Exchange Rate at December 31, 2012, as reported and certified by the Superintendency of Finance. |
| (2) | Number of common shares includes 644,185,868 shares issued to the public in connection with our second offering of shares in Colombia in September 2011. |
| (3) | Represents payments made in 2012, 2011, 2010, 2009 and 2008, based on net income and retained earnings for the years ended December 31, 2011, 2010, 2009, 2008 and 2007 respectively. |
| | | INCOME STATEMENT | |
| | | For the year ended December 31, | |
| | | 2012(1) | | | 2012 | | | 2011 | | | 2010 | | | 2009 | | | 2008 | |
| | | (US$ in thousands
except for net
income per share
and average number
of shares amounts) | | | (Pesos in millions except for net income per share and average number of shares amounts) | |
| Total revenue | | | 38,938,375 | | | | 68,852,002 | | | | 65,967,514 | | | | 42,089,745 | | | | 30,404,390 | | | | 33,896,669 | |
| Operating income | | | 13,689,560 | | | | 24,206,290 | | | | 25,872,980 | | | | 12,747,448 | | | | 7,873,339 | | | | 12,657,358 | |
| Net operating income per share | | | 0.33 | | | | 589 | | | | 637 | | | | 315 | | | | 195 | | | | 313 | |
| Income before income tax | | | 12,629,410 | | | | 22,331,701 | | | | 23,641,432 | | | | 11,492,617 | | | | 7,250,844 | | | | 16,011,204 | |
| Net income | | | 8,358,046 | | | | 14,778,947 | | | | 15,452,334 | | | | 8,146,471 | | | | 5,132,054 | | | | 11,629,677 | |
| Weighted average number of shares outstanding | | | 41,116,698,456 | (2) | | | 41,116,698,456 | (2) | | | 40,634,882,725 | (2) | | | 40,472,512,588 | | | | 40,472,512,588 | | | | 40,472,512,588 | |
| Net income per share(3) | | | 0.20 | | | | 359 | | | | 380 | | | | 201.28 | | | | 127 | | | | 287 | |
| Amounts in accordance with U.S. GAAP | | | | | | | | | | | | | | | | | | | | | | | | |
| | | | | | | | | | | | | | | | | | | | | | | | | |
| Total revenue | | | 37,815,859 | | | | 66,867,137 | | | | 62,715,815 | | | | 40,879,324 | | | | 29,551,574 | | | | 33,849,213 | |
| Operating income | | | 13,322,341 | | | | 23,556,963 | | | | 23,673,787 | | | | 13,878,515 | | | | 8,055,213 | | | | 9,840,311 | |
| Net operating income per share | | | 0.32 | | | | 573 | | | | 583 | | | | 343 | | | | 199 | | | | 243 | |
| Income before income tax and non-controlling interest | | | 12,675,660 | | | | 22,413,482 | | | | 23,456,685 | | | | 12,840,721 | | | | 8,768,383 | | | | 13,427,443 | |
| Net income attributable to Ecopetrol | | | 8,310,937 | | | | 14,695,649 | | | | 14,817,207 | | | | 8,211,035 | | | | 5,718,304 | | | | 8,841,883 | |
| Net income per share | | | 0.20 | | | | 357 | | | | 365 | | | | 203 | | | | 141 | | | | 218 | |
| Average number of shares outstanding(4) | | | 41,116,698,456 | | | | 41,116,698,456 | | | | 40,634,882,725 | | | | 40,472,512,588 | | | | 40,472,512,588 | | | | 40,472,512,588 | |
| (1) | Amounts stated in U.S. dollars have been translated for the convenience of the reader at the rate of Ps$1,768.23 to US$1.00, which was the Representative Market Exchange Rate at December 31, 2012, as reported and certified by the Superintendency of Finance. |
| (2) | The weighted average number of common shares outstanding during 2012 and 2011 was 41,116,698,456 and 40,634,882,725, respectively, as a result of 644,185,868 shares issued to the public in connection with our second offering of shares in Colombia in September 2011. |
| (3) | Net income per share is calculated using the weighted-average number of outstanding shares at December 31 of each year. |
| (4) | Calculated in accordance with U.S. GAAP, which differs in certain respects with the calculation of weighted average number of shares pursuant to Colombian Government Entity GAAP. |
Exchange Rate Information
On April 26, 2013, the Representative Market Exchange Rate was Ps$1,830.84 per US$1.00. The Federal Reserve Bank of New York does not report a noon-buying rate for Colombian Pesos. The Superintendency of Finance calculates the Representative Market Exchange Rate based on the weighted averages of the buy and sell foreign exchange rates quoted daily by foreign exchange rate market intermediaries including financial institutions for the purchase and sale of U.S. dollars.
The following table sets forth the high, low, average and period-end exchange rate for Pesos/U.S. dollar Representative Market Exchange Rate for each of the last five years and for the last six months.
| | | Exchange Rates | |
| | | High | | | Low | | | Average | | | Period-End | |
| | | | | | | | | | | | | |
| 2008 | | | 2,392.28 | | | | 1,652.41 | | | | 1,966.26 | | | | 2,243.59 | |
| 2009 | | | 2,596.37 | | | | 1,825.68 | | | | 2,156.29 | | | | 2,044.23 | |
| 2010 | | | 2,044.23 | | | | 1,786.20 | | | | 1,897.89 | | | | 1,913.98 | |
| 2011 | | | 1,972.76 | | | | 1,748.41 | | | | 1,848.17 | | | | 1,942.70 | |
| 2012 | | | 1,942.70 | | | | 1,754.89 | | | | 1,798.23 | | | | 1,768.23 | |
| October | | | 1,831.25 | | | | 1,795.40 | | | | 1,804.97 | | | | 1,829.89 | |
| November | | | 1,831.25 | | | | 1,814.21 | | | | 1,820.29 | | | | 1,817.93 | |
| December | | | 1,813.73 | | | | 1,768.23 | | | | 1,793.94 | | | | 1,768.23 | |
| | | | | | | | | | | | | | | | | |
| 2013: | | | | | | | | | | | | | | | | |
| January | | | 1,779.84 | | | | 1,758.45 | | | | 1,770.01 | | | | 1,773.24 | |
| February | | | 1,818.54 | | | | 1,775.65 | | | | 1,791.48 | | | | 1,816.42 | |
| March | | | 1,828.95 | | | | 1,797.28 | | | | 1,809.89 | | | | 1,832.20 | |
| April (through April 26) | | | 1,847.02 | | | | 1,813.11 | | | | 1,829.83 | | | | 1,830.84 | |
Source: Superintendency of Finance for historical data.Banco de la República, or the Colombian Central Bank for averages.
Risk Factors
Risks related to our business
Our crude oil and natural gas reserve estimates involve some degree of uncertainty and may prove to be incorrect over time, which could adversely affect our ability to generate revenue.
Reserves estimates are prepared using generally accepted geological and engineering evaluation methods and procedures. Estimates are based on geological, topographic and engineering facts. Actual reserves and production may vary materially from estimates shown in this annual report, and downward revisions in our reserve estimates could lead to lower future production which could affect our results of operations and financial condition.
Our business depends substantially on international prices for crude oil and refined products, and prices for these products are volatile. A sharp decrease in such prices could adversely affect our business prospects and results of operations.
Crude oil prices have traditionally fluctuated as a result of a variety of factors including, among others, the following:
| · | competition within the oil and natural gas industry; |
| · | changes in international prices of natural gas and refined products; |
| · | long-term changes in the demand for crude oil, natural gas and refined products; |
| · | increase in the cost of capital; |
| · | adverse economic conditions; |
| · | global or regional financial crises, such as the global financial crisis of 2008; |
| · | development of new technologies; |
| · | global and regional economic and political developments in oil producing regions, particularly in the Middle East; |
| · | the willingness and ability of the Organization of the Petroleum Exporting Countries, or OPEC, and its members to set production levels and prices; |
| · | local and global demand and supply for crude oil, oil products and natural gas; |
| · | trading activity in oil and natural gas and transactions in derivative financial instruments related to oil and gas; |
| · | development oravailability of alternative fuels; |
| · | natural events or disasters; and |
| · | terrorism and armed conflict. |
As of December 2012, nearly 96% of our revenues came from sales of crude oil, natural gas and refined products. Most prices for products developed and sold by us are quoted in U.S. dollars and consequently, fluctuations in the U.S. dollar/Peso exchange rate have a direct effect on our Peso-denominated financial statements.
A significant and sustained decrease in crude oil prices could have a negative impact on our results of operations and financial condition. In addition, a reduction of international crude oil prices could result in a delay or a change in our capital expenditure plan, in particular delaying exploration and development activities, thereby delaying the development of reserves and affecting future cash flows.
Our operations are subject to certain operational risks that, if materialized, may result in the disruption or shutdown of our operation activities, as well as in damages to the environment and to third parties.
Our exploration, production, refining and transportation activities are subject to industry-specific operating risks, some of which, despite our internal procedures, are beyond our control. Our operations may be curtailed, delayed or cancelled due to adverse or abnormal weather conditions, natural disasters, equipment failures or accidents, oil or natural gas spills or leaks, shortages or delays in the availability or in the delivery of equipment, delays or cancellation of environmental licenses or other government authorizations, fires, explosions, blow-outs, surface cratering, pipeline failures, theft and damage to our transportation infrastructure, sabotage, terrorist attacks and criminal activities.
The occurrence of any of these operating risks could result in substantial losses or slowdowns to our operations, including injury to our employees, destruction of property, equipment and infrastructure, clean-up responsibilities, third-party liability claims, government investigations and imposition of fines, withdrawal of environmental licenses and other government permits, suspension or shutdown of our activities and loss of revenue. The occurrence of any of these events may have a material adverse effect on our financial condition and results of operations.
We are exposed to the credit risks of our customers and any material nonpayment or nonperformance by our key customers could adversely affect our cash flow and results of operations.
Our customers may experience financial problems that could have a significant negative effect on their creditworthiness. Severe financial problems encountered by our customers could limit our ability to collect amounts owed to us, or to enforce the performance of obligations owed to us under contractual arrangements. In addition, many of our customers finance their activities through their cash flows from operations, the incurrence of debt or the issuance of equity.
The combination of declining cash flows as a result of declines in commodity prices, a reduction in borrowing bases under reserve-based credit facilities and the lack of availability of debt or equity financing may result in a significant reduction of our customers’ liquidity and limit their ability to make payments or perform on their obligations to us.
Furthermore, some of our customers may be highly leveraged and subject to their own operating expenses. Therefore, the risk we face in doing business with these customers may increase. Other customers may also be subject to regulatory changes, which could increase the risk of defaulting on their obligations to us. For example, constraints on foreign currency transactions by the Venezuelan government have resulted in delays by PDVSA Gas to make payments to its providers, including us. Financial problems experienced by our customers could result in the impairment of our assets, a decrease in our operating cash flows and may also reduce or curtail our customers’ future use of our products and services, which may have an adverse effect on our revenues.
Achieving our long-term growth prospects depends on our ability to execute our Strategic Plan, in particular discovering additional reserves and successfully developing them.
We describe our Strategic Plan under “Item 4. Information on the Company—The Company—Strategic Plan.” The ability to achieve our long-term growth objectives depends on discovering or acquiring new reserves as well as successfully developing them. Our exploration activities expose us to the inherent risks of drilling, including the risk that we will not discover commercially productive crude oil or natural gas reserves. The costs associated with drilling wells are often uncertain, and numerous factors beyond our control may cause drilling operations to be curtailed, delayed or cancelled.
If we are unable to conduct successful exploration and development of our exploration activities, or if we do not acquire properties having proved reserves, our level of proved reserves will decline. Failure to secure additional reserves may impede us from achieving production targets, and may have a negative effect on our results of operation and financial condition.
Our current and planned investments outside Colombia are exposed to political and economic risks.
As part of our Strategic Plan, we have begun to operate through business partners, subsidiaries or affiliates outside of Colombia. As of the date hereof, we have investments and subsidiaries incorporated in Peru, Brazil, Bermuda, Panama, the Cayman Islands, Switzerland, Spain, the United Kingdom and the United States, and we are analyzing investments in other countries. In connection with making investments, we are and will be subject to risks relating to economic and political conditions, governmental economic actions, such as exchange or price controls or limits on the activities to be performed by us, increases in tax rates, contractual changes, and social and environmental challenges.
In addition, we cannot predict the positions of foreign governments relating to the oil and gas industry, land tenure, protection of private property, environmental regulation or taxation; nor can we assure you that future governments will maintain a generally favorable business climate and economic policies. Any changes in the economic policies or regulations by the governments of the countries where we own investments may adversely affect our business, financial condition and results of operations.
Our participation in deep water drilling in conjunction with our business partners involves certain risks and costs, which may be outside of our control.
In association with our business partners, we have undertaken deep water exploratory drilling in the U.S. Gulf Coast and in Brazil. Additionally, as of December 31, 2012, we were involved in 19 off-shore exploratory and production projects in Colombia that involve deep-water drilling, of which we act as operators in four, while Equion acts as operator in two. Our deep water drilling activities present several risks such as the risk of spills, explosions in platforms and drilling operations, and natural disasters. The occurrence of any of these events or other incidents could result in personal injuries, loss of life, severe environmental damage with the resulting containment, clean-up and repair expenses, equipment damage and liability in civil and administrative proceedings. Heightened risks and costs associated with deep water drilling may have a negative effect on our results of operations, financial condition and reputation.
As a result of the oil spill in the Macondo field in the U.S. Gulf Coast in April 2010, significant concerns regarding the safety of deep water drilling had been raised and regulation in different countries has changed. In association with our business partners, which act as operators, we are currently drilling and have plans to drill exploratory wells in the U.S. Gulf Coast and Brazil. Since we have no control over these types of foreign government regulations, they may negatively impact the timing of our deep water drilling operations and consequently our results of operations and financial condition.
Our drilling activities are capital intensive and may not be productive.
Drilling for crude oil and natural gas involves numerous risks, including the risk that we will not encounter commercially productive crude oil or natural gas reservoirs. The cost of drilling, completing and operating wells is high and uncertain, and drilling operations may be curtailed, delayed or canceled as a result of a variety of factors, including:
| · | unexpected drilling conditions; |
| · | pressure or irregularities in formations; |
| · | equipment failures or accidents; |
| · | fires, explosions, blow-outs and surface cratering; |
| · | delays or cancellation of environmental licenses; |
| · | other adverse weather conditions and natural disasters; and |
| · | shortages or delays in the availability or in the delivery of equipment. |
Certain of our future drilling activities may not be successful and, if unsuccessful, this failure could reduce the ratio at which we replace our reserves, which could have an adverse effect on our results of operations and financial condition. While all drilling, whether developmental or exploratory, involves risks, exploratory drilling involves greater risks of dry holes or failure to find commercial quantities of hydrocarbons. Because of the percentage of our capital budget devoted to higher-risk exploratory projects, it is likely that we may in the future experience significant exploration and dry hole expenses.
Increased competition from local and foreign crude oil companies may have a negative impact on our ability to gain access to additional crude oil and natural gas reserves in Colombia.
The ANH is the governmental entity responsible for promoting oil and gas investments in Colombia, establishing terms of reference for exploration rounds and assigning exploration blocks to oil and gas companies. Prior to the enactment of Decree Law 1760 of 2003, we had an automatic right to explore any territory in Colombia and to enter into joint venture agreements with foreign and local oil companies. Under current regulations, we are entitled to bid for any exploration blocks offered for exploration by the ANH and we compete under the same conditions as other domestic and foreign oil and gas companies, receiving no special treatment. We or other oil companies may request the ANH to directly assign exploration blocks which have not been previously reserved by that Agency, depending on exceptional situations that are defined on Accord 04 of 2012. Our ability to obtain access to potential production fields also depends on our ability to evaluate and select potential hydrocarbon-producing fields and to adequately bid for these exploration fields.
Our strategies include international expansion where we face competition from local market players and international oil companies that have experience exploring in other countries.
If we are unable to adequately compete with local and foreign oil companies, or if we cannot enter into joint ventures with market players with properties where we could potentially find additional reserves, we may be conducting exploration activities in less attractive blocks, and we could reduce our market share participation. If we fail to maintain our current market position in Colombia, our results of operations and financial conditions may be adversely affected.
Our future performance depends on the successful development and deployment of new technologies and the knowledge to apply and improve them.
Technology, knowledge and innovation are essential to our business, especially for improvements in the production of heavy crude oil, the exploitation of mature fields and the development of non-conventional hydrocarbons. If we do not develop the right technology or do not obtain the expertise to operate new technology or to improve our processes, do not have access to, or deploy the knowledge necessary to apply and improve such technology effectively, the execution of our Strategic Plan, our profitability and our earnings may be adversely affected.
Legislation and regulatory initiatives relating to hydraulic fracturing and other drilling activities for non-conventional oil and gas reserves could increase the cost of implementing our Strategic Plan and the future costs of doing business or cause delays and adversely affect our operations.
Hydraulic fracturing is a commonly used process that involves injecting water, sand, and small volumes of chemicals into the wellbore to fracture the hydrocarbon-bearing rock thousands of feet below the surface to facilitate higher flow of hydrocarbons into the wellbore. Our Strategic Plan contemplates the use of hydraulic fracturing in the production of oil and natural gas from certain reservoirs, especially shale formations. We currently do not have information about any proposals of regulations concerning of hydraulic fracturing beyond the regulation already in place, which has allowed the use of this technique of reservoir stimulation for decades in Colombia. However, various initiatives in regions outside of Colombia with substantial shale gas resources have been or may be proposed or implemented to regulate hydraulic fracturing practices, limit water withdrawals and water use, require disclosure of fracturing fluid constituents, restrict which additives may be used, or implement temporary or permanent bans on hydraulic fracturing. If Colombia adopts similar regulations, which is something we cannot anticipate right now, the imposition of stringent regulatory and permitting requirements related to the practice of hydraulic fracturing in Colombia could significantly increase the cost of or cause delays in the implementation of our Strategic Plan and adversely affect our operations.
We may be subject to substantial risks relating to our development of exploration activities outside Colombia.
We began exploration activities outside Colombia in 2006 through our Brazilian subsidiary, Ecopetrol Oleo é Gas Do Brasil Ltda. Our foreign subsidiaries have subsequently entered into a number of joint venture exploration agreements with regional and international oil companies to explore blocks in Peru, Brazil and the U.S. Gulf Coast. The results of operations and financial condition of our subsidiaries in these countries may be adversely affected not only by risks associated with hydrocarbon exploration and production but also by fluctuations in their local economies, political instability and government actions, including: imposition of price controls; imposition of restrictions on hydrocarbon exports; fluctuation of local currencies against the Peso; nationalization of oil and gas reserves; increases in export tax and income tax rates for crude oil and oil products; and unilateral (governmental) institutional and contractual changes, including controls on investments and limitations on new projects.
We have limited experience exploring outside Colombia, where we are the incumbent operator. We may face new and unexpected risks involving environmental requirements that exceed those currently faced by us. Additionally, we may be exposed to legal disputes with foreign regulators. For example, we were awarded block Tucano-156 in Brazil in the 8th round of 2006. However, in August 2011, the Ministry of Mines and Energy of Brazil (Ministério de Minas e Energía)confirmed that the government would not sign any contract awarded in the 8th round of 2006, after the National Energy Policy Council (Conselho Nacional de Política Energética)decided to annul the bidding process. We may also experience the imposition of restrictions on hydrocarbon exploration and export, or increases in export tax or income tax rates for crude oil and natural gas.
If one or more of these risks described above were to materialize, we might not achieve the strategic objectives in our international operations, which may negatively affect our results of operations and financial condition.
We may incur losses and spend time and money defending pending lawsuits and arbitrations.
We are currently a party to several legal proceedings filed against us. We are also subject to labor-related lawsuits filed by current and former employees in connection with pension plans and retirement benefits. As of December 31, 2012, we were a party to 2,658 legal proceedings relating to civil, administrative, environmental, tax, and labor claims filed against us of which 659 met the accounting threshold for an accrual provision. We allocate substantial amounts of money and time to defend these claims. These claims involve substantial sums of money as well as other remedies. See Notes 19 and 31 to our consolidated financial statements and “Item 8. Financial Information—Legal Proceedings.”
Our natural gas production may not be able to keep up with our natural gas commitments.
We are party to certain natural gas supply contracts that have firm gas commitments. If we are unable to deliver natural gas to supply these contract clients, such as due to cuts in operations, delays in new projects for production facilities or the acceleration of the decline in our gas production, we may be required to compensate such contract customers for our failure to supply natural gas. See “Item 4. Information on the Company—Marketing and Supply—Natural Gas Distribution.” Both situations may negatively impact our financial condition and results of operations.
During 2012, delays in the start of new projects, mainly the Planta de Gas Cupiagua and those for increasing the production capacity at the Guajira fields resulted in fines claimed by our clients. Such delays were mainly caused by the process to obtain environmental licenses for building the pipeline Cupiagua – Cusiana, landslides due to weather conditions and isolated strikes by workers in the project area from other oil and gas companies. During 2010, 2011 and 2012, the fines paid in compensation for non-delivery of natural gas were Ps$85.2 billion (approximately US$44.5 million), Ps$2.5 billion (approximately US$1.3 million) and Ps$9.2 billion (approximately US$5.2 million), respectively.
We are not permitted by law to own more than 25% of a natural gas transportation company, which may not allow us to transport new natural gas reserves to distribution points and to our customers.
We discovered natural gas reserves in the Cusiana and Cupiagua fields for which transportation capacity is limited. New natural gas transportation infrastructure may not be available to transport natural gas from new or existing fields to consumption areas. Furthermore, we are prohibited by law from holding more than 25% of the equity of any natural gas transportation company and consequently there can be no assurance that the transportation capacity necessary to transport natural gas is built by third parties. Due to the limited number of natural gas transportation companies currently operating in Colombia we may be required to enter into agreements on terms that are not as favorable to us as they could be if there were multiple transportation companies.
If we are unable to obtain transportation services to transport natural gas from new discoveries to our customers or to regions where natural gas is demanded, we may not be able to develop these reserves, which may result in impairment of the related assets and would not allow us to recover the capital expenditures invested to make these natural gas discoveries.
In addition, at the end of 2011, we had five medium-term supply contracts with gas-fired power plants that required us to deliver natural gas in Barrancabermeja. In 2012, four of those contracts ended and we currently have only a medium-term supply contract, with one gas-fired power plant that requires us to deliver natural gas in Barrancabermeja. If we were unable to find the necessary transportation, we could be unable to meet our obligation with those power generators, which could result in us having to pay monetary fines.
Our operations could be affected by conflicts with labor unions.
In the past, we have been affected by strikes and work stoppages promoted by our own and our industry’s labor unions. These strikes have been both politically and contract-related, especially during collective bargaining negotiations. In April 2009, we entered into an agreement with theUnión Sindical Obrera de la Industria del Petróleo, or USO, one of our industry labor unions, to restore trust between USO and us with open communication and transparency as the main principles.
Additionally, on August 22, 2009, as a result of consensual negotiations, we entered into a new five-year collective bargaining agreement with three of the most significant industry labor unions: USO,Asociación de Directivos Profesionales,Técnicos y Trabajadores de las Empresas de la Rama de Actividad Económica del Recurso Natural del Petróleo y sus Derivados de Colombia, or ADECO, andSindicato Nacional de Trabajadores de Empresas Operadoras, Contratistas,Subcontratistas de Servicios y Actividades de la Industria del Petróleo y Similares, or SINDISPETROL. The new collective bargaining agreement was effective as of July 1, 2009 and covers salaries, healthcare, education, housing, transportation, meals, cultural activities, union rights and guarantees, among other aspects.Sindicato Nacional de Trabajadores de Empresas Operadoras, or SINCOPETROL, the Company’s labor union, neither presented any list of claims to us nor objected to the bargaining agreement, and as a result, we do not have a labor conflict with SINCOPETROL.
During 2011, there were two work stoppages promoted by USO in Barrancabermeja in support of the protests by employees at Pacific Rubiales, an unaffiliated oil and gas company in Colombia. On June 19, 2012 and December 22, 2012, USO members protested the creation of our subsidiary Cenit Transporte y Logística de Hidrocarburos S.A.S, or Cenit. These protests did not materially affect our operations.See “Item 6. Directors, Senior Management and Employees—Employees.”
We cannot assure you that we will not experience labor unrest in the future. In the event relations with our labor unions deteriorate, which could result in strikes, work stoppages or even sabotage, our results of operations and financial condition could be negatively affected.
We may not be able to achieve our corporate goals if we face difficulty in finding competent successors to our current management and employees.
Our growth strategy and the successful achievement of our corporate goals depend on the competence of our management and employees, and our ability to retain top talent. However, if our managers and employees decide to retire or leave us for other reasons, it may be difficult for us to find adequate successors with the required skills, knowledge, leadership and qualifications for the job. In addition, we may face difficulties in retaining our key managers and employees because of the high level of competition for human resources with experience and knowledge in the oil and gas industries. Furthermore, our compensation structure may not be able to meet industry levels and as a result our key employees may leave for jobs offering higher compensation. We also may face difficulties acquiring or developing the optimal set of professional skills and talent required to reach and sustain our performance under international standards. These difficulties, in turn, may negatively affect our results. See “Item 6. Directors, Senior Management and Employees—Employees.”
Our activities may be interrupted or affected by external factors, such as abnormal weather conditions, natural disasters and third-party acts.
We are exposed to several risks that may partially interrupt our activities. These risks include, among others, fire disasters, explosions, natural disasters such as earthquakes, landslides, volcanic eruptions, tropical storms, hurricanes and floods, criminal acts and acts of terror, malfunction of pipelines and emission of toxic substances.
For instance, in 2011 we were affected by weather conditions that intensified the strength of the average rain season in Colombia, causing landslides due to the abnormal concentration of water in the soil. These abnormal landslides affected transportation of crude oil by trucks, transportation of crude oil, natural gas and products by pipelines and the normal operation of our production fields and Reficar, which experienced floods at its facilities also as a result of torrential rains.
As a result of the occurrence of any of the above, our activities could be significantly affected or paralyzed. These risks could result in property damage, loss of revenue, loss of life, pollution and harm to the environment, among others. If any of these occur, we may be exposed to economic sanctions, fines or penalties, which may adversely affect our financial condition and results of operations. On December 23, 2011, our Salgar-Cartago pipeline ruptured. We believe that this incident occurred as a result of a creep movement as a consequence of severe weather conditions in the area, causing the surrounding soil to exercise strong pressure on the pipeline, causing it to rupture. The spilled gasoline from the pipeline subsequently came into contact with a heat source which ignited it causing several explosions, resulted in 33 fatalities, 77 injuries, and damaged and destroyed property. On December 11, 2011, our Caño Limón – Coveñas oil pipeline ruptured as a result of a soil motion caused by the heavy rainy season. While the accident did not result in any fatalities, it resulted in crude oil spilling into the Iscala creek. See “Item 4. Information on the Company—Transportation Infrastructure—Incidents at Transportation Facilities.”
We conduct exploration and production activities in areas classified as indigenous reserves and Afro-Colombian lands.
We carry out and plan to carry out exploration and production activities in areas classified by the Government as indigenous reserves (resguardos) and Afro-Colombian lands (territorios colectivos). We may not begin to explore for or produce hydrocarbons in these regions until we reach an agreement with the indigenous or Afro-Colombian communities living on these lands. Generally these consultations last between four and six months, but may be significantly delayed if we cannot reach an agreement. For example, we conduct operations in areas of the Northeastern region, which are inhabited by the U’wa community. Commencement of operations on two blocks in this region have been delayed for 20 years and ten years, respectively as of December 2012 because the community has refused to participate in the consultation process and the applicable legislation does not contemplate any alternatives in such a case. Similarly, some of our exploration operations in the Southern region have been delayed for seven years as a result of the presence of the Kofan community who oppose our presence and activities in the reservation. We may be exposed to similar delays due to opposition from local communities in other countries where we carry out exploration activities in indigenous reserves, such as Peru. If our activities endanger the conservation and preservation of these cultural minorities or their identities or beliefs, we may not be able to explore regions with good prospects. We may face similar risks in other jurisdictions where we have initiated exploration activities, which could have a negative effect on our operations.
Our operations are subject to social risks.
Our activities are subject to social risks, including protests by communities surrounding our operations. For example, during the construction of the Bicentenario oil pipeline, construction was suspended as a result of lockouts used by communities in the area of influence of the oil pipeline to demand greater participation of the Government and social investment, as well as greater participation of private companies in the development plans of towns in the departments of Arauca and Casanare. While we are committed to operating in a socially responsible manner, we may face opposition from local communities with respect to our current and future projects and such opposition could adversely affect our business, results of operations and financial condition.
Currency fluctuations and an appreciation of the Peso against the U.S. dollar could have an adverse effect on our financial condition and results of operations given that approximately 65% of our revenues are derived from foreign sales.
Approximately 65% of our sales are made in the international markets. The impact of fluctuations in exchange rates, especially the Peso/U.S. dollar rate on our operations has been and may continue to be material. In addition, a substantial share of our liquid assets are held in U.S. dollars or indexed to foreign currencies and gain value when the Peso depreciates against the U.S. dollar and lose value when the Peso appreciates against the U.S. dollar. We control our currency risk using natural hedging when possible, by maintaining funds in U.S. dollars and Pesos to meet our expenses in its respective currency. In addition, the obligations derived from our U.S. dollar-denominated debt are naturally hedged by our funds in the same currency. This situation partially mitigates any adverse effect that currency risk may have over the financial statements of the Company.
The U.S. dollar/Peso exchange rate has shown some instability in the last several years, particularly with the Peso experiencing significant fluctuations during the last twelve months. The Peso appreciated 2.7% on average against the U.S. dollar in 2012, and depreciated 0.6%, on average, during the first three months of 2013. When the Peso appreciates against the U.S. dollar, our revenues from exports, when translated into Pesos, decrease. However, imported goods, oil services and interest on external debt denominated in U.S. dollars become less expensive for us. Conversely, when the Peso depreciates against the U.S. dollar, our revenues from exports, when translated into Pesos, increase, and our imports and external debt service become more expensive. We cannot assure you that measures adopted by the government of Colombia and the Colombian Central Bank (Banco de la República de Colombia) such as the purchase of U.S. dollars in the foreign exchange market in response to the appreciation of the Peso, and the government’s intervention through the purchase of significant amounts of U.S. dollars in the spot market to pay interest and principal on foreign bonds coming due or to increase the size of the oil-stability fund will be sufficient to control this instability. Future volatility in the exchange rate of the Peso to the U.S. dollar may adversely affect our financial condition and results of operations and our ability to comply with our obligations under our indebtedness, pay dividends or make other distributions to our shareholders.
Our ability to access the credit and capital markets on favorable terms to obtain funding for our capital projects may be limited due to the deterioration of these markets and the authorizations we need before incurring any financial indebtedness.
We expect to make significant expenditures in capital and operations to reach the corporate goals established by our Strategic Plan. See “Item 4. Information on the Company—The Company—Strategic Plan.” Our ability to fund these expenditures is dependent on our ability to access the capital necessary to finance the construction of these facilities on terms acceptable to us. In recent years, domestic and global financial markets and economic conditions have been weak and volatile and have contributed significantly to a substantial deterioration in the credit and capital markets. A new financial crisis or an expansion of the current European sovereign debt crisis could also make it more difficult for us and our subsidiaries to access international capital markets and finance our operations and capital expenditures in the future on terms acceptable to us. These conditions, along with significant write-offs in the financial services sector and the re-pricing of credit risk, can make it difficult for us to obtain funding for our capital needs on favorable terms. As a result, we may be forced to revise the timing and scope of these projects as necessary to adapt to existing market and economic conditions, or access the financial markets on terms less favorable, therefore negatively affecting our results of operation and financial condition.
In addition, under applicable regulation, the Government, through the Ministry of Finance and Public Credit, must authorize all indebtedness of governmental entities and Nation-controlled companies through a majority equity stake. Consequently, all of our own indebtedness and our subsidiaries’ indebtedness, except for our foreign subsidiaries or those subsidiaries in which we hold minority interest, must be previously authorized by the Colombian Ministry of Finance and Public Credit. As such, our indebtedness is subject to the Government’s time frames and policies, and we cannot assure you that such authorizations would be granted in a timely fashion or at all.
We may be exposed to increases in interest rates, thereby increasing our financial costs.
We may incur debt locally and in the international capital markets and, consequently, may be affected by changes in prevailing interest rates. If market interest rates increase, our financing expenses may increase, which could have an adverse effect on our results of operations and financial condition.
Financial markets have not recovered from the recent global economic crisis and remain vulnerable to the European sovereign debt crisis that affects the liquidity of commercial banks and investment funds. If recovery falters or takes a few years longer than expected, the costs of raising funds in debt and equity capital markets may increase and impair our ability to obtain capital on terms acceptable to us.
We are subject to extensive environmental regulations in Colombia and in the other countries in which we operate and under certain of our credit agreements, we are under an obligation to comply with international environmental standards.
Our operations are subject to extensive national, state and local environmental regulations in Colombia. Environmental rules and regulations are applicable to our exploration, production, refining, transportation, supply and marketing activities, as well as the biofuels we produce. These regulations establish, among other things, quality standards for hydrocarbon products, air emissions and greenhouse gases, water discharges and waste disposal, environmental standards for abandoned crude oil wells, remedies for soil, water pollution and the general storage, handling, transportation and treatment of hydrocarbons in Colombia. Currently, all exploratory projects drilling in areas that do not yet have a license must undergo an environmental impact assessment and must receive an environmental license from the Ministry of the Environment. The Ministry of the Environment routinely inspects our crude oil fields, refineries and other production sites and may decide to open investigations which may result in fines, restrictions on operations or other sanctions in connection with potential non-compliance with environmental laws.
We are also subject to regional environmental regulations issued by thecorporaciones autónomas regionales,or regional environmental authorities, which oversee compliance with each region’s environmental regulations. If we fail to comply with any of these national or regional environmental regulations, we could be subject to administrative and criminal penalties, including warnings, fines and closure orders of our facilities. See “Item 4. Information on the Company—Overview by Business Segment—Environmental Matters.”
Environmental compliance has become more stringent in Colombia in recent years and as a result we have allocated a greater percentage of our expenditures for compliance with these laws and regulations. If environmental laws continue to impose additional costs and expenses on us, and as new laws and regulations relating to climate change become applicable to us, we may need to reduce our investments on strategic projects in order to allocate funds to environmental compliance. We are exposed to delays in obtaining environmental licenses from ANLA (Asociación Nacional de Licencias Ambientales, the government agency which is in charge of environmental licenses), which can lead to cost overruns or to changes in the investment plans of the company. These additional costs may have a negative impact on the profitability of the projects we intend to undertake or may make them economically unattractive, in turn having a negative impact on our results of operations and financial condition.
We are subject to foreign environmental regulations for the exploratory activities conducted by us outside Colombia. Failure to comply with foreign environmental regulations may result in investigations by foreign regulators, which could lead to fines, warnings or temporary suspensions of our operations, which could have a negative impact on our financial condition and results of operations.
Under certain of our credit agreements, we are under an obligation to comply with international environmental standards established by our lenders or by multilateral institutions. Failure to comply with such environmental standards could result in an event of default under the relevant credit agreements that we, or our subsidiaries, have entered into, which would affect our financial condition. For instance, the credit agreements executed by Ecopetrol in order to finance purchases of U.S. goods and services and the credit facilities executed by Reficar for the financing of its expansion and modernization project, include an obligation to comply with the U.S.-Exim Environmental Procedures and Guidelines, and the Organization for Economic Co-operation and Development (OECD) Common Approaches on Environment and Officially Supported Export Credits.
Our activities face operational risks that may affect the health and safety of our workforce and of the local communities.
Some of our operations are developed in remote and dangerous locations which involve health and safety risks that could affect our workforce. Under Colombian law and industrial safety regulations we are required to have health and safety practices that minimize risks and health issues faced by our workforce. Failure to comply with health and safety regulations may lead to investigations by health officials that could result in lawsuits or fines.
We may be required to incur additional costs and expenses to allocate funds to industrial safety and health compliance under Colombian law and industrial safety regulations. Additionally, if any operational incident occurs that affects local communities in nearby areas, we will need to incur additional costs and expenses in order to return affected areas to normality. These additional costs may have a negative impact on the profitability of the projects we may decide to undertake.
In addition, we may be subject to foreign health and safety regulations for our exploratory activities conducted outside Colombia. Foreign health and safety regulations may be more severe than those established under Colombian law and, therefore, we may be required to make additional investments to comply with those regulations.
We have made significant investments in acquisitions and we may not realize the expected value.
We have acquired interests in several companies in Colombia and abroad. See “Item 4. Information on the Company.” Obtaining the expected benefits of the acquisitions will depend, in part, on our ability to (1) obtain the expected operational and financial results from these acquisitions, (2) manage disparate operations and integrate distinct corporate cultures and (3) manage our objectives as a corporate group. These efforts may not succeed. Our failure to successfully obtain the expected results from our acquisitions could adversely affect our financial condition and results of operations.
Our subsidiaries Reficar and Oleoducto Bicentenario are currently engaged in their own construction projects. If they or any other material project is delayed or if its costs exceed our initial estimate, it could affect our operating results and financial condition.
Reficar has raised US$3.5 billion through a limited-recourse project financing in which we have acted as sponsor and have provided both a construction guarantee and a debt service guarantee to the project lenders. If the construction project of the upgraded refinery is delayed because of operational problems, due to, but not limited to, labor productivity or unavailability of construction material in the development of the project, or if the upgraded refinery does not reach the expected performance level in terms of the quality of products and/or volumes produced, the project lenders could request that we act on the guarantees and assume the payment obligations of Reficar, which would require us to make additional capital contributions thereby affecting our operating results and financial condition. Additionally, delays in the implementation of the project may result in larger capital expenditures, which could increase the overall cost of the project and impact our financial position.
In February 2013, Reficar requested contributions from Ecopetrol under the Construction Support Agreement in an amount of US$500 million, of which US$250 million has already been provided, with the remaining amount to be supplied throughout the rest of the year. As the project’s budget and schedule are being revised, we may be required to provide additional funding in excess of this amount. Any increase in the project’s capital expenditures is expected to be funded under the Construction Support Agreement between Reficar and Ecopetrol.
Oleoducto Bicentenario is in the first phase of construction of the Araguaney-Coveñas pipeline, which connects the Araguaney and Banadía loading facilities, and which is expected to be the largest of its kind in Colombia. Its estimated investment of US$2,035 million is expected to be financed by the project partners’ equity participation amounting to a 30% interest and the remaining 70% through loans from local banks, which have approved Ps$2.1 trillion and of which Ps$1,295 billion (approximately US$732 million) has been drawn. The first phase of the construction is expected to permit the evacuation of at least 110 thousand bpd, with a pipeline of 230 kilometers in length and a diameter of 42 inches. Delays in the completion of the first phase of this project due in part to events such as lockouts from communities in the areas of project construction demanding more social investment from the government, security issues, attacks by guerrilla groups, and unfavorable weather conditions could affect our production in certain fields and would prevent us from having the necessary infrastructure for crude oil transportation, negatively impacting our financial position.
Other investment projects that are part of our Strategic Plan could face similar planning and implementation problems, which could impact the competitiveness of our programs and projects, affecting our results and expected financial condition.
Our results may be affected by the performance of our business partners, as many of our operations are executed under association and joint venture agreements with business partners.
Many of our operations are executed through associations, joint ventures and other agreements with our business partners. Consequently, we depend on the performance of our business partners. The poor performance of any of our business partners, especially in those projects in which we do not act as operators, could negatively impact our results of operations and financial condition. In addition, we are exposed to the risk of not finding business partners with the appropriate skills and performance that we require for our projects.
Our insurance policies do not cover all liabilities and may not be available for all risks.
Our insurance policies do not cover all liabilities, and insurance may not be available for all risks. There can be no assurance that incidents will not occur in the future, that insurance will adequately cover the entire scope or extent of our losses or that we will not be found liable in connection with claims arising from these and other events, which could adversely affect our financial condition and results of operations.
A failure in our information technology systems or cyber security attacks may adversely affect our financial results.
We depend on the reliability and security of our information technology systems to conduct certain exploration, development and production activities, process and record financial and operating data, communicate with our employees and business partners, and for many other activities related to our business. Our information technology systems may fail or have other significant shortcomings due to operational system flaws or employee misuse, tampering or manipulation. In addition, we may become the target of cyber attacks or information security breaches that could result in the unauthorized release, gathering, monitoring, misuse, loss or destruction of proprietary and other information. Any of these occurrences could disrupt our business, result in potential liability or reputational damage or otherwise have an adverse effect on our financial results. Although we have not experienced any material losses relating to failure of our information technology systems or cyber incidents, there can be no assurance that we will not suffer such losses in the future.
Risks relating to our ADSs
Holders of our ADSs may encounter difficulties in exercising their voting rights.
The procedures established in the Deposit Agreement provide that holders of our ADSs are entitled to instruct our current depositary, JPMorgan Chase Bank, N.A., to vote on shareholder matters by giving instructions, in advance of a shareholders’ meeting, to such depositary. Under Colombian law, Ecopetrol is not required to request proxies from our existing shareholders and, therefore, shareholders may not receive notice in time to instruct the depositary to vote their shares.
Pursuant to the Deposit Agreement, holders of our ADSs can instruct the depositary to vote the common shares separately. However, this issue has been subject to different regulatory interpretations, which may limit the ability of the depositary to vote separately. Under prior regulatory interpretations, the depositary could be required to vote the underlying common shares in a single block (presumably reflecting the majority vote of the ADS holders). In the future, the Colombian regulatory authorities may change their interpretation as to how the voting rights should be exercised by ADS holders, and such possible interpretation could adversely affect the value of the common shares and ADSs
Our ADSs holders may be subject to restrictions on foreign investment in Colombia.
Colombia’s International Investment Statute regulates the manner in which non-Colombian residents can invest in Colombia and participate in the Colombian securities market. Among other requirements, Colombian law requires foreign investors to register certain foreign exchange transactions with the Colombian Central Bank and outlines the necessary procedures to authorize certain types of foreign investments. Colombian law requires that certain foreign exchange transactions, including international investment in foreign currency between Colombian residents and non-Colombian residents, must be made through authorized foreign exchange market participants. Any income or expenses under our American Depositary Receipt, or ADR, program must be made through the foreign exchange market.
Investors acquiring our ADRs are not required to register with the Colombian Central Bank, as they will benefit from the registration to be obtained by the custodian for our common shares underlying the ADRs in Colombia. If investors in ADRs choose to surrender their ADRs and withdraw common shares, they must register their investment in the common shares as a portfolio investment through their local representative, which may be a brokerage firm, trust company or investment management companies supervised by the Superintendency of Finance. Investors will only be allowed to transfer dividends abroad after their foreign investment registration procedure with the Colombian Central Bank has been completed. Investors withdrawing common shares could incur expenses and/or suffer delays in the application process. The failure of a non-resident investor to report or register foreign exchange transactions with the Colombian Central Bank relating to investments in Colombia on a timely basis may prevent the investor from remitting dividends, or initiate an investigation that may result in a fine. In the future, the Government, the Colombian Congress or the Colombian Central Bank may amend Colombia’s International Investment Statute or the foreign investment rules, which could result in more restrictive rules and could negatively affect trading of our ADSs.
Additionally, Colombia currently has a floating exchange rate system; however, other restrictive rules for the exchange rate system could be implemented in the future. In the event that a more restrictive exchange rate system is implemented, the depositary may experience difficulties converting Peso amounts into U.S. dollars to remit dividend payments. See “Item 10. Additional Information—Exchange Controls.”
Holders of our ADSs may not be able to effect service of process on us, our directors or executive officers within the United States, which may limit your recovery in any foreign judgment you obtain against us.
We are a mixed economy company organized under the laws of Colombia. In addition, most of our Directors and executive officers reside outside the United States. All or a substantial portion of our assets and the assets of these persons are located outside of the United States. As a result, it may not be possible for you to effect service of process within the United States upon us or these persons or to enforce judgments against us or them in U.S. courts obtained in such courts predicated upon the civil liability provisions of the U.S. federal securities laws. Colombian courts determine whether to enforce a U.S. judgment predicated on the U.S. securities laws through a procedural system known asexequatur. For a description of these limitations, see “Enforcement of Civil Liabilities.”
The protections afforded to minority shareholders in Colombia are different from those in the United States, and may be difficult to enforce.
Under Colombian law, the protections afforded to minority shareholders are different from those in the United States. In particular, the legal framework with respect to shareholder disputes is substantially different under Colombian law than U.S. law and there are different procedural requirements for commencing shareholder lawsuits, such as shareholder derivative suits. As a result, it may be more difficult for our minority shareholders to enforce their rights against us or our Directors or controlling shareholder than it would be for shareholders of a U.S. company.
ADRs do not have the same tax benefits as other equity investments in Colombia.
Although ADRs represent Ecopetrol’s common shares, for Colombian tax purposes, ADRs are securities different from their underlying assets. Therefore, ADR holders are not entitled to the tax benefits granted to holders of the common shares. Such tax benefits are, among others, those relating to dividends and profits derived from sale of Colombian common shares. For further information see “Item 10. Additional Information—Taxation—Colombian Tax Considerations.”
Judgments of Colombian courts with respect to our ADSs will be payable only in Pesos.
If proceedings are brought in the courts of Colombia seeking to enforce the rights of ADS holders of common shares, we will be required to discharge our obligation amounts in Pesos. Under Colombian laws, an obligation in Colombia to pay amounts denominated in foreign currency may only be satisfied in Colombian currency at the Representative Market Exchange Rate of the date the judgment is obtained, and such amounts are then adjusted to reflect exchange rate variations through the effective payment date.
The relative volatility and illiquidity of the Colombian securities markets may substantially limit our investors’ ability to sell our ADSs at the price and time they desire.
Investing in securities that are traded in emerging markets, such as Colombia, often involves greater risk when compared to other world markets, and these investments are generally considered to be more speculative in nature.
The Colombian securities market is substantially smaller, less liquid, more concentrated and can be more volatile than other securities markets. The Colombian Stock Exchange (Bolsa de Valores de Colombia), or BVC, had a market capitalization of approximately Ps$483,295 billion (US$273,321 million using the closing rate for 2012) as of December 31, 2012, a 19.6% increase when compared with the amount at the end of 2011, a daily average trading volume of approximately Ps$188,212 million (US$104,665 million, using the average exchange rate for 2012), a 15.8% increase when compared to the volume in 2011. In contrast, the New York Stock Exchange, or NYSE, had a market capitalization of US$14 trillion as of December 31, 2012, and a daily trading volume of approximately US$37 billion in 2012.
As of December 31, 2012, our shares represented the highest market capitalization of the BVC with 43% of the total. In addition, they had the second highest trading volume in the BVC, averaging Ps$26,146 million traded per day. In the last quarter of 2012, our shares represented 26.6% of theÍndice General de la Bolsa de Valores de Colombia, or IGBC, stock market index, 12.61% of the COL20, a stock market index that includes the top 20 traded stocks in the BVC, and 20.2% of the COLCAP, a stock price volatility index.
Given the current ownership structure of our shares, it may be difficult for you to purchase large quantities of shares from a single shareholder. We cannot assure you that a liquid trading market for our ADSs will develop or, if developed, that it will be maintained. Without a liquid trading market, the ability of investors in our ADSs to sell them at the desired price and time could be substantially limited.
We are not required to disclose as much information to investors as a U.S. issuer is required to disclose.
We are subject to the reporting requirements of the Superintendency of Finance and the BVC. The corporate disclosure requirements that apply to us may not be equivalent to the disclosure requirements that apply to a U.S. issuer and, as a result, you may receive less interim information about us than you would receive from a U.S. issuer.
Risks relating to Colombia’s political and regional environment
Colombia has experienced internal security issues that have had or could have a negative effect on the Colombian economy and on us.
Colombia has experienced internal security issues, primarily due to the activities of guerrillas, paramilitary groups, drug cartels and criminal bands known asBacrim. From time to time, guerrillas target crude oil and multi-purpose pipelines, including the Oleoducto Transandino, Caño Limón-Coveñas and Ocensa pipelines, and other related infrastructure disrupting our activities and those of our business partners. During 2011 and 2012, these attacks have intensified. On several occasions, guerilla attacks have resulted in unscheduled shut-downs of transportation systems in order to repair sections of pipelines that have been damaged and to undertake clean-up activities, as well as in deferral of production in certain fields. Guerrilla groups and other illegal armed groups also attacked natural gas transportation infrastructure. Although we do not have any interest in natural gas transportation assets, these attacks have affected our natural gas production. These activities, their possible escalation and the effects associated with them have had and may have, in the future, a negative impact on the Colombian economy or on us, which may affect our customers, employees, assets or the environment, with resulting containment, clean-up and repair expenses. In the context of this complex security situation, allegations and court judgments have been levied against members of the Colombian Congress and on government officials for possible ties with illegal groups. This situation may have a negative impact on the credibility of the Colombian government, which could in turn have a negative impact on the Colombian economy or on us in the future.
Recently, the Colombian government began negotiations with the Revolutionary Armed Forces of Colombia, or FARC, the largest guerrilla group in Colombia, with a view to end the armed conflict. This is the latest attempt in a series of unsuccessful negotiations between the Colombian government and the FARC. While the process is ongoing, military operations and hostilities continue. If the negotiations fail, the intensity of the internal armed conflict could increase, resulting in a deterioration of Colombia’s national security and, consequently, negatively affecting our operating results.
There have been certain events in Colombia and abroad, which have resulted in political tensions between Colombia and some of its neighboring countries.
Diplomatic relations between Colombia and some of its neighboring countries, in particular Ecuador and Venezuela, have been very tense in the past. These political tensions were heightened by the Colombian Government’s allegations that neighboring countries are supporting the guerilla groups, as well as by claims made by Venezuela stating that the Colombian army has entered its territory while in pursuit of FARC members. The Colombian army and air force continue to combat FARC members in the Colombian territory, including Colombia’s borders with neighboring countries. Although relations with these countries have stabilized recently, there can be no assurance that similar allegations could not be made again that may result in new and heightened tensions with Colombia’s neighbors, which have had in the past, and could have in the future, a negative impact on Colombia’s economy and general security situation.
Companies operating in Colombia, including us, are subject to the prevailing economic conditions and the investment climate in Colombia, which may be less stable than the prevailing economic conditions and investment climate in developed countries.
Market prices of securities issued by Colombian companies, including us, are subject to the prevailing economic conditions in Colombia. A large portion of our assets and operations are located in Colombia and most of our sales are currently derived from our crude oil and natural gas production and the production of our refineries located in Colombia. Accordingly, our financial condition and results of operations depend to a significant extent on macroeconomic and political conditions prevailing from time to time in Colombia and on the rates of exchange between the Peso and the U.S. dollar.
In the past, economic growth in Colombia has been negatively affected by lower foreign direct investment, high inflation rates and the perception of political instability.
The investment and security climate in Colombia continues to be tied to the results and performance of President Juan Manuel Santos’s economic, security and social policies and the perception of such policies by foreign investors. Since his election in 2011, President Juan Manuel Santos has continued policies to increase foreign investment in Colombia as well as to improve relations with neighboring countries, which have resulted in economic stability for Colombia. In 2012, Colombia’s annual gross domestic product increased by 4% due principally to an increase of 5.9% in crude oil and mining production. In 2011, Colombia’s annual gross domestic product increased by 6.6% due principally to an increase of 14.4% in crude oil and mining production.
If the perception of improved overall security in Colombia deteriorates or if foreign direct investment declines, the Colombian economy may face a downturn, which could negatively affect our financial condition and results of operations. Furthermore, the market price of our shares and American Depositary Shares, or ADSs, may be adversely affected by changes in governmental policies, particularly those affecting economic growth, exchange rates, interest rates, inflation and taxes. The Colombian government has changed monetary, fiscal, taxation, labor and other policies over time and has thus influenced the performance of the Colombian economy. We have no control over the extent and timing of government intervention and policies.
Adverse developments in the global economy restricting the credit markets may materially and negatively impact our business, results of operations and financial condition.
The downturn in the world’s major economies over the past several years and the constraints in the credit markets have heightened, and could continue to heighten, a number of material risks to our business, results of operations and financial condition, as well as our future prospects. Continued weakness in, and uncertainty about, global economic conditions, and in particular the economic conditions in the United States, could cause businesses to postpone spending in response to tighter credit, negative financial news or declines in income or asset values, which could have a material adverse effect on the demand for goods and international trade which, in turn, could adversely affect the demand for our products. For example, the recent challenges faced by the European Union to stabilize some of its member economies, such as Cyprus, Greece, Ireland, Italy, Portugal and Spain, have had international implications affecting the stability of global financial markets, which have hindered economies worldwide. Many member nations in the European Union are addressing the issues with controversial austerity measures. If the European Union monetary policy measures are insufficient to restore confidence and stability to the financial markets, any recovery of the global economy, including the U.S. and European Union economies, could be hindered or reversed, which could negatively affect our business, results of operations and financial condition. There could also be a number of follow-on effects from these economic developments and negative economic trends to our business, including customer insolvencies, decreased customer demand, decreased customer liquidity due to tightening in the credit markets and decreased customer ability to fulfill their payment obligations.
The recent economic problems affecting the banking system and financial markets and the recent uncertainty in global economic conditions has resulted in a number of adverse effects including tightening in the credit markets, a low level of liquidity in many financial markets, extreme volatility in credit, equity, currency and fixed income markets, instability in the stock market and high unemployment.
Financial markets have also recently been affected by concerns over U.S. fiscal policy, as well as the U.S. federal government’s debt ceiling and the federal deficit. These concerns have also renewed discussions relating to a potential downgrade of the long-term sovereign credit rating of the United States. Any actions taken by the U.S. federal government regarding the debt ceiling or the federal deficit or any action taken or threatened by ratings agencies, could significantly impact the global and U.S. economies and financial markets, which could lead to a recession. Our business is closely tied to general economic conditions in the United States, Colombia and other Latin American countries, and any such economic downturn could have a material adverse effect on our business, financial condition, and results of operations.
Developments and the perception of risk in other countries, especially emerging market countries, may adversely affect the market price of Colombian securities, including our ADSs.
Securities issued by Colombian companies may be affected by economic and market conditions in other countries, including other Latin American and emerging market countries. Although economic conditions in Latin American countries and in other emerging market countries may differ significantly from economic conditions in Colombia, investors’ reactions to developments in these other countries may have an adverse effect on the market value of securities of Colombian issuers.
Due to past financial crises in several emerging market countries (such as the Asian financial crisis of 1997, the Russian financial crisis of 1998 and the Argentine financial crisis of 2001), the world financial crisis of 2009 and the recent sovereign debt crises in certain European countries, investors may view investments in emerging markets with heightened caution. In the past, as a result of crises in other countries, flows of investments into Colombia have been reduced. Crises in other countries, especially in emerging market countries, may hamper investor enthusiasm for securities of Colombian issuers. If Latin America experiences a new slow-down or if the price for securities of Latin American issuers falls, the price for our ADSs could follow this trend and could be adversely affected.
Our controlling shareholder’s interests may be different from those of our minority shareholders.
Colombian Law 1118 of 2006 requires the Nation to maintain the majority of our outstanding capital stock. The Nation currently holds 88.49% of our outstanding capital stock, making it our controlling shareholder. The Nation as our controlling shareholder has majority voting rights at the shareholders’ meeting to elect the members of our Board of Directors and approve decisions. The Nation could propose and approve decisions that do not necessarily benefit minority shareholders.
Our controlling shareholder may approve dividends at the ordinary general shareholders’ meeting, notwithstanding the interest of minority shareholders, in an amount that results in us having to reduce our capital expenditures, thereby negatively affecting our prospects, results of operations and financial condition. See “Item 8. Financial Information—Dividends.”
Additionally, given our controlling shareholder’s interests, it may undertake projects, approve decisions or make announcements about its intentions related to its holding of our capital stock which may not be in our best interest or in the best interest of our minority shareholders, including holders of our ADSs, and could impact the price of our shares or ADSs.
Our operations are subject to extensive regulation.
The Colombian hydrocarbons industry is subject to extensive regulation and supervision by the Government in matters including the award of exploration and production blocks by the National Hydrocarbon Agency (Agencia Nacional de Hidrocarburos), or ANH, the imposition of specific drilling and exploration obligations, restrictions on production, price controls, capital expenditures and required divestments. Existing regulation applies to virtually all aspects of our operations in Colombia and abroad. The commercialization activities of some of our products also face extensive regulation. Such regulation is subject to change by the applicable regulator affecting our ability to commercialize our products. See “Item 4. Information on the Company—Overview by Business Segment—Regulation.”
The terms and conditions of the agreements with the ANH under which we explore and produce crude oil and natural gas generally reflect negotiations with the ANH and other governmental authorities and may vary by fields, basins and hydrocarbons discovered.
We are required, as are all oil companies undertaking exploratory and production activities in Colombia, to pay a percentage of our production to the Government as royalties. The oil and gas reserve figures included in this annual report are net of such royalties. The Government has modified the royalty program for crude oil and natural gas production several times in the last 20 years, as it has modified the regime regulating new contracts entered into with the Government. Since2002, the royalty regime for contracts being entered into for crude oil is tied to a scale that begins at 8% for production of up to 5,000 bpd, and increases up to 25% for production above 600,000 bpd. Royalties for natural gas production are also subject to a sliding scale depending on whether the field is on- or off-shore and range between 8% and 25%.
In the future, the Government may once again amend royalty payment levels for new contracts and such changes could have an adverse effect on our future exploration and production contracts in Colombia.
The Government may delay the reimbursement of gasoline and diesel fuel price differentials.
The Government regulates domestic prices of liquid fuels according to international market conditions in order to align domestic prices with trends in international prices. When domestic prices of liquid fuels are lower than international parity prices, the Government is responsible for reimbursing importers or refiners for the difference, which is called the fuel price differential, pursuant to Law 1151 of 2007. Currently, the fuel price differential is calculated on a monthly basis and reported on a quarterly basis, with the corresponding cash payment to be made during the subsequent quarter. In cases of payment delays, refiners are entitled to receive interest on past due amounts.
Historically, when domestic prices of liquid fuels were higher than international parity prices, the Government lowered domestic prices. However, towards the end of 2008 as international prices decreased, the Government decided not to lower domestic prices. Instead, the Government kept domestic prices high and allocated the positive difference between domestic fuel prices and the international parity prices to a Fuels Stabilization Fund (Fondo de Estabilización de Precios de los Combustibles), or FEPC. Similar to the approach followed by other countries, the FEPC is funded with these excess payments when international prices are low and depleted when international prices are high in order to mitigate domestic price volatility.
During 2010, oil refiners, including us, were entitled to fuel price differential payments from the Ministry of Mines and Energy indexed to international prices. However, such payments due to us by the Ministry of Mines and Energy were not made until the fourth quarter of 2011. Similarly, during 2011, the fuel price differential payments corresponding to the first three quarters of the year were not paid until December 2011. The fuel price differential payments due to us as of December 31, 2011, equal Ps$571.8 billion and those for 2012 equal Ps$1,381.5 billion. In April 2013, the Ministry of Mines and Energy paid the corresponding amounts due to us for the fourth quarter of 2011 and first three quarters of 2012, amounting to Ps$1,271.9 billion. The amount due to us, corresponding to the fourth quarter of 2012 and the first quarter of 2013, is equivalent to Ps$390.3 billion.
Delays in price differential payments make it difficult to determine when we will collect the amount of any fuel price differentials that become due in the future. Any material delay in the payment of these fuel price differentials by the Government or a significant amendment to Law 1151 of 2007 imposing additional responsibilities on us with respect to fuel price differentials could have a negative impact on our financial condition and results of operations. On September 30, 2011, the Ministry of Mines and Energy established a new methodology to calculate domestic prices of gasoline and diesel fuel, which sets the maximum monthly variation in refiners’ revenues at 1.5%. Currently, the Colombian Congress is discussing a bill to introduce a new methodology to calculate fuel price differentials, and determine the maximum retail price of gasoline and diesel, including the revenues for the Colombian refineries. There can be no assurance that this bill, if enacted into law, will not negatively affect the amount and timeliness of the fuel price differential payments, which in turn could affect our financial condition and results of operations. See “Item 5. Operating and Financial Review and Prospects—Gasoline and Diesel Price Differentials.”
New or higher taxes resulting from changes in tax regulations or the interpretation thereof in Colombia could adversely affect our results of operations and financial condition.
New tax laws and regulations, and uncertainties in the interpretation with respect to existing and future tax policies pose risks to us. In recent years, the Colombian Congress and tax authorities have imposed additional taxes and enacted modifications to taxes related to financial transactions, income, value added tax, or VAT, and taxes on net worth. Changes in tax-related laws and regulations, and interpretations thereof, can affect tax burdens by increasing tax rates and fees, creating new taxes, limiting tax deductions, and eliminating tax-based incentives and non-taxed income. In addition, tax authorities and tax courts may interpret tax regulations differently than we do, which could result in tax litigation and associated costs and penalties. For Colombian income tax purposes and, as a general rule, dividends that are distributed from profits taxed at the corporate level are not taxed or subject to withholding tax at the shareholder level. Tax treaty rules might also apply on dividend distributions when a shareholder is a resident in a country that has executed a tax treaty with Colombia. However, this tax treatment may change in the future, and any change could have an adverse effect on our results of operations and financial condition.
| ITEM 4. | Information on the Company |
The Company
We are a vertically integrated oil company with presence in Colombia, Peru, Brazil and the U.S. Gulf Coast. We divide our operations into four business segments: exploration and production; transportation and logistics; refining and petrochemicals; and marketing and supply. We are the largest corporation in Colombia, as measured by revenues, profits, assets, shareholders’ equity, sales, net income and net worth, and we play a key role in the local hydrocarbon market. Our operation does not include natural gas transportation activities due to legal restrictions.
Corporate History
Ecopetrol is a mixed economy company, incorporated on August 25, 1951, and existing under the laws of Colombia. We have an unlimited term of duration. Our legal name is Ecopetrol S.A. Our principal executive offices are located at Carrera 13 No. 36-24 Bogota, Colombia and our telephone number is +571 234 4000.
In 1951, we were incorporated as the Empresa Colombiana de Petróleos as a result of the reversion of the De Mares concession to the Government by the Tropical Oil Company. We began our operations as a governmental industrial and commercial company, responsible for administering Colombia’s hydrocarbon resources. In the same year, we began operating the crude oil fields at La Cira-Infantas and the pipeline that connected that field with the Barrancabermeja refinery and the port of Cartagena. Three years later, the first national seismic study was performed under the De Mares concession which led to the discovery of the Llanito crude oil field in 1960.
In 1961, we assumed the direct operation of the Barrancabermeja refinery and continued its transformation into an industrial complex. International Petroleum Colombia Limited or Intercol began the construction of a new facility in Mamonal, Cartagena, where the pipeline terminal of the Andean National Corporation was already located and which also included a loading port. In December 1957, the Cartagena refinery began operations, and in 1974 it was acquired by us.
In 1970, we adopted our first bylaws that transformed us into a governmental industrial and commercial company, linked to the Ministry of Mines and Energy. Decree Law 1760 of 2003 renamed us Ecopetrol S.A. and transformed us from an industrial and commercial company into a state-owned corporation by shares linked to the Ministry of Mines and Energy, in order to make us more competitive. Prior to our reorganization our capital expenditures program and access to the credit markets were limited by the Government, which was making its decisions based on its budgetary needs and not on our growth prospects.
We have been undergoing a two-step transformation process since 2003: (1) first, from a wholly state-owned entity to a state-owned entity characterized by shares, and then (2) to a mixed economy company, which incorporates private capital, pursuant to law 1118 of 2006, with the initial public offering in November 2007. This two-step process has resulted in a substantial change in the legal framework to which we are subject and in the nature of our relationship with the Nation.
In 2006, the Colombian Congress authorized us to issue up to 20% of our voting capital stock in Colombia, subject to the condition that the Nation control at least 80% of our voting capital stock. On November 13, 2007, we placed 4,087,723,771 shares in the BVC, trading under the symbol “ECOPETROL,” which resulted in 482,941 new shareholders and raised approximately Ps$5,723 billion for the sale of 10.1% of our capital stock. On September 30, 2011, we issued a total of 644,185,868 shares in an offering directed exclusively to investors in Colombia. Of the 219,054 investors participating in this offering, 73% were new stockholders. The aggregate proceeds of this offering were Ps$2.38 trillion. As a result of the two offerings made by us, the Nation currently controls 88.49% of our voting capital stock. Since September 18, 2008, our ADSs have been trading on the NYSE under the symbol “EC.” On December 4, 2009, our ADSs began trading on the Lima Stock Exchange under the symbol “EC.” Since March 16, 2011 our ADS’s were delisted from the Lima Stock Exchange. In addition, on August 13, 2010, our ADSs began trading on the Toronto Stock Exchange under the symbol “ECP.” Each ADS represents 20 common shares of the Company.
The following table sets forth our recent material acquisitions and the effective date as of which each has been reflected in our operating results.
| Company | | | Date | | | Participation
acquired in
transaction | | | Sector | | | Price (US$)(1) |
| Polipropileno del Caribe S.A. (Propilco) | | | April 2008 | | | 100% | | | Petrochemicals | | | 691 million |
| Offshore International Group Inc. (OIG) | | | February 2009 | | | 50%(2) | | | Exploration and Production | | | 639 million |
| Oleoducto Central S.A. (Ocensa) | | | March 2009 | | | 24.7%(3) | | | Transportation | | | 418 million |
| Hocol Petroleum Limited | | | March 2009 | | | 100%(4) | | | Exploration and Production | | | 807 million |
| Refinería de Cartagena S.A. (Reficar) | | | May 2009 | | | 51%(5) | | | Refining | | | 545 million |
| Equion Energia Limited | | | January 2011 | | | 51%(6) | | | Exploration and Production | | | 814 million |
| (1) | Includes amounts of adjustment on transaction prices. |
| (2) | U.S. parent of Savía Perú (formerly Petrotech Peruana S.A.). |
| (3) | As a result of this transaction, our ownership of Ocensa increased to 60%. |
| (4) | We acquired 100% of Maurel et Prom’s interest in Hocol Petroleum Limited, whose most important assets are Hocol S.A. and Homcol Cayman Inc. As a result of the acquisition, our ownership in Oleoducto de Colombia, increased from 43.85% to 65.57%. |
| (5) | As a result of this transaction, we became the sole owner of Reficar. |
| (6) | As a result of this acquisition, our ownership increased to 72.65% in Ocensa, 73.00% in ODC, and to 85.12% in Oleoducto del Alto Magdalena or OAM. We also obtained a 10.2% interest in Transgas de Occidente. |
In August 2010, we incorporated Oleoducto Bicentenario de Colombia S.A.S., or Oleoducto Bicentenario, a new company to build and operate a private pipeline that will run from the Casanare Department to the port of Coveñas. The new pipeline is linked to facilitate oil exports from the Llanos region. We have, indirectly, a 55.97% ownership of the company and five other shareholders own the remaining 44.03%.
The transactions described above were funded mainly through cash on hand and cash flow from our operations.
In January 2011, we increased our participation in Invercolsa S.A., a holding company with investments in natural gas transportation and distribution companies in Colombia, to 43.35% based on a final judgment of a court, which ordered the defendant, who had been the legal representative of Invercolsa, to return to us approximately 145 million shares of Invercolsa, which he had illegally bought in 1997 as part of the divestment of natural gas investments belonging to us.
In June 2012, we incorporated Cenit as our wholly-owned subsidiary. In October, 2012, we transferred all of our direct interests in Ocensa, ODC, Oleoducto Bicentenario, ODL and Serviport to Cenit and in April 2013, we transferred our crude oil and products transportation assets to it. This new subsidiary performs all of our hydrocarbon transport activities, pursuant to transport agreements between Cenit, us and other producers and distributors in Colombia. We continue operating Cenit’s transportation infrastructure in accordance with an operation and maintenance agreement. See “Item 4. Overview by Business Segment—Transportation and Logistics—Cenit.”
In 2012, we undertook a process of reorganization, consisting of the following actions:
| · | On May 11, 2012, Ecopetrol Pipelines International (EPI) merged with Ecopetrol Transportation Company Limited (ETI) and Ecopetrol Transportation Investments Limited, with EPI as the surviving entity. |
| · | On July 12, 2012, Ecopetrol S.A. transferred to Ecopetrol Global Energy S.L.U. all of its shares in Ecopetrol America Inc. |
| · | On August 14, 2012, Ecopetrol S.A. transferred to Ecopetrol Global Energy S.L.U. all of its shares in Ecopetrol del Perú S.A. |
| · | On November 2, 2012, Equión Energía, in which we have a 51% interest, transferred 12.648% of its shares in Oleoducto Central S.A. (“Ocensa”) to Ecopetrol Equity Investments (Cayman), a wholly-owned subsidiary of Ecopetrol S.A. |
| · | On December 11, 2012, Ecopetrol S.A. transferred to Ecopetrol Global Energy S.L.U. all of its shares in Ecopetrol Oleo e Gas do Brasil. |
| · | On December 21, 2012, Ecopetrol Pipelines International (EPI) merged with Ecopetrol Oil & Gas Investments and Ecopetrol Equity Investments. |
| · | On December 27, 2012, Hocol S.A., or Hocol, merged with Hocol Limited and Homcol Cayman Inc., or Homcol. |
Significant Subsidiaries
We are a mixed economy company and have a number of subsidiaries both in Colombia and abroad. Our subsidiaries are either directly owned by us or indirectly owned by us through one or more of our other subsidiaries. As of March 31, 2013, there were 25 subsidiaries directly owned by us, nine of which were incorporated in Colombia and 16 were incorporated abroad, and 14 subsidiaries were indirectly owned by us. Some of our subsidiaries have subsidiaries of their own.
We do not have any significant subsidiaries as such term is defined under SEC Regulation S-X. The following table sets forth some of our subsidiaries, their respective countries of incorporation, our percentage ownership in each (both directly and indirectly through other subsidiaries) and our voting percentage in each as of March 31, 2013:
| COMPANY | | COUNTRY OF
INCORPORATION | | OWNERSHIP AND
VOTING % | |
| Exploration and Production | | | | | | |
| Ecopetrol Oleo e Gas do Brasil Ltda** | | Brazil | | | 100.00 | |
| Ecopetrol del Perú S.A.** | | Peru | | | 100.00 | |
| Ecopetrol America Inc.** | | United States | | | 100.00 | |
| Hocol Petroleum Limited | | Bermuda | | | 100.00 | |
| Equion Energía Limited | | United Kingdom | | | 51.00 | |
| Transportation | | | | | | |
| Oleoducto de los Llanos Orientales S.A. (ODL)** | | Panama | | | 65.00 | |
| Oleoducto de Colombia S.A.** | | Colombia | | | 73.00 | |
| Oleoducto Central S.A.** | | Colombia | | | 72.65 | |
| Oleoducto Bicentenario de Colombia S.A.S. (OBC) ** | | Colombia | | | 55.97 | |
| Cenit Transporte y Logística de Hidrocarburos S.A.S | | Colombia | | | 100.00 | |
| | | | | | | |
| Refining and Petrochemicals | | | | | | |
| Refinería de Cartagena S.A.* | | Colombia | | | 100.00 | |
| Propilco S.A.* | | Colombia | | | 100.00 | |
| Compounding and Masterbatching Industry Ltda. (COMAI)** | | Colombia | | | 100.00 | |
| Biofuels | | | | | | |
| Bioenergy S.A.** | | Colombia | | | 91.43 | |
| Other | | | | | | |
| Black Gold Re Ltd. | | Bermuda | | | 100.00 | |
* Direct and indirect participation.
** Solely indirect participation through other subsidiaries or affiliates.
See Exhibit 8.1 to this annual report for a complete list of our subsidiaries, their respective countries of incorporation, our percentage of ownership in each (both directly and indirectly through our other subsidiaries) and our voting ownership in each.
Strategic Plan
In 2010, we extended the scope of our strategic plan to 2020, which we updated in 2012, and which we refer to as our Strategic Plan. Our Strategic Plan considers Ecopetrol to be an integrated corporate group, composed of Ecopetrol S.A. and its subsidiaries and affiliates located in Colombia and abroad, focused on the exploration and development of crude oil, natural gas, petrochemicals and alternative fuels. We intend to develop as a key player and become one of the 30 main companies in the global oil industry, recognized for our international positioning, innovation and commitment to sustainable development.
We are committed to our goal of producing 1 million gross Clean Barrels of oil equivalent per day by 2015 and 1.3 million gross Clean Barrels of oil equivalent per day in 2020, aligned with our principal stakeholders in a sustainable way in three categories: economic, social and environmental, with an average return on capital employed, or ROCE, of 17%. We use the term “Clean Barrels” to refer to the production of crude oil barrels without accidents or environmental incidents and in harmony with our stakeholders. We continue approaching operational excellence as a commitment to work systematically in a healthy, clean and safe manner, maximizing the use of resources, striving to exceed our clients’ and interest groups’ expectations.
Our Strategic Plan contemplates investments of US$84.7 billion for the period 2012-2020 and US$75 billion between 2013 and 2020, to be allocated as follows:
Upstream: Investments in exploration and production are expected to be US$71 billion which corresponds to 84% of the total investment plan. Our operations in Colombia are expected to receive approximately 90% of our total investment in this segment. The additional 10% is expected to be destined to projects in the Gulf of Mexico and Brazil. Out of the US$71 billion, US$13 billion is expected to be invested in the exploration and development of new reserves. Furthermore, our implementation of the latest technology to accomplish a better recovery factor requires an investment of US$35 billion, which is expected to result in 3,400 million boe by 2020. Our development plan is mainly concentrated on certain current fields including: Castilla, Chichimene, Apiay, Casabe, La Cira-Infantas, Rubiales, Quifa, Putumayo, Arauca and Catatumbo. Incorporation of proved reserves (1P) of crude oil equivalent between 2011 - 2020 is estimated at 6,200 million gross barrels. The expected ROCE is 26%
Midstream and Downstream: We plan to make an investment in refining of US$9 billion for 2013–2020, which represents 11% of our Strategic Plan, to complete the modernization of the Cartagena and Barrancabermeja refineries. The ROCE is estimated at 8% for the period 2020 – 2025. We expect to invest US$4.5 billion in transportation and logistics in order to complete our network’s expansion, mainly through our participation in the Bicentenario Pipeline, the expansion of the Ocensa Pipeline, increasing the evacuation capacity from the Magdalena Medio crudes and the enlargement of the Pozos Colorados – Galán system. The ROCE is estimated at 11% by 2020.
The investments that our Strategic Plan envisions are subject to market analysis, conceptual engineering and financial feasibility. We currently expect to fund the investments contemplated by our Strategic Plan as follows: 75% from our cash generation from operations, 11% from a primary equity issuance and 14% from debt. We believe that we should be able to access local and international debt markets if the need arises, although we can make no assurances that these external sources of financing will be available on terms acceptable to us, if at all. See “Item 5. Operating and Financial Review and Prospects – Liquidity and Capital Resources.” We are also authorized by Law 1118 of 2006 to issue up to 20% of additional equity, of which we have so far issued 11.51%, leaving us with the ability to issue an additional 8.49%, which could be used as an additional source of funding for our Strategic Plan. In our Strategic Plan, we have adopted a conservative criteria that does not take into account the high prices on the market and long-term estimates about the West Texas Intermediate, or WTI, and Brent prices, whereby we used a fixed price of US$80 per barrel for WTI reference and $90 for Brent reference. We further assume and expect that the dividend payout ratio will be close to 70% which, compared to other global oil and gas companies, surpasses the average of between 35-50%. Our Strategic Plan assumes a profitability close to 17% of ROCE by 2020.
We expect to meet the goals of our Strategic Plan together with our joint venture partners with whom we have built long-term relationships. We are also working on making progress on our Strategic Plan with foreign governmental authorities in countries where we already have operations or where we intend to develop operations.
In addition, we maintain strategic initiatives with respect to each of our different segments, as outlined below.
Exploration and Production
Become an international player with the capacity to incorporate reserves and increase production of crude oil and natural gas in a sustainable way
We aim to develop a competitive advantage in heavy crudes, increasing our capacity to add reserves and produce oil and gas in a sustainable way. Our 2012 review of our Strategic Plan confirmed our assessment that we believe we have the potential to produce 1.3 gross million boepd by 2020 from our operations in Colombia and abroad. Furthermore, in the near term we plan to continue to focus on infill drilling and water injection projects and continue to develop the enhanced oil recovery technology. In 2012, capital expenditures amounted to Ps$8.2 trillion (approximately US$ 4.5 billion) in our Exploration and Production segment.
National Exploration: We expect to invest in 3D seismic and stratigraphic wells, as well as to explore prospects in other materials, especially in the heavy crude belt located in the Llanos, Caguan-Putumayo and Piedemonte Llanero regions. We believe there is a likelihood of finding oil and gas in the Caribbean offshore, especially in the north area. However, we expect offshore exploration in the Caribbean to contribute to production starting around 2020.
International Exploration: We continue to believe that the Gulf of Mexico and Brazil exhibit a high potential for exploration and production growth. In the Gulf of Mexico, we intend to focus on the following plays: Miocene subsalt, Paleogene and Jurassic. Ecopetrol is also seeking to balance the risk of its investment portfolio with short-term development projects. In Brazil, our focus is on the Santos and Ecuatorian borders as well as the Presal Plays.
Conventional Hydrocarbons: With higher certainty and a better understanding of the risks associated with this segment, production of conventional hydrocarbons could reach 1.1 gross million boepd by 2020. We have assessed potential improvements in our recovery factor, mainly through the use of infill drilling and water-injection methodologies which, we believe, have fewer associated risks and better economic results.
Unconventional Hydrocarbons: In our 2012 Strategic Plan, we gave more emphasis to the potential presented by unconventional reservoirs, as defined by the Colombian law, including shale oil, shale gas and tight reservoirs, among others.
Refining and Petrochemicals
Produce cleaner and more valuable products, ensuring profitability through synergies and taking advantage of market opportunities by adding greater value to the refining streams while increasing production of petrochemicals.
For 2012, capital expenditures in our Refining and Petrochemical segment were Ps$ 4.4 trillion (approximately US$2.4 billion).
Refining: We seek to be the competitive choice in Colombia for products supply, intending to meet a ROCE of 8% for the period 2020 – 2025. We aim to complete modernization projects at our refineries that encourage value creation and operational excellence with a particular focus on: (1) ensuring the completion of the projects at Barrancabermeja and Cartagena refineries, (2) developing our reputation as producer of clean fuels, and capitalizing and developing market opportunities within the local, regional and international markets, (3) becoming the preferred alternative for raw material supply within the petrochemical business, (4) growing sustainably and profitably by turning heavy crude oils into our competitive advantage, maximizing their worth in the chain and optimizing their performance to achieve the expected value of projects, (5) refining margin maximization by optimizing the integrated performance within the supply chain, and (6) finding opportunities to use raw materials, supplies and technologies that add value and align with the regulatory framework and business competitive development.
Petrochemical: Our strategy will focus on consolidating our current position in the market, and improving the competitiveness and reliability of our existing infrastructure, identifying feasible options for a cost-efficient operation, maximizing the margin of our petrochemicals through integrated performance optimization in our supply chain and seeking alternatives that allow us to guarantee the availability and logistics for competitive raw materials within the petrochemical industry.
Transportation and Logistics
Foster profitable growth and development across the entire value chain
Our strategy for transportation and logistics seeks to turn this sector into a facilitator for the development of the entire value chain, providing solutions, ensuring the efficiency of crude oil flows and their derivatives for use by our company and for third parties. During 2012, capital expenditures in our Transportation and Logistics segment amounted to Ps$ 2.7 trillion (approximately US$ 1.5 billion).
We aim to accomplish: (1) an increase in the total capacity of crude oil transportation by more than 100%, from 850 thousand to 1.7 million barrels per day, (2) an increase in the total capacity of refining products transportation by 65%, from 415 thousand to 680 thousand barrels per day, (3) diversification of our risks and investments through strategic alliances with system users and third parties, (4) development of our customer service for internal and external clients, (5) profitable growth with 11% ROCE by 2020 and (6) leveraging of our competitive advantage in heavy crude oil.
Create a new transportation subsidiary
In June 2012, we incorporated Cenit as a wholly-owned subsidiary specializing in logistics and transportation of hydrocarbons within Colombia. With the incorporation of Cenit, we aim to enhance the strategic and logistical framework of Colombia’s oil industry in response to the increase in hydrocarbon production and higher sales of crudes and refined products, both within Colombia and on the international markets. Cenit is expected to operate with an open model in which all interested parties will have the opportunity to access its transportation infrastructure. See “Item 4. Overview by Business Segment—Transportation and Logistics—Cenit.”
Marketing and Supply
Focus on the importance of the market and clients and define our key products and markets
Our Strategic Plan sets out guidelines for sales and marketing that cut across our operational areas and emphasizes the importance of defining our markets, our clients and the need to define key products. Our strategy is focused on supplying the local market and exporting crude oil, refined products, petrochemical products and natural gas to end-users, including refineries and wholesalers, in order to improve our margins. We also intend to increase our market participation in crude oil and refined products in Asia and Europe.
Develop and consolidate the Corporate Group’s basket of products through alternative energy
We intend to participate in the Colombian renewable energy market in partnership with local investors, with whom we have undertaken the development of refineries to process sugar cane and palm oil for biofuels. We plan to produce 450 thousand tons of biofuels by 2020 (including biodiesel from Ecodiesel Colombia S.A., or Ecodiesel, in which we have a 50% share, and ethanol from Bioenergy S.A.).
OVERVIEW BY BUSINESS SEGMENT
Exploration and Production
Summary
Our exploration and production business segment includes exploration, development and production activities in Colombia and abroad. We began local exploration in 1955 and international exploration in 2006. We conduct exploration and production activities directly and through joint ventures with third parties. As of December 31, 2012, we were the largest producer of crude oil and natural gas, the largest operator and we maintained the largest acreage under exploration in Colombia.
We have exploratory activities in all of the sedimentary basins that currently have activity in Colombia. The following map shows the basins where we conduct exploratory activities.
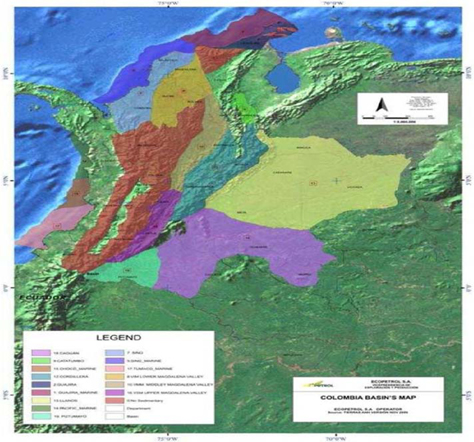
We have divided Ecopetrol S.A.’s production activities in Colombia into six administrative regions. The administrative regions, and their respective 2012 production results, prior to deducting royalties, are as follows:
Northeastern Region – The Northeastern region is comprised of two areas: one located in the north of Colombia along the Atlantic coast and the other located in the Piedemonte Llanero. The Northeastern region covers approximately 541,404 acres and includes the natural gas fields located at La Guajira and the crude oil and natural gas fields located in Cusiana-Cupiagua. In 2012, the Northeastern region had a total production of approximately 47.8 thousand bpd of crude oil, 548.1 million cubic feet per day or mcfpd of natural gas and 3.2 bpd of liquids from the natural gas process.
Mid-Magdalena Valley Region – The Mid-Magdalena Valley region runs along the Magdalena river valley and covers approximately 997,839 acres. It includes the crude oil fields located in the Santander department and part of the Antioquia, Cesar and Boyacá departments near the Barrancabermeja refinery. In 2012, the Mid-Magdalena Valley region had a total production of approximately 100.3 thousand bpd of heavy and light crude oil, 33.7 mcfpd of natural gas and 1.6 bpd of liquids from the natural gas process.
Central Region – For the year 2012 this region was divided in two: the Central Region and the Eastern Region. The Central region includes the western part of the Meta department. It covers approximately 74,264 acres and in 2012 had a total production of approximately 177.9 thousand bpd of heavy and medium crude oil, 0.5 mcfpd of natural gas and 1.5 bpd of liquids from the natural gas process.
Eastern Region – The Eastern region is located in Colombia’s central area and includes the northeastern and eastern part of the Meta department. While this administrative region was formally created in October 2011, it completed its first full year in operation at the end of 2012. Operations in this region are made up mainly of joint venture fields that originally belonged to the Central Region. It covers approximately 645,093 acres and in 2012 had a total production of approximately 130.4 thousand bpd of heavy and medium crude oil.
Catatumbo-Orinoquía Region – The Catatumbo-Orinoquía region is located in the eastern part of Colombia and runs along the border with Venezuela, covering approximately 1,197,310 acres. It includes the Caño Limón crude oil field, with a total production in 2012 of approximately 69.6 thousand bpd of crude oil, 2.6 mcfpd of natural gas and 0.04 bpd of liquids from the natural gas process.
Southern Region – The Southern region is located on the southwestern region of Colombia and covers approximately 917,781 acres. It includes the Orito, Guando and Tello and San Francisco fields located mainly in the Cundinamarca, Huila and Putumayo departments. In 2012, the Southern region had a total production of approximately 56.9 thousand bpd of crude oil, 5.9 mcfpd of natural gas and 0.5 bpd of liquids from the natural gas process.
In addition to the administrative regions mentioned above, we have established a minor fields area that covers some of our smaller fields throughout Colombia. The main purpose of this minor fields area is to establish strategies to improve efficiency in the production of reserves from these fields. The total production of the minor fields area during 2012 was 5.9 thousand bpd of crude oil and 3.3 mcfpd of natural gas. This production corresponds to fields located in the Mid-Magdalena Valley, Central, Catatumbo-Orinoquía and the Southern regions.
The map below indicates the location of our operations in Colombia.
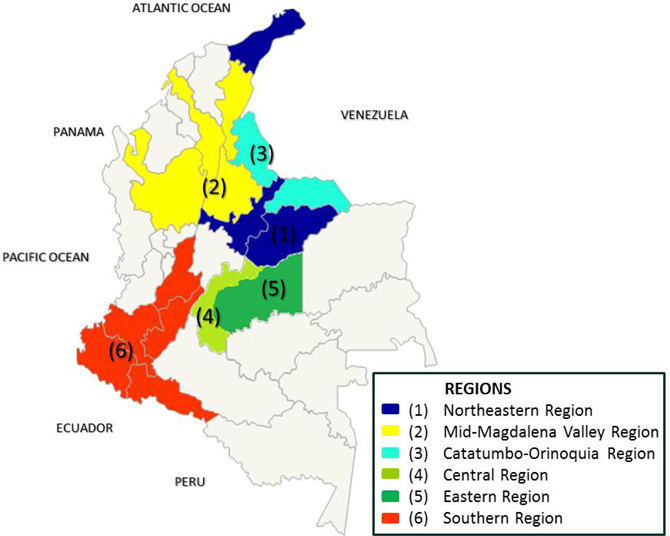
Exploration
Our exploration plan in Colombia is focused on exploration of existing production sites in close proximity, exploration of currently producing basins and exploration of frontier areas, including off-shore areas primarily operated by our business partners, which we believe have the potential for large findings. Our exploration strategy outside of Colombia is focused on locating prospects and establishing joint ventures with experienced operators.
During 2012, we drilled 23 gross wildcats exploratory wells (A3-A2), 15 in Colombia and eight overseas. A2 exploratory wells are drilled adjacent to and at deeper or at shallower depths than proven oil deposits in a productive oil field. We drill A3 exploratory wells to find oil deposits in fields where no wells have yet proven productive. We discovered hydrocarbon presence in 11 productive wells, of which nine are located in Colombia and two in the U.S. Gulf Coast. Ten wells were dry, of which five were located in Colombia and five overseas. As of December 31, 2012, two wells were under evaluation, of which one is located in Colombia and the remaining one in Brazil.
Exploration Activities in Colombia
We conduct exploration in Colombia on our own and through joint ventures with regional and global oil and gas companies. We also benefit from sole risk contracts when commercial reserves are found. In the case of sole risk contracts, we do not take any exploration risk. See “Contractual Arrangements for the Exploration and Production of Crude Oil and Natural Gas in Colombia.”
In 2012, we acquired 2,590 equivalent kilometers of seismic data in Colombia, including 935 equivalent kilometers acquired by Hocol. Ecopetrol S.A. acquired 1,655 equivalent kilometers, corresponding to 229.7 kilometers of 2D seismic and 1,425.7 equivalent kilometers of 3D seismic data. Ecopetrol directly acquired 748 of those kilometers of seismic and 907 kilometers were acquired by our business partners.
Ecopetrol S.A. drilled a total of seven wildcats exploratory wells (A3-A2) in 2012. Evidence of hydrocarbons was discovered in five of the wells (Tisquirama Este-1, Caronte, Aullador-1, Embrujo-1 ST-2 and Mapalé). One well was dry and the remaining were under evaluation. Hocol drilled eight A3 wells. Evidence of hydrocarbons was found in four of the Hocol wells (Pintado, Dorcas, Mamey and Merlín 6), while the other four were dry.
During 2012, Ecopetrol S.A. signed 12 exploration and production contracts with the ANH and business partners corresponding to blocks awarded to Ecopetrol S.A. in the Colombia Open Round 2012. These blocks cover a total area of more than four million hectares and are located in the Llanos (provinces of Arauca, Casanare and Meta), Mid-Magdalena Valley (Cundinamarca and Caldas provinces) and Sinu-San Jacinto (Antioquia and Cordoba provinces) basins, and the Guajira offshore field. Ecopetrol S.A. has a 100% stake in six of the contracts.
Exploration Activities Outside of Colombia
Our international exploration strategy is focused on participating in bidding rounds to secure blocks available for exploration and entering into joint ventures with international and regional oil companies. We believe exploring outside Colombia allows us to diversify our risks and improve the possibilities of increasing our crude oil and natural gas reserves.
In 2012, we drilled eight international gross exploratory wells through our subsidiaries and partners as follows:
| · | Brazil:During the second half of 2012, a concession in which Ecopetrol Brasil is a partner, drilled three wells. Ecopetrol Brasil thus acquired a 30% interest in the blocks BM-S-72 (the Sabiá prospect), BM-S-63 (the Canário prospect) and BM-S-71 (the Jandaia prospect), operated by Vanco (with a 40% working interest), Brasoil and Panoro (each with 15% working interest). As of December 31, 2012, Sabiá and Canário were declared dry and Jandaia was under evaluation. |
| · | Gulf of Mexico: Ecopetrol America drilled three wells in the Gulf of Mexico, two of which encountered hydrocarbons and one was declared dry. The Parmer well was drilled with our partners Apache Deepwater LLC, as operator, and Stone Energy Offshore LLC. Ecopetrol America has a 30% working interest in this well. The second discovery was the Dalmatian well, in which Ecopetrol America has a 30% working interest, drilled with our partner Murphy Exploration and Production Company, as operator. Ecopetrol America had a 30% working interest in the Candy Bars well, with our partner Statoil as operator, which was declared dry. |
| · | Peru: Savía Perú S.A., or Savía Perú, in which we have a 50% ownership interest, drilled two wells off the Peruvian coast. As of December 31, 2012, these wells showed presence of hydrocarbons but were commercially unsuccessful. |
As of December 31, 2012, we acquired 23,908 kilometers of additional seismic equivalent: 13,908 kilometers in the U.S. Gulf Coast and 10,000 kilometers in Brazil, an increase of 18.7% compared with seismic data as of December 31, 2011.
Exploratory Wells
The following table sets forth the number of gross and net productive and dry exploratory wells drilled by us and our joint venture partners, and the exploratory wells drilled by third parties under sole risk contracts for the years ended December 31, 2012, 2011 and 2010.
| | | For the year ended December 31, | |
| | | 2012 | | | 2011 | | | 2010 | |
| COLOMBIA | | | | | | | | | | | | |
| Ecopetrol | | | | | | | | | | | | |
| Gross Exploratory Wells | | | | | | | | | | | | |
| Owned and operated by Ecopetrol | | | | | | | | | | | | |
| Productive(1) | | | 4 | | | | 7 | | | | 2 | |
| Dry(2) | | | 1 | | | | 10 | | | | 4 | |
| Total | | | 5 | (3) | | | 17 | | | | 6 | |
| Operated by Partner in Joint Venture | | | | | | | | | | | | |
| Productive(1) | | | - | (4) | | | - | | | | 1 | |
| Dry(2) | | | - | | | | - | | | | 2 | |
| Total | | | - | | | | - | | | | 3 | |
| Operated by Ecopetrol in Joint Venture | | | | | | | | | | | | |
| Productive(1) | | | - | | | | 2 | | | | 3 | |
| Dry(2) | | | - | | | | 2 | | | | 1 | |
| Total | | | - | | | | 4 | | | | 4 | |
| Net Exploratory Wells(5) | | | | | | | | | | | | |
| Productive(1) | | | 3.3 | | | | 7.8 | | | | 3.2 | |
| Dry(2) | | | 2 | | | | 10.9 | | | | 5.6 | |
| Total | | | 5.3 | | | | 18.7 | | | | 8.8 | |
| Sole Risk(7) | | | | | | | | | | | | |
| Productive(1) | | | - | | | | 2 | | | | 7 | |
| Dry(2) | | | 1 | | | | 6 | | | | 11 | |
| Total | | | 1 | (6) | | | 8 | | | | 18 | |
| Hocol | | | | | | | | | | | | |
| Gross Exploratory Wells | | | | | | | | | | | | |
| Productive(1) | | | 4 | | | | 2 | | | | - | |
| Dry(2) | | | 4 | | | | 2 | | | | 9 | |
| Total | | | 8 | | | | 4 | | | | 9 | |
| Net Exploratory Wells(5) | | | | | | | | | | | | |
| Productive(1) | | | 3 | | | | 2 | | | | - | |
| Dry(2) | | | 4 | | | | 1.5 | | | | 5 | |
| Total | | | 7 | | | | 3.5 | | | | 5 | |
| Equion | | | | | | | | | | | | |
| Gross Exploratory Wells | | | | | | | | | | | | |
| Productive(1) | | | - | | | | - | | | | N/A | |
| Dry(2) | | | 1 | | | | - | | | | N/A | |
| Total | | | 1 | | | | - | | | | N/A | |
| Net Exploratory Wells(5) | | | | | | | | | | | | |
| Productive(1) | | | - | | | | - | | | | N/A | |
| Dry(2) | | | - | | | | - | | | | N/A | |
| Total | | | - | | | | - | | | | N/A | |
| INTERNATIONAL | | | | | | | | | | | | |
| Ecopetrol America Inc. | | | | | | | | | | | | |
| Gross Exploratory Wells | | | | | | | | | | | | |
| Productive(1)` | | | 2 | | | | 1 | | | | - | |
| Dry(2) | | | 1 | | | | 1 | | | | 3 | |
| Total | | | 3 | | | | 2 | | | | 3 | |
| Net Exploratory Wells(5) | | | | | | | | | | | | |
| Productive(1) | | | - | | | | 0.2 | | | | - | |
| Dry(2) | | | - | | | | 0.3 | | | | 0.9 | |
| Total | | | - | | | | 0.5 | | | | 0.9 | |
| Ecopetrol Oleo e Gas do Brasil | | | | | | | | | | | | |
| Gross Exploratory Wells | | | | | | | | | | | | |
| Productive(1) | | | - | | | | - | | | | 1 | |
| Dry(2) | | | 2 | | | | 2 | | | | 1 | |
| Total | | | 2 | (8) | | | 2 | | | | 2 | |
| Net Exploratory Wells(5) | | | | | | | | | | | | |
| Productive(1) | | | - | | | | - | | | | 0.5 | |
| Dry(2) | | | 1 | | | | 0.2 | | | | 0.3 | |
| Total | | | 1 | | | | 0.2 | | | | 0.8 | |
| Ecopetrol del Perú | | | | | | | | | | | | |
| Gross Exploratory Wells | | | | | | | | | | | | |
| Productive(1) | | | - | | | | - | | | | - | |
| Dry(2) | | | - | | | | - | | | | 1 | |
| Total | | | - | | | | - | | | | 1 | |
| Net Exploratory Wells(5) | | | | | | | | | | | | |
| Productive(1) | | | - | | | | - | | | | - | |
| Dry(2) | | | - | | | | - | | | | 0.3 | |
| Total | | | - | | | | - | | | | 0.3 | |
| Savía Perú | | | | | | | | | | | | |
| Gross Exploratory Wells | | | | | | | | | | | | |
| Productive(1) | | | - | | | | 5 | | | | 1 | |
| Dry(2) | | | 2 | | | | 1 | | | | - | |
| Total | | | 2 | | | | 6 | | | | 1 | |
| Net Exploratory Wells(5) | | | | | | | | | | | | |
| Productive(1) | | | - | | | | 3 | | | | 0.5 | |
| Dry(2) | | | 2 | | | | 0.5 | | | | - | |
| Total | | | 2 | | | | 3.5 | | | | 0.5 | |
| (1) | A productive well is an exploratory well that is not a dry well. |
| (2) | A dry well or hole is an exploratory well found to be incapable of producing either crude oil or natural gas in sufficient quantities to justify completion as a crude oil or natural gas well. |
| (3) | This number does not include one well under evaluation at December 31, 2012. |
| (4) | This number does not include the Mapale well which is included in Equion’s operation. |
| (5) | Net exploratory wells are calculated according to our percentage of ownership in these wells. |
| (6) | This number does not include two wells under evaluation at December 31, 2012. |
| (7) | We do not take any risk in sole risk contracts but we benefit from successful exploratory efforts. |
| (8) | This number does not include one well under evaluation at December 31, 2012. |
Production
As part of our Strategic Plan, we take into account the increase of the recovery factor in the fields currently held by Ecopetrol S.A., including those that were discovered more than 20 years ago. Our target is to invest in these fields in order to increase our average daily production of hydrocarbons and reserves. Around 88% of the fields of Ecopetrol S.A. are in primary recovery. Secondary recovery (waterflooding) is or has been implemented in 8% of the fields. Finally, tertiary or enhanced oil recovery has been applied in 4% of the fields. We continue to focus our efforts on improving the productivity ratio of several directly operated fields and other fields currently held through joint ventures with other oil companies. All figures for crude oil and natural gas production are shown prior to deducting royalties, except when specifically stated otherwise.
Our total average consolidated daily production of hydrocarbons in 2012, prior to deducting royalties, totaled 754 thousand boepd, of which 635 thousand bpd corresponded to crude oil and 119 thousand boepd corresponded to natural gas. This production includes the production contribution from our subsidiaries and affiliates, Hocol, Equion, Ecopetrol America Inc. and Savía Perú on the basis of our participation. Ecopetrol S.A.’s production amounted to 93.1% of total consolidated production, Hocol 3.3%, Equion 2.4%, Savía Perú 0.9% and Ecopetrol America 0.3%.
During 2012, we produced 745 thousand boepd in Colombia through Ecopetrol S.A., Hocol and Equion, out of which 627 thousand boepd corresponded to crude oil and 118 thousand boepd corresponded to natural gas.
During 2011, our consolidated average daily production of hydrocarbons totaled 724 thousand boepd, out of which 616 thousand bpd corresponded to crude oil and 108 thousand boepd corresponded to natural gas. In 2010, our consolidated average daily production of hydrocarbons totaled 616 thousand boepd, out of which 516 thousand bpd corresponded to crude oil and 100 thousand boepd corresponded to natural gas.
Ecopetrol S.A.’s crude oil production during 2012 consisted of approximately 48% light and medium crudes(above 15º American Petroleum Institute, or API, gravity) and 52% of heavy crudes, with a gravity equal or lower than API gravity 15°. In 2011, approximately 51% of the crude oil production corresponded to light and medium crudes while the remaining 49% to heavy crudes. During 2010, production distribution was approximately 56% of light and medium crudes and 44% of heavy crudes.
As of December 31, 2012, we were the largest participant in the Colombian hydrocarbons industry, with approximately 66% of crude oil production and approximately 58% of natural gas production. Our production volume in 2012 in Colombia includes Ecopetrol S.A. and Hocol’s production along with our share in Equion’s production.
We undertake development drilling in producing regions, drilling 210 gross development wells operated by us in Colombia in 2012, 27% less than in 2011 and 4% less than in 2010. Of the total gross development wells drilled by Ecopetrol S.A. and through joint ventures in 2012, 16 wells were dry in the Eastern Region, two in the minor fields, one in the Catatumbo Orinoquía Region, one in the Mid-Magdalena Valley Region and one was dry in the Southern Region. In 2011, Ecopetrol S.A. had seven dry development wells and in 2010 it had three.
Relevant Operational Activities
The following table sets forth the number of gross and net productive and dry development wells drilled exclusively by us and in joint ventures for the years ended December 31, 2012, 2011 and 2010.
| | | For the year ended December 31, | |
| | | 2012 | | | 2011 | | | 2010 | |
| COLOMBIA | | | | | | | | | | | | |
| Ecopetrol S.A. | | | | | | | | | | | | |
| Northeastern Region: | | | | | | | | | | | | |
| Gross wells owned and operated by Ecopetrol | | | - | | | | 2 | | | | - | |
| Gross wells in Joint Ventures | | | 6 | | | | 4 | | | | 4 | |
| Net Wells(1) | | | 3 | | | | 4 | | | | 3 | |
| Mid-Magdalena Valley Region: | | | | | | | | | | | | |
| Gross wells owned and operated by Ecopetrol | | | 46 | | | | 74 | | | | 50 | |
| Gross wells in Joint Ventures | | | 212 | | | | 314 | | | | 268 | |
| Net Wells(1) | | | 135 | | | | 233 | | | | 181 | |
| Central Region: | | | | | | | | | | | | |
| Gross wells owned and operated by Ecopetrol | | | 134 | | | | 170 | | | | 121 | |
| Gross wells in Joint Ventures | | | - | | | | 175 | | | | 189 | |
| Net Wells(1) | | | 134 | | | | 245 | | | | 207 | |
| Eastern Region(2): | | | | | | | | | | | | |
| Gross wells owned and operated by Ecopetrol | | | - | | | | N/A | | | | N/A | |
| Gross wells in Joint Ventures | | | 265 | | | | N/A | | | | N/A | |
| Net Wells(1) | | | 115 | | | | N/A | | | | N/A | |
| Catatumbo-Orinoquía Region: | | | | | | | | | | | | |
| Gross wells owned and operated by Ecopetrol | | | 1 | | | | 14 | | | | - | |
| Gross wells in Joint Ventures | | | 36 | | | | 44 | | | | 23 | |
| Net Wells(1) | | | 17 | | | | 34 | | | | 9 | |
| Southern Region: | | | | | | | | | | | | |
| Gross wells owned and operated by Ecopetrol | | | 1 | | | | 4 | | | | 12 | |
| Gross wells in Joint Ventures | | | 20 | | | | 21 | | | | 39 | |
| Net Wells(1) | | | 8 | | | | 11 | | | | 16 | |
| Minor Fields: | | | | | | | | | | | | |
| Gross wells owned and operated by Ecopetrol | | | - | | | | - | | | | - | |
| Gross wells in Joint Ventures | | | 2 | | | | 1 | | | | - | |
| Net Wells(1) | | | - | | | | 1 | | | | - | |
| Hocol | | | | | | | | | | | | |
| Gross wells owned and operated by Hocol | | | 25 | | | | 20 | | | | 36 | |
| Gross wells in Joint Ventures | | | 5 | | | | 10 | | | | 7 | |
| Net Wells(1) | | | 24 | | | | 23 | | | | 34 | |
| Equion | | | | | | | | | | | | |
| Gross wells owned and operated by Equion | | | 3 | | | | 2 | | | | N/A | |
| Gross wells in Joint Ventures | | | - | | | | - | | | | N/A | |
| Net Wells(1) | | | 2 | | | | 1 | | | | N/A | |
| Total Gross wells owned and operated in Colombia | | | 210 | | | | 286 | | | | 219 | |
| Total Gross wells in Joint Ventures in Colombia | | | 546 | | | | 569 | | | | 530 | |
| Total Net Wells (Colombia) | | | 438 | | | | 552 | | | | 450 | |
| INTERNATIONAL | | | | | | | | | | | | |
| Savía Perú | | | | | | | | | | | | |
| Gross wells | | | 18 | | | | 20 | | | | 14 | |
| Net Wells(1) | | | 9 | | | | 10 | | | | 7 | |
| Ecopetrol America Inc. | | | | | | | | | | | | |
| Gross wells | | | - | | | | - | | | | - | |
| Net Wells(1) | | | - | | | | - | | | | - | |
| Total Gross Wells (International) | | | 18 | | | | 20 | | | | 14 | |
| Total Net Wells (International) | | | 9 | | | | 10 | | | | 7 | |
| (1) | Net wells correspond to the sum of wells entirely owned by us and our ownership percentage of wells owned in joint ventures with our partners. |
| (2) | The Eastern region is included for 2012, the first full year in which it operated its fields after its creation in October 2011. |
Production Activities in Colombia
Our average daily production of crude oil in Colombia reached 627 thousand bpd in 2012, a 2.9% increase compared to 2011. The increase in our average daily production is due to a 7.7% increase in production from fields operated by us, which totaled 349 thousand bpd in 2012 compared to 324 thousand bpd in 2011.
During 2011, we had an average daily production of crude oil of 609 thousand bpd of crude oil, which represents a 19.9% growth compared to 2010. This increase was due to (1) a 19.7% increase in production from fields developed with our business partners, which totaled 285 thousand bpd in 2011 from 238 thousand bpd in 2010, and (2) a 20.0% increase in production from fields operated by us, for a total of 324 thousand bpd in 2011 compared to 270 thousand bpd in 2010.
The following table sets forth our average daily crude oil production, prior to deducting royalties, for the years ended December 31, 2012, 2011 and 2010.
| | | For the Year ended December 31 | |
| | | 2012 | | | 2011 | | | 2010 | |
| | | (thousand bpd) | |
| COLOMBIA | | | | | | | | | | | | |
| Ecopetrol | | | | | | | | | | | | |
| Northeastern region: | | | | | | | | | | | | |
| Joint venture operation | | | 27 | | | | 24 | | | | 29 | |
| Direct operation | | | 21 | | | | 23 | | | | 12 | |
| Total Northeastern region | | | 48 | | | | 47 | | | | 41 | |
| Mid-Magdalena Valley region: | | | | | | | | | | | | |
| Joint venture operation | | | 22 | | | | 21 | | | | 19 | |
| Direct operation | | | 79 | | | | 74 | | | | 65 | |
| Total Mid-Magdalena Valley region | | | 100 | | | | 95 | | | | 84 | |
| Central region: | | | | | | | | | | | | |
| Joint venture operation | | | - | | | | 120 | | | | 78 | |
| Direct operation | | | 178 | | | | 165 | | | | 140 | |
| Total Central region | | | 178 | | | | 285 | | | | 219 | |
| Eastern region(1): | | | | | | | | | | | | |
| Joint venture operation | | | 130 | | | | N/A | | | | N/A | |
| Direct operation | | | - | | | | N/A | | | | N/A | |
| Total Eastern region | | | 130 | | | | N/A | | | | N/A | |
| Catatumbo-Orinoquía region: | | | | | | | | | | | | |
| Joint venture operation | | | 66 | | | | 77 | | | | 60 | |
| Direct operation | | | 4 | | | | 4 | | | | 3 | |
| Total Catatumbo-Orinoquia region | | | 70 | | | | 81 | | | | 63 | |
| Southern region: | | | | | | | | | | | | |
| Joint venture operation | | | 25 | | | | 33 | | | | 36 | |
| Direct operation | | | 32 | | | | 24 | | | | 27 | |
| Total Southern region | | | 57 | | | | 57 | | | | 62 | |
| Minor Fields: | | | | | | | | | | | | |
| Joint venture operation | | | 4 | | | | 6 | | | | 12 | |
| Direct operation | | | 2 | | | | - | | | | 1 | |
| Total Minor Fields | | | 6 | | | | 6 | | | | 13 | |
| Hocol | | | | | | | | | | | | |
| Joint venture operation | | | 3 | | | | 4 | | | | 4 | |
| Direct operation | | | 22 | | | | 26 | | | | 22 | |
| Total Hocol | | | 25 | | | | 30 | | | | 26 | |
| Equion | | | | | | | | | | | | |
| Joint venture operation | | | - | | | | - | | | | N/A | |
| Direct operation | | | 11 | | | | 8 | | | | N/A | |
| Total Equion | | | 11 | | | | 8 | | | | N/A | |
| Production Tests | | | 2.1 | | | | 0.4 | | | | 0.2 | |
| Total Average Daily Crude Oil Production (Colombia) | | | 627 | | | | 609 | | | | 508 | |
| INTERNATIONAL | | | | | | | | | | | | |
| Savía Perú | | | 6 | | | | 6 | | | | 6 | |
| Ecopetrol America Inc. | | | 2 | | | | 2 | | | | 2 | |
| Total Average Daily Crude Oil Production (International) | | | 8 | | | | 8 | | | | 8 | |
| TOTAL AVERAGE DAILY CRUDE OIL PRODUCTION | | | 635 | | | | 616 | | | | 516 | |
| (1) | The Eastern region is included for 2012, the first full year in which it operated its fields after its creation in 2011. |
The following table sets forth our developed and undeveloped gross and net acreage of crude oil and natural gas production by region for the year ended December 31, 2012.
| | | Production Acreage at December 31, 2012 | | | Average crude
oil and natural
gas production
for the year
ended
December 31,
2012(1) | |
| | | Developed | | | Undeveloped | | | (thousands
| |
| | | Gross | | | Net | | | Gross | | | Net | | | boepd) | |
| | | (in acres) | | | | |
| COLOMBIA | | | | | | | | | | | | | | | | | | | | |
| Ecopetrol | | | | | | | | | | | | | | | | | | | | |
| Northeastern region | | | 81,552 | | | | 51,007 | | | | 459,852 | | | | 361,321 | | | | 147 | |
| Mid-Magdalena Valley region | | | 52,813 | | | | 39,360 | | | | 945,026 | | | | 847,112 | | | | 108 | |
| Central region | | | 16,640 | | | | 16,640 | | | | 57,624 | | | | 57,624 | | | | 179 | |
| Eastern region | | | 72,155 | | | | 48,906 | | | | 572,938 | | | | 277,703 | | | | 130 | |
| Catatumbo-Orinoquía region | | | 51,668 | | | | 41,818 | | | | 1,145,642 | | | | 693,659 | | | | 70 | |
| Southern region | | | 45,122 | | | | 33,786 | | | | 872,659 | | | | 628,997 | | | | 58 | |
| Minor Fields | | | 8,538 | | | | 7,440 | | | | 444,455 | | | | 284,131 | | | | 7 | |
| Hocol | | | 4,238 | | | | 3,707 | | | | 735 | | | | 583 | | | | 25 | |
| Equion | | | 19,436 | | | | 7,430 | | | | 890,717 | | | | 353,354 | | | | 18 | |
| Total (Colombia) | | | 352,162 | | | | 250,094 | | | | 5,389,648 | | | | 3,504,484 | | | | 742 | |
| INTERNATIONAL | | | | | | | | | | | | | | | | | | | | |
| Savía Perú | | | 80,205 | | | | 80,205 | | | | 5,575 | | | | 5,575 | | | | 6 | |
| Ecopetrol America Inc.(2) | | | 20,880 | | | | 1,925 | | | | 28,800 | | | | 7,443 | | | | 2 | |
| Total (International) | | | 101,085 | | | | 82,130 | | | | 34,375 | | | | 13,018 | | | | 9 | |
| Total | | | 453,247 | | | | 332,224 | | | | 5,424,023 | | | | 3,517,502 | | | | 751 | |
| (1) | Does not include 2.1 thousand bpd of production from exploratory activities. |
| (2) | Production and acreage from Ecopetrol America Inc. is related to the K2 field lease contracts in the Gulf of Mexico. There are five lease contracts, four of which are in the production stage and do not have expiration dates, while one is an exploratory lease that expires on June 30, 2016. For the Dalmatian production acreage four leases are included as undeveloped acreage until production starts. These leases do not have expiration date. |
The following table sets forth our total gross and net productive wells by region for the year ended December 31, 2012.
| | | At December 31, 2012 | |
| | | Crude Oil | | | Natural Gas | |
| | | Gross | | | Net | | | Gross | | | Net | |
| COLOMBIA | | | | | | | | | | | | | | | | |
| Ecopetrol | | | | | | | | | | | | | | | | |
| Northeastern region | | | 76 | | | | 59 | | | | 26 | | | | 15 | |
| Mid-Magdalena Valley region | | | 3,165 | | | | 2,145 | | | | 10 | | | | 10 | |
| Central region | | | 520 | | | | 520 | | | | - | | | | - | |
| Eastern region | | | 705 | | | | 296 | | | | - | | | | - | |
| Catatumbo-Orinoquía region | | | 649 | | | | 389 | | | | - | | | | - | |
| Southern region | | | 845 | | | | 556 | | | | 3 | | | | 2 | |
| Minor fields | | | 187 | | | | 121 | | | | 4 | | | | 2 | |
| Hocol | | | 197 | | | | 115 | | | | 2 | | | | 1 | |
| Equion | | | 38 | | | | 11 | | | | - | | | | - | |
| Total (Colombia) | | | 6,382 | | | | 4,212 | | | | 45 | | | | 30 | |
| INTERNATIONAL | | | | | | | | | | | | | | | | |
| Savía Perú | | | 641 | | | | 321 | | | | - | | | | - | |
| Ecopetrol America Inc. | | | 7 | | | | 1 | | | | - | | | | - | |
| Total (International) | | | 648 | | | | 321 | | | | - | | | | - | |
| Total | | | 7,030 | | | | 4,533 | | | | 45 | | | | 30 | |
We consider as crude oil wells those which main operation is directed towards oil production, although many of these wells produce gas associated with oil production that, in some cases, have a commercial purpose. Natural gas wells are those which operations are directed only towards production of commercial gas. The above table reflects the productive wells that directly contribute to hydrocarbons production, and therefore excludes wells used for injection, disposal, captation, or other similar activities.
Crude Oil
Volume of Crude Oil Purchased
The table below sets forth the volumes of crude oil purchased from our business partners and third parties and volumes of crude oil purchased from the ANH corresponding to royalties that have been received by the ANH in-kind from producers for the years ended December 31, 2012, 2011 and 2010.
| | | For the year ended December 31, | |
| | | 2012 | | | 2011 | | | 2010 | |
| | | (million barrels) | |
| Ecopetrol | | | | | | | | | | | | |
| Crude oil purchased from the ANH | | | 48.0 | | | | 46.7 | | | | 40.5 | |
| Crude oil purchased from our business partners and third parties | | | 25.4 | | | | 22.8 | | | | 23.1 | |
| Hocol | | | | | | | | | | | | |
| Crude oil purchased from our business partners and third parties | | | 10.8 | | | | 10.3 | | | | 9.1 | |
| Equion | | | | | | | | | | | | |
| Crude oil purchased from our business partners and third parties | | | 3.5 | | | | 4.4 | | | | N/A | |
| Total(1) | | | 87.7 | | | | 84.2 | | | | 72.7 | |
| (1) | Purchases of crude oil from the ANH and our business partners are allocated to our Marketing and Supply segment. |
Light Crude Oil
Light crude oil has API gravity 35° or higher and tends to have a higher sales price in the international market. We develop and produce light crude oil in the Cusiana, Cupiagua, Pauto, Floreña and Rancho Hermoso fields. During 2012, 2011 and 2010, Ecopetrol S.A.’s production of light crude oil (on a stand-alone basis) was 60 thousand, 61 thousand and 48 thousand bpd, respectively.
Heavy Crude Oil
We consider heavy crudes as those with API gravity below 15°. Ecopetrol S.A. (on a stand-alone basis) develops, upgrades and produces heavy crude in the Central, Eastern and Mid-Magdalena Valley regions. Ecopetrol S.A.’s production of heavy crude oil increased from 24 thousand bpd in 2000 to 304 thousand bpd in 2012 and production from 2011 to 2012 increased 9.1% as a result of the development of the Rubiales, Castilla and Chichimene fields.In 2011, Ecopetrol S.A.’s production of heavy crudes amounted to 278 thousand bpd, compared to 210 thousand bpd produced in 2010, mainly as a result of the development of the same fields. We are committed to developing our heavy crude reserves as they are a key element of our growth strategy.
Our most important heavy crude oil projects are:
| · | Cubarral. The Cubarral block is located in the Central region and is comprised of the Castilla and Chichimene fields. Together, these fields in 2012 produced approximately 156 thousand bpd, a 9.9% increase compared with 2011 production. |
| · | Rubiales - Quifa. The Rubiales and Quifa fields are located in the Eastern region and are developed in joint venture with Metapetroleum. The Rubiales and Quifa fields increased our production from 113.2 thousand bpd in 2011 to 124.9 thousand bpd in 2012. In 2011, we, along with Pacific Rubiales Energy Corp., started the Synchronized Thermal Additional Recovery, or STAR, technology pilot project in the Quifa field to begin testing the use ofin situ combustion-based technology which is expected to increase the recovery factor in Colombia’s heavy oil fields. |
Natural Gas
In 2012, our average daily production of natural gas in Colombia reached 118 thousand boepd, a 9.3% increase when compared to 2011 production. When compared to 2010, natural gas production increased by 9.1% in 2011.
The following table sets forth our average daily natural gas production, prior to deducting royalties, for the years ended December 31, 2012, 2011 and 2010. The volume of liquids from the natural gas process is included since 2012.
| | | For the year ended December 31, | |
| | | 2012 | | | 2011 | | | 2010 | |
| | | (Thousand boepd)(1) | |
| COLOMBIA | | | | | | | | | | | | |
| Ecopetrol | | | | | | | | | | | | |
| Northeastern region: | | | | | | | | | | | | |
| Joint Venture | | | 94 | | | | 94 | | | | 92 | |
| Direct Operation | | | 5 | | | | - | | | | - | |
| Total Northeastern region | | | 99 | | | | 95 | | | | 92 | |
| Mid-Magdalena Valley region: | | | | | | | | | | | | |
| Joint Venture | | | 1 | | | | 1 | | | | 1 | |
| Direct Operation | | | 6 | | | | 3 | | | | 3 | |
| Total Mid-Magdalena Valley region | | | 8 | | | | 4 | | | | 4 | |
| Central region: | | | | | | | | | | | | |
| Joint Venture | | | - | | | | - | | | | - | |
| Direct Operation | | | 2 | | | | - | | | | - | |
| Total Central region | | | 2 | | | | - | | | | - | |
| Eastern region(2): | | | | | | | | | | | | |
| Joint Venture | | | - | | | | - | | | | - | |
| Direct Operation | | | - | | | | - | | | | - | |
| Total Eastern region | | | - | | | | - | | | | - | |
| Catatumbo-Orinoquía region: | | | | | | | | | | | | |
| Joint Venture | | | - | | | | - | | | | - | |
| Direct Operation | | | - | | | | - | | | | - | |
| Total Catatumbo-Orinoquía region | | | - | | | | - | | | | - | |
| Southern region: | | | | | | | | | | | | |
| Joint Venture | | | - | | | | - | | | | 1 | |
| Direct Operation | | | 1 | | | | 1 | | | | - | |
| Total Southern region | | | 1 | | | | 1 | | | | 1 | |
| Minor Fields: | | | | | | | | | | | | |
| Joint venture operation | | | - | | | | 1 | | | | 1 | |
| Direct operation | | | - | | | | - | | | | - | |
| Total Minor Fields | | | 1 | | | | 1 | | | | 1 | |
| Hocol | | | | | | | | | | | | |
| Joint venture operation | | | - | | | | - | | | | - | |
| Direct operation | | | - | | | | - | | | | 1 | |
| Total Hocol | | | - | | | | - | | | | 1 | |
| Equion(3) | | | | | | | | | | | | |
| Joint venture operation | | | - | | | | - | | | | N/A | |
| Direct operation | | | 7 | | | | 6 | | | | N/A | |
| Total Equion | | | 7 | | | | 6 | | | | N/A | |
| Production Tests | | | - | | | | - | | | | - | |
| Total Natural Gas Production (Colombia) | | | 118 | | | | 108 | | | | 99 | |
| INTERNATIONAL | | | | | | | | | | | | |
| Savía Perú | | | 1 | | | | 1 | | | | 1 | |
| Ecopetrol America Inc. | | | - | | | | - | | | | - | |
| Total Natural Gas Production (International) | | | 1 | | | | 1 | | | | 1 | |
| Total Natural Gas Production | | | 119 | | | | 109 | | | | 100 | |
| (1) | Conversion between mcfpd and boepd is performed at 5,700 mcfpd to 1 boepd. |
| (2) | The Eastern region is included for 2012, the first full year in which it operated its fields after its creation in 2011. |
| (3) | Equion production figures correspond to its equivalent daily productions since its month of acquisition. |
Northeastern Region
The largest production of natural gas in Colombia is located in the Northeastern region, which we develop primarily under joint venture contracts. We developed the Guajira natural gas reserves with our partner Chevron. The Cusiana reserve is developed along with Equion and Total. Additionally, Ecopetrol S.A. directly operated the reserves in the Cupiagua field.
Natural gas production in the Northeastern region averaged 548.1 mcfpd and 3.2 bpd of liquids from the natural gas process in 2012. The natural gas produced from these fields is used to supply local demand and to meet our commitments to supply natural gas to Venezuela. See “—Marketing and Supply—Natural Gas Distribution.” We continue re-injection of natural gas in the Cusiana field. This production outcome was leveraged by Chuchupa and Ballena assets operated by Chevron, which represented a production of 339.0 mcfpd in 2012 and 363.3 mcfpd in 2011.
Lifting and Production Costs
Our consolidated average production costs on a Peso basis increased to Ps$23,088 during 2012 from Ps$21,605 during 2011 and Ps$18,940 during 2010, mainly due to: (1) increased costs from joint ventures, related to higher volumes of water production and related disposal costs, (2) high-price clauses in our joint venture agreements, which assign additional production to us when oil prices are higher than a reference price (the “High-Price Clauses”), (3) a 2.62% increase in production volumes and (4) an increase in direct operation costs. Our consolidated average lifting costs on a dollar basis increased to US$11.93 in 2012 from US$10.43 in 2011 and US$9.83 in 2010, as a result of the above-mentioned factors and a 2.7% appreciation of the average exchange rate of the Peso against the U.S. dollar.
Our consolidated average lifting costs differ from our consolidated average production costs because our lifting costs do not include costs related to self-consumption of hydrocarbons included in the production process, such as by our small refineries and natural gas liquid plants.
The following table sets forth our crude oil and natural gas average sales price, aggregate average lifting costs and aggregate average unit production costs for the years ended December 31, 2012, 2011 and 2010.
| | | For the year ended December 31, | |
| | | 2012 | | | 2011 | | | 2010 | |
| Crude Oil Average Sales Price | | | | | | | | | | | | |
| (U.S. dollars per barrel)(1) | | | 103.47 | | | | 99.30 | | | | 72.42 | |
| Crude Oil Average Sales Price | | | | | | | | | | | | |
| (Ps$per barrel)(1) | | | 186,004 | | | | 183,514 | | | | 137,493 | |
| Natural Gas Average Sales Price | | | | | | | | | | | | |
| (U.S. dollars per thousand cf) | | | 5.53 | | | | 4.62 | | | | 3.42 | |
| Natural Gas Average Sales Price | | | | | | | | | | | | |
| (Ps$per thousand cf) | | | 9,944 | | | | 8,534 | | | | 6,487 | |
| Aggregate Average Unit Production Costs | | | | | | | | | | | | |
| (U.S. dollars per boe)(2) | | | 12.84 | | | | 11.70 | | | | 9.98 | |
| Aggregate Average Unit Production Cost | | | | | | | | | | | | |
| (Ps$per boe)(2) | | | 23,088 | | | | 21,605 | | | | 18,940 | |
| Aggregate Average Lifting Costs | | | | | | | | | | | | |
| (U.S. dollars per boe)(3)(4) | | | 11.93 | | | | 10.43 | | | | 9.83 | |
| Aggregate Average Lifting Costs | | | | | | | | | | | | |
| (Ps$per boe)(3)(4) | | | 21,441 | | | | 19,266 | | | | 18,652 | |
| (1) | Corresponds to our average sales price on a consolidated basis. |
| (2) | Unit production costs correspond to consolidated average costs on total production volumes net of royalties. Production costs do not include costs related to transport, commercialization and administrative expenses. |
| (3) | Lifting costs per barrel are calculated based on total production, which are net of royalties, and correspond to our lifting costs on a consolidated basis. |
| (4) | We calculate aggregate average lifting cost by taking our production cost and dividing it by our produced volumes net of royalties as the denominator. |
Reserves
Our proved reserves of crude oil and natural gas, net of royalties to the Nation, at December 31 2012, totaled 1,876.7 million boe, which represents a 1.1% increase from the 1,856.7 million boe registered in 2011. Our crude oil proved reserves in 2012 were 1,370.3 million barrels of crude oil and, in 2011, 1,371.0 million barrels. Our natural gas proved reserves increased to 2,886 billion cubic feet, or bcf, from 2,768 bcf of reserves in 2011. In 2011, our proved reserves increased 8% from the 1,714 million boe registered in 2010. The increase in our reserves in 2012 is mainly due to (1) a 44.2 million boe increase corresponding to revisions of previous estimates, (2) a 65.3 million boe increase corresponding to improved recovery, (3) a 142.8 million boe increase corresponding to extensions and discoveries and (4) a 232.4 million boe decrease corresponding to production.
Hydrocarbon reserves were calculated in accordance with SEC regulations and the requirements of the Financial Accounting Standards Board, or FASB. Ecopetrol’s reserves process is supervised and coordinated by the Director of Reserves, who reports to the Chief Financial Officer. The Reserves Directorate is comprised of reserves coordinators, who are petroleum engineers with experience of more than 15 years in reservoir characterization, field development, estimation and reporting of reserves and that have supervision and supporting responsibilities with the professionals involved in the estimation and reporting process.
Reserves are first estimated internally. This process is supervised and coordinated by the corporate manager of reservoirs, a geologist who holds a master’s degree in geology and has more than 20 years of experience in projects associated with reservoir characterization and development, estimation, and reporting of reserves. The employees involved in the reserves process meet the Society of Petroleum Engineers, or SPE, qualifications for reserves estimators. Internally estimated reserves are submitted to an external audit process, which was conducted by the External Engineers (Ryder Scott, DeGolyer and MacNaughton and Gaffney, Cline & Associates). These firms have audited 99% of our total net proved reserves for 2012, 2011, and 2010. According to our corporate policy, we report the reserves values obtained from the External Engineers.
The reserves process ends when the Reserves Directorate consolidates the results and presents them to the Reserves Committee, whose members are the Chief Financial Officer, the Exploration and Production Executive Vice-President and the Vice-President of Strategy. Results are presented to the Audit Committee of the Board of Directors and finally approved by the Board of Directors.
The audit process was conducted in accordance with SEC definitions and rules set forth in Rule 4-10(a) of Regulation S-X and the disclosure guidelines contained in the SEC’sModernization of Oil and Gas Reporting final rule dated December 31, 2008 and effective as of January 1, 2010. The information presented below and elsewhere in this annual report is based on an external audit of 99% of our total reserves, prepared by the External Engineers under SEC definitions and rules. The remaining 1% corresponds to our own internal calculations, conducted using SEC definitions and rules, as described above. Our crude oil and natural gas net proved reserves include reserves from our subsidiaries located in the United States (Gulf of Mexico) and Peru, and Equión and Hocol’s assets in Colombia.
The reserves information presented in this section is based on the SEC’s definitions and rules used for U.S. GAAP purposes. See “Item 5. Operating and Financial Review and Prospects—Critical Accounting Policies and Estimates—Oil and Gas Reserves” and Note 35 to our consolidated financial statements.
The following table sets forth our estimated net proved reserves (developed and undeveloped) of crude oil and gas for the years ended December 31, 2012, 2011 and 2010.
| | | At December 31, | |
| | | 2012 | | | 2011 | | | 2010 | |
| | | Crude Oil
(million
barrels) | | | Gas (bcf) | | | Crude Oil
(million
barrels) | | | Gas (bcf) | | | Crude Oil
(million
barrels) | | | Gas (bcf) | |
| PROVED DEVELOPED RESERVES | | | | | | | | | | | | | | | | | | | | | | | | |
| | | | | | | | | | | | | | | | | | | | | | | | | |
| Total (Colombia) | | | 922.4 | | | | 2,523.6 | | | | 840.4 | | | | 2,206.1 | | | | 780.7 | | | | 2,234.6 | |
| Total (International) | | | 10.9 | | | | 12.3 | | | | 15.4 | | | | 23.4 | | | | 20.0 | | | | 27.0 | |
| North America | | | 1.1 | | | | 2.0 | | | | 3.7 | | | | 2.3 | | | | 4.1 | | | | 2.3 | |
| South America | | | 9.8 | | | | 10.3 | | | | 11.7 | | | | 21.1 | | | | 15.9 | | | | 24.8 | |
| | | | | | | | | | | | | | | | | | | | | | | | | |
| TOTAL PROVED DEVELOPED RESERVES | | | 933.3 | | | | 2,535.9 | | | | 855.8 | | | | 2,229.5 | | | | 800.7 | | | | 2,261.7 | |
| | | | | | | | | | | | | | | | | | | | | | | | | |
| PROVED UNDEVELOPED RESERVES | | | | | | | | | | | | | | | | | | | | | | | | |
| | | | | | | | | | | | | | | | | | | | | | | | | |
| Total (Colombia) | | | 431.6 | | | | 340.6 | | | | 507.5 | | | | 537.0 | | | | 421.3 | | | | 460.9 | |
| Total (International) | | | 5.4 | | | | 10.0 | | | | 7.7 | | | | 1.9 | | | | 14.3 | | | | 0.0 | |
| North America | | | 2.9 | | | | 12.0 | | | | 0.0 | | | | 0.0 | | | | 0.0 | | | | 0.0 | |
| South America | | | 2.5 | | | | (2.1 | ) | | | 7.7 | | | | 1.9 | | | | 14.3 | | | | 0.0 | |
| | | | | | | | | | | | | | | | | | | | | | | | | |
| TOTAL PROVED UNDEVELOPED RESERVES | | | 437.0 | | | | 350.6 | | | | 515.2 | | | | 538.9 | | | | 435.6 | | | | 460.9 | |
| | | | | | | | | | | | | | | | | | | | | | | | | |
| TOTAL PROVED RESERVES (DEVELOPED AND UNDEVELOPED) | | | 1,370.3 | | | | 2,886.5 | | | | 1,371.0 | | | | 2,768.4 | | | | 1,236.3 | | | | 2,722.6 | |
The following table sets forth our estimated consolidated net proved developed and undeveloped reserves of crude oil and natural gas at December 31, 2012, 2011 and 2010.
| Net proved developed and undeveloped Reserves |
| | | | | | | | | | |
| | | Crude Oil (million
barrels) | | | Gas (bcf) | | | Total (million boe) | |
| | | | | | | | | | |
| Reserves at December 31, 2010 | | | 1,236.3 | | | | 2,722.6 | | | | 1,714.0 | |
| Revisions of previous estimates | | | 107.6 | | | | (260.8 | ) | | | 61.8 | |
| Improved recovery | | | 14.8 | | | | 3.6 | | | | 15.4 | |
| Purchases of minerals in place | | | 18.3 | | | | 93.3 | | | | 34.6 | |
| Extensions and discoveries | | | 184.5 | | | | 386.2 | | | | 252.3 | |
| Production | | | (190.5 | ) | | | (176.5 | ) | | | (221.5 | ) |
| | | | | | | | | | | | | |
| Reserves at December 31, 2011 | | | 1,371.0 | | | | 2,768.4 | | | | 1,856.7 | |
| Revisions of previous estimates | | | 42.7 | | | | 8.8 | | | | 44.2 | |
| Improved recovery | | | 65.3 | | | | 0.0 | | | | 65.3 | |
| Purchases of minerals in place | | | 0.0 | | | | 0.0 | | | | 0.0 | |
| Extensions and discoveries | | | 90.4 | | | | 298.6 | | | | 142.8 | |
| Production | | | (199.2 | ) | | | (189.3 | ) | | | (232.4 | ) |
| Reserves at December 31, 2012 | | | 1,370.3 | | | | 2,886.5 | | | | 1,876.7 | |
| | | | | | | | | | | | | |
| Net proved developed reserves | | | | | | | | | | | | |
| At December 31, 2010 | | | 800.7 | | | | 2,261.7 | | | | 1,197.5 | |
| At December 31, 2011 | | | 855.8 | | | | 2,229.5 | | | | 1,246.9 | |
| At December 31, 2012 | | | 933.3 | | | | 2,535.9 | | | | 1,378.2 | |
The above-referenced reserve amounts, net of royalty payments to the Nation, are the same amounts used to reconcile Note 35 to our consolidated financial statements under FASB ASC 932.
The Company’s revisions, on a consolidated basis, during 2012 amounted to 44.2 million boe, corresponding primarily to the following:
| · | Pauto Field: Sales of liquids from the natural gas process, volumes associated with our gas processing plant, better production performance and new development projects focused in gas conversion activities and drilling, representing a 19.4 million boe increase. |
| · | Caño Limón Field: Better production performance, representing a 13.9 million boe increase. |
The revisions described above represented 75% of the additions to reserves revisions in 2012, while the revisions with respect to the remaining 10.9 million boe resulted from varying increases and decreases from a variety of fields, including Apiay, Quifa and others.
The Company’s improved recovery during 2012 amounted to 65.3 million boe, which corresponded mainly to new proved areas under waterflooding in the La Cira-Infantas, Casabe and Tibu fields.
The Company’s extensions and discoveries during 2012 amounted to 142.8 million boe, which corresponded to 16.2 million boe of newly discovered fields and 126.6 million boe of extensions of proved acreage. The newly discovered fields corresponded mainly to Ecopetrol S.A.’s Cajua, Chipiron fields, Hocol’s Mamey-Bonga fields and Ecopetrol America’s Dalmatian field.
In terms of extensions of proved acreage (126.6 million boe) in 2012, 70% was associated with activities in the following fields: 25.5 million boe was associated with the Castilla field, where the Company plans additional drilling activities in order to cover new proved areas, 47.8 million boe was associated with new sales agreements permitting increases in future gas sales in the Cupiagua field and 15.4 million boe was associated with new proved areas in the Quifa and Chichimene fields. The remaining 30% corresponds to smaller changes in several other fields.
In terms of proved undeveloped reserves, during 2012 the Company added approximately 101 million boe and converted 212 million boe. Total proved undeveloped reserves decreased by 111.5 million boe to 498.5 million boe at December 31, 2012 when compared to 610 million boe at December 31, 2011. At December 31, 2012, 88% of our total proved undeveloped reserves corresponded to crude oil.
The additions in the Company’s proved undeveloped reserves in 2012 correspond to revisions of previous estimates (17%), improved recovery (26%) and extensions and discoveries (57%). Revisions of previous estimates correspond primarily to variations in economic factors, adjustments based on production behavior and updated development plans in several fields, mainly in Pauto, Caño Limon, Apiay and Quifa.
The increases due to improved recovery are associated mainly with the waterflood projects of the La Cira Infantas, Casabe and Tibu fields, as described above. The Company’s extensions and discoveries relate mainly to extensions of proved acreage, corresponding to projects previously described in the Castilla, Cupiagua, Chichimene and Quifa fields.
Of the total amount of proved undeveloped reserves that we had at the end of 2011 (610 million boe), we converted approximately 212 million boe, or 35%, to proved developed reserves during 2012, which resulted mainly from (1) crude oil projects, primarily associated with the development of heavy crude oil fields in Castilla, Rubiales, Chichimene and Quifa in the Central region, which represented approximately 59% of the total conversion and (2) availability of a new compression facilities for gas processing in the Chuchupa field, which represented 18% of the total conversion. The remaining 23% is associated with development execution in other fields such as the Casabe, Cira Infantas, Apiay fields, among others. The amount of investment made during 2012 to convert proved undeveloped reserves to proved developed reserves was US$2,155 million.
Present Activities
During the first quarter of 2013, Ecopetrol S.A. drilled five stratigraphic wells, out of which two exhibited evidence of hydrocarbons (Segua 1 and Circe 1). In addition, two wells evidenced hydrocarbon presence (Pastinaca 1 and Venus 2), from a total of three A3/A2 wells drilled by Ecopetrol S.A.
During the first quarter of 2013, Hocol drilled one A3/A2 well (Canario Sur 1) which evidenced presence of hydrocarbons.
Regarding offshore activity, Ecopetrol America placed the most competitive bids for six blocks in the “Central Planning Area Lease Sale 227” round held in New Orleans. Ecopetrol America partnered with Murphy Exploration and Production in two blocks; with Anadarko US Offshore Corporation, MCX Gulf of Mexico LLC and JX Nippon Oil Exploration (U.S.A) Limited in two blocks, and in two blocks Ecopetrol America has 100% interest.
Contractual Arrangements for the Exploration and Production of Crude Oil and Natural Gas in Colombia
To address the country’s exploration and production needs, Colombia has modified the contractual regime governing the exploration, development and production of hydrocarbons on a number of occasions since its introduction in 1970. The exploration and production contracts entered into with our business partners provide for the production split, the length of the exploration and production terms, and royalty payments.
Under Colombian law, an existing contract cannot be modified because of a change to the contractual regime, except in the case of public order regulations. As a result, contracts that were executed prior to the issuance of a new contractual regime remain in full force and are not affected by the subsequent regime. At December 31, 2012, we were party to 114 agreements with partners and 27 exploration and production agreements with the ANH in which we do not have any partners.
Under joint venture contracts entered into before March 1994, which include the Cusiana and Cupiagua crude oil fields, among others, the private investor explored a previously agreed upon area at its own risk and expense. Thereafter, we had the option to become a joint venture partner by reimbursing the investor 50% of the exploration costs of oil wells within commercially viable fields and 50% interest of all future development costs related to those fields. Once we became a partner, we had a 50% interest in the production of the field. If we decided not to become a joint venture partner within a certain period of time, the private investor had the right to enter into a sole risk contract for the field’s crude oil production until it had recovered 200% of its investment and 100% of its total costs. Thereafter, we could participate in the development of the field and all future costs and expenses were automatically shared with our partner, as if we had elected to become a joint venture partner in the field.
Beginning in 1994, modifications were made to standard joint venture contracts to maintain the private investor’s share of production at 50% until aggregate production exceeded 60 million barrels. Thereafter, our share increased gradually, up to a maximum of 70% of production. In 1995, further modifications to the standard joint venture contracts required us to pay for half of the exploration costs, not only for wells that ultimately proved to be productive, but also for dry wells, stratigraphic wells and seismic exploration in fields that became commercially viable. The modifications also provided for competitive bidding for the right to explore and develop marginal fields (defined according to certain technical, financial and operational criteria). In the bidding process, private companies presented bids based on percentages of production they would pay us in exchange for the rights to develop these fields. Winning bidders were responsible for all future investment and operating costs related to the field.
The standard joint venture contract was once again modified in 1997 in order to promote private sector activity in the development of inactive areas and small fields and in the exploration for natural gas. These modifications extended the exploration periods, increased the levels of reimbursement for private companies’ exploration costs and provided for the reimbursement of exploration costs in real terms and denominated in U.S. dollars.
In 1999, Colombia adopted two additional modifications to the standard terms, applicable to new joint venture contracts:
| · | Reduction of Our Initial Participation.Our initial participation under the joint venture contracts signed after this reform, was reduced from 50% to 30%. As of December 31, 2012, we had 37 joint venture contracts outstanding in which our participation was greater than or equal to 50%, and 17 joint venture agreements where our participation was less than 50%. |
| · | Modified R Factor. The Government modified the formula used to determine the increase in our share of total production, or the R Factor. The R Factor is calculated by dividing accumulated revenues in cash by investments and costs. If the R Factor increases above a certain profitability threshold, then our share of production increases above the initial 30%. Pursuant to the 1999 modifications, we raised the profitability threshold at which the R Factor triggers an increase in our share from 1.0 to 1.5. Additionally, the R Factor was calculated prior to the 1999 modifications in constant U.S. dollars. The new calculation method was designed to prevent inflation from causing an increase in the R Factor and a corresponding increase in our share. |
We have also entered into various types of arrangements in connection with our own crude oil and natural gas exploration and production projects. These arrangements include: risk participation contracts, incremental production agreements, shared risk production contracts, risk services production contracts, discovered undeveloped fields contracts and sole risk contracts.
| · | Risk-Participation Contracts.Under these contracts, we assume 20% of the exploration costs and risks at the beginning of the second year in exchange for a larger participation in the future production and equal representation on the executive committee of the joint venture. At December 31, 2012, we had four risk participation contracts in effect. |
| · | Incremental Production Agreements. We currently have two types of incremental production agreements, the standard incremental production agreements, or SIPAs, and the development of incremental production project agreements, or DIPAs. |
Under SIPAs, we calculate the total number of proved developed reserves available in a specific field or well and then establish a base production curve for the reserves. Any future production exceeding the curve, which we refer to as incremental production, results from extracting proved undeveloped reserves or probable reserves which require additional investments funded by our partners under the SIPA. We have the right to a previously specified percentage of the incremental production. Our percentage participation varies depending on the total amount invested by our partners and on the R Factor which cannot be lower than 1.5. The volume produced under the production curve is not shared with our partners. At December 31, 2012, we had five SIPAs in effect.
Under DIPAs, we must file a request with the Ministry of Mines and Energy to approve an incremental production project for a field that we directly operate. If the project is approved, we agree with our partners to develop the field and we determine mandatory investment thresholds for our partners. We are not required to fund any investment. The production from the field is distributed to us and our partners receive a percentage of the total production from the field that varies depending on the invested amount. Once the mandatory investment stage expires, we agree with our partners on the percentage of production, total costs and additional investments to be paid by each party. We pay 20% royalties to the Nation on the base production curve and variable royalties on any incremental production. Additionally, in the event of higher prices and large volumes, we have adjustment clauses to increase our share in the production. At December 31, 2012, we had one DIPA in effect.
| · | Shared-Risk Production Contracts.Under these contracts, we remain as operators of the field and assume responsibility for 50% of all investments and costs. Private oil companies submit bids to enter into agreements with us based upon the production percentage they will assign to us. The successful bidder has the right to enter into the shared risk contract with us. At December 31, 2012, we had two shared risk production contracts outstanding. |
| · | Risk Service Production Contracts.We began using the risk service production contract in January 1998 to increase production through the use of new technologies in crude oil fields then operated by our partners. All investments in new technologies were made by our partners who received a previously specified fee per barrel. At December 31, 2012, we had one risk service contract outstanding for the development of the Rancho Hermoso field located in the Mirador formation. |
| · | Discovered Undeveloped Fields Contracts.We have entered into discovered undeveloped fields contracts to promote exploration by private companies of both undeveloped and inactive fields. Under these contracts, the contracting party assumes all costs and expenses for the development and operation of a field in exchange for a certain amount of production. At December 31, 2012, we had 16 discovered undeveloped fields contracts outstanding, of which, at March 1, 2013, two were terminated . |
| · | SoleRisk Contracts.We have entered into sole risk operations, where we benefit from successful exploratory efforts. Our partner in such operations has the right to the field’s crude oil production until it has recovered the percentage (which varies according to the agreement) of its investment and of its total costs. Thereafter, we participate in the development of the field, and all the future costs and expenses are automatically shared with our partner as if we had selected to become a joint venture partner in the agreement. As of December 31, 2012, we had 17 sole risk operations. |
At December 31, 2012 we also had the following agreements:
| · | One Service and Technical Cooperation Contract with the Universidad Industrial de Santander for research and development of the Colorado Field which was terminated on March 10, 2013; and |
| · | One Technical Alliance Agreement with a service company to support the operation of Casabe field in which we maintain operations and ownership of 100% reserves. |
Current Joint Venture Contractual Regime
In 2004, the authority to enter into exploration and production contracts was assigned to the ANH under a different exploration and production contractual scheme. We became an operator like any other company, competing with all other regional and international oil companies in Colombia for exploration and production opportunities under the same conditions and without any special rights. Decree Law 1760 of 2003 gave us the right to maintain in effect all contracts we had entered into prior to January 1, 2004, as well as to have absolute discretion as to whether or not such contracts would be extended after their stated termination date. If we decide not to extend the contracts, the production rights and assets related to the relevant block will revert to us and we would have the right, at no additional cost, to exploit the associated reserves indefinitely. Contracts entered into by us after January 1, 2004 that are not extended by the ANH will revert to the ANH and not to us.
In 2004, the ANH introduced two new model contracts to replace the previously used joint venture contracts: the exploration and production contract and the technical evaluation agreement.
| · | Exploration and Production Contracts. Under exploration and production contracts the contractor, including us, assumes all exploration and production activities. The contractor also assumes all risks and costs of exploration and is the sole owner of all production and assets involved in the exploration and production activities for the term of the contract. There is no partnership or joint venture between the contractor and the ANH. |
| · | Technical Evaluation Agreements. The scope of technical evaluation agreements is limited to exploration activities. Under this type of agreement, the contractor can evaluate a specific area and decide whether or not it will enter into an exploration and production contract. The contractor assumes all risks and costs of the activities and operations. |
In June 2010, the Santiago de las Atalayas Contract, one of the most significant exploration and production contracts based on crude oil and natural gas output and reserves, expired. Pursuant to the terms of the agreement, the right to develop and commercialize the existing crude oil and natural gas reserves in the Cupiagua and Cupiagua Sur fields reverted back to us.
We entered into several agreements or “Convenios” with the ANH in areas directly operated by Ecopetrol S.A., where Ecopetrol S.A. holds total exploration and production rights up to the point when revenue from the well falls below the costs of operations set by the company (the “economic limit”). Article 2 of Decree 2288 of 2004 (a regulatory decree pursuant to Decree Law 1760 of 2003), establishes that the ANH shall determine the general criteria according to which the agreements pertaining to the areas directly operated by Ecopetrol shall be subscribed.
Agreements must also be entered into between Ecopetrol with the ANH according to Article 2 of Decree 2288 of 2004, when joint venture contracts subscribed before December 31, 2003, expire during their production phase. The purpose of these agreements is to define the terms and conditions under which Ecopetrol S.A. can exercise its exclusive right of exploration and production of hydrocarbons—granted by Decree Law 1760 of 2003—in the agreement area until the economic limit. Annex I presents a list of those agreements (Convenios).
We have entered into a number of exploration and production contracts with regional and international oil companies. Annex II includes a list of our contracts still in force as of December 31, 2012 with a complete description of their main characteristics, and Annex III includes a list of our contracts still in force as of December 31, 2012, which are in the exploration phase, with a complete description of their main characteristics.
Management of Crude Oil and Natural Gas Joint Ventures
Every crude oil and natural gas joint venture has an executive committee that makes all technical, financial and operational decisions. All major decisions must be made unanimously. Although we do not operate a number of these joint ventures, we have an active role in the decision-making process and development of the projects. As a result, we have direct control over the development of joint ventures, even for those joint ventures in which we have less than a majority economic interest.
Refining and Petrochemicals
Summary
Our two main refineries in Colombia are the Barrancabermeja refinery, which we directly own and operate, and Reficar, a wholly-owned subsidiary, which we also operate. We also own and operate two other minor refineries — Orito and Apiay. Our refineries produce a full range of refined products, including gasoline, diesel, jet fuel, liquefied petroleum gas, or LPG, and heavy fuel oils, among others.
In 2012, we invested Ps$4.4 trillion (approximately US$2.4 billion) in refining and petrochemicals, an increase compared to the Ps$3.0 trillion (approximately US$1.5 billion) invested in 2011, mainly due to the investments related to the expansion and modernization of the Reficar refinery. Investments in Ecopetrol S.A. in 2012 included 45 different projects, such as re-conversion, upgrading, equipment replacement and environmental projects.
The following table sets forth our daily average installed and actual refinery capacity for each of the last three years.
| | | For the year ended December 31, | |
| | | 2012 | | | 2011 | | | 2010 | |
| | | Capacity | | | Through-
put | | | % Use | | | Capacity | | | Through-
put | | | % Use | | | Capacity | | | Through-
put | | | % Use | |
| | | (bpd) | | | | | | | | | (bpd) | | | | | | | | | (bpd) | | | | | | | |
| | | | | | | | | | | | | | | | | | | | | | | | | | | | |
| Barrancabermeja | | | 250,000 | | | | 219,385 | | | | 88 | % | | | 250,000 | | | | 225,990 | | | | 90 | % | | | 250,000 | | | | 225,259 | | | | 90 | % |
| Reficar | | | 80,000 | | | | 74,545 | | | | 93 | % | | | 80,000 | | | | 76,770 | | | | 96 | % | | | 80,000 | | | | 67,674 | | | | 84 | % |
| Apiay | | | 2,500 | | | | 1,617 | | | | 65 | % | | | 2,500 | | | | 1,768 | | | | 71 | % | | | 2,500 | | | | 1,631 | | | | 65 | % |
| Orito | | | 2,500 | | | | 793 | | | | 32 | % | | | 2,500 | | | | 1,103 | | | | 44 | % | | | 2,500 | | | | 1,480 | | | | 59 | % |
| Total | | | 335,000 | | | | 296,340 | | | | 88 | % | | | 335,000 | | | | 305,631 | | | | 91 | % | | | 335,000 | | | | 296,044 | | | | 88 | % |
Barrancabermeja
At Barrancabermeja, we produce a variety of fuels, such as regular and premium unleaded gasoline, diesel fuel, kerosene, jet fuel, aviation fuel, LPG, fuel oil and sulfur. We also produce petrochemicals and industrial products, including, paraffin waxes, lube base oils, low-density polyethylene, aromatics, asphalts, alkylates, cyclohexane and aliphatic solvents, as well as refinery grade propylene. The Barrancabermeja refinery supplies approximately 70% of the fuels consumed in Colombia.
The average conversion ratio for Barrancabermeja during 2012 was 76.5%. The gross refining margin decreased from US$11.22 per barrel in 2011 to US$10.87 per barrel in 2012 mainly due to the higher cost of crude oil as a result of the better crude oil export prices for Ecopetrol, to which they are indexed.
Barrancabermeja is currently undergoing a modernization process, (the Barrancabermeja Refinery Modernization Project, or PMRB), which aims to modernize the Barrancabermeja refinery to process heavy Colombian crudes and to upgrade its processing configuration from medium to deep conversion. During 2012, the PMRB continued to make progress towards beginning the contracting phase of the main components of the project and the modification of the Crude Unit U-250 to be developed in 2013. We also advanced our forestry and fauna sustainable resettlement, in compliance with the local environmental authority. The project is in the process of approval for its Environmental Management Plan, and once this license is obtained, a comprehensive review will be conducted to update its schedule.
The following table sets forth the production of refined products of Barrancabermeja for the years ended December 31, 2012, 2011 and 2010.
| | | For the year ended December 31, | |
| | | 2012 | | | 2011 | | | 2010 | |
| | | (bpd) | |
| LPG, Propylene and Butane | | | 14,546 | | | | 13,116 | | | | 15,140 | |
| Gasoline Fuels and Naphtha | | | 71,552 | | | | 74,196 | | | | 76,542 | |
| Diesel | | | 52,486 | | | | 53,319 | | | | 52,801 | |
| Jet Fuel and Kerosene | | | 19,043 | | | | 18,562 | | | | 18,324 | |
| Fuel Oil | | | 51,618 | | | | 52,179 | | | | 49,570 | |
| Lube Base Oils and Waxes | | | 2,011 | | | | 2,001 | | | | 2,216 | |
| Aromatics and Solvents | | | 2,953 | | | | 3,293 | | | | 2,739 | |
| Asphalts and Aromatic Tar | | | 5,892 | | | | 7,495 | | | | 6,759 | |
| Polyethylene, Sulfur and Sulfuric Acid | | | 1,149 | | | | 957 | | | | 1,038 | (1) |
| Total | | | 221,250 | | | | 225,118 | | | | 225,129 | (1) |
| Difference between Inventory of Intermediate Products | | | 208 | | | | 386 | | | | 725 | (1) |
| Total Production | | | 221,458 | | | | 225,504 | | | | 225,854 | (1) |
| (1) | Amounts adjusted upwards based on updated measurements. |
During 2012, we delivered 62.9 thousandbpd of low sulfur gasoline (less than 300 parts per million sulfur content) and 76.3 thousand bpd of low sulfur diesel to meet existing fuel quality standards. We delivered two low sulfur diesel qualities in 2012—less than 50 and less than 500 parts per million sulfur content.
Reficar
As part of our Strategic Plan, we expect to increase the competitiveness and profitability of Reficar through the modernization of its facilities and processes, and the improvement of its reliability. We plan to increase the refinery’s production capacity to 165 thousand bpd by 2014 and improve refining margins by processing lower cost heavy crude oils, raising the conversion ratio, and producing a higher quality product slate. We also expect to satisfy existing environmental regulations for fuels by reducing sulfur content in gasoline and diesel fuel, thus complying with national and international fuel standards.
On December 30, 2011, with approval from the Ministry of Finance, Reficar executed the project financing agreements for the expansion and modernization of the Reficar refinery in the amount of US$3.5 billion with a repayment term of 14 years. See “Item 5. Operating and Financial Review and Prospects—Liquidity and Capital Resources.” During 2012, Reficar drew US$2.67 billion under these financial agreements.
In February 2013, Reficar requested contributions from Ecopetrol under the Construction Support Agreement in an amount of US$500 million, of which US$250 million has already been provided, with the remaining amount to be supplied throughout the rest of the year. As the project’s budget and schedule are being revised, we may be required to provide additional funding in excess of this amount. Any increase in the project’s capital expenditures is expected to be funded under the Construction Support Agreement between Reficar and Ecopetrol.
The following table sets forth the production of refined products of Reficar for the years ended December 31, 2012, 2011 and 2010.
| | | For the year ended December 31,(1) | |
| | | 2012 | | | 2011 | | | 2010 | |
| | | (bpd) | |
| LPG, Propylene and Butane | | | 3,447 | | | | 5,526 | | | | 4,056 | |
| Motor Fuels | | | 21,602 | | | | 25,515 | | | | 23,826 | |
| Diesel | | | 17,982 | | | | 20,533 | | | | 16,516 | |
| Jet Fuel and Kerosene | | | 6,776 | | | | 6,730 | | | | 6,252 | |
| Fuel Oil | | | 18,110 | | | | 17,469 | | | | 14,907 | |
| Aromatic Tar | | | 729 | | | | 1,225 | | | | 1,252 | |
| Other Products | | | 29 | | | | 44 | | | | 42 | |
| Total | | | 68,676 | | | | 77,042 | | | | 66,852 | |
| Difference between Inventory of Intermediate Products | | | 6,521 | | | | 1,130 | | | | 1,722 | |
| Total Production | | | 75,197 | | | | 78,172 | | | | 68,573 | |
| (1) | The table shows the entire production of Reficar. |
In 2012, production by Reficar decreased to 75.2 thousand bpd, from 78.2 thousand bpd in 2011. Reficar’s operation suffered an unplanned production stoppage at the fluid Catalytic Unit – FCC, between February and May 2012. The turnaround of its FCC unit had been initially planned for 45 days. However, damages in the rotor of the cracking unit’s gas compressors lengthen the turnaround to 90.65 days, disturbing the production of gasoline, LPG, butane and propylene.
The average conversion ratio for Reficar during 2012 was 68.07%. The gross refining margin decreased from US$6.68 per barrel in 2011, to US$5.31 per barrel in 2012, mainly due to a longer cracker turnaround and lower prices of refined products such as gasoline, diesel and jet fuel, compared to 2011.
In 2011 we started to purchase low-sulfur gasoline and continued purchasing low-sulfur diesel and biodiesel to improve the quality of the diesel and gasoline produced at Reficar. Reficar is currently purchasing biodiesel fuel in the local market and mixing it with its production of diesel to reduce sulfur content to meet local specifications.
Petrochemicals and Other Products
We own and operate four petrochemical plants and one paraffin and lube plant located within Barrancabermeja, producing a variety of products, including aromatics, cyclohexane, paraffin waxes, lube base oils, polyethylene and solvents. In 2012, we produced 36,882 tons of low-density polyethylene and 774.5 thousand barrels of aromatics (benzene, toluene, xylene, orthoxylene, heavy aromatics and cyclohexane), a 27% increase and 16% decrease compared to a production of 28,992 tons of low-density polyethylene and 926 thousand barrels of aromatics in 2011, respectively.
Propilco
During 2012, Propilco’s production totaled 410 thousand tons of petrochemical products, a 7.6% increase compared to the 381 thousand tons produced in 2011. The contribution margin in 2012 was 10.3% higher than in 2011, an increase from 260 per ton in 2011 to 287 per ton in 2012. The following table sets forth Propilco’s average capacity and throughput for each of the last three years.
| | | For the year ended December 31, | |
| | | 2012 | | | 2011 | | | 2010 | |
| | | (Metric Tons) | |
| | | | | | | | | | |
| Average capacity | | | 475,000 | | | | 475,000 | | | | 475,278 | |
| Throughput | | | 409,628 | | | | 380,878 | | | | 407,411 | |
| % Use | | | 86 | % | | | 80 | % | | | 86 | % |
Transportation and Logistics
Summary
Cenit
In 2012, we incorporated Cenit as a wholly-owned subsidiary specializing in logistics and transportation of hydrocarbons within Colombia. The creation of Cenit aims to enhance the strategic and logistical framework of Colombia’s oil industry in response to the increase in hydrocarbon production and higher sales of crudes and refined products, both within Colombia and in international markets. Furthermore, it aims to strengthen and expand the transportation network while maintaining high standards of industrial safety, reliability as well as contributing to the environmental preservation.
We expect the creation of Cenit to represent a signal of clear rules to the market, by separating Ecopetrol’s role as owner, planner, operator and user of transportation systems. Cenit is expected to operate with an open model, in which all the interested parties will have the opportunity of accessing its transportation infrastructure. On the other hand, we have also ensured that Cenit will provide the capacity to meet our transportation needs.
This new hydrocarbon transportation framework is expected to produce significant advantages to Ecopetrol by allowing the company to focus on its strategic business segments and allocate higher investment to other key segments, while Cenit takes the lead in finding and exploiting profitable opportunities in transportation and logistics.
We expect that Cenit will offer its customers a wide portfolio of services that include transportation, storage, logistics and multimodal transportation services for hydrocarbons in Colombia. In addition, our Vice-Presidency of Transportation and Logistics will focus its efforts in the operation and maintenance of the infrastructure and strengthening our risk-management model to support its processes and develop the required infrastructure projects to meet the needs of our customers.
Cenit’s authorized and outstanding capital amounts to Ps.$1.3 billion and Ps.$10 million, respectively. In October 2012, we transferred our direct interests in Ocensa, ODC, Oleoducto Bicentenario, ODL and Serviport to Cenit. On April 1, 2013, Ecopetrol completed the transfer of hydrocarbon transport and logistics assets to Cenit.
Beginning in the second half of 2012, Ecopetrol and Cenit have been working to finalize the transition process in order for Cenit to start operations in the first half of 2013. As part of that process, on April 1, 2013 we entered into a transportation agreement with Cenit, pursuant to which it will provide us with hydrocarbon transportation and logistics services through the transportation assets transferred to it as an in-kind capitalization. On April 1, 2013, we also entered into an operation and maintenance agreement with Cenit, pursuant to which we will perform the activities related to the operation of the transportation assets transferred to it, as well as their maintenance. In return, Cenit will pay us variable monthly installments for the services rendered. See “Item 7. Major Shareholders and Related Party Transactions—Related Party Transactions—Agreements—Cenit.”
Vice-Presidency of Transportation and Logistics
Along with the creation of Cenit and the transfer of the transportation assets to it during 2013, the Vice-Presidency of Transportation and Logistics redefined its strategy, which is to be focused on strengthening our operations and maintenance services, comprehensive logistics solutions and risk management, in order to ensure customer satisfaction while adding value.
The transportation and logistics segment includes the transportation of crude oil, motor fuels, fuel oil and other refined products. Since 2009, our transportation and logistics segment has been transporting diesel and biofuels.
As of December 31, 2012, we, directly or indirectly with private sector participants, owned, operated and maintained an extensive network of crude oil and refined products pipelines connecting our own and third-party production centers and terminals to refineries, major distribution points and export facilities. We directly own 41% of the total crude oil pipeline shipping capacity, a 1% more than in 2011 and 99% of the total product pipeline shipping capacity in Colombia. When aggregated with the crude oil pipelines in which we own an interest, we own 77% of the oil pipeline shipping capacity in Colombia. The total length of our crude-oil pipelines decreased with respect to 2011 mainly due to a higher accuracy in our measurement during 2012 through the inline inspection method. Multi-purpose pipelines length increased mainly due to the construction of an alternative line in the Galán – Bucaramanga system.
By December 31, 2012, our network of crude oil and multi-purpose pipelines was approximately 8,760 kilometers in length. The transportation network we own directly, in partnership with other companies, and in joint venture partnerships, consists of approximately 5,042 kilometers of main crude oil pipeline networks connecting various fields to the Barrancabermeja refinery and Reficar, as well as to export facilities. We directly own 3,029 kilometers of crude oil pipeline and an additional 2,013 kilometers of crude oil pipeline with our business partners. We also own 3,717 kilometers of multi-purpose pipelines for transportation of refined products from the Barrancabermeja refinery and from Reficar to wholesale distribution points.
During 2012, we met our customer satisfaction index goal, and we maintained our ISO 9001:2008, ISO 14001 and OHSAS 18001 certifications for all of our transportation processes. We also attained the certification by the Oil Companies International Marine Forum (OCIMF), which provides standards for hydrocarbons reception, storage, dispatch by pipes and pipelines and the import and export facilities of our docks.
We are currently developing our transportation infrastructure in order to meet our increased transportation needs in Colombia and any additional needs, which may result from new discoveries.
Special Programs
During 2012, our Vice-Presidency of Transportation and Logistics continued to focus its efforts on strengthening its practices in order to anticipate potential natural events that may cause impairments to the transportation facilities and damages in the surrounding environment and communities. The following were some of the steps taken in order to ensure the continuity of the integrity and the contingency programs:
Integrity Program:
This program is aimed at reinforcing our operational risk management model, enhancing the integrity of the transportation infrastructure and handling the environmental conditions in the places where our systems operate. The program has strengthened the risk management model of the Vice-Presidency of Transportation and Logistics by improving risk identification, assessment and management, especially in relation to weather conditions and third-party damage.
In addition, new technologies to monitor the transportation infrastructure and its surroundings have been updated and incorporated into routine inspections and maintenance practices, meeting the highest international standards. Pipeline replacement projects in areas susceptible to incidents with major consequences were executed.
Under this program, there was a decrease of 15% in very-high and high-risk levels at our transportation infrastructure and a decrease of 36% in medium-risk levels when compared to 2011.
Contingency Program:
During 2012, our contingency program carried out activities aimed at reducing the potential consequences of a loss of containment as a result of any event in the transportation infrastructure that might impact nearby communities and the environment, by reinforcing our cooperation with the local communities and the local emergency services.
Those activities include (1) signing of contracts with 15 branches of the Colombian Red Cross to communicate emergency plans in 1,349 local communities; (2) planning and execution of level I (operational drills, performed within Ecopetrol´s facilities, that triggers internal procedures of the company), level II (local and regional drills, involving emergency services and local authorities in the area of influence) , level III (national drills, with the participation of the Risk and Disaster Management Unit of the Colombian Presidency); (3) planning and execution of the Annual Expert Meeting to address our emergency response in coordination with the Risk and Disasters Management Unit of the Colombian Presidency; and (4) designing the structure of a new emergency-response model for Ecopetrol.
In 2013, these programs will continue their planned activities in order to achieve those objectives to guarantee the welfare of local communities.
The map below shows the main transportation networks owned by our business partners and us.
TRANSPORTATION INFRASTRUCTURE
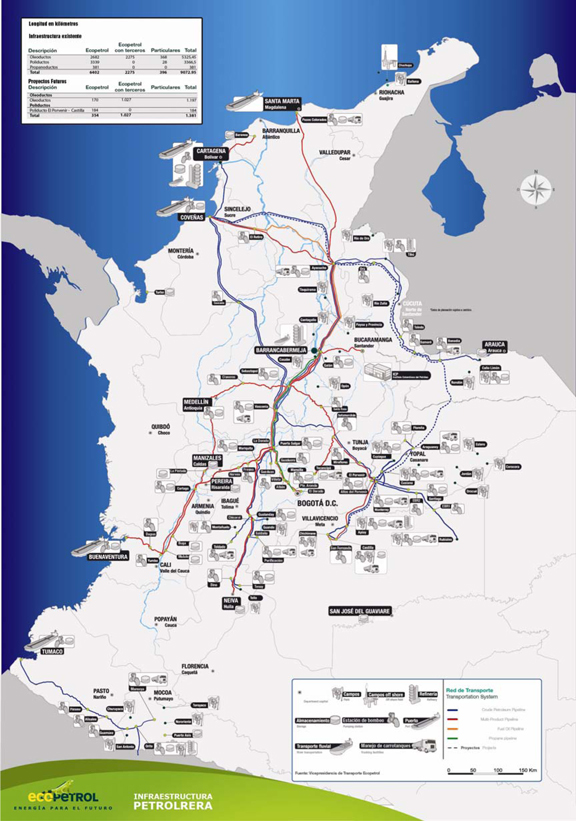
Pipelines
In 2012, pipelines in which we own an interest transported a total of 916.2 thousand bpd of crude oil and 302.7 bpd of refined products for a total of 1.22 million bpd in 2012, a 1.2% increase when compared to 2011. In 2011, pipelines transported a total of 1.20 million bpd of crude oil and refined products compared to 1.03 million bpd in 2010.
In October 2012, we transferred our interests in Ocensa, ODC, Oleoducto Bicentenario de Colombia, ODL and Serviport to Cenit, which is expected to perform all of the hydrocarbon transportation activities that we used to perform directly. We have entered into a transportation agreement with Cenit, pursuant to which it will transport part of our crude oil and refined products, as well as those of certain third parties. See “Item 4. Overview by Business Segment—Transportation and Logistics—Cenit.”
The operation of our pipelines follows international standards and industry practices, such as remote operation, integral management, automatic ticket transfer, health, safety and environmental policies and a high customer satisfaction index.
The following table sets forth our main pipelines and the main pipelines in which we own an interest by name, kilometers covered, type of product transported, origin, destination and our ownership percentage as of December 31, 2012.
| Pipeline | | Kilometers | | | Capacity
Thousand
bpd | | | Product
Transported | | Origin | | Destination | | Ownership
Percentage | |
| | | | | | | | | | | | | | | | |
| Caño Limón-Coveñas | | | 770.6 | | | | 220 | | | Crude Oil | | Caño Limón | | Coveñas | | | 100.00 | % |
| Oleoducto del Alto Magdalena (OAM) | | | 396.5 | | | | 110 | | | Crude Oil | | Tenay | | Vasconia | | | 85.12 | % |
| Oleoducto de Colombia (ODC) | | | 480.8 | | | | 205 | | | Crude Oil | | Vasconia | | Coveñas | | | 73.00 | % |
| Oleoducto Central (Ocensa) | | | 834.5 | | | | 590 | | | Crude Oil | | Cupiagua | | Coveñas | | | 72.65 | % |
| Oleoducto Transandino | | | 306.9 | | | | 48 | | | Crude Oil | | Southern fields | | Tumaco Port | | | 100.00 | % |
| Oleoducto de los Llanos (ODL) | | | 262.0 | | | | 340 | | | Crude Oil | | East fields | | Monterrey Cusiana | | | 65.00 | % |
| Oleoducto Bicentenario de Colombia S.A.S. | | | 230.0 | (1) | | | 240 | (2) | | Crude Oil | | Araguaney | | Banadia | | | 55.97 | % |
| (1) | Represents the estimated length of phase 1 of the project and connects the Araguaney and Banadia stations, expected to be operational in 2013. |
| (2) | Represents the crude oil transportation capacity once the project starts its operation. |
Oleoducto Bicentenario is in the first phase of construction of the Araguaney-Coveñas pipeline, which connects the Araguaney and Banadía loading facilities, and which is expected to be the largest of its kind in Colombia. Its estimated investment of US$2,035 million is expected to be financed by the project partners’ equity participation amounting to a 30% interest and the remaining 70% through loans from local banks, which have approved Ps$2.1 trillion and of which Ps$1,295 billion (approximately US$732 million) has been drawn. The loan’s financial terms include an interest rate of DTF + 4.54% (DTF refers to the fixed term deposit rate), and a term of 12 years with a one-year grace period.
The first phase of the construction is expected to permit the evacuation of at least 110 thousand bpd, with a pipeline of 230 kilometers in length and a diameter of 42 inches, connecting Araguaney to Banadía. Delays in the completion of the first phase of this project due in part to events such as lockouts from communities in the areas of project construction demanding more social investment from the government, security issues, attacks by guerrilla groups, and unfavorable weather conditions could affect our production in certain fields and would prevent us from having the necessary infrastructure for crude oil transportation. During 2012, we completed the construction of 60.8% of the first phase and expect to complete this phase in third quarter of 2013.
In addition to the construction of the first phase of the Araguaney – Banadía pipeline, we adapted the Araguaney and Banadía stations, which by 2012 were 55% and 47% completed, respectively, and the enlargement of the Coveñas station which was 43% completed in 2012. The next phases of the Oleoducto Bicentenario are awaiting internal approvals from shareholders and obtaining environmental licenses from governmental authorities.
The table below sets forth the volumes of crude oil and refined products transported through the crude oil pipelines and multipurpose pipelines owned by us.
| | | For the year ended December 31, | |
| | | 2012 | | | 2011 | | | 2010 | |
| | | (thousand bpd) | |
| Crude oil transport | | | 916.2 | | | | 915.6 | | | | 770.9 | |
| Refined products transport | | | 302.7 | | | | 288.9 | | | | 264.9 | |
| Total | | | 1,218.9 | | | | 1,204.5 | | | | 1,035.8 | |
At December 31, 2012, we owned 53 stations, 21 of them located in crude oil pipelines, 23 of them in refined products pipelines and nine in the ports and riversides (not including those associated with the transportation network that belong to third parties and are operated by us). In addition, we have a nominal storage capacity associated with the transportation network of 19 million barrels of crude oil and 6 million barrels of refined products. We also sell storage capacity to third parties in our Pozos Colorados and Mansilla facilities and in the Coveñas port. We do not own any tankers.
Theft of Hydrocarbons
In 2012, we achieved significant reductions in the theft of hydrocarbons. We believe the results in controlling the theft of both crude oil and refined oil are evidence of the effectiveness of a structured strategy and strong teamwork. This effort has been recognized by third parties such as Accenture, which gave Ecopetrol its Innovation Award in 2012, and other governments which have shown interest in implementing our strategies in their own infrastructure of hydrocarbons transportation. Theft of refined products, which reached a peak of 7,270 bpd in 2002, was reduced to 23.9 bpd in 2012 mainly due to the efforts in the detection of illicit valves, the development of technologies and cooperation with the Colombian Army and law enforcement agencies. In 2012, theft of refined products was reduced by 70%, from 81 bpd to 23.9 bpd when compared to 2011. The theft of crude oil decreased from 419 bpd in 2011 to 413 bpd in 2012, mainly due to our cooperation with the Colombian Army and local communities.
Other Transportation Facilities
We have entered into transportation agreements with tanker-truck and barge companies in order to transport crude oil from locations that do not have pipeline connections to refineries and export facilities. The volume of refined products that cannot be transported in pipelines or in tanker trucks because of capacity limitation is transported by barges. During 2012, 37.8 million barrels of crude oil and refined products were transported by tanker trucks and 7.4 million barrels of crude oil and refined products were transported by barges.
Export and Import Facilities
We currently have concessions granted by the Nation for four export docks for crude oil and refined products (Pozos Colorados, Coveñas, Tumaco and Buenaventura). Our export capacity reached 1,456 million bpd for crude oil and 1,027 million bpd for refined products. Our import capacity reached 1,223 million bpd.
Our crude oil loading facilities can load tankers of up to 350 thousand deadweight tonnage, or DWT. Adjacent to these loading facilities we also have crude oil storage facilities that are capable of storing 7.5 million barrels. Our docks used for import and export of refined products can load tankers of up to 85 thousand DWT. Additionally, these facilities have storage capacity of up to 1.2 million barrels.
New Transportation Projects
Projects to Increase Transportation Capacity
During 2012, we increased capacity in our primary and secondary oil pipelines, loading facilities, refined products and gas pipelines due to several projects carried out by the Vice-Presidency of Transportation and Logistics.
The nominal capacity of the main systems was increased as follows: our main oil pipeline systems increased from 1,109.5 thousand bpd in 2011 to 1,200 thousand bpd in 2012; and our main refined-products pipeline systems increased from 423.4 thousand bpd in 2011 to 426 thousand bpd in 2012, attributable to the increase in capacity of the Pozos Colorados – Galán line that offsetthe decrease in the capacity of the 16” Galán – Sebastopol line.
Main Accomplishments
Primary Oil Pipeline Network:
| · | Increase of 12 thousand bdp in the nominal capacity of the Vasconia – GRB – Galan system, from 168 to 180 thousand bpd. |
| · | Increase of 12 thousand bpd in the nominal capacity of the Transandino Oil Pipeline, from 48 to 60 thousand bpd. |
| · | Increase of 14.5 thousand bpd in the nominal capacity of the 16” Ayacucho – Coveñas corridor, from 60.5 to 75 thousand bpd. |
Secondary-Oil Pipelines:
| · | Increase in pumping capacity from 36 to 54 thousand bpd in the 12” Monterrey – Porvenir System. |
| · | Start of operations of the 14” Galán – Ayacucho line to evacuate the oil production from La Cira and Isla VI camps. Increase of 19 thousand bpd, from 16 thousand bpd to 35 thousand bpd. |
Loading Facilities:
| · | Increase from 20 to 30 thousand bpd in the capacity of the oil loading facility in Castilla |
Refined Pipeline Network:
| · | Transportation of 40 thousand bpd from Apiay to the production fields located in Acacías, Chichimene and Castilla. |
| · | Increase of 15 thousand bpd in the capacity of the Pozos Colorados – Galán system, from 90 to 105 thousand bpd .. |
Gas Pipelines:
| · | Beginning of operations of the Cupiagua – Cusiana gas pipeline to 1.1 bcfd in November |
Storage Capacity:
| · | The beginning of operations of the tanks TK 142 with a restored capacity of 56 thousand barrels in the Puerto Salgar station, as well as the 50 thousand-barrel tank 403 in the Apiay station concluded their maintenance activities with no impact on the nominal capacity. |
| · | Beginning of operations of the pumping and storage station Ayacucho II to increase the capacity and reliability in the diluent transportation and refined products in the Pozos Colorados – Galán system, reaching a capacity of 300 thousand barrels. |
New Business Developments
Throughout the transportation-capacity bidding rounds held in 2012, contracts with CEPSA and Petrominerales Colombia Limited were executed for the Santiago – El Porvenir oil pipeline, and with Mansarovar Energy Colombia for the Galán – Ayacucho – Coveñas oil pipeline.
In addition, a “ship or pay” and “ship and pay” capacity deal was signed with Occidental Petroleum de Colombia for the Galán – Ayachucho – Coveñas system, as well as a capacity deal for the Araguaney – Porvenir system with Equion.
In connection with crude loading, “ship or pay” contracts were signed for the loading facility in Araguaney with Petrominerales and Metapetroleum, along with capacity contracts with Metapetroleum Corp in Colombia and Petrominerales.
Incidents at Transportation Facilities
Salgar-Cartago Multipurpose Pipeline Spill
On December 23, 2011 our Salgar-Cartago pipeline ruptured. The experts believe this incident occurred as a result of creep movement caused by severe weather conditions in the area, causing the surrounding soil to exercise strong pressure on the pipeline and rupturing it. Due to the rupture, approximately 59,976 U.S. gallons of gasoline spilled into the surrounding area in La Divisa and Villa Carola in the Municipality of Dosquebradas, Risaralda. The spilled gasoline from the pipeline subsequently came into contact with a heat source which ignited it, causing several explosions that tragically resulted in 33 fatalities and 35 injuries, as well as damages to the neighboring houses and buildings.
In connection with this incident, the Corporación Autónoma Regional de Risaralda, or CARDER (the Regional Environmental Authority for the Department of Risaralda), initiated a proceeding against Ecopetrol for alleged violation of the environmental regulation. In addition, the National Authority on Environmental Licensing – ANLA, has had more detailed involvement in the surveillance of Ecopetrol’s fulfillment of the environmental plan for the area.
We performed our own internal investigation of the incident, and additionally hired a local engineering firm as well as a highly renowned international consultant to investigate the causes of the incident. Our internal investigation, the investigation conducted by the Colombian engineering firm and the one conducted by the international consultant, concurred that the origin of the rupture of the pipeline was the result of a creep movement caused by severe weather conditions in the area, causing the surrounding soil to exercise strong pressure on the pipeline
Notwithstanding that the causes of such incident cannot be attributed to Ecopetrol, based on objective responsibility criteria established by Colombian Law, and based on principles of solidarity and social responsibility, Ecopetrol agreed to compensate the affected families for their injuries and loses. This compensation does not imply the admission of any guilt as to the incident or the damages caused. For these purposes, Ecopetrol and the affected families agreed on the extrajudicial settlement of the damages and executed conciliation contracts, which were further reviewed and approved by judges in the city of Pereira. Settlements were agreed to cover all injuries and losses for an approximate amount of Ps$12.9 billion.
Furthermore, during 2012 and 2013, Ecopetrol has developed several social programs agreed with and for the benefit of the affected communities. These programs have represented as of December 31, 2012 contributions of approximately Ps$12 billion to assist those affected by the incident and to restore the environment and social infrastructure.
As of January 4, 2012, we had cleaned the affected water bodies and completed the majority of our remediation activities in connection with the spill. In addition, as of December 31, 2012, we had planted 3,700 trees in the Aguazul Creek basin, in accordance with the guidelines provided by the CARDER.
In January 2012, we launched the Dosquebradas Project and have taken the following steps to ensure its continuity:
| · | Health: We have sought to guarantee the physical and mental health of the affected people by making specialized surgery available and delivering the required supplies and drugs. |
| · | Legal and Environment - Housing: As of March 18, 2013, we had agreed to settlements with 97% of the families of the deceased persons and the owners of collapsed houses. Also, affected soils including 3.76 km of the Aguazul creek riverside had been recovered. |
| · | Social: Activities held with the local community during 2012 included monitoring and comprehensive care of 129 families and the training of 172 community leaders in risk management. Additionally, a school in the Aguazul village was built in record time, and an ecological park to promote health and sports in the Villa Carola Village and a healthcare center were finished, and the Youth Leadership Network was founded. |
Caño Limon – Coveñas Crude Oil Pipeline Spill
Due to natural causes occurring as a result of unusual movement of soil and the tensioning of the pipeline, resulting from severe weather conditions, on December 11, 2011, the Caño Limon - Coveñas oil pipeline ruptured and caused the spill of approximately 3,267 barrels of crude oil into the Iscala creek, which connects with the Pamplonita River that provides water to the city of Cucuta. The incident did not cause any fatalities or injuries.
We launched our own internal investigation and hired a highly renowned international consultant to investigate the causes of this incident. The conclusions of the investigations support that the rupture occurred as a result of an unusual movement of soil and the tensioning of the pipeline. We believe investigations will continue for the foreseeable future, and we cannot provide any indication as to their outcome, including whether we will be found liable or subject to enforcement actions.
This incident has been subject to investigations by the competent authorities and has originated the filing of an ongoing class action against Ecopetrol and the ongoing proceedings against employees of the company.
The Regional Environmental Authority of Norte de Santander, or Corporación Autónoma Regional de la Frontera Nororiental – CORPONOR, has launched an investigation into the causes of the incident and has initiated enforcement actions against us for the alleged wrongful implementation of the contingency plan.
The Colombian General Comptroller’s office launched an investigation to determine if this incident might have caused a decrease in the assets of Ecopetrol.
At the same time, in 2012, the Colombian General Comptroller’s Office initiated an investigation to determine if there is a fiscal liability of Ecopetrol’s President, the Vice-president of Transportation, and two other employees of the company due to the Caño Limon-Coveñas pipeline spill. The advisors to the employees of Ecopetrol representing them in front of the Colombian General Comptroller’s Office are optimistic regarding the final results of the proceedings; the worst case scenario could eventually imply civil liability of such employees and the risk of termination of their labor contracts.
As of the date of this annual report, no judgment or sanction against Ecopetrol or any of its employees has been issued. The different lawsuits and proceedings are being handled by in house lawyers and by the employees’ counselors.
The legal counselors’ are optimistic as to the possible results of the proceedings underway, particularly due to the fact that there is technical evidence that the causes of the incident are not imputable to Ecopetrol, and that Ecopetrol took care of the incident in a timely and efficient manner.
At the time of the incident, the pipeline was not in operation. We activated the corresponding contingency plan and called for the support of the CREPAD, which is the regional committee for attention and prevention of disasters. Five hundred workers were assigned to the decontamination of the Iscala creek and the Pamplonita River. In addition, the authorities decided to close Cúcuta’s aqueduct gates as a preventive measure, while certified laboratories performed tests to determine its water quality.
In order to prevent the occurrence of another incident of this kind, as part of the strengthening of the contingency plans as well as the relationship with its stakeholders, Ecopetrol, national and local authorities are developing a project Ecopetrol has lead for the development of an alternative to the water supply in the intake of the aqueduct in Cúcuta, which project was approved by the Company’s Board of Directors in December 2011. In order to meet this commitment, as of December 31, 2011, we allocated a provision of Ps$67 billion. After basic engineering studies performed during 2012, the provision was updated and set at Ps$189 billion as of December 31, 2012.
We paid Ps$9.2 billion in 2012 for the decontamination of the Iscala creek and Pamplonita river and additional remediation activities. In 2011 we paid Ps$17.2 billion for these activities.
As of January 4, 2012, we had cleaned the entirety of affected water bodies and the majority of our remediation activities in connection with the product spill were completed. Further analyses conducted by our research institute have shown recovery of the natural resources affected by the incident.
We have third-party general liability insurance coverage that applies to damages resulting from incidents such as the ones that occurred in Dosquebradas and Cucuta.
Given the uncertainty of the outcome of current investigations and of potential future claims regarding these two incidents, we recorded in our financial statements a provision for future payments and disbursements as if we had been found liable for all damages caused by the incidents. Nevertheless, the provision is only a reasonable estimate of the costs associated with the incident and not a definitive amount. We will continue to review the amount of any necessary accruals, potential asset impairments, or other related expenses and record the charges in the period in which the determination is made and an adjustment is required.
Marketing and Supply
Summary
We market a full range of refined and feed stock products locally including regular and high octane gasoline, diesel fuel, jet fuel, natural gas and petrochemical products, among others. Local sales of regular gasoline, LPG, jet fuel and diesel fuel as well as natural gas from the Guajira field are subject to government price regulation with reference to international benchmarks.
We are the main producer and supplier of refined products in Colombia. For regulated products, the Ministry of Mines and Energy establishes maximum prices producers can charge and retail prices for these products pursuant to resolutions. The Ministry also establishes maximum wholesale and retail margins. For LPG, the Energy and Gas Regulatory Commission establishes maximum prices as well as wholesale and retail margins.
Our crude oil export sales are made both in the spot market and through long-term contracts, primarily to refiners in the U.S. Gulf Coast, Far East, Europe and the U.S. West Coast.
Purchase Commitments with our Business Partners
We have signed a number of crude oil purchase contracts with certain of our business partners and third parties. Crude oil purchased from our business partners is either processed in ourrefineries or exported. The purchase price is calculated based on international market prices. Consequently, part of our financial exposure depends on the international prices of oil. We believe that the risk of such exposure is naturally hedged since we either export the crude oil at international market prices or sell refined products at prices which are correlated with international market prices. Under most of our existing contracts, the purchases are subject to the pipeline capacity. During 2012, total volumes of crude oil we purchased from our business partners and third parties amounted to 20.2% of our total crude oil volume sales.
The term of some of our purchase contracts is linked to the term of the joint venture agreements signed with our business partners. Other clauses of the contracts such as price and place of delivery may be subject to renegotiation during the term of the contract. Certain purchase contracts not linked to joint venture agreements may be extended and renegotiated by the parties.
Crude Oil Supply Commitments
As part of our transfer of assets to Reficar in April 2007, we extended a commercial offer to Reficar for the supply of crude oil. The commercial offer has been periodically renewed and it is still in effect. Pursuant to the terms of the offer, Reficar has the option to purchase from us up to 200 thousand bpd of crude oil from our Caño Limón, Vasconia Blend, Cusiana and Castilla fields production according to the future requirements for the upgraded refinery. As we continue to operate Reficar, our operations committee evaluates and determines on a monthly basis the refinery’s crude oil mix needs, including the need for foreign crudes which we may import to meet our commitments. The purchase price for the delivered volumes is equal to an international benchmark index, subject to certain adjustments.
Import of Ultra Low Sulfur Diesel and Diluents
We are reducing sulfur emissions from fuels produced by us through blending with imported ultra-low sulfur diesel. Since January 2010, we supply diesel with sulfur levels under 50 ppm (parts per million) to Bogota, Medellin and other cities around the country that also have bus-based mass-transportation systems, while in the rest of the country, we deliver diesel with sulfur levels under 500 ppm (parts per million). We expect that the quality (sulfur levels) of our diesel will continue improving in 2013 according to international standards. In 2012 we increased imports of ultra-low sulfur diesel by 1,233 bpd compared to 2011 due to rising local demand, depletion of inventory in the country and additional requirements for the production of diesel according to the quality standards of sulfur content effective in 2013. Imports of low sulfur diesel decreased by 1,200 bpd when compared to 2011.
Until 2011, we managed gasoline sulfur levels under 1,000 ppm (parts per million) nationwide. Since 2011, we reduced these levels to under 300 ppm (parts per million), an improvement that placed this type of gasoline as one of the grades with the lowest sulfur levels in Latin America.
We have also increased imports of naphtha, used as a diluent to allow our heavy crudes to be pumped through pipelines. In 2012, we imported 39.6 thousand bpd of naphtha as compared to 34.8 thousand bpd in 2011.
Natural Gas Distribution
Summary
Development of natural gas reserves began in the 1970s with the discovery of the Guajira fields in the Northeastern region. Additional natural gas reserves were discovered in the Piedemonte Llanero. In Colombia, we have been selling natural gas to local distribution companies, power generators and large customers, and have also been exporting natural gas to Venezuela. In 1986, we introduced a program known as “Natural Gas for Change,” which sought to increase local consumption. In 1993, the Government developed a regulatory framework for the distribution and marketing of natural gas. Between 1995 and 1997, we connected our natural gas production fields with distribution points and major cities. In 1997, we transferred all of our natural gas transportation assets to a newly created company, Empresa Colombiana de Gas, or Ecogas. Ecogas had spun off from us in 1998. Thereafter, Ecogas transferred all of its assets to a new company, incorporated for such purpose, named Transportadora de Gas Internacional S.A. E.S.P., or TGI, formerly, Transportadora de Gas del Interior S.A.E.S.P., which is owned by Empresa de Energía Eléctrica de Bogotá.
Marketing of Natural Gas
As a result of the growth of natural gas demand from Venezuela and the increase in domestic consumption of gas-powered plants in recent years, the total demand for natural gas, including natural gas exports in 2012 was 1,090 gbtud, representing a 2.6% increase with respect to 1,062 gbtud demanded in 2011. In 2010, demand was 1,061 gbtud while in 2009, demand was 1,035 gbtud.
We supplied 614 gbtud in 2012, including for self-consumption, which represents an overall market share of 56.3%.
Natural Gas Distribution
Currently, there are more than 20 natural gas distribution companies with operations in Colombia. We sell natural gas to distribution companies through take-or-pay or swing contracts.
Compressed Natural Gas
Demand for natural gas for vehicles increased by 4.8% between 2012 and 2011, from 73 gbtud to 76.4 gbtud. This increase is mainly due to an increase in the number of compressed natural gas vehicles in response to incentives offered by companies engaged in marketing and delivery of compressed natural gas. According to the latest available report of the Ministry of Energy and Mines, as of December 31, 2012, a total of 402,524 vehicles had been converted to natural gas, an increase of 37,342 vehicles over the total of 365,182 that had been converted in 2011, when 40,667 vehicles were added to the 2010 total of 324,515.
During 2012, we amended four of the agreements for the supply of compressed natural gas in the Colombian Atlantic Coast, Bucaramanga, Western region and Bogota in order to maintain the current incentives program that fosters conversions of motor vehicles in these regions from gasoline to natural gas. In addition, we began an early stage of planning and implementation of new incentives programs in the southern part of the country and in the Llanos region.
Natural Gas Sales to the Power and Industrial Sector
We market and sell natural gas to the industrial sector and to gas-fired and combined cycle power plants. We have a number of long-term supply contracts with power generators under which such companies have entered into take-or-pay contracts and purchase and supply obligations for the supply of natural gas. Currently, we have long-term take-or-pay contracts with three of 14 gas-fired and combined cycle power plants. Pursuant to the terms of these agreements, if we do not ship the contracted natural gas amounts we must pay a fine to our customers. Long-term supply contracts establish a pricing formula that depends on international reference prices.
During 2012, Ecopetrol sold 484.2 gbtud in the local market to clients from different sectors such as distributors, industries and power plants. In 2012, as well as in 2011, the lower consumption by power generators allowed the recovery of sales to the industrial sector. This was the opposite of what had occurred in 2010, when sales to the industrial sector dropped, due both to the weather phenomenon known as “El Niño” and to the corresponding higher demand by power plants.
The following table sets forth our local deliveries of natural gas including deliveries to our refineries, during 2012, 2011 and 2010.
| | | For the year ended December 31, | |
| | | 2012 | | | 2011 | | | 2010 | |
| | | (gbtud) | |
| Gas-fired power plants | | | 86.1 | | | | 95.1 | | | | 158.8 | |
| Refineries | | | 116.8 | | | | 112.5 | | | | 98.5 | |
| Petrochemical | | | 1.6 | | | | 3.8 | | | | 3.7 | |
| Industrial(3) | | | 157.0 | | | | 156.5 | | | | 67.8 | |
| Distributors(3) | | | 78.1 | (1) | | | 101.7 | (1) | | | 167.6 | (1) |
| Compressed Natural Gas | | | 39.2 | | | | 39.5 | | | | 41.9 | |
| Producers(2) | | | 5.4 | | | | 36.2 | | | | 106.5 | |
| Total Deliveries | | | 484.2 | | | | 545.3 | | | | 644.8 | |
| (1) | Deliveries to distributors include deliveries to industrial clients that are required to purchase natural gas from distributors. |
| (2) | Between January and September 2010, an increase resulted from higher gas delivery contemplated by our agreement with Chevron. |
| (3) | The difference between 2010 and 2011 figures is explained by our implementation of “Sinergy,” a new nomination software we use to disaggregate sales to distributors by market sector supply. The previous nomination system did not allow this disaggregation. |
Natural Gas Exports
In 2007, we and Chevron entered into a long-term natural gas supply contract with PDVSA through the end of 2011. In December 2011, taking into account that Ecopetrol and Chevron had gas surpluses, we negotiated an extension of exports to PDVSA from January 2012 to June 2014. However, the date of the export contract between Ecopetrol, Chevron and PDVSA could be extended if, by June 2014 Colombia still has a surplus of natural gas to export to Venezuela.. Pursuant to the terms of the agreement, we have agreed to deliver the following quantities of natural gas to Venezuela, for which Chevron assumed 43% and Ecopetrol, 57% of the responsibility:
| | | For the year ended December 31, | |
| | | 2012(2) | | | 2013(2) | | | 2014(2)(3) | |
| | | (gbtud) | |
| Volume commitments(1) | | | 127.2 | | | | 154.8 | | | | 100 | |
| (1) | The quantities for each month are different, because the volume per year is a weighted average. |
| (2) | Total gas delivery commitment to PDVSA. |
| (3) | The quantity for 2014 is a weighted average from January to June 2014. |
In 2012, we and our partner Chevron delivered 186.4 gbtud, exceeding the quantity of natural gas we agreed to supply in our gas export contract with PDVSA. In 2011 and 2010, we and Chevron delivered 204.4 gbtud and 154.9 gbtud respectively. Of the total volume of gas delivered in 2012, 70% came from us and 30% came from Chevron.
In 2007, we signed a gas import contract in which PDVSA would export gas to Colombia from February 2012 (one month after the date on which the original contract called for an end of exports from Colombia to Venezuela) until December 2027. Given that the export contract described above was extended, the start date of the import contract between Ecopetrol and PDVSA was also changed to September 2014. We have agreed that any change in the date of the end of the export contract will also change date on which the import contract begins.
Natural Gas Delivery Commitments
In 2011, we participated along with the Commission for Regulation of Energy and Gas in the definition and implementation of new rules for marketing gas in the mid-term. In accordance with the new regulatory framework, we updated our committed natural gas volumes for the years 2012 and 2013.
The table below sets forth the commitments we have in firm contracts with local natural gas distribution companies, local industries, gas fired power generators, international companies, including PDVSA in Venezuela, and internal agreements with our refineries and fields.
| | | For the year ended December 31, | |
| | | 2012 | | | 2013 | | | 2014 | | | 2015 | | | 2016 | | | 2017 | |
| | | (gbtud) | |
| Volume Commitments | | | 637 | | | | 613 | | | | 353 | | | | 271 | | | | 256 | | | | 257 | |
Pursuant to long-term supply contracts and other agreements, we must supply natural gas to these parties, and failure to deliver the agreed amounts could result in fines under the contracts.
In 2012, we paid Ps$9.2 billion, mainly in compensation for non-delivery of natural gas. The fines resulted from delays in the beginning of new projects, mainly the Planta de Gas Cupiagua and the expansion project of the Guajira fields. In 2010, we paid Ps$85.2 billion for non-delivery of natural gas as a consequence of the weather phenomenon known as “El Niño.”
In order to meet our natural gas delivery commitments, we have three main natural gas production fields, the Guajira fields, the Cusiana and the Gibraltar fields. Of our total natural gas production at December 31, 2012, 57.1% was supplied by the Guajira production, 22.6% from the Cusiana field and the remaining 20.3% from fields located in other regions. Our participation in the Colombian natural gas market in 2012, including export volumes, was 56.3%, a decrease compared to 2011 and 2010 when the participations stood at 62.0% and 64.5% respectively.
Since 2011, Decree 2100 of 2011 issued by the Ministry of Energy and Mines established that all producers have to make a production statement including the volumes available for sales. The following table sets forth the total production statement for 2012-2016 published by the Ministry of Energy and Mines in the fields in which we hold a stake.
| | | For the year ended December 31, | |
| | | 2012 | | | 2013 | | | 2014 | | | 2015 | | | 2016 | |
| | | (gbtud) | |
| Guajira Fields | | | 684.0 | | | | 656.0 | | | | 576.0 | | | | 475.0 | | | | 415.0 | |
| Cusiana and Cupiagua Fields | | | 466.1 | | | | 466.1 | | | | 466.1 | | | | 466.1 | | | | 466.1 | |
| Other Fields | | | 114.5 | | | | 108.0 | | | | 101.7 | | | | 99.7 | | | | 99.1 | |
| Imports(1) | | | 0.0 | | | | 0.0 | | | | 39.0 | | | | 85.0 | | | | 127.0 | |
| Total | | | 1,264.6 | | | | 1,230.1 | | | | 1,182.8 | | | | 1,125.8 | | | | 1,107.2 | |
| (1) | Imports were moved from 2012 to 2014 due to the extension of the export contract with PDVSA. |
Price Controls on the La Guajira Natural Gas Production
The Ministry of Mines and Energy through the Colombian Commission for the Regulation of Energy and Gas, or CREG, establishes the maximum price we are allowed to charge customers that consume less than 100 thousand cfpd from La Guajira field under take-or-pay contracts. Maximum prices we can charge to these “regulated customers” are determined with reference to the average export price for fuel oil for the previous six months.
Priorities for Delivery of Natural Gas
The Ministry of Mines and Energy established distribution priorities in the event of a shortfall of reserves or production of natural gas. Residential consumers with existing supply contracts, small businesses and distributors of compressed natural gas have the first priority for delivery. Contracts for export of natural gas have the same priority under the firm commitments as other users such as industrial consumers and power generators. The agreements that are not firm commitments and contemplate delivery of natural gas “as available” have priority over customers on the spot market. We may enter into natural gas export contracts if the ratio of reserves to production exceeds seven years.
The Ministry of Mines and Energy also establishes distribution priorities in the event of a natural gas shortfall derived from supply or infrastructure issues. This order of priority is based on the type of contract, with firm supply contracts having priority over swing supply contracts.
Regulation
The main authorities that regulate our activities in Colombia are the Ministry of Mines and Energy, the ANH, the CREG, the Ministry of Environment and Sustainable Development, and the National Authority on Environmental Licensing.
Ministry of Mines and Energy
The Ministry of Mines and Energy is responsible for managing and regulating Colombia’s nonrenewable natural resources assuring their optimal use by defining and adopting national policies regarding exploration, production, transportation, refining, distribution and export of minerals and hydrocarbons.
National Hydrocarbons Agency – ANH
The ANH was created in 2003 and is responsible for the administration of Colombia’s hydrocarbon reserves. The ANH’s objective is to manage the hydrocarbon reserves owned by the Nation through the design, promotion and negotiation of the exploration and production agreements in areas where hydrocarbons may be found, and not subject to joint ventures executed before December 31, 2003 and still in force, that are directly operated by Ecopetrol. The ANH is also responsible for creating and maintaining attractive conditions for investments in the hydrocarbon sector and for designing bidding rounds for exploration blocks. Decree 4137 of 2011 changed ANH’s legal nature and defined new functions for it.
Energy and Gas Regulatory Commission – CREG
Laws 142 and 143 of 1994 created the CREG, a special administrative unit of the Ministry of Mines and Energy, responsible for establishing the standards for the exploitation and use of energy, regulating the domestic utilities of electricity and fuel gas (liquefied petroleum gas and natural gas). The CREG is also responsible for fostering the development of the energy services industry, promoting competition and responding to consumer and industry needs. Decree 4130 of 2011 assigns CREG new functions previously fulfilled by the Ministry of Mines and Energy.
Ministry of Environment and Sustainable Development
Formerly the Ministry of Environment, Housing and Territorial Development, the Ministry of Environment and Sustainable Development was spun off and reorganized by Law 1444 of 2011. It has among its main functions the issuance of public policies regarding the use and exploitation of natural resources and the regulation of national environmental laws.
For the oil industry in particular, the ministry defines the procedures structures that regulate the issuance of environmental licenses and permits necessary for the development of the following activities: seismic, when the project includes the construction of roads or highways, production, exploration, extraction, transportation and refining.
National Authority on Environmental Licensing
Created by Decree 3573 of 2011, the National Authority on Environmental Licensing has among its functions the issuance of licenses and environmental permits required for projects related to oil activities. Additionally, the National Authority on Environmental Licensing constantly monitors license compliance, handles complaints and grievances presented by local communities, and, in general, is in charge of regulating the procedures by which the environmental permits needed for Ecopetrol’s operation are issued and enforced.
Control Entities
Superintendency of Public Utilities
Under Colombian regulations, the distribution and marketing of natural gas is considered a public utility. As such, this activity is regulated by Law 142 of 1994 and supervised by the Superintendency of Public Utilities (Superintendencia de Servicios Públicos Domiciliarios).
Superintendency of Corporations
We are subject to the supervision of the Superintendency of Corporations (Superintendencia de Sociedades), the governmental body responsible for supervising corporations domiciled in Colombia.
Superintendency of Finance
The Superintendency of Finance (Superintendencia Financiera) is responsible for monitoring, promoting and regulating the publicly traded securities market, registered issuers, broker-dealers, mutual funds and any other participants in the public market including the BVC.
We are a registered issuer and our debt and equity securities are publicly traded. The Superintendency of Finance is responsible for the supervision of any activity we undertake that may affect the market for our securities. We are required to inform the Superintendency of Finance of any material event and provide periodic reports of our financial condition.
Superintendency of Ports and Transport
The Superintendency of Ports and Transport (Superintendencia de Puertos y Transporte) has exclusive control and regulates us in matters related to ports concession contracts, in which we act as contractor.
National Superintendency of Health Care
Because we provide health care benefits to our employees and their families, the National Superintendency of Health Care (Superintendencia Nacional de Salud) has exclusive control and regulates us in matters related to the inspection, supervision and control of the Social Security Health Care System.
Hydrocarbon Resources Administrator
National Hydrocarbons Agency – ANH
Any oil company selected by the ANH to explore a specific block must execute an exploration and production contract with the ANH. All royalty payments in connection with the production of hydrocarbons are made to the ANH in-kind unless the ANH grants a specific waiver to make royalty payments in cash. Any oil company working in Colombia, must file with the ANH periodical reports on the development of their exploratory and production activities.
Authorities Related to Environmental Matters
Regional Autonomous Corporations
Regulated by Law 99 of 1993, the Regional Autonomous Corporations are responsible for the administration of natural resources located in their jurisdiction and, although they do not have competency over issues related to the oil industry, they are responsible for granting permission in certain cases to issue permits for natural resources usage, such as water, air or soil necessary for the development of our activities.
Ministry of Internal Affairs
The Ministry of Internal Affairs is responsible for certifying the existence of ethnic communities (such as Aboriginal, Afro Colombian and “Raizales,” a Colombian legal term that refers to the people born in the San Andrés Island archipelago) in areas in which seismic, exploration, extraction, transportation and refining activities are being developed, and issuing general guidelines which should be developed through consultation procedures necessary for the viability of any work, project or activity intended to be done in the territories of those communities.
Regulatory Framework
Regulation of Exploration and Production Activities
Pursuant to Colombian law, the Nation is the exclusive owner of all hydrocarbon resources located in Colombia and has full authority to determine the rights, royalties or compensation to be paid by investors for the exploration or production of any hydrocarbon reserves. The Ministry of Mines and Energy and the ANH, are the authorities responsible for regulating all activities related to the exploration and production of hydrocarbons in Colombia.
Decree Law 1056 of 1953, or the Petroleum Code (Código de Petróleos), establishes the general procedures and requirements that must be completed by investors prior to commencing hydrocarbon exploration or production activities. The Petroleum Code sets forth general guidelines, obligations and disclosure procedures that need to be followed during the performance of these activities.
Prior to 2003, all activities regarding the exploration and production of hydrocarbons were governed by Decree 2310 of 1974. Consequently, during such period all of our activities were outlined and regulated by this decree. Decree 2310 of 1974 was replaced by Decree Law 1760 of 2003, but all agreements entered into by us prior to 2003 with other oil companies are still regulated by Decree 2310 of 1974.
Decree Law 1760 of 2003 created the ANH to regulate and oversee the exploration and production of hydrocarbon reserves; according to its exclusive legal authority, the ANH developed a new contractual regime for hydrocarbons. Decree Law 1760 of 2003 was complemented by Decree 2288 of 2004, which regulates all aspects related to the extension and termination of contracts executed by us before 2004.
Accord 008 of 2004 (applicable to agreements entered into by us prior to May 2012) and Accord 004 of 2012 (applicable to agreements entered into by on or after May 2012) issued by the Directive Council of the ANH set forth the necessary steps for entering into exploration and production contracts with the ANH.
Resolution 18-1495 of 2009 of the Ministry of Mines and Energy establishes a series of regulations regarding hydrocarbon exploration and production.
Pursuant to Colombian law we must pay a percentage of our production to the ANH as royalties. Each production contract has its applicable royalty arrangement in accordance with applicable law. In 1999, a modification to the royalty system established a sliding scale for royalty payments, linking them to the production level of crude oil and natural gas fields discovered after July 29, 1999 and to the quality of the crude oil produced. Since 2002, the royalties system has ranged from 8% for fields producing up to 5 thousand bpd to 25% for fields producing in excess of 600 thousand bpd. Changes in royalty programs only apply to new discoveries and do not alter fields already in their production stage. Producing fields pay royalties in accordance with the applicable royalty law at the time of the discovery. Our contracts specify that royalties are to be paid in kind (oil and gas) to the ANH.
We currently purchase all physical products delivered by producers of crude oil as royalty payments to the ANH at prices set forth in Law 756 of 2002 and Resolution 18-1709 of 2003 of the Ministry of Mines and Energy.
The purchase price is calculated based on a reference price for crude oil at the wellhead and varies depending on prevailing international prices. We have an interagency collaboration agreement, or “Convenio de Colaboración,” with the ANH, whereby we collect all in kind and cash royalties owed to the ANH by the oil companies in Colombia. We also have a purchase agreement to buy all the royalty volume. We sell the physical product purchased from the ANH as part of our ordinary business.
Decree 2100 of 2011 modified the commercialization scheme of natural gas royalties. Beginning in June 2012, producers must directly commercialize the royalties of their own production on behalf of the ANH. In return, the ANH pays a commercialization fee to producers.
Regulation of Refining and Petrochemical Activities
Refining and petrochemical activities are considered a public utility activity and are subject to governmental regulation. Article 58 of the Petroleum Code establishes that oil refining activities can be developed throughout Colombia. Oil refineries must comply with the technical characteristics and requirements established by the existing regulations.
The Ministry of Mines and Energy is responsible for regulating, supervising and overseeing all activities related to the refining of crude oil, import of refined products, storage, transport and distribution.
Decree 2657 of 1964 regulated the oil refining activities and created the Oil Refining Planning Committee, which is responsible for studying industry problems and implementing short- and long-term refining planning policies. The Committee is also responsible for evaluating and reviewing new refining projects or expansion of existing infrastructure. Prior to deciding on a new project, the Committee must take into account the significance of the project and the economic impact, the sources of financing, profitability, social contribution, the effects on Colombia’s balance of payments and the price structure of the refined products.
Pursuant to Resolution 18-0966 of 2006 issued by the Ministry of Mines and Energy and Article 58 of the Petroleum Code, any refining company operating in Colombia must provide a portion or, if needed, the total of its production to supply local demand prior to exporting any production. If the regulated production income, the principal item in the price formula, becomes lower than the export parity price, the price paid for the refined products will be equivalent to the price for those products in the U.S. Gulf Coast market. If there is a need of local demand for imported crudes, the refining company may charge additional transportation costs in proportion to the crudes delivered to the refinery.
In 2008, Law 1205 was issued with the main purpose of contributing to a healthier environment, and established the minimum quality that fuels must have in the country and the time frame for compliances. Since August 2010, Ecopetrol has been selling diesel and gasoline that complies with the requirements of the aforementioned law at its refinery in Barrancabermeja.
The Ministry of Mines and Energy establishes the safety standards for LPG, storage equipment, maintenance and distribution. Regulations issued in 1992 established that every local, commercial and industrial facility with a storage capacity of LPG greater than 420 pounds must receive an authorization for operations from the Ministry of Mines and Energy.
As of May 2012, under the powers granted by Decree 4130 of 2011 for currency and tax matters, the ANH determines the crude oil price reference.
Regulation of Transportation Activities
Hydrocarbon transportation activity is considered a public utility activity in Colombia and therefore is under governmental supervision and control. Transportation and distribution of crude oil, natural gas and refined products must comply with the Petroleum Code, the Commerce Code (Código de Comercio)and with all governmental decrees and resolutions, including Resolutions 181258 and 124386 of 2010 issued by the Ministry of Mines and Energy on Crude Oil Pipeline Transportation, and Resolutions 122 of 2008 and 092 of 2009 issued by the CREG on LPG Pipeline Transportation.
Notwithstanding the general rules for hydrocarbon transportation in Colombia, natural gas transportation has specific regulations, due to the categorization of natural gas distribution as a public utility activity under Colombian laws. Therefore, natural gas distribution transportation is governed by specific regulations, issued by the CREG that primarily seeks to satisfy the needs of the population.
Transport systems, classified as crude oil pipelines and multipurpose pipelines, can be owned by private parties. The construction, operation and maintenance of pipelines must comply with environmental, social, technical and economic requirements under national and international standards. Transportation networks must follow specific conditions regarding design and specifications, while complying with the quality standards demanded by the oil and gas industry.
According to Law 681 of 2001, multipurpose pipelines owned by Ecopetrol (currently by Cenit) must be open to third-party use on the basis of equal access to all.
Hydrocarbon transport activity may be developed by third parties and must meet all requirements established by law.
The Ministry of Mines and Energy is responsible for:
| · | studying and approving the design and blueprints of all pipelines; |
| · | mediation of rates between parties or, in case of disagreement, establishing the hydrocarbon transport rates based on information furnished by the service provider; |
| · | issuing hydrocarbon transport regulations; |
| · | liquidation, distribution and verification of payment of transport-related taxes; and |
| · | managing the information system for the oil product distribution chain. |
The construction of transportation systems requires government licenses and local permits awarded by the Ministry of the Environment as well as other requirements from regional environmental authorities.
Regulation on Selling, Distributing, Transporting and Marketing of Natural Gas
The Colombian natural gas market is divided into two types of markets: (1) the regulated price market and (2) the free price market. Decree 2100 of 2011, issued by the Ministry of Mines and Energy, introduced a new regime for the selling and marketing of natural gas in Colombia, including specific procedures that regulate the Colombian market in order to administer the remaining natural gas reserves that the Nation owns, and protect national consumers, especially the residential consumers of natural gas.
Decree 2100 of 2011 divided markets in order to regulate marketing procedures as they relate to the production capacity of each production field in Colombia. The producers that operate fields with production capacity of more than 30 million cfpd (“Large Fields”) of natural gas must follow a specific procedure for selling natural gas. The producers that operate fields that produce under 30 million cfpd are free to sell natural gas in terms agreed upon with interested buyers in the Colombian market.
Decree 2100 of 2011 distinguished between regulated price fields (Guajira field) and non-regulated price fields with respect to selling procedures for Large Fields. For the Guajira field, Decree 2100 of 2011 determines a specific order to allocate natural gas, prioritizing buyers that would supply residential consumers and small businesses and industry, as well as natural gas transporters. Buyers included in the priority list have the first option to buy natural gas under the conditions offered by the producer. If such buyers choose not to use this option, then the next buyer in the priority list will be awarded that first option to acquire natural gas, until the gas is entirely allocated.
For non-regulated price fields, Decree 2100 of 2011 and Resolutions 118 of 2011, 140 of 2011 and 167 of 2011, issued by the CREG, provide a specific procedure to sell natural gas in the Colombian market. The procedure to perform the auction process is completely regulated by the CREG in these Resolutions so that the conditions of the auction are clear to the whole market, setting equal rules and opportunities for the buyers. First, the natural gas producer must publish the available natural gas volumes available for sale. Then, all potential consumers present a supply agreement request. Afterwards, the producer compares the natural gas volume offer with the volumes requested by the potential buyers. If the natural gas demand volumes are higher than the natural gas offer published by the producer, then the producer must perform an auction in order to sell the natural gas that is available. If the natural gas demand volumes are lower than the natural gas offer published by the producer, then the producer is able to directly negotiate the terms of the agreement with each one of the potential buyers that presented the supply agreement request.
CREG’s Resolution 057 of 1996 establishes the rules for the different activities related to the natural gas market. It defines transportation as an independent activity. Therefore, transporters of natural gas are not allowed to (1) perform production, commercialization or distribution activities or (2) participate in companies for which the main purpose is to perform one of these activities. Transporters also cannot have an economic interest in electricity generating companies. The CREG also regulates certain aspects of the agreements that can be used for the marketing, production, distribution and transportation of natural gas. CREG’s Resolutions 118 of 2011, 140 of 2011 and 167 of 2011, as amended, provide four types of contracts that can be used:
| · | Take-or-Pay Agreements. The buyer agrees to purchase a specific amount or percentage of production of natural gas and the producer guarantees the availability of 100% of the agreed amount. If the buyer does not consume the agreed natural gas volume, the buyer still must pay the producer the agreed price. |
| · | Optional Purchase Agreements. The buyer agrees to pay a premium for its right to take a fixed amount of natural gas if certain previously agreed conditions are met, and then the buyer agrees to pay an exercise price for the amount of natural gas effectively delivered. The producer guarantees to maintain available 100% of the natural gas agreed volume. |
| · | Interruptible Supply Agreements. The parties determine on a daily basis if the quantity of natural gas specified in the agreement is requested and will be supplied. |
| · | Conditional Firm Supply Agreements. The seller must supply every day the agreed natural gas volumes unless certain previous agreed conditions take place. Then, the producer is able to interrupt the natural gas supply. If the producer supplies natural gas, the buyer must pay a fixed price. |
The export of natural gas is not considered a public utility activity under Colombian law and therefore is not subject to Law 142 of 1994. Nevertheless, the internal supply of natural gas is a priority for the Colombian government. This policy is included in Decree 2100 of 2011, providing that in the event the supply of natural gas is reduced or halted as a result of a shortage of this hydrocarbon, the Colombian government has the right to suspend the supply of natural gas to foreign customers. Notwithstanding the foregoing, Decree 2100 of 2011 establishes freedom to export natural gas, under normal conditions for gas reserves.
Regulation of Selling, Distributing, Transporting and Marketing of Liquefied Petroleum gas (LPG)
Wholesale marketing, transport, distribution and retail marketing of LPG are mainly regulated by Resolution CREG 74 of 1996, and subsequent resolutions. LPG in Colombia is primarily obtained from our refineries, field production and our own imports. The LPG must meet minimum quality standards to be marketed. Our wholesale marketing and transport activities are regulated by Resolutions 53 of 2011 and 92 of 2009. LPG price is regulated by Resolutions CREG 66 of 2007 and CREG 59 of 2008.
Regulation of Sales of Liquid Fuels
According to section 212 of the Petroleum Code and Law 39 of 1987, distribution of liquid fuels and their derivatives is considered a public utility activity. Consequently, individuals or entities that engage in these activities are subject to regulations issued by the government in the interest of Colombian citizens. The government has the power to determine quality standards, measurement and control of liquid fuels, and establish penalties that may apply to dealers who do not observe such rules.
The Ministry of Mines and Energy is the entity that controls and exercises technical supervision over the distribution of liquid fuels derived from petroleum, including the refining, importing, storage, transport and distribution in the country. Law 812 of 2003 identified the agents of the supply chain of petroleum-derived liquid fuels.
The distribution of liquid fuels, except LPG, is regulated by Decree 4299 of 2005, as modified by Decrees 1333 and 1717 of 2007 and 2008, respectively, which establish the requirements, obligations and penalties applicable to supply agents in the distribution, refining, import, storage, wholesale, transport, retail sale and consumption of liquid fuels.
Decrees 283 of 1990 and 1521 of 1998, and their modifications, establish minimum technical requirements for the construction of storage plants and service stations. The Decrees also regulate the distribution of liquid fuels, establishing the minimum requirements for distributors and the activities and types of agreements permitted for these agents. The Ministry of Mines and Energy also regulates the types of liquid fuels that can be sold and purchased and the penalties for noncompliance with governmental regulations.
As of May 2012, the CREG determines the prices for regulated crude oil by-products, except for gasoline, diesel and biofuels (all of which are determined by the Ministry of Mines and Energy). The ANH determines the price for crude oil corresponding to royalty payments. Jet fuel prices are determined according to Law 1450 of 2011.
The distribution of fuels in areas near Colombian borders is subject to specific regulations that impose stringent control procedures and requirements. Currently, Ecopetrol is no longer responsible for fuel distribution in these areas. That responsibility was transferred to the Ministry of Mines and Energy, pursuant to Law 1430 of 2010.
Regulation of Biofuel and Related Activities
The sale and distribution of biofuels is regulated by the Ministry of Mines and Energy. Regulations establish the quality and pricing standards for biofuels and impose minimum requirements for mixing ethanol with gasoline and biodiesel with diesel.
Environmental Matters
Regulation
The Ministry of Environment and Sustainable Development is the highest environmental authority in Colombia and is in charge of issuing nationwide environmental regulations, policies, and programs. At the regional local level, regional environmental authorities, such as the Regional Autonomous Corporations(Corporaciones Autónomas Regionales), are the highest environmental authorities of the region and are in charge of executing and overseeing the enforcement of all regulations, policies and programs issued by the Ministry of Environment within their area of jurisdiction, related to the environment and renewable natural resources, as well as overseeing any activity from a sustainable development perspective.
Law 99 of 1993 and other environmental regulations impose on companies in general, including oil and gas companies, the obligation to obtain an environmental license prior to undertaking any activity that could negatively impact the environment, or produce serious damage to the environment and natural renewable resources. The National Authority on Environmental Licensing, created by Decree 3573 of 2011, is responsible for evaluating license applications and overseeing all hydrocarbons projects and monitoring compliance.
If projects or activities may impact indigenous, afro-colombian and “raizal” communities, the Colombian constitution provides that the companies developing such projects or activities must consult with those communities before initiating the project or activities or the environmental licensing process. Further, along with this process, the communities or the public oversight entities can request that a public hearing take place for this purpose. In addition, the Colombian constitution and laws establish that in order to comply with public participation mechanisms, the communities may demand information regarding the activities of the project and the impacts it could have.
The environmental licensing process begins when the company filing an environmental plan with the National Authority on Environmental Licensing. Such licensing includes, but is not limited to, the application for the use of natural renewable resources (water, soil and air), the filing of an environmental impact assessment, and a plan to prevent, mitigate, correct and compensate for any activity that may harm the environment. According to recently issued regulations, obtaining a license may take between 165 and 265 business days, depending on whether the authority requires the applicant to file additional information or if it is necessary to establish a governmental committee to decide on the viability of the project.
The Ministry of Environment and Sustainable Development is also responsible for establishing guidelines regarding climate change policies for the hydrocarbon sector in Colombia. We are in compliance with those guidelines. At present, the Ministry of Environment has not proposed any specific steps for the implementation of the Kyoto Accords as it relates to our operations. We are continuously monitoring climate change requirements that could be applicable to us.
A company that does not comply with applicable environmental law and regulations, does not execute the environmental plan approved by the environmental authority or that ignores the requirements imposed by an environmental license may be subject to an administrative proceeding initiated by the National Authority on Environmental Licensing or the regional environmental authorities established by Law 1333 of 2009. The proceeding may result in oral or written warnings, monetary penalties fines, license revocation or even temporary or permanent suspension of the activity being undertaken.
As of March 2013, we were party to 147 environmental administrative proceedings, of which 110 were initiated before 2012, 30 during 2012 and seven during the first three months of 2013. During 2012, ten proceedings were concluded, for which we were subject to monetary fines. The largest fine imposed in 2011 amounted to Ps$3.427 million (approximately US$1.9 million), after being reduced by the authority after being appealed by the Company. As of December 31, 2012, we were subject to four monetary fines that are not yet finally decided, amounting to Ps$616.621 million (approximately US$344,000). It is not possible for us to determine the material effect of the pending proceedings.
Environmental Practices
During 2012, we reviewed and adjusted the focus of our environmental management strategy in order to ensure environmental sustainability, taking into account the challenges we face in complying with environmental regulatory requirements related to larger, international commitments and the expectations of our stakeholders. Our environmental strategy has four action fronts: environmental feasibility, operational excellence, environmental water management and proactive environmental management. During 2012, we invested Ps$1,161 million in environmental programs to strengthen environmental management and increase environmental compliance. These investments include those made through contracts with our business partners in the amount of Ps$113,607 million. Such programs include:
| · | Compliance. The purpose of this program is to guarantee knowledge, assessment, disclosure and compliance with all laws, regulations and requirements imposed by the Ministry of Environment and other regulatory bodies. We undertake environmental impact assessments and constantly review our environmental plan. |
| · | Contingency Planning. This program focuses on implementing preventive actions in our operative and administrative areas in order to diminish the impact of oil and hydrocarbon spills, illness, personal and other operational problems and establish the steps that need to be followed in case of an emergency. |
| · | Eco-Efficiency. This program is designed to minimize the environmental impacts resulting from our (1) use of natural resources through activities such as water uptake and forest exploitation and (2) waste generation through liquid emissions and the creation of hazardous waste. In 2012, we developed two testing projects designed to identify areas that could reduce our use of natural resources and waste generation. Among the alternatives identified to enhance operational efficiency, we are reducing fresh water consumption for the production camps of the Castilla and Chichimene fields. We have also identified opportunities to reduce consumption and emissions of waste water at transportation facilities and are striving to apply a zero liquid discharge plan. |
| · | Biodiversity. This program implements initiatives to preserve endangered species and ecosystems in areas where our activities have strong influence. In 2012, we invested Ps$4.6 billion to develop the “Environmental Planning for the Biodiversity Conservation in Ecopetrol Areas of Influence” project with the National Institute of Biodiversity. |
| · | Environmental Culture. This program seeks to promote an environmental culture in our organization, activities, and daily life. We initiated several environmental campaigns to educate our workforce in areas such as occupational health and friendly environmental practices. |
| · | Climate Change.We have designed a climate change strategy to guide, plan, define and execute our actions towards mitigating the effects of climate change and our participation in the elaboration of local and international climate change policies. In this context, we have entered into technical cooperation agreements with different parties, such as the U.S. Environmental Protection Agency, or EPA, under the Global Methane Initiative, and the Petroleum Technology Alliance of Canada, or PTAC under the energy efficiency program. During 2012, we made progress with our climate change mitigation strategy. We implemented 13 projects, which sought a reduction of 280,257 tons of CO2 in one year. Our project portfolio comprises emission reduction initiatives and compensation activities for forest conservation and restoration. . |
| · | Alternative Energy Sources.This program is designed to develop alternative energy sources, such as biodiesel and ethanol projects. In June 2010, the biodiesel production plant (operated by Ecodiesel) began operations with a capacity of producing 2 thousand bpd. Biodiesel is obtained from refining crude palm oil. The plant has produced a total of 1,795,915 barrels of biodiesel since it began operations. In 2012, the plant produced 804,133 barrels, compared to 718,149 barrels in 2011 and 273,625 barrels in 2010. Additionally, we own 91.43% of Bioenergy S.A., a company established in Colombia, with a production capacity of 2,640 bpd. In 2011, Bioenergy S.A. began the construction of its plant, while its sugarcane plantation has been developed and covers 5,514 hectares of 14,400 hectares projected. The plant is expected to begin operations during the second half of 2013. |
We have also been undertaking significant efforts to make an efficient and rational use of the energy resources we use in our production processes, reducing consumption, costs and CO2 emissions. In line with the 2012 update of our Strategic Plan, energy issues have taken special relevance. These include energy use, which encompasses the concept of integral energy solutions focused on efficiency, reliability and optimization, and the concept of energy diversification. Our 2012 energy efficiency audit was completed for our buildings located in the city of Bogota. The approximate energy savings totaled 497,000 kwh per year, equivalent to US$65 million and 145 tons of CO2 per year. Additionally, we undertook feasibility studies of potential pipeline energy recovery at our pumping stations in Vasconia and La Belleza. We expect the results of these studies by the first quarter of 2013.
In line with our initiatives to diversify the energy resources we use, we began two studies during 2011 on the use of water, solar and eolic resources.. The first one, regarding Small Hydraulic Plants (PCH – Pequeñas Centrales Hidráulicas) attempts to identify water resources with enough generation potential to supply the demand of our operations in the South Region. The second aims to measure 13 operation areas, to determine which of them have adequate conditions to implement applications of solar and eolic resources that could (i) have a positive impact on emissions reduction, (ii) provide energy solutions to reduce consumption and (iii) have economic feasibility.
We launched two new projects: the Termocoa turbine conversion and the electrification of the San Roque - Tisquirama fields, resulting in an energy-consumption reduction of 449 boed, equivalent to US$4.7 million per year. In addition, the following developments associated with our projects in potential pipeline energy recovery, geothermal energy, solar and wind power and hydroelectric plants took place:
| · | Potential Pipeline Energy Recovery:The project is currently under survey and analysis. It is expected that our analyses of energy-use optimization, carbon footprint reduction, and system-reliability improvement analysis in the Vasconia pumping station will conclude by April 2013. |
| · | Geothermal energy: Our geothermal energy project is currently undergoing a corporate strategic alignment. We expect a framework for this initiative to be available by 2014. |
| · | Solar – Wind Energy Potential:We achieved two important goals in 2012. We completed the collection of the relevant information to identify six locations potentially well-suited for the development of solar-energy projects. We also have been conducting measurements in the Teca field to determine its potential for solar and thermal energy. We expect basic engineering for ten projects to be completed by the end of 2013. |
| · | Small Hydroelectric Plant (SHP):We have developed two studies in the southern region of Colombia in order to determine the economic and technical feasibility of pursuing hydroelectric projects near identified water resources. |
In the case of an oil spill or leak from our operations, we must follow contingency plans in accordance with internal guidelines and procedures designed in line with our health, safety and environment, or HSE, programs in compliance with best practices to prevent oil spill events from happening and to mitigate the environmental impact. In addition, we must comply with Colombian Regulation Decree 321 of 1999 and the National Contingency Plan, which are a set of guidelines that must be followed by oil and gas companies in Colombia to prevent, and react in case of, operational events that could impact the environment. For offshore joint ventures, the operator partner has the responsibility of designing and implementing remediation plans and procedures to deal with operational emergencies in accordance with best practices and local environmental regulations. Despite the fact that in the case of an emergency the operator partner is the one responsible for the remediation plan, we will also activate our own contingency plan and act along with the operator. We acted according to our contingency plans with respect to the oil spills occurring in the Salgar-Cartago and the Caño Limón-Coveñas pipelines. See “Item 4. Information on the Company—Transportation Infrastructure—Incidents at Transportation Facilities.”
Health, Safety and the Environment
We are devoted to improving our HSE, practices. We have several programs in place to increase our industrial and process safety, minimize the number of accidents of our workforce or our contractors and minimize catastrophic incidents. The frequency of accidents taking place within our premises has declined significantly to 0.8 accidents per million of hours worked in 2012 from 5.77 accidents per million of hours worked in 2005. Additionally, since 2009 we are working on a “Process Safety Management” system aimed at the continuous improvement and minimization of operational incidents, such as fire, explosion, loss of primary containment and multiple fatalities. We also employ Technological Risk Analysis and a System of Command Incidents (SCI) and continue the process of standardization of HSE protocols and procedures, drafting safety manuals, compliance with existing regulations and the study of HSE benchmarks among oil companies. Our HSE programs are comprised of the following six pillars: (1) culture and leadership, (2) HSE competences in our employees and contractors, (3) safe design, (4) safe operation, (5) prevention and response to emergencies and (6) performance and audits. We have established guidelines to develop these pillars.
In the area of occupational health, our goal is to ensure a healthy workplace for all of our employees. We have defined five main programs in our organization: epidemiology surveillance, ergonomic risk management, industrial hygiene program, industrial health program and medical emergency response. These programs help to control the risks of our daily operations, identified through a health risk assessment. Our goal is to have healthy workers, preventing occupational illness, preserving and maintaining individual and collective health of workers in their occupations inside a safe work environment.
In 2012, we recorded 27 environmental incidents, and 41 were recorded in 2011, the same number as in 2010. Oil spills increased from 2,599 barrels in 2011 to 4,050 barrels in 2012. This increase was primarily due to a single incident a fuel spill in the Sebastopol Galán pipeline of 3,323 barrels.
Human Rights Initiatives
We have a strong commitment to the protection of human rights in the areas where we operate and use a set of security and human rights principles, orPrincipios Voluntarios en Seguridad y Derechos Humanos, as a basis for the risk analysis of our Company in the communities where we operate. We use this set of principles to interact with local communities and strengthen their relationship with local authorities, our third party contractors and us. In particular, under the Colombian Constitution and legal framework, we are required to enter into formal consultations with indigenous communities whenever we are making plans to commence projects or operations in lands under their control.
In addition, as part of our commitment to human rights, in 2009, we approved our Human Rights Policy and joined the United Nations Global Compact. To manage and ensure compliance with the policy and principles of the United Nations Global Compact, in 2010, we created the following forums and tools:
| · | Tactical Plan on Human Rights; and |
| · | Compliance Indicator for Corporate Human Rights Program. |
In 2012, to manage and ensure compliance with both our Human Rights Policy/Tactical Plan on Human Rights and the principles of the United Nations Global Compact, we implemented the actions provided within the Tactical Plan on Human Rights. The Tactical Plan on Human Rights revolves around six components:
| · | right of association and collective bargaining; |
| · | right to equality at work; |
| · | human rights complaint, reporting and claims system; |
| · | rights of ethnic groups; |
| · | human rights and security. |
Among our most outstanding activities in 2012, we conducted an analysis of human rights risks associated with the development of the different phases of our operating lines, with emphasis on projects in the Meta, Casanare and Magdalena Medio departments. This work is planned to continue in 2013 with the formulation of a plan for human rights risk management within the broader risk management plan of the Company.
Additionally, in 2012, we designed a process to monitor risks and the human rights impact of our operations and value chain. We identified the various sources of information that will support the identification of specific cases of alleged human rights violations in the future and trends in the perceptions of our stakeholders regarding our performance in the area of human rights.
Dow Jones Sustainability Index (DJSI)
In 2012, we continued to be listed on the Dow Jones Sustainability Index - World. This index tracks the financial performance of the leading sustainability-driven companies worldwide and is a reference used to assess corporate sustainability.
Insurance
We have a clear and defined corporate policy based on risk financing guidelines that summarizes the Company’s risk transference and retention alternatives and provides support and guidance for all the insurance-related issues of all of our affiliated and subsidiary companies.
There are two corporate insurance programs according to our core business operations, insured values, limits and other aspects.
In the text and tables below, we set forth our insurance programs and the companies covered, along with limits and coverage details.
World-Wide Umbrella Program. This insurance program provides coverage for downstream (assets and operations) of Ecopetrol and all of its affiliates and subsidiaries in excess of their local insurance programs, and also in excess of the “Global Energy Package” program, when applicable. Coverage includes all physical damage, sabotage and terrorism, general liability, directors and officers, crime and marine cargo.
| | | Limit (eel/agg(1)) | | | Deductible | | | | | | | | | | | | | | | | | | | | | | | | | | | | |
| Policies | | Onshore | | | Offshore | | | Onshore | | | Offshore | | | Ecopetrol | | | | | | | | | Ecoeptrol | | | | | | | | | | | | | | | | |
| | | (US$ in millions) | | | Downstream | | | Reficar | | | Propilco | | | Upstream | | | Equion | | | Hocol | | | America | | | Brazil | | | Peru | |
| Property all risk | | | 2,000 | | | | 0 | | | | 5 - 10 | | | | N/A | | | | X | | | | X | | | | X | | | | | | | | | | | | | | | | | | | | | | | | | |
| Sabotage and terrorism | | | 600 | | | | 0 | | | | 0.5 | | | | N/A | | | | X | | | | X | | | | X | | | | | | | | | | | | | | | | | | | | | | | | | |
| Third Party Liability | | | 500 | | | | | | | | 1 - 5 | | | | | | | | X | | | | X | | | | X | | | | X | | | | X | | | | X | | | | X | | | | X | | | | X | |
| Crime | | | 50 | | | | | | | | Various | | | | | | | | X | | | | X | | | | X | | | | X | | | | X | | | | X | | | | X | | | | X | | | | X | |
| Directors and Officers | | | 250 | | | | | | | | Various | | | | | | | | X | | | | X | | | | X | | | | | | | | | | | | | | | | | | | | | | | | | |
| Cargo | | | 100 | | | | | | | | 3% dispatch | | | | | | | | X | | | | X | | | | | | | | X | | | | | | | | | | | | | | | | | | | | | |
| (1) | Eel: each and every loss. Agg: Aggregate |
Global Energy Package This program provides coverage for upstream and midstream (assets and operations) of Ecopetrol’s interests and all of its upstream affiliate and subsidiary companies, including all physical damage, sabotage and terrorism, general liability and control of wells.
| | | Limit (eel/agg(1)) | | | Deductible | | | | | | | | | | | | | | | | | | | | | | | | | |
| Policies | | Onshore | | | Offshore | | | Onshore | | | Offshore | | | Ecopetrol | | | | | | | | | Ecopterol | | | | | | | | | | | | | |
| | | (US$ in millions) | | | Downstream | | | Reficar | | | Propilco | | | Upstream | | | Equion | | | Hocol | | | America | | | Brazil | |
| Third Party Liability | | | 0 | | | | 100 | | | | N/A | | | | 0.15 | | | | | | | | | | | | | | | | X | | | | | | | | | | | | X | | | | X | |
| Sabotage and terrorism | | | 50 | | | | 0 | | | | 0.5 | | | | N/A | | | | | | | | | | | | | | | | X | | | | X | | | | X | | | | | | | | | |
| Control of wells | | | 25 | | | | 400 | | | | 0.25 - 0.50 | | | | 5 | | | | | | | | | | | | | | | | X | | | | X | | | | X | | | | X | | | | X | |
| Property All Risk | | | 400 | | | 0.25 | | | | | | | | | | | | | | | | | | | | X | | | | X | | | | X | | | | X | | | | | |
| (1) | Eel: each and every loss. Agg: Aggregate |
Our third-party liability insurance policies cover Ecopetrol, our subsidiaries and affiliates in excess of local underlying policy limits for claims made against them by third parties. Our commercial general liability, umbrella liability, and excess liability coverages will pay on behalf of or indemnify amounts for which an insured becomes legally obligated to pay, including damages in respect of bodily injury, property, pollution and product liability. Coverage of bodily injury and property damage is subject to a coverage territory during the policy period.
We do not currently act as an operator in any offshore production operation, although we are involved in certain offshore joint ventures in Colombia, the U.S. Gulf Coast and Brazil, and have exploration operations offshore of the Colombian Caribbean coast, which are operated by Equion. In Colombia, currently offshore production operations are carried out by Chevron. There are two platforms that produce liquefied petroleum gas. The World Wide Umbrella and Global Energy Package programs cover all of our interests.
With respect to offshore operations in the U.S. Gulf Coast, Ecopetrol America Inc. is party to Operating Agreements, or OA, that include customary conditions and which contain similar terms and provisions to those in the Model Form of Offshore Deepwater Operating Agreement of the American Association of Professional Landmen (AAPL). In general, pursuant to these OAs, the obligations, duties, and liabilities of the contract parties are several, and not joint or collective, for all operations covered by the OAs. Liability for losses, damages, costs, expenses, or claims involving activities or operations under the OAs which are not covered by or in excess of the insurance carried for the joint account are borne by each contract party in proportion to its participating interest in the activity or operation out of which that liability arises, except when any damages result from a party’s gross negligence or willful misconduct, in which case, such party is solely liable for such damages. The operators supervise the handling, conduct, and prosecution of all claims involving activities or operations under the respective OA or affecting the leases or the contract area covered thereunder. Finally, operators must obtain insurance as required by the OA which costs are charged to the joint account and must have HSE practices in place and comply with locally applicable HSE related statutory requirements.
Ecopetrol Oleo e Gas do Brasil Ltd. and Ecopetrol del Perú are parties to Joint Operating Agreements (JOA) based on the Association of International Petroleum Negotiators (AIPN), model. Liability is generally the same as described for the OA above, with the following variations: if claims arise from third parties as part of a claim not involving an operator’s gross negligence or willful misconduct, and the operator pays such claims, all parties must concur and reimburse such claim amounts. In certain contracts, all environmental damages are distributed according the parties’ participation interest, regardless of whether the damages were caused by an operator’s gross negligence or willful misconduct. In certain cases, non-operators may intervene and directly verify compliance of the operator’s HSE programs. Ecopetrol use the same liability clauses in JOAs for offshore operations in Colombia, when Colombian laws do not govern such agreements.
As part of the corporate policy based on risk financing guidelines, the assets transferred to Cenit are covered by the corresponding corporate insurance programs (World Wide Umbrella Program and Global Energy Package). Pipelines, however, are excluded under the property and terrorism policy coverage as part of a corporate risk determination.
Salgar-Cartago and Caño Limon-Coveñas Pipeline Spill Incidents
We have a liability policy covering damages to third parties. We gave timely notice of the events of Dosquebradas (Salgar-Cartago pipeline) and Cucuta (Caño Limón-Coveñas pipeline) to our insurance company, which appointed the corresponding loss adjusters. The loss adjusters report concluded that the cause of the incidents were related to slow and imperceptible movements of land that caused the rupture of the pipelines. Since these events were unforeseeable, the report concluded that the incident was caused by a force majeure event, which is expressly excluded from our liability policy. The claim was therefore declined by the insurers.
PROPERTY, PLANT AND EQUIPMENT
Under Colombian law, the Nation owns all crude oil and natural gas reserves within Colombia and we have certain rights to explore and produce those reserves in areas awarded by the ANH after public bidding. Most of our property, consisting of refineries and storage, production and transportation facilities, is located in Colombia. Our main assets consist of our wells, refining facilities and our pipelines. See “—Overview by Business Segment—Reserves” for a description of our reserves, sources of crude oil and natural gas, main tangible assets and material plans for expansion and improvements in our facilities. See “Item 5. Operating and Financial Review and Prospects—Liquidity and Capital Resources—Use of Funds—Capital expenditures” and “Item 4. Transportation and Logistics.”
| ITEM 4A. | Unresolved Staff Comments |
None.
| ITEM 5. | Operating and Financial Review and Prospects |
The following discussion presents our financial results and prospects as well as factors that affect our results of operation under Colombian Government Entity GAAP, unless otherwise indicated.
Effects of Acquisitions
Our most significant recent acquisitions are listed below, together with the effective date as of which each has been reflected in our financial statements. These acquisitions were funded mainly through cash on hand and cash flow from our operations.
| · | Offshore International Group Inc., or OIG (February 2009) – 50% ownership. OIG is incorporated in the United States and its main asset is Savía Perú, which carries out offshore exploration and production activities in Peru and has 8.6 million hectares of exploration and production areas. Savía Perú contributed with a gross production of approximately 6 thousand boepd in 2012. |
| · | Ocensa (March 2009) – 72.65% ownership. In January 2011, as a result of our acquisition of BP Exploration Company Limited, we indirectly acquired 51% of its interest in Ocensa, increasing our share in the company to 72.65%. With this acquisition we increased our participation in a key crude oil transport system in Colombia, which transports approximately 57.5% of total crude oil production that reaches the Coveñas export facilities. Prior to the acquisition of BP Exploration, in March 2009, we entered into an agreement with Enbridge Inc., a Canadian company, pursuant to which we acquired 100% of its stake in Ocensa, thereby increasing our interest in Ocensa from 35.3% to 60%. During 2012, we used, on average, approximately 76.3% of the total capacity of this system. |
| · | Reficar (May 2009) – 100% ownership. After increasing our participation in Reficar, we continue developing the expansion and modernization of the Cartagena refinery. We believe this project will allow us to transform heavy crude oil into more valuable products to improve our profitability. |
| · | Hocol Petroleum Limited (May 2009) – 100% ownership. The principal asset is Hocol, which has exploration and production activities in Colombia. This operation contributed to increase our hydrocarbon reserves and production in Colombia. In 2012, Hocol contributed a gross production of 25.1 thousand boepd. On December 27, 2012, Hocol merged with Hocol Limited and Homcol Cayman Inc. |
| · | Equion Energía Limited (January 2011) – 51% ownership. BP Exploration Company Limited sold its interests in Colombia, which were acquired by us and Talisman Colombia Holdco Limited. The company was later renamed Equion Energía Limited. During 2012, Equion contributed a production of 10.6 thousand barrels per day of crude oil and 42 million cubic feet per day of natural gas. |
For more information related to our acquisitions, see “Item 4. Information on the Company.”
Factors Affecting our Operating Results
Our operating results are affected mainly by international prices of crude oil, refined products and natural gas, sales volumes and product mix. Higher crude oil and natural gas prices have a positive impact on our results of operations in our Exploration and Production segment due to the increase in our revenues from exported volumes. Results from our refining activities are also affected by conversion ratios, utilization rates, refining capacity and operating costs, all of which affect our refining margins. Finally, changes in the value of foreign currencies, particularly the U.S. dollar against the Peso, have a significant effect on our financial statements.
Sales Volumes and Prices
Our Exploration and Production segment results depend on production levels and average local and international prices for crude oil and natural gas that we market and sell to our customers locally and abroad. Additionally, sales volumes are affected by the purchase of crude oil and natural gas that we make from our business partners and the ANH.
We sell crude oil in the international market. In addition, we process crude oil at the Barrancabermeja Refinery and Reficar, and sell refined products in the local and international markets. Currently, production volumes and sale prices of crude oil and refined products are the main drivers of our financial performance, together with marketing, cost reduction and operative performance strategies.
Local Sales and Prices
We have a number of crude oil and natural gas long-term supply contracts with local customers, including Reficar, gas-fired power plants, local natural gas distribution companies and PDVSA Gas in Venezuela. Local sale prices are determined in accordance with existing regulations, contractual arrangements and the spot market linked to international benchmarks.
International Sales and Prices
We export crude oil and refined products at prices which are set by reference to international benchmarks. However, we export any crude oil and refined products surplus only after we have fulfilled our supply commitments with our refineries and local customers.
Our commercial strategy, which includes market diversification, has led us to countries such as China, India, Singapore and Spain. In addition, we have started to trade some volume out of the Colombian supply chain by purchasing refined products from an international supplier and selling such products to clients in the foreign market. .
During the past three years, we have significantly increased our international sales on a “delivered” basis to the Caribbean, Central America, the United States and Asian markets, giving us more flexibility both in operational and commercial terms.
Gasoline and Diesel Price Differentials
We charge the domestic prices established by the Government to wholesalers and, at the same time, we accrue the amount of any fuel price differential due pursuant to Law 1151 of 2007 as revenues and record an account receivable from the Government.
During 2010, refiners were entitled to fuel price differential payments. The payments made by the Ministry of Mines and Energy in 2010 corresponded to the first three quarters of the year. The amount due to us by the Ministry, which included the opportunity cost recognized to compensate the delay on the payments, as of December 31, 2010, amounting to Ps$163.4 billion, was delayed and paid in the fourth quarter of 2011.
The fuel price differential payment from the Ministry of Mines and Energy corresponding to the first three quarters of 2011 was paid in December 2011. The fuel price differential payment from the Ministry of Mines and Energy corresponding to the fourth quarter of 2011 was Ps$571.8 billion and for the year ended of 2012 was Ps$1,381.5 billion. In April 2013, the Ministry of Mines and Energy paid the corresponding amounts due to us for the fourth quarter of 2011 and first three quarters of 2012, amounting to Ps$1,271.9 billion. The amount due to us, corresponding to the fourth quarter of 2012 and the first quarter of 2013 is equivalent to Ps$390.3 billion.
Exploration Costs
We account for exploratory drilling using the successful effort method whereby all costs associated with the exploration and drilling of productive wells are capitalized, while costs incurred in exploring and drilling of dry wells are expensed in the period and accounted for under operating expenses—studies and projects. Consequently, the number of exploratory wells we declared as dry negatively affects our results. As such, the significant expansion of our drilling program, which we are currently undertaking, will likely result in higher dry well expenses and may lead to material changes or volatility in our operating expenses.
Royalties
We are required by law to pay in kind a percentage of our production (crude oil and natural gas) to the ANH as royalties. Each production contract has its own royalty arrangement. In 1999, a modification to the royalty system established a sliding scale for royalty payments linked to the production level of crude oil and natural gas fields discovered after July 29, 1999 depending on whether the production is crude oil or natural gas, and on the quality of the crude oil produced. Since 2002, the royalties system has ranged from 8% for fields producing up to 5,000 bpd to 25% for fields producing in excess of 600 thousand bpd. Changes in royalty programs only apply to new discoveries and do not alter fields already in their production stage. Producing fields pay royalties in accordance with the applicable royalty program at the time of the discovery.
Commercialization of Natural Gas from the ANH
Pursuant to Decree 2100 of 2011, we entered into an agreement with the ANH under which we will no longer purchase the natural gas received in kind by the ANH as royalties and instead will commercialize the natural gas of those fields in which the producer does not decide to directly commercialize the royalties. The agreement establishes that we shall sell to third parties on behalf of the ANH the natural gas that belongs to the government between 2012 and 2013. This agreement became effective in July 2012 and reduced the natural gas we purchase from the ANH and sale to third parties by approximately 100 gbtud during 2012.
Purchases of Hydrocarbons from the ANH
We continue purchasing all crude oil delivered to the ANH by us and from third parties as well as the natural gas from certain fields not covered by the above-mentioned agreement and delivered as royalty payments to the ANH. Prices are set forth in a contract between the ANH and us dated December 28, 2012, and a natural gas offer letter from ANH dated June 17, 2009. For crude oil, the purchase price is calculated according to a formula that includes our exports sales prices (crudes and products), a quality adjustment for API gravity and sulfur content, the transportation rates from the wellhead to the Coveñas and Tumaco ports, the refining process cost and a marketing fee. We sell the physical product purchased from the ANH as part of our ordinary business.
Import of Products for Transportation and Blending
During 2012, we increased the volume of naphtha imported to 14.5 million barrels from 12.7 million barrels in 2011 for blending with heavy crude oil to ease its transportation through pipeline systems. In addition, in order to meet local environmental regulations regarding sulfur content in diesel, we imported 11.2 million barrels of ultra low sulfur diesel for blending with our local production. Imported diesel volumes were higher than in 2011 due to growth in local demand along with less availability of this product related to scheduled maintenance of the hydrotreating plant in Barrancabermeja. Purchase prices were lower in 2012 (US$8 per barrel) compared to 2011, in line with international trends. Our variable costs are affected by available volumes of these products and their prices, affecting our operating results.
Effect of Taxes and Exchange Rate Variation on our Income
Income Taxes
The Colombian Congress adopted Law 1607 of December 26, 2012, which introduces significant reforms to the Colombian tax system. In particular, the income tax rate was reduced from 33% to 25% starting in 2013 and the Equality Income Tax (Impuesto de Renta para la Equidad - CREE) was created with a rate of 9% from 2013 to 2015 and 8% starting in 2016. There are some differences between the treatment used to determine this tax and the one used to determine ordinary income tax. As a result, as of January 2013 we are subject to tax on our income at a rate of 34%. From 2008 until December 2012 the standard corporate rate in Colombia was 33%.
Exchange Rate Variation
The appreciation or revaluation of the Peso, particularly against the U.S. dollar, has multiple effects on our financial results. In compliance with Colombian regulations, our results are reported in Pesos, and we maintain our financial records in Pesos. Almost all of our exports of crude oil, natural gas and refined products are sold in U.S. dollars at prices determined by reference to international benchmarks.
During 2012, 2011 and 2010, the Peso has appreciated on average 2.7%, 2.6%, and 12.0%, respectively, against the U.S. dollar. When the Peso appreciates against the U.S. dollar, our revenues from exports of crude oil and natural gas are reduced in Pesos. The appreciation of the Peso also results in lower cost of products, services supplied and contracted abroad as these are denominated in U.S. dollars.
When the Peso depreciates against the U.S. dollar, our revenues from exports increase when expressed in Pesos. Imported goods, however, including imported services denominated in U.S. dollars, will by the same token increase.
Similarly, when we incur in U.S. dollar-denominated debt, a depreciation or appreciation of the Peso in relation to the U.S. dollar, may increase or decrease both our financial expenses and the outstanding value of our indebtedness when expressed in Peso. During 2010 and 2012, we did not incur any U.S. dollar-denominated debt. During 2011, we raised US$3,500 million and US$80 million through our subsidiaries Reficar and Propilco, respectively.
New Accounting Policies
Colombian Government Entity GAAP
There were no significant new accounting standards effective in the year 2012 impacting the Company pursuant to Colombian Government Entity GAAP.
U.S. GAAP
In December, 2011, the FASB issued ASU No. 2011-11 Balance Sheet (Topic 210) - Disclosures about Offsetting Assets and Liabilities. The amendments in this update require an entity to disclose information about its offsetting of assets and liabilities, as well as related arrangements. An entity is required to apply the amendments for annual reporting periods beginning on or after January 1, 2013 and interim periods within those annual periods. Our preliminary analysis indicates that we do not expect these amendments to have any impact due to the fact that we do not have offsetting assets and liabilities.
Critical Accounting Policies and Estimates
The following discussion sets forth our critical accounting policies. Critical accounting policies are those policies that require us to exercise judgment or involve a higher degree of complexity in the application of the accounting policies that currently affect our financial condition and results of operations. The accounting estimates we make in these contexts require us to calculate variables and make assumptions about matters that are highly uncertain. In each case, if we had made other estimates, or if changes in the estimates occur from period to period, our financial condition and results of operations could be materially affected. This information should be read together with Note 1 to our consolidated financial statements for a summary of the principal accounting policies and practices applicable to us. There are many other areas in which we use estimates about uncertain matters, but the reasonably likely effect of changed or different estimates is not material to our financial presentation.
Oil and Gas Reserves
When accounting for our reserves we use the internationally recognized “successful efforts” method of accounting for investments in exploration and production areas. These investments are amortized using the technical units of production method on the basis of proved developed reserves by field. The reserves are based on technical studies prepared internally. Internally estimated reserves are then submitted to an external audit process, which is carried out by our External Engineers. According to our corporate policy, we report the reserves values obtained from the External Engineers. The reserves process ends when the Reserves Directorate consolidates the results and present them to the Reserves Committee, whose members are the Chief Financial Officer, the Exploration and Production Executive Vice-President and the Vice-President of Strategy. Results are presented to the Audit Committee of the Board of Directors and finally approved by the Board of Directors.
The estimation of hydrocarbon reserves is subject to several uncertainties inherent to the determination of proved reserves, production recovery rates, the timelines with which investments are made to develop the reservoirs and the degree of maturity of the fields.
Crude oil prices have traditionally fluctuated as a result of a variety of factors such as changes in international prices of natural gas and refined products, long-term changes in the demand for crude oil, natural gas and refined products, regulatory changes, inventory levels, increase in the cost of capital, economic conditions, development of new technologies, economic and political events, and local and global demand and supply. Revisions to proved reserves estimates of crude oil and gas and the effect of such price variations are presented in Note 35 to our consolidated financial statements. Changes in the crude oil price may affect our estimates in the future. A decrease in our estimated proved reserves due to pricing may result in the impairment of oil and gas properties.
The calculation of units-of-production depreciation and depletion is a critical accounting estimate that measures the depreciation and depletion of upstream assets. The units of production are equal to the ratio of actual volumes produced to total proved developed reserves (those proved reserves recoverable through existing wells with existing equipment and operating methods) and applied to our asset cost.
Proved oil and gas properties held and used by us are reviewed for impairment whenever events or circumstances indicate that the carrying amounts may not be recoverable. Impairments are measured by the amount by which the carrying value exceeds its fair value. Any impairment tests that we perform make use of our long-term price assumptions for the crude oil and natural gas markets and petroleum products.
Volumes produced and asset costs are known, while proved reserves have a high probability of recoverability and are based on estimates that are subject to some variability. The impact of changes in estimated proved reserves is treated prospectively by depreciating the remaining book value of the assets over the future expected production, affecting the following year’s net income.
Suspended Exploratory Well Costs
We capitalizate of exploratory well costs when the well has found a sufficient quantity of reserves to justify its completion as a producing well and the Company is making sufficient progress assessing the reserves and the economic and operating viability of the project. Exploratory well costs not meeting these criteria are charged as expense. The facts and circumstances that support continued capitalization of suspended wells as of year-end 2012 are disclosed in Note 35 to the consolidated financial statements.
Impairment of Long-Lived Assets
In the performance of the impairment testing under U.S. GAAP, our management must make reasonable and supportable assumptions and estimates with respect to: (1) the market value of reserves, (2) oil fields’ production profiles and future production of refined and chemical products, (3) future investments, taxes and costs, (4) future capital expenditures and useful life for properties and (5) future prices, among other factors. As such, any change in the variables used to prepare such assumptions and estimates may have a significant effect on the impairment tests.
Financial Derivative Instruments
We may enter into hedging agreements to reduce our exposure to the fluctuations of international crude oil and products prices. Under Colombian Government Entity GAAP, amounts paid and income received under hedging operations is recognized as financial income/expense. We are not permitted to enter into hedging contracts for speculative purposes.
Under Colombian Government Entity GAAP, our estimates are based on current spot prices subject to market variations according to the regulation and methodology established by the Superintendency of Finance.
Pension Plans and Other Benefits
By virtue of Legislative Act 01 of 2005, enacted by Congress, the pension regimes excluded from the General Social Security System in Colombia expired on July 31, 2010. In accordance with provisions therein, it was concluded that those workers who consolidated their right to pension were those workers who complied with the age and continuous or discontinuous service time requirements of the law, the Collective Bargaining Agreement in force and/or Agreement 01 of 1977, prior to August 1, 2010. Other workers who were not covered by the previously described conditions must mandatorily be affiliated with the General Pension System. The agency responsible for paying the respective pension is the pension administrator chosen by the worker (either the governmental institution Colpensiones -formerly the Social Security Institute - or a private pension fund).
The determination of the expense, liability and adjustments in memorandum accounts relating to our pension and other retirement benefits requires us to use judgment in the determination of actuarial assumptions. These include active employees with indefinite term contracts, retirees and their heirs, pension benefits, healthcare and education expenses, the number of temporary employees who will remain with us until retirement, voluntary retirement plans and pension bonuses. The calculation of retirement bonds posted by us to meet our pension obligations is regulated by Decrees 1748 of 1995, 1474 of 1997 and 876 of 1998, as well as Law 100 of 1993 and its regulatory decree. See Note 1 to our consolidated financial statements.
These actuarial assumptions include estimates of future mortality, withdrawal, changes in compensation and discount rate to reflect the time value of money as well as the rate of return on pension bonds and other plan assets. These assumptions are reviewed at least annually and may differ materially from actual results due to changing market and economic conditions, regulatory events, judicial rulings, higher or lower withdrawal rates or longer or shorter life spans of participants.
In accordance with Resolution 1555 of 2010 and Decree 4565 of 2010 applicable to Colombian Government Entity GAAP, due to the change in the mortality rates in 2010, the Company started to amortize the increase in the pension obligation calculated as of December 31, 2011 using a five-year term. See Note 1 to our consolidated financial statements.
Actuarial gains and losses, a result of differences between estimates and actual calculations and differences between Colombian Government Entity GAAP and U.S. GAAP are disclosed in Note 35 to our consolidated financial statements. Changes in interest rates and amendments to plan conditions have affected prior estimates. We believe that the assumptions used in recording our obligations under the plans are reasonable based on our experience and market conditions. See Note 35of our consolidated financial statements for an analysis of the sensitivity of the assumed health care cost trend rates as a result of a 1% change in interest rates.
Litigation and Tax Assessments
We are subject to claims for substantial amounts, regulatory and arbitration proceedings, tax assessment and other claims arising in the normal course of business. Management and legal counsel evaluate these situations based on their nature, the likelihood that they materialize, and the amounts involved, to decide on any changes to the amounts accrued and/or disclosed. This analysis includes current legal processes against the Company and claims not yet initiated. In accordance with management’s evaluation and guidance provided by Colombian Government Entity GAAP, we created provisions to meet these costs when it is probable that a liability has been incurred and reasonable estimates of the liability can be made. As of December 31, 2012, we had a provision of Ps$792.894 million for litigation contingencies. We also maintain insurance policies to cover specific operational risks and asset protection.
Estimates are based on legal counsel’s evaluation of the cases and management’s judgment. In the past, our estimates have been accurate and have not varied substantially compared to final judgments. We believe that payments required to settle the amounts related to the claims, in case of loss, will not vary significantly from the estimated costs, and thus will not have a material adverse effect on our financial statements taken as a whole. Litigation and tax assessment differences between Colombian Government Entity GAAP and U.S. GAAP are disclosed in Note 35 to our consolidated financial statements.
Income taxes are accounted for under the assets and liability method. Deferred tax assets and liabilities are recognized for the future tax consequences attributable to differences between the carrying amounts of existing assets and liabilities in the financial statements and their respective tax base. Deferred taxes on assets and liabilities are calculated based on statutory tax rates that we believe will be applied to our taxable income during the years in which temporary differences between the carrying amounts are expected to be recovered.
Abandonment of Fields
We are required by law to remove equipment and restore the land or seabed at the end of operations at production sites. To estimate this obligation, we include plugging costs and abandonment of wells, dismantling of facilities and environmental recovery of areas and wells. Changes resulting from new estimates of the liability for abandonment can occur as a result of changes in economic conditions. We accrue the estimated discounted costs of dismantling and removing these facilities at the time of installation of the assets.
We use economic factors from different sources and develop our own internal estimates of future inflation rates and discount rates. There have not been significant disparities between estimates and asset retirement costs paid. We believe that the assumptions used in recording our asset retirement costs and obligations are reasonable based on our experience and market conditions. The related liability is estimated in local currency and does not require adjustment for exchange difference at the end of each year as a greater or lesser value of assets.
Differences between Colombian Government Entity GAAP and U.S. GAAP are disclosed in Note 35 to our consolidated financial statements.
Recognition and Measurement of Assets Recognized and Liabilities Assumed upon Business Combinations
Under U.S. GAAP, we account for businesses acquired using the purchase method of accounting which requires that the assets acquired and liabilities assumed be recorded at the date of acquisition at their respective fair values. The application of the purchase method requires certain estimates and assumptions especially concerning the determination of the fair values of the acquired intangible assets, property, plant and equipment as well as the liabilities assumed at the date of the acquisition. In addition, the useful lives of the acquired intangible assets, property, plant and equipment have to be determined. The judgments made in the context of the purchase price allocation can materially impact our future results of operations. Accordingly, for significant acquisitions, we obtain assistance from third-party valuation specialists. The valuations are based on information available at the acquisition date and different methodologies are used for each intangible identified above.
Goodwill
Under U.S. GAAP, we test goodwill for impairment at least annually using a two-step process that begins with an estimation of the fair value of a reporting unit. The first step is a screen for potential impairment and the second step measures the amount of impairment, if any. However, if certain criteria are met, the requirement to test goodwill for impairment annually can be satisfied without a remeasurement of the fair value of a reporting unit. Fair value is determined by reference to market value, if available, or by a qualified evaluator or pricing model. Determination of a fair value by a qualified evaluator or pricing model requires management to make assumptions and use estimates. Management believes that the assumptions and estimates used are reasonable and supportable in the existing market environment and commensurate with the risk profile of the assets valued. However, different assumptions and estimates could be used which would lead to different results. The valuation models used to determine the fair value of these companies are sensitive to changes in the underlying assumptions. For example, the prices and volumes of product sales to be achieved and the prices which will be paid for the purchase of raw materials are assumptions which may vary in the future. Adverse changes in any of these assumptions could lead us to record a goodwill impairment charge. See Notes 13 and35 to our consolidated financial statements.
Under Colombian Government Entity GAAP, goodwill corresponds to the difference between the acquisition price and the book value of the acquired company. This amount is amortized during the period in which the Company expects to receive future benefits. Additionally, under Colombian Government Entity GAAP, goodwill is not subject to impairment tests.
Operating Results
The following discussion is based on information contained in our audited consolidated financial statements and should be read in conjunction therewith. Our consolidated financial statements have been prepared in accordance with Colombian Government Entity GAAP, which differs in certain significant respects from U.S. GAAP. See Note 35 to our consolidated financial statements for a description of the principal differences.
Certain line items from our consolidated financial statements as of December 31, 2011 and 2010 related to the presentation of the consolidated Balance Sheet and the Consolidated Statement of Financial, Economic, Social and Environmental Activities have been reclassified in order to make the presentation of such financial statements comparable to that of the financial statements as of December 31, 2012. The main reclassifications were under cost of sales, marketing and projects, accounts payable and related parties, Taxes, contributions and duties payable, Deposits held in trust and Other assets. See Note 34 to our consolidated financial statements for a description of the principal differences.
Results of Operations for the Year Ended December 31, 2012, Compared to the Year Ended December 31, 2011, and Compared to the Year Ended December 31, 2010.
The following table sets forth components of our income statement for the years ended December 31, 2012, 2011 and 2010.
| | | For the Year ended
December 31, | | | | | | | | | | |
| | | 2012 | | | 2011 | | | 2012/2011
% change | | | For the Year ended
December 31, 2010 | | | 2011/2010
% change | |
| | | (Pesos in millions) | | | | | | (Pesos in millions) | | | | |
| Revenues | | | | | | | | | | | | | | | | | | | | |
| | | | | | | | | | | | | | | | | | | | | |
| Total Revenue | | | 68,852,002 | | | | 65,967,514 | | | | 4 | % | | | 42,089,745 | | | | 57 | % |
| | | | | | | | | | | | | | | | | | | | | |
| Cost of Sales | | | 40,535,508 | | | | 36,704,584 | | | | 10 | % | | | 25,960,456 | | | | 41 | % |
| Gross Profit | | | 28,316,494 | | | | 29,262,930 | | | | (3 | )% | | | 16,129,289 | | | | 81 | % |
| | | | | | | | | | | | | | | | | | | | | |
| Operating Expenses | | | 4,110,204 | | | | 3,389,950 | | | | 21 | % | | | 3,381,841 | | | | 0 | % |
| Operating Income | | | 24,206,290 | | | | 25,872,980 | | | | (6 | )% | | | 12,747,448 | | | | 103 | % |
| | | | | | | | | | | | | | | | | | | | | |
| Non-operating income | | | | | | | | | | | | | | | | | | | | |
| (expenses) | | | (1,874,589 | ) | | | (2,231,548 | ) | | | (16 | )% | | | (1,254,831 | ) | | | 78 | % |
| Income before income tax | | | 22,331,701 | | | | 23,641,432 | | | | (6 | )% | | | 11,492,617 | | | | 106 | % |
| | | | | | | | | | | | | | | | | | | | | |
| Income tax | | | 7,133,395 | | | | 7,955,721 | | | | (10 | )% | | | 3,238,650 | | | | 146 | % |
| Non-controlling interest | | | 419,359 | | | | 233,377 | | | | 80 | % | | | 107,496 | | | | 117 | % |
| | | | | | | | | | | | | | | | | | | | | |
| Net Income | | | 14,778,947 | | | | 15,452,334 | | | | (4 | )% | | | 8,146,471 | | | | 90 | % |
Total Revenues
Methodology
We use the following criteria to analyze our financial information by business segment: (1) third party sales are made at market prices by each segment according to their ownership of the products or services sold; (2) each segment bears costs and expenses incurred for production and marketing of its products, the corresponding administrative expenses and those expenses related to non-operational transactions related to its activity; (3) transactions between segments are accounted for as if each segment were a separate entity and prices between segments are determined by reference to those that could be obtained in transactions with third parties.
All of our financial information is presented by segment as follows:
| · | Exploration and Production – includes our crude oil and natural gas exploration and production activities. Revenue is derived from inter-company and inter-segment sales, exports and third-party sales. Revenues, costs and expenses for this segment include those costs incurred by us from the production field to the end customer. Expenses include all exploration costs that are not capitalized. |
| · | Refining and Petrochemicals – includes our refining activities. Revenue is derived from inter-company and inter-segment sales, exports and third-party sales and corresponds to products processed in our refineries and our downstream subsidiaries such as motor fuels, fuel oils and petrochemicals at market prices. This segment also includes other services sold to third parties. |
| · | Marketing and Supply – includes our revenues, costs and expenses associated with marketing and sale of products purchased from third parties and the ANH. |
| · | Transportationand Logistics – includes our sales and costs associated with our pipelines and other transportation activities. |
Results
The following table sets forth our principal sources of revenue by business segment for the years ended December 31, 2012, 2011 and 2010.
| | | For the Year ended December 31, | | | | | | For the Year ended
December 31, | | | | |
| | | 2012 | | | 2011 | | | 2012/2011
% change | | | 2010 | | | 2011/2010
% change | |
| | | (Pesos in millions) | | | | | | (Pesos in millions) | | | | |
| Exploration and Production segment: | | | | | | | | | | | | | | | | | | | | |
| Crude oil: | | | | | | | | | | | | | | | | | | | | |
| Local sales | | | 842,975 | | | | 460,591 | | | | 83.0 | % | | | 123,797 | | | | 272.1 | % |
| Export sales | | | 26,026,622 | | | | 24,039,881 | | | | 8.3 | % | | | 13,515,877 | | | | 77.9 | % |
| Total sales of crude oil | | | 26,869,597 | | | | 24,500,472 | | | | 9.7 | % | | | 13,639,674 | | | | 79.6 | % |
| Natural gas: | | | | | | | | | | | | | | | | | | | | |
| Local sales | | | 910,953 | | | | 882,847 | | | | 3.2 | % | | | 712,409 | | | | 23.9 | % |
| Other income from local sales of natural gas | | | 278,013 | | | | 210,232 | | | | 32.2 | % | | | 142,018 | | | | 48.0 | % |
| Export sales | | | 555,813 | | | | 381,000 | | | | 45.9 | % | | | 101,363 | | | | 275.9 | % |
| Total sales of natural gas | | | 1,744,779 | | | | 1,474,079 | | | | 18.4 | % | | | 955,790 | | | | 54.2 | % |
| Other income from Exploration and Production segment(1) | | | 494,239 | | | | 197,717 | | | | 150.0 | % | | | 336,009 | | | | (41.2 | )% |
| Total Exploration and production segment sales | | | 29,108,615 | | | | 26,172,268 | | | | 11.2 | % | | | 15,052,907 | | | | 73.9 | % |
| Exploration and Production segment eliminations in consolidation | | | (4,659,284 | ) | | | (4,068,104 | ) | | | 14.5 | % | | | (2,859,175 | ) | | | 42.3 | % |
| Total Exploration and Production segment sales to third parties | | | 24,449,331 | | | | 22,104,164 | | | | 10.6 | % | | | 12,193,732 | | | | 81.3 | % |
| Refining and Petrochemicals segment: | | | | | | | | | | | | | | | | | | | | |
| Refined products: | | | | | | | | | | | | | | | | | | | | |
| Local sales(2) | | | 19,292,525 | | | | 19,177,196 | | | | 0.6 | % | | | 14,360,357 | | | | 33.5 | % |
| Sales of refined products allocated to our Exploration and Production segment(3) | | | (289,252 | ) | | | (121,249 | ) | | | 138.6 | % | | | (226,701 | ) | | | (46.5 | )% |
| Other income from local sales of refined products(4) | | | 4,949 | | | | 6,850 | | | | (27.7 | )% | | | 32,546 | | | | (79.0 | )% |
| Export sales | | | 7,717,048 | | | | 8,403,561 | | | | (8.2 | )% | | | 5,641,545 | | | | 49.0 | % |
| Total Refining and Petrochemicals segment sales | | | 26,725,271 | | | | 27,466,358 | | | | (2.7 | )% | | | 19,807,747 | | | | 38.7 | % |
| Refining and Petrochemicals segment eliminations in consolidation | | | (64,227 | ) | | | (119,393 | ) | | | (46.2 | )% | | | (22,337 | ) | | | 434.5 | % |
| Total Refining and Petrochemicals segments sales to third parties | | | 26,661,044 | | | | 27,346,965 | | | | (2.5 | )% | | | 19,785,410 | | | | 38.2 | % |
| Marketing and Supply segment: | | | | | | | | | | | | | | | | | | | | |
| Crude oil sales: | | | | | | | | | | | | | | | | | | | | |
| Local sales | | | - | | | | - | | | | 0.0 | % | | | - | | | | 0.0 | % |
| Export sales | | | 15,102,638 | | | | 14,790,487 | | | | 2.1 | % | | | 8,108,425 | | | | 82.4 | % |
| Total crude oil sales | | | 15,102,638 | | | | 14,790,487 | | | | 2.1 | % | | | 8,108,425 | | | | 82.4 | % |
| Natural gas sales: | | | | | | | | | | | | | | | | | | | | |
| Local sales | | | 203,175 | | | | 332,851 | | | | (39.0 | )% | | | 376,403 | | | | (11.6 | )% |
| Other income from local sales of natural gas | | | 748 | | | | 1,590 | | | | (53.0 | )% | | | 2,536 | | | | (37.3 | )% |
| Export sales | | | 50,198 | | | | 173,540 | | | | (71.1 | )% | | | 44,700 | | | | 288.2 | % |
| Total natural gas sales | | | 254,121 | | | | 507,981 | | | | (50.0 | )% | | | 423,639 | | | | 19.9 | % |
| Refined products sales: | | | | | | | | | | | | | | | | | | | | |
| Local sales | | | 861,658 | | | | 714,874 | | | | 20.5 | % | | | 522,145 | | | | 36.9 | % |
| Export sales | | | 299,814 | | | | 179,389 | | | | 67.1 | % | | | 10,246 | | | | n.m. | |
| Other income from local sales | | | 56,414 | | | | 67,284 | | | | (16.2 | )% | | | 54,492 | | | | 23.5 | % |
| Total Marketing and Supply segment sales | | | 16,574,645 | | | | 16,260,015 | | | | 1.9 | % | | | 9,118,947 | | | | 78.3 | % |
| Marketing and Supply segment eliminations in consolidation | | | (684,180 | ) | | | (1,413,845 | ) | | | (51.6 | )% | | | (772,502 | ) | | | 83.0 | % |
| Total Marketing and Supply segment sales to third parties | | | 15,890,465 | | | | 14,846,170 | | | | 7.0 | % | | | 8,346,445 | | | | 77.9 | % |
| Transportation and logistics segment: | | | | | | | | | | | | | | | | | | | | |
| Transportation sales | | | 2,418,903 | | | | 2,135,953 | | | | 13.2 | % | | | 2,168,032 | | | | (1.5 | )% |
| Other income transportation services | | | 461,029 | | | | 412,010 | | | | 11.9 | % | | | 353,869 | | | | 16.4 | % |
| Total transportation sales(5) | | | 2,879,932 | | | | 2,547,963 | | | | 13.0 | % | | | 2,521,901 | | | | 1.0 | % |
| Transportation segment eliminations in consolidation | | | (1,028,770 | ) | | | (877,747 | ) | | | 17.2 | % | | | (757,743 | ) | | | 15.8 | % |
| Total Transportation segment sales to third parties | | | 1,851,162 | | | | 1,670,215 | | | | 10.8 | % | | | 1,764,158 | | | | (5.3 | )% |
| Total Revenues or sales | | | 68,852,002 | | | | 65,967,514 | | | | 4.4 | % | | | 42,089,745 | | | | 56.7 | % |
n.m. = Not meaningful.
| (1) | Corresponds to sales of refined products and services allocated to our Exploration and Production segment. |
| (2) | Includes motor fuel price differential reimbursements by the Nation amounting to Ps$809.7 billion in 2012, Ps$2,251 billion in 2011 and Ps$740.6 billion in 2010. |
| (3) | Corresponds to sales of refined products from our Apiay and Orito refineries allocated to our Exploration and Production segment. |
| (4) | Corresponds to sales of services allocated to our Refining and Petrochemicals segment. |
| (5) | Pursuant to a change in the methodology used to assign the costs and expenses corresponding to transportation services provided to Ecopetrol S.A., in which transportation services provided by third parties are now directly assigned the correspondent segment without being considered income to the transportation segment, certain figures for the years ended December 31, 2011 and 2010 were reclassified for presentation purposes to be consistent with those for the year ended December 31, 2012. |
In 2012, total revenues increased by 4.4% as compared to 2011, mainly due to higher prices of the crude oil basket, supported primarily by the higher Brent and Maya benchmarks prices. In addition, revenues increased due to (1) an increase in total volumes sold of crude oil mainly of Vasconia and Magdalena blends and (2) higher local sales of gasolines and medium distillates. In 2011, total revenues increased by 56.7% when compared to 2010 mainly due to higher average price of crude oil and an increase in total volumes.
The following table sets forth our total export and local sales of crude oil, natural gas and refined products for the years ended December 31, 2012, 2011 and 2010.
| | | For the Year ended December 31, | | | | | | For the Year
ended
December 31, | | | | |
| | | 2012 | | | 2011 | | | 2012/2011
% change | | | 2010 | | | 2011/2010
% change | |
| | | (Pesos in millions) | | | (Pesos in millions) | |
| Crude oil: | | | | | | | | | | | | | | | | | | | | |
| Local sales (barrels) | | | 4,621,107 | | | | 1,783,807 | | | | 159.1 | % | | | 1,086,090 | | | | 64.2 | % |
| Export sales (barrels) | | | 192,216,579 | | | | 181,504,337 | | | | 5.9 | % | | | 131,316,387 | | | | 38.2 | % |
| Average price per local barrel (in U.S. dollars) (1) | | | 68.95 | | | | 69.90 | | | | (1.4 | )% | | | 56.85 | | | | 23.0 | % |
| Average price per export barrel (in U.S. dollars)(2) | | | 103.93 | | | | 99.58 | | | | 4.4 | % | | | 72.55 | | | | 37.3 | % |
| Weighted average price per local and export barrel (in U.S. dollars) | | | 103.11 | | | | 99.30 | | | | 3.8 | % | | | 72.42 | | | | 37.1 | % |
| | | | | | | | | | | | | | | | | | | | | |
| Natural gas: | | | | | | | | | | | | | | | | | | | | |
| Local sales (mbtu) | | | 145,745,113 | | | | 153,293,739 | | | | (4.9 | )% | | | 188,681,680 | | | | (18.8 | )% |
| Export sales (mbtu) | | | 48,168,567 | | | | 55,013,647 | | | | (12.4 | )% | | | 19,701,959 | | | | 179.2 | % |
| Average local price (mbtu) (in U.S. dollars) (1) | | | 4.23 | | | | 4.28 | | | | (1.2 | )% | | | 3.24 | | | | 32.1 | % |
| Average export price (mbtu) (in U.S. dollars) (2) | | | 6.62 | | | | 4.97 | | | | 33.2 | % | | | 3.93 | | | | 26.5 | % |
| | | | | | | | | | | | | | | | | | | | | |
| Refined products: | | | | | | | | | | | | | | | | | | | | |
| Product local sales (barrels) | | | 92,890,866 | | | | 90,900,442 | | | | 2.2 | % | | | 87,271,761 | | | | 4.2 | % |
| Export sales (barrels) | | | 41,880,845 | | | | 40,775,850 | | | | 2.7 | % | | | 37,746,666 | | | | 8.0 | % |
| Average local price per barrel (U.S. dollars) (1) | | | 118.83 | | | | 116.08 | | | | 2.4 | % | | | 87.74 | | | | 32.3 | % |
| Average export price per barrel (U.S. dollars) (1) | | | 107.88 | | | | 112.37 | | | | (4.0 | )% | | | 78.90 | | | | 42.4 | % |
| (1) | Corresponds to average price per local barrel translated at an average exchange rate of Ps$1,798.23 to US$1.00 for 2012,Ps$1,848.17 to US$1.00 for 2011 and Ps$1,897.89 to US$1.00 for 2010. |
| (2) | Corresponds to the average of the actual prices at which we sold our products in the international markets. |
Exploration and Production Segment Sales
Crude Oil
Local Sales
Our revenues from local sales of crude oil increased by 83% in 2012 as compared to 2011 mainly due to a 159.1% increase in volumes sold, especially from Rubiales blend as a consequence of higher demand of crude oil from shipping companies. In 2011, our revenues from local sales of crude oil increased by 87.8% in 2011 as compared to 2010, mainly due to an increase in the average price per barrel and a 64.2% increase in the volume sold, primarily due to higher demand from shipping companies and local industries for energy generation purposes.
Export Sales
Our revenues from exports of crude oil increased by 8.3% in 2012 as compared to 2011, mainly due to a 4.4% increase in the average export price per barrel, explained primarily by the higher Brent and Maya benchmarks prices. Export volumes increased as well by 5.9% primarily due to higher production and export of Vasconia and Magdalena blends. Despite the increase in volumes and prices, the segment’s revenues were impacted by a 2.7% appreciation of the Peso against the U.S. dollar.
In 2011, our revenues from exports of crude oil increased by 77.9% as compared to 2010, mainly due to a 37.3% increase in the average export price per barrel, and a 38.2% increase in the volume of export sales. Increased export sales resulted from improvements in our transportation capacity and higher production of Castilla and Magdalena blends, partially offset by a 2.6% appreciation of the Peso against the U.S. dollar.
Natural Gas
Local Sales
Despite the decrease of 4.9% in volume of local sales of natural gas on a consolidated basis, Exploration and Production segment accounted for a higher production of natural gas which led to an increase of 3.2% in local sales in 2012 as compared to 2011. The 4.9% decrease is mainly due to lower gas purchases from the ANH, pursuant to Decree 2100 of 2011, through which other companies are also able to purchase gas directly from the ANH.
In 2011, our local sales of natural gas increased by 23.9% as compared to 2010, mainly due to a 32.1% increase in the average local price per mbtu, despite an 18.8% decrease in volumes sold. The decrease in volumes sold was explained by a higher allocation of natural gas for export sales due to the elimination of local regulatory restrictions during 2010 that forced us to guarantee availability of natural gas to supply local gas-fired power plants.
Export Sales
In 2012, export sales of natural gas increased by 45.9% as compared to 2011, principally due to a 33.2% increase in our average export prices, partially offset by a 12.4% decrease in volumes sold, mainly due to (1) the delay in the start of new projects related to natural gas production and (2) higher domestic thermal demand, and a 2.7% appreciation of the Peso against the U.S. dollar
In 2011, export sales of natural gas increased by 275.9% as compared to 2010, principally due to a 179.2% increase in the volume of export sales as a result of higher volumes of natural gas available for export sales, an increase in the natural gas demand from Venezuela, and a 26.5% increase in our average export prices, partially offset by the appreciation of the Peso against the U.S. dollar.
Total Exploration and Production Segment Sales to Third Parties
In 2012 and 2011, our total Exploration and Production segment sales to third parties increased by 10.6% and 81.3%, respectively, in each case as compared to the prior year principally due to an increase in volumes produced, higher prices for our export crude oil basket and higher selling spreads for our crude oil due to the indexation to the Brent and Maya benchmarks prices. In addition, during 2012, revenues from this segment were positively impacted by our commercial strategy which included market diversification of sales to countries such as China, India and Singapore.
Refining and Petrochemicals Segment Sales
Local Sales
In 2012, local sales of refined products and petrochemicals increased by 0.6% as compared to 2011, as a result of a 2.4% increase in average local prices and a 2.2% increase in volumes sold due to higher demand for gasoline and middle distillates from automotive, aviation and mining sectors, resulting from the country’s economic growth, partially offset by the appreciation in the average exchange rate of the Peso against the U.S. dollar.
Local sales of petrochemicals and refined products increased 33.5% in 2011 as compared to 2010 as a result of a 32.3% increase in average local prices and a 4.2% increase in volumes sold due to the same reasons mentioned in the paragraph above related to Colombia’s economic growth.
Export Sales
In 2012, export sales of refined products and petrochemicals decreased by 8.2% as compared to 2011 due to a 4.0% decrease in average export prices of our products basket in line with the behavior of international prices partially offset by an increase of 2.7% in volumes sold.
Export sales of petrochemicals and refined products increased 49.0% in 2011 as compared to 2010 mainly as a result of a 42.4% increase in average export prices and an 8.0% increase in volumes exported, caused by greater fuel oil production at our Barrancabermeja refinery and an increase in the river transportation availability from Barrancabermeja to the Cartagena export terminal.
Total Refining and Petrochemicals Segment Sales to Third Parties
In 2012, total refining and petrochemicals segment sales to third parties decreased by 2.5% as compared to 2011 mainly as a result of the lower export sales of gasolines, diesel and fuel oil in line with the 4.0% decrease in average export prices of refined products due to the behavior of international prices.
Total refining and petrochemicals segment sales to third parties increased 38.2% in 2011 as compared to 2010 as a result of an increase in selling prices and in the volumes sold.
Marketing and Supply Segment Sales
Crude Oil
Local Sales
Since January 2010, we consider crude oil sold to Reficar as an export sale because it corresponds to special free trade zone sales. We do not have any other revenues that we record as revenues from crude oil local sales and do not record any local sales of crude oil in our Marketing and Supply segment.
Export Sales
In 2012, export sales of crude oil from our Marketing and Supply segment increased by 2.1% mainly due to a 4.4% increase in the average export price per barrel, mainly supported by the higher Brent and Maya benchmarks prices, and a 5.9% increase in the volume of export sales. Increased export sales also resulted from improvements in our transportation capacity and higher volumes of Vasconia and Magdalena blends commercialized, but were partially offset by a 2.7% appreciation of the Peso against the U.S. dollar.
Exports of crude oil allocated to our Marketing and Supply segment went up by 82.4% in 2011 as compared to 2010 as a result of higher volume available from purchases from third parties and the ANH as a result of an increase in other producers’ production and higher average export prices, partially offset by the appreciation of the Peso against the U.S. dollar.
Natural Gas
Local Sales
In 2012, local sales of natural gas from our Marketing and Supply segment decreased by 39.0% as compared to 2011, mainly as a result of less gas available for commercialization due to the decrease in gas purchases from the ANH, pursuant to Decree 2100 of 2011, through which other companies are also able to purchase gas directly from the ANH.
Revenues from local sales of natural gas from our Marketing and Supply segment decreased by 11.6% in 2011 as compared to 2010, mainly as a result of lower local demand, partially offset by a 32.1% increase in the average local prices.
Export Sales
In 2012, export sales of natural gas from our Marketing and Supply segment decreased by 71.1%, as compared to 2011, mainly as a result of less gas purchased from the ANH, pursuant to Decree 2100 of 2011, as described above.
Revenues from export sales of natural gas from our Marketing and Supply segment increased by 288.2% in 2011 as compared to 2010, mainly as a result of an increase in volume of export sales and increase in the average export prices.
Marketing and Supply Segment Sales to Third Parties
During 2012 and 2011, our Marketing and Supply segment sales to third parties increased by 7.0% and 77.9% respectively, in each case as compared to the prior year, principally due to an increase in the volume of export sales of crude oil and higher average selling prices. In addition, during 2012, the segment’s sales of crude oil were also positively impacted by our commercial strategy which included a market diversification of sales to countries in Asia.
Transportation and Logistics Segment Sales
In 2012, our Transportation and Logistics segment sales increased by 13.0% as compared to 2011 mainly due to the higher transported volume of crude oil, associated with (1) higher crude oil production in Colombia and (2) higher volume of products, mainly as a result of higher naphtha transported to dilute heavy crude oil. The segment sales were impacted as well by the revision of applicable tariffs charged per transported barrel approved by the Ministry of Mines and Energy.
Total transportation sales increased by 1.0% in 2011 as compared to 2010, mainly due to higher volumes transported, offset by a one-time transaction in 2010 and corresponding to a premium received by Ocensa from Pacific Rubiales Energy Corp to increase transportation capacity during that year.
Transportation and Logistics Segment Sales to Third Parties
Our transportation and logistics segment sales to third parties increased by 10.8% in 2012 compared to 2011 mainly due to the higher volume of crude oil produced by other companies in Colombia which required higher transportation services.
As a result of the above-mentioned increase in the segment volumes transported, after giving effect to eliminations from consolidation, our transportation and logistics segment sales to third parties decreased by 5.3% in 2011 compared to 2010.
Cost and Expenses
The following table sets forth elements of our cost of sales, operating expenses and operating income for the years ended December 31, 2012, 2011 and 2010.
| | | For the Year ended
December 31, | | | 2012/2011 | | | For the Year ended
December 31, | | | 2011/2010 | |
| | | 2012 | | | 2011 | | | % change | | | 2010 | | | % change | |
| | | (Pesos in millions) | | | | | | (Pesos in millions) | | | | |
| Cost of sales | | | 40,535,508 | | | | 36,704,584 | | | | 10 | % | | | 25,960,456 | | | | 41 | % |
| Operating expenses | | | 4,110,204 | | | | 3,389,950 | | | | 21 | % | | | 3,381,841 | | | | 0.2 | % |
| Operating Income | | | 24,206,290 | | | | 25,872,980 | | | | (6 | )% | | | 12,747,448 | | | | 103 | % |
Cost of Sales—Consolidated
Our cost of sales is affected by a number of factors, including the increase in international prices for crude oil. The most important factors are described below:
| · | Purchases of hydrocarbons from the ANH in 2012 increased 5% to Ps$8,452,336 million compared to 2011 and 51% in 2011 to Ps$8,048,981 million compared to 2010. Both increases were mainly the result of higher average prices and an increase in the volumes purchased. |
| · | Purchases of imported products in 2012 increased 7% to Ps$9,447,041 million compared to 2011 and 56% in 2011 to Ps$8,840,450 million as compared to 2010, as a result of (1) higher volumes of naphtha purchased for blending with increasing heavy crude oil production in order to transport it, (2) higher volumes of products (mainly low sulfur diesel) for blending to meet local environmental regulations regarding sulfur content and (3) higher average prices. |
| · | Purchases of crude oil from our business partners in 2012 increased 8% to Ps$7,207,707 million compared to 2011 and 47% in 2011 compared to 2010 to Ps$ 6,701,500 million, mainly as a result of higher average prices and an increase in the volumes purchased. |
| · | Services contracted with associations, which are pro rata expenses for our joint ventures, increased 14% in 2012 to Ps$2,037,205 million compared to 2011, mainly as a result of an increase in production activities and water treatment expense due to higher bottom sediment contained in crude. Services contracted with associations in 2011 increased 22% to Ps$1,791,681 million compared to 2010 due to an increase in production activities andhigh-price clauses in our joint venture agreements, which assign us additional production when oil prices are higher than a reference price (the “High-Price Clauses”). |
| · | Maintenance costs increased 22% to Ps$1,923,736 million compared to 2011, mainly due to the relocation and replacement of our transmission lines pursuant to our integrity program. See “Item 4. Overview by Business Segment—Transportation and Logistics—Integrity Program.” In addition, higher costs related the to repair and coating of pipes of existing wells as a result of the heavy rain season. Maintenance costs in 2011 increased 37% to Ps$1,570,912 million compared to 2010, mainly due to an increase in our operating activities and actions taken under our maintenance plan. |
| · | Labor costs in 2012 increased 9% to Ps$1,095,479 million compared to 2011 as aresult of an 11.1% increase in our total number of employees due to an increase in our operations and projects. Labor costs increased by 6% to Ps$1,001,102 million in 2011 as compared to 2010 as a result of an 8% increase in our total number of employees, due to an increase in our operations and projects. |
| · | Depreciation costs increased 4% to Ps$1,886,620 million in 2012 compared to 2011 and 17% to Ps$1,809,546 million in 2011 as compared to 2010, in each year mainly due to new investments and transport systems. |
| · | Services contracted with third parties increased 25% to Ps$1,088,597 million compared to 2011 and 2% in 2011 to Ps$872,565 million as compared to 2010, in each year as a result of increased supervision and technical management contracts for our business associations, due to increased exploration activity. |
The principal elements of our cost of sales by business segments are as follows:
Exploration and Production Segment’s Cost of Sales
Cost of sales affecting our Exploration and Production segment are mainly related to the amortization and depletion of our production assets, services contracted with outside vendors, maintenance costs, project expenses and labor costs related to this segment. In addition, this segment’s costs were impacted by imported naphtha and transportation services.
In 2012, cost of sales for this segment increased by 14.8% compared to 2011, mainly due to a 22.2% increase in cost of imported and locally purchased naphtha necessary to dilute and transport heavy crude oil, and a 14% increase of contracted services in the Joint Venture Agreements of the Rubiales and Quifa fields corresponding to higher subsoil activities and water treatment.
In 2011, cost of sales for this segment increased by 44.6%, mainly due to a 32.3% increase in our heavy crude oil production, which required increased purchases of imported naphtha to dilute and transport crude oil, and an increase in costs of services contracted (subject to High-Price Clauses) with certain business associations, such as Cravo Norte and La Cira, due to higher production and participation levels.
Refined Products and Petrochemicals Segment’s Cost of Sales
Cost of sales affecting our refined products and petrochemicals segment results primarily from the purchase of crude oil and natural gas to upload and feed our refineries, imported products for the refining process, feed stock transportation services, services contracted for refinery maintenance, and amortization and depreciation of refining assets.
In 2012, cost of sales for this segment remained practically flat compared to 2011, principally due to a 4.6% decrease in crude oil purchased from our Exploration and Production segment to upload our refineries, offset by a 4.0% increase in the cost of imported products and crude oil purchased from the ANH and third parties.
In 2011, cost of sales for this segment increased by 35.1% as compared to 2010, principally due to higher prices for the crude oil purchased from our Exploration and Production segment, third parties and the ANH.
Marketing and Supply Segment’s Cost of Sales
Cost of sales affecting our Marketing and Supply segment are mainly related to the costs associated with purchases of crude oil and natural gas volumes from the ANH and our business partners.
Cost of sales for this segment increased by 4.7% in 2012 and by 80.4% in 2011 due to the increase in volumes and prices of the crude oil purchased from the ANH and third parties. In 2011, costs were impacted by higher volumes and prices of natural gas purchased.
Transportation and Logistics Segment’s Cost of Sales
Cost of sales affecting our transportation and logistics segment are: (1) project costs, which relate to costs associated with the maintenance of transportation networks and (2) construction and conversion of existing pipelines for the transportation of heavy crude oil.
Cost of sales for this segment increased by 2.6% in 2012 as compared to 2011 principally due to the higher maintenance and contracted services costs associated with the development of our integrity program. See “Item 4. Overview by Business Segment—Transportation and Logistics—Integrity Program.”
Cost of sales for this segment increased by 31.5% in 2011 as compared to 2010 due to an increase in volumes transported through pipelines and tanker trucks and an increase in maintenance costs as a result of the heavy rain season that forced us to increase pipeline maintenance activities.
Operating Expenses
In 2012, our operating expenses increased by 21% as compared to 2011, mainly as a result of the following factors:
| · | An increase in provisions of 604% mainly due to valuation of property, plant and equipment. As per Colombian Government Entity GAAP, valuation of assets is to be performed every three years being in 2012. This process involves the comparison between the net book value and a technical value for a specific asset. The result of such exercise was the taking of a provision for impairment of some assets, mainly for buildings and transportation equipment from the Exploration and Production segment and the Transportation segment. |
| · | Labor expenses for operating and projects increased by 46% as a result of an increase in the number of employees, which, in turn, increased both wages and other benefits. |
| · | An increase in exploration expenses of 48%, primarily as a result of seismic studies and unsuccessful explorations. |
| · | An increase in overhead operational expenses of 19% primarily as a consequence of additional agreements signed with national police force as a strategy to ensure the normal course of operations. This entry was also affected by higher freight and customs charges on foreign sales. |
In 2011, our operating expenses increased by 0.2% as compared to 2010, mainly as a result of the following factors:
| · | Amortizations increased 50% in 2011 as compared to 2010 mainly as a result of goodwill amortizations. |
| · | Operating and administrative labor expenses increased 174% and 26%, respectively, as a result of the increased activities and projects. |
| · | An increase in taxes in 2011 as compared to 2010 due to the tax effect on the consolidation of Equion with Ecopetrol and the recognition of net worth tax of our subsidiaries Reficar, Ocensa and Oleoducto de Colombia. |
| · | Increases in amortizations, labor expenses and taxes were mainly offset by a decrease of 87% in operational allowances and a 97% decrease in the amount of fines paid for the non-fulfilment in gas supply in 2010. |
Each segment bears the costs and expenses incurred for product use or marketing and each segment assumes administrative expenses and all non-operational transactions related to their activity. Operating expenses by business segment are described below.
Exploration and Production Segment’s Operating Expenses
Operating expenses affecting our Exploration and Production segment are primarily for studies and projects, which correspond to expensing dry wells, amortization of the goodwill from our acquisitions and administrative expenses assigned to this segment.
These expenses increased by 28.3% in 2012 as compared to 2011 mainly due to the higher provisions for property, plant and equipment generated by the update made on the valuation of property, plant and equipment, as described above. In 2011, these expenses decreased by 8.8% as compared to the prior year.
Refining and Petrochemicals Segment’s Operating Expenses
Operating expenses affecting our Refining and Petrochemicals segment result primarily due to the amortization of goodwill from acquisitions, projects and administrative expenses assigned to this segment. In 2012, operating expenses decreased by 3.3% as compared to 2011 mainly due to the lower administrative expenses. In 2011, as compared to 2010, operating expenses increased by 10.6% mainly due to non-capitalized projects expenses.
Marketing and Supply Segment’s Operating Expenses
Operating expenses affecting our Marketing and Supply segment result primarily from relatively low administrative expenses related to the commercialization of crude oil and natural gas assigned to this segment. In 2012, operating expenses decreased by 4.9% mainly due to the lower Selling and Projects expenses.
Transportation and Logistics Segment’s Operating Expenses
Operating expenses affecting our Transportation and Logistics segment result primarily from the amortization of the goodwill from acquisitions assigned to this segment and the development of projects in order to improve our transportation systems. In 2012 and 2011, operating expenses increased by 30.1% and 81.2%, respectively, mainly due to expenses related to our increased transportation and logistics activity.
Non-Operating Income (Expenses)
The following table sets forth our non-operating income (expenses) for the years ended December 31, 2012, 2011 and 2010.
| | | At December 31, | | | 2012/2011 | | | At December 31, | | | 2011/2010 | |
| | | 2012 | | | 2011 | | | % change | | | 2010 | | | % change | |
| | | (Pesos in millions) | | | | | | (Pesos in millions) | | | | |
| Non-operating income (expenses): | | | | | | | | | | | | | | | | | | | | |
| Financial income, net | | | (167,889 | ) | | | (904,302 | ) | | | (81 | )% | | | 37,789 | | | | n.m. | |
| Pension expenses | | | (948,455 | ) | | | (706,298 | ) | | | 34 | % | | | (377,626 | ) | | | 87.0 | % |
| Inflation gain | | | 97,663 | | | | 21,836 | | | | 347 | % | | | 22,030 | | | | (0.9 | )% |
| Other income (expenses), net | | | (855,908 | ) | | | (642,784 | ) | | | 33 | % | | | (937,024 | ) | | | (31 | )% |
n.m. = Not meaningful.
Financial income, net. Financial income, net, mainly includes exchange difference gains or losses and , interest expenses, yields and interest from our investments, and results from our hedging operations. During 2012, our results reflected a net financial expense primarily due to the cumulative exchange rate loss resulting from the appreciation of the Peso against the U.S. dollar. During 2011, our results reflected a net financial expense due to the results in our commodity hedging financial side (put options on WTI Nymex and swaps calculated using the Maya-WTI spread), affected by the spreads between Maya heavy crude oil and WTI light crude oil benchmark prices, which resulted in higher prices for heavy crude oil compared to those of the light crude oil.
Pension expenses. Pension expenses grew by 34% in 2012 when compared to 2011, principally as a result of (1) an actuarial calculation update for the health reserve due an increase of approximately 23% in the average health services costs per beneficiary and an increase of approximately 3.5% in the population covered (retirees and their beneficiaries) and (2) an increase of approximately 9% in the education reserve. Additionally, the actuarial calculation of 2012 included an increase of 1.5% on top of inflation taking into account the upward trend in the Company’s growth. In 2011, pension expenses increased by 87% when compared to 2010, mostly as a result of (1) the actuarial calculation updating the health reserve which increased mainly due to a rise of approximately 21% in the average health services costs per beneficiary and an increase of approximately 15% in the population covered (retirees and their beneficiaries) and (2) an increase in health care services resulting from an increase of approximately 20% in medicine supplies and services due to the increase in the average age of the retirees and their beneficiaries. See Note 1 to our consolidated financial statements.
Other income (expenses), net.Other income, net, includes recovery of provisions, other revenues and other recoveries. Other expenses, net, include legal and other provisions and taxes unrelated to income. Other income (expenses), net, increased by 33% in 2012 compared to 2011, mainly due to a decrease of 27% in other income in 2012 as compared to 2011, mainly as a result of (1) a decrease of 14% in allowance recoveries due to a lower recovery in 2012 of environmental, legal and healthcare provisions and (2) recovery of expenses in 2011 which had no longer effect in 2012. As of December 31, 2011, there had been an increase in recovery of services to partners, which mainly corresponded to (1) recoveries of associated pension services, product of our association with Occidental Petroleum Corporation and (2) income from commercially-declared fields held in association with partners. Other income (expenses) decreased 31% in 2011 compared to 2010, principally due to a recovery of past provisions for legal proceedings and other recoveries, such as the recovery of our allowance for pension liabilities, partially offset by an increase in taxes not related to income and new legal, pension liability and other provisions.
Income Before Income Tax
Income before income tax decreased by 5.5% in 2012 as compared to 2011. This was mainly due to higher unexpected costs of water treatment and higher prices of larger volume purchases of hydrocarbons. Income before income tax increased by 105.7% in 2011, compared to 2010, as a result of higher revenues from greater average price of crude oil and an increase in the exported volumes of crude oil.
Income Tax
The effective income tax rate for 2012 was 31.9% compared to 33.7% in 2011 and 28.2% in 2010. The decrease in the effective income tax rate in 2012 compared to 2011 was primarily due to the deferred tax credit on the valuation of investments, which caused a reduction of 1.65% in the tax rate. The increase in the effective income tax rate in 2011 compared to 2010 was primarily due to the elimination, as of January 1, 2011, of the income tax deductions on investments in real productive fixed assets.
Net Income
As a result of the foregoing, in 2012 our net income decreased by 4.36% as compared to 2011. In 2011, it increased by 90% as compared to 2010.
Principal Differences Between Colombian Government Entity GAAP and U.S. GAAP
We prepare our financial statements in accordance with Colombian Government Entity GAAP. The accounting principles and regulations under Colombian Government Entity GAAP differ in certain significant respects from U.S. GAAP. The following is a description of the most relevant differences between Colombian Government Entity GAAP and U.S. GAAP. Note 35 to our consolidated financial statements presents reconciliations of net income and shareholders’ equity determined under Colombian Government Entity GAAP to these same amounts as determined according to U.S. GAAP, as well as a complete description of the differences between the two accounting standards. The principal differences between Colombian Government Entity GAAP and U.S. GAAP are as follows:
Advances Received from Ecogas for Build, Operate, Maintain and Transfer Contracts
Under Colombian Government Entity GAAP, payment obligations under the Build, Operate, Maintain and Transfer, or BOMT, contracts were treated as equivalent to an operating lease. Under U.S. GAAP, the obligations were treated as capital leases, and an asset and liability were recognized. Payments under the BOMT contracts serve to reduce liability and the asset is depreciated. Subsequently, we subleased the same asset to Ecogas, with the corresponding treatment of the payments receivable from Ecogas as direct financing leases for U.S. GAAP purposes.
Reversal of Concessions
Under Colombian Government Entity GAAP, we recorded an asset for the contributions of the Nation of crude oil and natural gas reserves derived from the return of oil field concessions to the Nation, which took place before the effectiveness of Decree 1760 of 2003 came into effect. Reserves were valued by means of the technical-economic model where the value per barrel resulted from the relation of the net present value obtained at a discount rate and the total proved reserves on the contribution date. For U.S. GAAP purposes, these reversions were considered a transfer of assets between entities under common control. Ecopetrol as the entity that received the net assets, should have initially recognized the assets transferred at their carrying amounts in the accounts of the transferring entity at the date of transfer, which in this case would be zero as the transferring entity did not recognize a carrying value.
Effects of Inflation on Financial Information
The accompanying consolidated financial statements have been prepared from the accounting records, which are maintained under the historical cost convention, modified since 1992 to comply with the legal provisions of the CGN to recognize the effect of inflation on non-monetary balance sheet accounts until December 31, 2001, including equity. The CGN eliminated the use of inflation adjustments for accounting purposes for state-owned companies starting on January 1, 2002. However, our consolidated financial statements recognize the effect of inflation on non-monetary balance sheet accounts for an extended period from January 1, 1992 until December 31, 2006 for Propilco S.A., COMAI – Compounding and Masterbatching Industry Ltda, Hocol, Oleoducto de Colombia S.A., and Ocensa because prior to our acquisition of these companies, they were subject to the accounting rules applicable to Colombian privately owned entities. Under such rules, the effect of inflation on non-monetary balance sheet accounts was required to be recognized until December 31, 2006. The accumulated inflation adjustments were eliminated in the process of reconciling our financial statements to U.S. GAAP.
Valuation Surplus
Under Colombian Government Entity GAAP, property, plant and equipment are revalued every three years in accordance with market value and the investments in unconsolidated investees are revalued by using the equity intrinsic value (percentage of ownership of the Company in the equity of the investee). The excess of these amounts over the carrying amount is treated as valuation surplus with a corresponding amount in equity (valuation surplus). Revaluation of these assets is not done for purposes of U.S. GAAP.
Variable Interest Entity
Under Colombian Government Entity GAAP, consolidation with significant subsidiaries is required when there is control by having more than 50% ownership or majority of the voting rights in the subsidiary. Under U.S. GAAP (FIN 46 (R)), if an entity has variable interests whereby one party absorbs losses or benefits from net profits in excess of its ownership interest then those variable interests must be evaluated. Ocensa was not consolidated under Colombian Government Entity GAAP until March 2009 since Ocensa was a variable interest entity under the rules of ASC 810 and was included in our consolidated results pursuant thereto until March 2009. Thereafter, Ocensa was consolidated under both Colombian Government Entity GAAP and U.S. GAAP. See Note 35 to our consolidated financial statements for a description of our analysis.
Equity Method Accounting
Under Colombian Government Entity GAAP, the equity method is applied for investments where significant influence, but not control, exists. However, unlike U.S. GAAP, there is no ownership requirement between 20% to 50%.
Employee Benefit Plans
There are significant differences in the measurement of expense and balance sheet amounts for employee benefit plans between Colombian Government Entity GAAP and U.S. GAAP. See “—Critical Accounting Policies and Estimates—Pension Plans and Other Benefits” and Note 35 to our consolidated financial statements.
Investment Securities
There are significant differences in the measurement of expense and balance sheet amounts for investments between Colombian Government Entity GAAP and U.S. GAAP. See Note 35 to our consolidated financial statements.
Provisions — Allowances and Contingences
There are significant differences in the measurement of expense and balance sheet amounts for provisions—allowances and contingences—between Colombian Government Entity GAAP and U.S. GAAP. See Note 35 to our consolidated financial statements.
Cumulative Translation Adjustment
Under Colombian Government Entity GAAP, foreign currency investments held in a currency other than U.S. dollars must be remeasured to U.S. dollars prior to translating such financial information to Colombian pesos as the reporting currency. Any impact as a result of the translation process is recognized in equity as cumulative translation adjustments.
Under U.S. GAAP, investments in foreign currency must be remeasured to the functional currency with the effects recorded in the income statement and translate them to the reporting currency with the effects recognized in equity as cumulative translation adjustments.
Liquidity and Capital Resources
Our principal sources of liquidity in 2012 were cash flows from our operations amounting to Ps$20,531,233 million and cash flows from financing activities, mainly from the proceeds of our additional indebtedness, which totaled Ps$5,110,249 million. Our principal uses of liquidity in 2012 were (1) Ps$15,467,862 million in capital expenditures, which included investments in natural and environmental resources and reserves, and additions to our property, plant and equipment, (2) dividend payments for the fiscal year 2012 amounting to Ps$ 8,419,331 million and (3) taxes charged to Ecopetrol amounting to Ps$8,320,779. We believe that our financial performance driven by high production and favorable prices along with our access to additional indebtedness have resulted in cash sufficient to fund our operational activities and our investment plan.
At December 31, 2012, we had outstanding consolidated indebtedness of Ps$13,705,825 million, which corresponded mainly to:
| · | Ps$1,600 billion (approximately US$905 million) outstanding out of a Ps$ 2,220 billion (approximately US$1 billion) under a syndicated loan facility entered into by Ecopetrol with a syndicate of 11 local banks in May 2009. This loan facility has a term of seven years with a two-year grace period. The interest rate under the facility equals the DTF, plus an additional 4%. We make amortization payments semi-annually under the facility. In November 2011, we modified the guarantee we initially granted in this loan by replacing the original pledge over direct stock in Reficar (which was 49% of the total shares at the time of the loan), Ocensa and Propilco with a new pledge over our direct stock in Hocol Petroleum Limited, Offshore International Group (which corresponds to 50% of the total share) and Propilco. We used the proceeds from this loan to finance our Strategic Plan. |
| · | An issuance of US$1,500 million aggregate principal amounts of 7.625% Notes Due 2019 (the “Original Notes”) on July 23, 2009 by Ecopetrol. The Original Notes were issued pursuant to Rule 144A/ Regulation S with registration rights with the SEC. The Original Notes were subsequently registered with the SEC on September 3, 2009 (the “Registered Notes”). Concurrently with this registration, we commenced an exchange offer to exchange up to US$1.5 billion aggregate principal amount of the Registered Notes for an equal principal amount of our outstanding Original Notes under the terms and subject to the conditions set forth in a prospectus dated September 3, 2009. The exchange offer was carried out in compliance with the obligations acquired by us under the Registration Rights Agreement referred to in the prospectus. The exchange offer expired on October 2, 2009. Bond exchange requests were received in an aggregate amount of US$1,492,541,000. On October 7, 2009, we issued an aggregate amount of US $1,492,541,000 in Registered Notes and cancelled an aggregate amount of US$1,492,541,000 in Original Notes. The Registered Notes were listed on the NYSE. |
| · | A local issuance of Ps$1,000 billion (approximately US$517 million) notes on December 1, 2010 by Ecopetrol. The notes were issued in four tranches with maturities of five, seven, ten and 30 years and with variable interest rates based on the Consumer Price Indexplus spreads of 2.80%, 3.30%, 3.94% and 4.90%, respectively. The notes have semi-annual payments of interest and bullet amortization for each tranche. We used the proceeds from the offering of these notes to finance our capital expenditures in 2010. |
| · | US$2.7 billion outstanding out of US$3.5 billion under three facilities held by Reficar with international banks and export credit agencies (United States Export Credit Agency, Export-Import Bank of the United States (the US Eximbank), the Italian Export Credit Agency (SACE) and Exportkreditnämnden (EKN), the official Export Credit Agency in Sweden) to finance the refinery’s expansion. The facilities have a tenor of 16 years and begin amortization as of June 2014. |
| · | ODL: Ps$720 billion (approximately US$407 million) outstanding out of Ps$800 billion under a loan facility with local banks. This loan facility was executed in May 2010 and has a term of seven years with a two-year grace period and the principal amount will be amortized in 20 equal quarterly payments. This loan has an interest rate of DTF + 4%. |
| · | ODL: Ps$400 billion (approximately US$226 million) series of notes outstanding, having a maturity of seven years, will be amortized in five equal payments from 2012 to 2016 and have an interest rate based on the consumer price index plus an additional spread of 4.88%. |
| · | Oleoducto Bicentenario de Colombia: Ps$1,295 billion (approximately US$732 million) out of Ps$2.1 trillion under a facility due in 2024 with an interest rate of DTF + 4.54%. The loan will be amortized in 44 quarterly payments after a one-year grace period. |
| · | Ocensa: Ps$900 billion (approximately US$509 million) outstanding out of Ps$1,200 billion under a term facility due 2017 with an interest rate of DTF + 4%. We make amortization payments semi-annually under the facility. |
On March 22, 2013, we entered into a credit facility guaranteed by the US Eximbank. The four international lender banks are JPMorgan Chase Bank, N.A., The Bank of Tokyo-Mitsubishi UFJ LTD, Mizuho Corporate Bank, Ltd. and Citibank N.A.
The facility consists of two parts, whose terms are governed by: (1) a Facility Agreement for US$420,442,800, amortized over 7 years at a rate of LIBOR + 0.65 and (2) a Credit Agreement for US$426,616,323, amortized over 10 years at a rate of Libor + 0.90. The funds can only be disbursed abroad and used exclusively to pay for goods and services purchased from U.S. providers. Therefore, none of the foreign currency disbursed pursuant to these facilities will be entering Colombia. Ecopetrol has not yet drawn on either of these facilities.
Use of Funds
Capital Expenditures
The following table sets forth our consolidated capital expenditures for each of our business segments for 2012, 2011 and 2010.
| | | For the Year ended December 31, | |
| | | 2012 | | | 2011 | | | 2010 | |
| | | (Pesos in millions) | |
| Exploration and Production | | | 8,223,165 | | | | 8,067,968 | | | | 5,878,246 | |
| Refining and Petrochemicals | | | 4,458,762 | | | | 3,044,252 | | | | 2,084,554 | |
| Transportation and Logistics | | | 2,781,277 | | | | 3,382,463 | | | | 2,351,662 | |
| Corporate | | | - | | | | - | | | | - | |
| Marketing and Supply | | | 4,657 | | | | 5,988 | | | | 5,513 | |
| Total | | | 15,467,862 | | | | 14,500,671 | | | | 10,319,975 | |
The budget for our capital expenditures under our Strategic Plan for the period 2012 - 2020 is approximately US$84.7 billion distributed by business segment. See “Item 4. Information on the Company—The Company—Strategic Plan.”
Our investment plan approved for 2013 amounts to US$9,549 million of which US$6,590 million is expected to be invested directly in Ecopetrol S.A. and US$2,959 million in our subsidiaries. According to the plan, 93% of investments are expected to be made in Colombia and the remaining 7% for exploration and production projects along the U.S. Gulf Coast, Brazil and Peru. As in prior years, the majority of investments (62%) is intended for exploration and production. From the investment amount in our subsidiaries in 2013, US$1.336million is expected to be invested by them through their own cash generation, commercial financing and third-party or partner contributions, and distributed by segments as follows: 43% in downstream, 19% in midstream and 38% in upstream branches. We expect our existing and anticipated working capital, capital expenditure requirements and declared dividend payments to be met from our cash flows from operations and cash on hand, and to fund part of our capital expenditures through the local and international financial markets. We believe that we should be able to access local and international debt markets if the need arises, although we can make no assurances that these external sources of financing will be available in terms acceptable to us, if at all. See “Item 3. Key Information—Risk Factors—Risks related to our business.” Furthermore, we may decide to access the equity markets through the issuance of an additional 8.49% of our common stock as authorized by Law 1118 of 2006, or through credit facilities with commercial banks, export development credits and sale of shares in non-strategic assets. The schedule for carrying out our investment plan depends on our cash generating activities, capital market conditions, execution of the investment budget in the various business areas and possible acquisitions. Our investment plan and anticipated capital expenditures in future years may change based on market and other conditions and our results of operations and financial resources.
Cash from Operating Activities
Net cash provided by operating activities decreased by 11% in 2012 compared to 2011 as a result of a 10% increase in cost of sales as a result of purchases of crude oil at higher international prices. Net cash provided by operating activities increased by 59% in 2011 compared to 2010 as a result of an increase in the average price of crude oil and natural gas and in volumes produced, which resulted in a 57% increase in our total revenues.
Cash Used in Investing Activities
In 2012, net cash used in investing activities decreased by 7% as compared to 2011 mainly due to the fact that we did not make any acquisition of companies as was the case in 2011. Additionally, during 2012, the investments for liquidity purposes decreased according to internal policies.
Net cash used in investing activities increased by 35% in 2011 compared to 2010 mainly as a result of an increase in our property, plant and equipment investments resulting from our increasing activities. These investments were partially funded by cash provided by our portfolio investments, which totaled Ps$9,861,330 million.
Cash Used in Financing Activities
Net cash used in financing activities increased 22% in 2012 compared to 2011 mainly due to an increase in dividend payments, partially offset by cash inflows derived from indebtedness from our subsidiaries Reficar and Bicentenario. Net cash used in financing activities increased in 2011 compared to 2010 mainly due to an increase in dividend payments, partially offset by the proceeds from the second round of our shares offering and from our minority interest in other companies. See “—Liquidity and Capital Resources.”
Dividends
In 2012, we paid dividends of Ps$8,419,331 million to our shareholders, including the Nation, to whom we owed Ps$3,915,436 million as of December 31 2012. That amount was paid as of January 2013. On March 21, 2013, our shareholders at the ordinary general shareholders’ meeting approved dividends for the fiscal year ended December 31, 2012, amounting to Ps$11,964,959 million, or Ps$291 per share, based on the number of outstanding shares at December 31, 2012. The dividend per share was comprised of an ordinary dividend of Ps$255 per share and an extraordinary dividend of Ps$36 per share. Ordinary dividends corresponding to the Nation will be paid in six installments. The first payment was made on April 15, the second will be made on September 16, the third will be made in October 16, the fourth will be made on November 14, the fifth will be made on December 6, and the last payment will be made between December 2013 and January 15, 2014. The extraordinary dividend to be paid to the Nation will be paid between December 16, 2013 and January 31, 2014. The payment of the ordinary and extraordinary dividend to the minority shareholders was made in one lump sum on April 15, 2013.
Research and Development, Patents and Licenses, etc.
Our Vice-Presidency of Technology and Innovation was created in 2012 to add value to our business chain through the managing of innovation, technology, knowledge and development of competitive advantage. The Vice-Presidency of Technology oversees three directorates: The Colombian Petroleum Institute (Instituto Colombiano del Petróleo, ICP or the Institute), the Directorate of Information Technology, or DTI, and the new Strategic Directorate of Knowledge, Innovation and Technology, or DCT.
Our research and development activities are conducted by the Institute, our research, development, transfer and data-protection unit. Its activities are focused on developing technology solutions for us and the Colombian oil industry. Its scope covers the entire value chain of the company: exploration, production, refining, transportation, supply and marketing, as well as environmental issues, integrity and automatization. Each year, we present to the Colombian Institute for the Development of Science and Technology (Instituto Colombiano para el Desarrollo de la Ciencia y la Tecnología, or COLCIENCIAS) our research and development projects in order to get a certification for our investment in science and technology. In 2012, 2011 and 2010, COLCIENCIAS recognized investments of US$86.15 million, US$50.83 million, and US$46.5 million, respectively, in science and technology projects. Our total investment in science and technology during 2012 was approximately US$97.3 million, of which approximately US$52.26 million corresponded to 12 high-risk projects in research and development related to air and chemicals injection in oil fields, application of technologies for offshore exploration, petroleum systems in convergent margins, non-conventional hydrocarbons, biofuels, petrochemicals new refining processes, scaling deasphalting process and heavy oil upgrading, among others. We also invested US$45 million in projects for specialized technical and technological development as well as knowledge for strategic business groups. In 2011, we invested approximately US$67.8 million, and in 2010 we invested approximately US$69.1 million.
Our intellectual capital is preserved through a technological value-generation process and an intellectual property protection process, which include the consolidation of trade secrets, patents, copyrights, trademarks and publications in specialized journals. In the last seven years, we have filed 126 new patent applications including nine in 2012 for issues related to 3D seismic acquisition, surfactants for hydrocarbon transport, detection drilling tools for pipes and processes for production of bio-products from vegetable oils.
We currently hold 44 patents in Colombia, the United States, Mexico, Russia, Peru, Venezuela, Ecuador, Brazil and Nigeria. In 2012, 21 new patents were granted. In addition, a layout-design of integrated circuit was awarded in Colombia. Our efforts in applications have been focused on improving additives production and the optimization of refining processes, equipment and tools to prevent fuel theft from pipelines, improvements in the transport of heavy and extra heavy crude oils and processes to obtain biofuels from vegetable oils at refineries, among others. In 2011, we filed for 28 new patents in various countries, including Colombia, the United States, Brazil, Mexico, Indonesia and Malaysia. One of our most significant patents for which we filed an application in 2009, is an anti-theft patent that allowed us to reduce fuel oil and crude oil theft by 50% in 2009 compared to 2008. Most of our patents will expire between 2016 and 2029.
In 2012, we registered eight copyrights, reaching a total 135. We also registered 33 trademarks, such as our first slogan, “Clean Barrels.”
During 2012 and 2011, two new commercial brands were granted to us. In 2010, we were also granted nine new commercial brands, adding to the 20 brands we had been granted previously (the existing brands have been renewed for an additional ten-year period).
Ecopetrol became the first Colombian company to obtain the American MAKE Prize (Most Admired Knowledge Enterprises), an international award that recognizes a company’s ability to transfer knowledge in order to improve performance through its operational, administrative and management areas. We were ranked among the ten best in this category of the Americas. Likewise, Ecopetrol has been selected for the third consecutive year as a finalist for the Global MAKE award, where it was ranked 28 among 112 nominees worldwide.
In 2010, the ICP’s Technical Information Center became one of the first specialized information units in the oil and gas sector in Latin America to receive the certification in the System of Information Security Management under the NTC/ISO 27001:2005, standard granted by theInstituto Colombiano de Normas Técnicas, or ICONTEC, a Colombian National Standards organization.
In 2012, the scores for repeatability and reproducibility programs conducted by the ICP with about two thousand international laboratories from the American Society for Testing and Materials, or ASTM, the United Kingdom Petroleum Institute and Shell, among others, remained above 95%, keeping the international quality standards for laboratories.
Off-Balance Sheet Arrangements
As of December 31, 2012, we did not have off-balance sheet arrangements of the type that we are required to disclose under Item 5.E of Form 20-F.
Tabular Disclosure of Contractual Obligations
Contractual Obligations
We enter into various commitments and contractual obligations that may require future cash payments. The following table summarizes our contractual obligations at December 31, 2012.
Payments Due by Period
| | | Payments due by period | |
| | | Total | | | Less than 1
Year | | | 1 to 3
years | | | 3 to 5
years | | | More than 5
years | |
| | | (Pesos in millions) | |
| | | | | | | | | | | | | | | | |
| Contractual Obligations: | | | | | | | | | | | | | | | | | | | | |
| Employee Benefit Plan | | | 23,383,379 | | | | 894,522 | | | | 2,901,201 | | | | 3,214,951 | | | | 16,372,705 | |
| Contract Service Obligations | | | 4,850,309 | | | | 2,261,958 | | | | 2,426,488 | | | | 75,907 | | | | 85,956 | |
| Operating Lease Obligations | | | 239,430 | | | | 77,424 | | | | 145,714 | | | | 15,615 | | | | 677 | |
| Natural Gas Supply Agreements | | | 905,382 | | | | 166,074 | | | | 315,403 | | | | 209,101 | | | | 214,805 | |
| Purchase Obligations | | | 204,623 | | | | 114,833 | | | | 89,791 | | | | - | | | | - | |
| Energy Supply Agreements | | | 186,946 | | | | 100,981 | | | | 71,968 | | | | 13,885 | | | | 112 | |
| Capital Expenditures | | | 2,338,684 | | | | 2,147,849 | | | | 172,631 | | | | 9,095 | | | | 9,108 | |
| Build, Operate, Maintain and Transfer Contracts (BOMT) | | | 395,422 | | | | 55,789 | | | | 113,187 | | | | 104,976 | | | | 12,146 | |
| Capital (Finance) Lease Obligations | | | 65,583 | | | | 23,468 | | | | 37,209 | | | | 4,905 | | | | - | |
| Financial Sector Debt | | | 13,043,545 | | | | 1,529,364 | | | | 5,180,899 | | | | 1,570,173 | | | | 4,763,109 | |
| Bonds | | | 6,032,396 | | | | 270,944 | | | | 904,952 | | | | 662,253 | | | | 4,194,247 | |
| Total | | | 51,536,375 | | | | 7,643,206 | | | | 12,359,443 | | | | 5,880,861 | | | | 25,652,865 | |
| ITEM 6. | Directors, Senior Management and Employees |
Directors and Senior Management
The information below sets forth the names and business experience of each of our Directors, executive officers and senior management, as of the date hereof:
Directors of Ecopetrol
The following are our current Directors as elected at the shareholders’ meeting held on March 21, 2013:
Minister of Mines and Energy, Federico Rengifo Vélez (59) has been member of our Board of Directors since March 24, 2011. He has served as Minister of the Interior and Director of the Administrative Department of the Presidency of the Republic of Colombia. He has also been Vice-Minister and Minister of Finance, Economic Development, and Mines and Energy of Colombia. He has served as Executive President of the Banco de Colombia, President of Compañia Financiera Internacional S.A., and member of the city council of Cali (Valle del Cauca – Colombia), among others. Currently, Mr. Rengifo is also a member of the Board of Directors of ISA, Isagen and chairman of the board of the National Hydrocarbons Agency and the Institute of Geological Services. He has participated in several boards of directors of the financial and public sectors. Mr. Rengifo is a lawyer of Javeriana University and has a master’s degree in socioeconomic sciences. Mr. Rengifo was appointed as a director by the Nation.
Minister of Finance and Public Credit, Mauricio Cárdenas Santamaría (50) has been a member of our Board of Directors since March 27, 2008. Mr. Cárdenas was the Minister of Mines and Energy of Colombia from September 26, 2011 to August 30, 2012. He has served as Senior Fellow and Director for Latin America Initiative of Brookings Institution, Massachusetts, Washington, D.C. Previously, Mr. Cárdenas served as Executive Director of Fedesarrollo (Fundación para la Educación Superior y el Desarrollo), President of Empresa de Energía Eléctrica de Bogotá, Minister of Economic Development, Minister of Transport and Director of the National Planning Agency of Colombia. Mr. Cárdenas has also served as a member of the Board of Directors of various organizations, including the Latin American and Caribbean Economic Association (LACEA), Universidad de los Andes and the BVC. Currently, he is a director of the Central Bank of Colombia. Mr. Cárdenas holds a BA and an MSc in economics from the Universidad de los Andes and a Ph.D. in economics from the University of California, Berkeley. In 2001, Mr. Cárdenas was a visiting scholar at Harvard University’s Center for International Development. In 1999, he was elected by Time Magazine and CNN as one of Latin America’s Leaders for the New Millennium. Mr. Cárdenas was appointed as director by the Nation.
Director of the National Planning Agency of Colombia, Mauricio Santamaría Salamanca (46) has been a member of our Board of Directors since January 24, 2012. He was Minister of Health and Social Protection between 2010 and 2012. He has been Deputy Director and Deputy Executive Director of Fedesarrollo. He also has been Deputy Director and Director of Infrastructure and Energy, Director of Social Development and head of the Foreign Business Division of the National Planning Agency of Colombia. Mr. Santamaría was a Senior Economist and Advisor at the World Bank. He was a member of the Board of Directors of Ecopetrol in 2006. He earned a Ph.D. degree and a master’s degree in economics from Georgetown University. He holds a BA in economics from the Universidad de los Andes. Mr. Santamaría was appointed as a director by the Nation.
Jorge Pinzón Sánchez (54) has been a member of our Board of Directors since December 6, 2012. He is a freelance attorney and an arbitrator registered at the Centers of Conciliation and Arbitration of the Chambers of Commerce of Bogotá and Barranquilla. He was a partner at Estudios Palacios Lleras S.A. and served as the head of the Superintendency of Corporations as well as of the Superintendency of Finance of Colombia. He was also a member of the Advisory Committee of the Banking Superintendency, member of the General Board of the Securities Superintendency of Colombia, Secretary General of the Ministry of Finance and Public Credit and Deputy General Counsel, Secretary General and General Counsel of Banco del Comercio, among other positions in the public and private sector. He serves as an arbitrator in the Center of Arbitration of the Chamber of Commerce of Bogotá and served several years as a Colombian representative to the United Nations Commission on International Trade Law (UNCITRAL). Mr. Pinzón has been a member of several boards of directors of Colombian financial sector companies. He also was a law professor at Universidad Javeriana, Universidad de los Andes, as well as other universities. He has also published several legal articles. Mr. Pinzón earned a degree in law and a master’s degree in Philosophy from Universidad Javeriana. He was appointed as an independent Director.
Fabio Echeverri Correa (80) has been a member of our Board of Directors since September 16, 2002, and is its current Chairman. From 1957 to 1962, Mr. Echeverri served as President of Banco de Colombia and Banco Comercial Antioqueño. Since then, he has held various positions in the private and public sectors, serving as President of Siderurgica de Medellin and Director of the National Businessmen Association of Colombia (ANDI), the Latin American Association of Industries (AILA), and the Andean Confederation of Industries (CONANDI). He has been a member of the Inter-American Council of Commerce and Production for over 18 years. Mr. Echeverri is currently a member of the board of directors of the Shaio Clinic, Telecom-Colombia and Frigoríficos Ganaderos de Colombia S.A. During his career, Mr. Echeverri has been a chairman of the board of directors of Fondo Ganadero de Antioquia and the board of directors of Siemens S.A., among others. Mr. Echeverri earned a bachelor’s degree in economics from Universidad Jorge Tadeo Lozano. Mr. Echeverri was appointed as an independent director.
Joaquín Moreno Uribe (64) has been a member of our Board of Directors since March 27, 2008. Mr. Moreno worked for 33 years for the Royal Dutch/Shell Group. He has held various positions such as Project Manager in Colombia; Project and Operations Manager and Marketing and Operations Manager of Shell Química de Venezuela; Director of Marketing for Agrochemical Products and Global Marketing Manager for Petrochemical Products at Shell Centre–Shell International Chemicals Company in London; Director of Shell Venezuela S.A.; Director of Shell Colombia S.A., Director of Cerromatoso S.A., and Exploration and Production Business Economics and Strategic Planning Director for Europe and the Middle East at the Shell International Central offices in The Hague, the Netherlands. Mr. Moreno has also served as Country Chairman and President for Shell in Mexico, Colombia and Venezuela, as well as Regional CEO for Downstream Oil Business in the Northern Latin American Region. Mr. Moreno has been a member of the boards of directors of various local and international companies. Mr. Moreno earned a degree in civil engineering from Universidad Industrial de Santander and completed a program in advanced management at Harvard University Business School in Cambridge, Massachusetts. He was appointed as an independent Director.
Luis Carlos Villegas Echeverri (55)has been a member of our Board of Directors since March 22, 2012. Mr. Villegas has been President of the National Businessmen Association of Colombia or ANDI since 1996. Prior to his position as President of ANDI, he served as the Economic Advisor to the Colombian Embassy in France, Vice-Minister of Foreign Affairs of Colombia, Governor of the Department of Risaralda, General Secretary of the National Federation of Coffee Growers of Colombia, and Senator. Mr. Villegas has served as a member of the boards of directors of several financial and industrial companies throughout Colombia. Mr. Villegas is also President of the National Council of Private Sector Associations and a board member of the International Organization of Employers. In 1999, Mr. Villegas was designated Chairman of the Board of the Fund for Reconstruction and Social Development of the “Eje Cafetero” region, overseeing all reconstruction efforts following the earthquake that hit the region in that year. Mr. Villegas earned a degree in law and social economics from the Universidad Javeriana and attended a graduate program on Public Administration at the University of Paris II. Mr. Villegas was appointed as an independent director.
Amilcar Acosta Medina(62) has been a member of our Board of Directors since his appointment at the extraordinary shareholders’ meeting held on August 3, 2011. From 2002 to 2004, he served as Advisor to the Office of the General Comptroller of the Republic. Mr. Acosta served in the Senate of Colombia from 1991 until 2002 and was the President of the Colombian Congress from July 1997 to July 1998. From 1990 to 1991, he served as Deputy Minister of Mines and Energy. He has held positions as a researcher and professor at several universities and published many books and research articles on economics and on the mines and energy sector. He has been a columnist for the leading newspapers of Colombia. Mr. Acosta earned a BA in Economics from the University of Antioquia. He was appointed by the shareholders’ meeting as an independent director representing the hydrocarbon producing departments of Colombia.
Roberto Steiner Sampedro (53)has been a member of our Board of Directors since October 12, 2011. Mr. Steiner is an associated researcher and former Executive Director of Fedesarrollo. He served as Alternate Executive Director of the International Monetary Fund from 2002 to 2007, Director of the Economics Research Department of the Central Bank of Colombia from October 1989 to April 1993, Director of the Economic Development Research Centre of Universidad de los Andes, Consultant at the World Bank from 1995 to 1996, Deputy Director of Fedesarrollo from 1993 to 1994, Deputy Director of the Economics Research Department of the Central Bank of Colombia from 1988 to 1989, and Senior Economist at the Central Bank of Colombia from 1986 to 1988. He was professor and researcher at various Colombian universities, including the Universidad de los Andes, Universidad Javeriana and Universidad Nacional. In 1995, he was a summer professor at Columbia University in New York. He has published several books, articles and research papers on economics. Mr. Steiner earned a degree in economics from Universidad de los Andes and M.A. and M.Phil degrees in economics from Columbia University in New York. Mr. Steiner was appointed by the shareholders’ meeting as an independent director representing the minority shareholders and currently serves as the audit committee financial expert.
Officers and Senior Management of Ecopetrol
In November 2012, our Board of Directors approved changes to our senior management’s structure adding one new position: Vice-President of E&P’s Technique and Development.
The following presents information concerning our executive officers and senior management.
Javier Gutiérrez (61) has served as our President and Chief Executive Officer since January 22, 2007. Prior to becoming our CEO, Mr. Gutiérrez served as CEO of Interconexión Eléctrica S.A. ESP (ISA) since 1992, where he started in the planning department in 1975. Mr. Gutiérrez also worked as Vice-President of the Colombian Commission for Regional Electric Integration from 1995 to 1997. In 2002, Mr. Gutiérrez received an award from the Portafolio economic journal as the “Best Enterprise Leader in Colombia.” In 2005, the América Economía Journal granted Mr. Gutiérrez an award of excellence and in the same year, La República, a renowned financial journal in Colombia, ranked Mr. Gutiérrez among Colombia’s top 10 executives. In 2008, Mr. Gutiérrez was recognized as the enterprise leader with the best reputation in Colombia by the Spanish Monitor of Corporate Reputation (MERCO). Mr. Gutiérrez earned a degree in civil engineering and a master’s degree in industrial engineering from Universidad de los Andes and a specialization degree in finance from Universidad EAFIT. Mr. Gutiérrez has worked as a part-time professor of statistics and research at Universidad de los Andes and as a professor of operational research at Universidad EAFIT.
Adriana M. Echeverri (42) joined Ecopetrol in 1994, and has served as our Chief Financial Officer since September 2006. Prior to being appointed as our CFO, Mrs. Echeverri worked as Head of the Finance and Treasury Unit and Head of the Corporate Finance Unit. She earned a degree in finance and foreign affairs and an MBA from Universidad Externado de Colombia.
Margarita Obregón (55) joined Ecopetrol in 2000 and has served as Secretary of the Board of Directors and as Secretary General since January 2008. Prior to joining us, Mrs. Obregón worked in the supply department of Previsora S.A. Insurance Company, and as a legal advisor of lands for British Petroleum Company – BP, at Alvaro Rengifo y Cia. Mrs. Obregón also served as the head of the Business and Administration department of the Fiduciaria del Estado. Mrs. Obregón earned a law degree from Colegio Mayor de Nuestra Señora del Rosario with specialization degrees in financial law and administration law.
Hector Manosalva (51) joined Ecopetrol in 1986 and serves as Production and Explorations Executive Vice-President. Mr. Manosalva is a petroleum engineer from the Universidad de América in Bogotá, and completed post-graduate studies in Finance at the Universidad EAFIT and in Executive Management at the Universidad de los Andes. Over the course of his career at Ecopetrol, Mr. Manosalva has served as Chief of Production, Head of the Planning Division, Production Manager of the Southern Region, Director of Corporate Social Responsibility, Advisor to the Office of the President of the Republic for the Protection of Energy Infrastructure and Production Manager of the Central Region.
Pedro A. Rosales (49)joined Ecopetrol in 1989, and has served as our Downstream Executive Vice-President since February 2008. Mr. Rosales is responsible for the Company’s refining, petrochemicals, marketing and distribution, biofuels and gas businesses. Mr. Rosales has held several positions in the Company within the areas of maintenance, operations, projects, planning and administration. Prior to becoming our Downstream Executive Vice-President, Mr. Rosales served as our Vice-President of Transportation since January 2003 and as our Chief Operation Officer since 2006. Mr. Rosales earned a degree in mechanical engineering and a MBA from Universidad de los Andes.
Hector Castaño (51) joined us in 1988 and has served as our Production Vice-President since 2011. Mr. Castaño earned a degree in petroleum engineering from Universidad Nacional and a specialization degree in management from Universidad Sur Colombiana de Neiva. He has held a number of positions in Ecopetrol, including Director of Production in the Central region, in the Southern region and in the Mid-Magdalena Valley region.
Enrique Velásquez (60) joined us in June 2008 and has served as our Exploration Vice-President since September 2010. Mr. Velasquez earned a degree in geology from Universidad Nacional, a specialization degree in financial management from Universidad EAN and a specialization degree in high management from Universidad de los Andes. In his 32 years of work experience, he has held a number of positions in oil and gas companies such as Oxy, Hocol, Sipetrol, Texaco, Exxon and Halliburton.
Rafael Guzmán (46) is the Vice-President of E&P’s Technique and Development and has over 17 years of experience in the oil and gas industry. He holds a BSc degree in petroleum engineering from Universidad America in Colombia, a MSc in petroleum engineering and a PhD in petroleum engineering with a minor in mathematics, all from Stanford University. Mr. Guzmán joined Ecopetrol in October 2010 as the Regional Manager. Prior to Ecopetrol, he worked with ENI and BP. Mr. Guzmán was awarded the SPE Ferguson Medal, the Ramey Fellowship at Stanford University and the Infantas award for innovation from ACIPET. He also served as SPE Colombian chapter president from 1995 to 1997.
Hernando Zerda (47) is the acting Vice-President of Growth and Strategy. Mr. Zerda has more than 18 years of experience in the oil and gas industry, mainly in international trade and strategy. During the past 12 years, he has worked in Ecopetrol, serving in the Vice-Presidency of Growth and Strategy. Mr. Zerda holds a B.A. in Chemical Engineering from Universidad América in Bogotá, a specialization in International Economics from Universidad Externado de Colombia and an MBA from Universidad de los Andes.
Federico Maya (48)has served as our Vice-President of Refining and Petrochemicals since December 2005. Mr. Maya has held various positions at Ecopetrol over the last 20 years, including Marketing and Contract Coordinator for Ecopetrol’s Gas Department, Corporate Planning Directory member, and Vice-President of Supply and Marketing. Mr. Maya earned a degree in chemical engineering from Pontificia Universidad Bolivariana and a specialization degree in marketing from Universidad EAFIT.
Claudia Castellanos (49)has served as our Vice-President of Supply and Marketing since 2009. Mrs. Castellanos earned a degree in chemical engineering from Universidad Industrial de Santander and a specialization degree in energy resources management from Universidad Autónoma de Bucaramanga. She has worked in Ecopetrol for over 25 years including positions as a process engineer at Refineria de Cartagena, where she also worked in the Economy Department. Prior to becoming our Vice-President of Supply and Marketing, Mrs. Castellanos was Gas Manager for six years, where her focus was in the domestic and international commercialization of natural gas.
Jaime Bocanegra(44) is the acting Vice-President of Transportation since April 22, 2013. Mr. Bocanegra earned a degree in petroleum engineering from Universidad America in Colombia, a specialization degree in Management, a specialization degree in International Management of Oil and Gas Industry and Strategic Leadership. He was worked for Ecopetrol for the last 20 years and has held various positions within the Company, including Plant Coordinator, Multipurpose Pipelines Manager, Chief of Department, Program Manager of Dosquebradas and Chief of the Centralized Operations. Mr. Bocanegra is replacing Alvaro Castañeda who served as Vice-president of Tranportation for the last four years and who was named as Project Manager at our subsidiary Cenit.
Martha Cecilia Castaño (44) joined us in 2004 and has served as our Vice-President of Human Resources since 2008. Prior to becoming our Human Resources Vice-President, Mrs. Castaño worked as Coordinator of Organizational Culture, Chief of the Leadership, Internal Communications and Cultural Unit and was also head of the Labor Relations Department. Mrs. Castaño earned a degree in social communications and a specialization degree in economics from Universidad de la Sabana. She has also worked in Acopi, El Tiempo, Uniandinos and Empresa de Telecomunicaciones de Bogotá (ETB), in several areas such as human resources management, corporate communications and labor relations.
Oscar Villadiego (48)joined us in 1986 and is currently serving as the Vice-President of HSE and Operational Sustainability. He served as Vice-President of Services and Technology since February 2008, until 2012. He has held several positions in the Production Vice-Presidency for crude oil reserves, development and the human resources unit. He served as manager for the Central region for a period of 2.5 years, and as Technical Manager for the Production Vice-Presidency for four years. Mr. Villadiego earned a degree in Petroleum Engineering from Universidad America in 1987.
Mauricio Echeverry (56)joined us in November 1999 and has served as our General Counsel since then. Mr. Echeverry held the positions of Dean, Associate Dean and Professor at Universidad de los Andes Law School. He was also Colombia’s Deputy General Prosecutor and Plenipotentiary Minister for Colombia’s Embassy in the US. Mr. Echeverry earned a law degree and a specialization degree in commercial law from Universidad de los Andes.
Jaime Pineda (50)has served as our Director of Strategic Procurement since March 2012. He joined Ecopetrol in November 1989, working for the Legal Advisory Office in Barrancabermeja, and has served as our Head of Procurement Legal Advice Office from 2003 until 2012. He also serves as professor at Santo Tomas and Externado de Colombia universities. Mr. Pineda has a Law Degree from Universidad Autónoma de Bucaramanga, and a specialization degree in public procurement from Universidad Santo Tomas and a contracting law degree from Universidad Externado de Colombia.
Néstor Saavedra (50)has served as our Vice-President of Innovation and Technology since September 2012. Mr. Saavedra earned a degree in petroleum engineering from Universidad Industrial de Santander and a master’s degree in petroleum engineering from Texas A&M. His work within the Company has included serving as Director of the Colombian Petroleum Institute of Ecopetrol, coordinating horizontal well technology and rock mechanics projects, as well as assessing and predicting the behavior of Colombian oil fields. Mr. Saavedra serves as Director of the Society of Petroleum Engineers (SPE) in the South American and Caribbean Region.
Carlos Zamudio (48) has been the Director of Shared Services since August, 2012. Mr. Zamudio has more than 20 years of extensive experience in service delivery operations in multinational companies at regional and global levels. He previously worked at Belcorp, where he was the Corporate Director of the Shared Services Center overseeing 15 countries including the US and Brazil. He also worked at Procter & Gamble, where he was the Corporate Finance Manager for Chile, Brazil, Costa Rica and Colombia, as well as the Global Business Services Manager for the Latin America region.
Adriana M. Echeverri is first cousin of Luis Carlos Villegas Echeverri, a member of the Board of Directors. None of our other Directors or executive officers has any familial relationship with any other director or executive officer.
Compensation
The total compensation paid to our Directors, executive officers and senior management during 2012 amounted to Ps$14,974 million.
Based on a resolution adopted at our 2012 annual shareholders’ meeting, compensation for Directors for attendance at Board of Directors and/or committee meetings in person increased from the equivalent of four to six minimum monthly wage salaries, which totals approximately Ps$3,400,200 for 2012 and Ps$3,537,000 for 2013. Fees for attendance at virtual meetings are set at 50% of the in-person meeting fee.
Our Directors are not eligible to receive pension and retirement benefits from us. The total amount set aside to provide pension and retirement benefits to our eligible executive officers totals Ps$16,917 million.
Share Ownership
No individual Director or executive officer beneficially owns more than 1% of our outstanding shares.
Board Practices
Our Board of Directors is composed of nine members and is responsible for, among other things, establishing our general business policies. According to Colombian law, the members of the Board of Directors must be elected at the annual shareholders’ meeting in accordance with a proportional representation system similar to cumulative voting (through an electoral quota voting system – The number of votes required to fill each position is calculated by dividing the number of possible votes by the number of open board positions) and may be reelected indefinitely. The members of the Board of Directors may be elected without an electoral quota voting system when there is unanimity. Pursuant to our bylaws, Directors are elected for a one-year term, and the positions are filled either by person or by position. Currently, we have three members appointed by their position: the Minister of Mines and Energy, the Minister of Finance and Public Credit and the Director of the National Planning Agency. Our current Directors were elected on March 21, 2013. Directors may be removed without cause at any moment by a majority of the shareholders present at a general shareholders’ meeting. Our executive officers are appointed by our Board of Directors.
The compensation of our Directors is set exclusively by the shareholders at the general shareholders’ meeting. See “—Compensation.” Colombian law prohibits Directors from receiving corporate loans. Directors are compensated for attending board meetings and committee meetings. A Board meeting requires a quorum of at least five members and decisions are approved with a majority of the members present. None of the contracts of any of our Directors contains provisions for benefits upon termination of such director’s services.
Under Colombian law, a director or executive officer must disclose during the general shareholders’ meeting any transaction involving a conflict of interest. The general shareholders’ meeting may approve or reject the transaction giving rise to the conflict with the vote of the majority of the shares present at the shareholders’ meeting. If the director or executive officer with a conflict is a shareholder, his or her vote will be excluded. We disclose conflicts of interest of our employees, executive officers and directors in our Corporate Governance and Board of Directors reports.
Neither our bylaws nor our corporate governance code provide a maximum retirement age for our Directors. Under our bylaws, there is no requirement for a person to have a minimum number of shares to be considered as a Director. Colombian law provides that Directors willing to sell or purchase shares in our Company require a prior authorization of the Board of Directors. Colombian law does not impose any limitation as to the number of shares that may be acquired by a Director.
Pursuant to our bylaws, our Board of Directors has four committees (Audit Committee, Corporate Governance and Sustainability Committee, Nomination and Compensation Committee and Business Committee), which establish guidelines, set specific actions and evaluate and submit proposals designed to improve performance in the areas under their supervision and control. These committees are comprised by members of the Board of Directors and who are also appointed by the members of the Board of Directors. In addition to applicable regulations, the committees also have their own specific regulations that establish their purposes, duties and responsibilities.
| Audit Committee(1) | | Compensation and Nomination
Committee | | Corporate Governance and
Sustainability Committee |
| Joaquín Moreno Uribe | | Fabio Echeverri Correa | | Amilcar Acosta Medina |
| Roberto Steiner Sampedro | | Minister of Finance and Public Credit | | Joaquín Moreno Uribe |
| Amilcar Acosta Medina | | Joaquín Moreno Uribe | | Jorge Pinzón Sánchez |
Luis Carlos Villegas Echeverri Jorge Pinzón Sánchez | | Amilcar Acosta Medina | | Roberto Steiner Sampedro |
| | | | | Minister of Mines and Energy |
| | | | | Minister of Finance and Public Credit |
| Business Committee | | | | |
| Minister of Mines and Energy | | | | |
| | | | | |
| Minister of Finance and Public Credit | | | | |
Director of the National Planning Agency of Colombia Luis Carlos Villegas Echeverri | | | | |
| Joaquín Moreno Uribe | | | | |
| Roberto Steiner Sampedro | | | | |
| (1) | All members of our audit committee must be independent. |
Audit Committee
Our audit committee, which must be comprised of at least three members, all of them independent Directors, is our highest internal control body and provides support to our Board of Directors in risk, accounting and financial matters. It is in charge of guaranteeing the design, implementation and supervision of our internal control over financial reporting. It also ratifies the annual hydrocarbons reserves report and provides support for our Board in analyzing topics related to financial matters, risks, control environment and assessment of the Company’s internal and external auditors.
All committee members are required to be knowledgeable in accounting matters and at least one of them is required to be an expert in financial and accounting matters. Roberto Steiner Sampedro currently serves as the audit committee financial expert.
Compensation and Nomination Committee
Our compensation and nomination committee, which must be comprised of at least three members, including at least one independent director, provides general guidelines for selection and compensation of our executive officers and employees.
Corporate Governance and Sustainability Committee
Our corporate governance and sustainability committee, which must be comprised of at least three members, including at least one independent director, makes proposals to our Board of Directors to ensure and supervise the fulfillment of our good corporate governance and sustainability practices in accordance with our corporate governance code.
Business Committee
Our business committee, which must be comprised of at least five members, including at least one independent director, assists our Board in analyzing potential business ventures. Based on its delegation of power, the committee studies and analyzes capital expenditure policies, major investment projects, strategy, new business and other matters that would help us move forward in our efforts toward the consolidation of our strategy. The primary criteria used in the committee’s decision-making are the optimization of our portfolio and the proper allocation of our resources.
Employees
As of December 31, 2012, we had 9,701 employees. A collective bargaining agreement between us and our three main labor unions (USO, ADECO and SINDISPETROL) governs the labor relations we have with our unionized employees, which amounted to 2,230 employees as of December 31, 2012. It also governs the labor relations with the 1,225 non-unionized employees that agreed to abide by it after asking to be waived of the Agreement 01 of 1977.Agreement 01 of 1977 governs the labor relations of our employees devoted to technical and trustworthy activities, which numbered 4,632 employees in Ecopetrol S.A. as of December 31, 2012. The collective bargaining agreement and Agreement 01 of 1977 do not vary significantly in benefits. Employees are subject to Law 100 of 1993 with respect to their retirement scheme.
Most of our employees are located in Colombia. In order to support our corporate growth strategy, we increased the total number of Ecopetrol S.A. employees by 10.7% from 7,303 in 2011 to 8,087 in 2012. The table below presents the breakdown of Ecopetrol S.A.’s employees according to the business segments where they work, and the personnel of our subsidiaries for the years ended December 31, 2012, 2011 and 2010. As of December 31, 2012, Ecopetrol had 8 direct employees working abroad.
| | | As December 31, | |
| Ecopetrol S.A. | | 2012(1) | | | 2011 | | | 2010 | |
| Exploration and Production | | | | | | | | | | | | |
| Exploration | | | 174 | | | | 130 | | | | 133 | |
| Production | | | 1,725 | | | | 1,565 | | | | 1,460 | |
| Others | | | 386 | | | | 309 | | | | 283 | |
| Total Exploration and Production | | | 2,285 | | | | 2,004 | | | | 1,876 | |
| Downstream | | | | | | | | | | | | |
| Refining | | | 2,425 | | | | 2,134 | | | | 2,000 | |
| Marketing | | | 181 | | | | 175 | | | | 159 | |
| Others | | | 16 | | | | 18 | | | | 17 | |
| Total Downstream | | | 2,622 | | | | 2,327 | | | | 2,176 | |
| Transport | | | 1,097 | | | | 964 | | | | 856 | |
| Corporate | | | 2,083 | | | | 2,008 | | | | 1,836 | |
| TOTAL ECOPETROL S.A. | | | 8,087 | | | | 7,303 | | | | 6,744 | |
| Ecopetrol America Inc. | | | 28 | | | | 14 | | | | 10 | |
| Bioenergy S.A. | | | 143 | | | | 102 | | | | 83 | |
| Bioenergy Zona Franca S.A.S. | | | 35 | | | | 23 | | | | 19 | |
| Hocol S.A. | | | 194 | | | | 202 | | | | 192 | |
| Equion Energia Limited | | | 493 | | | | 465 | | | | - | |
| Oleoducto Central S.A. | | | 133 | | | | 133 | | | | 133 | |
| Oleoducto de Colombia S.A. | | | 1 | | | | 1 | | | | 1 | |
| Oleoducto de los Llanos S.A. | | | 17 | | | | 19 | | | | 17 | |
| Oleoducto Bicentenario de Colombia S.A.S. | | | 27 | | | | 19 | | | | - | |
| Ecopetrol del Perú S.A. | | | 12 | | | | 12 | | | | 6 | |
| Refinería de Cartagena S.A. | | | 158 | | | | 142 | | | | 122 | |
| Ecopetrol Oleo e Gas do Brasil Ltda. | | | 14 | | | | 10 | | | | 3 | |
| Propilco S.A. | | | 339 | | | | 325 | | | | 286 | |
| Cenit | | | 20 | | | | - | | | | - | |
| TOTAL(2) | | | 9,701 | | | | 8,770 | | | | 7,616 | |
| (1) | 353 persons employed by us during 2012 were not included in our 2012 employee statistics as they were independent contractors, involved in non-regular activities and do not classify as temporary employees. |
| (2) | Totals are as of the last day of each year. |
During 2012, Ecopetrol S.A. had 833 temporary employees, an increase of 45% compared to 2011. In 2011 and 2010, Ecopetrol S.A. had 574 and 379 temporary employees, respectively.
Labor Unions
We currently have three industry-wide labor unions and one company labor union:
| · | Unión Sindical Obrera de la Industria del Petróleo — USO (Industry labor union); |
| · | Asociación de Directivos Profesionales, Técnicos y Trabajadores de las Empresas de la Rama de Actividad Económica del Recurso Natural del Petróleo y sus Derivados de Colombia — ADECO (Industry labor union); |
| · | Sindicato Nacional de Trabajadores de Empresas Operadoras, Contratistas, Subcontratistas de Servicios y Actividades de la Industria del Petróleo y Similares — SINDISPETROL (Industry labor union); and |
| · | Sindicato Nacional de Trabajadores de Ecopetrol — SINCOPETROL (Company labor union). |
Currently ECOPETROL does not have any workers in the SINCOPETROL union. This union did not participate in the negotiation exercise.
Our employees and any employee working for any company in the oil and gas industry may join the USO, ADECO or Sindispetrol. Sincopetrol may only be joined by our employees.
On August 2, 2011 and November 8, 2011, we experienced two work stoppages promoted by the USO in Barrancabermeja to support workers protesting at an unaffiliated oil and gas exploration and production company, Pacific Rubiales Energy. After our subsidiary Cenit was created on June 15, 2012, some workers (members of the USO) protested on June 19 and December 22, 2012. These protests did not affect our operations.
Typically, union protests do not impact our operations because, as soon as they occur, we implement our continuity plan and integrate other trained workers that can operate in emergency situations.
Ecopetrol’s current transportation contracts were transferred to Cenit, in connection with the previous agreement. See “Item 4. Overview by Business Segment—Transportation and Logistics—Cenit. There is no change in working conditions contemplated for employees who currently work at the transport segment of the Company.
On August 22, 2009, as a result of consensual negotiations, we entered into a five-year collective bargaining agreement with USO, ADECO and Sindispetrol. During the first quarter of 2012, we held meetings with the unions to discuss revisions to the collective bargaining agreement signed in 2009. The meetings were carried out under normal conditions and did not affect our operations.During these meetings, we analyzed certain articles of the collective bargaining agreement to clarify ambiguities as well as those that became outdated after the Company became public. The aspects that were analyzed during the revision process were, among others, union rights, health care benefits and food and transportation allowances.
Benefits and wages will be reviewed once the collective bargaining agreement expires in 2014. The following are the key terms of the agreement currently in effect since 2009 until June 2014.
| · | Transportation Subsidy. Monthly transportation subsidy depends on the employee’s location and ranges between Ps$1,292 and Ps$138,557. |
| · | Food Subsidy. Monthly food subsidy ranges between Ps$258,390 and Ps$299,010 depending on the employee’s location. |
| · | Lodging Subsidy. Monthly lodging subsidy to employees is Ps$205,564. |
| · | Education Subsidy. Subsidy that covers 90% of tuition and board expenses and fixed amounts of transportation and textbooks for our employees and their children. |
| · | Health Benefits. Ecopetrol pays 100% of medical expenses for workers and their families. The health benefits include integral basic attention, programs in prevention of diseases, the supply of medicines and others. |
| · | Six months Bonus. Ecopetrol pays 48 days of regular wage to its workers; 24 days in June and 24 in December. |
| · | Stability Clause. Employees who, as of December 1, 2004 had worked over 16 months, cannot be fired without just cause. |
| · | Retirement plan for employees. Employees hired after January 29, 2003 are not covered by our retirement scheme but are covered by the national social security system. |
| · | Five-year bonus. A cash benefit bonus accrues on a yearly basis and is paid for every 5-year period an employee works in the Company according to the following scale: |
| 5 years worked: | Bonus equivalent to 9 days of basic payment plus Ps$193,990 |
| | |
| 10 years worked: | Bonus equivalent to 14 days of basic payment plus Ps$193,990 |
| | |
| 15 years worked: | Bonus equivalent to 19 days of basic payment plus Ps$193,990 |
| | |
| 20 years worked: | Bonus equivalent to 24 days of basic payment plus Ps$193,990 |
| | |
| 25 years worked: | Bonus equivalent to 29 days of basic payment plus Ps$193,990 |
| | |
| 30 years worked: | Bonus equivalent to 34 days of basic payment plus Ps$193,990 |
Labor Relations
As part of our goal to improve workplace morale, in 2010 we implemented a number of initiatives to maintain good and trustworthy relations with our employees, guarantee competitive wages, strengthen our corporate principles and culture, provide opportunities for personal development and improve the general welfare of our employees. Our initiatives also sought to strengthen communication processes and to implement performance-based compensation.
To improve the quality of life of our employees, we extend various types of loans to them, including housing loans and general-purpose loans. In 2012, we extended 1,043 house loans for a total of Ps$106 billion and 1,169 general-purpose loans for a total of Ps$1.1 billion. We also provided on-site and external training and development courses to our employees. At December 31, 2012, our investments in employees’ development amounted to Ps$31.6 billion and we extended a total of Ps$67 billion in subsidies for education.
Labor Regulation
Since November 13, 2007, all of our employees are official employees as a result of our transformation into a mixed economy company. Therefore, our employees are governed by the provisions of the Colombian Labor Code since then.
ITEM 7.Major Shareholders and Related Party Transactions
MAJOR SHAREHOLDERS
The following table sets forth the names of our major shareholders, and the number of shares and the percentage of outstanding shares owned by them at March 31, 2013:
| | | At March 31, 2013 | |
| Shareholders | | Number of shares | | | % Ownership | |
| Nation - Ministry of Finance and Public Credit | | | 36,384,788,817 | | | | 88.49 | % |
| Public float | | | 4,731,909,639 | | | | 11.51 | % |
| Total | | | 41,116,698,456 | | | | 100.00 | % |
All our common shares have identical voting rights.
As of March 31, 2013, 1.215% of our common shares were held of record in the form of American Depository Shares. As of February 22, 2013, we had 18 registered holders and 23,352 beneficiaries of common shares, or ADSs representing common shares, in the United States.
RELATED PARTY TRANSACTIONS
Agreements
We engage in a variety of transactions with related parties in the ordinary course of business. Set forth below is a description of material related party transactions. For additional information about transactions with related parties, see Note 16 to our consolidated financial statements.
Ocensa
We have entered into the following agreements with Ocensa:
| · | In March 1995, we entered into an agreement for the transportation of crude oil through the Ocensa pipeline. Pursuant to the terms of this agreement, we were required to make monthly payments that vary depending on the volumes of crude oil we transported through the pipeline and a tariff calculated by Ocensa on the basis of Ocensa’s financial projections and their expected volumes of crude oil. In 2012, payments made by us under this agreement amounted to US$290.42 million. On January 17, 2013, this agreement was amended as a result of Ocensa’s new business model. Among other changes, this amendment to the transportation agreement establishes the payment of the tariff calculated according to the Resolutions issued in 2010 by the Ministry of Mines and Energy. |
| · | On January 17, 2013, the Amended and Restated Oleoducto Central Agreement (AROCA) and other agreements derived from it were terminated by mutual consent among the parties. On the same date January 17, 2013, the shareholders and Ocensa entered into a new shareholders agreement that establishes the basis for a new business model, pursuant to which Ocensa will be a profit center instead of a cost center. |
| · | In December 1995, we leased the Porvenir and Miraflores terminals to Ocensa. Pursuant to the terms of the lease agreement we received monthly payments during 2012 of approximately US$8,598,266 plus applicable taxes. The duration of this agreement is indefinite. |
| · | In November 1996, we leased the Cravo Norte dock to Ocensa. Pursuant to the terms of the agreement, we received monthly payments during 2012 of US$23,000, plus applicable taxes. The duration of this agreement is indefinite. |
| · | In September 1999, we entered into a joint operation agreement for the TLU-3 Coveñas buoy with Ocensa and ODC. Pursuant to the terms of this agreement we are required to make monthly payments of a fixed amount of US$75,000 plus a variable amount depending of the volumes exported through the buoy. There have not been variable payments in the last three years. The duration of this agreement is indefinite. |
| · | In December 1999, we entered into an operation and maintenance agreement for the Porvenir, Miraflores and Vasconia pumping stations. In 2012, pursuant to the terms of this agreement, we received monthly payments of approximately US$677,326 plus applicable taxes and variable costs in 2012. This agreement was renewed for a five-year term on April 1, 2011. |
| · | In December 2004, we entered into a natural gas supply contract pursuant to which we receive variable monthly payments based on the volumes of natural gas delivered and a fixed tariff. During 2012, we received monthly payments of approximately US$99,228 under this contract. |
Ocensa has entered into the following agreements with some of our subsidiaries:
| · | In March 1995, Equion Energia Limited and Santiago Oil Company entered into an agreement for the transportation of crude oil through the Oleoducto Central S.A. (Ocensa) pipeline. In November 2012, Equion Energia Limited and Santiago Oil Company transferred, by means of various transactions its shares (24.8%) and transportation rights (19.8%) holdings in the Ocensa pipeline to wholly-owned subsidiaries of Ecopetrol S.A. (51%) and Talisman (49%). Equion kept 5% of transportation rights in Ocensa. In 2012, the transportation fees billed by Ocensa were: Equion Energia Limited (US$7.5 million), Santiago Oil Company (US$1.3 million) and Hocol and Homcol (US$18.5 million). |
| · | On January 3, 2013, the Technical Services and Management Agreement (Contrato de Servicios Técnicos y Administrativos) between Ecopetrol and Ocensa was terminated by mutual consent. |
Oleoducto de Colombia S.A.
We entered into the following agreements with ODC:
| · | In July 1992, we entered into a take-and-pay agreement for the transportation of hydrocarbons. Pursuant to this agreement, we must pay a previously agreed tariff over the volume of hydrocarbons transported. The duration of this agreement is indefinite. |
| · | In August 1992, we entered into an operation and maintenance agreement for the Vasconia and Coveñas terminals. Pursuant to the terms of this agreement, ODC is required to make payments of approximately US$1.5 million per year plus any other expenses incurred by us in the performance of the agreement, including a variable surcharge between 5% and 12% on such expenses, plus any applicable taxes. The duration of this agreement is indefinite. |
| · | In July 2006, we entered into an operation and maintenance agreement for the Caucasia Station and the Vasconia-Coveñas pipeline system. Since 2010, this agreement is only in effect for the operation of the Caucasia Station. Pursuant to the terms of this agreement, we received payments of approximately US$704,065 per year, plus any other expenses incurred by us for the performance of the agreement, including a variable surcharge of between 5% and 12% on such expenses, plus any applicable taxes. The duration of this agreement is indefinite. |
| · | In March 2007, we entered into a service agreement to guarantee the protection and safety of the Cusiana Coveñas and Vasconia Coveñas pipeline systems. Under the terms of this agreement, ODC paid us Ps$51 million per year. This agreement expired on December 31, 2011. |
Refinería de Cartagena S.A.
| · | In April 2007, we entered into a maintenance and administration agreement with Reficar, our wholly-owned subsidiary as of May 2009. Pursuant to the terms of this agreement, we provided Reficar with maintenance and administration services in exchange for a monthly fee. This agreement expired in April 2011, but was extended through the term of our negotiations. |
| · | On November 29, 2010, Ecopetrol S.A. entered into a Peso-denominated loan facility with Reficar for an amount in Pesos equivalent to US$1 billion to finance capital expenditures and construction costs in connection with a project to modernize Reficar’s refinery. Ecopetrol S.A. disbursed the equivalent of US$591 million in Pesos and amended the agreement to reduce the commitment amount to US$600 million. The interest rate for the US$591 million Peso-equivalent loan is the DTF as of December 31 of the year before each annual period. On September 26, 2011, Reficar and Ecopetrol Capital A.G. executed a new long-term U.S. dollar-denominated subordinated loan agreement for up to US$400 million also to finance capital expenditures and construction costs in connection with the project to modernize Reficar’s refinery. Ecopetrol Capital A.G. disbursed the US$400 million under this new subordinated loan agreement in 2011. The interest rate for this subordinated loan is 6 months LIBOR plus 4.775% per annum. |
| · | In December 2011, we executed an agreement that governs the composition of the crude slate that the refinery processes, its purchase of crude and other products, and its sale of refining products. Additionally, in January 2012, we executed a new operations and maintenance contract. These contracts replaced the old maintenance and administration services contract. The fees billed to Reficar during 2012 under these contracts were approximately Ps$73.7 billion. |
| · | In December 2011, we entered into a construction support agreement and a debt service guarantee agreement to guarantee certain obligations of Reficar under the US$3.5 billion project finance for the expansion and modernization of its facilities. Pursuant to the terms of the construction support agreement, Ecopetrol S.A. agreed to support Reficar’s costs and expenses related to overcost and delays in construction. Pursuant to the terms of the debt service guarantee agreement, Ecopetrol S.A. provided Reficar with a liquidity mechanism to pay its debt service shortfalls and a mechanism to exit the project financing by transferring its debt to us. See “Item 5. Operating and Financial Review and Prospects—Liquidity and Capital Resources.” In June 2011, Ecopetrol Capital A.G. granted a US$240 million treasury loan to Reficar to finance delayed subsidy payments from the Nation. The interest rate for this loan is 2.10% per year. In December 2011, the Government paid US$198 million to Reficar for accrued subsidies, and Reficar used the entire amount to repay principal and interest on the treasury loan. As of December 31, 2011, the amount outstanding under this loan was US$45 million. |
| · | On February 1, 2012, we entered into a crude oil supply contract with Reficar for a period of five years. Pursuant to the terms of this contract, Reficar has the option to purchase up to 200 thousand bpd of crude oil from our Caño Limón, Vasconia Blend and Castilla blends. This contract includes an option for Reficar to receive from Ecopetrol crude oil we have bought from other national producers or imported from foreign producers on behalf of Reficar. |
Oleoducto de los Llanos Orientales
We have entered into two ship-or-pay agreements with ODL:
| · | In March 2009, we entered into a ship-or-pay agreement with ODL that establishes a financing tariff used to pay ODL’s indebtedness to Grupo Aval for five years. This agreement was superseded by a new contract executed in May 2010, with a seven-year term, to reflect new conditions agreed with Grupo Aval. This financing tariff is collected through a trust fund, which in turn is responsible for making the debt service payments to Grupo Aval. Under this agreement, ODL has committed to transport 75 thousand bpd during the two-year grace period of the facility and 90 thousand bpd during the remaining five years. Ecopetrol is responsible for 65% of this capacity. |
| · | In September 2009, we entered into a second ship-or-pay agreement with ODL that establishes a financing tariff collected through a trust fund that in turn is responsible for making debt service payments to security holders. Under this agreement, ODL committed to transport 19.5 thousand bpd during the first phase of the ODL project (which began in September 2009 and ended in the first quarter of 2010) and 39 thousand bpd upon commencement of the second phase of the ODL project which occurred in the first quarter of 2010. |
| · | In December 2009, we entered into a service agreement with ODL to transport crude oil. This agreement expires in June 2016 and can be renewed. Pursuant to the terms of this agreement, in 2012 we made monthly payments totaling Ps$176 billion for the year. |
| · | In March 2010, we entered into a pipeline operating and maintenance agreement with ODL. This agreement has a five-year term and the amount payable to us for the entire term of the agreement is Ps$56.4 billion, plus any applicable taxes. |
| · | In March 2010, we entered into an undiluted crude oil supply agreement, which was renewed in March, May and November 2012 until December 2013. Pursuant to the terms of this agreement, in 2012 ODL paid us Ps$20.3 billion plus applicable taxes. |
Oleoducto Bicentenario de Colombia S.A.S.
| · | In November 2011, we signed a five-year technical assistance services contract for the construction of the Araguaney Covenas pipeline. This contract is part of the project construction and the amount payable to us for the entire term of the agreement is approximately Ps$8.8 billion. |
| · | In November 2011, we entered into an operation and maintenance agreement for the Banadia unloading facility. Pursuant to the terms of the agreement, we receive monthly payments of approximately Ps$128.9 million plus applicable taxes. The duration of this agreement is 15 years. |
| · | In June 2012, we entered into ship-or-pay and ship-and-pay crude oil transportation agreements with Oleoducto Bicentenario that establishes a price, which requires the payment of Bicentenario’s indebtedness to local banks for twelve years. This tariff is collected through a trust, which in turn is responsible for making the debt service payments to the banks. The duration of the ship-or-pay agreement is 12 years or when the credit has been entirely paid, and the duration of the ship-and-pay agreement is 20 years after the ship-or-pay terminates. Under these agreements, Bicentenario has committed to transport at least 110 thousand bpd, of which the 55% of the agreement volume is provided directly by Ecopetrol and 0.97% indirectly by Hocol. In June 2012, we entered into storage-or-pay and storage-and pay agreements with Oleoducto Bicentenario. Under these agreements, Bicentenario is committed to receive, store, preserve and deliver our crude oil. The storage-or-pay agreement will terminate when Bicentenario’s indebtedness to local banks has been entirely paid, and the duration of the storage-and-pay agreement is 20 years after the storage-or-pay agreement terminates. |
| · | In August 2012, we entered into an Operation and Maintenance agreement for the Arguaney – Banadia pipeline system. Pursuant to the terms of this agreement, we will receive payments of approximately Ps$3.5 billion in the first year and approximately Ps$18.6 billion per year thereafter. The duration of this agreement is 15 years. |
Andean Chemicals Ltd.
| · | In May 2009 we granted a loan to our subsidiary, Andean Chemicals Ltd., for the acquisition from Glencore International A.G. of its 51% interest in Reficar, in the amount of US$541 million for a five year term. The interest rate for each year was the DTF, applicable at December 31 of the previous year. In December 2011, we capitalized this loan, for a total amount of US$615.7 million (capital and interest). |
Compounding and Masterbatching Industry Ltda.¾ COMAI
| · | In 2008 we entered into a contract with COMAI for the delivery of refinery grade propylene through January 2018. COMAI operates a splitter to separate refinery-grade propylene into polymer-grade propylene and propane. Refinery grade propylene is sold by COMAI to Propilco who uses it as raw material in the production of polypropylene, while propane is delivered back to us. |
Cenit
| · | On October 1, 2012 we entered into an Asset Contribution Agreement, establishing the terms and conditions under which Ecopetrol contributed to Cenit its shares in companies engaged in oil transport, and on April 1, 2013, under this agreement Ecopetrol contributed to Cenit its assets for the transportation of hydrocarbons and derivatives. This agreement has a term of 30 years. |
On April 1, 2013 we entered into the following agreements with Cenit:
| · | Projects and Transport Logistic Solutions Service Agreement, under which we will provide management services to Cenit for a term of 15 years. |
| · | Operation and Maintenance Agreement for the operation, maintenance, emergency and disaster risk management, among other services, which we will provide for a term of 15 years. |
| · | Service Agreement for the provision of comprehensive services by Cenit for the transport, storage loading and unloading of hydrocarbons for a term of 30 years. |
| · | Service Agreement for the provision of comprehensive services by Cenit for the transport, storage loading and unloading of refined products for a term of 30 years. |
Other Agreements
| · | We entered into a supply agreement with Ecodiesel a company in which we have a 50% equity interest. This agreement has been operative since August 1, 2010. Pursuant to the terms of this agreement, Ecodiesel must deliver to us and we must purchase from Ecodiesel at least 80% of Ecodiesel’s biodiesel production each month. Payments vary depending on the purchased volumes of biodiesel. This agreement expires on December 31, 2017. |
| · | In 2010, we renewed the service agreement with Societal Colombiana de Servicios Mortuaries S.A., or Serviport, a company in which we had a 49% equity interest through September 30, 2012. Since October 1, 2012, our equity ownership passed to Cenit. Pursuant to the terms of this agreement, Serviport assists us in our maritime operations in Coveñas port. This agreement expires on May 27, 2019. |
Transactions with Other State-Controlled Entities
We are a state-controlled oil and gas company and operate in an industry regulated by governmental authorities, agencies and other organizations.
In the ordinary course of business we enter into transactions with other state-owned entities that include but are not limited to the following:
| · | selling and purchasing goods, including crude oil purchases of ANH royalties; |
| · | properties and other assets; |
| · | rendering and receiving services; |
| · | depositing and borrowing money; and |
Purchases of Hydrocarbons
These transactions are conducted in the ordinary course of business on terms comparable to the terms of transactions with private parties. We have also established procurement policies and approval processes for purchases of products and services, which do not depend on whether the counterparties are state-owned entities or not.
Loans to our Employees
We extend loans to all of our employees as part of our compensation scheme. We grant loans for housing and general purposes. The Human Resources and Strategy vice-presidents along with the compensation manager are part of the housing loans committee that is in charge of approving housing loans to employees. The principal amount of the loan depends on the applicant’s tenure and cannot exceed 59 times the applicant’s monthly salary. We do not guarantee any loans made by third parties.
Other than maintaining housing loans to some executive officers, which were in place prior to the registration of our ADSs, since registering our ADSs, neither us nor any of our subsidiaries have provided loans (including housing loans), extended or maintained credit, arranged for the extension of credit, or renewed an extension of credit, in the form of a personal loan to or for any of our executive officers. We have not materially modified any term of any such extension of credit or renewed any such extension of credit, in each case including the aforementioned housing loans, since our ADSs were registered.
In addition, other than the housing loans referred to below, neither us, nor any of our subsidiaries will provide loans (including housing loans), extend or maintain credit, arrange for the extension of credit, or renew an extension of credit, in the form of a personal loan to or for any of our executive officers in the future. In addition, we will not materially modify any term of any such extension of credit or renew any such extension of credit, in each case including the aforementioned housing loans, in the future. We do not extend loans to Directors.
The following table sets forth a description of the loans outstanding to our executive officers as of March 31, 2013 (figures in millions of Colombian pesos).
| | | Nature of the | | Principal | | | Amount | | | Largest Amount | | | | | | |
| | | Loan and Date | | Amount of | | | Outstanding at | | | Outstanding | | | Termination | | | Applicable |
| Executive Officer | | of Disbursement | | the Loan | | | December 31, 2012 | | | during period | | | Date | | | Interest Rate |
| Javier G. Gutiérrez | | Housing, June 2008 | | | 729.0 | | | | 565.8 | | | | 729.0 | | | June 2028 | | | UVR(1) |
| Adriana M. Echeverri | | Housing, December 2002 | | | 37.5 | | | | 29.0 | | | | 45.1 | | | October 2018 | | | UVR(1) |
| Pedro A. Rosales | | Housing, December 2003 | | | 231.9 | | | | 133.4 | | | | 247.5 | | | December 2018 | | | UVR(1) |
| Oscar Villadiego(2) | | Housing, January 2001 | | | 78.0 | | | | 7.1 | | | | 78.0 | | | January 2016 | | | UVR(1) |
| Nestor Saavedra(3) | | Housing, October 2007 | | | 134.1 | | | | 95.5 | | | | 134.1 | | | October 2022 | | | UVR(1) |
| (1) | As the regulatory entity for these purposes, the Central Bank of Colombia (Banco de la República) defines the term “UVR” as Unidad de Valor Real (Real Value Unit), an accounting unit which reflects purchasing power based exclusively on the consumer price index variation certified by the National Statistics Department of Colombia (DANE). The UVR is used to calculate the cost of housing credits in Colombia. This accounting unit allows financial entities to adjust credit values to the cost of living increase in Colombia. |
| (2) | Oscar Villadiego became an executive officer in March 2012 as a consequence of the reorganization of our senior management’s structure approved by our Board of Directors. See “Item 6. Directors, Senior Management and Employees–Officers and Senior Management of Ecopetrol.” |
| (3) | Néstor Saavedra became an executive officer in September 2012. |
| ITEM 8. | Financial Information |
CONSOLIDATED STATEMENTS AND OTHER FINANCIAL INFORMATION
Our annual consolidated financial statements are filed as part of this annual report starting on page F-1.
LEGAL PROCEEDINGS
We are party to various legal proceedings in the ordinary course of business. Other than as disclosed in this annual report, we are not currently involved in any litigation or arbitration proceeding, including any proceeding that is pending or threatened of which we are aware, which we believe will have a material adverse effect on our Company. Other legal proceedings that are pending against or involve us and our subsidiaries are incidental to the conduct of our and their business. We believe that the ultimate disposition of such other proceedings individually or in an aggregate basis will not have a material adverse effect on our consolidated financial condition or results of operations.
As of December 31, 2012, we were a party to 2,658 legal proceedings relating to civil, administrative, environmental, tax and labor claims filed against us in the Colombian courts and arbitration tribunals of which 659 had an accrual provision. We allocate sufficient amounts of money and time to defend these claims. Historically, we have been successful in defending lawsuits filed against us. Based on the advice of our legal advisors it is reasonable to assume that the litigation procedures brought against us will not materially affect our financial position or solvency regardless of the outcome. See Note 31 to our annual consolidated financial statements included in this annual report for a discussion of our legal proceedings.
In December 2010, Llanos Oil Exploration Ltd., or Llanos Oil, filed a lawsuit against us in a district court of the Netherlands before The Court of The Hague which, if decided against us, could materially affect our financial condition. The complaint alleges early termination by us of the following exploration activity contracts: the 1997 Las Nieves Association Contract and the 2002 Guatapurí Association Contract. These contracts were terminated because of the default by Llanos Oil on July 28, 2000, and July 23, 2003, respectively, in accordance with the provisions of the contracts. In the incidental proceedings judgment of May 30, 2012, the district court in The Hague ruled that it lacks jurisdiction to hear the case and rejected all the legal grounds of the plea of Llanos Oil regarding the jurisdiction of the court. Llanos Oil appealed on August 2012 and the decision on appeal is expected during the second quarter of 2013. We have not created a provision for this claim because our legal counsel in The Hague considers the probability of success for Llanos Oil to be remote.
On April 16, 2012, we were served with a class action suit against us seeking monetary damages of approximately Ps$85,936 billion related to the December 2011 Caño Limon – Coveñas Crude Oil Pipeline Spill. See “Item 4. Overview by Business Segment—Transportation and Logistics—Caño Limon – Coveñas Crude Oil Pipeline Spill.” The Colombian Attorney General’s Office filed a motion requesting the judge to require the claimant to justify the amount. The claimant reduced the claim to Ps$11 billion. However, the court appraised the damages to be at the most Ps$298 million based on the number of people involved in the class action. The court set the date of the conciliation hearing for October 23, 2012 but the claimant did not attend and instead requested the court to set a new date for the settlement hearing. The court declined the request and decided to continue with the proceeding. As of the date of this annual report the evidence phase is pending. Our legal counsel is of the view that this class action suit has only a remote possibility of success.
Foncoeco
An association of former employees known by the acronymFoncoeco brought an action against us in connection with a company profit-sharing plan offered in 1962 that expired in 1975. The plaintiffs claim that our Board of Directors had set aside a specific amount under the profit sharing plan, which was not entirely distributed to employees eligible under the plan. The court of first instance ruled on June 25, 2002 in our favor and rejected the plaintiffs’ arguments. The plaintiffs appealed the ruling to the Bogota Higher Tribunal, which ordered us to present arendición de cuentas (an accounting action) to the first instance judge based on the amounts allocated by our Board of Directors. Based on the judge’s conclusion with respect to our accounting and the expert testimony of a witness presented by the plaintiffs, who we maintain included amounts never allocated by our Board of Directors to the profit sharing plan, the first instance judge, in 2005, ordered us to pay Ps$541,833 million, or approximately US$260 million. We appealed the decision by the first instance judge to the Bogota Higher Tribunal and on June 22 2011, the court ruled in our favor and reduced the amount we must pay to Ps$6.6 million, or approximately US$3,707. On March 14, 2012, the Colombian Supreme Court of Justice permitted an extraordinary appeal filed by the plaintiffs. Ecopetrol filed its reply on May 18, 2012 and the appeal is currently in the evidence phase. As of the date of this annual report, the Colombian Supreme Court of Justice has not decided the extraordinary appeal. Our legal counsel is of the view that the appeal has a remote possibility of success.
DIVIDENDS
We do not have a dividend policy. Pursuant to Colombian law, we may distribute dividends to our shareholders. Our Board of Directors may propose a dividend, which declaration, amount and payment per share is subject to approval by a simple majority of the shareholders. In 2010, 2011 and 2012 the shareholders approved the distribution of 71.8%, 70.3% and 79.9% of 2009, 2010 and 2011 of net income, respectively. On March 21, 2013, our shareholders at the ordinary general shareholders’ meeting approved an ordinary dividend of 70.9% plus an extraordinary dividend of 10% of net income for the fiscal year ended December 31, 2012. See “Item 5. Operating and Financial Review and Prospects—Liquidity and Capital Resources—Use of Funds—Dividends.”
SIGNIFICANT CHANGES
Except as discussed in “Item 4. Overview by Business Segment—Transportation and Logistics” related to the incorporation of Cenit as our wholly-owned subsidiary and the transfer of assets to it, there have not been any significant changes since the date of our annual consolidated financial statements for the year ended December 31, 2012.
| ITEM 9. | The Offer and Listing |
TRADING MARKETS
In August 2007, we conducted an initial public offering of 10.1% of our common shares in Colombia. As a result of such offering, our common shares have traded on the BVC since November 2007 under the symbol “ECOPETROL.” Our ADSs, representing 20 common shares, have been traded on the NYSE under the symbol “EC” since September 2008. JPMorgan Chase Bank, N.A. serves as depositary for our ADSs.
Since August 2010, our ADSs have been traded on the Toronto Stock Exchange under the symbol “ECP.”
The second round of the equity offering program took place between July 27 and August 17, 2011. The offer was directed exclusively to investors in Colombia as permitted by Law 1118 of 2006. A total of 644,185,868 shares were allotted, equivalent to approximately Ps$2.38 trillion. Out of the 219,054 investors participating in this round, 73% were new stockholders. In addition, 87% of the offering was allocated to retail investors and the remaining 13% to institutional investors. Funds obtained by us through this offering were allocated to the company’s investment plan.
In the future, the Nation – Ministry of Finance and Public Credit, as our controlling shareholder, may make decisions or announcements about its intention to sell part of its holding of our capital stock, as it has announced in recent years. We understand that our cooperation is necessary for the successful coordination of the Nation’s process.
The following table sets forth reported high and low closing prices in Pesos for our shares and the reported average daily trading volume of our shares on the BVC for the periods indicated. The table also sets forth information on the trading price of our shares in Pesos and U.S. dollars, as well as the average trading volume.
| | | Shares Traded on the BVC | |
| | | | | | | | | | | | | | | Average number of | |
| | | Pesos per share | | | U.S. dollars per share(1) | | | shares traded | |
| | | High | | | Low | | | High | | | Low | | | per day | |
| 2008 | | | 2,895 | | | | 1,575 | | | | 1.6638 | | | | 0.7647 | | | | 21,063,806 | |
| 2009 | | | 2,815 | | | | 1,990 | | | | 1.4707 | | | | 0.7833 | | | | 10,245,002 | |
| 2010 | | | 4,660 | | | | 2,370 | | | | 2.5582 | | | | 1.1958 | | | | 8,764,023 | |
| 2011 | | | 4,300 | | | | 3,575 | | | | 2.2823 | | | | 1.9466 | | | | 6,750,979 | |
| 2012 | | | 5,850 | | | | 4,200 | | | | 3.3236 | | | | 2.1619 | | | | 8,396,801 | |
| | | | | | | | | | | | | | | | | | | | | |
| Most recent quarters | | | | | | | | | | | | | | | | | | | | |
| | | | | | | | | | | | | | | | | | | | | |
| First quarter 2011 | | | 4,060 | | | | 3,750 | | | | 2.1774 | | | | 1.9805 | | | | 5,983,470 | |
| Second quarter 2011 | | | 4,045 | | | | 3,605 | | | | 2.2823 | | | | 1.9964 | | | | 5,769,997 | |
| Third quarter 2011 | | | 4,135 | | | | 3,575 | | | | 2.2689 | | | | 1.9967 | | | | 8,029,866 | |
| Fourth quarter 2011 | | | 4,300 | | | | 3,755 | | | | 2.2342 | | | | 1.9466 | | | | 7,105,117 | |
| First quarter 2012 | | | 5,480 | | | | 4,200 | | | | 3.0963 | | | | 2.1619 | | | | 11,929,722 | |
| Second quarter 2012 | | | 5,850 | | | | 4,850 | | | | 3.3236 | | | | 2.7133 | | | | 9,823,519 | |
| Third quarter 2012 | | | 5,430 | | | | 4,870 | | | | 2.9820 | | | | 2.7096 | | | | 6,398,774 | |
| Fourth quarter 2012 | | | 5,790 | | | | 5,140 | | | | 3.1866 | | | | 2.8253 | | | | 5,480,062 | |
| First quarter 2013 | | | 5,710 | | | | 4,895 | | | | 3.2091 | | | | 2.7050 | | | | 6,608,557 | |
| | | | | | | | | | | | | | | | | | | | | |
| Most recent six months | | | | | | | | | | | | | | | | | | | | |
| | | | | | | | | | | | | | | | | | | | | |
| October 2012 | | | 5,790 | | | | 5,270 | | | | 3.1866 | | | | 2.9269 | | | | 6,517,472 | |
| November 2012 | | | 5,360 | | | | 5,140 | | | | 2.9519 | | | | 2.8253 | | | | 4,982,031 | |
| December 2012 | | | 5,500 | | | | 5,200 | | | | 3.1047 | | | | 2.8673 | | | | 4,865,598 | |
| January 2013 | | | 5,650 | | | | 5,430 | | | | 3.1863 | | | | 3.0645 | | | | 4,956,770 | |
| February 2013 | | | 5,710 | | | | 5,190 | | | | 3.2091 | | | | 2.8683 | | | | 8,243,934 | |
| March 2013 | | | 5,200 | | | | 4,895 | | | | 2.8662 | | | | 2.7050 | | | | 6,860,155 | |
| April 2013 (through April 26) | | | 5,020 | | | | 4,225 | | | | 2.7447 | | | | 2.3115 | | | | 10,471,473 | |
| (1) | U.S. dollars per common share translated at the Representative Market Exchange Rate for each period. |
The following table sets forth reported high and low closing prices in U.S. dollars for our ADSs and the average daily trading volume of our ADSs on the NYSE for the periods indicated. The table also sets forth information on the trading price of our ADSs in U.S. dollars, as well as the average trading volume.
| | | ADSs Traded on NYSE | |
| | | U.S. dollars per ADS(1) | | | Average number of ADSs | |
| | | High | | | Low | | | traded per day | |
| 2008 | | | 27.25 | | | | 15.04 | | | | 42,074 | |
| 2009 | | | 29.99 | | | | 15.31 | | | | 48,289 | |
| 2010 | | | 51.92 | | | | 23.60 | | | | 163,749 | |
| 2011 | | | 46.00 | | | | 38.47 | | | | 357,289 | |
| 2012 | | | 67.48 | | | | 44.52 | | | | 551,410 | |
| | | | | | | | | | | | | |
| Most recent quarters | | | | | | | | | | | | |
| | | | | | | | | | | | | |
| First quarter 2011 | | | 43.81 | | | | 39.54 | | | | 289,293 | |
| Second quarter 2011 | | | 46.00 | | | | 39.66 | | | | 337,737 | |
| Third quarter 2011 | | | 45.53 | | | | 39.31 | | | | 469,033 | |
| Fourth quarter 2011 | | | 44.70 | | | | 38.47 | | | | 327,033 | |
| First quarter 2012 | | | 61.86 | | | | 44.52 | | | | 522,679 | |
| Second quarter 2012 | | | 67.48 | | | | 53.83 | | | | 749,654 | |
| Third quarter 2012 | | | 59.55 | | | | 53.96 | | | | 505,225 | |
| Fourth quarter 2012 | | | 63.70 | | | | 56.13 | | | | 429,951 | |
| First quarter 2013 | | | 63.80 | | | | 53.71 | | | | 480,344 | |
| | | | | | | | | | | | | |
| | | | | | | | | | |
| Most recent six months | | | | | | | | | | | | |
| | | | | | | | | | | | | |
| October 2012 | | | 63.70 | | | | 58.59 | | | | 492,495 | |
| November 2012 | | | 59.00 | | | | 56.13 | | | | 435,198 | |
| December 2012 | | | 61.60 | | | | 57.31 | | | | 355,954 | |
| January 2013 | | | 63.38 | | | | 59.67 | | | | 382,999 | |
| February 2013 | | | 63.80 | | | | 57.31 | | | | 549,337 | |
| March 2013 | | | 57.16 | | | | 53.71 | | | | 521,254 | |
| April 2013 (through April 26) | | | 54.70 | | | | 45.97 | | | | 726,425 | |
| (1) | Each ADS represents the right to receive 20 of our common shares. |
TRADING ON THE BOLSA DE VALORES DE COLOMBIA
The BVC is the largest stock exchange in Colombia for trading securities and derivatives. The BVC is a member of the World Federation of Exchanges and theFederación Iberoamericana de Bolsas.
The BVC is the only exchange where our common shares trade in Colombia. The table below sets forth the reported aggregate market capitalization of the BVC, as of December 31, 2012.
| | | Aggregate Market Capitalization of the BVC | |
| | | Market Capitalization | | | Market Capitalization | |
| | | (Ps$ in billions) | | | (US$ in billions)(1) | |
| | | | | | | |
| December 31, 2012 | | | 483,296 | | | | 273.3 | |
| (1) | Representative Market Exchange Rate at December 31, 2012. |
Transfer and Registration of Shares
Transfer of Shares
Under Colombian legislation, if the transfer of shares has a value equivalent or higher than 66,000 Unidades de Valor Real, or UVR, a measurement unit used in the Colombian market calculated daily, and the shares are registered with the BVC, the transfer has to be done through the BVC. Otherwise, shareholders can freely negotiate a transfer of shares.
Nevertheless, the following transfers are not required to be executed through the BVC:
| · | transfers between shareholders who are considered to be the same beneficial owner; |
| · | transfers of shares owned by financial institutions that are in a liquidation process; |
| · | repurchases of shares by the issuer; |
| · | transfers of shares made by the Nation or the Financial Institutions Guaranty Fund (Fondo de Garantias de Instituciones Financieras) or FOGAFIN; |
| · | transfers of shares issued abroad by Colombian companies, provided they take place outside Colombia; |
| · | transfers of shares issued by foreign companies, offered through a public offer in Colombia, and that they take place outside Colombia; and |
| · | any other transaction specifically authorized by the Superintendency of Finance to take place outside the BVC. |
With regard to public tender offers, Colombian law requires that all purchases of 25% or more of the outstanding shares with voting rights (including ADSs) of a listed company, or the purchase of 5% or more of the outstanding shares with voting rights (including ADSs) by an existing shareholder or group of shareholders beneficially owning 25% or more of the outstanding capital stock of a listed company, must be made pursuant to a public tender offer.
Tender offer rules have certain exemptions:
| · | sales in which 100% of the shareholders authorized the transfer to take place without a tender offer; |
| · | transfers made through an auction as a result of privatization procedures; |
| · | repurchase of shares by the issuer in open market transactions; |
| · | when the company issues shares with voting rights; |
| · | when the company capitalizes its debts; and |
| · | transfers by virtue of law including donations, liquidation processes and judicial decisions, among others. |
In any case, the Superintendency of Finance must be notified of any transfer that is deemed to be an “hecho relevante” or a material event under Colombian law.
Registration of Shares
Under Colombian law, transfers of shares must be registered on the issuer’s stock ledger. Only those holders registered on the stock ledger are considered by law as shareholders.
However, shares may be traded either in physical or electronic form. Transfers of shares are subject to a process for registration that differs depending on whether the shares are evidenced in physical or electronic form.
Transfers of shares evidenced in electronic form must first be registered with the Centralized Security Deposit (Depósito Centralizado de Valores) or DECEVAL, through the relevant stockbroker. Once DECEVAL has made the registration in its systems, it notifies the issuer of the transfer of shares in order to make the corresponding registration in the stock ledger.
When the stockholder has physical certificates, he is required, either by endorsing the certificates to the buyer or by giving a written instruction to the issuer for it to register the transfer on the stock ledger.
Transfers of shares do not require any fees to be paid to the issuer, but they may be subject to certain taxes, stamp duties or other governmental charges which must be paid by the parties.
| ITEM 10. | Additional Information |
BYLAWS
The following is a summary of the material provisions of our bylaws. The last amendment of our bylaws was approved on March 21, 2013 by the shareholders, which allows the Board of Directors to authorize the issuance and placement of non-convertible bonds as well as other debt securities. The amendment to the bylaws is in the process of being drafted and affirmed by the Notary.
This summary does not purport to be complete and is qualified by reference to our bylaws, which are filed as an exhibit to this annual report. For a description of the provisions of our bylaws relating to our Board of Directors and its committees, see “Item 6. Directors, Senior Management and Employees.”
Organization and Register
Ecopetrol was organized on August 25, 1951, existing under the laws of Colombia. Since November 13, 2007, Ecopetrol has been a mixed economy company. We are registered in the Chamber of Commerce of Bogota (Cámara de Comercio de Bogota) under registry number 899.999.068-1.
Corporate Purpose
Pursuant to Article 4 of our bylaws, we may engage in the exploration, production, refining, transportation, storage, distribution and commercialization of crude oil and its by-products in Colombia and abroad, and to support, promote and manage democratization programs and sales of its equity in accordance with applicable rules. Our bylaws also authorize us to perform activities for the exploration and production of crude oil in areas that prior to January 1, 2004 were operated by us directly or were subject to agreements subscribed by us; to directly or indirectly explore and produce crude oil in areas assigned to us by the ANH; to directly or indirectly explore and produce crude oil in areas assigned to us by a foreign regulatory entity; to buy, sell, import, export, store, blend, or distribute hydrocarbons and its by-products in Colombia or abroad; to undertake research for developing and commercializing alternative energy sources; and in general, to undertake any other activity instrumental or required to develop our corporate purpose. Our corporate purpose includes administering and managing all properties that were formerly part of the De Mares concession.
Additionally, pursuant to Article 5 of our bylaws, we may enter into all acts, contracts and legal business and activities that may be required for us to adequately fulfill our corporate purpose.
Preference Rights and Restrictions Attaching to Our Shares
We have only one class of stock without special rights or restrictions. Our shareholders do not have any type of preemptive rights.
Under Colombian law, our shareholders have the following economic privileges and voting rights:
| · | to participate and vote on the decisions of the general shareholders’ meeting; |
| · | to receive dividends based on the financial performance of the Company in proportion to their share ownership; |
| · | to transfer and sell shares according to our bylaws and Colombian law; |
| · | to inspect corporate books and records 15 business days prior to the ordinary shareholders’ meeting where the year-end financial statements are to be approved; |
| · | upon liquidation, to receive a proportional amount of the corporate assets after the payment of external liabilities; and |
| · | to sell the shares, known asderecho de retiro, if a corporate restructuring affects the economic or voting rights of the shareholders in the terms and conditions established under Colombian law. |
Our bylaws and corporate governance code provide additional rights to our minority shareholders. These rights include:
| · | Sale of Assets. For a ten-year period counted from the date of subscription of the declaration of the Nation dated July 26, 2007 or until the Nation loses its status as majority shareholder, the Nation guarantees that any sale of 15% or more of our assets requires the approval of the general shareholders’ meeting and that the Nation would only be allowed to vote its shares in favor of the proposal if 2% or more of our minority shareholders accept the proposal. |
| · | Candidate List. Pursuant to our bylaws and Law 1118 of 2006, the Nation will include in its candidate list for election of members of the Board of Directors one member selected by the departments that produce hydrocarbons. In addition, pursuant to the declaration of the Nation dated July 26, 2007, the Nation will include in its candidate list for election of members of the Board of Directors one member selected by the ten largest minority shareholders. The minority shareholders’ right to select a candidate loses its effect when minority shareholders, according to their share participation, name a member to our Board of Directors. |
| · | Extraordinary Meetings. Our bylaws and corporate governance code provide that the entity exercising permanent control over Ecopetrol must instruct the Company’s CEO or External Auditor to call an extraordinary meeting of the Company’s shareholders when so requested by a or plurality of shareholders holding at least 5% of the total number of outstanding shares. Such requests shall be made in writing and must clearly indicate the purpose of the meeting. |
| · | Office for the Attention of Shareholders. Ecopetrol has an office for the attention of shareholders, our specialized unit responsible for receiving complaints from our shareholders. Pursuant to our bylaws, shareholders holding at least 5% of the total number of shares outstanding may request that the office for the attention of shareholders conduct a special audit of the following documents: the income statement; the proposal for the distribution of profits; the report of the Board of Directors as to the economic and financial status of our Company; the report from our general counsel as to the legal status of our Company; and the report from the independent auditors. Special audits cannot be made of documents that contain scientific, technological or statistical information of our Company, or agreement that gives us competitive and economic advantages over our competitors, or in respect of any document related to intellectual property. Shareholders also have the right to propose good corporate governance recommendations to the office for the protection of investors. |
| · | Others. Pursuant to our bylaws, shareholders holding at least 5% of the total number of shares outstanding may propose recommendations to our Board of Directors pertaining to the management of our Company. Any shareholder may file a written petition to our Board of Directors to investigate corporate governance violations that the shareholder believes to have been committed. |
Amendments to Rights and Restrictions to Shares
The rights and restrictions given to our shareholders may only be modified through an amendment to our bylaws. The general shareholders’ meeting has full and exclusive authority to modify or amend our bylaws.
General Shareholders’ Meeting
Shareholders’ meetings may be ordinary or extraordinary. Ordinary meetings will take place in our legal domicile located in Bogota, Colombia, within the first three months following the end of each fiscal year, on the day and at the time set forth in the notice for the general shareholders’ meeting. The call for the general shareholders’ meeting may be made electronically or by written communication sent to each shareholder. In both cases the call must be published in a newspaper of wide circulation 20 business days prior to the date on which the meeting will take place.
In the ordinary general shareholders’ meeting, our Board of Directors and the external auditor are appointed and our annual financial statements, profit distribution, audit and management reports and any other matter provided under applicable law or our corporate bylaws are approved.
Extraordinary meetings of shareholders may be called by our Board of Directors, by our president or chief executive officer, by our external auditor, or by shareholders holding at least 5% of the shares outstanding. Calls to extraordinary meetings should be made at least eight days prior to the date of the meeting, and may be made electronically or by written communication to each shareholder or be published in a newspaper of wide circulation. The meeting notice must specify the agenda for the meeting.
The required quorum for both ordinary and extraordinary meetings is 50% plus one share entitled to vote and decisions are approved with a majority of the members present. This quorum is exempted in the case of “second-call meetings,” which may take place when a meeting fails to obtain the required quorum and is called within a period between 10 business days and 30 business days from the first date, in which case decisions may be adopted by a majority of the shares present regardless of the number represented.
Unless Colombian law requires a super majority, decisions made at ordinary and extraordinary shareholders’ meeting must be approved by a majority of the shares present. Colombian law requires super majorities in the following cases:
| · | the vote of at least 70% of the shares present and entitled to vote at the ordinary shareholders’ meeting is required to approve the issuance of stock not subject to preemptive rights; |
| · | the vote of at least 78% of the shares represented entitled to vote is required to approve the distribution of less than 50% of the annual net profits. If the sum of all legal reserves (statutory, legal and optional) exceeds the amount of the outstanding capital, the Company must distribute at least 70% of the annual net profits; |
| · | the vote of at least 80% of the shares represented is required to approve the payment of dividends in shares; and |
| · | the vote of 100% of the outstanding and issued shares is required to replace a vacancy on the Board of Directors without applying the electoral quotient system. |
Shareholders may be represented by proxies provided that the proxy: (1) is in writing (faxes and electronic documents are valid), (2) specifies the name of the representative, (3) specifies the date or time of the meeting for which the proxy is given and (4) includes other information specified by the applicable law. Proxies granted abroad do not require legalization or an apostille.
During our ordinary annual shareholders’ meeting, our employees and Directors are only allowed to represent their own shares, unless they act as legal representatives.
Limitations to the Rights to Hold Securities
There are no limitations in our bylaws or Colombian law on the rights of Colombian residents or foreign investors to own the shares of our Company, or on the right to hold or exercise voting rights with respect to those shares, except in cases of legal representation.
Restrictions on Change of Control Mergers, Acquisitions or Corporate Restructuring of the Company
Under Colombian law and our bylaws, the general shareholders’ meeting has full authority to approve any corporate restructuring including, any mergers, acquisitions or spin-offs. Corporate restructurings are also subject to the requirement that the Nation must hold a minimum of 80% of our common stock at all times. While Law 1118 of 2006 is in effect, there cannot be any restructuring that results in a change of control of our Company.
Ownership Threshold Requiring Public Disclosure
Our corporate governance code provides that we must disclose periodically on our web page, the names of the shareholders of our Company including, at least, the 20 shareholders with the greatest number of shares. We must also disclose this information to the Superintendency of Finance at the end of each fiscal year.
Colombian securities regulations set forth the obligation to disclose any material event orhecho relevante. Any transfer of shares equal or greater than 5% of our capital stock or any person acquiring a percentage of shares that would make him the beneficial owner of 5% or more of our capital stock, is a material event, and therefore, must be disclosed to the Superintendency of Finance.
Changes in the Capital of the Company
There are no conditions in our bylaws governing changes in our capital stock that are more stringent than those required under Colombian law, with the exception that the Nation must hold a minimum of 80% of our capital stock at all times. Even though the Government noted in previous years its intention to make a proposal to the Colombian Congress that would allow the Nation to hold 70% of the capital stock of the Company, Government officials remarked in early 2013 that no such proposals were intended in 2013. We do not know whether the Government will make such a proposal or if the Colombian Congress will approve any such law.
External Auditor
Pursuant to our bylaws, our external auditor shall not be appointed for more than five consecutive one-year terms by us. However, an external auditor may be hired again after two terms have passed since the conclusion of its last term of appointment. At the ordinary general shareholders’ meeting on March 21, 2013, the shareholders appointed Pricewaterhouse Coopers Ltd. as external auditor of Ecopetrol.
MATERIAL CONTRACTS
Transportation Agreement between Ecopetrol and Empresa Colombiana de Gas ESP/Transportadora de Gas del Interior S.A. ESP
On October 6, 2006, we entered into a natural gas transportation agreement with Empresa Colombiana de Gas ESP, or Ecogas, for the transportation of natural gas from the Ballena terminal located in the La Guajira fields to the Barrancabermeja terminal. On February 27, 2007, Ecogas transferred the rights and obligations under this agreement to Transportadora de Gas del Interior S.A. ESP, currently operating as Transportadora de Gas Internacional S.A. ESP, or TGI. This agreement expired on November 30, 2012.
On October 1, 2008, Ecopetrol and TGI signed a natural gas transportation agreement for the transportation of 116,500 thousand cfpd from December 1, 2012 to December 31, 2020 of natural gas from the Ballena terminal located in the La Guajira fields to Barrancabermeja. Pursuant to the terms of the agreement, we pay to TGI a regulated transportation tariff composed of a fixed fee, variable fee depending on transported volumes and an administration, operation and maintenance fee. Payments for transported volume are made in Pesos. During 2012, we paid Ps$49,416 million for the transportation services provided to us by TGI.
Transportation Agreement between Ecopetrol and Ocensa
On March 31, 1995, we entered into a crude oil transportation agreement with Ocensa. See “Item 7. Major Shareholders and Related Party Transactions—Related Party Transactions—Agreements—Ocensa.”
Reficar
On December 30, 2011, we entered into a construction support agreement pursuant to which we agreed to support Reficar’s costs and expenses related to overcost and delays in construction. The project financing contract and the related guarantee are described in “Item 5. Operating and Financial Review and Prospects—Liquidity and Capital Resources.”
Cenit
On April 1, 2013 we entered into two transportation agreements with Cenit, pursuant to which it will provide us with hydrocarbon and refined products transportation and logistics services through the transportation assets transferred to it as an in-kind capitalization. See “Item 7. Major Shareholders and Related Party Transactions—Related Party Transactions—Agreements—Cenit.”
EXCHANGE CONTROLS
Payments in foreign currency with respect to certain foreign exchange transactions including international investments between Colombian residents and non-Colombian residents must by law be conducted through the commercial exchange market. Therefore, any foreign currency income or expenses under the ADRs must be channeled through that market. Transactions conducted through the commercial exchange market are made at market rates freely negotiated with authorized intermediaries (banks, financial corporations, administrators and others).
Foreign capital investments must be made through authorized foreign exchange investment management companies. Only brokerage firms, trusts and investment management companies, subject to the inspection and supervision of the Superintendency of Finance are allowed to make investments in the local Colombian market on behalf of foreign investors, and, when referring to portfolio investments, such firms, trusts and investment management companies also act as the investors’ local representatives.
Colombian law provides that the Colombian Central Bank may intervene in the foreign exchange market at its own discretion at any time. Likewise, from time to time, the Colombian government introduces amendments to the International Investment Statute. The Colombian Central Bank may also limit the remittance of dividends and/or investments of foreign currency received by Colombian residents whenever international reserves fall below an amount equal to three months of imports. We cannot assure you that the Colombian Central Bank will not intervene in the future. However, since the establishment of the current foreign exchange regime in 1991, the Colombian Central Bank has never taken such action. See “Item 3. Key Information—Risk Factors—Risks Relating to Colombia’s political and regional environment.”
Registration of Foreign Investment Represented in Underlying Shares
Colombia’s International Investment Statute, which has been amended from time to time through related decrees and regulations, regulates the manner in which non-Colombian resident entities and individuals can invest in Colombia and participate in the Colombian securities markets. Among other requirements, the statute mandates registration of certain foreign exchange transactions with the Colombian Central Bank and specifies procedures to authorize and administer certain types of foreign investments. Additionally, pertinent information must be updated yearly.
Under these foreign investment regulations, the failure of a foreign investor to report or register with the Colombian Central Bank foreign exchange transactions relating to investments in Colombia on a timely basis may prevent the investor from obtaining remittance rights, constitute an exchange control infraction, and result in a fine.
Foreign investors who acquire ADRs are not required to register the investment with Colombian authorities. Holders of ADRs will benefit from the registration to be obtained by the custodian for our common shares underlying the ADRs in Colombia, which permits the custodian to convert dividends and other distributions with respect to the common shares into foreign currency and remit the proceeds abroad. If investors in ADRs choose to surrender their ADRs and withdraw common shares, they must register their investment in the common shares as a portfolio investment through their local representative. The local representative is the brokerage firm, trust company or investment management company that acts on behalf of the holders for the common shares in Colombia, and the request for registration is made by them through the transmission of consolidated information to the Colombian Central Bank.
In obtaining its own foreign investment registration, an investor who surrenders its ADRs and withdraws common shares may incur expenses and/or suffer delays in the application process. Investors would only be allowed to transfer dividends abroad or transfer funds received as distributions relating to our common shares after their foreign investment registration procedure with the Colombian Central Bank has been completed. In addition, the depositary’s foreign investment registration may also be adversely affected by future legislative changes, but its rights to transfer dividends abroad or profits arising from distributions relating to our common shares must be maintained according to Colombian law and foreign investment treaties entered into by Colombia, except when Colombia’s international reserves fall below an amount equivalent to three months’ worth of imports.
TAXATION
Colombian Tax Considerations
The following is a general description of the Colombian tax considerations for investments in common shares in Colombia or for the purchase of ADSs, in a foreign securities market. This description is based on applicable law in effect as of the date of this annual report, which may be subject to change. Please note that changes in tax regulations may apply retroactively, which in turn may affect the validity of the information provided herein.
Prospective purchasers of common shares or ADSs should consult their own tax advisors for a detailed analysis of the tax consequences resulting from the acquisition, ownership and disposition of common shares or ADSs.
General Rules
Entities and individuals who are residents or are domiciled in Colombia or are considered residents in Colombia for tax purposes, are subject to Colombian income tax on their worldwide income. Non-resident entities and non-resident individuals are subject to income tax in Colombia solely on their Colombian-source income which, as a general rule, originates in the sale of assets located in the country at the time of the sale, in the exploitation of tangible and intangible assets in Colombia, and in the rendering of services within the Colombian territory. Double taxation treaties signed by Colombia, if applicable, provide for special rules regarding income tax.
For purposes of Colombian taxation, an individual is a resident if he or she meets any of the following criteria:
| (i) | remains in Colombia for more than 183 calendar days within any given 365-consecutive-day term; |
| (ii) | is related to the Colombian Government’s foreign service or to individuals who are at the Colombian Government’s foreign service and who, by virtue of the Vienna Conventions on diplomatic and consular relations, is exempt from taxes during the time of service; or |
| (iii) | is a Colombian national and: |
- has a spouse or permanent companion, or dependent children, who are Residents, or
- 50% or more of his or her total income is sourced in Colombia, or
- 50% or more of his or her assets are managed in Colombia, or
- 50% or more of his or her assets are deemed to be located in Colombia, or
- has failed to provide proof of residency in another country (different from Colombia) upon previous official request by the Colombian tax office, or
- is a resident of a country deemed a tax haven under Colombian law.
For purposes of Colombian taxation, an entity is deemed to be a national, and, therefore, is subject to taxation in Colombia as a resident, if it meets any of the following criteria:
(i) it has its place of business or its place of effective management in Colombia during the corresponding year or taxable period;
(ii) it has its main domicile in the Colombian territory; or
(iii) it has been incorporated in Colombia, in accordance with Colombian laws.
Pursuant to the Colombian Tax Statute, a foreign company or non-resident individual has a permanent establishment in Colombia when said company or individual performs activities in Colombia through: (i) a fixed place of business (i.e., branches, factories or offices), or (ii) an individual who is not an independent agent empowered to execute agreements on behalf of the foreign company. Permanent establishments are considered Colombian taxpayers in connection with the income and taxable gains attributed to said permanent establishment. A foreign company or entity will not be deemed to have a permanent establishment by the sole fact that it acts through a broker or any other independent agent.
Tax Treatment of a Non-Resident of Colombia who Purchases an ADS in a Foreign Securities Market
Dividends
As a general rule, dividends paid to foreign companies, foreign entities or non-Colombian residents who are investing in Colombian shares directly or through a foreign investment capital fund, or FICF, are treated as Colombian-source income, and thus are subject to Colombian income tax.
To avoid double taxation, dividends are not subject to tax at the shareholder level when they are paid out of corporate profits that have been previously taxed at the corporate level. If the accounting or commercial earnings of a Colombian company exceed the tax profits subject to income tax at the corporate level, then the excess distributed as dividends is subject to income tax at the shareholder level. If the shareholder is a non-resident, the applicable tax rate is 33%. Further regulation and decrees are pending to be enacted by the government, as a consequence of the tax reform (Law 1607 of 2012 which entered into force on January 1, 2013).
If the shareholder is a non-resident entity or a non-resident individual investing through an FICF on portfolio investments, the applicable withholding tax rate is 25% and it is applied on the basis of the total amounts distributed, assuming that the dividends cannot be attributed to a permanent establishment in Colombia belonging to the shareholder. Foreign shareholders subject to such withholding taxes are not required to file an income tax return in Colombia.
Therefore, dividends distributed out of taxed earnings at the corporate level to shareholders who are non-residents will be exempt from income, withholding and remittance taxes. This exception does not apply in the case of distributions paid out of non-taxed earnings at the corporate level, which would be subject to the 33% income tax rate.
Taxation of Capital Gains from the sale of ADSs
Capital gains obtained from the sale of ADSs by non-resident entities, Colombian individuals who are not residents in Colombia or foreign non-resident individuals, are not subject to income tax in Colombia as such sale does not result in Colombian-source income to the extent that the ADSs are not deemed to be owned in Colombia.
If the holder of the ADSs who is a non-resident entity, a Colombian individual who is not a resident in Colombia or a foreign non-resident individual, decides to surrender the ADSs and withdraw the underlying common shares, it is arguable that such transaction does not constitute a capital gain subject to income tax in Colombia. However, different interpretations may be adopted by the Colombian Tax Authorities on this matter.
Tax Treatment in Colombia of Non-Resident who Purchases Ecopetrol´s Shares in Colombia’s Securities Market
Dividends
As a general rule, dividends paid to foreign companies or foreign entities, non-Colombian residents, who are investing in Colombian shares directly or through a FICF are treated as Colombian-source income; thus, they are subject to Colombian income tax.
To avoid double taxation, dividends are not subject to tax at the shareholder level when they are paid out of corporate profits that have been previously taxed at the corporate level. If the accounting or commercial earnings of a Colombian company exceed the tax profits subject to income tax at the corporate level, then the excess distributed as dividends is subject to income tax at the shareholder level. If the shareholder is a non-Colombian resident, the applicable tax rate is 33%. Further regulation and decrees are pending to be enacted by the government, as a consequence of the tax reform (Law 1607 of 2012 which entered into force on January 1, 2013).
If the shareholder is a non-resident entity or a non-resident individual investing through a FICF on portfolio investments, the applicable withholding tax rate is 25% and it is applied on the basis of the total amounts distributed, assuming that the dividends cannot be attributed to a permanent establishment in Colombia belonging to the shareholder. Foreign shareholders subject to said withholding taxes are not required to file an income tax return in Colombia.
Therefore, dividends distributed out of taxed earnings at the corporate level to shareholders who are non-residents, will be exempt from income, withholding and remittance taxes. This exception does not apply in the case of distributions paid out of non-taxed earnings at the corporate level which would be subject to the 33% income tax rate.
Taxation of Capital Gains for the Sale of Shares
Capital gains obtained in the sale of shares listed on the BVC and owned by the same beneficial owner, are not subject to income tax in Colombia, provided that the shares sold during the taxable year do not represent more than 10% of the outstanding shares of the listed company. Pursuant to Article 18 of Decree 2634 of 2012, sellers of shares are not required to file an income tax return for the transfer of securities that are listed in the National Registry of Securities and Issuers (Registro Nacional de Valores y Emisores orRNVE) as long as the foreign investment is treated as a portfolio investment under article 3 of Decree 2080 of 2000.
If the abovementioned requirements are not met, the capital gain obtained in the sale of shares is subject to income tax or capital gains tax, under the following rules:
| · | The gain or loss arising therefrom will be equivalent to the difference between the sale price and the tax basis of the shares. As a general rule, the tax basis of shares is equal to the price paid for such shares (i.e., cost of acquisition). |
| · | The applicable tax rate and the withholding tax rate have to be determined on a case-by-case basis. |
Tax Treatment by Non-Resident Who Purchase Ecopetrol’s Shares in the BVC Market and Exchange them for ADSs
Dividends
Payment of dividends made from Colombia to a non-resident are subject to the tax treatment described above. Therefore, payments to holders of ADSs are not subject to income, withholding or remittance taxes. Dividends paid to the Depositary of ADSs arising from Colombian shares are not subject to taxation, unless dividends are paid out of earnings that were not taxed at the corporate level, in which case they will be subject to income tax in Colombia at a 33% rate via withholding tax.
Taxation on Capital Gains for the Sale of Shares
Assuming that the exchange of securities is treated as a sale of Ecopetrol’s shares, the seller is subject to the tax treatment described above.
Therefore, capital gains obtained in the sale of shares listed on the BVC and owned by the same beneficial owner, are not subject to income tax in Colombia, provided that the shares sold during the taxable year do not represent more than 10% of the outstanding shares of the listed company. Pursuant to Article 18 of Decree 2634 of 2012, sellers of shares are not required to file an income tax return for the transfer of securities that are listed in the RNVE as long as the foreign investment is treated as a portfolio investment under article 3 of Decree 2080 of 2000.
If the abovementioned requirements are not met, the capital gain obtained in the sale of shares is subject to income tax or capital gains tax, under the following rules:
| · | The gain or loss arising therefrom will be equivalent to the difference between the sale price and the tax basis of the shares. As a general rule, the tax basis of shares is equal to the price paid for such shares (i.e., cost of acquisition). |
| · | The applicable tax rate and the withholding tax rate has to be determined in a case-by-case basis. |
U.S. Federal Income Tax Consequences
This summary describes the principal U.S. federal income tax consequences of the ownership and disposition of common shares or ADSs, but it does not purport to be a comprehensive description of all of the U.S. tax consequences that may be relevant to a decision to hold or dispose of common shares or ADSs. This summary applies only to purchasers of common shares or ADSs who will hold the common shares or ADSs as capital assets and does not apply to special classes of holders such as dealers in securities or currencies, holders whose functional currency is not the U.S. dollar, holders of ten percent or more of our shares (taking into account shares held directly or through depositary arrangements), tax-exempt organizations, financial institutions, holders liable for the alternative minimum tax, securities traders who elect to account for their investment in common shares or ADSs on a mark-to-market basis, partnerships or other pass-through entities, insurance companies, U.S. expatriates, and persons holding common shares or ADSs in a hedging transaction or as part of a straddle, conversion or other integrated transaction for U.S. federal income tax purposes. The statements regarding U.S. tax law set forth in this summary are based on U.S. law as in force on the date of this annual report, and changes to such law subsequent to the date of this annual report may affect the tax consequences described herein (possibly with retroactive effect). This summary is also based in part on the representations of the Depositary and the assumption that each obligation in the deposit agreement and any related agreement will be performed in accordance with its terms.
Each holder is encouraged to consult such holder’s tax advisor concerning the overall tax consequences to it, including the consequences under laws other than U.S. federal income tax laws, of an investment in common shares or ADSs.
In this discussion, references to a “U.S. Holder” are to a beneficial holder of a common share or an ADS (1) that is a citizen or resident of the United States of America, (2) that is a corporation, or any other entity taxable as a corporation, organized under the laws of the United States of America, any state thereof or the District of Columbia, or (3) that is otherwise subject to U.S. federal income taxation on a net basis with respect to the common shares or ADS.
For purposes of the U.S. Internal Revenue Code of 1986, as amended, which we call the “Code,” holders of ADSs will generally be treated as owners of the common shares represented by such ADSs.
This discussion does not address U.S. federal estate and gift tax or the alternative minimum tax consequences of holding common shares or ADSs. In addition, this discussion does not address the state, local and non-U.S. tax consequences of holding our common shares or ADSs.
Distributions on Common Shares or ADSs
A distribution to U.S. Holders made by us of cash or property with respect to common shares or ADSs generally will be treated as a dividend for U.S. federal income tax purposes to the extent paid out of our current or accumulated earnings and profits (as determined under U.S. federal income tax principles). A U.S. Holder of common shares or ADSs generally will be taxed on such dividend as ordinary income. Distributions in excess of our current or accumulated earnings and profits will be treated first as a tax-free return of capital reducing such U.S. Holder’s adjusted tax basis in the common shares or ADSs. Any distribution in excess of such adjusted tax basis will be treated as capital gain and will be either long-term or short-term capital gain depending upon whether the U.S. Holder held the common shares or ADSs for more than one year. Distributions of additional common shares or ADSs to U.S. Holders that are part of a pro rata distribution to all of our shareholders generally will not be subject to U.S. federal income tax. We do not maintain calculations of our earnings and profits under U.S. federal income tax principles, and, therefore, U.S. Holders should expect that any distributions generally will be reported as dividends for U.S. federal income tax purposes. As used below, the term “dividend” means a distribution that constitutes a dividend for U.S. federal income tax purposes.
The amount of any distribution will include the amount of any Colombian tax withheld on the amount distributed, and the amount of a distribution paid in Pesos will be measured by reference to the exchange rate for converting Pesos into U.S. dollars in effect on the date the distribution is received by the Depositary (or by a U.S. Holder in the case of a holder of common shares). If the Depositary (or U.S. Holder in the case of a holder of common shares) does not convert such Pesos into U.S. dollars on the date it receives them, it is possible that the U.S. Holder will recognize foreign currency loss or gain, which would be ordinary loss or gain, when the Pesos are converted into U.S. dollars. Dividends paid by us will not be eligible for the dividends received deduction allowed to corporations under the Code.
Subject to certain exceptions for short-term and hedged positions, the dividends received by an individual with respect to the ADSs will be subject to taxation at a maximum rate of 20.0% if the dividends are “qualified dividends.” Dividends paid on the ADSs will be treated as qualified dividends if (1) the ADSs are readily tradable on an established securities market in the United States and (2) we were not, in the year prior to the year in which the dividend was paid, and are not, in the year in which the dividend is paid, a passive foreign investment company (“PFIC”). The ADSs are listed on the New York Stock Exchange, and will qualify as readily tradable on an established securities market in the United States so long as they are so listed. Based on our audited financial statements and relevant market and shareholder data, we believe that we were not treated as a PFIC for U.S. federal income tax purposes with respect to our 2012 taxable year. In addition, based on our audited financial statements and our current expectations regarding the value and nature of our assets, the sources and nature of our income, and relevant market and shareholder data, we do not anticipate becoming a PFIC for the 2013 taxable year. Based on existing guidance, it is not clear whether dividends received with respect to the common shares will be treated as qualified dividends. In addition, the U.S. Treasury has announced its intention to promulgate rules pursuant to which holders of ADSs or common shares and intermediaries through whom such securities are held will be permitted to rely on certifications from issuers to treat dividends as qualified for tax reporting purposes. Because such procedures have not yet been issued, it is not clear whether we will be able to comply with them. Holders of ADSs and common shares should consult their own tax advisers regarding the availability of the reduced dividend tax rate in the light of the considerations discussed above and their own particular circumstances.
A U.S. Holder will be entitled, subject to a number of complex limitations and conditions, to claim a U.S. foreign tax credit in respect of any Colombian income taxes withheld on dividends received on common shares or ADSs. U.S. Holders who do not elect to claim a credit for any foreign income taxes paid during the taxable year may instead claim a deduction in respect of such Colombian income taxes provided the U.S. Holder elects to deduct (rather than credit) all foreign income taxes for that year. Dividends received with respect to the common shares or ADSs will be treated as foreign source income, subject to various classifications and other limitations. For the purposes of the U.S. foreign tax credit limitations, the dividends paid with respect our common shares or ADSs should generally constitute “passive category income.” The rules relating to computing foreign tax credits or deducting foreign income taxes are extremely complex, and U.S. Holders are urged to consult their own independent tax advisors regarding the availability of foreign tax credits with respect to any Colombian income taxes withheld.
Sale, Exchange or Other Taxable Dispositions of Common Shares or ADSs
A U.S. Holder generally will recognize capital gain or loss upon the sale, exchange or other taxable disposition of common shares or ADSs in an amount equal to the difference between the amount realized on the sale, exchange or other taxable disposition of the common shares or ADSs and the U.S. Holder’s adjusted tax basis in the common shares or ADSs. Any gain or loss will be long-term capital gain or loss if the common shares or ADSs have been held for more than one year. Certain non-corporate U.S. Holders (including individuals) may be eligible for preferential rates of U.S. federal income tax in respect of long-term capital gains. The deductibility of capital losses is subject to limitations under the Code.
If you are a U.S. Holder of common shares or ADSs, the initial tax basis of your common shares or ADSs will be the U.S. dollar value of the Peso-denominated purchase price determined on the date of purchase. If the common shares or ADSs are treated as traded on an “established securities market,” a cash basis U.S. Holder, or, if it elects, an accrual basis U.S. Holder, will determine the dollar value of the cost of such common shares or ADSs by translating the amount paid at the spot rate of exchange on the settlement date of the purchase. If you convert U.S. dollars to Pesos and immediately use that currency to purchase common shares or ADSs, such conversion generally will not result in taxable gain or loss to you.
With respect to the sale or exchange of common shares or ADSs, the amount realized generally will be the U.S. dollar value of the payment received determined on (1) the date of receipt of payment in the case of a cash basis U.S. Holder and (2) the date of disposition in the case of an accrual basis U.S. Holder. If the common shares or ADSs are treated as traded on an “established securities market,” a cash basis taxpayer, or, if it elects, an accrual basis taxpayer, will determine the U.S. dollar value of the amount realized by translating the amount received at the spot rate of exchange on the settlement date of the sale.
If a Colombian income tax is withheld or otherwise imposed on the sale, exchange or other taxable disposition of common shares or ADSs, the amount realized by a U.S. Holder will include the gross amount of the proceeds of that sale or other disposition before deduction of the Colombian income tax. Capital gain or loss, if any, realized by a U.S. Holder on the sale, exchange or other taxable disposition of common shares or ADSs generally will be treated as U.S. source income or loss for U.S. foreign tax credit purposes. Consequently, in the case of a disposition of a common share or ADS that is subject to Colombian income tax imposed on the gain, the U.S. Holder may not be able to benefit from the foreign tax credit for the Colombian income tax (because the income or loss on the disposition would be U.S. sourced), unless the U.S. Holder can apply the credit against U.S. federal income tax payable on other income from foreign sources. Alternatively, the U.S. Holder may take a deduction for the Colombian income tax if it does not elect to claim a foreign tax credit for any foreign income taxes paid or accrued during the taxable year.
Deposits and withdrawals of common shares in exchange for ADSs will not result in the realization of gain or loss for U.S. federal income tax purposes.
Backup Withholding and Information Reporting
In general, dividends on common shares or ADSs, and payments of the proceeds of a sale, exchange or other taxable disposition of common shares or ADSs, paid within the United States, by a U.S. payor through certain U.S.-related financial intermediaries to a U.S. Holder are subject to information reporting and may be subject to backup withholding at a current rate of 28% unless the holder (1) establishes that it is a corporation or other exempt recipient or (2) with respect to backup withholding, provides an accurate taxpayer identification number and certifies that it is a U.S. person and that no loss of exemption from backup withholding has occurred.
Backup withholding is not an additional tax. The amount of any backup withholding tax from a payment to a U.S. Holder will be allowed as a credit against the U.S. Holder’s U.S. federal income tax liability, provided that the required information is timely furnished to the IRS. A U.S. Holder generally may obtain a refund of any amounts withheld under the backup withholding rules that exceed its U.S. federal income tax liability by timely filing a refund claim with the IRS.
U.S. Tax Considerations for Non-U.S. Holders
A holder or beneficial owner of common shares or ADSs that is not a U.S. Holder for U.S. federal income tax purposes (a “non-U.S. Holder”) generally will not be subject to U.S. federal income or withholding tax on dividends received on common shares or ADSs.
A non-U.S. Holder of common shares or ADSs will not be subject to U.S. federal income or withholding tax on gain realized on the sale of common shares or ADSs, unless, in the case of gain realized by an individual non-U.S. Holder, the non-U.S. Holder is present in the United States for 183 days or more in the taxable year of the sale and certain other conditions are met.
Although non-U.S. Holders generally are exempt from backup withholding, a non-U.S. Holder may be required to comply with certification and identification procedures in order to establish its exemption from information reporting and backup withholding.
DOCUMENTS ON DISPLAY
We file reports, including annual reports on Form 20-F, and other information with the SEC pursuant to the rules and regulations of the SEC that apply to foreign private issuers. You may read and copy any materials filed with the SEC in the SEC’s public reference room at 100 F. Street, NE, Washington, D.C. 20549. Please call the SEC at 1-800-SEC-0330 for further information on the operation of the public reference room. Any filings we make are also available to the public over the Internet at the SEC’s website at www.sec.gov and at our website at www.ecopetrol.com.co. (This URL is intended to be an inactive textual reference only. It is not intended to be an active hyperlink to our website. The information on our website, which might be accessible through a hyperlink resulting from this URL, is not and shall not be deemed to be incorporated into this annual report.)
| ITEM 11. | Quantitative and Qualitative Disclosures About Market Risk |
Risk Management and Financial Instruments
We are exposed to certain risks associated with the nature of our operations and the financial instruments we use. Among those risks affecting our financial assets, liabilities and expected future cash flows are the changes in commodity prices, currency exchange rates and interest rates.
Commodity price risk is associated with our day-to-day operations as we export and import crude oil, natural gas, and refined products. We control our exposure to commodity price volatility using the “cash flow at risk” methodology, which provides an estimation of the impact that price fluctuations have over the liquidity of the company. When necessary, we use derivative financial instruments such as options and swaps to hedge our exposure to volatility in commodity prices. We do not use derivative financial instruments for speculative or profit-generating purposes.
Currency risk is associated with the fact that approximately 65% of our income is denominated in U.S. dollars and only 35% of our expenses are denominated in U.S. dollars, whereas our income and expenses denominated in Colombian pesos are 35% and 65%, respectively. We control our currency risk using natural hedging when possible, by maintaining funds in U.S. dollars and Pesos to meet our expenses in its respective currency. However, we have to sell U.S. dollars regularly in order to cover the currency mismatches that may arise. Derivative financial instruments such as forwards, futures and swaps are usually used when weaker or stronger Peso/U.S. dollar-denominated obligations may affect the cash flow of the Company. In addition, the obligations derived from our U.S. dollar-denominated debt are naturally hedged by our funds in the same currency. This situation partially mitigates any adverse effect that currency risk may have over the financial statements of the Company.
Interest rate risk arises from our exposure to changes in interest rates, as we have floating-rate instruments in our investment portfolio and issuances of floating rate debt linked to DTF and IPC rates. Thus, volatility in interest rates may affect the fair value and cash flows related to our investments and floating rate debt. In 2011, credit risk events emerged constantly, with financial entities being downgraded or declaring restricted default. As a result, our analysis of the situation in the global financial markets resulted in the decision not to hedge the interest rate risk. Nevertheless, our treasury office continuously monitors the performance of interest rates and its impact on the financial statements of the Company. On the other hand, the exposure to interest rate risk of our fixed income portfolio is controlled through its effective duration. The limits allowed for the effective duration are between +/- 25% of the portfolio’s benchmark duration.
Investment Guidelines
Following Decree 1525 of 2008, our management established guidelines for our investment portfolios. In general terms, our guidelines determine that we must invest our excess cash in fixed-income securities issued by entities rated A or higher in the long term and A1/P1/F1 or higher in the short term (international scale) by a recognized rating agency. We have no limitation to invest in securities issued or guaranteed by the U.S. government or the Colombian government. In our Peso-portfolio, we must invest in fixed-income securities of issuers rated AAA in the long term and F1+/BRC1+ in the short term (local scale) by a recognized rating agency, except securities issued or guaranteed by the Colombian government.
Our investment portfolio in U.S. dollars is segmented in four tranches, each one matching our liquidity needs. The working capital tranche is calculated taking into account our cash flow needs for the next 60 days. The liquidity tranche is calculated as the contingent cash flow needs over the working capital, taking into account the development of capital expenditures related to projects. The asset liability tranche is built to match our off-balance sheet debt. The investment tranche includes the remaining amount of the total portfolio after deducting the amounts pertaining to the above mentioned tranches.
Our investment portfolio in Pesos is segmented in two tranches, each one matching our liquidity needs. The first tranche is calculated taking into account our cash flow needs for the next 30 days, and the second tranche is built for investment purposes.
Sensitivity Analysis
The following table provides information about our financial statements as of December 31, 2012 that may be sensitive to changes in West Texas Intermediate, or WTI, prices and exchange rates:
| | | Income
Statement 2012 | | | Income
Statement Case
WTI(1) + US$1 | | | Difference
Between Real
2012 and Case
WTI | | | Income
Statement Case
TRM(2) - 1% | | | Difference
Between Real
2012 and Case
TRM | |
| | | (Pesos in Billons) | |
| | | | | | | | | | | | | | | | |
| Local Revenue | | | 24,361.91 | | | | 24,596.14 | | | | 234.23 | | | | 24,181.03 | | | | (180.88 | ) |
| Export Revenue | | | 44,490.09 | | | | 44,886.71 | | | | 396.63 | | | | 44,094.58 | | | | (395.50 | ) |
| Total Revenue | | | 68,852.00 | | | | 69,482.85 | | | | 630.85 | | | | 68,275.61 | | | | (576.39 | ) |
| Cost of Sales | | | 40,535.51 | | | | 40,795.77 | | | | 260.26 | | | | 40,333.17 | | | | (202.34 | ) |
| Selling Operating Expenses | | | 3,235.22 | | | | 3,235.22 | | | | 0.00 | | | | 3,235.22 | | | | 0.00 | |
| Administrative Operating Expenses | | | 874.98 | | | | 874.98 | | | | 0.00 | | | | 874.98 | | | | 0.00 | |
| Operating Profit | | | 24,206.29 | | | | 24,576.88 | | | | 370.59 | | | | 23,832.24 | | | | (374.05 | ) |
| Non-Operating Income (Expenses) | | | (1,999.87 | ) | | | (1,999.87 | ) | | | 0.00 | | | | (1,999.87 | ) | | | 0.00 | |
| Profit before Income Tax | | | 22,206.42 | | | | 22,577.01 | | | | 370.59 | | | | 21,832.37 | | | | (374.05 | ) |
| Income Tax | | | (7,133.39 | ) | | | (7,255.67 | ) | | | (122.27 | ) | | | (7,016.95 | ) | | | (116.45 | ) |
| Minority Interest | | | (419.36 | ) | | | (419.36 | ) | | | 0.00 | | | | (419.36 | ) | | | 0.00 | |
| Net Income | | | 14,653.67 | | | | 14,901.99 | | | | 248.32 | | | | 14,396.07 | | | | (257.60 | ) |
WTI= West Texas Intermediate.
| (1) | Average WTI for 2012 was US$94.20 per barrel. |
| (2) | Average Market Representative Rate for 2012 was Ps$1,798 per US$1.00 on a calendar day basis. |
Assumptions for the Sensitivity Analysis of Financial Statements
| · | The base scenario on which our sensitivity analysis is made corresponds to the Consolidated Statements of Financial, Economic, Social and Environmental Activity or Income Statement, for 2012 as presented elsewhere in this annual report. |
| · | The sensitivity of the WTI price index is the increase of one U.S. dollar per barrel of crude oil in the average WTI reference price based on a 365-day year for 2012. Prices assumed correspond to real prices for crude oil, natural gas and refined products for 2012, adjusted to account for the differences between such real prices and the WTI reference price. |
| · | The sensitivity of our results to changes in the exchange rates is the 2.67% average appreciation of the Peso against the U.S. dollar during 2012. Prices assumed correspond to real prices of crude oil, natural gas and refined products in 2012, proportionally adjusted to account for differences between actual and the monthly average exchange rate. |
The table below sets forth the line items that are being affected by the variation on the reference prices or the average exchange rate.
| VARIATION ON WTI REFERENCE PRICE | VARIATION ON AVERAGE EXCHANGE RATE |
| OPERATING INCOME |
| Local Sales | Local Sales |
| Crude Oil | Crude Oil |
| Refined products | Refined products |
| Natural gas | Natural gas |
| | |
| Exports | Exports |
| Crude Oil | Crude Oil |
| Refined products | Refined products |
| Natural gas | Natural gas |
| COST OF SALES |
| Local purchases | Local purchases |
| Purchases from business partners | Purchases from business partners |
| Purchases of hydrocarbons from the ANH | Purchases of hydrocarbons from the ANH |
| Purchases of Natural gas | Purchases of Natural gas |
| Imports | Imports |
| Crude Oil | Crude Oil |
| Products | Products |
| NON-OPERATING INCOME |
| | Exchange income |
| | Exchange loss |
| ITEM 12. | Description of Securities Other than Equity Securities |
Not applicable.
| ITEM 12B. | Warrants and Rights |
Not applicable.
| ITEM 12C. | Other Securities |
Not applicable.
| ITEM 12D. | American Depositary Shares |
Fees and Charges That a Holder of our ADSs May Have to Pay, Either Directly or Indirectly
JPMorgan Chase Bank, N.A., our Depositary, may charge each person to whom ADSs are issued, including, without limitation, issuances against deposits of shares, issuances in respect of share distributions, rights and other distributions, issuances pursuant to a stock dividend or stock split declared by us or issuances pursuant to a merger, exchange of securities or any other transaction or event affecting the ADSs or deposited securities, and each person surrendering ADSs for withdrawal of deposited securities in any manner permitted by the deposit agreement or whose ADRs are cancelled or reduced for any other reason, US$5.00 for each 100 ADS (or any portion thereof) issued, delivered, reduced, cancelled or surrendered, as the case may be. The Depositary may sell (by public or private sale) sufficient securities and property received in respect of a share distribution, rights and/or other distribution prior to such deposit to pay such charge.
The Depositary collects its fees for issuance and cancellation of ADSs directly from investors depositing shares or surrendering ADSs for the purpose of withdrawal or from intermediaries acting for them. The Depositary collects fees for making distributions to investors by deducting those fees from the amounts distributed or by selling a portion of distributable property to pay the fees. The Depositary may collect its annual fee for Depositary services by deduction from cash distributions, or by directly billing investors, or by charging the book-entry system accounts of participants acting for them. The Depositary may generally refuse to provide services to any holder until the fees and expenses owing by such holder for those services or otherwise are paid.
The following additional charges may be incurred by ADS holders, by any party depositing or withdrawing shares or by any party surrendering ADSs or to whom ADSs are issued (including, without limitation, issuance pursuant to a stock dividend or stock split declared by us or an exchange of stock regarding the ADRs or the deposited securities or a distribution of ADSs), whichever is applicable:
| · | a fee of US$1.50 per ADR or ADRs for transfers of certificated or direct registration ADRs; |
| · | a fee of up to US$0.02 per ADS for any cash distribution made pursuant to the deposit agreement; |
| · | a fee of US$0.05 per ADS per calendar year (or portion thereof) for services performed by the Depositary in administering our ADR program (which fee may be charged on a periodic basis during each calendar year and shall be assessed against holders of ADRs as of the record date or record dates set by the Depositary during each calendar year and shall be payable in the manner described in the next succeeding provision); |
| · | any other charge payable by any of the Depositary, any of the Depositary’s agents, including, without limitation, the custodian, or the agents of the Depositary’s agents in connection with the servicing of our shares or other deposited securities (which charge shall be assessed against registered holders of our ADRs as of the record date or dates set by the Depositary and shall be payable at the sole discretion of the Depositary by billing such registered holders or by deducting such charge from one or more cash dividends or other cash distributions); |
| · | a fee for the distribution of securities (or the sale of securities in connection with a distribution), such fee being in an amount equal to the fee for the execution and delivery of ADSs which would have been charged as a result of the deposit of such securities (treating all such securities as if they were shares) but which securities or the net cash proceeds from the sale thereof are instead distributed by the Depositary to those holders entitled thereto; |
| · | stock transfer or other taxes and other governmental charges; |
| · | cable, telex and facsimile transmission and delivery charges incurred at the ADS holder’s request; |
| · | transfer or registration fees for the registration of transfer of deposited securities on any applicable register in connection with the deposit or withdrawal of deposited securities; |
| · | expenses of the Depositary in connection with the conversion of foreign currency into U.S. dollars; and |
| · | such fees and expenses as are incurred by the Depositary (including, without limitation, expenses incurred in connection with compliance with foreign exchange control regulations or any law or regulation relating to foreign investment) in delivery of deposited securities or otherwise in connection with the Depositary’s or its custodian’s compliance with applicable laws, rules or regulations. |
We will pay all other charges and expenses of the Depositary and any agent of the Depositary (except the custodian) pursuant to agreements from time to time between us and the Depositary. The fees described above may be amended from time to time.
Fees and Other Direct and Indirect Payments Made by the Depositary to Us
Our Depositary has agreed to reimburse us for certain expenses we incur that are related to establishment and maintenance of the ADR program, including investor relations expenses and exchange application and listing fees. In 2012, the Depositary made direct payments and reimbursements to us in the amount of approximately US$446,149.84 for expenses related to investor relations expenses.
| ITEM 13. | Defaults, Dividend Arrearages and Delinquencies |
None.
| ITEM 14. | Material Modifications to the Rights of Security Holders and Use of Proceeds |
None.
| ITEM 15. | Controls and Procedures |
Disclosure Controls and Procedures
As required by Rules 13a-15(e) and 15d-15(e) under the Securities Exchange Act of 1934, as of December 31, 2012, we evaluated the design and effectiveness of our financial disclosure controls and procedures under the supervision and participation of our management, including our Chief Executive Officer and Chief Financial Officer. There are inherent limitations to the effectiveness of any system of disclosure controls and procedures, including the possibility of human error and the circumvention or overriding of the controls and procedures. Accordingly, even if effective, disclosure controls and procedures can only provide reasonable assurance of achieving their control objectives.
Based upon this evaluation, our Chief Executive Officer and Chief Financial Officer concluded that as of the end of the period covered by this annual report, our disclosure controls and procedures were effective to provide reasonable assurance that the information required to be disclosed in the reports that we file and submit under the Securities Exchange Act of 1934 is recorded, summarized and reported as and when required and is accumulated and communicated to our management, including our Chief Executive Officer and Chief Financial Officer, or persons performing similar functions, as appropriate to allow timely decisions regarding required disclosure.
Management’s Annual Report on Internal Control over Financial Reporting
Our management is responsible for establishing and maintaining adequate internal control over financial reporting as defined in Rules 13a-15(f) and 15(d)-15(f) under the Securities Exchange Act of 1934. Our internal control over financial reporting is a process designed under the supervision of our Chief Executive Officer and Chief Financial Officer, and affected by our board of directors, management and other personnel, to provide reasonable assurance regarding the reliability of financial reporting and the preparation of our financial statements for external reporting purposes in accordance with generally accepted accounting principles, and it includes those policies and procedures that:
| · | pertain to the maintenance of records that, in reasonable detail, accurately and fairly reflect transactions and dispositions of our assets; |
| · | provide reasonable assurance that transactions are recorded as necessary to permit preparation of financial statements in accordance with generally accepted accounting principles, and that receipts and expenditures are being made only in accordance with authorization of our management and directors; and |
| · | provide reasonable assurance regarding prevention or timely detection of unauthorized acquisition, use or disposition of our assets that could have a material effect on our financial statements. |
Because of its inherent limitations, internal control over financial reporting may not prevent or detect misstatements. Therefore, effective control over financial reporting cannot, and does not, provide absolute assurance of achieving our control objectives. Also, projection of any evaluation of the effectiveness of the internal controls to future periods is subject to the risk that controls may become inadequate because of changes in conditions or that the degree of compliance with the policies or procedures may deteriorate.
As of the year ended December 31, 2012, our management conducted an assessment of the effectiveness of our internal control over financial reporting in accordance with the criteria established in the publication “Internal Control – Integrated Framework”, issued by the Treadway Commission’s Committee of Sponsoring Organizations (COSO), as well as the rules prescribed by the SEC in its Final Rule “Management’s Report on Internal Control Over Financial Reporting and Certification of Disclosure in Exchange Act Periodic Reports.”
Based on the assessment performed, management concluded that our internal control over financial reporting was effective as of the end of the period covered by this annual report.
The effectiveness of our internal control over financial reporting has been audited by KPMG Ltda., an independent registered public accounting firm, as stated in their audit report accompanying our consolidated financial statements.
Changes in Internal Control over Financial Reporting
There were no changes made in our internal control over financial reporting during the year ended December 31, 2012 that have materially affected or are reasonably likely to materially affect the Company’s internal controls over financial reporting.
Attestation Report of the Registered Public Accounting Firm
KPMG Ltda.’s attestation report on our internal control over financial reporting is included in their audit report accompanying our consolidated financial statements. See our consolidated financial statements.
| ITEM 16A. | Audit Committee Financial Expert |
Our Board of Directors has determined that Roberto Steiner Sampedro qualifies as an “audit committee financial expert,” and he is independent under the definition of “independent” applicable to us under the rules of the NYSE (17 CFR 240.10A-3). See “Item 6. Directors, Senior Management and Employees—Audit Committee.”
We have adopted a code of ethics within the meaning of this Item 16B of Form 20-F, which complies with applicable U.S. and Colombian law. Our code of ethics applies to our chief executive officer, chief financial officer, principal accounting officer, persons performing similar functions and other personnel. Our code of ethics is available on our website at http://www.ecopetrol.com.co/english/especiales/Ethics_Code2010_English/index_eng.html. If we amend the provisions of our code of ethics that apply to our chief executive officer, our chief financial officer, our principal accounting officer and persons performing similar functions, or if we grant any waiver of such provisions, we will disclose such amendment or waiver on our website at the same address.
| ITEM 16C. | Principal Accountant Fees and Services |
Audit and Non-Audit Fees
The following table sets forth the fees billed to us by KPMG during the fiscal years ended December 31, 2012 and 2011, respectively:
| | | At December 31, | |
| | | 2012 | | | 2011 | |
| | | (in millions of pesos, excluding 16% value added tax) | |
| | | | |
| Audit fees | | | 6,548 | | | | 5,411 | |
| Audit-related fees | | | 225 | | | | 1,013 | |
| Tax fees | | | 295 | | | | 287 | |
| All Other fees(1) | | | 3,384 | | | | 1,553 | |
| | | | | | | | | |
| Total | | | 10,452 | | | | 8,264 | |
| (1) | Provision of advice that helps Ecopetrol develop its documents, procedures and policies related to Business Continuity Planning in certain areas of the organization. |
Audit Fees.The audit fees listed in the table above are the aggregated fees billed by KPMG in connection with its audits of our annual consolidated financial statements (under Colombian Government Entity GAAP and U.S. GAAP), interim consolidated financial statements (under Colombian Government Entity GAAP), subsidiary audits (under local GAAP) and review of periodic documents filed with the SEC. In addition, these audit fees include fees related to our independent auditors’ audits of our internal controls over financial reporting.
Audit-related Fees.The audit-related fees listed in the table above are the fees billed by KPMG in connection with their agreed-upon procedures of our variable compensation bonus system.
Tax Fee.The tax fees listed in the table above correspond to (1) assisting some subsidiaries in the preparation and filing of appropriate tax returns with the tax authorities (including electronic filings), (2) advising some subsidiaries about the tax consequences associated with new or proposed legislation and (3) rendering advice to some subsidiaries on the likely tax consequences of proposed transactions and the appropriate methods of structuring and reporting.
Audit Committee Approval Policies and Procedures
Our audit committee has not established pre-approval policies and procedures for the engagement of our independent auditors for services. Our audit committee expressly approves on a case-by-case basis any engagement of our independent auditors for audit and non-audit services provided to us.
| ITEM 16D. | Exemptions from the Listing Standards for Audit Committees |
Not applicable.
| ITEM 16E. | Purchases of Equity Securities by the Issuer and Affiliated Purchasers |
None.
| ITEM 16F. | Change in Registrant’s Certifying Accountant |
At the general ordinary shareholders meeting held on March 21, 2013, the Company´s shareholders approved the appointment of PricewaterhouseCoopers Ltda. as recommended by the Company’s Audit Committee, as the new independent registered public accounting firm to replace KPMG Ltda., which was appointed as described above.
During the Company’s two fiscal years ended December 31, 2012 and 2011 and subsequent interim periods through the date of its report, there were no disagreements with KPMG Ltda. on any matter of accounting principles or practices, financial statement disclosure, or auditing scope or procedure, which disagreements if not resolved to the satisfaction of KPMG Ltda. would have caused them to make reference thereto in their reports on the consolidated financial statements for such periods.
During the Company’s two most recent fiscal years ended December 31, 2012 and 2011 and the subsequent periods through the date of its report, there have been no reportable events (as defined in Item 16F(a)(1)(v)) of Form 20-F).
We have not previously consulted with PricewaterhouseCoopers Ltda. regarding either (i) the application of accounting principles to a specific completed or contemplated transaction; (ii) the type of audit opinion that might be rendered on our financial statements; or (iii) a reportable event (as provided in 16F(a)(1)(v) of Form 20-F) during the years ended December 31, 2012 and 2011, or any later interim period, including the interim period up to and including the date of its report.
We have provided KPMG Ltda. with a copy of the foregoing disclosure, and have requested that KPMG Ltda. furnish us with a letter addressed to the SEC stating whether or not KPMG Ltda. agrees with such disclosure, which we attach to this report as Exhibit 16.1 as required by Item 16F(a)(3) of Form 20-F.
At the general ordinary shareholders meeting held on March 24, 2011, the Company´s shareholders approved the appointment of KPMG Ltda., as recommended by the Company’s Audit Committee, as the new independent registered public accounting firm to replace PricewaterhouseCoopers Ltda., as previously reported in the Company’s annual report on Form 20-F for the fiscal year ended December 31, 2010 as amended.
During the Company’s two fiscal years ended December 31, 2010 and 2009 and subsequent interim periods through July 15, 2011, there were no disagreements with PricewaterhouseCoopers Ltda. on any matter of accounting principles or practices, financial statement disclosure , or auditing scope or procedure, which disagreements if not resolved to the satisfaction of PricewaterhouseCoopers Ltda., would have caused them to make reference to such disagreement in their reports on the consolidated financial statements for such periods.
During the Company’s two fiscal years ended December 31, 2010 and 2009 and the subsequent periods through July 15, 2011, there have been no reportable events (as defined in Item 16F(a)(1)(v)) of Form 20-F).
We did not previously consult with KPMG Ltda. regarding either (i) the application of accounting principles to a specific completed or contemplated transaction; (ii) the type of audit opinion that might be rendered on our financial statements; or (iii) a reportable event (as provided in Item 16F(a)(1)(v) of Form 20-F) during the years ended December 31, 2010 and 2009, or any later interim period, including the interim period up to and including the date the relationship with Pricewaterhouse Coopers Ltda.. KPMG Ltda. reviewed the foregoing disclosure required by Item 16F of Form 20-F before it was filed with the SEC and was provided an opportunity to furnish the SEC with a letter addressed to the SEC containing any new information, clarification of the expression of our views, or the respects in which it does not agree with the statements made by us in response to Item 16F of Form 20-F.
| ITEM 16G. | Corporate Governance |
Pursuant to the requirements of Section 303A.11 of the NYSE’s Listed Company Manual, the following is a summary of the significant differences between our corporate governance practices and those required for U.S. companies under the NYSE listing standards.
The following discloses the significant differences between our corporate governance practices and the NYSE standards.
| NYSE Standards | | Our Corporate Governance Practices |
| Director Independence |
| |
| The majority of the board of directors must be independent. §303A.01. “Controlled companies,” which would include Ecopetrol if we were a U.S. issuer, are exempt from this requirement. A controlled company is one in which more than 50% of the voting power is held by an individual, group or another company, rather than the public. §303A.00. | | Law No. 964/2005 establishes that (1) the board of directors of listed companies must be comprised of a minimum of five directors and a maximum of ten directors and (2) at least 25% of board members must be independent. Under our corporate governance guidelines, our board of directors must be comprised of nine directors, of which at least three must be independent. As of the date of this annual report, we have six (6) independent directors. |
| | | |
| Executive Sessions |
| |
| The non-management directors of each listed company must meet at regularly scheduled executive sessions without management. §303A.03. | | A comparable rule does not exist under Colombian law. Except for our Audit Committee, our Board of Directors does not meet without management. |
| | | |
| Nominating/Corporate Governance and Sustainability Committee |
| |
| A nominating/corporate governance and sustainability committee composed entirely of independent directors is required. The committee must have a charter specifying the purpose, duties and evaluation procedures of the committee. §303A.04. “Controlled companies” are exempt from these requirements. §303A.00. | | Colombian law does not require the establishment of a nominating and corporate governance and sustainability committee composed entirely of independent directors. Pursuant to our bylaws, both our corporate governance and sustainability committee, and our nomination and compensation committee shall be composed of at least one independent director which acts pursuant to a written charter. |
| | | |
| Compensation Committee |
| |
| A compensation committee composed entirely of independent directors is required, which must evaluate and approve executive officer compensation. The committee must have a charter specifying the purpose, duties and evaluation procedures of the committee. §303A.05. “Controlled companies” are exempt from this requirement. §303A.00. | | Colombian law does not require the establishment of a compensation committee composed entirely of independent directors. Pursuant to our bylaws, our nomination and compensation committee shall be composed of at least one independent director which acts pursuant to a written charter. |
| | | |
| Audit Committee |
| |
| An audit committee with a minimum of three independent directors satisfying the independence and other requirements of Rule 10A-3 under the Exchange Act and the more stringent requirements under the NYSE standards is required. §303A.06, §303A.07. | | According to Law No. 964/2005, Colombian companies that are authorized to issue securities by the Superintendency of Finance must have an audit committee that satisfies the requirements of Law No. 964/2005, including its minimum number of members, independence criteria and audit related duties. Our audit committee is composed of Joaquín Moreno Uribe, Amilcar Acosta Medina, Roberto Steiner Sampedro, Luis Carlos Villegas Echeverri and Jorge Pinzón Sánchez, all of whom are independent directors, and the committee meets the requirements of Law No. 964/2005 and Rule 10A 3 under the Exchange Act. |
| Equity Compensation Plans |
| |
| Equity compensation plans and all material revisions thereto require shareholder approval, subject to limited exemptions. §§303A.08 and 312.03. | | Under Colombian law, no similar right to vote on equity compensation plans and material revisions thereto is given to shareholders. We do not give our shareholders the right to vote on equity compensation plans and material revisions thereto. |
| | | |
| Corporate Governance Guidelines |
| | | |
| Listed companies must adopt and disclose corporate governance guidelines. §303A.09. | | The Superintendency of Finance does recommend the adoption of corporate governance guidelines. However, according to Superintendency of Finance Circular No. 007/2011, the adoption of corporate governance guidelines is voluntary. Listed companies must annually publish a corporate governance survey comparing their corporate governance standards with those recommended by the Superintendency of Finance. Our corporate governance guidelines (Code of Good Corporate Governance) are listed on our website at http://www.ecopetrol.com.co. |
| | | |
| Code of Ethics for Directors, Officers and Employees |
| |
| Corporate governance guidelines and a code of business conduct and ethics is required, with disclosure of any waiver for directors or executive officers. The code must contain compliance standards and procedures that will facilitate the effective operation of the code. §303A.10. | | We have adopted a code of ethics which complies with applicable U.S. and Colombian law. Our code of ethics applies to our chief executive officer, chief financial officer, principal accounting officer, persons performing similar functions and generally to all the employees, members of the board of directors, suppliers, and contractors of Ecopetrol S.A. and its corporate group. Our code of ethics is available on our website at http://www.ecopetrol.com.co. |
| ITEM 16H. | Mine Safety Disclosure |
Not applicable.
| ITEM 17. | Financial Statements |
Not applicable.
| ITEM 18. | Financial Statements |
See our audited consolidated financial statements beginning on page F-1, incorporated herein by reference.
| Exhibit No. | | Description |
| 1.1 | | Bylaws of Ecopetrol S.A., dated November 6, 2007, as recorded under Public Deed No. 5314 of November 14, 2007 (English Translation) (incorporated by reference to Exhibit 1.1 on Form 20-F filed with the U.S. Securities and Exchange Commission on September 12, 2008 (File No. 001-34175)). |
| | | |
| 1.2 | | Amended and Restated Bylaws of Ecopetrol S.A., dated March 24, 2011, as recorded under Public Deed No. 560 of May 23, 2011 (English Translation) (incorporated by reference to Exhibit 1.2 on Form 20-F filed with the U.S. Securities and Exchange Commission on July 15, 2011 (File No. 001-34175)). |
| | | |
| 4.1 | | Transportation Agreement between Ecopetrol S.A. and Oleoducto Central S.A., dated March 31, 1995 (incorporated by reference to Exhibit 4.1 on Form 20-F filed with the U.S. Securities and Exchange Commission on September 12, 2008 (File No. 001-34175)) (English Translation). |
| | | |
| 4.2 | | Supplementary Agreement to Transportation Agreement between Ecopetrol S.A. and Oleoducto Central S.A., dated January 13, 2013 (English Translation). |
| | | |
| 4.3 | | Natural Gas Transportation Agreement between Ecopetrol S.A. and Transportadora de Gas del Interior S.A. ESP, dated October 1, 2008 (English Translation). |
| | | |
| 4.4 | | Supplementary Agreement No. 1, dated December 5, 2008, to the Natural Gas Transportation Agreement between Ecopetrol S.A. and Transportadora de Gas del Interior S.A. ESP, dated October 1, 2008 (English Translation). |
| | | |
| 4.5 | | Supplementary Agreement No. 2, dated April 11, 2012, to the Natural Gas Transportation Agreement between Ecopetrol S.A. and Transportadora de Gas del Interior S.A. ESP, dated October 1, 2008 (English Translation). |
| | | |
| 4.6 | | Crude Oil Transportation Services Agreement between Ecopetrol S.A. and Cenit Transporte y Logística de Hidrocarburos S.A.S., dated April 1, 2013 (English Translation). |
| | | |
| 4.7 | | Refined Products Transportation Services Agreement between Ecopetrol S.A. and Cenit Transporte y Logística de Hidrocarburos S.A.S., dated April 1, 2013 (English Translation). |
| | | |
| 4.8 | | Indenture, dated as of July 23, 2009, between the Company and The Bank of New York Mellon, as trustee (incorporated by reference to Exhibit 4.2 to the Company’s Form F-4 filed with the U.S. Securities and Exchange Commission on July 31, 2009 (File No. 333-160965)). |
| | | |
| 8.1 | | List of subsidiaries of Ecopetrol S.A. |
| | | |
| 12.1 | | Section 302 Certification of the Chief Executive Officer. |
| | | |
| 12.2 | | Section 302 Certification of the Chief Financial Officer. |
| | | |
| 13.1 | | Section 906 Officer Certification. |
| | | |
| 16.1 | | Letter dated April 29, 2013 of KPMG Ltda. as required by Item 16F of Form 20-F. |
| | | |
| 99.1 | | Third Party Reserve Report of Ryder Scott. |
| | | |
| 99.2 | | Third Party Reserve Report of Gaffney, Cline & Associates. |
| | | |
| 99.3 | | Third Party Reserve Report of DeGolyer and MacNaughton. |
The amount of long-term debt securities of Ecopetrol authorized under any given instrument does not exceed 10% of its total assets on a consolidated basis. Ecopetrol hereby agrees to furnish to the SEC, upon its request, a copy of any instrument defining the rights of holders of its long-term debt or of its subsidiaries for which consolidated or unconsolidated financial statements are required to be filed.
ANNEX I
DESCRIPTION OF “CONVENIOS” WITH THE ANH
Convenio
Name | Type of
Agreement | Purpose | Owner | Partners | Ownership
Percentage | Partnership
Percentage | Term of
Convenio | Right of
Reversion
upon
Termination | Royalty |
| Tibú | Convenio | Exploration and Production | Ecopetrol | Ecopetrol - ANH | 100% | 0% | Field’s economic limit | Yes | 20% and variable (8% to 25%) |
| Chimichagua | Convenio | Exploration and Production | Ecopetrol | Ecopetrol - ANH | 100% | 0% | Field’s economic limit | Yes | variable (8% to 25%) |
| Río Meta | Convenio | Exploration and Production | Ecopetrol | Ecopetrol - ANH | 100% | 0% | Field’s economic limit | Yes | variable (8% to 25%) |
| Nancy Burdine Maxine | Convenio | Exploration and Production | Ecopetrol | Ecopetrol - ANH | 100% | 0% | Field’s economic limit | Yes | 20% |
| Rancho Hermoso | Convenio | Exploration and Production | Ecopetrol | Ecopetrol - ANH | 100% | 0% | Field’s economic limit | Yes | variable (8% to 25%) |
| Camoa | Convenio | Exploration and Production | Ecopetrol | Ecopetrol - ANH | 100% | 0% | Field’s economic limit | Yes | variable (8% to 25%) |
| Cicuco - Momposina | Convenio | Exploration and Production | Ecopetrol | Ecopetrol - ANH | 100% | 0% | Field’s economic limit | Yes | variable (8% to 25%) |
| Playón | Convenio | Exploration and Production | Ecopetrol | Ecopetrol - ANH | 100% | 0% | Field’s economic limit | Yes | 20% |
| Cicuco - Boquete | Convenio | Exploration and Production | Ecopetrol | Ecopetrol - ANH | 100% | 0% | Field’s economic limit | Yes | variable (8% to 25%) |
| Quebradaroja | Convenio | Exploration and Production | Ecopetrol | Ecopetrol - ANH | 100% | 0% | Field’s economic limit | Yes | variable (8% to 25%) |
| Ayombe | Convenio | Exploration and Production | Ecopetrol | Ecopetrol - ANH | 100% | 0% | Field’s economic limit | Yes | 20% |
| El Díficil | Convenio | Exploration and Production | Ecopetrol | Ecopetrol - ANH | 100% | 0% | Field’s economic limit | Yes | 20% |
| Toca | Convenio | Exploration and Production | Ecopetrol | Ecopetrol - ANH | 100% | 0% | Field’s economic limit | Yes | 20% |
| Barranca Lebrija | Convenio | Exploration and Production | Ecopetrol | Ecopetrol - ANH | 100% | 0% | Field’s economic limit | Yes | 20% |
| Pavas Cáchira | Convenio | Exploration and Production | Ecopetrol | Ecopetrol - ANH | 100% | 0% | Field’s economic limit | Yes | 20% |
| Río de Oro | Convenio | Exploration and Production | Ecopetrol | Ecopetrol - ANH | 100% | 0% | Field’s economic limit | Yes | 20% |
| Chenche | Convenio | Exploration and Production | Ecopetrol | Ecopetrol - ANH | 100% | 0% | Field’s economic limit | Yes | variable (8% to 25%) |
| Valdivia - Almagro | Convenio | Exploration and Production | Ecopetrol | Ecopetrol - ANH | 100% | 0% | Field’s economic limit | Yes | 20% |
| La Rompida | Convenio | Exploration and Production | Ecopetrol | Ecopetrol - ANH | 100% | 0% | Field’s economic limit | Yes | variable (8% to 25%) |
| La Cira Infantas | Convenio | Exploration and Production | Ecopetrol | Ecopetrol - ANH | 100% | 0% | Field’s economic limit | Yes | variable (8% to 25%) |
| Cubarral | Convenio | Exploration and Production | Ecopetrol | Ecopetrol - ANH | 100% | 0% | Field’s economic limit | Yes | variable (8% to 25%) |
| Apiay | Convenio | Exploration and Production | Ecopetrol | Ecopetrol - ANH | 100% | 0% | Field’s economic limit | Yes | variable (8% to 25%) |
| Lisama Nutria | Convenio | Exploration and Production | Ecopetrol | Ecopetrol - ANH | 100% | 0% | Field’s economic limit | Yes | variable (8% to 25%) |
| Provincia P-Norte | Convenio | Exploration and Production | Ecopetrol | Ecopetrol - ANH | 100% | 0% | Field’s economic limit | Yes | variable (8% to 25%) |
| Provincia P-Sur | Convenio | Exploration and Production | Ecopetrol | Ecopetrol - ANH | 100% | 0% | Field’s economic limit | Yes | variable (8% to 25%) |
| Sogamoso | Convenio | Exploration and Production | Ecopetrol | Ecopetrol - ANH | 100% | 0% | Field’s economic limit | Yes | variable (8% to 25%) |
| Palagua | Convenio | Exploration and Production | Ecopetrol | Ecopetrol - ANH | 100% | 0% | Field’s economic limit | Yes | 20% and variable (8% to 25%) |
| Pijao Potrerillo | Convenio | Exploration and Production | Ecopetrol | Ecopetrol - ANH | 100% | 0% | Field’s economic limit | Yes | 32% and variable (8% to 25%) |
| Caimito | Convenio | Exploration and Production | Ecopetrol | Ecopetrol - ANH | 100% | 0% | Field’s economic limit | Yes | variable (8% to 25%) |
| Ortega/Pacande | Convenio | Exploration and Production | Ecopetrol | Ecopetrol - ANH | 100% | 0% | Field’s economic limit | Yes | 20% and variable (8% to 25%) |
| Toy | Convenio | Exploration and Production | Ecopetrol | Ecopetrol - ANH | 100% | 0% | Field’s economic limit | Yes | 20% |
| Quimbaya | Convenio | Exploration and Production | Ecopetrol | Ecopetrol - ANH | 100% | 0% | Field’s economic limit | Yes | 20% |
| Toldado | Convenio | Exploration and Production | Ecopetrol | Ecopetrol - ANH | 100% | 0% | Field’s economic limit | Yes | 20% |
| Santa Clara | Convenio | Exploration and Production | Ecopetrol | Ecopetrol - ANH | 100% | 0% | Field’s economic limit | Yes | 32% and variable (8% to 25%) |
| Área Occidental | Convenio | Exploration and Production | Ecopetrol | Ecopetrol - ANH | 100% | 0% | Field’s economic limit | Yes | 20% and variable (8% to 25%) |
| Área Sur | Convenio | Exploration and Production | Ecopetrol | Ecopetrol - ANH | 100% | 0% | Field’s economic limit | Yes | 20% |
| Orito | Convenio | Exploration and Production | Ecopetrol | Ecopetrol - ANH | 100% | 0% | Field’s economic limit | Yes | 20% and variable (8% to 25%) |
| Tisquirama | Convenio | Exploration and Production | Ecopetrol | Ecopetrol - ANH | 100% | 0% | Field’s economic limit | Yes | 8% to 25% |
| Nororiente | Convenio | Exploration and Production | Ecopetrol | Ecopetrol - ANH | 100% | 0% | Field’s economic limit | Yes | 20% |
| Suroriente | Convenio | Exploration and Production | Ecopetrol | Ecopetrol - ANH | 100% | 0% | Field’s economic limit | Yes | 20% and variable (8% to 25%) |
| Río Zulia | Convenio | Exploration and Production | Ecopetrol | Ecopetrol - ANH | 100% | 0% | Field’s economic limit | Yes | 32% |
| Arauca | Convenio | Exploration and Production | Ecopetrol | Ecopetrol - ANH | 100% | 0% | Field’s economic limit | Yes | 32% |
| Entrerríos | Convenio | Exploration and Production | Ecopetrol | Ecopetrol - ANH | 100% | 0% | Field’s economic limit | Yes | variable (8% to 25%) |
| Hato Nuevo | Convenio | Exploration and Production | Ecopetrol | Ecopetrol - ANH | 100% | 0% | Field’s economic limit | Yes | 32% and variable (8% - 25%) |
| La Punta | Convenio | Exploration and Production | Ecopetrol | Ecopetrol - ANH | 100% | 0% | Field’s economic limit | Yes | variable (8% to 25%) |
| Tello La Jagua | Contrato | Exploration and Production | Ecopetrol | Ecopetrol - ANH | 50% | 50% | Field’s economic limit | Yes | 26.5% and variable (8% to 25%) |
| Huila | Convenio | Exploration and Production | Ecopetrol | Ecopetrol - ANH | 100% | 0% | Field’s economic limit | Yes | 20% |
ANNEX II
DESCRIPTION OF EXPLORATION AND PRODUCTION CONTRACTS
| Region | Contract
Name | Type of
Agreement | Purpose | Operator | Partners | Ownership
Percentage | Partnership Percentage | Term of
Contract | Expiration
Date | Right of Reversion
upon Termination | Royalty |
| Southern | Abanico | Joint Venture | E&P | Pacific Stratus Energy | Pacific Stratus Energy | 50% | Pacific Stratus Energy 50% | 28 years | October 10, 2024 | Yes | variable (5% to 25%) |
| Minor Fields | Alcaravan | Joint Venture - Sole Risk | E&P | Colombia Energy Development Co. (antes Harken) | Colombia Energy Development Co. (antes Harken) | 0% | Colombia Energy Development Co. 100% | 28 years | February 13, 2021 | Yes | variable (20% and 5% to 25%). |
| Alcaravan | Joint Venture | 50% | Colombia Energy Development Co. 50% | variable (8% to 25%) |
| Minor Fields | Arjona | Discovered Undeveloped Field | CDND/I | Vetra- Suroco Consortium | Vetra- Suroco Consortium | 40% Volumen A (Escalonada) | Consorcio Vetra - Suroco 60% Volumen A (Escalonada) | 10 years | February 14, 2021 (Amendment 3) | Yes | variable(8% to 25%) |
| Minor Fields | Ambrosía | Joint Venture | E&P | Interoil | Interoil | 30% | Interoil Colombia E&P 70% | 25 years | December 27, 2027 | Yes | variable(8% to 25%) |
| Minor Fields | Barranca Lebrija | Discovered Undeveloped Field | CDND/I | Union Temporal Mocam SAS | Union Temporal Mocam SAS (ASER INGENIERIA ING S.A., CONEQUIPOS ING LTDA. MOVE S.A. Y MONTECZ S.A.) | 19% | Unión Temporal Mocam S.A.S. 81% | 10 years | December 29, 2013 | Yes | 20% |
| Minor Fields | Bocachico | Joint Venture - Sole Risk | E&P | Colombia Energy Development Co. (antes Harken) | Colombia Energy Development Co. (antes Harken) | 0% | Colombia Energy Development Co. 100% | 28 years | March 7, 2022 | Yes | 20% |
| Minor Fields | Bolivar | Joint Venture - Sole Risk | E&P | Colombia Energy Development Co. (antes Harken) | Colombia Energy Development Co. (antes Harken) | 0% | Colombia Energy Development Co. 100% | 28 years | June 12, 2024 | Yes | 20% |
| Minor Fields | Camoa | Discovered Undeveloped Field | CDND/I | Drilling and Workover Services Ltda. | Drilling and Workover Services Ltda. | 20% | Drilling and Workover Services Ltda. 80% | 10 years | December 31, 2012 | Yes | variable (8% to 25%) |
| Minor Fields | Carbonera la Silla | Discovered Undeveloped Field | CDND/I | Mompos Oil Company Inc. | Mompos Oil Company Inc. | 6% | Mompos Oil Company Inc. 94% | 10 years | October 25, 2014 | Yes | 20% |
| Southern | Boquerón | Joint Venture | E&P | Petrobras | Petrobras/Nexen | 75% (R Factor applied ) | Petrobras Colombia Ltd. 15% Nexen Petroleum Colombia Ltd. 10 % | 28 years | September 30, 2023 | Yes | variable ( 5% to 25%) |
| Minor Fields | Cerrito | Joint Venture | E&P | Pacific Stratus Energy | Pacific Stratus Energy | 30% | Pacific Stratus Energy 70% | 27.5 years | August 17, 2029 | Yes | 20% |
| Minor Fields | Chaparral | Joint Venture | E&P | Vetra Exploración y Producción Colombia | Vetra Exploración y Producción Colombia | 50% | Vetra Exploración y Producción Colombia S.A.S. 50% | 28 years | October 4, 2015 | Yes | variable (8% to 25%) |
| Minor Fields | Chenche | Discovered Undeveloped Field | CDND/I | Vetra Exploración y Producción Colombia | Vetra Exploración y Producción Colombia | 70% | Vetra Exploración y Producción Colombia S.A.S. 30% | 10 years | December 28, 2013 | Yes | variable (8% to 25%) |
| Region | Contract
Name | Type of
Agreement | Purpose | Operator | Partners | Ownership
Percentage | Partnership Percentage | Term of
Contract | Expiration
Date | Right of Reversion
upon Termination | Royalty |
| Catatumbo-Orinoquía | Campo Rico | Joint Venture | E&P | Emerald Energy PLC Sucursal Colombia | Emerald Energy PLC Sucursal Colombia | 50% | Emerald Energy PLC Sucursal Colombia 50% | 25 years | May 24, 2027 | Yes | variable (8% to 25%) |
| Minor Fields | Chípalo | Joint Venture - Sole Risk | E&P | Pacific Stratus Energy | Pacific Stratus Energy | 0% | Pacific Stratus Energy 100% | 28 years | February 27, 2026 | Yes | variable (8% to 25%) |
| Minor Fields | Dindal | Joint Venture - Sole Risk | E&P | Pacific Stratus Energy | Pacific Stratus Energy | 0% | Pacific Stratus Energy 100% | 28 years | March 22, 2021 | Yes | 20% |
| Minor Fields | Entrerrios | Discovered Undeveloped Field | CDND/I | Union Temporal Andina | Union Temporal Andina | 61% for wells < 9,000 feet deep. 40% + %PAP for wells > 9,000 feet deep, | Unión Temporal Andina 39% for wells < 9,000 feets deep.. 60% + %PAP for wells > 9,000 feets deep | 10 years | December 29, 2013 | Yes | variable (8% to 25% |
| Orient | Caracara | Joint Venture | E&P | CEPCOLSA | CEPCOLSA | 30% | Cepcolsa 70% | 28 years | April 8, 2029 | Yes | variable (8% to 25%) |
| Mid–Magdalena Valley | Carare las Monas | Joint Venture | E&P | PetroSantander (Colombia Inc) | PetroSantander (Colombia Inc) | 30% (Pozos Payoa West-ST y Corazón 09 se encuentran en solo riesgo 100% a cargo de la Asociada) | Petrosantander (Colombia Inc). 70% | Until economic limit | Until economic limit | Yes | variable (20% and 8% to 25%) |
| Minor Fields | Guachiría | Joint Venture | E&P | Lewis Energy | Lewis Energy | 13% | Lewis Energy 87% | 28 years | September 30, 2031 | Yes | variable (8% to 25%) |
| Catatumbo-Orinoquía | Casanare | Joint Venture | E&P | Perenco | Perenco - Hocol | 64% (60% + %PAP) | Hocol 12.4% (14.4%- %PAP)Perenco 23.6% (25.6%- %PAP) | Until economic limit | Until economic limit | Yes | 20% |
| Minor Fields | La Punta | Discovered Undeveloped Field | CDND/I | Vetra Exploración y Producción Colombia | Vetra Exploración y Producción Colombia | Volume 1 - 70%Volume 2 - (escalonada) 15% | Vetra Exploración y Producción Colombia S.A.S. Volumen de Desarrollo Volume 1 - 30%Volume 2 - (Amendment 2 escalonada 85%) | 10 years (volumen 1) + 10 years (volumen 2, amendment 2) | December 28, 2013 (Amendment 2 August 3, 2020) | Yes | variable (8% to 25%) |
| Minor Fields | Las Quinchas | Joint Venture - Sole Risk | E&P | Pacific Stratus Energy | Pacific Stratus Energy | 0% | Pacific Stratus Energy 100% | 28 years | February 19, 2024 | Yes | Variable (8% to 25%) |
| Minor Fields | Lebrija | Joint Venture - Sole Risk | E&P | Petroleos del Norte S.A. | Petroleos del Norte S.A. | 0% | Petroleos del Norte S.A. 100% | 28 years | May 15 , 2014 | Yes | 20% |
| Minor Fields | Magangué | Joint Venture | E&P | Solana Petroleum Exploration (Colombia Limited) | Solana Petroleum Exploration (Colombia Limited) | 58% | Solana Petroleum Exploration (Colombia Limited) 42% | 28 years | December 31, 2017 | Yes | 20% |
| Minor Fields | Maracas | Joint Venture - Sole Risk | E&P | Texican Oil Ltd. | Texican Oil Ltd. | 0% | Texican Oil Ltd. 100% | 28 years | March 5, 2024 | Yes | 20% |
| Catatumbo-Orinoquía | Chipirón | Joint Venture | E&P | Occidental de Colombia LLC | Occidental de Colombia LLC and Occidental Andina LLC | 30% JIBA UNIFICADO : 34.14 + 0.1657 * (%PAP de ACN) | Occidental de Colombia 35%Occidental Andina 35%(- %PAP promedio) | 25 years | February 13, 2028 | Yes | variable (8% to 25%) |
| Minor Fields | Nancy-Burdine- Maxine | Discovered Undeveloped Field | CDND/I | Union Temporal II&B | Union Temporal II&B | 41% | Unión Temporal II&B 59% | 10 years | September 2, 2015 | Yes | 20% |
| Region | Contract
Name | Type of
Agreement | Purpose | Operator | Partners | Ownership
Percentage | Partnership Percentage | Term of
Contract | Expiration
Date | Right of Reversion
upon Termination | Royalty |
| Minor Fields | Opon | Joint Venture | E&P | Compañía Operadora Petrocolombia SAS-COPP S.A.S | Gas, Petróleo y derivados de Colombia S.A.S y Compañía Operadora Petrocolombia S.A.S COPP S.A.S | Producción:53% | Gas, Petróleo y derivados de Colombia S.A.S y Compañía Operadora Petrocolombia S.A.S COPP S.A.S 47% | 28 years | July 14, (Extension Amendment until 2035) | Yes | variable (20% and 8% to 25%) |
| Joint Venture - Sole Risk | 0% | 100% |
| Catatumbo-Orinoquía | Corocora | Joint Venture | E&P | Perenco | Hocol S.A - Perenco | 56% | Hocol S.A. 27.91%Perenco 16.09% | Until economic limit | Until economic limit | Yes | variable (20% and 8% to 25%) |
| Catatumbo-Orinoquía | Cosecha | Joint Venture | E&P | Occidental de Colombia LLC | Occidental de Colombia LLC | 30% | Occidental de Colombia LLC 70% | 28 years | December 30, 2030 | Yes | variable (8% to 25%) |
| Minor Fields | Pavas-Cáchira | Discovered Undeveloped Field | CDND/I | Unión Temporal Ismocol, Joshi - Parko | Unión Temporal Ismocol, Joshi - Parko | 7% | Unión Temporal I.J.P. 93% | 10 years | December 29, 2013 | Yes | 20% |
| Southern | Santana | Risk participation contract | E&P | GranTierra Energy Colombia Ltd. | GranTierra Energy Colombia Ltd. | 65% | Gran Tierra Colombia 35% | 28 years | July 27, 2015 | Yes | 20% |
| Minor Fields | Playón | Discovered Undeveloped Field | CDND/I | Serinpet | Serinpet, DYAS COLOMBIA BV | 53% | Serinpet 9.4% Dyas Colombia BV 37.6% | 10 years | July 12, 2015 | Yes | variable (8% to 25%) |
| Catatumbo-Orinoquía | Cravo Norte | Joint Venture | E&P | Occidental de Colombia LLC | Occidental de Colombia LLC and Occidental Andina LLC | 55% + % PAP (71.50%) | Occidental de Colombia 22.5% - %PAP (14.25%)Occidental Andina 22.5% - %PAP (14.25%) | Until economic limit | Until economic limit | Yes | variable (20% and 5% to 25%) |
| Minor Fields | Puerto Barco | Discovered Undeveloped Field | CDND/I | Avante Ltd. | Vetra Exploracion y Produccion Colombia - Avante Ltd. | 6% | Vetra Exploración y Producción Colombia S.A.S. 47% Avante Ltd. 47% | 10 years | December 29, 2013 | Yes | 20% |
| Minor Fields | Quebrada Roja | Discovered Undeveloped Field | CDND/I | Campos de Producción Consortium | Campos de Producción Consortium | 54% | Campos de Producción Consortium 46% | 10 years | October 15, 2016 | Yes | variable (8% to 25%) |
| Minor Fields | Río de Oro | Discovered Undeveloped Field | CDND/I | Avante Ltd. | Vetra Exploracion y Produccion Colombia - Avante Ltd. | 12% | Vetra Exploración y Producción Colombia S.A.S. 44% Avante Ltd. 44% | 10 years | December 29, 2013 | Yes | 20% |
| Southern | Espinal | Risk participation contract | E&P | Petrobras | Petrobras / Cepsa | 55% (R Factor applied) | Petrobras Colombia Ltd. 30% Cepcolsa 15% | 28 years | October 19, 2015 | Yes | 20% |
| Minor Fields | La Rompida | Discovered Undeveloped Field | CDND/I | Vetra Exploracion y Produccion Colombia | Vetra Exploración y Producción Colombia | 12% | Vetra Exploración y Producción Colombia S.A.S. 88% | 10 years (volumen 1) + 10 years (volumen 2, amendment 2) | Volume 1 - December 28, 2013Volume 2 (Extension Amendment - August 8, 2023) | Yes | variable (8% to 25%) |
| Catatumbo-Orinoquía | Estero | Joint Venture | E&P | Perenco | Perenco - Hocol | 89% | Perenco 4.02% Hocol 6.98% | Until economic limit | Until economic limit | yes | 20% |
| Minor Fields | San Luis | Joint Venture | E&P | Vetra Exploración y Producción Colombia S.A.S. | Vetra Exploración y Producción Colombia S.A.S | 50% | Vetra Exploración y Producción Colombia S.A.S. 50% | 28 years | May 8, 2014 | Yes | 20% |
| Catatumbo-Orinoquía | Garcero | Joint Venture | E&P | Perenco | Perenco - Hocol | 76% | Perenco 8.78% Hocol 15.22% | Until economic limit | Until economic limit | Yes | variable (20% and 8% to 25%) |
| Minor Fields | Tapir | Joint Venture - Sole Risk | E&P | Petrolco S.A. | Petrolco S.A. and Doreal Energy | 0% | Petrolco S.A. 88.334% and Doreal 11.666% | 28 years | February 5, 2023 | Yes | 20% |
| Northeastern | Guajira | Joint Venture | E&P | Chevron Petroleum Company | Chevron Petroleum Company | 57% | Chevron Petroleum Company 43% | Until economic limit | Until economic limit | Yes | 20% |
| Minor Fields | Toca | Discovered Undeveloped Field | CDND/I | Campos de Producción Consortium | Campos de Producción Consortium | 58% | Campos de Producción Consortium 42% | 10 years | March 22, 2016 | Yes | variable (8% to 25%) |
| Region | Contract
Name | Type of
Agreement | Purpose | Operator | Partners | Ownership
Percentage | Partnership Percentage | Term of
Contract | Expiration
Date | Right of Reversion
upon Termination | Royalty |
| Minor Fields | Tolima B | Joint Venture | E&P | Vetra Exploración y Producción Colombia S.A.S. | Vetra Exploración y Producción Colombia S.A.S. | 54% (Extension amendment) | Vetra Exploración y Producción Colombia S.A.S. 46% (Extension amendment) | 28 years + 10 years extension | June 11 (Extension Amendment until 2024) | Yes | 20% |
| Southern | Guayuyaco | Joint Venture | E&P | GranTierra Energy Colombia Ltd. | GranTierra Energy Colombia Ltd. | 30% | Gran Tierra Energy Colombia Ltd. 70% | 27.5 years | March 31, 2030 | Yes | variable (8% to 25%) |
| Minor Fields | Colorado | Services and Technical Cooperation | Production | Universidad Industrial de Santander | Universidad Industrial de Santander | 100% | Universidad Industrial de Santander 0% | 10 years | June 1, 2016 | Yes | 20% |
| Minor Fields | El Piñal | Joint Venture - Sole Risk | E&P | PetroSantander (Colombia Inc) | PetroSantander (Colombia Inc) | 0% | PetroSantander (Colombia Inc) 100% | 28 years | July 28, 2018 | Yes | 20% |
| Minor Fields | Fortuna | Joint Venture - Sole Risk | E&P | Emerald Energy PLC Sucursal Colombia | Emerald Energy PLC Sucursal Colombia | 5% | Emerald Energy PLC Sucursal Colombia 95% | 28 years | December 18, 2031 | Yes | variable (20% and 8% to 25%) |
| Mid–Magdalena Valley | La Cira | Business Cooperation | E&P | Ecopetrol S.A. | Occidental Andina LLC and Ecopetrol S.A. | 52% + %PAP (63%) | Occidental Andina LLC 48% - % PAP (37%) | Until economic limit | Until economic limit | Yes | variable (20% and 8% to 25%) |
| Minor Fields | Buganviles | Joint Venture - Sole Risk | E&P | Pacific Stratus Energy | Pacific Stratus Energy | 0% | Pacific Stratus Energy 100% | 28 years | November 17, 2028 | Yes | variable (8% to 25%) |
| Minor Fields | Maná | Joint Venture | E&P | Interoil | Interoil | 30% | Interoil Colombia E&P 70% | 25 years | November 11, 2028 (oil) | Yes | variable (8% to 25%) |
| Minor Fields | Hato Nuevo | Discovered Undeveloped Field | CDND/I | EMPESA - NTC Consortium | EMPESA -NTC Consortium | 41% | EMPESA -NTC Consortium 59% | 10 years | May 17, 2017 | Yes | variable (32% and 8% to 25%) |
| Southern | Matambo | Joint Venture | E&P | Emerald Energy PLC Sucursal Colombia | Emerald Energy PLC Sucursal Colombia | 50% | Emerald Energy PLC Sucursal Colombia 50% | 28 years | November 29, 2024 | Yes | 20% |
| Catatumbo-Orinoquía | Área Casanare (Ranchohermoso) | SPBR | SPBR | CANACOL | N/A | 100% | N/A | Until economic limit | Until economic limit | Yes | 20% |
| Catatumbo-Orinoquía | Ranchohermoso | Operation Agreement | Operation Agreement | CANACOL | CANACOL | 70%+ % PAP (75.38%) | CANACOL 30% - %PAP (24.62%) | Until economic limit | Until economic limit | Yes | variable (8% to 25%) |
| Mid–Magdalena Valley | Nare | Joint Venture | E&P | Mansarovar Energy Colombia Ltd. | Mansarovar Energy Colombia Ltd. | 50% | Mansarovar Energy Colombia 50% | 28 years | November 5, 2021 | Yes | variable (20% and 8% to 25%) |
| Joint Venture - Sole Risk | Jazmin R05 Well0% | 100% |
| Southern | Neiva | Incremental Production | E&P | Ecopetrol S.A. | Petrominerales | 100% basica y 32% Incremental (R Factor) | Petrominerales 68% (incremental only - R Factor) | 22 years | June 5, 2023 | Yes | variable (32% and 8% to 25%) |
| Southern | Orito | Incremental Production | E&P | Ecopetrol S.A. | Petrominerales | 100% basica y 21% incremental | Petrominerales 79% (incremental only) | 22 years | June 5, 2023 | Yes | variable (20% and 8% to 25%) |
| Catatumbo-Orinoquía | Orocué | Joint Venture | E&P | Perenco | Perenco and Hocol | 63% | Perenco 13.53% Hocol 23.47% | Until economic limit | Until economic limit | Yes | 20% |
| Southern | Ortega | Incremental Production | E&P | Ecopetrol S.A. | Hocol S.A. | 100% basica y 31% incremental | Hocol S.A. 69% (Incremental Production) | 22 years | February 28, 2023 | Yes | variable (20% and 8% to 25%) |
| Mid–Magdalena Valley | Palagua | Incremental Production | E&P | Union Temporal IJP | Union Temporal Ismocol, Joshi- Parko | 50% | Unión Temporal I.J.P. 50% | 22 years | July 14, 2023 | Yes | variable (20% and 8% to 25%) |
| Northeastern | Piedemonte | Joint Venture | E&P | EQUIÓN | EQUIÓN | 50% | EQUIÓN 50% | 28 years | February 29, 2020 | Yes | 20% |
| Orient | Pirirí | Joint Venture | E&P | Meta Petroleum Corp. | Meta Petroleum Corp. | 50% | Meta Petroleum Corp. 50% | 28 years | June 30, 2016 | Yes | 20% |
| Northeastern | Recetor | Joint Venture | E&P | EQUIÓN | EQUIÓN - Santiago Oil Co. | 50% | EQUIÓN 40% Santiago Oil Company 10% | 28 years | May 29, 2017 | Yes | 20% |
| Region | Contract
Name | Type of
Agreement | Purpose | Operator | Partners | Ownership
Percentage | Partnership Percentage | Term of
Contract | Expiration
Date | Right of Reversion
upon Termination | Royalty |
| Northeastern | Río Chitamena | Joint Venture | E&P | EQUIÓN | EQUIÓN. -Santiago Oil Co. - TEPMA | 50% | EQUIÓN 19% Santiago Oil Co. 12% TEPMA 19% | 28 years | January 31, 2019 | Yes | 20% |
| Minor Fields | Río Opia | Joint Venture | E&P | Interoil | Interoil | 30% | Interoil Colombia E&P 70% | 28 years | June 23, 2030 | Yes | variable (8% to 25%) |
| Catatumbo-Orinoquía | Rondón | Joint Venture | E&P | Occidental de Colombia LLC | Occidental de Colombia LLC and Occidental Andina LLC | 50% | Occidental de Colombia LLC 25% Occidental Andina 25% LLC | 28 years | January 8, 2023 | Yes | variable (8% to 25%) |
| Orient | Rubiales | Risk participation contract | E&P | Meta Petroleum Corp. | Meta Petroleum Corp. | 60% | Meta Petroleum Corp. 40% | 28 years | June 30, 2016 | Yes | 20% |
| Southern | San Jacinto | Joint Venture (La Cañada Norte) | E&P | Hocol S.A. | Hocol S.A. Petrobras Cepcolsa | 50% | Hocol S.A. 18.335% Petrobras 15% Cepcolsa 16.665% | 28 years | December 22, 2024 | Yes | variable (8% to 25%) |
| Joint Venture -Sole Risk (La Hocha) | E&P | Hocol S.A. | Hocol S.A. | 0% | Campo La Hocha 100 % Hocol S.A. | Yes | variable (5% to 25%) |
| Southern | Suroriente | Incremental Production | E&P | Vetra Exploración y Producción Colombia S.A.S. | Consorcio Colombia Energy | 48% | Consorcio Colombia Energy: 52% | 22 years | June 11, 2024 | Yes | variable (8% to 25%) |
| Northeastern | Tauramena | Joint Venture | E&P | EQUIÓN | EQUIÓN. - Santiago Oil Co. - TEPMA | 50% | Equion 19%Santiago Oil 12%TEPMA 19% | 28 years | July 3, 2016 | Yes | 20% |
| Mid–Magdalena Valley | Tisquirama | Joint Venture | E&P | Petroleos del Norte S.A. | Petroleos del Norte S.A – PetroSantander (Colombia Inc.) | Campo Los Ángeles: 68% (60% + %PAP) | Petroleos del norte 32% (40% - PAP%) | Until economic limit | Until economic limit | Yes | variable (20% and 8% to 25%) |
| Campo Santa Lucía: 70% (60% + %PAP) | PetroSantander (Colombia Inc.) 15% and Petroleos del Norte 15% (40% - PAP%) |
| Campo Querubín: 68% (60% + %PAP) | PetroSantander (Colombia Inc.) 16% and Petroleos del norte 16% (40% - PAP%) |
| Campo Serafín: 60% (60% + %PAP) | PetroSantander (Colombia Inc.) 20% and Petroleos del norte 20% (40% - PAP%) |
| Southern | Doima | Joint Venture | E&P | Hocol S.A. | Hocol S.A | 39% | Hocol S.A. 61% | 40 years | February 16, 2041 | Yes | 6.4% Gas |
| Mid–Magdalena Valley | CRC-2004-01 (Guariquies) | Risk participation contract exploration and productions (CRC) | E&P | Ecopetrol S.A. | Ramshorn | 55% | Ramshorn 45% | 25 years | May 24, 2029 | Yes | variable (8% to 25%) |
| Southern | Río Paez | Joint Venture (La Cañada Norte) | E&P | Hocol S.A. | Hocol S.A. Petrobras Cepcolsa | 50% | Hocol S.A. 18.335% Petrobras 15% Cepcolsa 16.665% | 25 years | April 26, 2026 | Yes | variable (8% to 25%) |
| Joint Venture - Sole Risk ( Campo La Hocha) | E&P | Hocol S.A. | Hocol S.A. | 0% | Campo La Hocha 100 % Hocol S.A. | variable (5% to 25%) |
| Minor Fields | Río Seco | Joint Venture - Sole Risk | E&P | Pacific Stratus Energy | Pacific Stratus Energy | 0% | Pacific Stratus Energy 100% | 28 years | August 21, 2023 | yes | 20% |
| Region | Contract
Name | Type of
Agreement | Purpose | Operator | Partners | Ownership
Percentage | Partnership Percentage | Term of
Contract | Expiration
Date | Right of Reversion
upon Termination | Royalty |
| Mid–Magdalena Valley | Alianza Tecnológica Casabe | Technological Alliance agreement | E&P | Ecopetrol S.A. | Schlumberger | 100% | Schlumberger 0% | 16 years | April 26, 2020 | yes | variable (20% and 8% to 25%) |
| Minor Fields | Río Magdalena | Joint Venture - Sole risk | E&P | GranTierra Energy Colombia Ltd. | GranTierra Energy Colombia Ltd. | 0% | Grantierra Energy Colombia 100% | 28 years | February 8, 2030 | Yes | variable (20% and 8% to 25%) |
ANNEX III
DESCRIPTION OF EXPLORATION AND PRODUCTION CONTRACTS (EXPLORATION PHASE)
Contract
Name | Type of
Agreement | Purpose | Operator | Partners | Ownership
Percentage | Term of
Contract | Expiration
Date | Ecopetrol’s Right of
Reversion
upon Termination | Royalty |
| CPE 8 | TEA | Technical Evaluation | TALISMAN | TALISMAN | ECP 50% | 3 YEARS plus extension | SEPTEMBER 22, 2014 | NO | N/A |
| CPO 11 | E&P | Exploration and Production | ECOPETROL | NONE | ECP 100% | 30 YEARS | DECEMBER 18, 2038 | NO | The applicable law is the law in force when the discovery takes place |
| LL 4 | E&P | Exploration and Production | ECOPETROL | NONE | ECP 100% | 30 YEARS plus extension | FEBRUARY 10, 2041 | NO | The applicable law is the law in force when the discovery takes place |
| LL 9 | E&P | Exploration and Production | ECOPETROL | NONE | ECP 100% | 30 YEARS plus extension | OCTOBER 6, 2039 | NO | The applicable law is the law in force when the discovery takes place |
| LL 14 | E&P | Exploration and Production | ECOPETROL | NONE | ECP 100% | 30 YEARS plus extension | OCTOBER 6, 2040 | NO | The applicable law is the law in force when the discovery takes place |
| ODISEA | E&P | Exploration and Production | ECOPETROL | NONE | ECP 100% | 30 YEARS plus extension | JANUARY 13, 2040 | NO | The applicable law is the law in force when the discovery takes place |
| CAÑO SUR | E&P | Exploration and Production | ECOPETROL | NONE | ECP 100% | 30 YEARS plus extension | DECEMBER 1, 2035 | NO | 8% to 25% |
| URIBANTE | E&P | Exploration and Production | ECOPETROL | NONE | ECP 100% | 30 YEARS | FEBRUARY 17, 2037 | NO | 8% to 25% |
| CPE 2 | TEA | Technical Evaluation | ECOPETROL | SHELL | ECP 50% | 2 YEARS plus extension | APRIL 26, 2013 | NO | N/A |
| CPE 4 | TEA | Technical Evaluation | ECOPETROL | SHELL | ECP 50% | 2 YEARS plus extension | FEBRUARY 18, 2013 | NO | N/A |
| CPO 8 | E&P | Exploration and Production | ECOPETROL | NONE | ECP 100% | 30 YEARS plus extension | MARCH 17, 2040 | NO | The applicable law is the law in force when the discovery takes place |
| CPO 9 | E&P | Exploration and Production | ECOPETROL | TALISMAN | ECP 55% | 30 YEARS plus extension | OCTOBER 7, 2039 | NO | 8% to 25% |
| CPO 10 | E&P | Exploration and Production | ECOPETROL | NONE | ECP 100% | 30 YEARS | JUNE 17, 2039 | NO | The applicable law is the law in force when the discovery takes place |
| LLA 6 | E&P | Exploration and Production | ECOPETROL | NONE | ECP 100% | 30 YEARS | FORCE MAJOR - UNDETERMINED | NO | The applicable law is the law in force when the discovery takes place |
| LLA 8 | E&P | Exploration and Production | ECOPETROL | NONE | ECP 100% | 30 YEARS | FORCE MAJOR - UNDETERMINED | NO | The applicable law is the law in force when the discovery takes place |
| LLA 37 | E&P | Exploration and Production | ECOPETROL | NONE | ECP 100% | 30 YEARS | AUGUST 31, 2041 | NO | The applicable law is the law in force when the discovery takes place |
| LLA 38 | E&P | Exploration and Production | ECOPETROL | NONE | ECP 100% | 30 YEARS | FORCE MAJOR - UNDETERMINED | NO | The applicable law is the law in force when the discovery takes place |
| LLA 39 | E&P | Exploration and Production | ECOPETROL | NONE | ECP 100% | 30 YEARS plus extension | JULY 25, 2039 | NO | The applicable law is the law in force when the discovery takes place |
| LLA 52 | E&P | Exploration and Production | ECOPETROL | NONE | ECP 100% | 30 YEARS | FORCE MAJOR - UNDETERMINED | NO | The applicable law is the law in force when the discovery takes place |
| CAT 3 | E&P | Exploration and Production | ECOPETROL | NONE | ECP 100% | 30 YEARS | UNDETERMINED - Phase 0 | NO | The applicable law is the law in force when the discovery takes place |
| AMA 4 | TEA | Technical Evaluation | ECOPETROL | HOCOL | ECP 50% | 3 YEARS | UNDETERMINED - Phase 0 | NO | N/A |
| RC 4 | E&P | Exploration and Production | EQUION | EQUION AND PETROBRAS | ECP 32% | 30 YEARS | NOVEMBER 28, 2037 | NO | The applicable law is the law in force when the discovery takes place |
| RC 5 | E&P | Exploration and Production | EQUION | EQUION AND PETROBRAS | ECP 32% | 30 YEARS | NOVEMBER 28, 2037 | NO | The applicable law is the law in force when the discovery takes place |
| SSJN 4 | E&P | Exploration and Production | ECOPETROL | NONE | ECP 100% | 30 YEARS plus extension | AUGUST 18, 2040 | NO | The applicable law is the law in force when the discovery takes place |
| FUERTE NORTE | E&P | Exploration and Production | ANADARKO | ANADARKO | ECP 50% | 30 YEARS plus extension | APRIL 15, 2041 | NO | The applicable law is the law in force when the discovery takes place |
| FUERTE SUR | E&P | Exploration and Production | ANADARKO | ANADARKO | ECP 50% | 30 YEARS plus extension | APRIL 15, 2041 | NO | The applicable law is the law in force when the discovery takes place |
| RC 6 | E&P | Exploration and Production | PETROBRAS | PETROBRAS AND HESS | ECP 30% | 30 YEARS plus extension | MARCH 14, 2038 | NO | The applicable law is the law in force when the discovery takes place |
Contract
Name | Type of
Agreement | Purpose | Operator | Partners | Ownership
Percentage | Term of
Contract | Expiration
Date | Ecopetrol’s Right of
Reversion
upon Termination | Royalty |
| RC 7 | E&P | Exploration and Production | PETROBRAS | PETROBRAS AND HESS | ECP 30% | 30 YEARS plus extension | MARCH 14, 2038 | NO | The applicable law is the law in force when the discovery takes place |
| RC 8 | E&P | Exploration and Production | ONGC VIDESH | ONGC VIDESH LIMITED AND PETROBRAS | ECP 40% | 30 YEARS | NOVEMBER 30, 2037 | NO | The applicable law is the law in force when the discovery takes place |
| RC 9 | E&P | Exploration and Production | ECOPETROL | ONGC VIDESH LIMITED | ECP 50% | 30 YEARS | NOVEMBER 30, 2037 | NO | The applicable law is the law in force when the discovery takes place |
| RC 10 | E&P | Exploration and Production | ONGC VIDESH | ONGC VIDESH LIMITED | ECP 50% | 30 YEARS | NOVEMBER 30, 2037 | NO | The applicable law is the law in force when the discovery takes place |
| RC 11 | E&P | Exploration and Production | ECOPETROL | REPSOL | ECP 50% | 30 YEARS | NOVEMBER 30, 2037 | NO | The applicable law is the law in force when the discovery takes place |
| RC 12 | E&P | Exploration and Production | ECOPETROL | REPSOL | ECP 50% | 30 YEARS | NOVEMBER 30, 2037 | NO | The applicable law is the law in force when the discovery takes place |
| TAYRONA | E&P | Exploration and Production | PETROBRAS | PETROBRAS AND REPSOL | ECP 30% | 34 YEARS plus extension | MAY 12, 2040 | NO | The applicable law is the law in force when the discovery takes place |
| TUMOFF 3 | E&P | Exploration and Production | ECOPETROL | NONE | ECP 100% | 30 YEARS | NOVEMBER 16, 2041 | NO | The applicable law is the law in force when the discovery takes place |
| SSJS 1 | E&P | Exploration and Production | ECOPETROL | SK ENERGY | ECP 70% | 30 YEARS | DECEMBER 16, 2041 | NO | The applicable law is the law in force when the discovery takes place |
| PURPLE ANGEL | E&P | Exploration and Production | ANADARKO | ANADARKO | ECP 50% | 30 YEARS | UNDETERMINED - Phase 0 | NO | The applicable law is the law in force when the discovery takes place |
| GUAOFF 1 | TEA | Technical Evaluation | REPSOL | REPSOL | ECP 50% | 3 YEARS | UNDETERMINED - Phase 0 | NO | N/A |
| COL 5 | TEA | Technical Evaluation | ANADARKO | ANADARKO | ECP 50% | 3 YEARS | UNDETERMINED - Phase 0 | NO | N/A |
| URA 4 | E&P | Exploration and Production | ANADARKO | ANADARKO | ECP 50% | 30 YEARS | UNDETERMINED - Phase 0 | NO | The applicable law is the law in force when the discovery takes place |
| SILVESTRE | E&P | Exploration and Production | ECOPETROL | NONE | ECP 100% | 29 YEARS AND 8 MONTHS | OCTOBER 12, 2042 | NO | The applicable law is the law in force when the discovery takes place |
| BOROJÓ NORTH | E&P | E&P | RELIANCE | RELIANCE INDUSTRIES LIMITED | ECP 20% | 30 YEARS | N/A | NO | 8% to 25% |
| BOROJÓ SOUTH | E&P | E&P | RELIANCE | RELIANCE INDUSTRIES LIMITED | ECP 20% | 30 YEARS | N/A | NO | 8% to 25% |
| VMM 6 | E&P | Exploration and Production | ECOPETROL | NONE | ECP 100% | 30 YEARS | APRIL 07, 2039 | NO | The applicable law is the law in force when the discovery takes place |
| VMM 32 | E&P | Exploration and Production | ECOPETROL | CEMENTACIONES PETROLERAS VENEZOLANAS (CPVEN) | ECP 51% | 30 YEARS | APRIL 17, 2041 | NO | The applicable law is the law in force when the discovery takes place |
| SAMICHAY A | E&P | Exploration and Production | ECOPETROL | NONE | ECP 100% | 30 YEARS | FORCE MAJOR - UNDETERMINED | NO | The applicable law is the law in force when the discovery takes place |
| SAMICHAY B | E&P | Exploration and Production | ECOPETROL | NONE | ECP 100% | 30 YEARS | JUNE 13/ 2041 | NO | The applicable law is the law in force when the discovery takes place |
| VMM 5 | E&P | Exploration and Production | ECOPETROL | NONE | ECP 100% | 39 YEARS | UNDETERMINED - Phase 0 | NO | The applicable law is the law in force when the discovery takes place |
| VMM 16 | E&P | Exploration and Production | ECOPETROL | NONE | ECP 100% | 39 YEARS | UNDETERMINED - Phase 0 | NO | The applicable law is the law in force when the discovery takes place |
| VMM 29 | E&P | Exploration and Production | ECOPETROL | EXXON MOBIL | ECP 50% | 39 YEARS | UNDETERMINED - Phase 0 | NO | The applicable law is the law in force when the discovery takes place |
| COR 46 | TEA | Technical Evaluation | EXXON MOBIL | EXXON MOBIL | ECP 50% | 3 YEARS | UNDETERMINED - Phase 0 | NO | N/A |
| COR 62 | E&P | Exploration and Production | ECOPETROL | EXXON MOBIL | ECP 50% | 39 YEARS | UNDETERMINED - Phase 0 | NO | The applicable law is the law in force when the discovery takes place |
| PUT 13 | E&P | Exploration and Production | ECOPETROL | NONE | ECP 100% | 30 YEARS | UNDETERMINED - Phase 0 | NO | The applicable law is the law in force when the discovery takes place |
Contract
Name | Type of
Agreement | Purpose | Operator | Partners | Ownership
Percentage | Term of
Contract | Expiration
Date | Ecopetrol’s Right of
Reversion
upon Termination | Royalty |
| PUT 17 | TEA | Technical Evaluation | ECOPETROL | NONE | ECP 100% | 3 YEARS | UNDETERMINED - Phase 0 | NO | N/A |
| CATLEYA | SHARED RISK AGREEMENT | Exploration and Production | ECOPETROL | REPSOL | ECP 34% or 44% (Clause 20) | 28 YEARS and 30 YEARS (GAS) | THE EFFECTIVE DATE HAS NOT OCCURED - UNDETERMINED | YES | The applicable law is the law in force when the discovery takes place |
| MUNDO NUEVO | JOINT VENTURE | Exploration and Production | HOCOL | HOCOL- E&P COLOMBIE AND TALISMAN | 30% | 28 YEARS and 30 YEARS (GAS) | FORCE MAJOR - UNDETERMINED | YES | The applicable law is the law in force when the discovery takes place |
| QUIFA | RISK PARTICIPATION CONTRACT | Exploration and Production | META PETROLEUM CORP | META PETROLEUM CORP | 40% + pap | 28 YEARS and 30 YEARS (GAS) | DECEMBER 22, 2031 | YES | 8% to 25% |
| CONDOR | JOINT VENTURE | Exploration and Production | LUKOIL | LUKOIL | ECP 30% | 28 YEARS and 30 YEARS (GAS) | JUNE 6, 2030 | YES | 8% to 25% |
| RIO RANCHERIA | JOINT VENTURE | Exploration and Production | DRUMMOND | DRUMMOND | ECP 30% | 36 YEARS | MAY 24, 2037 | YES | The applicable law is the law in force when the discovery takes place |
SIGNATURES
The registrant hereby certifies that it meets all of the requirements for filing on Form 20-F and that it has duly caused and authorized the undersigned to sign this annual report on its behalf.
| | Ecopetrol S.A. |
| | | |
| | By: | /s/ Adriana M. Echeverri |
| | | Name: | Adriana M. Echeverri |
| | | Title: | Chief Financial Officer |
| | | |
| | By: | /s/ Javier G. Gutíerrez |
| | | Name: | Javier G. Gutiérrez |
| Dated: April 29, 2013 | | Title: | Chief Executive Officer |
Ecopetrol S.A. and Subsidiaries
Consolidated Financial Statements
Years ended December 31, 2012, 2011 and 2010
Ecopetrol S.A. and Subsidiaries
Consolidated Financial Statements
Years ended December 31, 2012, 2011 and 2010
Contents
| Report of Independent Registered Public Accounting Firm – KPMG Ltda | | F-3 |
| | | |
| Report of Independent Registered Public Accounting Firm – PricewaterhouseCoopers Ltda | | F-4 |
| | | |
| Consolidated Balance Sheets | | F-5 |
| | | |
| Consolidated Statements of Financial, Economic, Social and Environmental Activities | | F-6 |
| | | |
| Consolidated Statements of Changes in Shareholders’ Equity | | F-7 |
| | | |
| Consolidated Statements of Cash Flows | | F-8 |
| | | |
| Notes to Consolidated Financial Statements | | F-9 |
Report of Independent Registered Public Accounting Firm
To the Board of Directors and Shareholders of
Ecopetrol S.A.:
We have audited the accompanying consolidated balance sheets of Ecopetrol S.A. and subsidiaries (the “Company”) as of December 31, 2012 and 2011, and the related consolidated statements of Financial, Economic, Social and Environmental Activities, Changes in Stockholders’ Equity, and Cash Flows for the years then ended. We also have audited the Company’s internal control over financial reporting as of December 31, 2012, based on criteria established in Internal Control – Integrated Framework issued by the Committee of Sponsoring Organizations of the Treadway Commission (COSO). The Company’s management is responsible for these consolidated financial statements, for maintaining effective internal control over financial reporting, and for its assessment of the effectiveness of internal control over financial reporting, included in ITEM 15 of the FORM 20-F for the fiscal year ended December 31, 2012. Our responsibility is to express an opinion on these consolidated financial statements and an opinion on the Company’s internal control over financial reporting based on our audits.
We conducted our audits in accordance with the standards of the Public Company Accounting Oversight Board (United States). Those standards require that we plan and perform the audits to obtain reasonable assurance about whether the financial statements are free of material misstatement and whether effective internal control over financial reporting was maintained in all material respects. Our audits of the consolidated financial statements included examining, on a test basis, evidence supporting the amounts and disclosures in the financial statements, assessing the accounting principles used and significant estimates made by management, and evaluating the overall financial statement presentation. Our audit of internal control over financial reporting included obtaining an understanding of internal control over financial reporting, assessing the risk that a material weakness exists, and testing and evaluating the design and operating effectiveness of internal control based on the assessed risk. Our audits also included performing such other procedures as we considered necessary in the circumstances. We believe that our audits provide a reasonable basis for our opinions.
A company’s internal control over financial reporting is a process designed to provide reasonable assurance regarding the reliability of financial reporting and the preparation of financial statements for external purposes in accordance with generally accepted accounting principles. A company’s internal control over financial reporting includes those policies and procedures that (1) pertain to the maintenance of records that, in reasonable detail, accurately and fairly reflect the transactions and dispositions of the assets of the company; (2) provide reasonable assurance that transactions are recorded as necessary to permit preparation of consolidated financial statements in accordance with generally accepted accounting principles, and that receipts and expenditures of the company are being made only in accordance with authorizations of management and directors of the company; and (3) provide reasonable assurance regarding prevention or timely detection of unauthorized acquisition, use, or disposition of the company’s assets that could have a material effect on the financial statements.
Because of its inherent limitations, internal control over financial reporting may not prevent or detect misstatements. Also, projections of any evaluation of effectiveness to future periods are subject to the risk that controls may become inadequate because of changes in conditions, or that the degree of compliance with the policies or procedures may deteriorate.
In our opinion, the consolidated financial statements referred to above present fairly, in all material respects, the financial position of the Company as of December 31, 2012 and 2011, and the results of its operations and its cash flows for the years then ended, in conformity with accounting principles generally accepted in Colombia, promulgated by the National Accounting Office (Contaduría General de la Nación or CGN). Also in our opinion, the Company maintained, in all material respects, effective internal control over financial reporting as of December 31, 2012, based on criteria established in COSO.
Accounting principles generally accepted for Colombian Government Entities vary in certain significant respects from accounting principles generally accepted in the United States of America. Information relating to the nature and effects of such differences is presented in Note 35 to the consolidated financial statements.
/s/ KPMG Ltda.
Bogotá, Colombia
April 29, 2013
Report of Independent Registered Public Accounting Firm
To the Board of Directors and Shareholders of Ecopetrol S. A.
In our opinion, the accompanying consolidated statements of financial, economic, social and environmental activities, of changes in shareholders’equity and of cash flows for the year ended December 31, 2010 present fairly, in all material respects, the results of operations and cash flows of Ecopetrol S.A. and its subsidiaries for the year ended December 31, 2010, in conformity with generally accepted accounting principles for Colombian Government Entities issued by theContaduría General de la Nación . These financial statements are the responsibility of the Company's management. Our responsibility is to express an opinion on these financial statements based on our audit. We conducted our audit in accordance with generally accepted auditing standards in Colombia and the standards of the Public Company Accounting Oversight Board (United States). Those standards require that we plan and perform the audit to obtain reasonable assurance about whether the financial statements are free of material misstatement. Our audit of the financial statements included examining, on a test basis, evidence supporting the amounts and disclosures in the financial statements, assessing the accounting principles used and significant estimates made by management, and evaluating the overall financial statement presentation. Our audit also included performing such other procedures as we considered necessary in the circumstances. We believe that our audit provides a reasonable basis for our opinion.
Accounting principles generally accepted for Colombian Government Entities vary in certain significant respects from accounting principles generally accepted in the United States of America. Information relating to the nature and effects of such differences is presented in Note 35 to the consolidated financial statements.
/s/ PricewaterhouseCoopers Ltda.
Bogotá, Colombia
July 15, 2011
ECOPETROL S.A. and Subsidiaries
Consolidated Balance Sheet
As at December 31, 2012 and 2011
(Expressed in millions of Colombian pesos)
| | | As at December 31 | |
| | | 2012 | | | 2011 | |
| Assets | | | | | | | | |
| | | | | | | | | |
| Current assets: | | | | | | | | |
| Cash and cash equivalents (notes 2 and 3) | | $ | 7,940,690 | | | $ | 6,779,937 | |
| Investments (notes 2 and 4) | | | 1,371,559 | | | | 1,337,602 | |
| Accounts and notes receivable, net (notes 2 and 5) | | | 5,261,501 | | | | 4,636,536 | |
| Inventories, net (note 6) | | | 2,806,282 | | | | 2,761,605 | |
| Advances and deposits (notes 2 and 7) | | | 5,378,926 | | | | 3,459,942 | |
| Deferred tax asset (note 17) | | | 14,014 | | | | 10,019 | |
| Prepaid expenses (note 8) | | | 110,655 | | | | 52,374 | |
| Total current assets | | | 22,883,627 | | | | 19,038,015 | |
| | | | | | | | | |
| Long term assets: | | | | | | | | |
| Investments (notes 2 and 4) | | | 5,812,223 | | | | 5,474,805 | |
| Accounts and notes receivable, net (notes 2 and 5) | | | 503,451 | | | | 407,227 | |
| Advances and deposits (notes 2 and 7) | | | 172,708 | | | | 144,482 | |
| Deposits held in trust (note 9) | | | 478,810 | | | | 321,361 | |
| Property, plant and equipment, net (note 10) | | | 37,134,955 | | | | 30,033,380 | |
| Natural and environmental resources, net (note 11) | | | 18,568,730 | | | | 15,440,787 | |
| Deferred charges (notes 12 and 17) | | | 3,646,421 | | | | 3,950,060 | |
| Other assets (notes 2 and 13) | | | 4,030,763 | | | | 3,891,391 | |
| Valuations (note 14) | | | 20,647,890 | | | | 13,575,878 | |
| Total assets | | $ | 113,879,578 | | | $ | 92,277,386 | |
| | | | | | | | | |
| Liabilities and Equity | | | | | | | | |
| | | | | | | | | |
| Current liabilities: | | | | | | | | |
| Financial obligations (notes 2 and 15) | | | 2,239,139 | | | | 831,594 | |
| Accounts payable and related parties (notes 2 and 16) | | | 10,905,375 | | | | 4,683,148 | |
| Taxes, contributions and duties payable (note 17) | | | 7,859,948 | | | | 8,309,180 | |
| Labor and pension obligations (note 18) | | | 256,929 | | | | 233,322 | |
| Estimated liabilities and provision (notes 2 and 19) | | | 1,872,335 | | | | 1,695,193 | |
| Total current liabilities | | $ | 23,133,726 | | | $ | 15,752,437 | |
| | | | | | | | | |
| Long term liabilities: | | | | | | | | |
| Financial obligations (notes 2 and 15) | | | 11,466,686 | | | | 7,969,978 | |
| Accounts payable and related parties (notes 2 and 16) | | | 662,472 | | | | 518,143 | |
| Labor and pension obligations (note 18) | | | 4,070,744 | | | | 3,190,229 | |
| Taxes, contributions and duties payable (note 17) | | | 555,054 | | | | 1,035,971 | |
| Estimated liabilities and provision (notes 2 and 19) | | | 4,376,004 | | | | 4,084,829 | |
| Other long-term liabilities (notes 2 and 20) | | | 2,271,844 | | | | 2,784,313 | |
| Total liabilities | | | 46,536,530 | | | | 35,335,900 | |
| | | | | | | | | |
| Non-controlling interest (note 21) | | | 2,602,167 | | | | 2,252,631 | |
| Equity: | | | | | | | | |
| (Note 22 and see attached statement) | | | 64,740,881 | | | | 54,688,855 | |
| Total liabilities and equity | | $ | 113,879,578 | | | $ | 92,277,386 | |
| | | | | | | | | |
| Memorandum accounts (note 23) : | | | | | | | | |
| Debtor | | $ | 144,971,427 | | | $ | 130,221,872 | |
| Creditor | | $ | (115,482,125 | ) | | $ | (111,784,600 | ) |
See the accompanying notes to the consolidated financial statements.
ECOPETROL S.A. and Subsidiaries
Consolidated Statement of Financial, Economic, Social and Environmental Activities
For the years ended December 31, 2012, 2011 and 2010
(Expressed in millions of Colombian pesos, except for net income per share, which are expressed in Colombian pesos)
| | | 2012 | | | 2011 | | | 2010 | |
| | | | | | | | | | |
| Revenues or Sales (note 24): | | | | | | | | | | | | |
| National sales | | $ | 24,361,913 | | | $ | 23,554,629 | | | $ | 18,205,859 | |
| Foreign sales | | | 44,490,089 | | | | 42,412,885 | | | | 23,883,886 | |
| Total Revenues or Sales | | | 68,852,002 | | | | 65,967,514 | | | | 42,089,745 | |
| | | | | | | | | | | | | |
| Cost of sales (note 25) | | | 40,535,508 | | | | 36,704,584 | | | | 25,960,456 | |
| Gross income | | | 28,316,494 | | | | 29,262,930 | | | | 16,129,289 | |
| Operating expenses (note 26): | | | | | | | | | | | | |
| Administration | | | 874,980 | | | | 1,018,917 | | | | 603,523 | |
| Marketing and projects | | | 3,235,224 | | | | 2,371,033 | | | | 2,778,318 | |
| Operating income | | | 24,206,290 | | | | 25,872,980 | | | | 12,747,448 | |
| | | | | | | | | | | | | |
| Non-operating income (expenses): | | | | | | | | | | | | |
| Financial expenses, net (note 27) | | | (167,889 | ) | | | (904,302 | ) | | | 37,789 | |
| Pension expenses (note 28) | | | (948,455 | ) | | | (706,298 | ) | | | (377,626 | ) |
| Inflation gain (note 29) | | | 97,663 | | | | 21,836 | | | | 22,030 | |
| Other expenses, net (note 30) | | | (855,908 | ) | | | (642,784 | ) | | | (937,024 | ) |
| Income before income tax and non-controlling interest | | | 22,331,701 | | | | 23,641,432 | | | | 11,492,617 | |
| | | | | | | | | | | | | |
| Income tax (note 17) | | | 7,095,874 | | | | 7,561,634 | | | | 3,201,041 | |
| Deferred tax (note 17) | | | 37,521 | | | | 394,087 | | | | 37,609 | |
| | | | | | | | | | | | | |
| Earnings before non-controlling interest | | | 15,198,306 | | | | 15,685,711 | | | | 8,253,967 | |
| | | | | | | | | | | | | |
| Non-controlling interest | | | (419,359 | ) | | | (233,377 | ) | | | (107,496 | ) |
| | | | | | | | | | | | | |
| Net income for the period | | $ | 14,778,947 | | | $ | 15,452,334 | | | $ | 8,146,471 | |
| | | | | | | | | | | | | |
| Net income per share | | $ | 359.44 | | | $ | 380.27 | | | $ | 201.28 | |
See the accompanying notes to the consolidated financial statements.
ECOPETROL S.A. and Subsidiaries
Consolidated Statement of Changes in Equity
For the years ended December 31, 2012 and 2011
(Expressed in millions of Colombian pesos except dividends per share)
| | | Subscribed
and paid
capital | | | Additional
paid-in
capital | | | Legal and
other
reserves | | | Incorporated
institutional
equity | | | Equity
method
surplus | | | Valuation
surplus | | | Public
Accounting
Regime
effect | | | Accumulated
Retained
earnings | | | Total equity | |
| | | | | | | | | | | | | | | | | | | | | | | | | | | | |
| Balance as at December 31, 2010 | | $ | 10,118,128 | | | | 4,720,508 | | | | 6,732,738 | | | | 157,352 | | | | 1,178,418 | | | | 10,977,041 | | | | (702,475 | ) | | | 8,146,471 | | | | 41,328,181 | |
| Distribution of dividends ($145 per share) | | | - | | | | - | | | | - | | | | - | | | | - | | | | - | | | | - | | | | (5,868,514 | ) | | | (5,868,514 | ) |
| Capitalization - second round share issuance and placement | | | 161,047 | | | | - | | | | - | | | | - | | | | - | | | | - | | | | - | | | | - | | | | 161,047 | |
| Subscribed capital receivable and additional paid-in capital | | | - | | | | 2,222,459 | | | | - | | | | - | | | | - | | | | - | | | | - | | | | - | | | | 2,222,459 | |
| Additional paid-in capital - called in guarantees | | | - | | | | (154,823 | ) | | | - | | | | - | | | | - | | | | - | | | | - | | | | - | | | | (154,823 | ) |
| Valuation surplus | | | - | | | | - | | | | - | | | | - | | | | - | | | | 1,694,655 | | | | - | | | | - | | | | 1,694,655 | |
| Property, plant and equipment revaluation | | | - | | | | - | | | | - | | | | - | | | | - | | | | - | | | | 6,114 | | | | - | | | | 6,114 | |
| Legal reserve appropriation | | | - | | | | - | | | | 834,610 | | | | - | | | | - | | | | - | | | | - | | | | (834,610 | ) | | | - | |
| Investment program reserve appropriation | | | - | | | | - | | | | 1,065,465 | | | | - | | | | - | | | | - | | | | - | | | | (1,065,465 | ) | | | - | |
| Regulatory Decree 2336/95 reserve appropriation | | | - | | | | - | | | | 96,695 | | | | - | | | | - | | | | - | | | | - | | | | (96,695 | ) | | | - | |
| Dividend payment (shares issued in 2011) reserve appropriation | | | - | | | | - | | | | 449,904 | | | | - | | | | - | | | | - | | | | - | | | | (449,904 | ) | | | - | |
| Use of reserves to pay dividends | | | - | | | | - | | | | - | | | | - | | | | - | | | | - | | | | - | | | | (30,909 | ) | | | (30,909 | ) |
| Addition to incorporated institutional equity | | | - | | | | - | | | | - | | | | 16,728 | | | | - | | | | - | | | | - | | | | - | | | | 16,728 | |
| Equity method capital surplus and exchange rate adjustment | | | - | | | | - | | | | - | | | | - | | | | (11,608 | ) | | | - | | | | - | | | | - | | | | (11,608 | ) |
| Unrealized earnings | | | - | | | | - | | | | - | | | | - | | | | - | | | | - | | | | - | | | | (126,809 | ) | | | (126,809 | ) |
| Net income for the year | | | - | | | | - | | | | - | | | | - | | | | - | | | | - | | | | - | | | | 15,452,334 | | | | 15,452,334 | |
| Balance as at December 31, 2011 | | | 10,279,175 | | | | 6,788,144 | | | | 9,179,412 | | | | 174,080 | | | | 1,166,810 | | | | 12,671,696 | | | | (696,361 | ) | | | 15,125,899 | | | | 54,688,855 | |
| | | | | | | | | | | | | | | | | | | | | | | | | | | | | | | | | | | | | |
| Distribution of dividends ($300 per share) | | | - | | | | - | | | | - | | | | - | | | | - | | | | - | | | | - | | | | (12,335,009 | ) | | | (12,335,009 | ) |
| Additional paid-in capital | | | - | | | | 10,390 | | | | - | | | | - | | | | - | | | | - | | | | - | | | | - | | | | 10,390 | |
| Additional paid-in capital receivable | | | - | | | | 155,713 | | | | - | | | | - | | | | - | | | | - | | | | - | | | | - | | | | 155,713 | |
| Valuation surplus | | | - | | | | - | | | | - | | | | - | | | | - | | | | 7,103,965 | | | | - | | | | - | | | | 7,103,965 | |
| Revaluation of property, plant and equipment | | | - | | | | - | | | | - | | | | - | | | | - | | | | - | | | | 680,129 | | | | - | | | | 680,129 | |
| Legal reserve appropriation | | | - | | | | - | | | | 187,958 | | | | - | | | | - | | | | - | | | | - | | | | (187,958 | ) | | | - | |
| Regulatory Decree 2336/95 reserve appropriation | | | - | | | | - | | | | 1,829,362 | | | | - | | | | - | | | | - | | | | - | | | | (1,829,362 | ) | | | - | |
| Corporate Group unrealized reserve appropriation | | | - | | | | - | | | | 2,123,538 | | | | - | | | | - | | | | - | | | | - | | | | (2,123,538 | ) | | | - | |
| Transportation infrastructure integrity strengthening | | | - | | | | - | | | | 605,135 | | | | - | | | | - | | | | - | | | | - | | | | (605,135 | ) | | | - | |
| Release of the Corporate Group's reserves for unrealized gains | | | - | | | | - | | | | (1,086,070 | ) | | | - | | | | - | | | | - | | | | - | | | | 1,086,070 | | | | - | |
| Release of the dividend payment (shares issued in 2011) reserves | | | - | | | | - | | | | (449,904 | ) | | | - | | | | - | | | | - | | | | - | | | | 449,904 | | | | - | |
| Release of the Regulatory Decree 2336/95 reserves for the previous year | | | - | | | | - | | | | (96,695 | ) | | | - | | | | - | | | | - | | | | - | | | | 96,695 | | | | - | |
| Equity method capital surplus and exchange rate adjustment | | | - | | | | - | | | | - | | | | - | | | | (342,109 | ) | | | - | | | | - | | | | - | | | | (342,109 | ) |
| Net income for the year | | | - | | | | - | | | | - | | | | - | | | | - | | | | - | | | | - | | | | 14,778,947 | | | | 14,778,947 | |
| Balance as at December 31, 2012 | | $ | 10,279,175 | | | | 6,954,247 | | | | 12,292,736 | | | | 174,080 | | | | 824,701 | | | | 19,775,661 | | | | (16,232 | ) | | | 14,456,513 | | | | 64,740,881 | |
See the accompanying notes to the consolidated financial statements
ECOPETROL S.A. and Subsidiaries
Consolidated Statement of Cash Flow
For the years ended December 31, 2012, 2011 and 2010
(Expressed in millions of Colombian pesos)
| | | 2012 | | | 2011 | | | 2010 | |
| Cash flows from operating activities: | | | | | | | | | |
| Net income for the year | | $ | 14,778,947 | | | $ | 15,452,334 | | | $ | 8,146,471 | |
| Adjustments to reconcile net income to net cash provided by operating activities: | | | | | | | | | | | | |
| Non-controlling interest | | | 419,359 | | | | 233,377 | | | | 107,495 | |
| Deferred income tax, net | | | 37,521 | | | | 394,087 | | | | 37,609 | |
| Property, plant and equipment depreciation | | | 2,027,658 | | | | 1,960,007 | | | | 1,624,009 | |
| Amortizations: | | | | | | | | | | | | |
| Natural resources | | | 2,682,955 | | | | 2,306,269 | | | | 2,003,771 | |
| Facility abandonment | | | 312,252 | | | | 285,814 | | | | 241,842 | |
| Pension liabilities for health and education | | | 869,491 | | | | 517,345 | | | | 166,211 | |
| Intangibles | | | 291,884 | | | | 295,670 | | | | 189,261 | |
| Deferred charges | | | 154,101 | | | | 111,811 | | | | 107,422 | |
| Deferred monetary correction, net | | | (97,663 | ) | | | (21,836 | ) | | | (22,030 | ) |
| Allowances: | | | | | | | | | | | | |
| Accounts receivable | | | 87,187 | | | | 32,422 | | | | 169,789 | |
| Inventory | | | 14,459 | | | | 8,505 | | | | 9,743 | |
| Property, plant and equipment | | | 315,627 | | | | 41,948 | | | | 227,266 | |
| Legal disputes and proceedings | | | 593,028 | | | | 360,351 | | | | 125,888 | |
| Pension transfer | | | - | | | | 241,624 | | | | - | |
| Other | | | 23,087 | | | | 122,395 | | | | 19,834 | |
| Recovery of allowances | | | | | | | | | | | | |
| Accounts receivable | | | (225 | ) | | | (365 | ) | | | (68,772 | ) |
| Inventories | | | (11,966 | ) | | | (3,263 | ) | | | (29,481 | ) |
| Property, plant and equipment | | | (159,833 | ) | | | (46,019 | ) | | | (55,717 | ) |
| Legal disputes and proceedings | | | (258,784 | ) | | | (229,345 | ) | | | (80,237 | ) |
| Other | | | (283,283 | ) | | | (387,117 | ) | | | (138,397 | ) |
| Property, plant and equipment write-off | | | - | | | | 418 | | | | 3,395 | |
| Property, plant and equipment retirement loss | | | 127 | | | | - | | | | 38,945 | |
| Natural and environmental resource write-off loss | | | 34,191 | | | | - | | | | 39,668 | |
| Other asset write-off loss | | | - | | | | 300 | | | | 287,918 | |
| Equity method | | | (125,277 | ) | | | (141,275 | ) | | | (82,772 | ) |
| Net changes in asset and liabilities: | | | | | | | | | | | | |
| Accounts and notes receivables | | | (2,517,198 | ) | | | (1,324,033 | ) | | | 794,512 | |
| Inventories | | | (390,847 | ) | | | (561,846 | ) | | | (129,823 | ) |
| Deferred and other assets | | | 856,001 | | | | (2,165,464 | ) | | | 698,423 | |
| Accounts payable | | | 2,318,922 | | | | (121,422 | ) | | | 1,248,736 | |
| Tax payable | | | (730,923 | ) | | | 5,073,370 | | | | (618,440 | ) |
| Labor and pension obligations | | | 34,632 | | | | (85,757 | ) | | | (26,737 | ) |
| Estimated liabilities and provision | | | 253,832 | | | | 86,805 | | | | (64,028 | ) |
| Other long-term liabilities | | | (998,029 | ) | | | 559,203 | | | | (507,467 | ) |
| Net cash provided by operating activities | | $ | 20,531,233 | | | $ | 22,996,312 | | | $ | 14,464,307 | |
| Cash flows from investing activities: | | | | | | | | | | | | |
| Payment and advances for the acquisition of companies, | | | | | | | | | | | | |
| net of acquired cash | | | - | | | | (868,954 | ) | | | (1,163,131 | ) |
| Increase in investments | | | (15,281,566 | ) | | | (11,685,030 | ) | | | (11,808,784 | ) |
| Redemption and sale of investments | | | 14,725,312 | | | | 9,861,330 | | | | 10,578,200 | |
| Investment in natural and environmental resources | | | (5,615,306 | ) | | | (4,311,149 | ) | | | (3,874,824 | ) |
| Additions to property, plant and equipment | | | (9,852,556 | ) | | | (10,189,522 | ) | | | (6,445,151 | ) |
| Proceeds from sales of property and equipment | | | - | | | | - | | | | 4,751 | |
| Net cash used in investing activities | | $ | (16,024,116 | ) | | $ | (17,193,325 | ) | | $ | (12,708,939 | ) |
| | | | | | | | | | | | | |
| Cash flows financing activities: | | | | | | | | | | | | |
| Non-controlling interest | | | (69,823 | ) | | | 1,027,567 | | | | (562,855 | ) |
| Financial obligations | | | 5,110,249 | | | | (109,191 | ) | | | 2,761,449 | |
| Capitalizations | | | - | | | | 2,228,683 | | | | 525 | |
| Dividends | | | (8,386,790 | ) | | | (5,896,886 | ) | | | (3,789,828 | ) |
| Net cash used in financing activities | | $ | (3,346,364 | ) | | $ | (2,749,827 | ) | | $ | (1,590,709 | ) |
| Net increase in cash and cash equivalents | | | 1,160,753 | | | | 3,053,159 | | | | 164,659 | |
| Cash and cash equivalents at the beginning of the year | | | 6,779,937 | | | | 3,726,778 | | | | 3,562,119 | |
| Cash and cash equivalents at the end of the year | | $ | 7,940,690 | | | $ | 6,779,937 | | | $ | 3,726,778 | |
See the accompanying notes to the consolidated financial statements
Ecopetrol S.A. and Subsidiaries
For the years ended December 31, 2012, 2011 and 2010
(Amounts are expressed in millions of Colombian pesos, except amounts stated in other currencies; exchange rates and income per share, which are expressed in Colombian pesos – throughout these financial statements pesos or $ refer to Colombian pesos and U.S. dollar refers to United States dollars)
| (1) | Economic entity and principal accounting policies and practices |
Reporting entity
ECOPETROL S.A. (hereinafter Ecopetrol or the Company) was constituted by Law 165 of 1948 and transformed through Extraordinary Decree 1760 of 2003 (as well as Decree 409 of 2006) and Law 1118 of 2006 into a state-owned stock company and then into a mixed economy Company of a commercial nature, at the national level, linked to the Ministry of Mines and Energy, for an indefinite period. Ecopetrol’s corporate purpose is the development, in Colombia or abroad, of commercial or industrial activities arising from or related to the exploration, production, refining, transportation, storage, distribution, and selling of hydrocarbons, their by-products and associated products, as well as subsidiary operations, connected or complementary to these activities, in accordance with applicable regulations. Ecopetrol’s principal domicile is Bogota and it may establish subsidiaries, branches and agencies in Colombia or abroad.
Pursuant to Transformation Decree 1760 of 2003, all administration of the Colombian nation’s hydrocarbon reserves, as well as the administration of non-strategic assets represented by stocks and shares in companies, were split from Ecopetrol. Furthermore, Ecopetrol’s basic structure was changed and two entities were created: a) theAgencia Nacional de Hidrocarburos (ANH) was created to issue and develop Colombian oil policy from that point forward (formerly the responsibility of Ecopetrol), and b)Sociedad Promotora de Energía de Colombia S.A., which received the non-strategic assets owned by Ecopetrol.
Law 1118 of December 27, 2006 changed the legal nature of Ecopetrol and authorized the Company to issue shares to be placed on the market and acquired by Colombian individuals or legal entities. Once the shares corresponding to 10.1% of the authorized capital were issued and placed, at the end of 2007, the Company became a public-private entity of a commercial nature, at the national level, linked to the Ministry of Mines and Energy.
Ecopetrol entered into a deposit agreement with JP Morgan Chase Bank, N.A., as depositary, for the issuance of ADSs evidenced by ADRs. Each of the ADSs represents 20 of Ecopetrol’s common shares or the right to receive 20 common shares of Ecopetrol.
On September 12, 2008, Ecopetrol submitted an application to the U.S. Securities and Exchange Commission (SEC) to register and list the Company’s ADSs evidenced by ADRs on the New York Stock Exchange (NYSE). The Company’s ADSs began trading on the NYSE under the symbol “EC” on September 18, 2008.
On December 3, 2009, theComisión Nacional Supervisora de Empresas y Valores del Perú (CONASEV) (Peruvian National Commission of Companies and Securities) approved the listing of Ecopetrol’s ADRs on the Lima Stock Exchange and the registration of such securities with the Public Registry of the Securities Market. The ADRs began trading on the Lima Stock Exchange on December 4, 2009 in the Peruvian market under the symbol “EC”.
On August 13, 2010, Ecopetrol began trading its ADRs on the Toronto Stock Exchange – Canada, one of the biggest in the world in the energy sector. Thus, Ecopetrol became the first Colombian company to be listed on the Toronto Stock Exchange.
Between July 27 and August 17, 2011, Ecopetrol carried out the second placement of its public share offering, authorized by Law 1118 of 2006. As a result of this process, 644,185,868 shares were placed at a nominal price of $3,700 per share, for a total amount of $2,383,488. The common shares were registered with the National Registry of Securities and Issuers in accordance with Decree 2555 of 2010. After this, the Colombian National Government’s equity participation in Ecopetrol was 88.49%.
On February 13, 2008, Ecopetrol S.A. announced that it had become the parent company in the Group (the « Group »), with the following subsidiaries: Black Gold Re Limited, Ecopetrol Oleo é Gas do Brasil Ltda., Ecopetrol del Perú S.A., and Ecopetrol America Inc. Subsequently, Andean Chemicals Ltd., parent company of Bioenergy and an investor in Propilco S.A., which in turn is the parent company of Compounding and Masterbatching Industry Ltd. (Comai Ltd.), joined the Group.
Similarly, in 2009, the Group was joined by: ODL Finance, which is in turn the parent company of Oleoducto de los Llanos; Hocol Petroleum Limited, parent company of Homcol Cayman Inc and Hocol Limited, the Colombian branch of which is Hocol S.A.; Ecopetrol Transportation Company, the parent company of Ecopetrol Pipelines International Ltd., Oleoducto Central S.A., Oleoducto de Colombia S.A., and finally, Ecopetrol Global Energy and Refinería de Cartagena S.A.
On September 20, 2010, Ecopetrol S.A. announced the setting up of a Group with Oleoducto Bicentenario de Colombia S.A.S. as a subsidiary.
On January 17, 2011, Ecopetrol S.A. set up a Group with Ecopetrol Capital S.L.U., Ecopetrol Capital AG and Ecopetrol Transportation Investments Ltd., domiciled outside of Colombia.
On February 23, 2011, Ecopetrol S.A. set up control over the following subsidiaries: Colombia Pipelines Limited, Equión Energía Limited, Santiago Oil Co, Santiago Oil Company and Santiago Pipelines Co.
In December 2011, the Board of Directors of Andean Chemicals Ltd, approved the capitalization of a liability (capital plus interest) with Ecopetrol S.A. Andean placed 615,677,799 ordinary shares at a nominal value of US$1 per share for this process. The liability was originated by a loan contract between Andean and Ecopetrol in May 2009, to acquire the Refinería de Cartagena through Andean Ltd as an investment vehicle.
At its meeting on August 13, 2012, the Board of Directors of Cenit Transporte y Logística de Hidrocarburos S.A.S. drafted and approved the Issuance and Placement of Shares Regulation, through which it offered to Ecopetrol S.A. the subscription of 45,582,982 common shares in the Company’s capital, for a total value of $2,279,149, of which $455,830 corresponds to nominal value, and a total of $1,823,319 corresponds to paid-in capital. The above share subscription offer was accepted by Ecopetrol S.A. on August 22, 2012.
The companies consolidated by Ecopetrol S.A. are:
| Subsidiary | | Ecopetrol participation
percentages | | Activity | | Subsidiaries | | Date of
incorporation | | Country/
domicile | | Geographic
area of
operations |
| | | 2012 | | 2011 | | 2010 | | | | | | | | | | |
| Ecopetrol Oleo é Gas do Brasil Ltda. | | 100 | | 100 | | 100 | | Hydrocarbon exploration and exploitation | | - | | 14-dec-06 | | Brazil | | Brazil |
| Ecopetrol del Perú S.A. | | 100 | | 100 | | 100 | | Hydrocarbon exploration and exploitation | | - | | 27-aug-07 | | Peru | | Peru |
| Ecopetrol America Inc. | | 100 | | 100 | | 100 | | Hydrocarbon exploration and exploitation | | - | | 09-oct-07 | | United States | | United States |
| Black Gold Re Ltd. | | 100 | | 100 | | 100 | | Reinsurer of Ecopetrol and its subsidiaries | | - | | 24-aug-06 | | Bermuda | | Bermuda |
| Andean Chemicals Ltd. | | 100 | | 100 | | 100 | | Investment vehicle | | Bioenergy S.A., Refinería de Cartagena, Propileno del Caribe y Comai | | 30-jan-97 | | Bermuda | | Bermuda |
| ODL Finance S.A. | | 65 | | 65 | | 65 | | Pipeline transportation of crude oil | | ODL S.A. | | 15-jul-08 | | Panama | | Panama |
| Propileno del Caribe. Propilco S.A. | | 100 | | 100 | | 100 | | Production and marketing of polypropylene resin | | Comai Ltd, Refineria de Cartagena. | | 16-mar-89 | | Colombia | | Colombia |
| Bioenergy S.A. | | 91.43 | | 88.6 | | 88.6 | | Biofuel production | | Bioenergy Zona Franca S.A. | | 13-dec-05 | | Colombia | | Colombia |
| Ecopetrol Global Energy | | 100 | | 100 | | 100 | | Investment vehicle | | Ecopetrol America Inc., Ecopetrol Oleo & Gas do Brasil Ltda, Ecopetrol del Perú S.A.,Refinería de Cartagena | | 26-mar-09 | | Spain | | Spain |
| Ecopetrol Pipelines International Limited | | 100 | | - | | - | | Investment vehicle | | OBC y Ocensa | | 05-dec-94 | | Bermuda | | Bermuda |
| Oleoducto Central S.A. – Ocensa | | 72.65 | | 72.6 | | 60 | | Pipeline transportation of crude oil | | - | | 14-dec-94 | | Colombia | | Colombia |
| COMAI – Compounding and Masterbatching Industry | | 100 | | 100 | | 100 | | Manufacturing of polypropylene compounds and masterbatches for a wide range of uses | | Refinería de Cartagena. | | 21-may-91 | | Colombia | | Colombia |
| Refinería de Cartagena S.A. | | 100 | | 100 | | 100 | | Hydrocarbon refining, marketing and distribution. | | - | | 11-oct-06 | | Colombia | | Colombia |
| Hocol Petroleum Limited | | 100 | | 100 | | 100 | | Investment vehicle | | Hocol S.A. | | 29-sep-95 | | Bermuda | | Bermuda |
| Oleoducto de Colombia S.A. – ODC | | 73 | | 73 | | 66 | | Pipeline transportation of crude oil | | - | | 10-jul-89 | | Colombia | | Colombia |
| Oleoducto Bicentenario de Colombia SAS | | 55.97 | | 55.97 | | 55.97 | | Pipeline transportation of crude oil | | - | | 18-aug-10 | | Colombia | | Colombia |
| Ecopetrol Capital AG | | 100 | | 100 | | 100 | | Financing, liquidation of funding for companies, groups or any business or related activity | | - | | 07-dec-10 | | Switzerland | | Switzerland |
| Equión Energía Limited | | 51 | | 51 | | - | | Hydrocarbon exploration, exploitation and production | | Santiago Oil Company, ODC | | 05-jun-59 | | United Kingdom | | Colombia |
| Ecopetrol Global Capital SL | | 100 | | 100 | | - | | Investment vehicle | | - | | 10-jan-11 | | Spain | | Spain |
| Cenit S.A.S. | | 100 | | - | | - | | Storage and pipeline transportation of hydrocarbons | | OBC, Ocensa, ODC, ODL | | 15-jun-12 | | Colombia | | Colombia |
The Company and some of its subsidiaries carry out exploration and production operations through Exploration and Production (E&P) Contracts, Technical Evaluation Contracts and Agreements (TEA) signed with theAgencia Nacional de Hidrocarburos (National Hydrocarbons Agency, hereinafter ANH), as well as through Association Contracts and other types of contracts in various forms. The following is the situation at the close of December 2012:
| | | No. of contracts | |
| Type of contract | | Ecopetrol
S.A. | | | Hocol
Petroleum
Ltd. | | | Ecopetrol
Oleo é Gas do
Brasil Ltda. | | | Ecopetrol
America
Inc. | | | Ecopetrol
del Perú
S.A. | | | Equión
Energía
Limited | |
| Exploration | | | | | | | | | | | | | | | | | | | | | | | | |
| E&P – ANH Contracts | | | 47 | | | | 19 | | | | - | | | | - | | | | - | | | | 2 | |
| E&P – ANH Agreements | | | 6 | | | | - | | | | - | | | | - | | | | - | | | | - | |
| TEAs – ANH | | | 5 | | | | 1 | | | | - | | | | - | | | | - | | | | - | |
| Association contracts | | | 3 | | | | 1 | | | | 13 | | | | 7 | | | | 6 | | | | - | |
| Production | | | | | | | | | | | | | | | | | | | | | | | | |
| Partnership | | | 51 | | | | 8 | | | | - | | | | 1 | | | | - | | | | 4 | |
| E&P – ANH Contracts | | | - | | | | 1 | | | | - | | | | - | | | | - | | | | - | |
| Undeveloped and Inactive Discovered Fields (CDNDI) | | | 16 | | | | - | | | | - | | | | - | | | | - | | | | - | |
| Sole risk | | | - | | | | - | | | | - | | | | - | | | | - | | | | 1 | |
| Incremental production | | | 5 | | | | 1 | | | | - | | | | - | | | | - | | | | - | |
| Risk participation | | | 3 | | | | - | | | | - | | | | - | | | | - | | | | - | |
| Technological partnership | | | 1 | | | | - | | | | - | | | | - | | | | - | | | | - | |
| Business collaboration | | | 1 | | | | - | | | | - | | | | - | | | | - | | | | 1 | |
| Services and technical cooperation | | | 1 | | | | - | | | | - | | | | - | | | | - | | | | - | |
| Shared risk participation | | | 1 | | | | - | | | | - | | | | - | | | | - | | | | - | |
| Operation | | | 1 | | | | - | | | | - | | | | - | | | | - | | | | - | |
| Production services with risk | | | 1 | | | | - | | | | - | | | | - | | | | - | | | | - | |
| | | | 142 | | | | 31 | | | | 13 | | | | 8 | | | | 6 | | | | 8 | |
The following is a breakdown of production and exploration operations for 2011:
| | | No. of contracts | |
| Type of contract | | Ecopetrol
S.A. | | | Hocol
Petroleum
Ltd. | | | Ecopetrol
Oleo é Gas
do Brasil
Ltda. | | | Ecopetrol
America Inc. | | | Ecopetrol
del Perú
S.A. | | | Equión
Energía
Limited | |
| Exploration | | | | | | | | | | | | | | | | | | | | | | | | |
| E&P – ANH Contracts | | | 37 | | | | 15 | | | | - | | | | - | | | | 6 | | | | 2 | |
| E&P – ANH Agreements | | | 5 | | | | - | | | | - | | | | - | | | | - | | | | - | |
| TEAs – ANH | | | 3 | | | | - | | | | - | | | | - | | | | - | | | | - | |
| Association contracts | | | 4 | | | | 1 | | | | 10 | | | | 5 | | | | 5 | | | | - | |
| Production | | | | | | | | | | | | | | | | | | | | | | | | |
| Partnership | | | 56 | | | | 9 | | | | - | | | | 1 | | | | - | | | | 4 | |
| E&P – ANH Contracts | | | - | | | | 1 | | | | - | | | | - | | | | - | | | | - | |
| Undeveloped and Inactive Discovered Fields (CDNDI) | | | 16 | | | | - | | | | - | | | | - | | | | - | | | | - | |
| Sole risk | | | - | | | | - | | | | - | | | | - | | | | - | | | | 1 | |
| Incremental production | | | 5 | | | | 1 | | | | - | | | | - | | | | - | | | | - | |
| Risk participation | | | 3 | | | | - | | | | - | | | | - | | | | - | | | | - | |
| Technological partnership | | | 1 | | | | - | | | | - | | | | - | | | | - | | | | - | |
| Business collaboration | | | 1 | | | | - | | | | - | | | | - | | | | - | | | | 1 | |
| Services and technical cooperation | | | 1 | | | | - | | | | | | | | - | | | | - | | | | - | |
| Shared risk participation | | | 1 | | | | - | | | | - | | | | - | | | | - | | | | - | |
| Operation | | | 1 | | | | - | | | | - | | | | - | | | | - | | | | - | |
| Production services with risk | | | 2 | | | | - | | | | - | | | | - | | | | - | | | | - | |
| | | | 136 | | | | 27 | | | | 10 | | | | 6 | | | | 11 | | | | 8 | |
Principal accounting policies and practices
TheContaduría General de la Nación (CGN – National Accounts Office) adopted the Public Accounting Regime (RCP) in September 2007, defining its configuration, scope and application. Pursuant to CGN Communication No. 20079-101345 of September 28, 2007, the Colombian Government Entity Generally Accepted Accounting Principles (GAAP) went into effect for Ecopetrol on January 1, 2008.
Consolidation process
The consolidated financial statements have been prepared in accordance with Articles 23 and 122 of Decree 2649 of 1993. The latter article stipulates that an economic entity that owns more than 50% of the other economic entities must present, along with its basic financial statements, the consolidated financial statements with their respective notes. The consolidation method used is the full consolidation method set out in External Circular Letter No. 005 of April 6, 2000, issued by the Superintendence of Corporations, which stipulates that consolidated financial statements must be aggregated based on the individual financial statements of the parent company and of each of its subsidiaries, identifying the effect of all of the operations among the companies in the group on assets, liabilities, equity and results.
The group consolidation was carried out using the financial statements of the parent company and its subsidiaries, at the same cut-off point of December 31, 2012, 2011 and 2010, after they were standardized according to the Public Accounting Regime issued by theContaduria General de la Nación (CGN) (National Accounting Office).
The consolidated financial statements were prepared in conformity with Colombian Government Entity GAAP standards and principles issued by the CGN, and other legal provisions. These principles may differ in certain respects from those established by other standards and other control authorities and CGN opinions on specific matters prevail over other regulations.
The accrual method was applied for the accounting recognition of the consolidated statement of financial, economic, social and environmental activity.
A structure was established in accordance with the rules for the inspection, supervision, and/or control of Ecopetrol and the companies that apply the Regime of Public Accounting (RCP) to record operations at the level of source documents, or for standardization purposes, to define the accounting treatment of operations not covered by the CGN. The structure involves: i) principal and permanent inspection, supervision, and control: Superintendence of Domiciliary Public Services; ii) residual control: Superintendence of Corporations; and iii) concurrent control: Superintendence of Finance, of the activities of the Company in its capacity as issuer in the stock market. International Financial Reporting Standards (IFRS) are applied when accounting guidance under Colombian Government Entity GAAP does not address specific accounting issues applicable to the Company, while accounting standards under generally accepted accounting principles in the United States (U.S. GAAP) are applied for accounting issues related to crude oil and natural gas activities.
The basic consolidated financial statements defined by the CGN are: the Balance Sheet, the Financial, Economic, Social and Environmental Activities Statement, the Statement of Changes in Shareholders’ Equity and the Statement of Cash Flows. The notes to the basic consolidated financial statements are an integral part of them.
The consolidated financial statements include the accounts of the businesses in which the Company holds a direct or indirect share of over 50% of capital, or over which it has significant influence without being a majority shareholder. All inter-company transactions among consolidated companies have been eliminated. The attached consolidated financial statements consolidate the assets, liabilities, equity and results of the subsidiaries.
An economic fact is material when, due to its nature, amount and surrounding circumstances, knowledge or ignorance of it can significantly alter the economic decisions of users of financial information.
As set forth by the RCP, the informationdisclosed in the consolidated financial statements and financial accounting reports must cover the main aspects of the public accounting entity in a way that must be significantly close to the truth, so that it is relevant and reliable for decision-making purposes or the evaluations required to meet accounting information objectives. Materiality depends on the nature of the facts or the magnitude of the amounts revealed or not revealed.
The consolidated financial statements include specific headings in accordance with legal requirements or for elements representing 5% or more of total assets, current assets, total liabilities, current liabilities, working capital, equity and income, as appropriate. In addition, lower amounts are shown when they are deemed to contribute to a better interpretation of financial information.
The preparation of consolidated financial statements requires that the management of the companies in the Group make estimates and assumptions that could affect the recorded amounts of assets, liabilities, results of activities and the attached notes. These estimates are carried out based on technical criteria, judgment and tenets pursuant to the regulations and legal provisions in effect. Actual results may differ from such estimates.
| (d) | Foreign currency transactions |
Foreign currency transactions are recognized in accordance with applicable regulations and recorded at the appropriate exchange rates on the transaction date. Balances denominated in foreign currency are reflected in Colombian pesos at the official exchange rates at the end of each year.
The exchange difference resulting from asset adjustment is recorded in results, and the difference resulting from liabilities is recorded against the related asset until it is ready for use or sale, at which time the adjustment is recorded in the results.
In accordance with Decree 4318 of December 26, 2007 issued by theMinisterio de Comercio, Industria y Turismo (Ministry of Trade, Industry and Tourism), the exchange difference generated by equity investments in foreign subsidiaries is recorded as an increase or decrease in equity value, and when the investment is actually made this value affects the results for the year.
While performing their oil industry activities, the Company and its subsidiaries can freely deal in foreign currencies, provided that they comply with the provisions of Colombia’s exchange rate regime.
The conversion of financial statements of subsidiaries that use currencies other than the Colombian peso involved changing the currency first to U.S. dollars and then to Colombian pesos. The official exchange rate (ER) for the end of the period was used to convert asset and liability balances, monthly average ERs were used to convert result figures, and historical rates were used to convert capital figures.
| (e) | Joint venture contracts |
Joint venture contracts are entered into between Ecopetrol or the companies in the Group and third parties in order to share the risk, secure capital, maximize operating efficiency and optimize the recovery of reserves. In these joint ventures, one party is designated as the operator and each party takes its share of the hydrocarbons (crude oil or gas) produced according to its agreed participation. When Ecopetrol or one of the companies in the Group participates as a non-operator partner, it records the assets, liabilities, revenues, costs and expenses based on information reported by the operators. When Ecopetrol or one of the companies in the Group is the direct operator of the joint venture contract, it records 100% of the assets, liabilities, revenues, costs and expenses, recognizing, on a monthly basis, the distribution according to the participation interests of each partner in the line items corresponding to: assets, liabilities, expenses, costs and revenues for the associate.
Cash equivalents are represented by negotiable investments with maturity dates that fall within ninety (90) days of their acquisition, and are recorded as cash management investments.
Cash from joint operations in which the Company is the operating partner corresponds to advances from partners (including the companies in the Group) according to their contractually agreed participation percentages, and funds are managed in a joint operation exclusive-use bank account.
| (g) | Derivative financial instruments |
The Company enters into hedging agreements to hedge against fluctuations in crude-oil prices, product prices and exchange rates. The difference between traded value and market value, generated by hedging operations, is recognized as financial income or expense in the statement of financial, economic, social and environmental activities. The Group does not use derivative financial instruments for speculative purposes.
The investments are classified as: i) liquidity management investments; ii) investments for policy purposes; and iii) equity investments.
| i. | Liquidity management investments correspond to resources invested in debt and participative securities with the objective of obtaining profits through short-term price fluctuations. Their initial recording corresponds to their historical cost and they are updated based on valuation methods issued by the Superintendence of Finance of Colombia. |
| ii. | Investments for policy purposes are made up of national or foreign debt securities acquired in compliance with the macroeconomic or internal policies of the Group, which include investments held through their maturity date and those available for sale, which are kept for at least one (1) year, as of the first day on which they were classified for the first time, or when they were reclassified. |
Investments held to maturity are updated based on the internal rate of return (IRR) as set out in the methodology adopted by the Superintendence of Finance; the investments for the purpose of macroeconomic policy and those available for sale must be updated based on the methodology adopted by the Superintendence of Finance for tradable investments.
| iii. | Equity investments are classified as being in controlled and uncontrolled entities. Equity investments in controlled entities are recognized at their acquisition cost whenever it is lower than the intrinsic value; otherwise, they are recognized at the intrinsic value, and the difference between the purchase price and the intrinsic value corresponds to goodwill. Their values are updated using the equity method, as established in CGN Resolution 145 of 2008. |
Investments in associates in which the Company exerts significant influence are recorded using the equity method.
Significant influence is defined as the power the entity has, whether or not the percentage of ownership is 50% or lower, to participate in setting and directing the financial and operational policies of another entity for the purpose of obtaining profits from that entity.
Significant influence may be present in one or more of the following ways:
| • | Representation on the Board of Directors or equivalent governing body of the associate; |
| • | Participation in policy-making; |
| • | Significant transactions between the investor and the associate; |
| • | Secondment of officers; or |
| • | Supplying essential technical information. |
For subsidiaries abroad, the equity method must apply in Colombian legal currency after the conversion of financial statements in foreign currency.
Equity investments in uncontrolled entities include shares with a low or minimum market, or shares not listed on an exchange. They do not enable any type of control or significant influence and are recognized at historical cost. Their change in value arises from periodically comparing the cost of the investment to its intrinsic value or its value on the stock market.
Investments made in foreign currency are recognized by applying the ER on the date of the transaction. The value must be re-expressed periodically based on the ER, whenever the adjustment method does not take it into account.
| (i) | Accounts and notes receivable and allowance for doubtful accounts |
Accounts and notes receivable are stated at their original amount or at the value accepted by the debtor, subject to periodic updating according to legal provisions in effect, or according to agreed upon contract terms.
The allowance for doubtful accounts is reviewed and updated periodically based on the age of the balances and the recovery analysis of individual accounts. The Group carries out the necessary administrative and legal steps to recover overdue accounts receivable and to collect interest from clients who do not comply with payment policies.
Accounts and notes receivable are only written off against the allowances when there is reasonable legal or material certainty of the total or partial loss of the incorporated or represented right.
The inventories include assets extracted, in production process, transformed and acquired for any reason, to be sold, intended for transformation and consumed in the production process, or as part of services delivered. The perpetual inventory system is used.
Inventories are stated at historical cost or at purchase cost, including direct and indirect charges incurred to prepare the inventory for sale or production.
The value of inventories is measured using the weighted average method, taking into account the following parameters:
| • | Inventories of crude oil and own production, taking into account production cost; |
| • | Crude oil purchases, at acquisition costs, including transportation and delivery costs incurred; |
| • | Inventory of finished products, at total production costs; |
| • | Work in progress inventory, at production costs; and |
| • | Raw materials inventory, at weighted average cost. |
Raw materials and supplies in joint ventures are controlled by the operator and reported in a joint account at the acquisition cost (recorded in the original currency at average costs). Inventory consumption is charged to the joint venture as a cost, expense or investment, as appropriate.
Furthermore, inventories are valued at market cost or average cost, whichever is lower, and in-transit inventories are valued at actual cost incurred. At the end of the fiscal year allowances are calculated to take into account impairment, obsolescence, excess, slow movement or loss of market value.
| (k) | Property, plant and equipment depreciation |
Property, plant and equipment are stated at historical cost adjusted for inflation up to 2001. This cost includes financial expenses and the exchange differences for acquisition in foreign currency up until commissioning of the asset, as well as financial revenues from the unused portion of financial obligations acquired to finance investment projects. When an asset is sold or retired, the adjusted cost and accumulated depreciation are written off and any gain or loss is recorded in the year’s results.
Depreciation is calculated on the total acquisition cost using the straight-line method, based on the assets’ useful life, which are reviewed periodically. Annual depreciation rates are:
| | | % | |
| Buildings and pipelines | | | 5 | |
| Plant and equipment | | | 10 | |
| Transportation equipment | | | 20 | |
| Computers | | | 33.3 | |
Disbursements for maintenance and repairs are recorded as expenses. Significant disbursements that improve efficiency of an asset or extend its useful life are capitalized as an increase in the value of that asset.
The value of property, plant and equipment is subject to periodic revaluation by comparing the net book value with the value determined through technical appraisals. When the value of an asset’s technical appraisal is greater than its net book cost, the difference is recorded as an asset valuation and credited to the surplus account for equity valuation; otherwise, it is recorded as an allowance for devaluations and charged to results.
Upon termination of an association contract, the Group receives, at no cost, the property, plant and equipment, materials and amortizable oil investments belonging to the associate. This transaction does not affect the Group’s results.
| (l) | Natural and environmental resources |
The Group follows the successful-efforts method of accounting for investments in exploration and production or development. Expenses for geological and geophysical studies are recorded as they are incurred. Acquisition and exploration costs are capitalized until it is determined whether the exploration drilling was successful or not. If it is not successful, all of the costs incurred are charged to expenses. When a project is approved for development, the accumulated value of the acquisition and exploration costs are classified in the oil investment account. Costs capitalized also include asset retirement costs. Asset and liability balances related to asset retirement costs are updated every six months. Production and support equipment is accounted under the historical cost and is included in property, plant and equipment subject to depreciation.
Natural and environmental resources investments are amortized by applying the amortization factor to technical units of production and proven developed reserves per field, royalty-free, estimated as of December 31 of the immediately preceding year. The amortization charged to results is adjusted at the end of December, recalculating the DD&A (Depletion, Depreciation and Amortization) as of January 1 of the current year, based on the reserve study updated at the end of the current year.
In the same way that it receives property, plant and equipment upon termination of an association contract, Ecopetrol receives, at no cost, the associate’s amortizable oil investments.
Ecopetrol has established a corporate process for reserves led by the Reserves Directorate, which reports directly to the Vice President of Corporate Finance. The reserves are audited by internationally recognized external consultants and approved by the Company’s Reserves Committee. Proven reserves consist of the estimated quantities of crude oil and natural gas demonstrated with reasonable certainty by geological and engineering data to be recoverable in future years from known reserves under existing economic and operating conditions, that is, at the prices and costs that apply at the date of the estimate.
Since Ecopetrol became an issuer on theBolsa de Valores de Colombia (BVC – Colombia Stock Exchange) and the New York Stock Exchange (NYSE), the Group has applied the methodology approved by the SEC (Securities Exchange Commission) for estimating reserves. Under this methodology, the reference price is the arithmetic average of the BRENT price for crude over the previous twelve (12) months.
Estimating hydrocarbon reserves is fraught with the various uncertainties inherent to determining proven reserves, recovery and production rates, the timeliness of investments to develop deposits and the maturity of fields.
We capitalize of exploratory well costs when the well has found a sufficient quantity of reserves to justify its completion as a producing well and the Company is making sufficient progress assessing the reserves and the economic and operating viability of the project. Exploratory well costs not meeting these criteria are charged as expense.
Deferred charges include: i) deferred income tax resulting from the temporary differences between the basis for determining commercial gains and taxable net income at the end of each period; ii) the net equity tax, which is amortized up to 2014; and iii) investments made to develop cooperation contracts that are amortized based on technical units of production.
Other assets include goodwill, which corresponds to the difference between the purchase value of equity investments in controlled or joint-control entities, and their intrinsic value, which reflects the economic benefits expected to be achieved from the investment, created by good name, specialized personnel, preferential credit reputation, prestige due to sale of better products and services, favourable location and the expectations of new businesses, among other things.
Goodwill is amortized using methods of recognized technical value over the term for expected recovery of the investment, which is 10 to 18 years. At the close of each accounting period, the Group must evaluate goodwill to determine whether the conditions for the generation of future economic benefits still exist; otherwise, the asset must be retired. If the book value of the equity investment plus the book value of goodwill, which includes its historical cost added to all price adjustments and amortizations, is greater than the market value, the asset shall, as a result of such difference, be retired in the related year, with charge to results, and the reasons for said decision shall be disclosed.
Intangible assets like software, licenses and patents are recognized at acquisition, development or production cost. Intangible assets are amortized using the straight-line method over the periods during which the benefits arising from the incurred costs and expenses are expected to occur, or during the term of the legal or contractual coverage of the granted rights.
Valuations correspond to the differences between the net book value of the investments and their intrinsic value or quoted price on the stock exchange.
| b. | Property, plant and equipment |
Valuations and the valuation surplus of property, plant and equipment correspond to the difference between the net book cost and the market value for real estate or the current use value (CUV) for plant and equipment, determined by specialists registered with the Colombian Real Estate Association or by suitable technical personnel, as appropriate.
The methodology used for plant and equipment appraisal is the current use value (CUV) for running businesses, for the economic valuation of assets, taking into account facilities’ current conditions and their useful life in terms of production capability and ability to generate income. It is not mandatory to adjust the value of moveable property when its historical value, taken individually, is lower than 35 current monthly legal minimum wages, or of property, plant and equipment located in high risk zones.
Public credit operations pertain to any actions undertaken or contracts entered into, in compliance with legal regulations governing public credit, to supply the Company with resources, goods and services under specific payment terms such as loans, issue and placement of bonds and public credit securities, and suppliers’ credit.
With respect to loans, public credit operations must be recorded for the actual disbursed amount, while bonds and securities placed are recorded at their nominal value. Placement costs are carried directly to expenses.
Current tax expenses are calculated based on taxable income.
The effect of temporary differences leading to the payment of a lower or higher income tax in the current year is recorded as a deferred tax asset or liability, as appropriate, provided that there is a reasonable expectation that such differences will be reversed.
| (r) | Labor and pension obligations |
The main plan covers salary and benefits for Ecopetrol S.A. staff, and is governed by the Collective Labor Agreement 01 of 1977, and by the Substantive Labor Code. In addition to legally mandated benefits, employees are entitled to agreed upon additional benefits linked to place of work, type of work, length of service, and basic salary. Annual interest of 12% is recognized on accumulated severance amounts for each employee, and the payment of indemnities is provided for when special circumstances arise that result in the non-voluntary termination of the contract, without just cause, and in periods other than the probationary period.
The actuarial calculation includes active employees, employees with indefinite term contracts, pensioners and heirs, for pension, health care and education plans; it also includes pension bonds for temporary employees, active employees and voluntary retirements. Health and education obligations are not part of pension liabilities, they are part of benefit obligations.
All social benefits of employees who joined the Company before 1990 are the responsibility of Ecopetrol, without the involvement of any social security entity or institution. The cost of health services for the employee and his/her relatives registered with the Company is determined by means of the morbidity table, based on facts occurring during 2011.
Similarly, Ecopetrol calculates educational allowances according to experience, based on the annual average cost of each business, subdivided in accordance with the type of studies: pre-school, elementary, high school and university.
For employees who joined the Company subsequent to the entry into effect of Law 50 of 1990, the Company makes periodic contributions for severance, pensions and occupational injuries to the funds created for these respective obligations. Similarly, Law 797 of January 29, 2003 determined that Ecopetrol employees who joined the Company as of that date would be subject to the provisions of the General Pension Regime.
Pursuant to Legislative Act 01 of 2005, enacted by the Colombian Congress, the pension plans excluded from the General Social Security System in Colombia expired on July 31, 2010. In accordance with the provisions therein, the Ministry of Social Protection’s judicial pronouncement on the matter and the analysis conducted by Ecopetrol’s labor advisers, it was concluded that those workers who had met the age and continuous or discontinuous service time requirements of the law, the Collective Bargaining Agreement in effect and/or Agreement 01 of 1977, prior to August 1, 2010, had consolidated their right to their pension. It was, however, mandatory for other workers, who were not covered, to join the General Pension System. The pension administrator chosen by the worker (Colpensiones, Private Pension Fund, or whichever applies) would be responsible for recognizing and paying the respective pension.
As set out in Decree 941 of 2002, upon approval of the actuarial calculation by the Ministry of Finance in October 2008, and upon approval of the mechanism by the Ministry of Social Protection through the Administration Act of December 29, 2008, the Company partially switched over the value corresponding to monthly pension payments from its pension liabilities, transferring said liabilities and their underlying amounts to stand-alone pension equities (PAP). The funds transferred and returns on those funds cannot be redirected nor be returned to the Company until all of the pension obligations have been fulfilled.
The transferred liability corresponds only to pension allowances and pension bonds. The portion relating to health care and education services remains within Ecopetrol’s labor liabilities.
At the end of each period, Ecopetrol must check the reported value of trust funds against the updated pension liability value as determined by the latest actuarial calculation. In the event that equity is insufficient to cover 100% of the liability, the Company must create an allowance for the difference, which must be funded should the contingency materialize. Ecopetrol remains materially responsible for the payment of pension liabilities.
Through Resolution 1555 of July 30, 2010, the Superintendence of Finance replaced the mortality tables used to prepare actuarial calculations and stipulated that the effects of the change could be recognized gradually. Subsequently, Decree 4565 of December 7, 2010 modified the accounting standards for amortization of the actuarial calculation in effect up to that date. Pursuant to the new decree, the companies that had amortized 100% of their actuarial calculation at December 31, 2009 could gradually amortize the increase in the actuarial calculation for 2010 using the new mortality tables, up to 2029.
Given the above, in 2010 Ecopetrol modified its accounting policy for amortization of the actuarial calculation of monthly pension payments, pension quotas and bonds (transferred liabilities) and health bonds, and adopted a five-year term starting in 2010 to amortize the increase in the 2010 actuarial calculation. Up until 2009, the yearly increase in the actuarial calculation was recorded as expenses for the period, as the actuarial calculation was 100% amortized.
Resolution 717 of December 2012 amended theManual de Procedimiento del Régimen de Contabilidad Pública (Regime of Public Accounting Procedure Manual) with regard to the Accounting Procedure for recognizing and disclosing pension liability, the underlying financial reserve, and related expenses, at items 5 and 44. With regard to item 5, the indications in the previous paragraph lead to the conclusion that this item has no impact on the Company’s activities within its amortization plan.
With regard to item 44, its only impact is to disclose the fact that the Reserve Funds are common funds that are also under the administration of Colpensiones. There are no further implications for Ecopetrol.
| (s) | Advances received from Ecogas to cover BOMT (Build, Operate, Maintain and Transfer) obligations |
Pursuant to the sale of Ecogas by the Colombian Nation, and following specific instructions from CGN, the net present value of the future payment scheme in connection with Ecopetrol’s debt toward BOMT contractors was recognized as deferred income. These liabilities are due in 2017, the year when the contract obligations will be fulfilled.
Ecopetrol purchases hydrocarbons that the ANH receives from all production in Colombia, at prices established according to section four of Law 756 of 2002 and Resolution 18-1709 of 2003 of the Ministry of Mines and Energy, taking into account international reference prices.
Hydrocarbons are also purchased from partners and other producers in Colombia and abroad to meet the Group’s needs and operating plans.
Revenue from crude oil and natural gas sales is recognized at the time of transfer of title to the buyer, including risks and benefits. In the case of refined and petrochemical products, revenue is recognized when products are shipped by the refinery and subsequently adjusted in accordance with the volumes actually delivered.
Revenue from transportation services is recognized when products are transported and delivered to the buyer in accordance with sale terms. In other cases, revenue is recognized at the time it is earned and a true, probable and quantifiable right to demand its payment arises.
Under current regulations, Ecopetrol S.A. and Sociedad Refinería de Cartagena S.A. (Reficar) sell regular gasoline and diesel at a regulated price, and the National Government recognizes for these businesses the amount of the subsidy on regular gasoline and diesel granted to local consumers, which is generated by adding the difference, for every day of the month, between the producer’s regulated revenues and the daily price equivalent to the U.S. Gulf Coast reference price, calculated according to origin and multiplied by the volumes sold daily.
Resolution 182439 and Decree 4839 of December 2008 establish the procedure for recognizing subsidies in the event they are negative (negative value between parity and regulated prices).
In March 2010, the Ministry of Mines and Energy issued Resolution No. 180522, which revoked provisions that were contrary to Resolutions 181496 of September 2008, 182439 of December 30, 2008, and 180219 of February 13, 2009 and modified the formula for calculating the international reference prices for gasoline and diesel.
In 2012, Resolution 91658 was issued, amending Resolution 180522 with regard to the subsidy procedure for refiners and importers of regular gasoline and diesel.
| (v) | Cost of sales and expenses |
Costs are recognized at their historic value both for goods purchased for sale and for the accumulated production costs of goods produced and services rendered. Costs are disclosed according to the operation generating them.
Expenses correspond to the amounts required for the development of ordinary activities and include those related with activities caused by extraordinary events. Expenses are disclosed in accordance with their nature and the occurrence of extraordinary events.
Costs and expenses are recognized upon receipt of goods or services or when there is certainty that the economic event will occur. Fuel shortages and losses due to theft and explosions are recorded as non-operating expenses.
The Group recognizes estimated liability for future environmental obligations, and its corresponding entry is a higher value for natural resource and environmental assets. The estimate includes the cost of plugging and abandoning wells, dismantling facilities and the environmental recovery of areas and wells. Amortization is recorded as production costs, using the technical-units-of-production method, based on remaining proved developed reserves. Changes resulting from new estimates of liability for abandonment and environmental restoration are accounted for under the corresponding asset.
Depending on the scope of certain association contracts, field abandonment costs are taken on by partners according to the same participation percentages set out in each contract. Ecopetrol has not allocated funds to cover these obligations, with the exception of the Casanare, Orocue, Garcero, Estero, Corocora, Monas, Guajira, Tisquirama, Cravo Norte association contracts and the Caño Limón Coveñas pipeline. However, as activities linked to field abandonment take place, they will be covered by the Group.
| (x) | Accounting for contingencies |
On the date of issuance of these consolidated financial statements, conditions might exist that could result in losses for the Company that will only be known if specific future circumstances arise. The nature, probability of such situations, as well as the amounts involved are evaluated by Management, the Vice President of Legal Affairs, and legal consultants, so that decisions can be made regarding changes to amounts provisioned and/or disclosed. This analysis includes current legal suits against the Companies of the Group.
The methodology used to assess legal proceedings and any contingent obligations is based on the Nation’s credit system used by the Ministry of the Interior and Justice.
A provision is recorded for legal proceedings when there is a conviction at trial court or when the risk assessment outcome is “likely to lose.”
Creditor and debtor memorandum accounts represent the estimated value of facts or circumstances that could affect the Group’s financial, economic, social and environmental situation. They also disclose the value of the goods, rights and obligations that require control, and also include differences between accounting information and the information used for tax purposes.
| (z) | Net earnings per share |
Net earnings per share are calculated based on net earnings for the year, divided by the weighted average of subscribed shares in circulation.
The Company does not have share-based employee incentive plans.
| (aa) | Transition from Colombian Government Entity GAAP (RCP) to International Financial Reporting Standards (IFRS) |
In accordance with Law 1314 of 2009 and Regulatory Decrees 1706 and 2784 of 2012, the Group must begin the transition toward convergence of the accounting and financial information standards applied in Colombia with IFRS. For this purpose, theConsejo Técnico de la Contaduría Pública(Public Accounting Technical Council)has placed companies in groups; the Company belongs to Group 1, with a transition period beginning in January 1, 2014, and with the first consolidated financial statements under International Financial Reporting Standards to be issued in 2015.
| (2) | Assets and liabilities denominated in foreign currency |
Transactions and balances in foreign currency are converted at the representative market exchange rate certified by the Superintendence of Finance of Colombia.
As at December 31, 2012 and 2011, the consolidated financial statements of Ecopetrol included the following assets and liabilities denominated in foreign currency (converted to Colombian pesos at the closing exchange rates of $1,768.23 and $1,942.70 per US$1, respectively).
| | | December 31, 2012 | | | December 31, 2011 | |
| | | Thousands of
US dollars | | | Equivalent
millions of pesos | | | Thousands of
US dollars | | | Equivalent
millions of pesos | |
| Assets | | | | | | | | | | | | | | | | |
| Cash and cash equivalents | | $ | 978,367 | | | $ | 1,729,977 | | | $ | 1,387,341 | | | $ | 2,695,187 | |
| Investments | | | 2,546,927 | | | | 4,503,553 | | | | 3,142,338 | | | | 6,104,620 | |
| Accounts and notes receivable | | | 1,861,230 | | | | 3,291,083 | | | | 2,722,535 | | | | 5,289,069 | |
| Advances and deposits | | | 92,210 | | | | 163,048 | | | | 58,644 | | | | 113,928 | |
| Other assets | | | 11,662 | | | | 20,622 | | | | 4,024 | | | | 7,817 | |
| | | $ | 5,490,396 | | | $ | 9,708,283 | | | $ | 7,314,882 | | | $ | 14,210,621 | |
| | | December 31, 2012 | | | December 31, 2011 | |
| | | Thousands of
US dollars | | | Equivalent
millions of pesos | | | Thousands of
US dollars | | | Equivalent
millions of pesos | |
| Liabilities | | | | | | | | | | | | | | | | |
| Financial obligations | | $ | 4,398,712 | | | $ | 7,777,934 | | | | 1,700,334 | | | $ | 3,303,239 | |
| Estimated liabilities and provision | | | 94,677 | | | | 167,411 | | | | 248,652 | | | | 483,056 | |
| Accounts payable and affiliates | | | 1,992,017 | | | | 3,522,345 | | | | 1,135,850 | | | | 2,206,616 | |
| Other liabilities | | | 282,606 | | | | 499,712 | | | | 663,960 | | | | 1,289,875 | |
| | | $ | 6,768,012 | | | $ | 11,967,402 | | | $ | 3,748,796 | | | $ | 7,282,786 | |
| Net asset (liabilities) position | | $ | (1,277,616 | ) | | $ | (2,259,119 | ) | | $ | 3,566,086 | | | $ | 6,927,835 | |
| (3) | Cash and cash equivalents |
The following is a breakdown of cash and cash equivalents:
| | | December 31,
2012 | | | December 31,
2011 | |
| Banks and corporations (1) | | $ | 6,119,406 | | | $ | 5,452,929 | |
| Special funds (2) | | | 1,549,016 | | | | 1,043,726 | |
| Cash | | | 757 | | | | 3,699 | |
| Investments on demand (3) | | | 271,511 | | | | 279,583 | |
| | | $ | 7,940,690 | | | $ | 6,779,937 | |
| (1) | Corresponds to advances made by partners to Ecopetrol S.A. for the exclusive use of the joint venture, in the amount of $75,207 (2011, $52,533) and the Group’s own resources in the amount of $6,044,199 (2011, $5,400,396). |
| (2) | Corresponds mainly to savings in special funds in pesos in the amount of $556,756 (2011, $2,073) and in foreign currency of $708,007 (2011, $942,962) as well as investments in overnight operations in the amount of $4,942 (2011, $80,109). |
| (3) | As at December 31, 2012, represented by investments on demand, mainly fixed-term deposit certificates and overnight operations, comprised mainly of the following: $108,374 from Ocensa S.A., $12,838 from Reficar, $40,768 from Hocol, $74,345 from Ecopetrol Óleo e Gas do Brasil and $12,504 from Equión and as at December 31, 2011 mainly represented by time deposits TDs (CDT) and overnight operations, between which the most representative are: $99,435 of Ocensa S.A, $83,482 of Reficar, $56,358 of Hocol, $14,838 of Ecopetrol Óleo E Gas Do Brasil and $11,934 of Equión. |
The following is a breakdown of investments:
| | | December 31,
2012 | | | December 31,
2011 | |
| Current: | | | | | | | | |
| Fixed yield | | | | | | | | |
| Term deposits | | $ | 156,287 | | | $ | - | |
| Bonds and securities of private or foreign entities | | | 654,635 | | | | 512,378 | |
| Bonds issued by the Colombian Government | | | 17,219 | | | | 398,959 | |
| Investment funds administered by third parties | | | - | | | | 149,021 | |
| Specific purpose fund – legal contingencies (1) | | | 30,300 | | | | 86,026 | |
| Treasury securities – TES | | | 508,575 | | | | 191,204 | |
| Hedging financial instruments | | | 4,543 | | | | 14 | |
| Total current | | $ | 1,371,559 | | | $ | 1,337,602 | |
| | | | | | | | | |
| Long term: | | | | | | | | |
| Variable yield – Shares (2) | | $ | 1,077,190 | | | $ | 1,020,059 | |
| Fixed yield | | | | | | | | |
| Bonds and securities of foreign entities | | | 2,071,957 | | | | 3,303,859 | |
| Bonds issued by the Colombian Government | | | 1,008,433 | | | | 869,710 | |
| Treasury securities – TES | | | 1,236,166 | | | | - | |
| Specific purpose fund – legal contingencies (1) | | | 393,916 | | | | 273,805 | |
| Other investments | | | 24,561 | | | | 7,372 | |
| Total long term | | $ | 5,812,223 | | | $ | 5,474,805 | |
| (1) | Corresponds to restricted resources made up of fixed-yield investments entered into based on the court rulings linked to the Derecho Comuneros – Santiago de las Atalayas and Pueblo Viejo de Cusiana proceedings, with regard to the attachment and seizure of royalty payments that Ecopetrol was to have paid pursuant to Royalty Contracts No. 15, 15A, 16 and 16A, declared null by statute in the State Council ruling of September 13, 1999. |
| (2) | Variable yield – Shares: |
The following is a breakdown of the variable yield investments represented in shares at December 31, 2012 and 2011.
| | | December 31,
2012 | | | December 31,
2011 | |
| Companies: | | | | | | | | |
| Significant Influence | | $ | 840,692 | | | $ | 783,566 | |
| Non-strategic | | | 236,498 | | | | 236,493 | |
| Total | | $ | 1,077,190 | | | $ | 1,020,059 | |
The following is a breakdown of long-term, variable yield investments as at December 31, 2012, recognized using the equity method:
| Equity share | | Number of shares
and/or quotas | | | Participation
percentage | | | Valuation
date | | Historical
cost | | | Book value | | | Equity method
effect | |
| Significant influence: | | | | | | | | | | | | | | | | | | | | | | |
| Ecodiesel Colombia S.A. | | | 10,500,000,000 | | | | 50 | | | December | | $ | 10,500 | | | $ | 19,408 | | | $ | 8,908 | |
| Serviport S.A. | | | 58,800,000 | | | | 49 | | | December | | | 2,081 | | | | 7,193 | | | | 5,112 | |
| Offshore International Group | | | 250 | | | | 50 | | | December | | | 408,517 | | | | 532,269 | | | | 123,752 | |
| Invercolsa S.A. | | | 1,213,801,146 | | | | 43.35 | | | October | | | 61,671 | | | | 240,555 | | | | 178,884 | |
| Transgas | | | 27,372,771 | | | | 20 | | | November | | | 4,051 | | | | 41,267 | | | | 37,216 | |
| Total | | | | | | | | | | | | $ | 486,820 | | | $ | 840,692 | | | $ | 353,872 | |
The following is a breakdown of long-term, variable yield investments as at December 31, 2011, recognized using the equity method:
| Equity share | | Number of shares
and/or quotas | | | Participation
percentage | | | Valuation
date | | Historical
cost | | | Book value | | | Equity
method effect | |
| Significant influence: | | | | | | | | | | | | | | | | | | | | | | |
| Serviport S.A. | | | 53,714,116 | | | | 49 | | | November | | $ | 2,081 | | | $ | 5,129 | | | $ | 3,048 | |
| Ecodiesel Colombia S.A. | | | 10,500,000,000 | | | | 50 | | | December | | | 10,500 | | | | 10,681 | | | | 181 | |
| Offshore International Group | | | 250 | | | | 50 | | | December | | | 408,517 | | | | 493,171 | | | | 84,653 | |
| Invercolsa S.A. | | | 1,213,801,146 | | | | 43.35 | | | November | | | 61,672 | | | | 232,757 | | | | 171,085 | |
| Transgas | | | 27,372,771 | | | | 20 | | | November | | | 4,051 | | | | 41,828 | | | | 37,778 | |
| Total | | | | | | | | | | | | $ | 486,821 | | | $ | 783,566 | | | $ | 296,745 | |
The following is a breakdown of long-term, variable yield investments as at December 31, 2012, recognized using the cost method:
| Equity share | | Number of shares
and/or quotas | | | Participation
percentage | | | Valuation
date | | Cost | | | Market/
Intrinsic value | | | Appreciation
/
Depreciation | |
| STRATEGIC | | | | | | | | | | | | | | | | | | | | | | |
| Zona Franca de Cartagena S.A. | | | 290 | | | | 10 | | | November | | $ | 394 | | | $ | 1,163 | | | $ | 769 | |
| Sociedad Portuaria del Dique | | | 200 | | | | 1 | | | November | | | 5 | | | | 20 | | | | 15 | |
| Sociedad Portuaria Olefinas | | | 249,992 | | | | 50 | | | November | | | 250 | | | | 439 | | | | 189 | |
| Los Arces Group | | | 10,001 | | | | 100 | | | December | | | 5,100 | | | | 5,100 | | | | - | |
| Amandine Holding | | | 500 | | | | 100 | | | December | | | 6,657 | | | | 6,657 | | | | - | |
| | | | | | | | | | | | | $ | 12,406 | | | $ | 13,379 | | | $ | 973 | |
| | | | | | | | | | | | | | | | | | | | | | | |
| NON STRATEGIC | | | | | | | | | | | | | | | | | | | | | | |
| Empresa de Energía de Bogotá | | | 631,098,000 | | | | 6.87 | | | December | | $ | 154,375 | | | $ | 801,494 | | | $ | 647,119 | |
| Interconexión Eléctrica S.A. | | | 58,925,480 | | | | 5.32 | | | December | | | 69,549 | | | | 565,683 | | | | 496,134 | |
| Concentra Inteligencia en Energía S.A.S. | | | 168,000 | | | | 9.52 | | | November | | | 168 | | | | 159 | | | | (9 | ) |
| | | | | | | | | | | | | $ | 224,092 | | | $ | 1,367,336 | | | $ | 1,143,244 | |
| | | | | | | | | | | | | $ | 236,498 | | | $ | 1,380,715 | | | $ | 1,144,217 | |
The following is a breakdown of long-term, variable yield investments as at December 31, 2011, recognized using the cost method:
| Equity share | | Number of shares
and/or quotas | | | Participation
percentage | | | Valuation
date | | Cost | | | Market/Intrinsic
value | | | Appreciation/
Depreciation | |
| STRATEGIC | | | | | | | | | | | | | | | | | | | | | | |
| Zona Franca de Cartagena S.A. | | | 290 | | | | 10 | | | November | | $ | 392 | | | $ | 1,755 | | | $ | 1,363 | |
| Sociedad Portuaria del Dique | | | 200 | | | | 1 | | | November | | | 5 | | | | 17 | | | | 12 | |
| Sociedad Portuaria Olefinas | | | 249,992 | | | | 50 | | | November | | | 329 | | | | 386 | | | | 57 | |
| Los Arces Group | | | 10,001 | | | | 100 | | | March | | | 5,100 | | | | 5,100 | | | | - | |
| Amandine Holding | | | 500 | | | | 100 | | | March | | | 6,657 | | | | 6,657 | | | | - | |
| | | | | | | | | | | | | $ | 12,483 | | | $ | 13,915 | | | $ | 1,432 | |
| | | | | | | | | | | | | | | | | | | | | | | |
| NON STRATEGIC | | | | | | | | | | | | | | | | | | | | | | |
| Empresa de Energía de Bogotá | | | 631,098,000 | | | | 6.87 | | | December | | $ | 154,376 | | | $ | 741,540 | | | $ | 587,164 | |
| Interconexión Eléctrica S.A. | | | 58,925,480 | | | | 5.32 | | | December | | | 69,549 | | | | 659,966 | | | | 590,417 | |
| Concentra Inteligencia en Energía S.A.S. | | | 84,000 | | | | 5 | | | October | | | 85 | | | | 92 | | | | 7 | |
| Total non-strategic | | | | | | | | | | | | $ | 224,010 | | | $ | 1,401,598 | | | $ | 1,777,588 | |
| | | | | | | | | | | | | $ | 236,493 | | | $ | 1,415,513 | | | $ | 1,179,020 | |
Restrictions on long-term investments – variable income:
The following developments can be reported for the Invercolsa S.A. trial as at January 10, 2013: The Supreme Court of Justice is deciding over the cassation appeals put forth by AFIB S.A. and Fernando Londoño Hoyos against the sentence issued by the 28th Civil Circuit Court on February 8, 2007, (sentence that was confirmed by the Superior Court of the Judicial District of Bogota – Civil Chamber, on January 11, 2011). On October 22, 2012, the notification for the appellant AFIB S.A. to support the corresponding recourse came due, and was submitted in a timely manner, and the notification period began so that appellant Fernando Londoño Hoyos could support his recourse, which was also done within the prescribed period. Therefore, on December 5, 2012, the Court Registrar indicated that, upon notification to the appellants, the corresponding claims were made on time and are part of the record, the report of which was dispatched on the same day.
It should be noted that the appeal sentence of January 11, 2011 ordered: i) that the purchase of 145 million shares of Invercolsa by Fernando Londoño Hoyos be cancelled; ii) that the cancellation of said transaction be recorded in the shareholders’ book, including the pledge in favor of the Pacífico Colombia y Panamá banks, as well as the payment in kind of the Arrendadora Financiera Internacional Bolivariana S.A. shares; iii) that Fernando Londoño Hoyos and AFIB return the Invercolsa dividends to Ecopetrol, along with the new shares received as profit and/or revaluations; iv) that Fernando Londoño Hoyos did not acquire or possess in good faith the 145 million Invercolsa shares; and v) that Invercolsa adjust its operation and the Assembly to the declarations made in the sentence. If ruled in favor of Ecopetrol, the Company would be the owner of the aforementioned number of shares of Invercolsa and the normal rights that come with it: voice, vote and dividends.
The economic activity for the entities in which the Group has investments are as follows:
| Company | | Economic Activity |
| | | |
| Invercolsa S.A. | | Investments in companies in the energy sector, including activities specific to the hydrocarbon and mining industry and trade |
| Serviport S.A. | | Support services for loading and unloading oil tankers, supplying equipment for the same purpose, technical inspections and load measurements |
| Ecodiesel Colombia S.A. | | Production, marketing and distribution of biofuels and oleo chemicals |
| Offshore International Group | | Hydrocarbon exploration, development, production and processing |
Maturity of fixed-yield investments
The following is a summary showing the maturity of long term fixed-yield investments as at December 31, 2012:
| Maturity | | 1 – 3 years | | | 3 – 5 years | | | > 5 years | | | Total | |
| Foreign bonds and other securities | | $ | 1,845,673 | | | $ | 226,284 | | | $ | - | | | $ | 2,071,957 | |
| Government bonds and other securities | | | 628,816 | | | | 304,048 | | | | 75,569 | | | | 1,008,433 | |
| Fixed-term securities – TES | | | 772,747 | | | | 148,949 | | | | 314,470 | | | | 1,236,166 | |
| Specific purpose fund | | | 58,328 | | | | 63,339 | | | | 272,249 | | | | 393,916 | |
| Other* | | | 24,561 | | | | - | | | | - | | | | 24,561 | |
| | | $ | 3,330,125 | | | $ | 742,620 | | | $ | 662,288 | | | $ | 4,735,033 | |
Ecopetrol Oleo e Gas do Brasil has financial investments in Citibank in the amount of $24,492, given as a guarantee to the ANP (the equivalent of the ANH) until it approves ECP Brazil’s participation in the Vanco-BM-S-63, 71 and 72 drilling blocks. Following said approval, this amount will be transferred to the purchase of participation, and in the event that it is not approved, the amount will be returned.
The following is a summary showing the maturity of long term fixed-yield investments as at December 31, 2011:
| Maturity | | 1 – 3 years | | | 3 – 5 years | | | > 5 years | | | Total | |
| Foreign bonds and other securities | | $ | 3,218,402 | | | $ | 85,457 | | | $ | - | | | $ | 3,303,859 | |
| Government bonds and other securities | | | 768,385 | | | | - | | | | 101,325 | | | | 869,710 | |
| Specific purpose fund | | | 139,427 | | | | 15,827 | | | | 118,551 | | | | 273,805 | |
| Other investments | | | 7,372 | | | | - | | | | - | | | | 7,372 | |
| | | $ | 4,133,586 | | | $ | 101,284 | | | $ | 219,876 | | | $ | 4,454,746 | |
| (5) | Accounts and notes receivable |
The following is a breakdown of accounts and notes receivable:
| | | December 31,
2012 | | | December 31,
2011 | |
| Current portion | | | | | | | | |
| Customers | | | | | | | | |
| National | | $ | 975,306 | | | $ | 964,697 | |
| Foreign | | | 2,402,406 | | | | 2,578,421 | |
| Price differential to be received from the Ministry of Mines and Energy (1) | | | 1,381,515 | | | | 571,742 | |
| Various debtors | | | 462,757 | | | | 434,014 | |
| Reimbursements and yields on investment | | | 53 | | | | 2,968 | |
| Association contracts – joint ventures | | | 13,002 | | | | 12,234 | |
| Accounts receivable from employees | | | 19,748 | | | | 61,005 | |
| Doubtful debts | | | 199,216 | | | | 131,750 | |
| Industrial service clients | | | 8,517 | | | | 19,005 | |
| Notes receivable | | | 34,533 | | | | (627 | ) |
| Total | | $ | 5,497,053 | | | $ | 4,775,209 | |
| | | | | | | | | |
| Less – Allowance for doubtful accounts | | | (235,552 | ) | | | (138,673 | ) |
| Total current | | $ | 5,261,501 | | | $ | 4,636,536 | |
| Long term portion | | | | | | | | |
| National | | | 20,830 | | | | 1,183 | |
| Foreign | | | 2,300 | | | | 3,143 | |
| Cavipetrol and loans to employees (2) | | | 359,451 | | | | 282,947 | |
| Price differential to be received from the Ministry of Mines and Energy (1) | | | 77,510 | | | | 77,510 | |
| Credit portfolio | | | 8,520 | | | | 5,836 | |
| Other | | | 34,840 | | | | 36,608 | |
| Total long term | | $ | 503,451 | | | $ | 407,227 | |
Determination and classification of the client portfolio as at December 31, 2012, according to maturity:
| | | Days to maturity | |
| | | 0 – 180 | | | 181 – 360 | | | Over 361* | |
| Current portfolio | | $ | 3,217,740 | | | $ | 20,366 | | | $ | 1,951 | |
| Default portfolio | | | 123,848 | | | | 7,358 | | | | 29,579 | |
| | | $ | 3,341,588 | | | $ | 27,724 | | | $ | 31,530 | |
| | | | | | | | | | | | | |
| National clients | | $ | 968,375 | | | | 26,648 | | | | 1,113 | |
| Foreign clients | | | 2,373,213 | | | | 1,076 | | | | 30,417 | |
| | | $ | 3,341,588 | | | $ | 27,724 | | | $ | 31,530 | |
Determination and classification of the client portfolio as at December 31, 2011, according to maturity:
| | | Days to maturity | |
| | | 0 – 180 | | | 181 – 360 | | | Over 361* | |
| Current portfolio | | $ | 3,210,484 | | | $ | 1,051 | | | $ | - | |
| Default portfolio | | | 225,900 | | | | 105,683 | | | | 4,326 | |
| | | $ | 3,436,384 | | | $ | 106,734 | | | $ | 4,326 | |
| | | | | | | | | | | | | |
| National clients | | $ | 963,646 | | | | 1,051 | | | | 1,183 | |
| Foreign clients | | | 2,472,738 | | | | 105,683 | | | | 3,143 | |
| | | $ | 3,436,384 | | | $ | 106,734 | | | $ | 4,326 | |
| | * Client portfolio included in doubtful debts. |
The following shows the movement in the allowance for accounts receivable:
| | | December 31,
2012 | | | December 31,
2011 | |
| Opening balance: | | $ | 138,673 | | | $ | 101,400 | |
| Additions (new allowances) | | | 88,441 | | | | 32,422 | |
| Recovery of allowances | | | (5,945 | ) | | | (365 | ) |
| Accounts receivable write-off | | | (78 | ) | | | (770 | ) |
| Use of allowances | | | 14,461 | | | | 5,986 | |
| Balance | | $ | 235,552 | | | $ | 138,673 | |
| (1) | Account receivable from the Ministry of Finance and Public Credit, arising from the calculation of the regular motor gasoline and diesel price differential pursuant to Resolution 180522 issued on March 29, 2010. |
| (2) | By means of Leg contracts 058-80 of 1980 and 4008928 of 2006, the administration, management and control of loans granted to employees by the Company were transferred to Cavipetrol. In its capacity as administrator, Cavipetrol monitors, in its database and financial system, the details per employee of said loans and their respective conditions. |
Future collection of accounts receivable from Cavipetrol as at December 31, 2012 are estimated as follows:
| Year | | Value | |
| | | | |
| 2013 | | $ | 31,613 | |
| 2014 | | | 31,613 | |
| 2015 and beyond | | | 276,239 | |
| | | $ | 339,465 | |
Similarly, at December 31, 2012 loans were made to the employees of Equión in the amount of $11,984, of Hocol in the amount of $7,525, of Propilco in the amount of $412, of Comai in the amount of $65.
There are no major restrictions for the recovery of accounts and notes receivable.
The following is a breakdown of the inventories:
| | | December 31,
2012 | | | December 31,
2011 | |
| Finished products: | | | | | | | | |
| Crude oil | | $ | 941,846 | | | $ | 1,094,691 | |
| Fuels | | | 801,403 | | | | 701,665 | |
| Petrochemicals | | | 66,107 | | | | 85,411 | |
| Natural gas (1) | | | 29,415 | | | | - | |
| Purchased products: | | | | | | | | |
| Fuels | | | 13,613 | | | | 43,527 | |
| Crude oil | | | 260,429 | | | | 116,398 | |
| Petrochemicals | | | 11,995 | | | | 24,042 | |
| Natural gas (1) | | | - | | | | 392 | |
| Agricultural products | | | 1,149 | | | | | |
| Raw materials: | | | | | | | | |
| Crude oil | | | 127,272 | | | | 187,048 | |
| Petrochemicals | | | 30,485 | | | | 32,087 | |
| Products in process: | | | | | | | | |
| Fuels | | | 435,952 | | | | 396,270 | |
| Petrochemicals | | | 7,627 | | | | 12,523 | |
| Packaging material | | | 1,579 | | | | 5,139 | |
| Materials for the production of goods | | | 82,082 | | | | 65,706 | |
| Materials in transit | | | 22,478 | | | | 24,359 | |
| Total | | $ | 2,833,432 | | | $ | 2,789,258 | |
| Less – Reserve for inventories | | | (27,150 | ) | | | (27,653 | ) |
| Total | | $ | 2,806,282 | | | $ | 2,761,605 | |
The movement in the allowance for inventories is as follows:
| | | December 31, 2012 | | | December 31, 2011 | |
| Opening balance | | $ | 27,653 | | | $ | 19,297 | |
| Allowance increase (decrease) | | | (503 | ) | | | 8,356 | |
| Closing balance | | $ | 27,150 | | | $ | 27,653 | |
| (1) | Natural gas imbalance – The Group uses the entitlement method of accounting for gas balancing agreements, through which the amount of natural gas sold is based on the shared ownership interest. The Group had a gas imbalance as at December 31, 2012 of $5,713 (US$3,241,756) in its favor, equivalent to 574,109 MBTU. The Group did not have an imbalance as at December 31, 2011. In accordance with Colombian Government Entity GAAP, natural gas imbalances are resolved through sales or purchases to or from the partner, accounted for at the end of the period. |
The following is a breakdown of advances and deposits:
| | | December 31,
2012 | | | December 31,
2011 | |
| Current: | | | | | | | | |
| Official entities (1) | | $ | 4,752,125 | | | $ | 2,851,195 | |
| Advances to investment projects | | | - | | | | 1,749 | |
| Partners in joint ventures (2) | | | 286,474 | | | | 232,492 | |
| Customs agents | | | 2,531 | | | | 62,074 | |
| Advances to contractors | | | 17,399 | | | | 40,129 | |
| Agreements (3) | | | 18,613 | | | | 18,911 | |
| Advances to employees | | | 1,073 | | | | 1,084 | |
| Advances to suppliers | | | 300,711 | | | | 252,308 | |
| Short-term total | | $ | 5,378,926 | | | $ | 3,459,942 | |
| Long term: | | | | | | | | |
| Advances and deposits | | | 172,708 | | | | 144,482 | |
| Total | | $ | 5,551,634 | | | $ | 3,604,424 | |
| (1) | Corresponds to theDirección de Impuestos y Aduanas Nacionales (DIAN – National Tax and Customs Directorate), from advances on income tax for the 2012 tax year of $3,480,067 (2011, $1,771,005), self-withholdings and others in the amount of $1,272,058 (2011, $1,080,190). |
| (2) | The following is a breakdown of the advances and deposits with partners in joint operations: |
| | | December 31,
2012 | | | December 31,
2011 | |
| Contracts in which Ecopetrol is not the operator: | | | | | | | | |
| Meta Petroleum Ltd. | | $ | 9,069 | | | $ | 45,140 | |
| Occidental de Colombia Inc. | | | 17,733 | | | | 15,012 | |
| Mansarovar Energy Colombia Ltd. | | | - | | | | 3,386 | |
| Petrobras Colombia Limited | | | 11,213 | | | | 13,406 | |
| Other operations | | | 11,484 | | | | 26,027 | |
| Perenco Colombia Limited | | | 12,041 | | | | 27,324 | |
| Emerald Energy PLC Suc Colombia | | | 20,893 | | | | - | |
| Chevron Petroleum Company | | | 7,065 | | | | 4,197 | |
| Repsol | | | - | | | | 50 | |
| Vector Group | | | - | | | | 48 | |
| Larsen & Toubro | | | - | | | | 3,919 | |
| Petrobras Internacional Braspetro B.V. | | | 589 | | | | 4,866 | |
| CEPSA Colombia S.A. | | | 13,118 | | | | 583 | |
| Talismán Perú B.V., Sucursal del Perú | | | 781 | | | | 563 | |
| Petróleo Brasileiro S.A. Petrobras | | | - | | | | 1,107 | |
| Petrobras Energía Perú S.A. | | | 197 | | | | 147 | |
| Maurel & Prom Colombia B.V. | | | 747 | | | | - | |
| Lewis Energy Colombia | | | 242 | | | | - | |
| Contracts for which Ecopetrol is the operator: | | | | | | | | |
| Oleoducto Caño Limón | | | 15,985 | | | | 36,137 | |
| Other operations | | | 2,998 | | | | 27,138 | |
| Vanco | | | 29,739 | | | | - | |
| Niscota | | | 23,164 | | | | - | |
| La Cira | | | 38,027 | | | | 17,289 | |
| JOA Caño Sur | | | 3,619 | | | | 3,681 | |
| CRC 2004 – 01 | | | 1,935 | | | | 2,401 | |
| JOA Platanillo | | | - | | | | 71 | |
| Bloque CPO-9 | | | 25,189 | | | | - | |
| Master Agreement TLU-1 | | | 11,514 | | | | - | |
| Operation Agreement TLU-3 | | | 13,477 | | | | - | |
| Heavy Crude Block CPE-2 | | | 15,655 | | | | - | |
| Total | | $ | 286,474 | | | $ | 232,492 | |
| (3) | Represents the resources transferred to workers as an advance for the education plan. |
The following provides details on prepaid expenses:
| | | December 31,
2012 | | | December 31,
2011 | |
| Insurance (1) | | $ | 106,257 | | | $ | 44,049 | |
| Other (2) | | | 4,398 | | | | 8,325 | |
| Total | | $ | 110,655 | | | $ | 52,374 | |
| (1) | Of the total insurance, $70,326 corresponds to Ecopetrol S.A., in effect up until May 2013, at a cost of $168,238 and amortization of $97,912 as at December 31, 2012. |
As at December 31, 2012, the insurance by the other companies in the Group was: $19,072 for Refinería de Cartagena, $7,036 for Oleoducto Bicentenario, $4,543 for Ecopetrol America Inc., $2,868 for Equión, $1,265 for Propilco, $494 for Ocensa, $325 for Hocol, $150 for Oleoducto de Colombia, $110 for Bioenergy, $57 for Comai, $11 for Ecopetrol Perú.
| (2) | Mainly includes resources for the acquisition and maintenance of vehicles assigned to senior officials of Ecopetrol through leasing, managed under Contract No. 5203585 by Cavipetrol; electric power consumption by the Meta Power Plant for Hocol’s Ocelote field: $2,833, and prepaid medication by Hocol: $643. |
| (9) | Deposits held in trust |
This corresponds to trust funds for pensions and abandonment costs, created under Occidental de Colombia and received upon termination of the Asociación Cravo Norte – ACN contract, which came into effect in February 2011. The pension fund and the abandonment fund are administered by the Fiduciaria Bancolombia Trust. The following sets forth a breakdown of the funds as of the dates shown:
| | | December 31,
2012 | | | December 31,
2011 | |
| Abandonment fund | | $ | 306,651 | | | $ | 269,073 | |
| Corficolombiana Securitization – ODL | | | 127,784 | | | | 20,565 | |
| Administered by Cavipetrol | | | 19,645 | | | | 16,863 | |
| Pension fund | | | 16,920 | | | | 14,431 | |
| Other | | | 7,810 | | | | 429 | |
| | | $ | 478,810 | | | $ | 321,361 | |
| (10) | Property, plant and equipment, net |
Here is a breakdown of property, plant and equipment, net as of the dates shown:
| | | December 31,
2012 | | | December 31,
2011 | |
| Plant and equipment | | $ | 17,835,237 | | | $ | 17,611,968 | |
| Construction in progress (1) | | | 17,474,710 | | | | 12,715,494 | |
| Pipelines, networks and lines | | | 19,799,381 | | | | 17,991,919 | |
| Buildings | | | 4,295,597 | | | | 3,559,908 | |
| Equipment on deposit and in transit | | | 1,394,003 | | | | 1,198,856 | |
| Computer equipment | | | 580,225 | | | | 569,159 | |
| Transportation equipment and other assets | | | 1,668,096 | | | | 1,674,134 | |
| Agricultural plantations | | | 44,428 | | | | 21,846 | |
| Operating materials | | | 140,237 | | | | 76,986 | |
| Land | | | 745,632 | | | | 679,997 | |
| Total | | $ | 63,977,546 | | | $ | 56,100,267 | |
| Accumulated depreciation | | | (26,278,595 | ) | | | (25,009,147 | ) |
| Allowance for property, plant and equipment depreciation (2) | | | (563,996 | ) | | | (1,057,740 | ) |
| Total | | $ | 37,134,955 | | | $ | 30,033,380 | |
| | | | | | | | | |
| (1) | Principally includes the following: |
| (i) | Exploration and production investments in direct-operation production projects, such as development (Castilla, Chichimene and Apiay), and secondary recovery (Yarigui and Cupiagua), and the joint operations development projects (Piedemonte and La Cira Infantas). |
| (ii) | Major projects in refining such as the modernization of the Barrancabermeja Refinery, and the Master Plan for Industrial Services. |
| (iii) | In transportation, the expansion of the Chichimene-Castilla-Apiay transportation system, the Cupiagua gas transportation system and the Master Plan for the Refinery Integration; as well as investments made on the Bicentenario Pipeline amounting $1,059,992. |
| (iv) | The capitalized portion of interests amounting $63,526 related to the syndicated loan and bonds issued in dollars and peso. |
| (2) | Here is a breakdown of the movement in the allowance for property, plant and equipment depreciations: |
| | | December 31,
2012 | | | December 31,
2011 | |
| Opening balance as of January | | $ | 1,057,740 | | | $ | 1,064,204 | |
| Additions to new allowances | | | 315,627 | | | | 41,948 | |
| Adjustment to existing allowances | | | 30,590 | | | | 3,721 | |
| Depreciation of assets | | | (680,128 | ) | | | (6,114 | ) |
| Recovery | | | (159,833 | ) | | | (46,019 | ) |
| Closing balance as of December | | $ | 563,996 | | | $ | 1,057,740 | |
Summary of property, plant and equipment as at December 31, 2012, including appreciation and allowances:
| Type of asset | | Adjusted cost | | | Accumulated
depreciation | | | Appreciation | | | Allowance | |
| Plant and equipment | | $ | 17,835,237 | | | $ | (11,818,813 | ) | | $ | 5,160,255 | | | $ | (66,980 | ) |
| Pipelines, networks and lines | | | 19,799,381 | | | | (11,628,422 | ) | | | 8,533,118 | | | | (52,075 | ) |
| Work in progress | | | 17,474,710 | | | | - | | | | - | | | | - | |
| Buildings | | | 4,295,597 | | | | (1,608,846 | ) | | | 2,267,564 | | | | (212,487 | ) |
| Equipment on deposit and in transit | | | 1,394,003 | | | | - | | | | - | | | | - | |
| Computer equipment | | | 580,225 | | | | (423,614 | ) | | | 35,915 | | | | (4,632 | ) |
| Agricultural plantations | | | 44,428 | | | | - | | | | - | | | | - | |
| Transportation equipment and other assets | | | 1,668,096 | | | | (798,900 | ) | | | 369,031 | | | | (211,831 | ) |
| Land | | | 745,632 | | | | - | | | | 3,137,790 | | | | (9,944 | ) |
| Operating material | | | 140,237 | | | | - | | | | - | | | | (6,047 | ) |
| Total | | $ | 63,977,546 | | | $ | (26,278,595 | ) | | $ | 19,503,673 | | | $ | (563,996 | ) |
Summary of property, plant and equipment as at December 31, 2011:
| Type of asset | | Adjusted cost | | | Accumulated
depreciation | | | Appreciation | | | Allowance | |
| Plant and equipment | | $ | 17,611,968 | | | $ | (11,551,625 | ) | | $ | 4,354,890 | | | $ | (348,240 | ) |
| Pipelines, networks and lines | | | 17,991,919 | | | | (10,876,272 | ) | | | 4,360,294 | | | | (354,404 | ) |
| Works in progress | | | 12,715,494 | | | | - | | | | - | | | | - | |
| Buildings | | | 3,559,908 | | | | (1,432,962 | ) | | | 1,595,248 | | | | (122,010 | ) |
| Equipment on deposit and in transit | | | 1,198,856 | | | | (11 | ) | | | - | | | | - | |
| Computer equipment | | | 569,159 | | | | (448,025 | ) | | | 42,014 | | | | (15,612 | ) |
| Transportation equipment and other assets | | | 1,695,980 | | | | (700,252 | ) | | | 396,355 | | | | (215,419 | ) |
| Land | | | 679,997 | | | | - | | | | 1,648,057 | | | | (145 | ) |
| Operating materials | | | 76,986 | | | | - | | | | - | | | | (1,910 | ) |
| Total | | $ | 56,100,267 | | | $ | (25,009,147 | ) | | $ | 12,396,858 | | | $ | (1,057,740 | ) |
There are no restrictions or pledges on assets, nor have they been offered as security.
Technical appraisals of fixed assets take place every three years in accordance with the stipulations of the Regime of Public Accounting. At the close of 2012, the last technical appraisal of assets was updated by the T.F. Auditores & Asesores firm.
| (11) | Natural and environmental resources, net |
The following is a breakdown of natural and environmental resources, net:
| | | December 31,
2012 | | | December 31,
2011 | |
| Amortizable oil investments (1) | | $ | 34,866,137 | | | $ | 29,991,872 | |
| Less: Accumulated amortization of oil investments | | | (20,299,730 | ) | | | (18,055,338 | ) |
| | | | 14,566,407 | | | | 11,936,534 | |
| Plugging and abandonment, facility dismantling and environmental recovery costs (2) | | | 4,093,973 | | | | 3,703,535 | |
| Less: Accumulated amortization for facility abandonment | | | (2,100,281 | ) | | | (1,626,621 | ) |
| | | | 1,993,692 | | | | 2,076,914 | |
| Reservoirs and appraisals (3) | | | 701,590 | | | | 701,590 | |
| Less: Accumulated depletion | | | (632,941 | ) | | | (622,040 | ) |
| | | | 68,649 | | | | 79,550 | |
| Exploration (4) | | | 1,939,982 | | | | 1,347,789 | |
| Total | | $ | 18,568,730 | | | $ | 15,440,787 | |
| (1) | As at December 31, 2012, net capitalization of oil investments was approximately $3,821,276, mainly in the following fields: Chichimene, Castilla Norte, Rubiales, La Cira, Yarigui-Cantagallo, Casabe, Pauto, Apiay, Matachin Norte, Infantas, Suria, Cusiana, Quifa, Tibú, Guatiquia, and Caño Limón. |
| (2) | Corresponds to the cost of abandoning production areas, updated in June and December of 2012. |
| (3) | The appraisal of reserves is represented by the reservoirs received through the reverting of concession contracts worth $520,218, administered by Gerencia Sur and $181,372, administered by Magdalena Medio. |
| (4) | The increase in 2012 is mainly due to an increase in the execution in Caño Sur, Quifa, Acacias and unconventional hydrocarbons. The reversal adjustment of the stratigraphic wells in the Caño Sur block also had an impact. |
The following is a breakdown of deferred charges:
| | | December 31,
2012 | | | December 31,
2011 | |
| Other deferred charges, net (1) | | $ | 2,102,874 | | | $ | 2,326,838 | |
| Deferred income tax | | | 1,543,209 | | | | 1,582,996 | |
| Deferred monetary correction charges, net | | | 338 | | | | 40,226 | |
| | | $ | 3,646,421 | | | $ | 3,950,060 | |
| (1) | Includes investments made in developing the business cooperation contract between Ecopetrol and Schlumberger, with the aim of obtaining incremental production at the Casabe field. These investments are amortized based on technical units of field production. |
The following is a breakdown of other assets:
| | | December 31,
2012 | | | December 31,
2011 | |
| Goodwill (1) | | $ | 2,842,518 | | | $ | 3,163,762 | |
| Intangibles (net): brands, licenses, patents, software | | | 569,320 | | | | 405,582 | |
| Trust funds (2) | | | 126,155 | | | | 83,129 | |
| National Royalties Fund (3) | | | 67,815 | | | | 72,909 | |
| Other assets (4) | | | 424,955 | | | | 166,009 | |
| | | $ | 4,030,763 | | | $ | 3,891,391 | |
| (1) | Goodwill corresponds mainly to Ecopetrol S.A. and is composed of: |
| | | 2012 | |
| Company | | Acquisition
date | | | Goodwill
amount | | | Amortized
amount | | | Pending
amortization | | | Amortization
period (years) | |
| Propilco S.A. | | | 07/04/2008 | | | $ | 327,986 | | | $ | 86,572 | | | $ | 241,414 | | | | 17.8 | |
| Andean Chemicals | | | 07/04/2008 | | | | 357,629 | | | | 94,400 | | | | 263,229 | | | | 17.8 | |
| IPL Enterprises | | | 17/03/2009 | | | | 537,093 | | | | 137,257 | | | | 399,836 | | | | 15 | |
| Offshore International | | | 06/02/2009 | | | | 748,986 | | | | 186,175 | | | | 562,811 | | | | 14 | |
| Hocol Petroleum Limited | | | 27/05/2009 | | | | 748,948 | | | | 157,334 | | | | 591,614 | | | | 16 | |
| Equión Energía Limited | | | 24/01/2011 | | | | 972,409 | | | | 189,695 | | | | 782,714 | | | | 10 | |
| Bioenergy Zona Franca | | | 30/08/2008 | | | | 900 | | | | - | | | | 900 | | | | | |
| Total | | | | | | $ | 3,693,951 | | | $ | 851,433 | | | $ | 2,842,518 | | | | | |
| | | 2011 | |
| Company | | Acquisition
date | | | Goodwill
amount | | | Amortized
amount | | | Pending
amortization | | | Amortization
period (years) | |
| Propilco S.A. | | | 07/04/2008 | | | $ | 327,986 | | | $ | 68,002 | | | $ | 259,984 | | | | 17.8 | |
| Andean Chemicals | | | 07/04/2008 | | | | 357,629 | | | | 74,152 | | | | 283,477 | | | | 17.8 | |
| IPL Enterprises | | | 17/03/2009 | | | | 537,093 | | | | 101,451 | | | | 435,642 | | | | 15 | |
| Offshore International | | | 06/02/2009 | | | | 749,699 | | | | 130,766 | | | | 618,933 | | | | 14 | |
| Hocol Petroleum Limited | | | 27/05/2009 | | | | 801,911 | | | | 109,686 | | | | 692,225 | | | | 16 | |
| Equión Energía Limited | | | 24/01/2011 | | | | 957,513 | | | | 84,912 | | | | 872,601 | | | | 10 | |
| Bioenergy Zona Franca | | | 30/08/2008 | | | | 900 | | | | - | | | | 900 | | | | | |
| Total | | | | | | $ | 3,732,731 | | | $ | 568,969 | | | $ | 3,163,762 | | | | | |
| (2) | Includes, i) $59,989 for contributions and shares in theFondo Nacional de Hidrocarburos (National Hydrocarbons Fund) created to support future hydrocarbon investment, exploration and production contracts in smaller fields, for projects administered by theFondo de Capital Privado de Hidrocarburos de Colombia (Colombia Hydrocarbons Private Capital Fund); ii) $48,567 corresponds to the Bicentenario de Colombia pipeline as follow: $28,779 for the open collective portfolio into which the money for the quarterly payment of interest on the syndicated loan is paid; $19,532 represents trusts to consign the money withheld as guarantee, by contract, and which is returned upon completion of the work; and $256 for the mercantile administration trust and payments for construction of the terrace by HGC Ingenieros; iii) $9,611 from the Colpet, Cóndor and Sagoc Fund to deal with potential contingencies in the liquidation of said former subsidiaries; iv) $4,238 for Bioenergy to purchase land; v) $2,325 corresponds to Equión for expenses linked to the medical plan; and iv) $1,425 from the Procuraduría Fund, created to fund projects for the general benefit of municipalities near the direct operations at the Cicuco field: Cicuco, Mompox and Talaigua Nueva (the purpose of the trust is to draft funds in advance of the projects to be implemented by the municipalities, through contracts with Incoder and the Ministry of the Environment). |
| (3) | Corresponds to the deposits to the National Royalties Fund (FAEP). Its sole purpose is the payment of debts and financing for development projects and programs in hydrocarbon producing and non-producing municipalities and departments. Ecopetrol S.A. disburses amounts after the Ministry of Finance issues the corresponding approvals. |
| (4) | Includes, for Ecopetrol, goods acquired through financial leasing in the amount of $105,205 ($73,140 in 2011), as well as restricted funds in the amount of $50,359 ($47,751 in 2011), represented by judicial deposits to pay for labor, civil and tax litigation, and third-party property improvements on assets received through concessions for the Colorados and Tumaco wells in the amount of $44,639 ($23,740 in 2011); ODL Finance in the amount of $162,806, mainly for BOMT contracts ($19,672 in 2011); Andean in the amount of $48,273 for assets received in partial payment for the Louisiana Green Fuels bond; OBC in the amount of $12,217; Hocol in the amount of $1,390; Other in the amount of $66 ($294 in 2011). |
| Property, plant and equipment (1): | | December 31,
2012 | | | December 31,
2011 | |
| Plant and equipment | | $ | 5,160,255 | | | $ | 4,354,890 | |
| Buildings | | | 2,267,564 | | | | 1,595,248 | |
| Land | | | 3,137,790 | | | | 1,648,057 | |
| Pipelines and lines | | | 8,533,118 | | | | 4,360,294 | |
| Transportation equipment and other assets | | | 369,031 | | | | 396,355 | |
| Communication and computer equipment | | | 35,915 | | | | 42,014 | |
| | | $ | 19,503,673 | | | $ | 12,396,858 | |
| Variable yield investments: | | | | | | | | |
| Empresa de Energía de Bogotá S.A. E.S.P. | | $ | 647,119 | | | $ | 587,164 | |
| Interconexión Eléctrica S.A. | | | 496,126 | | | | 590,417 | |
| Zona Franca de Cartagena S.A. | | | - | | | | 1,363 | |
| Sociedad Portuaria del Dique | | | - | | | | 12 | |
| Sociedad Portuaria Olefinas | | | 189 | | | | 57 | |
| Concentra S.A. | | | - | | | | 7 | |
| Zona Franca Industrial | | | 783 | | | | - | |
| | | | 1,144,217 | | | | 1,179,020 | |
| Total | | $ | 20,647,890 | | | $ | 13,575,878 | |
| (1) | As at December 31, 2012, the property, plant and equipment valuations for Ecopetrol showed a $7,232,040 increase due to an update of the technical study of fixed-asset valuation with a cut-off date of December 31, 2012. |
| (15) | Financial obligations |
The following is a breakdown of financial obligations:
| | | December 31,
2012 | | | December 31,
2011 | |
| Current: | | | | | | | | |
| Debt in national currency (1) | | $ | 2,116,790 | | | $ | 660,186 | |
| Debt in foreign currency (2) | | | 122,349 | | | | 171,408 | |
| Total current | | $ | 2,239,139 | | | $ | 831,594 | |
| | | | | | | | | |
| Long term: | | | | | | | | |
| Debt in national currency (1) | | $ | 2,856,688 | | | $ | 3,263,017 | |
| Debt in foreign currency (2) | | | 7,609,998 | | | | 3,706,961 | |
| Bonds issued (3) | | | 1,000,000 | | | | 1,000,000 | |
| Total Long term | | $ | 11,466,686 | | | $ | 7,969,978 | |
| (1) | Corresponds mainly to Ecopetrol’s balance for the syndicated loan with 11 national banks at an initial amount of $2,220,200, earmarked for financing the Company’s investment programs. According to the terms of payment as at December 2012, the amount of $620,510 in capital has been amortized. Capital amortization in 2013 is estimated at $444,041. The loan was obtained with the following conditions: |
Term: 7 years, including a 2-year grace period
Payment of interest: Starting in November 2009
Rate: DTF + 4% (anticipated quarterly rate)
Amortization: Every six months
Guarantee: Ecopetrol S.A. granted a pledge over the stock shares owned either directly or indirectly on the following companies, thus reaching a 120% coverage of the loan amount. The shares given in guarantee were replaced by another contract between some banks and Ecopetrol S.A, on November 17, 2011. The value of guarantees according to the intrinsic value of the shares of companies in June 30, 2012 and translated into Colombian pesos with the current TRM at December 31, 2012 as follows:
| Company | | Value | |
| Hocol Petroleum Limited | | $ | 2,456,361 | |
| Offshore International Group | | | 439,498 | |
| Polipropileno del Caribe S.A. | | | 294,179 | |
| Total | | $ | 3,190,038 | |
The breakdown of long-term payments corresponding mainly to Ecopetrol is as follows:
| 2014 | | $ | 444,040 | |
| 2015 | | | 444,040 | |
| 2016 | | | 267,570 | |
| | | $ | 1,155,650 | |
Ecopetrol currently does not expect any situation that might represent non-compliance with its obligations in the immediate future.
Furthermore, long-term payments mostly cover other financial obligations acquired by the companies in the Group, mainly by: Oleoducto Bicentenario de Colombia in the amount of $1,294,685 for 11 years at an interest rate of DTF+4.54%; Ocensa S.A. in the amount of $900,000 for 7 years with an interest rate of DTF+4%; the ODL Finance S.A. loan in the amount of $725,867; and the Bioenergy loan in the amount of $322,236 for 15 years with an average interest rate of DTF+3%.
Here is the breakdown of the guarantees granted by ODL as at December 31, 2012:
Irrevocable mercantile trust agreement between Oleoducto de los Llanos Orientales S.A. Sucursal Colombia and Fiduciaria Corficolombiana S.A., creating the ODL – Ecopetrol Issuer of ODL Securities – Ecopetrol trust funds.
Guarantee: Loan Securities ODL – Ecopetrol
According to the contract, ODL will use the resources from the placement to finance the project to build and commission the pipeline, and to return capital to the pipeline sponsors, as established in the Information Prospectus. Additionally the agreement considers the creation of a Trustee Fund ,to administer the resources from the Tariff payments for Ecopetrol to only be used to make the debt payments.
Four promissory notes were generated, with the following characteristics:
Nature of the
guarantee | | Counterpart | | Start date | | Maturity
date | | Amount
$ | | | Terms of the
guarantee |
| Bank guarantee | | Bco. de Bogotá | | 06/01/2010 | | 06/01/2017 | | | 520 | | | Breach of undertakings |
| Bank guarantee | | AV Villas | | 06/01/2010 | | 06/01/2017 | | | 70 | | | Breach of undertakings |
| Bank guarantee | | Bco. de Occidente | | 06/01/2010 | | 06/01/2017 | | | 105 | | | Breach of undertakings |
| Bank guarantee | | Bco. Popular | | 06/01/2010 | | 06/01/2017 | | | 105 | | | Breach of undertakings |
Bioenergy has loans registered in the amount of $1,683, of which $914 is guaranteed through a mortgage on a field called “Predio La Esperanza” that has a book value of $4,096, with a surface area of 249.68 hectares, which backs the three financial obligations outlined below:
| Bank | | Start date | | End date | | Note
number | | | Initial
value | | | Rate | | | Duration | | | Balance as of
December 31,
2012 | |
| Bancolombia | | 14/02/2008 | | 14/02/2013 | | | 570087615 | | | $ | 2,159 | | | FTD YR + 8.54% | | | 60 months | | | $ | 359 | |
| Bancolombia | | 22/07/2008 | | 22/07/2013 | | | 570087988 | | | | 1,402 | | | FTD YR + 7.06% | | | 60 months | | | | 350 | |
| Bancolombia | | 22/07/2008 | | 22/07/2013 | | | 570087989 | | | | 618 | | | FTD YR + 7.06% | | | 60 months | | | | 206 | |
| Total | | | | | | | | | | $ | 4,179 | | | | | | | | | $ | 915 | |
These loans were granted byBancolombia through a Finagro line. According to cash flow, it is expected that the payments will be made on the scheduled dates. Finagro is a governmental fund which seeks to increase the production and marketing activities of the agricultural and livestock sector and the Finagro line corresponds to lines of credit towards working capital and investment. It finances projects such as construction projects, purchase of machinery, purchase of animals and establishing crops. The beneficiaries are small, medium and large-scale and associate producers.
| (2) | On July 23, 2009, the Ecopetrol S.A. Company issued unsecured and unsubordinated debt bonds (notes), with the right to register them with the SEC, maturing in 2019, for an amount of US$1,500 million. The registration took place on October 6, 2009. The notes were initially issued under Rule-144A/Regulation S |
The terms of the notes are:
Coupon interest: 7.625%
Make Whole Premium: 50 basis points over U.S. Treasury securities. Interest payment dates are July 23 and January 23 of every year, starting on January 23, 2010. Maturity date: July 23, 2019.
The Company must comply with the various standard covenants, including the due and timely payment of interest and capital; no creation of collateral guarantees by Ecopetrol and its subordinates, except for authorized collateral; and the offer to purchase the bonds in the event of repurchasing for change of control, in accordance with the definition thereof in the issuance documents.
Refinería de Cartagena incurred indebtedness in the amount of $4,727,455 with foreign banks (Ex-Im Bank of the United States, HSBC USA, Bank of Tokyo Sumitomo BBVA – SACE, BBVA/HSBC/SEK, HSBCBank Plc-EKN) to finance the project to expand the new refinery. Amortization for these loans will begin in June 2014, for a period of 16 years.
| (3) | Through Resolution No. 3150 of October 20, 2010, Ecopetrol was authorized by the Ministry of Finance and Public Credit to issue, subscribe and place internal public debt bonds for an amount of up to one billion pesos, to finance Ecopetrol’s 2010 investment plan. Subsequently, through Resolution No. 2176 of November 11, 2010, the Company obtained the authorization of the Finance Superintendence of Colombia to register its internal public debt bonds with the National Register of Securities and Issuing Agencies, and to place them through public offering. |
Here are the results of the issuing and placing of the internal public debt bonds:
| Amount placed: | | 1 billion pesos |
| Issuance date: | | December 1, 2010 |
| Principal payment due: | | At maturity |
| Series A: | | Bonds denominated in pesos with a variable rate based on the consumer price index (CPI) |
| Redemption term: | | 5 years | | 7 years | | 10 years | | 30 years |
| Rate: | | CPI + 2.80% | | CPI + 3.30% | | CPI + 3.94% | | CPI + 4.90% |
| Amount (millions) | | $97,100 | | 138,700 | | 479,900 | | 284,300 |
| (16) | Accounts payable between related entities |
The following is a breakdown of accounts payable and transactions with related entities:
| | | December 31,
2012 | | | December 31,
2011 | |
| Dividends payable (1) | | $ | 3,919,102 | | | $ | 3,424 | |
| Suppliers | | | 5,149,354 | | | | 1,974,233 | |
| Hydrocarbon purchases from the National Hydrocarbons Agency – ANH | | | 208,425 | | | | 775,329 | |
| Partner advances | | | 716,379 | | | | 532,282 | |
| Deposits received from third parties | | | 247,301 | | | | 777,444 | |
| Various creditors | | | 564,250 | | | | 269,381 | |
| Deductions at source for income tax and VAT | | | 100,564 | | | | 308,258 | |
| Reimbursement of exploratory costs | | | - | | | | 42,797 | |
| Total | | $ | 10,905,375 | | | $ | 4,683,148 | |
| | | | | | | | | |
| Long term | | | | | | | | |
| Other accounts payable | | | 662,472 | | | | 518,143 | |
| Total long term | | $ | 662,472 | | | $ | 518,143 | |
| (1) | Represents the dividends payable as decreed at the Shareholders’ General Assembly held on March 22, 2012, in the amount of $12,335,009, less payments made in 2012 in the amount of $8,419,331. The amounts paid include dividends paid to shareholders who are in arrears in the payment of quotas generated by the purchasing of shares whose economic and political rights have been suspended pursuant to section 397 of the Commercial Code, and whose rights will be reinstated once the payments are up to date. |
| (17) | Taxes, contributions and duties payable |
The following is a breakdown of taxes, contributions and duties payable:
| Current: | | December 31,
2012 | | | December 31,
2011 | |
| Income tax and complementary taxes | | $ | 7,059,715 | | | $ | 7,517,178 | |
| Global tax and surtax on gasoline (1) | | | 135,266 | | | | 118,257 | |
| Sales tax payable | | | 34,204 | | | | 21,670 | |
| Equity tax | | | 579,329 | | | | 594,391 | |
| Industry and trade and other minor taxes | | | 51,434 | | | | 57,684 | |
| Total current | | $ | 7,859,948 | | | $ | 8,309,180 | |
| | | | | | | | | |
| Long term: | | | | | | | | |
| Equity tax | | | 555,054 | | | | 1,035,971 | |
| Total long term | | $ | 555,054 | | | $ | 1,035,971 | |
| Total taxes | | $ | 8,415,002 | | | $ | 9,345,151 | |
| (1) | These taxes are levied on sales and/or consumption of regular and premium gasoline and diesel, and the application of the fees set by the Ministry of Mines and Energy. The funds collected are sent to the National Treasury Directorate of the Ministry of Finance and/or territorial entities. |
Income tax
Income tax charged to expenses covers:
| | | December 31,
2012 | | | December 31,
2011 | | | December 31,
2010 | |
| Current income tax | | $ | 7,095,874 | | | $ | 7,561,634 | | | $ | 3,201,041 | |
| Deferred income tax debit | | | 35,199 | | | | (49,865 | ) | | | (100,899 | ) |
| Deferred income tax credit | | | 2,322 | | | | 443,952 | | | | 138,508 | |
| Total | | $ | 7,133,395 | | | $ | 7,955,721 | | | $ | 3,238,650 | |
The deferred tax asset is calculated based on the value of accounting provisions only deductible for tax purposes, at the time of their utilization, and the value of asset inflation adjustments originated between 2004 and 2006. The deferred tax credit is the result of: a) the value of the differences in the policy for amortizing oil investments, which are amortized for accounting purposes using the technical units of production, but amortized for tax purposes using the straight-line method; b) the difference in the valuation of fixed yield investments, which are valuated using the market value method for accounting purposes but valuated using the straight-line method for tax purposes; and c) the difference in the amortized value of goodwill which amortization is accelerated for tax purposes.
Income tax returns can be reviewed by the tax authorities for up to two years following filing. To date, for Ecopetrol S.A. the tax return for 2010 is open for review.
Currently there are differences with the National Customs and Tax Directorate – DIAN with regard to the calculation and payment of the first income tax installment for 2004. It is the DIAN’s view that the value of the surtax for said year should have been included in the basis for the calculation. Having that the total amount of the income tax was paid. In practice, the amount in question relates to the impact on interests from the time the first installment and the total amount was paid. The result of this process will not affect the Company’s cash flow because in a related matter the DIAN compensated for the amounts in question directly from balances paid in excess by the Company originated in withholding taxes.
The balance of deferred income tax assets and liabilities is as follows:
| | | December 31,
2012 | | | December 31,
2011 | |
| Deferred tax asset (Note 12): | | | | | | | | |
| Opening balance | | $ | 1,593,015 | | | $ | 1,497,076 | |
| Company acquisition | | | - | | | | 47,291 | |
| Movement for the year | | | (35,199 | ) | | | 49,864 | |
| Conversion of reporting currency | | | (593 | ) | | | (1,216 | ) |
| Closing balance | | $ | 1,557,223 | | | $ | 1,593,015 | |
| Deferred tax liability (Note 20): | | | | | | | | |
| Opening balance | | | 1,788,224 | | | | 1,333,356 | |
| Company acquisition | | | - | | | | 10,917 | |
| Movement for the year | | | 2,322 | | | | 443,951 | |
| Closing balance | | $ | 1,790,546 | | | $ | 1,788,224 | |
Transfer prices
As of 2004, income tax payers who had engaged in transactions with economic associates or related parties abroad, and/or with residents of countries considered to be tax havens, are under the obligation of determining, for income and additional tax purposes, their regular and extraordinary income, costs and deductions, and assets and liabilities, taking into account the denominated market prices and profit margins for these operations. Based on the opinion of the Company’s external consultants, no significant changes are expected for the 2012 tax year related to fulfilling the principle of full jurisdiction set out in section 260-1 of the Taxation Act, and there are no foreseen adjustments to the determination of income tax expenses for said year.
Equity tax
Pursuant to Law 1370 of 2009, the value of equity tax payable was to be registered just once, on January 1, 2011, to be paid in eight equal installments during 2011, 2012, 2013 and 2014, by deadlines established by the National Government.
Based on the above and in accordance with accounting management decrees, Ecopetrol recognized the value of equity tax payable and the corresponding charge to results for the proportional value corresponding to 2011 and 2012. The outstanding balance payable was registered as a deferred charge amortizable in subsequent years.
Tax reform
The Congress of the Republic adopted Law 1607 of December 26, 2012, which introduces significant reforms to the Colombian tax system, in particular:
| · | The income tax rate was reduced from 33% to 25% starting in 2013, and the Equality Income Tax (impuesto de renta para la equidad - CREE), was created with a rate of 9% from 2013 to 2015 and 8% starting in 2016; there are some differences between the treatment used to determine this tax and the one used to determine ordinary income tax. |
| · | Those who pay the Equality Income Tax do not have to pay the SENA and ICBF contributions for employees who earn less than 10 minimum monthly wages; this exemption will have an extensive effect on contributions to the health plan starting in January 1, 2014. |
| · | The concept of permanent establishment was defined, and is understood as fixed premises through which a foreign Company does business in Colombia. |
| · | There is a change in the way that taxable and non-taxable profits are calculated for companies that distribute profits to partners or shareholders. |
New rules on the transfer price regime have been introduced. Among other things, these rules extend the regime’s scope of application to transactions with economic associates located in duty-free zones, and to some taxpayer transactions with foreign entities linked to a permanent establishment in Colombia and abroad.
| (18) | Labor and pension obligations |
The following is a breakdown of labor and pension obligations:
| | | December 31,
2012 | | | December 31,
2011 | |
| Current: | | | | | | | | |
| Leave | | $ | 81,062 | | | $ | 71,838 | |
| Bonuses, increases and allowances | | | 100,635 | | | | 75,691 | |
| Severance | | | 46,398 | | | | 42,241 | |
| Salaries and pensions payable | | | 3,559 | | | | 21,453 | |
| Interest on severance | | | 5,180 | | | | 4,438 | |
| Other | | | 20,095 | | | | 17,661 | |
| Total Current | | $ | 256,929 | | | $ | 233,322 | |
| | | | | | | | | |
| Long term: | | | | | | | | |
| Actuarial liability for health and education (1) | | | 3,992,829 | | | | 3,109,480 | |
| Retirement pensions, joint ventures | | | 71,052 | | | | 70,789 | |
| Other | | | 6,863 | | | | 9,960 | |
| Total long term | | $ | 4,070,744 | | | $ | 3,190,229 | |
| Total | | $ | 4,327,673 | | | $ | 3,423,551 | |
| (1) | The actuarial calculations for health and education for Ecopetrol S.A. were prepared by applying the mortality tables updated in 2010 and using a technical interest rate of 4.8%. The value of future health and education payments was estimated by applying an increase of 4.755%, which corresponds to the average inflation rate registered by the DANE during the last three years, to the year of calculation, plus an additional 1.5%, taking into account the Company’s real growth. As a result of the 2010 change in the accounting principle for amortization, as at December 31, 2012, the portion to be amortized is 11%, which is equivalent to $454,973. |
The amortized actuarial liability for health is indicated below:
| Concept | | December 31,
2012 | | | December 31,
2011 | |
| Actuarial calculation of health obligations | | $ | 4,062,323 | | | | 3,310,894 | |
| Minus – actuarial calculation pending amortization | | | (454,973 | ) | | | (555,894 | ) |
| Amortized actuarial liability | | $ | 3,607,350 | | | | 2,755,000 | |
The difference in amortized actuarial liability is described below:
| | | December 31,
2012 | | | December 31,
2011 | | | Variation | |
| Health: | | | | | | | | | | | | |
| Active personnel | | $ | 401,883 | | | $ | 229,309 | | | $ | 172,574 | |
| Retirees | | | 3,205,467 | | | | 2,525,691 | | | | 679,776 | |
| Education: | | | | | | | | | | | | |
| Active personnel | | | 37,736 | | | | 27,996 | | | | 9,740 | |
| Retirees | | | 347,743 | | | | 326,484 | | | | 21,259 | |
| Total: | | $ | 3,992,829 | | | $ | 3,109,480 | | | $ | 883,349 | |
| (19) | Estimated liabilities and Provision |
The following is a breakdown of estimated liabilities and provision:
| | | December 31,
2012 | | | December 31,
2011 | |
| Current: | | | | | | | | |
| Provision for legal proceedings (1) (see Note 31) | | $ | 783,692 | | | $ | 688,191 | |
| Provision for pension obligations | | | 500 | | | | 500 | |
| Provision for abandonment, facility dismantling and environmental recovery costs (2) | | | 20,667 | | | | 120,128 | |
| Other Provision (3) | | | 974,510 | | | | 589,181 | |
| Provision for contingencies (4) | | | 92,966 | | | | 297,193 | |
| Total current | | $ | 1,872,335 | | | $ | 1,695,193 | |
| Long term: | | | | | | | | |
| Provision for abandonment, facility dismantling and environmental recovery costs (2) | | | 3,885,726 | | | | 3,634,229 | |
| Provision for community members (5) | | | 424,500 | | | | 418,318 | |
| Provision for legal proceedings (1) | | | 9,202 | | | | 11,079 | |
| Other Provision | | | 56,576 | | | | 21,203 | |
| Total long term | | $ | 4,376,004 | | | $ | 4,084,829 | |
| Total | | $ | 6,248,339 | | | $ | 5,780,022 | |
| (1) | The following shows the movement in the provision for legal proceedings at December 2012: |
| | | Number of
proceedings | | | Provision
amounts | |
| December 31, 2010 opening balance | | $ | 822 | | | $ | 663,932 | |
| Additions (new provision) | | | 271 | | | | 42,859 | |
| Adjustment to existing provision | | | - | | | | 60,067 | |
| Recovery from transfer of proceedings | | | 71 | | | | 227,542 | |
| Proceedings ended | | | (273 | ) | | | (229,644 | ) |
| Proceedings transferred | | | (107 | ) | | | (76,565 | ) |
| December 31, 2011 closing balance | | $ | 784 | | | $ | 688,191 | |
| Additions (new provision) | | | 313 | | | | 412,177 | |
| Adjustment to existing provision | | | (410 | ) | | | (310,150 | ) |
| Recovery | | | (5 | ) | | | (6,526 | ) |
| December 31, 2012 closing balance | | $ | 682 | | | $ | 783,692 | |
| (2) | The following shows the total movements in the provision for abandonment, facility dismantling and environmental recovery costs: |
| | | December 31,
2012 | | | December 31,
2011 | |
| Opening balance | | $ | 3,754,357 | | | $ | 3,134,387 | |
| Additions | | | 342,257 | | | | 619,505 | |
| Withdrawals and use | | | (174,359 | ) | | | - | |
| Conversion into the reporting currency | | | (15,862 | ) | | | 465 | |
| Closing balance | | $ | 3,906,393 | | | $ | 3,754,357 | |
Most of these abandonment allowances were caused by Ecopetrol S.A., in the amount of $3,804,199.
| (3) | Mainly includes allowances created for the purpose of anticipating potential nature-related and other events that could affect transportation facilities and have an impact on the regions where there is a presence. Starting January 2012, three large-scale projects were created: the Dosquebradas Project, the Integrity Program and the Contingency Program. Additionally, includes allowances in subsidiaries mainly such as: Mainly Refinería de Cartagena, in the amount of $397,378, for goods and services; Equión in the amount of $116,313 for partnership agreements; Oleoducto Bicentenario in the amount of $47,415; Ocensa in the amount of $48,399; Hocol in the amount of $43,384; Ecopetrol America Inc. in the amount of $16,885 and Propilco in the amount of $4,411. |
| (4) | This is represented mainly by: (i) $26,029 for potential PDVSA claims for payment of work to clean up and decontaminate Lake Maracaibo in Venezuela, and $66,380 for situations with environmental implications, and (ii) $152 corresponding to the success-based fees for the representative in the litigation against Ecopetrol S.A. initiated by Industrias Crizasa. |
| (5) | Includes the interim relief ordered by the Council of State in its decree of June 24, 1994 in the invalidity action brought by the Ministry of Mines and Energy againstComuneros (community members) of Santiago de las Atalayas and Pueblo Viejo de Cusiana, corresponding to the attachment and seizure of the payments to be made by Ecopetrol for royalties, based on Royalty contracts No. 15, 15A, 16 and 16A, declared null and void by the Council of State in its ruling of September 13, 1999, in which it was ordered that said interim relief should be cancelled and that the attached and seized amounts should be handed over to the State – the Ministry of Mines. Ecopetrol has capacity as receiver. Of said amount, $90,752 corresponds to the value initially recognized by Ecopetrol, as well as the valuation of the fund containing the resources; $333,748 corresponds to generated interest. In a ruling on December 12, 2012, notified by edict on January 21, 2013, the Council of State declared that the special plea for reconsideration filed by the Comuneros was dismissed. Said special plea for reconsideration was filed on December 13, 1999 by the Comuneros. |
| (20) | Other long-term liabilities |
The following is a breakdown of other long-term liabilities:
| | | December 31,
2012 | | | December 31,
2011 | |
| Deferred income tax credit | | $ | 1,790,546 | | | $ | 1,788,224 | |
| Advances received from Ecogas for BOMTs | | | 369,517 | | | | 676,628 | |
| Credit for deferred monetary correction | | | 493 | | | | 138,064 | |
| Other liabilities | | | 111,288 | | | | 181,397 | |
| Total | | $ | 2,271,844 | | | $ | 2,784,313 | |
| (21) | Non-controlling interest |
The following is a breakdown of non-controlling interest equity:
| | | December 31,
2012 | | | December 31,
2011 | |
| Bioenergy | | $ | 12,474 | | | $ | 11,219 | |
| ODL Finance S.A. | | | 304,584 | | | | 237,214 | |
| Ocensa | | | 866,774 | | | | 508,389 | |
| Oleoducto de Colombia | | | 84,632 | | | | 90,473 | |
| Oleoducto Bicentenario | | | 313,026 | | | | 318,147 | |
| Equión | | | 1,020,677 | | | | 1,087,189 | |
| Total | | $ | 2,602,167 | | | $ | 2,252,631 | |
Subscribed and paid capital
Ecopetrol’s authorized capital is $15,000,000 divided into 60,000,000,000 ordinary nominative shares with a nominal value of $250 each, of which 41,116,698,456 shares have been subscribed, representing 11.51% in non-controlling interest and 88.49% held by state entity shareholders. The value of the reserve shares amounts to $4,720,825 composed of 18,883,301,544 shares.
Additional paid-in capital
As at December 31, 2012, mainly corresponds to: (i) the surplus with respect to its nominal value derived from the sale of shares upon capitalization in 2007, in the amount of $4,700,883, (ii) $31,225, the value generated by the process of placing the shares on the secondary market, arising from the calling of guarantees from debtors in arrears, according to the stipulations of Article 397 of the Commercial Code, and (iii) to the surplus over nominal value arising from the sale of shares awarded in the second round, which took place in September 2011, in the amount of $2,222,441.
| | | December 31,
2012 | | | December 31,
2011 | |
| Additional paid-in capital | | $ | 6,954,549 | | | $ | 6,944,159 | |
| Additional paid-in capital receivable | | | (302 | ) | | | (156,015 | ) |
| Total | | $ | 6,954,247 | | | $ | 6,788,144 | |
Effect of applying the Public Accounting Regime (RCP)
Corresponds to the transfer of negative balances derived from devaluations of property, plant and equipment, as established by the Public Accounting Regime (RCP) from 2008.
This heading also shows the responsibilities pending decision, arising from the proceedings on loss of materials, through enforcement of the process established in the above-mentioned standard.
Equity reserves
The legal reserve is made up of 10% of net income and can be used as compensation for losses or for distribution in the event of liquidation of the Company.
On March 22, 2012, the results for the 2011 period were considered by the General Assembly of Shareholders, at which it was decided that the legal reserve should be increased by $187,958 for a total of $5,139,587.
Similarly, increases were made in the reserves for investment programs, in the amount of $2,581,994, and in the reserves to fulfill Regulatory.
Decree 2336 of 1995 (valuation at market prices) in the amount of $343,372.
The following is a breakdown of the reserves:
| | | December 31,
2012 | | | December 31,
2011 | |
| Legal | | $ | 5,139,587 | | | $ | 4,951,629 | |
| Occasional for investment programs | | | 6,713,082 | | | | 4,131,088 | |
| Regulatory Decree 2336 of 1995 | | | 440,067 | | | | 96,695 | |
| Total | | $ | 12,292,736 | | | $ | 9,179,412 | |
Incorporated institutional equity
Corresponds to the product of commercial activity linked mainly to the following association contracts: Nare, Matambo, Garcero, Corocora, Estero, Caracara, for the Sardinas 6, Remache Norte 3, Abejas 3, Jaguar T5 and T6 wells, Orocué, the Guarilaque 7 well; Campo Rico for the Candalay, Jordán 5, Remache Norte 2 and 5, Abejas 2 and Vigia wells, and the incorporation of the Cocorná materials warehouse.
The following is a breakdown of memorandum accounts:
| | | December 31,
2012 | | | December 31,
2011 | |
| Debtor: | | | | | | | | |
| Exploitation rights – Decree 727 of 2007 (1) | | $ | 65,885,263 | | | $ | 67,496,739 | |
| Other contingent rights and debtor accounts (2) | | | 31,953,744 | | | | 21,023,083 | |
| Costs and expenses (deductible and non-deductible) | | | 22,585,481 | | | | 19,534,605 | |
| Autonomous pension trust (3) | | | 11,866,064 | | | | 11,303,177 | |
| Securities given in custody and guarantee | | | 5,544,415 | | | | 5,314,653 | |
| Implementation of investment projects | | | 129,455 | | | | 751,827 | |
| Legal proceedings | | | 650,918 | | | | 584,810 | |
| Tax differences | | | 6,356,087 | | | | 4,212,978 | |
| Total | | $ | 144,971,427 | | | $ | 130,221,872 | |
| | | December 31,
2012 | | | December 31,
2011 | |
| Creditor: | | | | | | | | |
| Legal proceedings | | $ | 33,611,100 | | | $ | 34,791,375 | |
| Goods received in custody (4) | | | 27,329,613 | | | | 28,326,369 | |
| Contractual guarantees (5) | | | 14,327,340 | | | | 7,648,023 | |
| Autonomous pension trust (7) | | | 11,730,386 | | | | 11,544,801 | |
| Non-tax liabilities | | | 10,170,665 | | | | 9,890,185 | |
| Other contingent obligations (6) | | | 9,183,073 | | | | 10,939,385 | |
| Potential obligations – pension liabilities (7) | | | 809,596 | | | | 1,222,955 | |
| Non-taxed income | | | 5,821,444 | | | | 4,818,819 | |
| Mandate agreements (8) | | | 1,416,574 | | | | 1,400,596 | |
| Administration funds – Decrees 1939 of 2001, and 2652 of 2002 | | | 973,565 | | | | 973,151 | |
| Future BOMT payments | | | 108,769 | | | | 228,941 | |
| Total | | $ | 115,482,125 | | | $ | 111,784,600 | |
| | | $ | 260,453,552 | | | $ | 242,006,472 | |
| (1) | Reserves evaluated as at December 31, 2012 based on the volumes in the audited reserves study and applying the average price set by SEC-approved regulations. |
On March 7, 2007, Decree 727, which replaced Decree 2625 of 2000, was issued featuring the regulations for valuating reserves and accounting for the Nation’s hydrocarbon reserves in the Company’s financial statements. The decree also establishes that the value of the hydrocarbon exploration or production rights it owns must be recorded. Said value is recorded under memorandum accounts, in accordance with the opinion provided by the National Accounts Office (CGN); however, the memorandum accounts are not part of the Company’s balance sheet.
| (2) | The balance corresponds mainly to: (i) the balance of tax memorandum accounts in the amount of $22,590,844, which reflect the differences between the values of both equity and result accounts, taken from the 2011 tax return, and the accounting balances. The differences are derived from concepts such as valuations, allowances that are not accepted for tax purposes, the difference in the amortization method for oil investments, which is done using the units of production method for accounting purposes, and using the straight-line method for tax purposes, and the effect of the adjustment for inflation, (ii) securities in custody in the amount of $2,253,560, and (iii) other contingent rights, mainly for recognition of the right linked to high prices for the Quifa contract in the amount of $262,166. |
| (3) | Reflects the contingent right (debtor account) on resources put in the autonomous pension trust, to pay transferred pension liabilities, in order to control the existence of liquid resources in the stand-alone equity fund. The value transferred on December 31, 2012, which is $11,866,064 ($10,092,528 on the date of transfer, December 31, 2008), corresponds to pension liability for monthly pension payments, shares and pension bonds; the amounts tied to health and education are within Ecopetrol’s pension liability. The transferred resources, and their yield, cannot change destination or be returned to the Company until all pension obligations have been fulfilled. |
Here is a breakdown of autonomous pension trust funds:
| | | December 31,
2012 | | | December 31,
2011 | |
| Consorcio Ecopensiones 2011 | | $ | 2,855,165 | | | $ | 2,716,510 | |
| Porvenir S.A. | | | 2,609,500 | | | | 2,493,719 | |
| Consorcio Pensiones Ecopetrol 2011 | | | 2,151,960 | | | | 2,052,000 | |
| Unión temporal Skandia-HSBC | | | 2,142,634 | | | | 2,032,891 | |
| Consorcio Bogotá-Colpatria-Occidente | | | 2,106,805 | | | | 2,008,057 | |
| Total | | $ | 11,866,064 | | | $ | 11,303,177 | |
| (4) | Made up mainly of the value of royalties corresponding to the balance of Ecopetrol reserves, in the amount of $27,222,901, calculated according to SEC-approved regulations. This heading also includes the inventories of products sold and materials, pending delivery to clients, in the amount of $37,203, as well as goods received in concession custody: Coveñas, $41,660; Pozos Colorados, $21,058; and Tumaco, $6,083. |
| (5) | Mainly for contracts pending execution, in pesos, dollars and Euros, updated to the official exchange rate as at December 31, 2012 in the amount of $14,327,340; stand-by letters of credit, which guarantee contracts signed by Ecopetrol in the amount of $327,705; and documentary letters in the amount of $170. |
| (6) | Includes, mainly, the closed pledge of $3,190,038 on the shares that Ecopetrol S.A. holds directly or indirectly in Hocol Petroleum Limited, Offshore International Group and Polipropileno del Caribe S.A., with 120% coverage of the credit amount granted by the national bank. (see note 15 (1)). |
Equión has two lending-rate stand-by letters of credit, which total US$4,583,280, and seek to guarantee, to the ANH, the fulfillment and execution of contracts No. 32 and 33 of the Ronda Caribe Sector, for the RC-4 and RC-5 Blocks.
Issuing entity: Helm Bank S.A.
| Card N. | | Beneficiary | | Purpose | | Start date | | End date | | USD Value | | | COP Value | |
| T000126 | | Agencia Nacional de Hidrocarburos | | Guarantee the fulfillment and execution of Contract No. 33 of the Ronda Caribe Sector, Block RC-5 | | 28-nov-10 | | 28-feb-14 | | $ | (2,352,480 | ) | | $ | (4,159,725,710 | ) |
| T000127 | | Agencia Nacional de Hidrocarburos | | Guarantee the fulfillment and Execution of Contract No. 32 of the Ronda Caribe Sector, Block RC-4 | | 28-nov-10 | | 28-feb-14 | | $ | (2,230,800 | ) | | $ | (3,944,567,484 | ) |
The risk that the guarantees will be disbursed remains low.
| (7) | Made up of the value of the actuarial calculation of monthly pension payments, shares and bonds as at December 31, 2012, plus the percentage of amortization of the 2010 reserve that arose from the change in accounting principle for amortization. At the end of 2012, the amortizable reserve was 7%, equivalent to $809,596. |
The balance of amortized actuarial liability is as follows:
| Concept | | December 31,
2012 | | | December 31,
2011 | |
| Actuarial calculation of the obligation for monthly pension payments and pension bonds | | $ | 12,539,982 | | | $ | 12,767,756 | |
| Minus – Actuarial calculation pending amortization | | | (809,596 | ) | | | (1,222,955 | ) |
| Amortized actuarial liability | | $ | 11,730,386 | | | $ | 11,544,801 | |
The balance of stand-alone pension funds as well as the value of the actuarial reserve and the amortized value of the pension liability for monthly payments are included in the memorandum accounts.
The actuarial calculation was carried out using a technical interest rate of 4%. The increase in salaries, pensions in cash and pensions in kind was calculated using the average inflation rate by theDepartamento Administrativo Nacional de Estadística (DANE – National Administrative Department of Statistics), for the three years immediately preceding the calculation year.
As at December 31, 2012, the number of people covered by the actuarial pension calculation was 13,210.
| (8) | Includes the value of assets received in custody from Refinería de Cartagena S.A. in fulfillment of obligations acquired under the mandate contract signed between Ecopetrol and that Company to operate the refinery, namely: product inventories in the amount of $429,108 (2011, $362,251), materials inventory in the amount of $30,269 (2011, $34,253), and property, plant and equipment in the amount of $957,197 (2011, $1,004,092). |
The following is a breakdown of revenues:
| | | December 31,
2012 | | | December 31,
2011 | | | December 31,
2010 | |
| National sales: | | | | | | | | | | | | |
| Mid-distillates | | $ | 11,132,983 | | | $ | 9,742,346 | | | $ | 7,099,176 | |
| Gasoline | | | 5,697,178 | | | | 5,206,873 | | | | 4,302,282 | |
| Services | | | 2,077,858 | | | | 1,762,060 | | | | 1,947,829 | |
| Natural gas | | | 1,108,164 | | | | 1,212,310 | | | | 1,159,245 | |
| Other products | | | 2,100,780 | | | | 2,019,225 | | | | 1,885,361 | |
| L.P.G. and propane | | | 492,440 | | | | 727,111 | | | | 627,361 | |
| Asphalts | | | 369,768 | | | | 402,923 | | | | 326,737 | |
| Crude (1) | | | 572,969 | | | | 230,459 | | | | 117,186 | |
| | | $ | 23,552,140 | | | $ | 21,303,307 | | | $ | 17,465,177 | |
| Recognition of price differential (2) | | | 809,773 | | | | 2,251,322 | | | | 740,682 | |
| | | $ | 24,361,913 | | | $ | 23,554,629 | | | $ | 18,205,859 | |
| Foreign sales: | | | | | | | | | | | | |
| Crude (1) | | $ | 35,884,535 | | | $ | 33,418,191 | | | $ | 18,073,357 | |
| Fuel oil | | | 4,283,814 | | | | 4,447,657 | | | | 2,377,266 | |
| Natural gas (1) | | | 563,412 | | | | 508,066 | | | | 146,063 | |
| Gasoline and turbo fuel | | | 1,182,367 | | | | 1,663,222 | | | | 698,068 | |
| Propylene | | | - | | | | - | | | | 109,271 | |
| Other products | | | 1,329,983 | | | | 871,105 | | | | 831,129 | |
| Diesel | | | 1,223,159 | | | | 1,482,625 | | | | 1,638,044 | |
| | | $ | 44,467,270 | | | $ | 42,390,866 | | | $ | 23,873,198 | |
| Premium income net | | | 22,819 | | | | 22,019 | | | | 10,688 | |
| | | $ | 44,490,089 | | | $ | 42,412,885 | | | $ | 23,883,886 | |
| | | $ | 68,852,002 | | | $ | 65,967,514 | | | $ | 42,089,745 | |
| (1) | Corresponds to crude oil sales by Ecopetrol in the amount of $30,758,736, Hocol in the amount of $3,738,837, Equión in the amount of $1,862,183, and Ecopetrol America Inc. in the amount of $97,748. |
| (2) | Corresponds to the application of Decree 4839 of December 2008, which defined the procedure for price differentials (value generated by the difference between parity price and regulated price, which can be positive or negative). |
The following is a breakdown of the cost of sales:
| | December 31,
2012 | | | December 31,
2011 | | | December 31,
2010 | |
| Variable Costs: | | | | | | | | | | | |
| Hydrocarbon purchases – ANH (1) | $ | 8,452,336 | | | $ | 8,048,981 | | | $ | 5,335,946 | |
| Imported products (2) | | 9,447,041 | | | | 8,840,450 | | | | 5,680,601 | |
| Purchases of crude in association and concession | | 7,207,707 | | | | 6,701,500 | | | | 4,548,193 | |
| Amortization and depletion | | 3,000,758 | | | | 2,642,132 | | | | 2,280,355 | |
| Hydrocarbon transportation services | | 1,152,081 | | | | 938,036 | | | | 542,010 | |
| Purchases of other products and gas | | 618,715 | | | | 673,545 | | | | 316,192 | |
| Electric power | | 306,942 | | | | 257,110 | | | | 205,102 | |
| Processing materials | | 276,550 | | | | 263,329 | | | | 180,676 | |
| Volume adjustments and other allocations | | (109,850 | ) | | | (360,165 | ) | | | (460,938 | ) |
| Unit-of-production depreciation | | 105,805 | | | | 125,482 | | | | 55,473 | |
| | $ | 30,458,085 | | | $ | 28,130,400 | | | $ | 18,683,610 | |
| Fixed Costs: | | | | | | | | | | | |
| Services contracted in associations | | 2,037,205 | | | | 1,791,681 | | | | 1,469,586 | |
| Maintenance | | 1,923,736 | | | | 1,570,912 | | | | 1,143,724 | |
| Labor costs | | 1,095,479 | | | | 1,001,102 | | | | 940,111 | |
| Depreciation | | 1,886,620 | | | | 1,809,546 | | | | 1,548,797 | |
| Contracted services | | 1,088,597 | | | | 872,565 | | | | 857,431 | |
| Non-capitalized project costs | | 561,416 | | | | 461,757 | | | | 421,239 | |
| Operating materials and supplies | | 372,165 | | | | 278,740 | | | | 345,326 | |
| Taxes and contributions | | 401,576 | | | | 387,788 | | | | 254,489 | |
| Amortization of deferred charges, intangibles and insurance | | 171,902 | | | | 73,070 | | | | 72,680 | |
| General costs | | 411,641 | | | | 258,283 | | | | 205,021 | |
| Amortization of the actuarial calculation for health and education | | 127,086 | | | | 68,740 | | | | 18,442 | |
| | $ | 10,077,423 | | | $ | 8, 574,184 | | | $ | 7,276,846 | |
| | $ | 40,535,508 | | | $ | 36,704,584 | | | $ | 25,960,456 | |
| (1) | Corresponds to Ecopetrol’s crude oil and gas purchases from the ANH derived from national production, both by the Company in direct operations and third parties. |
| (2) | Corresponds mainly to Ecopetrol in the amount of $6,863,138 for the importation of very low-sulphur diesel, to improve the quality of local products and diluting agents to help transport heavy crude. It also includes purchases from Reficar in the amount of $1,903,443 (imported Acem, Ron 95 Gasoline, Ron 92 Gasoline and Diesel), Propilco in the amount of $647,593 and Comai in the amount of $32,867 (propylene, titanium dioxide and polyethylene). |
The following is a breakdown of the operating expenses:
| | | December 31,
2012 | | | December 31,
2011 | | | December 31,
2010 | |
| Administration: | | | | | | | | | | | | |
| Amortizations (1) | | $ | 313,344 | | | $ | 283,304 | | | $ | 189,261 | |
| Labor expenses | | | 321,643 | | | | 269,828 | | | | 213,739 | |
| General expenses | | | 172,735 | | | | 203,431 | | | | 149,772 | |
| Depreciations | | | 35,233 | | | | 24,979 | | | | 19,739 | |
| Rentals and leases | | | 12,441 | | | | 10,878 | | | | 7,986 | |
| Amortization of the actuarial calculation for health and education | | | 8,896 | | | | 4,715 | | | | 1,052 | |
| Maintenance | | | 5,756 | | | | 5,294 | | | | 2,611 | |
| Taxes | | | 4,932 | | | | 216,488 | | | | 19,363 | |
| | | $ | 874,980 | | | $ | 1,018,917 | | | $ | 603,523 | |
| Operation and projects: | | | | | | | | | | | | |
| Projects expenses (2) | | $ | 237,280 | | | $ | 293,478 | | | $ | 321,580 | |
| Exploration expenses (3) | | | 1,419,530 | | | | 959,938 | | | | 1,465,537 | |
| General expenses (4) | | | 678,022 | | | | 570,321 | | | | 300,837 | |
| Labor expenses | | | 277,430 | | | | 190,166 | | | | 69,490 | |
| Taxes | | | 232,622 | | | | 192,064 | | | | 155,662 | |
| Transportation via gas pipelines | | | 136,573 | | | | 122,780 | | | | 125,376 | |
| Maintenance | | | 19,018 | | | | 5,488 | | | | 1,786 | |
| Gas supply default | | | 764 | | | | 2,511 | | | | 85,222 | |
| Operation allowances (5) | | | 233,979 | | | | 33,229 | | | | 252,828 | |
| Amortizations | | | 6 | | | | 1,058 | | | | - | |
| | | $ | 3,235,224 | | | $ | 2,371,033 | | | $ | 2,778,318 | |
| | | $ | 4,110,204 | | | $ | 3,389,950 | | | $ | 3,381,841 | |
| (1) | During the 2012 period, at Ecopetrol S.A. the amount of $274,558 was amortized (corresponding mainly to the goodwill of the following companies: Propilco, Ocensa, Hocol, Offshore and Equión, in the amount of $274,558), Reficar in the amount of $9,156 corresponding to mine and oil policies and legal stability, and Equión in the amount of $9,197 for software licenses. |
| (2) | The decrease compared to the previous year is mainly due to the reclassification of the cost at Ecopetrol of the man hours for technical management in 2012 in the amount of $182,655, offset by the increase in projects, notably the development of petrochemical potential, the modernization of Barranca and the environmental management plan. |
| (3) | The amount of $591,412 corresponds to Ecopetrol S.A., mainly for seismic studies in the amount of $297,966, and unsuccessful explorations in the amount of $188,875, the most significant of which were: estimates in the amount of $36,800; (dry well estimate for Tarabita-1 in the amount of $12,505, Tingua-1 in the amount of $6,665, Trasgo-2 in the amount of $5,365, Embrujo-1 in the amount of $3,310, CSE8 in the amount of $2,727), environmental recovery and non-capitalized items in the amount of $83,885. It also includes exploratory projects by the companies in the group, as follows: Ecopetrol Oleo é Gas do Brasil in the amount of $242,557, of which $63,428 was for seismic studies and $179,129 for dry wells (Itauna, Canario and Sabia wells); Hocol in the amount of $239,338, of which $127,133 was for seismic studies, $92,826 for dry wells (Granate and Santa Fe 1 wells), and $19,379 for other exploratory expenses; Ecopetrol America Inc. in the amount of $217,214, of which $73,906 was for seismic studies, and $143,308 for dry wells (Candy bars wells 1 and 2); Equión in the amount of $121,493, of which $6,302 was for seismic studies and $115,190 for dry wells (Mapale well); and Ecopetrol Perú in the amount of $8,739 for other exploratory expenses. |
| (4) | Corresponds to Ecopetrol in the amount of $590,876, mainly for agreements with the National Police in the amount of $225,019, freight expenses and customs operation for foreign sales in the amount of $111,532, other agreements in the amount of $101,751, and insurance in the amount of $28,298. It also includes Propilco in the amount of $69,199 (transportation of goods, commissions and legal expenses), Refinería de Cartagena in the amount of $20,622 (freight, LPG regulation and operation and marketing agreement with Ecopetrol), Comai in the amount of $2,979 (transportation, freight and handling services), and Hocol in the amount of $1,143 (fees for crude oil marketing, paid to Ecopetrol S.A.). |
| (5) | The detail of operation provisions for the year ended at December 31 of 2012, 2011 and 2010 respectively is as follows: |
| Recovery of operation provisions | | 2012 | | | 2011 | | | 2010 | |
| Inventories | | $ | 11,966 | | | $ | 3,263 | | | $ | 29,481 | |
| Property, plant and equipment | | | 171,102 | | | | 46,019 | | | | 55,717 | |
| Portfolio recovery | | | 225 | | | | 365 | | | | 68,772 | |
| | | $ | 183,293 | | | $ | 49,647 | | | $ | 153,970 | |
| | | | | | | | | | | | | |
| Operation provisions | | | | | | | | | | | | |
| Inventories | | $ | (14,459 | ) | | $ | (8,505 | ) | | $ | (9,743 | ) |
| Property, plant and equipment | | | (315,627 | ) | | | (41,948 | ) | | | (227,266 | ) |
| Portfolio | | | (87,186 | ) | | | (32,423 | ) | | | (169,789 | ) |
| | | $ | (417,272 | ) | | $ | (82,876 | ) | | $ | (406,798 | ) |
| | | $ | (233,979 | ) | | $ | (33,229 | ) | | $ | (252,828 | ) |
| (27) | Financial expenses, net |
The following is a breakdown of the net financial expenses:
| | | December 31,
2012 | | | December 31,
2011 | | | December 31,
2010 | |
| Income: | | | | | | | | | | | | |
| Foreign exchange gain (1) | | $ | 4,087,029 | | | $ | 7,783,658 | | | $ | 4,265,882 | |
| Equity method earnings | | | 125,474 | | | | 141,647 | | | | 83,574 | |
| Dividends in cash | | | 32,541 | | | | 10,135 | | | | 30,941 | |
| Yields and interest | | | 383,795 | | | | 193,087 | | | | 156,336 | |
| Hedging transactions (2) | | | 20,906 | | | | 88,317 | | | | 80,445 | |
| Other | | | 5,647 | | | | 5,144 | | | | 9,202 | |
| Investment portfolio valuation earnings | | | 178,076 | | | | 100,373 | | | | 80,111 | |
| | | $ | 4,833,468 | | | $ | 8,322,361 | | | $ | 4,706,491 | |
| Expenses: | | | | | | | | | | | | |
| Foreign exchange loss (1) | | | 4,396,159 | | | | 7,819,025 | | | | 4,412,224 | |
| Hedging transactions (2) | | | 4,253 | | | | 890,008 | | | | 99,139 | |
| Interest | | | 581,597 | | | | 415,222 | | | | 145,910 | |
| Other minor expenses | | | 19,092 | | | | 57,621 | | | | 10,101 | |
| Equity method loss | | | 197 | | | | 372 | | | | 802 | |
| Administration and issuance of securities | | | 59 | | | | 44,415 | | | | 526 | |
| | | $ | 5,001,357 | | | $ | 9,226,663 | | | $ | 4,668,702 | |
| Net | | $ | (167,889 | ) | | $ | (904,302 | ) | | $ | 37,789 | |
| (1) | The accumulated loss due to the exchange rate difference as of December 2012 was $309,130, mainly due to the appreciation of the peso. The accumulated variance as of December 2012 was (8.98)%. As of December 2011, there were earnings of $35,367 as a result of accumulated devaluation of 1.50%, which represents a $344,497 greater loss compared to December 2012. |
| (2) | The net results of hedging transactions as at December 31, 2012 correspond to those derived from the exchange rate in the amount of $681 for Ecopetrol and $15,972 for Hocol. |
The following is a breakdown of pension expenses:
| | | December 31,
2012 | | | December 31,
2011 | | | December 31,
2010 | |
| Amortization of actuarial calculation and pensions (1) | | $ | 688,693 | | | | 443,890 | | | | 146,717 | |
| Health care services | | | 204,269 | | | | 205,928 | | | | 171,636 | |
| Education services | | | 55,493 | | | | 56,480 | | | | 59,273 | |
| | | $ | 948,455 | | | | 706,298 | | | | 377,626 | |
| (1) | At Ecopetrol in December 2012, the actuarial calculation study was updated. The actuarial calculations for health care and education were done using the mortality tables updated in 2010, and using the technical interest rate of 4.8%. To estimate the value of future benefits, an increase of 4.755% was used, reflecting the average interest rate registered by the DANE in the three years immediately preceding the calculation year, plus an additional percentage of 1.5% taking into account the Company’s real growth. |
Corresponds to the net amortization of the deferred monetary correction in the amounts of $97,663, $21,836 and $22,030 for 2012, 2011 and 2010 respectively.
The following is a breakdown of other expenses net:
| | | December 31,
2012 | | | December 31,
2011 | | | December 31,
2010 | |
| Other income: | | | | | | | | | | | | |
| Provision recovery (1) | | $ | 531,465 | | | $ | 616,462 | | | $ | 211,545 | |
| Other minor income | | | 213,277 | | | | 172,013 | | | | 65,252 | |
| Deferred BOMT income | | | 17,408 | | | | - | | | | - | |
| Recovery of expenses | | | 61,443 | | | | 127,580 | | | | 99,900 | |
| Recovery of exploration expenses | | | 23,722 | | | | 25,543 | | | | 40,336 | |
| Compensation received | | | 19,512 | | | | 10,045 | | | | 9,253 | |
| Income from services | | | 18,551 | | | | 6,720 | | | | 28,779 | |
| Earnings from the sale of materials and property, plant and equipment | | | 5,052 | | | | 9,443 | | | | 18,837 | |
| Recovery of services to associates | | | 4,743 | | | | 219,952 | | | | 15,535 | |
| Income from ceded rights | | | 725 | | | | 30,396 | | | | 19,222 | |
| Income from discovered non-developed fields | | | | | | | 855 | | | | 28,097 | |
| | | $ | 895,898 | | | $ | 1,219,009 | | | $ | 536,756 | |
| Other expenses: | | | | | | | | | | | | |
| Taxes | | | 724,785 | | | | 641,947 | | | | 343,128 | |
| Provision (2) | | | 616,115 | | | | 724,370 | | | | 145,722 | |
| Other minor expenses | | | 231,293 | | | | 275,367 | | | | 413,276 | |
| Gas pipeline availability under BOMT contracts | | | - | | | | 12,026 | | | | 63,947 | |
| Fuel losses | | | 83,039 | | | | 78,816 | | | | 140,153 | |
| Audit quota | | | 55,786 | | | | 49,884 | | | | 49,435 | |
| Contributions and donations | | | 39,293 | | | | 27,940 | | | | 23,906 | |
| Loss from decrease in fixed assets | | | 1,495 | | | | 51,143 | | | | 6,295 | |
| Loss from decrease in goodwill | | | - | | | | 300 | | | | 287,918 | |
| | | $ | 1,751,806 | | | $ | 1,861,793 | | | $ | 1,473,780 | |
| | | $ | (855,908 | ) | | $ | (642,784 | ) | | $ | (937,024 | ) |
| (1) | The breakdown of provision recovery as at December 31 is as follows: |
| | | December 31,
2012 | | | December 31,
2011 | | | December 31,
2010 | |
| Legal proceedings | | $ | 259,450 | | | $ | 229,345 | | | $ | 80,237 | |
| Other recovery | | | 272,015 | | | | 387,117 | | | | 131,208 | |
| | | $ | 531,465 | | | $ | 616,462 | | | $ | 211,445 | |
| (2) | The breakdown of provision as at December 31 is as follows: |
| | | December 31,
2012 | | | December 31,
2011 | | | December 31,
2010 | |
| Legal proceedings | | $ | 414,322 | | | $ | 330,468 | | | $ | 125,888 | |
| Potential obligations | | | 56,928 | | | | 29,883 | | | | - | |
| Pension transfer (*) | | | - | | | | 241,624 | | | | - | |
| Other provisions | | | 144,865 | | | | 122,395 | | | | 19,834 | |
| | | $ | 616,115 | | | $ | 724,370 | | | $ | 145,722 | |
| (*) | Corresponds to the effect occurred only in 2011 of comparing the yield of autonomous trusts and Ecopetrol’s transferred obligation, which has been greater than the generated yield. |
Ecopetrol S.A.
The following is a summary of the most significant legal proceedings with claims above $10,000 million, for which allowances have been recognized, in accordance with the evaluations of the Company’s internal and external advisors:
| Proceeding | | Suit | | Allowance
amount
December 31,
2012 | | | Allowance
amount
December 31,
2011 | |
| Garcero association contract | | Class action suit against Ecopetrol S.A., the Nation, the Ministry of Mines and others, on the extension of the Garcero association contract. | | $ | 155,184 | | | $ | 204,189 | |
| Municipalities of Aguazul and Tauramena | | Class action suit. Contributions to the solidarity and electric-power-generation income redistribution fund, pursuant to Law 142 of 1994. | | | 220,044 | | | | 139,688 | |
| Municipality of Arauca | | Class action suit. Contributions to the solidarity and electric-power-generation income redistribution fund, pursuant to Law 142 of 1994. | | | 283,010 | | | | 121,051 | |
| Department of Tolima (*) | | Class action suit for the reassessment of royalties with the 20% stipulated in Law 141 of 1994. | | | - | | | | 82,287 | |
| Salary impact – saving stimulus suit | | Apply the salary impact to the amounts paid under the saving stimulus heading and consequently reassess social benefit payments (legal and extralegal) and monthly pension payments, from the date at which Ecopetrol S.A. began recognizing it. | | $ | 18,689 | | | $ | 20,154 | |
As at December 31, 2012, the balance of the allowance for legal proceedings was $770,922 (2011, $682,158).
(*) The State Council, in its decision of May 30, 2012, issued on June 5, decreed null and void all of the proceedings in the Department of Tolima’s contract litigation against Ecopetrol, Petrobras and Nexen, based on the ruling handed down by the Administrative Tribunal of Tolima on February 20, 2007, and made it binding on the Ministry of Mines and Energy.
Other companies in the Group
The following is a summary of the most significant legal proceedings of other companies in the Group as at December 31, 2012 and 2011:
Group
Company | | Proceeding | | Suit | | Allowance
amount
December
31, 2012 | | | Allowance
amount
December
31, 2011 | |
| Refinería de Cartagena S.A. | | Class action suit – pro-Culture stamp | | Lower court – Awaiting decision. | | $ | 166 | | | $ | 591 | |
| Refinería de Cartagena S.A. | | Class action suit – Contribution for self-generation of power | | Lower court – Beginning evidentiary phase. | | | 154 | | | | 1,181 | |
| Oleoducto de los Llanos ODL | | Administrative investigation before the Superintendence of Corporations | | Appeal for reversal of the Resolution issued by the Superintence of Companies, pursuant to which the Company received a sanction for late presentation of Form No. 13 for investments over assigned capital. | | | 3,587 | | | | 3,587 | |
| Ocensa | | Administrative Court proceedings | | 39 real estate suits before the regular courts, in which Ocensa is an intervening party because it holds the right of way in the fields involved. | | | 8,042 | | | | - | |
| Hocol S.A. | | Special appeal in cassation, sole risk San Jacinto, La Hocha Contract | | In April the recourse was allowed and the applicant was transferred. Hydrocarbon Services presented the appeal in cassation. In September, the Company presented the respective appeal. It is awaiting decision. | | | 1,500 | | | | 1,500 | |
| Hocol S.A. | | Regular/Labor | | Resolved favorably by the Court. The applicant presented an appeal on the grounds that the amount taken into account for the claim did not match the sentence. The Company ordered the main sentence to be paid by the pension fund, in the amount set by the Court; the proceeding is awaiting decision regarding the liquidation of payment. | | | 1,040 | | | | 1,040 | |
| Hocol S.A. | | Regular/Labor | | Through which the Court declared that the work accident suffered by claimant Blanco Motta was the fault of the employer, SAN ANTONIO INTERNACIONAL, sentencing the Company to pay full compensation for damages to the applicant and other claimants – family members | | | 1,000 | | | | - | |
| Hocol S.A. | | Regular/Labor | | Sentence declaring that in the events of the work accident that took place on July 21, 2008, in which Mr. OSWALD ANDRADE SÁNCHEZ lost his life, there was employer culpability on the part of PROFESIONALES TÉCNICOS S.A.S., and declaring the other defendants, HOCOL S.A., HÉCTOR RAMÓN CASTAÑEDA MAYOR and HUGO ARENAS PARRADO joint and severally liable for payment. | | $ | 643 | | | $ | - | |
Gas supply contracts
In addition to existing contracts, the Company has concluded new gas sale or supply contracts with third parties, such as Gases de Occidente S.A. E.S.P., Empresas Públicas de Medellín E.S.P., and ISAGEN S.A. E.S.P, among others. As of December 2012, the Company had sold an average of 498.48 GBTUD in the amount of $1,539,631 (including exports).
Ship or pay contracts
Ecopetrol S.A. and ODL Finance S.A. have signed the following ship or pay contracts: (i) the first supports the five-year debt (Financial Tariff) with Grupo Aval, which is collected in trust, from which the debt amortization payments are made. This contract was replaced by a new one, concluded in May 2010, for a seven-year term, to reflect the new terms agreed to with Grupo Aval, and (ii) the second contract backs securitization (autonomous trust securities) for a seven-year term. The securities are administrated from their date of issuance by an autonomous trust structured for that purpose, to which have been ceded the rights for invoicing, collecting and paying the securities holders.
Under the first ship or pay contract, ODL Finance S.A. committed to transporting 75,000 barrels of crude a day during the two-year grace period for the facility, and 90,000 barrels of crude a day during the subsequent five years. Under the second contract, ODL Finance S.A. committed to transporting 19,500 barrels of crude during the first phase of the construction period (which began operations in September 2009) and 39,000 barrels of crude a day from the beginning of the second phase, which took place in the first quarter of 2010.
Bicentenario ship or pay contract for crude oil transportation
In order to finance the construction of Stages 0 and 1 of the Bicentenario oil pipeline, crude oil transportation contacts were signed that create the obligation on the part of the respective shareholder or affiliate to ship crude oil under its ownership: (i) from the Araguaney station to Coveñas, (ii) under the ‘ship or pay’ modality, and (iii) up to the capacity of the shareholder, determined by his share in Bicentenario, which will depend on the contracted capacity of all Bicentenario’s shareholders and/or affiliates, and which shall not be less than 110,000 BPCD.
In exchange for the shipping service, the shareholder or his affiliate must pay a fixed monthly fee, even if no barrels at all are shipped, from one of the following dates, whichever comes first: (i) The date at which the oil pipeline begins operation or (ii) 12 months from the date of the first disbursement of the syndicated loan, namely July 5, 2013. The right to receive the fee under the ship or pay modality was ceded to an autonomous trust created for the purpose of administrating and making payments.
The contracts will initially be in effect from the date of the first payment of the fee, or the date of the beginning of service, whichever takes place first, and will end either (a) 12 years after the beginning of the period, or (b) the day on which all of the obligations under the contract have been discharged, whichever comes last. Once the above period has been completed, the contract will be in effect for an additional period of 20 years.
Guarantee for the Cartagena Refinery expansion and modernization project
On December 30, 2011, Ecopetrol S.A. granted a guarantee to Refinería de Cartagena S.A.– Reficar S.A., as part of the financing granted by a group of export credit agencies and commercial banks, for the project to expand and modernize the Cartagena Refinery. The Project Finance financing structure has a maximum repayment period of 14 years, starting six months after the date of completion of the Project.
For the purposes of financing the Project, Ecopetrol gave the lenders a contingent guarantee to pay potential amounts that Reficar S.A. may need to service the debt.
Hocol’s undertakings toward theAgencia Nacional de Hidrocarburos (ANH)
Hocol has 4 Bank Guarantees and 22 Letters of Credit to guarantee the various undertakings that Hocol has with the ANH, as listed below:
| No. | | Bank | | Guarantee | | Maturity | | Linked to | | Required
upon? | | Date at
which
contract
was signed
with the
ANH | | Currency | | Pour
Montants | | Beneficiary | | Type of
Guarantee |
| | | | | | | | | | | | | | | | | | | | | |
| 1 | | Occidente | | 288-9846-2009 | | 18/06/2013 | | CPO-17 Phase I | | Breach of undertakings toward ANH | | 18/12/2008 | | USD | | 9,253,000 | | ANH | | BANK GUARANTEE IN FOREIGN CURRENCY |
| | | | | | | | | | | | | | | | | | | | | |
| 2 | | Occidente | | 288-9861-2009 | | 17/12/2015 | | Niscota Phase I and II | | Breach of undertakings toward ANH | | 18/09/2006 | | USD | | 4,680,000 | | ANH | | BANK GUARANTEE IN FOREIGN CURRENCY |
| | | | | | | | | | | | | | | | | | | | | |
| 3 | | Occidente | | 288-9889-2009 | | 16/02/2013 | | VSM-10 Phase I | | Breach of undertakings toward ANH | | 17/02/2009 | | USD | | 25,000,000 | | ANH | | BANK GUARANTEE IN FOREIGN CURRENCY |
| | | | | | | | | | | | | | | | | | | | | |
| 4 | | Bogota | | 917-211-000-342 | | 12/09/2013 | | Saltarin Phase IV | | Breach of undertakings toward ANH | | 12/04/2007 | | USD | | 996,000 | | ANH | | STAND-BY LETTER OF CREDIT IN FOREIGN CURRENCY |
| | | | | | | | | | | | | | | | | | | | | |
| 5 | | Bogota | | 917-211-000-345 | | 12/01/2013 | | SSJN-9 Phase I | | Breach of undertakings toward ANH | | 18/12/2008 | | USD | | 3,075,235 | | ANH | | STAND-BY LETTER OF CREDIT IN FOREIGN CURRENCY |
| | | | | | | | | | | | | | | | | | | | | |
| 6 | | Bogota | | 917-211-1000-361 | | 30/07/2013 | | Saman Phase IV | | Breach of undertakings toward ANH | | 20/06/2006 | | USD | | 600,000 | | ANH | | STAND-BY LETTER OF CREDIT IN FOREIGN CURRENCY |
| | | | | | | | | | | | | | | | | | | | | |
| 7 | | Bogota | | 917-211-1000-374 | | 21/02/2013 | | Guarrojo – Abandonment of Ocelote Field | | Breach of undertakings toward ANH | | 06/04/2006 | | USD | | 2,002,293 | | ANH | | STAND-BY LETTER OF CREDIT IN FOREIGN CURRENCY |
| | | | | | | | | | | | | | | | | | | | | |
| 8 | | Bogota | | 917-211-1000-391 | | 25/03/2013 | | Perdices Phase V | | Breach of undertakings toward ANH | | 18/02/2011 | | USD | | 600,000 | | ANH | | STAND-BY LETTER OF CREDIT IN FOREIGN CURRENCY |
| | | | | | | | | | | | | | | | | | | | | |
| 9 | | Bogota | | 917-211-100-392 | | 06/06/2013 | | Cocli Phase V | | Breach of undertakings toward ANH | | 12/03/2007 | | USD | | 348,000 | | ANH | | STAND-BY LETTER OF CREDIT IN FOREIGN CURRENCY |
| No. | | Bank | | Guarantee | | Maturity | | Linked to | | Required
upon? | | Date at
which
contract
was signed
with the
ANH | | Currency | | Pour
Montants | | Beneficiary | | Type of
Guarantee |
| | | | | | | | | | | | | | | | | | | | | |
| 10 | | Bogota | | 917-211-1000-407 | | 23/11/2014 | | LIa-13 Phase I | | Breach of undertakings toward ANH | | 25/02/2011 | | USD | | 300,000 | | ANH | | STAND-BY LETTER OF CREDIT IN FOREIGN CURRENCY |
| | | | | | | | | | | | | | | | | | | | | |
| 11 | | Bogota | | 917-211-1000-412 | | 27/11/2014 | | VSM-9 Phase I | | Breach of undertakings toward ANH | | 25/02/2011 | | USD | | 300,000 | | ANH | | STAND-BY LETTER OF CREDIT IN FOREIGN CURRENCY |
| | | | | | | | | | | | | | | | | | | | | |
| 12 | | Bogota | | 917-211-1000-413 | | 27/11/2014 | | VIM-6 Phase I | | Breach of undertakings toward ANH | | 25/02/2011 | | USD | | 2,429,925 | | ANH | | STAND-BY LETTER OF CREDIT IN FOREIGN CURRENCY |
| | | | | | | | | | | | | | | | | | | | | |
| 13 | | Bogota | | 917-211-1000-414 | | 26/11/2014 | | CPO-16 Phase I | | Breach of undertakings toward ANH | | 25/02/2011 | | USD | | 916,650 | | ANH | | STAND-BY LETTER OF CREDIT IN FOREIGN CURRENCY |
| | | | | | | | | | | | | | | | | | | | | |
| 14 | | Bogota | | 917-211-1000-475 | | 25/11/2013 | | LLA-39 Phase I | | Breach of undertakings toward ANH | | 25/02/2011 | | USD | | 8,900,000 | | ANH | | STAND-BY LETTER OF CREDIT IN FOREIGN CURRENCY |
| | | | | | | | | | | | | | | | | | | | | |
| 15 | | Citibank | | 543-560-0176 | | 27/05/2013 | | LLA-13 Phase I – Exploratory | | Breach of undertakings toward ANH | | 25/02/2011 | | USD | | 2,250,000 | | ANH | | LETTER OF CREDIT |
| | | | | | | | | | | | | | | | | | | | | |
| 16 | | Citibank | | 543-660-0179 | | 26/11/2014 | | CPO-16 Phase I | | Breach of undertakings toward ANH | | 25/02/2011 | | USD | | 4,000,000 | | ANH | | LETTER OF CREDIT |
| | | | | | | | | | | | | | | | | | | | | |
| 17 | | Citibank | | 543-760-0179 | | 26/11/2014 | | VSM-9 Phase I | | Breach of undertakings toward ANH | | 25/02/2011 | | USD | | 4,800,000 | | ANH | | LETTER OF CREDIT |
| | | | | | | | | | | | | | | | | | | | | |
| 18 | | Citibank | | 543-560-0179 | | 26/11/2014 | | VIM-6 Phase I | | Breach of undertakings toward ANH | | 25/02/2011 | | USD | | 1,120,000 | | ANH | | LETTER OF CREDIT |
| | | | | | | | | | | | | | | | | | | | | |
| 19 | | Citibank | | 543-960-0482 | | 24/03/2014 | | Phase I exploratory program Guarrojo contract | | Breach of undertakings toward ANH | | 27/05/2008 | | USD | | 350,000 | | ANH | | LETTER OF CREDIT |
| | | | | | | | | | | | | | | | | | | | | |
| 20 | | Citibank | | 543-260-0493 | | 18/12/2013 | | E&P Contract CP017 Phase 2 of the exploratory period | | Breach of undertakings toward ANH | | 18/12/2008 | | USD | | 6,000,000 | | ANH | | LETTER OF CREDIT |
| | | | | | | | | | | | | | | | | | | | | |
| 21 | | BBVA | | 401-0508-2010 | | 08/04/2013 | | SSJN-I | | Breach of undertakings toward ANH | | 18/12/2008 | | USD | | 3,900,020 | | ANH | | LETTER OF CREDIT |
| | | | | | | | | | | | | | | | | | | | | |
| 22 | | BBVA | | 401-0407-2012 | | 30/07/2014 | | Exploration contract phase I Saman | | Breach of undertakings toward ANH | | 20/06/2006 | | USD | | 600,000 | | ANH | | LETTER OF CREDIT |
| | | | | | | | | | | | | | | | | | | | | |
| 23 | | BBVA | | 401-110-611 | | 10/09/2014 | | Clarinero Phase III | | Breach of undertakings toward ANH | | 27/05/2008 | | USD | | 576,000 | | ANH | | LETTER OF CREDIT |
| | | | | | | | | | | | | | | | | | | | | |
| 24 | | Bancolombia | | 250-440-774 | | 25/05/2015 | | LLA39 Phase I | | Breach of undertakings toward ANH | | 25/02/2011 | | USD | | 300,000 | | ANH | | LETTER OF CREDIT |
| No. | | Bank | | Guarantee | | Maturity | | Linked to | | Required
upon? | | Date at
which
contract
was signed
with the
ANH | | Currency | | Pour
Montants | | Beneficiary | | Type of
Guarantee |
| | | | | | | | | | | | | | | | | | | | | |
| 25 | | Scotiabank | | 400000000462 | | 28/02/2013 | | Natural gas – La Hocha | | Breach of contract obligations | | | | USD | | 12,410 | | ANH | | LETTER OF CREDIT |
| | | | | | | | | | | | | | | | | | | | | |
| 26 | | Banco Bogota | | 910-721-120-000-584 | | 25/09/2014 | | Perdices Phase I | | Breach of undertakings toward ANH | | | | USD | | 600,000 | | ANH | | STAND-BY LETTER OF CREDIT IN FOREIGN CURRENCY |
Ecopetrol del Perú letters of guarantee
Article 21 of the Organic Law for Hydrocarbons of Peru requires that:
“For all Contracts, each period of the exploration phase must feature a mandatory minimum work program. Each of said programs shall be guaranteed by a bond, the amount of which shall be agreed with the Contracting Party, and which shall be joint and several, unconditional, irrevocable, automatically enforced in Peru, without benefit of discussion, and issued by a Financial System entity that is duly qualified and domiciled in the country.”
Pursuant to said Law, Ecopetrol del Perú maintains a series of guarantee letters in effect to guarantee the Company’s undertakings to fulfill the mandatory minimum work programs at the various sup-stages of exploration of the various oil lots provided in the following list:
| DATE | | DESCRIPTION | | MAT.
DATE | | ORIGINAL
AMOUNT L.
OF
GUARANTEE | | | %
PART | | | DOLLARS | |
| | | RESPONSIBILITY LETTER OF GUARANTEE | | | | | | | | | | | |
| 13/04/2010 | | Renewal of L.G. No. 0011-0586-9800143415-50 (*) License Contract Lot 117 | | 20/09/2013 | | | 1,400,000 | | | | 25 | % | | | 350,000 | |
| 31/03/2012 | | Renewal of L.G. No. 0011-0586-9800154116-52 (**) Call for tenders Lot 180 | | 31/01/2013 | | | 20,000 | | | | 50 | % | | | 10,000 | |
| 31/03/2012 | | Renewal of L.G. No. 0011-0586-9800154078-54 (**) Call for tenders Lot 182 | | 31/01/2013 | | | 20,000 | | | | 50 | % | | | 10,000 | |
| 31/03/2012 | | Renewal of L.G. No. 0011-0586-9811454086-57 (**) Call for tenders Lot 184 | | 31/01/2013 | | | 20,000 | | | | 50 | % | | | 10,000 | |
| 28/09/2011 | | Renewal of L.G. No. 0011-0586-9800190422-50 (***) License contract Lot 179 | | 10/01/2013 | | | 69,000 | | | | 100 | % | | | 69,000 | |
| 01/09/2011 | | Renewal of Letter of Guarantee No. 10281659-000 License contract Lot 101 | | 15/03/2013 | | | 1,521,850 | | | | 30 | % | | | 456,555 | |
Contributions to Cenit (Subsidiary)
At its meeting on August 13, 2012, the Company’s Board of Directors drafted and unanimously approved the Issuance and Placement Regulation, through which it decided to offer to Ecopetrol S.A. the subscription of 45,582,982 common shares in Cenit’s capital, for a total value of COP$2,279,149; of which COP$11,796 would be a cash contribution, and COP$2,267,353 would be paid by Ecopetrol through the contribution of shares of the shipping companies listed in the following table:
| | | OBC | | | Ocensa | | | ODC | | | ODL | | | Serviport | |
| Direct participation of Ecopetrol S.A. | | | 54.8 | % | | | 35.3 | % | | | 43.8 | % | | | 65.0 | % | | | 49.0 | % |
| Value of the operation (millions of COP)* | | $ | 392,837 | | | $ | 1,197,702 | | | $ | 213,247 | | | $ | 456,227 | | | $ | 7,339 | |
*Figures from Ecopetrol’s financial statements with the cut-off date of July 31, 2012.
This value is made up of the following amounts: COP$455,830 corresponding to the nominal value of the shares and COP$1,823,319 corresponding to the paid-in capital.
Similarly, the transfer of Ecopetrol shipping assets is scheduled for January 2013.
The management assessed subsequent events up to April 24, 2013, and no significant events were identified as a result of said assessment that would alter the value of assets and liabilities as at December 31, 2012.
In accordance with the Public Accounting Regime’s Technical Standards in relation to subsequent events, we indicate that the basic financial statements with the cut-off date of December 31, 2012 were authorized by the legal representative on February 15, 2013.
Certain line items from the financial statements as of December 31, 2011 and 2010 related to the presentation of the consolidated Balance Sheet and the Consolidated Statement of Financial, Economic, Social and Environmental Activities have been reclassified in order to make the presentation of such financial statements comparable to that of the financial statements as of December 31, 2012. The main reclassifications were under cost of sales, marketing and projects, accounts payable and related parties, Taxes, contributions and duties payable, Deposits held in trust and Other assets.
| 35. | Differences between Colombian Governmental Entity accounting principles and U.S. GAAP |
The Company's consolidated financial statements are prepared in accordance with Colombian Government Entity GAAP (RCP). These principles and regulations differ in certain significant aspects from accounting principles generally accepted in the United States of America (U.S. GAAP), and therefore this note presents reconciliations of net income and shareholders’ equity determined under Colombian Government Entity GAAP to those same amounts as determined according to U.S. GAAP. Also presented in this note are those disclosures required under U.S. GAAP but not required under Colombian Government Entity GAAP.
A) Reconciliation of net income attributable to Ecopetrol.:
The following table presents the reconciliation of consolidated net income under Colombian Government Entity GAAP to consolidated net income under U.S. GAAP attributable to Ecopetrol for the years ended December 31, 2012, 2011 and 2010:
| | | | | 2012 | | | 2011 | | | 2010 | |
| | | | | | | | | | | | | | | |
| | | Consolidated net income under Colombian Government Entity GAAP | | $ | 14,778,947 | | | $ | 15,452,334 | | | $ | 8,146,471 | |
| i. | | Investment securities: | | | | | | | | | | | | |
| | | a. Unrealized gain (loss) | | | (45,199 | ) | | | (224 | ) | | | 63,545 | |
| | | b. Impairment | | | (34,657 | ) | | | 21,423 | | | | (36,818 | ) |
| ii. | | Investments in non-marketable securities: | | | | | | | | | | | | |
| | | a. Equity method | | | (109,749 | ) | | | (27,825 | ) | | | (25,063 | ) |
| | | b. Variable interest entity (VIE) | | | - | | | | - | | | | (13 | ) |
| | | c. Impairment | | | 9 | | | | 13,136 | | | | (61,371 | ) |
| iii. | | Derivatives | | | (4,709 | ) | | | (768 | ) | | | (24,736 | ) |
| iv. | | Exchange of non-monetary assets | | | - | | | | 425,521 | | | | 23,640 | |
| v. | | Deferred charges | | | 493,159 | | | | (1,710,944 | ) | | | (7,167 | ) |
| vi. | | Employee benefit plans | | | (157,893 | ) | | | 288,616 | | | | 336,276 | |
| vii. | | Provisions and contingencies | | | 141,755 | | | | 335,983 | | | | 67,629 | |
| viii. | | Assets and liabilities present value | | | (99,188 | ) | | | 126,861 | | | | - | |
| ix. | | Deferred income taxes | | | (392,593 | ) | | | (647,139 | ) | | | (1,159,147 | ) |
| x. | | Revenue recognition: | | | | | | | | | | | | |
| | | a. Cost of sales – over and under deliveries | | | 208,644 | | | | (449,225 | ) | | | 158,609 | |
| | | b. Other income | | | 6,100 | | | | 70,658 | | | | (11,685 | ) |
| xi. | | Inflation adjustment | | | 165,867 | | | | 289,470 | | | | 320,374 | |
| xii. | | Inventories | | | (16,699 | ) | | | 76,126 | | | | (87,797 | ) |
| xiii. | | Lease accounting | | | (75,203 | ) | | | (47,372 | ) | | | (36,298 | ) |
| xiv. | | Property, plant and equipment: | | | | | | | | | | | | |
| | | a. Interest | | | (607,200 | ) | | | (122,177 | ) | | | (168,527 | ) |
| | | b. Impairment | | | (43,609 | ) | | | (120,225 | ) | | | (157,446 | ) |
| | | c. Capitalized expenses | | | 17,685 | | | | 7,472 | | | | 38,751 | |
| | | d. Exchange difference | | | 28,793 | | | | (5,769 | ) | | | - | |
| xv. | | Depreciation, depletion and amortization | | | 239,571 | | | | 462,333 | | | | 702,527 | |
| xvi. | | Asset retirement obligations | | | (117,988 | ) | | | (217,430 | ) | | | 140,959 | |
| xvii. | | Equity contributions: | | | | | | | | | | | | |
| | | a. Incorporated institutional equity | | | 14,195 | | | | 29,446 | | | | 20,281 | |
| | | b. Reversal of concession rights contributed as capital | | | 2,725 | | | | 2,464 | | | | 81,058 | |
| xviii. | | Public offering cost and discount on issuance of shares | | | - | | | | 103,949 | | | | - | |
| xix. | | Indebtedness cost | | | (36 | ) | | | (652 | ) | | | (1,670 | ) |
| xx. | | Business combinations: | | | | | | | | | | | | |
| | | a. Goodwill | | | 275,271 | | | | 229,646 | | | | 172,660 | |
| | | b. Fair value adjustments to assets and liabilities acquired | | | - | | | | 89,387 | | | | (176,590 | ) |
| xxi. | | Non-controlling interest | | | 227,514 | | | | (7,015 | ) | | | (124,394 | ) |
| xxii. | | Cumulative translation adjustment | | | (199,863 | ) | | | 149,147 | | | | 16,977 | |
| | | Consolidated net income under U.S. GAAP attributable to Ecopetrol | | $ | 14,695,649 | | | $ | 14,817,207 | | | $ | 8,211,035 | |
B) Reconciliation of shareholders’ equity attributable to Ecopetrol:
The following table presents the reconciliation of Ecopetrol shareholders’ equity under Colombian Government Entity GAAP to Ecopetrol shareholders’ equity under U.S. GAAP attributable to Ecopetrol for the years ended December 31, 2012 and 2011:
| | | | | 2012 | | | 2011 | |
| | | | | | | | | |
| | | Consolidated shareholders’ equity under Colombian Government Entity GAAP | | $ | 64,740,881 | | | $ | 54,688,855 | |
| i. | | Investment securities: | | | | | | | | |
| | | a. Unrealized gain | | | 1,111,085 | | | | 1,145,134 | |
| ii. | | Investments in non-marketable securities: | | | | | | | | |
| | | a. Equity method | | | (1,616,529 | ) | | | (1,578,658 | ) |
| | | b. Variable interest entity (VIE) | | | 320,587 | | | | 320,587 | |
| | | c. Valuation surplus | | | (1,144,221 | ) | | | (1,179,024 | ) |
| | | d. Impairment | | | (53,036 | ) | | | (53,045 | ) |
| iii. | | Derivatives | | | - | | | | - | |
| iv. | | Exchange of non-monetary assets | | | 1,135,175 | | | | 1,135,175 | |
| v. | | Deferred charges | | | (1,140,342 | ) | | | (1,646,275 | ) |
| vi. | | Employee benefit plans | | | (3,229,160 | ) | | | (2,985,447 | ) |
| vii. | | Provisions and contingencies | | | 492,223 | | | | 350,535 | |
| viii. | | Assets and liabilities present value | | | (708 | ) | | | 98,600 | |
| ix. | | Deferred income taxes | | | (2,729,013 | ) | | | (2,335,269 | ) |
| x. | | Revenue recognition: | | | | | | | | |
| | | a. Cost of sales – over and under deliveries | | | (177,762 | ) | | | (386,427 | ) |
| | | b. Other income | | | (1,128 | ) | | | (1,128 | ) |
| xi. | | Inflation adjustment | | | (3,071,684 | ) | | | (3,237,529 | ) |
| xii. | | Inventories | | | (55,078 | ) | | | (38,473 | ) |
| xiii. | | Lease accounting | | | 240,726 | | | | 315,923 | |
| xiv. | | Property, plant and equipment: | | | | | | | | |
| | | a. Interest | | | (912,619 | ) | | | (314,700 | ) |
| | | b. Revaluation of property, plant and equipment and public accounting effect | | | (19,503,673 | ) | | | (12,396,858 | ) |
| | | c. Impairment | | | (851,991 | ) | | | (128,210 | ) |
| | | d. Capitalized expenses | | | (525,995 | ) | | | (577,734 | ) |
| | | e. Exchange difference | | | (129,515 | ) | | | (253,782 | ) |
| xv. | | Depreciation, depletion and amortization | | | 5,402,349 | | | | 5,152,512 | |
| xvi. | | Asset retirement obligations | | | 135,412 | | | | 253,327 | |
| xvii. | | Equity contributions: | | | | | | | | |
| | | a. Incorporated institutional equity | | | (37,499 | ) | | | (51,693 | ) |
| | | b. Reversal of concession rights contributed as capital | | | (17,013 | ) | | | (19,738 | ) |
| xviii. | | Indebtedness cost | | | 6,443 | | | | 6,479 | |
| xix. | | Business combinations: | | | | | | | | |
| | | a. Goodwill | | | 658,346 | | | | 383,075 | |
| | | b. Fair value adjustments to assets and liabilities acquired | | | (1,405,659 | ) | | | (1,405,659 | ) |
| xx. | | Non-controlling interest | | | 1,184,780 | | | | 981,572 | |
| xxi. | | Cumulative translation adjustment | | | (1,177,030 | ) | | | (186,952 | ) |
| | | Consolidated Ecopetrol shareholders’ equity under U.S. GAAP | | $ | 37,648,352 | | | $ | 36,055,173 | |
C) Supplemental condensed consolidated financial statements under U.S. GAAP
1. Supplemental condensed consolidated balance sheets of the Company as of December 31, 2012 and 2011 in conformity with under U.S. GAAP are presented below:
| | | 2012 | | | 2011 | |
| | | | | | | |
| Assets | | | | | | | | |
| Current assets: | | | | | | | | |
| Cash and cash equivalents | | $ | 7,972,335 | | | $ | 7,073,550 | |
| Investments | | | | | | | | |
| Available for sale | | | 1,331,665 | | | | 909,161 | |
| Held to maturity | | | 5,054 | | | | 19,002 | |
| Accounts and notes receivable, net | | | 6,076,043 | | | | 5,474,883 | |
| Inventories | | | 2,670,226 | | | | 2,696,103 | |
| Prepaid expenses and other assets | | | 359,200 | | | | 408,195 | |
| Deferred income taxes | | | 1,748,302 | | | | 1,228,552 | |
| Total current assets | | | 20,162,825 | | | | 17,809,445 | |
Long term assets | | | | | | | | |
| Investments | | | | | | | | |
| Available for sale | | | 5,595,745 | | | | 5,476,838 | |
| Held to maturity | | | 87,988 | | | | 98,372 | |
| Equity method | | | 1,014,251 | | | | 1,037,012 | |
| Accounts and notes receivable, net | | | 514,526 | | | | 406,944 | |
| Restricted assets | | | 546,246 | | | | 549,882 | |
| Property, plant and equipment, net | | | 32,997,535 | | | | 25,604,983 | |
| Natural and environmental resources, net | | | 17,730,899 | | | | 15,690,887 | |
| Goodwill | | | 1,264,470 | | | | 1,388,568 | |
| Deferred charges and other assets | | | 1,032,330 | | | | 1,374,470 | |
| Deferred income taxes | | | 102,284 | | | | 1,158,314 | |
| Capital lease | | | 470,233 | | | | 313,364 | |
| Total assets | | $ | 81,519,332 | | | $ | 70,909,079 | |
| Liabilities and shareholders’ equity | | | | | | | | |
| Current liabilities: | | | | | | | | |
| Financial obligations | | $ | 970,479 | | | $ | 837,408 | |
| Accounts payable and related parties | | | 7,233,313 | | | | 5,043,569 | |
| Capital lease liability | | | 109,000 | | | | 108,848 | |
| Taxes payable | | | 3,738,483 | | | | 6,236,515 | |
| Dividends Payable | | | 3,919,102 | | | | - | |
| Labor and pension plan obligations | | | 256,930 | | | | 233,322 | |
| Estimated liabilities and provisions | | | 1,564,562 | | | | 1,521,444 | |
| Deferred income tax liability | | | - | | | | 21 | |
| Other short-term liabilities | | | - | | | | 2,370 | |
| Total current liabilities | | | 17,791,869 | | | | 13,983,497 | |
| Financial obligations, long-term | | | 12,784,167 | | | | 8,396,125 | |
| Accounts payable, long-term | | | 6,173 | | | | 140,469 | |
| Capital lease liability | | | 593,144 | | | | 351,809 | |
| Taxes payable | | | 534,078 | | | | 1,003,442 | |
| Pension plan obligation and other labor obligations, long-term | | | 7,304,395 | | | | 6,354,272 | |
| Estimated liabilities and provisions | | | 2,322,280 | | | | 2,081,776 | |
| Deferred income tax liability | | | - | | | | 144,149 | |
| Other long-term liabilities | | | 100,426 | | | | 110,248 | |
| Total long term liabilities | | | 23,644,663 | | | | 18,582,290 | |
| Total liabilities | | | 41,436,532 | | | | 32,565,787 | |
| Shareholders’ equity of Ecopetrol | | | 37,648,352 | | | | 36,055,173 | |
| Non-controlling interest | | | 2,434,448 | | | | 2,288,119 | |
| Total equity | | | 40,082,800 | | | | 38,343,292 | |
| Total liabilities and shareholders’ equity | | $ | 81,519,332 | | | $ | 70,909,079 | |
2. Supplemental consolidated statements of income
The consolidated statements of income of the Company for the years ended December 31, 2012, 2011 and 2010 in conformity with U.S. GAAP are presented below:
| | | 2012 | | | 2011 | | | 2010 | |
| | | | | | | | | | |
| Revenue: | | | | | | | | | | | | |
| Local sales | | $ | 24,918,476 | | | $ | 23,109,208 | | | $ | 18,291,606 | |
| Foreign sales | | | 41,948,661 | | | | 39,606,607 | | | | 22,587,718 | |
| Total revenue | | | 66,867,137 | | | | 62,715,815 | | | | 40,879,324 | |
| | | | | | | | | | | | | |
| Cost of sales | | | 38,353,685 | | | | 33,519,507 | | | | 24,441,962 | |
| Gross income | | | 28,513,452 | | | | 29,196,308 | | | | 16,437,362 | |
| | | | | | | | | | | | | |
| Operating expenses: | | | | | | | | | | | | |
| Administration | | | 2,057,796 | | | | 3,826,298 | | | | 856,881 | |
| Selling and projects | | | 2,898,693 | | | | 1,696,223 | | | | 1,701,967 | |
| Operating income | | | 23,556,963 | | | | 23,673,787 | | | | 13,878,514 | |
| | | | | | | | | | | | | |
| Non-operating income, net | | | (1,143,481 | ) | | | (217,102 | ) | | | (1,037,793 | ) |
| Income before income tax | | | 22,413,482 | | | | 23,456,685 | | | | 12,840,721 | |
| | | | | | | | | | | | | |
| Income tax: | | | | | | | | | | | | |
| Current income tax | | | 7,095,874 | | | | 7,501,002 | | | | 3,201,040 | |
| Deferred income tax | | | 430,114 | | | | 898,084 | | | | 1,196,757 | |
| | | | 7,525,988 | | | | 8,399,086 | | | | 4,397,797 | |
| Net income | | | 14,887,494 | | | | 15,057,599 | | | | 8,442,924 | |
| Less: Net income attributable to non-controlling interest | | | (191,845 | ) | | | (240,392 | ) | | | (231,889 | ) |
| Net Income attributable to Ecopetrol | | $ | 14,695,649 | | | $ | 14,817,207 | | | $ | 8,211,035 | |
| Earnings per share (Basic) attributable to Ecopetrol common shareholders | | $ | 357.41 | | | $ | 364.64 | | | $ | 202.88 | |
| Weighted-average shares outstanding (Basic) | | | 41,116,698,456 | | | | 40,634,882,725 | | | | 40,472,512,588 | |
3. Supplemental consolidated comprehensive income
| | | 2012 | | | 2011 | | | 2010 | |
| | | | | | | | | | |
| Net income | | $ | 14,887,494 | | | $ | 15,057,599 | | | $ | 8,442,925 | |
| Other comprehensive income, net of tax: | | | | | | | | | | | | |
| Unrealized gain (loss) on investment securities, net of tax: | | | 18,088 | | | | (529,956 | ) | | | 997,425 | |
| Unrealized actuarial (loss), net of tax | | | (57,500 | ) | | | (990,918 | ) | | | (419,661 | ) |
| Translation gain (loss) adjustment | | | (943,192 | ) | | | 150,424 | | | | (313,642 | ) |
| Total other comprehensive income | | | (982,604 | ) | | | (1,370,450 | ) | | | 264,122 | |
| Comprehensive income | | | 13,904,890 | | | | 13,687,149 | | | | 8,707,047 | |
| Comprehensive income attributable to the non-controlling interest | | | (141,999 | ) | | | (271,039 | ) | | | (232,194 | ) |
| Comprehensive income attributable to Ecopetrol | | $ | 13,762,891 | | | | 13,416,110 | | | $ | 8,474,853 | |
A reconciliation of accumulated other comprehensive income attributable to Ecopetrol, including the related income tax effects, is presented below:
| | | 2012 | |
| | | Before-Income
Tax Amount | | | Income Tax
(Expense)
Benefit | | | Net of Income
Tax Amount | |
| | | | | | | | | | |
| Unrealized gain (loss) on securities available for sale | | $ | 1,242,990 | | | $ | (46,437 | ) | | $ | 1,196,553 | |
| Pension liability – net unamortized actuarial gain (loss) | | | (4,203,835 | ) | | | 1,387,265 | | | | (2,816,570 | ) |
| Cumulative translation adjustment | | | (1,476,022 | ) | | | - | | | | (1,476,022 | ) |
| Other comprehensive income (loss) | | $ | (4,436,867 | ) | | $ | 1,340,828 | | | $ | (3,096,039 | ) |
| | | 2011 | |
| | | Before-Income
Tax Amount | | | Income Tax
(Expense)
Benefit | | | Net of Income
Tax Amount | |
| | | | | | | | | | |
| Unrealized gain (loss) on securities available for sale | | $ | 1,197,304 | | | $ | (18,718 | ) | | $ | 1,178,586 | |
| Pension liability - net unamortized actuarial gain (loss) | | | (4,118,015 | ) | | | 1,358,945 | | | | (2,759,070 | ) |
| Cumulative translation adjustment | | | (582,797 | ) | | | - | | | | (582,797 | ) |
| Other comprehensive income (loss) | | $ | (3,503,508 | ) | | $ | 1,340,227 | | | $ | (2,163,281 | ) |
| | | 2010 | |
| | | Before-Income
Tax Amount | | | Income Tax
(Expense)
Benefit | | | Net of Income
Tax Amount | |
| | | | | | | | | | |
| Unrealized gain (loss) on securities available for sale | | $ | 1,734,255 | | | $ | (25,802 | ) | | $ | 1,708,453 | |
| Pension liability – net unamortized actuarial gain (loss) | | | (2,639,033 | ) | | | 870,881 | | | | (1,768,152 | ) |
| Cumulative translation adjustment | | | (702,485 | ) | | | - | | | | (702,485 | ) |
| Other comprehensive income (loss) | | $ | (1,607,263 | ) | | $ | 845,079 | | | $ | (762,184 | ) |
4. Supplemental condensed consolidated statements of cash flows
The statements of cash flows of the Company for the years ended December 31, 2012, 2011 and 2010 under U.S. GAAP are presented below:
| | | 2012 | | | 2011 | | | 2010 | |
| | | | | | | | | | |
| Cash flows provided by operating activities: | | | | | | | | | | | | |
| Net income | | $ | 14,695,649 | | | $ | 14,817,207 | | | $ | 8,211,035 | |
| Adjustments to reconcile net income to cash provided by operating activities: | | | | | | | | | | | | |
| Non-controlling interest | | | 191,845 | | | | 240,392 | | | | 231,889 | |
| Equity method in non-marketable securities | | | (15,528 | ) | | | (545,421 | ) | | | 25,063 | |
| Depreciation, depletion and amortization | | | 4,977,009 | | | | 5,109,820 | | | | 3,608,292 | |
Accretion Expense | | | 148,593 | | | | 133,796 | | | | 151,516 | |
| Capitalized exploratory well costs charged to expense | | | 278,254 | | | | 378,959 | | | | 841,713 | |
| Impairment | | | 276,147 | | | | 116,154 | | | | 157,446 | |
| Provisions | | | 431,293 | | | | 481,191 | | | | (141,038 | ) |
| Deferred income tax | | | 428,559 | | | | 898,084 | | | | 1,196,757 | |
| Exchange gain (loss) | | | 267,125 | | | | 58,380 | | | | (137,054 | ) |
| Loss on retirement of property, plant and equipment | | | 64,385 | | | | 418 | | | | 42,340 | |
| Losses in retirement of investment in natural and environmental resources | | | 358,599 | | | | - | | | | 39,668 | |
| Other asset write-offs | | | - | | | | 300 | | | | 359,981 | |
| Net changes in operating assets and liabilities: | | | | | | | | | | | | |
| Accounts and notes receivable | | | (1,099,884 | ) | | | (2,056,410 | ) | | | (22,944 | ) |
| Inventories | | | (423,073 | ) | | | (642,888 | ) | | | (90,512 | ) |
| Deferred charges and other assets | | | (1,060,411 | ) | | | 76,208 | | | | (520,175 | ) |
| Accounts payable and related parties | | | 2,668,864 | | | | (235,888 | ) | | | 1,294,450 | |
| Taxes payable | | | (2,890,533 | ) | | | 3,857,834 | | | | 553,613 | |
| Labor obligations | | | 888,708 | | | | 631,036 | | | | (369,839 | ) |
| Estimated liabilities and provisions | | | (58,268 | ) | | | (1,069,585 | ) | | | (791,274 | ) |
| Bargain purchase gain | | | - | | | | (89,387 | ) | | | - | |
| Net cash provided by operating activities | | | 20,127,333 | | | | 22,160,200 | | | | 14,640,927 | |
| Cash flows from investing activities: | | | | | | | | | | | | |
| Payment for purchase of companies, net of cash acquired | | | - | | | | (262,009 | ) | | | (1,163,131 | ) |
| Dividends received | | | 32,541 | | | | 61,900 | | | | 30,855 | |
| Purchase of investment securities | | | (15,281,566 | ) | | | (11,685,030 | ) | | | (11,808,784 | ) |
| Redemption of investment securities | | | 14,458,913 | | | | 12,019,376 | | | | 9,952,542 | |
| Proceeds from sales of property, plant and equipment | | | - | | | | - | | | | 4,751 | |
| Investment in natural and environmental resources | | | (5,872,995 | ) | | | (4,637,881 | ) | | | (4,601,123 | ) |
| Additions to property, plant and equipment | | | (9,350,074 | ) | | | (10,100,158 | ) | | | (5,946,298 | ) |
| Net cash used in investing activities | | | (16,013,181 | ) | | | (14,603,802 | ) | | | (13,351,188 | ) |
| Cash flows from financing activities: | | | | | | | | | | | | |
| Return on capital through spin-off | | | - | | | | - | | | | (325,367 | ) |
| Repayment of financial obligations | | | (1,203,309 | ) | | | 132,542 | | | | (43,677 | ) |
| Proceeds from financial obligations | | | 5,995,738 | | | | (217,383 | ) | | | 2,959,345 | |
| Proceeds from issuance of shares | | | 171,582 | | | | 2,499,062 | | | | 525 | |
| Cash paid to acquire a non-controlling interest | | | (1,917 | ) | | | (884,946 | ) | | | - | |
| Dividends paid | | | (8,419,331 | ) | | | (5,907,021 | ) | | | (3,782,966 | ) |
| Net cash used in financing activities | | | (3,457,237 | ) | | | (4,377,746 | ) | | | (1,192,140 | ) |
| Effect of exchange rate changes on cash | | | 241,870 | | | | (15,847 | ) | | | 155,476 | |
| Net increase (decrease) in cash and cash equivalents | | | 656,915 | | | | 3,178,652 | | | | (82,401 | ) |
| Cash and cash equivalents at beginning of year | | | 7,073,550 | | | | 3,910,745 | | | | 3,837,670 | |
| Cash and cash equivalents at end of year | | $ | 7,972,335 | | | $ | 7,073,550 | | | $ | 3,910,745 | |
| | | 2012 | | | 2011 | | | 2010 | |
| Supplemental cash flows information | | | | | | | | | | | | |
| Cash paid during the year | | | | | | | | | | | | |
| Interest | | $ | 732,335 | | | $ | 509,177 | | | $ | 404,708 | |
| Income taxes | | $ | 8,320,779 | | | $ | 3,631,331 | | | $ | 982,783 | |
| | | | | | | | | | | | | |
| Non-cash transactions | | | | | | | | | | | | |
| Liabilities assumed in business combinations | | $ | - | | | $ | 382,456 | | | $ | - | |
| Assets acquired through capital lease contracts | | $ | 260,648 | | | $ | 72,784 | | | $ | - | |
| Increase of natural and environmental resources through asset retirement obligations | | $ | (156,871 | ) | | $ | 655,240 | | | $ | 779,913 | |
Under Colombian Government Entity GAAP as in effect for 2007, some deposits with banks were considered as short-term investments since they produced yields and the Company has defined them to be used for specific purposes. Under U.S. GAAP, these deposits are considered cash and are valued at fair value. The amounts reclassified as of December 31, 2011 and 2010 were $487,922 and $183,967. There were not any amount reclassified as of December 31, 2012.
Certain reclassifications have been made to prior year’s cash flow financial statement to conform to current year presentation.
5. Supplemental consolidated statements of shareholders’ equity.
The statements of shareholders’ equity of the Company for the years ended December 31, 2012, 2011 and 2010 under U.S. GAAP as follows:
| | | Common Stock | | | | | | | | | | | | | | | | | | | | | | |
| | | Millions
of
shares | | | Value | | | Additional
paid-
in-capital | | | Comprehensive
Income | | | Retained
earnings | | | Accumulated
Other
Comprehensive
income (loss) | | | Ecopetrol’s
Equity | | | Non-
Controlling
Interest | | | Total Equity | |
| Balance at December 31, 2009 | | | 40,473 | | | | 10,117,791 | | | | 4,044,669 | | | | | | | | 9,247,252 | | | | (1,026,001 | ) | | | 22,383,712 | | | | 634,718 | | | | 23,018,430 | |
| Acquired non-controlling interest | | | - | | | | - | | | | (804 | ) | | | - | | | | - | | | | - | | | | (804 | ) | | | 804 | | | | - | |
| Other non-controlling interest | | | - | | | | - | | | | - | | | | - | | | | - | | | | - | | | | - | | | | 4,444 | | | | 4,444 | |
| Issuance of Company shares | | | - | | | | 337 | | | | 188 | | | | - | | | | - | | | | - | | | | 525 | | | | - | | | | 525 | |
| Distribution of dividends | | | - | | | | - | | | | - | | | | - | | | | (3,682,998 | ) | | | - | | | | (3,682,998 | ) | | | (418,558 | ) | | | (4,101,556 | ) |
| Return of capital due to a spin-off | | | - | | | | - | | | | - | | | | - | | | | - | | | | - | | | | - | | | | (144,251 | ) | | | (144,251 | ) |
| Comprehensive income: | | | - | | | | - | | | | - | | | | - | | | | - | | | | - | | | | - | | | | - | | | | - | |
| Net income | | | - | | | | - | | | | - | | | $ | 8,442,925 | | | | 8,211,035 | | | | - | | | | 8,211,035 | | | | 231,889 | | | | 8,442,925 | |
| Other comprehensive income, net of tax: | | | | | | | | | | | | | | | | | | | | | | | | | | | | | | | | | | | | |
| Unrealized earnings on investment securities, net of tax effect of $8,819 | | | - | | | | - | | | | - | | | | 997,425 | | | | - | | | | - | | | | 997,425 | | | | - | | | | 997,425 | |
| Actuarial (loss), net of tax effect of $206,699 | | | - | | | | - | | | | - | | | | (419,661 | ) | | | - | | | | - | | | | (419,661 | ) | | | - | | | | (419,661 | ) |
| Translation adjustment | | | - | | | | - | | | | - | | | | (313,642 | ) | | | - | | | | - | | | | (313,947 | ) | | | 305 | | | | (313,642 | ) |
| Total other comprehensive income | | | - | | | | - | | | | - | | | | 264,122 | | | | - | | | | 263,817 | | | | - | | | | - | | | | - | |
| Comprehensive income | | | - | | | | - | | | | - | | | $ | 8,707,047 | | | | - | | | | - | | | | - | | | | - | | | | - | |
| Balance at December 31, 2010 | | | 40,473 | | | $ | 10,118,128 | | | $ | 4,044,053 | | | | | | | $ | 13,775,291 | | | $ | (762,184 | ) | | $ | 27,175,285 | | | $ | 309,351 | | | $ | 27,484,636 | |
| Business combination | | | - | | | | - | | | | - | | | | - | | | | - | | | | - | | | | - | | | | 1,425,702 | | | | 1,425,702 | |
| Acquired non-controlling interest | | | - | | | | - | | | | (792,440 | ) | | | - | | | | - | | | | - | | | | (792,440 | ) | | | (92,506 | ) | | | (884,946 | ) |
| Issuance of shares | | | 644 | | | | 161,047 | | | | 1,963,687 | | | | - | | | | - | | | | - | | | | 2,124,734 | | | | 374,328 | | | | 2,499,062 | |
| Distribution of dividends | | | - | | | | - | | | | - | | | | - | | | | (5,868,515 | ) | | | - | | | | (5,868,515 | ) | | | - | | | | (5,868,515 | ) |
| Comprehensive income: | | | | | | | | | | | | | | | | | | | | | | | | | | | | | | | | | | | | |
| Net income | | | - | | | | - | | | | | | | $ | 15,057,599 | | | | 14,817,207 | | | | - | | | | 14,817,207 | | | | 240,392 | | | | 15,057,599 | |
| Other comprehensive income, net of tax: | | | | | | | | | | | | | | | | | | | | | | | | | | | | | | | | | | | | |
| Unrealized earnings on investment securities, net of tax effect of $7,086 | | | - | | | | - | | | | - | | | | (529,751 | ) | | | - | | | | - | | | | (529,867 | ) | | | 116 | | | | (529,751 | ) |
| Actuarial (loss), net of tax effect of $488,064 | | | - | | | | - | | | | - | | | | (990,918 | ) | | | - | | | | - | | | | (990,918 | ) | | | - | | | | (990,918 | ) |
| Translation adjustment | | | - | | | | - | | | | - | | | $ | 150,424 | | | | - | | | | - | | | | 119,688 | | | | 30,736 | | | | 150,424 | |
| Total other comprehensive income | | | - | | | | - | | | | - | | | | (1,370,245 | ) | | | - | | | | (1,401,097 | ) | | | - | | | | - | | | | - | |
| Comprehensive income | | | - | | | | - | | | | - | | | $ | 13,687,354 | | | | - | | | | - | | | | - | | | | - | | | | - | |
| Balance at December 31, 2011 | | $ | 41,117 | | | $ | 10,279,175 | | | $ | 5,215,300 | | | | | | | $ | 22,723,983 | | | $ | (2,163,281 | ) | | $ | 36,055,173 | | | $ | 2,288,119 | | | $ | 38,343,292 | |
| Acquired non-controlling interest | | | - | | | | - | | | | - | | | | - | | | | (689 | ) | | | - | | | | (689 | ) | | | (1,125 | ) | | | (1,814 | ) |
| Other non-controlling interest | | | - | | | | - | | | | - | | | | - | | | | (103 | ) | | | - | | | | (103 | ) | | | - | | | | (103 | ) |
| Spin-off | | | | | | | | | | | | | | | | | | | | | | | | | | | | | | | (37 | ) | | | (37 | ) |
| Issuance of Company shares | | | - | | | | - | | | | 166,090 | | | | - | | | | - | | | | - | | | | 166,090 | | | | 5,492 | | | | 171,582 | |
| Distribution of dividends | | | - | | | | - | | | | - | | | | - | | | | (12,335,009 | ) | | | - | | | | (12,335,009 | ) | | | - | | | | (12,335,009 | ) |
| Return of capital due to a spin-off | | | - | | | | - | | | | - | | | | - | | | | - | | | | - | | | | - | | | | - | | | | - | |
| Comprehensive income: | | | - | | | | - | | | | - | | | | - | | | | - | | | | - | | | | - | | | | - | | | | - | |
| Net income | | | - | | | | - | | | | - | | | $ | 14,887,494 | | | | 14,695,648 | | | | - | | | | 14,695,648 | | | | 191,845 | | | | 14,887,493 | |
| Other comprehensive income, net of tax: | | | - | | | | - | | | | - | | | | - | | | | - | | | | - | | | | - | | | | - | | | | - | |
| Unrealized earnings on investment securities, net of tax effect of $(27,734) | | | - | | | | - | | | | - | | | | 18,088 | | | | - | | | | - | | | | 17,967 | | | | 121 | | | | 18,088 | |
| Actuarial (loss), net of tax effect of $27,522 | | | - | | | | - | | | | - | | | | (57,500 | ) | | | - | | | | - | | | | (57,500 | ) | | | - | | | | (57,500 | ) |
| Translation adjustment | | | - | | | | - | | | | - | | | | (943,192 | ) | | | - | | | | - | | | | (893,225 | ) | | | (49,967 | ) | | | (943,192 | ) |
| Total other comprehensive income | | | - | | | | - | | | | - | | | $ | (982,604 | ) | | | - | | | | (932,758 | ) | | | - | | | | - | | | | - | |
| Comprehensive income | | | - | | | | - | | | | - | | | $ | 13,904,890 | | | | - | | | | - | | | | - | | | | - | | | | - | |
| Balance at December 31, 2012 | | $ | 41,117 | | | $ | 10,279,175 | | | $ | 5,381,390 | | | | | | | $ | 25,083,830 | | | $ | (3,096,039 | ) | | $ | 37,648,352 | | | $ | 2,434,448 | | | $ | 40,082,800 | |
D) Summary of significant differences between Colombian Government Entity GAAP and U.S. GAAP and required U.S. GAAP disclosures
The Company’s investments include both marketable and non-marketable securities. Under Colombian Government Entity GAAP , the Company classifies investment securities based on the form of their investment return, either as fixed-yield investment or as variable-yield investments. Fixed-yield investments generally represent debt securities and are initially recorded at cost with subsequent adjustments to fair value recorded in the income statement. Variable-yield investments generally represent equity securities or interests in other entities and are initially recorded at cost. Subsequent adjustments to fair value are made with increases in fair value resulting in an increase to equity, while decreases in fair value are charged to the income statement. Fair values are determined using quoted market prices, if and when available. In the absence of quoted market prices, these investments are recorded at Management’s estimate of fair value using discounted cash flow techniques.
Under U.S. GAAP, the Company has classified its investment securities as held to maturity or available for sale, as defined in ASC Sub-topic 320-10-25, Accounting for Certain Investments in Debt and Equity Securities. Debt security investments for which the Company has demonstrated its ability and intent to hold until maturity are classified as held-to-maturity. Such investments are reported at amortized cost. Investments classified as available-for-sale are reported at fair value, with unrealized gains and losses reported, net of taxes, as a component of other comprehensive income.
In the event that any other than temporary impairment of the investments value occurs, the impairment loss is recorded in income.
The Company’s short-term and long-term investments at December 31, 2012, 2011, and 2010 consist of the following:
| As of December 31, 2012 | | Aggregated
Fair
Value | | | Gross
Unrealized
Holding Gains | | | Gross Unrealized
Holding Losses | | | Gross
Recognized
Losses | | | Cost
Basis | |
| Short-term Investments – available for sale securities: | | | | | | | | | | | | | | | | | | | | |
| Securities issued or secured by Colombian government | | $ | 844,764 | | | $ | 29,365 | | | $ | (41 | ) | | $ | (27,899 | ) | | $ | 843,338 | |
| Securities issued or secured by government sponsored enterprise (GSEs) | | | 92,536 | | | | - | | | | (57 | ) | | | - | | | | 92,594 | |
| Securities issued or secured by financial entities | | | 197,933 | | | | 989 | | | | (5 | ) | | | (734 | ) | | | 197,683 | |
| Other debt securities | | | 196,432 | | | | 1,000 | | | | (90 | ) | | | (967 | ) | | | 196,490 | |
| Total short-term investments classified as available for sale | | | 1,331,665 | | | | 31,354 | | | | (193 | ) | | | (29,600 | ) | | | 1,330,105 | |
| Long-term investments – available for sale securities: | | | | | | | | | | | | | | | | | | | | |
| Securities issued or secured by Colombian government | | | 2,156,611 | | | | 59,719 | | | | (1,059 | ) | | | (17,363 | ) | | | 2,115,315 | |
| Securities issued or secured by government sponsored enterprise (GSEs) | | | 1,545,377 | | | | 3,466 | | | | (401 | ) | | | (2,865 | ) | | | 1,545,178 | |
| Securities issued or secured by financial entities | | | 18,112 | | | | 362 | | | | - | | | | (309 | ) | | | 18,059 | |
| Securities issued or secured by the U.S government | | | 44,265 | | | | 18 | | | | - | | | | - | | | | 44,247 | |
| Other debt securities | | | 464,202 | | | | 5,103 | | | | (283 | ) | | | (2,466 | ) | | | 461,847 | |
| Securities issued by mixed- economy governmental entities | | | 1,367,178 | | | | 1,106,181 | | | | - | | | | - | | | | 260,998 | |
| Total long-term investments classified as available for sale | | | 5,595,745 | | | | 1,174,849 | | | | (1,743 | ) | | | (23,003 | ) | | | 4,445,644 | |
| Total available for sale | | $ | 6,927,410 | | | $ | 1,206,203 | | | $ | (1,936 | ) | | $ | (52,603 | ) | | $ | 5,775,749 | |
| | | | | | | | | | | | | | | | | | | | | |
| | | Aggregated Fair
Value | | | Gross Unrealized
Holding Gains | | | Gross Unrealized
Holding Losses | | | Net Carrying
Amount | | | | | |
| Short-term investments – held to maturity securities: | | | | | | | | | | | | | | | | | | | | |
| Other debt securities | | $ | 2,411 | | | $ | - | | | $ | (2,642 | ) | | $ | 5,054 | | | | | |
| Total short-term investments classified as held to maturity | | | 2,411 | | | | - | | | | (2,642 | ) | | | 5,054 | | | | | |
| Long-term investments- held to maturity securities: | | | | | | | | | | | | | | | | | | | | |
| Securities issued or secured by Colombian government | | | 96,791 | | | | 8,803 | | | | - | | | | 87,988 | | | | | |
| Total long-term investments classified as held to maturity | | | 96,791 | | | | 8,803 | | | | - | | | | 87,988 | | | | | |
| Total held to maturity | | $ | 99,202 | | | $ | 8,803 | | | $ | (2,642 | ) | | $ | 93,042 | | | | | |
| As of December 31, 2011 | | Aggregated
Fair Value | | | Gross Unrealized
Holding Gains | | | Gross
Unrealized
Holding Losses | | | Gross
Recognized
Losses | | | Cost Basis | |
| Short-term investments – available for sale securities: | | | | | | | | | | | | | | | | | | | | |
| Securities issued or secured by Colombian government | | $ | 496,184 | | | $ | 17,151 | | | $ | (279 | ) | | $ | (10,257 | ) | | $ | 489,569 | |
| Securities issued or secured by government sponsored enterprise (GSEs) | | | 48,672 | | | | 270 | | | | - | | | | - | | | | 48,402 | |
| Securities issued or secured by financial entities | | | 293,111 | | | | 1,613 | | | | (36 | ) | | | (1,430 | ) | | | 292,964 | |
| Other debt securities | | | 71,194 | | | | 338 | | | | (10 | ) | | | (136 | ) | | | 71,002 | |
| Total short-term investments classified as available for sale | | | 909,161 | | | | 19,372 | | | | (325 | ) | | | (11,823 | ) | | | 901,937 | |
| Long-term investments – available for sale securities: | | | | | | | | | | | | | | | | | | | | |
| Securities issued or secured by Colombian government | | | 806,961 | | | | 22,083 | | | | (9,075 | ) | | | (9,397 | ) | | | 803,350 | |
| Securities issued or secured by government sponsored enterprise (GSEs) | | | 2,100,055 | | | | 7,422 | | | | (1,374 | ) | | | (56 | ) | | | 2,094,063 | |
| Securities issued or secured by financial entities | | | 259,745 | | | | 100 | | | | (1,818 | ) | | | - | | | | 261,463 | |
| Securities issued or secured by the U.S government | | | 700,237 | | | | 503 | | | | (16 | ) | | | (60 | ) | | | 699,810 | |
| Other debt securities | | | 208,334 | | | | 631 | | | | (153 | ) | | | - | | | | 207,856 | |
| Securities issued by mixed- economy governmental entities | | | 1,401,506 | | | | 1,140,507 | | | | - | | | | - | | | | 260,999 | |
| Total long-term investments classified as available for sale | | | 5,476,838 | | | | 1,171,246 | | | | (12,436 | ) | | | (9,513 | ) | | | 4,327,541 | |
| Total available for sale | | $ | 6,385,999 | | | $ | 1,190,618 | | | $ | (12,761 | ) | | $ | (21,336 | ) | | $ | 5,229,478 | |
| | | | | | | | | | | | | | | | | | | | | |
| | | Aggregated Fair
Value | | | Gross Unrealized
Holding Gains | | | Gross
Unrealized
Holding Losses | | | Net Carrying
Amount | | | | | |
| Short-term investments – held to maturity securities: | | | | | | | | | | | | | | | | | | | | |
| Other debt securities | | $ | 3,477 | | | $ | - | | | $ | (3,322 | ) | | $ | 6,798 | | | | | |
| Securities issued or secured by Colombian government | | | 12,285 | | | | 81 | | | | - | | | | 12,204 | | | | | |
| Total short-term investments classified as held to maturity | | | 15,762 | | | | 81 | | | | (3,322 | ) | | | 19,002 | | | | | |
| | | | | | | | | | | | | | | | | | | | | |
| Long-term investments- held to maturity securities: | | | | | | | | | | | | | | | | | | | | |
| Securities issued or secured by Colombian government | | | 109,629 | | | | 11,257 | | | | - | | | | 98,372 | | | | | |
| Total long-term investments classified as held to maturity | | | 109,629 | | | | 11,257 | | | | - | | | | 98,372 | | | | | |
| Total held to maturity | | $ | 125,391 | | | $ | 11,338 | | | $ | (3,322 | ) | | $ | 117,374 | | | | | |
| As of December 31, 2010 | | Aggregated
Fair Value | | | Gross Unrealized
Holding Gains | | | Gross
Unrealized
Holding
Losses | | | Gross
Recognized
Losses | | | Cost Basis | |
| Short-term investments – available for sale securities: | | | | | | | | | | | | | | | | | | | | |
| Securities issued or secured by Colombian government | | $ | 19,527 | | | $ | 255 | | | $ | - | | | $ | - | | | $ | 19,272 | |
| Securities issued or secured by financial entities | | | 39,408 | | | | - | | | | (1,338 | ) | | | (156 | ) | | | 40,902 | |
| Total short-term investments classified as available for sale | | | 58,935 | | | | 255 | | | | (1,338 | ) | | | (156 | ) | | | 60,174 | |
| Long-term investments – available for sale securities: | | | | | | | | | | | | | | | | | | | | |
| Securities issued or secured by Colombian government | | | 1,622,809 | | | | 35,723 | | | | (5,546 | ) | | | (19,654 | ) | | | 1,612,286 | |
| Securities issued or secured by government sponsored enterprise (GSEs) | | | 1,498,957 | | | | 33,141 | | | | (1,021 | ) | | | (21,382 | ) | | | 1,488,219 | |
| Securities issued or secured by financial entities | | | 80,636 | | | | 201 | | | | (458 | ) | | | (1,430 | ) | | | 82,323 | |
| Securities issued or secured by the U.S government | | | 642,974 | | | | 9,061 | | | | (1,924 | ) | | | - | | | | 635,837 | |
| Other debt securities | | | 29,585 | | | | 459 | | | | - | | | | (136 | ) | | | 29,262 | |
| Securities issued by mixed-economy governmental entities | | | 1,932,115 | | | | 1,656,071 | | | | - | | | | - | | | | 276,044 | |
| Total long-term investments classified as available for sale | | | 5,807,076 | | | | 1,734,656 | | | | (8,949 | ) | | | (42,602 | ) | | | 4,123,971 | |
| Total available for sale | | $ | 5,866,011 | | | $ | 1,734,911 | | | $ | (10,287 | ) | | $ | (42,758 | ) | | $ | 4,184,145 | |
| | | | | | | | | | | | | | | | | | | | | |
| | | Aggregated Fair
Value | | | Gross Unrealized
Holding Gains | | | Gross
Unrealized
Holding
Losses | | | Net Carrying
Amount | | | | | |
| Short-term investments – held to maturity securities: | | | | | | | | | | | | | | | | | | | | |
| Other debt securities | | $ | 7,700 | | | $ | - | | | $ | - | | | $ | 7,700 | | | | | |
| Securities issued or secured by the U.S government | | | 9,867 | | | | 199 | | | | - | | | | 9,669 | | | | | |
| Total short-term investments classified as held to maturity | | | 17,567 | | | | 199 | | | | - | | | | 17,369 | | | | | |
| | | | | | | | | | | | | | | | | | | | | |
| Long-term investments-held to maturity securities: | | | | | | | | | | | | | | | | | | | | |
| Securities issued or secured by Colombian government | | | 120,322 | | | | 9,567 | | | | - | | | | 110,755 | | | | | |
| Total long-term investments classified as held to maturity | | | 120,322 | | | | 9,567 | | | | - | | | | 110,755 | | | | | |
| Total held to maturity | | $ | 137,889 | | | $ | 9,766 | | | $ | - | | | $ | 128,124 | | | | | |
The maturities of fixed-income investments as of December 31, 2012 and 2011 are as follows:
| As of December 31, 2012 |
| | | Available for Sale | | | Held to Maturity | |
| | | Cost Basis | | | Fair Value | | | Cost Basis | | | Fair Value | |
| | | | | | | | | | | | | |
| Due in one year or less | | $ | 1,330,105 | | | $ | 1,331,665 | | | $ | 5,054 | | | $ | 2,411 | |
| Due in one to five years | | | 4,070,503 | | | | 5,205,708 | | | | 87,988 | | | | 96,791 | |
| Due in five to ten years | | | 375,141 | | | | 390,037 | | | | - | | | | - | |
| Total | | $ | 5,775,749 | | | $ | 6,927,410 | | | $ | 93,042 | | | $ | 99,202 | |
| As of December 31, 2011 |
| | | Available for Sale | | | Held to Maturity | |
| | | Cost Basis | | | Fair Value | | | Cost Basis | | | Fair Value | |
| | | | | | | | | | | | | |
| Due in one year or less | | $ | 901,937 | | | $ | 909,161 | | | $ | 19,002 | | | $ | 15,762 | |
| Due in one to five years | | | 3,961,965 | | | | 3,974,007 | | | | 98,372 | | | | 109,629 | |
| Due in five to ten years | | | 365,576 | | | | 1,502,831 | | | | - | | | | - | |
| Total | | $ | 5,229,478 | | | $ | 6,385,999 | | | $ | 117,374 | | | $ | 125,391 | |
Amounts recorded in other comprehensive income in prior years realized on securities available for sale sold at December 31, 2012, 2011 and 2010 were:
| | | 2012 | | | 2011 | | | 2010 | |
| | | | | | | | | | |
| Losses | | $ | 2,004 | | | $ | 5,837 | | | $ | 67,225 | |
| Gains | | $ | 33,955 | | | $ | 41,331 | | | $ | 24,322 | |
Foreign exchange gains and losses on securities available for sale
Under Colombian Government Entity GAAP, changes in account balances resulting from variations in foreign currency exchange rates are reflected in the Company’s net income. Under U.S. GAAP, any change in value of available-for-sale debt securities as a result of changes in foreign currency exchange rates is reflected in equity as required under the guidance in ASC subtopic 320-10-35. The amount reclassified from earnings under Colombian Government Entity GAAP purposes to other comprehensive income for U.S. GAAP purposes includes $(112,060), $197,664 and $18,931 in 2012, 2011 and 2010, respectively that correspond to exchange rate differences.
Unrealized loss
Available-for-sale securities in an unrealized loss position as of December 31, 2012 and 2011 are as follows:
| As of December 31, 2012 |
| | | Less than 12 months | | | 12 Months or Greater | | | Total | |
| Descriptions of Securities | | Fair Value | | | Unrealized
Losses | | | Fair Value | | | Unrealized
Losses | | | Fair Value | | | Unrealized
Losses | |
| Securities issued or secured by Colombian government | | $ | 33,317 | | | $ | 41 | | | $ | 262,014 | | | $ | 1,059 | | | $ | 295,331 | | | $ | 1,100 | |
| Securities issued or secured by financial entities | | | 11,273 | | | | 5 | | | | - | | | | - | | | | 11,273 | | | | 5 | |
| Securities issued or secured by government sponsored enterprise (GSEs) | | | 92,536 | | | | 57 | | | | 942,131 | | | | 401 | | | | 1,034,667 | | | | 459 | |
| Securities issued or secured by the U.S. government | | | - | | | | - | | | | - | | | | - | | | | - | | | | - | |
| Other debt securities | | | 71,320 | | | | 90 | | | | 80,368 | | | | 283 | | | | 151,688 | | | | 372 | |
| Total | | $ | 208,446 | | | $ | 193 | | | $ | 1,284,513 | | | $ | 1,743 | | | $ | 1,492,959 | | | $ | 1,936 | |
| As of December 31, 2011 |
| | | Less than 12 months | | | 12 Months or Greater | | | Total | |
| Descriptions of Securities | | Fair Value | | | Unrealized
Losses | | | Fair Value | | | Unrealized
Losses | | | Fair Value | | | Unrealized
Losses | |
| Securities issued or secured by Colombian government | | $ | 248,874 | | | $ | 279 | | | $ | 171,756 | | | $ | 9,075 | | | $ | 420,630 | | | $ | 9,354 | |
| Securities issued or secured by financial entities | | | 84,860 | | | | 36 | | | | 241,208 | | | | 1,818 | | | | 326,068 | | | | 1,854 | |
| Securities issued or secured by government sponsored enterprise (GSEs) | | | - | | | | - | | | | 757,494 | | | | 1,374 | | | | 757,494 | | | | 1,374 | |
| Securities issued or secured by the U.S. government | | | - | | | | - | | | | 48,759 | | | | 16 | | | | 48,759 | | | | 16 | |
| Other debt securities | | | 30,488 | | | | 10 | | | | 89,532 | | | | 153 | | | | 120,020 | | | | 163 | |
| Total | | $ | 364,222 | | | $ | 325 | | | $ | 1,308,749 | | | $ | 12,436 | | | $ | 1,672,971 | | | $ | 12,761 | |
Restricted Assets
Under U.S. GAAP the Company classifies as restricted assets, those assets where their availability depends on a court decision, such as cash, trust funds or investments. The detail of restricted assets as of December 31, 2012 and 2011 is as follows:
| Concept | | 2012 | | | 2011 | |
| Investment securities | | $ | 448,705 | | | $ | 423,020 | |
| Specific destination funds | | | 79,497 | | | | 78,515 | |
| Cash | | | 50,483 | | | | 48,347 | |
| Total | | $ | 578,685 | | | $ | 549,882 | |
The most significant restricted asset is related to Santiago de las Atalayas Fund which is detailed in the chart below:
| Concept | | 2012 | | | 2011 | |
| Investments available for sale | | $ | 424,213 | | | $ | 415,722 | |
| Specific destination funds * | | | 163 | | | | 1,999 | |
| Cash | | | 124 | | | | 597 | |
| Total | | $ | 424,500 | | | $ | 418,318 | |
*This fund receives the coupons and principal payments of Santiago de las Atalayas investments in U.S. dollars.
The investments related to Santiago de las Atalayas at December 31, 2012 and 2011 consist of the following:
| As of December 31, 2012 | | Aggregated
Fair Value | | | Gross
Unrealized
Holding
Gains | | | Gross
Unrealized
Holding
Losses | | | Gross
Recognized
Losses | | | Cost Basis | |
| Short-term Investments – available for sale securities: | | | | | | | | | | | | | | | | | | | | |
| Securities issued or secured by Colombian government | | $ | 30,297 | | | $ | 6,903 | | | $ | (6 | ) | | $ | (6,896 | ) | | $ | 30,296 | |
| Total Short-term Investments classified as available for sale | | | 30,297 | | | | 6,903 | | | | (6 | ) | | | (6,896 | ) | | | 30,296 | |
| Long-term Investments – available for sale securities: | | | | | | | | | | | | | | | | | | | | |
| Securities issued or secured by Colombian government | | | 378,819 | | | | 31,759 | | | | (7 | ) | | | (6,555 | ) | | | 353,622 | |
| Other debt securities | | | 15,098 | | | | 106 | | | | - | | | | - | | | | 14,992 | |
| Total Long-term Investments classified as available for sale | | $ | 393,917 | | | $ | 31,865 | | | $ | (7 | ) | | $ | (6,555 | ) | | $ | 368,614 | |
| Total Available for Sale | | $ | 424,214 | | | $ | 38,768 | | | $ | (13 | ) | | $ | (13,451 | ) | | $ | 398,910 | |
| As of December 31, 2011 | | Aggregated
Fair Value | | | Gross
Unrealized
Holding
Gains | | | Gross
Unrealized
Holding
Losses | | | Gross
Recognized
Losses | | | Cost Basis | |
| Long-term investments - available for sale securities: | | | | | | | | | | | | | | | | | | | | |
| Securities issued or secured by Colombian government | | | 415,722 | | | | 19,656 | | | | (300 | ) | | | (10,062 | ) | | | 406,427 | |
| Total long-term investments classified as available for sale | | $ | 415,722 | | | $ | 19,656 | | | $ | (300 | ) | | $ | (10,062 | ) | | $ | 406,427 | |
The unrealized gains and losses of the restricted assets are recognized in other comprehensive income
Impairment of investment securities are reported differently under Colombian Government Entity GAAP and U.S. GAAP. Under Colombian Government Entity GAAP, impairment is charged to income in the current period, but recoveries in value can be recorded up to the amount that was originally impaired. Under U.S. GAAP, other-than-temporary impairment should be charged to income in the current period and a new cost basis for the security is established. Subsequent increases in the cost basis of an impaired investment as a result of a recovery in fair value are included in other comprehensive income.
The Company has a policy under which they conduct periodic reviews of marketable securities to assess whether other-than-temporary impairment exists. A number of factors are considered in performing an impairment analysis of securities. Those factors include:
| a) | The length of time and the extent to which the market value of the security has been less than cost; |
| b) | The financial condition and near-term prospects of the issuer, including any specific events which influence the operations of the issuer (such as changes in technology that may impair the earnings potential of the investment, or the discontinuance of a segment of a business that may affect the future earnings potential); and |
| c) | Carry out the analysis as instructed in ASC paragraph 320-10-65-1 which includes the comparison of the fair value and the amortized cost, evaluates the intention to sell the security and if it is more-likely-than-not that the Company will be required to sell the security prior to recovery, including the existence of a credit loss. |
The Company also takes into account changes in global and regional economic conditions and changes related to specific issuers or industries that could adversely affect these values.
Ecopetrol’s marketable security portfolio consists only of debt securities, such as treasury investments, bonds, and commercial papers. For this reason, the Company has an internal policy to limit the ratings of their investments and issuers to the following ratings:
| Credit Rating Agency | | Short – Term
Credit Rating | | Long – Term
Credit Rating | |
| Standard & Poor’s | | A-1 | | A | |
| Moody’s Investors Services | | P-1 | | A2 | |
| Fitch Ratings | | F-1 | | A | |
The Company recognized impairment on its investment securities amounting to $50,126, $116 and $44,851 in 2012, 2011 and 2010 respectively.
| ii. | INVESTMENTS IN NON-MARKETABLE SECURITIES |
| a. | Equity Method and Valuation Surplus |
Under Colombian Government Entity GAAP , equity securities for which prices are unquoted, or for which trading volume is minimal, and the Company does not control the investee, are accounted for under the cost method and subsequently are valued by the shareholders' equity comparison method. Under the equity comparison method, the Company accounts for the difference between its proportionate share of shareholders' equity of the investee and its acquisition cost, adjusted for inflation through 2001, in a separate valuation account in the assets and equity (valuation surplus), if the proportionate share of shareholders’ equity of the investee is higher than its cost or as an allowance for losses, affecting net income, if the cost is higher than the proportionate share of shareholders’ equity of the investee. The proportionate share of shareholder’s equity is considered as the market value for this purpose and is known as book value. Under this method, the Company only records dividends as income when received. From 2008 the Colombian Government Entity GAAP incorporated the concept of significant influence for the recognition of investments in associated entities and established the equity method to update these investments.
Under U.S. GAAP, an investment in a non-marketable equity security is recorded using the equity method when the investor can exercise significant influence over the investee, or the cost method when significant influence cannot be exercised. Under the equity method of accounting for U.S. GAAP the carrying value of such an investment is adjusted to reflect (1) the Company’s proportionate share of earnings or losses from the investee and (2) additional investments and distributions of dividends. The Company’s proportionate share of income or loss is reported in earnings but any dividends or additional investments are reported only as an adjustment of the carrying amount of the investment.
The differences between the application of the cost and the equity method under U.S. GAAP were:
| · | Reversal of valuations and allowances for losses recorded under Colombian Government Entity GAAP |
| · | Reversal of inflation adjustments recorded under Colombian Government Entity GAAP |
| · | Reversal of Goodwill amortization and impairment |
| · | Inclusion of share of earnings or losses under U.S. GAAP, net of inter-company eliminations. |
| · | Inclusion of share in Other Comprehensive Income under U.S. GAAP. |
| · | Recognition of impairment under U.S. GAAP |
The summary of the investments valued by the equity method for U.S. GAAP purposes is shown in the following table:
For the Year Ended December 31, 2012
| Company | | Percentage of
Voting
Interest | | | Equity
Calculated
under
U.S. GAAP | | | Equity
Under
Colombian
GAAP | | | Assets
Under
Colombian
GAAP | | | Liabilities
Under
Colombian
GAAP | | | Net Income
(Loss) Under
Colombian
GAAP | | | Investment
Under U.S.
GAAP
Equity
Method | | | Equity
Method
Accounting
Adj (*) | | | Total
Equity
Method
Investment | |
| | | | | | | | | | | | | | | | | | | | | | | | | | | | |
| Invercolsa S.A. | | | 43.35 | % | | $ | 208,648 | | | $ | 554,914 | | | $ | 571,945 | | | $ | 17,031 | | | $ | 82,570 | | | $ | 90,449 | | | $ | - | | | $ | 90,449 | |
| Serviport S.A. | | | 49.00 | % | | | 6,660 | | | | 14,679 | | | | 47,919 | | | | 33,240 | | | | 2,181 | | | | 3,263 | | | | - | | | | 3,263 | |
| Offshore International Group | | | 50.00 | % | | | 914,845 | | | | 914,845 | | | | 1,794,451 | | | | 879,606 | | | | 122,287 | | | | 457,422 | | | | 433,516 | | | | 890,938 | |
| Ecodiesel S.A. | | | 50.00 | % | | | 30,938 | | | | 38,817 | | | | 129,258 | | | | 90,441 | | | | 17,455 | | | | 15,469 | | | | - | | | | 15,469 | |
| Sociedad Portuaria de Olefinas | | | 50.00 | % | | | 452 | | | | 878 | | | | 1,224 | | | | 346 | | | | 112 | | | | 226 | | | | - | | | | 226 | |
| Transgas de Occidente S.A. | | | 20.00 | % | | | 127,912 | | | | 206,382 | | | | 356,244 | | | | 149,862 | | | | 7,285 | | | | 25,582 | | | | (11,676 | ) | | | 13,906 | |
| | | | | | | | | | | | | | | | | | | | | | | | | | | $ | 592,411 | | | $ | 421,840 | | | $ | 1,014,251 | |
For the Year Ended December 31, 2011
| Company | | Percentage of
Voting
Interest | | | Equity
Calculated
under
U.S. GAAP | | | Equity
Under
Colombian
GAAP | | | Assets
Under
Colombian
GAAP | | | Liabilities
Under
Colombian
GAAP | | | Net Income
(Loss) Under
Colombian
GAAP | | | Investment
Under U.S.
GAAP
Equity
Method | | | Equity
Method
Accounting
Adj (*) | | | Total
Equity
Method
Investment | |
| | | | | | | | | | | | | | | | | | | | | | | | | | | | |
| Invercolsa S.A. | | | 43.35 | % | | $ | 226,891 | | | $ | 536,924 | | | $ | 537,332 | | | $ | 408 | | | $ | 89,713 | | | $ | 98,357 | | | $ | - | | | $ | 98,357 | |
| Serviport S.A. | | | 49.00 | % | | | 2,503 | | | | 10,469 | | | | 50,005 | | | | 39,536 | | | | (750 | ) | | | 1,226 | | | | - | | | | 1,226 | |
| Offshore International Group | | | 50.00 | % | | | 882,435 | | | | 882,435 | | | | 1,807,581 | | | | 925,145 | | | | 157,644 | | | | 441,218 | | | | 476,596 | | | | 917,814 | |
| Ecodiesel S.A. | | | 50.00 | % | | | 15,889 | | | | 21,362 | | | | 138,170 | | | | 116,808 | | | | - | | | | 7,944 | | | | - | | | | 7,944 | |
| Sociedad Portuaria de Olefinas | | | 50.00 | % | | | 420 | | | | 772 | | | | 1,042 | | | | 270 | | | | 8 | | | | 210 | | | | - | | | | 210 | |
| Transgas de Occidente S.A. | | | 20.00 | % | | | 121,455 | | | | 209,114 | | | | 415,669 | | | | 206,555 | | | | 20,007 | | | | 24,291 | | | | (12,828 | ) | | | 11,463 | |
| | | | | | | | | | | | | | | | | | | | | | | | | | | $ | 573,246 | | | $ | 463,768 | | | $ | 1,037,014 | |
(*) Represents the purchase price allocation adjustments
| Concept | | 2012 | | | 2011 | |
| Fair value of property, plant and equipment | | $ | (8,847 | ) | | $ | (9,414 | ) |
| Goodwill | | | 430,687 | | | | 473,182 | |
| Total | | $ | 421,840 | | | $ | 463,768 | |
The number of shares which the Company owns with respect to its investment in Invercolsa S.A. has been subject to a legal dispute with another Invercolsa shareholder. Lower court decisions had ruled in favor of both the Company and the other shareholder and a final court decision in January 2011 determined that 324 million shares, equivalent to 11.58% of the capital stock of Invercolsa should be returned to Ecopetrol. As a result Ecopetrol controls 43.35%. The dividends paid in respect of the shares returned to Ecopetrol are still in dispute, as well as the ownership of shares constituting 8.53% of Invercolsa. The resolution of these matters is still pending.
Under Colombian Government Entity GAAP it is not mandatory to perform impairment tests of the Equity Method Investments unless positive evidence is identified. For the years 2011, the investment in Offshore International Group was evaluated for impairment resulting in a loss of $13,136.
The impairment under U.S. GAAP ASC paragraph 325-20-35 1A and 2, assets held at cost, including non-marketable equity investments, should be evaluated for impairment if the Company is aware of any events or changes in circumstances that may have significant adverse effects on the fair value of the investment. If the Company believes such circumstances exist, the Company would estimate the asset’s fair value and compare that to the cost to determine if any impairment is necessary. During 2012 and 2011 the Company eventhough it was not aware of any event that may have a significant adverse effect on the fair value of the investment, calculate the fair value of these investments and concluded that there were not impaired
| c. | Variable Interest Entity (VIE) |
Under U.S. GAAP, ASC paragraph 810-10-15-13 requires that consolidated financial statements include subsidiaries in which the Company has a controlling financial interest, i.e., a majority voting interest. However, application of the majority voting interest requirement to certain types of entities may not identify the party with a controlling financial interest because that interest may be achieved through other arrangements. Thus, the U.S. GAAP rules also require a Company to consolidate a variable interest entity if that Company is the primary beneficiary of the VIE, with that has the power to direct the activities of the VIE that most significantly affect the entity’s economic performance and will absorb a majority of the entity’s expected losses, receive a majority of the entity’s expected residual returns, or both. In determining whether it is a primary beneficiary of a variable interest entity, a Company shall treat variable interests in that same entity held by the Company’s related parties as its own interest. Under Colombian Government Entity GAAP, consolidated financial statements only include subsidiaries in which the Company has the majority voting interest.
In October 2009, the subsidiary Oleoducto de los Llanos Orientales (hereinafter “ODL”) assigned its rights under a "Ship or Pay” contract for the completion of a securitization for the purpose of obtaining the funds required to finish the second phase of the project, the refund of capital to the associates, and maintain the capital structure initially agreed. The structure of this issuance was made through assets in a trust fund (hereinafter “Fideicomiso P.A. ODL - ECOPETROL”) administered by Corficolombiana S.A., who has to pay the security holder on the due dates. Additionally, each month, the trust Company must report to ODL income and expenses that are generated in this process and that are paid, if applicable, to ODL as advances.
Based on the ASC 810, ODL determined that it must consolidate Fideicomiso P.A. ODL - ECOPETROL, since it is a VIE and ODL is the primary beneficiary and therefore, consolidated its financial statements for U.S. GAAP purposes.
The adjustments of Fideicomiso P. A. ODL – ECOPETROL, according to financial information under U.S. GAAP as of and for the years ended December 31, 2012 and 2011, are as follows:
| | | 2012 | | | 2011 | |
| | | | | | | |
| Assets | | $ | (92,103 | ) | | $ | 6,580 | |
| Liabilities | | | 92,090 | | | | (6,593 | ) |
| Equity | | $ | (13 | ) | | $ | (13 | ) |
| Net income | | $ | - | | | $ | - | |
The financial information summary of Fideicomiso P. A. ODL - ECOPETROL according to U.S. GAAP as of and for the years ended December 31, 2012 and 2011, are as follows:
| | | 2012 | | | 2011 | |
| | | | | | | |
| Assets | | $ | 539,506 | | | $ | 530,969 | |
| Liabilities | | | (411,722 | ) | | | (510,405 | ) |
| Equity | | $ | 127,784 | | | $ | 20,564 | |
| Net income | | $ | 109,204 | | | $ | 8,336 | |
Ecopetrol is exposed to market risk from changes in foreign currency exchange rates, interest rate risk of its financial obligations and to commodity price risk, resulting from the fluctuations of international crude oil prices which affect its earnings, cash flows and financial condition. Ecopetrol manages its exposure to these market risks through its regular operating and financial activities and, when appropriate, through the use of derivative financial instruments. Ecopetrol has established a control to assess, approve and monitor derivative financial instrument activities. Ecopetrol does not buy, hold or sell derivative financial instruments for trading purposes. Ecopetrol's primary foreign currency exposures relate to the U.S. dollar; however, Ecopetrol manages its foreign currency risk position internally, using non-deliverable forwards, according to the size of the mismatches between its asset-liability position in U.S. dollars and its asset-liability position in Colombian pesos. If no mismatches occur Ecopetrol has a perfect natural hedge. Ecopetrol also utilizes other derivative agreements to mitigate changes in the fair value of commodities. None of the derivatives were designated or documented for hedge accounting.
The Company periodically enters into call and put option contracts to cover the price risk associated with fluctuations in market prices of asphalt. The option contracts limit the unfavorable effect that the price increase will have on asphalt. The maximum term over which the Company is managing its exposure to the variability for commodity price risk is 12 months.
As of December 31, 2012, only the subsidiary Hocol S.A. is exposed to foreign currency fluctuations. Such exposures arise primarily from expenditures that are denominated in currencies other than the functional currency. The Company constantly monitors its exposure to foreign currency risks. To reduce its foreign currency exposure associated with operating expenses incurred in Colombian pesos, the Company may enter into foreign currency derivatives to manage such risks. These derivatives are recognized at their fair value as either a financial asset or obligation with the corresponding income or expense recognized.
Total results recognized related to derivative activities during the years are as follows:
| | | 2012 | | | 2011 | | | 2010 | |
| | | Realized | | | Unrealized | | | Realized | | | Unrealized | | | Realized | | | Unrealized | |
| Options (1) | | $ | 4,315 | | | $ | 4,619 | | | $ | (199,402 | ) | | $ | (2,370 | ) | | $ | (13,175 | ) | | $ | (1,474 | ) |
| Swaps | | | - | | | | - | | | | (613,387 | ) | | | - | | | | (7,031 | ) | | | 2,242 | |
| Forwards | | | 695 | | | | - | | | | 2,549 | | | | 14 | | | | 245 | | | | 107 | |
| Total | | $ | 5,010 | | | $ | 4,619 | | | $ | (810,240 | ) | | $ | (2,356 | ) | | $ | (19,961 | ) | | $ | 875 | |
| | (1) | Amounts include premiums paid |
Under Colombian Government Entity GAAP, each derivative has its own accounting treatment depending on the type of derivative. Option premiums paid are recorded as deferred charges and amortized to the income statement as financial expense on a straight-line basis over the life of the contract, the option contract is recognized in memo accounts unless it is likely to be exercised, and the gain is recognized as an investment. Swap and forward contract net results are recorded as an investment. In all cases, gains and losses are recognized in earnings as financial income or expense. Amounts receivable or payable upon maturity resulting from net payments are recorded using current rates for the period.
U.S. GAAP requires that all derivative instruments be recorded on the balance sheet at fair value. Changes in the fair value of derivatives are recorded each period in current earnings. The fair value of derivatives instruments is recorded as other assets and other liabilities.
Under U.S. GAAP, embedded derivative instruments shall be separated from the host contract, and accounted for using different measurement attributes, if certain conditions are met. In the case of the Company, some contracts to which the Company is counterparty include embedded foreign exchange derivatives. According to ASC paragraph 815-15-15-10 through 13 these contracts do not require separate accounting for the embedded derivative and the host contract because contract payments are made in the functional currency of a party to the contract or contract payments are made in a currency in which the price of the good or service delivered is routinely denominated in international commerce. In other cases, contracts indexed to inflation considered clearly and closely related.
Gas imbalance agreements were evaluated to identify if they were derivatives. Management concluded that these agreements are not derivatives since they do not contain fixed notional amounts.
| iv. | EXCHANGE OF NON-MONETARY ASSETS |
During 2007, the Company exchanged a refinery business with a book value of $234,371 for a 49% interest in Refinería de Cartagena S.A. The Company estimated the fair value of the 49% investment as $1,369,546. Under Colombian Government Entity GAAP, this difference between the cost of the assets given and the fair value of the assets received was recorded as an increase to asset revaluation and equity. However, under ASC Subtopic 845-10-30, 51% of the difference between the book value of the Refinery and the fair value of the assets received, which the Company determined to be a more reliable indicator of the value of the exchange since the fair value of the investment was greater, was recorded in the results of operations as a gain in the amount of $578,939. The remaining 49% of unrealized gain was recorded as a deferred gain with a corresponding increase to the investment, equivalent to a deferred gain of $556,236, to be amortized over the expected useful life of the equipment. In 2011, the Company determined that in 2009, as a result of the acquisition of 51% of the remaining participation in Reficar S.A., the unamortized unrealized gain should have been recorded at fair value since the Company obtained control of Refinería de Cartagena S.A. in 2009 in line with the acquired entity’s fair value of the assets and liabilities acquired as of May 27, 2009. However, according to ASC 250 and SAB 108, we do not consider such amount significant and decided to fully amortize the remaining balance as of 2011. As a result, the net income reconciliation includes amortized income of $425,521 in 2011 and $23,640 in 2010, corresponding to the amortization of the deferred gain.
Under Colombian Government Entity GAAP, the Equity Tax is recognized as a deferred charge for the total amount due payable during the years 2011 through 2014. The deferred charge is amortized as an expense of the year based on the payments made. The local regulatory entities also allowed companies that applied inflation adjustments and still have outstanding balances in the Equity Revaluation account to reduce such balance instead of recognizing a deferred charge. Other deferred assets recognized under Colombian Government Entity GAAP are related to certain pre-operating expenses and other charges that include normal recurring maintenance and fees.
For U.S. GAAP purposes, the amount of the adjustment in the Company’s net income related to deferred charges amounting to $493,159 in 2012, $1,710,944 in 2011 and $7,167 in 2010.
| vi. | EMPLOYEE BENEFIT PLANS |
Under Colombian Government Entity GAAP, the Company estimates the net present value of its actuarial liability for all pension plans and other post-retirement obligations. Annually, the Company estimates the net present value of the actuarial liability and adjusts the recorded liability accordingly. The amount of the adjustment is reflected in the Company’s net income.
For other post-retirement benefits, the payments are made according to seniority and the salary at the time of retirement, as stipulated in the Collective Labor Agreement and Agreement No. 01.
Under the post-retirement benefits plan for Ecopetrol personnel, the Company covers 90% of educational expenses for children of employees, including enrollment fees, tuition and other associated costs. A fixed annual sum, depending on grade level, is also provided for the acquisition of textbooks. Educational coverage includes kindergarten, elementary school, high school and college. Ecopetrol´s financial statements must also show the cost of post-retirement educational benefits for children of retired employees, since benefits continue irrespective of retirement or death.
According to the Collective Labor Agreement and Agreement No. 01, the Company will pay for health services for employees and enrolled family members. Health services include: office visits and required laboratory services, drugs, diagnostic examinations, ambulatory treatment, hospitalization due to illness or accident, surgery due to illness or accident, maternity and rehabilitation treatments and orthopedic parts. Therefore, such post-retirement health benefit costs are recorded in the consolidated financial statements of the Company prepared in accordance with Colombian Government Entity GAAP, since retired workers and enrolled family members continue to receive full medical coverage. The same is true for deceased non-retired employees.
U.S. GAAP requires the recognition of pension, health care and education plans costs based on actuarial computations under a prescribed methodology which differs from that used under RCP. For purposes of the U.S. GAAP reconciliation, the transition obligation is calculated at the date the Company adopted the ASC Topic 420, 715, 805, and 835 Employers’ Accounting for Pensions and is being amortized as of January 1, 1989. The transition obligation for the education and medical plan is being amortized from January 1, 1995
Under Colombian law, employees are entitled to one month salary for each year of service. This benefit is known as the “severance obligation” or “cesantias”. This benefit accumulates during the time of employment and is paid to employees upon their termination or retirement from Ecopetrol. However, employees may request advanced benefit payments at any time. In 1990, the Colombian government revised its labor regulations to permit companies, subject to employee approval, to pay the severance obligation to their employees on a current basis. Law 50 of 1990 also enabled each employee to freely choose yearly which trust fund would manage the amount accrued during each year in which they are eligible for severance payments. This amount must be transferred by the Company to the trust fund no later than the next subsequent year.
In addition, the Company under Colombian law must pay pension bonds for certain employees when they leave Ecopetrol. Those bonds payable accrue interest at the DTF rate, according to the class of bonds, as follows:
| 1) | For pension bonds type B, CPI + 4%; |
| 2) | For pension bonds type A, with date of transfer before December 31, 1998, CPI + 4%; |
| 3) | For the remaining pension bonds type A, CPI + 3%. |
The economic assumptions used in the determination of pension obligations under U.S. GAAP differ from those used under RCP since the latter are established annually by the Colombian regulations.
Ecopetrol has not made any change to its methodology or accounting policy for the determination of disclosure information. However, since 2011 they are based on the calculations of a new actuary and therefore have a new valuation system.
The combined costs for the above mentioned benefit plans, determined using U.S. GAAP, for the years ended December 31, 2012, 2011 and 2010 are summarized below: (all obligations were measured at year-end)
| | | 2012 | | | 2011 | | | 2010 | |
Components of net periodic benefit
costs: | | Pension | | | Other
Benefits (*) | | | Total | | | Pension | | | Other
Benefits (*) | | | Total | | | Pension | | | Other
Benefits (*) | | | Total | |
| Service cost | | $ | - | | | $ | 44,089 | | | $ | 44,089 | | | $ | - | | | $ | 788 | | | $ | 788 | | | $ | 46,686 | | | $ | 32,840 | | | $ | 79,526 | |
| Interest cost | | | 840,944 | | | | 525,628 | | | | 1,366,572 | | | | 830,411 | | | | 371,698 | | | | 1,202,109 | | | | 845,144 | | | | 386,159 | | | | 1,231,303 | |
| Expected return on plan assets | | | (720,034 | ) | | | (45,265 | ) | | | (765,299 | ) | | | (714,757 | ) | | | (164,644 | ) | | | (879,401 | ) | | | (1,303,018 | ) | | | (290,075 | ) | | | (1,593,093 | ) |
| Amortization of net (gain) or loss | | | 18,531 | | | | 81,589 | | | | 100,120 | | | | 592,582 | | | | 24,564 | | | | 617,146 | | | | 22,977 | | | | 41,293 | | | | 64,270 | |
| Net periodic pension cost under U.S. GAAP - (gain) or loss | | | 139,441 | | | | 606,041 | | | | 745,482 | | | | 708,236 | | | | 232,406 | | | | 940,642 | | | | (388,211 | ) | | | 170,217 | | | | (217,994 | ) |
| Net periodic pension cost under Colombian GAAP (gain) or loss | | | (83,776 | ) | | | 849,961 | | | | 766,185 | | | | 565,725 | | | | 663,536 | | | | 1,229,261 | | | | 264,693 | | | | (146,411 | ) | | | 118,282 | |
| Difference to be recognized under U.S. GAAP (income) loss | | $ | 223,217 | | | $ | (243,920 | ) | | $ | (20,703 | ) | | $ | 142,511 | | | $ | (431,130 | ) | | $ | (288,619 | ) | | $ | (652,904 | ) | | $ | 316,628 | | | $ | (336,276 | ) |
(*) Other benefits include education, health care, pension bonds and accrued retroactive severance.
The changes in the benefit obligations and in plan assets for the above mentioned benefit plans, determined using U.S. GAAP, for the years end December 31, 2012 and 2011, are summarized below:
| | | Pension Plan | | | Other Benefits | |
| | | 2012 | | | 2011 | | | 2012 | | | 2011 | |
| Reconciliation of project benefit obligation: | | | | | | | | | | | | | | | | |
| Project benefit obligation as of January 1 | | $ | (11,196,520 | ) | | $ | (10,686,243 | ) | | $ | (6,628,739 | ) | | $ | (4,888,821 | ) |
| Service cost | | | - | | | | - | | | | (44,089 | ) | | | (788 | ) |
| Interest cost | | | (840,944 | ) | | | (830,411 | ) | | | (525,628 | ) | | | (371,698 | ) |
| Actuarial (gain) loss | | | (802,355 | ) | | | (332,635 | ) | | | 155,978 | | | | (1,640,621 | ) |
| Benefit payments | | | 660,243 | | | | 652,769 | | | | 271,656 | | | | 273,189 | |
| Projected benefit obligation as of December 31 | | $ | (12,179,576 | ) | | $ | (11,196,520 | ) | | $ | (6,770,822 | ) | | $ | (6,628,739 | ) |
| Reconciliation of plan assets : | | | | | | | | | | | | | | | | |
| Fair value of plan assets as of January 1 | | | 10,631,832 | | | | 9,105,179 | | | | 671,346 | | | | 2,097,376 | |
| Fund contribution | | | - | | | | 1,568,695 | | | | 269,048 | | | | (1,568,695 | ) |
| Expected return on plan assets | | | 720,034 | | | | 714,757 | | | | 45,265 | | | | 164,644 | |
| Benefits paid | | | (660,243 | ) | | | (652,769 | ) | | | (271,656 | ) | | | (3,137 | ) |
| Actuarial (gain) loss on plan assets | | | 430,848 | | | | (104,030 | ) | | | 29,590 | | | | (18,842 | ) |
| Fair value of plan assets as of December 31 | | $ | 11,122,471 | | | $ | 10,631,832 | | | $ | 743,593 | | | $ | 671,346 | |
| | | | | | | | | | | | | | | | | |
| Projected net benefit obligation and assets, as of December 31 | | | 801,161 | | | | 940,601 | | | | (3,681,660 | ) | | | (3,344,667 | ) |
| Amounts recognized in other comprehensive (income) loss | | | (1,858,266 | ) | | | (1,505,289 | ) | | | (2,345,570 | ) | | | (2,612,726 | ) |
| | | | | | | | | | | | | | | | | |
| Net liability | | | (1,057,105 | ) | | | (564,688 | ) | | | (6,027,230 | ) | | | (5,957,393 | ) |
| Net liability under Colombian Government Entity GAAP | | | (865,328 | ) | | | (949,105 | ) | | | (2,989,847 | ) | | | (2,587,529 | ) |
| Net effect under pension plan and other benefits | | $ | (191,777 | ) | | $ | 384,417 | | | $ | (3,037,383 | ) | | $ | (3,369,864 | ) |
Under U.S. GAAP, the method of allocating the comingled asset fund as of the valuation date between the pension and the pension bond plan have been changed from allocating the asset fund in proportion to the amounts of the respective liabilities.
While under Colombian Government Entity GAAP, to allocating the total return for the year between the two plans by calculating a return for each plan, equal to the fund´s total return, given the beginning balances and actual payments for the year. The allocated return added to the beginning balance plus contributions and less the actual payments results in the year-end balance.
Net liability of employee benefit plans, net of other employee benefits, is classified as follows:
Decree 1861 of 2012 establishes the investment regime for trust funds guaranteeing pension plans of governmental entities, which precepts are intended to bear a moderate risk. Assets fund investment decisions are made accordingly, following, among other, next restrictions:
| - | Investments in public debt shall not exceed 50% of fund assets value. |
| - | Investments in joint portfolios, limited to 5% of fund assets value, are allowed only if its index is representative of general market behavior, and is not related to specific economic sectors or specific issuers. |
| - | Investments in funds representing a foreign index are limited to 5% of fund assets. |
| - | Investments in Ecopetrol S.A. shares are allowed. |
| o | Shares of foreign companies or securities representing these shares. |
| o | Asset-backed securities different from mortgage-backed securities. |
| o | Investments regarding related parties of trust fund manager. |
The fair value of asset fund is calculated using quoted market prices in active markets. The company obtains these quoted prices from renowned trustworthy financial data providers in Colombia or abroad depending on the investment. For those portfolio items not having a quoted price the Company uses an income approach technique capturing observable market data. Our fair value measurements did not use any unobservable inputs for significant valuations as of December 31, 2012.
Net liability of employee benefit plans, net of other employee benefits, is classified as follows:
| | | Pension Plans | | | Other Benefits | | | TOTAL | |
| | | 2012 | | | 2011 | | | 2012 | | | 2011 | | | 2012 | | | 2011 | |
| Current portion | | $ | - | | | $ | - | | | $ | (264,076 | ) | | $ | (268,647 | ) | | $ | (264,076 | ) | | $ | (268,647 | ) |
| Long-term portion | | | (1,057,105 | ) | | | (564,688 | ) | | | (5,763,154 | ) | | | (5,688,746 | ) | | | (6,820,259 | ) | | | (6,253,434 | ) |
| Net liability | | $ | (1,057,105 | ) | | $ | (564,688 | ) | | $ | (6,027,230 | ) | | $ | (5,957,393 | ) | | $ | (7,084,335 | ) | | $ | (6,522,081 | ) |
Under U.S. GAAP, the Company applies the provisions of Statement on ASC Topic 420, 715, 805 and 835, as amended by Statement on ASC Topic No. 450 and 715, Employers Disclosure about Pension and Other Post-retirement Benefits, an amendment to ASC Topic No. 420, 715, 805, and 835, 712 and 710. The Company adopted Statement on ASC Topic No. 715 effective January 1, 2006, in respect of its defined benefits pension, health and education plans. Accordingly, the Company recognizes the overfunded and underfunded status of each of its defined benefit pension and other postretirement benefit plans as an asset or liability and to reflect changes in the funded status through Accumulated Other Comprehensive Income, as a separate component of shareholders’ equity. The actuarial calculations are estimated at year-end dates
As of December 31, 2012 and 2011, net obligation amounts recognized in the balance sheet related to pension, health, education, bonds and severance obligations consist of:
| | | 2012 | | | 2011 | |
| Long-term liability | | | | | | | | |
| Pension | | $ | (1,057,105 | ) | | $ | (564,688 | ) |
| Health care | | | (5,183,081 | ) | | | (5,286,782 | ) |
| Education | | | (476,507 | ) | | | (399,142 | ) |
| Bonds | | | (102,148 | ) | | | - | |
| Severance | | | (1,418 | ) | | | (2,822 | ) |
| Total long-term liability | | $ | (6,820,259 | ) | | $ | (6,253,434 | ) |
As of December 31, 2012, 2011 and 2010, the amounts recognized in accumulated other comprehensive loss, related to pension, health and education obligations consist of:
| | | 2012 | | | 2011 | | | 2010 | |
| Other comprehensive income | | | | | | | | | | | | |
| Actuarial income (loss) | | | | | | | | | | | | |
| Pension | | $ | (1,858,266 | ) | | $ | (1,505,289 | ) | | $ | (1,661,206 | ) |
| Health care | | | (3,239,842 | ) | | | (3,795,848 | ) | | | (1,373,096 | ) |
| Education | | | (213,816 | ) | | | (109,493 | ) | | | (139,445 | ) |
| Bonds | | | 1,102,706 | | | | 1,284,430 | | | | 534,714 | |
| Severance | | | 5,382 | | | | 8,185 | | | | - | |
| Total other comprehensive income (loss) | | | (4,203,836 | ) | | | (4,118,015 | ) | | | (2,639,033 | ) |
| Deferred income tax effect | | | 1,387,266 | | | | 1,358,945 | | | | 870,881 | |
| Total | | $ | (2,816,570 | ) | | $ | (2,759,070 | ) | | $ | (1,768,152 | ) |
The significant variation in the other comprehensive income from 2011 to 2012 relates to health and bonds plans due to changes in actuarial assumptions since the last actuarial valuation.
The Company expects the following amounts in other comprehensive income to be recognized as components of net periodic pension cost during 2013:
| | | Years for
Amortization | | | Amortization | |
| Pension | | | 20.26 | | | $ | (31,605 | ) |
| Bonds | | | 14.07 | | | | 72,362 | |
| Health Care | | | 20.17 | | | | (133,891 | ) |
| Education | | | 20.10 | | | | (8,001 | ) |
| Severance | | | 12.67 | | | | 404 | |
| Total | | | | | | $ | (100,731 | ) |
As of December 31, 2012 and 2011, the amounts of gain (loss) in the year and accumulated related with pension, health, education bonds and severance consist of:
| | | 2012 | | | 2011 | | | 2010 | |
| | | Gain (loss) in the year | | | Cumulative Gain
(loss) | | | Gain (loss) in the year | | | Cumulative gain (loss) | | | Gain (loss) in the year | | | Cumulative gain (loss) | |
| | | | | | | | | | | | | | | | | | | |
| Pension | | $ | (371,507 | ) | | $ | (1,858,266 | ) | | $ | (332,635 | ) | | $ | (1,505,289 | ) | | | (58,216 | ) | | | (1,661,206 | ) |
| Health care | | | 394,226 | | | | (3,239,842 | ) | | | (2,473,272 | ) | | | (3,795,848 | ) | | | (457,941 | ) | | | (1,373,096 | ) |
| Education | | | (107,551 | ) | | | (213,816 | ) | | | 25,757 | | | | (109,493 | ) | | | (56 | ) | | | (139,445 | ) |
| Bonds | | | (98,915 | ) | | | 1,102,706 | | | | 798,709 | | | | 1,284,430 | | | | 578,374 | | | | 534,714 | |
| Severance | | | (2,192 | ) | | | 5,382 | | | | 8,185 | | | | 8,185 | | | | - | | | | - | |
The economic assumptions adopted are shown below in nominal terms. Those assumptions used in determining the actuarial present value of the pension obligation and the projected pension obligations for the plan years were as follows:
| | | 2012 | | | 2011 | |
| | | Pension | | | Health | | | Education | | | Bonds | | | Severance | | | Pension | | | Health | | | Education | | | Bonds | | | Severance | |
| Discount rate | | | 6.25 | % | | | 6.25 | % | | | 5.50 | % | | | 5.50 | % | | | 5.50 | % | | | 6.25 | % | | | 8.25 | % | | | 7.50 | % | | | 7.50 | % | | | 5.75 | % |
| Rate of compensation and pension increases | | | 4.00 | % | | | 11.20 | % | | | 4.00 | % | | | 4.00 | % | | | 4.00 | % | | | 4.50 | % | | | 18.40 | % | | | 4.50 | % | | | 4.50 | % | | | 4.50 | % |
| Expected rate of return | | | 7.00 | % | | | - | | | | - | | | | 7.00 | % | | | - | | | | 3.38 | % | | | - | | | | - | | | | 3.38 | % | | | - | |
| Mortality table | | | * | | | | * | | | | * | | | | * | | | | * | | | | * | | | | * | | | | * | | | | * | | | | * | |
* Colombian Mortality Table ISS, male and female, 2005-2008.
The Superintendence of Finance concluded a mortality study based on the experience of the affiliated workers to the pension funds and to the Social Security Institute ISS, during the years 2005-2008. The resulting mortality table from such study reflects the current mortality of the Colombian workers. As it was expected, the new table shows a lower mortality rate compared with those of the actual mortality table, ISS, experience 1981-1989. For such reason, the new table was applied for purposes of executing the different actuarial calculations included in this valuation in 2009.
The rate of return of the plan assets during 2012 was 11.02%. We have considered the expected rate of return on plan assets of 7.00% and an expected inflation rate equal to 3.00% at December 31, 2012, with a discount rate of 6.25%.
In 2011, the health plan had an increase in the obligation since the amount reflects the current medical cost trend during the last 3 years in increases in health costs in Colombia. In 2010, the Company did not consider generating an increase in health care obligation due to projections by the health department in 2009 and 2010. However, in 2011 and 2012, the most recent analyses by the health department shows a tendency to the decrease and control of the high costs.
The actuarial assumptions of health plan have changed since the last actuarial valuation as of December 31, 2011:
The 2011 valuation used a trend rate that starts at 18.4% and grades down to general inflation +1% over 10 years. In 2012 we used a trend rate starting at 11.20% and grading down to general inflation +1% over 10 years.
The 2010 valuation considered the current family group for active participants. For 2011 and 2012 the valuation was valued as an assumed family group, projected to retirement eligibility based on the demographics of the currently inactive population near first retirement eligibility.
The 2010 valuation does not consider spouses of active or inactive female participants. For 2011 and 2012 the valuation was valued for all eligible spouses of female inactive participants and projected spouses for active female participants.
The 2010 valuation uses a retirement age that depends on the employee completing the service requirement for retirement with Social Security using only with Ecopetrol. For 2011 and 2012 valuation, we have assumed an employee´s labor history and Social Security participation starting at age 25.
As mentioned above, as of December 31, 2012, the actuarial assumptions of Pension have changed since the last actuarial valuation as of December 31, 2011, with main updates as follows:
The 2010 liability was calculated as if a participant´s first employer was Ecopetrol. Since employment with other employers before and after employment with the Company is unknown, for the 2011 and 2012 valuations assumptions have been established to estimate the employee labor history.
The 2010 liability was calculated as if all participants have a Bond type B. For 2011 and 2012 the valuation was established assumptions that depend on the hire date and the Social Security system in which participants are enrolled.
The 2010 liability was calculated as if all participants would retire immediately. For 2011 and 2012 the valuation establishes retirement dates depending on whether the participants are eligible for the Company pension plan or the general Social Security retirement benefit.
The 2011 pension bond liability was calculated assuming that if a retired participant had not claimed his bond there was a likelihood that he would never claim it, equivalent to: a) 100 % after 15 years b) 50% among 10 and 15 years, c) 25% among 5 and 10 years; and d) 0% for less than 5 years. For 2012 this assumption was revised assuming there was a 100% likelihood after 3 years and 0% for less than 3 years.
Estimated future benefit payments
The benefit payments, which reflect expected future service, as appropriate, are expected to be paid as follows:
| Period | | Pension
Benefits | | | Health Care
benefits | | | Education
benefits | | | Pension Bonds | | | Severance
Plan | |
| 2013 | | | 685,047 | | | | 209,475 | | | | 53,372 | | | | 71,830 | | | | 1,229 | |
| 2014 | | | 699,827 | | | | 229,370 | | | | 50,493 | | | | 14,368 | | | | 78 | |
| 2015 | | | 716,775 | | | | 250,591 | | | | 47,882 | | | | 5,418 | | | | 67 | |
| 2016 | | | 733,720 | | | | 270,919 | | | | 45,154 | | | | 9,824 | | | | 73 | |
| 2017 | | | 750,535 | | | | 288,318 | | | | 42,282 | | | | 23,140 | | | | 79 | |
| Years 2018 – 2022 | | | 3,995,117 | | | | 1,632,226 | | | | 152,906 | | | | 204,293 | | | | 768 | |
All of the benefits estimated in the table above are to be paid from plan assets. The Company does not have any insurance policies that are intended to cover benefits that plan participants are to receive in the future.
Furthermore, to the Company currently does not intend to contribute to the fund in the upcoming fiscal year. Management believes that the plan assets will provide for a sufficient return to cover any payments that are necessary to be made in the upcoming year.
Assumed health care cost trend rates have an effect on the amounts reported for the health care plans. A one percentage point change in assumed health care cost trend rates would have the following effects:
| | | 1% Percentage Point | |
| | | Increase | | | Decrease | |
| Effect on total of service and interest cost components | | $ | 18,965 | | | $ | 13,594 | |
| Effect on postretirement benefit obligation | | $ | 872,271 | | | $ | 697,563 | |
Plan assets
Pension and pension bonds are covered by assets in a single fund with the following investment allocation:
| | | 2012 | | | 2011 | |
| Government securities | | $ | 49 | % | | $ | 47 | % |
| Investments funds | | | 35 | % | | | 33 | % |
| Equity instruments | | | - | | | | 1 | % |
| Other | | | 16 | % | | | 19 | % |
| | | $ | 100 | % | | $ | 100 | % |
The plan assets do not contain any shares of stock of Ecopetrol or any of its related parties. However it includes bonds issued by the Company, representing 0.2% of fund investments.
| vii. | PROVISIONS AND CONTINGENCIES |
For U.S. GAAP, Accounting for Contingencies (ASC 450), provides the guidance for recording contingencies. Under ASC 450, there are three levels of assessment of contingent events – probable, reasonably possible and remote. The term probable in ASC 450 is defined as “the future event or events that are likely to occur”. The term reasonably possible is defined as “the chance of the future event or events occurring is more than remote but less than likely”. While the term remote is defined as “the chance of the future event or events occurring is slight”.
Under ASC 450, an estimated loss related to a contingent event shall be accrued by a charge to income if both of the following conditions are met:
| • | Information available prior to issuance of the financial statements indicates that it is probable that an asset had been impaired or a liability had been incurred at the date of the financial statements |
| • | The amount of loss can be reasonably estimated. |
The amount recorded is an estimate of the amount of loss at the date of the financial statements. If the contingent event is evaluated to be reasonably possible, no provision for the contingent event may be made, but disclosure of the event is required with amount of loss that is reasonably possible.
As a result of the difference in the definition of “probable” between Colombian Government Entity GAAP and U.S. GAAP, and the general interpretation of the definition in practice in Colombia, there is a difference in the amount of the provision for legal proceedings.
The effects of this adjustment in the reconciliation of income were $(36,841); $335,983 and $67,629 in December 2012, 2011 and 2010, respectively.
The effects of this adjustment in the reconciliation of consolidated shareholders´ equity were 313,637 and 350,535in December 2012 and 2011 respectively.
| viii. | ASSETS AND LIABILITIES PRESENT VALUE |
Under Colombian government Entity GAAP, accounts receivable and payable are recognized at amortized cost, represented by any uncollected or unpaid balances, regardless if such balances are due within the year or not. For U.S. GAAP purposes, the Company measures the long-term balances at present value by discounting future cash flows at the appropriate discount rate. Such balance is amortized using the effective interest method.
The estimated discount rate for long-term liability was calculated by our Treasury department and is based on the Colombian Government Treasury bonds as it was considered that the Company has a similar credit risk.
As a result of the measurement of the Equity Tax liability recognized by Ecopetrol and its subsidiaries in the year 2012 and 2011, an adjustment for $92,512 and $126,861 was recorded respectively.
Under U.S. GAAP a valuation allowance is provided for deferred tax assets to the extent that it is more likely than not that they will not be realized.
Under Colombian Government Entity GAAP, deferred income taxes are calculated using the current statutory tax rate. Under U.S. GAAP, deferred income taxes are calculated based on rates and tax laws enacted at the reporting date considering the future tax rate that will apply when the deferred income tax difference will be realized.
Under Colombian Government Entity GAAP, since 2009, goodwill is deductible and does not generate differences between tax laws and the Colombian Government Entity GAAP, except by the difference in the time of amortization. Under U.S. GAAP, the goodwill is not amortizable and generates a temporary difference, as a result it is necessary to compute and recognize deferred income taxes for differences originated by deductions since the acquisition date.
Under Colombian Government Entity GAAP, the fair value of the assets is not recorded; the difference between this value (zero) and the value recorded under U.S. GAAP generates deferred tax calculated under ASC 740.
All of the income tax effects in the U.S. GAAP reconciliation are the tax effect of pretax adjustments, and none relate to differences between the accounting for income tax standards.
The Company and its subsidiaries file separate income tax returns since tax regulations do not allow consolidated income tax returns. There are no requirements to file tax returns by segments. Tax returns are required for each legal entity. Tax rate of Refineria de Cartagena S,A, Bioenergy and Comai is 15% because it has tax benefit until 2023, 2025 and 2021 respectively. The tax savings for the last three years has not been significant.
Taxable loss carry forwards are deductible in future years depending of countries tax regulations. As of December 31, 2012, Ecopetrol S.A and its subsidiaries had accumulated tax loss carry-forwards and excesses of presumptive income generated in previous years, as follows:
| Expiration date | | Loss carry-
forwards | | | Excess of
presumed income | |
| With no Maximum expiry date | | $ | 1,927,525 | | | $ | - | |
| 2012 | | | - | | | | 360 | |
| 2013 | | | 7,794 | | | | 66,115 | |
| 2014 | | | 15,356 | | | | 79,313 | |
| 2015 | | | - | | | | 61,074 | |
| 2016 | | | 4,270 | | | | 39,325 | |
| 2017 | | | - | | | | 55,762 | |
| 2018 | | | - | | | | 1,187 | |
| 2028 | | | 1,443,050 | | | | - | |
| | | $ | 3,397,995 | | | $ | 303,136 | |
Tax reform
The Congress of the Republic adopted Law 1607 of December 26, 2012, which introduces significant reforms to the Colombian tax system, in particular, the income tax rate was reduced from 33% to 25% starting in 2013, and the Equality Income Tax(Impuesto de Renta para la Equidad - CREE), was created with a rate of 9% from 2013 to 2015 and 8% starting in 2016; there are some differences between the treatment used to determine this tax and the one used to determine ordinary income tax.
The following information regarding income taxes has been prepared under U.S. GAAP:
Income Taxes
Total income taxes for the years ended December 31, 2012, 2011 and 2010 were comprised as follows:
| | | 2012 | | | 2011 | | | 2010 | |
| Income tax expense | | $ | 7,525,988 | | | $ | 8,399,086 | | | $ | 4,397,797 | |
| Income tax effects based on items of other comprehensive income: | | | | | | | | | | | | |
| Pension plan liability | | | 28,321 | | | | 488,064 | | | | 206,699 | |
| Available-for-sale securities | | | (27,721 | ) | | | 7,086 | | | | 8,819 | |
| | | $ | 7,526,588 | | | $ | 8,894,236 | | | $ | 4,613,315 | |
Income tax expense attributable to income from continuing operations consists of:
| | | 2012 | | | 2011 | | | 2010 | |
| Current provision | | $ | 7,095,874 | | | $ | 7,501,002 | | | $ | 3,201,040 | |
| Deferred tax | | | 430,114 | | | | 898,084 | | | | 1,196,757 | |
| | | $ | 7,525,988 | | | $ | 8,399,086 | | | $ | 4,397,797 | |
In 2012, 2011 and 2010, there are foreign subsidiaries that do not pay income taxes and therefore do not generate income tax expense or deferred tax effects. Those entities that do pay taxes and are currently not generating taxable income will record a valuation allowance against any deferred tax asset recorded.
Amount of foreign and domestic pretax income:
| | | 2012 | | | 2011 | | | 2010 | |
| Domestic pretax income | | $ | 21,083,067 | | | $ | 22,470,684 | | | $ | 14,095,314 | |
| Foreign pretax income | | | 1,330,415 | | | | 986,001 | | | | (1,254,593 | ) |
| Income before income tax | | $ | 22,413,482 | | | $ | 23,456,685 | | | $ | 12,840,721 | |
Unremitted earnings accumulated as of December 31, 2012 of certain international subsidiaries totaling $1,388,340 are permanently invested. No deferred tax liability was recognized for the remittance of such earnings. The income tax liability that might be incurred if such earnings were remitted to Colombia is not practicable to estimate.
Tax Rate Reconciliation
Income tax expense attributable to income from continuing operations was $7,525,988, $8,399,086 and $4,397,797 for the years ended December 31, 2012, 2011 and 2010, respectively, and differed from the amounts computed by applying the statutory income tax rate for Colombian entities that is 33% in 2012, 2011 and 2010 to pretax income from continuing operations as follows:
| | | 2012 | | | 2011 | | | 2010 | |
| Statutory income tax | | | 33.00 | % | | | 33.00 | % | | | 33.00 | % |
| Non – taxable income (exempt domestic dividend income) | | | 0.04 | % | | | (1.59 | )% | | | (5.66 | )% |
| Non – deductible expenses | | | 0.28 | % | | | 3.66 | % | | | 4.64 | % |
| Others | | | (0.15 | )% | | | 1.00 | % | | | 2.84 | % |
| Other exempt income | | | (0.30 | )% | | | (0.24 | )% | | | (0.52 | )% |
| Income taxable at other tax rate | | | 0.60 | % | | | (0.02 | )% | | | (0.05 | )% |
| Changes in tax rate | | | 0.11 | % | | | - | | | | - | |
| Effective income tax under U.S. GAAP | | | 33.58 | % | | | 35.81 | % | | | 34.25 | % |
Ecopetrol has no unrecognized tax benefits. The tax years open to the taxing authority’s reviews by major components are as follows:
| Company | | Tax years | |
| Ecopetrol S.A. | | | 2012 | |
| Refinería de Cartagena | | | 2007 to 2012 | |
The Company is subject to income taxation in many jurisdictions around the world. Unrecognized tax benefits reflect the difference between positions taken or expected to be taken on income tax returns and the amounts recognized in the financial statements.
We recognize interest accrued related to an underpayment of income taxes in interest expense. Penalties, if recognized, would be presented as a component of other expense.
Deferred Taxes
The significant components of deferred income tax expense attributable to income from continuing operations for the years ended December 31, 2012, 2011 and 2010 are as follows:
| | | 2012 | | | 2011 | | | 2010 | |
| Deferred income tax expense (exclusive of the effects of other components below): | | | | | | | | | | | | |
| Accounts payable | | $ | 100,511 | | | $ | (129,334 | ) | | $ | (6,586 | ) |
| Inventories | | | (5,967 | ) | | | 35,226 | | | | (6,949 | ) |
| Property, plant and equipment, principally due to DD&A | | | 78,201 | | | | (36,884 | ) | | | (1,223,111 | ) |
| Deferred charges | | | (11,185 | ) | | | (580 | ) | | | 92,747 | |
| Prepaid expenses | | | (75 | ) | | | 62,930 | | | | (52,613 | ) |
| Capital lease asset | | | 83,829 | | | | (39,109 | ) | | | 11,597 | |
| Monetary correction and other | | | (275,294 | ) | | | 150,603 | | | | 212,482 | |
| DD&A and inflation adjustments | | | 310,351 | | | | (305,288 | ) | | | 890,348 | |
| Investment | | | (352,018 | ) | | | 164,276 | | | | (111,530 | ) |
| Direct finance lease | | | (39,922 | ) | | | 39,922 | | | | - | |
| Estimated liabilities and provisions | | | (73,955 | ) | | | (58,663 | ) | | | 87,423 | |
| Accounts and notes receivable | | | (6,194 | ) | | | 2,337 | | | | (3,734 | ) |
| Carry forward loss | | | (159,549 | ) | | | (43,515 | ) | | | 16,652 | |
| Pension and benefits obligations | | | (56,941 | ) | | | (390,205 | ) | | | (98,280 | ) |
| Deferred income | | | - | | | | 140,422 | | | | 7,811 | |
| Natural and environmental resources capitalized expenses | | | 381,072 | | | | 1,069,749 | | | | 23,841 | |
| Valuation allowance | | | 604,394 | | | | 27,079 | | | | 91,712 | |
| Additional tax discount on the acquisition of productive assets according to ASC 740 (1) | | | 534 | | | | 6,939 | | | | 1,276,705 | |
| Excess in presumptive income tax | | | (373,085 | ) | | | 14,225 | | | | (217,577 | ) |
| Other | | | 37,608 | | | | (18,565 | ) | | | 5,654 | |
| Amortization of actuarial loss recorded in OCI | | | 28,321 | | | | 488,064 | | | | 206,699 | |
| Unrealized loss in available for sale securities | | | (27,721 | ) | | | 7,086 | | | | 8,819 | |
| Amortization of fiscal goodwill according to (ASC 830) | | | 187,199 | | | | (288,631 | ) | | | (15,353 | ) |
| | | $ | 430,114 | | | $ | 898,084 | | | $ | 1,196,757 | |
| (1) | This value corresponds to the deferred tax generated by the calculation of ASC 740, due to the implementation of the special deduction for investment in real productive assets. |
The tax effects of temporary differences that give rise to significant portions of the deferred tax assets and deferred tax liabilities at December 31, 2012 and 2011 are presented below:
| | | 2012 | | | 2011 | |
| Deferred income tax assets and liabilities | | | | | | | | |
| Deferred income tax assets: | | | | | | | | |
| Inventories | | $ | 39,886 | | | $ | 33,919 | |
| Investments | | | 1,390,880 | | | | 937,774 | |
| Accounts and notes receivable | | | 6,896 | | | | 702 | |
| Deferred income | | | - | | | | - | |
| Property, plant and equipment, principally due to DD&A | | | 2,991,078 | | | | 3,069,279 | |
| Deferred charges | | | 28,348 | | | | 17,164 | |
| Prepaid expenses | | | 169 | | | | 95 | |
| Financial obligation, principally due to capitalized leasing | | | 62,797 | | | | 146,626 | |
| Pension obligations | | | 1,104,155 | | | | 1,047,213 | |
| Accounts payable | | | 170,076 | | | | 270,587 | |
| Carry forward loss (1) | | | 333,344 | | | | 173,795 | |
| Excess in presumptive income tax (2) | | | 691,179 | | | | 318,094 | |
| Other | | | 1,295 | | | | 561 | |
| Amortization of fiscal goodwill according to ASC 830 | | | 385,800 | | | | 574,472 | |
| Estimated liabilities and provisions | | | 918,770 | | | | 844,815 | |
| Total gross deferred income tax assets | | | 8,124,673 | | | | 7,435,096 | |
| Less valuation allowance (3) | | | (826,612 | ) | | | (222,218 | ) |
| Deferred income tax assets | | | 7,298,061 | | | | 7,212,878 | |
| Deferred income tax liabilities | | | | | | | | |
| Natural and environmental properties due to the difference between the methods of amortization | | | 1,915,156 | | | | 1,534,084 | |
| Monetary correction and other | | | 505,788 | | | | 781,082 | |
| DD&A and inflation adjustments | | | 1,191,049 | | | | 880,699 | |
| Investments | | | 1,835,482 | | | | 1,734,394 | |
| Direct finance lease | | | - | | | | 39,923 | |
| Deferred income tax liabilities | | | 5,447,475 | | | | 4,970,182 | |
| Net deferred income tax assets | | $ | 1,850,586 | | | $ | 2,242,696 | |
The realizability of the net deferred tax assets detailed above is expected given that it is more likely than not that the results of future operations will generate sufficient taxable income to realize the deferred tax. For those which realizability is in question valuation allowances have been provided.
| (1) | Carry forwards losses are generated by subsidiaries and according to local tax laws, these losses do not expire. |
| (2) | The excess in presumptive income tax are generated by subsidiaries and will expire in 5 years. |
| (3) | The changes in the valuation allowance is mainly due to 2012 tax losses originated by Ecopetrol do Brazil, Ecopetrol America Inc. and Refineria de Cartagena amounted $620,915 approximately offsetted by utilizations in Ecopetrol del Peru and ODC, amounting $16,521 approximately, as detailed bellow: |
| | | 2012 | | | Variation | | | 2011 | |
| Ecopetrol do Brazil | | $ | 248,991 | | | $ | 90,717 | | | $ | 158,274 | |
| Ecopetrol del Peru | | | 46,893 | | | | (969 | ) | | | 47,862 | |
| ODC | | | - | | | | (15,552 | ) | | | 15,552 | |
| Bioenergy | | | 463 | | | | - | | | | 463 | |
| Ecopetrol America Inc. | | | 520,861 | | | | 520,861 | | | | - | |
| Refineria de Cartagena | | | 9,404 | | | | 9,337 | | | | 67 | |
| | | $ | 826,612 | | | $ | 604,394 | | | $ | $ 222,218 | |
| a.1 | Over and under deliveries |
Under Colombian Government Entity GAAP, the Company recognizes receivables from or payables to partners and to pipeline companies based on the cost of the inventory.
The Company’s crude oil over balance position at December 31, 2012 was $221,350 and at December 31, 2011 was $659,535 equivalent to 968,656 and 4,184,690 barrels, respectively.
For U.S. GAAP purposes, the Company utilizes the entitlement method of accounting for over and under positions by which the amount of crude oil sold is based on its shared interest in the properties, and revenue is recognized based on market prices. The pipeline imbalances determined through volume allocation are recorded as either receivables or payables as per EITF 90-22. valued at selling prices.
During 2012, the Company identified some transactions that Ecopetrol was considering as Over and Under lifting but corresponded mainly to transportation imbalances and therefore not to entitlement accounting. This, given that the distribution of the production is done at the wellhead and in that sense none of the association contracts establishes the possibility to sell oil on behalf of the other party. Accordingly, the values that would affected Ecopetrol´s income in previous years as a revenue recognition issue should be recognized as imbalances with the transporter. Given the financial and operational mechanics of these inventories, the record should affect the cost of sales because these imbalances will be delivered by or return to Ecopetrol in kind and not adjusting income and being presented in the reconciliation netting the adjustment of cost of sales, as previously done. The valuation would remain at selling prices in accordance with the requirements of the EITF90-22. However, according to ASC 250 and SAB 108, we do not consider such amount significant and decided to adjust revenues and cost of sale as of 2012. The said adjustment as of December 31, 2011 represents lower net assets and higher net income amounting $286,203 (higher net assets and lower net income amounting $21,975 in 2010).
Under U.S. GAAP, the related cost of sale in the reconciliation of net income for over and under deliveries transactions described at a.1 above amounted to $208,644, $(449,225) and $158,609 during 2012, 2011 and 2010, respectively, in comparison with the amount recognized under Colombian Government Entity GAAP.
The Company has sales transactions were it transports crude oil, from the supplier to the customer, using its pipelines. For U.S. GAAP purposes, when price is fixed, there are no changes made to the product and the Company has no physical inventory loss risk, among other criteria, the Company records such sales on a net basis. Under Colombian Government Entity GAAP, such crude oil sales are recognized gross.
The Colombian Government Entity GAAP consolidated financial statements were adjusted for inflation based on the variation in the IPC (Colombia’s equivalent to the consumer price index in the United States) for middle income-earners from January 1, 1992 to December 31, 2001 for Ecopetrol S.A. and from January 1, 1992 to December 31, 2006 for Oleoducto de Colombia S.A. (ODC), Hocol S.A., Oleoducto Central S.A. (Ocensa), Equion, and Reficar S.A. The adjustment was applied monthly to non-monetary assets, equity (except for the valuation surplus) and memorandum accounts.
Under U.S. GAAP, the aforementioned adjustments under Colombian Government Entity GAAP are not applicable and have been reversed.
Under Colombian Government Entity GAAP, inventories are valued at the lower of average cost or sale price. Under U.S. GAAP, inventories are valued at the lower of average cost or market value, the determination of which can be made using several different methods acceptable under U.S. GAAP. An adjustment has been recorded to reflect the difference in the method used to determine the valuation of inventories that arises from using sale price instead of market value, as defined by U.S. GAAP. Inventories are also affected by the effect of adjustments to cost of sales included in this reconciliation. These adjustments are related to depreciation, expenses capitalized in property, plant and equipment, asset retirement cost and impairment of long-lived assets.
The effects of this adjustment (loss) gain in the reconciliation of income were $(16,699), $76,126, and $(87,797) in December 2012, 2011 and 2010, respectively.
The effects of these adjustments in the reconciliation of equity and the corresponding effect in inventory were $(55,078) and $(38,473) at December 31, 2012 and 2011, respectively.
Under both Colombian Government Entity GAAP and U.S. GAAP, lease accounting for capital leases and operating leases is similar. However, the tests used to determine if a lease is a capital or an operating lease differs between Colombian Government Entity GAAP and U.S. GAAP. In applying the tests in accordance with Colombian Government Entity GAAP, the Company has determined that all leases are operating leases. Under U.S. GAAP some of these leases should be accounted for as capital leases in accordance with ASC 840-10. As a result, adjustments were recorded to reflect the related assets and liabilities, and to recognize interest expense and de-recognize operating expenses associated with the lease payments.
Embedded Leasing
Under Colombian Government Entity GAAP, there is no requirement to identify whether the arrangements or contracts contain leases.
Under U.S. GAAP, an arrangement contains a lease if both of the following two criteria are met:
| 1. | The arrangement depends on a specific fixed asset, either identified contractually or implicitly identified as no alternative item could feasibly be used. |
| 2. | The purchaser has the right to control the use of the underlying fixed asset, such control demonstrated by the existence of any of the following qualitative conditions: |
| a) | The purchaser can operate the asset or direct others to operate the asset while obtaining or controlling more than a minor amount of the asset’s output; |
| b) | The purchaser can control physical access to the asset while obtaining or controlling more than a minor amount of the asset’s output; or |
| c) | Probability is remote that another party will get more than minor amount of the asset’s output and the price is not fixed per unit. |
Under U.S. GAAP, if the arrangement contains a lease, ASC 840 is applied by both purchaser and supplier for recognition, measurement, classification and disclosure purposes.
Build, Operate, Maintain and Transfer (BOMT)
| Future Payments | | Ecogas (1) - ECP | | | Dina – Tello (2) –
ECP | | | Gibraltar (3) - ECP | | | Termo ERB (4) –
ODL | | | Termo Servicios (4)
- ODL | | | Termo Proyectos
(4) - ODL | |
| Year | | USD
(million) | | | Pesos | | | USD
(million) | | | Pesos | | | USD
(million) | | | Pesos | | | USD
(million) | | | Pesos | | | USD
(million) | | | Pesos | | | USD
(million) | | | Pesos | |
| 2013 | | $ | 17.3 | | | $ | 30,578 | | | $ | 3.3 | | | $ | 5,850 | | | $ | 2.1 | | | $ | 3,748 | | | | 3.0 | | | $ | 5,234 | | | | 2.9 | | | $ | 5,190 | | | | 2.9 | | | $ | 5,190 | |
| 2014 | | | 17.0 | | | | 30,037 | | | | 3.8 | | | | 6,650 | | | | 2.2 | | | | 3,872 | | | | 2.9 | | | | 5,207 | | | | 2.9 | | | | 5,163 | | | | 2.9 | | | | 5,163 | |
| 2015 | | | 17.0 | | | | 30,037 | | | | 4.3 | | | | 7,534 | | | | 2.3 | | | | 4,000 | | | | 2.9 | | | | 5,205 | | | | 2.9 | | | | 5,160 | | | | 2.9 | | | | 5,160 | |
| 2016 | | | 16.2 | | | | 28,695 | | | | 4.8 | | | | 8,509 | | | | 2.3 | | | | 4,132 | | | | 3.0 | | | | 5,219 | | | | 2.9 | | | | 5,174 | | | | 2.9 | | | | 5,174 | |
| 2017 | | | 10.3 | | | | 18,256 | | | | 5.4 | | | | 9,585 | | | | 2.4 | | | | 4,268 | | | | 2.9 | | | | 5,205 | | | | 2.9 | | | | 5,160 | | | | 2.9 | | | | 5,160 | |
| Payments after 2017 | | | 0.1 | | | | 92 | | | | - | | | | - | | | | 21.6 | | | | 38,228 | | | | 9.6 | | | | 16,911 | | | | 10.2 | | | | 18,053 | | | | 11.7 | | | | 20,654 | |
| | | $ | 77.9 | | | $ | 137,695 | | | $ | 21.6 | | | $ | 38,128 | | | $ | 32.9 | | | $ | 58,248 | | | | 24.3 | | | $ | 42,981 | | | | 24.7 | | | $ | 43,900 | | | | 26.2 | | | $ | 46,501 | |
The Transmetano agreement finished in the year 2012.
| (1) | Three original leases that were accounted for as capital leases under U.S. GAAP are BOMT contracts, the use of which are specifically required under Colombian law for projects that involve the building, operating, maintaining and transferring of natural gas pipelines for the transportation of natural gas. These contracts had original terms of 20 years, no renewal provisions, and a purchase option. The rights to the leased assets were subsequently transferred to a related Company (ECOGAS) that was sold, but Ecopetrol was not relieved of the primary obligation under the original lease. This transfer was considered a sublease accounted for as a direct finance lease. In 2007, Ecopetrol received a prepayment of all amounts to be received during the term of the sublease contract. |
| (2) | In 2010, we entered in a new BOMT, corresponding to the gas treatment plant located in the Dina-Tello field with an estimated value of construction US$28 million. This BOMT is accounted as capital lease in accordance with ASC 840 such as the contracts described previously, this contract had original term of 8 years, ending in 2017. |
| (3) | Ecopetrol subscribed a contract with Unión Temporal Gas Gibraltar firm to advanced the design, build, operation and maintenance of a plant of treatment with 30 capacity of mpcd. Likewise, for the marketing of this product a contract with Natural Gas E.S.P was signed., Company that it contracted with the Company TransOriente E.S.P the construction of the pipeline that will transport the treated gas from the Gibraltar field to Bucaramanga, where it will be connected with the national system of gas transport. The plant of gas processing of Gibraltar is located between the populations of Toledo (Norte de Santander) and Cubará (Boyacá). This BOMT is accounted as capital lease in accordance with ASC 840 such as the contracts described previously, this contract had original term of 15 years, ending in 2026. |
| (4) | ODL signed three agreements for the acquisition of assets necessary for energy conversion. The purpose of these assets is to ensure availability of capacity to meet the needs of power consumption in ODL booster station 1 (ER1). Booster station (ER2) and Rubiales Field. |
The assets will be owned by ODL beyond the duration of the agreement and settle purchase option, or ends early to settle the purchase option at any time by the contract elapsed time. ODL has no obligation to perform the purchase option, if not the assets will be removed by the contractor.
ODL considering the guidelines of the regulations established under U.S. GAAP ASC 840. According to this rule, these contracts were treated as a finance lease therefore recorded an asset and a liability for the present value of their initial measurement and subsequent measurement at amortized cost.
In 2011 the BOMT´s contracts were recognized in the adjustment No. 14, with an annual interest rate of 9.13% equivalent ODL Average debt.
During 2012 is included under the guidelines of RCP with an annual interest rate of 3% equivalent to the CPI projection target of the Bank of the Republic of Colombia in the long term, taken from Ecopetrol instructive: "Bases of subordinated financial planning and budget 2013-2015 ". For U.S. GAAP 2012 report, was eliminated this recognition made in 2011 and made a reclassification of accounts coming from RCP to use the same accounts under U.S. GAAP.
The accounting recognition of contracts BOMT's under RCP follows the same guidelines of normativity U.S. GAAP (ASC - 840), and using a discount rate of 3%
| xiv. | PROPERTY, PLANT AND EQUIPMENT |
Under Colombian Government Entity GAAP, property, plant and equipment are recorded at cost and are adjusted for inflation until 2001. The cost includes administrative expenses until 2004, financial expenses and exchange differences from foreign currency financing until the asset is placed in service. Normal disbursements for maintenance and repairs are charged to expense and those significant costs that improve efficiency or extend the useful life are capitalized. Under U.S. GAAP, cost includes expenditures until the asset is placed in service such as installation cost, freight, interest, retirement cost; construction cost and other direct expenses are capitalized, with exception of adjustment for inflation and foreign currency loss. For U.S. GAAP purposes, administrative expenses capitalized were eliminated from property, plant and equipment. In addition, a deferred income tax asset resulted from the application of the provisions of ASC 740-10,Accounting for Acquired Temporary Differences in Certain Purchase Transactions that are not Accounted for as Business Combinations, since the investment in real productive assets creates an additional tax deduction of 30% in 2010. Starting in January 2011, investment tax credit were no longer be available.
The following table reflects the net changes in capitalized exploratory wells during 2012 and 2011 it does not include amounts that were capitalized and recorded as expenses during the same period under the successful efforts method.
| | | 2012 | | | 2011 | |
| Opening balance at January 1 | | $ | 928,857 | | | $ | 418,740 | |
| Additions from business combination | | | - | | | | 2,278 | |
| Additions to capitalized exploratory well costs | | | 915,771 | | | | 918,955 | |
| Reclassifications to wells, facilities and equipment based on the determination of proved reserves | | | (138,427 | ) | | | (32,157 | ) |
| Capitalized exploratory well costs charged to expense* | | | (278,254 | ) | | | (378,959 | ) |
| Ending balance at December 31 | | $ | 1,427,947 | | | $ | 928,857 | |
* Includes $10,748 and $32,351 of capitalized exploratory well costs at December 31, 2012 and 2011 respectively, which were declared as dry wells during 2012 and 2011 respectively.
Accounting For Suspended Exploratory Wells
The following tables provide an aging of capitalized exploratory well costs based on the date the drilling was completed and the number of projects for which exploratory well costs have been capitalized for a period greater than one year since the completion of the drilling:
| | | Year ended December 31, | |
| | | 2012 | | | 2011 | |
| Capitalized exploratory well costs that have been capitalized for a period greater than one year | | $ | 519,747 | | | $ | 184,217 | |
| Number of projects that have exploratory well costs that have been capitalized for a period greater than one year | | | 30 | | | | 23 | |
| | | | | | | 2012 | |
| Entity | | Well | | Comment | | Total > 1
Year | | | 1 to 3
Years | | | 3 to 5
Years | | | More than
5 Years | |
| ECP | | Oripaya 1 | | Gas well. Pending drilling a boundary well. | | $ | 53,315 | | | $ | 53,315 | | | $ | - | | | $ | - | |
| ECP | | Rumbero 1 | | Producing well in assessment of the complete project | | | 51,000 | | | | 51,000 | | | | - | | | | - | |
| ECP | | Rumbero ST 1 | | Producing well in assessment of the complete project | | | 25,674 | | | | 25,674 | | | | - | | | | - | |
| ECP | | Mito 1 | | Producing well in assessment of the complete project | | | 34,002 | | | | 34,002 | | | | - | | | | - | |
| ECP | | Trasgo | | Producing well in assessment of the complete project | | | 22,047 | | | | 22,047 | | | | - | | | | - | |
| ECP | | Rio Zulia West 3 | | Producing well, pending ANH license for dispose the well | | | 17,255 | | | | - | | | | 17,255 | | | | - | |
| ECP | | Fontana | | Producing well in assessment of the complete project | | | 16,236 | | | | 16,236 | | | | - | | | | - | |
| ECP | | Pinocho | | Producing well in assessment of the complete project | | | 9,255 | | | | 9,255 | | | | - | | | | - | |
| ECP | | Fauno | | Producing well in assessment of the complete project | | | 9,122 | | | | 9,122 | | | | - | | | | - | |
| ECP | | CSE 8 ST 1 | | Producing well in assessment of the complete project | | | 8,225 | | | | 8,225 | | | | - | | | | - | |
| ECP | | Quifa 6 | | Producing well, pending environmental license extension to install a production line and to request commerciality. | | | 2,560 | | | | 2,560 | | | | - | | | | - | |
| ECP | | Quifa 31 | | Producing well in process to reclassification proved properties | | | 1,810 | | | | 1,810 | | | | - | | | | - | |
| ECP | | Opalo-3 | | Producing well in assessment of the complete project | | | 1,688 | | | | 1,688 | | | | - | | | | - | |
| ECP | | Azabache-1 | | Producing well in assessment of the complete project | | | 942 | | | | 942 | | | | - | | | | - | |
| ECP | | Quifa 32 | | Producing well in process to reclassification proved properties | | | 708 | | | | 708 | | | | - | | | | - | |
| ECP | | Opalo-2 | | Producing well in assessment of the complete project | | | 697 | | | | 697 | | | | - | | | | - | |
| ECP | | Ambar-5 | | Producing well in assessment of the complete project | | | 195 | | | | 195 | | | | - | | | | - | |
| ECP | | Ambar-1 | | Producing well in process to reclassification proved properties | | | 116 | | | | 116 | | | | - | | | | - | |
| ECP | | Quifa 12 | | Producing well in assessment of the complete project | | | 83 | | | | - | | | | 83 | | | | - | |
| HOCOL | | Corocora Sur 1 | | Producing well, pending environmental license extension to install a production line and to request commerciality. | | | 4,047 | | | | 4,047 | | | | - | | | | - | |
| HOCOL | | Bonga-1 | | Appraisal drilling | | | 24,188 | | | | 24,188 | | | | - | | | | - | |
| HOCOL | | Mamey | | Appraisal drilling | | | 24,973 | | | | 24,973 | | | | - | | | | - | |
| HOCOL | | Bonga 1 | | Appraisal drilling | | | 21,272 | | | | 21,272 | | | | - | | | | - | |
| HOCOL | | Huron 1 | | Producing well in assessment of the complete project | | | 30,769 | | | | - | | | | - | | | | 30,769 | |
| HOCOL | | Huron 2 | | Appraisal drilling | | | 14,815 | | | | 14,815 | | | | - | | | | - | |
| HOCOL | | Afe | | Appraisal drilling | | | 134 | | | | 134 | | | | - | | | | - | |
| HOCOL | | Merlin 2 | | Appraisal drilling | | | 8,141 | | | | 8,141 | | | | - | | | | - | |
| HOCOL | | Merlin 1 | | Appraisal drilling | | | 3,420 | | | | 3,420 | | | | - | | | | - | |
| HOCOL | | Dorcas 1 | | Appraisal drilling | | | 4,572 | | | | 4,572 | | | | - | | | | - | |
| BRAZIL | | Anadarko BM-C-29 | | Appraisal drilling | | | 128,486 | | | | 128,486 | | | | - | | | | - | |
| | | | | Total | | $ | 519,747 | | | $ | 471,640 | | | $ | 17,338 | | | $ | 30,769 | |
| | | | | | | 2011 | |
| Entity | | Well | | Comment | | Total > 1
Year | | | 1 to 3
Years | | | 3 to 5
Years | | | More than
5 Years | |
| ECP | | Oripaya 1 | | Gas well. Pending drilling a boundary well. | | $ | 53,876 | | | $ | 53,876 | | | $ | - | | �� | $ | - | |
| ECP | | Rio Zulia West 3 | | Producing well, pending ANH license for dispose the well | | | 17,255 | | | | - | | | | 17,255 | | | | - | |
| ECP | | Quifa 6 | | Producing well, pending environmental license extension to install a production line and to request commerciality. | | | 2,560 | | | | 2,560 | | | | - | | | | - | |
| ECP | | Quifa 31 | | Producing well in process to reclassification proved properties | | | 1,810 | | | | 1,810 | | | | - | | | | - | |
| ECP | | Quifa 32 | | Producing well in process to reclassification proved properties | | | 697 | | | | 697 | | | | - | | | | - | |
| ECP | | Ambar-1 | | Appraisal drilling | | | 2,104 | | | | 2,104 | | | | - | | | | - | |
| ECP | | Quifa 12 | | Producing well in assessment of the complete project | | | 72 | | | | 72 | | | | - | | | | - | |
| HOCOL | | Huron 1 | | Producing well in assessment of the complete project | | | 33,597 | | | | - | | | | 33,597 | | | | - | |
| ECP | | Tinkhana 1 | | Appraisal drilling | | | 27,795 | | | | 27,795 | | | | - | | | | - | |
| ECP | | Akacias -1 | | Appraisal drilling | | | 20,955 | | | | 20,955 | | | | - | | | | - | |
| ECP | | Pachaquiaro | | Appraisal drilling | | | 20,131 | | | | - | | | | 20,131 | | | | - | |
| ECP | | Quifa 7 | | Producing well in assessment of the complete project | | | 817 | | | | 817 | | | | - | | | | - | |
| ECP | | Quifa 9 | | Producing well in assessment of the complete project | | | 600 | | | | 600 | | | | - | | | | - | |
| ECP | | Quifa 10 | | Producing well in assessment of the complete project | | | 534 | | | | 534 | | | | - | | | | - | |
| ECP | | Quifa 11 | | Producing well in assessment of the complete project | | | 332 | | | | 332 | | | | - | | | | - | |
| ECP | | Quifa 8 | | Producing well in assessment of the complete project | | | 298 | | | | 298 | | | | - | | | | - | |
| ECP | | Quifa 18 | | Producing well in assessment of the complete project | | | 269 | | | | 269 | | | | - | | | | - | |
| ECP | | Quifa 13 | | Producing well in assessment of the complete project | | | 228 | | | | 228 | | | | - | | | | - | |
| ECP | | Quifa 17 | | Producing well in assessment of the complete project | | | 222 | | | | 222 | | | | - | | | | - | |
| ECP | | Quifa B2 | | Producing well in assessment of the complete project | | | 38 | | | | 38 | | | | - | | | | - | |
| ECP | | Quifa Q2 24X | | Producing well in assessment of the complete project | | | 15 | | | | 15 | | | | - | | | | - | |
| ECP | | Quifa K 20X | | Producing well in assessment of the complete project | | | 8 | | | | 8 | | | | - | | | | - | |
| ECP | | Quifa F4 26X | | Producing well in assessment of the complete project | | | 3 | | | | 3 | | | | - | | | | - | |
| | | | | Total | | | 184,217 | | | | 113,235 | | | | 70,982 | | | | - | |
Under Colombian Government Entity GAAP, all interest paid net of interest income is subject to capitalization regardless of the utilization of the funds. Exchange rate differential is also capitalized as part of the asset.The Company´s assessment of the methodology followed to determine the capitalization amount under U.S. GAAP considered more detailed information available to estimate the interest to be capitalized. Previous to 2010, the calculations were made based on the average monthly disbursements, as an improvement, the Company obtained a detail of the assets associated to the debt and was able to apply the analysis and calculations based on each project, providing further detail of interest capitalized. The impact was recognized during 2010 as it was considered a change in an accounting estimate per ASC 250-10-45-17 and 18, Change in Accounting Estimates.
The total interest capitalized during 2012 under Colombian Government Entity GAAP was $761,199 and the total interest capitalized under U.S. GAAP was $153,999. The effect of this adjustment in the reconciliation of income was $607,200 The total interest capitalized during 2011 under Colombian Government Entity GAAP was $207,514 and the total interest capitalized under U.S. GAAP was $85,337. The effect of this adjustment in the reconciliation of income was $122,177. The total interest capitalized during 2010 under RCP was $319,326 and the total interest capitalized under U.S. GAAP was $150,800. The effect of this adjustment in the reconciliation of income was $$168,527.
| b. | Revaluation of property, plant and equipment and public accounting effect |
Valuation surplus of property, plant and equipment and public accounting effect correspond to the difference between net book value and the market value for real estate or the current value in use for property, plant and equipment, determined by specialists. These accounts are reflected as valuations and as valuation surplus from reappraisals of assets and the public accounting effect (components of equity) in the Company’s consolidated balances sheets. The last valuation was in December 2012. Technical appraisals are valid for three years.
Under U.S. GAAP, the valuation surplus of assets and the public accounting effect are not permitted. The effect of this adjustment in the reconciliation of Equity as of December 31, 2012 and 2011, $19,503,673, $12,396,858, respectively.
Under Colombian Government Entity GAAP , technical appraisals for property, plant and equipment are performed at least every three years. If the technical study is lower than the carrying value, the difference is recorded in equity as a reduction of the property, plant and equipment carrying value even if it reduces the valuation surplus below zero. Under U.S. GAAP, in accordance with ASC 360-10, Property, Plant, and Equipment - Impairment or Disposal of Long-Lived Assets (ASC 360-10), property, plant, and equipment are reviewed for impairment whenever events or changes in circumstances indicate that the carrying amount of an asset may not be recoverable. If circumstances require a long-lived asset to be tested for possible impairment, the Company first compares undiscounted cash flows expected to be generated by the asset to the carrying value of the asset. If the carrying value of the long-lived asset is not recoverable on an undiscounted cash flow basis, impairment is recognized to the extent that the carrying value exceeds its fair value. Fair value is determined through various valuation techniques including discounted cash flow models, quoted market values and third-party independent appraisals, as considered necessary. For U.S. GAAP purposes, the Company reviewed property, plant and equipment for impairment as of December 31, 2012, 2011, 2010, and recorded impairment losses when required. For U.S. GAAP purposes, the Company recorded in 2012, 2011 and 2010, $276,145, $136,357, and $135,469, respectively, as additional impairment charges to reduce the net book value of certain field assets and pipelines to their estimated recoverable values.
| xv. | DEPRECIATION, DEPLETION AND AMORTIZATION |
Under Colombian Government Entity GAAP, all tangible equipment, including those used in crude oil and natural gas, exploration and development, are depreciated on a straight-line basis over the related estimated useful lives. Intangible crude oil and natural gas assets reflected on the Company’s consolidated balance sheets as natural and environmental resources are depleted on a units-of-production basis.
In the case of HOCOL, all tangible and intangible assets used in the production of crude and natural gas production are depreciated or depleted using the units of production method, using developed proved reserves, except for the pipeline asset which is depreciated on a straight-line basis over the related estimated useful life (20 years). For REFICAR, in the case of the unit “Viscorreductora”, this is depreciated based on a 4 year life on a straight line basis, ending in December 2012. For BIOENERGY, in relation to agricultural sugarcane crops, the Company develops the plantations that it will use as base for the production of Bioethanol. The cost of the agricultural plantations will be amortized during productive cycle time frame, in agreement with recognized technical value methods.
Under U.S. GAAP, all assets, including tangible equipment, used in crude oil and natural gas producing activities are required to be depreciated or depleted using a units-of-production method, using proved reserves calculated in accordance with SEC requirements. Therefore, an adjustment to net income per U.S. GAAP has been recorded to account for the difference in depreciation, depletion and amortization expense based on the above-described differences in the methods used. In addition, the financial statements reflect the amortization of those assets affected by the application of ASC 740-10, Accounting for Acquired Temporary Differences in Certain Purchase Transactions That Are Not Accounted for as Business Combinations. Therefore, an adjustment to net income per U.S. GAAP has been recorded to account for the difference in depreciation, depletion and amortization expense.
| xvi. | ASSET RETIREMENT OBLIGATIONS |
Under Colombian Government Entity GAAP , the Company updates annually the analysis of the estimated liability for future asset retirement obligations as of each balance sheet date. The liability is adjusted to the current value and an offsetting amount is recorded as an adjustment to the asset cost. Until 2009 the elements of the liability originated in U.S. dollars, changes in the foreign currency rates are included in the adjustment to the liability and the related asset, the component of the asset cost resulting from this liability is included in the depreciable base of the related asset.
For purposes of U.S. GAAP reporting, the Company follows the provisions of Accounting Standards Codification (ASC) 410-20Asset Retirement Obligations. ASC 410-20 requires the Company to recognize a liability for the present value of all legal obligations associated with the retirement of tangible, long-lived assets as of the date the related asset was placed into service, and capitalize an equal amount as an asset retirement cost (asset). Each period the liability is accreted using the effective interest rate method. The accretion is included as an operating expense. The cost associated with the abandonment obligation, is included in the computation of depreciation, depletion and amortization.
An adjustment has been recorded in the consolidated financial statements to reflect accretion expense, and the related obligation and assets in accordance with ASC 410-20.
For Pipeline systems there is insufficient information to reasonably determine the timing and/or method of settlement for estimating the fair value of the asset retirement obligation. In these cases, the asset retirement obligation cost is considered indeterminate because there is no data or information that can be derived from past practice, industry practice, our intentions or the estimated economic life of the asset. Useful lives of most pipeline systems are primarily derived from available supply resources and ultimate consumption of those resources by end users. Variables can affect the remaining lives of the assets which preclude us from making a reasonable estimate of the asset retirement obligation. Indeterminate asset retirement obligation costs will be recognized in the period in which sufficient information exists to allow us to reasonably estimate potential settlement dates and methods.
In addition to the aforementioned situation, it is not possible at this time to reasonably estimate the amount of any obligation for asset retirement obligation related to refineries since the Company undergoes major renovations. In addition, The Company believes there is not sufficient information available to estimate the fair value of the asset retirement obligation because the settlement date or the range of potential settlement dates have not been specified by others and information is not available to apply an expected present value technique.
The following table presents the changes in asset retirement obligations for 2012 and 2011 as is required by ASC 410-20.
| | | 2012 | | | 2011 | |
| Balance at beginning of year | | $ | 2,125,900 | | | $ | 1,817,791 | |
| Liabilities incurred in the current year | | | 72,340 | | | | 49,748 | |
| Abandonment cost from business combination | | | - | | | | 81,046 | |
| Revisions in estimated cash flows | | | (23,389 | ) | | | 93,687 | |
| Liabilities settled in the current period | | | (103,793 | ) | | | (50,168 | ) |
| Accretion expense | | | 148,593 | | | | 133,796 | |
| Balance at end of year | | $ | 2,219,651 | | | $ | 2,125,900 | |
| xvii. | EQUITY CONTRIBUTIONS |
| a. | Incorporated Institutional Equity |
At the end of association contracts that were signed prior to January 1, 2004, private companies are required to transfer, without cost, to Ecopetrol, all producing wells, facilities and other real estate and assets acquired in executing the contracts. Under Colombian Government Entity GAAP, the Company accounts for the receipt, using the relinquishing Company’s reported historical cost, by recording an increase to assets and equity. The assets are then depreciated in accordance with the Company’s previously disclosed accounting policies. For U.S. GAAP reporting purposes, these balances and their related impacts on accumulated depreciation, depletion and amortization, and cost of production have been removed from the financial statements, based on the fact that the cost of these assets is zero.
The adjustment to conform to U.S. GAAP in 2012 was a reduction in equity of $37,088 (original value of $149,695 net of $112,607 in accumulated depreciation or the assets received), holds materials of $1,105.
The adjustment to conform to U.S. GAAP in 2011 was a reduction in equity of $50,479 (original value of $148,999 net of $98,520 in accumulated depreciation or the assets received), holds materials of $1,214.
The adjustment to conform to U.S. GAAP in 2010 was a reduction in equity of $62,592 (original value of $137,010 net of $74,418 in accumulated depreciation of the assets received) holds materials of $1,819.
| b. | Reversal of Concession Rights Contributed as Capital |
Under Colombian Government Entity GAAP, the Company recorded as reservoirs the contributions of the Nation represented by crude oil and natural gas reserves deriving from the reversion of concessions of oilfield areas in favor of the Nation, given before the effectiveness of Decree 1760 of 2003. Reserves were valued by means of the technical-economic model where the value per barrel resulted from the relation of the net present value obtained at a discount rate and the total proved reserves on the contribution date.
For U.S. GAAP purposes, these reversions were considered a transfer of assets between entities under common control. Ecopetrol, the entity that received the net assets, recognized the assets transferred at their carrying amounts in the accounts of the transferring entity at the date of transfer which was zero value. The unamortized amount reverted at December 31, 2012 and 2011 was $17,013 and $19,737 respectively. Since 2003 (creation of theAgencia Nacional de Hidrocarburos - ANH) there have not been reversals of concessions.
Under Colombian Government Entity GAAP, the borrowing costs correspond to interest paid, lender commissions and other costs related to the debt transactions, the exchange difference for the interest rate to be paid, the amortization of premiums and discounts in the placement of bonds and securities, and any income results earned on the temporary investment of such loans.
Under U.S. GAAP, the borrowing costs correspond to interest paid, lender commissions and other costs related to the debt transactions, the amortization of premiums and discounts in the placement of bonds and securities, should not offset interest expense with interest income, unless the financing transaction involves restricted, tax-exempt borrowings. Unlike Colombian Government Entity GAAP, the cost of borrowing does not include the exchange difference for the interest rate to be paid, unless such difference forms part of the negotiation of the interest rate for the transaction.
The total indebtedness cost incurred during 2012 under Colombian Government Entity GAAP was $820,821 and the total indebtedness cost incurred under U.S. GAAP was $820,856. The effects of this adjustment in the reconciliation of income were $36. The total indebtedness cost incurred during 2011 under Colombian Government Entity GAAP was $608,261 and the total indebtedness cost incurred under U.S. GAAP was $608,912. The effects of this adjustment in the reconciliation of income were $652. The total indebtedness cost incurred during 2010 under Colombian Government Entity GAAP was $ 519,697 and the total indebtedness cost incurred under U.S. GAAP was $521,367.The effects of this adjustment in the reconciliation of income were $1,670.
| xix. | BUSINESS COMBINATIONS |
Under Colombian Government Entity GAAP, goodwill corresponds to the difference between the acquisition price and the book value of the acquired Company recognized as an intangible asset. Separate intangibles are not identified under Colombian Government Entity GAAP nor are assets stepped up to fair values as a result of acquisitions; if the book value is higher than the acquisition price, the resulting difference is recorded as a gain. The amount recognized as goodwill is amortized during the period in which the Company expects to receive future benefits; in addition, it is subject to an annual impairment test
Under U.S. GAAP, goodwill is not amortized, but it is subject to an annual impairment test with the option of an initial qualitative test.In addition, the tax effect on temporary difference between tax basis and fair values is allocated to goodwill.
The following table shows, by Company, the goodwill balance as of December 31, 2012, 2011 and 2010 net of the amount of deferred income tax on goodwill and the translation adjustment:
| Company | | Balance before
impairment
2011 | | | Goodwill
acquired during
2012 | | | Exchange
rate effect | | | Deferred
income tax | | | Balance before
impairment
2012 | | | Accumulated
impairment 2012 | | | Balance 2012 | |
| Propilco | | $ | 694,387 | | | $ | - | | | $ | (56,829 | ) | | $ | (1,540 | ) | | $ | 636,018 | | | $ | (46,691 | ) | | $ | 589,327 | |
| Refineria de Cartagena S.A. | | | 731,879 | | | | - | | | | (65,729 | ) | | | - | | | | 666,150 | | | | - | | | | 666,150 | |
| Bioenergy | | | 8,993 | | | | - | | | | - | | | | - | | | | 8,993 | | | | - | | | | 8,993 | |
| Total | | $ | 1,435,259 | | | $ | - | | | $ | (122,558 | ) | | $ | (1,540 | ) | | $ | 1,311,161 | | | $ | (46,691 | ) | | $ | 1,264,470 | |
| Company | | Balance before
impairment
2010 | | | Goodwill
acquired during
2011 | | | Exchange
Rate Effect | | | Deferred
Income tax | | | Balance Before
impairment 2011 | | | Accumulated
Impairment
2011 | | | Balance 2011 | |
| Propilco | | $ | 650,577 | | | $ | - | | | $ | 45,282 | | | $ | (1,472 | ) | | $ | 694,387 | | | $ | (46,691 | ) | | $ | 647,696 | |
| Refineria de Cartagena S.A. | | | 721,062 | | | | - | | | | 10,817 | | | | - | | | | 731,879 | | | | - | | | | 731,879 | |
| Bioenergy | | | 8,993 | | | | - | | | | - | | | | - | | | | 8,993 | | | | - | | | | 8,993 | |
| Equion | | | - | | | | 226,592 | | | | - | | | | (226,592 | ) | | | - | | | | - | | | | - | |
| Total | | $ | 1,380,632 | | | $ | 226,592 | | | $ | 56,099 | | | $ | (228,064 | ) | | $ | 1,435,259 | | | $ | (46,691 | ) | | $ | 1,388,568 | |
Under Colombian Government Entity GAAP, the following table shows the amounts deductible for income tax purposes for 2012 and 2011.
| | | 2012 | |
| Company | | Goodwill | | | Accumulated
Amortization | | | Balance | | | Net Effect | | | Remaining
time-years | |
| Propilco | | | 327,986 | | | | (86,572 | ) | | | 241,414 | | | | 79,667 | | | | 14,8 | |
| Andean Chemicals Ltd | | $ | 357,629 | | | $ | (94,400 | ) | | $ | 263,229 | | | $ | 86,866 | | | | 14,8 | |
| IPL Enterprises | | | 537,093 | | | | (137,257 | ) | | | 399,836 | | | | 131,946 | | | | 12 | |
| Offshore International Group – “OIG” | | | 748,986 | | | | (186,175 | ) | | | 562,811 | | | | 185,728 | | | | 11 | |
| Hocol | | | 748,947 | | | | (157,333 | ) | | | 591,615 | | | | 195,233 | | | | 13 | |
| Equion | | | 972,409 | | | | (189,695 | ) | | | 782,714 | | | | 258,296 | | | | 8.3 | |
| Total | | $ | 3,693,050 | | | $ | (851,432 | ) | | $ | 2,841,619 | | | $ | 937,736 | | | | | |
| | | 2011 | |
| Company | | Goodwill | | | Accumulated
Amortization | | | Balance | | | Net Effect | | | Remaining
time-years | |
| Propilco | | $ | 327,986 | | | $ | (68,002 | ) | | $ | 259,984 | | | $ | 85,795 | | | | 15.8 | |
| Andean Chemicals Ltd | | | 357,629 | | | | (74,152 | ) | | | 283,477 | | | | 93,548 | | | | 15.8 | |
| IPL Enterprises | | | 537,093 | | | | (101,451 | ) | | | 435,642 | | | | 143,762 | | | | 13.0 | |
| Offshore International Group – “OIG” | | | 749,699 | | | | (130,766 | ) | | | 618,933 | | | | 204,248 | | | | 12.0 | |
| Hocol | | | 801,911 | | | | (109,686 | ) | | | 692,225 | | | | 228,434 | | | | 14.0 | |
| Equion | | | 957,513 | | | | (84,912 | ) | | | 872,600 | | | | 287,958 | | | | 9.3 | |
| Total | | $ | 3,731,831 | | | $ | (568,969 | ) | | $ | 3,162,862 | | | $ | 1,043,745 | | | | | |
Under Colombian Government Entity GAAP in 2012 and 2011, $282,463 and $262,984 were amortized in regard to goodwill acquired from OIG, Ecopetrol Transportation Company, Hocol, Andean Chemicals, IPL Enterprises, Propilco and Equion. The amortization in the table above represents the accumulated amortization of the companies that could be deductible for income tax purposes. Under U.S. GAAP, goodwill acquired from OIG, which is recognized by the equity method, is included as part of the investment.
Under U.S. GAAP, Ecopetrol tests goodwill for impairment at least annually using a two step process that begins with an estimation of the fair value of a reporting unit. The first step is a screen for potential impairment and the second step measures the amount of impairment. Ecopetrol did not perform a qualitative analysis although allowed.
Fair value is determined by reference to market value, if available, or by a qualified evaluator or pricing model. Determination of a fair value by a qualified evaluator or pricing model requires management to make assumptions and use estimates. Management believes that the assumptions and estimates used are reasonable and supportable in the existing market environment and commensurate with the risk profile of the assets valued. However, different assumptions and estimates could be used which would lead to different results. The valuation models used to determine the fair value of these companies are sensitive to changes in the underlying assumptions. For example, the prices and volumes of product sales to be achieved and the prices which will be paid for the purchase of raw materials are assumptions which may vary in the future. Adverse changes in any of these assumptions could lead the Company to record a goodwill impairment charge.
During 2011, Ecopetrol performed an impairment test of goodwill which showed that goodwill had been impaired in Propilco by $46,691, due to the increase in book value during current year as a result of a change in functional currency from Colombian pesos to US dollars. In addition during 2011 Propilco change their raw material suppliers due to Ecopetrol stopped providing it. New suppliers are more expensive than Ecopetrol so in the foreseeable a cost increase on Ecopetrol investment in Propilco is expected.
During 2012, Ecopetrol was not incurred involved in any business combination.
In August 2010, Ecopetrol entered in into a memorandum of understanding with Talisman Colombia Holdco Limited, or Talisman, a Canadian oil and gas Company, to acquire BP Exploration Company (Colombia) Limited, a British Petroleum subsidiary operating in Colombia; the acquired Company was renamed as Equion Energia Limited. After obtaining required authorizations, we completed the acquisition, in January 24, 2011, which includes assets in oil and gas exploration and production as well as oil transportation and gas marketing. As a result of this acquisition, we increased our participation in the ownership of the Ocensa pipeline from 60.00% to 72.65%, in ODC from 66% to 73% and in Oleoducto del Alto Magdalena, or OAM assets, from 83.00% to 85.12%. We also acquired a 10.20% interest in Transgas de Occidente.
The total acquisition price, paid in cash, was US$1,596,157 thousands, Ecopetrol totals 51% ownership, the remaining 49% represents Talisman Energy Inc. share. The following table details the purchase price calculation (USD in thousands) as well as the Colombian peso equivalent (in millions) of the transaction using the effective exchange rate on the dates of the payments.
| | | Amount USD | | | Amount COP | |
| Purchase Price | | $ | 1,750,000 | | | | | |
| Less: Purchase Price Adjustment | | | (153,842 | ) | | | | |
| Adjusted Purchase Price | | | 1,596,157 | | | | | |
| Participation (%) | | | 51 | % | | | | |
| Total Purchase Price | | $ | 814,040 | | | $ | 1,483,891 | |
The acquisition was accounted for as a business combination (ASC 805) which, among other things, requires assets acquired and liabilities assumed to be measured at their acquisition date fair values. Fair value measurements and Purchase Price Allocation process was finalized in fourth quarter 2011.
Pro-forma financial information is not presented as it would not be materially different from the information presented in the Consolidated Statement of Income.
The following table summarizes the measurement at fair value of the assets acquired and liabilities assumed:
| | | Amount USD | |
| Current assets | | $ | 293,465 | |
| Investments and long-term receivables | | | 508,242 | |
| Property, plant and equipment and reserves | | | 1,367,948 | |
| Deferred tax asset | | | 15,073 | |
| Other assets | | | 24,913 | |
| Total assets acquired | | $ | 2,209,641 | |
| Current liabilities | | | 331,145 | |
| Long term debt | | | 3,601 | |
| Deferred tax liability | | | 283,332 | |
| Other liabilities | | | 131,835 | |
| Total liabilities acquired | | | 749,913 | |
| Net assets acquired | | $ | 1,459,728 | |
| Non-controlling interest goodwill | | | 66,850 | |
| Goodwill | | | 69,579 | |
| Total consideration paid in cash | | $ | 1,596,157 | |
Property, plant and equipment and reserves were measured primarily using an income approach. The fair values of the acquired oil and gas properties were based on significant inputs not observable in the market and thus represent Level 3 measurements. Significant inputs included estimated resource volumes, assumed future production profiles, and assumptions on the timing and amount of future operating and development costs.
The net assets acquired for US$1,459,728, represent $2,682,999 pesos and goodwill of $226,592 pesos. The goodwill represents the amount of the consideration transferred in excess of the values assigned to the individual assets acquired and liabilities assumed. Goodwill represents the future economic benefits arising from other assets acquired that could not be individually identified and separately recognized. The fair value of the 49% share of Talisman Energy Inc. is US$782,117.
In Colombia, the goodwill is deductible for tax purposes, thus, a deferred tax asset of $315,979 was recognized for the difference between the tax goodwill and the goodwill, resulting in a bargain purchase gain of $89,387 recorded in earnings for the year ended December 31, 2011.
In addition, Ecopetrol increased its ownership interest in Ocensa and ODC while retaining control, as a result, the difference between the fair value and the carrying amount of the non-controlling interest was recognized in a decrease in additional paid-in-capital for the amount of $792,440.
| xx. | NON-CONTROLLING INTEREST |
This table presents the carrying amount of total equity (net assets) attributable to the non-controlling interest as of December 31 of 2012, 2011 and 2010.
| | | OCENSA | | | ODC | | | ODL | | | BIOENERGY | | | OBC | | | EQUION | | | TOTAL | |
| Balance 2009 | | | 482,896 | | | | 14,192 | | | | 128,477 | | | | 9,153 | | | | - | | | | - | | | | 634,718 | |
| Other non-controlling interest | | | - | | | | 3,902 | | | | - | | | | 1,346 | | | | - | | | | - | | | | 5,248 | |
| Net income (loss) | | | 223,403 | | | | (7,173 | ) | | | 21,676 | | | | (975 | ) | | | (5,042 | ) | | | - | | | | 231,889 | |
| Distribution of dividends | | | (99,888 | ) | | | - | | | | - | | | | - | | | | - | | | | - | | | | (99,888 | ) |
| Return of capital through and due to spin-off | | | (144,251 | ) | | | - | | | | - | | | | - | | | | - | | | | - | | | | (144,251 | ) |
| Dividends for spin-off | | | (318,670 | ) | | | - | | | | - | | | | - | | | | - | | | | - | | | | (318,670 | ) |
| Translation adjustments | | | - | | | | - | | | | 305 | | | | - | | | | - | | | | - | | | | 305 | |
| Balance 2010 | | | 143,490 | | | | 10,921 | | | | 150,458 | | | | 9,524 | | | | (5,042 | ) | | | - | | | | 309,351 | |
| Acquired non-controlling interest (*) | | | (88,970 | ) | | | (3,536 | ) | | | - | | | | - | | | | - | | | | 1,425,702 | | | | 1,333,196 | |
| Issuance of Company shares | | | - | | | | - | | | | 53,284 | | | | - | | | | 321,044 | | | | - | | | | 374,328 | |
| Net income (loss) | | | 37,787 | | | | (4,739 | ) | | | 22,493 | | | | (2,294 | ) | | | (9,114 | ) | | | 196,259 | | | | 240,392 | |
| Other comprehensive income | | | - | | | | - | | | | - | | | | - | | | | - | | | | 116 | | | | 116 | |
| Translation adjustments | | | - | | | | - | | | | 1,404 | | | | - | | | | - | | | | 29,332 | | | | 30,736 | |
| Balance 2011 | | $ | 92,307 | | | $ | 2,646 | | | $ | 227,639 | | | $ | 7,230 | | | $ | 306,888 | | | $ | 1,651,409 | | | $ | 2,288,119 | |
| Acquired non-controlling interest | | | - | | | | - | | | | - | | | | (1,797 | ) | | | 672 | | | | - | | | | (1,125 | ) |
| Issuance of Company shares | | | - | | | | - | | | | - | | | | 5,492 | | | | - | | | | - | | | | 5,492 | |
| Net income (loss) | | | 51,408 | | | | 11,888 | | | | 46,133 | | | | (1,593 | ) | | | (13,700 | ) | | | 97,709 | | | | 191,845 | |
| Other comprehensive income | | | - | | | | - | | | | - | | | | - | | | | - | | | | 121 | | | | 121 | |
| Translation adjustments | | | - | | | | - | | | | (44 | ) | | | - | | | | - | | | | (49,923 | ) | | | (49,967 | ) |
| Spin-off of Ocensa shares | | | 73,797 | | | | - | | | | - | | | | - | | | | - | | | | (73,797 | ) | | | - | |
| Dividends for Spin-Off | | | - | | | | - | | | | - | | | | - | | | | - | | | | (37 | ) | | | (37 | ) |
| Balance 2012 | | $ | 217,512 | | | $ | 14,534 | | | $ | 273,728 | | | $ | 9,332 | | | $ | 293,860 | | | $ | 1,625,482 | | | $ | 2,434,448 | |
(*) Ecopetrol acquired 51.00% of Equion Energia Limited on January 24, 2011. As a result of this business combination Ecopetrol increased its participation in Ocensa by 12.65% and its participation in ODC by 7.43%. The amount of $1,425,702 in Equion includes $205 related to its unrealized gains on bonds. In 2012 Ecopetrol and Talisman Energy Inc. proportionally spun-off Equion Energia Limited participation in Ocensa.
| xxi. | CUMULATIVE TRANSLATION ADJUSTMENT |
Under Colombian Government Entity GAAP, the companies domiciled outside of the country, regardless of its functional currency, must report in USD and then translated to Colombian pesos with the impact recorded as cumulative translation adjustment.
For U.S. GAAP, the Company must remeasure all subsidiary financial information to its functional currency and then translate it to the reporting currency. This difference in methodology results in a difference in the translated amounts recorded in the consolidated financial statements.
As such an adjustment is made to appropriately reflect amounts under translated U.S. GAAP.
| xxii. | PUBLIC OFFERING COST |
In August 2011, the Company issued shares in a second public offering in Colombia. Under Colombian Government Entity GAAP, all related costs of this issuance were expensed as well as a discount granted to shares fully paid in cash. For U.S. GAAP purposes, direct costs incurred in public offerings and cash discounts are recorded as a reduction of the proceeds received and, consequently, a reduction in equity. An adjustment in the amount of $103,949 was recorded to recognize the effect of these amounts. There were not any public offering shares during 2012.
Under Colombian Government Entity GAAP, earnings per share ("EPS") are calculated by dividing net income by the weighted average of both common and preferred shares outstanding for each period presented. However, although the Company has presented EPS under Colombian Government Entity GAAP for informational purposes, the presentation of EPS is not required for financial statements issued under Colombian Government Entity GAAP. The Company does not have any issued or outstanding preferred shares.
U.S. GAAP requires dual presentation of basic and diluted EPS for entities with complex capital structures, as well as a reconciliation of the basic EPS calculation with the diluted EPS calculation. Basic EPS is calculated by dividing net income available to common shareholders by the weighted average of common shares outstanding for the corresponding period.
Diluted EPS assumes the issuance of common shares for all dilutive potential common shares outstanding during the reporting period. For the years ended December 31, 2012, 2011 and 2010, the Company had a simple capital structure. There are no any other compensation plan involving shares. Therefore, the Company is not required to present diluted EPS for these years.
In 2012, there were no customers in excess of 10% of total sales. In 2011, there were no customers in excess of 10% of total sales. In 2010 one customer of the refining segment accounted for 11.4% of total sales. One customer of the production segment and market and supply segment accounted for 10.5% from total sales. No other customers accounted for more than 10% of total sales in 2010. There was no exposure that affects the financial position of Ecopetrol if the company lost the client.
The majority of the Company’s assets and activities are located in Colombia. The financial position and results of operations of those subsidiaries located outside of Colombia are not material to the Company.
| xxv. | RECENTLY ADOPTED U.S. ACCOUNTING STANDARDS |
In May 2011, FASB issued ASU No. 2011-04 Fair Value Measurement (Topic 820) - Amendments to Achieve Common Fair Value Measurement and Disclosure Requirements in U.S. GAAP and IFRS, the amendments in this Update are the result of the work by the FASB and the IASB to develop common requirements for measuring fair value and for disclosing information about fair value measurements in accordance with U.S. generally accepted accounting principles (GAAP) and International Financial Reporting Standards (IFRSs). This amendment is effective prospectively, for public entities, the amendments are effective during interim and annual periods beginning after December 15, 2011. Ecopetrol adopted this update in fiscal year 2012 and determined that there will not be any significant effect on fair value measurements or disclosures of the Company.
In June 2011, FASB issued ASU No. 2011-05 Comprehensive Income (Topic 220) - Presentation of Comprehensive Income, the amendments require that all non-owner changes in stockholders’ equity be presented either in a single continuous statement of comprehensive income or in two separate but consecutive statements in order to improve the comparability, consistency, and transparency of financial reporting and to increase the prominence of items reported in other comprehensive income. The amendments in this Update should be applied retrospectively. For public entities, the amendments are effective for fiscal years beginning after December 15, 2011. In December 2011, the FASB issued ASU No. 2011-12 Comprehensive Income (Topic 220) Deferral of the Effective Date for Amendments to the Presentation of Reclassifications of Items Out of Accumulated Other Comprehensive Income In Accounting Standards Update No. 2011-05. Ecopetrol adopted these updates in fiscal year 2012 and determined that no significant effect will arise in our financial statements.
In October 2012, FASB issued ASU No. 2012-03 Technical Corrections and Amendments to SEC sections pursuant to SAB 114 and SEC Release 33-9250, and 2012-04 Technical Corrections and Improvements. These ASU introduce changes related to cross references among SEC and FASB and include minor changes in Codification that have no impact in our accounting policies.
Recently issued accounting standards and U.S. GAAP pronouncements
In December 2011, FASB issued ASU No. 2011-11 Balance Sheet (Topic 210) - Disclosures about Offsetting Assets and Liabilities, the amendments in this Update require an entity to disclose information about offsetting and related arrangements to enable users of its financial statements to understand the effect of those arrangements on its financial position. An entity is required to apply the amendments for annual reporting periods beginning on or after January 1, 2013, and interim periods within those annual periods. On January 31, 2013, the FASB issued ASU 2013-01, which clarifies the scope of the offsetting disclosure requirements in ASU 2011-11. Under ASU 2013-01, the disclosure requirements would apply to derivative instruments accounted for in accordance with ASC 815, including bifurcated embedded derivatives, repurchase agreements and reverse repurchase agreements, and securities borrowing and securities lending arrangements that are either offset on the balance sheet or subject to an enforceable master netting arrangement or similar agreement. However, as a result our analysis we don’t expect any impact at all due to we don’t have these compensation agreements.
The FASB issued ASU 2013-02 in February 2013. This standard became effective for the company on January 1, 2013. ASU 2013-02 changes the presentation requirements of significant reclassifications out of accumulated other comprehensive income in their entirety and their corresponding effect on net income. For other significant amounts that are not required to be reclassified in their entirety, the standard requires the company to cross-reference to related footnote disclosures. Adoption of the standard is not expected to have a significant impact on the company's financial statement presentation.
On February 28, 2013, the FASB issued ASU 2013-04, which is based on a consensus reached by the EITF. The ASU requires entities to “measure obligations resulting from joint and several liability arrangements for which the total amount of the obligation within the scope of this guidance is fixed at the reporting date, as the sum of the following: a) The amount the reporting entity agreed to pay on the basis of its arrangement among its co-obligors b) Any additional amount the reporting entity expects to pay on behalf of its co-obligors.” Required disclosures include a description of the joint-and-several arrangement and the total outstanding amount of the obligation for all joint parties. The ASU permits entities to aggregate disclosures (as opposed to providing separate disclosures for each joint-and-several obligation). These disclosure requirements are incremental to the existing related-party disclosure requirements in ASC 850. The ASU is effective for all prior periods in fiscal years beginning on or after December 15, 2013. Adoption of the standard is not expected to have a significant impact on the company's financial statement presentation.
On March 4, 2013, the FASB issued ASU 2013-05, which indicates that the entire amount of a cumulative translation adjustment (CTA) related to an entity's investment in a foreign entity should be released when there has been a) Sale of a subsidiary or group of net assets within a foreign entity and the sale represents the substantially complete liquidation of the investment in the foreign entity. b) Loss of a controlling financial interest in an investment in a foreign entity (i.e., the foreign entity is deconsolidated). c) Step acquisition for a foreign entity (i.e., when an entity has changed from applying the equity method for an investment in a foreign entity to consolidating the foreign entity). The ASU does not change the requirement to release a pro rata portion of the CTA of the foreign entity into earnings for a partial sale of an equity method investment in a foreign entity. the ASU is effective for fiscal years (and interim periods within those fiscal years) beginning on or after December 15, 2013. Adoption of the standard is not expected to have a significant impact on the company's financial statement presentation.
The following segment information has been prepared according to ASC 280, Disclosure about Segments of an Enterprise and Related Information. Financial information by business segment is reported in accordance with the internal reporting system under Colombian Government Entity GAAP and shows internal segment information that is used by the chief operating decision maker to manage and measure the performance of Ecopetrol.
The financial information among segments is reported considering each business as a separate entity. Prices between segments are established by referencing those that would apply in an arm’s length transaction. Each segment should bear the costs and expenses required to put the product in terms of use or marketing. Each segment assumes its administrative expenses and all non-operational transactions related to their activity.
The Company operates under the following segments, which are described as follows:
Exploration and Production — this segment includes the Company’s oil & gas exploration and production activities. Revenue is derived from the sale of crude oil and natural gas to intercompany segments, at market prices, and to third parties. Revenue is derived from local sales of crude oil, regulated fuels, non-regulated fuels and natural gas. Sales are made to local and foreign distributors. Costs include those costs incurred in production. Expenses include all exploration costs that are not capitalized.
Refiningand Petrochemicals – this segment includes the Company’s refining activities. Goods sold, both internally and to third parties, include refined products such as motor fuels, fuel oils and petrochemicals at market prices. This segment also includes sales of industrial services to third parties.
Transportation – this segment includes the Company’s sales and costs associated with the Company’s pipelines and other transportation activities
Market and Supply – this segment includes the Company’s revenues, costs and expenses associated with distribution, including distribution of purchases from third parties and the ANH (Agencia Nacional de Hidrocarburos).
These functions have been defined as the operating segments of the Company since these are the segments (a) that engage in business activities from which revenues are earned and expenses are incurred; (b) whose operating results are regularly reviewed by the Company's chief operating decision maker to allocate resources to the segments and assess their performance; and (c) for which discrete financial information is available. Internal transfers represent sales to inter-company segments and are recorded and presented at market prices.
The following tables present the Company’s consolidated balance sheet by segment in accordance with Colombian Government Entity GAAP:
| | | As of December 31, 2012 | |
| | | Exploration &
Production | | | Refining
Activities | | | Transportation | | | Market and
Supply | | | Eliminations | | | Total | |
| Current assets | | | | | | | | | | | | | | | | | | | | | | | | |
| Cash and cash equivalents | | $ | 6,157,784 | | | $ | 460,291 | | | $ | 1,272,326 | | | $ | 55,778 | | | $ | (5,489 | ) | | $ | 7,940,690 | |
| Accounts and notes receivable | | | 3,111,006 | | | | 2,918,286 | | | | 646,561 | | | | 658,394 | | | | (2,072,746 | ) | | | 5,261,501 | |
| Inventories | | | 1,078,414 | | | | 1,411,636 | | | | 795 | | | | 547,956 | | | | (232,519 | ) | | | 2,806,282 | |
| Investments | | | 2,095,917 | | | | 33,680 | | | | 52,041 | | | | 18,646 | | | | (828,725 | ) | | | 1,371,559 | |
| Other current assets | | | 3,334,857 | | | | 1,979,056 | | | | 307,559 | | | | 25,789 | | | | (143,666 | ) | | | 5,503,595 | |
| | | | 15,777,978 | | | | 6,802,949 | | | | 2,279,282 | | | | 1,306,563 | | | | (3,283,145 | ) | | | 22,883,627 | |
| Investments in non-consolidated companies | | | 1,022,084 | | | | 40,900 | | | | 12,210 | | | | 1,996 | | | | - | | | | 1,077,190 | |
| Property, plant and equipment, net | | | 30,637,517 | | | | 13,991,025 | | | | 11,436,179 | | | | 29,724 | | | | (390,760 | ) | | | 55,703,685 | |
| Other long term assets | | | 18,867,275 | | | | 7,694,224 | | | | 12,745,077 | | | | 344,823 | | | | (5,436,323 | ) | | | 34,215,076 | |
| Long term assets | | | 50,526,876 | | | | 21,726,149 | | | | 24,193,466 | | | | 376,543 | | | | (5,827,083 | ) | | | 90,995,951 | |
| Total assets | | $ | 66,304,854 | | | $ | 28,529,098 | | | $ | 26,472,748 | | | $ | 1,683,106 | | | $ | (9,110,228 | ) | | $ | 113,879,578 | |
| | | | | | | | | | | | | | | | | | | | | | | | | |
| Accounts payable | | $ | (7,827,800 | ) | | $ | (1,743,525 | ) | | $ | (2,684,244 | ) | | $ | (915,703 | ) | | $ | 2,265,897 | | | $ | (10,905,375 | ) |
| Financial obligations short-term | | | (333,210 | ) | | | (443,208 | ) | | | (1,741,870 | ) | | | (1,896 | ) | | | 281,045 | | | | (2,239,139 | ) |
| Other current liabilities | | | (6,427,763 | ) | | | (2,474,522 | ) | | | (947,912 | ) | | | (142,402 | ) | | | 3,387 | | | | (9,989,212 | ) |
| Current liabilities | | | (14,588,773 | ) | | | (4,661,255 | ) | | | (5,374,026 | ) | | | (1,060,001 | ) | | | 2,550,329 | | | | (23,133,726 | ) |
| Financial obligations long-term | | | (3,035,573 | ) | | | (8,210,403 | ) | | | (2,134,095 | ) | | | (21 | ) | | | 1,913,406 | | | | (11,466,686 | ) |
| Other long term liabilities | | | (9,453,083 | ) | | | (2,053,543 | ) | | | (1,389,086 | ) | | | (163,694 | ) | | | 1,123,288 | | | | (11,936,118 | ) |
| Long term liabilities | | | (12,488,656 | ) | | | (10,263,946 | ) | | | (3,523,181 | ) | | | (163,715 | ) | | | 3,036,694 | | | | (23,402,804 | ) |
| Total liabilities | | | (27,077,429 | ) | | | (14,925,201 | ) | | | (8,897,207 | ) | | | (1,223,716 | ) | | | 5,587,023 | | | | (46,536,530 | ) |
| Non-controlling interest | | | (1,020,677 | ) | | | (12,849 | ) | | | (1,569,016 | ) | | | - | | | | 375 | | | | (2,602,167 | ) |
| Shareholders’ equity of Ecopetrol | | | (38,206,748 | ) | | | (13,591,048 | ) | | | (16,006,525 | ) | | | (459,390 | ) | | | 3,522,830 | | | | (64,740,881 | ) |
| Total equity | | | (39,227,425 | ) | | | (13,603,897 | ) | | | (17,575,541 | ) | | | (459,390 | ) | | | 3,523,205 | | | | (67,343,048 | ) |
| Total liabilities and equity | | $ | (66,304,854 | ) | | $ | (28,529,098 | ) | | $ | (26,472,748 | ) | | $ | (1,683,106 | ) | | $ | 9,110,228 | | | $ | (113,879,578 | ) |
| Capital expenditures | | $ | 8,223,166 | | | $ | 4,458,762 | | | $ | 2,781,277 | | | $ | 4,657 | | | $ | - | | | $ | 15,467,862 | |
| Goodwill | | $ | 1,945,463 | | | $ | 514,093 | | | $ | 382,962 | | | $ | - | �� | | $ | - | | | $ | 2,842,518 | |
| | | As of December 31, 2011 | |
| | | Exploration &
Production | | | Refining
Activities | | | Transportation | | | Market and
Supply | | | Eliminations | | | Total | |
| Current assets | | | | | | | | | | | | | | | | | | | | | | | | |
| Cash and cash equivalents | | $ | 5,489,959 | | | $ | 403,905 | | | $ | 1,080,111 | | | $ | 63,662 | | | $ | (257,700 | ) | | $ | 6,779,937 | |
| Accounts and notes receivable | | | 3,653,401 | | | | (41,433 | ) | | | 231,897 | | | | 1,007,032 | | | | (214,361 | ) | | | 4,636,536 | |
| Inventories | | | 1,147,213 | | | | 1,343,072 | | | | 855 | | | | 503,991 | | | | (233,526 | ) | | | 2,761,605 | |
| Investments | | | 1,358,439 | | | | 45,388 | | | | 351,260 | | | | 39,164 | | | | (456,649 | ) | | | 1,337,602 | |
| Other current assets | | | 1,519,940 | | | | 1,563,270 | | | | 342,980 | | | | 98,726 | | | | (2,581 | ) | | | 3,522,335 | |
| | | | 13,168,952 | | | | 3,314,202 | | | | 2,007,103 | | | | 1,712,575 | | | | (1,164,817 | ) | | | 19,038,015 | |
| Investments in non-consolidated companies | | | 962,906 | | | | 20,888 | | | | 16,902 | | | | 19,363 | | | | - | | | | 1,020,059 | |
| Property, plant and equipment, net | | | 24,817,733 | | | | 10,774,630 | | | | 9,909,505 | | | | 72,529 | | | | (100,229 | ) | | | 45,474,168 | |
| Other long term assets | | | 17,232,843 | | | | 5,841,229 | | | | 6,463,476 | | | | 594,169 | | | | (3,386,573 | ) | | | 26,745,144 | |
| Long term assets | | | 43,013,482 | | | | 16,636,747 | | | | 16,389,883 | | | | 686,061 | | | | (3,486,802 | ) | | | 73,239,371 | |
| Total assets | | $ | 56,182,434 | | | $ | 19,950,949 | | | $ | 18,396,986 | | | $ | 2,398,636 | | | $ | (4,651,619 | ) | | $ | 92,277,386 | |
| | | | | | | | | | | | | | | | | | | | | | | | | |
| Accounts payable | | $ | (2,666,349 | ) | | $ | (1,035,829 | ) | | $ | (269,912 | ) | | $ | (933,515 | ) | | $ | 222,457 | | | $ | (4,683,148 | ) |
| Financial obligations (short-term) | | | (331,490 | ) | | | (321,391 | ) | | | (263,892 | ) | | | (1,890 | ) | | | 87,069 | | | | (831,594 | ) |
| Other current liabilities | | | (6,607,085 | ) | | | (2,572,126 | ) | | | (975,849 | ) | | | (82,635 | ) | | | - | | | | (10,237,695 | ) |
| Current liabilities | | | (9,604,924 | ) | | | (3,929,346 | ) | | | (1,509,653 | ) | | | (1,018,040 | ) | | | 309,526 | | | | (15,752,437 | ) |
| Financial obligations (long-term) | | | (3,617,652 | ) | | | (2,429,766 | ) | | | (3,038,809 | ) | | | - | | | | 1,116,249 | | | | (7,969,978 | ) |
| Other long term liabilities | | | (10,049,747 | ) | | | (1,671,795 | ) | | | (1,435,931 | ) | | | (332,958 | ) | | | 1,876,946 | | | | (11,613,485 | ) |
| Long term liabilities | | | (13,667,399 | ) | | | (4,101,561 | ) | | | (4,474,740 | ) | | | (332,958 | ) | | | 2,993,195 | | | | (19,583,463 | ) |
| Total liabilities | | | (23,272,323 | ) | | | (8,030,907 | ) | | | (5,984,393 | ) | | | (1,350,998 | ) | | | 3,302,721 | | | | (35,335,900 | ) |
| Non-controlling interest | | | (1,087,189 | ) | | | (11,219 | ) | | | (1,154,223 | ) | | | - | | | | - | | | | (2,252,631 | ) |
| Shareholders’ equity of Ecopetrol | | | (31,822,922 | ) | | | (11,908,823 | ) | | | (11,258,370 | ) | | | (1,047,638 | ) | | | 1,348,898 | | | | (54,688,855 | ) |
| Total equity | | | (32,910,111 | ) | | | (11,920,042 | ) | | | (12,412,593 | ) | | | (1,047,638 | ) | | | 1,348,898 | | | | (56,941,486 | ) |
| Total liabilities and equity | | $ | (56,182,434 | ) | | $ | (19,950,949 | ) | | $ | (18,396,986 | ) | | $ | (2,398,636 | ) | | $ | 4,651,619 | | | $ | (92,277,386 | ) |
| Capital expenditures | | $ | 8,067,968 | | | $ | 3,044,252 | | | $ | 3,382,463 | | | $ | 5,988 | | | $ | - | | | $ | 14,500,671 | |
| Goodwill | | $ | 2,102,481 | | | $ | 629,037 | | | $ | 432,244 | | | $ | - | | | $ | - | | | $ | 3,163,762 | |
The Company’s consolidated statement of net income by segment is as follows in accordance with Colombian Government Entity GAAP:
| | | Year ended December 31, 2012 | |
| | | Exploration &
Production | | | Refining
Activities | | | Transportation | | | Market and
Supply | | | Eliminations | | | Total | |
| | | | | | | | | | | | | | | | | | | |
| Revenues: | | | | | | | | | | | | | | | | | | | | | | | | |
| Local sales | | $ | 2,501,015 | | | $ | 19,008,223 | | | $ | 2,879,341 | | | $ | 1,121,995 | | | $ | (1,148,661 | ) | | $ | 24,361,913 | |
| Foreign sales, net | | | 26,607,600 | | | | 7,717,048 | | | | 591 | | | | 15,452,650 | | | | (5,287,800 | ) | | | 44,490,089 | |
| Inter-segment net operating revenues | | | 12,980,715 | | | | 1,621,117 | | | | 1,159,229 | | | | 6,421 | | | | (15,767,482 | ) | | | - | |
| Total Revenue | | | 42,089,330 | | | | 28,346,388 | | | | 4,039,161 | | | | 16,581,066 | | | | (22,203,943 | ) | | | 68,852,002 | |
| Cost of sales | | | 11,600,946 | | | | 27,629,236 | | | | 2,093,392 | | | | 16,133,690 | | | | (22,213,927 | ) | | | 35,243,337 | |
| Depreciation, depletion and amortization | | | 3,771,768 | | | | 658,649 | | | | 859,097 | | | | 2,657 | | | | - | | | | 5,292,171 | |
| Selling and projects | | | 2,297,570 | | | | 454,992 | | | | 402,332 | | | | 80,330 | | | | - | | | | 3,235,224 | |
| Administration expenses | | | 461,278 | | | | 194,000 | | | | 198,774 | | | | 20,928 | | | | - | | | | 874,980 | |
| Costs and expenses | | | 18,131,562 | | | | 28,936,877 | | | | 3,553,595 | | | | 16,237,605 | | | | (22,213,927 | ) | | | 44,645,712 | |
| Operating income | | | 23,957,768 | | | | (590,489 | ) | | | 485,566 | | | | 343,461 | | | | 9,984 | | | | 24,206,290 | |
| Financial income (expenses), net | | | (98,536 | ) | | | 77,493 | | | | 65,296 | | | | (56,950 | ) | | | (155,192 | ) | | | (167,889 | ) |
| Pension expenses | | | (378,442 | ) | | | (431,316 | ) | | | (137,574 | ) | | | (1,123 | ) | | | - | | | | (948,455 | ) |
| Other non-operating income (expenses) | | | (142,171 | ) | | | (231,679 | ) | | | (186,564 | ) | | | (101,017 | ) | | | (96,814 | ) | | | (758,245 | ) |
| Other expenses, net | | | (619,149 | ) | | | (585,502 | ) | | | (258,842 | ) | | | (159,090 | ) | | | (252,006 | ) | | | (1,874,589 | ) |
| Income before income taxes and non-controlling | | | 23,338,619 | | | | (1,175,991 | ) | | | 226,724 | | | | 184,371 | | | | (242,022 | ) | | | 22,331,701 | |
| Income tax benefit (expense) | | | (7,404,563 | ) | | | 325,145 | | | | (23,005 | ) | | | (30,972 | ) | | | - | | | | (7,133,395 | ) |
| Non-Controlling interest | | | (352,649 | ) | | | 1,310 | | | | (68,020 | ) | | | - | | | | - | | | | (419,359 | ) |
| Net income for the year | | $ | 15,581,407 | | | $ | (849,536 | ) | | $ | 135,699 | | | $ | 153,399 | | | $ | (242,022 | ) | | $ | 14,778,947 | |
| | | Year ended December 31, 2011 | |
| | | Exploration &
Production | | | Refining
Activities | | | Transportation | | | Market and
Supply | | | Eliminations | | | Total | |
| | | | | | | | | | | | | | | | | | | |
| Revenues: | | | | | | | | | | | | | | | | | | | | | | | | |
| Local sales | | $ | 1,729,123 | | | $ | 19,062,797 | | | $ | 2,547,156 | | | $ | 1,116,599 | | | $ | (901,046 | ) | | $ | 23,554,629 | |
| Foreign sales, net | | | 24,443,145 | | | | 8,403,561 | | | | 806 | | | | 15,143,416 | | | | (5,578,043 | ) | | | 42,412,885 | |
| Inter-segment net operating revenues | | | 13,558,328 | | | | 1,566,700 | | | | 1,589,959 | | | | 14,483 | | | | (16,729,470 | ) | | | - | |
| Total Revenue | | | 39,730,596 | | | | 29,033,058 | | | | 4,137,921 | | | | 16,274,498 | | | | (23,208,559 | ) | | | 65,967,514 | |
| Cost of sales | | | 10,108,169 | | | | 27,583,170 | | | | 2,040,593 | | | | 15,409,850 | | | | (23,156,169 | ) | | | 31,985,614 | |
| Depreciation, depletion and amortization | | | 3,311,968 | | | | 607,446 | | | | 798,355 | | | | 1,201 | | | | - | | | | 4,718,970 | |
| Selling and projects | | | 1,597,171 | | | | 409,820 | | | | 262,047 | | | | 101,996 | | | | - | | | | 2,371,033 | |
| Administration expenses | | | 552,900 | | | | 261,456 | | | | 200,134 | | | | 4,427 | | | | - | | | | 1,018,917 | |
| Costs and expenses | | | 15,570,208 | | | | 28,861,892 | | | | 3,301,129 | | | | 15,517,474 | | | | (23,156,169 | ) | | | 40,094,534 | |
| Operating income | | | 24,160,388 | | | | 171,166 | | | | 836,792 | | | | 757,024 | | | | (52,390 | ) | | | 25,872,980 | |
| Financial income (expenses), net | | | (241,989 | ) | | | (302,293 | ) | | | (115,164 | ) | | | (273,373 | ) | | | 28,517 | | | | (904,302 | ) |
| Pension expenses | | | (292,011 | ) | | | (318,995 | ) | | | (94,664 | ) | | | (628 | ) | | | - | | | | (706,298 | ) |
| Other non-operating income (expenses) | | | (134,405 | ) | | | (318,938 | ) | | | (89,657 | ) | | | (77,102 | ) | | | (846 | ) | | | (620,948 | ) |
| Other expenses, net | | | (668,405 | ) | | | (940,226 | ) | | | (299,485 | ) | | | (351,103 | ) | | | 27,671 | | | | (2,231,548 | ) |
| Income before income taxes and non-controlling | | | 23,491,983 | | | | (769,060 | ) | | | 537,307 | | | | 405,921 | | | | (24,719 | ) | | | 23,641,432 | |
| Income tax benefit (expense) | | | (7,938,519 | ) | | | 270,062 | | | | (179,620 | ) | | | (107,644 | ) | | | - | | | | (7,955,721 | ) |
| Non-Controlling interest | | | (208,962 | ) | | | 1,151 | | | | (25,566 | ) | | | - | | | | - | | | | (233,377 | ) |
| Net income for the year | | $ | 15,344,502 | | | $ | (497,847 | ) | | $ | 332,121 | | | $ | 298,277 | | | $ | (24,719 | ) | | $ | 15,452,334 | |
| | | Year ended December 31, 2010 | |
| | | Exploration &
Production | | | Refining
Activities | | | Transportation | | | Market and
Supply | | | Eliminations | | | Total | |
| | | | | | | | | | | | | | | | | | | |
| Revenues: | | | | | | | | | | | | | | | | | | | | | | | | |
| Local sales | | $ | 1,423,709 | | | $ | 14,166,202 | | | $ | 2,521,184 | | | $ | 955,576 | | | $ | (860,812 | ) | | $ | 18,205,859 | |
| Foreign sales, net | | | 13,629,198 | | | | 5,641,545 | | | | 717 | | | | 8,163,371 | | | | (3,550,945 | ) | | | 23,883,886 | |
| Inter-segment net operating revenues | | | 9,032,898 | | | | 1,024,563 | | | | 1,186,659 | | | | 47,061 | | | | (11,291,181 | ) | | | - | |
| Total Revenue | | | 24,085,805 | | | | 20,832,310 | | | | 3,708,560 | | | | 9,166,008 | | | | (15,702,938 | ) | | | 42,089,745 | |
| Cost of sales | | | 6,990,223 | | | | 20,421,756 | | | | 1,552,292 | | | | 8,542,971 | | | | (15,522,533 | ) | | | 21,984,709 | |
| Depreciation, depletion and amortization | | | 2,759,835 | | | | 487,911 | | | | 727,970 | | | | 31 | | | | - | | | | 3,975,747 | |
| Selling and projects | | | 2,116,028 | | | | 422,704 | | | | 90,057 | | | | 149,529 | | | | - | | | | 2,778,318 | |
| Administration expenses | | | 242,717 | | | | 184,420 | | | | 164,985 | | | | 11,401 | | | | - | | | | 603,523 | |
| Costs and expenses | | | 12,108,803 | | | | 21,516,791 | | | | 2,535,304 | | | | 8,703,932 | | | | (15,522,533 | ) | | | 29,342,297 | |
| Operating income | | | 11,977,002 | | | | (684,481 | ) | | | 1,173,256 | | | | 462,076 | | | | (180,405 | ) | | | 12,747,448 | |
| Financial income (expenses), net | | | 115,361 | | | | (55,244 | ) | | | 983 | | | | (7,242 | ) | | | (16,069 | ) | | | 37,789 | |
| Pension expenses | | | (157,035 | ) | | | (171,547 | ) | | | (48,706 | ) | | | (338 | ) | | | - | | | | (377,626 | ) |
| Other non-operating income (expenses) | | | (463,171 | ) | | | (146,601 | ) | | | (178,391 | ) | | | (126,831 | ) | | | - | | | | (914,994 | ) |
| Other expenses, net | | | (504,845 | ) | | | (373,392 | ) | | | (226,114 | ) | | | (134,411 | ) | | | (16,069 | ) | | | (1,254,831 | ) |
| Income before income taxes and non-controlling | | | 11,472,157 | | | | (1,057,873 | ) | | | 947,142 | | | | 327,665 | | | | (196,474 | ) | | | 11,492,617 | |
| Income tax benefit (expense) | | | (3,127,944 | ) | | | 266,997 | | | | (294,616 | ) | | | (83,087 | ) | | | - | | | | (3,238,650 | ) |
| Non-Controlling interest | | | - | | | | 403 | | | | (107,899 | ) | | | - | | | | - | | | | (107,496 | ) |
| Net income for the year | | $ | 8,344,213 | | | $ | (790,473 | ) | | $ | 544,627 | | | $ | 244,578 | | | $ | (196,474 | ) | | $ | 8,146,471 | |
The following tables illustrate sales by geographic zones:
Sales by geographic zones for the year ended December 31, 2012
| Zone | | Products | | Value | | | Participation | |
| Colombia* | | Crude oil, Refined, Petrochemicals and natural gas | | $ | 24,447,603 | | | | 35.5 | % |
| United States of America | | Crude oil, Refined and Petrochemicals | | | 24,721,340 | | | | 35.9 | % |
| Asia | | Crude oil, Refined and Petrochemicals | | | 7,201,295 | | | | 10.5 | % |
| Africa | | Refined and Petrochemicals | | | 330,775 | | | | 0.5 | % |
| Europe | | Crude oil, Refined and Petrochemicals | | | 3,977,682 | | | | 5.8 | % |
| South America | | Crude oil, Refined, Petrochemicals and natural gas | | | 1,791,111 | | | | 2.6 | % |
| Central America and Caribbean | | Crude oil, Refined and Petrochemicals | | | 6,213,770 | | | | 9.0 | % |
| Other | | Petrochemicals | | | 168,426 | | | | 0.2 | % |
| | | | | $ | 68,852,002 | | | | 100.0 | % |
*Includes sales to free trade by $85,690
Sales by geographic zones December 31, 2011
| Zone | | Products | | Value | | | Participation | |
| Colombia* | | Crude oil, Refined, Petrochemicals and natural gas | | $ | 23,659,990 | | | | 35.9 | % |
| United States of America | | Crude oil, Refined and Petrochemicals | | | 27,450,466 | | | | 41.6 | % |
| Asia | | Crude oil, Refined and Petrochemicals | | | 4,351,492 | | | | 6.6 | % |
| Africa | | Refined and Petrochemicals | | | 140,512 | | | | 0.2 | % |
| South America | | Crude oil, Refined, Petrochemicals and natural gas | | | 2,458,953 | | | | 3.7 | % |
| Central America and Caribbean | | Crude oil, Refined and Petrochemicals | | | 5,054,208 | | | | 7.7 | % |
| Europe | | Crude oil, Refined and Petrochemicals | | | 2,768,359 | | | | 4.2 | % |
| Other | | Petrochemicals | | | 83,534 | | | | 0.1 | % |
| | | | | $ | 65,967,514 | | | | 100.0 | % |
*Includes sales to free trade zone of $105,361
Sales by geographic zones December 31, 2010
| Zone | | Products | | Value | | | Participation | |
| Colombia* | | Crude oil, Refined, Petrochemicals and natural gas | | $ | 18,350,593 | | | | 43.6 | % |
| United States of America | | Crude oil, Refined and Petrochemicals | | | 14,965,911 | | | | 35.6 | % |
| Asia | | Crude oil, Refined and Petrochemicals | | | 3,952,186 | | | | 9.4 | % |
| South America | | Crude oil, Refined, Petrochemicals and natural gas | | | 1,031,808 | | | | 2.5 | % |
| Central America and Caribbean | | Crude oil, Refined and Petrochemicals | | | 2,311,529 | | | | 5.5 | % |
| Europe | | Crude oil, Refined and Petrochemicals | | | 1,431,301 | | | | 3.4 | % |
| Other | | Petrochemicals | | | 46,417 | | | | 0.1 | % |
| | | | | $ | 42,089,745 | | | | 100.0 | % |
*Includes sales to free trade zone of $144,734
The following tables illustrate sales of products by segment:
Sales of products by segment December 31, 2012
| Local Sales | | Exploration
&
Production | | | Refining
Activities | | | Transportation | | | Market and
Supply | | | Eliminations | | | Total | |
| Medium distillates | | $ | 1,839 | | | $ | 10,304,092 | | | $ | - | | | $ | 827,048 | | | $ | - | | | $ | 11,132,979 | |
| Gasolines | | | - | | | | 5,662,568 | | | | - | | | | 34,610 | | | | - | | | | 5,697,178 | |
| Crude oil | | | 842,975 | | | | - | | | | - | | | | - | | | | (19,784 | ) | | | 823,191 | |
| Other products | | | 126,445 | | | | 1,162,728 | | | | - | | | | 11,891 | | | | (70,299 | ) | | | 1,230,765 | |
| Services | | | 179,731 | | | | 4,949 | | | | 2,879,341 | | | | 44,523 | | | | (1,028,676 | ) | | | 2,079,868 | |
| Natural gas | | | 1,188,966 | | | | - | | | | - | | | | 203,923 | | | | (10,493 | ) | | | 1,382,396 | |
| L.P.G. | | | 160,968 | | | | 350,881 | | | | - | | | | - | | | | (19,409 | ) | | | 492,440 | |
| Diesel and gasoline subsidies | | | - | | | | 809,773 | | | | - | | | | - | | | | - | | | | 809,773 | |
| Plastic and rubber | | | 91 | | | | 713,232 | | | | - | | | | - | | | | - | | | | 713,323 | |
| Total local sales | | $ | 2,501,015 | | | $ | 19,008,223 | | | $ | 2,879,341 | | | $ | 1,121,995 | | | $ | (1,148,661 | ) | | $ | 24,361,913 | |
| Foreign Sales | | Exploration &
Production | | | Refining
Activities | | | Transportation | | | Market and
Supply | | | Eliminations | | | Total | |
| | | | | | | | | | | | | | | | | | | |
| Crude oil | | $ | 26,026,622 | | | $ | - | | | $ | - | | | $ | 15,102,638 | | | $ | (5,244,725 | ) | | $ | 35,884,535 | |
| Fuel oil | | | - | | | | 4,283,814 | | | | - | | | | - | | | | - | | | | 4,283,814 | |
| Gasolines | | | - | | | | 882,650 | | | | - | | | | 299,717 | | | | - | | | | 1,182,367 | |
| Diesel | | | - | | | | 1,216,213 | | | | - | | | | - | | | | - | | | | 1,216,213 | |
| L.P.G | | | 2,968 | | | | 48,539 | | | | - | | | | - | | | | - | | | | 51,507 | |
| Natural gas | | | 555,813 | | | | - | | | | - | | | | 50,198 | | | | (42,599 | ) | | | 563,412 | |
| Plastic and rubber | | | - | | | | 754,648 | | | | - | | | | - | | | | - | | | | 754,648 | |
| Other products and services | | | 22,197 | | | | 531,184 | | | | 591 | | | | 97 | | | | (476 | ) | | | 553,593 | |
| Total foreign sales | | $ | 26,607,600 | | | $ | 7,717,048 | | | $ | 591 | | | $ | 15,452,650 | | | $ | (5,287,800 | ) | | $ | 44,490,089 | |
Sales of products by Segment December 31, 2011
| Local Sales | | Exploration
&
Production | | | Refining
Activities | | | Transportation | | | Market and
Supply | | | Eliminations | | | Total | |
| Medium distillates | | $ | 6,141 | | | $ | 9,045,328 | | | $ | - | | | $ | 690,877 | | | $ | - | | | $ | 9,742,346 | |
| Gasolines | | | - | | | | 5,185,831 | | | | - | | | | 21,042 | | | | - | | | | 5,206,873 | |
| Crude oil | | | 460,591 | | | | - | | | | - | | | | - | | | | (14,886 | ) | | | 445,705 | |
| Other products | | | 63,979 | | | | 1,086,384 | | | | - | | | | 9,117 | | | | - | | | | 1,159,480 | |
| Services | | | 52,218 | | | | 6,850 | | | | 2,547,156 | | | | 58,167 | | | | (877,747 | ) | | | 1,786,644 | |
| Natural gas | | | 1,093,079 | | | | - | | | | - | | | | 334,441 | | | | (8,413 | ) | | | 1,419,107 | |
| L.P.G. | | | 53,115 | | | | 671,041 | | | | - | | | | 2,955 | | | | - | | | | 727,111 | |
| Diesel and gasoline subsidies | | | - | | | | 2,251,322 | | | | - | | | | - | | | | - | | | | 2,251,322 | |
| Plastic and rubber | | | - | | | | 816,041 | | | | - | | | | - | | | | - | | | | 816,041 | |
| Total local sales | | $ | 1,729,123 | | | $ | 19,062,797 | | | $ | 2,547,156 | | | $ | 1,116,599 | | | $ | (901,046 | ) | | $ | 23,554,629 | |
| Foreign Sales | | Exploration &
Production | | | Refining
Activities | | | Transportation | | | Market and
Supply | | | Eliminations | | | Total | |
| | | | | | | | | | | | | | | | | | | |
| Crude oil | | $ | 24,039,881 | | | $ | - | | | $ | - | | | $ | 14,790,487 | | | $ | (5,412,176 | ) | | $ | 33,418,192 | |
| Fuel oil | | | - | | | | 4,447,657 | | | | - | | | | - | | | | - | | | | 4,447,657 | |
| Gasolines | | | - | | | | 1,484,245 | | | | - | | | | 178,976 | | | | - | | | | 1,663,221 | |
| Diesel | | | - | | | | 1,482,625 | | | | - | | | | - | | | | - | | | | 1,482,625 | |
| Natural gas | | | 381,000 | | | | - | | | | - | | | | 173,540 | | | | (46,474 | ) | | | 508,066 | |
| Plastic and rubber | | | - | | | | 804,835 | | | | - | | | | - | | | | - | | | | 804,835 | |
| Other products | | | 22,264 | | | | 184,199 | | | | 806 | | | | 413 | | | | (119,393 | ) | | | 88,289 | |
| Total foreign sales | | $ | 24,443,145 | | | $ | 8,403,561 | | | $ | 806 | | | $ | 15,143,416 | | | $ | (5,578,043 | ) | | $ | 42,412,885 | |
Sales of products by segment for the year ended December 31, 2010
| Local Sales | | Exploration &
Production | | | Refining
Activities | | | Transportation | | | Market and
Supply | | | Eliminations | | | Total | |
| Medium distillates | | $ | 5,058 | | | $ | 6,588,097 | | | $ | - | | | $ | 506,021 | | | $ | - | | | $ | 7,099,176 | |
| Gasolines | | | - | | | | 4,324,551 | | | | - | | | | - | | | | (22,269 | ) | | | 4,302,282 | |
| Crude oil | | | 245,231 | | | | - | | | | - | | | | - | | | | (6,611 | ) | | | 238,620 | |
| Other products | | | 189,833 | | | | 1,214,831 | | | | - | | | | 16,124 | | | | (68 | ) | | | 1,420,720 | |
| Services | | | 97,350 | | | | 32,546 | | | | 2,521,184 | | | | 54,492 | | | | (757,743 | ) | | | 1,947,829 | |
| Natural gas | | | 854,427 | | | | - | | | | - | | | | 378,939 | | | | (74,121 | ) | | | 1,159,245 | |
| L.P.G. | | | 31,810 | | | | 595,551 | | | | - | | | | - | | | | - | | | | 627,361 | |
| Diesel and gasoline subsidies | | | - | | | | 740,682 | | | | - | | | | - | | | | - | | | | 740,682 | |
| Plastic and rubber | | | - | | | | 669,944 | | | | - | | | | - | | | | - | | | | 669,944 | |
| Total local sales | | $ | 1,423,709 | | | $ | 14,166,202 | | | $ | 2,521,184 | | | $ | 955,576 | | | $ | (860,812 | ) | | $ | 18,205,859 | |
| Foreign Sales | | Exploration &
Production | | | Refining
Activities | | | Transportation | | | Market and
Supply | | | Eliminations | | | Total | |
| | | | | | | | | | | | | | | | | | | |
| Crude oil | | $ | 13,515,877 | | | $ | - | | | $ | - | | | $ | 8,108,425 | | | $ | (3,550,945 | ) | | $ | 18,073,357 | |
| Fuel oil | | | - | | | | 2,377,266 | | | | - | | | | - | | | | - | | | | 2,377,266 | |
| Gasoline | | | - | | | | 687,984 | | | | - | | | | 10,084 | | | | - | | | | 698,068 | |
| Diesel | | | - | | | | 1,638,044 | | | | - | | | | - | | | | - | | | | 1,638,044 | |
| Natural gas | | | 101,363 | | | | - | | | | - | | | | 44,700 | | | | - | | | | 146,063 | |
| Plastic and rubber | | | - | | | | 673,574 | | | | - | | | | - | | | | - | | | | 673,574 | |
| Other products | | | 11,958 | | | | 264,677 | | | | 717 | | | | 162 | | | | - | | | | 277,514 | |
| Total foreign sales | | $ | 13,629,198 | | | $ | 5,641,545 | | | $ | 717 | | | $ | 8,163,371 | | | $ | (3,550,945 | ) | | $ | 23,883,886 | |
NOTE: Certain amounts of the consolidated financial statements of December 2011 and December 2010 were reclassified for presentation purposes consistent with those of December 31, 2012.
The Company is majority owned by Colombian Government, so other state-owned companies and governmental entities are considered to be related parties. In addition to those transactions disclosed in Note 16 of statutory financial statements and those included in Item 7, numerous transactions with these entities exist. The most significant of them are disclosed below.
Fuel subsidy: Selling prices of regular motor gasoline and diesel are regulated by government. However a subsidy is granted to producers to compensate the difference between selling price and U.S. Gulf reference market price. The amount received by the Company in 2012, 2011 and 2010 was $809,773, $2,251,322 and $740,682, respectively. In addition, in 2010, the Company recognized interests amounting to $929 regarding subsidies recorded.
Purchases of hydrocarbons from ANH: The Company purchases the physical product that the ANH receives from all producers in Colombia at prices set forth by Law 756 of 2002 and Resolution 18-1709 of 2003, which references international prices. For more information on this transaction, please see Notes 1(s), 16 and 25.
The Company also paid in kind royalties over certain fields as set forth in Law 141 of 1994, the Administrative Agreement of Collaborative Collection of Liquid Hydrocarbon Royalties signed on September 16, 2010, with the ANH, and Decree 4923 of 2011. The quantities of oil and gas paid as in-kind royalties to the ANH for the years ended December 31, 2012, 2011, 2010 were 54,095,846 boe, 59,059,539 boe and 52,518,111 boe, respectively.
The following tables present consolidated accounts receivable, payable as well as revenues and expenses with related parties of the Company as of December 31, 2012 and 2011:
| | | 2012 | | | 2011 | |
| | | Assets | | | Liabilities | | | Assets | | | Liabilities | |
| Dirección de Impuestos y Aduanas Nacionales | | $ | 3,117,918 | | | $ | 1,059,565 | | | $ | 2,224,871 | | | $ | 1,763,035 | |
| Ministerio de Hacienda y Crédito Público | | | 3,183,910 | | | | 4,201,048 | | | | 1,367,554 | | | | 108 | |
| E.S.P. Empresa de Energia de Bogotá S.A. | | | 801,496 | | | | - | | | | 741,724 | | | | - | |
| Interconexion Electrica S.A. | | | 565,759 | | | | 79 | | | | 662,499 | | | | - | |
| Entidades Territoriales (Departments, Municipalities) | | | 57,170 | | | | 46,198 | | | | 46,034 | | | | 35,840 | |
| E.S.P. Generadora y Comerc.de Energia del Caribe | | | 17,049 | | | | 330 | | | | 19,749 | | | | 1,299 | |
| Isagen S.A. | | | 10,495 | | | | 5,979 | | | | 9,286 | | | | 7,694 | |
| Empresas Públicas de Medellín | | | 6,714 | | | | 5,630 | | | | 13,813 | | | | 2 | |
| E.S.P. Transportadora de Gas Internacional S.A. | | | 2,459 | | | | - | | | | 857 | | | | - | |
| Electrificadora del Meta S. A. -E.S.P. | | | 2,369 | | | | 1 | | | | 1,701 | | | | - | |
| Universidad Industrial de Santander | | | 34 | | | | 4,705 | | | | 27 | | | | - | |
| Banco Agrario de Colombia | | | 17 | | | | 184,785 | | | | 18 | | | | 177,136 | |
| Fiduciaria Agraria S. A. | | | - | | | | 7,761 | | | | - | | | | - | |
| CAR del Rio Grande de la Magdalena | | | - | | | | 6,330 | | | | - | | | | - | |
| Universidad Pedagogica y Tecnologica de Colombia | | | - | | | | 5,791 | | | | - | | | | - | |
| Other | | | 919 | | | | 19,455 | | | | 56,285 | | | | 5,277 | |
| | | $ | 7,766,309 | | | $ | 5,547,657 | | | $ | 5,144,418 | | | $ | 1,990,391 | |
Other transactions with related parties during 2012, 2011 and 2010 are:
| | | 2012 | | | 2011 | | | 2010 | |
| | | Income | | | Expenses | | | Income | | | Expenses | | | Income | | | Expenses | |
| Direccion de Impuestos y Aduanas Nacionales | | $ | - | | | $ | 16,563 | | | $ | - | | | $ | 706,206 | | | $ | 1 | | | $ | 3,523,700 | |
| U.A.E. Agencia Nacional de Hidrocarburos | | | 1,158 | | | | 213,974 | | | | 141 | | | | 15 | | | | 3,913 | | | | 2,524 | |
| Contraloria General de la Republica | | | - | | | | 64,519 | | | | - | | | | 55,082 | | | | - | | | | 52,876 | |
| Entidades Territoriales (Departments, Municipalities) | | | 1 | | | | 59,313 | | | | 233 | | | | 60,005 | | | | 1,328 | | | | 30,986 | |
| Banco Agrario de Colombia | | | - | | | | 20,696 | | | | - | | | | 15,392 | | | | - | | | | - | |
| Instituto Colombiano de Bienestar Familiar | | | - | | | | 6,892 | | | | - | | | | 6,761 | | | | - | | | | 4,472 | |
| Ministerio de Hacienda y Crédito Público | | | 616 | | | | 196,404 | | | | 2 | | | | 883 | | | | - | | | | 792 | |
| Empresas Públicas de Medellín | | | 19,220 | | | | - | | | | 96,373 | | | | 2,281 | | | | - | | | | - | |
| Isagen S.A. | | | 3,194 | | | | - | | | | 113,447 | | | | 230 | | | | 46,236 | | | | 17,930 | |
| E.S.P. Generadora y Comercializadora de Energia del Caribe S.A. | | | 11 | | | | - | | | | 165,828 | | | | - | | | | - | | | | - | |
| Military Forces – Republic of Colombia | | | - | | | | 225,019 | | | | - | | | | - | | | | - | | | | - | |
| Other | | | 156 | | | | 42,975 | | | | 35,676 | | | | 35,008 | | | | 326,687 | | | | 26,186 | |
| | | $ | 24,356 | | | $ | 846,355 | | | $ | 411,700 | | | $ | 881,863 | | | $ | 378,165 | | | $ | 3,659,466 | |
Accounting standards for fair value measurement (ASC 820) establish a framework for measuring fair value and stipulate disclosures about fair value measurements. The standards apply to recurring and nonrecurring financial and nonfinancial assets and liabilities that require or permit fair-value measurements. Among the required disclosures is the fair-value hierarchy of inputs the Company uses to value an asset or a liability. The three levels of the fair-value hierarchy are described as follows:
Level 1: Quoted prices (unadjusted) in active markets for identical assets and liabilities. For the Company, Level 1 inputs include marketable securities that are actively traded.
Level 2: Inputs other than Level 1 that is observable, either directly or indirectly. For the Company, Level 2 inputs include quoted prices for similar assets, prices obtained through third-party broker quotes, and prices that can be corroborated with other observable inputs for substantially the complete term of a contract.
Level 3: Unobservable inputs - The Company does not use Level 3 inputs for any of its recurring fair-value measurements. Level 3 inputs may be required for the determination of fair value associated with certain nonrecurring measurements of nonfinancial assets and liabilities. The Company uses Level 3 inputs to determine the fair value of certain nonrecurring nonfinancial assets.
The fair value hierarchy for recurring assets measured at fair value at December 31, 2012, and December 31, 2011, is as follows:
| | | | | | Fair Value at Reporting Date Using | | | | | | Fair Value at Reporting Date Using | |
| | | | | | Quoted Price
in Active
Markets for
Identical
Assets | | | Significant
Other
Observable
Inputs | | | Significant
Unobservable
Inputs | | | | | | Quoted Price
in Active
Markets for
Identical
Assets | | | Significant
Other
Observable
Inputs | | | Significant
Unobservable
Inputs | |
| Description | | 2012 | | | (Level 1) | | | (Level 2) | | | (Level 3) | | | 2011 | | | (Level 1) | | | (Level 2) | | | (Level 3) | |
| ASSETS | | | | | | | | | | | | | | | | | | | | | | | | | | | | | | | | |
| Available for sale debt securities | | | | | | | | | | | | | | | | | | | | | | | | | | | | | | | | |
| Securities issued by mixed – economy governmental entities | | $ | 1,367,179 | | | $ | 1,367,179 | | | $ | - | | | $ | - | | | $ | 1,401,505 | | | $ | 1,401,505 | | | $ | - | | | $ | - | |
| Securities issued or secured by Colombian government | | | 3,001,374 | | | | 3,000,260 | | | | 1,114 | | | | - | | | | 1,303,145 | | | | 1,303,145 | | | | - | | | | - | |
| Securities issued or secured by government sponsored enterprise (GSEs) | | | 1,637,914 | | | | 1,637,914 | | | | - | | | | - | | | | 2,148,727 | | | | 2,148,727 | | | | - | | | | - | |
| Securities issued or secured by financial entities | | | 216,046 | | | | 59,759 | | | | 156,287 | | | | - | | | | 552,857 | | | | 361,653 | | | | 191,204 | | | | - | |
| Other debt securities | | | 660,634 | | | | 660,634 | | | | - | | | | - | | | | 279,528 | | | | 279,528 | | | | - | | | | - | |
| Securities issued or secured by USA government | | | 44,265 | | | | 44,265 | | | | - | | | | - | | | | 700,237 | | | | 700,237 | | | | - | | | | - | |
| Total available for sale debt securities | | | 6,927,412 | | | | 6,770,011 | | | | 157,401 | | | | - | | | | 6,385,999 | | | | 6,194,795 | | | | 191,204 | | | | - | |
| Derivatives | | | | | | | | | | | | | | | - | | | | | | | | | | | | | | | | | |
| Option | | | 4,543 | | | | - | | | | 4,543 | | | | - | | | | (2,370 | ) | | | - | | | | (2,370 | ) | | | - | |
| Swap | | | - | | | | - | | | | - | | | | - | | | | - | | | | - | | | | - | | | | - | |
| FX Forward | | | - | | | | - | | | | - | | | | - | | | | 14 | | | | - | | | | 14 | | | | - | |
| Total derivatives | | | 4,543 | | | | | | | | 4,543 | | | | - | | | | (2,356 | ) | | | - | | | | (2,356 | ) | | | - | |
| Total Recurring Assets at fair value | | $ | 6,931,955 | | | $ | 6,770,011 | | | $ | 161,944 | | | $ | - | | | $ | 6,383,643 | | | $ | 6,194,795 | | | $ | 188,848 | | | $ | - | |
Marketable Securities: The Company calculates fair value for its marketable securities based on quoted market prices for identical assets and liabilities. The fair values reflect the cash that would have been received if the instruments were sold at December 31, 2012.
Derivatives: The Company records its derivative instruments on the consolidated balance sheet at fair value, with the offsetting amount to the Consolidated Statement of Income. For derivatives with identical or similar provisions as contracts that are publicly traded on a regular basis, the Company uses the market values of the publicly traded instruments as an input for fair-value calculations.
The Company’s derivative instruments principally include foreign exchange and refined-product (asphalt) swaps, options and forward contracts, principally with financial institutions and other oil and gas companies, the fair values for which are obtained from third-party broker quotes, industry pricing services and exchanges.
The Company obtains multiple sources of pricing information for the Level 2 instruments. Since this pricing information is generated from observable market data, it has historically been very consistent. The Company does not materially adjust this information.
The fair value hierarchy for non-recurring assets measured at fair value at December 31, 2012 is as follows:
| | | | | | Fair Value Measurements Using | | | | |
| Description | | 2012 | | | Quoted Price
in Active
Markets for
Identical
Assets Level 1 | | | Significant
Other
Observable
Inputs
Level 2 | | | Significant
Unobservable
Inputs Level 3 | | | Total Gains
(Losses) | | | 2011 | |
| Goodwill | | $ | 1,264,470 | | | $ | - | | | $ | - | | | $ | 1,264,470 | | | $ | - | | | $ | 1,388,568 | |
| Production fixed assets with impairment | | | 189,294 | | | | - | | | | - | | | | 189,294 | | | | (80,242 | ) | | | 144,106 | |
| Transportation fixed assets with impairment (*) | | | - | | | | - | | | | - | | | | - | | | | (195,903 | ) | | | - | |
| Other fixed assets | | | 34,311,563 | | | | - | | | | - | | | | 34,311,563 | | | | - | | | | 15,389,893 | |
| Total Fixed Assets | | $ | 34,500,857 | | | $ | - | | | $ | - | | | $ | 34,500,857 | | | $ | (276,145 | ) | | $ | 15,533,999 | |
| Total Non-Recurring Assets | | $ | 35,765,327 | | | $ | - | | | $ | - | | | $ | 35,765,327 | | | $ | (276,145 | ) | | $ | 16,922,567 | |
* Transportation fixed assets were written down to their fair value of $0 in 2011 and 2012, resulting in an impairment charge of ($41,043), under U.S. GAAP, in 2011 and ($195,903) in 2012.
Impairment of “Goodwill”- During 2011 in accordance with the accounting standard for Intangibles – Goodwill Impairment Test (ASC 350 - 20), the Goodwill in Propilco with a carrying amount of $694,388 was written down to a fair value of $647,697, resulting in a before-tax loss of $46,691. The fair value was determined from internal cash-flow models, using discount rates consistent with those used by the Company to evaluate cash flows of other assets of a similar nature. In 2012 there is no impairment according to our analysis.
Impairment of “Properties, plant and equipment” and “Natural and environmental Resources” - During 2012 and in accordance with the accounting standard for the impairment or disposal of long-lived assets (ASC 360), long-lived assets “held and used” with a carrying amount of $34,777,002 were written down to a fair value of $34,500,857, resulting in a before-tax loss of $276,145. The fair values were determined from internal cash-flow models, using discount rates consistent with those used by the Company to evaluate cash flows of other assets of a similar nature. The respective long-lived assets were reviewed for impairment on a field-by-field basis.
Assets and liabilities not required to be measured at fair value
The Company holds cash and cash equivalents. The instruments held are primarily time deposits and money market funds. The fair values reflect the cash that would have been received or paid if the instruments were settled at year-end. Cash equivalents had carrying/fair values of $7,972,335 and $7,073,550 at December 31, 2012 and 2011, respectively. Fair values of other financial instruments at the end of 2012 and 2011 were not material.
The Company’s financial instruments that are exposed to concentrations of credit risk consist primarily of cash and accounts receivables. The carrying value of cash and accounts receivable reflects management’s assessment of credit risk. As of December 31, 2011 and 2012, cash and cash equivalents includes balances in savings and checking accounts, as well as term deposits and certificates of deposit, placed primarily with governments and financial institutions with strong investment grade ratings.
Fair value of financial instruments: The estimated fair value amounts presented below have been determined by the Company using available market information or other appropriate valuation methodologies that require considerable judgment in developing and interpreting the estimates of fair value. Accordingly, the estimates presented herein are not necessarily indicative of the amounts that the Company could realize in a current market exchange. The use of different market assumptions and/or estimation methodologies may have a material effect on the estimated fair value amounts.
The carrying amounts of the Company’s accounts receivable, accounts payable and current notes payable approximate fair value because they have relatively short-term maturities and bear interest at rates tied to market indicators, as appropriate. The Company’s long-term debt consists of debt instruments that bear interest at fixed or variable rates tied to market indicators.
The carrying amount and estimated fair values of the Company’s financial instruments that are not recognized in the balance sheets at fair value as of December 31 are as follows:
| | | 2012 | | | | | | 2011 | | | | |
| Description | | Carrying
Amount | | | Estimated Fair
Value | | | Fair
Value
Hierarchy | | | Carrying
Amount | | | Estimated
Fair Value | | | Fair
Value
Hierarchy | |
| Long-term notes payable | | $ | 9,600,559 | | | $ | 9,521,801 | | | | Level 2 | | | $ | 4,724,355 | | | $ | 4,726,610 | | | | Level 2 | |
| Long-term debt (including current portion): | | $ | 4,154,087 | | | $ | 4,987,654 | | | | Level 1 | | | $ | 4,009,178 | | | $ | 4,624,413 | | | | Level 1 | |
| Total | | $ | 13,754,646 | | | $ | 14,509,455 | | | | | | | $ | 8,733,533 | | | $ | 9,351,023 | | | | | |
| xxix. | SUPPLEMENTAL INFORMATION ON OIL AND GAS PRODUCING ACTIVITIES (UNAUDITED) |
In accordance with the requirements of the United States Securities and Exchange Commission (SEC), Accounting Standards Codification 932 and the ASU- 2010-03 “Oil and Gas reserve Estimation and Disclosures” Rule, this section provides supplemental information on oil and gas exploration and producing activities of the Company. The information included in items (i) through (iii) provides historical cost information pertaining to costs incurred in exploration, property acquisitions and development, capitalized costs and results of operations. The information included in items (iv) and (v) presents information on Ecopetrol’s estimated net proved reserve quantities, standardized measure of estimated discounted future net cash flows related to proved reserves, and changes in estimated discounted future net cash flows.
The following information corresponds to Ecopetrol’s oil and gas producing activities at December 31 2012, 2011 and 2010 in direct and joint operations.
Under the SEC final rule, optional disclosure of possible and probable reserves is allowed. But, the Company opted not to do so. Ecopetrol estimated its reserves without considering non-traditional resources.
Table i – Capitalized costs relating to oil and gas producing activities
| | | Year ended December 31 | |
| | | 2012 | | | 2011 | | | 2010 | |
| Natural and environmental properties | | $ | 25,836,787 | | | $ | 21,795,716 | | | $ | 16,977,248 | |
| Wells, equipment and facilities – property, plant and equipment | | | 10,045,169 | | | | 8,460,137 | | | | 6,564,590 | |
| Construction in progress | | | 5,841,384 | | | | 4,912,199 | | | | 2,490,365 | |
| Accumulated depreciation, depletion and amortization | | | (18,802,677 | ) | | | (15,850,932 | ) | | | (11,864,137 | ) |
| Net capitalized costs | | $ | 22,920,663 | | | $ | 19,317,120 | | | $ | 14,168,066 | |
It includes information of the exploration and production segment subsidiaries.
In accordance with ASC 410-20, these natural and environmental costs include the asset retirement obligations amounting $80,244, $79,930 and $30,748, during 2012, 2011 and 2010, respectively
Table ii – Costs incurred in oil and gas exploration and development activities
Costs incurred are summarized below and include both amounts expensed and capitalized in the corresponding period.
| | | Year ended December 31 | |
| | | 2012 | | | 2011 | | | 2010 | |
| Acquisition of proved properties (1) | | $ | - | | | $ | 1,483,891 | | | | - | |
| Acquisition of unproved properties (2) | | | 67,016 | | | | 336,824 | | | | - | |
| Exploration costs | | | 1,676,821 | | | | 1,562,147 | | | | 1,598,276 | |
| Development costs | | | 9,204,629 | | | | 8,875,850 | | | | 5,835,141 | |
| Total costs incurred | | $ | 10,948,466 | | | $ | 12,258,712 | | | $ | 7,433,417 | |
| (1) | Includes wells, equipment and facilities associated with Equion. |
| (2) | Represents the scheduled buy-in costs paid to Murphy Oil (Operator) to participate in the Dalmation project in 2012, and wells, equipment and facilities associated with Caño Sur in 2011. |
Table iii Results of operations for oil and gas producing activities
| | | 2012 | | | 2011 | | | 2010 | |
| Net revenues | | | | | | | | | | | | |
| Sales | | $ | 29,515,227 | | | $ | 26,222,068 | | | $ | 15,245,110 | |
| Transfers | | | 12,980,714 | | | | 13,558,328 | | | | 9,032,898 | |
| Total | | $ | 42,495,941 | | | $ | 39,780,396 | | | $ | 24,278,008 | |
| | | | | | | | | | | | | |
| Production cost (1) | | | 5,361,603 | | | | 4,879,884 | | | | 3,577,780 | |
| Depreciation, depletion and amortization (2) | | | 3,365,845 | | | | 2,622,867 | | | | 1,856,118 | |
| Other production costs (3) | | | 6,502,268 | | | | 5,486,537 | | | | 3,554,315 | |
| Exploration expenses (4) | | | 1,392,834 | | | | 1,149,937 | | | | 1,696,383 | |
| Other expenses (5) | | | 1,369,032 | | | | 1,078,564 | | | | 593,257 | |
| Total | | | 17,991,582 | | | | 15,217,789 | | | | 11,277,853 | |
| Income before income tax | | | 24,504,359 | | | | 24,562,607 | | | | 13,000,155 | |
| Income tax expenses | | | (8,064,384 | ) | | | (8,105,660 | ) | | | (4,290,051 | ) |
| Results of operations for producing activities | | $ | 16,439,975 | | | $ | 16,456,947 | | | $ | 8,710,104 | |
Note: Effects of naphtha addition are included into results of operations in the table above. During 2012, 2011 and 2010 the additional total barrels (million boe) were 19.4, 15.4 and 12.2.
| (1) | Production costs are lifting costs incurred to operate and maintain productive wells and related equipment and facilities, including costs such as operating labor, materials, supplies, and fuel consumed in operations and the costs of operating natural gas liquids plants. In addition includes accretion expense related to the asset retirement obligations that were recognized during 2012, 2011 and 2010 amounting approximately $150,754, $ 133,796 and $ 151,516 respectively. The Company’s results of operations from oil and gas producing activities for the years ending December 31, 2012, 2011 and 2010 are shown above. |
| (2) | In accordance with ASC 410-20, the expense related to asset retirement obligations that were recognized during 2012, 2011 and 2010 in depreciation, depletion and amortization amounted approximately to $131,342, $28,676 and $180,484 respectively. |
| (3) | Corresponds to transportation costs and naphtha that are not part of the Company´s lifting cost. |
| (4) | Exploration expenses include the costs of geological and geophysical activities as well as the non-productive exploratory wells. |
| (5) | Corresponds to administration and marketing expenses. |
During 2012, 2011 and 2010, respectively, the Company transferred approximately 31%, 34% and 37% of its crude oil and gas production; (percentages based on the value sales in Colombian pesos) to intercompany business units. Base on volume, those transfers were 39%, 42% and 47% respectively (including Reficar). The intercompany transfers were recorded at values equal to the Company’s market prices.
Table iv – Reserve information
The reserve information presented in this section is based on the definitions and rules used for U.S. GAAP purposes. The estimates for proved oil and gas reserves used in the preparation of the consolidated financial statements were prepared by Ecopetrol’s engineers, audited in a 99% by the “external engineers”.
Reserves are first estimated internally. This process is supervised and coordinated by the corporate manager of reservoirs, a geologist who holds a master’s degree in geology and has more than 20 years of experience in projects associated with reservoir characterization and development, estimation, and reporting of reserves. The employees involved in the reserves process meet the Society of Petroleum Engineers, or SPE, qualifications for reserves estimators. Internally estimated reserves are submitted to an external audit process, which was conducted by the External Engineers (Ryder Scott, DeGolyer and MacNaughton and Gaffney, Cline & Associates). These firms have audited 99% of our total net proved reserves for 2012, 2011, and 2010. According to our corporate policy, we report the reserves values obtained from the External Engineers.
The reserves process ends when the Reserves Directorate consolidates the results and present them to the Reserves Committee, whose members are the Chief Financial Officer, the Exploration and Production Executive Vice-President and the Vice-President of Strategy. Finally, results are presented to the Audit Committee of the Board of Directors and approved by the Board of Directors.
Information concerning the technical definitions used for the estimated proved reserves is included in this annual report. The information provided in this annual report about our 2012 net proved reserves is based on the 2012 audited reserve reports for 99% of our total reserves prepared by experts under the SEC definitions and rules. The remaining 1% corresponds to calculations made by us internally using SEC definitions and rules set forth in Rule 4-10(a) of Regulation S-X and the disclosure guidelines contained in the SEC’s “Modernization of Oil and Gas Reporting” final rule dated December 31, 2008 and effective as of January 1, 2010.
Our 2012 crude oil and natural gas net proved reserves include reserves from production assets located in the United States, Perú and Colombia regarding the Hocol and Equion’s assets.
The Company’s proved reserves as of December 31, 2012, 2011 and 2010 are based on the SEC average price methodology for U.S. GAAP purposes, which mirrors the average price methodology used by the Company in Colombia during this period.
Future development, abandonment and production costs were computed by estimating the expenditures to be incurred in developing, producing, and abandoning proved oil and gas reserves at the end of the year, based on year-end costs. Future income taxes were computed by applying statutory tax rates to the estimated net pre-tax cash flows after consideration of tax basis and tax credits and carry forwards. Discounted future net cash flows are calculated using 10% mid period discount factors. This discounting requires a year-by-year estimate of when the future expenditures will be incurred and when the reserves will be produced.
The arbitrary valuation methodology prescribed under ASU 2010-03 and ASU-2010-14 requires assumptions as to the timing and amount of future development and production costs. The calculations are made as of December 31 each year and should not be relied upon as an indication of the Company’s future cash flows or the value of its oil and gas reserves.
Ecopetrol used deterministic methods that are commonly used internationally to estimate reserves. These methods have some uncertainty in degradation, and thus, the estimates should not be interpreted as being exact amounts. However, the technology used to estimate reserves is considered reliable.
Estimates of reserves were prepared by geological and engineering methods commonly used in the oil industry. The method or combination of methods used in the analysis of each reserve was adopted from experience with similar reserves, stage of development, quality and completeness of basic data and production history.
The majority of the producing proved reserves were estimated by applying appropriate decline curves or other performance relationships. In analyzing decline curves, reserves were estimated by calculating economic limits that are based on current economic conditions. In certain cases, where the methods previously employed could not be used, reserves were estimated by analogy with similar reserves where more complete data was available.
Most of the Company’s activities and reserves are located in Colombia. The Colombian Nation is the owner of all mineral interests located in Colombia. The Company and, by extension of joint association contracts, its partners, are given the right to explore, develop, produce and sell those reserves, but do not own them. The reserve quantities and their standardized measure, presented in the following tables, represent those reserves and their estimated value that the Company has the right to extract and sell.
The information provided does not represent management’s estimate of the Company’s expected future cash flows or value of proved oil and gas reserves. Estimates of proved reserve quantities involve uncertainty and change over time as new information becomes available.
The table below sets forth the Company’s total proved oil and gas reserves together with their changes therein as of and for the years ended December 31, 2012, 2011 and 2010. The estimates (oil in million barrels, gas in billion cf, gas converted to million barrels at 5.7 billion cf per million barrels) using the SEC rules in effect for each respective year.
The following is the reserve quantity information:
| | | 2012 | | | 2011 | | | 2010 | |
| | | Oil | | | Gas | | | Total | | | Oil | | | Gas | | | Total | | | Oil | | | Gas | | | Total | |
| | | million
barrels | | | billion
cf | | | million
boe | | | million
barrels | | | billion
cf | | | million
boe | | | million
barrels | | | billion
cf | | | million
boe | |
| Proved Reserves: | | | | | | | | | | | | | | | | | | | | | | | | | | | | | | | | | | | | |
| Beginning of year | | | 1,371.0 | | | | 2,768.4 | | | | 1,856.7 | | | | 1,236.4 | | | | 2,722.6 | | | | 1,714.0 | | | | 1,123.3 | | | | 2,329.4 | | | | 1,538.2 | |
| Revisions of previous estimates | | | 42.7 | | | | 8.8 | | | | 44.2 | | | | 107.6 | | | | (260.8 | ) | | | 61.8 | | | | 99.1 | | | | 558.7 | | | | 190.9 | |
| Improved recovery | | | 65.3 | | | | - | | | | 65.3 | | | | 14.8 | | | | 3.6 | | | | 15.4 | | | | 47.4 | | | | - | | | | 47.4 | |
| Purchases of minerals in place | | | - | | | | - | | | | - | | | | 18.3 | | | | 93.3 | | | | 34.6 | | | | - | | | | - | | | | - | |
| Extensions and discoveries | | | 90.4 | | | | 298.6 | | | | 142.8 | | | | 184.5 | | | | 386.2 | | | | 252.3 | | | | 126.3 | | | | 0.3 | | | | 126.5 | |
| Production | | | (199.2 | ) | | | (189.3 | ) | | | (232.4 | ) | | | (190.5 | ) | | | (176.5 | ) | | | (221.5 | ) | | | (159.8 | ) | | | (165.9 | ) | | | (188.9 | ) |
| End of year | | | 1,370.3 | | | | 2,886.4 | | | | 1,876.7 | | | | 1,371.0 | | | | 2,768.4 | | | | 1,856.7 | | | | 1,236.4 | | | | 2,722.6 | | | | 1,714.0 | |
| | | | | | | | | | | | | | | | | | | | | | | | | | | | | | | | | | | | | |
| Proved developed reserves: | | | | | | | | | | | | | | | | | | | | | | | | | | | | | | | | | | | | |
| Beginning of year | | | 855.8 | | | | 2,229.5 | | | | 1,246.9 | | | | 800.7 | | | | 2,261.7 | | | | 1,197.5 | | | | 630.5 | | | | 1,732.6 | | | | 939.0 | |
| End of year | | | 933.3 | | | | 2,535.9 | | | | 1,378.2 | | | | 855.8 | | | | 2,229.5 | | | | 1,246.9 | | | | 800.7 | | | | 2,261.7 | | | | 1,197.5 | |
| Proved undeveloped reserves: | | | | | | | | | | | | | | | | | | | | | | | | | | | | | | | | | | | | |
| Beginning of year | | | 515.2 | | | | 538.9 | | | | 609.8 | | | | 435.6 | | | | 460.9 | | | | 516.5 | | | | 492.8 | | | | 596.9 | | | | 599.2 | |
| End of year | | | 437.0 | | | | 350.6 | | | | 498.5 | | | | 515.2 | | | | 538.9 | | | | 609.8 | | | | 435.6 | | | | 460.9 | | | | 516.5 | |
The Company’s revisions, on a consolidated basis, during 2012 amounted to 44.2 million boe, corresponding primarily to the following:
| · | Pauto Field: Sales natural gas liquids , or NGL volumes associated with our gas processing plant , better production performance, and new development projects focused in gas conversion activities and drilling, representing a 19.4 million boe increase. |
| · | Caño Limon Field: Better production performance representing a 13.9 million boe increase |
The revisions described above represented 75% of the additions to reserves revisions in 2012, while the revisions with respect to the remaining 10.9 million boe resulted from varying increases and decreases from a variety of fields like Apiay, Quifa and others.
The Company’s improved recovery during 2012 amounted to 65.3 million boe, which corresponded mainly to new proved areas under waterflooding in the La Cira-Infantas, Casabe and Tibu fields.
The Company’s extensions and discoveries during 2012 amounted to 142.8 million boe, which corresponded to 16.2 million boe of newly discovered fields and 126.6 million boe of extensions of proved acreage. The newly discovered fields corresponded mainly to Ecopetrol S.A.’s Cajua, Chipiron fields Hocol’s Mamey-Bonga fields and Ecopetrol America’s Dalmatian field.
In terms of extensions of proved acreage (126.6 million boe), 70% was associated with activities in the followings fields:
25.5 million boe related to the Castilla Field where the company´s plan is to perform additional drilling activities in order to cover new proved areas, 47.8 million boe was associated with new sales agreements enabling increases the future gas sales in the Cupiagua field and 15.4 million boe related to new proved areas in the Quifa and Chichimene fields. The remaining 30% is distributed in smaller changes in several Company fields.
The remaining 30% is distributed in smaller changes in several Company fields.
Table v – Standardized measure of discounted future net cash flows relating to proved oil and gas quantities and changes therein
The standardized measure of discounted future net cash flows, related to the above proved crude oil and natural gas reserves, is calculated in accordance with the requirements of ASU 2010-03. Estimated future cash inflows from production under U.S. GAAP are computed by applying unweighted arithmetic average of the first-day-of-the-month for oil and gas price to year-end quantities of estimated net proved reserves.
| | | 2012 | | | 2011 | | | 2010 | |
| Future cash inflows | | $ | 251,891,162 | | | $ | 251,939,319 | | | $ | 186,295,426 | |
| Future production and development costs | | | (81,405,039 | ) | | | (87,262,683 | ) | | | (57,267,518 | ) |
| Future income tax expenses | | | (55,445,509 | ) | | | (56,743,761 | ) | | | (36,783,230 | ) |
| Future net cash flow | | | 115,040,614 | | | | 107,932,875 | | | | 92,244,678 | |
| 10% annual discount for estimated timing of cash flows | | | (42,457,937 | ) | | | (38,932,148 | ) | | | (36,690,043 | ) |
| Standardized measure of discounted future net cash flows | | $ | 72,582,677 | | | $ | 69,000,727 | | | $ | 55,554,635 | |
The following are the principal sources of change in the standardized measure of discounted net cash flows:
| | | 2012 | | | 2011 | | | 2010 | |
| | | | | | | | | | |
| Net change in sales and transfer prices and in production (lifting) cost related to future production | | $ | 8,921,835 | | | $ | 21,725,178 | | | $ | 23,136,538 | |
| Changes in estimated future development costs | | | 2,092,588 | | | | (3,602,471 | ) | | | (2,936,160 | ) |
| Sales and transfer of oil and gas produced during the period | | | (37,134,338 | ) | | | (34, 900,512 ) | | | | (24,278,008 | ) |
| Net change due to extension discoveries | | | 2,370,545 | | | | 9,500,676 | | | | 4,102,951 | |
| Net change due to purchase and sales of minerals in place | | | - | | | | 1,239,446 | | | | - | |
| Net change due to revisions in quantity estimates | | | 3,017,004 | | | | 3,912,856 | | | | 10,577,037 | |
| Previously estimated development costs incurred during the period | | | 5,928,223 | | | | 8,265,106 | | | | 4,352,080 | |
| Accretion of discount | | | 10,527,661 | | | | 7,770,745 | | | | 3,545,989 | |
| Timing and other | | | 6,564,830 | | | | 13,658,144 | | | | 6,674,884 | |
| Net change in income taxes | | | 1,293,602 | | | | (14,123,076 | ) | | | (5,080,563 | ) |
| Aggregate change in the standardized measure of discounted future net cash flows for the year | | $ | 3,581,950 | | | $ | 13,446,092 | | | $ | 20,094,748 | |