Table of Contents
UNITED STATES
SECURITIES AND EXCHANGE COMMISSION
Washington, D.C. 20549
FORM N-CSR
CERTIFIED SHAREHOLDER REPORT OF REGISTERED
MANAGEMENT INVESTMENT COMPANIES
Investment Company Act file number: 811-22235
AQR Funds
(Exact name of registrant as specified in charter)
Two Greenwich Plaza, 4th Floor
Greenwich, CT 06830
(Address of principal executive offices) (Zip code)
Bradley D. Asness, Esq.
Principal and Chief Legal Officer
AQR Capital Management, LLC
Two Greenwich Plaza
4th Floor
Greenwich, CT 06830
(Name and Address of Agent for Service)
Registrant’s telephone number, including area code: 203-742-3600
Date of fiscal year end: December 31
Date of reporting period: January 1, 2015 to December 31, 2015
Table of Contents
Item 1. Reports to Shareholders.
The following is a copy of the report transmitted to shareholders pursuant to Rule 30e-1 under the Investment Company Act of 1940 (17 CFR 270.30e-1.)
Table of Contents
Annual Report
December 31, 2015
AQR Diversified Arbitrage Fund
AQR Equity Market Neutral Fund
AQR Global Macro Fund
AQR Long-Short Equity Fund
AQR Managed Futures Strategy Fund
AQR Managed Futures Strategy HV Fund
AQR Multi-Strategy Alternative Fund
AQR Risk-Balanced Commodities Strategy Fund
AQR Risk Parity Fund
AQR Risk Parity II HV Fund
AQR Risk Parity II MV Fund
AQR Style Premia Alternative Fund
AQR Style Premia Alternative LV Fund
Table of Contents
| Shareholder Letters (unaudited) | ||||
| 2 | ||||
| 6 | ||||
| 8 | ||||
| 11 | ||||
| 13 | ||||
| 16 | ||||
| 19 | ||||
| 21 | ||||
| 23 | ||||
| 26 | ||||
| 29 | ||||
| 32 | ||||
| 34 | ||||
| Schedule of Investments | ||||
| 40 | ||||
| 62 | ||||
| 88 | ||||
| 105 | ||||
| 134 | ||||
| 146 | ||||
| 157 | ||||
| 222 | ||||
| 228 | ||||
| 241 | ||||
| 248 | ||||
| 256 | ||||
| 286 | ||||
| Financial Statements and Notes | 315 | |||
| Report of Independent Registered Public Accounting Firm | 402 | |||
| Other Federal Tax Information (unaudited) | 403 | |||
| Fund Expense Examples (unaudited) | 404 | |||
| Trustees and Officers (unaudited) | 408 | |||
| Board Approval of Investment Advisory Agreements (unaudited) | 410 | |||
Table of Contents
Shareholder Letter (Unaudited)
| AQR DIVERSIFIED ARBITRAGE FUND |

Ronen Israel
Principal

Mark Mitchell Ph.D.
Founding Principal, CNH Partners

Lars Nielsen
Principal

Todd Pulvino, Ph.D.
Founding Principal, CNH Partners
Dear Shareholder:
The AQR Diversified Arbitrage Fund (the “Fund”) invests in merger arbitrage, convertible arbitrage, and event-driven strategies. The investment process seeks to capture liquidity premia around corporate events and is implemented using corporate securities. Over the 2015 calendar year, the Fund returned -4.87%, for Class I. As described below, this loss was driven by negative contributions from investments in the Fund’s event-driven segment a result of the continued decline in commodity prices and increases in regulatory scrutiny around corporate restructurings. The negative contribution from event-driven investments was partially offset by a positive contribution from merger arbitrage. The Fund’s correlation with overall equity markets continues to be low. Based on monthly return data since its inception on January 15, 2009 through December 31, 2015, the Fund’s equity market beta (relative to the S&P 500®) is 0.06, its annualized volatility is 2.7% and its sharpe ratio is 0.5.
Fund Description
Unlike textbook arbitrage where identical securities can simultaneously be bought and sold for different prices, corporate arbitrage investments involve the purchase and sale of similar but not identical securities at advantageous prices. For example, in merger arbitrage, the target stock can often be purchased for a price that is less than the merger consideration offered by the acquiring company. Arbitrageurs attempt to capture this difference by buying the target stock, and in the case of a stock merger, short-selling the acquirer’s stock. Similarly, in the case of convertible arbitrage, investors typically purchase a convertible bond at a price below fundamental value, and through short selling of the issuer’s common stock, effectively hedging the risk of the call option that is embedded in the convertible bond. Profits are generated when the market price of the bond increases relative to fundamental value.
Like merger arbitrage and convertible arbitrage, other strategies employed by the Fund involve the purchase of securities around corporate events at what we believe are discounts to their fundamental values. For every investment, an attempt is made to hedge the embedded systematic risk. Where there is no direct hedge for a purchased security, highly correlated indirect hedges are employed. For example, systematic equity market risk is hedged by shorting S&P futures. Similarly, credit market risk and interest rate risk are hedged using derivative contracts (credit default swap indices and Treasury futures). Although indirect hedges effectively mitigate systematic risk (e.g. beta), they expose the Fund to basis risk – the basket of securities purchased around corporate events do not necessarily move in lockstep with the hedging instruments.
Performance Attribution
The Fund’s 2015 performance was caused by a negative contribution from event-driven investments (-5.8%) partially offset by a positive contribution from merger arbitrage (+1.0%). Convertible arbitrage did not contribute, positively or negatively, to the Fund’s 2015 return. There were two underlying causes for the negative contribution from event-driven investments. The first involves commodity prices. For event-driven trades that focus on corporate bankruptcies and restructurings in commodity-focused industries, the significant and continuous decline in prices of the underlying commodities caused deterioration in recovery values. As a result, even secured corporate bonds that would normally receive a full recovery in a corporate restructuring suffered significant losses. This was especially true in the energy industry, but it was also true in other industries such as chemicals and paper. Large losses are not uncommon in event-driven investments. However, they are typically idiosyncratic in nature and are offset by idiosyncratic gains. In the global environment that has existed since the fourth quarter of 2014, the distribution of returns has been skewed to the downside with few positive outcomes.
The second underlying cause of the negative contribution from event-driven investments is related to regulatory developments. In 2014, the Obama administration announced that it was considering new regulations to dissuade companies from undertaking tax-inversion mergers whereby merging companies reduce their overall tax liabilities by incorporating in foreign countries with lower corporate tax rates. Beginning in late 2014, a number of mergers were adversely affected by the new
| AQR Funds | Annual Report | December 2015 | ||||||||||||||
2
Table of Contents
Shareholder Letter (Unaudited)
| AQR DIVERSIFIED ARBITRAGE FUND |
regulations. Along a similar vein, in 2015 the government signalled a possible change in the tax treatment of corporate spinoffs. Historically, corporations were able to separate lines of business without incurring taxes at the corporate level. However, in response to Yahoo!’s announced spinoff of its holdings in Alibaba Group, the government indicated that it may take a more aggressive view of the taxability of these types of corporate restructurings. This aggressive response by the government had a direct and significant effect on the Fund. One of the Fund’s largest positions is comprised of a long position in Yahoo! and short positions in Alibaba and Yahoo! Japan. However, when the government refused to grant Yahoo! a favorable tax ruling, Yahoo! cancelled the Alibaba spinoff causing the effective market price of the core internet assets to decline generating losses for the Fund. Ultimately we think that Yahoo! will successfully separate its core internet business from its holdings in Alibaba and Yahoo! Japan in a tax-efficient way, and when it does, the Fund’s position should appreciate.
Over 2015, merger arbitrage contributed +1.0% to the Fund’s return. Throughout the year, merger deal flow remained strong, nearly matching pre-financial-crisis levels, and merger spreads were wide. One might think that with strong deal flow and wide spreads, merger profits would be unusually strong. However, wide deal spreads often reflect heightened risk that announced mergers will fail to be consummated. There were two primary sources of deal failure risk in 2015, both related to government regulations. As suggested above, one involves tax inversion mergers where the government continues to modify rules in an attempt to make it less economically attractive for U.S. corporations to change their domiciles through mergers. The second source of risk is related to a more aggressive stance taken by U.S. anti-trust regulators. In a number of cases, the government filed suit to prevent parties from consummating mergers. Merging parties responded by either cancelling their mergers or opting to fight anti-trust authorities in court. As a result of the increase in regulatory risk, the median merger spread widened throughout 2015. At the beginning of the year, the median annualized merger spread was 5.5%. By the end of 2015, the median annualized spread had increased to 8.5%. Although a portion of the spread increase may have been caused by the combination of robust merger deal flow and insufficient arbitrage capital, a majority of the increase was likely caused by investors’ reactions to more aggressive merger regulation.
Unlike merger arbitrage, new deal flow in the convertible market was slow in 2015. Approximately $39 billion was issued in the domestic convertible market, a decrease from approximately $49 billion in each of the two prior years. On a net basis (new issues less retirements), the convertible market grew by approximately $10 billion in 2015, similar to the growth in 2014.
During 2015, we estimated the median difference between the market price and fundamental value (we refer to this difference as “cheapness”) for equity-sensitive convertible bonds increased from approximately 1.0% to 1.6%. Although it is difficult to know with certainty the underlying cause of convertible cheapening, it is likely related to activity in the high yield market. Convertible bonds richened moderately between January and May when high-yield corporate debt generated positive returns and then cheapened considerably between June and December when the high yield market generated negative returns. However, even with the net cheapening, other sources of value in the convertible strategy, namely dynamic hedging, portfolio rebalancing, and portfolio hedging offset the cheapening such that losses from convertible arbitrage were not realized over the year.
Looking Forward
2015 was a difficult year across corporate arbitrage strategies, particularly in the restructuring space. The Altman-Kuehne Defaulted Bond Index returned -39.5%, its second-worst year ever (2008 was the worst year). As a consequence, redemptions from event-driven funds were high and a number of hedge funds and mutual funds that follow event/restructuring strategies announced that they were ceasing operations. Although the selling associated with the cessation of operations put further pressure on prices and has amplified losses, it has produced two positive effects. First, price pressure caused by sellers’ demand for liquidity should revert causing a partial rebound in prices. More importantly, with fewer investors going forward, securities issued by companies involved in restructurings will be more attractively priced. In addition, given the copious amount of high-yield debt issued over the past several years, we expect the volume of restructuring opportunities to increase, particularly if the market volatility experienced during the first few weeks of 2016 continues. Recent market volatility is also creating opportunities in other strategies. Closed-end fund discounts have widened significantly as have yields on Special Purpose Acquisition Companies (SPACs). The increase in SPAC spreads is a particularly strong indication that the price of liquidity has increased.
The price of liquidity noted in the event-driven space is also affecting prices in the merger and convertible markets. As noted above, merger spreads widened significantly in 2015 and remain wide relative to recent history. Although merger spreads reflect heightened regulatory risk, currently wide spreads can be partially attributed to strong deal flow and reduced investor willingness to provide liquidity. Similarly, in the convertible market, the fundamental cheapness of convertible bonds has increased despite the extraordinarily slow new-issue market. This too is an indication that the price of liquidity has increased.
| AQR Funds | Annual Report | December 2015 | ||||||||||||||
3
Table of Contents
Shareholder Letter (Unaudited)
| AQR DIVERSIFIED ARBITRAGE FUND |
Opportunities in corporate arbitrage will be particularly attractive if deal flow remains robust. In the current environment, the convertible new-issue market is slow, but merger deal flow continues to be strong and we expect distressed opportunities across industries to be plentiful. Relative to prior years, we expect investment opportunities to be above average in 2016. Irrespective of where the Fund deploys capital in 2016, we will continue to hedge systematic equity, credit, and interest rate risk, with the intention of delivering uncorrelated positive returns.1
AVERAGE ANNUAL TOTAL RETURNS AS OF 12/31/2015 AQR DIVERSIFIED ARBITRAGE FUND | ||||||||||||||||||||
| 1 Year | 3 Year | 5 Year | Since Inception | Date of Inception | ||||||||||||||||
| Fund - Class I: ADAIX | -4.87% | * | -2.78% | -0.87% | 1.31% | 1/15/2009 | ||||||||||||||
| Fund - Class N: ADANX | -5.04% | * | -3.00% | -1.11% | 1.05% | 1/15/2009 | ||||||||||||||
| Fund - Class R6: QDARX | -4.74% | * | na | na | -7.90% | 9/2/2014 | ||||||||||||||
| BofA Merrill Lynch 3-Month U.S. Treasury Bill IndexSM | 0.05% | |||||||||||||||||||
Past performance does not guarantee future results. Investment results and principal value of an investment will fluctuate so that an investor’s shares, when redeemed, may be worth more or less than their original cost. Current performance may be lower or higher than the performance data quoted. As of the latest prospectus, the gross expense ratio for the Fund’s Class I/N/R6 shares are 1.96%, 2.20% and 2.02%, respectively. Call 1-866-290-2688 or visit www.aqrfunds.com for current month-end performance.
| * | Total return information is based on net asset values calculated for shareholder transactions. Certain adjustments were made to the net assets of the Fund at 12/31/2015 for financial reporting purposes, and as a result, the net asset values for shareholder transactions and the total returns based on those net asset values differ from the adjusted net asset values and total returns for financial reporting. |
| 1 | Note that the Fund utilizes various derivatives instruments (e.g., futures, options, forwards, and swaps), primarily to hedge systematic risks including credit risk and interest rate risk. While the purpose of employing derivatives instruments is to decrease the Fund’s overall risk, hedging instruments are imperfect tools and their effectiveness depends on the degree of price correlation between the derivative instruments and the assets being hedged. Imperfect correlation may be caused by several factors, including temporary price disparities between derivative markets and markets for the underlying assets. |
| AQR Funds | Annual Report | December 2015 | ||||||||||||||
4
Table of Contents
Shareholder Letter (Unaudited)
| AQR DIVERSIFIED ARBITRAGE FUND |
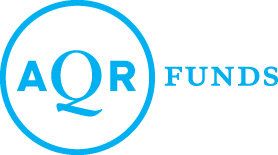
| AQR DIVERSIFIED ARBITRAGE FUND VS. BOFA MERRILL LYNCH 3-MONTH U.S. TREASURY BILL INDEXSM VALUE OF $10,000 INVESTED ON 01/15/2009 | ||||
The chart above represents historical performance of a hypothetical investment of $10,000 in the Fund over the past ten years (or since inception if shorter). Performance data quoted represents past performance and does not guarantee future results. Returns shown are total returns, which assume the reinvestment of dividends and capital gains. The table and graph presented above do not reflect the deduction of taxes a shareholder would pay on fund distributions or the redemption of fund shares.
| AQR Funds | Annual Report | December 2015 | ||||||||||||||
5
Table of Contents
Shareholder Letter (Unaudited)
| AQR EQUITY MARKET NEUTRAL FUND |

Andrea Frazzini
Principal

Jacques Friedman
Principal
Lars Nielsen
Principal
Dear Shareholder:
The AQR Equity Market Neutral Fund (the “Fund”) seeks to provide investors with returns from potential gains of its long and short equity positions. The Fund is designed to be market- or beta-neutral, meaning the Fund seeks to achieve returns that are not closely correlated with the returns of the equity markets in which the Fund invests. Accordingly, the Fund, on average, intends to target a portfolio beta of zero over a normal business cycle.
Since the Fund targets a beta of zero, an appropriate benchmark is U.S. Treasury returns, which remain at near-zero levels. Since inception, the Fund handily outperformed the BofA Merrill Lynch 3-Month U.S. Treasury Bill IndexSM, its benchmark, with the Class I shares returning 19.51% vs the benchmark return of 0.05% during this period.
Fund returns were driven by strong performance of most of our investment themes. Investor Sentiment, Stability, Country-Industry Pairs, and all of our Momentum-related themes (within industry, across industry and indirect Momentum) worked particularly well in 2015, with the exposure gained through the use of Total Return basket swaps. Valuation signals within and across industries underperformed slightly. These valuation themes tend to be negatively correlated with momentum signals. Geographically, stocks in the U.S. and Canada contributed the most to overall returns, while in Spain and the Netherlands stock selection detracted most from returns. At the sector level, the stock selection strategy worked best in industrials and energy in 2015.
The Fund ended the year with a highly diversified stock portfolio. Securities remained globally diversified with nearly 40% of the Fund invested outside of the U.S. The Fund does take small industry views. As of the end of the year, our largest sector overweights were in healthcare and information technology, while our largest underweights were in energy and utilities.
AVERAGE ANNUAL TOTAL RETURNS AS OF 12/31/2015 AQR EQUITY MARKET NEUTRAL FUND | ||||||||||||
| 1 Year | Since Inception | Date of Inception | ||||||||||
| Fund - Class I: QMNIX | 17.60% | 19.51% | 10/7/2014 | |||||||||
| Fund - Class N: QMNNX | 17.43% | 19.31% | 10/7/2014 | |||||||||
| Fund - Class R6: QMNRX | 17.72% | 19.63% | 10/7/2014 | |||||||||
| BofA Merrill Lynch 3-Month U.S. Treasury Bill IndexSM | 0.05% | |||||||||||
Past performance does not guarantee future results. Investment results and principal value of an investment will fluctuate so that an investor’s shares, when redeemed, may be worth more or less than their original cost. Current performance may be lower or higher than the performance data quoted. As of the latest prospectus, the gross expense ratio for the Fund’s Class I/N/R6 shares are 4.61%, 4.87% and 4.53%, respectively. Call 1-866-290-2688 or visit www.aqrfunds.com for current month-end performance.
| AQR Funds | Annual Report | December 2015 | ||||||||||||||
6
Table of Contents
Shareholder Letter (Unaudited)
| AQR EQUITY MARKET NEUTRAL FUND |
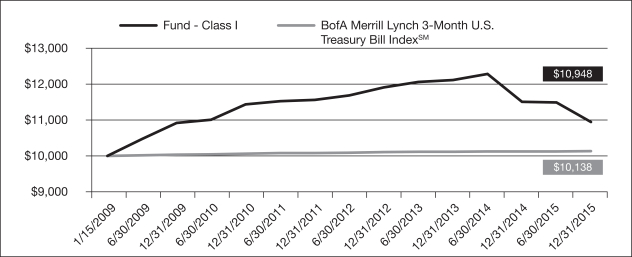
AQR EQUITY MARKET NEUTRAL FUND VS. BOFA MERRILL LYNCH 3-MONTH U.S. TREASURY BILL INDEXSM | ||||
The chart above represents historical performance of a hypothetical investment of $10,000 in the Fund over the past ten years (or since inception if shorter). Performance data quoted represents past performance and does not guarantee future results. Returns shown are total returns, which assume the reinvestment of dividends and capital gains. The table and graph presented above do not reflect the deduction of taxes a shareholder would pay on fund distributions or the redemption of fund shares.
| AQR Funds | Annual Report | December 2015 | ||||||||||||||
7
Table of Contents
Shareholder Letter (Unaudited)
| AQR GLOBAL MACRO FUND |

John Liew
Founding Principal

Michael Katz
Principal
Lars Nielsen
Principal

Jordan Brooks
Managing Director

David Kupersmith
Managing Director
Dear Shareholders:
The AQR Global Macro Fund (the “Fund”) invests across four liquid asset classes: fixed income, currencies, commodities and equities. Within each asset class, we take both relative value and directional positions. The strategy is long-term market-neutral, but can take directional views over the short term. The targeted annualized volatility for the Fund is 10%, on average, which varies modestly over time based on attractiveness of opportunities within the different asset classes we trade. The Fund’s strategy trades predominately on macroeconomic news and trends, using a systematic, bottom-up approach that integrates both quantitative and discretionary trading signals.
Our investment philosophy is rooted in the insight that financial markets tend to underreact to macroeconomic news. This implies that macroeconomic news tends to have a persistent effect on asset prices. Our strategy seeks to take advantage of this tendency by investing across liquid markets on the basis of macroeconomic news and trends, an investment approach we call macro momentum. We form macro momentum views by evaluating both quantitative and discretionary indicators across a variety of dimensions, from growth and inflation to monetary policy and international trade. By integrating both quantitative and discretionary indicators of macro momentum in a bottom-up, risk-controlled portfolio construction, we capture the best features of both approaches while maintaining the benefits of a systematic and disciplined process.
With macro momentum at the core of our investment philosophy, we also consider price momentum, value and carry indicators. This multifactor approach provides a more holistic picture of each asset’s attractiveness than trading on macro momentum alone does. Macro momentum tends to drive asset positioning (long or short) in our portfolio, but the degree of agreement between macro momentum, on the one hand, and price momentum, value and carry, on the other, determines ultimate position sizing. Our bottom-up portfolio construction – in which we evaluate the attractiveness of each asset across a large number of dimensions – allows us to build a highly diversified portfolio.
The Fund’s benchmark, the BofA Merrill Lynch 3-Month U.S. Treasury Bill IndexSM, was up +0.05% over the course of 2015. The Fund outperformed this benchmark, with the Class I shares returning +1.71% net of fees on the year. The low, positive benchmark performance can be attributed to the general low rate environment over the course of 2015. The Fund performance across asset classes was mixed. The Fund experienced gains in commodities (up +2.93%) and currencies (developed currencies up +1.50% and emerging currencies up +0.63%). The Fund had losses in equities (developed equities down -1.81% and emerging equities down -0.01%) and fixed income (developed interest rates down -1.70%, yield curve -1.54% although somewhat offset by developed bonds that were up +1.65%). U.S. tactical asset allocation also contributed to returns, as the strategy was up +0.07% on the year.
Commodities
The Fund’s directional commodities strategies were the top contributor on the year. Gains were seen in the first, third and fourth quarters, largely driven by short positions in energy and agricultural commodity futures. The Fund held short Brent and WTI crude oil positions over the year based on downward revisions to growth and industrial production forecasts in commodity consuming countries such as China, U.S. dollar appreciation, unattractive carry, and negative price momentum. The Fund was short agricultural commodities also on downward revisions to growth forecasts in key commodity consuming countries, U.S. dollar appreciation, and negative longer-term price momentum. The sizing of our short views across these commodity markets was slightly reduced by attractive value. Short positions in Brent and WTI crude oil performed well, as global oil production remained elevated despite the drastic decline in crude prices from over $100 per barrel in mid-2014 to below $40 per barrel in 2015. Shale oil operations in the U.S., a segment of global production once thought to be highly dependent on elevated crude prices, managed to maintain production near peak levels. OPEC members not only failed to boost prices by cutting production quotas, but actually pushed their output further above previously agreed limits, adding to the glut of crude in global markets. Short positions in agricultural commodities performed well as weather was favorable in key growing regions, production was elevated and a stronger U.S. dollar weighed on export prospects.
| AQR Funds | Annual Report | December 2015 | ||||||||||||||
8
Table of Contents
Shareholder Letter (Unaudited)
| AQR GLOBAL MACRO FUND |
Developed Bonds
Both directional and relative value bond strategies added to returns. Directional long views in U.K. gilts and Canadian government bonds performed well. The Fund was long U.K. gilts during the third quarter based on poor equity market performance and positive price momentum. Concerns over slower growth in China and other emerging markets boosted gilt prices during the period. The Fund was long Canadian government bonds over the year on negative earnings revisions, poor equity market performance, downward revisions to inflation and positive price momentum. This position performed well as the Bank of Canada responded to lower oil prices and related growth concerns by cutting its key policy rate twice, once in January and again in July. Short Australian and Japanese government bonds were top contributors within the relative value strategy. The Fund was short Australian bonds on poor carry and positive growth surprises. The Fund’s short in Japanese government bonds was driven by unattractive carry and valuation as well as equity market outperformance. Australian bonds underperformed over the fourth quarter on stronger than expected employment data released by the Australian Bureau of Statistics and a less dovish than expected Reserve Bank of Australia (RBA). The RBA kept its key policy rate unchanged at its November meeting, despite nearly half of surveyed economists expecting a rate cut. Japanese government bonds underperformed the cross section over the year as the Bank of Japan remained optimistic on reaching its inflation target without taking further easing measures.
Developed Currencies
The developed currency strategy was another meaningful contributor. Gains were seen in a long Japanese Yen position in the third quarter and a long Euro position in the second quarter. The Fund was long the Yen and Euro on improvements in terms of trade, aided by the fall in oil prices, positive twelve month equity market performance and attractive valuation. The Japanese Yen outperformed, with large gains seen in the third quarter. In addition to the Bank of Japan remaining optimistic on reaching its inflation target, worries over global growth during the third quarter led low-yielding currencies to outperform their high-yielding counterparts. After depreciating over the first quarter on the European Central Bank’s announcement of a larger than expected asset purchase program, the Euro rebounded in the second quarter as European growth data improved and inflation exceeded consensus forecasts.
Developed Equities
The largest detractor over the year was the developed equity strategies, with losses concentrated in the Fund’s relative value strategy. During the second quarter the Fund was long the German DAX Index and short the S&P 500 Index. The German DAX position was based on positive growth surprises and improved international trade, helped by a weaker Euro. The short S&P 500 view was driven by deteriorating exports, partially the result of a strengthening U.S. dollar, as well as elevated valuations. The overweight position in the German DAX detracted from performance due to uncertainty over Greek bailout negotiations and a rebound in the value of the Euro currency, which dampened the outlook for exporters which make up a meaningful portion of the index. The short position in the S&P 500 was also unprofitable, as a depreciating U.S. dollar and dovish guidance from the Federal Reserve (“Fed”) led to outperformance relative to other developed markets.
Developed Interest Rates
Another detractor was the developed interest rates strategy, with losses concentrated in the first and fourth quarters and mainly in the Fund’s relative value strategy. In the first quarter, a short view on Canadian interest rate futures was a large detractor. The short position was driven by equity market outperformance and unattractive value. Canadian interest rate futures outperformed over the quarter as the Bank of Canada surprised markets in January by cutting its key policy rate despite consensus forecasts for the central bank to remain on hold. Losses over the first quarter were partially offset by a long Swiss interest rate futures position. The Swiss National Bank surprised markets on January 15th by removing its 1.20 Euro-Swiss franc FX floor and cutting its deposit rate to -0.75%. In the fourth quarter the Fund was long U.S. and U.K. interest rate futures. The U.S. view was supported by inflation forecasts being revised lower and negative inflation surprises, U.S. dollar appreciation and attractive value. The U.K. view was based on equity market underperformance, negative growth revisions and attractive value. The Fund’s long U.S. interest rate futures position detracted as the Fed came across more hawkish than expected at its October meeting, shifting market pricing to expect higher odds the Fed would hike at its December meeting. In line with these revised expectations, at its December meeting, the Fed hiked its key policy rate for the first time since 2006. U.K. interest rate futures also underperformed. Despite Bank of England (BOE) Governor Mark Carney signaling that the BOE was unlikely to follow the Fed in hiking rates due to low inflation in the U.K., Canadian and European interest rate futures outperformed the U.K. contracts. Lower oil prices helped to support Canadian interest rate futures and a more accommodative European Central Bank aided European interest rate futures.
| AQR Funds | Annual Report | December 2015 | ||||||||||||||
9
Table of Contents
Shareholder Letter (Unaudited)
| AQR GLOBAL MACRO FUND |
AVERAGE ANNUAL TOTAL RETURNS AS OF 12/31/2015 AQR GLOBAL MACRO FUND | ||||||||||||
| 1 Year | Since Inception | Date of Inception | ||||||||||
| Fund - Class I: QGMIX | 1.71% | 0.74% | 4/8/2014 | |||||||||
| Fund - Class N: QGMNX | 1.41% | 0.45% | 4/8/2014 | |||||||||
| Fund - Class R6: QGMRX | 1.71% | 3.15% | 9/2/2014 | |||||||||
| BofA Merrill Lynch 3-Month U.S. Treasury Bill IndexSM | 0.05% | |||||||||||
Past performance does not guarantee future results. Investment results and principal value of an investment will fluctuate so that an investor’s shares, when redeemed, may be worth more or less than their original cost. Current performance may be lower or higher than the performance data quoted. As of the latest prospectus, the gross expense ratio for the Fund’s Class I/N/R6 shares are 2.30%, 2.55% and 2.08%, respectively. Call 1-866-290-2688 or visit www.aqrfunds.com for current month-end performance.
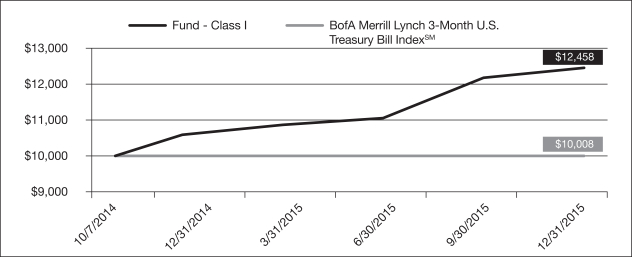
| AQR GLOBAL MACRO FUND VS. BOFA MERRILL LYNCH 3-MONTH U.S. TREASURY BILL INDEXSM VALUE OF $10,000 INVESTED ON 04/08/2014 | ||||
The chart above represents historical performance of a hypothetical investment of $10,000 in the Fund over the past ten years (or since inception if shorter). Performance data quoted represents past performance and does not guarantee future results. Returns shown are total returns, which assume the reinvestment of dividends and capital gains. The table and graph presented above do not reflect the deduction of taxes a shareholder would pay on fund distributions or the redemption of fund shares.
| AQR Funds | Annual Report | December 2015 | ||||||||||||||
10
Table of Contents
Shareholder Letter (Unaudited)
| AQR LONG-SHORT EQUITY FUND |
Jacques Friedman
Principal
Lars Nielsen
Principal
Andrea Frazzini
Principal
Dear Shareholder:
The AQR Long-Short Equity Fund (the “Fund”) seeks to provide higher risk-adjusted returns with lower volatility relative to global equity markets. It does so using three different sources of return: 1) the potential gains from its long/short equity positions by entering into Total Return Basket Swaps, 2) overall exposure to equity markets, through the use of futures contracts, and 3) the tactical variation of its net exposure to equity markets. The strategy primarily seeks to add alpha via its long/short (market-neutral) stock portfolio. It also manages its beta relative to the MSCI World Index** (“MSCI World”) to a long-term target of 0.5, and within a shorter-term range of 0.3 to 0.7, depending on our market views.
Global developed equity markets performed negatively in 2015, driven primarily by expectations of slower growth in China and the underperformance of the energy sector. The Fund’s custom benchmark (0.5* MSCI World + 0.5* Bofa Merrill Lynch 3-Month U.S. Treasury Bill IndexSM) delivered slightly negative returns of -0.19% over this period. The Fund handily outperformed this benchmark, with the Class I shares returning 17.04%.
The stock selection strategy, through the use of Total Return basket swaps, contributed to the majority of the outperformance and returned 16.90% for the year. Returns were driven by the strong performance of nearly all of our investment themes. In particular, investor sentiment, stability, and all of our momentum investment themes contributed the most to positive returns. Conversely, valuation signals within and across industries underperformed. These valuation themes tend to be negatively correlated to momentum signals. Geographically, stocks in the U.S. and Canada contributed the most to overall returns, while Spanish and Italian stocks detracted slightly from performance. At the sector level, the stock selection strategy worked best in industrials and energy in 2015.
The Fund did not benefit from its static long-term beta exposure of 0.5 to the MSCI World, given this index’s negative performance. Our tactical market exposure (the desired deviation from a beta of 0.5) slightly contributed to outperformance.
The Fund ended the year with a highly diversified stock portfolio. Securities remained globally diversified, with nearly 40% of the Fund invested outside of the U.S. The stock selection strategy does take small industry views. As of the end of the year, our largest sector overweights were in healthcare and information technology, while our largest underweights were in energy and utilities.
Our tactical market view was positive at the end of the year and as a consequence, our ex-ante beta to the MSCI World was 0.6. This was mostly driven by favorable valuation and fundamental momentum indicators.
| AQR Funds | Annual Report | December 2015 | ||||||||||||||
11
Table of Contents
Shareholder Letter (Unaudited)
| AQR LONG-SHORT EQUITY FUND |
AVERAGE ANNUAL TOTAL RETURNS AS OF 12/31/2015 AQR LONG-SHORT EQUITY FUND | ||||||||||||
| 1 Year | Since Inception | Date of Inception | ||||||||||
| Fund - Class I: QLEIX | 17.04% | 17.76% | 7/16/2013 | |||||||||
| Fund - Class N: QLENX | 16.79% | 17.45% | 7/16/2013 | |||||||||
| Fund - Class R6: QLERX | 17.16% | 17.86% | 9/2/2014 | |||||||||
| 50% MSCI World Index**/50% BofA Merrill Lynch 3-Month U.S. Treasury Bill IndexSM | -0.19% | |||||||||||
Past performance does not guarantee future results. Investment results and principal value of an investment will fluctuate so that an investor’s shares, when redeemed, may be worth more or less than their original cost. Current performance may be lower or higher than the performance data quoted. As of the latest prospectus, the gross expense ratio for the Fund’s Class I/N/R6 shares are 2.40%, 2.52% and 2.05%, respectively. Call 1-866-290-2688 or visit www.aqrfunds.com for current month-end performance.
| AQR LONG-SHORT EQUITY FUND VS. BOFA MERRILL LYNCH 3-MONTH U.S. TREASURY BILL INDEXSM VALUE OF $10,000 INVESTED ON 07/16/2013 | ||||
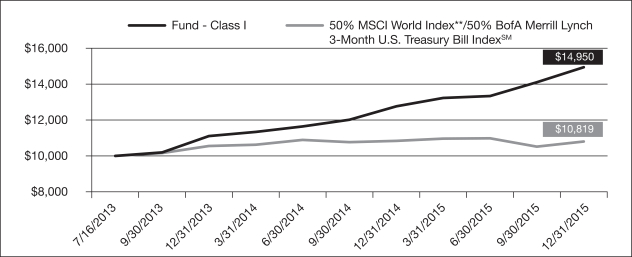
The chart above represents historical performance of a hypothetical investment of $10,000 in the Fund over the past ten years (or since inception if shorter). Performance data quoted represents past performance and does not guarantee future results. Returns shown are total returns, which assume the reinvestment of dividends and capital gains. The table and graph presented above do not reflect the deduction of taxes a shareholder would pay on fund distributions or the redemption of fund shares.
| ** | MSCI makes no express or implied warranties or representations and shall have no liability whatsoever with respect to any MSCI data contained herein. The MSCI data may not be further redistributed or used as a basis for other indices or any securities or financial products. This report is not approved, reviewed, or produced by MSCI. |
| AQR Funds | Annual Report | December 2015 | ||||||||||||||
12
Table of Contents
Shareholder Letter (Unaudited)
| AQR MANAGED FUTURES STRATEGY FUND |

Cliff Asness
Managing & Founding Principal
John Liew
Founding Principal

Brian Hurst
Principal

Yao Hua Ooi
Principal

Ari Levine
Managing Director
Dear Shareholder:
The AQR Managed Futures Strategy Fund (the “Fund”) actively invests in futures and forward contracts both long and short across the global equity, fixed income, commodity and currency markets. The Fund uses both short- and long-term trend-following signals to attempt to profit from different trends that occur in all of these markets. Trend following can be simply described as going long markets that are rising in price and going short markets that are falling in price.
In addition to trend-following signals, we also incorporate signals that seek to identify overextended trends and reduce risk when the chance of a reversal is perceived as higher than normal, since market reversals generally cause losses for trend-following strategies.
We expect that the correlation of this strategy to the equity markets will average close to zero over a full economic cycle. That said, it is the nature of the strategy to exhibit a positive beta when markets have been rising and a negative beta when the markets have been falling.
The strategy had another year of positive performance in 2015, with the Class I shares returning 2.00% versus a 0.05% return for its benchmark, the BofA Merrill Lynch 3-Month U.S. Treasury Bill IndexSM. The strategy outperformed the SG Trend Index, formerly the Newedge Trend Index, which returned +0.04% in 2015. This index is an equal weighted composite of 10 of the largest trend-following managed futures hedge funds. By asset class, on a gross basis, equities detracted -2.06%, fixed income contributed +0.28%, commodities contributed +5.05%, and currencies were roughly flat at +0.02%.
Several market themes that emerged in 2014 continued to shape the path markets took in 2015. One in particular was the divergence of central bank policy across various countries, which continued throughout 2015.
Most notably, the Federal Reserve (“Fed”) ended its quantitative easing program in late 2014, and in subsequent communications throughout 2015, reiterated the readiness of the U.S. economy for a rate hike sometime within the year. While acknowledging certain headwinds to the global economy, the Fed raised interest rates in December for the first time since 2006, justifying its action on the back of strong improvements in the U.S. labor market. In sharp contrast, the European Central Bank (“ECB”) took the opposite path, announcing a new and larger than expected 60 billion Euro per month asset purchase program in early 2015. Also early in the year, the Bank of Canada preemptively cut interest rates due to concerns regarding the impact of falling commodity prices on its economy. Other central banks joined the easing bias in 2015 including Australia, New Zealand, Singapore, India, Korea and China. In Japan, the government remained committed to continuing aggressive monetary policy and fiscal stimulus, as well as implementing structural reforms.
These divergent policy responses had significant influence on markets during the year. The Fed’s aim of hiking interest rates versus other countries’ easing bias fueled a continuation of 2014’s bullish trend in the U.S. dollar, which was among the strongest performing trends in 2015. Related to U.S. dollar strength, commodity prices continued to suffer significant declines in 2015, most notably in the energy sector. This was partially a U.S. dollar story, but perhaps more importantly global oil producers largely maintained, and in some cases increased, production despite falling prices, causing prices to fall further. Falling energy prices were in fact among the most consistent trends in 2015 and the strongest contributors to overall performance for the year.
In contrast to these key trends, most other markets responded to inherently unstable sentiment throughout 2015. In the first quarter for example, European equities and fixed income experienced strong rallies, only to give back some of their gains as issues concerning Greece took center stage, and as the prospect for rising rates in the U.S. became tangible in the second quarter. Additionally, the consistent path of monetary policy in Japan meant that at times the Yen depreciated due to monetary stimulus, while at others, it appreciated on safe-haven demand. The Euro exhibited similar dynamics, as
| AQR Funds | Annual Report | December 2015 | ||||||||||||||
13
Table of Contents
Shareholder Letter (Unaudited)
| AQR MANAGED FUTURES STRATEGY FUND |
markets debated the degree of commitment to additional stimulus by the ECB. These shifts prompted reversals and generally hurt the strategy.
In the third quarter, global equities suffered their worst drawdown since 2011 due to fears that slowing growth in China and other large emerging markets might drag down global growth. These concerns intensified following the Chinese leadership’s surprise decision to allow the Renminbi to depreciate against the dollar on August 11th, which caused large sell-offs in higher-yielding currencies, and risk assets more broadly. In the major risk-off episode of August, and the third quarter more generally, the strategy demonstrated its strong diversification potential with positive performance.
Transitioning into the fourth quarter, sentiment shifted again. As the Fed did not hike in September and the People’s Bank of China eased, riskier assets globally rallied strongly as markets entered a more accommodative environment. However, with the Fed raising interest rates in December for the first time since 2006, and the ECB disappointing markets with the pace of its stimulus measures in December, equities, fixed income and currencies experienced reversals yet again, creating a difficult environment for trend following.
Long-term trend-following signals outperformed short-term signals, contributing mainly due to short commodities positioning, and also from long positions in the U.S. dollar and in global fixed income markets. Short-term signals detracted however, performing negatively in every asset class as every asset class exhibited reversals at various points throughout the year. Over-extended signals contributed, as they helped the strategy navigate reversals in fixed income during the second quarter and in commodities in February and at the end of August.
The strategy’s average annualized volatility target is 10.0%, which we allow to vary based on the conditional attractiveness of trends in the markets we trade. The Fund entered the year targeting a slightly-below-average 8.4% volatility, due to conflicting long- and short-term signals in some assets. The Fund ended the year at a similar volatility level of 8.2% as the trend environment continued to be varied for the assets the Fund trades at the end of the year.
Overall, given the degree to which market sentiment changed direction in 2015 across various asset classes, our strategy weathered a difficult environment for trend following and markets more broadly. The Fund notably outperformed the SG Trend Index. There are several factors we can point to which were likely helpful in 2015. First, unlike some competitors, we maintain a trend-following focused approach and avoid adding non-trend strategies, which can exhibit positive correlation to risky assets in weak market environments. Some of these non-trend strategies performed poorly in 2015. Second, our over-extended signals helped navigate certain periods of reversals, such as in fixed income in late-April and early-May. Some aspects of our approach did not help, such as trading non-U.S. dollar currency crosses, but we will continue to emphasize diversification as we believe it allows for better risk management and an improved long-run investor experience.
AVERAGE ANNUAL TOTAL RETURNS AS OF 12/31/2015 AQR MANAGED FUTURES STRATEGY FUND | ||||||||||||||||||||
| 1 Year | 3 Year | 5 Year | Since Inception | Date of Inception | ||||||||||||||||
| Fund - Class I: AQMIX | 2.00% | 6.97% | 3.37% | 3.71% | 1/5/2010 | |||||||||||||||
| Fund - Class N: AQMNX | 1.75% | 6.68% | 3.10% | 3.44% | 1/5/2010 | |||||||||||||||
| Fund - Class R6: AQMRX | 2.16% | na | na | 11.40% | 9/2/2014 | |||||||||||||||
| BofA Merrill Lynch 3-Month U.S. Treasury Bill IndexSM | 0.05% | |||||||||||||||||||
Past performance does not guarantee future results. Investment results and principal value of an investment will fluctuate so that an investor’s shares, when redeemed, may be worth more or less than their original cost. Current performance may be lower or higher than the performance data quoted. As of the latest prospectus, the gross expense ratio for the Fund’s Class I/N/R6 shares are 1.26%, 1.53% and 1.19%, respectively. Call 1-866-290-2688 or visit www.aqrfunds.com for current month-end performance.
| AQR Funds | Annual Report | December 2015 | ||||||||||||||
14
Table of Contents
Shareholder Letter (Unaudited)
| AQR MANAGED FUTURES STRATEGY FUND |
| AQR MANAGED FUTURES STRATEGY FUND VS. BOFA MERRILL LYNCH 3-MONTH U.S. TREASURY BILL INDEXSM VALUE OF $10,000 INVESTED ON 01/05/2010 | ||||
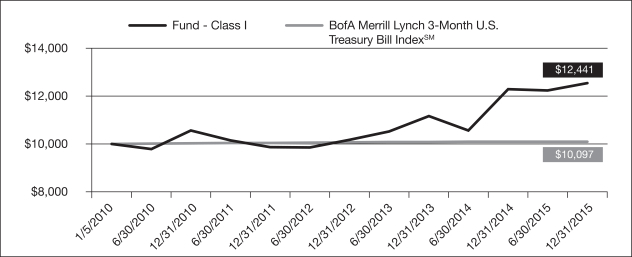
The chart above represents historical performance of a hypothetical investment of $10,000 in the Fund over the past ten years (or since inception if shorter). Performance data quoted represents past performance and does not guarantee future results. Returns shown are total returns, which assume the reinvestment of dividends and capital gains. The table and graph presented above do not reflect the deduction of taxes a shareholder would pay on fund distributions or the redemption of fund shares.
| AQR Funds | Annual Report | December 2015 | ||||||||||||||
15
Table of Contents
Shareholder Letter (Unaudited)
| AQR MANAGED FUTURES STRATEGY HV FUND |
Cliff Asness
Managing & Founding Principal
John Liew
Founding Principal
Brian Hurst
Principal
Yao Hua Ooi
Principal
Ari Levine
Managing Director
Dear Shareholder:
The AQR Managed Futures Strategy HV Fund (the “Fund”) actively invests in futures and forward contracts both long and short across the global equity, fixed income, commodity and currency markets. The Fund uses both short- and long-term trend-following signals to attempt to profit from different trends that occur in all of these markets. Trend following can be simply described as going long markets that are rising in price and going short markets that are falling in price.
In addition to trend-following signals, we also incorporate signals that seek to identify overextended trends and reduce risk when the chance of a reversal is perceived as higher than normal, since market reversals generally cause losses for trend-following strategies.
We expect that the correlation of this strategy to the equity markets will average close to zero over a full economic cycle. That said, it is the nature of the strategy to exhibit a positive beta when markets have been rising and a negative beta when the markets have been falling.
The Fund had another year of positive performance in 2015, with the Class I shares returning +2.48% versus a +0.05% return for its benchmark, the BofA Merrill Lynch 3-Month U.S. Treasury Bill IndexSM. By asset class, on a gross basis, equities detracted -3.15%, fixed income contributed +0.29%, commodities contributed +7.43%, and currencies detracted -0.37%. The strategy outperformed the SG Trend Index, formerly the Newedge Trend Index, which returned +0.04% in 2015. This index is an equal weighted composite of 10 of the largest trend-following managed futures hedge funds.
Overall, given the degree to which market sentiment changed direction in 2015 across various asset classes, our strategy weathered a difficult environment for trend following and markets more broadly. There are several factors we can point to for the positive results. We continually maintain a trend-following focused approach and avoid adding non-trend strategies, which can exhibit positive correlation to risky assets in weak market environments. Second, our over-extended signals helped navigate certain periods of reversals, such as in fixed income in late-April and early-May. Some aspects of our approach did not help, such as trading non-U.S. dollar currency crosses, however we will continue to emphasize diversification as we believe it allows for better risk management and an improved long-run investor experience.
Several market themes that emerged in 2014 continued to shape the path markets took in 2015. One in particular was the divergence of central bank policy across various countries, which continued throughout 2015.
Most notably, the Federal Reserve (“Fed”) ended its quantitative easing program in late 2014, and in subsequent communications throughout 2015, reiterated the readiness of the U.S. economy for a rate hike sometime within the year. While acknowledging certain headwinds to the global economy, the Fed raised interest rates in December for the first time since 2006, justifying its action on the back of strong improvements in the U.S. labor market. In sharp contrast, the European Central Bank (“ECB”) took the opposite path, announcing a new and larger than expected 60 billion Euro per month asset purchase program in early-2015. Also early in the year, the Bank of Canada preemptively cut interest rates due to concerns regarding the impact of falling commodity prices on its economy. Other central banks joined the easing bias in 2015 including Australia, New Zealand, Singapore, India, Korea and China. In Japan, the government remained committed to continuing aggressive monetary policy and fiscal stimulus, as well as implementing structural reforms.
These divergent policy responses had significant influence on markets during the year. The Fed’s aim of hiking interest rates versus other countries’ easing bias fueled a continuation of 2014’s bullish trend in the U.S. dollar, which was among the strongest performing trends in 2015. Related to U.S. dollar strength, commodity prices continued to suffer significant declines in 2015, most notably in the energy sector. This was partially a U.S. dollar story, but perhaps more importantly global oil producers largely maintained, and in some cases increased, production despite falling prices, causing prices to fall further. Falling energy prices were in fact among the most consistent trends in 2015 and the strongest contributors to overall performance for the year.
| AQR Funds | Annual Report | December 2015 | ||||||||||||||
16
Table of Contents
Shareholder Letter (Unaudited)
| AQR MANAGED FUTURES STRATEGY HV FUND |
In contrast to these key trends, most other markets responded to inherently unstable sentiment throughout 2015. In the first quarter for example, European equities and fixed income experienced strong rallies, only to give back some of their gains as issues concerning Greece took center stage, and as the prospect for rising rates in the U.S. became tangible in the second quarter. Additionally, the consistent path of monetary policy in Japan meant that at times the Yen depreciated due to monetary stimulus, while at others, it appreciated on safe-haven demand. The Euro exhibited similar dynamics, as markets debated the degree of commitment to additional stimulus by the ECB. These shifts prompted reversals and generally hurt the strategy.
In the third quarter, global equities suffered their worst drawdown since 2011 due to fears that slowing growth in China and other large emerging markets might drag down global growth. These concerns intensified following the Chinese leadership’s surprise decision to allow the Renminbi to depreciate against the dollar on August 11th, which caused large sell-offs in higher-yielding currencies, and risk assets more broadly. In the major risk-off episode of August, and the third quarter more generally, the strategy demonstrated its strong diversification potential with positive performance.
Transitioning into the fourth quarter, sentiment shifted again. As the Fed did not hike in September and the People’s Bank of China eased, riskier assets globally rallied strongly as markets entered a more accommodative environment. However, with the Fed raising interest rates in December for the first time since 2006, and the ECB disappointing markets with the pace of its stimulus measures in December, equities, fixed income and currencies experienced reversals yet again, creating a difficult environment for trend following.
Long-term trend-following signals outperformed short-term signals, contributing mainly due to short commodities positioning, and also from long positions in the U.S. dollar and in global fixed income markets. Short-term signals detracted however, performing negatively in every asset class as every asset class exhibited reversals at various points throughout the year. Over-extended signals contributed, as they helped the strategy navigate reversals in fixed income during the second quarter and in commodities in February and at the end of August.
The strategy’s average annualized volatility target is 15.0%, which we allow to vary based on the conditional attractiveness of trends in the markets we trade. The Fund entered the year targeting a slightly-below-average 12.5% volatility, due to conflicting long- and short-term signals in some assets. The Fund ended the year at a similar volatility level of 11.8% as the trend environment continued to be varied for the assets the Fund trades at the end of the year.
Overall, given the degree to which market sentiment changed direction in 2015 across various asset classes, our strategy weathered a difficult environment for trend following and markets more broadly. The Fund notably outperformed the SG Trend Index. There are several factors we can point to which were likely helpful in 2015. First, unlike some competitors, we maintain a trend-following focused approach and avoid adding non-trend strategies, which can exhibit positive correlation to risky assets in weak market environments. Some of these non-trend strategies performed poorly in 2015. Second, our over-extended signals helped navigate certain periods of reversals, such as in fixed income in late-April and early-May. Some aspects of our approach did not help, such as trading non-U.S. dollar currency crosses, but we will continue to emphasize diversification as we believe it allows for better risk management and an improved long-run investor experience.
AVERAGE ANNUAL TOTAL RETURNS AS OF 12/31/2015 AQR MANAGED FUTURES STRATEGY HV FUND | ||||||||||||
| 1 Year | Since Inception | Date of Inception | ||||||||||
| Fund - Class I: QMHIX | 2.48% | 10.24% | 7/16/2013 | |||||||||
| Fund - Class N: QMHNX | 2.19% | 9.94% | 7/16/2013 | |||||||||
| Fund - Class R6: QMHRX | 2.54% | 16.85% | 9/2/2014 | |||||||||
| BofA Merrill Lynch 3-Month U.S. Treasury Bill IndexSM | 0.05% | |||||||||||
Past performance does not guarantee future results. Investment results and principal value of an investment will fluctuate so that an investor’s shares, when redeemed, may be worth more or less than their original cost. Current performance may be lower or higher than the performance data quoted. As of the latest prospectus, the gross expense ratio for the Fund’s Class I/N/R6 shares are 1.79%, 2.15% and 1.71%, respectively. Call 1-866-290-2688 or visit www.aqrfunds.com for current month-end performance.
| AQR Funds | Annual Report | December 2015 | ||||||||||||||
17
Table of Contents
Shareholder Letter (Unaudited)
| AQR MANAGED FUTURES STRATEGY HV FUND |
| AQR MANAGED FUTURES STRATEGY HV FUND VS. BOFA MERRILL LYNCH 3-MONTH U.S. TREASURY BILL INDEXSM VALUE OF $10,000 INVESTED ON 07/16/2013 | ||||
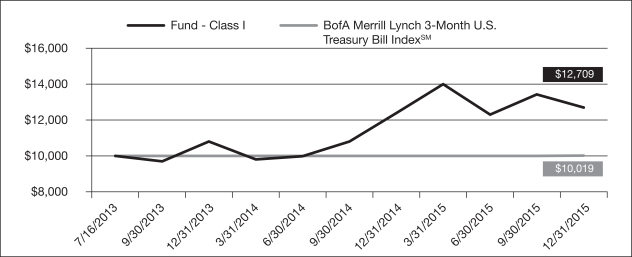
The chart above represents historical performance of a hypothetical investment of $10,000 in the Fund over the past ten years (or since inception if shorter). Performance data quoted represents past performance and does not guarantee future results. Returns shown are total returns, which assume the reinvestment of dividends and capital gains. The table and graph presented above do not reflect the deduction of taxes a shareholder would pay on fund distributions or the redemption of fund shares.
| AQR Funds | Annual Report | December 2015 | ||||||||||||||
18
Table of Contents
Shareholder Letter (Unaudited)
| AQR MULTI-STRATEGY ALTERNATIVE FUND |
John Liew
Founding Principal
Jacques Friedman
Principal
Ronen Israel
Principal
Lars Nielsen
Principal
Mark Mitchell, Ph.D.
Founding Principal, CNH Partners
Todd Pulvino, Ph.D.
Founding Principal, CNH Partners
Dear Shareholder:
The AQR Multi-Strategy Alternative Fund’s (the “Fund”) Class I shares returned 9.25% in 2015. For the year, the Fund realized 7.9% annualized daily volatility and a 0.0 correlation to equities. The Fund’s benchmark, the BofA Merrill Lynch 3-Month U.S. Treasury Bill IndexSM, had a slight positive return of 0.05%. The hedge fund industry, as measured by its representative indices, also posted modest losses, with the Credit Suisse Hedge Fund IndexSM (“CS Index”) gaining -0.70% and the HFRITM Fund Weighted Composite Index (“HFRI Index”) gaining -1.02% net of fees for the year. These indices had monthly correlations to global equities, as represented by the MSCI World Index**, of 0.7 and 0.9, respectively in the past 24 months.
Eight of the Fund’s nine strategies had positive results for the year. Stock selection strategies in aggregate were the largest source of profits, particularly the Dedicated Short Bias strategy. The Arbitrage and Macro strategy groups also contributed positively.
Following is a more detailed review of the performance of the categories with notable contributions.
Stock Selection Strategies – Dedicated Short Bias (+5.1%), Equity Market Neutral (+1.7%) and Long/Short Equity (+0.7%) were all strong contributors. The net effect of the directional components of Long/Short Equity and Dedicated Short Bias was slightly down (-0.2%), with the remaining stock selection gains all coming from market neutral themes within the three strategies. Nearly all of the underlying themes produced gains for the year. The largest thematic contributions, in descending order of magnitude, were investor sentiment, growth, high-risk, and valuation.
Event Driven (+1.0%) – Gains from mergers were not concentrated in any particular deal but rather were the product of numerous relatively small gains. In fact, the largest profit from any deal (Lorillard/Reynolds) was less than +0.2%. Gains from mergers were a function of a low rate of deal cancellations (10 of 237) and healthy median annualized spreads in the portfolio throughout the year, averaging about 8%. Relatively wide spreads were partially explained by the perception of increased regulatory risk. In this past year, deal volume increased 81% to a total volume of $880 billion, led by a number of “mega-deals”. These deals may have contributed to larger spreads as the arbitrage community may not have had the capacity or willingness to totally absorb their impact. Due to the low rate of deal cancellations, there were very few portfolio holdings that produced meaningful losses. In fact, Office Depot/Staples, a not-quite-dead-yet deal that was announced in February, lost -0.3% in 2015 and no other deal even lost half as much.
Managed Futures (+0.6%) – Trend following was profitable across asset classes with the exception of equity indices but short positioning across commodities, the result of both longer- and shorter-term trend signals, was virtually the sole driver of performance. Within commodities, energy contracts themselves produced +1.4% in gains, as WTI and Brent crude oil declined -30% and -35%, respectively, while industrial metals led by copper (-26.1%) produced smaller gains, and grains produced small losses while precious metals, softs and livestock were all relatively flat on the year. Equity indices lessened strategy gains by -0.5%, driven by fourth quarter losses as shorter-term trend signals struggled with indices that had dropped sharply in the third quarter and reversed course in October and November. Fixed income and currencies produced very modest gains.
| ** | MSCI makes no express or implied warranties or representations and shall have no liability whatsoever with respect to any MSCI data contained herein. The MSCI data may not be further redistributed or used as a basis for other indices or any securities or financial products. This report is not approved, reviewed, or produced by MSCI. |
| AQR Funds | Annual Report | December 2015 | ||||||||||||||
19
Table of Contents
Shareholder Letter (Unaudited)
| AQR MULTI-STRATEGY ALTERNATIVE FUND |
AVERAGE ANNUAL TOTAL RETURNS AS OF 12/31/2015 AQR MULTI-STRATEGY ALTERNATIVE FUND | ||||||||||||||||
| 1 Year | 3 Year | Since Inception | Date of Inception | |||||||||||||
| Fund - Class I: ASAIX | 9.25% | 6.99% | 4.59% | 7/18/2011 | ||||||||||||
| Fund - Class N: ASANX | 9.02% | 6.72% | 4.34% | 7/18/2011 | ||||||||||||
| Fund - Class R6: QSARX | 9.33% | * | na | 11.97% | 9/2/2014 | |||||||||||
| BofA Merrill Lynch 3-Month U.S. Treasury Bill IndexSM | 0.05% | |||||||||||||||
Past performance does not guarantee future results. Investment results and principal value of an investment will fluctuate so that an investor’s shares, when redeemed, may be worth more or less than their original cost. Current performance may be lower or higher than the performance data quoted. As of the latest prospectus, the gross expense ratio for the Fund’s Class I/N/R6 shares are 3.68%, 3.97% and 3.23%, respectively. Call 1-866-290-2688 or visit www.aqrfunds.com for current month-end performance
| * | Total return information is based on net asset values calculated for shareholder transactions. Certain adjustments were made to the net assets of the Fund at 12/31/2015 for financial reporting purposes, and as a result, the net asset values for shareholder transactions and the total returns based on those net asset values differ from the adjusted net asset values and total returns for financial reporting. |
| AQR MULTI-STRATEGY ALTERNATIVE FUND VS. BOFA MERRILL LYNCH 3-MONTH U.S. TREASURY BILL INDEXSM VALUE OF $10,000 INVESTED ON 07/18/2011 | ||||
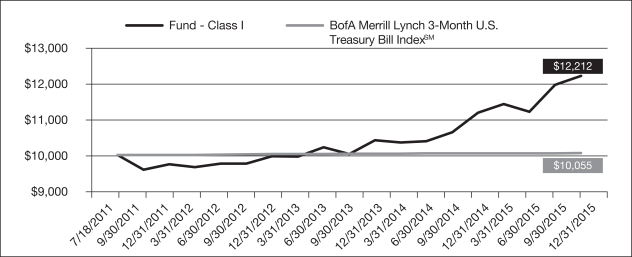
The chart above represents historical performance of a hypothetical investment of $10,000 in the Fund over the past ten years (or since inception if shorter). Performance data quoted represents past performance and does not guarantee future results. Returns shown are total returns, which assume the reinvestment of dividends and capital gains. The table and graph presented above do not reflect the deduction of taxes a shareholder would pay on fund distributions or the redemption of fund shares.
| AQR Funds | Annual Report | December 2015 | ||||||||||||||
20
Table of Contents
Shareholder Letter (Unaudited)
| AQR RISK-BALANCED COMMODITIES STRATEGY FUND |
Brian Hurst
Principal
Yao Hua Ooi
Principal
Ari Levine
Managing Director
Dear Shareholder:
The AQR Risk Balanced Commodities Fund’s (the “Fund”) Class I shares returned -19.48% in 2015, as commodities across the board experienced extreme sell-offs. Energies, in particular, exhibited significant declines, as West Texas Intermediate (“WTI”) and Brent crude fell -44% and -45%, respectively. The protracted decline was driven primarily by continued supply concerns as OPEC maintained its current production quota, U.S. inventory levels increased more than expected, and Russian production rose to a multi-decade high. Natural gas dropped -39% mainly on warmer weather. In addition, concerns about weaker demand, particularly in China, also fueled the decline in energies. Grains fell throughout 2015 on beneficial weather, diminishing export estimates, and a stronger dollar. Base metals also sold off, as copper and aluminum fell -25% and -22%, respectively. Continued demand weakness in China (the biggest user of industrial metals), which saw volatile financial markets and bearish economic data, contributed to losses in the sector. Precious metals declined in 2015 on US interest rate hikes by the Federal Reserve and a stronger dollar.
While the Class I shares declined -19.48% in 2015, the Fund’s benchmark, the Bloomberg Commodity IndexSM (“BCOM”) declined -24.66%, for an outperformance of 5.18% relative to the benchmark. This brings our three-year outperformance to 0.17% annualized, and our since inception underperformance to -0.07% annualized. We expect the Fund to outperform traditional passive indices over the long term, but in any given year we expect the Fund to average a sizable tracking error of about 10% per year to its benchmark.
The outperformance in 2015 relative to the passive BCOM benchmark was due to a number of fund features. The largest source of outperformance was our drawdown control process, which reduced the Fund’s long-run risk target throughout 2015 as all sectors declined. Although the Fund’s risk-targeted allocation detracted from relative performance since an average net exposure of greater than 100% is entailed in order to target steady volatility, this effect was mitigated by the Fund’s drawdown control process. Tactical models also contributed to relative performance, with gains driven primarily by bearish views on commodities as a whole. Another source of outperformance is the Fund’s risk-balanced strategic allocation, which is less exposed to energies than the passive benchmark. Given the significant declines in energies in 2015, the Fund’s sector allocation contributed significantly to relative outperformance.
The Fund began the year at a volatility target of 9.6%, reflecting a lowered strategic risk target due to drawdown control. Ultimately, at year-end, the volatility target of the Fund was 11.4%, reflecting both drawdown control and bearish tactical views on commodities.
The strategic portion of the portfolio returned -21.2% while tactical tilts added +1.8%. The strategic return in this attribution is the return to a long-only portfolio with risk-balanced sector weights and an annual volatility target of 18%. The tactical returns are the active returns to commodity over- and underweights relative to this strategic portfolio.
The main contributors to tactical performance were our bearish views across most sectors. Generally, fundamental and technical signals were bearish on commodities throughout 2015, when the asset class declined significantly across the board. In addition, within agricultural commodities, value and risk-premia metrics underweighted wheat, contributing meaningfully to performance, particularly in January, as wheat underperformed the sector.
At year-end, the Fund’s tactical positioning reflected bearish views on commodities as a whole due to technical and fundamental weakness. Specifically, trend-following signals contributed to underweights given the poor performance of the asset class in 2015. The Fund finished its third full year with unfortunately poor absolute returns. However, the Fund’s risk-balanced and active approach helped it to outperform the BCOM benchmark. While short term results can be noisy, in the long term we believe the Fund’s broader diversification, strong risk management and active commodity selection can ultimately deliver more steady volatility and strong returns across market environments.
| AQR Funds | Annual Report | December 2015 | ||||||||||||||
21
Table of Contents
Shareholder Letter (Unaudited)
| AQR RISK-BALANCED COMMODITIES STRATEGY FUND |
AVERAGE ANNUAL TOTAL RETURNS AS OF 12/31/2015 AQR RISK-BALANCED COMMODITIES STRATEGY FUND | ||||||||||||||||
| 1 Year | 3 Year | Since Inception | Date of Inception | |||||||||||||
| Fund - Class I: ARCIX | -19.48% | -17.12% | -15.26% | 7/9/2012 | ||||||||||||
| Fund - Class N: ARCNX | -19.74% | -17.33% | -15.48% | 7/9/2012 | ||||||||||||
| Fund - Class R6: QRCRX | -19.46% | na | -27.30% | 9/2/2014 | ||||||||||||
| Bloomberg Commodity IndexSM | -24.66% | |||||||||||||||
Past performance does not guarantee future results. Investment results and principal value of an investment will fluctuate so that an investor’s shares, when redeemed, may be worth more or less than their original cost. Current performance may be lower or higher than the performance data quoted. As of the latest prospectus, the gross expense ratio for the Fund’s Class I/N/R6 shares are 1.40%, 1.65% and 1.38%, respectively. Call 1-866-290-2688 or visit www.aqrfunds.com for current month-end performance.
| AQR RISK-BALANCED COMMODITIES STRATEGY FUND VS. BLOOMBERG COMMODITY INDEXSM VALUE OF $10,000 INVESTED ON 07/09/2012 | ||||
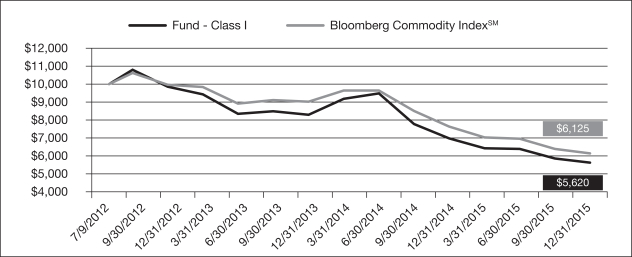
The chart above represents historical performance of a hypothetical investment of $10,000 in the Fund over the past ten years (or since inception if shorter). Performance data quoted represents past performance and does not guarantee future results. Returns shown are total returns, which assume the reinvestment of dividends and capital gains. The table and graph presented above do not reflect the deduction of taxes a shareholder would pay on fund distributions or the redemption of fund shares.
| AQR Funds | Annual Report | December 2015 | ||||||||||||||
22
Table of Contents
Shareholder Letter (Unaudited)
| AQR RISK PARITY FUND |
John Liew
Founding Principal
Brian Hurst
Principal

Michael Mendelson
Principal
Yao Hua Ooi
Principal

John J. Huss
Managing Director
Dear Shareholder:
Through the use of derivatives such as futures and swaps, the AQR Risk Parity Fund (the “Fund”) invests across a wide variety of global markets – including developed- and emerging-market equities, nominal and inflation-linked government bonds, commodities, global credit, and emerging currencies – in an attempt to build a truly diversified portfolio where all markets matter, but no one market matters too much. Risk parity investing involves allocating to investments by risk, which means that instruments with less risk will generally be allocated more capital than instruments that are deemed riskier. As markets move through different risk regimes, the portfolio is dynamically adjusted with the goal of keeping overall portfolio risk and the balance of risk across asset classes fairly steady through time. We believe this leads to more consistent results, reduces tail risks, and enables the investor to remain invested through difficult market environments. In addition to adjusting position sizes to control for increasing or decreasing risk expectations, we also overlay modest portfolio tilts based on AQR’s proprietary expected-return models, which include signals based on carry, momentum, valuation and other important economic variables. These tilts allow the portfolio to get over- and underweight a broad array of global markets. The ultimate goal is to build a portfolio that in the long run will deliver higher returns at a risk level similar to that of traditional portfolios by combining a better asset allocation with return-boosting tactical tilts.
The Fund is expected to remain long all of the markets in which it invests while averaging a moderate (below 0.5 on average) beta to the stock market over a full market cycle. The targeted annualized volatility for the Fund is 10%, on average, which varies modestly over time based on our perceptions of tactical opportunities within the different asset classes it trades. The Fund started the year at slightly above the 10% long-term average as bullish tactical views in equities and fixed income were not fully offset by bearish views in inflation-sensitive assets. By the end of the year the Fund’s volatility was below its long-term target due to bearish tactical views in fixed income, credit, and inflation-sensitive assets coupled with a fund-wide reduction in portfolio volatility as a result of risk management policies.
Total exposures ended the year lower than they began the year, primarily driven by a shift to bearish tactical tilts and the Fund’s risk management policies. Equity volatility rose on the year, peaking in August, causing a reduction in exposures required to target the same level of risk. Volatility in credit rose slightly while volatility in global bonds and commodities remained relatively flat on the year. Despite these changes, the Fund’s beta to the S&P 500® at the end of 2014 and at the end of 2015 was 0.36. For the year ended December 31, 2015, the Fund’s Class I shares returned 8.10% and realized an annualized volatility of 9.1%. During this period, the Fund’s benchmark the BofA Merrill Lynch 3-Month U.S. Treasury Bill IndexSM returned 0.05% and a “60/40 benchmark” consisting of 60% S&P 500®/40% Barclays® U.S. Aggregate Bond Index returned 1.28% at an average realized volatility of 9.1%. The Fund’s net assets across all share classes were over $510 million at the end of 2015. The Fund experienced gains in one of the four major asset class buckets for the full year. To the net total return of -8.10% for 2015, fixed income contributed +0.9%, credit assets detracted -1.0%, equities detracted –1.8%, and inflation-sensitive assets detracted -6.2%. Tactical tilts contributed positively to performance in all asset classes except equities.
Equity risk detracted as markets fell sharply in August and September on concerns over slower Chinese growth and subsequently rebounded as fears eased in the fourth quarter on accommodative European Central Bank (ECB) rhetoric and better than expected economic data. Emerging markets significantly underperformed developed markets as Chinese growth slowed, commodity prices fell, and political uncertainty increased. Nominal bonds contributed over the year. Bond yields were up in most markets on the year, but returns were generally positive due to roll down and carry. Inflation-sensitive assets detracted significantly from the Fund, with losses coming from both commodities and inflation-linked bonds. Commodity markets were down substantially during the period, driven by excess production, weak demand, and a stronger U.S. dollar. Inflation-linked bonds detracted somewhat as inflation expectations fell in tandem with commodities. Credit spreads contributed and emerging currencies detracted on the year. European credit spreads held on to large gains from early in the year when the ECB was more accommodative than expected with its asset purchase program and economic data improved despite a less dovish ECB at the end of the year. U.S. credit spreads eked out small
| AQR Funds | Annual Report | December 2015 | ||||||||||||||
23
Table of Contents
Shareholder Letter (Unaudited)
| AQR RISK PARITY FUND |
gains despite widening spreads. Emerging currencies fell against the dollar, especially the Brazilian Real, which was hurt by lower commodity prices, worse than expected economic data and political uncertainty.
Tactical tilts in equities detracted from performance, driven mostly from trend reversals in the second half of the year. Fixed income active views contributed positively, driven by asset class timing underweights in the second quarter which offset strategic losses, as global bond prices fell. Tactical views in inflation-sensitive assets added significant value as trend-following and fundamental momentum timing signals kept commodities underweight throughout the year. Active tilts in credit assets contributed as bearish asset class timing views in the third quarter helped to mitigate loses. Going forward, the portfolio is tactically underweight in fixed income, credit assets, and inflation-sensitive assets and relatively neutral in equities.
Despite a disappointing year, we stand by our conviction in the Fund’s underlying premises and believe that it is a better long-term asset allocation strategy than a traditional equity-risk-centric allocation. It is inevitable that painful periods of underperformance such as the recent one can occur in a strategy that has a high tracking error to traditional allocations with only a modest (but valuable) edge. The great strength of risk parity is the limited, humble assumptions necessary to believe in the strategy. If you believe that taking market risk in the major asset classes is rewarded on average, that their risk-adjusted returns are more similar than they are different, and that they tend to pay off at somewhat different times, then the case for risk parity is still a sound one. Nothing about the past year (or past few years) would lead us to change our long-term beliefs and going forward, we remain confident that the diversification benefits of a risk parity approach provide a sound allocation for the wide variety of potential market environments we may face in the coming years.
AVERAGE ANNUAL TOTAL RETURNS AS OF 12/31/2015 AQR RISK PARITY FUND | ||||||||||||||||||||
| 1 Year | 3 Year | 5 Year | Since Inception | Date of Inception | ||||||||||||||||
| Fund - Class I: AQRIX | -8.10% | -0.51% | 3.46% | 4.04% | 9/29/2010 | |||||||||||||||
| Fund - Class N: AQRNX | -8.20% | -0.77% | 3.21% | 3.78% | 9/29/2010 | |||||||||||||||
| Fund - Class R6: AQRRX | -8.00% | na | na | -8.89% | 9/2/2014 | |||||||||||||||
| BofA Merrill Lynch 3-Month U.S. Treasury Bill IndexSM | 0.05% | |||||||||||||||||||
| 60% S&P 500®/40% Barclays® U.S. Aggregate Bond Index | 1.28% | |||||||||||||||||||
Past performance does not guarantee future results. Investment results and principal value of an investment will fluctuate so that an investor’s shares, when redeemed, may be worth more or less than their original cost. Current performance may be lower or higher than the performance data quoted. As of the latest prospectus, the gross expense ratio for the Fund’s Class I/N/R6 shares are 0.93%, 1.23% and 0.89%, respectively. Call 1-866-290-2688 or visit www.aqrfunds.com for current month-end performance.
| AQR Funds | Annual Report | December 2015 | ||||||||||||||
24
Table of Contents
Shareholder Letter (Unaudited)
| AQR RISK PARITY FUND |
| AQR RISK PARITY FUND VS. BOFA MERRILL LYNCH 3-MONTH U.S. TREASURY BILL INDEXSM/ 60% S&P 500®/ 40% BARCLAYS® U.S. AGGREGATE BOND INDEX VALUE OF $10,000 INVESTED ON 09/29/2010 | ||||
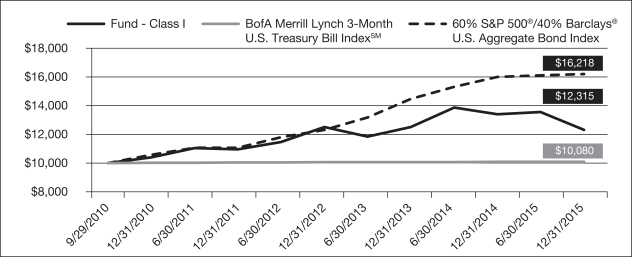
The chart above represents historical performance of a hypothetical investment of $10,000 in the Fund over the past ten years (or since inception if shorter). Performance data quoted represents past performance and does not guarantee future results. Returns shown are total returns, which assume the reinvestment of dividends and capital gains. The table and graph presented above do not reflect the deduction of taxes a shareholder would pay on fund distributions or the redemption of fund shares.
| AQR Funds | Annual Report | December 2015 | ||||||||||||||
25
Table of Contents
Shareholder Letter (Unaudited)
| AQR RISK PARITY II HV FUND |
John Liew
Founding Principal
Brian Hurst
Principal
Michael Mendelson
Principal
Yao Hua Ooi
Principal
John J. Huss
Managing Director
Dear Shareholder:
Through the use of derivatives such as futures and swaps, the AQR Risk Parity II HV Fund (the “Fund”) invests across a wide variety of global markets – including developed- and emerging-market equities, nominal and inflation-linked government bonds, and commodities – in an attempt to build a truly diversified portfolio where all markets matter, but no one market matters too much. Risk parity investing involves allocating to investments by risk, which means that instruments with less risk will generally be allocated more capital than instruments that are deemed riskier. As markets move through different risk regimes, the portfolio is dynamically adjusted with the goal of keeping overall portfolio risk and the balance of risk across asset classes fairly steady through time. We believe this leads to more consistent results, reduces tail risks, and enables the investor to remain invested through difficult market environments. In addition to adjusting position sizes to control for increasing or decreasing risk expectations, we also overlay modest portfolio tilts based on AQR’s proprietary expected-return models, which include signals based on carry, momentum, valuation and other important economic variables. These tilts allow the portfolio to get over- and underweight a broad array of global markets. The ultimate goal is to build a portfolio that in the long run will deliver higher returns at a risk level similar to that of traditional portfolios by combining a better asset allocation with return-boosting tactical tilts.
The Fund is expected to remain long all of the markets in which it invests while averaging a moderate (below 0.7 on average) beta to the stock market over a full market cycle. The targeted annualized volatility for the Fund is 15%, on average, which varies modestly over time based on our perceptions of tactical opportunities within the different asset classes it trades. The Fund started the year close to the 15% long-term average as bullish tactical views in equities and fixed income were offset by bearish views in inflation-sensitive assets. By the end of the year the Fund’s volatility was below its long-term target due to bearish tactical views in fixed income and inflation-sensitive assets coupled with a fund-wide reduction in portfolio volatility as a result of risk management policies.
Total exposures ended the year lower than they began the year, primarily driven by a shift to bearish tactical tilts and the Fund’s risk management policies. Equity volatility rose on the year, peaking in August, causing a reduction in exposures required to target the same level of risk. Volatility in global bonds and commodities remained relatively flat on the year. With these changes, the Fund went from a 0.42 beta versus the S&P 500 Index at the end of 2014 to a 0.35 beta at the end of 2015. For the year ended December 31, 2015, the Fund’s Class I shares returned -13.33% and realized an annualized volatility of 12.7%. During this period, the Fund’s benchmark the BofA Merrill Lynch 3-Month U.S. Treasury Bill IndexSM returned 0.05% and a “60/40 benchmark” consisting of 60% S&P 500®/40% Barclays® U.S. Aggregate Bond Index returned 1.28% at an average realized volatility of 9.1%. The Fund’s net assets across all share classes were over $48 million at the end of 2015. The Fund experienced gains in one of the three major asset class buckets for the full year. To the net total return of -13.33% for 2015, fixed income contributed 1.3%, equities detracted –4.0%, and inflation-sensitive assets detracted -10.6%. Tactical tilts contributed positively to performance in all asset classes except equities.
Equity risk detracted as markets fell sharply in August and September on concerns over slower Chinese growth and subsequently rebounded as fears eased in the fourth quarter on accommodative European Central Bank (ECB) rhetoric and better than expected economic data. Emerging markets significantly underperformed developed markets as Chinese growth slowed, commodity prices fell, and political uncertainty increased. Nominal bonds contributed over the year. Bond yields were up in most markets on the year, but returns were generally positive due to roll down and carry. Inflation-sensitive assets detracted significantly from the Fund, with losses coming from both commodities and inflation-linked bonds. Commodity markets were down substantially during the period, driven by excess production, weak demand, and a stronger U.S. dollar. Inflation-linked bonds detracted somewhat as inflation expectations fell in tandem with commodities.
Tactical tilts in equities detracted from performance, driven mostly from trend reversals in the second half of the year. Fixed income active views contributed positively, driven by asset class timing underweights in the second quarter which offset strategic losses, as global bond prices fell. Tactical
| AQR Funds | Annual Report | December 2015 | ||||||||||||||
26
Table of Contents
Shareholder Letter (Unaudited)
| AQR RISK PARITY II HV FUND |
views in inflation-sensitive assets added significant value as trend-following and fundamental momentum timing signals kept commodities underweight throughout the year. Going forward, the portfolio is tactically underweight in fixed income and inflation-sensitive assets and relatively neutral in equities.
Despite a disappointing year, we stand by our conviction in the Fund’s underlying premises and believe that it is a better long-term asset allocation strategy than a traditional equity-risk-centric allocation. It is inevitable that painful periods of underperformance such as the recent one can occur in a strategy that has a high tracking error to traditional allocations with only a modest (but valuable) edge. The great strength of risk parity is the limited, humble assumptions necessary to believe in the strategy. If you believe that taking market risk in the major asset classes is rewarded on average, that their risk-adjusted returns are more similar than they are different, and that they tend to pay off at somewhat different times, then the case for risk parity is still a sound one. Nothing about the past year (or past few years) would lead us to change our long-term beliefs and going forward, we remain confident that the diversification benefits of a risk parity approach provide a sound allocation for the wide variety of potential market environments we may face in the coming years.
AVERAGE ANNUAL TOTAL RETURNS AS OF 12/31/2015 AQR RISK PARITY II HV FUND | ||||||||||||||||
| 1 Year | 3 Year | Since Inception | Date of Inception | |||||||||||||
| Fund - Class I: QRHIX | -13.33% | -2.74% | -1.86% | 11/5/2012 | ||||||||||||
| Fund - Class N: QRHNX | -13.64% | -3.02% | -2.15% | 11/5/2012 | ||||||||||||
| Fund - Class R6: QRHRX | -13.42% | na | -13.74% | 9/2/2014 | ||||||||||||
| BofA Merrill Lynch U.S. 3-Month Treasury Bill IndexSM | 0.05% | |||||||||||||||
| 60% S&P 500®/40% Barclays® U.S. Aggregate Bond Index | 1.28% | |||||||||||||||
Past performance does not guarantee future results. Investment results and principal value of an investment will fluctuate so that an investor’s shares, when redeemed, may be worth more or less than their original cost. Current performance may be lower or higher than the performance data quoted. As of the latest prospectus, the gross expense ratio for the Fund’s Class I/N/R6 shares are 1.57%, 1.89% and 1.50%, respectively. Call 1-866-290-2688 or visit www.aqrfunds.com for current month-end performance.
| AQR Funds | Annual Report | December 2015 | ||||||||||||||
27
Table of Contents
Shareholder Letter (Unaudited)
| AQR RISK PARITY II HV FUND |
| AQR RISK PARITY II HV FUND VS. BOFA MERRILL LYNCH 3-MONTH U.S. TREASURY BILL INDEXSM/ 60% S&P 500®/ 40% BARCLAYS® U.S. AGGREGATE BOND INDEX VALUE OF $10,000 INVESTED ON 11/05/2012 |
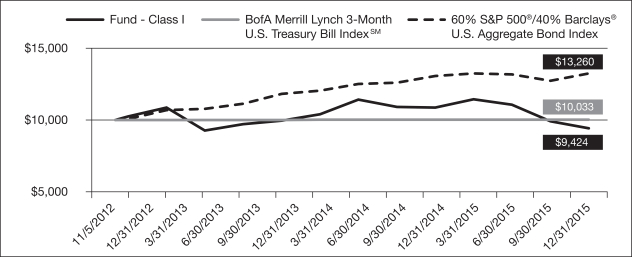
The chart above represents historical performance of a hypothetical investment of $10,000 in the Fund over the past ten years (or since inception if shorter). Performance data quoted represents past performance and does not guarantee future results. Returns shown are total returns, which assume the reinvestment of dividends and capital gains. The table and graph presented above do not reflect the deduction of taxes a shareholder would pay on fund distributions or the redemption of fund shares.
| AQR Funds | Annual Report | December 2015 | ||||||||||||||
28
Table of Contents
Shareholder Letter (Unaudited)
| AQR RISK PARITY II MV FUND |
John Liew
Founding Principal
Brian Hurst
Principal
Michael Mendelson
Principal
Yao Hua Ooi
Principal
John J. Huss
Managing Director
Dear Shareholder:
Through the use of derivatives such as futures and swaps, the AQR Risk Parity II MV Fund (the “Fund”) invests across a wide variety of global markets – including developed- and emerging-market equities, nominal and inflation-linked government bonds, and commodities – in an attempt to build a truly diversified portfolio where all markets matter, but no one market matters too much. Risk parity investing involves allocating to investments by risk, which means that instruments with less risk will generally be allocated more capital than instruments that are deemed riskier. As markets move through different risk regimes, the portfolio is dynamically adjusted with the goal of keeping overall portfolio risk and the balance of risk across asset classes fairly steady through time. We believe this leads to more consistent results, reduces tail risks, and enables the investor to remain invested through difficult market environments. In addition to adjusting position sizes to control for increasing or decreasing risk expectations, we also overlay modest portfolio tilts based on AQR’s proprietary expected-return models, which include signals based on carry, momentum, valuation and other important economic variables. These tilts allow the portfolio to get over- and underweight a broad array of global markets. The ultimate goal is to build a portfolio that in the long run will deliver higher returns at a risk level similar to that of traditional portfolios by combining a better asset allocation with return-boosting tactical tilts.
The Fund is expected to remain long all of the markets in which it invests while averaging a moderate (below 0.5 on average) beta to the stock market over a full market cycle. The targeted annualized volatility for the Fund is 10%, on average, which varies modestly over time based on our perceptions of tactical opportunities within the different asset classes it trades. The Fund started the year close to the 10% long-term average as bullish tactical views in equities and fixed income were offset by bearish views in inflation-sensitive assets. By the end of the year the Fund’s volatility was below its long-term target due to bearish tactical views in fixed income and inflation-sensitive assets coupled with a fund-wide reduction in portfolio volatility as a result of risk management policies.
Total exposures ended the year lower than they began the year, primarily driven by a shift to bearish tactical tilts and the Fund’s risk management policies. Equity volatility rose on the year, peaking in August, causing a reduction in exposures required to target the same level of risk. Volatility in global bonds and commodities remained relatively flat on the year. Despite these changes, the Fund’s beta to the S&P 500® at the end of 2014 and at the end of 2015 was 0.27. For the year ended December 31, 2015, the Fund’s Class I shares returned -8.77% and realized an annualized volatility of 8.6%. During this period, the Fund’s benchmark the BofA Merrill Lynch 3-Month U.S. Treasury Bill IndexSM returned 0.05% and a “60/40 benchmark” consisting of 60% S&P 500®/40% Barclays® U.S. Aggregate Bond Index returned 1.28% at an average realized volatility of 9.1%. The Fund’s net assets across all share classes were over $90 million at the end of 2015. The Fund experienced gains in one of the three major asset class buckets for the full year. To the net total return of -8.77% for 2015, fixed income contributed +0.9%, equities detracted –2.5%, and inflation-sensitive assets detracted -7.2%. Tactical tilts contributed positively to performance in all asset classes except equities.
Equity risk detracted as markets fell sharply in August and September on concerns over slower Chinese growth and subsequently rebounded as fears eased in the fourth quarter on accommodative European Central Bank (ECB) rhetoric and better than expected economic data. Emerging markets significantly underperformed developed markets as Chinese growth slowed, commodity prices fell, and political uncertainty increased. Nominal bonds contributed over the year. Bond yields were up in most markets on the year, but returns were generally positive due to roll down and carry. Inflation-sensitive assets detracted significantly from the Fund, with losses coming from both commodities and inflation-linked bonds. Commodity markets were down substantially during the period, driven by excess production, weak demand, and a stronger U.S. dollar. Inflation-linked bonds detracted somewhat as inflation expectations fell in tandem with commodities.
Tactical tilts in equities detracted from performance, driven mostly from trend reversals in the second half of the year. Fixed income active views contributed positively, driven by asset class timing underweights in the second quarter which offset strategic losses, as global bond prices fell. Tactical views in inflation-sensitive assets added significant value as trend-following and fundamental
| AQR Funds | Annual Report | December 2015 | ||||||||||||||
29
Table of Contents
Shareholder Letter (Unaudited)
| AQR RISK PARITY II MV FUND |
momentum timing signals kept commodities underweight throughout the year. Going forward, the portfolio is tactically underweight in fixed income and inflation-sensitive assets and relatively neutral in equities.
Despite a disappointing year, we stand by our conviction in the Fund’s underlying premises and believe that it is a better long-term asset allocation strategy than a traditional equity-risk-centric allocation. It is inevitable that painful periods of underperformance such as the recent one can occur in a strategy that has a high tracking error to traditional allocations with only a modest (but valuable) edge. The great strength of risk parity is the limited, humble assumptions necessary to believe in the strategy. If you believe that taking market risk in the major asset classes is rewarded on average, that their risk-adjusted returns are more similar than they are different, and that they tend to pay off at somewhat different times, then the case for risk parity is still a sound one. Nothing about the past year (or past few years) would lead us to change our long-term beliefs and going forward, we remain confident that the diversification benefits of a risk parity approach provide a sound allocation for the wide variety of potential market environments we may face in the coming years.
AVERAGE ANNUAL TOTAL RETURNS AS OF 12/31/2015 AQR RISK PARITY II MV FUND | ||||||||||||||||
| 1 Year | 3 Year | Since Inception | Date of Inception | |||||||||||||
| Fund - Class I: QRMIX | -8.77% | -1.51% | -0.88% | 11/5/2012 | ||||||||||||
| Fund - Class N: QRMNX | -8.94% | -1.75% | -1.14% | 11/5/2012 | ||||||||||||
| Fund - Class R6: QRMRX | -8.59% | na | -8.97% | 9/2/2014 | ||||||||||||
| BofA Merrill Lynch 3-Month U.S. Treasury Bill IndexSM | 0.05% | |||||||||||||||
| 60% S&P 500®/40% Barclays® U.S. Aggregate Bond Index | 1.28% | |||||||||||||||
Past performance does not guarantee future results. Investment results and principal value of an investment will fluctuate so that an investor’s shares, when redeemed, may be worth more or less than their original cost. Current performance may be lower or higher than the performance data quoted. As of the latest prospectus, the gross expense ratio for the Fund’s Class I/N/R6 shares are 1.15%, 1.47% and 1.06%, respectively. Call 1-866-290-2688 or visit www.aqrfunds.com for current month-end performance.
| AQR Funds | Annual Report | December 2015 | ||||||||||||||
30
Table of Contents
Shareholder Letter (Unaudited)
| AQR RISK PARITY II MV FUND |
| AQR RISK PARITY II MV FUND VS. BOFA MERRILL LYNCH 3-MONTH U.S. TREASURY BILL INDEXSM/ 60% S&P 500®/ 40% BARCLAYS® U.S. AGGREGATE BOND INDEX VALUE OF $10,000 INVESTED ON 11/05/2012 |
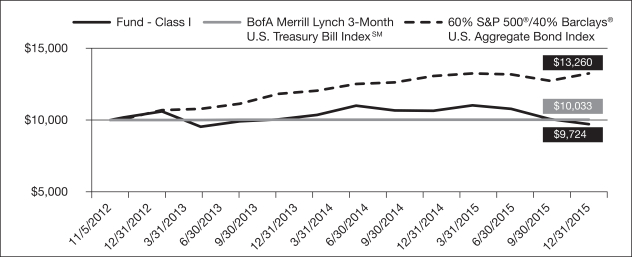
The chart above represents historical performance of a hypothetical investment of $10,000 in the Fund over the past ten years (or since inception if shorter). Performance data quoted represents past performance and does not guarantee future results. Returns shown are total returns, which assume the reinvestment of dividends and capital gains. The table and graph presented above do not reflect the deduction of taxes a shareholder would pay on fund distributions or the redemption of fund shares.
| AQR Funds | Annual Report | December 2015 | ||||||||||||||
31
Table of Contents
Shareholder Letter (Unaudited)
| AQR STYLE PREMIA ALTERNATIVE FUND |
Jacques Friedman
Principal
Ronen Israel
Principal
Andrea Frazzini
Principal
Michael Katz
Principal
Dear Shareholder:
The AQR Style Premia Alternative Fund (the “Fund”), which targets 10% annual volatility, returned 8.76% (Class I shares) in 2015. The Fund’s benchmark, the BofA Merrill Lynch 3-Month U.S. Treasury Bill IndexSM, had a slight positive return of 0.05% over this period. We invest long and short across six different asset groups: stocks of major developed markets, country indices, bond futures, interest rate futures, currencies and commodities. We employ market-neutral, long-short strategies across these asset groups based on four investment styles:
Value – the tendency for relatively cheap assets to outperform relatively expensive ones
Momentum – the tendency for an asset’s recent relative performance to continue in the future
Carry – the tendency for higher-yielding assets to provide higher returns than lower-yielding assets
Defensive – the tendency for lower-risk and higher-quality assets to generate higher risk-adjusted returns
Each of these styles have historically had low correlations to one another, so we expect them to be profitable at different times for different reasons. Thus, a portfolio combining all four of them seeks to benefit from their expected low correlations to one another and could help provide a more robust, dependable stream of returns.
Two of the Fund’s four styles had positive results for the period. Defensive was the top contributor, with gains coming primarily from stock & industry selection. Value also contributed with profits in equity indices, commodities, and fixed income. Momentum and Carry detracted from performance. Momentum detracted in fixed income, equity indices, and commodities but produced partially offsetting gains from stocks & industry selection. Carry detracted in commodities and currencies.
Positive performance was almost entirely driven by stocks and industries while commodities also contributed meaningfully. Currencies, fixed income, and to a lesser degree equity indices detracted, offsetting some of the gains. Gains in stocks & industries were largely driven by gains from Defensive but Momentum also contributed. Offsetting some of these gains were losses from Value. Commodity gains were solely due to Value as Momentum and Carry both detracted. Losses in currencies came from Carry and Value while Momentum was flat. Conversely, losses in fixed income came from Momentum which were offset by gains in Carry, Value and Defensive.
AVERAGE ANNUAL TOTAL RETURNS AS OF 12/31/2015 AQR STYLE PREMIA ALTERNATIVE FUND | ||||||||||||
| 1 Year | Since Inception | Date of Inception | ||||||||||
| Fund - Class I: QSPIX | 8.76% | 11.23% | 10/30/2013 | |||||||||
| Fund - Class N: QSPNX | 8.50% | 10.99% | 10/30/2013 | |||||||||
| Fund - Class R6: QSPRX | 8.80% | 12.65% | 9/2/2014 | |||||||||
| BofA Merrill Lynch 3-Month U.S. Treasury Bill IndexSM | 0.05% | |||||||||||
Past performance does not guarantee future results. Investment results and principal value of an investment will fluctuate so that an investor’s shares, when redeemed, may be worth more or less than their original cost. Current performance may be lower or higher than the performance data quoted. As of the latest prospectus, the gross expense ratio for the Fund’s Class I/N/R6 shares are 2.61%, 2.97% and 2.62%, respectively. Call 1-866-290-2688 or visit www.aqrfunds.com for current month-end performance.
| AQR Funds | Annual Report | December 2015 | ||||||||||||||
32
Table of Contents
Shareholder Letter (Unaudited)
| AQR STYLE PREMIA ALTERNATIVE FUND |
| AQR STYLE PREMIA ALTERNATIVE FUND VS. BOFA MERRILL LYNCH 3-MONTH U.S. TREASURY BILL INDEXSM VALUE OF $10,000 INVESTED ON 10/30/2013 |
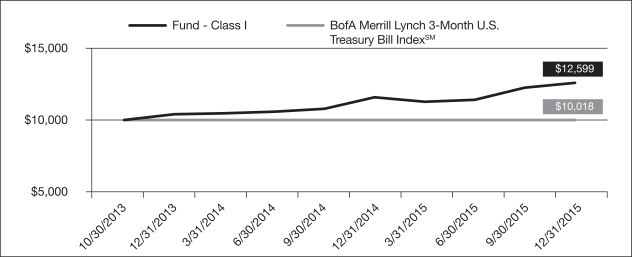
The chart above represents historical performance of a hypothetical investment of $10,000 in the Fund over the past ten years (or since inception if shorter). Performance data quoted represents past performance and does not guarantee future results. Returns shown are total returns, which assume the reinvestment of dividends and capital gains. The table and graph presented above do not reflect the deduction of taxes a shareholder would pay on fund distributions or the redemption of fund shares.
| AQR Funds | Annual Report | December 2015 | ||||||||||||||
33
Table of Contents
Shareholder Letter (Unaudited)
| AQR STYLE PREMIA ALTERNATIVE LV FUND |
Jacques Friedman
Principal
Ronen Israel
Principal
Andrea Frazzini
Principal
Michael Katz
Principal
Dear Shareholder:
The AQR Style Premia Alternative LV Fund (the “Fund”), which targets 5% annual volatility, returned 4.02% (Class I shares) in 2015. The Fund’s benchmark, the BofA Merrill Lynch 3-Month U.S Treasury Bill IndexSM, had a slight positive return of 0.05% over this period. We invest long and short across six different asset groups: stocks of major developed markets, country indices, bond futures, interest rate futures, currencies and commodities. We employ market-neutral, long-short strategies across these asset groups based on four investment styles:
Value – the tendency for relatively cheap assets to outperform relatively expensive ones
Momentum – the tendency for an asset’s recent relative performance to continue in the future
Carry – the tendency for higher-yielding assets to provide higher returns than lower-yielding assets
Defensive – the tendency for lower-risk and higher-quality assets to generate higher risk-adjusted returns
Each of these styles have historically had low correlations to one another, so we expect them to be profitable at different times for different reasons. Thus, a portfolio combining all four of them seeks to benefit from their expected low correlations to one another and could help provide a more robust, dependable stream of returns.
Two of the Fund’s four styles had positive results for the period. Defensive was the top contributor, with gains coming primarily from stock & industry selection. Value also contributed with profits in equity indices, commodities, and fixed income. Momentum and Carry detracted from performance. Momentum detracted in fixed income, equity indices, and commodities but produced partially offsetting gains from stocks & industry selection. Carry detracted in commodities and currencies.
Positive performance was almost entirely driven by stocks and industries while commodities also contributed. Currencies and fixed income detracted, offsetting some of the gains. Gains in stocks & industries were largely driven by gains from Defensive but Momentum also contributed meaningfully. Offsetting some of these gains were losses from Value. Commodity gains were solely due to Value as Momentum and Carry both detracted. Losses in currencies came from Carry and Value while Momentum was flat. Conversely, losses in fixed income came from Momentum which were offset by gains in Carry, Value and Defensive.
AVERAGE ANNUAL TOTAL RETURNS AS OF 12/31/2015 AQR STYLE PREMIA ALTERNATIVE LV FUND | ||||||||||||
| 1 Year | Since Inception | Date of Inception | ||||||||||
| Fund - Class I: QSLIX | 4.02% | 5.56% | 9/17/2014 | |||||||||
| Fund - Class N: QSLNX | 3.85% | 5.32% | 9/17/2014 | |||||||||
| Fund - Class R6: QSLRX | 4.23% | 5.65% | 9/17/2014 | |||||||||
| BofA Merrill Lynch 3-Month U.S. Treasury Bill IndexSM | 0.05% | |||||||||||
Past performance does not guarantee future results. Investment results and principal value of an investment will fluctuate so that an investor’s shares, when redeemed, may be worth more or less than their original cost. Current performance may be lower or higher than the performance data quoted. As of the latest prospectus, the gross expense ratio for the Fund’s Class I/N/R6 shares are 1.54%, 1.97% and 1.80%, respectively. Call 1-866-290-2688 or visit www.aqrfunds.com for current month-end performance.
| AQR Funds | Annual Report | December 2015 | ||||||||||||||
34
Table of Contents
Shareholder Letter (Unaudited)
| AQR STYLE PREMIA ALTERNATIVE LV FUND |
| AQR STYLE PREMIA ALTERNATIVE LV FUND VS. BOFA MERRILL LYNCH 3-MONTH U.S. TREASURY BILL INDEXSM VALUE OF $10,000 INVESTED ON 09/17/2014 |
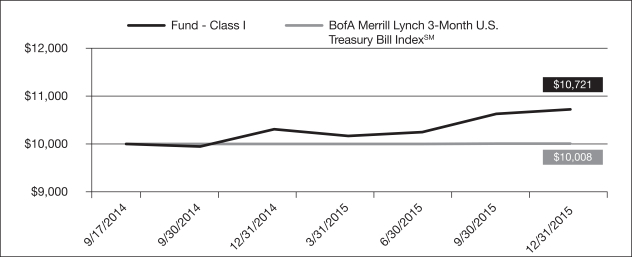
The chart above represents historical performance of a hypothetical investment of $10,000 in the Fund over the past ten years (or since inception if shorter). Performance data quoted represents past performance and does not guarantee future results. Returns shown are total returns, which assume the reinvestment of dividends and capital gains. The table and graph presented above do not reflect the deduction of taxes a shareholder would pay on fund distributions or the redemption of fund shares.
| AQR Funds | Annual Report | December 2015 | ||||||||||||||
35
Table of Contents
Shareholder Letter (Unaudited)
RISK FACTORS:
AQR Diversified Arbitrage Fund: As the Fund employs arbitrage and alternative strategies, the Fund has the risk that the anticipated opportunites do not play out as planned, resulting in potentially reduced returns or losses to the Fund as it unwinds its trades. This Fund enters into a short sale by selling a security it has borrowed. If the market price of a security increases after the Fund borrows the security, the Fund will suffer a potentially unlimited loss when it replaces the borrowed security at the higher price. The Fund may also take a short position in a derivative instrument, which involves the risk of theoretically unlimited increase in the value of the underlying instrument. Short sales also involve transaction and other costs that will reduce potential Fund gains and increase potential Fund losses. The use of derivatives, including forward and futures contracts and swap agreements, exposes the Fund to additional risks including increased volatility, lack of liquidity, and possible losses greater than the Fund’s initial investment as well as increased transaction costs. Derivative contracts involve exposure to counterparty credit risks, which refers to the possibility that the counterparty to a derivative instrument will not be able to make principal and interest payments when due. When investing in or gaining exposure to bonds, yield and share price will vary with changes in interest rates and market conditions. The Fund may lose money if short-term or long-term interest rates rise sharply or otherwise change in a manner not anticipated by the Fund’s Adviser or Sub-Adviser. There is also a chance that some of a Fund’s holdings may have their credit rating downgraded or may default. The Fund may invest in securities rated below investment grade which are high risk investments that may cause income and principal losses for the Fund. The Fund may invest in illiquid instruments which may be difficult to sell in a timely manner at the price that it believes the investments are worth. Emerging market and foreign investing involves special risks such as currency fluctuations, political uncertainty, differences in generally accepted accounting principles, increased volatility and lower trading volume. This Fund is not suitable for all investors.
AQR Global Macro Fund: The use of derivatives, including forward and futures contracts, options and swap agreements and exposure to the commodities markets, exposes the Fund to additional risks including increased volatility, lack of liquidity, and possible losses greater than the Fund’s initial investment as well as increased transaction costs. Derivative contracts involve exposure to counterparty credit risk, which refers to the possibility that the counterparty to a derivative instrument will not be able to make principal and interest payments when due. The Fund may take a short position in a derivative instrument, which involves the risk of a theoretically unlimited increase in the value of the underlying instrument. When investing in or gaining exposure to bonds, yield and share price will vary with changes in interest rates and market conditions. The Fund may lose money if short-term or long-term interest rates rise sharply or otherwise change in a manner not anticipated by the Fund’s Adviser. There is also a chance that some of the Fund’s holdings may have their credit rating downgraded or may default. The Fund may have exposure to the securities of small and mid-cap companies, the prices of which are generally more volatile than those of larger capitalization companies. Emerging market and foreign investing involves special risks such as currency fluctuations, political uncertainty, differences in generally accepted accounting principles, increased volatility and lower trading volume. This Fund is not suitable for all investors.
AQR Long-Short Equity Fund and AQR Equity Market Neutral Fund: The use of derivatives, including futures and forward contracts, options and swap agreements, exposes the Funds to additional risks including increased volatility, lack of liquidity, and possible losses greater than a Fund’s initial investment as well as increased transaction costs. Derivative contracts involve exposure to counterparty credit risks, which refers to the possibility that the counterparty to a derivative instrument will not be able to make principal and interest payments when due. A Fund enters into a short sale by selling a security it has borrowed. If the market price of a security increases after the Fund borrows the security, the Fund will suffer a potentially unlimited loss when it replaces the borrowed security at the higher price. A Fund may also take a short position in a derivative instrument, which involved the risk of theoretically unlimited increase in the value of the underlying instrument. Short sales also involve transaction and other costs that will reduce potential Fund gains and increase potential Fund losses. The Funds may have exposure to the securities of small or mid-cap companies, the prices of which are generally more volatile than those of larger capitalization companies. Foreign investing involves special risks such as currency fluctuations, political uncertainty, differences in generally accepted accounting principles, increased volatility and lower trading volume. These Funds are not suitable for all investors.
AQR Managed Futures Strategy Fund and AQR Managed Futures Strategy HV Fund: The use of derivatives, including forward and futures contracts, swap agreements and exposure to the commodities markets, exposes the Funds to additional risks including increased volatility, lack of liquidity, and possible losses greater than a Fund’s initial investment as well as increased transaction costs. Derivative contracts involve exposure to counterparty credit risk, which refers to the possibility that the counterparty to a derivative instrument will not be able to make principal and interest payments when due. A Fund may take a short position in a derivative instrument, which involves the risk of a theoretically unlimited increase in the value of the underlying instrument. When investing in or gaining exposure to bonds, yield and share price will vary with changes in interest rates and market conditions. A Fund may lose money if short-term or long-term interest rates rise sharply or otherwise change in a manner not anticipated by the Fund’s Adviser. There is also a chance that some of the Fund’s holdings may have their credit rating downgraded or may default. Emerging market and foreign investing involves special risks such as currency fluctuations,
| AQR Funds | Annual Report | December 2015 | ||||||||||||||
36
Table of Contents
Shareholder Letter (Unaudited)
political uncertainty, differences in generally accepted accounting principles, increased volatility and lower trading volume. These Funds are not suitable for all investors.
AQR Risk-Balanced Commodities Strategy Fund: The use of derivatives, including forward and futures contracts, swap agreements and exposure to the commodities markets, exposes the Fund to additional risks including increased volatility, lack of liquidity, and possible losses greater than the Fund’s initial investment as well as increased transaction costs. Derivative contracts involve exposure to counterparty credit risk, which refers to the possibility that the counterparty to a derivative instrument will not be able to make principal and interest payments when due. The Fund may take a short position in a derivative instrument, which involves the risk of a theoretically unlimited increase in the value of the underlying instrument. When investing in or gaining exposure to bonds, yield and share price will vary with changes in interest rates and market conditions. The Fund may lose money if short-term or long-term interest rates rise sharply or otherwise change in a manner not anticipated by the Fund’s Adviser. There is also a chance that some of the Fund’s holdings may have their credit rating downgraded or may default. Foreign investing involves special risks such as currency fluctuations, political uncertainty, differences in generally accepted accounting principles, increased volatility and lower trading volume. This Fund is not suitable for all investors.
AQR Risk Parity Fund, AQR Risk Parity II MV Fund and AQR Risk Parity II HV Fund: The use of derivatives, including forward and futures contracts, swap agreements and exposure to the commodities markets, exposes the Funds to additional risks including increased volatility, lack of liquidity, and possible losses greater than a Fund’s initial investment as well as increased transaction costs. Derivative contracts involve exposure to counterparty credit risk, which refers to the possibility that the counterparty to a derivative instrument will not be able to make principal and interest payments when due. A Fund may take a short position in a derivative instrument, which involves the risk of a theoretically unlimited increase in the value of the underlying instrument. When investing in or gaining exposure to bonds, yield and share price will vary with changes in interest rates and market conditions. A Fund may lose money if short-term or long-term interest rates rise sharply or otherwise change in a manner not anticipated by the Fund’s Adviser. There is also a chance that some of a Fund’s holdings may have their credit rating downgraded or may default. A Fund may have exposure to the securities of small and mid-cap companies, the prices of which are generally more volatile than those of larger capitalization companies. Emerging market and foreign investing involves special risks such as currency fluctuations, political uncertainty, differences in generally accepted accounting principles, increased volatility and lower trading volume. These Funds are not suitable for all investors.
AQR Multi-Strategy Alternative Fund: The use of derivatives, including forward and futures contracts, swap agreements and exposure to the commodities markets, exposes the Fund to additional risks including increased volatility, lack of liquidity, and possible losses greater than the Fund’s initial investment as well as increased transaction costs. Derivative contracts involve exposure to counterparty credit risk, which refers to the possibility that the counterparty to a derivative instrument will not be able to make principal and interest payments when due. The Fund employs arbitrage and alternative strategies, which carry the risk that the anticipated opportunities do not play out as planned, resulting in potentially reduced returns or losses to the Fund as it unwinds its trades. This Fund enters into a short sale by selling a security it has borrowed. If the market price of a security increases after the Fund borrows the security, the Fund will suffer a potentially unlimited loss when it replaces the borrowed security at the higher price. The Fund may also take a short position in a derivative instrument, which involves the risk of theoretically unlimited increase in the value of the underlying instrument. Short sales also involve transaction and other costs that will reduce potential Fund gains and increase potential Fund losses. The Funds may have exposure to the securities of mid-cap companies, the prices of which are generally more volatile than those of larger capitalization companies. When investing in or gaining exposure to bonds, yield and share price will vary with changes in interest rates and market conditions. The Fund may lose money if short-term or long-term interest rates rise sharply or otherwise change in a manner not anticipated by the Fund’s Adviser or Sub-Adviser. There is also a chance that some of the Fund’s holdings may have their credit rating downgraded or may default. Emerging market and foreign investing involves special risks such as currency fluctuations, political uncertainty, differences in generally accepted accounting principles, increased volatility and lower trading volume. This Fund is not suitable for all investors.
AQR Style Premia Alternative Fund and AQR Style Premia Alternative LV Fund: The use of derivatives, including futures and forward contracts, options and swap agreements and exposure to the commodities markets, exposes the Funds to additional risks including increased volatility, lack of liquidity, and possible losses greater than a Fund’s initial investment as well as increased transaction costs. Derivative contracts involve exposure to counterparty credit risks, which refers to the possibility that the counterparty to a derivative instrument will not be able to make principal and interest payments when due. A Fund enters into a short sale by selling a security it has borrowed. If the market price of a security increases after the Fund borrows the security, the Fund will suffer a potentially unlimited loss when it replaces the borrowed security at the higher price. A Fund may also take a short position in a derivative instrument, which involves the risk of theoretically unlimited increase in the value of the underlying instrument. Short sales also involve transaction and other costs that will reduce potential Fund gains and increase potential Fund losses. The Funds may have exposure to the securities of mid-cap companies, the prices of which are generally more volatile than those of larger capitalization companies. When investing in or gaining exposure to bonds,
| AQR Funds | Annual Report | December 2015 | ||||||||||||||
37
Table of Contents
Shareholder Letter (Unaudited)
yield and share price will vary with changes in interest rates and market conditions. The Funds may lose money if short-term or long-term interest rates rise sharply or otherwise change in a manner not anticipated by the Fund’s Adviser. There is also a chance that some of a Fund’s holdings may have their credit rating downgraded or may default. Emerging market and foreign investing involves special risks such as currency fluctuations, political uncertainty, differences in generally accepted accounting principles, increased volatility and lower trading volume. These Funds are not suitable for all investors.
An investment in any of the AQR Funds listed above (the ”Funds”) involves risk, including loss of principal. Diversification does not eliminate this risk. The value of the Funds’ portfolio holdings may fluctuate in response to events specific to the companies in which the Fund invests, as well as economic, political or social events in the United States or abroad.
The Funds (other than the AQR Diversified Arbitrage Fund, the AQR Long-Short Equity Fund and the AQR Equity Market Neutral Fund) are each a non-diversified fund. Because these Funds may invest in securities of a smaller number of issuers, the Fund may be more exposed to the risks associated with and developments affecting an individual issuer than a fund that invests more widely, which may therefore have a greater impact on the Fund’s performance. The Funds (other than the AQR Diversified Arbitrage Fund, the AQR Long-Short Equity Fund and the AQR Equity Market Neutral Fund) also invest in a wholly-owned and controlled subsidiary and are indirectly exposed to the risks associated with the subsidiary’s investments. The Funds from time to time employ various hedging techniques, it is not possible to hedge fully or perfectly against any risk, and hedging entails its own costs.
An investor considering the Funds should be able to tolerate potentially wide price fluctuations. The Funds are subject to high portfolio turnover risk as a result of frequent trading, and thus will incur a higher level of brokerage fees and commissions and cause a higher level of tax liability to shareholders in the funds. The AQR Diversified Arbitrage Fund and the AQR Multi-Strategy Alternative Fund may attempt to increase their income or total return through the use of securities lending, and they may be subject to the possibility of additional loss as a result of this investment technique.
Please refer to each Fund’s prospectus for complete information regarding the principal risks associated with the Funds.
DEFINITIONS:
Accommodative Monetary Policy: An accommodative monetary policy is one where the central bank increases the money supply, typically by lowering interest rates and/or purchasing financial assets, in an attempt to stimulate the economy.
Alpha: is a measure of performance on a risk-adjusted basis. Alpha takes the volatility (price risk) of a mutual fund and compares its risk-adjusted performance to a benchmark index. The excess return of the fund relative to the return of the benchmark index is a fund’s alpha.
Barclays® U.S. Aggregate Bond Index: is a broad-based bond index comprised of government, corporate, mortgage and asset-backed issues, rated investment grade or higher, and having at least one year to maturity. Indexes are unmanaged and one cannot invest directly in an index.
Bearish: A belief that a particular security, sector or the overall market will fall.
Beta: is a measure of volatility of a security or portfolio in comparison to an index or the market as a whole. A beta of 1.0 means the security or portfolio will generally move in tandem with the index or market it is being compared to. A beta greater than 1.0 means the security or portfolio will be more volatile and a beta less than 1.0 means the security or portfolio will be less volatile than the index or market it is being compared to.
Bloomberg Commodity IndexSM: is a broad-based index used to represent the most frequently-traded global commodity futures. It was formally known as the Dow Jones – UBS Commodity Index. Indexes are unmanaged and one cannot invest directly in an index.
BofA Merrill Lynch 3-Month U.S. Treasury Bill IndexSM: is designed to measure the performance of high-quality short-term cash-equivalent investments. Indexes are unmanaged and one cannot invest directly in an index.
Bullish: A belief that a particular security, sector or the overall market will rise.
Bund: Is the German equivalent of a U.S. Treasury Bond.
| AQR Funds | Annual Report | December 2015 | ||||||||||||||
38
Table of Contents
Shareholder Letter (Unaudited)
Carry: The return obtained from holding an asset (if positive), or the cost of holding it (if negative).
Contagion: The likelihood that significant economic changes in one country will spread to other countries.
Correlation: is computed into what is known as the correlation coefficient, which ranges between -1 and +1. Perfect positive correlation (+1) implies that as one security moves, either up or down, the other security will move in lockstep, in the same direction. Alternatively, perfect negative correlation (-1) means that if one security moves in either direction the security that is perfectly negatively correlated will move in the opposite direction. If the correlation is 0, the movements of the securities are said to have no correlation; they are completely random.
Credit: This strategy purchases attractively priced securities on a hedged basis, typically around event induced capital flows.
Credit Default Swap contracts: is designed to transfer the credit exposure of fixed income products between parties.
Credit Suisse Hedge Fund IndexSM: is an asset-weighted benchmark that seeks to measure hedge fund performance and provide the most accurate representation of the hedge fund universe. Indexes are unmanaged and one cannot invest directly in an index.
Futures and Forwards contracts: A financial contract obligating the buyer to purchase an asset (or the seller to sell an asset) at a pre-determined future date and price.
Gilt: Is the U.K. equivalent of a U.S. Treasury Bond.
HFRITM Fund Weighted Composite Index: is a global, equal-weighted index of over 2,000 single-manager funds.
Macroeconomics: is focused on the movement and trends of the whole economy as a whole, including changes such as unemployment, national income, rate of growth, GDP, inflation and price levels.
Momentum: An investment style wherein an asset is deemed to have positive momentum if it has performed well in the past relative to other assets in the same universe.
MSCI World Index**: is a free float-adjusted market capitalization index that is designed to measure the performance of equities in developed markets, including the United States and Canada. Indexes are unmanaged and one cannot invest directly in an index.
NASDAQ Index: is a capitalization weighted index designed to measure performance of the more than 3,000 common stocks representing all major industries. Indexes are unmanaged and one cannot invest directly in an index.
Profitability: An investment style wherein an asset as certain identifiable characteristics including, profit margin, asset efficiency, leverage and earnings variability.
S&P 500®: is a capitalization weighted index designed to measure performance of the broad domestic economy through changes in the aggregate market value of 500 stocks representing all major industries. Indexes are unmanaged and one cannot invest directly in an index.
SG CTA Index: The Societe General (SG) CTA index follows traders of trend following methodologies. The SG CTA Index is equal weighted, calculates the net daily rate of return for a pool of commodity trading advisors (CTAs) selected from the larger managers open to new investment. Indexes are unmanaged and one cannot invest directly in an index.
Sharpe Ratio: is a ratio which measures risk-adjusted performance.
Tail Risk: The risk of larger or more frequent losses than would be expected if returns to an asset or portfolio followed a normal distribution.
Tracking Error: A measure of how closely a portfolio follows the index to which it is benchmarked. It measures the standard deviation of the difference between the portfolio and index returns.
Valuation: A process of determining the current worth of an asset or company.
Volatility: is a statistical measurement of up and down asset price fluctuations over time. If an asset has rapid dramatic price swings, its “volatility” will likely be relatively high. If prices are consistent and rarely change, “volatility” of that asset will likely be relatively low. “Volatility” can be measured as the standard deviation of an asset with a specific time horizon. It is often used to quantify the risk of such asset over a time period, typically expressed in annualized terms.
| AQR Funds | Annual Report | December 2015 | ||||||||||||||
39
Table of Contents
| Schedule of Investments | December 31, 2015 |
| AQR DIVERSIFIED ARBITRAGE FUND |
| LONG INVESTMENTS - 136.0% | SHARES | VALUE (Note 5) | ||||||
| COMMON STOCKS - 31.4% | ||||||||
| Communications - 0.0% (a) | ||||||||
| FriendFinder Networks, Inc. (3)†(b) | 6,483 | $ | 177,657 | |||||
|
| |||||||
| Consumer Discretionary - 1.4% | ||||||||
| Barnes & Noble Education, Inc. †(c) | 55,476 | 551,986 | ||||||
| China Networks International Holdings Ltd. (2)† | 2,287,278 | 114,364 | ||||||
| DEMC Ltd., Class A (3)†(b) | 13,027 | 130,269 | ||||||
| DEMC Ltd., Class B (3)†(b) | 10,488 | — | ||||||
| Education Management Corp. (3)†(b) | 26,919,323 | 1,766,446 | ||||||
| Exide Technologies (3)†(b) | 198,814 | 31,383 | ||||||
| Expedia, Inc. | 16 | 1,989 | ||||||
| General Motors Co. (n) | 165 | 5,612 | ||||||
| MSG Networks, Inc., Class A †(c) | 27,418 | 570,294 | ||||||
| News Corp., Class A (c) | 39,762 | 531,220 | ||||||
| Pep Boys - Manny Moe & Jack/The † | 5,550 | 102,176 | ||||||
| Sequential Brands Group, Inc. †(c) | 200,229 | 1,583,809 | ||||||
| Time Warner Cable, Inc. | 25,524 | 4,736,999 | ||||||
| Twenty-First Century Fox, Inc., Class A (c) | 116,821 | 3,172,858 | ||||||
|
| |||||||
| 13,299,405 | ||||||||
|
| |||||||
| Consumer Staples - 0.1% | ||||||||
| Herbalife Ltd. †(c) | 12,094 | 648,480 | ||||||
|
| |||||||
| Energy - 0.0% (a) | ||||||||
| Energy Fuels, Inc. (Canada) † | 14,400 | 42,668 | ||||||
|
| |||||||
| Financials - 20.8% | ||||||||
| 1347 Capital Corp. †*(c) | 420,504 | 4,141,964 | ||||||
| Acasta Enterprises, Inc., Class A (Canada) (2)† | 733,170 | 5,033,689 | ||||||
| Alignvest Acquisition Corp., Class A (Canada) † | 890,000 | 6,303,390 | ||||||
| AR Capital Acquisition Corp. † | 905,000 | 8,805,650 | ||||||
| Arowana, Inc. (Australia) †* | 787,920 | 7,737,374 | ||||||
| Atlantic Alliance Partnership Corp. (2)† | 450,000 | 4,549,500 | ||||||
| Bank of Cyprus PCL (Cyprus) (2)† | 64,254,993 | 10,261,179 | ||||||
| Barington/Hilco Acquisition Corp. (2)†* | 487,260 | 4,775,148 | ||||||
| Boulevard Acquisition Corp. II † | 1,047,480 | 10,370,052 | ||||||
| Capitol Acquisition Corp. III † | 125,000 | 1,195,000 | ||||||
| Care Capital Properties, Inc. REIT (c) | 19,569 | 598,224 | ||||||
| CB Pharma Acquisition Corp. †* | 325,500 | 3,238,725 | ||||||
| Deutsche Wohnen AG (Germany) (2) | 49,778 | 1,376,452 | ||||||
| DT Asia Investments Ltd. (Hong Kong) (2)† | 209,241 | 2,090,318 | ||||||
| Dundee Acquisition Ltd., Class A (Canada) (2)†* | 1,260,000 | 8,769,097 | ||||||
| Easterly Acquisition Corp. † | 1,146,500 | 11,350,350 | ||||||
| Federal Home Loan Mortgage Corp. † | 160,324 | 259,725 | ||||||
| Federal National Mortgage Association † | 56,433 | 92,550 | ||||||
| FinTech Acquisition Corp. (2)†* | 810,000 | 7,703,100 | ||||||
| Garnero Group Acquisition Co. (Brazil) †* | 1,800,200 | 17,659,962 | ||||||
| Gibraltar Growth Corp., Class A (Canada) (2)†* | 1,274,000 | 8,756,045 | ||||||
| Global Partner Acquisition Corp. †(c) | 757,142 | 7,495,706 | ||||||
| Gores Holdings, Inc., Class A (2)†(c) | 215,000 | 2,150,000 | ||||||
| GP Investments Acquisition Corp. (2)†*(c) | 2,130,000 | 20,448,000 | ||||||
| Harmony Merger Corp. (2)†*(c) | 1,375,100 | 13,407,225 | ||||||
| Hennessy Capital Acquisition Corp. II †(c) | 609,837 | 5,878,829 | ||||||
| SHARES | VALUE (Note 5) | |||||||
| Financials - 20.8% (continued) | ||||||||
| Hydra Industries Acquisition Corp. (2)†*(c) | 1,620,000 | $ | 15,649,200 | |||||
| Pacific Special Acquisition Corp. (China) (3)†(b)(c) | 373,500 | 3,678,975 | ||||||
| PNBK Holdings LLC, Class A (3)†(b) | 2,090,900 | 1,403,705 | ||||||
| PNBK Holdings LLC, Class B (3)†(b) | 3,218 | — | ||||||
| Pinecrest Resources Ltd. (Canada) (2)† | 79,820 | 2,884 | ||||||
| PJT Partners, Inc., Class A †(c) | 23,789 | 672,991 | ||||||
| Rescap Liquidating Trust †(c) | 294,219 | 2,412,596 | ||||||
| TPT Acquisition, Inc. (3)†(b) | 20,730 | — | ||||||
| Wilshire Bancorp, Inc. | 4,113 | 47,505 | ||||||
|
| |||||||
| 198,315,110 | ||||||||
|
| |||||||
| Health Care - 0.1% | ||||||||
| China Medical Technologies, Inc. ADR (China) (3)†(b)(c) | 4,931 | 49 | ||||||
| Ocata Therapeutics, Inc. † | 145,427 | 1,224,496 | ||||||
| Rotech Healthcare, Inc. (3)†(b) | 16,828 | 186,220 | ||||||
|
| |||||||
| 1,410,765 | ||||||||
|
| |||||||
| Industrials - 0.1% | ||||||||
| Pangaea Logistics Solutions Ltd. †(c) | 56,508 | 150,311 | ||||||
| SPX Corp. (c) | 63,409 | 591,606 | ||||||
| USG People NV (Netherlands) (2) | 3,139 | 58,398 | ||||||
|
| |||||||
| 800,315 | ||||||||
|
| |||||||
| Information Technology - 8.5% | ||||||||
| Akamai Technologies, Inc. † | 4,823 | 253,834 | ||||||
| Alcatel-Lucent ADR (France) † | 3,538 | 13,551 | ||||||
| Alphabet, Inc., Class C † | 5,794 | 4,396,951 | ||||||
| Citrix Systems, Inc. † | 60,958 | 4,611,473 | ||||||
| Fairchild Semiconductor International, Inc. † | 112,058 | 2,320,721 | ||||||
| Hewlett Packard Enterprise Co. (c) | 177,025 | 2,690,780 | ||||||
| Red Hat, Inc. † | 124,896 | 10,342,638 | ||||||
| SunEdison, Inc. † | 194,237 | 988,666 | ||||||
| Telestone Technologies Corp. (China) † | 115,818 | 116 | ||||||
| Yahoo!, Inc. †(c) | 1,659,320 | 55,188,983 | ||||||
|
| |||||||
| 80,807,713 | ||||||||
|
| |||||||
| Materials - 0.3% | ||||||||
| Chemours Co./The | 79,167 | 424,335 | ||||||
| Dow Chemical Co./The | 3,612 | 185,946 | ||||||
| Jaguar Mining, Inc. (3)†(b) | 142,136 | 8,640 | ||||||
| Jaguar Mining, Inc. (Canada) (2)†(c) | 25,812 | 2,798 | ||||||
| Momentive Performance Materials, Inc. (3)†(b) | 288,707 | 2,539,415 | ||||||
| Southern Arc Minerals, Inc. (Canada) †(c) | 24,848 | 5,747 | ||||||
|
| |||||||
| 3,166,881 | ||||||||
|
| |||||||
| Telecommunication Services - 0.1% | ||||||||
| Cleveland Unlimited (3)†(b) | 1 | 1,473,412 | ||||||
| XO holdings, Inc. O Shares (3)†(b) | 1,366,340 | — | ||||||
|
| |||||||
| 1,473,412 | ||||||||
|
| |||||||
TOTAL COMMON STOCKS | 300,142,406 | |||||||
|
| |||||||
| The accompanying notes are an integral part of these financial statements. | (Continued) |
| AQR Funds | Annual Report | December 2015 | ||||||||||||||
40
Table of Contents
| Schedule of Investments | December 31, 2015 |
| AQR DIVERSIFIED ARBITRAGE FUND |
| CONVERTIBLE PREFERRED STOCKS - 19.5% | SHARES | VALUE (Note 5) | ||||||||||||||
| Consumer Discretionary - 4.3% | ||||||||||||||||
| Fiat Chrysler Automobiles NV, Series FCAU (Netherlands), $100.00 par, 7.875%, 12/15/16 (2)(c) | 12,355,000 | $ | 14,354,966 | |||||||||||||
| Sealy Corp., $25.00 par, 8.000%, 07/15/16 (3)†(b)(d) | 299,636 | 27,392,207 | ||||||||||||||
|
| |||||||||||||||
| 41,747,173 | ||||||||||||||||
|
| |||||||||||||||
| Consumer Staples - 3.9% | ||||||||||||||||
| Bunge Ltd., Perpetual Preferred Stock, $100.00 par, 4.875%, 12/31/49 (c)(e) | 96,625 | 8,989,990 | ||||||||||||||
| Post Holdings, Inc., Perpetual Preferred Stock, Series C, $100.00 par, 2.500%, 12/31/49 (2)(c)(e) | 22,897 | 2,734,761 | ||||||||||||||
| Tyson Foods, Inc., $50.00 par, 4.750%, 07/15/17 (c) | 232,550 | 14,111,134 | ||||||||||||||
| Universal Corp., Perpetual Preferred Stock, $1,000.00 par, 6.750%, 03/15/18 (2)(c)(e) | 9,125 | 11,508,906 | ||||||||||||||
|
| |||||||||||||||
| 37,344,791 | ||||||||||||||||
|
| |||||||||||||||
| Energy - 1.6% | ||||||||||||||||
| Energy XXI Ltd., Perpetual Preferred Stock, $250.00 par, 5.625% , 12/31/49 (2)(c)(e) | 4,610 | 76,353 | ||||||||||||||
| Sanchez Energy Corp., Perpetual Preferred Stock, Series A, $50.00 par, 4.875%, 10/05/17 (2)(c)(e) | 411,250 | 4,125,331 | ||||||||||||||
| Sanchez Energy Corp., Perpetual Preferred Stock, Series B, $50.00 par, 6.500%, 04/06/18 (2)(c)(e) | 140,250 | 1,412,318 | ||||||||||||||
| Southwestern Energy Co., Series B, $50.00 par, 6.250%, 01/15/18 (c) | 488,875 | 9,068,631 | ||||||||||||||
|
| |||||||||||||||
| 14,682,633 | ||||||||||||||||
|
| |||||||||||||||
| Financials - 3.3% | ||||||||||||||||
| Cowen Group, Inc., Perpetual Preferred Stock, Series A 144A, $1,000.00 par, 5.625%, 12/31/49 (2)(c)(e)(f) | 5,700 | 4,275,000 | ||||||||||||||
| Crown Castle International Corp., Series A, $100.00 par, 4.500%, 11/01/16 (2)(c) | 40,550 | 4,330,334 | ||||||||||||||
| iStar, Inc., Perpetual Preferred Stock, Series J, $50.00 par, 4.500%, 03/15/18 (2)(c)(e) | 125,175 | 6,221,198 | ||||||||||||||
| Maiden Holdings Ltd., Series B, $50.00 par, 7.250%, 09/15/16 (c) | 83,593 | 4,399,082 | ||||||||||||||
| Welltower, Inc., Perpetual Preferred Stock, Series I, $50.00 par, 6.500%, 12/31/49 (c)(e) | 205,600 | 12,523,096 | ||||||||||||||
|
| |||||||||||||||
| 31,748,710 | ||||||||||||||||
|
| |||||||||||||||
| Health Care - 2.0% | ||||||||||||||||
| Allergan PLC, Series A, $1,000.00 par, 5.500% , 03/01/18 (c) | 13,075 | 13,469,603 | ||||||||||||||
| Amsurg Corp., Series A-1, $100.00 par, 5.250%, 07/01/17 (2)(c) | 41,475 | 5,956,847 | ||||||||||||||
|
| |||||||||||||||
| 19,426,450 | ||||||||||||||||
|
| |||||||||||||||
| Industrials - 0.0% (a) | ||||||||||||||||
| Timberjack Corp., $188,000.00 par, 8.000% ,12/31/16 (3)†(b)(g) | 188,000 | 917 | ||||||||||||||
|
| |||||||||||||||
| Materials - 0.4% | ||||||||||||||||
| A Schulman, Inc., Perpetual Preferred Stock, $1,000.00 par, 6.000% ,12/31/49 (c)(e) | 4,625 | 3,838,750 | ||||||||||||||
|
| |||||||||||||||
| Telecommunication Services - 2.0% | ||||||||||||||||
| T-Mobile US, Inc., $50.00 par, 5.500% ,12/15/17 (c) | 281,925 | 19,089,142 | ||||||||||||||
|
| |||||||||||||||
| Utilities - 2.0% | ||||||||||||||||
| Dominion Resources, Inc., Series A, $49.00 par, 6.125% , 04/01/16 (c) | 118,650 | 6,297,942 | ||||||||||||||
| Dominion Resources, Inc., Series B, $49.00 par, 6.000%, 07/01/16 (c) | 242,350 | 13,006,924 | ||||||||||||||
|
| |||||||||||||||
| 19,304,866 | ||||||||||||||||
|
| |||||||||||||||
TOTAL CONVERTIBLE PREFERRED STOCKS |
| 187,183,432 | ||||||||||||||
|
| |||||||||||||||
| CORPORATE BONDS - 1.7% | INTEREST RATE | MATURITY DATE | PRINCIPAL AMOUNT (000’s) | |||||||||||||
| Communications - 0.0% (a) | ||||||||||||||||
| Interactive Network, Inc./FriendFinder Networks, Inc. (2)(c) | 14.000% | 12/20/18 | $ | 838 | 439,932 | |||||||||||
|
| |||||||||||||||
| The accompanying notes are an integral part of these financial statements. | (Continued) |
| AQR Funds | Annual Report | December 2015 | ||||||||||||||
41
Table of Contents
| Schedule of Investments | December 31, 2015 |
| AQR DIVERSIFIED ARBITRAGE FUND |
| INTEREST RATE | MATURITY DATE | PRINCIPAL | VALUE (Note 5) | |||||||||||||
| Consumer Discretionary - 0.3% | ||||||||||||||||
| Brookstone Holdings Corp. (3)(b)(d) | 10.000% | 07/07/21 | $ | 59 | $ | 17,636 | ||||||||||
| Caesars Entertainment Operating Co., Inc. (2)(c)(g) | 10.750% | 02/01/16 | 10,125 | 2,581,875 | ||||||||||||
| Exide Technologies (3)(b)(g) | 8.625% | 02/01/18 | 33,550 | — | ||||||||||||
| Quiksilver, Inc. / QS Wholesale, Inc. (2)(g) | 10.000% | 08/01/20 | 6,325 | 300,438 | ||||||||||||
| RS Legacy Corp. (3)(b)(c)(g) | 6.750% | 05/15/19 | 6,230 | 5,607 | ||||||||||||
|
| |||||||||||||||
| 2,905,556 | ||||||||||||||||
|
| |||||||||||||||
| Consumer Staples - 0.1% | ||||||||||||||||
| Rite Aid Corp. (2) | 9.250% | 03/15/20 | 1,175 | 1,242,563 | ||||||||||||
|
| |||||||||||||||
| Energy - 0.7% | ||||||||||||||||
| Black Elk Energy Offshore Operations LLC/Black Elk Finance Corp. (3)(b)(g) | 13.750% | 12/01/15 | 5,800 | 406,000 | ||||||||||||
| Endeavour International Corp. (3)(b)(c)(g) | 12.000% | 06/01/18 | 7,600 | 38,000 | ||||||||||||
| Endeavour International Corp., Series WI (3)(b)(g) | 12.000% | 03/01/18 | 16,850 | 842,500 | ||||||||||||
| Gold Point Energy Corp. (3)(b)(g) | 4.500% | 05/01/15 | 1,140 | — | ||||||||||||
| NSA Bondco Ltd. (Cayman Islands) (3)(b)(d) | 12.000% | 08/31/20 | 4,223 | 2,111,456 | ||||||||||||
| Quicksilver Resources, Inc. (2)(g) | 9.125% | 08/15/19 | 4,425 | 121,687 | ||||||||||||
| Sabine Oil & Gas Corp. (2)(g) | 7.250% | 06/15/19 | 17,830 | 1,114,375 | ||||||||||||
| Sabine Oil & Gas Corp. (2)(g) | 7.500% | 09/15/20 | 10,750 | 623,500 | ||||||||||||
| Songa Offshore (Cyprus) (2) | 7.500% | 12/11/18 | 15,000 | 1,118,436 | ||||||||||||
| ZaZa Energy Corp. (3)(b)(c)(g) | 9.000% | 08/01/17 | 3,550 | 355,000 | ||||||||||||
|
| |||||||||||||||
| 6,730,954 | ||||||||||||||||
|
| |||||||||||||||
| Financials - 0.1% | ||||||||||||||||
| Washington Mutual Bank, Bank Note (3)(b)(g) | 0.000% | 05/01/09 | 5,000 | 950,000 | ||||||||||||
|
| |||||||||||||||
| Materials - 0.5% | ||||||||||||||||
| Momentive Performance Materials, Inc. (2)(c) | 3.880% | 10/24/21 | 6,175 | 4,260,750 | ||||||||||||
| Momentive Performance Materials, Inc. (3)(b)(g) | 8.875% | 10/15/20 | 13,550 | — | ||||||||||||
| Verso Paper Holdings LLC / Verso Paper, Inc. (2)(c)(g) | 13.000% | 08/01/20 | 12,680 | 63,402 | ||||||||||||
|
| |||||||||||||||
| 4,324,152 | ||||||||||||||||
|
| |||||||||||||||
TOTAL CORPORATE BONDS | 16,593,157 | |||||||||||||||
|
| |||||||||||||||
| CONVERTIBLE BONDS - 26.6% | ||||||||||||||||
| Consumer Discretionary - 1.4% | ||||||||||||||||
| Cenveo Corp. (2)(c) | 7.000% | 05/15/17 | 1,800 | 1,326,375 | ||||||||||||
| Exide Technologies (3)(b)(g)(h) | 0.000% | 09/18/13 | 650 | 1 | ||||||||||||
| JAKKS Pacific, Inc. 144A (2)(c)(f) | 4.250% | 08/01/18 | 5,775 | 5,839,969 | ||||||||||||
| JAKKS Pacific, Inc. 144A (2)(c)(f) | 4.875% | 06/01/20 | 6,250 | 6,046,875 | ||||||||||||
| Palm Harbor Homes, Inc. (3)(b)(g) | 3.250% | 05/15/24 | 70 | 4,552 | ||||||||||||
|
| |||||||||||||||
| 13,217,772 | ||||||||||||||||
|
| |||||||||||||||
| Consumer Staples - 0.5% | ||||||||||||||||
| Herbalife Ltd. (2)(c) | 2.000% | 08/15/19 | 5,475 | 4,581,891 | ||||||||||||
|
| |||||||||||||||
| Energy - 5.2% | ||||||||||||||||
| Aegean Marine Petroleum Network, Inc. (Greece) (2)(c) | 4.000% | 11/01/18 | 6,175 | 5,360,672 | ||||||||||||
| Alon USA Energy, Inc. (2)(c) | 3.000% | 09/15/18 | 3,900 | 4,611,750 | ||||||||||||
| Alpha Natural Resources, Inc. (2)(c)(g) | 4.875% | 12/15/20 | 800 | 1,000 | ||||||||||||
| Amyris, Inc. 144A (2)(c)(f) | 9.500% | 04/15/19 | 8,400 | 8,925,000 | ||||||||||||
| Cal Dive International, Inc. (3)(b)(c)(g) | 5.000% | 07/15/17 | 2,275 | 11,375 | ||||||||||||
| Cheniere Energy, Inc. (2)(c) | 4.250% | 03/15/45 | 13,475 | 7,007,000 | ||||||||||||
| Emerald Oil, Inc. 144A (3)(b)(c)(f) | 2.000% | 04/01/19 | 1,600 | 512,000 | ||||||||||||
| Endeavour International Corp. (3)(b)(c)(g) | 5.500% | 07/15/16 | 8,229 | 41,145 | ||||||||||||
| James River Coal Co. (3)(b)(c)(g) | 10.000% | 06/01/18 | 310 | 31 | ||||||||||||
| Renewable Energy Group, Inc. (2)(c) | 2.750% | 06/15/19 | 3,650 | 3,081,969 | ||||||||||||
| The accompanying notes are an integral part of these financial statements. | (Continued) |
| AQR Funds | Annual Report | December 2015 | ||||||||||||||
42
Table of Contents
| Schedule of Investments | December 31, 2015 |
| AQR DIVERSIFIED ARBITRAGE FUND |
| INTEREST RATE | MATURITY DATE | PRINCIPAL | VALUE (Note 5) | |||||||||||||
| Energy - 5.2% (continued) | ||||||||||||||||
| SandRidge Energy, Inc. (2) | 7.500% | 02/16/23 | $ | 4,200 | $ | 766,500 | ||||||||||
| SandRidge Energy, Inc. (2) | 8.125% | 10/16/22 | 1,400 | 268,625 | ||||||||||||
| Scorpio Tankers, Inc. 144A (2)(c)(f) | 2.375% | 07/01/19 | 3,125 | 2,888,672 | ||||||||||||
| Ship Finance International Ltd. (Norway) (2)(c) | 3.250% | 02/01/18 | 14,850 | 15,787,406 | ||||||||||||
|
| |||||||||||||||
| 49,263,145 | ||||||||||||||||
|
| |||||||||||||||
| Financials - 2.1% | ||||||||||||||||
| Cowen Group, Inc. (2)(c) | 3.000% | 03/15/19 | 4,550 | 4,370,844 | ||||||||||||
| Encore Capital Group, Inc. (2)(c) | 3.000% | 07/01/20 | 1,300 | 1,108,250 | ||||||||||||
| Ezcorp, Inc. (2)(c) | 2.625% | 06/15/19 | 2,475 | 1,703,109 | ||||||||||||
| GAIN Capital Holdings, Inc. (2)(c) | 4.125% | 12/01/18 | 3,325 | 3,327,078 | ||||||||||||
| Lexington Realty Trust 144A (2)(c)(f) | 6.000% | 01/15/30 | 7,550 | 8,894,844 | ||||||||||||
| MBF Healthcare Acquisition Corp. (2)(g) | 3.375% | 08/01/18 | 1,609 | 358,002 | ||||||||||||
| NorthStar Realty Finance LP 144A (2)(f) | 5.375% | 06/15/33 | 300 | 373,849 | ||||||||||||
|
| |||||||||||||||
| 20,135,976 | ||||||||||||||||
|
| |||||||||||||||
| Health Care - 5.1% | ||||||||||||||||
| Accuray, Inc., Series A (2)(c) | 3.500% | 02/01/18 | 3,025 | 4,104,547 | ||||||||||||
| Acorda Therapeutics, Inc. (2)(c) | 1.750% | 06/15/21 | 875 | 1,006,250 | ||||||||||||
| Albany Molecular Research, Inc. (2)(c) | 2.250% | 11/15/18 | 1,525 | 2,051,125 | ||||||||||||
| Anthem, Inc. (2)(c) | 2.750% | 10/15/42 | 6,429 | 12,271,354 | ||||||||||||
| China Medical Technologies, Inc. (China) 144A (3)(b)(c)(f)(g) | 6.250% | 12/15/16 | 2,625 | 262 | ||||||||||||
| China Medical Technologies, Inc., Series CMT (China) (2)(c)(g) | 4.000% | 08/15/13 | 250 | 2 | ||||||||||||
| Healthways, Inc. (2)(c) | 1.500% | 07/01/18 | 6,775 | 6,402,375 | ||||||||||||
| Medicines Co./The (2)(c) | 1.375% | 06/01/17 | 2,300 | 3,273,187 | ||||||||||||
| Medicines Co./The (2)(c) | 2.500% | 01/15/22 | 6,325 | 8,016,938 | ||||||||||||
| PDL BioPharma, Inc. (2)(c) | 4.000% | 02/01/18 | 1,250 | 1,000,781 | ||||||||||||
| Sequenom, Inc. (2)(c) | 5.000% | 01/01/18 | 7,325 | 5,548,688 | ||||||||||||
| Spectrum Pharmaceuticals, Inc. (2)(c) | 2.750% | 12/15/18 | 5,600 | 4,907,000 | ||||||||||||
|
| |||||||||||||||
| 48,582,509 | ||||||||||||||||
|
| |||||||||||||||
| Industrials - 3.2% | ||||||||||||||||
| China Linen Textile Industry Ltd. (Cayman Islands) (3)(b)(g) | 7.500% | 12/31/15 | 1,850 | 18 | ||||||||||||
| General Cable Corp. (2)(c)(i) | 4.500% | 11/15/29 | 1,270 | 778,669 | ||||||||||||
| Meritor, Inc. (2)(c) | 7.875% | 03/01/26 | 10,015 | 11,942,888 | ||||||||||||
| Titan International, Inc. 144A (2)(c)(f) | 5.625% | 01/15/17 | 7,575 | 6,983,203 | ||||||||||||
| UTi Worldwide, Inc. (2)(c) | 4.500% | 03/01/19 | 11,075 | 10,922,719 | ||||||||||||
|
| |||||||||||||||
| 30,627,497 | ||||||||||||||||
|
| |||||||||||||||
| Information Technology - 8.2% | ||||||||||||||||
| Avid Technology, Inc. 144A (2)(c)(f) | 2.000% | 06/15/20 | 1,725 | 1,085,672 | ||||||||||||
| Convergys Corp. (2)(c) | 5.750% | 09/15/29 | 4,250 | 9,578,438 | ||||||||||||
| GT Advanced Technologies, Inc. (2)(c)(g) | 3.000% | 10/01/17 | 2,650 | 6,625 | ||||||||||||
| Microchip Technology, Inc. (2)(c) | 2.125% | 12/15/37 | 6,065 | 11,542,453 | ||||||||||||
| Micron Technology, Inc., Series F (2)(c) | 2.125% | 02/15/33 | 1,375 | 2,021,250 | ||||||||||||
| ModusLink Global Solutions, Inc. (2)(c) | 5.250% | 03/01/19 | 7,600 | 5,861,500 | ||||||||||||
| Nortel Networks Corp. (Canada) (2)(c)(g) | 1.750% | 04/15/12 | 3,000 | 2,535,000 | ||||||||||||
| Powerwave Technologies, Inc. 144A (3)(b)(c)(f)(g) | 2.750% | 07/15/41 | 3,900 | 4,875 | ||||||||||||
| Powerwave Technologies, Inc. (3)(b)(g) | 3.875% | 10/01/27 | 4,104 | 410 | ||||||||||||
| Quantum Corp. (2)(c) | 4.500% | 11/15/17 | 1,650 | 1,509,750 | ||||||||||||
| SunEdison, Inc. 144A (2)(c)(f) | 0.250% | 01/15/20 | 575 | 221,375 | ||||||||||||
| SunEdison, Inc. (2)(c) | 2.000% | 10/01/18 | 19,350 | 10,557,844 | ||||||||||||
| SunEdison, Inc. (2)(c) | 2.750% | 01/01/21 | 4,400 | 2,202,750 | ||||||||||||
| TTM Technologies, Inc. (2)(c) | 1.750% | 12/15/20 | 6,150 | 5,542,688 | ||||||||||||
| VeriSign, Inc. (2)(c) | 4.297% | 08/15/37 | 4,135 | 10,588,184 | ||||||||||||
| Vishay Intertechnology, Inc. (2)(c) | 2.250% | 11/15/40 | 15,402 | 14,901,435 | ||||||||||||
|
| |||||||||||||||
| 78,160,249 | ||||||||||||||||
|
| |||||||||||||||
| The accompanying notes are an integral part of these financial statements. | (Continued) |
| AQR Funds | Annual Report | December 2015 | ||||||||||||||
43
Table of Contents
| Schedule of Investments | December 31, 2015 |
| AQR DIVERSIFIED ARBITRAGE FUND |
| INTEREST RATE | MATURITY DATE | PRINCIPAL | VALUE (Note 5) | |||||||||||||
| Materials - 0.2% | ||||||||||||||||
| A.M. Castle & Co. (2)(c) | 7.000% | 12/15/17 | $ | 925 | $ | 343,984 | ||||||||||
| Cereplast, Inc. (3)(b)(g) | 7.000% | 06/01/16 | 3,516 | 35 | ||||||||||||
| ShengdaTech, Inc. 144A (3)(b)(f)(g) | 6.000% | 06/01/18 | 300 | 3 | ||||||||||||
| ShengdaTech, Inc. 144A (3)(b)(f)(g) | 6.500% | 12/15/15 | 1,200 | 12 | ||||||||||||
| Stillwater Mining Co. (2)(c) | 1.750% | 10/15/32 | 2,125 | 2,017,422 | ||||||||||||
|
| |||||||||||||||
| 2,361,456 | ||||||||||||||||
|
| |||||||||||||||
| Utilities - 0.7% | ||||||||||||||||
| NRG Yield, Inc. 144A (2)(c)(f) | 3.500% | 02/01/19 | 7,500 | 6,871,875 | ||||||||||||
|
| |||||||||||||||
TOTAL CONVERTIBLE BONDS | 253,802,370 | |||||||||||||||
|
| |||||||||||||||
| SECURITIES IN LITIGATION – 0.0% (a) | NUMBER OF UNITS | VALUE (Note 5) | ||||||
| Information Technology - 0.0% (a) | ||||||||
| Timegate (3)†(b) | 4,993,399 | $ | 90,995 | |||||
|
| |||||||
TOTAL SECURITIES IN LITIGATION | 90,995 | |||||||
|
| |||||||
| CLOSED END FUNDS - 10.9% | SHARES | |||||||
| Aberdeen Global Income Fund, Inc. | 7,286 | 56,029 | ||||||
| Adams Diversified Equity Fund, Inc. | 5,820 | 74,671 | ||||||
| Advent Claymore Convertible Securities and Income Fund (c) | 20,090 | 271,617 | ||||||
| Advent Claymore Convertible Securities and Income Fund II (c) | 165,776 | 920,057 | ||||||
| Advent Claymore Enhanced Growth & Income Fund (c) | 32,894 | 272,033 | ||||||
| AllianceBernstein Global High Income Fund, Inc. | 83,549 | 900,658 | ||||||
| AllianzGI Convertible & Income Fund | 30,728 | 170,233 | ||||||
| AllianzGI Convertible & Income Fund II | 29,935 | 151,172 | ||||||
| AllianzGI Equity & Convertible Income Fund | 17,055 | 306,308 | ||||||
| Alpine Global Dynamic Dividend Fund (c) | 66,960 | 592,596 | ||||||
| Alpine Global Premier Properties Fund (c) | 371,239 | 2,142,049 | ||||||
| Alpine Total Dynamic Dividend Fund | 50,776 | 389,960 | ||||||
| Apollo Senior Floating Rate Fund, Inc. (c) | 13,260 | 200,889 | ||||||
| Apollo Tactical Income Fund, Inc. | 31,192 | 433,257 | ||||||
| Ares Dynamic Credit Allocation Fund, Inc. | 73,763 | 985,474 | ||||||
| Avenue Income Credit Strategies Fund | 33,128 | 376,003 | ||||||
| Babson Capital Global Short Duration High Yield Fund | 23,475 | 387,103 | ||||||
| BlackRock Core Bond Trust | 252,951 | 3,197,301 | ||||||
| BlackRock Corporate High Yield Fund, Inc. | 306,535 | 2,997,912 | ||||||
| BlackRock Credit Allocation Income Trust | 278,877 | 3,441,342 | ||||||
| BlackRock Enhanced Equity Dividend Trust | 9,800 | 74,578 | ||||||
| BlackRock Floating Rate Income Strategies Fund, Inc. | 91,244 | 1,177,048 | ||||||
| BlackRock Floating Rate Income Trust | 22,992 | 287,400 | ||||||
| CLOSED END FUNDS - 10.9% (continued) | SHARES | VALUE (Note 5) | ||||||
| BlackRock Limited Duration Income Trust | 87,097 | $ | 1,269,874 | |||||
| BlackRock Long-Term Municipal Advantage Trust | 14,664 | 168,636 | ||||||
| BlackRock Multi-Sector Income Trust | 50,853 | 803,986 | ||||||
| BlackRock Muni Intermediate Duration Fund, Inc. | 44,115 | 625,110 | ||||||
| BlackRock Municipal Income Investment Quality Trust | 2,062 | 30,476 | ||||||
| BlackRock Municipal Target Term Trust | 82,057 | 1,769,969 | ||||||
| BlackRock MuniHoldings New Jersey Quality Fund, Inc. | 32,373 | 467,142 | ||||||
| BlackRock MuniYield Investment Quality Fund | 834 | 11,759 | ||||||
| BlackRock MuniYield Michigan Quality Fund, Inc. | 63,612 | 888,024 | ||||||
| BlackRock MuniYield Pennsylvania Quality Fund | 5,198 | 75,579 | ||||||
| BlackRock Resources & Commodities Strategy Trust | 354,350 | 2,519,428 | ||||||
| BlackRock Utility and Infrastructure Trust | 1,400 | 23,492 | ||||||
| Blackstone/GSO Long-Short Credit Income Fund | 56,559 | 762,415 | ||||||
| Blackstone/GSO Strategic Credit Fund | 164,836 | 2,203,857 | ||||||
| Boulder Growth & Income Fund, Inc. (c) | 11,875 | 91,912 | ||||||
| Brookfield Global Listed Infrastructure Income Fund, Inc. | 46,982 | 552,038 | ||||||
| Brookfield High Income Fund, Inc. | 27,898 | 191,938 | ||||||
| Calamos Convertible Opportunities and Income Fund | 2,556 | 25,330 | ||||||
| Calamos Global Dynamic Income Fund | 23,400 | 167,544 | ||||||
| Calamos Strategic Total Return Fund | 12,254 | 121,315 | ||||||
| CBRE Clarion Global Real Estate Income Fund (c) | 309,637 | 2,365,627 | ||||||
| Central Securities Corp. | 47,685 | 906,969 | ||||||
| Clough Global Allocation Fund | 2,950 | 39,736 | ||||||
| Clough Global Equity Fund | 7,198 | 90,192 | ||||||
| Clough Global Opportunities Fund | 25,329 | 264,435 | ||||||
| Cohen & Steers Quality Income Realty Fund, Inc. | 277,677 | 3,393,213 | ||||||
| Cohen & Steers REIT and Preferred Income Fund, Inc. | 116,494 | 2,148,149 | ||||||
| The accompanying notes are an integral part of these financial statements. | (Continued) |
| AQR Funds | Annual Report | December 2015 | ||||||||||||||
44
Table of Contents
| Schedule of Investments | December 31, 2015 |
| AQR DIVERSIFIED ARBITRAGE FUND |
| CLOSED END FUNDS - 10.9% (continued) | SHARES | VALUE (Note 5) | ||||||
| Cushing Renaissance Fund/The | 9,004 | $ | 128,487 | |||||
| Delaware Enhanced Global Dividend & Income Fund | 51,440 | 480,964 | ||||||
| Deutsche High Income Trust | 21,623 | 171,903 | ||||||
| Dividend and Income Fund | 6,525 | 71,840 | ||||||
| Eaton Vance Floating-Rate Income Plus Fund | 6,642 | 93,984 | ||||||
| Eaton Vance Floating-Rate Income Trust | 26,831 | 339,144 | ||||||
| Eaton Vance Limited Duration Income Fund (c) | 268,707 | 3,428,701 | ||||||
| Eaton Vance Senior Income Trust | 91,965 | 530,638 | ||||||
| Eaton Vance Short Duration Diversified Income Fund | 62,780 | 841,880 | ||||||
| Eaton Vance Tax-Advantaged Bond and Options Strategies Fund | 18,569 | 233,412 | ||||||
| First Trust Aberdeen Global Opportunity Income Fund | 112,237 | 1,136,961 | ||||||
| First Trust High Income Long/Short Fund | 159,985 | 2,252,589 | ||||||
| First Trust Senior Floating Rate Income Fund II | 17,430 | 215,261 | ||||||
| First Trust Strategic High Income Fund II | 20,769 | 231,159 | ||||||
| Franklin Limited Duration Income Trust | 85,296 | 914,373 | ||||||
| Gabelli Dividend & Income Trust/The | 33,308 | 614,866 | ||||||
| Gabelli Healthcare & WellnessRx Trust/The | 36,476 | 373,879 | ||||||
| GAMCO Natural Resources Gold & Income Trust | 6,616 | 37,910 | ||||||
| General American Investors Co., Inc. | 29,675 | 947,820 | ||||||
| Invesco Bond Fund (c) | 1,872 | 32,891 | ||||||
| Invesco Dynamic Credit Opportunities Fund (c) | 121,120 | 1,277,816 | ||||||
| Invesco High Income Trust II (c) | 28,675 | 368,474 | ||||||
| Invesco Municipal Trust (c) | 9,424 | 120,344 | ||||||
| Invesco Pennsylvania Value Municipal Income Trust (c) | 27,911 | 357,819 | ||||||
| Invesco Quality Municipal Income Trust (c) | 67,809 | 860,496 | ||||||
| Ivy High Income Opportunities Fund (c) | 33,166 | 410,595 | ||||||
| John Hancock Hedged Equity & Income Fund (c) | 1,691 | 24,452 | ||||||
| John Hancock Income Securities Trust (c) | 2,128 | 28,579 | ||||||
| KKR Income Opportunities Fund (c) | 22,799 | 316,222 | ||||||
| Lazard Global Total Return and Income Fund, Inc. (c) | 10,604 | 138,700 | ||||||
| Liberty All Star Equity Fund | 431,844 | 2,310,365 | ||||||
| Liberty All Star Growth Fund, Inc. | 13,172 | 60,328 | ||||||
| LMP Capital and Income Fund, Inc. (c) | 35,486 | 438,962 | ||||||
| LMP Corporate Loan Fund, Inc. (c) | 4,527 | 44,727 | ||||||
| Macquarie Global Infrastructure Total Return Fund, Inc. (c) | 25,906 | 493,509 | ||||||
| Madison Covered Call & Equity Strategy Fund (c) | 2,629 | 19,402 | ||||||
| MFS Investment Grade Municipal Trust (c) | 2,598 | 25,642 | ||||||
| MFS Municipal Income Trust (c) | 57,207 | 389,008 | ||||||
| Morgan Stanley Emerging Markets Fund, Inc. (c) | 531 | 6,807 | ||||||
| Morgan Stanley Income Securities, Inc. (c) | 17,929 | 302,462 | ||||||
| Neuberger Berman High Yield Strategies Fund, Inc. (c) | 64,878 | 654,619 | ||||||
| CLOSED END FUNDS - 10.9% (continued) | SHARES | VALUE (Note 5) | ||||||
| New America High Income Fund, Inc./The | 21,183 | $ | 162,262 | |||||
| Nuveen Connecticut Premium Income Municipal Fund (c) | 25,223 | 321,845 | ||||||
| Nuveen Credit Strategies Income Fund (c) | 361,008 | 2,830,303 | ||||||
| Nuveen Diversified Dividend & Income Fund (c) | 44,311 | 479,888 | ||||||
| Nuveen Dividend Advantage Municipal Fund 2 | 81,753 | 1,157,622 | ||||||
| Nuveen Dividend Advantage Municipal Fund 3 | 28,689 | 411,974 | ||||||
| Nuveen Dividend Advantage Municipal Income Fund (c) | 4,633 | 67,086 | ||||||
| Nuveen Floating Rate Income Opportunity Fund (c) | 2,769 | 27,136 | ||||||
| Nuveen Global Equity Income Fund (c) | 64,168 | 700,715 | ||||||
| Nuveen Maryland Premium Income Municipal Fund (c) | 72,572 | 920,939 | ||||||
| Nuveen Michigan Quality Income Municipal Fund (c) | 14,708 | 201,353 | ||||||
| Nuveen Municipal Advantage Fund, Inc. | 52,080 | 721,308 | ||||||
| Nuveen Municipal Market Opportunity Fund, Inc. (c) | 64,942 | 895,550 | ||||||
| Nuveen New Jersey Dividend Advantage Municipal Fund (c) | 107,761 | 1,454,774 | ||||||
| Nuveen New York AMT-Free Municipal Income Fund (c) | 90,486 | 1,188,081 | ||||||
| Nuveen North Carolina Premium Income Municipal Fund (c) | 48,664 | 637,498 | ||||||
| Nuveen Ohio Quality Income Municipal Fund (c) | 13,491 | 205,873 | ||||||
| Nuveen Pennsylvania Investment Quality Municipal Fund (c) | 61,098 | 837,043 | ||||||
| Nuveen Performance Plus Municipal Fund, Inc. (c) | 13,387 | 200,270 | ||||||
| Nuveen Premier Municipal Income Fund, Inc. (c) | 34,499 | 471,256 | ||||||
| Nuveen Premium Income Municipal Fund 2, Inc. (c) | 25,260 | 365,260 | ||||||
| Nuveen Premium Income Municipal Fund, Inc. (c) | 100,028 | 1,410,395 | ||||||
| Nuveen Quality Income Municipal Fund, Inc. | 66,789 | 947,068 | ||||||
| Nuveen Quality Municipal Fund, Inc. | 91,442 | 1,247,269 | ||||||
| Nuveen Select Quality Municipal Fund, Inc. (c) | 67,446 | 947,616 | ||||||
| Nuveen Senior Income Fund (c) | 36,490 | 210,547 | ||||||
| Nuveen Short Duration Credit Opportunities Fund (c) | 33,092 | 490,754 | ||||||
| PIMCO Dynamic Credit Income Fund (c) | 163,053 | 2,939,846 | ||||||
| PIMCO Income Strategy Fund (c) | 490 | 4,773 | ||||||
| PIMCO Income Strategy Fund II (c) | 549 | 4,815 | ||||||
| Pioneer Diversified High Income Trust | 10,931 | 159,483 | ||||||
| Pioneer Floating Rate Trust | 52,178 | 566,131 | ||||||
| Prudential Global Short Duration High Yield Fund, Inc. (c) | 60,675 | 858,551 | ||||||
| Prudential Short Duration High Yield Fund, Inc. | 48,225 | 704,085 | ||||||
| Putnam High Income Securities Fund (c) | 55,292 | 404,185 | ||||||
| The accompanying notes are an integral part of these financial statements. | (Continued) |
| AQR Funds | Annual Report | December 2015 | ||||||||||||||
45
Table of Contents
| Schedule of Investments | December 31, 2015 |
| AQR DIVERSIFIED ARBITRAGE FUND |
| CLOSED END FUNDS - 10.9% (continued) | SHARES | VALUE (Note 5) | ||||||
| Putnam Managed Municipal Income Trust (c) | 39,324 | $ | 289,425 | |||||
| Putnam Municipal Opportunities Trust (c) | 32,565 | 399,898 | ||||||
| RMR Real Estate Income Fund (c) | 40,121 | 773,132 | ||||||
| Royce Micro-Cap Trust, Inc. | 31,598 | 229,401 | ||||||
| Royce Value Trust, Inc. | 55,611 | 654,541 | ||||||
| Sprott Focus Trust, Inc. | 52,540 | 304,732 | ||||||
| Stone Harbor Emerging Markets Total Income Fund (c) | 26,011 | 295,745 | ||||||
| Swiss Helvetia Fund, Inc./The (c) | 35,998 | 380,139 | ||||||
| Templeton Emerging Markets Fund (c) | 4,387 | 43,738 | ||||||
| Templeton Global Income Fund (c) | 253,134 | 1,607,401 | ||||||
| THL Credit Senior Loan Fund (c) | 4,125 | 65,423 | ||||||
| Tortoise Energy Independence Fund, Inc. (c) | 1,900 | 21,432 | ||||||
| Tortoise Pipeline & Energy Fund, Inc. (c) | 451 | 6,544 | ||||||
| Tri-Continental Corp. (c) | 36,283 | 726,386 | ||||||
| Voya Emerging Markets High Income Dividend Equity Fund | 8,072 | 59,733 | ||||||
| Voya Global Equity Dividend and Premium Opportunity Fund | 8,673 | 60,711 | ||||||
| Voya Infrastructure Industrials and Materials Fund | 9,263 | 113,564 | ||||||
| Voya Natural Resources Equity Income Fund | 3,919 | 21,398 | ||||||
| Voya Prime Rate Trust | 51,080 | 258,465 | ||||||
| Wells Fargo Global Dividend Opportunity Fund | 42,245 | 250,090 | ||||||
| CLOSED END FUNDS - 10.9% (continued) | SHARES | VALUE (Note 5) | ||||||
| Wells Fargo Income Opportunities Fund | 101,774 | $ | 758,216 | |||||
| Wells Fargo Multi-Sector Income Fund | 138,115 | 1,563,462 | ||||||
| Western Asset Global Corporate Defined Opportunity Fund, Inc. (c) | 47,967 | 757,879 | ||||||
| Western Asset Global High Income Fund, Inc. (c) | 77,541 | 676,158 | ||||||
| Western Asset Global Partners Income Fund, Inc. (c) | 51,455 | 397,747 | ||||||
| Western Asset High Income Fund II, Inc. (c) | 62,939 | 397,145 | ||||||
| Western Asset High Income Opportunity Fund, Inc. (c) | 325,386 | 1,526,060 | ||||||
| Western Asset High Yield Defined Opportunity Fund, Inc. (c) | 23,599 | 332,746 | ||||||
| Western Asset Managed High Income Fund, Inc. | 189,489 | 856,490 | ||||||
| Western Asset Worldwide Income Fund, Inc. (c) | 62,760 | 632,621 | ||||||
| Zweig Total Return Fund, Inc./The | 37,480 | 456,506 | ||||||
|
| |||||||
TOTAL CLOSED END FUNDS | 103,582,307 | |||||||
|
| |||||||
| OPEN END FUND - 0.0% (a) | ||||||||
Transamerica Flexible Income Fund | 32,684 | 295,133 | ||||||
|
| |||||||
| LOAN PARTICIPATIONS - 0.3% | INTEREST RATE | MATURITY DATE | PRINCIPAL AMOUNT (000’s) | VALUE (Note 5) | ||||||||||||||
| Consumer Discretionary - 0.1% | ||||||||||||||||||
| RH Donnelley, Inc. (2)(h) | 6.000% | 12/31/16 | $ | 1,950 | $ | 809,397 | ||||||||||||
|
| |||||||||||||||||
| Financials - 0.1% | ||||||||||||||||||
| J.G. Wentworth LLC (3)(b)(h) | 7.500% | 02/08/19 | 1,876 | 1,385,235 | ||||||||||||||
|
| |||||||||||||||||
| Information Technology - 0.1% | ||||||||||||||||||
| GT Advanced Techonologies, Inc. (3)(b)(h) | 9.500% | 07/27/16 | 841 | 839,289 | ||||||||||||||
|
| |||||||||||||||||
TOTAL LOAN PARTICIPATIONS | 3,033,921 | |||||||||||||||||
|
| |||||||||||||||||
| PREFERRED STOCKS - 0.3% | SHARES | VALUE (Note 5) | ||||||
| Financials - 0.3% | ||||||||
| Federal Home Loan Mortgage Corp., Perpetual Preferred Stock, Series V (2)†(e) | 119,409 | $ | 311,657 | |||||
| Federal Home Loan Mortgage Corp., Perpetual Preferred Stock, Series W (2)†(e) | 56,025 | 168,075 | ||||||
| Federal Home Loan Mortgage Corp., Perpetual Preferred Stock, Series X (2)†(e) | 50,343 | 133,409 | ||||||
| Federal Home Loan Mortgage Corp., Perpetual Preferred Stock, Series Z (2)†(e)(h) | 158,730 | 539,682 | ||||||
| Federal National Mortgage Association, Perpetual Preferred Stock, 8.250%, Series S (2)†(e)(h) | 158,730 | 555,555 | ||||||
| SHARES | VALUE (Note 5) | |||||||
| Financials - 0.3% (continued) | ||||||||
| First Banks, Inc. (3)†(b) | 2,458 | $ | 817,262 | |||||
|
| |||||||
TOTAL PREFERRED STOCKS | 2,525,640 | |||||||
|
| |||||||
| RIGHTS - 0.2% | ||||||||
| Financials - 0.1% | ||||||||
| 1347 Capital Corp. (2)†*(c) | 420,504 | 12,615 | ||||||
| Arowana, Inc. (Australia) †* | 720,000 | 144,000 | ||||||
| Barington/Hilco Acquisition Corp.†* | 487,260 | 97,745 | ||||||
| CB Pharma Acquisition Corp. (2)†* | 325,500 | 41,501 | ||||||
| DT Asia Investments Ltd. (Hong Kong) (2)† | 209,241 | 20,924 | ||||||
| Garnero Group Acquisition Co. (Brazil) †* | 2,430,200 | 583,248 | ||||||
| The accompanying notes are an integral part of these financial statements. | (Continued) |
| AQR Funds | Annual Report | December 2015 | ||||||||||||||
46
Table of Contents
| Schedule of Investments | December 31, 2015 |
| AQR DIVERSIFIED ARBITRAGE FUND |
| SHARES | VALUE (Note 5) | |||||||
| Financials - 0.1% (continued) | ||||||||
| Hydra Industries Acquisition Corp. (2)†*(c) | 1,720,000 | $ | 399,040 | |||||
| Pacific Special Acquisition Corp. (China) (2)†(c) | 373,500 | 56,025 | ||||||
|
| |||||||
| 1,355,098 | ||||||||
|
| |||||||
| Health Care - 0.1% | ||||||||
| Ambit Biosciences Corp. (3)†(b) | 146,272 | 119,171 | ||||||
| American Medical Alert Corp. (3)†(b) | 283,523 | 2,835 | ||||||
| Chelsea Therapeutics International Ltd. (3)†(b) | 4,668,137 | 197,135 | ||||||
| Community Health Systems, Inc. † | 7,762,436 | 69,862 | ||||||
| Durata Therapeutics, Inc. (3)†(b) | 261,441 | 270,657 | ||||||
| Forest Laboratories, Inc. (3)†(b) | 335,833 | — | ||||||
| Furiex Pharmaceuticals, Inc. (3)†(b) | 251,398 | 2 | ||||||
| Prosensa Holding NV (Netherlands) (3)†(b) | 197,426 | 126,100 | ||||||
|
| |||||||
| 785,762 | ||||||||
|
| |||||||
| Information Technology - 0.0% (a) | ||||||||
| Gerber Scientific, Inc. (3)†(b) | 879,944 | — | ||||||
|
| |||||||
TOTAL RIGHTS | 2,140,860 | |||||||
|
| |||||||
| SHORT-TERM INVESTMENTS - 8.7% | PRINCIPAL AMOUNT (000’s) | |||||||
| U.S. Treasury Bill, 0.327%, 5/19/2016 (c)(j) | $ | 80,647 | 80,545,143 | |||||
| U.S. Treasury Bill, 0.515%, 6/23/2016 (c)(j) | 2,164 | 2,159,189 | ||||||
|
| |||||||
TOTAL SHORT-TERM INVESTMENTS | 82,704,332 | |||||||
|
| |||||||
| WARRANTS - 1.9% | SHARES | |||||||
| Consumer Discretionary - 0.4% | ||||||||
| Del Taco Restaurants, Inc. † | 733,262 | 2,126,460 | ||||||
| Education Management Corp. (3)†(b) | 16,528,497 | 98,840 | ||||||
| Global Eagle Entertainment, Inc. (2)† | 367,857 | 1,434,642 | ||||||
| IVS Group SA (Luxembourg) (2)† | 590,301 | 7,057 | ||||||
| KBS Fashion Group Ltd. (China) (2)†(c) | 763,024 | 22,891 | ||||||
|
| |||||||
| 3,689,890 | ||||||||
|
| |||||||
| Energy - 0.0% (a) | ||||||||
| Glori Energy, Inc.(2) † | 287,100 | 5,742 | ||||||
|
| |||||||
| Financials - 0.9% | ||||||||
| 1347 Capital Corp. (2)†*(c) | 420,504 | 59,291 | ||||||
| Acasta Enterprises, Inc. (Canada) † | 579,085 | 188,327 | ||||||
| Alignvest Acquisition Corp. (Canada) † | 445,000 | 112,561 | ||||||
| AR Capital Acquisition Corp. † | 697,500 | 125,550 | ||||||
| Arowana, Inc. (Australia) (2)†* | 720,000 | 61,200 | ||||||
| Associated Banc-Corp. (2)† | 20,065 | 58,188 | ||||||
| Barington/Hilco Acquisition Corp. (2)†* | 487,260 | 60,908 | ||||||
| Boston Private Financial Holdings, Inc. † | 97,674 | 468,835 | ||||||
| Boulevard Acquisition Corp. II (2)† | 1,698,740 | 679,496 | ||||||
| Capitol Acquisition Corp. III (2)† | 1,575,000 | 661,500 | ||||||
| SHARES | VALUE (Note 5) | |||||||
| Financials - 0.9% (continued) | ||||||||
| CB Pharma Acquisition Corp. (2)†* | 325,500 | $ | 48,825 | |||||
| Comerica, Inc. (2)† | 9,708 | 30,580 | ||||||
| Double Eagle Acquisition Corp. (2)† | 2,047,500 | 532,350 | ||||||
| DT Asia Investments Ltd. (Hong Kong) (2)† | 209,241 | 20,924 | ||||||
| Dundee Acquisition Ltd. (Canada) (2)†* | 630,000 | 97,890 | ||||||
| Easterly Acquisition Corp. (2)† | 823,250 | 271,673 | ||||||
| Electrum Special Acquisition Corp. (2)† | 990,000 | 158,400 | ||||||
| FinTech Acquisition Corp. (2)†* | 810,000 | 202,500 | ||||||
| Garnero Group Acquisition Co. (Brazil) †* | 2,430,200 | 291,624 | ||||||
| Gibraltar Growth Corp. (Canada) (2)†* | 1,274,000 | 119,694 | ||||||
| Global Partner Acquisition Corp. †(c) | 1,068,000 | 305,448 | ||||||
| Gores Holdings, Inc. (3)†(b)(c) | 3,115,000 | 841,050 | ||||||
| GP Investments Acquisition Corp. (3)†*(b)(c) | 1,237,500 | 495,000 | ||||||
| Harmony Merger Corp. †*(c) | 1,475,100 | 516,285 | ||||||
| Hennessy Capital Acquisition Corp. II †(c) | 1,028,837 | 195,479 | ||||||
| Hydra Industries Acquisition Corp. (2)†*(c) | 1,720,000 | 321,640 | ||||||
| Neostem (3)†(b) | 243,000 | 2 | ||||||
| Pace Holdings Corp. (2)†(c) | 455,000 | 61,561 | ||||||
| Pacific Special Acquisition Corp. (China) (2)†(c) | 373,500 | 33,615 | ||||||
| Quinpario Acquisition Corp. 2 †(c) | 2,880,708 | 590,545 | ||||||
| ROI Acquisition Corp. II (3)†(b) | 882,000 | — | ||||||
| Terrapin 3 Acquisition Corp. (2)†(c) | 1,428,000 | 357,000 | ||||||
| Valley National Bancorp † | 49,509 | 7,426 | ||||||
| WL Ross Holding Corp. †(c) | 2,898,000 | 956,340 | ||||||
|
| |||||||
| 8,931,707 | ||||||||
|
| |||||||
| Health Care - 0.0% (a) | ||||||||
| Mast Therapeutics, Inc. (3)†(b) | 103,750 | 249 | ||||||
| Pluristem Therapeutics, Inc. (Israel) (3)†(b) | 63,750 | 6,375 | ||||||
| Venaxis, Inc. (3)†(b) | 24,000 | 1,080 | ||||||
|
| |||||||
| 7,704 | ||||||||
|
| |||||||
| Industrials - 0.3% | ||||||||
| Ability, Inc. (Israel) † | 1,454,787 | 2,036,702 | ||||||
| Blue Bird Corp. (2)† | 756,000 | 680,400 | ||||||
| Jack Cooper Holdings Corp. (2)† | 2,223 | 255,645 | ||||||
| Jason Industries, Inc. †(c) | 1,933,070 | 115,984 | ||||||
| Pingtan Marine Enterprise Ltd. (China) (2)†(c) | 395,000 | 790 | ||||||
| Tempus Applied Solutions Holdings, Inc. (3)†(b) | 614,551 | 122,910 | ||||||
|
| |||||||
| 3,212,431 | ||||||||
|
| |||||||
| Information Technology - 0.0% (a) | ||||||||
| exceet Group SE (Germany) (2)† | 72,000 | 3,443 | ||||||
| Net Element International, Inc. (Bulgaria) (3)†(b) | 319,668 | 32 | ||||||
| RMG Networks Holding Corp. (3)†(b)(c) | 631,210 | 6,312 | ||||||
|
| |||||||
| 9,787 | ||||||||
|
| |||||||
| Materials - 0.3% | ||||||||
| AgroFresh Solutions, Inc. †(c) | 504,000 | 473,760 | ||||||
| Delta Technology Holdings Ltd. (China) (2)† | 818,832 | 49,130 | ||||||
| Tecnoglass, Inc. † | 330,838 | 1,968,486 | ||||||
|
| |||||||
| 2,491,376 | ||||||||
|
| |||||||
| The accompanying notes are an integral part of these financial statements. | (Continued) |
| AQR Funds | Annual Report | December 2015 | ||||||||||||||
47
Table of Contents
| Schedule of Investments | December 31, 2015 |
| AQR DIVERSIFIED ARBITRAGE FUND |
| SHARES | VALUE (Note 5) | |||||||
| Utilities - 0.0% (a) | ||||||||
| Electrawinds SE (Germany) (3)†(b) | 621,000 | $ | 1,350 | |||||
|
| |||||||
TOTAL WARRANTS | 18,349,987 | |||||||
|
| |||||||
| MONEY MARKET FUNDS - 34.5% | ||||||||
| BlackRock Liquidity Funds T-Fund Portfolio, Institutional Shares, 0.100% (2)(k) | 11,153,760 | 11,153,760 | ||||||
| Dreyfus Treasury Cash Management, Class I, 0.090% (2)(k) | 44,615,040 | 44,615,040 | ||||||
| J.P. Morgan U.S. Treasury Plus Money Market Fund - IM Shares, 0.129% (2)(k) | 168,920,927 | 168,920,927 | ||||||
| J.P. Morgan U.S. Treasury Plus Money Market Fund - Institutional Shares, 0.070% (2)(k)(l) | 49,486,880 | 49,486,880 | ||||||
| UBS Money Series - UBS Select Treasury Preferred Fund, Class I, 0.140% (2)(k) | 55,768,800 | 55,768,800 | ||||||
|
| |||||||
TOTAL MONEY MARKET FUNDS |
| 329,945,407 | ||||||
|
| |||||||
| PURCHASED OPTIONS - 0.0% (a) | | CONTRACTS/ NOTIONAL | | |||||
Call – Charter Communication, Inc., Expires 03/18/2016, Strike $210.00 | 67 | 15,276 | ||||||
|
| |||||||
TOTAL INVESTMENTS IN |
| 1,300,405,223 | ||||||
|
| |||||||
| SECURITIES SOLD SHORT - (36.2)% | SHARES | |||||||
| COMMON STOCKS - (33.2)% | ||||||||
| Consumer Discretionary - (3.2)% | ||||||||
| Charter Communications, Inc., Class A † | (26,456 | ) | (4,844,094 | ) | ||||
| Comcast Corp., Class A | (37 | ) | (2,088 | ) | ||||
| Ferrari NV (Italy) † | (9,587 | ) | (460,176 | ) | ||||
| Fiat Chrysler Automobiles NV (United Kingdom) † | (853,617 | ) | (11,942,102 | ) | ||||
| Global Eagle Entertainment, Inc. † | (234,566 | ) | (2,315,166 | ) | ||||
| JAKKS Pacific, Inc. † | (942,106 | ) | (7,499,164 | ) | ||||
| News Corp., Class B | (39,972 | ) | (558,009 | ) | ||||
| Twenty-First Century Fox, Inc., Class B | (116,863 | ) | (3,182,179 | ) | ||||
|
| |||||||
| (30,802,978 | ) | |||||||
|
| |||||||
| Consumer Staples - (2.5)% | ||||||||
| Bunge Ltd. | (64,597 | ) | (4,410,683 | ) | ||||
| Post Holdings, Inc. † | (39,345 | ) | (2,427,587 | ) | ||||
| Tyson Foods, Inc., Class A | (206,477 | ) | (11,011,418 | ) | ||||
| Universal Corp. | (113,419 | ) | (6,360,538 | ) | ||||
|
| |||||||
| (24,210,226 | ) | |||||||
|
| |||||||
| SHARES | VALUE (Note 5) | |||||||
| Energy - (3.3)% | ||||||||
| Aegean Marine Petroleum Network, Inc. (Greece) | (195,257 | ) | $ | (1,632,349 | ) | |||
| Alon USA Energy, Inc. | (196,108 | ) | (2,910,243 | ) | ||||
| Amyris, Inc. † | (274,863 | ) | (445,278 | ) | ||||
| Cheniere Energy, Inc. † | (52,584 | ) | (1,958,754 | ) | ||||
| Renewable Energy Group, Inc. † | (176,126 | ) | (1,636,210 | ) | ||||
| Sanchez Energy Corp. † | (1,030,071 | ) | (4,439,606 | ) | ||||
| SandRidge Energy, Inc. † | (2,036,364 | ) | (407,273 | ) | ||||
| Scorpio Tankers, Inc. (Monaco) | (146,875 | ) | (1,177,937 | ) | ||||
| Ship Finance International Ltd. (Norway) | (574,072 | ) | (9,512,373 | ) | ||||
| Southwestern Energy Co. † | (1,030,887 | ) | (7,329,607 | ) | ||||
|
| |||||||
| (31,449,630 | ) | |||||||
|
| |||||||
| Financials - (3.6)% | ||||||||
| Associated Banc-Corp. | (11,343 | ) | (212,681 | ) | ||||
| Boston Private Financial Holdings, Inc. | (87,311 | ) | (990,107 | ) | ||||
| CareTrust REIT, Inc. | (62,239 | ) | (681,517 | ) | ||||
| Cowen Group, Inc., Class A † | (1,207,435 | ) | (4,624,476 | ) | ||||
| Crown Castle International Corp. REIT | (29,515 | ) | (2,551,572 | ) | ||||
| Encore Capital Group, Inc. † | (16,065 | ) | (467,170 | ) | ||||
| Ezcorp, Inc., Class A † | (37,745 | ) | (188,347 | ) | ||||
| GAIN Capital Holdings, Inc. | (116,375 | ) | (943,801 | ) | ||||
| iStar, Inc. REIT † | (410,988 | ) | (4,820,889 | ) | ||||
| Lexington Realty Trust REIT | (975,782 | ) | (7,806,256 | ) | ||||
| Maiden Holdings Ltd. | (185,868 | ) | (2,771,292 | ) | ||||
| NorthStar Realty Finance Corp. REIT | (21,952 | ) | (373,843 | ) | ||||
| Penson Worldwide, Inc. (3)†(b) | (217,523 | ) | — | |||||
| Valley National Bancorp | (1,322 | ) | (13,022 | ) | ||||
| Vonovia SE (Germany) (2) | (31,659 | ) | (978,044 | ) | ||||
| Welltower, Inc. REIT | (98,099 | ) | (6,673,675 | ) | ||||
|
| |||||||
| (34,096,692 | ) | |||||||
|
| |||||||
| Health Care - (4.7)% | ||||||||
| Accuray, Inc. † | (476,914 | ) | (3,219,169 | ) | ||||
| Acorda Therapeutics, Inc. † | (15,214 | ) | (650,855 | ) | ||||
| Albany Molecular Research, Inc. † | (82,452 | ) | (1,636,672 | ) | ||||
| Allergan PLC † | (34,112 | ) | (10,660,000 | ) | ||||
| Amsurg Corp. † | (70,046 | ) | (5,323,496 | ) | ||||
| Anthem, Inc. | (78,046 | ) | (10,882,734 | ) | ||||
| China Medical Technologies, Inc. ADR (China) (3)†(b) | (45,264 | ) | (453 | ) | ||||
| Healthways, Inc. † | (174,039 | ) | (2,239,882 | ) | ||||
| Medicines Co./The † | (221,781 | ) | (8,281,303 | ) | ||||
| PDL BioPharma, Inc. | (2,728 | ) | (9,657 | ) | ||||
| Sequenom, Inc. † | (332,361 | ) | (545,072 | ) | ||||
| Spectrum Pharmaceuticals, Inc. † | (287,312 | ) | (1,732,491 | ) | ||||
|
| |||||||
| (45,181,784 | ) | |||||||
|
| |||||||
| Industrials - (0.6)% | ||||||||
| Cenveo, Inc. † | (10,868 | ) | (9,470 | ) | ||||
| General Cable Corp. | (31,961 | ) | (429,236 | ) | ||||
| Meritor, Inc. † | (542,479 | ) | (4,529,700 | ) | ||||
| Titan International, Inc. | (151,356 | ) | (596,343 | ) | ||||
|
| |||||||
| (5,564,749 | ) | |||||||
|
| |||||||
| The accompanying notes are an integral part of these financial statements. | (Continued) |
| AQR Funds | Annual Report | December 2015 | ||||||||||||||
48
Table of Contents
| Schedule of Investments | December 31, 2015 |
| AQR DIVERSIFIED ARBITRAGE FUND |
| SHARES | VALUE (Note 5) | |||||||
| Information Technology - (11.8)% | ||||||||
| Alibaba Group Holding Ltd. ADR (China) † | (678,163 | ) | $ | (55,114,307 | ) | |||
| Alphabet, Inc., Class A † | (5,794 | ) | (4,507,790 | ) | ||||
| Avid Technology, Inc. † | (34,598 | ) | (252,219 | ) | ||||
| Convergys Corp. | (346,247 | ) | (8,618,088 | ) | ||||
| Microchip Technology, Inc. | (235,015 | ) | (10,937,598 | ) | ||||
| Micron Technology, Inc. † | (105,031 | ) | (1,487,239 | ) | ||||
| ModusLink Global Solutions, Inc. † | (398,025 | ) | (987,102 | ) | ||||
| Nokia OYJ ADR (Finland) | (1,947 | ) | (13,668 | ) | ||||
| Quantum Corp. † | (470,856 | ) | (437,896 | ) | ||||
| SunEdison, Inc. † | (850,690 | ) | (4,330,012 | ) | ||||
| TTM Technologies, Inc. † | (420,700 | ) | (2,738,757 | ) | ||||
| VeriSign, Inc. † | (120,315 | ) | (10,510,718 | ) | ||||
| Vishay Intertechnology, Inc. | (1,024,090 | ) | (12,340,285 | ) | ||||
|
| |||||||
| (112,275,679 | ) | |||||||
|
| |||||||
| Materials - (0.3)% | ||||||||
| A Schulman, Inc. | (62,757 | ) | (1,922,874 | ) | ||||
| A.M. Castle & Co. † | (10,793 | ) | (17,161 | ) | ||||
| SHARES | VALUE (Note 5) | |||||||
| Materials - (0.3)% (continued) | ||||||||
| EI du Pont de Nemours & Co. | (2,821 | ) | $ | (187,879 | ) | |||
| Stillwater Mining Co. † | (88,877 | ) | (761,676 | ) | ||||
|
| |||||||
| (2,889,590) | ||||||||
|
| |||||||
| Telecommunication Services - (1.7)% | ||||||||
| T-Mobile US, Inc. † | (419,880 | ) | (16,425,706 | ) | ||||
|
| |||||||
| Utilities - (1.5)% | ||||||||
| Dominion Resources, Inc. | (190,626 | ) | (12,893,943 | ) | ||||
| NRG Yield, Inc., Class A | (91,757 | ) | (1,276,340 | ) | ||||
|
| |||||||
| (14,170,283) | ||||||||
|
| |||||||
TOTAL COMMON STOCKS SOLD SHORT | (317,067,317 | ) | ||||||
|
| |||||||
| CONVERTIBLE BONDS - (2.9)% | INTEREST RATE | MATURITY DATE | PRINCIPAL AMOUNT (000’s) | VALUE (Note 5) | ||||||||||||||
| Information Technology - (2.9)% | ||||||||||||||||||
| Akamai Technologies, Inc. (2) | 0.000% | 02/15/19 | $ | (1,600 | ) | $ | (1,534,000 | ) | ||||||||||
| Citrix Systems, Inc. (2) | 0.500% | 04/15/19 | (9,975 | ) | (10,847,812 | ) | ||||||||||||
| Red Hat, Inc. (2) | 0.250% | 10/01/19 | (12,225 | ) | (15,915,422 | ) | ||||||||||||
|
| |||||||||||||||||
TOTAL CONVERTIBLE BONDS SOLD SHORT | (28,297,234 | ) | ||||||||||||||||
|
| |||||||||||||||||
| EXCHANGE-TRADED FUND (ETF) -(0.1)% | SHARES | VALUE (Note 5) | ||||||
| SPDR S&P Oil & Gas Exploration & Production ETF | ||||||||
(proceeds $837,819) | (22,494 | ) | $ | (679,769 | ) | |||
|
| |||||||
TOTAL SECURITIES SOLD SHORT, AT VALUE | (346,044,320 | ) | ||||||
|
| |||||||
TOTAL INVESTMENTS, NET OF SECURITIES SOLD SHORT - 99.8% | 954,360,903 | |||||||
|
| |||||||
| OTHER ASSETS IN EXCESS OF LIABILITIES - 0.2% (m) | 1,928,342 | |||||||
|
| |||||||
| NET ASSETS - 100.0% | $956,289,245 | |||||||
|
| |||||||
| † | Non-income producing security. |
| * | Affiliated company as defined under the Investment Company Act of 1940. |
| (a) | Represents less than 0.05% of net assets. |
| (b) | Security fair valued as of December 31, 2015 using procedures approved by the Board of Trustees. The total value of positions fair valued was $49,511,641 or 5.2% of total net assets. |
| (c) | All or a portion of this security has been segregated as collateral for securities sold short and can be sold or replaced subject to |
| the broker’s right to re-hypothecate. At December 31, 2015, the value of these securities was $684,668,763. |
| (d) | Represents a Pay-in-Kind. Income may be received in additional securities and/or cash. |
| (e) | Security is perpetual and, thus, does not have a predetermined maturity date. The date shown, if applicable, reflects the next call date. The rate shown represents the variable dividend rate in effect as of the close of the reporting period. |
| (f) | Rule 144A, Section 4(2) or other security which is restricted as to resale to institutional investors. The Fund Adviser has deemed this security to be liquid based upon procedures approved by the Board of Trustees. |
| (g) | Defaulted security. |
| (h) | Indicates a variable rate security. The interest rate shown represents the rate as of the close of the reporting period. |
| (i) | Represents a step bond. The rate shown reflects the rate as of close of the reporting period. |
| (j) | The rate shown is the effective yield at the date of purchase. |
| (k) | Represents annualized seven-day yield as of the close of the reporting period. |
| (l) | All or a portion of the security is pledged as collateral to the brokers for forward foreign currency exchange and swap contracts. |
| (m) | Includes appreciation/(depreciation) on forward foreign currency exchange, futures, swap contracts and call options written. |
| (n) | All or a portion of this security has been segregated for covered call option written. |
| The accompanying notes are an integral part of these financial statements. | (Continued) |
| AQR Funds | Annual Report | December 2015 | ||||||||||||||
49
Table of Contents
| Schedule of Investments | December 31, 2015 |
| AQR DIVERSIFIED ARBITRAGE FUND |
All bonds are denominated in US dollars, unless noted otherwise.
All securities are United States companies, unless noted otherwise in parentheses.
All securities are Level 1 with respect to ASC 820, unless otherwise noted in parentheses.
| (2) | Level 2 security (See Note 5). |
| (3) | Level 3 security (See Note 5). |
The following abbreviations are used in portfolio descriptions:
144A - Restricted Security
ADR - American Depositary Receipt
REIT - Real Estate Investment Trust
Credit default swap contracts buy protection as of December 31, 2015:
| COUNTERPARTY | REFERENCE ENTITY | FIXED ANNUAL RATE PAID BY FUND | CURRENCY | CREDIT SPREAD | NOTIONAL AMOUNT | UPFRONT PREMIUM (RECEIVED) PAID | TERMINATION DATE | UNREALIZED APPRECIATION (DEPRECIATION) | ||||||||||||||||||||
| Exchange Cleared | ||||||||||||||||||||||||||||
| CitiBank | Markit CDX North America High Yield Index Series 25 | 5.000% | USD | 4.726% | 97,000,000 | $395,173 | 12/20/2020 | $(1,639,756 | ) | |||||||||||||||||||
| CitiBank | Markit CDX North America Investment Grade Index Series 25 | 1.000% | USD | 0.885% | 575,000 | (5,026 | ) | 12/20/2020 | 1,751 | |||||||||||||||||||
|
|
|
| |||||||||||||||||||||||||
| $390,147 | $(1,638,005 | ) | ||||||||||||||||||||||||||
|
|
|
| |||||||||||||||||||||||||
Open written options contracts outstanding at December 31, 2015:
Exchange Traded
Call options written
| NUMBER OF CONTRACTS | ISSUER | COUNTERPARTY | EXPIRATION DATE | PROCEEDS | VALUE AT DECEMBER 31, 2015 | UNREALIZED APPRECIATION (DEPRECIATION) | ||||||||||||||
| 4,000 | General Motors Co. (Exercise price $42) | J.P. Morgan | 01/15/2016 | $(2,203,697 | ) | $(4,000 | ) | $2,199,697 | ||||||||||||
| 796 | King Digital Entertainment PLC (Exercise price $18) | J.P. Morgan | 02/19/2016 | (12,683 | ) | (7,960 | ) | 4,723 | ||||||||||||
|
|
|
|
|
| |||||||||||||||
| $(2,216,380 | ) | $(11,960 | ) | $2,204,420 | ||||||||||||||||
|
|
|
|
|
| |||||||||||||||
Put options written
| NUMBER OF CONTRACTS | ISSUER | COUNTERPARTY | EXPIRATION DATE | PROCEEDS | VALUE AT DECEMBER 31, | UNREALIZED APPRECIATION (DEPRECIATION) | ||||||||||||||
| 67 | Charter Communication, Inc. (Exercise price $210) | J.P. Morgan | 03/18/2016 | $(172,051 | ) | $(189,476 | ) | $(17,425 | ) | |||||||||||
|
|
|
|
|
| |||||||||||||||
| The accompanying notes are an integral part of these financial statements. | (Continued) |
| AQR Funds | Annual Report | December 2015 | ||||||||||||||
50
Table of Contents
| Schedule of Investments | December 31, 2015 |
| AQR DIVERSIFIED ARBITRAGE FUND |
Open futures contracts outstanding at December 31, 2015:
Exchange Traded
| NUMBER OF CONTRACTS | COUNTERPARTY | DESCRIPTION | EXPIRATION DATE | VALUE AT TRADE DATE | VALUE AT DECEMBER 31, 2015 | UNREALIZED APPRECIATION (DEPRECIATION) | ||||||||||||||
| Short Contracts: | ||||||||||||||||||||
| 284 | Barclays Capital | Euro Stoxx 50 Index | 03/2016 | $(9,986,931 | ) | $(10,129,466 | ) | $(142,535 | ) | |||||||||||
| 352 | Barclays Capital | S&P 500 E-Mini Futures | 03/2016 | (35,430,596 | ) | (35,823,040 | ) | (392,444 | ) | |||||||||||
| 441 | Barclays Capital | U.S. Treasury 10-Year Note Futures | 03/2016 | (55,680,133 | ) | (55,524,656 | ) | 155,477 | ||||||||||||
| 399 | J.P. Morgan | U.S. Treasury 2-Year Note Futures | 03/2016 | (86,805,361 | ) | (86,676,516 | ) | 128,845 | ||||||||||||
| 198 | J.P. Morgan | U.S. Treasury 5-Year Note Futures | 03/2016 | (23,480,976 | ) | (23,427,422 | ) | 53,554 | ||||||||||||
|
|
|
|
|
| |||||||||||||||
| $(211,383,997 | ) | $(211,581,100 | ) | $(197,103 | ) | |||||||||||||||
|
|
|
|
|
| |||||||||||||||
Forward foreign currency exchange contracts outstanding as of December 31, 2015:
Over the Counter
| PURCHASE CONTRACTS | COUNTERPARTY | CURRENCY | CURRENCY AMOUNT PURCHASED | VALUE AT SETTLEMENT DATE | VALUE AT DECEMBER 31, 2015 | UNREALIZED APPRECIATION (DEPRECIATION) | ||||||||||||||
| Canadian Dollar, Expiring 03/16/16 | CitiBank | CAD | 8,130,000 | $5,843,706 | $5,876,683 | $32,977 | ||||||||||||||
| Canadian Dollar, Expiring 03/16/16 | Credit Suisse International | CAD | 7,457,082 | 5,458,158 | 5,390,272 | (67,886 | ) | |||||||||||||
| Euro, Expiring 03/16/16 | Credit Suisse International | EUR | 1,424,338 | 1,552,627 | 1,550,744 | (1,883 | ) | |||||||||||||
| Euro, Expiring 04/05/16 | Credit Suisse International | EUR | 21,000 | 22,913 | 22,877 | (36 | ) | |||||||||||||
| Euro, Expiring 04/05/17 | Credit Suisse International | EUR | 21,000 | 23,363 | 23,237 | (126 | ) | |||||||||||||
|
|
|
|
|
| |||||||||||||||
| $12,900,767 | $12,863,813 | $(36,954 | ) | |||||||||||||||||
|
|
|
|
|
| |||||||||||||||
| The accompanying notes are an integral part of these financial statements. | (Continued) |
| AQR Funds | Annual Report | December 2015 | ||||||||||||||
51
Table of Contents
| Schedule of Investments | December 31, 2015 |
| AQR DIVERSIFIED ARBITRAGE FUND |
| SALES CONTRACTS | COUNTERPARTY | CURRENCY | CURRENCY AMOUNT SOLD | VALUE AT SETTLEMENT DATE | VALUE AT DECEMBER 31, 2015 | UNREALIZED APPRECIATION (DEPRECIATION) | ||||||||||||||
| Canadian Dollar, Expiring 03/16/16 | CitiBank | CAD | (28,664,391 | ) | $(21,432,232 | ) | $(20,719,749 | ) | $712,483 | |||||||||||
| Canadian Dollar, Expiring 03/16/16 | Credit Suisse International | CAD | (28,664,391 | ) | (21,432,233 | ) | (20,719,748 | ) | 712,485 | |||||||||||
| Euro, Expiring 03/16/16 | CitiBank | EUR | (5,699,458 | ) | (6,066,810 | ) | (6,205,267 | ) | (138,457 | ) | ||||||||||
| Euro, Expiring 03/16/16 | Credit Suisse International | EUR | (6,573,466 | ) | (7,000,841 | ) | (7,156,841 | ) | (156,000 | ) | ||||||||||
| Euro, Expiring 04/05/16 | Credit Suisse International | EUR | (21,000 | ) | (27,886 | ) | (22,876 | ) | 5,010 | |||||||||||
| Euro, Expiring 04/05/17 | Credit Suisse International | EUR | (21,000 | ) | (28,010 | ) | (23,237 | ) | 4,773 | |||||||||||
|
|
|
|
|
| |||||||||||||||
| (55,988,012 | ) | (54,847,718 | ) | 1,140,294 | ||||||||||||||||
|
|
|
|
|
| |||||||||||||||
| $(43,087,245 | ) | $(41,983,905 | ) | $1,103,340 | ||||||||||||||||
|
|
|
|
|
| |||||||||||||||
CAD - Canadian Dollar
EUR - Euro
USD - United States Dollar
Total Return Basket Swaps* Outstanding at December 31, 2015
Over the Counter
| COUNTERPARTY | DESCRIPTION | TERMINATION DATE** | VALUE (Note 5) | |||||
| Bank of America | The Fund receives the total return on a portfolio of long and short positions and pays or receives the Federal Funds Effective Rate plus or minus a specified spread, which is denominated in USD based on the local currencies of the positions within the swap. | 66 to 67 months maturity 08/12/2019 | $126,482 | |||||
|
| |||||||
| * | See the accompanying “Additional Information — Total Return Basket Swap” for further details |
| ** | The maturity dates are measured from the commencement of investment in each underlying swap position. |
Additional Information — Total Return Basket Swaps
The following table represents the individual short positions and related values within the total return basket swap as of December 31, 2015.
| REFERENCE ENTITY | SHARES | NOTIONAL (a) | NET UNREALIZED APPRECIATION (DEPRECIATION) | |||||||||
| Short Positions | ||||||||||||
| Common Stock | ||||||||||||
| United States | ||||||||||||
| Herbalife Ltd. | (48,266 | ) | $ | (2,714,480 | ) | $ | 126,457 | |||||
|
| |||||||||||
Net Cash and Other | 25 | |||||||||||
|
| |||||||||||
Swaps, at Value | $ | 126,482 | ||||||||||
|
| |||||||||||
| (a) | Notional value represents the market value (including any fees or commissions) of the short positions when they are established. |
| (b) | Cash and other receivables/(payables) includes the gains (or losses) realized within the swap when the swap resets. |
| The accompanying notes are an integral part of these financial statements. | (Continued) |
| AQR Funds | Annual Report | December 2015 | ||||||||||||||
52
Table of Contents
| Schedule of Investments | December 31, 2015 |
| AQR DIVERSIFIED ARBITRAGE FUND |
| COUNTERPARTY | DESCRIPTION | TERMINATION DATE** | VALUE (Note 5) | |||||
| Deutsche Bank | The Fund receives the total return on a portfolio of long and short positions and pays or receives the Federal Funds floating rate plus or minus a specified spread, which is denominated in USD based on the local currencies of the positions within the swap. | 25 months maturity 11/10/2016 | $189,085 | |||||
|
| |||||||
| ** | The maturity dates are measured from the commencement of investment in each underlying swap position. |
Additional Information — Total Return Basket Swaps
The following table represents the individual long positions and related values within the total return basket swap as of December 31, 2015.
| REFERENCE ENTITY | SHARES | NOTIONAL (a) | NET UNREALIZED APPRECIATION (DEPRECIATION) | |||||||||
| Long Positions | ||||||||||||
| Common Stocks | ||||||||||||
| United States | ||||||||||||
| CareTrust REIT, Inc. | 62,239 | $ | — | $ | 681,517 | |||||||
|
| |||||||||||
| PRINCIPAL | ||||||||||||
| Corporate Bonds | ||||||||||||
| United Kingdom | ||||||||||||
| Virgin Media Finance PLC | $ | 11,400,000 | 10,771,328 | (230,291 | ) | |||||||
|
| |||||||||||
REFERENCE | PRINCIPAL | NOTIONAL (a) | NET UNREALIZED APPRECIATION (DEPRECIATION) | |||||||||
| Convertible Bonds | ||||||||||||
| United States | ||||||||||||
| HomeAway, Inc. | $ | 2,375,000 | $ | 2,457,258 | $ | (84,482 | ) | |||||
|
| |||||||||||
Total of Long Equity and Bond Positions | 366,744 | |||||||||||
|
| |||||||||||
Net Cash and Other Receivables/ (Payables) (b) | (177,659 | ) | ||||||||||
|
| |||||||||||
Swaps, at Value | $ | 189,085 | ||||||||||
|
| |||||||||||
| (a) | Notional value represents the market value (including any fees or commissions) of the long positions when they are established. |
| (b) | Cash and other receivables/(payables) includes the gains (or losses) realized within the swap when the swap resets. |
| COUNTERPARTY | DESCRIPTION | TERMINATION DATE** | VALUE (Note 5) | |||||
| Deutsche Bank | The Fund receives the total return on a portfolio of long and short positions and pays or receives the JPY/USD 1 Week Forward Swap Rate plus or minus a specified spread, which is denominated in JPY based on the local currencies of the positions within the swap. | 25 months maturity 10/19/2016 | $(1,971,221 | ) | ||||
|
| |||||||
| ** | The maturity dates are measured from the commencement of investment in each underlying swap position. |
Additional Information — Total Return Basket Swaps
The following table represents the individual short positions and related values within the total return basket swap as of December 31, 2015.
| REFERENCE ENTITY | SHARES | NOTIONAL (a) | NET UNREALIZED APPRECIATION (DEPRECIATION) | |||||||||
| Short Positions | ||||||||||||
| Common Stocks | ||||||||||||
| Japan | ||||||||||||
| Yahoo Japan Corp. | (3,591,338 | ) | $ | (13,645,986 | ) | $ | (952,461 | ) | ||||
|
| |||||||||||
Net Cash and Other Receivables/ (Payables) (b) | (1,018,760 | ) | ||||||||||
|
| |||||||||||
Swaps, at Value | $ | (1,971,221 | ) | |||||||||
|
| |||||||||||
| (a) | Notional value represents the market value (including any fees or commissions) of the short positions when they are established. |
| (b) | Cash and other receivables/(payables) includes the gains (or losses) realized within the swap when the swap resets. |
| The accompanying notes are an integral part of these financial statements. | (Continued) |
| AQR Funds | Annual Report | December 2015 | ||||||||||||||
53
Table of Contents
| Schedule of Investments | December 31, 2015 |
| AQR DIVERSIFIED ARBITRAGE FUND |
| COUNTERPARTY | DESCRIPTION | TERMINATION DATE** | VALUE (Note 5) | |||||
| Deutsche Bank | The Fund receives the total return on a portfolio of long and short positions and pays or receives the EUR/USD 1 Week Forward Swap Rate plus or minus a specified spread, which is denominated in EUR based on the local currencies of the positions within the swap. | 12 months maturity 12/19/2016 | $978 | |||||
|
| |||||||
| ** | The maturity dates are measured from the commencement of investment in each underlying swap position. |
Additional Information — Total Return Basket Swaps
The following table represents the individual long and short positions and related values within the total return basket swap as of December 31, 2015.
| REFERENCE ENTITY | SHARES | NOTIONAL (a) | NET UNREALIZED APPRECIATION (DEPRECIATION) | |||||||||
| Long Positions | ||||||||||||
| Common Stocks | ||||||||||||
| Italy | ||||||||||||
| Telecom Italia SpA | 471,432 | $ | 469,174 | $ | 14,669 | |||||||
|
| |||||||||||
| Short Positions | ||||||||||||
| Common Stocks | ||||||||||||
| Italy | ||||||||||||
| Telecom Italia SpA | (471,432 | ) | (583,973 | ) | (13,480 | ) | ||||||
|
| |||||||||||
Total of Long and Short Equity Positions | 1,189 | |||||||||||
|
| |||||||||||
Net Cash and Other Receivables/ (Payables) (b) | (211 | ) | ||||||||||
|
| |||||||||||
Swaps, at Value | $ | 978 | ||||||||||
|
| |||||||||||
| (a) | Notional value represents the market value (including any fees or commissions) of the short positions when they are established. |
| (b) | Cash and other receivables/(payables) includes the gains (or losses) realized within the swap when the swap resets. |
| The accompanying notes are an integral part of these financial statements. | (Continued) |
| AQR Funds | Annual Report | December 2015 | ||||||||||||||
54
Table of Contents
| Schedule of Investments | December 31, 2015 |
| AQR DIVERSIFIED ARBITRAGE FUND |
| COUNTERPARTY | DESCRIPTION | TERMINATION DATE** | VALUE (Note 5) | |||||
| Deutsche Bank | The Fund receives the total return on a portfolio of long and short positions and pays or receives the Federal Funds floating rate plus or minus a specified spread, which is denominated in USD based on the local currencies of the positions within the swap. | 25 months maturity 08/31/2016 | $(1,030,621 | ) | ||||
|
| |||||||
| ** | The maturity dates are measured from the commencement of investment in each underlying swap position. |
Additional Information — Total Return Basket Swaps
The following table represents the individual long and short positions and related values within the total return basket swap as of December 31, 2015.
| REFERENCE ENTITY | SHARES | NOTIONAL (a) | NET UNREALIZED APPRECIATION (DEPRECIATION) | |||||||||
| Long Positions | ||||||||||||
| Common Stocks | ||||||||||||
| France | ||||||||||||
| Alcatel-Lucent | 1,450,477 | $ | 5,482,803 | $ | 72,524 | |||||||
|
| |||||||||||
| Ireland | ||||||||||||
| Avolon Holdings Ltd. | 99,567 | 3,036,793 | 45,801 | |||||||||
| King Digital Entertainment PLC | 196,994 | 3,528,163 | (5,910 | ) | ||||||||
|
| |||||||||||
| 39,891 | ||||||||||||
|
| |||||||||||
| Israel | ||||||||||||
| EZchip Semiconductor Ltd. | 132,237 | 3,221,293 | 47,605 | |||||||||
|
| |||||||||||
| Netherlands | ||||||||||||
| NXP Semiconductors NV | 384 | 35,652 | (3,300 | ) | ||||||||
|
| |||||||||||
| Taiwan | ||||||||||||
| Inotera Memories, Inc. | 1,022,676 | 878,593 | (15,966 | ) | ||||||||
|
| |||||||||||
| United States | ||||||||||||
| AGL Resources, Inc. | 64,904 | 4,031,346 | 110,178 | |||||||||
| Airgas, Inc. | 12,960 | 1,796,386 | (3,758 | ) | ||||||||
| Allergan PLC | 10,769 | 3,280,916 | 84,397 | |||||||||
| American Residential Properties, Inc. | 63,321 | 1,179,670 | 17,097 | |||||||||
| Ark Restaurants Corp. | 16,640 | 388,045 | (3,661 | ) | ||||||||
| Astoria Financial Corp. | 138,948 | 2,235,673 | (33,348 | ) | ||||||||
| Atmel Corp. | 158,201 | 1,365,275 | (3,164 | ) | ||||||||
| Avangrid, Inc. | 919 | 36,650 | (1,360 | ) | ||||||||
| Baker Hughes, Inc. | 122,219 | 6,517,939 | (877,532 | ) | ||||||||
| Baxalta, Inc. | 35,261 | 1,165,729 | 210,508 | |||||||||
| BioMed Realty Trust, Inc. | 222,279 | 5,252,453 | 13,337 | |||||||||
| Blount International, Inc. | 186,112 | 1,833,203 | (7,444 | ) | ||||||||
| Boulder Brands, Inc. | 176,082 | 1,933,160 | 220 | |||||||||
| Broadcom Corp. | 74,114 | 3,819,836 | 465,436 | |||||||||
| Cablevision Systems Corp. | 103,795 | 3,422,121 | (111,061 | ) | ||||||||
| Cameron International Corp. | 35,465 | 2,317,283 | (75,895 | ) | ||||||||
| REFERENCE ENTITY | SHARES | NOTIONAL (a) | NET UNREALIZED APPRECIATION (DEPRECIATION) | |||||||||
| United States (continued) | ||||||||||||
| Chubb Corp./The | 28,323 | $ | 3,606,084 | $ | 150,678 | |||||||
| Cigna Corp. | 26,565 | 3,750,932 | 136,324 | |||||||||
| Cleco Corp. | 96,676 | 5,152,831 | (105,377 | ) | ||||||||
| Community Bank System, Inc. | 5,282 | 201,362 | 9,601 | |||||||||
| Constant Contact, Inc. | 93,789 | 2,672,986 | 69,404 | |||||||||
| Diamond Foods, Inc. | 32,898 | 1,306,051 | (37,833 | ) | ||||||||
| Dyax Corp. | 50,988 | 1,921,738 | (3,569 | ) | ||||||||
| EMC Corp. | 61,859 | 1,610,808 | (22,269 | ) | ||||||||
| Fidelity & Guaranty Life | 113,992 | 2,904,691 | (12,714 | ) | ||||||||
| First Niagara Financial Group, Inc. | 405,156 | 4,421,175 | (25,233 | ) | ||||||||
| Hawaiian Electric Industries, Inc. | 167,188 | 4,955,452 | (115,360 | ) | ||||||||
| Health Net, Inc. | 61,760 | 3,996,440 | 231,650 | |||||||||
| Heartland Payment Systems, Inc. | 15,837 | 1,519,243 | (17,579 | ) | ||||||||
| Humana, Inc. | 29,858 | 5,573,593 | (243,641 | ) | ||||||||
| Inland Real Estate Corp. | 210,426 | 2,287,331 | (52,607 | ) | ||||||||
| Jarden Corp. | 79,859 | 4,541,581 | 19,965 | |||||||||
| Journal Media Group, Inc. | 131,965 | 1,603,351 | (17,132 | ) | ||||||||
| Keurig Green Mountain, Inc. | 34,943 | 3,135,435 | 8,736 | |||||||||
| KLA-Tencor Corp. | 53,117 | 3,677,343 | 6,321 | |||||||||
| MedAssets, Inc. | 90,884 | 2,804,250 | 7,701 | |||||||||
| Media General, Inc. | 126,912 | 1,902,714 | 146,915 | |||||||||
| Metro Bancorp, Inc. | 96,143 | 2,888,136 | 128,832 | |||||||||
| National Penn Bancshares, Inc. | 304,417 | 3,652,780 | 100,682 | |||||||||
| NewBridge BanCorp. | 30,865 | 378,544 | (2,608 | ) | ||||||||
| Norfolk Southern Corp. | 10,525 | 914,096 | (23,787 | ) | ||||||||
| Office Depot, Inc. | 1,378,912 | 9,845,432 | (2,068,368 | ) | ||||||||
| PartnerRe Ltd. | 23,723 | 3,301,767 | 13,285 | |||||||||
| Pep Boys-Manny Moe & Jack/The | 112,537 | 1,958,144 | 113,662 | |||||||||
| Pepco Holdings, Inc. | 270,850 | 7,158,565 | (113,757 | ) | ||||||||
| Phoenix Cos., Inc. | 36,312 | 1,319,172 | 25,825 | |||||||||
| Piedmont Natural Gas Co., Inc. | 43,541 | 2,488,897 | (6,189 | ) | ||||||||
| The accompanying notes are an integral part of these financial statements. | (Continued) |
| AQR Funds | Annual Report | December 2015 | ||||||||||||||
55
Table of Contents
| Schedule of Investments | December 31, 2015 |
| AQR DIVERSIFIED ARBITRAGE FUND |
REFERENCE | SHARES | NOTIONAL (a) | NET UNREALIZED APPRECIATION (DEPRECIATION) | |||||||||
| United States (continued) | ||||||||||||
| Pinnacle Entertainment, Inc. | 5,923 | $ | 216,486 | $ | (32,162 | ) | ||||||
| Plum Creek Timber Co., Inc. | 64,713 | 3,121,755 | (33,651 | ) | ||||||||
| PMC-Sierra, Inc. | 361,693 | 4,218,395 | (15,522 | ) | ||||||||
| Precision Castparts Corp. | 25,161 | 5,824,017 | 13,587 | |||||||||
| RealD, Inc. | 226,553 | 2,367,479 | 22,655 | |||||||||
| Rentrak Corp. | 5,840 | 282,195 | (4,619 | ) | ||||||||
| Rite Aid Corp. | 361,231 | 2,850,113 | (18,062 | ) | ||||||||
| SanDisk Corp. | 62,592 | 4,731,329 | 25,037 | |||||||||
| Sirona Dental Systems, Inc. | 4,697 | 519,622 | (4,972 | ) | ||||||||
| SolarWinds, Inc. | 44,549 | 2,601,259 | 22,677 | |||||||||
| Solera Holdings, Inc. | 79,487 | 4,314,554 | 43,718 | |||||||||
| StanCorp Financial Group, Inc. | 36,699 | 4,206,439 | (27,157 | ) | ||||||||
| Starwood Hotels & Resorts Worldwide, Inc. | 16,661 | 1,168,936 | (14,662 | ) | ||||||||
| Symetra Financial Corp. | 147,810 | 4,692,967 | 2,956 | |||||||||
| TECO Energy, Inc. | 113,820 | 3,069,725 | (36,422 | ) | ||||||||
| TeleCommunication Systems, Inc. | 421,275 | 2,097,949 | (4,213 | ) | ||||||||
| Time Warner Cable, Inc. | 7,025 | 1,315,993 | (12,224 | ) | ||||||||
| Vivint Solar, Inc. | 201,310 | 2,455,982 | (531,458 | ) | ||||||||
| Wausau Paper Corp. | 139,680 | 1,430,323 | (1,397 | ) | ||||||||
| Wilshire Bancorp, Inc. | 86,652 | 1,061,487 | (60,656 | ) | ||||||||
|
| |||||||||||
| (2,581,039 | ) | |||||||||||
|
| |||||||||||
| Total of Long Equity Positions | (2,440,285) | |||||||||||
|
| |||||||||||
| Rights | ||||||||||||
| Netherlands | ||||||||||||
| Prosensa Holding NV (3) | 7,998 | — | 5,108 | |||||||||
|
| |||||||||||
| United States | ||||||||||||
| Durata Therapeutics, Inc. (3) | 89,246 | 87,949 | 4,443 | |||||||||
| Safeway, Inc. (3) | 351,185 | — | 16,952 | |||||||||
| Safeway, Inc. (3) | 351,185 | — | 51,874 | |||||||||
|
| |||||||||||
| 73,269 | ||||||||||||
|
| |||||||||||
Total Rights | 78,377 | |||||||||||
|
| |||||||||||
Total of Long Equity Positions and Rights | (2,361,908 | ) | ||||||||||
|
| |||||||||||
| Short Positions | ||||||||||||
| Common Stocks | ||||||||||||
| Finland | ||||||||||||
| Nokia OYJ | (753,960 | ) | (5,285,260 | ) | (7,540 | ) | ||||||
|
| |||||||||||
| Ireland | ||||||||||||
| Shire PLC | (5,949 | ) | (1,274,276 | ) | 54,731 | |||||||
|
| |||||||||||
| Singapore | ||||||||||||
| Avago Technologies Ltd. | (12,696 | ) | (1,510,316 | ) | (332,508 | ) | ||||||
|
| |||||||||||
REFERENCE | SHARES | NOTIONAL (a) | NET UNREALIZED APPRECIATION (DEPRECIATION) | |||||||||
| Switzerland | ||||||||||||
| ACE Ltd. | (17,160 | ) | $ | (1,879,192 | ) | $ | (125,954 | ) | ||||
|
| |||||||||||
| United Kingdom | ||||||||||||
| Liberty Global PLC | (204 | ) | (7,963 | ) | (678 | ) | ||||||
| Liberty Global PLC | (494 | ) | (18,534 | ) | (1,607 | ) | ||||||
|
| |||||||||||
| (2,285 | ) | |||||||||||
|
| |||||||||||
| United States | ||||||||||||
| Aetna, Inc. | (25,006 | ) | (2,743,016 | ) | 39,367 | |||||||
| American Homes 4 Rent | (71,870 | ) | (1,178,668 | ) | (18,686 | ) | ||||||
| Anthem, Inc. | (13,687 | ) | (2,020,304 | ) | 111,789 | |||||||
| ARRIS Group, Inc. | (150,113 | ) | (4,318,963 | ) | (269,992 | ) | ||||||
| Ball Corp. | (34,881 | ) | (2,362,770 | ) | (174,125 | ) | ||||||
| BB&T Corp. | (67,829 | ) | (2,476,849 | ) | (87,766 | ) | ||||||
| Centene Corp. | (38,415 | ) | (2,353,830 | ) | (174,262 | ) | ||||||
| comScore, Inc. | (5,839 | ) | (246,050 | ) | 5,775 | |||||||
| DENTSPLY International, Inc. | (9,456 | ) | (580,375 | ) | 4,978 | |||||||
| Diebold, Inc. | (17,451 | ) | (551,626 | ) | 26,526 | |||||||
| Equinix, Inc. | (7,888 | ) | (2,248,446 | ) | (136,885 | ) | ||||||
| Expedia, Inc. | (116 | ) | (16,122 | ) | 1,703 | |||||||
| FNB Corp. | (228,148 | ) | (2,984,300 | ) | (59,195 | ) | ||||||
| Gaming and Leisure Properties, Inc. | (5,035 | ) | (151,352 | ) | 11,379 | |||||||
| Global Payments, Inc. | (10,571 | ) | (693,669 | ) | 11,734 | |||||||
| Gramercy Property Trust | (2,943 | ) | (21,366 | ) | (1,354 | ) | ||||||
| Halliburton Co. | (136,886 | ) | (5,092,851 | ) | 433,252 | |||||||
| Iron Mountain, Inc. | (55,244 | ) | (1,750,130 | ) | 257,989 | |||||||
| KeyCorp. | (275,506 | ) | (3,672,581 | ) | 38,657 | |||||||
| Lam Research Corp. | (26,559 | ) | (2,135,203 | ) | 25,887 | |||||||
| Microsemi Corp. | (27,895 | ) | (917,136 | ) | 8,038 | |||||||
| New York Community Bancorp, Inc. | (138,948 | ) | (2,307,926 | ) | 40,295 | |||||||
| Newell Rubbermaid, Inc. | (68,800 | ) | (3,045,776 | ) | 13,072 | |||||||
| Nexstar Broadcasting Group, Inc. | (12,996 | ) | (704,224 | ) | (58,641 | ) | ||||||
| NextEra Energy, Inc. | (40,343 | ) | (4,186,393 | ) | (4,841 | ) | ||||||
| Pfizer, Inc. | (121,689 | ) | (3,807,965 | ) | (120,156 | ) | ||||||
| Schlumberger Ltd. | (25,393 | ) | (1,873,574 | ) | 102,412 | |||||||
| Snyder’s-Lance, Inc. | (25,484 | ) | (913,601 | ) | 39,500 | |||||||
| Staples, Inc. | (296,041 | ) | (3,722,716 | ) | 919,207 | |||||||
| STERIS PLC | (3 | ) | (202 | ) | (24 | ) | ||||||
| Western Digital Corp. | (1,028 | ) | (62,009 | ) | 278 | |||||||
| Weyerhaeuser Co. | (103,629 | ) | (3,173,120 | ) | 66,323 | |||||||
| Yadkin Financial Corp. | (15,386 | ) | (387,258 | ) | (8 | ) | ||||||
|
| |||||||||||
| 1,052,226 | ||||||||||||
|
| |||||||||||
Total of Short Equity Positions | 638,670 | |||||||||||
|
| |||||||||||
Total of Long and Short Equity Positions and Rights | (1,723,238 | ) | ||||||||||
|
| |||||||||||
Net Cash and Other Receivables/ (Payables) (b) | 692,617 | |||||||||||
|
| |||||||||||
Swaps, at Value | $ | (1,030,621 | ) | |||||||||
|
| |||||||||||
| The accompanying notes are an integral part of these financial statements. | (Continued) |
| AQR Funds | Annual Report | December 2015 | ||||||||||||||
56
Table of Contents
| Schedule of Investments | December 31, 2015 |
| AQR DIVERSIFIED ARBITRAGE FUND |
| (a) | Notional value represents the market value (including any fees or commissions) of the long positions when they are established. |
| (b) | Cash and other receivables/(payables) includes the gains (or losses) realized within the swap when the swap resets. |
| (3) | Level 3 security (See Note 5). |
| COUNTERPARTY | DESCRIPTION | TERMINATION DATE** | VALUE (Note 5) | |||||
| Deutsche Bank | The Fund receives the total return on a portfolio of long and short positions and pays or receives the GBP/USD 1 Week Forward Swap Rate plus or minus a specified spread, which is denominated in GBP based on the local currencies of the positions within the swap. | 24 months maturity 08/19/2016 | $2,447,770 | |||||
|
| |||||||
| ** | The maturity dates are measured from the commencement of investment in each underlying swap position. |
Additional Information — Total Return Basket Swaps
The following table represents the individual long and short positions and related values within the total return basket swap as of December 31, 2015.
| REFERENCE ENTITY | SHARES | NOTIONAL (a) | NET UNREALIZED APPRECIATION (DEPRECIATION) | |||||||||
| Long Positions | ||||||||||||
| Common Stocks | ||||||||||||
| United Kingdom | ||||||||||||
| Amlin PLC | 344,979 | $ | 3,346,624 | $ | 26,537 | |||||||
| BG Group PLC | 323,580 | 5,136,039 | (445,475 | ) | ||||||||
| Cable & Wireless Communications PLC | 61,218 | 66,627 | 346 | |||||||||
| Pace PLC | 1,032,212 | 5,805,629 | 515,459 | |||||||||
| Rexam PLC | 570,443 | 4,438,916 | 649,152 | |||||||||
| SABMiller PLC | 82,367 | 4,917,751 | 9,775 | |||||||||
| Telecity Group PLC | 234,758 | 3,821,689 | 516,695 | |||||||||
|
| |||||||||||
| 1,272,489 | ||||||||||||
|
| |||||||||||
Total of Long Equity Positions | 1,272,489 | |||||||||||
|
| |||||||||||
| REFERENCE ENTITY | SHARES | NOTIONAL (a) | NET UNREALIZED APPRECIATION (DEPRECIATION) | |||||||||
| Short Positions | ||||||||||||
| Common Stocks | ||||||||||||
| Netherlands | ||||||||||||
| Royal Dutch Shell PLC | (144,123 | ) | $ | (3,841,694 | ) | $ | 556,997 | |||||
| Royal Dutch Shell PLC | (3,269 | ) | 691 | (74,731 | ) | |||||||
|
| |||||||||||
| 482,266 | ||||||||||||
|
| |||||||||||
Total of Long and Short Equity Positions | 1,754,755 | |||||||||||
|
| |||||||||||
Net Cash and Other Receivables/ (Payables) (b) | 693,015 | |||||||||||
|
| |||||||||||
Swaps, at Value | $ | 2,447,770 | ||||||||||
|
| |||||||||||
| (a) | Notional value represents the market value (including any fees or commissions) of the long and short positions when they are established. |
| (b) | Cash and other receivables/(payables) includes the gains (or losses) realized within the swap when the swap resets. |
| The accompanying notes are an integral part of these financial statements. | (Continued) |
| AQR Funds | Annual Report | December 2015 | ||||||||||||||
57
Table of Contents
| Schedule of Investments | December 31, 2015 |
| AQR DIVERSIFIED ARBITRAGE FUND |
| COUNTERPARTY | DESCRIPTION | TERMINATION DATE** | VALUE (Note 5) | |||||
| Deutsche Bank | The Fund receives the total return on a portfolio of long and short positions and pays or receives the Canadian Offered Rate plus or minus a specified spread, which is denominated in CAD based on the local currencies of the positions within the swap. | 25 months maturity 08/31/2016 | $18,568 | |||||
|
| |||||||
| ** | The maturity dates are measured from the commencement of investment in each underlying swap position. |
Additional Information — Total Return Basket Swaps
The following table represents the individual long and short positions and related values within the total return basket swap as of December 31, 2015.
| REFERENCE ENTITY | SHARES | NOTIONAL (a) | NET UNREALIZED APPRECIATION (DEPRECIATION) | |||||||||
| Long Positions | ||||||||||||
| Common Stocks | ||||||||||||
| Canada | ||||||||||||
| Canexus Corp. | 1,391,565 | $ | 1,307,435 | $ | 50,239 | |||||||
|
| |||||||||||
| Short Positions | ||||||||||||
| Common Stocks | ||||||||||||
| Canada | ||||||||||||
| Canadian Pacific Railway Ltd. | (5,870 | ) | (750,763 | ) | 1,030 | |||||||
| Superior Plus Corp. | (212,934 | ) | (1,646,588 | ) | (9,240 | ) | ||||||
|
| |||||||||||
| (8,210 | ) | |||||||||||
|
| |||||||||||
Total of Short Equity Positions | (8,210 | ) | ||||||||||
|
| |||||||||||
Total of Long and Short Equity Positions | 42,029 | |||||||||||
|
| |||||||||||
Net Cash and Other Receivables/ (Payables) (b) | (23,461 | ) | ||||||||||
|
| |||||||||||
Swaps, at Value | $ | 18,568 | ||||||||||
|
| |||||||||||
| (a) | Notional value represents the market value (including any fees or commissions) of the long and short positions when they are established. |
| (b) | Cash and other receivables/(payables) includes the gains (or losses) realized within the swap when the swap resets. |
| The accompanying notes are an integral part of these financial statements. | (Continued) |
| AQR Funds | Annual Report | December 2015 | ||||||||||||||
58
Table of Contents
| Schedule of Investments | December 31, 2015 |
| AQR DIVERSIFIED ARBITRAGE FUND |
| COUNTERPARTY | DESCRIPTION | TERMINATION DATE** | VALUE (Note 5) | |||||
| Deutsche Bank | The Fund receives the total return on a portfolio of long and short positions and pays or receives the EUR/USD 1 Week Forward Swap Rate plus or minus a specified spread, which is denominated in EUR based on the local currencies of the positions within the swap. | 12-24 months maturity ranging from 04/20/2016 - 09/26/2016 | $1,094,341 | |||||
|
| |||||||
| ** | The maturity dates are measured from the commencement of investment in each underlying swap position. |
Additional Information — Total Return Basket Swaps
The following table represents the individual long positions and related values within the total return basket swap as of December 31, 2015.
| REFERENCE ENTITY | SHARES | NOTIONAL (a) | NET UNREALIZED APPRECIATION (DEPRECIATION) | |||||||||
| Long Positions | ||||||||||||
| Common Stocks | ||||||||||||
| Belgium | ||||||||||||
| Delhaize Group | 40,639 | $ | 3,516,810 | $ | 438,445 | |||||||
|
| |||||||||||
| Germany | ||||||||||||
| Wincor Nixdorf AG | 40,208 | 2,018,748 | (2,862 | ) | ||||||||
|
| |||||||||||
| Italy | ||||||||||||
| Ansaldo STS SpA | 360,382 | 3,801,730 | 59,706 | |||||||||
| Enel Green Power SpA | 332,829 | 716,352 | (39,854 | ) | ||||||||
| Italcementi SpA | 234,156 | 2,568,268 | 37,956 | |||||||||
|
| |||||||||||
| 57,808 | ||||||||||||
|
| |||||||||||
| Netherlands | ||||||||||||
| TNT Express NV | 431,580 | 3,200,820 | 449,844 | |||||||||
| USG People NV | 40,260 | 751,110 | (2,115 | ) | ||||||||
|
| |||||||||||
| 447,729 | ||||||||||||
|
| |||||||||||
Total of Long Equity Positions | 941,120 | |||||||||||
|
| |||||||||||
| REFERENCE ENTITY | SHARES | NOTIONAL (a) | NET UNREALIZED APPRECIATION (DEPRECIATION) | |||||||||
| Short Positions | ||||||||||||
| Common Stocks | ||||||||||||
| Germany | ||||||||||||
| Dialog Semiconductor PLC | (17,719 | ) | $ | (594,622 | ) | $ | 3,363 | |||||
|
| |||||||||||
| Italy | ||||||||||||
| Enel SpA | (161,755 | ) | (725,481 | ) | 47,193 | |||||||
|
| |||||||||||
| Netherlands | ||||||||||||
| Koninklijke Ahold NV | (206,572 | ) | (3,948,455 | ) | (408,861 | ) | ||||||
|
| |||||||||||
Total of Short Equity Positions | (358,305 | ) | ||||||||||
|
| |||||||||||
Total of Long and Short Equity Positions | 582,815 | |||||||||||
|
| |||||||||||
Net Cash and Other Receivables/ (Payables) (b) | 511,526 | |||||||||||
|
| |||||||||||
Swaps, at Value | $ | 1,094,341 | ||||||||||
|
| |||||||||||
| (a) | Notional value represents the market value (including any fees or commissions) of the long positions when they are established. |
| (b) | Cash and other receivables/(payables) includes the gains (or losses) realized within the swap when the swap resets. |
| The accompanying notes are an integral part of these financial statements. | (Continued) |
| AQR Funds | Annual Report | December 2015 | ||||||||||||||
59
Table of Contents
| Schedule of Investments | December 31, 2015 |
| AQR DIVERSIFIED ARBITRAGE FUND |
| COUNTERPARTY | DESCRIPTION | TERMINATION DATE** | VALUE (Note 5) | |||||
| Deutsche Bank | The Fund receives the total return on a portfolio of long and short positions and pays or receives the AUD/USD Overnight Forward FX Swap Rate plus or minus a specified spread, which is denominated in AUD based on the local currencies of the positions within the swap. | 24 months maturity 08/22/2016 | $(108,771 | ) | ||||
|
| |||||||
| ** | The maturity dates are measured from the commencement of investment in each underlying swap position. |
Additional Information — Total Return Basket Swaps
The following table represents the individual long positions and related values within the total return basket swap as of December 31, 2015.
| REFERENCE ENTITY | SHARES | NOTIONAL (a) | NET UNREALIZED APPRECIATION (DEPRECIATION) | |||||||||
| Long Positions | ||||||||||||
| Common Stocks | ||||||||||||
| Australia | ||||||||||||
| Asciano Ltd. | 194,096 | $ | 1,243,040 | $ | (9,036 | ) | ||||||
| Recall Holdings Ltd. | 320,814 | 1,773,033 | (159,149 | ) | ||||||||
| Veda Group Ltd. | 1,162,074 | 2,283,420 | 75,631 | |||||||||
|
| |||||||||||
| (92,554 | ) | |||||||||||
|
| |||||||||||
Total of Long Equity Positions | (92,554 | ) | ||||||||||
|
| |||||||||||
Net Cash and Other Receivables/ (Payables) (b) | (16,217 | ) | ||||||||||
|
| |||||||||||
Swaps, at Value | $ | (108,771 | ) | |||||||||
|
| |||||||||||
| (a) | Notional value represents the market value (including any fees or commissions) of the long and short positions when they are established. |
| (b) | Cash and other receivables/(payables) includes the gains (or losses) realized within the swap when the swap resets. |
| The accompanying notes are an integral part of these financial statements. | (Continued) |
| AQR Funds | Annual Report | December 2015 | ||||||||||||||
60
Table of Contents
| Schedule of Investments | December 31, 2015 |
| AQR DIVERSIFIED ARBITRAGE FUND |
Total Return Basket Swaps* Outstanding at December 31, 2015
| COUNTERPARTY | DESCRIPTION | TERMINATION DATE** | VALUE (Note 5) | |||||
| J.P. Morgan | The Fund receives the total return on a portfolio of long and short positions and pays or receives the LIBOR plus or minus a specified spread, which is denominated in USD based on the local currencies of the positions within the swap. | 12 months maturity 04/20/2016 | $561,243 | |||||
|
| |||||||
| ** | The maturity dates are measured from the commencement of investment in each underlying swap position. |
Additional Information — Total Return Basket Swaps
The following table represents the individual long positions and related values within the total return basket swap as of December 31, 2015.
| REFERENCE ENTITY | SHARES | NOTIONAL (a) | NET UNREALIZED APPRECIATION (DEPRECIATION) | |||||||||
| Long Positions | ||||||||||||
| Private Placements | ||||||||||||
| United States | ||||||||||||
| Penson Technologies LLC | 9,326,216 | $ | 9 | $ | 561,243 | |||||||
|
| |||||||||||
Net Cash and Other Receivables/ (Payables) (b) | — | |||||||||||
|
| |||||||||||
Swaps, at Value | $ | 561,243 | ||||||||||
|
| |||||||||||
| (a) | Notional value represents the market value (including any fees or commissions) of the long positions when they are established. |
| (b) | Cash and other receivables/(payables) includes the gains (or losses) realized within the swap when the swap resets. |
Collateral pledged to, or (received from), each counterparty at December 31, 2015 was as follows:
| COUNTERPARTY | OVER THE COUNTER | EXCHANGE TRADED/ CENTRALLY CLEARED | TOTAL | |||||||||
| Bank of America | ||||||||||||
| Money Market Funds | $800,647 | $— | $800,647 | |||||||||
| ||||||||||||
| Barclays Capital | ||||||||||||
| Cash | — | 3,774,535 | 3,774,535 | |||||||||
| ||||||||||||
| CitiBank | ||||||||||||
| Cash | — | 5,261,637 | 5,261,637 | |||||||||
| ||||||||||||
| Credit Suisse International | ||||||||||||
| Cash | (430,000 | ) | — | (430,000 | ) | |||||||
| ||||||||||||
| Deutsche Bank | ||||||||||||
| Money Market Funds | 48,686,226 | — | 48,686,226 | |||||||||
| ||||||||||||
| J.P. Morgan | ||||||||||||
| Cash | — | 209,514 | 209,514 | |||||||||
| ||||||||||||
| The accompanying notes are an integral part of these financial statements. |
| AQR Funds | Annual Report | December 2015 | ||||||||||||||
61
Table of Contents
| Schedule of Investments | December 31, 2015 |
| AQR EQUITY MARKET NEUTRAL FUND |
| LONG INVESTMENTS - 113.0% | SHARES | VALUE (Note 5) | ||||||
| COMMON STOCKS - 28.1% | ||||||||
| Belgium - 0.9% | ||||||||
| Ageas (a) | 20,691 | $ | 960,350 | |||||
| bpost SA (a) | 26,832 | 658,387 | ||||||
| Colruyt SA (a) | 2,202 | 113,278 | ||||||
| KBC Groep NV (a) | 9,197 | 575,053 | ||||||
| Proximus (a) | 5,554 | 180,732 | ||||||
|
| |||||||
| 2,487,800 | ||||||||
|
| |||||||
| Canada - 5.4% | ||||||||
| Aimia, Inc. (1)(a) | 16,076 | 109,327 | ||||||
| Air Canada (1)†(a) | 162,289 | 1,197,493 | ||||||
| Alimentation Couche-Tard, Inc., Class B (1)(a) | 6,872 | 302,503 | ||||||
| Atco Ltd., Class I (1) | 6,227 | 160,659 | ||||||
| Bank of Montreal (1)(a) | 2,298 | 129,672 | ||||||
| Bank of Nova Scotia/The (1)(a) | 1,657 | 67,025 | ||||||
| Baytex Energy Corp. (1) | 120,004 | 388,536 | ||||||
| BlackBerry Ltd. (1)†(a) | 30,285 | 281,029 | ||||||
| Bombardier, Inc., Class B (1)† | 346,920 | 335,964 | ||||||
| Canadian Imperial Bank of Commerce (1)(a) | 4,076 | 268,621 | ||||||
| Canadian Tire Corp. Ltd., Class A (1)(a) | 7,261 | 620,048 | ||||||
| Canfor Corp. (1)†(a) | 27,701 | 404,194 | ||||||
| CCL Industries, Inc., Class B (1)(a) | 2,546 | 412,839 | ||||||
| CGI Group, Inc., Class A (1)†(a) | 7,711 | 308,730 | ||||||
| CI Financial Corp. (1)(a) | 8,692 | 192,220 | ||||||
| Constellation Software, Inc. (1)(a) | 965 | 402,319 | ||||||
| Dollarama, Inc. (1)(a) | 6,191 | 357,670 | ||||||
| Element Financial Corp. (1) | 6,604 | 79,704 | ||||||
| Empire Co., Ltd., Class A (1)(a) | 40,918 | 761,169 | ||||||
| Encana Corp. (1) | 43,001 | 218,470 | ||||||
| Enerplus Corp. (1) | 53,101 | 182,286 | ||||||
| Fairfax Financial Holdings Ltd. (1)(a) | 181 | 85,930 | ||||||
| George Weston Ltd. (1)(a) | 6,973 | 538,912 | ||||||
| IGM Financial, Inc. (1)(a) | 3,269 | 83,491 | ||||||
| Industrial Alliance Insurance & Financial Services, Inc. (1) | 6,606 | 210,684 | ||||||
| Intact Financial Corp. (1)(a) | 2,701 | 173,104 | ||||||
| Kinross Gold Corp. (1)† | 75,943 | 137,759 | ||||||
| Linamar Corp. (1)(a) | 14,649 | 791,154 | ||||||
| Magna International, Inc. (1)(a) | 31,573 | 1,280,535 | ||||||
| MEG Energy Corp. (1)† | 15,300 | 88,680 | ||||||
| Metro, Inc. (1)(a) | 21,313 | 596,709 | ||||||
| National Bank of Canada (1)(a) | 1,538 | 44,805 | ||||||
| Onex Corp. (1)(a) | 4,531 | 277,748 | ||||||
| Open Text Corp. (1)(a) | 4,520 | 216,707 | ||||||
| Progressive Waste Solutions Ltd. (1)(a) | 17,850 | 420,546 | ||||||
| Ritchie Bros Auctioneers, Inc. (1)(a) | 30,950 | 745,735 | ||||||
| Royal Bank of Canada (1)(a) | 5,084 | 272,442 | ||||||
| Saputo, Inc. (1)(a) | 2,167 | 51,838 | ||||||
| Shaw Communications, Inc., Class B (1)(a) | 22,917 | 394,178 | ||||||
| SNC-Lavalin Group, Inc. (1)(a) | 17,188 | 510,783 | ||||||
| Sun Life Financial, Inc. (1)(a) | 3,610 | 112,576 | ||||||
| West Fraser Timber Co., Ltd. (1)(a) | 9,613 | 364,942 | ||||||
|
| |||||||
| 14,579,736 | ||||||||
|
| |||||||
| SHARES | VALUE (Note 5) | |||||||
| China - 0.1% | ||||||||
| Yangzijiang Shipbuilding Holdings Ltd. | 503,500 | $ | 388,994 | |||||
|
| |||||||
| Denmark - 2.0% | ||||||||
| Chr Hansen Holding A/S (a) | 739 | 46,225 | ||||||
| Danske Bank A/S | 3,590 | 96,328 | ||||||
| DSV A/S (a) | 23,937 | 942,248 | ||||||
| Genmab A/S †(a) | 4,083 | 542,892 | ||||||
| GN Store Nord A/S (a) | 2,555 | 46,369 | ||||||
| ISS A/S (a) | 14,458 | 521,164 | ||||||
| Novo Nordisk A/S, Class B (a) | 21,546 | 1,247,475 | ||||||
| Pandora A/S (a) | 6,286 | 792,563 | ||||||
| TDC A/S | 98,234 | 489,111 | ||||||
| Vestas Wind Systems A/S (a) | 6,480 | 452,556 | ||||||
| William Demant Holding A/S † | 684 | 65,154 | ||||||
|
| |||||||
| 5,242,085 | ||||||||
|
| |||||||
| Finland - 1.1% | ||||||||
| Amer Sports OYJ (a) | 18,182 | 530,839 | ||||||
| Cargotec OYJ, B Shares | 17,436 | 650,450 | ||||||
| Elisa OYJ (a) | 11,913 | 448,225 | ||||||
| Kesko OYJ, B Shares (a) | 16,874 | 591,467 | ||||||
| Metso OYJ (a) | 17,533 | 392,743 | ||||||
| Neste OYJ (a) | 2,090 | 62,378 | ||||||
| Orion OYJ, Class B (a) | 9,306 | 321,971 | ||||||
|
| |||||||
| 2,998,073 | ||||||||
|
| |||||||
| Germany - 5.1% | ||||||||
| Allianz SE (a) | 3,843 | 677,437 | ||||||
| Aurubis AG (a) | 14,199 | 718,983 | ||||||
| Bayer AG (a) | 2,727 | 340,576 | ||||||
| Brenntag AG (a) | 6,527 | 340,107 | ||||||
| Deutsche Lufthansa AG †(a) | 50,641 | 797,650 | ||||||
| Evonik Industries AG (a) | 19,379 | 640,999 | ||||||
| Freenet AG (a) | 32,687 | 1,103,018 | ||||||
| Hannover Rueck SE (a) | 2,765 | 315,734 | ||||||
| HeidelbergCement AG (a) | 554 | 45,150 | ||||||
| Hella KGaA Hueck & Co. (a) | 3,551 | 147,467 | ||||||
| HOCHTIEF AG (a) | 15,383 | 1,426,735 | ||||||
| HUGO BOSS AG (a) | 1,547 | 127,642 | ||||||
| K+S AG (a) | 7,211 | 183,817 | ||||||
| KION Group AG †(a) | 15,062 | 746,890 | ||||||
| Krones AG (a) | 3,764 | 448,189 | ||||||
| LANXESS AG (a) | 4,930 | 226,865 | ||||||
| Merck KGaA (a) | 8,239 | 797,707 | ||||||
| MTU Aero Engines AG (a) | 1,343 | 130,895 | ||||||
| Muenchener Rueckversicherungs-Gesellschaft AG in Muenchen (a) | 2,695 | 536,944 | ||||||
| OSRAM Licht AG (a) | 20,074 | 838,672 | ||||||
| ProSiebenSat.1 Media SE (a) | 8,840 | 445,990 | ||||||
| Rheinmetall AG (a) | 11,319 | 752,395 | ||||||
| RHOEN-KLINIKUM AG | 1,507 | 45,208 | ||||||
| Salzgitter AG (a) | 7,895 | 192,932 | ||||||
| Software AG (a) | 14,335 | 408,572 | ||||||
| STADA Arzneimittel AG (a) | 9,734 | 392,527 | ||||||
| Symrise AG (a) | 1,129 | 74,738 | ||||||
| Talanx AG (a) | 12,114 | 372,560 | ||||||
| United Internet AG (a) | 1,951 | 107,264 | ||||||
| Zalando SE 144A †(a)(b) | 6,730 | 265,798 | ||||||
|
| |||||||
| 13,649,461 | ||||||||
|
| |||||||
| The accompanying notes are an integral part of these financial statements. | (Continued) |
| AQR Funds | Annual Report | December 2015 | ||||||||||||||
62
Table of Contents
| Schedule of Investments | December 31, 2015 |
| AQR EQUITY MARKET NEUTRAL FUND |
| SHARES | VALUE (Note 5) | |||||||
| Hong Kong - 0.3% | ||||||||
| Hongkong Land Holdings Ltd. (1) | 77,800 | $ | 532,930 | |||||
| Jardine Matheson Holdings Ltd. | 5,000 | 242,650 | ||||||
|
| |||||||
| 775,580 | ||||||||
|
| |||||||
| Italy - 2.3% | ||||||||
| A2A SpA | 347,329 | 470,303 | ||||||
| Assicurazioni Generali SpA (a) | 4,963 | 90,658 | ||||||
| Atlantia SpA (a) | 1,690 | 44,715 | ||||||
| Autogrill SpA † | 12,056 | 114,898 | ||||||
| Banca Generali SpA | 3,447 | 108,429 | ||||||
| Banca Popolare di Milano Scarl | 150,504 | 149,068 | ||||||
| Buzzi Unicem SpA | 11,428 | 204,850 | ||||||
| Davide Campari-Milano SpA (a) | 29,823 | 257,844 | ||||||
| Enel SpA | 64,714 | 271,365 | ||||||
| Eni SpA (a) | 24,946 | 370,653 | ||||||
| FinecoBank Banca Fineco SpA | 32,588 | 267,968 | ||||||
| Finmeccanica SpA †(a) | 15,275 | 212,388 | ||||||
| Luxottica Group SpA (a) | 693 | 45,159 | ||||||
| Mediobanca SpA (a) | 26,269 | 251,816 | ||||||
| Moncler SpA | 7,170 | 99,777 | ||||||
| Prysmian SpA (a) | 79,303 | 1,732,702 | ||||||
| Recordati SpA | 25,143 | 656,002 | ||||||
| Snam SpA (a) | 8,722 | 45,520 | ||||||
| Unipol Gruppo Finanziario SpA | 83,521 | 429,598 | ||||||
| UnipolSai SpA | 142,004 | 361,273 | ||||||
|
| |||||||
| 6,184,986 | ||||||||
|
| |||||||
| Netherlands - 2.3% | ||||||||
| Akzo Nobel NV (a) | 4,440 | 296,675 | ||||||
| ASM International NV (a) | 1,692 | 66,333 | ||||||
| Boskalis Westminster (a) | 13,914 | 567,583 | ||||||
| Delta Lloyd NV | 10,439 | 61,537 | ||||||
| Fugro NV CVA † | 20,217 | 331,600 | ||||||
| Heineken NV (a) | 8,532 | 727,071 | ||||||
| Koninklijke Ahold NV (a) | 35,067 | 739,684 | ||||||
| Koninklijke KPN NV | 22,319 | 84,419 | ||||||
| Koninklijke Vopak NV (a) | 2,945 | 126,826 | ||||||
| NN Group NV (a) | 51,191 | 1,806,167 | ||||||
| Randstad Holding NV (a) | 13,926 | 867,192 | ||||||
| Wolters Kluwer NV (a) | 11,037 | 370,661 | ||||||
|
| |||||||
| 6,045,748 | ||||||||
|
| |||||||
| Norway - 0.2% | ||||||||
| Orkla ASA (a) | 5,698 | 44,951 | ||||||
| Yara International ASA (a) | 12,282 | 528,227 | ||||||
|
| |||||||
| 573,178 | ||||||||
|
| |||||||
| Portugal - 0.2% | ||||||||
| Galp Energia SGPS SA (a) | 16,653 | 194,318 | ||||||
| Jeronimo Martins SGPS SA (a) | 28,021 | 364,620 | ||||||
| NOS SGPS SA | 5,688 | 44,753 | ||||||
|
| |||||||
| 603,691 | ||||||||
|
| |||||||
| Singapore - 0.5% | ||||||||
| ComfortDelGro Corp. Ltd. | 84,300 | 180,509 | ||||||
| Genting Singapore PLC | 443,400 | 239,248 | ||||||
| Singapore Airlines Ltd. | 106,200 | 836,801 | ||||||
| United Overseas Bank Ltd. | 3,800 | 52,390 | ||||||
| Wilmar International Ltd. | 23,000 | 47,457 | ||||||
|
| |||||||
| 1,356,405 | ||||||||
|
| |||||||
| SHARES | VALUE (Note 5) | |||||||
| Spain - 1.9% | ||||||||
| Abengoa SA, B Shares | 366,501 | $ | 77,431 | |||||
| ACS Actividades de Construccion y Servicios SA (a) | 8,822 | 258,110 | ||||||
| Almirall SA | 33,263 | 672,282 | ||||||
| Ebro Foods SA | 10,978 | 215,946 | ||||||
| Enagas SA (a) | 1,603 | 45,217 | ||||||
| Endesa SA (a) | 45,890 | 921,914 | ||||||
| Gamesa Corp. Tecnologica SA (a) | 22,976 | 393,348 | ||||||
| Gas Natural SDG SA (a) | 49,446 | 1,008,315 | ||||||
| Iberdrola SA (a) | 35,639 | 252,644 | ||||||
| Industria de Diseno Textil SA (a) | 13,979 | 480,237 | ||||||
| Mediaset Espana Comunicacion SA (a) | 43,365 | 471,803 | ||||||
| Tecnicas Reunidas SA | 9,417 | 356,055 | ||||||
|
| |||||||
| 5,153,302 | ||||||||
|
| |||||||
| Sweden - 2.3% | ||||||||
| BillerudKorsnas AB | 46,755 | 865,276 | ||||||
| Boliden AB (a) | 21,125 | 353,932 | ||||||
| Electrolux AB, Series B (a) | 42,418 | 1,023,437 | ||||||
| Hexpol AB | 11,327 | 121,451 | ||||||
| Husqvarna AB, B Shares | 43,060 | 284,170 | ||||||
| Securitas AB, B Shares (a) | 24,801 | 379,230 | ||||||
| Skanska AB, B Shares (a) | 17,122 | 332,057 | ||||||
| SKF AB, B Shares | 12,546 | 202,634 | ||||||
| Svenska Cellulosa AB SCA, Class B (a) | 14,332 | 415,343 | ||||||
| Swedish Match AB (a) | 17,569 | 620,843 | ||||||
| Swedish Orphan Biovitrum AB † | 43,780 | 694,437 | ||||||
| Tele2 AB, B Shares (a) | 35,658 | 355,599 | ||||||
| TeliaSonera AB (a) | 130,329 | 647,199 | ||||||
|
| |||||||
| 6,295,608 | ||||||||
|
| |||||||
| Switzerland - 2.8% | ||||||||
| Actelion Ltd. †(a) | 10,771 | 1,496,562 | ||||||
| Adecco SA †(a) | 13,258 | 907,414 | ||||||
| Baloise Holding AG (a) | 353 | 44,739 | ||||||
| Clariant AG †(a) | 11,564 | 219,264 | ||||||
| DKSH Holding AG †(a) | 1,571 | 98,807 | ||||||
| EMS-Chemie Holding AG | 102 | 44,890 | ||||||
| Flughafen Zuerich AG (a) | 1,428 | 1,071,446 | ||||||
| Galenica AG (a) | 120 | 187,746 | ||||||
| GAM Holding AG †(a) | 2,740 | 45,354 | ||||||
| Helvetia Holding AG (a) | 80 | 45,065 | ||||||
| Julius Baer Group Ltd. †(a) | 1,238 | 59,891 | ||||||
| Kuehne + Nagel International AG (a) | 2,012 | 275,642 | ||||||
| Lonza Group AG †(a) | 4,173 | 678,675 | ||||||
| Partners Group Holding AG (a) | 361 | 129,828 | ||||||
| Sika AG (a) | 61 | 220,441 | ||||||
| Sonova Holding AG (a) | 358 | 45,485 | ||||||
| Straumann Holding AG | 210 | 63,737 | ||||||
| Sunrise Communications Group AG 144A †(a)(b) | 1,066 | 62,839 | ||||||
| Swiss Life Holding AG †(a) | 2,532 | 681,994 | ||||||
| Swiss Re AG (a) | 10,646 | 1,039,755 | ||||||
| Zurich Insurance Group AG †(a) | 818 | 210,144 | ||||||
|
| |||||||
| 7,629,718 | ||||||||
|
| |||||||
| United Kingdom - 0.6% | ||||||||
| Dialog Semiconductor PLC †(a) | 19,271 | 643,047 | ||||||
| Fiat Chrysler Automobiles NV †(a) | 17,761 | 246,662 | ||||||
| The accompanying notes are an integral part of these financial statements. | (Continued) |
| AQR Funds | Annual Report | December 2015 | ||||||||||||||
63
Table of Contents
| Schedule of Investments | December 31, 2015 |
| AQR EQUITY MARKET NEUTRAL FUND |
| SHARES | VALUE (Note 5) | |||||||
| United Kingdom - 0.6% (continued) | ||||||||
| Subsea 7 SA † | 14,150 | $ | 100,154 | |||||
| Unilever NV CVA (a) | 11,414 | 497,174 | ||||||
|
| |||||||
| 1,487,037 | ||||||||
|
| |||||||
| United States - 0.1% | ||||||||
| Thomson Reuters Corp. (1)(a) | 6,873 | 260,327 | ||||||
|
| |||||||
TOTAL COMMON STOCKS | 75,711,729 | |||||||
|
| |||||||
| MONEY MARKET FUNDS - 66.2% | ||||||||
| J.P. Morgan U.S. Treasury Plus Money Market Fund - IM Shares, 0.129% (c)(d) | 133,521,947 | 133,521,947 | ||||||
| J.P. Morgan U.S. Treasury Plus Money Market Fund - Institutional Shares, 0.070% (c)(d) | 44,640,000 | 44,640,000 | ||||||
|
| |||||||
TOTAL MONEY MARKET FUNDS | 178,161,947 | |||||||
|
| |||||||
| SHORT-TERM INVESTMENTS - 18.7% |
| PRINCIPAL AMOUNT (000’s | ) | |||||
| U.S. Treasury Bill, 0.343%, 5/12/2016 (e) | $ | 1,120 | 1,118,702 | |||||
| U.S. Treasury Bill, 0.113%, 3/24/2016 (e) | 1,435 | 1,434,435 | ||||||
| U.S. Treasury Bill, 0.327%, 5/19/2016 (e) | 11,695 | 11,680,229 | ||||||
| U.S. Treasury Bill, 0.582%, 6/16/2016 (e) | 3,531 | 3,523,553 | ||||||
| U.S. Treasury Bill, 0.536%, 6/9/2016 (e) | 3,785 | 3,777,578 | ||||||
| U.S. Treasury Bill, 0.259%, 3/17/2016 (e) | 3,354 | 3,353,319 | ||||||
| U.S. Treasury Bill, 0.145%, 4/28/2016 (e) | 17,475 | 17,460,356 | ||||||
| U.S. Treasury Bill, 0.264%, 3/3/2016 (e) | 1,714 | 1,713,698 | ||||||
| U.S. Treasury Bill, 0.241%, 2/11/2016 (e) | 3,790 | �� | 3,789,473 | |||||
| U.S. Treasury Bill, 0.345%, 5/26/2016 (e) | 1,434 | 1,431,786 | ||||||
| U.S. Treasury Bill, 0.516%, 6/23/2016 (e) | 1,242 | 1,239,239 | ||||||
|
| |||||||
TOTAL SHORT-TERM INVESTMENTS | 50,522,368 | |||||||
|
| |||||||
TOTAL INVESTMENTS IN SECURITIES, AT VALUE | 304,396,044 | |||||||
|
| |||||||
SECURITIES SOLD SHORT - (23.6)% | SHARES | |||||||
| COMMON STOCKS - (23.2)% | ||||||||
| Austria - 0.0% (f) | ||||||||
| ams AG | (1,415 | ) | (47,301 | ) | ||||
|
| |||||||
| SHARES | VALUE (Note 5) | |||||||
| Belgium - (0.6)% | ||||||||
| Anheuser-Busch InBev SA/NV | (7,849 | ) | $ | (976,786 | ) | |||
| Telenet Group Holding NV † | (1,277 | ) | (69,015 | ) | ||||
| UCB SA | (5,739 | ) | (518,020 | ) | ||||
|
| |||||||
| (1,563,821 | ) | |||||||
|
| |||||||
| Canada - (6.0)% | ||||||||
| Agnico Eagle Mines Ltd. (1) | (36,660 | ) | (963,593 | ) | ||||
| Agrium, Inc. (1) | (4,058 | ) | (362,689 | ) | ||||
| ARC Resources Ltd. (1) | (11,112 | ) | (134,112 | ) | ||||
| Barrick Gold Corp. (1) | (19,825 | ) | (146,714 | ) | ||||
| Canadian National Railway Co. (1) | (13,333 | ) | (745,326 | ) | ||||
| Canadian Natural Resources Ltd. (1) | (9,459 | ) | (206,585 | ) | ||||
| Canadian Utilities Ltd., Class A (1) | (49,135 | ) | (1,134,185 | ) | ||||
| Eldorado Gold Corp. (1) | (81,289 | ) | (240,865 | ) | ||||
| Enbridge, Inc. (1) | (31,477 | ) | (1,046,428 | ) | ||||
| First Quantum Minerals Ltd. (1) | (115,631 | ) | (432,875 | ) | ||||
| Franco-Nevada Corp. (1) | (20,549 | ) | (940,053 | ) | ||||
| Gildan Activewear, Inc. (1) | (26,744 | ) | (760,359 | ) | ||||
| Goldcorp, Inc. (1) | (34,335 | ) | (396,774 | ) | ||||
| Hudson’s Bay Co. (1) | (6,079 | ) | (79,519 | ) | ||||
| Husky Energy, Inc. (1) | (13,714 | ) | (141,828 | ) | ||||
| Imperial Oil Ltd. (1) | (37,181 | ) | (1,211,332 | ) | ||||
| Inter Pipeline Ltd. (1) | (14,804 | ) | (237,622 | ) | ||||
| Keyera Corp. (1) | (9,794 | ) | (284,965 | ) | ||||
| Loblaw Cos., Ltd. (1) | (2,544 | ) | (120,131 | ) | ||||
| Manulife Financial Corp. (1) | (5,233 | ) | (78,436 | ) | ||||
| Methanex Corp. (1) | (20,351 | ) | (672,140 | ) | ||||
| Pembina Pipeline Corp. (1) | (22,995 | ) | (501,047 | ) | ||||
| Potash Corp of Saskatchewan, Inc. (1) | (6,221 | ) | (106,553 | ) | ||||
| PrairieSky Royalty Ltd. (1) | (11,658 | ) | (184,681 | ) | ||||
| Precision Drilling Corp. (1) | (114,766 | ) | (453,689 | ) | ||||
| Restaurant Brands International, Inc. (1) | (17,057 | ) | (637,927 | ) | ||||
| Rogers Communications, Inc., Class B (1) | (15,606 | ) | (538,208 | ) | ||||
| Silver Wheaton Corp. (1) | (25,565 | ) | (317,784 | ) | ||||
| Suncor Energy, Inc. (1) | (31,264 | ) | (807,075 | ) | ||||
| Toronto-Dominion Bank/The (1) | (5,269 | ) | (206,541 | ) | ||||
| Tourmaline Oil Corp. (1)† | (17,615 | ) | (284,524 | ) | ||||
| TransAlta Corp. (1) | (101,688 | ) | (360,836 | ) | ||||
| TransCanada Corp. (1) | (39,134 | ) | (1,278,070 | ) | ||||
| Vermilion Energy, Inc. (1) | (8,159 | ) | (221,768 | ) | ||||
| Yamana Gold, Inc. (1) | (38,922 | ) | (72,291 | ) | ||||
|
| |||||||
| (16,307,525 | ) | |||||||
|
| |||||||
| Denmark - (0.5)% | ||||||||
| Carlsberg A/S, Class B | (3,704 | ) | (328,144 | ) | ||||
| H Lundbeck A/S † | (1,736 | ) | (59,276 | ) | ||||
| Novozymes A/S, B Shares | (9,926 | ) | (475,246 | ) | ||||
| Tryg A/S | (19,971 | ) | (396,855 | ) | ||||
|
| |||||||
| (1,259,521 | ) | |||||||
|
| |||||||
| Finland - (1.0)% | ||||||||
| Kone OYJ, Class B | (2,071 | ) | (87,688 | ) | ||||
| Nokia OYJ | (262,121 | ) | (1,854,381 | ) | ||||
| Nokian Renkaat OYJ | (14,868 | ) | (530,806 | ) | ||||
| Wartsila OYJ Abp | (6,897 | ) | (314,903 | ) | ||||
|
| |||||||
| (2,787,778 | ) | |||||||
|
| |||||||
| The accompanying notes are an integral part of these financial statements. | (Continued) |
| AQR Funds | Annual Report | December 2015 | ||||||||||||||
64
Table of Contents
| Schedule of Investments | December 31, 2015 |
| AQR EQUITY MARKET NEUTRAL FUND |
| SHARES | VALUE (Note 5) | |||||||
| Germany - (4.0)% | ||||||||
| adidas AG | (2,259 | ) | $ | (219,257 | ) | |||
| BASF SE | (2,429 | ) | (185,037 | ) | ||||
| Bayerische Motoren Werke AG | (13,758 | ) | (1,449,426 | ) | ||||
| Beiersdorf AG | (6,140 | ) | (558,073 | ) | ||||
| Bilfinger SE | (4,214 | ) | (198,035 | ) | ||||
| Commerzbank AG † | (5,158 | ) | (53,223 | ) | ||||
| Continental AG | (2,266 | ) | (548,168 | ) | ||||
| Daimler AG | (5,205 | ) | (434,899 | ) | ||||
| Deutsche Post AG | (14,590 | ) | (407,904 | ) | ||||
| Deutsche Telekom AG | (36,384 | ) | (653,480 | ) | ||||
| Duerr AG | (4,474 | ) | (355,067 | ) | ||||
| E.ON SE | (43,633 | ) | (418,964 | ) | ||||
| Fresenius Medical Care AG & Co. KGaA | (2,818 | ) | (236,809 | ) | ||||
| Infineon Technologies AG | (30,076 | ) | (438,469 | ) | ||||
| Linde AG | (1,103 | ) | (159,338 | ) | ||||
| MAN SE | (542 | ) | (54,467 | ) | ||||
| Rocket Internet SE 144A †(b) | (21,109 | ) | (643,056 | ) | ||||
| RWE AG | (122,853 | ) | (1,548,855 | ) | ||||
| SAP SE | (7,270 | ) | (576,898 | ) | ||||
| Siemens AG | (5,969 | ) | (577,476 | ) | ||||
| Telefonica Deutschland Holding AG | (30,003 | ) | (158,256 | ) | ||||
| ThyssenKrupp AG | (3,550 | ) | (70,373 | ) | ||||
| Wirecard AG | (15,919 | ) | (795,712 | ) | ||||
|
| |||||||
| (10,741,242 | ) | |||||||
|
| |||||||
| Italy - (0.3)% | ||||||||
| Banca Popolare dell’Emilia Romagna SC | (5,819 | ) | (44,138 | ) | ||||
| Banco Popolare SC † | (3,204 | ) | (44,152 | ) | ||||
| Mediaset SpA | (46,697 | ) | (193,507 | ) | ||||
| Salvatore Ferragamo SpA | (14,852 | ) | (348,103 | ) | ||||
| UniCredit SpA | (29,557 | ) | (163,412 | ) | ||||
|
| |||||||
| (793,312 | ) | |||||||
|
| |||||||
| Luxembourg - (0.6)% | ||||||||
| APERAM SA † | (1,278 | ) | (45,439 | ) | ||||
| ArcelorMittal | (167,236 | ) | (705,603 | ) | ||||
| Tenaris SA | (73,674 | ) | (872,400 | ) | ||||
|
| |||||||
| (1,623,442 | ) | |||||||
|
| |||||||
| Netherlands - (1.5)% | ||||||||
| Aalberts Industries NV | (2,910 | ) | (100,266 | ) | ||||
| Altice NV, Class A † | (10,155 | ) | (145,900 | ) | ||||
| ASML Holding NV | (11,549 | ) | (1,026,146 | ) | ||||
| Gemalto NV | (9,973 | ) | (598,400 | ) | ||||
| Koninklijke Philips NV | (59,785 | ) | (1,525,969 | ) | ||||
| QIAGEN NV † | (2,128 | ) | (57,678 | ) | ||||
| SBM Offshore NV † | (46,037 | ) | (581,573 | ) | ||||
|
| |||||||
| (4,035,932 | ) | |||||||
|
| |||||||
| Norway - (0.5)% | ||||||||
| Gjensidige Forsikring ASA | (30,068 | ) | (481,242 | ) | ||||
| Marine Harvest ASA † | (13,077 | ) | (175,949 | ) | ||||
| Norsk Hydro ASA | (11,917 | ) | (44,297 | ) | ||||
| Schibsted ASA, Class A | (15,435 | ) | (507,451 | ) | ||||
| Telenor ASA | (3,424 | ) | (57,073 | ) | ||||
|
| |||||||
| (1,266,012 | ) | |||||||
|
| |||||||
| SHARES | VALUE (Note 5) | |||||||
| Portugal - (0.4)% | ||||||||
| Banco Comercial Portugues SA † | (4,112,113 | ) | $ | (217,914 | ) | |||
| EDP - Energias de Portugal SA | (266,546 | ) | (960,456 | ) | ||||
|
| |||||||
| (1,178,370 | ) | |||||||
|
| |||||||
| Singapore - (1.4)% | ||||||||
| CapitaLand Ltd. | (180,100 | ) | (423,323 | ) | ||||
| City Developments Ltd. | (26,700 | ) | (143,636 | ) | ||||
| DBS Group Holdings Ltd. | (11,400 | ) | (133,602 | ) | ||||
| Global Logistic Properties Ltd. | (245,400 | ) | (370,594 | ) | ||||
| Golden Agri-Resources Ltd. | (874,800 | ) | (208,957 | ) | ||||
| Hutchison Port Holdings Trust (1) | (544,600 | ) | (283,192 | ) | ||||
| Keppel Corp. Ltd. | (142,000 | ) | (648,681 | ) | ||||
| Oversea-Chinese Banking Corp. Ltd. | (89,800 | ) | (555,182 | ) | ||||
| Singapore Post Ltd. | (394,200 | ) | (455,096 | ) | ||||
| Singapore Press Holdings Ltd. | (61,800 | ) | (171,297 | ) | ||||
| Singapore Telecommunications Ltd. | (98,600 | ) | (254,217 | ) | ||||
| UOL Group Ltd. | (10,300 | ) | (45,141 | ) | ||||
|
| |||||||
| (3,692,918 | ) | |||||||
|
| |||||||
| Spain - (1.6)% | ||||||||
| Acerinox SA | (4,260 | ) | (43,452 | ) | ||||
| Amadeus IT Holding SA, A Shares | (13,926 | ) | (613,784 | ) | ||||
| Atresmedia Corp. de Medios de Comunicacion SA | (17,820 | ) | (189,821 | ) | ||||
| Banco de Sabadell SA | (146,975 | ) | (260,482 | ) | ||||
| Banco Popular Espanol SA | (158,260 | ) | (521,449 | ) | ||||
| Bankia SA | (229,042 | ) | (266,540 | ) | ||||
| Bankinter SA | (35,508 | ) | (251,799 | ) | ||||
| CaixaBank SA | (108,278 | ) | (376,874 | ) | ||||
| Cellnex Telecom SAU 144A (b) | (41,422 | ) | (774,466 | ) | ||||
| Distribuidora Internacional de Alimentacion SA † | (23,044 | ) | (135,916 | ) | ||||
| Grifols SA | (975 | ) | (45,066 | ) | ||||
| Obrascon Huarte Lain SA | (75,915 | ) | (433,221 | ) | ||||
| Repsol SA | (4,654 | ) | (51,237 | ) | ||||
| Telefonica SA | (23,775 | ) | (263,758 | ) | ||||
| Zardoya Otis SA | (6,205 | ) | (72,570 | ) | ||||
|
| |||||||
| (4,300,435 | ) | |||||||
|
| |||||||
| Sweden - (1.3)% | ||||||||
| Assa Abloy AB, Class B | (21,838 | ) | (457,128 | ) | ||||
| Atlas Copco AB, A Shares | (5,363 | ) | (131,527 | ) | ||||
| Getinge AB, B Shares | (17,162 | ) | (449,563 | ) | ||||
| Hennes & Mauritz AB, B Shares | (16,717 | ) | (594,628 | ) | ||||
| Hexagon AB, B Shares | (16,214 | ) | (599,802 | ) | ||||
| Meda AB, A Shares | (6,818 | ) | (85,954 | ) | ||||
| Nordea Bank AB | (10,736 | ) | (117,793 | ) | ||||
| Skandinaviska Enskilda Banken AB, Class A | (6,390 | ) | (67,200 | ) | ||||
| Svenska Handelsbanken AB, A Shares | (30,041 | ) | (398,989 | ) | ||||
| Swedbank AB, A Shares | (9,831 | ) | (216,514 | ) | ||||
| Telefonaktiebolaget LM Ericsson, B Shares | (24,458 | ) | (235,807 | ) | ||||
| Trelleborg AB, B Shares | (4,659 | ) | (90,421 | ) | ||||
|
| |||||||
| (3,445,326 | ) | |||||||
|
| |||||||
| The accompanying notes are an integral part of these financial statements. | (Continued) |
| AQR Funds | Annual Report | December 2015 | ||||||||||||||
65
Table of Contents
| Schedule of Investments | December 31, 2015 |
| AQR EQUITY MARKET NEUTRAL FUND |
| SHARES | VALUE (Note 5) | |||||||
| Switzerland - (2.4)% | ||||||||
| Aryzta AG † | (7,992 | ) | $ | (404,306 | ) | |||
| Barry Callebaut AG † | (189 | ) | (205,296 | ) | ||||
| Chocoladefabriken Lindt & Spruengli AG | (34 | ) | (212,320 | ) | ||||
| Cie Financiere Richemont SA | (15,798 | ) | (1,130,709 | ) | ||||
| Dufry AG † | (11,618 | ) | (1,382,336 | ) | ||||
| Geberit AG | (561 | ) | (190,012 | ) | ||||
| LafargeHolcim Ltd. † | (21,153 | ) | (1,059,233 | ) | ||||
| OC Oerlikon Corp. AG † | (7,342 | ) | (65,354 | ) | ||||
| Roche Holding AG | (1,177 | ) | (326,157 | ) | ||||
| SGS SA | (40 | ) | (76,020 | ) | ||||
| Swatch Group AG/The | (1,747 | ) | (606,672 | ) | ||||
| Swisscom AG | (1,328 | ) | (664,537 | ) | ||||
| UBS Group AG | (9,606 | ) | (186,351 | ) | ||||
|
| |||||||
| (6,509,303 | ) | |||||||
|
| |||||||
| United Kingdom - (0.8)% | ||||||||
| CNH Industrial NV | (270,743 | ) | (1,854,304 | ) | ||||
| RELX NV | (18,527 | ) | (312,037 | ) | ||||
|
| |||||||
| (2,166,341 | ) | |||||||
|
| |||||||
| United States - (0.3)% | ||||||||
| Valeant Pharmaceuticals International, Inc. (1)† | (6,892 | ) | (700,108 | ) | ||||
|
| |||||||
TOTAL COMMON STOCKS SOLD SHORT | (62,418,687 | ) | ||||||
|
| |||||||
| PREFERRED STOCKS - (0.4)% | ||||||||
| Germany - (0.4)% | ||||||||
| Henkel AG & Co. KGaA | (4,674 | ) | (521,628 | ) | ||||
| Volkswagen AG | (4,601 | ) | (664,290 | ) | ||||
|
| |||||||
TOTAL PREFERRED STOCKS SOLD SHORT | (1,185,918 | ) | ||||||
|
| |||||||
TOTAL SECURITIES SOLD SHORT, AT VALUE | (63,604,605 | ) | ||||||
|
| |||||||
TOTAL INVESTMENTS, NET OF SECURITIES SOLD SHORT - 89.4% | 240,791,439 | |||||||
|
| |||||||
| OTHER ASSETS IN EXCESS OF LIABILITIES - 10.6% (g) | 28,423,836 | |||||||
|
| |||||||
NET ASSETS - 100.0% |
| $ | 269,215,275 | |||||
|
| |||||||
| SECTOR | VALUE | % OF NET ASSETS | ||||||
| Consumer Discretionary | $ | (1,431,785 | ) | (0.5 | )% | |||
| Consumer Staples | 3,039,303 | 1.1 | ||||||
| Energy | (6,078,979 | ) | (2.3 | ) | ||||
| Financials | 5,879,650 | 2.2 | ||||||
| Health Care | 5,816,176 | 2.2 | ||||||
| Industrials | 12,254,627 | 4.6 | ||||||
| Information Technology | (4,995,756 | ) | (1.9 | ) | ||||
| Materials | (1,135,899 | ) | (0.4 | ) | ||||
| Telecommunication Services | 7,146 | 0.0 | (f) | |||||
| Utilities | (1,247,359 | ) | (0.5 | ) | ||||
| Money Market Funds | 178,161,947 | 66.2 | ||||||
| Short-Term Investments | 50,522,368 | 18.7 | ||||||
|
|
|
| |||||
| Total Investments In Securities, At Value | 240,791,439 | 89.4 | ||||||
Other Assets in Excess of | 28,423,836 | 10.6 | ||||||
|
|
|
| |||||
Net Assets | $ | 269,215,275 | 100.0 | % | ||||
|
|
|
| |||||
| † | Non-income producing security. |
| (a) | All or a portion of this security has been segregated as collateral for securities sold short and can be sold or replaced subject to the broker’s right to re-hypothecate. At December 31, 2015, the value of these securities was $54,149,034. In addition, $10,693,408 of cash collateral was pledged. |
| (b) | Rule 144A, Section 4(2) or other security which is restricted as to resale to institutional investors. The Fund Adviser has deemed this security to be liquid based upon procedures approved by the Board of Trustees. |
| (c) | Represents annualized seven-day yield as of the close of the reporting period. |
| (d) | All or a portion of the security is pledged as collateral to the brokers for forward foreign currency exchange and swap contracts. |
| (e) | The rate shown is the effective yield at the date of purchase. |
| (f) | Represents less than 0.05% of net assets. |
| (g) | Includes appreciation/(depreciation) on forward foreign currency exchange and swap contracts. |
All securities are Level 2 with respect to ASC 820, unless otherwise noted in parentheses.
| (1) | Level 1 security (See Note 5). |
The following abbreviations are used in portfolio descriptions:
144A - Restricted Security
CVA - Dutch Certification
| The accompanying notes are an integral part of these financial statements. | (Continued) |
| AQR Funds | Annual Report | December 2015 | ||||||||||||||
66
Table of Contents
| Schedule of Investments | December 31, 2015 |
| AQR EQUITY MARKET NEUTRAL FUND |
Forward foreign currency exchange contracts outstanding as of December 31, 2015:
Over the Counter
| PURCHASE CONTRACTS | COUNTERPARTY | CURRENCY | CURRENCY AMOUNT PURCHASED | VALUE AT SETTLEMENT DATE | VALUE AT DECEMBER 31, 2015 | UNREALIZED APPRECIATION (DEPRECIATION) | ||||||||||||||
| Canadian Dollar, Expiring 03/16/16 | CitiBank | CAD | 3,363,353 | $2,451,347 | $2,431,164 | $(20,183 | ) | |||||||||||||
| Canadian Dollar, Expiring 03/16/16 | Credit Suisse International | CAD | 444,353 | 332,240 | 321,195 | (11,045 | ) | |||||||||||||
| Swiss Franc, Expiring 03/16/16 | CitiBank | CHF | 423,000 | 424,115 | 423,634 | (481 | ) | |||||||||||||
| Swiss Franc, Expiring 03/16/16 | Credit Suisse International | CHF | 423,000 | 424,115 | 423,634 | (481 | ) | |||||||||||||
| Euro, Expiring 03/16/16 | CitiBank | EUR | 12,000 | 13,177 | 13,065 | (112 | ) | |||||||||||||
| Norwegian Krone, Expiring 03/16/16 | CitiBank | NOK | 5,118,500 | 587,503 | 577,850 | (9,653 | ) | |||||||||||||
| Norwegian Krone, Expiring 03/16/16 | Credit Suisse International | NOK | 359,500 | 41,417 | 40,585 | (832 | ) | |||||||||||||
| Singapore Dollar, Expiring 03/16/16 | CitiBank | SGD | 2,352,500 | 1,663,909 | 1,655,220 | (8,689 | ) | |||||||||||||
| Singapore Dollar, Expiring 03/16/16 | Credit Suisse International | SGD | 745,500 | 528,151 | 524,535 | (3,616 | ) | |||||||||||||
|
|
|
|
|
| |||||||||||||||
| $6,465,974 | $6,410,882 | $(55,092 | ) | |||||||||||||||||
|
|
|
|
|
| |||||||||||||||
| SALES CONTRACTS | COUNTERPARTY | CURRENCY | CURRENCY AMOUNT SOLD | VALUE AT SETTLEMENT DATE | VALUE AT DECEMBER 31, 2015 | UNREALIZED APPRECIATION (DEPRECIATION) | ||||||||||||||
| Canadian Dollar, Expiring 03/16/16 | CitiBank | CAD | (1,388,000 | ) | $(1,018,839 | ) | $(1,003,301 | ) | $15,538 | |||||||||||
| Swiss Franc, Expiring 03/16/16 | CitiBank | CHF | (1,388,000 | ) | (1,407,329 | ) | (1,390,080 | ) | 17,249 | |||||||||||
| Danish Krone, Expiring 03/16/16 | CitiBank | DKK | (16,027,000 | ) | (2,347,370 | ) | (2,339,000 | ) | 8,370 | |||||||||||
| Danish Krone, Expiring 03/16/16 | Credit Suisse International | DKK | (8,845,000 | ) | (1,288,255 | ) | (1,290,850 | ) | (2,595 | ) | ||||||||||
| Euro, Expiring 03/16/16 | CitiBank | EUR | (6,292,500 | ) | (6,861,229 | ) | (6,850,940 | ) | 10,289 | |||||||||||
| Euro, Expiring 03/16/16 | Credit Suisse International | EUR | (1,018,500 | ) | (1,084,141 | ) | (1,108,889 | ) | (24,748 | ) | ||||||||||
| Hong Kong Dollar, Expiring 03/16/16 | CitiBank | HKD | (5,332,000 | ) | (688,230 | ) | (688,390 | ) | (160 | ) | ||||||||||
| Hong Kong Dollar, Expiring 03/16/16 | Credit Suisse International | HKD | (181,000 | ) | (23,364 | ) | (23,368 | ) | (4 | ) | ||||||||||
| Norwegian Krone, Expiring 03/16/16 | CitiBank | NOK | (1,077,000 | ) | (124,101 | ) | (121,587 | ) | 2,514 | |||||||||||
| Swedish Krona, Expiring 03/16/16 | CitiBank | SEK | (17,027,000 | ) | (2,001,530 | ) | (2,021,278 | ) | (19,748 | ) | ||||||||||
| Swedish Krona, Expiring 03/16/16 | Credit Suisse International | SEK | (6,471,000 | ) | (746,442 | ) | (768,174 | ) | (21,732 | ) | ||||||||||
| Singapore Dollar, Expiring 03/16/16 | CitiBank | SGD | (92,000 | ) | (65,112 | ) | (64,731 | ) | 381 | |||||||||||
|
|
|
|
|
| |||||||||||||||
| (17,655,942 | ) | (17,670,588 | ) | (14,646 | ) | |||||||||||||||
|
|
|
|
|
| |||||||||||||||
| $(11,189,968 | ) | $(11,259,706 | ) | $(69,738 | ) | |||||||||||||||
|
|
|
|
|
| |||||||||||||||
| The accompanying notes are an integral part of these financial statements. | (Continued) |
| AQR Funds | Annual Report | December 2015 | ||||||||||||||
67
Table of Contents
| Schedule of Investments | December 31, 2015 |
| AQR EQUITY MARKET NEUTRAL FUND |
CAD - Canadian Dollar
CHF - Swiss Franc
DKK - Danish Krone
EUR - Euro
HKD - Hong Kong Dollar
NOK - Norwegian Krone
SEK - Swedish Krona
SGD - Singapore Dollar
USD - United States Dollar
Total Return Basket Swaps* Outstanding at December 31, 2015
Over the Counter
| COUNTERPARTY | DESCRIPTION | TERMINATION DATE** | VALUE (Note 5) | |||||
Morgan Stanley Capital Services, Inc. | The Fund receives the total return on a portfolio of long and short positions and pays or receives the Bank of Japan Estimate Unsecured Overnight Call Rate plus or minus a specified spread, which is denominated in JPY based on the local currencies of the positions within the swap. | 10-25 months maturity 10/14/2016 | $432,864 | |||||
|
| |||||||
| * | See the accompanying “Additional Information — Total Return Basket Swap” for further details. |
| ** | The maturity dates are measured from the commencement of investment in each underlying portfolio swap positions. |
Additional Information — Total Return Basket Swap
The following table represents the individual long and short positions and related values within the total return basket swap as of December 31, 2015.
| REFERENCE ENTITY | SHARES | NOTIONAL (a) | NET UNREALIZED APPRECIATION (DEPRECIATION) | |||||||||
Long Positions |
| |||||||||||
| Common Stocks | ||||||||||||
| Japan | ||||||||||||
| ABC-Mart, Inc. | 800 | $ | 45,229 | $ | (1,439 | ) | ||||||
| Ajinomoto Co., Inc. | 5,000 | 107,466 | 10,912 | |||||||||
| Alfresa Holdings Corp. | 8,100 | 146,568 | 13,409 | |||||||||
| Alps Electric Co., Ltd. | 15,200 | 418,857 | (6,663 | ) | ||||||||
| Amada Holdings Co., Ltd. | 68,400 | 661,171 | (8,451 | ) | ||||||||
| Aozora Bank Ltd. | 26,000 | 101,216 | (10,480 | ) | ||||||||
| Asahi Kasei Corp. | 8,000 | 68,150 | (14,053 | ) | ||||||||
| Astellas Pharma, Inc. | 16,400 | 237,197 | (3,730 | ) | ||||||||
| Bandai Namco Holdings, Inc. | 41,600 | 952,880 | (73,991 | ) | ||||||||
| Bank of Yokohama Ltd./The | 32,000 | 195,143 | 1,005 | |||||||||
| Bridgestone Corp. | 19,900 | 729,555 | (46,957 | ) | ||||||||
| Central Japan Railway Co. | 700 | 104,916 | 19,357 | |||||||||
| Chiba Bank Ltd./The | 13,000 | 95,317 | (3,066 | ) | ||||||||
| Chubu Electric Power Co., Inc. | 93,500 | 1,357,806 | (77,442 | ) | ||||||||
| Chugoku Bank Ltd./The | 7,300 | 103,886 | (6,476 | ) | ||||||||
| Dai Nippon Printing Co., Ltd. | 5,000 | 50,376 | (933 | ) | ||||||||
| Daicel Corp. | 18,200 | 229,627 | 41,224 | |||||||||
| Dai-ichi Life Insurance Co., Ltd./The | 57,400 | 945,086 | 9,917 | |||||||||
| Daiichi Sankyo Co., Ltd. | 11,900 | 237,139 | 8,473 | |||||||||
| DeNA Co., Ltd. | 47,600 | 781,893 | (37,603 | ) | ||||||||
| REFERENCE ENTITY | SHARES | NOTIONAL (a) | NET UNREALIZED APPRECIATION (DEPRECIATION) | |||||||||
| Japan (continued) | ||||||||||||
| Disco Corp. | 1,400 | $ | 121,564 | $ | 10,276 | |||||||
| Don Quijote Holdings Co., Ltd. | 9,300 | 357,080 | (30,476 | ) | ||||||||
| Ezaki Glico Co., Ltd. | 1,600 | 73,860 | 12,578 | |||||||||
| Fuji Electric Co., Ltd. | 17,000 | 71,836 | (541 | ) | ||||||||
| Fuji Heavy Industries Ltd. | 36,300 | 1,323,037 | 172,388 | |||||||||
| FUJIFILM Holdings Corp. | 11,500 | 458,064 | 21,859 | |||||||||
| Fujitsu Ltd. | 27,000 | 150,664 | (15,903 | ) | ||||||||
| Fukuoka Financial Group, Inc. | 9,000 | 41,901 | 2,727 | |||||||||
| Gunma Bank Ltd./The | 26,000 | 161,345 | (10,175 | ) | ||||||||
| Hachijuni Bank Ltd./The | 23,000 | 159,786 | (19,026 | ) | ||||||||
| Hakuhodo DY Holdings, Inc. | 43,000 | 432,072 | 33,169 | |||||||||
| Haseko Corp. | 100,600 | 1,124,981 | (12,710 | ) | ||||||||
| Hikari Tsushin, Inc. | 700 | 46,714 | 955 | |||||||||
| Hiroshima Bank Ltd./The | 8,000 | 44,823 | 647 | |||||||||
| Hitachi Chemical Co., Ltd. | 12,200 | 197,603 | (4,054 | ) | ||||||||
| Hitachi High-Technologies Corp. | 15,000 | 366,011 | 39,636 | |||||||||
| Hitachi Metals Ltd. | 6,600 | 99,479 | (18,047 | ) | ||||||||
| Hokuhoku Financial Group, Inc. | 111,000 | 247,462 | (21,183 | ) | ||||||||
| Hoshizaki Electric Co., Ltd. | 1,100 | 73,459 | (5,077 | ) | ||||||||
| Hoya Corp. | 29,300 | 1,060,661 | 137,491 | |||||||||
| Ibiden Co., Ltd. | 2,700 | 43,470 | (4,762 | ) | ||||||||
| The accompanying notes are an integral part of these financial statements. | (Continued) |
| AQR Funds | Annual Report | December 2015 | ||||||||||||||
68
Table of Contents
| Schedule of Investments | December 31, 2015 |
| AQR EQUITY MARKET NEUTRAL FUND |
| REFERENCE ENTITY | SHARES | NOTIONAL (a) | NET UNREALIZED APPRECIATION (DEPRECIATION) | |||||||||
| Japan (continued) | ||||||||||||
| Idemitsu Kosan Co., Ltd. | 4,100 | $ | 63,492 | $ | 1,973 | |||||||
| Iida Group Holdings Co., Ltd. | 6,800 | 108,179 | 17,852 | |||||||||
| Inpex Corp. | 21,200 | 210,793 | (4,116 | ) | ||||||||
| Isuzu Motors Ltd. | 78,300 | 856,350 | (12,853 | ) | ||||||||
| ITOCHU Corp. | 13,800 | 168,716 | (5,483 | ) | ||||||||
| Itochu Techno-Solutions Corp. | 32,100 | 682,469 | (42,897 | ) | ||||||||
| Iyo Bank Ltd./The | 5,300 | 59,028 | (7,535 | ) | ||||||||
| Izumi Co., Ltd. | 9,600 | 383,817 | (11,122 | ) | ||||||||
| Japan Airlines Co., Ltd. | 33,000 | 1,129,337 | 51,829 | |||||||||
| Japan Petroleum Exploration Co., Ltd. | 26,000 | 708,107 | (9,815 | ) | ||||||||
| JSR Corp. | 6,200 | 109,440 | (12,817 | ) | ||||||||
| JTEKT Corp. | 24,800 | 411,437 | (5,508 | ) | ||||||||
| JX Holdings, Inc. | 136,400 | 560,426 | 12,056 | |||||||||
| Kaken Pharmaceutical Co., Ltd. | 13,000 | 915,508 | (27,177 | ) | ||||||||
| Kamigumi Co., Ltd. | 34,000 | 282,855 | 9,879 | |||||||||
| Kaneka Corp. | 36,000 | 357,861 | 16,332 | |||||||||
| Kansai Electric Power Co., Inc./The | 7,700 | 91,580 | 741 | |||||||||
| KDDI Corp. | 5,900 | 139,806 | 13,419 | |||||||||
| Kewpie Corp. | 5,600 | 133,933 | 4,397 | |||||||||
| Kobayashi Pharmaceutical Co., Ltd. | 600 | 45,537 | 3,741 | |||||||||
| Koito Manufacturing Co., Ltd. | 7,600 | 300,775 | 10,881 | |||||||||
| Konami Corp. | 39,600 | 914,999 | 27,661 | |||||||||
| Konica Minolta, Inc. | 73,500 | 800,523 | (64,407 | ) | ||||||||
| Kurita Water Industries Ltd. | 2,200 | 50,110 | (4,039 | ) | ||||||||
| Lawson, Inc. | 600 | 44,321 | 4,382 | |||||||||
| LIXIL Group Corp. | 8,300 | 173,532 | 10,808 | |||||||||
| M3, Inc. | 3,700 | 74,202 | 2,515 | |||||||||
| Mazda Motor Corp. | 32,600 | 671,177 | 1,516 | |||||||||
| Medipal Holdings Corp. | 45,200 | 740,676 | 29,712 | |||||||||
| MEIJI Holdings Co., Ltd. | 2,100 | 159,591 | 13,868 | |||||||||
| Miraca Holdings, Inc. | 4,000 | 179,645 | (3,639 | ) | ||||||||
| MISUMI Group, Inc. | 13,100 | 138,479 | 42,480 | |||||||||
| Mitsubishi Chemical Holdings Corp. | 27,300 | 176,475 | (3,264 | ) | ||||||||
| Mitsubishi Electric Corp. | 144,000 | 1,505,232 | 6,314 | |||||||||
| Mitsubishi Motors Corp. | 231,500 | 2,005,258 | (46,644 | ) | ||||||||
| Mitsubishi Tanabe Pharma Corp. | 53,300 | 932,315 | (14,029 | ) | ||||||||
| Mitsubishi UFJ Financial Group, Inc. | 24,200 | 172,450 | (22,550 | ) | ||||||||
| Mitsui Chemicals, Inc. | 119,000 | 521,943 | 5,823 | |||||||||
| Mixi, Inc. | 22,600 | 829,239 | 16,078 | |||||||||
| Mizuho Financial Group, Inc. | 85,400 | 185,940 | (15,140 | ) | ||||||||
| MS&AD Insurance Group Holdings, Inc. | 28,300 | 820,220 | 9,669 | |||||||||
| Murata Manufacturing Co., Ltd. | 2,200 | 295,185 | 21,354 | |||||||||
| Nexon Co., Ltd. | 49,300 | 745,153 | 56,847 | |||||||||
| NHK Spring Co., Ltd. | 81,300 | 800,506 | 14,631 | |||||||||
| REFERENCE ENTITY | SHARES | NOTIONAL (a) | NET UNREALIZED APPRECIATION (DEPRECIATION) | |||||||||
| Japan (continued) | ||||||||||||
| Nintendo Co., Ltd. | 2,000 | $ | 338,677 | $ | (63,657 | ) | ||||||
| Nippon Express Co., Ltd. | 154,000 | 770,624 | (46,943 | ) | ||||||||
| Nippon Shokubai Co., Ltd. | 4,700 | 343,854 | (16,805 | ) | ||||||||
| Nippon Telegraph & Telephone Corp. | 45,700 | 1,718,226 | 100,548 | |||||||||
| Nippon Yusen KK | 64,000 | 158,258 | (3,142 | ) | ||||||||
| Nisshin Seifun Group, Inc. | 13,000 | 212,185 | 163 | |||||||||
| Nitori Holdings Co., Ltd. | 600 | 38,937 | 11,452 | |||||||||
| Nitto Denko Corp. | 4,400 | 300,515 | 20,710 | |||||||||
| NOK Corp. | 30,700 | 827,989 | (110,811 | ) | ||||||||
| Nomura Research Institute Ltd. | 5,540 | 208,860 | 3,897 | |||||||||
| NSK Ltd. | 28,700 | 317,696 | (5,844 | ) | ||||||||
| NTN Corp. | 85,000 | 370,745 | (12,329 | ) | ||||||||
| Obic Co., Ltd. | 5,800 | 272,799 | 34,222 | |||||||||
| Omron Corp. | 1,500 | 63,096 | (13,076 | ) | ||||||||
| Oracle Corp. Japan | 10,900 | 489,887 | 17,618 | |||||||||
| ORIX Corp. | 25,500 | 351,577 | 6,149 | |||||||||
| Osaka Gas Co., Ltd. | 13,000 | 49,310 | (2,355 | ) | ||||||||
| Otsuka Corp. | 15,300 | 741,737 | 9,857 | |||||||||
| Otsuka Holdings Co., Ltd. | 14,200 | 467,355 | 37,156 | |||||||||
| Panasonic Corp. | 61,000 | 655,839 | (37,451 | ) | ||||||||
| Park24 Co., Ltd. | 3,500 | 63,244 | 21,552 | |||||||||
| Pola Orbis Holdings, Inc. | 23,100 | 1,442,994 | 79,495 | |||||||||
| Recruit Holdings Co., Ltd. | 1,500 | 47,109 | (3,018 | ) | ||||||||
| Resona Holdings, Inc. | 20,600 | 111,021 | (10,983 | ) | ||||||||
| Rohm Co., Ltd. | 7,800 | 393,659 | 1,418 | |||||||||
| Sankyo Co., Ltd. | 17,300 | 654,268 | (8,498 | ) | ||||||||
| Santen Pharmaceutical Co., Ltd. | 33,600 | 517,892 | 35,279 | |||||||||
| Sega Sammy Holdings, Inc. | 16,500 | 168,322 | (13,991 | ) | ||||||||
| Sekisui Chemical Co., Ltd. | 41,800 | 492,682 | 53,070 | |||||||||
| Shimadzu Corp. | 30,000 | 449,680 | 52,518 | |||||||||
| Shimamura Co., Ltd. | 2,300 | 225,870 | 43,481 | |||||||||
| Shimizu Corp. | 7,000 | 48,460 | 8,619 | |||||||||
| Shinsei Bank Ltd. | 25,000 | 49,953 | (3,945 | ) | ||||||||
| Shionogi & Co., Ltd. | 10,600 | 470,012 | 9,428 | |||||||||
| Sojitz Corp. | 480,300 | 1,031,547 | (23,599 | ) | ||||||||
| Sompo Japan Nipponkoa Holdings, Inc. | 18,300 | 605,957 | (5,082 | ) | ||||||||
| Sony Corp. | 14,000 | 377,277 | (33,201 | ) | ||||||||
| Sony Financial Holdings, Inc. | 2,500 | 44,536 | 183 | |||||||||
| Sugi Holdings Co., Ltd. | 5,000 | 226,888 | 48,976 | |||||||||
| Sumitomo Chemical Co., Ltd. | 110,000 | 619,187 | 12,553 | |||||||||
| Sumitomo Mitsui Financial Group, Inc. | 2,900 | 128,746 | (19,297 | ) | ||||||||
| Sumitomo Rubber Industries Ltd. | 8,200 | 141,047 | (34,420 | ) | ||||||||
| Sundrug Co., Ltd. | 8,200 | 527,683 | (450 | ) | ||||||||
| Suruga Bank Ltd. | 2,600 | 50,787 | 2,796 | |||||||||
| Suzuken Co., Ltd./Aichi Japan | 25,300 | 920,547 | 40,908 | |||||||||
| The accompanying notes are an integral part of these financial statements. | (Continued) |
| AQR Funds | Annual Report | December 2015 | ||||||||||||||
69
Table of Contents
| Schedule of Investments | December 31, 2015 |
| AQR EQUITY MARKET NEUTRAL FUND |
| REFERENCE ENTITY | SHARES | NOTIONAL (a) | NET UNREALIZED APPRECIATION (DEPRECIATION) | |||||||||
| Japan (continued) | ||||||||||||
| Suzuki Motor Corp. | 2,300 | $ | 63,073 | $ | 6,810 | |||||||
| T&D Holdings, Inc. | 45,800 | 575,423 | 28,841 | |||||||||
| Taiheiyo Cement Corp. | 52,000 | 159,867 | (8,011 | ) | ||||||||
| TDK Corp. | 1,400 | 94,232 | (4,571 | ) | ||||||||
| Teijin Ltd. | 178,000 | 621,593 | (14,992 | ) | ||||||||
| Toho Gas Co., Ltd. | 67,000 | 420,458 | 12,243 | |||||||||
| Tohoku Electric Power Co., Inc. | 62,500 | 814,373 | (33,041 | ) | ||||||||
| Tokio Marine Holdings, Inc. | 9,600 | 369,027 | 1,769 | |||||||||
| Tokyo Broadcasting System Holdings, Inc. | 2,900 | 41,491 | 4,425 | |||||||||
| Tokyo Electric Power Co., Inc. | 196,800 | 1,219,663 | (86,438 | ) | ||||||||
| Tokyo Gas Co., Ltd. | 136,000 | 646,150 | (7,114 | ) | ||||||||
| Toppan Printing Co., Ltd. | 22,000 | 198,810 | 3,880 | |||||||||
| Tosoh Corp. | 85,000 | 445,968 | (8,727 | ) | ||||||||
| Toyo Suisan Kaisha Ltd. | 6,100 | 219,080 | (6,480 | ) | ||||||||
| Toyoda Gosei Co., Ltd. | 4,700 | 108,200 | (1,430 | ) | ||||||||
| Toyota Boshoku Corp. | 26,300 | 547,432 | (18,081 | ) | ||||||||
| Trend Micro, Inc. | 1,200 | 45,613 | 3,079 | |||||||||
| Tsuruha Holdings, Inc. | 6,100 | 516,986 | 11,555 | |||||||||
| West Japan Railway Co. | 2,300 | 134,089 | 24,894 | |||||||||
| Yamaguchi Financial Group, Inc. | 10,000 | 121,897 | (3,425 | ) | ||||||||
|
| |||||||||||
| 284,845 | ||||||||||||
|
| |||||||||||
Total of Long Equity Positions | 284,845 | |||||||||||
|
| |||||||||||
Short Positions | ||||||||||||
| Common Stocks | ||||||||||||
| Japan | ||||||||||||
| Advantest Corp. | (16,600 | ) | (140,713 | ) | 3,012 | |||||||
| Aeon Co., Ltd. | (42,800 | ) | (606,661 | ) | (52,784 | ) | ||||||
| AEON Financial Service Co., Ltd. | (12,200 | ) | (262,438 | ) | (10,095 | ) | ||||||
| Aisin Seiki Co., Ltd. | (4,000 | ) | (173,937 | ) | 1,784 | |||||||
| ANA Holdings, Inc. | (117,000 | ) | (336,829 | ) | (729 | ) | ||||||
| Asahi Glass Co., Ltd. | (84,000 | ) | (488,659 | ) | 7,436 | |||||||
| Asahi Group Holdings Ltd. | (21,600 | ) | (682,124 | ) | 5,948 | |||||||
| Asics Corp. | (31,300 | ) | (709,344 | ) | 59,947 | |||||||
| Brother Industries Ltd. | (13,000 | ) | (152,107 | ) | 2,766 | |||||||
| Calbee, Inc. | (15,000 | ) | (607,164 | ) | (26,272 | ) | ||||||
| Canon, Inc. | (21,000 | ) | (639,057 | ) | 3,806 | |||||||
| Century Tokyo Leasing Corp. | (1,900 | ) | (67,762 | ) | (109 | ) | ||||||
| Chugai Pharmaceutical Co., Ltd. | (21,200 | ) | (729,257 | ) | (9,703 | ) | ||||||
| Chugoku Electric Power Co., Inc./The | (24,700 | ) | (318,075 | ) | (8,049 | ) | ||||||
| Citizen Holdings Co., Ltd. | (6,300 | ) | (44,409 | ) | (871 | ) | ||||||
| Credit Saison Co., Ltd. | (25,100 | ) | (475,758 | ) | (18,767 | ) | ||||||
| Daihatsu Motor Co., Ltd. | (17,700 | ) | (241,198 | ) | 2,425 | |||||||
| Daikin Industries Ltd. | (6,900 | ) | (469,991 | ) | (32,478 | ) | ||||||
| Daiwa Securities Group, Inc. | (11,000 | ) | (75,812 | ) | 8,561 | |||||||
| REFERENCE ENTITY | SHARES | NOTIONAL (a) | NET UNREALIZED APPRECIATION (DEPRECIATION) | |||||||||
| Japan (continued) | ||||||||||||
| Denso Corp. | (25,300 | ) | $ | (1,158,355 | ) | $ | (50,618 | ) | ||||
| Eisai Co., Ltd. | (3,300 | ) | (182,303 | ) | (35,995 | ) | ||||||
| Electric Power Development Co., Ltd. | (10,000 | ) | (354,285 | ) | (1,881 | ) | ||||||
| FamilyMart Co., Ltd. | (5,400 | ) | (251,784 | ) | 495 | |||||||
| Fast Retailing Co., Ltd. | (1,800 | ) | (661,406 | ) | 31,745 | |||||||
| Hamamatsu Photonics KK | (25,400 | ) | (685,669 | ) | (10,678 | ) | ||||||
| Hirose Electric Co., Ltd. | (1,400 | ) | (169,052 | ) | (449 | ) | ||||||
| Hitachi Construction Machinery Co., Ltd. | (27,100 | ) | (418,268 | ) | (3,200 | ) | ||||||
| Hitachi Ltd. | (56,000 | ) | (324,300 | ) | 6,983 | |||||||
| Hokkaido Electric Power Co., Inc. | (2,700 | ) | (17,428 | ) | (10,313 | ) | ||||||
| Honda Motor Co., Ltd. | (26,600 | ) | (816,568 | ) | (33,609 | ) | ||||||
| IHI Corp. | (386,000 | ) | (1,193,563 | ) | 128,010 | |||||||
| Isetan Mitsukoshi Holdings Ltd. | (9,500 | ) | (128,946 | ) | 5,056 | |||||||
| J Front Retailing Co., Ltd. | (13,700 | ) | (215,880 | ) | 16,714 | |||||||
| Japan Airport Terminal Co., Ltd. | (15,900 | ) | (745,144 | ) | 41,266 | |||||||
| Japan Tobacco, Inc. | (33,900 | ) | (1,206,613 | ) | (37,983 | ) | ||||||
| JFE Holdings, Inc. | (26,600 | ) | (429,170 | ) | 11,486 | |||||||
| JGC Corp. | (24,000 | ) | (409,912 | ) | 42,563 | |||||||
| Kajima Corp. | (14,000 | ) | (83,385 | ) | 65 | |||||||
| Kakaku.com, Inc. | (22,600 | ) | (409,387 | ) | (35,146 | ) | ||||||
| Kao Corp. | (10,600 | ) | (499,968 | ) | (44,753 | ) | ||||||
| Kawasaki Heavy Industries Ltd. | (47,000 | ) | (175,744 | ) | 1,849 | |||||||
| Keihan Electric Railway Co., Ltd. | (34,000 | ) | (224,929 | ) | (2,777 | ) | ||||||
| Keikyu Corp. | (28,000 | ) | (229,456 | ) | (1,915 | ) | ||||||
| Keio Corp. | (75,000 | ) | (589,472 | ) | (58,207 | ) | ||||||
| Keyence Corp. | (200 | ) | (99,148 | ) | (10,773 | ) | ||||||
| Kikkoman Corp. | (8,000 | ) | (247,242 | ) | (29,937 | ) | ||||||
| Kintetsu Group Holdings Co., Ltd. | (73,000 | ) | (265,838 | ) | (30,964 | ) | ||||||
| Kirin Holdings Co., Ltd. | (35,400 | ) | (485,585 | ) | 4,954 | |||||||
| Kobe Steel Ltd. | (90,000 | ) | (101,656 | ) | 3,870 | |||||||
| Komatsu Ltd. | (18,100 | ) | (316,574 | ) | 20,413 | |||||||
| Kubota Corp. | (30,000 | ) | (473,476 | ) | 10,017 | |||||||
| Kyocera Corp. | (1,800 | ) | (98,123 | ) | 14,530 | |||||||
| Kyushu Electric Power Co., Inc. | (133,000 | ) | (1,451,814 | ) | 2,232 | |||||||
| Mabuchi Motor Co., Ltd. | (3,200 | ) | (177,081 | ) | 3,658 | |||||||
| Makita Corp. | (9,700 | ) | (553,278 | ) | (5,701 | ) | ||||||
| Marubeni Corp. | (66,700 | ) | (349,024 | ) | 6,113 | |||||||
| Marui Group Co., Ltd. | (72,100 | ) | (862,228 | ) | (311,027 | ) | ||||||
| Maruichi Steel Tube Ltd. | (4,000 | ) | (118,903 | ) | 816 | |||||||
| Minebea Co., Ltd. | (58,000 | ) | (759,509 | ) | 262,915 | |||||||
| Mitsubishi Heavy Industries Ltd. | (103,000 | ) | (506,150 | ) | 55,782 | |||||||
| Mitsubishi Logistics Corp. | (65,000 | ) | (845,740 | ) | (10,711 | ) | ||||||
| Mitsui OSK Lines Ltd. | (255,000 | ) | (713,326 | ) | 70,145 | |||||||
| Nagoya Railroad Co., Ltd. | (35,000 | ) | (145,390 | ) | (284 | ) | ||||||
| NGK Insulators Ltd. | (11,000 | ) | (259,608 | ) | 11,666 | |||||||
| The accompanying notes are an integral part of these financial statements. | (Continued) |
| AQR Funds | Annual Report | December 2015 | ||||||||||||||
70
Table of Contents
| Schedule of Investments | December 31, 2015 |
| AQR EQUITY MARKET NEUTRAL FUND |
| REFERENCE ENTITY | SHARES | NOTIONAL (a) | NET UNREALIZED APPRECIATION (DEPRECIATION) | |||||||||
| Japan (continued) | ||||||||||||
| NGK Spark Plug Co., Ltd. | (55,200 | ) | $ | (1,438,199 | ) | $ | (15,133 | ) | ||||
| Nidec Corp. | (13,300 | ) | (983,411 | ) | 18,949 | |||||||
| Nippon Electric Glass Co., Ltd. | (65,000 | ) | (325,670 | ) | (1,941 | ) | ||||||
| Nippon Paint Holdings Co., Ltd. | (53,900 | ) | (1,209,883 | ) | (94,607 | ) | ||||||
| Nippon Steel & Sumitomo Metal Corp. | (25,500 | ) | (513,368 | ) | 8,917 | |||||||
| Nissan Chemical Industries Ltd. | (2,000 | ) | (45,433 | ) | 30 | |||||||
| Nissan Motor Co., Ltd. | (23,200 | ) | (230,375 | ) | (12,546 | ) | ||||||
| Nomura Holdings, Inc. | (45,900 | ) | (272,107 | ) | 16,442 | |||||||
| Obayashi Corp. | (6,000 | ) | (41,173 | ) | (14,191 | ) | ||||||
| Odakyu Electric Railway Co., Ltd. | (90,000 | ) | (865,244 | ) | (103,769 | ) | ||||||
| Oji Holdings Corp. | (11,000 | ) | (44,840 | ) | 631 | |||||||
| Olympus Corp. | (9,000 | ) | (326,410 | ) | (27,908 | ) | ||||||
| Ono Pharmaceutical Co., Ltd. | (2,700 | ) | (315,291 | ) | (166,150 | ) | ||||||
| Oriental Land Co., Ltd. | (23,800 | ) | (1,351,586 | ) | (88,230 | ) | ||||||
| Pigeon Corp. | (17,600 | ) | (421,556 | ) | (5,422 | ) | ||||||
| Rakuten, Inc. | (24,400 | ) | (332,055 | ) | 51,022 | |||||||
| Ricoh Co., Ltd. | (136,900 | ) | (1,385,835 | ) | (23,798 | ) | ||||||
| Rinnai Corp. | (3,800 | ) | (333,888 | ) | (2,806 | ) | ||||||
| Ryohin Keikaku Co., Ltd. | (400 | ) | (79,621 | ) | (1,384 | ) | ||||||
| Secom Co., Ltd. | (4,500 | ) | (305,718 | ) | 754 | |||||||
| Seibu Holdings, Inc. | (8,300 | ) | (202,328 | ) | 32,823 | |||||||
| Seiko Epson Corp. | (31,800 | ) | (503,111 | ) | 13,418 | |||||||
| Seven & i Holdings Co., Ltd. | (7,200 | ) | (329,682 | ) | 33 | |||||||
| Shikoku Electric Power Co., Inc. | (36,700 | ) | (571,460 | ) | (1,840 | ) | ||||||
| Shimano, Inc. | (8,200 | ) | (1,243,159 | ) | (16,022 | ) | ||||||
| Shiseido Co., Ltd. | (15,700 | ) | (346,108 | ) | 20,355 | |||||||
| SoftBank Group Corp. | (30,100 | ) | (1,604,136 | ) | 84,977 | |||||||
| Sohgo Security Services Co., Ltd. | (8,800 | ) | (394,893 | ) | (17,817 | ) | ||||||
| Stanley Electric Co., Ltd. | (32,000 | ) | (692,294 | ) | (9,708 | ) | ||||||
| Sumco Corp. | (160,100 | ) | (1,744,172 | ) | 536,298 | |||||||
| Sumitomo Corp. | (9,800 | ) | (98,368 | ) | (1,546 | ) | ||||||
| Sumitomo Dainippon Pharma Co., Ltd. | (13,000 | ) | (154,419 | ) | 1,260 | |||||||
| Sumitomo Metal Mining Co., Ltd. | (29,000 | ) | (351,522 | ) | (507 | ) | ||||||
| REFERENCE ENTITY | SHARES | NOTIONAL (a) | NET UNREALIZED APPRECIATION (DEPRECIATION) | |||||||||
| Japan (continued) | ||||||||||||
| Sumitomo Mitsui Trust Holdings, Inc. | (12,000 | ) | $ | (48,115 | ) | $ | 2,667 | |||||
| Suntory Beverage & Food Ltd. | (3,600 | ) | (154,850 | ) | (2,744 | ) | ||||||
| Sysmex Corp. | (700 | ) | (45,587 | ) | 686 | |||||||
| Taisei Corp. | (79,000 | ) | (523,266 | ) | 2,896 | |||||||
| Taiyo Nippon Sanso Corp. | (15,800 | ) | (154,948 | ) | 12,057 | |||||||
| Takashimaya Co., Ltd. | (27,000 | ) | (219,598 | ) | (23,550 | ) | ||||||
| Terumo Corp. | (18,500 | ) | (498,262 | ) | (75,116 | ) | ||||||
| THK Co., Ltd. | (11,400 | ) | (215,016 | ) | 3,727 | |||||||
| Tobu Railway Co., Ltd. | (71,000 | ) | (338,460 | ) | (11,742 | ) | ||||||
| Tokyo Electron Ltd. | (1,600 | ) | (102,765 | ) | 5,830 | |||||||
| Toray Industries, Inc. | (7,000 | ) | (58,911 | ) | (6,136 | ) | ||||||
| Toshiba Corp. | (831,000 | ) | (2,152,127 | ) | 444,235 | |||||||
| Toyo Seikan Group Holdings Ltd. | (84,300 | ) | (1,448,086 | ) | (115,607 | ) | ||||||
| Toyota Industries Corp. | (11,400 | ) | (603,973 | ) | (5,624 | ) | ||||||
| Toyota Motor Corp. | (5,200 | ) | (321,878 | ) | 1,667 | |||||||
| Unicharm Corp. | (98,100 | ) | (1,978,082 | ) | (25,284 | ) | ||||||
| Yahoo Japan Corp. | (52,800 | ) | (202,271 | ) | (12,356 | ) | ||||||
| Yakult Honsha Co., Ltd. | (20,400 | ) | (1,048,704 | ) | 50,232 | |||||||
| Yamaha Motor Co., Ltd. | (10,500 | ) | (235,246 | ) | (114 | ) | ||||||
| Yamato Holdings Co., Ltd. | (88,700 | ) | (1,807,178 | ) | (72,209 | ) | ||||||
| Yaskawa Electric Corp. | (63,500 | ) | (712,296 | ) | (151,729 | ) | ||||||
| Yokohama Rubber Co., Ltd./The | (16,600 | ) | (262,035 | ) | 7,095 | |||||||
|
| |||||||||||
| 171,715 | ||||||||||||
|
| |||||||||||
Total of Short Equity Positions | 171,715 | |||||||||||
|
| |||||||||||
Total of Long and Short Equity Positions | 456,560 | |||||||||||
|
| |||||||||||
Net Cash and Other Receivables/ (Payables) (b) | (23,696 | ) | ||||||||||
|
| |||||||||||
Swaps, at Value | $ | 432,864 | ||||||||||
|
| |||||||||||
| (a) | Notional value represents the market value (including any fees or commissions) of the long and short positions when they are established. |
| (b) | Cash and other receivables/(payables) includes the gains (or losses) realized within the swap when the swap resets. |
| The accompanying notes are an integral part of these financial statements. | (Continued) |
| AQR Funds | Annual Report | December 2015 | ||||||||||||||
71
Table of Contents
| Schedule of Investments | December 31, 2015 |
| AQR EQUITY MARKET NEUTRAL FUND |
| COUNTERPARTY | DESCRIPTION | TERMINATION DATE** | VALUE (Note 5) | |||||
Morgan Stanley Capital Services, Inc. | The Fund receives the total return on a portfolio of long and short positions and pays or receives the Federal Funds Effective Rate plus or minus a specified spread, which is denominated in USD based on the local currencies of the positions within the swap. | 10-12 months maturity 10/13/2016 | $4,004,019 | |||||
|
| |||||||
| ** | The maturity dates are measured from the commencement of investment in each underlying portfolio swap positions. |
Additional Information — Total Return Basket Swap
The following table represents the individual long and short positions and related values within the total return basket swap as of December 31, 2015.
| REFERENCE ENTITY | SHARES | NOTIONAL (a) | NET UNREALIZED APPRECIATION (DEPRECIATION) | |||||||||
| Long Positions | ||||||||||||
| Common Stocks | ||||||||||||
| Canada | ||||||||||||
| Domtar Corp. | 15,307 | $ | 608,496 | $ | (42,902 | ) | ||||||
|
| |||||||||||
| Ireland | ||||||||||||
| Accenture PLC | 7,244 | 774,515 | (17,517 | ) | ||||||||
| Jazz Pharmaceuticals PLC | 1,428 | 203,978 | (3,258 | ) | ||||||||
| XL Group PLC | 8,741 | 325,314 | 17,159 | |||||||||
|
| |||||||||||
| (3,616 | ) | |||||||||||
|
| |||||||||||
| Puerto Rico | ||||||||||||
| Popular, Inc. | 6,256 | 199,905 | (22,610 | ) | ||||||||
|
| |||||||||||
| Singapore | ||||||||||||
| Flextronics International Ltd. | 56,854 | 631,557 | 5,776 | |||||||||
|
| |||||||||||
| Switzerland | ||||||||||||
| ACE Ltd. | 481 | 51,265 | 4,940 | |||||||||
| Allied World Assurance Co. Holdings AG | 4,448 | 170,106 | (4,685 | ) | ||||||||
| TE Connectivity Ltd. | 4,456 | 291,883 | (3,981 | ) | ||||||||
|
| |||||||||||
| (3,726 | ) | |||||||||||
|
| |||||||||||
| United Kingdom | ||||||||||||
| Michael Kors Holdings Ltd. | 12,174 | 510,437 | (22,746 | ) | ||||||||
|
| |||||||||||
| United States | ||||||||||||
| 3M Co. | 7,530 | 1,139,062 | (4,743 | ) | ||||||||
| Aaron’s, Inc. | 3,471 | 79,416 | (1,700 | ) | ||||||||
| Abbott Laboratories | 33,006 | 1,381,892 | 100,408 | |||||||||
| AbbVie, Inc. | 17,448 | 1,009,025 | 24,594 | |||||||||
| Activision Blizzard, Inc. | 3,659 | 118,164 | 23,476 | |||||||||
| Adobe Systems, Inc. | 1,459 | 139,228 | (2,170 | ) | ||||||||
| Aetna, Inc. | 13,854 | 1,484,828 | 13,066 | |||||||||
| Aflac, Inc. | 22,756 | 1,399,123 | (36,039 | ) | ||||||||
| AGCO Corp. | 8,155 | 385,296 | (15,140 | ) | ||||||||
| Agilent Technologies, Inc. | 36,859 | 1,332,983 | 208,092 | |||||||||
| Akamai Technologies, Inc. | 16,686 | 1,004,340 | (126,156 | ) | ||||||||
| Alleghany Corp. | 291 | 140,160 | (1,082 | ) | ||||||||
| REFERENCE ENTITY | SHARES | NOTIONAL (a) | NET UNREALIZED APPRECIATION (DEPRECIATION) | |||||||||
| United States (continued) | ||||||||||||
| Allscripts Healthcare Solutions, Inc. | 19,550 | $ | 292,508 | $ | 8,171 | |||||||
| Allstate Corp./The | 22,464 | 1,382,310 | 12,479 | |||||||||
| Alphabet, Inc. | 1,970 | 1,408,976 | 123,704 | |||||||||
| Altria Group, Inc. | 41,196 | 2,353,179 | 44,840 | |||||||||
| Amazon.com, Inc. | 1,449 | 865,827 | 113,538 | |||||||||
| Amdocs Ltd. | 25,844 | 1,479,630 | (69,323 | ) | ||||||||
| AMERCO | 249 | 99,824 | (2,839 | ) | ||||||||
| Ameren Corp. | 37,862 | 1,658,089 | (21,315 | ) | ||||||||
| American Eagle Outfitters, Inc. | 15,432 | 238,087 | 1,109 | |||||||||
| American Electric Power Co., Inc. | 4,109 | 233,679 | 5,753 | |||||||||
| American Express Co. | 1,094 | 83,863 | (7,775 | ) | ||||||||
| American Financial Group, Inc. | 6,110 | 444,709 | (4,300 | ) | ||||||||
| American International Group, Inc. | 20,799 | 1,258,400 | 30,514 | |||||||||
| American Water Works Co., Inc. | 3,591 | 210,678 | 3,884 | |||||||||
| Ameriprise Financial, Inc. | 5,795 | 646,785 | (30,081 | ) | ||||||||
| AmerisourceBergen Corp. | 19,921 | 1,935,395 | 130,612 | |||||||||
| Amgen, Inc. | 12,595 | 1,935,466 | 109,081 | |||||||||
| Analog Devices, Inc. | 10,487 | 619,941 | (39,800 | ) | ||||||||
| ANSYS, Inc. | 483 | 44,081 | 597 | |||||||||
| Anthem, Inc. | 11,572 | 1,548,866 | 64,734 | |||||||||
| AO Smith Corp. | 19,692 | 1,477,370 | 31,234 | |||||||||
| Apollo Education Group, Inc. | 48,024 | 514,890 | (146,546 | ) | ||||||||
| Apple, Inc. | 12,843 | 1,434,576 | (82,722 | ) | ||||||||
| AptarGroup, Inc. | 1,163 | 80,990 | 3,502 | |||||||||
| Arch Capital Group Ltd. | 642 | 47,648 | (2,868 | ) | ||||||||
| Archer-Daniels-Midland Co. | 21,388 | 914,987 | (130,476 | ) | ||||||||
| Armstrong World Industries, Inc. | 7,880 | 381,170 | (20,818 | ) | ||||||||
| Arrow Electronics, Inc. | 16,890 | 982,005 | (66,905 | ) | ||||||||
| Aspen Insurance Holdings Ltd. | 4,189 | 204,629 | (2,300 | ) | ||||||||
| Assurant, Inc. | 9,074 | 741,648 | (10,828 | ) | ||||||||
| Assured Guaranty Ltd. | 51,134 | 1,402,241 | (50,769 | ) | ||||||||
| Atwood Oceanics, Inc. | 37,911 | 599,408 | (211,579 | ) | ||||||||
| The accompanying notes are an integral part of these financial statements. | (Continued) |
| AQR Funds | Annual Report | December 2015 | ||||||||||||||
72
Table of Contents
| Schedule of Investments | December 31, 2015 |
| AQR EQUITY MARKET NEUTRAL FUND |
| REFERENCE ENTITY | SHARES | NOTIONAL (a) | NET UNREALIZED APPRECIATION (DEPRECIATION) | |||||||||
| United States (continued) | ||||||||||||
| Automatic Data Processing, Inc. | 954 | $ | 81,204 | $ | (382 | ) | ||||||
| AutoZone, Inc. | 326 | 248,227 | (6,364 | ) | ||||||||
| Avery Dennison Corp. | 16,931 | 1,047,235 | 13,662 | |||||||||
| Avnet, Inc. | 35,391 | 1,608,110 | (91,959 | ) | ||||||||
| Avon Products, Inc. | 208,679 | 761,484 | 83,666 | |||||||||
| Axis Capital Holdings Ltd. | 8,670 | 486,535 | 893 | |||||||||
| Bank of New York Mellon Corp./The | 2,613 | 109,005 | (1,297 | ) | ||||||||
| Baxalta, Inc. | 15,819 | 619,227 | (1,811 | ) | ||||||||
| Baxter International, Inc. | 34,088 | 1,246,816 | 53,641 | |||||||||
| BB&T Corp. | 1,197 | 44,766 | 493 | |||||||||
| Bed Bath & Beyond, Inc. | 5,242 | 293,298 | (40,372 | ) | ||||||||
| Bemis Co., Inc. | 31,890 | 1,396,919 | 28,245 | |||||||||
| Best Buy Co., Inc. | 33,102 | 1,167,767 | (159,811 | ) | ||||||||
| Big Lots, Inc. | 21,622 | 923,613 | (90,301 | ) | ||||||||
| Biogen, Inc. | 5,026 | 1,417,666 | 122,049 | |||||||||
| Bio-Rad Laboratories, Inc. | 2,718 | 379,483 | (2,606 | ) | ||||||||
| BlackRock, Inc. | 601 | 206,400 | (1,748 | ) | ||||||||
| Boeing Co./The | 11,329 | 1,602,819 | 35,241 | |||||||||
| Boston Beer Co., Inc./The | 224 | 47,689 | (2,461 | ) | ||||||||
| Brinker International, Inc. | 6,989 | 345,506 | (10,384 | ) | ||||||||
| Bristol-Myers Squibb Co. | 8,313 | 543,536 | 28,315 | |||||||||
| Broadridge Financial Solutions, Inc. | 14,081 | 784,066 | (27,494 | ) | ||||||||
| Brocade Communications Systems, Inc. | 226,282 | 2,297,662 | (220,394 | ) | ||||||||
| Bruker Corp. | 6,666 | 164,892 | (3,108 | ) | ||||||||
| Brunswick Corp. | 12,925 | 658,490 | (5,648 | ) | ||||||||
| Bunge Ltd. | 13,396 | 982,077 | (67,398 | ) | ||||||||
| BWX Technologies, Inc. | 31,151 | 892,325 | 97,342 | |||||||||
| CA, Inc. | 24,812 | 703,550 | 5,080 | |||||||||
| Cabot Corp. | 4,852 | 203,494 | (5,144 | ) | ||||||||
| Cadence Design Systems, Inc. | 38,528 | 837,937 | (36,170 | ) | ||||||||
| California Resources Corp. | �� | 216,385 | 530,048 | (25,871 | ) | |||||||
| Campbell Soup Co. | 3,243 | 174,451 | (4,032 | ) | ||||||||
| Capital One Financial Corp. | 7,345 | 560,739 | (30,577 | ) | ||||||||
| Cardinal Health, Inc. | 9,590 | 770,169 | 85,930 | |||||||||
| Carlisle Cos., Inc. | 15,542 | 1,339,782 | 38,638 | |||||||||
| Carnival Corp. | 15,378 | 773,582 | 64,212 | |||||||||
| Carter’s, Inc. | 12,363 | 1,112,599 | (11,921 | ) | ||||||||
| CDW Corp. | 12,727 | 548,282 | (13,238 | ) | ||||||||
| CEB, Inc. | 8,472 | 564,233 | (44,136 | ) | ||||||||
| Celgene Corp. | 3,195 | 386,319 | (3,685 | ) | ||||||||
| CenterPoint Energy, Inc. | 2,507 | 45,429 | 600 | |||||||||
| CH Robinson Worldwide, Inc. | 3,725 | 230,603 | 421 | |||||||||
| Charles River Laboratories International, Inc. | 16,120 | 1,097,833 | 198,054 | |||||||||
| Cheesecake Factory, Inc./The | 13,037 | 656,524 | (55,388 | ) | ||||||||
| Chemours Co./The | 22,689 | 144,771 | (23,158 | ) | ||||||||
| REFERENCE ENTITY | SHARES | NOTIONAL (a) | NET UNREALIZED APPRECIATION (DEPRECIATION) | |||||||||
| United States (continued) | ||||||||||||
| Chico’s FAS, Inc. | 32,810 | $ | 395,967 | $ | (45,885 | ) | ||||||
| Church & Dwight Co., Inc. | 7,227 | 618,953 | (5,525 | ) | ||||||||
| Cintas Corp. | 8,170 | 747,187 | (3,309 | ) | ||||||||
| Cisco Systems, Inc. | 73,173 | 2,026,460 | (39,447 | ) | ||||||||
| CIT Group, Inc. | 1,131 | 47,340 | (2,440 | ) | ||||||||
| Citigroup, Inc. | 16,381 | 845,563 | 2,154 | |||||||||
| Citizens Financial Group, Inc. | 10,054 | 254,747 | 8,567 | |||||||||
| Citrix Systems, Inc. | 12,053 | 914,225 | (2,415 | ) | ||||||||
| Clorox Co./The | 5,506 | 680,857 | 17,469 | |||||||||
| Coach, Inc. | 13,673 | 416,402 | 31,116 | |||||||||
| Coca-Cola Co./The | 21,785 | 918,421 | 17,463 | |||||||||
| Cognizant Technology Solutions Corp. | 1,417 | 93,076 | (8,028 | ) | ||||||||
| Colgate-Palmolive Co. | 15,716 | 1,037,595 | 9,405 | |||||||||
| Comcast Corp. | 9,737 | 587,144 | (37,685 | ) | ||||||||
| Commerce Bancshares, Inc. | 9,002 | 387,927 | (4,982 | ) | ||||||||
| Commercial Metals Co. | 16,358 | 233,453 | (9,512 | ) | ||||||||
| Community Health Systems, Inc. | 27,410 | 1,081,009 | (353,822 | ) | ||||||||
| Computer Sciences Corp. | 40,440 | 1,306,593 | 14,986 | |||||||||
| Consolidated Edison, Inc. | 17,140 | 1,102,843 | (1,255 | ) | ||||||||
| Convergys Corp. | 16,927 | 423,554 | (2,241 | ) | ||||||||
| CoreLogic, Inc. | 10,819 | 401,535 | (35,203 | ) | ||||||||
| Corning, Inc. | 10,587 | 189,854 | 3,676 | |||||||||
| CR Bard, Inc. | 5,914 | 1,090,654 | 29,694 | |||||||||
| Cracker Barrel Old Country Store, Inc. | 1,098 | 151,024 | (11,765 | ) | ||||||||
| Crane Co. | 10,317 | 503,672 | (10,107 | ) | ||||||||
| Crown Holdings, Inc. | 11,606 | 591,741 | (3,317 | ) | ||||||||
| CSX Corp. | 14,854 | 430,413 | (44,952 | ) | ||||||||
| Cummins, Inc. | 9,837 | 1,010,017 | (144,263 | ) | ||||||||
| CVR Energy, Inc. | 1,477 | 59,077 | (957 | ) | ||||||||
| CVS Health Corp. | 6,346 | 648,371 | (27,922 | ) | ||||||||
| Dana Holding Corp. | 14,924 | 214,459 | (8,508 | ) | ||||||||
| Darden Restaurants, Inc. | 12,729 | 730,632 | 79,441 | |||||||||
| Dean Foods Co. | 26,475 | 472,536 | (18,490 | ) | ||||||||
| Delta Air Lines, Inc. | 15,049 | 691,652 | 71,182 | |||||||||
| Deluxe Corp. | 6,086 | 352,258 | (20,328 | ) | ||||||||
| DENTSPLY International, Inc. | 10,877 | 649,661 | 12,205 | |||||||||
| Dick’s Sporting Goods, Inc. | 4,389 | 205,511 | (50,360 | ) | ||||||||
| Discover Financial Services | 26,559 | 1,481,385 | (57,291 | ) | ||||||||
| Domino’s Pizza, Inc. | 1,122 | 115,162 | 9,660 | |||||||||
| Dover Corp. | 728 | 46,184 | (1,550 | ) | ||||||||
| Dow Chemical Co./The | 6,818 | 349,579 | 1,412 | |||||||||
| DR Horton, Inc. | 9,885 | 321,728 | (5,112 | ) | ||||||||
| Dr. Pepper Snapple Group, Inc. | 18,300 | 1,618,619 | 86,941 | |||||||||
| Dril-Quip, Inc. | 753 | 45,991 | (1,391 | ) | ||||||||
| DST Systems, Inc. | 2,427 | 276,465 | 359 | |||||||||
| DTE Energy Co. | 7,078 | 576,169 | (8,584 | ) | ||||||||
| Dun & Bradstreet Corp./The | 6,134 | 659,918 | (22,412 | ) | ||||||||
| The accompanying notes are an integral part of these financial statements. | (Continued) |
| AQR Funds | Annual Report | December 2015 | ||||||||||||||
73
Table of Contents
| Schedule of Investments | December 31, 2015 |
| AQR EQUITY MARKET NEUTRAL FUND |
| REFERENCE ENTITY | SHARES | NOTIONAL (a) | NET UNREALIZED APPRECIATION (DEPRECIATION) | |||||||||
| United States (continued) | ||||||||||||
| Eaton Corp PLC | 13,309 | $ | 709,382 | $ | (16,781 | ) | ||||||
| eBay, Inc. | 59,354 | 1,498,428 | 132,620 | |||||||||
| Edison International | 3,267 | 208,173 | (14,734 | ) | ||||||||
| Edwards Lifesciences Corp. | 4,196 | 307,831 | 23,569 | |||||||||
| Electronic Arts, Inc. | 7,608 | 527,575 | (4,753 | ) | ||||||||
| Eli Lilly & Co. | 10,581 | 882,795 | 8,760 | |||||||||
| Emerson Electric Co. | 13,975 | 662,741 | 5,683 | |||||||||
| Entergy Corp. | 7,533 | 510,084 | 4,872 | |||||||||
| EP Energy Corp. | 96,552 | 612,116 | (189,218 | ) | ||||||||
| Equifax, Inc. | 14,912 | 1,578,445 | 82,304 | |||||||||
| Estee Lauder Cos., Inc./The | 6,798 | 574,072 | 24,559 | |||||||||
| Esterline Technologies Corp. | 5,950 | 496,478 | (14,528 | ) | ||||||||
| Everest Re Group Ltd. | 3,956 | 721,709 | 2,595 | |||||||||
| Exelon Corp. | 38,600 | 1,169,522 | (97,600 | ) | ||||||||
| Expedia, Inc. | 6,911 | 856,523 | 2,515 | |||||||||
| Expeditors International of Washington, Inc. | 2,564 | 126,467 | (10,831 | ) | ||||||||
| Express Scripts Holding Co. | 4,202 | 364,551 | 2,746 | |||||||||
| F5 Networks, Inc. | 8,157 | 928,215 | (137,312 | ) | ||||||||
| Facebook, Inc. | 1,340 | 143,103 | (2,859 | ) | ||||||||
| FactSet Research Systems, Inc. | 5,432 | 906,565 | (23,485 | ) | ||||||||
| FedEx Corp. | 2,462 | 382,964 | (16,151 | ) | ||||||||
| Fidelity National Information Services, Inc. | 4,327 | 266,493 | (4,277 | ) | ||||||||
| Fifth Third BanCorp. | 2,838 | 56,067 | 977 | |||||||||
| First Solar, Inc. | 25,064 | 1,324,488 | 329,485 | |||||||||
| FLIR Systems, Inc. | 4,471 | 128,019 | (2,518 | ) | ||||||||
| Flowers Foods, Inc. | 15,175 | 337,191 | (11,081 | ) | ||||||||
| Fluor Corp. | 2,916 | 140,649 | (2,956 | ) | ||||||||
| Foot Locker, Inc. | 10,693 | 701,744 | (5,737 | ) | ||||||||
| Ford Motor Co. | 29,603 | 411,594 | 5,512 | |||||||||
| Franklin Resources, Inc. | 24,989 | 953,553 | (33,458 | ) | ||||||||
| FTI Consulting, Inc. | 1,298 | 52,043 | (7,055 | ) | ||||||||
| GameStop Corp. | 5,333 | 218,484 | (68,947 | ) | ||||||||
| Gap, Inc./The | 13,796 | 381,195 | (40,434 | ) | ||||||||
| General Dynamics Corp. | 12,083 | 1,710,988 | (51,267 | ) | ||||||||
| General Mills, Inc. | 12,060 | 700,838 | (5,459 | ) | ||||||||
| General Motors Co. | 67,389 | 2,325,115 | (33,215 | ) | ||||||||
| Genpact Ltd. | 25,321 | 631,760 | 759 | |||||||||
| Gilead Sciences, Inc. | 17,288 | 1,767,096 | (17,724 | ) | ||||||||
| Global Payments, Inc. | 1,920 | 127,524 | (3,665 | ) | ||||||||
| GNC Holdings, Inc. | 9,142 | 360,713 | (77,128 | ) | ||||||||
| Goldman Sachs Group, Inc./The | 6,357 | 1,159,332 | (13,610 | ) | ||||||||
| Goodyear Tire & Rubber Co./The | 31,294 | 1,013,395 | 8,980 | |||||||||
| Graham Holdings Co. | 1,050 | 599,297 | (90,078 | ) | ||||||||
| Groupon, Inc. | 185,032 | 674,715 | (106,667 | ) | ||||||||
| Guess?, Inc. | 8,203 | 159,983 | (5,111 | ) | ||||||||
| H&R Block, Inc. | 3,495 | 120,305 | (3,886 | ) | ||||||||
| REFERENCE ENTITY | SHARES | NOTIONAL (a) | NET UNREALIZED APPRECIATION (DEPRECIATION) | |||||||||
| United States (continued) | ||||||||||||
| Hanover Insurance Group, Inc./The | 4,380 | $ | 359,304 | $ | (3,035 | ) | ||||||
| Hartford Financial Services Group, Inc./The | 7,226 | 339,162 | (25,120 | ) | ||||||||
| HCA Holdings, Inc. | 17,867 | 1,296,388 | (88,042 | ) | ||||||||
| HD Supply Holdings, Inc. | 15,850 | 478,212 | (2,236 | ) | ||||||||
| Herman Miller, Inc. | 35,526 | 1,081,891 | (62,294 | ) | ||||||||
| HNI Corp. | 2,413 | 89,775 | (2,762 | ) | ||||||||
| HollyFrontier Corp. | 27,244 | 1,300,434 | (213,671 | ) | ||||||||
| Hologic, Inc. | 9,367 | 358,462 | 3,948 | |||||||||
| Home Depot, Inc./The | 3,435 | 416,034 | 38,245 | |||||||||
| Honeywell International, Inc. | 2,656 | 279,953 | (4,871 | ) | ||||||||
| Hormel Foods Corp. | 2,550 | 194,819 | 6,835 | |||||||||
| HP, Inc. | 131,506 | 1,730,871 | (173,840 | ) | ||||||||
| HSN, Inc. | 8,961 | 457,363 | (3,309 | ) | ||||||||
| Hubbell, Inc. | 983 | 91,870 | 7,452 | |||||||||
| Huntington Ingalls Industries, Inc. | 18,473 | 2,157,603 | 185,697 | |||||||||
| Huntsman Corp. | 20,087 | 232,965 | (4,576 | ) | ||||||||
| IAC/InterActiveCorp. | 20,871 | 1,356,912 | (103,609 | ) | ||||||||
| IHS, Inc. | 380 | 45,549 | (546 | ) | ||||||||
| Illinois Tool Works, Inc. | 484 | 43,537 | 1,320 | |||||||||
| IMS Health Holdings, Inc. | 13,091 | 342,888 | (9,461 | ) | ||||||||
| Ingram Micro, Inc. | 56,840 | 1,695,828 | 30,971 | |||||||||
| Ingredion, Inc. | 7,561 | 721,558 | 3,088 | |||||||||
| Integrated Device Technology, Inc. | 19,142 | 438,003 | 66,389 | |||||||||
| Intel Corp. | 26,919 | 904,886 | 22,474 | |||||||||
| InterDigital, Inc. | 4,879 | 247,491 | (8,225 | ) | ||||||||
| International Business Machines Corp. | 9,585 | 1,384,731 | (65,643 | ) | ||||||||
| International Paper Co. | 24,129 | 1,008,501 | (98,837 | ) | ||||||||
| Interpublic Group of Cos., Inc./The | 29,586 | 632,268 | 56,494 | |||||||||
| Intuit, Inc. | 4,856 | 448,216 | 20,388 | |||||||||
| Invesco Ltd. | 13,301 | 444,040 | 1,278 | |||||||||
| ITT Corp. | 11,467 | 427,139 | (10,658 | ) | ||||||||
| Jabil Circuit, Inc. | 11,968 | 284,203 | (5,469 | ) | ||||||||
| Jack Henry & Associates, Inc. | 6,118 | 483,338 | (5,767 | ) | ||||||||
| Jack in the Box, Inc. | 9,717 | 727,656 | 17,735 | |||||||||
| Janus Capital Group, Inc. | 7,631 | 110,614 | (3,093 | ) | ||||||||
| JetBlue Airways Corp. | 20,284 | 474,469 | (15,037 | ) | ||||||||
| John Wiley & Sons, Inc. | 13,312 | 642,176 | (42,736 | ) | ||||||||
| Johnson & Johnson | 12,596 | 1,226,585 | 67,276 | |||||||||
| Joy Global, Inc. | 8,513 | 110,107 | (2,758 | ) | ||||||||
| JPMorgan Chase & Co. | 9,289 | 581,092 | 32,261 | |||||||||
| Juniper Networks, Inc. | 32,956 | 973,261 | (63,676 | ) | ||||||||
| Kellogg Co. | 945 | 65,079 | 3,217 | |||||||||
| KeyCorp. | 7,107 | 94,882 | (1,141 | ) | ||||||||
| Keysight Technologies, Inc. | 1,581 | 48,712 | (3,922 | ) | ||||||||
| Kimberly-Clark Corp. | 14,154 | 1,690,339 | 111,466 | |||||||||
| Kohl’s Corp. | 1,115 | 51,785 | 1,323 | |||||||||
| Kroger Co./The | 7,475 | 283,430 | 29,249 | |||||||||
| L Brands, Inc. | 5,876 | 547,704 | 15,335 | |||||||||
| The accompanying notes are an integral part of these financial statements. | (Continued) |
| AQR Funds | Annual Report | December 2015 | ||||||||||||||
74
Table of Contents
| Schedule of Investments | December 31, 2015 |
| AQR EQUITY MARKET NEUTRAL FUND |
| REFERENCE ENTITY | SHARES | NOTIONAL (a) | NET UNREALIZED APPRECIATION (DEPRECIATION) | |||||||||
| United States (continued) | ||||||||||||
| L-3 Communications Holdings, Inc. | 5,858 | $ | 688,920 | $ | 11,169 | |||||||
| Lam Research Corp. | 7,823 | 591,313 | 29,990 | |||||||||
| Lancaster Colony Corp. | 3,566 | 392,332 | 19,398 | |||||||||
| Landstar System, Inc. | 2,157 | 127,296 | (788 | ) | ||||||||
| Lear Corp. | 6,244 | 748,673 | 18,278 | |||||||||
| Legg Mason, Inc. | 14,043 | 607,824 | (56,917 | ) | ||||||||
| Leggett & Platt, Inc. | 3,430 | 148,826 | (4,698 | ) | ||||||||
| Leidos Holdings, Inc. | 23,357 | 1,198,210 | 115,855 | |||||||||
| Lennox International, Inc. | 2,697 | 346,554 | (9,698 | ) | ||||||||
| Liberty Interactive Corp. QVC Group | 32,262 | 865,273 | 16,125 | |||||||||
| LifePoint Health, Inc. | 4,182 | 306,335 | 624 | |||||||||
| Lincoln Electric Holdings, Inc. | 6,731 | 385,112 | (35,840 | ) | ||||||||
| Lincoln National Corp. | 18,001 | 894,222 | 10,508 | |||||||||
| Linear Technology Corp. | 7,519 | 330,511 | (11,179 | ) | ||||||||
| Lockheed Martin Corp. | 1,062 | 230,389 | 224 | |||||||||
| Lowe’s Cos., Inc. | 12,056 | 883,466 | 33,273 | |||||||||
| LyondellBasell Industries NV | 12,673 | 1,173,712 | (72,428 | ) | ||||||||
| Macy’s, Inc. | 23,689 | 1,142,724 | (314,082 | ) | ||||||||
| Mallinckrodt PLC | 9,030 | 613,785 | 60,124 | |||||||||
| Manhattan Associates, Inc. | 6,663 | 458,703 | (17,812 | ) | ||||||||
| ManpowerGroup, Inc. | 17,133 | 1,457,648 | (13,507 | ) | ||||||||
| Marathon Petroleum Corp. | 30,210 | 1,521,482 | 44,605 | |||||||||
| Marvell Technology Group Ltd. | 163,823 | 1,484,956 | (40,037 | ) | ||||||||
| Masco Corp. | 69,030 | 1,890,498 | 63,051 | |||||||||
| Maxim Integrated Products, Inc. | 20,960 | 807,681 | (11,201 | ) | ||||||||
| McDonald’s Corp. | 7,016 | 734,413 | 94,457 | |||||||||
| McGraw Hill Financial, Inc. | 1,096 | 104,540 | 3,504 | |||||||||
| McKesson Corp. | 9,455 | 1,757,178 | 107,632 | |||||||||
| Mead Johnson Nutrition Co. | 5,492 | 396,138 | 37,455 | |||||||||
| Medivation, Inc. | 26,694 | 1,100,939 | 189,449 | |||||||||
| Mentor Graphics Corp. | 42,897 | 864,860 | (74,697 | ) | ||||||||
| Merck & Co., Inc. | 22,169 | 1,145,645 | 25,322 | |||||||||
| MetLife, Inc. | 20,905 | 1,018,009 | (10,179 | ) | ||||||||
| Mettler-Toledo International, Inc. | 1,434 | 489,912 | (3,600 | ) | ||||||||
| Micron Technology, Inc. | 53,059 | 958,663 | (207,348 | ) | ||||||||
| Microsoft Corp. | 17,593 | 852,933 | 123,127 | |||||||||
| Minerals Technologies, Inc. | 973 | 51,011 | (6,390 | ) | ||||||||
| Molina Healthcare, Inc. | 21,250 | 1,253,624 | 24,139 | |||||||||
| Mondelez International, Inc. | 23,603 | 1,048,604 | 9,754 | |||||||||
| Moody’s Corp. | 811 | 79,786 | 1,590 | |||||||||
| Mosaic Co./The | 10,287 | 349,897 | (66,078 | ) | ||||||||
| Motorola Solutions, Inc. | 1,917 | 137,401 | (6,182 | ) | ||||||||
| MSCI, Inc. | 22,064 | 1,374,808 | 216,668 | |||||||||
| MSG Networks, Inc. | 43,282 | 884,955 | 15,310 | |||||||||
| REFERENCE ENTITY | SHARES | NOTIONAL (a) | NET UNREALIZED APPRECIATION (DEPRECIATION) | |||||||||
| United States (continued) | ||||||||||||
| Murphy USA, Inc. | 5,080 | $ | 296,630 | $ | 11,929 | |||||||
| Nasdaq Inc | 24,109 | 1,345,458 | 56,963 | |||||||||
| Navient Corp. | 23,284 | 291,040 | (24,438 | ) | ||||||||
| NCR Corp. | 14,190 | 358,959 | (11,872 | ) | ||||||||
| NetApp, Inc. | 30,928 | 865,925 | (45,405 | ) | ||||||||
| NeuStar, Inc. | 10,222 | 255,537 | (10,516 | ) | ||||||||
| News Corp. | 25,288 | 345,620 | (7,772 | ) | ||||||||
| NIKE, Inc. | 20,114 | 1,262,214 | (5,089 | ) | ||||||||
| NiSource, Inc. | 12,006 | 235,895 | (1,658 | ) | ||||||||
| Nordstrom, Inc. | 21,587 | 1,199,451 | (124,203 | ) | ||||||||
| Northrop Grumman Corp. | 7,921 | 1,410,967 | 84,597 | |||||||||
| Nu Skin Enterprises, Inc. | 17,202 | 590,491 | 61,292 | |||||||||
| Nuance Communications, Inc. | 15,026 | 280,914 | 17,953 | |||||||||
| Nucor Corp. | 1,332 | 56,781 | (3,101 | ) | ||||||||
| NVIDIA Corp. | 11,481 | 331,369 | 47,045 | |||||||||
| NVR, Inc. | 91 | 150,131 | (618 | ) | ||||||||
| Oil States International, Inc. | 26,434 | 798,331 | (78,005 | ) | ||||||||
| Old Republic International Corp. | 8,374 | 149,700 | 6,308 | |||||||||
| Omnicom Group, Inc. | 2,604 | 196,676 | 342 | |||||||||
| ON Semiconductor Corp. | 83,183 | 851,628 | (36,434 | ) | ||||||||
| OneMain Holdings, Inc. | 8,459 | 373,939 | (22,552 | ) | ||||||||
| Oracle Corp. | 23,349 | 882,038 | (29,099 | ) | ||||||||
| Orbital ATK, Inc. | 2,613 | 208,738 | 24,707 | |||||||||
| O’Reilly Automotive, Inc. | 703 | 179,260 | (1,106 | ) | ||||||||
| Owens Corning | 42,694 | 1,936,374 | 71,525 | |||||||||
| Panera Bread Co. | 540 | 105,969 | (788 | ) | ||||||||
| Parker-Hannifin Corp. | 592 | 61,956 | (4,544 | ) | ||||||||
| PepsiCo, Inc. | 44,911 | 4,452,155 | 35,352 | |||||||||
| Pfizer, Inc. | 50,171 | 1,651,537 | (32,017 | ) | ||||||||
| PG&E Corp. | 18,795 | 997,827 | 1,879 | |||||||||
| Philip Morris International, Inc. | 8,362 | 703,662 | 31,441 | |||||||||
| Phillips 66 | 7,990 | 657,241 | (3,659 | ) | ||||||||
| Pinnacle West Capital Corp. | 3,183 | 206,728 | (1,488 | ) | ||||||||
| Pitney Bowes, Inc. | 12,237 | 255,128 | (2,434 | ) | ||||||||
| Plantronics, Inc. | 7,574 | 379,672 | (20,513 | ) | ||||||||
| PNC Financial Services Group, Inc./The | 4,047 | 377,985 | 7,735 | |||||||||
| Polycom, Inc. | 69,207 | 917,682 | (46,366 | ) | ||||||||
| Priceline Group, Inc./The | 751 | 969,605 | (12,118 | ) | ||||||||
| Principal Financial Group, Inc. | 5,622 | 262,355 | (9,477 | ) | ||||||||
| ProAssurance Corp. | 3,751 | 186,121 | (4,085 | ) | ||||||||
| Procter & Gamble Co./The | 22,227 | 1,664,426 | 100,620 | |||||||||
| Progressive Corp./The | 1,646 | 53,100 | (757 | ) | ||||||||
| Prudential Financial, Inc. | 6,956 | 575,495 | (9,207 | ) | ||||||||
| PTC, Inc. | 2,914 | 99,081 | 1,831 | |||||||||
| Public Service Enterprise Group, Inc. | 89,257 | 3,680,020 | (226,667 | ) | ||||||||
| PVH Corp. | 5,016 | 414,967 | (45,539 | ) | ||||||||
| QEP Resources, Inc. | 21,743 | 347,624 | (56,268 | ) | ||||||||
| QUALCOMM, Inc. | 8,793 | 446,937 | (7,419 | ) | ||||||||
| The accompanying notes are an integral part of these financial statements. | (Continued) |
| AQR Funds | Annual Report | December 2015 | ||||||||||||||
75
Table of Contents
| Schedule of Investments | December 31, 2015 |
| AQR EQUITY MARKET NEUTRAL FUND |
| REFERENCE ENTITY | SHARES | NOTIONAL (a) | NET UNREALIZED APPRECIATION (DEPRECIATION) | |||||||||
| United States (continued) | ||||||||||||
| Quanta Services, Inc. | 29,854 | $ | 652,086 | $ | (47,542 | ) | ||||||
| Quest Diagnostics, Inc. | 14,473 | 959,605 | 70,004 | |||||||||
| Quintiles Transnational Holdings, Inc. | 26,090 | 1,794,075 | (2,736 | ) | ||||||||
| Rackspace Hosting, Inc. | 45,973 | 1,168,701 | (4,665 | ) | ||||||||
| Ralph Lauren Corp. | 4,883 | 576,642 | (32,285 | ) | ||||||||
| Raymond James Financial, Inc. | 6,116 | 360,702 | (6,157 | ) | ||||||||
| Raytheon Co. | 8,589 | 1,060,941 | 8,647 | |||||||||
| Red Hat, Inc. | 3,447 | 282,107 | 3,339 | |||||||||
| Regions Financial Corp. | 21,850 | 211,730 | (1,970 | ) | ||||||||
| Reinsurance Group of America, Inc. | 11,276 | 1,026,949 | (62,287 | ) | ||||||||
| Reliance Steel & Aluminum Co. | 6,203 | 363,748 | (4,532 | ) | ||||||||
| RenaissanceRe Holdings Ltd. | 398 | 43,796 | 1,253 | |||||||||
| Rent-A-Center, Inc. | 2,997 | 57,498 | (12,633 | ) | ||||||||
| Republic Services, Inc. | 5,054 | 218,307 | 4,019 | |||||||||
| ResMed, Inc. | 3,939 | 214,860 | (3,375 | ) | ||||||||
| Reynolds American, Inc. | 3,203 | 149,145 | (1,327 | ) | ||||||||
| Robert Half International, Inc. | 34,495 | 1,715,237 | (89,142 | ) | ||||||||
| Rockwell Automation, Inc. | 13,279 | 1,405,513 | (42,955 | ) | ||||||||
| Ross Stores, Inc. | 4,071 | 197,185 | 21,876 | |||||||||
| Rovi Corp. | 25,095 | 268,415 | 149,668 | |||||||||
| Sally Beauty Holdings, Inc. | 5,836 | 146,204 | 16,562 | |||||||||
| Santander Consumer USA Holdings, Inc. | 13,811 | 286,190 | (67,285 | ) | ||||||||
| Seagate Technology PLC | 10,191 | 421,087 | (47,485 | ) | ||||||||
| Sealed Air Corp. | 7,467 | 328,945 | 4,083 | |||||||||
| SEI Investments Co. | 4,855 | 254,309 | 93 | |||||||||
| Service Corp. International | 8,960 | 242,064 | (8,925 | ) | ||||||||
| Sherwin-Williams Co./The | 672 | 175,128 | (677 | ) | ||||||||
| Skechers U.S.A., Inc. | 14,282 | 480,655 | (49,196 | ) | ||||||||
| Skyworks Solutions, Inc. | 4,407 | 356,378 | (17,789 | ) | ||||||||
| Snap-on, Inc. | 461 | 76,683 | 2,346 | |||||||||
| Sonoco Products Co. | 20,818 | 860,191 | (9,359 | ) | ||||||||
| Southwest Airlines Co. | 12,154 | 473,659 | 49,692 | |||||||||
| Spirit AeroSystems Holdings, Inc. | 40,324 | 2,015,633 | 3,390 | |||||||||
| SPX Corp. | 43,178 | 437,242 | (34,391 | ) | ||||||||
| St. Jude Medical, Inc. | 13,817 | 868,367 | (14,891 | ) | ||||||||
| Stanley Black & Decker, Inc. | 4,533 | 487,371 | (3,564 | ) | ||||||||
| Staples, Inc. | 51,084 | 541,299 | (57,534 | ) | ||||||||
| Starbucks Corp. | 6,191 | 377,931 | (6,286 | ) | ||||||||
| State Street Corp. | 810 | 56,290 | (2,538 | ) | ||||||||
| Steel Dynamics, Inc. | 9,544 | 180,396 | (9,845 | ) | ||||||||
| Stryker Corp. | 1,965 | 188,337 | (5,710 | ) | ||||||||
| SunTrust Banks, Inc. | 5,038 | 220,439 | (4,611 | ) | ||||||||
| Superior Energy Services, Inc. | 7,714 | 115,567 | (11,660 | ) | ||||||||
| SUPERVALU, Inc. | 121,176 | 860,090 | (38,517 | ) | ||||||||
| Synchrony Financial | 30,601 | 912,682 | 17,894 | |||||||||
| REFERENCE ENTITY | SHARES | NOTIONAL (a) | NET UNREALIZED APPRECIATION (DEPRECIATION) | |||||||||
| United States (continued) | ||||||||||||
| Synopsys, Inc. | 7,666 | $ | 377,091 | $ | (27,444 | ) | ||||||
| T Rowe Price Group, Inc. | 4,766 | 348,583 | (7,862 | ) | ||||||||
| Talen Energy Corp. | 29,476 | 297,070 | (113,434 | ) | ||||||||
| Target Corp. | 23,643 | 1,770,144 | (53,425 | ) | ||||||||
| Tech Data Corp. | 18,621 | 1,380,556 | (144,494 | ) | ||||||||
| Teekay Corp. | 10,463 | 104,091 | (821 | ) | ||||||||
| Teledyne Technologies, Inc. | 991 | 88,594 | (692 | ) | ||||||||
| Telephone & Data Systems, Inc. | 14,265 | 385,965 | (16,644 | ) | ||||||||
| Teradata Corp. | 17,310 | 482,668 | (25,338 | ) | ||||||||
| Teradyne, Inc. | 36,330 | 720,389 | 30,552 | |||||||||
| Tesoro Corp. | 8,394 | 879,836 | 4,640 | |||||||||
| Texas Instruments, Inc. | 15,089 | 859,398 | (32,370 | ) | ||||||||
| Textron, Inc. | 7,566 | 320,500 | (2,652 | ) | ||||||||
| Thermo Fisher Scientific, Inc. | 3,178 | 399,951 | 50,848 | |||||||||
| Thomson Reuters Corp. | 2,442 | 96,664 | (4,235 | ) | ||||||||
| Thor Industries, Inc. | 9,417 | 531,075 | (2,310 | ) | ||||||||
| Time Warner, Inc. | 3,210 | 220,411 | (12,820 | ) | ||||||||
| Timken Co./The | 5,037 | 150,908 | (6,900 | ) | ||||||||
| TJX Cos., Inc./The | 9,157 | 639,971 | 9,352 | |||||||||
| Total System Services, Inc. | 21,210 | 1,121,829 | (65,571 | ) | ||||||||
| Travelers Cos., Inc./The | 8,976 | 946,519 | 66,513 | |||||||||
| Trinity Industries, Inc. | 1,973 | 51,786 | (4,395 | ) | ||||||||
| Triumph Group, Inc. | 6,887 | 308,057 | (34,299 | ) | ||||||||
| Tupperware Brands Corp. | 3,206 | 175,982 | 2,432 | |||||||||
| Tyson Foods, Inc. | 11,528 | 604,271 | 10,517 | |||||||||
| Union Pacific Corp. | 6,413 | 540,864 | (39,368 | ) | ||||||||
| United Continental Holdings, Inc. | 24,078 | 1,355,979 | 23,690 | |||||||||
| United Technologies Corp. | 3,439 | 324,401 | 5,984 | |||||||||
| United Therapeutics Corp. | 14,538 | 1,953,430 | 323,366 | |||||||||
| UnitedHealth Group, Inc. | 10,556 | 1,210,747 | 31,061 | |||||||||
| Universal Health Services, Inc. | 4,023 | 483,971 | (3,262 | ) | ||||||||
| Unum Group | 18,453 | 615,743 | (1,443 | ) | ||||||||
| Urban Outfitters, Inc. | 7,789 | 178,497 | (1,297 | ) | ||||||||
| US Bancorp. | 7,642 | 327,648 | (1,564 | ) | ||||||||
| Valero Energy Corp. | 18,190 | 1,198,456 | 87,759 | |||||||||
| Validus Holdings Ltd. | 13,902 | 633,560 | 9,964 | |||||||||
| Varian Medical Systems, Inc. | 6,816 | 528,634 | 22,099 | |||||||||
| Vectren Corp. | 1,503 | 64,869 | (1,112 | ) | ||||||||
| VeriSign, Inc. | 5,415 | 424,707 | 48,348 | |||||||||
| Verizon Communications, Inc. | 15,574 | 704,886 | 14,944 | |||||||||
| VF Corp. | 8,570 | 610,948 | (77,466 | ) | ||||||||
| Viacom, Inc. | 21,765 | 1,028,359 | (132,512 | ) | ||||||||
| Vishay Intertechnology, Inc. | 27,495 | 317,349 | 13,966 | |||||||||
| Visteon Corp. | 8,751 | 971,540 | 30,450 | |||||||||
| VMware, Inc. | 5,580 | 375,322 | (59,661 | ) | ||||||||
| The accompanying notes are an integral part of these financial statements. | (Continued) |
| AQR Funds | Annual Report | December 2015 | ||||||||||||||
76
Table of Contents
| Schedule of Investments | December 31, 2015 |
| AQR EQUITY MARKET NEUTRAL FUND |
| REFERENCE ENTITY | SHARES | NOTIONAL (a) | NET UNREALIZED APPRECIATION (DEPRECIATION) | |||||||||
| United States (continued) | ||||||||||||
| Voya Financial, Inc. | 1,351 | $ | 54,270 | $ | (4,404 | ) | ||||||
| VWR Corp. | 4,419 | 120,611 | 4,491 | |||||||||
| Waddell & Reed Financial, Inc. | 15,289 | 456,968 | (18,785 | ) | ||||||||
| Wal-Mart Stores, Inc. | 29,573 | 1,896,960 | (84,135 | ) | ||||||||
| Walt Disney Co./The | 2,575 | 276,002 | (5,421 | ) | ||||||||
| Waste Management, Inc. | 13,961 | 738,206 | 6,892 | |||||||||
| Waters Corp. | 1,873 | 235,583 | 16,485 | |||||||||
| Watsco, Inc. | 1,975 | 236,249 | (4,917 | ) | ||||||||
| WellCare Health Plans, Inc. | 3,357 | 272,109 | (9,558 | ) | ||||||||
| Wells Fargo & Co. | 10,507 | 562,379 | 8,781 | |||||||||
| Werner Enterprises, Inc. | 30,595 | 762,887 | (47,270 | ) | ||||||||
| WESCO International, Inc. | 6,168 | 290,618 | (21,199 | ) | ||||||||
| Western Digital Corp. | 20,310 | 1,589,248 | (369,632 | ) | ||||||||
| Western Refining, Inc. | 10,279 | 473,831 | (107,693 | ) | ||||||||
| Western Union Co./The | 32,345 | 619,061 | (39,762 | ) | ||||||||
| Westlake Chemical Corp. | 12,054 | 692,687 | (37,914 | ) | ||||||||
| WGL Holdings, Inc. | 709 | 42,171 | 2,489 | |||||||||
| Whirlpool Corp. | 1,403 | 218,953 | (12,894 | ) | ||||||||
| World Fuel Services Corp. | 16,282 | 653,745 | (27,539 | ) | ||||||||
| Worthington Industries, Inc. | 6,381 | 195,003 | (2,680 | ) | ||||||||
| Wyndham Worldwide Corp. | 1,344 | 101,803 | (4,162 | ) | ||||||||
| Xerox Corp. | 65,415 | 685,813 | 9,548 | |||||||||
| Xilinx, Inc. | 15,701 | 744,254 | (6,778 | ) | ||||||||
| Yelp, Inc. | 8,069 | 196,915 | 35,472 | |||||||||
| Yum! Brands, Inc. | 11,740 | 823,077 | 34,530 | |||||||||
| Zoetis, Inc. | 12,219 | 559,863 | 25,671 | |||||||||
| Zynga, Inc. | 134,502 | 331,005 | 29,460 | |||||||||
|
| |||||||||||
| (2,618,630 | ) | |||||||||||
|
| |||||||||||
Total of Long Equity Positions | (2,708,454 | ) | ||||||||||
|
| |||||||||||
| Short Positions | ||||||||||||
| Common Stocks | ||||||||||||
| Canada | ||||||||||||
| lululemon athletica, Inc. | (10,665 | ) | (558,883 | ) | (709 | ) | ||||||
|
| |||||||||||
| Ireland | ||||||||||||
| Alkermes PLC | (1,223 | ) | (73,258 | ) | (23,824 | ) | ||||||
| Allegion PLC | (6,214 | ) | (413,509 | ) | 3,882 | |||||||
| Endo International PLC | (27,245 | ) | (1,637,512 | ) | (30,427 | ) | ||||||
| Medtronic PLC | (2,668 | ) | (199,595 | ) | (5,627 | ) | ||||||
| Perrigo Co. PLC | (5,442 | ) | (807,016 | ) | 19,559 | |||||||
|
| |||||||||||
| (36,437 | ) | |||||||||||
|
| |||||||||||
| Netherlands | ||||||||||||
| Chicago Bridge & Iron Co. NV | (11,952 | ) | (477,243 | ) | 11,235 | |||||||
| Core Laboratories NV | (10,894 | ) | (1,186,263 | ) | 1,649 | |||||||
| Frank’s International NV | (29,072 | ) | (486,952 | ) | 1,741 | |||||||
| QIAGEN NV | (36,049 | ) | (926,736 | ) | (70,019 | ) | ||||||
| Sensata Technologies Holding NV | (50,564 | ) | (2,307,177 | ) | (21,801 | ) | ||||||
|
| |||||||||||
| (77,195 | ) | |||||||||||
|
| |||||||||||
| REFERENCE ENTITY | SHARES | NOTIONAL (a) | NET UNREALIZED APPRECIATION (DEPRECIATION) | |||||||||
| Panama | ||||||||||||
| Copa Holdings SA | (1,714 | ) | $ | (83,966 | ) | $ | 1,248 | |||||
|
| |||||||||||
| Singapore | ||||||||||||
| Avago Technologies Ltd. | (1,046 | ) | (122,058 | ) | (29,769 | ) | ||||||
|
| |||||||||||
| Switzerland | ||||||||||||
| Weatherford International PLC | (107,312 | ) | (1,094,574 | ) | 194,226 | |||||||
|
| |||||||||||
| United Kingdom | ||||||||||||
| Aon PLC | (9,830 | ) | (909,782 | ) | 3,357 | |||||||
| Delphi Automotive PLC | (6,338 | ) | (524,178 | ) | (19,179 | ) | ||||||
| Ensco PLC | (10,669 | ) | (169,053 | ) | 4,857 | |||||||
| Liberty Global PLC | (19,631 | ) | (838,736 | ) | 7,167 | |||||||
| Pentair PLC | (21,205 | ) | (1,176,081 | ) | 125,797 | |||||||
| Willis Group Holdings PLC | (4,234 | ) | (178,844 | ) | (26,801 | ) | ||||||
|
| |||||||||||
| 95,198 | ||||||||||||
|
| |||||||||||
| United States | ||||||||||||
| 3D Systems Corp. | (53,401 | ) | (485,650 | ) | 21,595 | |||||||
| Acadia Healthcare Co., Inc. | (24,546 | ) | (1,553,064 | ) | 19,921 | |||||||
| ACI Worldwide, Inc. | (3,122 | ) | (70,432 | ) | 3,622 | |||||||
| Acuity Brands, Inc. | (1,808 | ) | (419,824 | ) | (2,887 | ) | ||||||
| Acxiom Corp. | (20,512 | ) | (445,957 | ) | 16,846 | |||||||
| ADT Corp./The | (1,452 | ) | (49,484 | ) | 1,597 | |||||||
| Advance Auto Parts, Inc. | (1,252 | ) | (234,562 | ) | 46,124 | |||||||
| AECOM | (31,163 | ) | (935,188 | ) | (637 | ) | ||||||
| AES Corp. | (10,179 | ) | (90,042 | ) | (7,371 | ) | ||||||
| Agios Pharmaceuticals, Inc. | (5,431 | ) | (355,462 | ) | 2,882 | |||||||
| Air Lease Corp. | (14,057 | ) | (474,380 | ) | 3,752 | |||||||
| Air Products & Chemicals, Inc. | (1,430 | ) | (190,401 | ) | 4,343 | |||||||
| Akorn, Inc. | (46,155 | ) | (1,327,198 | ) | (394,845 | ) | ||||||
| Alaska Air Group, Inc. | (2,918 | ) | (238,362 | ) | 3,434 | |||||||
| Albemarle Corp. | (26,919 | ) | (1,342,096 | ) | (165,638 | ) | ||||||
| Alcoa, Inc. | (49,109 | ) | (441,736 | ) | (42,970 | ) | ||||||
| Alere, Inc. | (9,748 | ) | (387,096 | ) | 6,046 | |||||||
| Alexion Pharmaceuticals, Inc. | (15,512 | ) | (2,667,229 | ) | (291,685 | ) | ||||||
| Align Technology, Inc. | (9,344 | ) | (536,084 | ) | (79,218 | ) | ||||||
| Allegheny Technologies, Inc. | (27,031 | ) | (409,084 | ) | 104,985 | |||||||
| Alliance Data Systems Corp. | (7,033 | ) | (1,974,784 | ) | 29,667 | |||||||
| Alliant Energy Corp. | (11,243 | ) | (714,110 | ) | 11,985 | |||||||
| Ally Financial, Inc. | (49,865 | ) | (956,408 | ) | 26,924 | |||||||
| Alnylam Pharmaceuticals, Inc. | (7,445 | ) | (639,133 | ) | (61,739 | ) | ||||||
| AMC Networks, Inc. | (1,679 | ) | (131,707 | ) | 6,319 | |||||||
| American Airlines Group, Inc. | (13,954 | ) | (598,971 | ) | 8,019 | |||||||
| AMETEK, Inc. | (14,234 | ) | (795,432 | ) | 32,632 | |||||||
| Amphenol Corp. | (19,123 | ) | (1,006,135 | ) | 7,340 | |||||||
| Anadarko Petroleum Corp. | (13,300 | ) | (832,598 | ) | 186,484 | |||||||
| Apache Corp. | (20,359 | ) | (962,214 | ) | 56,850 | |||||||
| Applied Materials, Inc. | (2,779 | ) | (53,641 | ) | 1,757 | |||||||
| The accompanying notes are an integral part of these financial statements. | (Continued) |
| AQR Funds | Annual Report | December 2015 | ||||||||||||||
77
Table of Contents
| Schedule of Investments | December 31, 2015 |
| AQR EQUITY MARKET NEUTRAL FUND |
| REFERENCE ENTITY | SHARES | NOTIONAL (a) | NET UNREALIZED APPRECIATION (DEPRECIATION) | |||||||||
| United States (continued) | ||||||||||||
| Aqua America, Inc. | (25,335 | ) | $ | (738,781 | ) | $ | (16,202 | ) | ||||
| ARRIS Group, Inc. | (53,565 | ) | (1,508,566 | ) | (128,916 | ) | ||||||
| Arista Networks, Inc. | (19,944 | ) | (1,429,450 | ) | (122,991 | ) | ||||||
| Arthur J Gallagher & Co. | (2,749 | ) | (116,764 | ) | 4,220 | |||||||
| Artisan Partners Asset Management, Inc. | (7,125 | ) | (258,568 | ) | 1,641 | |||||||
| Ascena Retail Group, Inc. | (47,697 | ) | (494,389 | ) | 24,573 | |||||||
| Ashland, Inc. | (3,277 | ) | (341,344 | ) | 4,796 | |||||||
| AT&T, Inc. | (14,697 | ) | (497,998 | ) | (7,726 | ) | ||||||
| athenahealth, Inc. | (297 | ) | (49,309 | ) | 1,501 | |||||||
| Autodesk, Inc. | (6,124 | ) | (344,254 | ) | (28,881 | ) | ||||||
| Avis Budget Group, Inc. | (58,472 | ) | (2,486,830 | ) | 364,881 | |||||||
| B/E Aerospace, Inc. | (1,701 | ) | (80,457 | ) | 8,386 | |||||||
| Ball Corp. | (15,708 | ) | (1,089,013 | ) | (53,430 | ) | ||||||
| Bank of America Corp. | (10,957 | ) | (194,376 | ) | 9,970 | |||||||
| Bank of the Ozarks, Inc. | (9,174 | ) | (457,523 | ) | 3,777 | |||||||
| Becton Dickinson and Co. | (4,385 | ) | (639,645 | ) | (36,040 | ) | ||||||
| Belden, Inc. | (1,034 | ) | (53,642 | ) | 4,341 | |||||||
| BioMarin Pharmaceutical, Inc. | (433 | ) | (43,641 | ) | (1,720 | ) | ||||||
| Bio-Techne Corp. | (10,339 | ) | (960,684 | ) | 30,174 | |||||||
| Black Hills Corp. | (13,178 | ) | (590,238 | ) | (21,617 | ) | ||||||
| Black Knight Financial Services, Inc. | (18,896 | ) | (624,060 | ) | (642 | ) | ||||||
| Bluebird Bio, Inc. | (11,795 | ) | (817,608 | ) | 60,133 | |||||||
| Booz Allen Hamilton Holding Corp. | (1,467 | ) | (43,327 | ) | (1,930 | ) | ||||||
| BorgWarner, Inc. | (52,040 | ) | (2,245,884 | ) | (3,805 | ) | ||||||
| Boston Scientific Corp. | (22,335 | ) | (401,336 | ) | (10,521 | ) | ||||||
| Brookdale Senior Living, Inc. | (16,402 | ) | (357,035 | ) | 54,254 | |||||||
| Brown & Brown, Inc. | (12,321 | ) | (396,735 | ) | 1,231 | |||||||
| Brown-Forman Corp. | (10,939 | ) | (1,135,903 | ) | 49,879 | |||||||
| Buffalo Wild Wings, Inc. | (3,644 | ) | (578,975 | ) | (2,790 | ) | ||||||
| Cabela’s, Inc. | (20,424 | ) | (923,534 | ) | (30,880 | ) | ||||||
| Cable One, Inc. | (609 | ) | (271,197 | ) | 7,098 | |||||||
| Cabot Oil & Gas Corp. | (37,717 | ) | (759,643 | ) | 92,429 | |||||||
| CalAtlantic Group, Inc. | (12,084 | ) | (487,951 | ) | 29,725 | |||||||
| CarMax, Inc. | (18,453 | ) | (1,077,068 | ) | 81,160 | |||||||
| Casey’s General Stores, Inc. | (1,285 | ) | (141,680 | ) | (13,098 | ) | ||||||
| Catalent, Inc. | (14,358 | ) | (383,565 | ) | 24,184 | |||||||
| Caterpillar, Inc. | (2,664 | ) | (179,931 | ) | (1,115 | ) | ||||||
| CBOE Holdings, Inc. | (10,464 | ) | (707,877 | ) | 28,764 | |||||||
| CBS Corp. | (5,127 | ) | (251,708 | ) | 10,073 | |||||||
| CDK Global, Inc. | (5,279 | ) | (262,577 | ) | 11,983 | |||||||
| Celanese Corp. | (1,537 | ) | (106,502 | ) | 3,016 | |||||||
| Centene Corp. | (688 | ) | (45,872 | ) | 595 | |||||||
| CenturyLink, Inc. | (3,023 | ) | (80,140 | ) | 4,081 | |||||||
| Cerner Corp. | (3,135 | ) | (199,455 | ) | 10,822 | |||||||
| CF Industries Holdings, Inc. | (9,795 | ) | (405,298 | ) | 5,564 | |||||||
| Charles Schwab Corp./The | (50,114 | ) | (1,506,686 | ) | (143,568 | ) | ||||||
| Cheniere Energy, Inc. | (30,939 | ) | (1,452,572 | ) | 300,095 | |||||||
| Chevron Corp. | (6,945 | ) | (626,803 | ) | 2,030 | |||||||
| Chipotle Mexican Grill, Inc. | (1,445 | ) | (916,778 | ) | 223,395 | |||||||
| REFERENCE ENTITY | SHARES | NOTIONAL (a) | NET UNREALIZED APPRECIATION (DEPRECIATION) | |||||||||
| United States (continued) | ||||||||||||
| Ciena Corp. | (40,548 | ) | $ | (884,349 | ) | $ | 45,411 | |||||
| Cimarex Energy Co. | (12,359 | ) | (1,422,587 | ) | 317,940 | |||||||
| Clean Harbors, Inc. | (5,736 | ) | (271,878 | ) | 32,974 | |||||||
| CME Group, Inc. | (6,594 | ) | (625,604 | ) | 28,188 | |||||||
| CMS Energy Corp. | (27,711 | ) | (997,544 | ) | (2,268 | ) | ||||||
| Cobalt International Energy, Inc. | (37,764 | ) | (292,504 | ) | 88,579 | |||||||
| Cognex Corp. | (8,043 | ) | (281,101 | ) | 9,489 | |||||||
| Colfax Corp. | (17,341 | ) | (489,041 | ) | 84,129 | |||||||
| Columbia Pipeline Group, Inc. | (19,266 | ) | (373,973 | ) | (11,347 | ) | ||||||
| CommScope Holding Co., Inc. | (58,821 | ) | (1,594,490 | ) | 71,614 | |||||||
| Compass Minerals International, Inc. | (6,586 | ) | (519,198 | ) | 23,470 | |||||||
| ConAgra Foods, Inc. | (2,273 | ) | (94,943 | ) | (886 | ) | ||||||
| Concho Resources, Inc. | (9,022 | ) | (968,349 | ) | 130,566 | |||||||
| ConocoPhillips | (9,337 | ) | (506,348 | ) | 70,403 | |||||||
| CONSOL Energy, Inc. | (56,411 | ) | (587,410 | ) | 141,763 | |||||||
| Constellation Brands, Inc. | (6,894 | ) | (942,341 | ) | (39,641 | ) | ||||||
| Cooper Cos., Inc./The | (4,602 | ) | (644,471 | ) | 26,883 | |||||||
| Copart, Inc. | (15,758 | ) | (608,747 | ) | 9,786 | |||||||
| CoStar Group, Inc. | (3,739 | ) | (714,557 | ) | (58,257 | ) | ||||||
| Costco Wholesale Corp. | (6,103 | ) | (975,169 | ) | (10,466 | ) | ||||||
| Covanta Holding Corp. | (77,940 | ) | (1,326,579 | ) | 119,289 | |||||||
| CST Brands, Inc. | (10,210 | ) | (359,416 | ) | (40,203 | ) | ||||||
| Cullen/Frost Bankers, Inc. | (2,301 | ) | (155,548 | ) | 17,488 | |||||||
| Cypress Semiconductor Corp. | (100,144 | ) | (958,959 | ) | (23,453 | ) | ||||||
| Danaher Corp. | (3,565 | ) | (340,929 | ) | 9,812 | |||||||
| DaVita HealthCare Partners, Inc. | (10,070 | ) | (724,104 | ) | 22,125 | |||||||
| Deckers Outdoor Corp. | (7,191 | ) | (352,846 | ) | 13,431 | |||||||
| Deere & Co. | (8,145 | ) | (641,206 | ) | 19,987 | |||||||
| Devon Energy Corp. | (4,858 | ) | (205,653 | ) | 50,197 | |||||||
| DeVry Education Group, Inc. | (16,852 | ) | (433,450 | ) | 6,926 | |||||||
| DexCom, Inc. | (9,023 | ) | (727,800 | ) | (11,183 | ) | ||||||
| Diamond Offshore Drilling, Inc. | (5,051 | ) | (107,057 | ) | 481 | |||||||
| Diebold, Inc. | (21,130 | ) | (709,113 | ) | 73,312 | |||||||
| Discovery Communications, Inc. | (24,101 | ) | (699,376 | ) | 56,361 | |||||||
| DISH Network Corp. | (2,605 | ) | (152,920 | ) | 3,967 | |||||||
| Dolby Laboratories, Inc. | (9,728 | ) | (333,679 | ) | 6,332 | |||||||
| Dollar General Corp. | (4,049 | ) | (293,672 | ) | 2,670 | |||||||
| Dollar Tree, Inc. | (51,626 | ) | (3,330,979 | ) | (655,580 | ) | ||||||
| Dominion Resources, Inc. | (66,664 | ) | (4,642,974 | ) | 133,821 | |||||||
| Donaldson Co., Inc. | (16,449 | ) | (487,139 | ) | 15,711 | |||||||
| DreamWorks Animation SKG, Inc. | (6,735 | ) | (177,646 | ) | 4,085 | |||||||
| DSW, Inc. | (6,859 | ) | (161,594 | ) | (2,061 | ) | ||||||
| Duke Energy Corp. | (4,653 | ) | (316,229 | ) | (15,949 | ) | ||||||
| Dunkin’ Brands Group, Inc. | (12,495 | ) | (523,471 | ) | (8,691 | ) | ||||||
| E*TRADE Financial Corp. | (16,981 | ) | (484,529 | ) | (18,788 | ) | ||||||
| Eagle Materials, Inc. | (13,765 | ) | (987,100 | ) | 155,281 | |||||||
| Eastman Chemical Co. | (3,057 | ) | (209,367 | ) | 2,989 | |||||||
| The accompanying notes are an integral part of these financial statements. | (Continued) |
| AQR Funds | Annual Report | December 2015 | ||||||||||||||
78
Table of Contents
| Schedule of Investments | December 31, 2015 |
| AQR EQUITY MARKET NEUTRAL FUND |
| REFERENCE ENTITY | SHARES | NOTIONAL (a) | NET UNREALIZED APPRECIATION (DEPRECIATION) | |||||||||
| United States (continued) | ||||||||||||
| EchoStar Corp. | (4,047 | ) | $ | (176,891 | ) | $ | 18,613 | |||||
| Ecolab, Inc. | (4,762 | ) | (574,010 | ) | 29,332 | |||||||
| Energen Corp. | (11,889 | ) | (535,729 | ) | 48,399 | |||||||
| Envision Healthcare Holdings Inc | (40,855 | ) | (1,246,750 | ) | 185,745 | |||||||
| EOG Resources, Inc. | (12,467 | ) | (971,198 | ) | 88,659 | |||||||
| EQT Corp. | (7,863 | ) | (491,518 | ) | 81,620 | |||||||
| Eversource Energy | (14,799 | ) | (751,976 | ) | (3,809 | ) | ||||||
| Exxon Mobil Corp. | (9,374 | ) | (747,791 | ) | 17,087 | |||||||
| Federated Investors, Inc. | (2,006 | ) | (60,219 | ) | 2,747 | |||||||
| FEI Co. | (4,863 | ) | (381,856 | ) | (6,163 | ) | ||||||
| FireEye, Inc. | (17,149 | ) | (364,089 | ) | 8,418 | |||||||
| First Horizon National Corp. | (14,674 | ) | (215,070 | ) | 2,004 | |||||||
| First Republic Bank | (5,779 | ) | (381,427 | ) | (334 | ) | ||||||
| FirstEnergy Corp. | (2,100 | ) | (65,814 | ) | (819 | ) | ||||||
| FleetCor Technologies, Inc. | (5,863 | ) | (864,572 | ) | 26,573 | |||||||
| Flowserve Corp. | (2,017 | ) | (86,198 | ) | 1,322 | |||||||
| FMC Corp. | (29,452 | ) | (1,144,287 | ) | (8,170 | ) | ||||||
| FMC Technologies, Inc. | (2,017 | ) | (69,724 | ) | 11,211 | |||||||
| FNF Group | (12,969 | ) | (447,104 | ) | (2,531 | ) | ||||||
| Forest City Enterprises, Inc. | (34,146 | ) | (728,757 | ) | (20,065 | ) | ||||||
| Fortinet, Inc. | (7,387 | ) | (253,669 | ) | 23,416 | |||||||
| Fortune Brands Home & Security, Inc. | (13,281 | ) | (722,076 | ) | (15,020 | ) | ||||||
| Freeport-McMoRan, Inc. | (18,399 | ) | (247,644 | ) | 123,083 | |||||||
| Frontier Communications Corp. | (62,040 | ) | (323,746 | ) | 34,019 | |||||||
| GATX Corp. | (2,606 | ) | (114,587 | ) | 3,702 | |||||||
| General Electric Co. | (72,967 | ) | (2,219,386 | ) | (53,536 | ) | ||||||
| Genesee & Wyoming, Inc. | (15,210 | ) | (1,017,802 | ) | 201,177 | |||||||
| Gentex Corp. | (37,615 | ) | (605,741 | ) | 3,525 | |||||||
| Genworth Financial, Inc. | (14,287 | ) | (66,635 | ) | 13,344 | |||||||
| Graco, Inc. | (2,943 | ) | (215,839 | ) | 3,737 | |||||||
| Granite Construction, Inc. | (8,531 | ) | (352,942 | ) | (13,123 | ) | ||||||
| Graphic Packaging Holding Co. | (37,711 | ) | (500,425 | ) | 16,593 | |||||||
| Greif, Inc. | (21,724 | ) | (758,646 | ) | 89,330 | |||||||
| Hain Celestial Group, Inc./The | (9,134 | ) | (448,713 | ) | 79,790 | |||||||
| Halliburton Co. | (52,384 | ) | (2,033,267 | ) | 250,116 | |||||||
| Halyard Health, Inc. | (1,336 | ) | (38,998 | ) | (5,637 | ) | ||||||
| Hanesbrands, Inc. | (15,796 | ) | (460,336 | ) | (4,540 | ) | ||||||
| Harley-Davidson, Inc. | (34,294 | ) | (1,750,480 | ) | 193,876 | |||||||
| Harman International Industries, Inc. | (6,342 | ) | (612,485 | ) | 15,005 | |||||||
| Harris Corp. | (13,251 | ) | (1,021,225 | ) | (130,287 | ) | ||||||
| Hasbro, Inc. | (1,267 | ) | (95,872 | ) | 10,526 | |||||||
| Helmerich & Payne, Inc. | (9,053 | ) | (487,248 | ) | 2,460 | |||||||
| Henry Schein, Inc. | (590 | ) | (92,508 | ) | (824 | ) | ||||||
| Hershey Co./The | (503 | ) | (48,774 | ) | 3,871 | |||||||
| Hertz Global Holdings, Inc. | (77,488 | ) | (1,525,351 | ) | 422,696 | |||||||
| Hess Corp. | (2,179 | ) | (113,649 | ) | 8,012 | |||||||
| REFERENCE ENTITY | SHARES | NOTIONAL (a) | NET UNREALIZED APPRECIATION (DEPRECIATION) | |||||||||
| United States (continued) | ||||||||||||
| Hexcel Corp. | (25,306 | ) | $ | (1,197,504 | ) | $ | 22,041 | |||||
| Hill-Rom Holdings, Inc. | (5,589 | ) | (275,767 | ) | 7,160 | |||||||
| Hilton Worldwide Holdings, Inc. | (13,529 | ) | (310,046 | ) | 20,525 | |||||||
| Howard Hughes Corp./The | (7,843 | ) | (958,485 | ) | 70,971 | |||||||
| IDEX Corp. | (1,201 | ) | (93,200 | ) | 1,191 | |||||||
| IDEXX Laboratories, Inc. | (23,187 | ) | (1,651,383 | ) | (39,413 | ) | ||||||
| Illumina, Inc. | (19,449 | ) | (3,051,034 | ) | (682,105 | ) | ||||||
| Incyte Corp. | (6,529 | ) | (682,337 | ) | (25,733 | ) | ||||||
| Ingersoll-Rand PLC | (883 | ) | (49,476 | ) | 655 | |||||||
| International Flavors & Fragrances, Inc. | (3,271 | ) | (388,506 | ) | (2,837 | ) | ||||||
| Intersil Corp. | (7,790 | ) | (97,141 | ) | (2,259 | ) | ||||||
| Ionis Pharmaceuticals, Inc. | (7,608 | ) | (429,763 | ) | (41,401 | ) | ||||||
| IPG Photonics Corp. | (497 | ) | (41,489 | ) | (2,823 | ) | ||||||
| ITC Holdings Corp. | (43,012 | ) | (1,588,192 | ) | (100,029 | ) | ||||||
| JB Hunt Transport Services, Inc. | (4,172 | ) | (312,434 | ) | 6,376 | |||||||
| JC Penney Co., Inc. | (12,431 | ) | (85,192 | ) | 2,402 | |||||||
| JM Smucker Co./The | (1,591 | ) | (186,107 | ) | (10,127 | ) | ||||||
| Kansas City Southern | (29,424 | ) | (2,689,782 | ) | 492,692 | |||||||
| KAR Auction Services, Inc. | (10,793 | ) | (403,686 | ) | 4,021 | |||||||
| Kate Spade & Co. | (33,230 | ) | (620,763 | ) | 30,266 | |||||||
| KBR, Inc. | (13,190 | ) | (248,628 | ) | 25,453 | |||||||
| Kinder Morgan, Inc. | (67,541 | ) | (1,698,691 | ) | 690,980 | |||||||
| Kirby Corp. | (2,210 | ) | (148,662 | ) | 32,372 | |||||||
| KLX, Inc. | (17,688 | ) | (651,048 | ) | 106,435 | |||||||
| Knowles Corp. | (21,992 | ) | (302,179 | ) | 9,025 | |||||||
| Kosmos Energy Ltd. | (113,124 | ) | (713,489 | ) | 125,245 | |||||||
| Laboratory Corp. of America Holdings | (4,518 | ) | (504,706 | ) | (53,900 | ) | ||||||
| Las Vegas Sands Corp. | (13,654 | ) | (629,172 | ) | 30,581 | |||||||
| Lennar Corp. | (16,602 | ) | (832,843 | ) | 20,839 | |||||||
| Leucadia National Corp. | (72,162 | ) | (1,428,164 | ) | 173,267 | |||||||
| Level 3 Communications, Inc. | (60,265 | ) | (2,848,999 | ) | (427,006 | ) | ||||||
| Lexmark International, Inc. | (3,572 | ) | (119,887 | ) | 3,976 | |||||||
| Liberty Broadband Corp. | (14,642 | ) | (785,350 | ) | 26,016 | |||||||
| LinkedIn Corp. | (2,181 | ) | (475,583 | ) | (15,317 | ) | ||||||
| Lions Gate Entertainment Corp. | (16,973 | ) | (614,535 | ) | 64,780 | |||||||
| Live Nation Entertainment, Inc. | (24,449 | ) | (635,494 | ) | 34,782 | |||||||
| Loews Corp. | (30,149 | ) | (1,113,395 | ) | (44,327 | ) | ||||||
| Louisiana-Pacific Corp. | (95,653 | ) | (1,635,706 | ) | (87,005 | ) | ||||||
| M&T Bank Corp. | (2,822 | ) | (352,898 | ) | 10,928 | |||||||
| Macquarie Infrastructure Corp. | (15,680 | ) | (1,168,672 | ) | 30,304 | |||||||
| Manitowoc Co., Inc./The | (40,285 | ) | (604,311 | ) | (14,063 | ) | ||||||
| Marathon Oil Corp. | (9,061 | ) | (182,851 | ) | 68,773 | |||||||
| Markel Corp. | (254 | ) | (224,315 | ) | (56 | ) | ||||||
| Marsh & McLennan Cos., Inc. | (7,871 | ) | (437,655 | ) | 1,208 | |||||||
| The accompanying notes are an integral part of these financial statements. | (Continued) |
| AQR Funds | Annual Report | December 2015 | ||||||||||||||
79
Table of Contents
| Schedule of Investments | December 31, 2015 |
| AQR EQUITY MARKET NEUTRAL FUND |
| REFERENCE ENTITY | SHARES | NOTIONAL (a) | NET UNREALIZED APPRECIATION (DEPRECIATION) | |||||||||
| United States (continued) | ||||||||||||
| Martin Marietta Materials, Inc. | (8,057 | ) | $ | (1,294,604 | ) | $ | 194,179 | |||||
| MasterCard, Inc. | (4,344 | ) | (427,002 | ) | 4,071 | |||||||
| Mattel, Inc. | (47,105 | ) | (1,059,961 | ) | (219,882 | ) | ||||||
| MAXIMUS, Inc. | (12,413 | ) | (703,981 | ) | 5,749 | |||||||
| MDC Holdings, Inc. | (4,249 | ) | (109,582 | ) | 1,105 | |||||||
| MDU Resources Group, Inc. | (94,957 | ) | (1,766,575 | ) | 26,963 | |||||||
| MEDNAX, Inc. | (4,242 | ) | (332,149 | ) | 28,167 | |||||||
| Memorial Resource Development Corp. | (56,318 | ) | (1,019,227 | ) | 109,691 | |||||||
| MGM Resorts International | (46,000 | ) | (1,003,229 | ) | (41,891 | ) | ||||||
| Microchip Technology, Inc. | (6,990 | ) | (328,341 | ) | 3,026 | |||||||
| Middleby Corp./The | (11,593 | ) | (1,272,085 | ) | 21,548 | |||||||
| Mohawk Industries, Inc. | (1,108 | ) | (215,516 | ) | 5,672 | |||||||
| Molson Coors Brewing Co. | (12,170 | ) | (1,112,450 | ) | (30,556 | ) | ||||||
| Monsanto Co. | (4,469 | ) | (422,818 | ) | (17,468 | ) | ||||||
| Monster Beverage Corp. | (14,247 | ) | (1,993,898 | ) | (128,336 | ) | ||||||
| MSC Industrial Direct Co., Inc. | (2,515 | ) | (163,450 | ) | 21,931 | |||||||
| Murphy Oil Corp. | (2,172 | ) | (48,844 | ) | 83 | |||||||
| Mylan NV | (16,028 | ) | (676,591 | ) | (190,043 | ) | ||||||
| Nabors Industries Ltd. | (19,223 | ) | (168,266 | ) | 4,678 | |||||||
| National Fuel Gas Co. | (19,209 | ) | (899,107 | ) | 77,922 | |||||||
| National Oilwell Varco, Inc. | (21,904 | ) | (819,070 | ) | 85,505 | |||||||
| Netflix, Inc. | (4,172 | ) | (486,322 | ) | 9,129 | |||||||
| NetScout Systems, Inc. | (25,654 | ) | (820,047 | ) | 32,469 | |||||||
| NetSuite, Inc. | (16,907 | ) | (1,456,227 | ) | 25,557 | |||||||
| Newell Rubbermaid, Inc. | (15,924 | ) | (685,267 | ) | (16,663 | ) | ||||||
| Newfield Exploration Co. | (17,625 | ) | (602,187 | ) | 28,317 | |||||||
| Nielsen Holdings PLC | (30,286 | ) | (1,419,479 | ) | 8,151 | |||||||
| Noble Energy, Inc. | (22,691 | ) | (779,336 | ) | 32,121 | |||||||
| Nordson Corp. | (7,650 | ) | (521,394 | ) | 30,646 | |||||||
| Northern Trust Corp. | (3,815 | ) | (263,693 | ) | (11,331 | ) | ||||||
| NorthStar Asset Management Group, Inc. | (74,426 | ) | (958,966 | ) | 55,434 | |||||||
| Norwegian Cruise Line Holdings Ltd. | (5,867 | ) | (348,762 | ) | 4,955 | |||||||
| NOW, Inc. | (22,794 | ) | (361,080 | ) | 479 | |||||||
| NRG Energy, Inc. | (69,796 | ) | (888,178 | ) | 66,680 | |||||||
| Occidental Petroleum Corp. | (17,387 | ) | (1,258,838 | ) | 83,303 | |||||||
| Oceaneering International, Inc. | (3,162 | ) | (129,228 | ) | 10,590 | |||||||
| OGE Energy Corp. | (14,995 | ) | (404,957 | ) | 10,738 | |||||||
| Old Dominion Freight Line, Inc. | (5,078 | ) | (300,225 | ) | 268 | |||||||
| Olin Corp. | (3,833 | ) | (73,833 | ) | 7,675 | |||||||
| ONE Gas, Inc. | (6,835 | ) | (338,078 | ) | (4,834 | ) | ||||||
| ONEOK, Inc. | (43,293 | ) | (1,183,148 | ) | 115,543 | |||||||
| Oshkosh Corp. | (6,600 | ) | (271,936 | ) | 14,272 | |||||||
| Owens-Illinois, Inc. | (56,299 | ) | (1,051,534 | ) | 70,805 | |||||||
| REFERENCE ENTITY | SHARES | NOTIONAL (a) | NET UNREALIZED APPRECIATION (DEPRECIATION) | |||||||||
| United States (continued) | ||||||||||||
| Packaging Corp. of America | (3,060 | ) | $ | (195,769 | ) | $ | 2,836 | |||||
| PacWest Bancorp | (12,412 | ) | (559,496 | ) | 24,539 | |||||||
| Palo Alto Networks, Inc. | (6,183 | ) | (1,073,531 | ) | (15,543 | ) | ||||||
| Pandora Media, Inc. | (29,641 | ) | (383,015 | ) | (14,471 | ) | ||||||
| PAREXEL International Corp. | (3,868 | ) | (247,444 | ) | (16,045 | ) | ||||||
| Patterson Cos., Inc. | (4,924 | ) | (224,006 | ) | 1,392 | |||||||
| Patterson-UTI Energy, Inc. | (59,424 | ) | (963,383 | ) | 67,269 | |||||||
| PayPal Holdings, Inc. | (15,855 | ) | (562,904 | ) | (11,047 | ) | ||||||
| Penske Automotive Group, Inc. | (2,005 | ) | (97,454 | ) | 12,562 | |||||||
| PerkinElmer, Inc. | (5,703 | ) | (273,060 | ) | (32,450 | ) | ||||||
| Platform Specialty Products Corp. | (87,188 | ) | (1,106,974 | ) | (11,648 | ) | ||||||
| Polaris Industries, Inc. | (3,120 | ) | (377,520 | ) | 109,356 | |||||||
| PolyOne Corp. | (8,135 | ) | (262,355 | ) | 3,988 | |||||||
| Post Holdings, Inc. | (6,855 | ) | (422,307 | ) | (646 | ) | ||||||
| PPL Corp. | (1,696 | ) | (55,335 | ) | (2,549 | ) | ||||||
| Praxair, Inc. | (4,522 | ) | (487,871 | ) | 24,818 | |||||||
| Premier, Inc. | (13,719 | ) | (468,463 | ) | (15,406 | ) | ||||||
| PulteGroup, Inc. | (3,814 | ) | (77,081 | ) | 9,115 | |||||||
| Qorvo, Inc. | (3,734 | ) | (182,457 | ) | (7,603 | ) | ||||||
| Questar Corp. | (64,950 | ) | (1,287,754 | ) | 22,528 | |||||||
| Range Resources Corp. | (29,738 | ) | (977,621 | ) | 245,769 | |||||||
| Regal Beloit Corp. | (1,481 | ) | (86,616 | ) | (52 | ) | ||||||
| Regeneron Pharmaceuticals, Inc. | (2,716 | ) | (1,350,219 | ) | (124,216 | ) | ||||||
| Rice Energy, Inc. | (51,041 | ) | (769,244 | ) | 212,897 | |||||||
| Rockwell Collins, Inc. | (491 | ) | (43,486 | ) | (1,834 | ) | ||||||
| Rollins, Inc. | (12,363 | ) | (329,338 | ) | 9,137 | |||||||
| Roper Technologies, Inc. | (4,237 | ) | (761,246 | ) | (42,894 | ) | ||||||
| Rowan Cos. PLC | (4,911 | ) | (98,760 | ) | 15,519 | |||||||
| Royal Caribbean Cruises Ltd. | (3,138 | ) | (295,756 | ) | (21,841 | ) | ||||||
| RPC, Inc. | (22,509 | ) | (275,208 | ) | 6,225 | |||||||
| RPM International, Inc. | (4,152 | ) | (181,484 | ) | (1,453 | ) | ||||||
| Ryder System, Inc. | (7,747 | ) | (458,315 | ) | 18,053 | |||||||
| Sabre Corp. | (12,447 | ) | (355,911 | ) | 7,769 | |||||||
| salesforce.com, Inc. | (4,108 | ) | (311,847 | ) | (10,220 | ) | ||||||
| SBA Communications Corp. | (17,131 | ) | (1,897,546 | ) | 97,592 | |||||||
| Schlumberger Ltd. | (9,789 | ) | (751,630 | ) | 68,847 | |||||||
| Scripps Networks Interactive, Inc. | (1,264 | ) | (70,468 | ) | 683 | |||||||
| Seattle Genetics, Inc. | (5,582 | ) | (214,963 | ) | (35,557 | ) | ||||||
| Sempra Energy | (11,331 | ) | (1,146,465 | ) | 81,238 | |||||||
| ServiceMaster Global Holdings, Inc. | (15,295 | ) | (545,242 | ) | (54,934 | ) | ||||||
| ServiceNow, Inc. | (11,130 | ) | (854,649 | ) | (108,764 | ) | ||||||
| Signature Bank/New York NY | (2,382 | ) | (351,981 | ) | (13,347 | ) | ||||||
| Signet Jewelers Ltd. | (2,317 | ) | (302,625 | ) | 16,036 | |||||||
| Silgan Holdings, Inc. | (7,220 | ) | (388,299 | ) | 440 | |||||||
| Silicon Laboratories, Inc. | (3,144 | ) | (138,713 | ) | (13,896 | ) | ||||||
| Sirius XM Holdings, Inc. | (251,740 | ) | (996,052 | ) | (28,530 | ) | ||||||
| The accompanying notes are an integral part of these financial statements. | (Continued) |
| AQR Funds | Annual Report | December 2015 | ||||||||||||||
80
Table of Contents
| Schedule of Investments | December 31, 2015 |
| AQR EQUITY MARKET NEUTRAL FUND |
| REFERENCE ENTITY | SHARES | NOTIONAL (a) | NET UNREALIZED APPRECIATION (DEPRECIATION) | |||||||||
| United States (continued) | ||||||||||||
| Six Flags Entertainment Corp. | (3,520 | ) | $ | (177,543 | ) | $ | (15,845 | ) | ||||
| SLM Corp. | (24,107 | ) | (171,106 | ) | 13,928 | |||||||
| SM Energy Co. | (15,486 | ) | (297,608 | ) | (6,847 | ) | ||||||
| Sotheby’s | (22,562 | ) | (766,054 | ) | 184,857 | |||||||
| Southern Co./The | (4,702 | ) | (213,794 | ) | (6,212 | ) | ||||||
| Southwestern Energy Co. | (113,247 | ) | (905,922 | ) | 100,736 | |||||||
| Spectra Energy Corp. | (40,959 | ) | (1,118,319 | ) | 137,761 | |||||||
| Spectrum Brands Holdings, Inc. | (19,720 | ) | (1,887,906 | ) | (119,590 | ) | ||||||
| Spirit Airlines, Inc. | (14,303 | ) | (609,948 | ) | 39,973 | |||||||
| Splunk, Inc. | (24,534 | ) | (1,393,713 | ) | (49,132 | ) | ||||||
| Sprint Corp. | (164,739 | ) | (749,562 | ) | 153,207 | |||||||
| Sprouts Farmers Market, Inc. | (79,558 | ) | (1,863,626 | ) | (251,821 | ) | ||||||
| SS&C Technologies Holdings, Inc. | (8,401 | ) | (591,322 | ) | 17,786 | |||||||
| Stericycle, Inc. | (10,692 | ) | (1,421,518 | ) | 132,062 | |||||||
| STERIS PLC | (3,493 | ) | (269,997 | ) | 6,834 | |||||||
| SunPower Corp. | (14,620 | ) | (444,474 | ) | 5,728 | |||||||
| SVB Financial Group | (1,376 | ) | (169,883 | ) | 6,277 | |||||||
| Synaptics, Inc. | (900 | ) | (76,119 | ) | 3,813 | |||||||
| Synovus Financial Corp. | (3,048 | ) | (91,958 | ) | (6,736 | ) | ||||||
| Tableau Software, Inc. | (2,186 | ) | (201,750 | ) | (4,215 | ) | ||||||
| Targa Resources Corp. | (21,679 | ) | (1,160,501 | ) | 573,867 | |||||||
| TEGNA, Inc. | (1,762 | ) | (46,037 | ) | 1,070 | |||||||
| Teleflex, Inc. | (867 | ) | (116,396 | ) | 2,429 | |||||||
| Tempur Sealy International, Inc. | (13,097 | ) | (1,000,618 | ) | 77,804 | |||||||
| Tenet Healthcare Corp. | (56,670 | ) | (1,736,977 | ) | 19,876 | |||||||
| TerraForm Power, Inc. | (45,083 | ) | (401,311 | ) | (165,833 | ) | ||||||
| Tesla Motors, Inc. | (13,706 | ) | (3,044,776 | ) | (244,801 | ) | ||||||
| Tiffany & Co. | (4,746 | ) | (363,348 | ) | 1,275 | |||||||
| Time, Inc. | (7,696 | ) | (118,926 | ) | (1,670 | ) | ||||||
| T-Mobile US, Inc. | (28,256 | ) | (1,098,360 | ) | (7,015 | ) | ||||||
| Toll Brothers, Inc. | (9,359 | ) | (322,217 | ) | 10,562 | |||||||
| TransDigm Group, Inc. | (7,776 | ) | (1,732,864 | ) | (43,563 | ) | ||||||
| TreeHouse Foods, Inc. | (3,987 | ) | (331,150 | ) | 18,330 | |||||||
| TRI Pointe Group, Inc. | (54,817 | ) | (721,680 | ) | 27,149 | |||||||
| Trimble Navigation Ltd. | (18,514 | ) | (348,897 | ) | (48,228 | ) | ||||||
| TripAdvisor, Inc. | (9,814 | ) | (710,934 | ) | (125,710 | ) | ||||||
| Twenty-First Century Fox, Inc. | (4,170 | ) | (115,260 | ) | 2,003 | |||||||
| Twitter, Inc. | (72,451 | ) | (2,060,893 | ) | 384,377 | |||||||
| Tyco International PLC | (4,297 | ) | (156,517 | ) | 19,485 | |||||||
| UGI Corp. | (5,808 | ) | (206,320 | ) | 10,242 | |||||||
| Ulta Salon Cosmetics & Fragrance, Inc. | (694 | ) | (124,553 | ) | (3,837 | ) | ||||||
| Ultimate Software Group, Inc./The | (1,654 | ) | (316,377 | ) | (6,996 | ) | ||||||
| Umpqua Holdings Corp. | (9,961 | ) | (170,473 | ) | 12,093 | |||||||
| Under Armour, Inc. | (23,995 | ) | (2,233,454 | ) | 299,217 | |||||||
| United Natural Foods, Inc. | (4,580 | ) | (205,378 | ) | 25,109 | |||||||
| United Parcel Service, Inc. | (3,746 | ) | (389,753 | ) | 29,275 | |||||||
| REFERENCE ENTITY | SHARES | NOTIONAL (a) | NET UNREALIZED APPRECIATION (DEPRECIATION) | |||||||||
| United States (continued) | ||||||||||||
| United Rentals, Inc. | (7,039 | ) | $ | (512,287 | ) | $ | 1,678 | |||||
| USG Corp. | (77,024 | ) | (2,033,700 | ) | 162,787 | |||||||
| Valley National Bancorp | (26,705 | ) | (269,873 | ) | 6,828 | |||||||
| Valspar Corp./The | (4,702 | ) | (374,617 | ) | (15,414 | ) | ||||||
| Vantiv, Inc. | (2,100 | ) | (98,721 | ) | (861 | ) | ||||||
| Veeva Systems, Inc. | (12,905 | ) | (342,390 | ) | (29,919 | ) | ||||||
| VeriFone Systems, Inc. | (5,920 | ) | (176,324 | ) | 10,446 | |||||||
| Verisk Analytics, Inc. | (38,734 | ) | (2,948,525 | ) | (29,345 | ) | ||||||
| Vertex Pharmaceuticals, Inc. | (4,476 | ) | (499,855 | ) | (63,360 | ) | ||||||
| Viavi Solutions, Inc. | (7,433 | ) | (43,719 | ) | (1,548 | ) | ||||||
| Visa, Inc. | (20,094 | ) | (1,560,898 | ) | 2,608 | |||||||
| Vista Outdoor, Inc. | (15,570 | ) | (680,019 | ) | (13,001 | ) | ||||||
| Vulcan Materials Co. | (2,653 | ) | (252,822 | ) | 867 | |||||||
| WABCO Holdings, Inc. | (2,636 | ) | (297,649 | ) | 28,092 | |||||||
| Wabtec Corp. | (3,034 | ) | (220,859 | ) | 5,081 | |||||||
| Walgreens Boots Alliance, Inc. | (8,817 | ) | (735,231 | ) | (15,580 | ) | ||||||
| Waste Connections, Inc. | (2,923 | ) | (150,276 | ) | (14,347 | ) | ||||||
| WEC Energy Group, Inc. | (63,469 | ) | (3,262,050 | ) | 5,455 | |||||||
| WestRock Co. | (38,172 | ) | (1,816,754 | ) | 75,348 | |||||||
| WEX, Inc. | (1,148 | ) | (107,267 | ) | 5,784 | |||||||
| WhiteWave Foods Co./The | (38,707 | ) | (1,516,060 | ) | 9,971 | |||||||
| Whiting Petroleum Corp. | (30,033 | ) | (322,410 | ) | 38,899 | |||||||
| Whole Foods Market, Inc. | (10,329 | ) | (337,884 | ) | (8,138 | ) | ||||||
| Williams-Sonoma, Inc. | (3,407 | ) | (202,919 | ) | 3,916 | |||||||
| WisdomTree Investments, Inc. | (81,288 | ) | (1,366,882 | ) | 92,286 | |||||||
| Workday, Inc. | (18,058 | ) | (1,433,339 | ) | (5,522 | ) | ||||||
| WPX Energy, Inc. | (8,693 | ) | (45,145 | ) | (4,752 | ) | ||||||
| WR Grace & Co. | (5,714 | ) | (562,996 | ) | (6,062 | ) | ||||||
| Wynn Resorts Ltd. | (9,859 | ) | (693,747 | ) | 11,603 | |||||||
| Zebra Technologies Corp. | (12,320 | ) | (951,751 | ) | 93,663 | |||||||
| Zimmer Biomet Holdings, Inc. | (17,378 | ) | (1,720,492 | ) | (62,318 | ) | ||||||
| Zions Bancorporation | (13,112 | ) | (382,260 | ) | 24,302 | |||||||
|
| |||||||||||
| 6,134,334 | ||||||||||||
|
| |||||||||||
Total of Short Equity Positions | 6,280,896 | |||||||||||
|
| |||||||||||
Total of Long and Short Equity Positions | 3,572,442 | |||||||||||
|
| |||||||||||
Net Cash and Other Receivables/ (Payables) (b) | 431,577 | |||||||||||
|
| |||||||||||
Swaps, at Value | $ | 4,004,019 | ||||||||||
|
| |||||||||||
| (a) | Notional value represents the market value (including any fees or commissions) of the long and short positions when they are established. |
| (b) | Cash and other receivables/(payables) includes the gains (or losses) realized within the swap when the swap resets. |
| The accompanying notes are an integral part of these financial statements. | (Continued) |
| AQR Funds | Annual Report | December 2015 | ||||||||||||||
81
Table of Contents
| Schedule of Investments | December 31, 2015 |
| AQR EQUITY MARKET NEUTRAL FUND |
| COUNTERPARTY | DESCRIPTION | TERMINATION DATE** | VALUE (Note 5) | |||||
Morgan Stanley Capital Services, Inc. | The Fund receives the total return on a portfolio of long and short positions and pays or receives the Sterling Overnight Index Average plus or minus a specified spread, which is denominated in GBP based on the local currencies of the positions within the swap. | 10-25 months maturity 10/12/2016 | $1,059,005 | |||||
|
| |||||||
| ** | The maturity dates are measured from the commencement of investment in each underlying portfolio swap positions. |
Additional Information — Total Return Basket Swap
The following table represents the individual long and short positions and related values within the total return basket swap as of December 31, 2015.
| REFERENCE ENTITY | SHARES | NOTIONAL (a) | NET UNREALIZED APPRECIATION (DEPRECIATION) | |||||||||
| Long Positions | ||||||||||||
| Common Stocks | ||||||||||||
| Australia | ||||||||||||
| BHP Billiton PLC | 20,518 | $ | 282,648 | $ | (53,835 | ) | ||||||
|
| |||||||||||
| Ireland | ||||||||||||
| DCC PLC | 10,884 | 794,189 | 115,082 | |||||||||
| Shire PLC | 4,586 | 314,993 | (360 | ) | ||||||||
|
| |||||||||||
| 114,722 | ||||||||||||
|
| |||||||||||
| Luxembourg | ||||||||||||
| Regus PLC | 72,671 | 342,276 | 14,798 | |||||||||
|
| |||||||||||
| South Africa | ||||||||||||
| Mondi PLC | 34,356 | 696,014 | (22,611 | ) | ||||||||
|
| |||||||||||
| Switzerland | ||||||||||||
| Coca-Cola HBC AG | 21,950 | 468,796 | (1,357 | ) | ||||||||
| Glencore PLC | 302,507 | 442,267 | (41,406 | ) | ||||||||
| Wolseley PLC | 6,542 | 360,636 | (5,321 | ) | ||||||||
|
| |||||||||||
| (48,084 | ) | |||||||||||
|
| |||||||||||
| United Kingdom | ||||||||||||
| AA PLC | 51,695 | 228,502 | 10,306 | |||||||||
| Aggreko PLC | 17,957 | 254,809 | (13,077 | ) | ||||||||
| Amec Foster Wheeler PLC | 36,612 | 235,646 | (4,527 | ) | ||||||||
| ASOS PLC | 11,364 | 535,181 | 42,220 | |||||||||
| AstraZeneca PLC | 4,923 | 328,143 | 4,392 | |||||||||
| Barratt Developments PLC | 85,588 | 744,252 | 44,417 | |||||||||
| Bellway PLC | 15,889 | 599,145 | 65,229 | |||||||||
| Berkeley Group Holdings PLC | 21,086 | 1,059,158 | 87,151 | |||||||||
| Britvic PLC | 29,410 | 297,411 | 17,694 | |||||||||
| BT Group PLC | 20,611 | 125,407 | 17,707 | |||||||||
| Burberry Group PLC | 15,738 | 310,463 | (33,569 | ) | ||||||||
| Centrica PLC | 390,597 | 1,240,741 | 13,455 | |||||||||
| Close Brothers Group PLC | 5,481 | 114,880 | (6,797 | ) | ||||||||
| Compass Group PLC | 2,966 | 44,886 | 6,509 | |||||||||
| Direct Line Insurance Group PLC | 6,178 | 33,755 | 3,276 | |||||||||
| Direct Line Insurance Group PLC | 1,224 | 7,425 | (88 | ) | ||||||||
| REFERENCE ENTITY | SHARES | NOTIONAL (a) | NET UNREALIZED APPRECIATION (DEPRECIATION) | |||||||||
| United Kingdom (continued) | ||||||||||||
| Dixons Carphone PLC | 6,108 | $ | 40,739 | $ | 4,210 | |||||||
| DS Smith PLC | 86,642 | 493,031 | 13,787 | |||||||||
| GKN PLC | 90,329 | 381,913 | 27,988 | |||||||||
| Hays PLC | 48,647 | 104,813 | (336 | ) | ||||||||
| Howden Joinery Group PLC | 53,715 | 385,588 | 30,598 | |||||||||
| Imperial Tobacco Group PLC | 6,603 | 321,105 | 27,650 | |||||||||
| Indivior PLC | 105,609 | 327,431 | (35,587 | ) | ||||||||
| Informa PLC | 15,864 | 139,070 | 4,300 | |||||||||
| Intermediate Capital Group PLC | 29,207 | 234,697 | 34,549 | |||||||||
| John Wood Group PLC | 85,725 | 749,630 | 22,428 | |||||||||
| Jupiter Fund Management PLC | 6,781 | 44,228 | 837 | |||||||||
| Just Eat PLC | 72,350 | 418,699 | 106,631 | |||||||||
| Kingfisher PLC | 116,990 | 596,384 | (29,745 | ) | ||||||||
| Man Group PLC | 251,946 | 644,503 | 3,630 | |||||||||
| Marks & Spencer Group PLC | 85,918 | 613,626 | (41,568 | ) | ||||||||
| Meggitt PLC | 120,595 | 673,235 | (7,399 | ) | ||||||||
| National Grid PLC | 12,359 | 164,265 | 6,185 | |||||||||
| Pearson PLC | 3,958 | 55,443 | (12,655 | ) | ||||||||
| Persimmon PLC | 22,231 | 609,524 | 53,701 | |||||||||
| Playtech PLC | 6,182 | 77,798 | (2,112 | ) | ||||||||
| Reckitt Benckiser Group PLC | 488 | 45,200 | (47 | ) | ||||||||
| Rentokil Initial PLC | 224,592 | 499,897 | 27,050 | |||||||||
| Rio Tinto PLC | 4,413 | 158,878 | (30,392 | ) | ||||||||
| Royal Mail PLC | 182,448 | 1,258,584 | (63,571 | ) | ||||||||
| Severn Trent PLC | 1,654 | 53,659 | (786 | ) | ||||||||
| Sky PLC | 2,766 | 41,267 | 4,075 | |||||||||
| Smith & Nephew PLC | 13,363 | 230,431 | 7,725 | |||||||||
| Smiths Group PLC | 74,529 | 1,081,125 | (50,470 | ) | ||||||||
| Stagecoach Group PLC | 95,466 | 470,249 | (53,128 | ) | ||||||||
| Tate & Lyle PLC | 5,182 | 45,535 | 110 | |||||||||
| Taylor Wimpey PLC | 449,375 | 1,230,722 | 112,623 | |||||||||
| Thomas Cook Group PLC | 188,138 | 334,175 | 1,518 | |||||||||
| Travis Perkins PLC | 1,539 | 40,303 | 4,344 | |||||||||
| UBM PLC | 6,875 | 50,739 | 2,545 | |||||||||
| United Utilities Group PLC | 3,246 | 45,979 | (1,283 | ) | ||||||||
| The accompanying notes are an integral part of these financial statements. | (Continued) |
| AQR Funds | Annual Report | December 2015 | ||||||||||||||
82
Table of Contents
| Schedule of Investments | December 31, 2015 |
| AQR EQUITY MARKET NEUTRAL FUND |
| REFERENCE ENTITY | SHARES | NOTIONAL (a) | NET UNREALIZED APPRECIATION (DEPRECIATION) | |||||||||
| United Kingdom (continued) | ||||||||||||
| Vedanta Resources PLC | 29,312 | $ | 182,915 | $ | (64,840 | ) | ||||||
| Vodafone Group PLC | 97,585 | 306,750 | 9,695 | |||||||||
| William Hill PLC | 81,540 | 430,381 | 45,494 | |||||||||
| WPP PLC | 8,113 | 183,570 | 3,044 | |||||||||
|
| |||||||||||
| 415,096 | ||||||||||||
|
| |||||||||||
Total of Long Equity Positions | 420,086 | |||||||||||
|
| |||||||||||
| Short Positions | ||||||||||||
| Common Stocks | ||||||||||||
| Chile | ||||||||||||
| Antofagasta PLC | (165,908 | ) | (1,324,352 | ) | 183,103 | |||||||
|
| |||||||||||
| Luxembourg | ||||||||||||
| B&M European Value Retail SA | (27,390 | ) | (125,591 | ) | 10,858 | |||||||
|
| |||||||||||
| United Kingdom | ||||||||||||
| Aberdeen Asset Management PLC | (158,257 | ) | (736,653 | ) | 62,284 | |||||||
| Admiral Group PLC | (38,177 | ) | (874,319 | ) | (58,560 | ) | ||||||
| Anglo American PLC | (53,905 | ) | (340,450 | ) | 103,958 | |||||||
| ARM Holdings PLC | (120,850 | ) | (1,795,430 | ) | (46,569 | ) | ||||||
| Ashtead Group PLC | (20,536 | ) | (334,311 | ) | (3,668 | ) | ||||||
| Associated British Foods PLC | (24,667 | ) | (1,206,534 | ) | (7,258 | ) | ||||||
| Aviva PLC | (57,239 | ) | (429,950 | ) | (4,522 | ) | ||||||
| Babcock International Group PLC | (25,554 | ) | (372,717 | ) | (9,703 | ) | ||||||
| Balfour Beatty PLC | (11,293 | ) | (43,436 | ) | (1,544 | ) | ||||||
| Booker Group PLC | (36,603 | ) | (97,046 | ) | (643 | ) | ||||||
| BP PLC | (134,547 | ) | (712,753 | ) | 13,554 | |||||||
| British American Tobacco PLC | (32,210 | ) | (1,755,007 | ) | (33,744 | ) | ||||||
| BTG PLC | (54,945 | ) | (523,440 | ) | (33,313 | ) | ||||||
| Bunzl PLC | (11,953 | ) | (330,570 | ) | (1,058 | ) | ||||||
| Cable & Wireless Communications PLC | (71,539 | ) | (65,069 | ) | (13,196 | ) | ||||||
| Capita PLC | (31,371 | ) | (568,844 | ) | 10,675 | |||||||
| Cobham PLC | (167,401 | ) | (699,653 | ) | 607 | |||||||
| Croda International PLC | (1,624 | ) | (73,286 | ) | 522 | |||||||
| Diageo PLC | (21,717 | ) | (592,295 | ) | (747 | ) | ||||||
| easyJet PLC | (8,936 | ) | (230,900 | ) | 1,718 | |||||||
| Essentra PLC | (24,790 | ) | (298,587 | ) | (3,605 | ) | ||||||
| G4S PLC | (41,840 | ) | (164,758 | ) | 25,775 | |||||||
| GlaxoSmithKline PLC | (7,074 | ) | (142,047 | ) | (819 | ) | ||||||
| Halma PLC | (13,763 | ) | (175,316 | ) | 62 | |||||||
| Hargreaves Lansdown PLC | (42,822 | ) | (716,740 | ) | (233,935 | ) | ||||||
| HSBC Holdings PLC | (13,550 | ) | (108,264 | ) | 1,298 | |||||||
| IMI PLC | (13,943 | ) | (180,096 | ) | 3,170 | |||||||
| Inmarsat PLC | (28,502 | ) | (436,797 | ) | (41,023 | ) | ||||||
| International Consolidated Airlines Group SA | (14,515 | ) | (125,133 | ) | (5,372 | ) | ||||||
| Intertek Group PLC | (3,759 | ) | (141,938 | ) | (11,829 | ) | ||||||
| REFERENCE ENTITY | SHARES | NOTIONAL (a) | NET UNREALIZED APPRECIATION (DEPRECIATION) | |||||||||
| United Kingdom (continued) | ||||||||||||
| ITV PLC | (106,946 | ) | $ | (436,872 | ) | $ | 1,457 | |||||
| J Sainsbury PLC | (190,206 | ) | (718,060 | ) | (6,283 | ) | ||||||
| Legal & General Group PLC | (91,582 | ) | (359,882 | ) | (1,492 | ) | ||||||
| Lloyds Banking Group PLC | (568,724 | ) | (612,555 | ) | 611 | |||||||
| Melrose Industries PLC | (16,627 | ) | (72,148 | ) | 927 | |||||||
| Merlin Entertainments PLC | (19,889 | ) | (132,766 | ) | (591 | ) | ||||||
| Micro Focus International PLC | (3,723 | ) | (75,045 | ) | (12,387 | ) | ||||||
| Ocado Group PLC | (128,441 | ) | (629,688 | ) | 55,848 | |||||||
| Old Mutual PLC | (108,675 | ) | (319,279 | ) | 33,392 | |||||||
| Pennon Group PLC | (8,562 | ) | (110,073 | ) | 1,452 | |||||||
| Petrofac Ltd. | (8,066 | ) | (115,912 | ) | 21,301 | |||||||
| Provident Financial PLC | (12,676 | ) | (636,045 | ) | 7,536 | |||||||
| Prudential PLC | (20,504 | ) | (452,590 | ) | (9,355 | ) | ||||||
| Rolls-Royce Holdings PLC (3) | (5,165,522 | ) | 337 | (7,952 | ) | |||||||
| Rolls-Royce Holdings PLC | (109,335 | ) | (1,099,369 | ) | 173,256 | |||||||
| Rotork PLC | (38,372 | ) | (110,980 | ) | 7,715 | |||||||
| Royal Bank of Scotland Group PLC | (45,668 | ) | (213,305 | ) | 10,308 | |||||||
| RSA Insurance Group PLC | (92,863 | ) | (548,158 | ) | (34,683 | ) | ||||||
| Schroders PLC | (2,064 | ) | (91,186 | ) | 785 | |||||||
| Serco Group PLC | (242,148 | ) | (433,743 | ) | 96,782 | |||||||
| Spectris PLC | (5,447 | ) | (144,579 | ) | 22 | |||||||
| Spirax-Sarco Engineering PLC | (1,330 | ) | (64,589 | ) | 266 | |||||||
| Sports Direct International PLC | (5,385 | ) | (55,576 | ) | 9,814 | |||||||
| SSE PLC | (12,237 | ) | (282,917 | ) | 8,150 | |||||||
| St. James’s Place PLC | (61,646 | ) | (870,476 | ) | (43,220 | ) | ||||||
| Standard Chartered PLC | (5,161 | ) | (57,161 | ) | 14,339 | |||||||
| Standard Life PLC | (183,108 | ) | (1,084,920 | ) | 36,350 | |||||||
| Tesco PLC | (911,547 | ) | (2,327,251 | ) | 324,331 | |||||||
| Weir Group PLC/The | (4,873 | ) | (130,422 | ) | 58,844 | |||||||
|
| |||||||||||
| 460,038 | ||||||||||||
|
| |||||||||||
Total of Short Equity Positions | 653,999 | |||||||||||
|
| |||||||||||
Total of Long and Short Equity Positions | 1,074,085 | |||||||||||
|
| |||||||||||
Net Cash and Other Receivables/ (Payables) (b) | (15,080 | ) | ||||||||||
|
| |||||||||||
Swaps, at Value | $ | 1,059,005 | ||||||||||
|
| |||||||||||
| (a) | Notional value represents the market value (including any fees or commissions) of the long and short positions when they are established. |
| (b) | Cash and other receivables/(payables) includes the gains (or losses) realized within the swap when the swap resets. |
| (3) | Level 3 security (See Note 5). |
| The accompanying notes are an integral part of these financial statements. | (Continued) |
| AQR Funds | Annual Report | December 2015 | ||||||||||||||
83
Table of Contents
| Schedule of Investments | December 31, 2015 |
| AQR EQUITY MARKET NEUTRAL FUND |
| COUNTERPARTY | DESCRIPTION | TERMINATION DATE** | VALUE (Note 5) | |||||
Morgan Stanley Capital Services, Inc. | The Fund receives the total return on a portfolio of long and short positions and pays or receives the Reserve Bank of Australia Cash rate plus or minus a specified spread, which is denominated in AUD based on the local currencies of the positions within the swap. | 10-25 months maturity 10/13/2016 | $(328,206 | ) | ||||
|
| |||||||
| ** | The maturity dates are measured from the commencement of investment in each underlying portfolio swap positions. |
Additional Information — Total Return Basket Swap
The following table represents the individual long and short positions and related values within the total return basket swap as of December 31, 2015.
| REFERENCE ENTITY | SHARES | NOTIONAL (a) | NET UNREALIZED APPRECIATION (DEPRECIATION) | |||||||||
| Long Positions | ||||||||||||
| Common Stocks | ||||||||||||
| Australia | ||||||||||||
| Amcor Ltd. | 18,880 | $ | 179,993 | $ | 3,431 | |||||||
| Ansell Ltd. | 41,552 | 616,666 | 27,274 | |||||||||
| Aurizon Holdings Ltd. | 208,953 | 689,315 | (25,973 | ) | ||||||||
| Boral Ltd. | 299,517 | 1,196,128 | 84,473 | |||||||||
| Caltex Australia Ltd. | 15,942 | 387,140 | 48,614 | |||||||||
| CIMIC Group Ltd. | 37,780 | 655,777 | 6,952 | |||||||||
| Coca-Cola Amatil Ltd. | 70,295 | 471,861 | 2,134 | |||||||||
| Cochlear Ltd. | 1,375 | 90,883 | 4,269 | |||||||||
| Flight Centre Travel Group Ltd. | 6,163 | 168,293 | 9,453 | |||||||||
| Harvey Norman Holdings Ltd. | 167,444 | 478,783 | 27,389 | |||||||||
| Iluka Resources Ltd. | 80,851 | 377,603 | (19,964 | ) | ||||||||
| Incitec Pivot Ltd. | 38,894 | 106,490 | 4,647 | |||||||||
| Macquarie Group Ltd. | 782 | 31,435 | 15,346 | |||||||||
| Newcrest Mining Ltd. | 37,897 | 321,122 | 37,468 | |||||||||
| Orica Ltd. | 9,683 | 114,965 | (6,480 | ) | ||||||||
| Qantas Airways Ltd. | 348,811 | 1,011,656 | 22,245 | |||||||||
| Sonic Healthcare Ltd. | 3,506 | 47,458 | (2,065 | ) | ||||||||
| Star Entertainment Grp Ltd./The | 260,979 | 908,640 | 49,007 | |||||||||
| Tabcorp Holdings Ltd. | 122,905 | 411,003 | 7,467 | |||||||||
| Tatts Group Ltd. | 87,503 | 267,158 | 10,654 | |||||||||
| Telstra Corp. Ltd. | 88,681 | 348,235 | 12,138 | |||||||||
| TPG Telecom Ltd. | 30,700 | 220,832 | (1,031 | ) | ||||||||
| Treasury Wine Estates Ltd. | 214,417 | 1,079,234 | 208,157 | |||||||||
| Woodside Petroleum Ltd. | 83,437 | 1,841,751 | (103,428 | ) | ||||||||
|
| |||||||||||
| 422,177 | ||||||||||||
|
| |||||||||||
| New Zealand | ||||||||||||
| Fletcher Building Ltd. | 96,220 | 442,755 | 37,029 | |||||||||
| Spark New Zealand Ltd. | 163,550 | 336,529 | 32,794 | |||||||||
|
| |||||||||||
| 69,823 | ||||||||||||
|
| |||||||||||
Total of Long Equity Positions | 492,000 | |||||||||||
|
| |||||||||||
| REFERENCE ENTITY | SHARES | NOTIONAL (a) | NET UNREALIZED APPRECIATION (DEPRECIATION) | |||||||||
| Short Positions | ||||||||||||
| Common Stocks | ||||||||||||
| Australia | ||||||||||||
| ALS Ltd. | (17,050 | ) | $ | (46,983 | ) | $ | 582 | |||||
| Alumina Ltd. | (682,151 | ) | (590,249 | ) | 20,966 | |||||||
| AMP Ltd. | (20,461 | ) | (91,719 | ) | 5,507 | |||||||
| APA Group | (232,467 | ) | (1,450,698 | ) | (12,069 | ) | ||||||
| AusNet Services | (379,814 | ) | (375,976 | ) | (32,914 | ) | ||||||
| Bank of Queensland Ltd. | (28,314 | ) | (282,305 | ) | (3,316 | ) | ||||||
| Brambles Ltd. | (62,675 | ) | (514,497 | ) | (10,400 | ) | ||||||
| Commonwealth Bank of Australia | (7,549 | ) | (430,084 | ) | (36,629 | ) | ||||||
| Computershare Ltd. | (43,492 | ) | (361,788 | ) | (4,178 | ) | ||||||
| Crown Resorts Ltd. | (65,967 | ) | (586,869 | ) | (9,356 | ) | ||||||
| CSL Ltd. | (14,806 | ) | (1,059,165 | ) | (69,640 | ) | ||||||
| Healthscope Ltd. | (199,450 | ) | (378,828 | ) | (5,520 | ) | ||||||
| Insurance Australia Group Ltd. | (253,040 | ) | (969,086 | ) | (47,125 | ) | ||||||
| Medibank Pvt Ltd. | (192,825 | ) | (301,324 | ) | 650 | |||||||
| Origin Energy Ltd. | (13,028 | ) | (51,386 | ) | 7,316 | |||||||
| QBE Insurance Group Ltd. | (7,910 | ) | (69,992 | ) | (1,951 | ) | ||||||
| Ramsay Health Care Ltd. | (14,211 | ) | (653,405 | ) | (45,382 | ) | ||||||
| REA Group Ltd. | (13,529 | ) | (444,113 | ) | (94,178 | ) | ||||||
| Santos Ltd. | (32,375 | ) | (79,440 | ) | (6,790 | ) | ||||||
| Seek Ltd. | (295,168 | ) | (3,019,405 | ) | (265,862 | ) | ||||||
| South32 Ltd. | (141,585 | ) | (123,261 | ) | 14,495 | |||||||
| Transurban Group | (21,978 | ) | (164,960 | ) | (1,633 | ) | ||||||
| Westpac Banking Corp. | (15,781 | ) | (370,175 | ) | (12,353 | ) | ||||||
|
| |||||||||||
| (609,780 | ) | |||||||||||
|
| |||||||||||
Total of Short Equity Positions | (609,780 | ) | ||||||||||
|
| |||||||||||
Total of Long and Short Equity Positions | (117,780 | ) | ||||||||||
|
| |||||||||||
Net Cash and Other Receivables/ (Payables) (b) | (210,426 | ) | ||||||||||
|
| |||||||||||
Swaps, at Value | $ | (328,206 | ) | |||||||||
|
| |||||||||||
| The accompanying notes are an integral part of these financial statements. | (Continued) |
| AQR Funds | Annual Report | December 2015 | ||||||||||||||
84
Table of Contents
| Schedule of Investments | December 31, 2015 |
| AQR EQUITY MARKET NEUTRAL FUND |
| (a) | Notional value represents the market value (including any fees or commissions) of the long and short positions when they are established. |
| (b) | Cash and other receivables/(payables) includes the gains (or losses) realized within the swap when the swap resets. |
| COUNTERPARTY | DESCRIPTION | TERMINATION DATE** | VALUE (Note 5) | |||||
Morgan Stanley Capital Services, Inc. | The Fund receives the total return on a portfolio of long and short positions and pays or receives the Euro Overnight Index Average plus or minus a specified spread, which is denominated in EUR based on the local currencies of the positions within the swap. | 10-25 months maturity 10/12/2016 | $580,612 | |||||
|
| |||||||
| ** | The maturity dates are measured from the commencement of investment in each underlying portfolio swap positions. |
Additional Information — Total Return Basket Swap
The following table represents the individual long and short positions and related values within the total return basket swap as of December 31, 2015.
| REFERENCE ENTITY | SHARES | NOTIONAL (a) | NET UNREALIZED APPRECIATION (DEPRECIATION) | |||||||||
| Long Positions | ||||||||||||
| Common Stocks | ||||||||||||
| France | ||||||||||||
| Accor SA | 1,040 | $ | 42,770 | $ | 2,272 | |||||||
| Aeroports de Paris | 1,937 | 214,799 | 10,607 | |||||||||
| Atos SE | 1,902 | 149,724 | 9,954 | |||||||||
| AXA SA | 15,028 | 387,246 | 23,373 | |||||||||
| Cap Gemini SA | 7,108 | 615,407 | 44,113 | |||||||||
| Christian Dior SE | 263 | 46,204 | (1,530 | ) | ||||||||
| Cie Generale des Etablissements Michelin | 3,226 | 308,908 | (1,849 | ) | ||||||||
| CNP Assurances | 12,956 | 176,088 | (1,320 | ) | ||||||||
| Dassault Systemes | 566 | 38,749 | 6,492 | |||||||||
| Eiffage SA | 8,934 | 548,425 | 28,963 | |||||||||
| Eutelsat Communications SA | 9,918 | 307,762 | (10,813 | ) | ||||||||
| Faurecia | 12,337 | 492,313 | 2,027 | |||||||||
| Groupe Eurotunnel SE | 3,719 | 48,203 | (1,935 | ) | ||||||||
| Hermes International | 236 | 80,752 | (979 | ) | ||||||||
| Imerys SA | 1,162 | 79,936 | 1,231 | |||||||||
| Ingenico Group | 2,277 | 262,659 | 24,747 | |||||||||
| Ipsen SA | 10,337 | 666,918 | 17,987 | |||||||||
| Lagardere SCA | 3,556 | 103,569 | 2,547 | |||||||||
| Numericable-SFR SAS | 9,292 | 381,857 | (44,297 | ) | ||||||||
| Peugeot SA | 134,518 | 2,141,243 | 216,712 | |||||||||
| Safran SA | 7,011 | 512,066 | (30,391 | ) | ||||||||
| Sanofi | 13,551 | 1,213,671 | (58,831 | ) | ||||||||
| SCOR SE | 17,809 | 652,264 | 14,109 | |||||||||
| SEB SA | 6,857 | 635,464 | 68,484 | |||||||||
| Societe BIC SA | 2,307 | 362,103 | 17,526 | |||||||||
| Societe Generale SA | 7,070 | 339,724 | (13,923 | ) | ||||||||
| Societe Television Francaise 1 | 30,966 | 401,740 | (57,899 | ) | ||||||||
| Sodexo SA | 6,600 | 647,770 | (2,970 | ) | ||||||||
| REFERENCE ENTITY | SHARES | NOTIONAL (a) | NET UNREALIZED APPRECIATION (DEPRECIATION) | |||||||||
| France (continued) | ||||||||||||
| Teleperformance | 4,535 | $ | 356,583 | $ | 24,754 | |||||||
| Thales SA | 13,759 | 932,807 | 97,050 | |||||||||
| TOTAL SA | 8,219 | 374,818 | (6,349 | ) | ||||||||
| Valeo SA | 3,456 | 482,655 | 50,172 | |||||||||
| Veolia Environnement SA | 23,825 | 564,410 | 857 | |||||||||
| Vinci SA | 7,263 | 465,488 | 32 | |||||||||
| Vivendi SA | 35,369 | 845,750 | (86,129 | ) | ||||||||
|
| |||||||||||
| 344,794 | ||||||||||||
|
| |||||||||||
| Luxembourg | ||||||||||||
| SES SA | 2,472 | 87,613 | (19,115 | ) | ||||||||
|
| |||||||||||
| Total of Long Equity Positions | 325,679 | |||||||||||
|
| |||||||||||
| Short Positions | ||||||||||||
| Common Stocks | ||||||||||||
| France | ||||||||||||
| Airbus Group SE | (9,100 | ) | (651,297 | ) | 38,072 | |||||||
| Alstom SA | (7,496 | ) | (227,580 | ) | (1,384 | ) | ||||||
| Arkema SA | (645 | ) | (46,678 | ) | 1,529 | |||||||
| Bollore SA | (140,177 | ) | (704,334 | ) | 51,161 | |||||||
| Carrefour SA | (3,023 | ) | (96,330 | ) | 9,087 | |||||||
| Cie de Saint-Gobain | (2,757 | ) | (120,295 | ) | 819 | |||||||
| Credit Agricole SA | (8,372 | ) | (98,326 | ) | (331 | ) | ||||||
| Danone SA | (3,237 | ) | (220,329 | ) | 1,593 | |||||||
| Edenred | (58,309 | ) | (1,072,007 | ) | (30,211 | ) | ||||||
| Electricite de France SA | (76,842 | ) | (1,182,187 | ) | 50,498 | |||||||
| Engie | (36,745 | ) | (591,481 | ) | (59,391 | ) | ||||||
| Essilor International SA | (1,310 | ) | (140,338 | ) | (22,935 | ) | ||||||
| Iliad SA | (1,005 | ) | (239,903 | ) | 333 | |||||||
| Kering | (2,590 | ) | (454,996 | ) | 12,171 | |||||||
| L’Oreal SA | (268 | ) | (48,090 | ) | 3,011 | |||||||
| Natixis SA | (45,700 | ) | (260,325 | ) | 1,796 | |||||||
| Orange SA | (7,246 | ) | (122,382 | ) | 1,187 | |||||||
| The accompanying notes are an integral part of these financial statements. | (Continued) |
| AQR Funds | Annual Report | December 2015 | ||||||||||||||
85
Table of Contents
| Schedule of Investments | December 31, 2015 |
| AQR EQUITY MARKET NEUTRAL FUND |
| REFERENCE ENTITY | SHARES | NOTIONAL (a) | NET UNREALIZED APPRECIATION (DEPRECIATION) | |||||||||
| France (continued) | ||||||||||||
| Orpea | (1,149 | ) | $ | (91,765 | ) | $ | (231 | ) | ||||
| Pernod Ricard SA | (7,707 | ) | (902,640 | ) | 23,699 | |||||||
| Plastic Omnium SA | (16,558 | ) | (398,495 | ) | (127,831 | ) | ||||||
| Remy Cointreau SA | (4,923 | ) | (308,592 | ) | (44,020 | ) | ||||||
| Renault SA | (953 | ) | (94,994 | ) | (397 | ) | ||||||
| Rexel SA | (19,525 | ) | (260,670 | ) | 679 | |||||||
| Schneider Electric SE | (7,085 | ) | (441,811 | ) | 39,355 | |||||||
| Suez Environnement Co. | (13,902 | ) | (257,766 | ) | (2,248 | ) | ||||||
| Technip SA | (18,975 | ) | (910,993 | ) | (32,639 | ) | ||||||
| Vallourec SA | (10,380 | ) | (100,891 | ) | 4,256 | |||||||
| Zodiac Aerospace | (79,101 | ) | (2,032,587 | ) | 149,167 | |||||||
|
| |||||||||||
| 66,795 | ||||||||||||
|
| |||||||||||
Total of Short Equity Positions | 66,795 | |||||||||||
|
| |||||||||||
Total of Long and Short Equity Positions | 392,474 | |||||||||||
|
| |||||||||||
Net Cash and Other Receivables/ (Payables) (b) | 188,138 | |||||||||||
|
| |||||||||||
Swaps, at Value | $ | 580,612 | ||||||||||
|
| |||||||||||
| (a) | Notional value represents the market value (including any fees or commissions) of the long and short positions when they are established. |
| (b) | Cash and other receivables/(payables) includes the gains (or losses) realized within the swap when the swap resets. |
| COUNTERPARTY | DESCRIPTION | TERMINATION DATE** | VALUE (Note 5) | |||||
Morgan Stanley Capital Services, Inc. | The Fund receives the total return on a portfolio of long and short positions and pays or receives the Hong Kong Overnight Index Average plus or minus a specified spread, which is denominated in HKD based on the local currencies of the positions within the swap. | 10-25 months maturity 10/14/2016 | $(48,131 | ) | ||||
|
| |||||||
| ** | The maturity dates are measured from the commencement of investment in each underlying portfolio swap positions. |
Additional Information — Total Return Basket Swap
The following table represents the individual long and short positions and related values within the total return basket swap as of December 31, 2015.
| REFERENCE ENTITY | SHARES | NOTIONAL (a) | NET UNREALIZED APPRECIATION (DEPRECIATION) | |||||||||
| Long Positions | ||||||||||||
| Common Stocks | ||||||||||||
| Hong Kong | ||||||||||||
| CK Hutchison Holdings Ltd. | 15,000 | $ | 198,916 | $ | 2,712 | |||||||
| CLP Holdings Ltd. | 135,500 | 1,151,647 | (3,148 | ) | ||||||||
| Hang Seng Bank Ltd. | 2,600 | 48,778 | 501 | |||||||||
| Henderson Land Development Co., Ltd. | 7,000 | 44,697 | (1,997 | ) | ||||||||
| Kerry Properties Ltd. | 143,500 | 423,986 | (33,470 | ) | ||||||||
| New World Development Co., Ltd. | 506,817 | 538,002 | (40,339 | ) | ||||||||
| REFERENCE ENTITY | SHARES | NOTIONAL (a) | NET UNREALIZED APPRECIATION (DEPRECIATION) | |||||||||
| Hong Kong (continued) | ||||||||||||
| Orient Overseas International Ltd. | 85,500 | $ | 414,738 | $ | (5,494 | ) | ||||||
| Sino Land Co., Ltd. | 386,000 | 590,801 | (28,493 | ) | ||||||||
| Sun Hung Kai Properties Ltd. | 31,000 | 410,731 | (38,123 | ) | ||||||||
| Swire Pacific Ltd. | 17,500 | 196,207 | (730 | ) | ||||||||
| Techtronic Industries Co., Ltd. | 15,000 | 57,894 | 2,830 | |||||||||
| WH Group Ltd. | 1,481,000 | 816,163 | 8,117 | |||||||||
| Wheelock & Co., Ltd. | 17,000 | 72,220 | (885 | ) | ||||||||
| The accompanying notes are an integral part of these financial statements. | (Continued) |
| AQR Funds | Annual Report | December 2015 | ||||||||||||||
86
Table of Contents
| Schedule of Investments | December 31, 2015 |
| AQR EQUITY MARKET NEUTRAL FUND |
| REFERENCE ENTITY | SHARES | NOTIONAL (a) | NET UNREALIZED APPRECIATION (DEPRECIATION) | |||||||||
| Hong Kong (continued) | ||||||||||||
| Yue Yuen Industrial Holdings Ltd. | 162,000 | $ | 578,594 | $ | (29,816 | ) | ||||||
|
| |||||||||||
| (168,335 | ) | |||||||||||
|
| |||||||||||
Total of Long Equity Positions | (168,335 | ) | ||||||||||
|
| |||||||||||
| Short Positions | ||||||||||||
| Common Stocks | ||||||||||||
| Hong Kong | ||||||||||||
| AIA Group Ltd. | (43,800 | ) | (260,363 | ) | (1,345 | ) | ||||||
| ASM Pacific Technology Ltd. | (54,400 | ) | (389,465 | ) | (35,263 | ) | ||||||
| Bank of East Asia Ltd./The | (29,000 | ) | (104,543 | ) | (3,032 | ) | ||||||
| Cathay Pacific Airways Ltd. | (53,000 | ) | (91,136 | ) | (59 | ) | ||||||
| Cheung Kong Property Holdings Ltd. | (175,000 | ) | (1,196,139 | ) | 64,067 | |||||||
| Esprit Holdings Ltd. | (268,800 | ) | (266,976 | ) | (28,915 | ) | ||||||
| Galaxy Entertainment Group Ltd. | (127,000 | ) | (361,974 | ) | (35,958 | ) | ||||||
| Hang Lung Properties Ltd. | (28,000 | ) | (64,940 | ) | 1,496 | |||||||
| HKT Trust & HKT Ltd. | (193,000 | ) | (236,600 | ) | (9,785 | ) | ||||||
| Hong Kong & China Gas Co., Ltd. | (834,300 | ) | (1,641,512 | ) | 8,753 | |||||||
| Hysan Development Co., Ltd. | (52,000 | ) | (214,749 | ) | 2,295 | |||||||
| REFERENCE ENTITY | SHARES | NOTIONAL (a) | NET UNREALIZED APPRECIATION (DEPRECIATION) | |||||||||
| Hong Kong (continued) | ||||||||||||
| MGM China Holdings Ltd. | (411,600 | ) | $ | (621,485 | ) | $ | 109,919 | |||||
| MTR Corp. Ltd. | (39,500 | ) | (193,558 | ) | (1,486 | ) | ||||||
| Sands China Ltd. | (73,200 | ) | (243,289 | ) | (4,873 | ) | ||||||
| Swire Properties Ltd. | (81,000 | ) | (240,636 | ) | 7,733 | |||||||
| Value Partners Group Ltd. | (373,000 | ) | (425,664 | ) | (7,892 | ) | ||||||
| Wharf Holdings Ltd./The | (24,000 | ) | (133,680 | ) | 1,357 | |||||||
| Wynn Macau Ltd. | (190,000 | ) | (221,745 | ) | 1,005 | |||||||
|
| |||||||||||
| 68,017 | ||||||||||||
|
| |||||||||||
| United States | ||||||||||||
| Samsonite International SA | (139,200 | ) | (457,448 | ) | 40,268 | |||||||
|
| |||||||||||
Total of Short Equity Positions | 108,285 | |||||||||||
|
| |||||||||||
Total of Long and Short Equity Positions | (60,050 | ) | ||||||||||
|
| |||||||||||
Net Cash and Other Receivables/ (Payables) (b) | 11,919 | |||||||||||
|
| |||||||||||
Swaps, at Value | $ | (48,131 | ) | |||||||||
|
| |||||||||||
| (a) | Notional value represents the market value (including any fees or commissions) of the long and short positions when they are established. |
| (b) | Cash and other receivables/(payables) includes the gains (or losses) realized within the swap when the swap resets. |
Collateral pledged to, or (received from), each counterparty at December 31, 2015 was as follows:
| COUNTERPARTY | OVER THE COUNTER | EXCHANGE TRADED/ CENTRALLY CLEARED | TOTAL | |||||||||
| CitiBank | ||||||||||||
| Money Market Funds | $260,000 | $— | $260,000 | |||||||||
| ||||||||||||
| Morgan Stanley Capital Services, Inc. | ||||||||||||
| Money Market Funds | 44,640,000 | — | 44,640,000 | |||||||||
| ||||||||||||
| The accompanying notes are an integral part of these financial statements. |
| AQR Funds | Annual Report | December 2015 | ||||||||||||||
87
Table of Contents
| Consolidated Schedule of Investments | December 31, 2015 |
| AQR GLOBAL MACRO FUND |
| MONEY MARKET FUNDS - 32.3% | SHARES | VALUE (Note 5) | ||||||
| J.P. Morgan U.S. Treasury Plus Money Market Fund - IM Shares, 0.129% ^(a)(b) | 16,864,870 | $ | 16,864,870 | |||||
| J.P. Morgan U.S. Treasury Plus Money Market Fund - Institutional Shares, 0.070% ^(a)(b) | 60,001 | 60,001 | ||||||
|
| |||||||
TOTAL MONEY MARKET FUNDS | 16,924,871 | |||||||
|
| |||||||
| SHORT-TERM INVESTMENTS - 57.0% |
| PRINCIPAL AMOUNT (000’s | ) | |||||
| U.S. Treasury Bill, 0.327%, 5/19/2016 ^(c) | $ | 29,914 | 29,876,219 | |||||
|
| |||||||
TOTAL SHORT-TERM INVESTMENTS | 29,876,219 | |||||||
|
| |||||||
TOTAL INVESTMENTS IN SECURITIES, AT VALUE - 89.3% | 46,801,090 | |||||||
|
| |||||||
| OTHER ASSETS IN EXCESS OF LIABILITIES - 10.7% (d) | 5,594,253 | |||||||
|
| |||||||
| NET ASSETS - 100.0% | $52,395,343 | |||||||
|
| |||||||
| (a) | Represents annualized seven-day yield as of the close of the reporting period. |
| (b) | All or a portion of the security is pledged as collateral to the brokers for forward foreign currency exchange and swap contracts. |
| (c) | The rate shown is the effective yield at the date of purchase. |
| (d) | Includes appreciation/(depreciation) on forward foreign currency exchange, futures and swap contracts. |
| ^ | All or a portion represents positions held in the respective Subsidiary (See Note 2). |
All securities are Level 2 with respect to ASC 820 (See Note 5).
Forward effective interest rate swap contracts outstanding as of December 31, 2015:
| COUNTERPARTY | PAYMENTS MADE BY THE FUND | PAYMENTS RECEIVED BY THE FUND | CURRENCY | NOTIONAL AMOUNT | UPFRONT PREMIUM (RECEIVED) PAID | TERMINATION DATE | UNREALIZED APPRECIATION (DEPRECIATION) | |||||||||||||||||
| Exchange Cleared | ||||||||||||||||||||||||
| Credit Suisse International | 2.000% | (1) | AUD | 2,890,000 | $561 | 03/08/2018 | $6,597 | |||||||||||||||||
| Credit Suisse International | 2.000% | (1) | AUD | 9,630,000 | 5,403 | 03/08/2018 | 18,451 | |||||||||||||||||
| Credit Suisse International | 2.000% | (1) | AUD | 6,400,000 | (1,015 | ) | 03/08/2018 | 16,868 | ||||||||||||||||
| Credit Suisse International | 2.000% | (1) | AUD | 2,900,000 | 953 | 03/08/2018 | 6,230 | |||||||||||||||||
| Credit Suisse International | 2.000% | (1) | AUD | 10,300,000 | (5,420 | ) | 03/08/2018 | 30,934 | ||||||||||||||||
| Credit Suisse International | 2.000% | (1) | AUD | 3,090,000 | 1,697 | 03/08/2018 | 5,957 | |||||||||||||||||
| Credit Suisse International | 2.000% | (1) | AUD | 7,950,000 | (2,226 | ) | 03/08/2018 | 21,919 | ||||||||||||||||
| Credit Suisse International | 2.000% | (1) | AUD | 2,940,000 | (509 | ) | 03/08/2018 | 7,791 | ||||||||||||||||
| Credit Suisse International | (1) | 2.000 | % | AUD | 3,100,000 | (6,699 | ) | 03/08/2018 | (980 | ) | ||||||||||||||
| Credit Suisse International | (1) | 2.000 | % | AUD | 2,800,000 | (7,691 | ) | 03/08/2018 | 755 | |||||||||||||||
| Credit Suisse International | (1) | 2.000 | % | AUD | 8,300,000 | (181 | ) | 03/08/2018 | (20,378 | ) | ||||||||||||||
| Credit Suisse International | 3.000% | (2) | AUD | 1,870,000 | 9,874 | 03/12/2026 | (541 | ) | ||||||||||||||||
| Credit Suisse International | 3.000% | (2) | AUD | 700,000 | 1,314 | 03/12/2026 | 2,179 | |||||||||||||||||
| The accompanying notes are an integral part of these financial statements. | (Continued) |
| AQR Funds | Annual Report | December 2015 | ||||||||||||||
88
Table of Contents
| Consolidated Schedule of Investments | December 31, 2015 |
| AQR GLOBAL MACRO FUND |
| COUNTERPARTY | PAYMENTS MADE BY THE FUND | PAYMENTS RECEIVED BY THE FUND | CURRENCY | NOTIONAL AMOUNT | UPFRONT PREMIUM (RECEIVED) PAID | TERMINATION DATE | UNREALIZED APPRECIATION (DEPRECIATION) | |||||||||||||||||
| Credit Suisse International | (2) | 3.000 | % | AUD | 2,300,000 | $ 5,083 | 03/12/2026 | $ (16,562 | ) | |||||||||||||||
| Credit Suisse International | (2) | 3.000 | % | AUD | 1,800,000 | (1,654 | ) | 03/12/2026 | (7,329 | ) | ||||||||||||||
| Credit Suisse International | (2) | 3.000 | % | AUD | 2,210,000 | (5,417 | ) | 03/12/2026 | (5,613 | ) | ||||||||||||||
| Credit Suisse International | (2) | 3.000 | % | AUD | 670,000 | (6,594 | ) | 03/12/2026 | 3,250 | |||||||||||||||
| Credit Suisse International | (2) | 3.000 | % | AUD | 660,000 | 2,715 | 03/12/2026 | (6,009 | ) | |||||||||||||||
| Credit Suisse International | (2) | 3.000 | % | AUD | 660,000 | (7,008 | ) | 03/12/2026 | 3,714 | |||||||||||||||
| Credit Suisse International | (2) | 3.000 | % | AUD | 1,500,000 | 57 | 03/12/2026 | (7,544 | ) | |||||||||||||||
| Credit Suisse International | 1.000% | (4) | CAD | 3,090,000 | (7,903 | ) | 03/19/2018 | 1,222 | ||||||||||||||||
| Credit Suisse International | 1.000% | (4) | CAD | 3,080,000 | (7,911 | ) | 03/19/2018 | 1,252 | ||||||||||||||||
| Credit Suisse International | 1.000% | (4) | CAD | 2,700,000 | (6,939 | ) | 03/19/2018 | 1,102 | ||||||||||||||||
| Credit Suisse International | 2.000% | (4) | CAD | 590,000 | 5,214 | 03/16/2026 | (8,232 | ) | ||||||||||||||||
| Credit Suisse International | 2.000% | (4) | CAD | 600,000 | (2,594 | ) | 03/16/2026 | (476 | ) | |||||||||||||||
| Credit Suisse International | 2.000% | (4) | CAD | 160,000 | 52 | 03/16/2026 | (870 | ) | ||||||||||||||||
| Credit Suisse International | 2.000% | (4) | CAD | 590,000 | 3,133 | 03/16/2026 | (6,152 | ) | ||||||||||||||||
| Credit Suisse International | 2.000% | (4) | CAD | 600,000 | 1,135 | 03/16/2026 | (4,205 | ) | ||||||||||||||||
| Credit Suisse International | 2.000% | (4) | CAD | 2,000,000 | 10,969 | 03/16/2026 | (21,202 | ) | ||||||||||||||||
| Credit Suisse International | 2.000% | (4) | CAD | 600,000 | (3,193 | ) | 03/16/2026 | 122 | ||||||||||||||||
| Credit Suisse International | 2.000% | (4) | CAD | 600,000 | (1,104 | ) | 03/16/2026 | (1,966 | ) | |||||||||||||||
| Credit Suisse International | (4) | 1.000 | % | CAD | 700,000 | 1,296 | 03/19/2018 | 217 | ||||||||||||||||
| Credit Suisse International | (4) | 1.000 | % | CAD | 2,670,000 | 4,411 | 03/19/2018 | 1,362 | ||||||||||||||||
| Credit Suisse International | (4) | 1.000 | % | CAD | 2,700,000 | 5,367 | 03/19/2018 | 470 | ||||||||||||||||
| Credit Suisse International | (4) | 1.000 | % | CAD | 2,800,000 | 5,996 | 03/19/2018 | 57 | ||||||||||||||||
| Credit Suisse International | (4) | 1.000 | % | CAD | 2,700,000 | 4,589 | 03/19/2018 | 1,248 | ||||||||||||||||
| Credit Suisse International | (4) | 1.000 | % | CAD | 2,700,000 | 3,920 | 03/19/2018 | 1,917 | ||||||||||||||||
| Credit Suisse International | (4) | 1.000 | % | CAD | 12,100,000 | 6,125 | 03/19/2018 | 20,034 | ||||||||||||||||
| Credit Suisse International | (4) | 1.000 | % | CAD | 2,600,000 | 4,027 | 03/19/2018 | 1,594 | ||||||||||||||||
| Credit Suisse International | (4) | 2.000 | % | CAD | 670,000 | (2,337 | ) | 03/16/2026 | 5,765 | |||||||||||||||
| The accompanying notes are an integral part of these financial statements. | (Continued) |
| AQR Funds | Annual Report | December 2015 | ||||||||||||||
89
Table of Contents
| Consolidated Schedule of Investments | December 31, 2015 |
| AQR GLOBAL MACRO FUND |
| COUNTERPARTY | PAYMENTS MADE BY THE FUND | PAYMENTS RECEIVED BY THE FUND | CURRENCY | NOTIONAL AMOUNT | UPFRONT PREMIUM (RECEIVED) PAID | TERMINATION DATE | UNREALIZED APPRECIATION (DEPRECIATION) | |||||||||||||||||
| Credit Suisse International | (4) | 2.000 | % | CAD | 670,000 | $ (2,032 | ) | 03/16/2026 | $ 5,460 | |||||||||||||||
| Credit Suisse International | 0.250% | (6) | CHF | 17,420,000 | 140,101 | 03/18/2026 | (92,493 | ) | ||||||||||||||||
| Credit Suisse International | 0.250% | (6) | CHF | 11,620,000 | 91,763 | 03/18/2026 | (60,006 | ) | ||||||||||||||||
| Credit Suisse International | 0.500% | (6) | CHF | 9,300,000 | (27,407 | ) | 03/21/2018 | 2,193 | ||||||||||||||||
| Credit Suisse International | 0.500% | (6) | CHF | 11,700,000 | (47,294 | ) | 03/21/2018 | 15,572 | ||||||||||||||||
| Credit Suisse International | 0.500% | (6) | CHF | 2,500,000 | (3,677 | ) | 03/21/2018 | (3,101 | ) | |||||||||||||||
| Credit Suisse International | 0.500% | (6) | CHF | 2,290,000 | (5,105 | ) | 03/21/2018 | (1,104 | ) | |||||||||||||||
| Credit Suisse International | 0.500% | (6) | CHF | 3,720,000 | (6,478 | ) | 03/21/2018 | (3,608 | ) | |||||||||||||||
| Credit Suisse International | 0.750% | (6) | CHF | 3,500,000 | (4,532 | ) | 03/21/2018 | 13,053 | ||||||||||||||||
| Credit Suisse International | 0.750% | (6) | CHF | 3,300,000 | 3,847 | 03/21/2018 | 4,187 | |||||||||||||||||
| Credit Suisse International | (6) | 0.250 | % | CHF | 1,800,000 | (5,884 | ) | 03/18/2026 | 965 | |||||||||||||||
| Credit Suisse International | (6) | 0.250 | % | CHF | 470,000 | 2,175 | 03/18/2026 | (3,460 | ) | |||||||||||||||
| Credit Suisse International | (6) | 0.250 | % | CHF | 400,000 | 6,212 | 03/18/2026 | (7,305 | ) | |||||||||||||||
| Credit Suisse International | (6) | 0.250 | % | CHF | 620,000 | (2,285 | ) | 03/18/2026 | 591 | |||||||||||||||
| Credit Suisse International | (6) | 0.250 | % | CHF | 400,000 | (8,685 | ) | 03/18/2026 | 7,592 | |||||||||||||||
| Credit Suisse International | (6) | 0.250 | % | CHF | 2,600,000 | (229 | ) | 03/18/2026 | (6,877 | ) | ||||||||||||||
| Credit Suisse International | (6) | 0.250 | % | CHF | 600,000 | 14,484 | 03/18/2026 | (16,124 | ) | |||||||||||||||
| Credit Suisse International | (6) | 0.500 | % | CHF | 86,290,000 | 152,099 | 03/21/2018 | 81,855 | ||||||||||||||||
| Credit Suisse International | (6) | 0.500 | % | CHF | 57,520,000 | 99,514 | 03/21/2018 | 56,437 | ||||||||||||||||
| Credit Suisse International | 0.500% | (5) | EUR | 144,030,000 | (936,108 | ) | 03/21/2018 | (697,939 | ) | |||||||||||||||
| Credit Suisse International | 1.000% | (5) | EUR | 600,000 | (3,437 | ) | �� | 03/18/2026 | 6,683 | |||||||||||||||
| Credit Suisse International | 1.000% | (5) | EUR | 500,000 | (6,118 | ) | 03/18/2026 | 8,823 | ||||||||||||||||
| Credit Suisse International | 1.000% | (5) | EUR | 400,000 | 7,950 | 03/18/2026 | (5,786 | ) | ||||||||||||||||
| Credit Suisse International | 1.000% | (5) | EUR | 400,000 | 2,595 | 03/18/2026 | (431 | ) | ||||||||||||||||
| Credit Suisse International | 1.000% | (5) | EUR | 500,000 | 1,904 | 03/18/2026 | 802 | |||||||||||||||||
| Credit Suisse International | 1.000% | (5) | EUR | 500,000 | 3,425 | 03/18/2026 | (720 | ) | ||||||||||||||||
| Credit Suisse International | 1.000% | (5) | EUR | 200,000 | (2,139 | ) | 03/18/2026 | 3,221 | ||||||||||||||||
| Credit Suisse International | 1.000% | (5) | EUR | 380,000 | 2,606 | 03/18/2026 | (550 | ) | ||||||||||||||||
| The accompanying notes are an integral part of these financial statements. | (Continued) |
| AQR Funds | Annual Report | December 2015 | ||||||||||||||
90
Table of Contents
| Consolidated Schedule of Investments | December 31, 2015 |
| AQR GLOBAL MACRO FUND |
| COUNTERPARTY | PAYMENTS MADE BY THE FUND | PAYMENTS RECEIVED BY THE FUND | CURRENCY | NOTIONAL AMOUNT | UPFRONT PREMIUM (RECEIVED) PAID | TERMINATION DATE | UNREALIZED APPRECIATION (DEPRECIATION) | |||||||||||||||||
| Credit Suisse International | 1.000% | (5) | EUR | 2,030,000 | $ 12,795 | 03/18/2026 | $ (1,811 | ) | ||||||||||||||||
| Credit Suisse International | 1.000% | (5) | EUR | 370,000 | 2,978 | 03/18/2026 | (976 | ) | ||||||||||||||||
| Credit Suisse International | 1.000% | (5) | EUR | 200,000 | (2,093 | ) | 03/18/2026 | 3,175 | ||||||||||||||||
| Credit Suisse International | 1.000% | (5) | EUR | 700,000 | 4,552 | 03/18/2026 | (765 | ) | ||||||||||||||||
| Credit Suisse International | 1.000% | (5) | EUR | 1,200,000 | (4,888 | ) | 03/18/2026 | 11,381 | ||||||||||||||||
| Credit Suisse International | (5) | 0.500 | % | EUR | 1,860,000 | 15,808 | 03/21/2018 | 5,294 | ||||||||||||||||
| Credit Suisse International | (5) | 0.500 | % | EUR | 1,500,000 | 15,079 | 03/21/2018 | 1,939 | ||||||||||||||||
| Credit Suisse International | (5) | 0.500 | % | EUR | 2,490,000 | 20,612 | 03/21/2018 | 7,637 | ||||||||||||||||
| Credit Suisse International | (5) | 0.500 | % | EUR | 1,300,000 | 17,251 | 03/21/2018 | (2,502 | ) | |||||||||||||||
| Credit Suisse International | (5) | 0.500 | % | EUR | 8,400,000 | 75,244 | 03/21/2018 | 20,055 | ||||||||||||||||
| Credit Suisse International | (5) | 0.500 | % | EUR | 2,600,000 | 27,399 | 03/21/2018 | 2,099 | ||||||||||||||||
| Credit Suisse International | (5) | 0.500 | % | EUR | 3,410,000 | 24,761 | 03/21/2018 | 13,926 | ||||||||||||||||
| Credit Suisse International | (5) | 0.500 | % | EUR | 1,900,000 | 15,638 | 03/21/2018 | 5,918 | ||||||||||||||||
| Credit Suisse International | (5) | 0.500 | % | EUR | 4,500,000 | 50,001 | 03/21/2018 | 1,052 | ||||||||||||||||
| Credit Suisse International | (5) | 0.500 | % | EUR | 1,800,000 | 15,304 | 03/21/2018 | 5,117 | ||||||||||||||||
| Credit Suisse International | (5) | 0.500 | % | EUR | 1,900,000 | 24,699 | 03/21/2018 | (3,143 | ) | |||||||||||||||
| Credit Suisse International | (5) | 0.500 | % | EUR | 6,000,000 | 70,792 | 03/21/2018 | (2,721 | ) | |||||||||||||||
| Credit Suisse International | (5) | 0.500 | % | EUR | 1,000,000 | 10,118 | 03/21/2018 | 1,227 | ||||||||||||||||
| Credit Suisse International | (5) | 0.500 | % | EUR | 1,780,000 | 12,850 | 03/21/2018 | 7,344 | ||||||||||||||||
| Credit Suisse International | (5) | 1.000 | % | EUR | 30,330,000 | (482,532 | ) | 03/18/2026 | 318,433 | |||||||||||||||
| Credit Suisse International | 1.500% | (6) | GBP | 2,100,000 | (22,779 | ) | 03/21/2018 | 3,204 | ||||||||||||||||
| Credit Suisse International | 1.500% | (6) | GBP | 1,700,000 | (14,839 | ) | 03/21/2018 | (1,008 | ) | |||||||||||||||
| Credit Suisse International | 2.000% | (6) | GBP | 120,000 | (1,489 | ) | 03/18/2026 | 2,161 | ||||||||||||||||
| Credit Suisse International | 2.000% | (6) | GBP | 15,090,000 | 220,329 | 03/18/2026 | (135,861 | ) | ||||||||||||||||
| Credit Suisse International | 2.000% | (6) | GBP | 170,000 | (2,127 | ) | 03/18/2026 | 3,079 | ||||||||||||||||
| Credit Suisse International | 2.000% | (6) | GBP | 300,000 | (2,931 | ) | 03/18/2026 | 4,610 | ||||||||||||||||
| Credit Suisse International | 2.000% | (6) | GBP | 440,000 | 989 | 03/18/2026 | 1,474 | |||||||||||||||||
| Credit Suisse International | 2.000% | (6) | GBP | 370,000 | (2,842 | ) | 03/18/2026 | 4,913 | ||||||||||||||||
| The accompanying notes are an integral part of these financial statements. | (Continued) |
| AQR Funds | Annual Report | December 2015 | ||||||||||||||
91
Table of Contents
| Consolidated Schedule of Investments | December 31, 2015 |
| AQR GLOBAL MACRO FUND |
| COUNTERPARTY | PAYMENTS MADE BY THE FUND | PAYMENTS RECEIVED BY THE FUND | CURRENCY | NOTIONAL AMOUNT | UPFRONT PREMIUM (RECEIVED) PAID | TERMINATION DATE | UNREALIZED APPRECIATION (DEPRECIATION) | |||||||||||||||||
| Credit Suisse International | 2.000% | (6) | GBP | 710,000 | $ 5,163 | 03/18/2026 | $ (1,189 | ) | ||||||||||||||||
| Credit Suisse International | (6) | 1.500 | % | GBP | 1,310,000 | 9,406 | 03/21/2018 | 2,805 | ||||||||||||||||
| Credit Suisse International | (6) | 1.500 | % | GBP | 2,960,000 | 22,068 | 03/21/2018 | 5,524 | ||||||||||||||||
| Credit Suisse International | (6) | 1.500 | % | GBP | 1,300,000 | 14,224 | 03/21/2018 | (2,106 | ) | |||||||||||||||
| Credit Suisse International | (6) | 1.500 | % | GBP | 1,230,000 | 13,392 | 03/21/2018 | (1,926 | ) | |||||||||||||||
| Credit Suisse International | (6) | 1.500 | % | GBP | 810,000 | 8,884 | 03/21/2018 | (1,333 | ) | |||||||||||||||
| Credit Suisse International | (6) | 1.500 | % | GBP | 1,310,000 | 15,166 | 03/21/2018 | (2,955 | ) | |||||||||||||||
| Credit Suisse International | (6) | 1.500 | % | GBP | 69,190,000 | 406,719 | 03/21/2018 | 238,237 | ||||||||||||||||
| Credit Suisse International | (6) | 2.000 | % | GBP | 500,000 | 2,719 | 03/18/2026 | (5,518 | ) | |||||||||||||||
| Credit Suisse International | (6) | 2.000 | % | GBP | 400,000 | 9,022 | 03/18/2026 | (11,261 | ) | |||||||||||||||
| Credit Suisse International | (6) | 2.000 | % | GBP | 300,000 | (1,371 | ) | 03/18/2026 | (308 | ) | ||||||||||||||
| Credit Suisse International | 0.250% | (6) | JPY | 30,000,000 | (775 | ) | 03/22/2018 | 51 | ||||||||||||||||
| Credit Suisse International | 0.250% | (6) | JPY | 16,015,700,000 | (268,547 | ) | 03/22/2018 | (122,311 | ) | |||||||||||||||
| Credit Suisse International | 0.250% | (6) | JPY | 329,740,000 | (6,370 | ) | 03/22/2018 | (1,677 | ) | |||||||||||||||
| Credit Suisse International | 0.250% | (6) | JPY | 239,670,000 | (4,565 | ) | 03/22/2018 | (1,284 | ) | |||||||||||||||
| Credit Suisse International | 0.250% | (6) | JPY | 238,790,000 | (5,173 | ) | 03/22/2018 | (655 | ) | |||||||||||||||
| Credit Suisse International | 0.500% | (6) | JPY | 60,000,000 | (1,211 | ) | 03/18/2026 | (1,530 | ) | |||||||||||||||
| Credit Suisse International | 0.500% | (6) | JPY | 50,000,000 | (128 | ) | 03/18/2026 | (2,156 | ) | |||||||||||||||
| Credit Suisse International | 0.750% | (6) | JPY | 60,000,000 | (10,929 | ) | 03/18/2026 | (4,885 | ) | |||||||||||||||
| Credit Suisse International | 0.750% | (6) | JPY | 480,000,000 | (91,128 | ) | 03/18/2026 | (35,385 | ) | |||||||||||||||
| Credit Suisse International | (6) | 0.250 | % | JPY | 2,340,000,000 | 54,747 | 03/22/2018 | 1,728 | ||||||||||||||||
| Credit Suisse International | (6) | 0.250 | % | JPY | 240,000,000 | 5,632 | 03/22/2018 | 160 | ||||||||||||||||
| Credit Suisse International | (6) | 0.250 | % | JPY | 250,000,000 | 5,687 | 03/22/2018 | 346 | ||||||||||||||||
| Credit Suisse International | (6) | 0.250 | % | JPY | 22,170,000 | 489 | 03/22/2018 | 46 | ||||||||||||||||
| Credit Suisse International | (6) | 0.250 | % | JPY | 240,000,000 | 5,316 | 03/22/2018 | 476 | ||||||||||||||||
| Credit Suisse International | (6) | 0.750 | % | JPY | 49,400,000 | 6,540 | 03/18/2026 | 6,480 | ||||||||||||||||
| Credit Suisse International | (6) | 0.750 | % | JPY | 53,670,000 | 5,551 | 03/18/2026 | 8,595 | ||||||||||||||||
| Credit Suisse International | (6) | 0.750 | % | JPY | 3,310,350,000 | 303,094 | 03/18/2026 | 569,410 | ||||||||||||||||
| The accompanying notes are an integral part of these financial statements. | (Continued) |
| AQR Funds | Annual Report | December 2015 | ||||||||||||||
92
Table of Contents
| Consolidated Schedule of Investments | December 31, 2015 |
| AQR GLOBAL MACRO FUND |
| COUNTERPARTY | PAYMENTS MADE BY THE FUND | PAYMENTS RECEIVED BY THE FUND | CURRENCY | NOTIONAL AMOUNT | UPFRONT PREMIUM (RECEIVED) PAID | TERMINATION DATE | UNREALIZED APPRECIATION (DEPRECIATION) | |||||||||||||||||
| Credit Suisse International | (6) | 0.750 | % | JPY | 33,250,000 | $ 5,324 | 03/18/2026 | $ 3,440 | ||||||||||||||||
| Credit Suisse International | 1.000% | (7) | NOK | 16,850,000 | 2,301 | 03/21/2018 | (4,946 | ) | ||||||||||||||||
| Credit Suisse International | 1.000% | (7) | NOK | 16,650,000 | 2,164 | 03/21/2018 | (4,777 | ) | ||||||||||||||||
| Credit Suisse International | 1.000% | (7) | NOK | 29,000,000 | (4,123 | ) | 03/21/2018 | (428 | ) | |||||||||||||||
| Credit Suisse International | 1.000% | (7) | NOK | 50,750,000 | 3,281 | 03/21/2018 | (11,246 | ) | ||||||||||||||||
| Credit Suisse International | 1.000% | (7) | NOK | 17,510,000 | (1,072 | ) | 03/21/2018 | (1,676 | ) | |||||||||||||||
| Credit Suisse International | 1.000% | (7) | NOK | 50,750,000 | 652 | 03/21/2018 | (8,617 | ) | ||||||||||||||||
| Credit Suisse International | 1.000% | (7) | NOK | 19,100,000 | (1,864 | ) | 03/21/2018 | (1,134 | ) | |||||||||||||||
| Credit Suisse International | 1.000% | (7) | NOK | 1,370,000 | (252 | ) | 03/21/2018 | 37 | ||||||||||||||||
| Credit Suisse International | 1.000% | (7) | NOK | 32,900,000 | (276 | ) | 03/21/2018 | (4,888 | ) | |||||||||||||||
| Credit Suisse International | 1.000% | (7) | NOK | 16,500,000 | 1,857 | 03/21/2018 | (4,447 | ) | ||||||||||||||||
| Credit Suisse International | 1.000% | (7) | NOK | 16,730,000 | 2,406 | 03/21/2018 | (5,032 | ) | ||||||||||||||||
| Credit Suisse International | 2.000% | (7) | NOK | 4,400,000 | (1,551 | ) | 03/18/2026 | (2,968 | ) | |||||||||||||||
| Credit Suisse International | 2.000% | (7) | NOK | 800,000 | (1,652 | ) | 03/18/2026 | 830 | ||||||||||||||||
| Credit Suisse International | (7) | 2.000 | % | NOK | 3,960,000 | (5,930 | ) | 03/18/2026 | 9,997 | |||||||||||||||
| Credit Suisse International | (7) | 2.000 | % | NOK | 11,060,000 | (19,040 | ) | 03/18/2026 | 30,398 | |||||||||||||||
| Credit Suisse International | (7) | 2.000 | % | NOK | 11,060,000 | (5,863 | ) | 03/18/2026 | 17,221 | |||||||||||||||
| Credit Suisse International | (7) | 2.000 | % | NOK | 4,100,000 | 195 | 03/18/2026 | 4,016 | ||||||||||||||||
| Credit Suisse International | (7) | 2.000 | % | NOK | 3,700,000 | (6,816 | ) | 03/18/2026 | 10,616 | |||||||||||||||
| Credit Suisse International | (7) | 2.000 | % | NOK | 3,700,000 | 3,335 | 03/18/2026 | 465 | ||||||||||||||||
| Credit Suisse International | (7) | 2.000 | % | NOK | 10,000,000 | 10,460 | 03/18/2026 | (190 | ) | |||||||||||||||
| Credit Suisse International | (7) | 2.000 | % | NOK | 4,110,000 | (5,166 | ) | 03/18/2026 | 9,387 | |||||||||||||||
| Credit Suisse International | (7) | 2.000 | % | NOK | 4,000,000 | 878 | 03/18/2026 | 3,230 | ||||||||||||||||
| Credit Suisse International | (7) | 2.000 | % | NOK | 3,900,000 | (1,251 | ) | 03/18/2026 | 5,256 | |||||||||||||||
| Credit Suisse International | (1) | 3.000 | % | NZD | 3,100,000 | 10,614 | 03/14/2018 | (6,845 | ) | |||||||||||||||
| Credit Suisse International | (1) | 3.000 | % | NZD | 6,720,000 | 19,984 | 03/14/2018 | (11,813 | ) | |||||||||||||||
| Credit Suisse International | (1) | 3.000 | % | NZD | 3,200,000 | 7,889 | 03/14/2018 | (3,998 | ) | |||||||||||||||
| Credit Suisse International | (1) | 3.000 | % | NZD | 4,100,000 | 14,006 | 03/14/2018 | (9,021 | ) | |||||||||||||||
| The accompanying notes are an integral part of these financial statements. | (Continued) |
| AQR Funds | Annual Report | December 2015 | ||||||||||||||
93
Table of Contents
| Consolidated Schedule of Investments | December 31, 2015 |
| AQR GLOBAL MACRO FUND |
| COUNTERPARTY | PAYMENTS MADE BY THE FUND | PAYMENTS RECEIVED BY THE FUND | CURRENCY | NOTIONAL AMOUNT | UPFRONT PREMIUM (RECEIVED) PAID | TERMINATION DATE | UNREALIZED APPRECIATION (DEPRECIATION) | |||||||||||||||||
| Credit Suisse International | (1) | 3.000 | % | NZD | 49,420,000 | $ 71,466 | 03/14/2018 | $ (11,376 | ) | |||||||||||||||
| Credit Suisse International | (1) | 3.000 | % | NZD | 160,000 | 453 | 03/14/2018 | (258 | ) | |||||||||||||||
| Credit Suisse International | (1) | 3.000 | % | NZD | 4,400,000 | 12,207 | 03/14/2018 | (6,857 | ) | |||||||||||||||
| Credit Suisse International | (1) | 3.000 | % | NZD | 21,460,000 | 21,342 | 03/14/2018 | 4,752 | ||||||||||||||||
| Credit Suisse International | (1) | 3.000 | % | NZD | 49,420,000 | 103,842 | 03/14/2018 | (43,752 | ) | |||||||||||||||
| Credit Suisse International | (1) | 3.000 | % | NZD | 3,630,000 | 11,798 | 03/14/2018 | (7,384 | ) | |||||||||||||||
| Credit Suisse International | (1) | 3.500 | % | NZD | 700,000 | (11,760 | ) | 03/11/2026 | (383 | ) | ||||||||||||||
| Credit Suisse International | 3.500% | (1) | NZD | 700,000 | 2,704 | 03/11/2026 | 9,439 | |||||||||||||||||
| Credit Suisse International | 3.500% | (1) | NZD | 900,000 | 9,915 | 03/11/2026 | 5,698 | |||||||||||||||||
| Credit Suisse International | 3.500% | (1) | NZD | 5,600,000 | 73,611 | 03/11/2026 | 23,536 | |||||||||||||||||
| Credit Suisse International | 3.500% | (1) | NZD | 770,000 | 3,934 | 03/11/2026 | 9,424 | |||||||||||||||||
| Credit Suisse International | 3.500% | (1) | NZD | 1,710,000 | 18,721 | 03/11/2026 | 10,943 | |||||||||||||||||
| Credit Suisse International | 3.500% | (1) | NZD | 11,340,000 | 80,896 | 03/11/2026 | 115,827 | |||||||||||||||||
| Credit Suisse International | 3.500% | (1) | NZD | 1,000,000 | 5,418 | 03/11/2026 | 11,930 | |||||||||||||||||
| Credit Suisse International | 3.500% | (1) | NZD | 900,000 | 6,952 | 03/11/2026 | 8,661 | |||||||||||||||||
| Credit Suisse International | 3.500% | (1) | NZD | 11,340,000 | 118,499 | 03/11/2026 | 78,224 | |||||||||||||||||
| Credit Suisse International | 0.500% | (8) | SEK | 15,490,000 | (16,764 | ) | 03/21/2018 | (3,937 | ) | |||||||||||||||
| Credit Suisse International | 0.500% | (8) | SEK | 17,730,000 | (18,912 | ) | 03/21/2018 | (4,783 | ) | |||||||||||||||
| Credit Suisse International | 0.500% | (8) | SEK | 26,200,000 | (36,267 | ) | 03/21/2018 | 1,253 | ||||||||||||||||
| Credit Suisse International | 0.500% | (8) | SEK | 16,770,000 | (19,000 | ) | 03/21/2018 | (3,412 | ) | |||||||||||||||
| Credit Suisse International | 0.500% | (8) | SEK | 119,900,000 | (189,495 | ) | 03/21/2018 | 29,257 | ||||||||||||||||
| Credit Suisse International | 0.500% | (8) | SEK | 16,500,000 | (18,250 | ) | 03/21/2018 | (3,801 | ) | |||||||||||||||
| Credit Suisse International | 0.500% | (8) | SEK | 17,300,000 | (23,312 | ) | 03/21/2018 | 192 | ||||||||||||||||
| Credit Suisse International | 0.500% | (8) | SEK | 16,900,000 | (23,628 | ) | 03/21/2018 | 1,042 | ||||||||||||||||
| Credit Suisse International | 0.500% | (8) | SEK | 34,100,000 | (46,415 | ) | 03/21/2018 | 843 | ||||||||||||||||
| Credit Suisse International | 0.500% | (8) | SEK | 16,200,000 | (18,716 | ) | 03/21/2018 | (2,934 | ) | |||||||||||||||
| Credit Suisse International | 1.500% | (8) | SEK | 7,000,000 | (3,024 | ) | 03/18/2026 | 18,421 | ||||||||||||||||
| Credit Suisse International | (8) | 0.500 | % | SEK | 32,960,000 | 37,160 | 03/21/2018 | 6,888 | ||||||||||||||||
| The accompanying notes are an integral part of these financial statements. | (Continued) |
| AQR Funds | Annual Report | December 2015 | ||||||||||||||
94
Table of Contents
| Consolidated Schedule of Investments | December 31, 2015 |
| AQR GLOBAL MACRO FUND |
| COUNTERPARTY | PAYMENTS MADE BY THE FUND | PAYMENTS RECEIVED BY THE FUND | CURRENCY | NOTIONAL AMOUNT | UPFRONT PREMIUM (RECEIVED) PAID | TERMINATION DATE | UNREALIZED APPRECIATION (DEPRECIATION) | |||||||||||||||||
| Credit Suisse International | (8) | 1.500 | % | SEK | 26,100,000 | $ 15,224 | 03/18/2026 | $ (72,632 | ) | |||||||||||||||
| Credit Suisse International | (8) | 1.500 | % | SEK | 4,800,000 | (6,565 | ) | 03/18/2026 | (3,993 | ) | ||||||||||||||
| Credit Suisse International | (8) | 1.500 | % | SEK | 3,600,000 | 415 | 03/18/2026 | (8,334 | ) | |||||||||||||||
| Credit Suisse International | (8) | 1.500 | % | SEK | 3,640,000 | 2,599 | 03/18/2026 | (10,606 | ) | |||||||||||||||
| Credit Suisse International | (8) | 1.500 | % | SEK | 3,420,000 | (1,101 | ) | 03/18/2026 | (6,421 | ) | ||||||||||||||
| Credit Suisse International | (8) | 1.500 | % | SEK | 9,700,000 | (1,485 | ) | 03/18/2026 | (19,851 | ) | ||||||||||||||
| Credit Suisse International | (8) | 1.500 | % | SEK | 3,650,000 | 1,315 | 03/18/2026 | (9,343 | ) | |||||||||||||||
| Credit Suisse International | (8) | 1.500 | % | SEK | 30,000 | 14 | 03/18/2026 | (80 | ) | |||||||||||||||
| Credit Suisse International | (8) | 1.500 | % | SEK | 3,800,000 | 429 | 03/18/2026 | (8,787 | ) | |||||||||||||||
| Credit Suisse International | (8) | 1.500 | % | SEK | 3,700,000 | 7,657 | 03/18/2026 | (15,795 | ) | |||||||||||||||
| Credit Suisse International | (8) | 1.500 | % | SEK | 3,600,000 | (745 | ) | 03/18/2026 | (7,173 | ) | ||||||||||||||
| Credit Suisse International | 1.000% | (3) | USD | 2,000,000 | (921 | ) | 03/16/2018 | 12,236 | ||||||||||||||||
| Credit Suisse International | 1.500% | (3) | USD | 2,150,000 | (12,078 | ) | 03/16/2018 | 2,995 | ||||||||||||||||
| Credit Suisse International | 1.500% | (3) | USD | 2,030,000 | (15,887 | ) | 03/16/2018 | 7,311 | ||||||||||||||||
| Credit Suisse International | 1.500% | (3) | USD | 270,000 | (1,375 | ) | 03/16/2018 | 234 | ||||||||||||||||
| Credit Suisse International | 1.500% | (3) | USD | 10,000,000 | (51,653 | ) | 03/16/2018 | 9,406 | ||||||||||||||||
| CitiBank | 2.000% | (3) | USD | 11,560,000 | (184,045 | ) | 03/16/2020 | 31,589 | ||||||||||||||||
| CitiBank | 2.000% | (3) | USD | 23,270,000 | (279,938 | ) | 03/16/2020 | (26,953 | ) | |||||||||||||||
| CitiBank | 2.000% | (3) | USD | 8,900,000 | (130,889 | ) | 03/16/2021 | 45,108 | ||||||||||||||||
| Credit Suisse International | 2.500% | (3) | USD | 300,000 | (9,180 | ) | 03/16/2026 | 1,813 | ||||||||||||||||
| Credit Suisse International | 2.500% | (3) | USD | 520,000 | (19,335 | ) | 03/16/2026 | 6,565 | ||||||||||||||||
| Credit Suisse International | 2.500% | (3) | USD | 10,000 | (326 | ) | 03/16/2026 | 80 | ||||||||||||||||
| Credit Suisse International | 2.500% | (3) | USD | 510,000 | (6,101 | ) | 03/16/2026 | (6,423 | ) | |||||||||||||||
| Credit Suisse International | (3) | 1.500 | % | USD | 2,420,000 | 14,085 | 03/16/2018 | (3,861 | ) | |||||||||||||||
| Credit Suisse International | (3) | 1.500 | % | USD | 2,000,000 | 12,813 | 03/16/2018 | (4,363 | ) | |||||||||||||||
| Credit Suisse International | (3) | 1.500 | % | USD | 500,000 | 3,198 | 03/16/2018 | (1,085 | ) | |||||||||||||||
| Credit Suisse International | (3) | 1.500 | % | USD | 800,000 | 4,814 | 03/16/2018 | (1,434 | ) | |||||||||||||||
| CitiBank | (3) | 2.000 | % | USD | 8,900,000 | 133,539 | 03/16/2021 | (47,758 | ) | |||||||||||||||
| CitiBank | (3) | 2.000 | % | USD | 11,000,000 | 200,586 | 03/16/2020 | (55,515 | ) | |||||||||||||||
| CitiBank | (3) | 2.000 | % | USD | 7,400,000 | 127,069 | 03/16/2020 | (29,475 | ) | |||||||||||||||
| CitiBank | (3) | 2.000 | % | USD | 9,300,000 | 190,721 | 03/16/2020 | (68,070 | ) | |||||||||||||||
| The accompanying notes are an integral part of these financial statements. | (Continued) |
| AQR Funds | Annual Report | December 2015 | ||||||||||||||
95
Table of Contents
| Consolidated Schedule of Investments | December 31, 2015 |
| AQR GLOBAL MACRO FUND |
| COUNTERPARTY | PAYMENTS MADE BY THE FUND | PAYMENTS RECEIVED BY THE FUND | CURRENCY | NOTIONAL AMOUNT | UPFRONT PREMIUM (RECEIVED) PAID | TERMINATION DATE | UNREALIZED APPRECIATION (DEPRECIATION) | |||||||||||||||||
| Credit Suisse International | (3) | 2.500 | % | USD | 450,000 | $ 9,017 | 03/16/2026 | $ 2,033 | ||||||||||||||||
| Credit Suisse International | (3) | 2.500 | % | USD | 450,000 | 4,487 | 03/16/2026 | 6,564 | ||||||||||||||||
| Credit Suisse International | (3) | 2.500 | % | USD | 60,000 | 270 | 03/16/2026 | 1,203 | ||||||||||||||||
| Credit Suisse International | (3) | 2.500 | % | USD | 500,000 | 14,524 | 03/16/2026 | (2,245 | ) | |||||||||||||||
| Credit Suisse International | (3) | 2.500 | % | USD | 2,200,000 | 53,873 | 03/16/2026 | 153 | ||||||||||||||||
|
|
|
| |||||||||||||||||||||
| $337,952 | $250,921 | |||||||||||||||||||||||
|
|
|
| |||||||||||||||||||||
| (1) | 3 Month Australian Bank-Bill Reference Rate |
| (2) | 6 Month Australian Bank-Bill Reference Rate |
| (3) | 3 Month London Interbank Offered Rate |
| (4) | 3 Month Canadian Bankers’ Acceptance Rate |
| (5) | 6 Month Euro Interbank Offered Rate |
| (6) | 6 Month London Interbank Offered Rate |
| (7) | 6 Month Norwegian Interbank Offered Rate |
| (8) | 3 Month Stockholm Interbank Offered Rate |
Total return swap contracts outstanding as of December 31, 2015:
Over the Counter
| COUNTERPARTY | UNDERLYING REFERENCE INSTRUMENT | TERMINATION DATE | CURRENCY | NOTIONAL VALUE | UNREALIZED APPRECIATION (DEPRECIATION) | |||||||||
| Goldman Sachs | BIST 30 February Futures | 02/2016 | TRY | 91,886 | $(963 | ) | ||||||||
| Bank of America | Bovespa Index February Futures | 02/2016 | BRL | (2,528,314 | ) | 29,214 | ||||||||
| Bank of America | H-SHARES Index January Futures | 01/2016 | HKD | 4,460,451 | (12,024 | ) | ||||||||
| Bank of America | KOSPI Index 200 March Futures | 03/2016 | KRW | 119,235,200 | 835 | |||||||||
| CitiBank | Soybean March Futures^ | 02/2016 | USD | (440,233 | ) | 8,108 | ||||||||
| Deutsche Bank | Soybean March Futures^ | 02/2016 | USD | (133,482 | ) | 3,844 | ||||||||
| Macquarie Capital | Soybean March Futures^ | 02/2016 | USD | (87,901 | ) | 1,476 | ||||||||
| Bank of America | Swiss Market Index March Futures | 03/2016 | CHF | 2,633,648 | 78,183 | |||||||||
| Bank of America | Taiwan Stock Exchange January Futures | 01/2016 | TWD | (3,184,070 | ) | (3,843 | ) | |||||||
| Bank of America | Tel Aviv 25 Index January Futures | 01/2016 | ILS | 753,027 | 2,922 | |||||||||
| Bank of America | WIG20 Index March Futures | 03/2016 | PLN | (106,527 | ) | (1,270 | ) | |||||||
|
| |||||||||||||
| $106,482 | ||||||||||||||
|
| |||||||||||||
| ^ | Represents positions held in the respective Subsidiary (See Note 2). |
| The accompanying notes are an integral part of these financial statements. | (Continued) |
| AQR Funds | Annual Report | December 2015 | ||||||||||||||
96
Table of Contents
| Consolidated Schedule of Investments | December 31, 2015 |
| AQR GLOBAL MACRO FUND |
Open futures contracts outstanding at December 31, 2015:
Exchange Traded
| NUMBER OF CONTRACTS | COUNTERPARTY | DESCRIPTION | EXPIRATION DATE | VALUE AT TRADE DATE | VALUE AT DECEMBER 31, 2015 | UNREALIZED APPRECIATION (DEPRECIATION) | ||||||||||||||
| Long Contracts: | ||||||||||||||||||||
| 1 | Morgan Stanley and Co., International PLC | Gold 100 OZ Futures^ | 02/2016 | $107,932 | $106,020 | $(1,912 | ) | |||||||||||||
| 4 | J.P. Morgan | LME Aluminum Futures^ | 01/2016 | 162,597 | 150,270 | (12,327 | ) | |||||||||||||
| 1 | J.P. Morgan | LME Aluminum Futures^ | 01/2016 | 39,611 | 37,585 | (2,026 | ) | |||||||||||||
| 1 | J.P. Morgan | LME Aluminum Futures^ | 02/2016 | 37,398 | 37,706 | 308 | ||||||||||||||
| 3 | J.P. Morgan | LME Aluminum Futures^ | 02/2016 | 110,640 | 113,171 | 2,531 | ||||||||||||||
| 8 | J.P. Morgan | LME Aluminum Futures^ | 02/2016 | 296,980 | 301,826 | 4,846 | ||||||||||||||
| 2 | J.P. Morgan | LME Aluminum Futures^ | 03/2016 | 73,715 | 75,569 | 1,854 | ||||||||||||||
| 1 | J.P. Morgan | LME Aluminum Futures^ | 03/2016 | 36,852 | 37,768 | 916 | ||||||||||||||
| 1 | J.P. Morgan | LME Aluminum Futures^ | 03/2016 | 37,227 | 37,756 | 529 | ||||||||||||||
| 10 | J.P. Morgan | LME Aluminum Futures^ | 03/2016 | 371,988 | 376,937 | 4,949 | ||||||||||||||
| 3 | J.P. Morgan | LME Aluminum Futures^ | 03/2016 | 113,557 | 113,031 | (526 | ) | |||||||||||||
| 1 | J.P. Morgan | LME Copper Futures^ | 01/2016 | 131,075 | 117,745 | (13,330 | ) | |||||||||||||
| 1 | J.P. Morgan | LME Copper Futures^ | 02/2016 | 123,019 | 117,781 | (5,238 | ) | |||||||||||||
| 2 | J.P. Morgan | LME Copper Futures^ | 02/2016 | 232,051 | 235,555 | 3,504 | ||||||||||||||
| 1 | J.P. Morgan | LME Copper Futures^ | 03/2016 | 113,752 | 117,743 | 3,991 | ||||||||||||||
| 1 | J.P. Morgan | LME Copper Futures^ | 03/2016 | 114,302 | 117,706 | 3,404 | ||||||||||||||
| 1 | J.P. Morgan | LME Nickel Futures^ | 02/2016 | 52,843 | 52,838 | (5 | ) | |||||||||||||
| 2 | J.P. Morgan | LME Nickel Futures^ | 03/2016 | 103,481 | 105,768 | 2,287 | ||||||||||||||
| 7 | Barclays Capital | Amsterdam Index Futures | 01/2016 | 657,838 | 672,253 | 14,415 | ||||||||||||||
| 37 | Barclays Capital | BIST 30 Futures | 02/2016 | 116,731 | 113,009 | (3,722 | ) | |||||||||||||
| 170 | Barclays Capital | Euro Stoxx 50 Index | 03/2016 | 5,991,407 | 6,063,413 | 72,006 | ||||||||||||||
| 1 | Barclays Capital | FTSE Bursa Malaysia KLCI Index Futures | 01/2016 | 19,481 | 19,663 | 182 | ||||||||||||||
| 2 | Barclays Capital | H-SHARES Index Futures | 01/2016 | 127,285 | 125,225 | (2,060 | ) | |||||||||||||
| 9 | Barclays Capital | IBEX 35 Index Futures | 01/2016 | 939,179 | 931,744 | (7,435 | ) | |||||||||||||
| 2 | Barclays Capital | KOSPI Index 200 Futures | 03/2016 | 203,614 | 205,066 | 1,452 | ||||||||||||||
| 127 | Barclays Capital | OMXS30 Index Futures | 01/2016 | 2,124,886 | 2,178,488 | 53,602 | ||||||||||||||
| 13 | Barclays Capital | SET50 Index Futures | 03/2016 | 57,623 | 57,411 | (212 | ) | |||||||||||||
| 7 | Barclays Capital | SGX S&P CNX Nifty Index Futures | 01/2016 | 110,955 | 111,272 | 317 | ||||||||||||||
| 53 | Barclays Capital | SPI 200 Index Futures | 03/2016 | 4,741,035 | 5,075,778 | 334,743 | ||||||||||||||
| 431 | J.P. Morgan | 3-Month Euro Euribor Futures | 09/2016 | 117,282,010 | 117,313,940 | 31,930 | ||||||||||||||
| 11 | J.P. Morgan | 3-Month Euro Euribor Futures | 12/2016 | 2,994,142 | 2,993,792 | (350 | ) | |||||||||||||
| 129 | J.P. Morgan | 90-Day EURODollar Futures | 06/2016 | 32,009,871 | 31,959,750 | (50,121 | ) | |||||||||||||
| 32 | J.P. Morgan | 90-Day EURODollar Futures | 09/2016 | 7,921,445 | 7,914,800 | (6,645 | ) | |||||||||||||
| 63 | J.P. Morgan | 90-Day Sterling Futures | 03/2016 | 11,520,936 | 11,535,026 | 14,090 | ||||||||||||||
| 284 | J.P. Morgan | 90-Day Sterling Futures | 06/2016 | 51,844,081 | 51,946,827 | 102,746 | ||||||||||||||
| 383 | J.P. Morgan | 90-Day Sterling Futures | 09/2016 | 69,934,190 | 69,963,302 | 29,112 | ||||||||||||||
| 349 | J.P. Morgan | 90-Day Sterling Futures | 12/2016 | 63,728,028 | 63,655,992 | (72,036 | ) | |||||||||||||
| 7 | Goldman Sachs | Canadian 10-Year Bond Futures | 03/2016 | 702,400 | 713,255 | 10,855 | ||||||||||||||
| 6 | Goldman Sachs | Euro-Bund Futures | 03/2016 | 1,031,282 | 1,029,717 | (1,565 | ) | |||||||||||||
| 27 | Goldman Sachs | Long Gilt Futures | 03/2016 | 4,679,888 | 4,647,843 | (32,045 | ) | |||||||||||||
| 279 | Morgan Stanley and Co., International PLC | U.S. Treasury 10-Year Note Futures | 03/2016 | 35,255,472 | 35,127,844 | (127,628 | ) | |||||||||||||
|
|
|
|
|
| |||||||||||||||
| 416,252,799 | 416,608,185 | 355,386 | ||||||||||||||||||
|
|
|
|
|
| |||||||||||||||
| The accompanying notes are an integral part of these financial statements. | (Continued) |
| AQR Funds | Annual Report | December 2015 | ||||||||||||||
97
Table of Contents
| Consolidated Schedule of Investments | December 31, 2015 |
| AQR GLOBAL MACRO FUND |
| NUMBER OF CONTRACTS | COUNTERPARTY | DESCRIPTION | EXPIRATION DATE | VALUE AT TRADE DATE | VALUE AT DECEMBER 31, 2015 | UNREALIZED APPRECIATION (DEPRECIATION) | ||||||||||||||
| Short Contracts: | ||||||||||||||||||||
| 19 | Goldman Sachs | Brent Crude Futures^ | 01/2016 | $(712,486 | ) | $(715,730 | ) | $(3,244 | ) | |||||||||||
| 61 | Morgan Stanley and Co., International PLC | Corn Futures^ | 03/2016 | (1,136,806 | ) | (1,094,188 | ) | 42,618 | ||||||||||||
| 4 | J.P. Morgan | LME Aluminum Futures^ | 01/2016 | (162,013 | ) | (150,270 | ) | 11,743 | ||||||||||||
| 1 | J.P. Morgan | LME Aluminum Futures^ | 01/2016 | (39,687 | ) | (37,584 | ) | 2,103 | ||||||||||||
| 1 | J.P. Morgan | LME Aluminum Futures^ | 02/2016 | (37,391 | ) | (37,705 | ) | (314 | ) | |||||||||||
| 3 | J.P. Morgan | LME Aluminum Futures^ | 02/2016 | (110,243 | ) | (113,171 | ) | (2,928 | ) | |||||||||||
| 8 | J.P. Morgan | LME Aluminum Futures^ | 02/2016 | (297,480 | ) | (301,826 | ) | (4,346 | ) | |||||||||||
| 2 | J.P. Morgan | LME Aluminum Futures^ | 03/2016 | (73,994 | ) | (75,569 | ) | (1,575 | ) | |||||||||||
| 1 | J.P. Morgan | LME Aluminum Futures^ | 03/2016 | (37,090 | ) | (37,769 | ) | (679 | ) | |||||||||||
| 1 | J.P. Morgan | LME Aluminum Futures^ | 03/2016 | (37,261 | ) | (37,756 | ) | (495 | ) | |||||||||||
| 16 | J.P. Morgan | LME Aluminum Futures^ | 03/2016 | (585,461 | ) | (603,099 | ) | (17,638 | ) | |||||||||||
| 3 | J.P. Morgan | LME Aluminum Futures^ | 03/2016 | (114,309 | ) | (113,031 | ) | 1,278 | ||||||||||||
| 1 | J.P. Morgan | LME Copper Futures^ | 01/2016 | (131,804 | ) | (117,745 | ) | 14,059 | ||||||||||||
| 1 | J.P. Morgan | LME Copper Futures^ | 02/2016 | (123,122 | ) | (117,781 | ) | 5,341 | ||||||||||||
| 2 | J.P. Morgan | LME Copper Futures^ | 02/2016 | (231,328 | ) | (235,556 | ) | (4,228 | ) | |||||||||||
| 1 | J.P. Morgan | LME Copper Futures^ | 03/2016 | (113,952 | ) | (117,744 | ) | (3,792 | ) | |||||||||||
| 2 | J.P. Morgan | LME Copper Futures^ | 03/2016 | (228,574 | ) | (235,412 | ) | (6,838 | ) | |||||||||||
| 1 | J.P. Morgan | LME Lead Futures^ | 03/2016 | (39,697 | ) | (44,918 | ) | (5,221 | ) | |||||||||||
| 1 | J.P. Morgan | LME Nickel Futures^ | 02/2016 | (52,828 | ) | (52,839 | ) | (11 | ) | |||||||||||
| 4 | J.P. Morgan | LME Zinc Futures^ | 03/2016 | (157,157 | ) | (160,900 | ) | (3,743 | ) | |||||||||||
| 23 | Morgan Stanley and Co., International PLC | Natural Gas Futures^ | 01/2016 | (484,750 | ) | (537,510 | ) | (52,760 | ) | |||||||||||
| 1 | Morgan Stanley and Co., International PLC | Silver Futures^ | 03/2016 | (70,448 | ) | (69,015 | ) | 1,433 | ||||||||||||
| 17 | Morgan Stanley and Co., International PLC | Soybean Futures^ | 03/2016 | (767,032 | ) | (734,612 | ) | 32,420 | ||||||||||||
| 31 | Morgan Stanley and Co., International PLC | Soybean Meal Futures^ | 03/2016 | (861,893 | ) | (823,050 | ) | 38,843 | ||||||||||||
| 47 | Morgan Stanley and Co., International PLC | Soybean Oil Futures^ | 03/2016 | (907,008 | ) | (867,150 | ) | 39,858 | ||||||||||||
| 32 | Morgan Stanley and Co., International PLC | Wheat Futures^ | 03/2016 | (813,468 | ) | (752,000 | ) | 61,468 | ||||||||||||
| 15 | Morgan Stanley and Co., International PLC | WTI Crude Futures^ | 01/2016 | (580,184 | ) | (555,600 | ) | 24,584 | ||||||||||||
| 4 | Barclays Capital | DAX Index Futures | 03/2016 | (1,125,023 | ) | (1,170,647 | ) | (45,624 | ) | |||||||||||
| 58 | Barclays Capital | FTSE 100 Index Futures | 03/2016 | (5,097,704 | ) | (5,299,513 | ) | (201,809 | ) | |||||||||||
| 5 | Barclays Capital | FTSE/JSE Top 40 Index Futures | 03/2016 | (143,013 | ) | (149,603 | ) | (6,590 | ) | |||||||||||
| 3 | Barclays Capital | FTSE/MIB Index Futures | 03/2016 | (343,294 | ) | (349,532 | ) | (6,238 | ) | |||||||||||
| 2 | Barclays Capital | Hang Seng Index Futures | 01/2016 | (283,890 | ) | (282,708 | ) | 1,182 | ||||||||||||
| 5 | J.P. Morgan | Mexican Stock Exchange Price and Quotation Index Futures | 03/2016 | (123,845 | ) | (125,153 | ) | (1,308 | ) | |||||||||||
| 19 | Barclays Capital | MSCI Singapore Index Futures | 01/2016 | (432,056 | ) | (433,627 | ) | (1,571 | ) | |||||||||||
| 1 | Barclays Capital | MSCI Taiwan Stock Index Futures | 01/2016 | (30,506 | ) | (30,440 | ) | 66 | ||||||||||||
| The accompanying notes are an integral part of these financial statements. | (Continued) |
| AQR Funds | Annual Report | December 2015 | ||||||||||||||
98
Table of Contents
| Consolidated Schedule of Investments | December 31, 2015 |
| AQR GLOBAL MACRO FUND |
| NUMBER OF CONTRACTS | COUNTERPARTY | DESCRIPTION | EXPIRATION DATE | VALUE AT TRADE DATE | VALUE AT DECEMBER 31, 2015 | UNREALIZED APPRECIATION (DEPRECIATION) | ||||||||||||||
| Short Contracts: (continued) | ||||||||||||||||||||
| 6 | Barclays Capital | S&P 500 E-Mini Futures | 03/2016 | $ (621,206 | ) | $ (610,620 | ) | $ 10,586 | ||||||||||||
| 21 | Barclays Capital | S&P/Toronto Stock Exchange 60 Index Futures | 03/2016 | (2,279,130 | ) | (2,309,590 | ) | (30,460 | ) | |||||||||||
| 15 | Barclays Capital | TOPIX Index Futures | 03/2016 | (1,927,937 | ) | (1,931,237 | ) | (3,300 | ) | |||||||||||
| 191 | Goldman Sachs | 10-Year Japanese Government Bond Futures | 03/2016 | (23,637,868 | ) | (23,686,892 | ) | (49,024 | ) | |||||||||||
| 22 | Goldman Sachs | 10-Year Japanese Government Bond Futures | 03/2016 | (27,229,636 | ) | (27,279,670 | ) | (50,034 | ) | |||||||||||
| 447 | J.P. Morgan | 3-Month Euro Euribor Futures | 03/2016 | (121,589,508 | ) | (121,644,693 | ) | (55,185 | ) | |||||||||||
| 114 | J.P. Morgan | 3-Month Euro Euribor Futures | 06/2016 | (30,981,902 | ) | (31,028,125 | ) | (46,223 | ) | |||||||||||
| 47 | J.P. Morgan | 90-Day EURODollar Futures | 12/2016 | (11,612,278 | ) | (11,605,475 | ) | 6,803 | ||||||||||||
| 209 | J.P. Morgan | Australia 10-Year Bond Futures | 03/2016 | (19,241,244 | ) | (19,325,486 | ) | (84,242 | ) | |||||||||||
| 41 | J.P. Morgan | Canadian 3-Month Bank Acceptance Futures | 03/2016 | (7,355,720 | ) | (7,348,784 | ) | 6,936 | ||||||||||||
| 137 | J.P. Morgan | Canadian 3-Month Bank Acceptance Futures | 06/2016 | (24,572,110 | ) | (24,564,357 | ) | 7,753 | ||||||||||||
| 172 | J.P. Morgan | Canadian 3-Month Bank Acceptance Futures | 09/2016 | (30,820,002 | ) | (30,841,476 | ) | (21,474 | ) | |||||||||||
| 132 | J.P. Morgan | Canadian 3-Month Bank Acceptance Futures | 12/2016 | (23,636,849 | ) | (23,660,692 | ) | (23,843 | ) | |||||||||||
| 277 | Morgan Stanley and Co., International PLC | U.S. Treasury 5-Year Note Futures | 03/2016 | (32,840,467 | ) | (32,774,726 | ) | 65,741 | ||||||||||||
|
|
|
|
|
| |||||||||||||||
| (374,832,654 | ) | (375,192,576 | ) | (359,922 | ) | |||||||||||||||
|
|
|
|
|
| |||||||||||||||
| $41,420,145 | $41,415,609 | $(4,536 | ) | |||||||||||||||||
|
|
|
|
|
| |||||||||||||||
| ^ | Represents positions held in the respective Subsidiary (See Note 2). |
Forward foreign currency exchange contracts outstanding as of December 31, 2015:
Over the Counter
| PURCHASE CONTRACTS | COUNTERPARTY | CURRENCY | CURRENCY AMOUNT PURCHASED | VALUE AT SETTLEMENT DATE | VALUE AT DECEMBER 31, 2015 | UNREALIZED APPRECIATION (DEPRECIATION) | ||||||||||||||
| Australian Dollar, Expiring 03/16/16 | CitiBank | AUD | 1,024,000 | $734,659 | $743,525 | $8,866 | ||||||||||||||
| Australian Dollar, Expiring 03/16/16 | Credit Suisse International | AUD | 1,024,000 | 734,659 | 743,525 | 8,866 | ||||||||||||||
| Brazilian Real, Expiring 03/16/16* | CitiBank | BRL | 623,000 | 155,411 | 153,822 | (1,589 | ) | |||||||||||||
| Brazilian Real, Expiring 03/16/16* | Credit Suisse International | BRL | 225,000 | 56,035 | 55,554 | (481 | ) | |||||||||||||
| Swiss Franc, Expiring 03/16/16 | CitiBank | CHF | 1,425,500 | 1,439,550 | 1,427,637 | (11,913 | ) | |||||||||||||
| Swiss Franc, Expiring 03/16/16 | Credit Suisse International | CHF | 1,425,500 | 1,439,397 | 1,427,637 | (11,760 | ) | |||||||||||||
| Chilean Peso, Expiring 03/16/16* | CitiBank | CLP | 40,000,000 | 56,627 | 55,989 | (638 | ) | |||||||||||||
| Chilean Peso, Expiring 03/16/16* | Credit Suisse International | CLP | 40,000,000 | 56,627 | 55,989 | (638 | ) | |||||||||||||
| The accompanying notes are an integral part of these financial statements. | (Continued) |
| AQR Funds | Annual Report | December 2015 | ||||||||||||||
99
Table of Contents
| Consolidated Schedule of Investments | December 31, 2015 |
| AQR GLOBAL MACRO FUND |
| PURCHASE CONTRACTS | COUNTERPARTY | CURRENCY | CURRENCY AMOUNT PURCHASED | VALUE AT SETTLEMENT DATE | VALUE AT DECEMBER 31, 2015 | UNREALIZED APPRECIATION (DEPRECIATION) | ||||||||||||||
| Chinese Renminbi, Expiring 03/16/16* | CitiBank | CNY | 503,000 | $ 77,191 | $ 75,775 | $ (1,416 | ) | |||||||||||||
| Chinese Renminbi, Expiring 03/16/16* | Credit Suisse International | CNY | 503,000 | 77,228 | 75,775 | (1,453 | ) | |||||||||||||
| Czech Republic Koruna, Expiring 03/16/16 | CitiBank | CZK | 73,350,000 | 2,969,872 | 2,956,129 | (13,743 | ) | |||||||||||||
| Czech Republic Koruna, Expiring 03/16/16 | Credit Suisse International | CZK | 6,450,000 | 259,456 | 259,946 | 490 | ||||||||||||||
| Euro, Expiring 03/16/16 | CitiBank | EUR | 2,638,500 | 2,875,195 | 2,872,658 | (2,537 | ) | |||||||||||||
| Euro, Expiring 03/16/16 | Credit Suisse International | EUR | 2,638,500 | 2,875,195 | 2,872,658 | (2,537 | ) | |||||||||||||
| British Pound, Expiring 03/16/16 | CitiBank | GBP | 643,500 | 958,543 | 948,762 | (9,781 | ) | |||||||||||||
| British Pound, Expiring 03/16/16 | Credit Suisse International | GBP | 643,500 | 958,506 | 948,762 | (9,744 | ) | |||||||||||||
| Hong Kong Dollar, Expiring 03/16/16 | CitiBank | HKD | 11,500 | 1,485 | 1,485 | — | ||||||||||||||
| Hong Kong Dollar, Expiring 03/16/16 | Credit Suisse International | HKD | 11,500 | 1,484 | 1,485 | 1 | ||||||||||||||
| Hungarian Forint, Expiring 03/16/16 | CitiBank | HUF | 61,490,000 | 211,353 | 211,641 | 288 | ||||||||||||||
| Hungarian Forint, Expiring 03/16/16 | Credit Suisse International | HUF | 45,250,000 | 156,177 | 155,745 | (432 | ) | |||||||||||||
| Indonesian Rupiah, Expiring 03/16/16* | CitiBank | IDR | 655,000,000 | 46,364 | 46,675 | 311 | ||||||||||||||
| Indonesian Rupiah, Expiring 03/16/16* | Credit Suisse International | IDR | 655,000,000 | 46,364 | 46,675 | 311 | ||||||||||||||
| Israeli Shekel, Expiring 03/16/16 | CitiBank | ILS | 910,000 | 235,330 | 234,221 | (1,109 | ) | |||||||||||||
| Israeli Shekel, Expiring 03/16/16 | Credit Suisse International | ILS | 910,000 | 235,329 | 234,221 | (1,108 | ) | |||||||||||||
| Japanese Yen, Expiring 03/16/16 | CitiBank | JPY | 686,601,500 | 5,599,040 | 5,722,222 | 123,182 | ||||||||||||||
| Japanese Yen, Expiring 03/16/16 | Credit Suisse International | JPY | 686,601,500 | 5,599,040 | 5,722,222 | 123,182 | ||||||||||||||
| Korean Won, Expiring 03/16/16* | CitiBank | KRW | 276,229,000 | 237,865 | 235,202 | (2,663 | ) | |||||||||||||
| Korean Won, Expiring 03/16/16* | Credit Suisse International | KRW | 165,774,000 | 142,647 | 141,152 | (1,495 | ) | |||||||||||||
| Mexican Peso, Expiring 03/16/16 | CitiBank | MXN | 1,206,000 | 72,120 | 69,614 | (2,506 | ) | |||||||||||||
| Mexican Peso, Expiring 03/16/16 | Credit Suisse International | MXN | 1,206,000 | 72,201 | 69,614 | (2,587 | ) | |||||||||||||
| Malaysian Ringgit, Expiring 03/16/16* | CitiBank | MYR | 495,000 | 116,248 | 114,702 | (1,546 | ) | |||||||||||||
| Malaysian Ringgit, Expiring 03/16/16* | Credit Suisse International | MYR | 495,000 | 116,248 | 114,702 | (1,546 | ) | |||||||||||||
| Norwegian Krone, Expiring 03/16/16 | CitiBank | NOK | 3,394,000 | 391,724 | 383,164 | (8,560 | ) | |||||||||||||
| Norwegian Krone, Expiring 03/16/16 | Credit Suisse International | NOK | 3,394,000 | 391,724 | 383,164 | (8,560 | ) | |||||||||||||
| New Zealand Dollar, Expiring 03/16/16 | CitiBank | NZD | 1,127,500 | 757,827 | 767,760 | 9,933 | ||||||||||||||
| New Zealand Dollar, Expiring 03/16/16 | Credit Suisse International | NZD | 1,127,500 | 757,983 | 767,760 | 9,777 | ||||||||||||||
| The accompanying notes are an integral part of these financial statements. | (Continued) |
| AQR Funds | Annual Report | December 2015 | ||||||||||||||
100
Table of Contents
| Consolidated Schedule of Investments | December 31, 2015 |
| AQR GLOBAL MACRO FUND |
| PURCHASE CONTRACTS | COUNTERPARTY | CURRENCY | CURRENCY AMOUNT PURCHASED | VALUE AT SETTLEMENT DATE | VALUE AT DECEMBER 31, 2015 | UNREALIZED APPRECIATION (DEPRECIATION) | ||||||||||||||
| Poland Zloty, Expiring 03/16/16 | CitiBank | PLN | 404,000 | $ 99,836 | $ 102,846 | $ 3,010 | ||||||||||||||
| Swedish Krona, Expiring 03/16/16 | CitiBank | SEK | 27,730,500 | 3,199,290 | 3,291,894 | 92,604 | ||||||||||||||
| Swedish Krona, Expiring 03/16/16 | Credit Suisse International | SEK | 27,730,500 | 3,199,270 | 3,291,893 | 92,623 | ||||||||||||||
| Singapore Dollar, Expiring 03/16/16 | CitiBank | SGD | 625,000 | 441,694 | 439,750 | (1,944 | ) | |||||||||||||
| Singapore Dollar, Expiring 03/16/16 | Credit Suisse International | SGD | 625,000 | 441,697 | 439,750 | (1,947 | ) | |||||||||||||
| Turkish Lira, Expiring 03/16/16 | CitiBank | TRY | 1,479,500 | 495,669 | 497,135 | 1,466 | ||||||||||||||
| Turkish Lira, Expiring 03/16/16 | Credit Suisse International | TRY | 1,479,500 | 495,686 | 497,135 | 1,449 | ||||||||||||||
| South African Rand, Expiring 03/16/16 | CitiBank | ZAR | 1,553,500 | 106,112 | 99,119 | (6,993 | ) | |||||||||||||
| South African Rand, Expiring 03/16/16 | Credit Suisse International | ZAR | 1,553,500 | 106,132 | 99,119 | (7,013 | ) | |||||||||||||
|
|
|
|
|
| |||||||||||||||
| $39,498,090 | $39,856,210 | $358,120 | ||||||||||||||||||
|
|
|
|
|
| |||||||||||||||
| SALES CONTRACTS | COUNTERPARTY | CURRENCY | CURRENCY AMOUNT SOLD | VALUE AT SETTLEMENT DATE | VALUE AT DECEMBER 31, 2015 | UNREALIZED APPRECIATION (DEPRECIATION) | ||||||||||||||
| Australian Dollar, Expiring 03/16/16 | CitiBank | AUD | (861,000 | ) | $(626,815 | ) | $(625,171 | ) | $1,644 | |||||||||||
| Australian Dollar, Expiring 03/16/16 | Credit Suisse International | AUD | (861,000 | ) | (626,814 | ) | (625,171 | ) | 1,643 | |||||||||||
| Brazilian Real, Expiring 03/16/16* | CitiBank | BRL | (2,091,000 | ) | (527,466 | ) | (516,280 | ) | 11,186 | |||||||||||
| Brazilian Real, Expiring 03/16/16* | Credit Suisse International | BRL | (2,091,000 | ) | (527,470 | ) | (516,280 | ) | 11,190 | |||||||||||
| Canadian Dollar, Expiring 03/16/16 | CitiBank | CAD | (1,418,000 | ) | (1,039,246 | ) | (1,024,985 | ) | 14,261 | |||||||||||
| Canadian Dollar, Expiring 03/16/16 | Credit Suisse International | CAD | (1,418,000 | ) | (1,039,075 | ) | (1,024,986 | ) | 14,089 | |||||||||||
| Swiss Franc, Expiring 03/16/16 | CitiBank | CHF | (2,068,500 | ) | (2,059,763 | ) | (2,071,599 | ) | (11,836 | ) | ||||||||||
| Swiss Franc, Expiring 03/16/16 | Credit Suisse International | CHF | (1,922,500 | ) | (1,912,522 | ) | (1,925,382 | ) | (12,860 | ) | ||||||||||
| Chinese Renminbi, Expiring 03/16/16* | CitiBank | CNY | (652,000 | ) | (100,149 | ) | (98,222 | ) | 1,927 | |||||||||||
| Chinese Renminbi, Expiring 03/16/16* | Credit Suisse International | CNY | (652,000 | ) | (100,149 | ) | (98,222 | ) | 1,927 | |||||||||||
| Colombian Peso, Expiring 03/16/16* | CitiBank | COP | (596,000,000 | ) | (184,883 | ) | (186,244 | ) | (1,361 | ) | ||||||||||
| Colombian Peso, Expiring 03/16/16* | Credit Suisse International | COP | (596,000,000 | ) | (184,883 | ) | (186,244 | ) | (1,361 | ) | ||||||||||
| Euro, Expiring 03/16/16 | CitiBank | EUR | (3,415,500 | ) | (3,714,511 | ) | (3,718,615 | ) | (4,104 | ) | ||||||||||
| Euro, Expiring 03/16/16 | Credit Suisse International | EUR | (941,500 | ) | (1,010,460 | ) | (1,025,054 | ) | (14,594 | ) | ||||||||||
| British Pound, Expiring 03/16/16 | CitiBank | GBP | (2,231,500 | ) | (3,355,604 | ) | (3,290,074 | ) | 65,530 | |||||||||||
| British Pound, Expiring 03/16/16 | Credit Suisse International | GBP | (2,231,500 | ) | (3,355,619 | ) | (3,290,074 | ) | 65,545 | |||||||||||
| The accompanying notes are an integral part of these financial statements. | (Continued) |
| AQR Funds | Annual Report | December 2015 | ||||||||||||||
101
Table of Contents
| Consolidated Schedule of Investments | December 31, 2015 |
| AQR GLOBAL MACRO FUND |
| SALES CONTRACTS | COUNTERPARTY | CURRENCY | CURRENCY AMOUNT SOLD | VALUE AT SETTLEMENT DATE | VALUE AT DECEMBER 31, 2015 | UNREALIZED APPRECIATION (DEPRECIATION) | ||||||||||||||
| Hong Kong Dollar, Expiring 03/16/16 | CitiBank | HKD | (514,000 | ) | $ (66,344 | ) | $ (66,360 | ) | $ (16 | ) | ||||||||||
| Hungarian Forint, Expiring 03/16/16 | CitiBank | HUF | (10,500,000 | ) | (36,253 | ) | (36,140 | ) | 113 | |||||||||||
| Hungarian Forint, Expiring 03/16/16 | Credit Suisse International | HUF | (10,500,000 | ) | (36,294 | ) | (36,140 | ) | 154 | |||||||||||
| Indian Rupee, Expiring 03/16/16* | CitiBank | INR | (13,324,000 | ) | (196,711 | ) | (199,030 | ) | (2,319 | ) | ||||||||||
| Indian Rupee, Expiring 03/16/16* | Credit Suisse International | INR | (13,324,000 | ) | (196,711 | ) | (199,030 | ) | (2,319 | ) | ||||||||||
| Japanese Yen, Expiring 03/16/16 | CitiBank | JPY | (81,639,500 | ) | (675,415 | ) | (680,394 | ) | (4,979 | ) | ||||||||||
| Japanese Yen, Expiring 03/16/16 | Credit Suisse International | JPY | (81,639,500 | ) | (675,455 | ) | (680,394 | ) | (4,939 | ) | ||||||||||
| Korean Won, Expiring 03/16/16* | CitiBank | KRW | (78,030,500 | ) | (66,348 | ) | (66,441 | ) | (93 | ) | ||||||||||
| Korean Won, Expiring 03/16/16* | Credit Suisse International | KRW | (78,030,500 | ) | (66,348 | ) | (66,441 | ) | (93 | ) | ||||||||||
| Mexican Peso, Expiring 03/16/16 | CitiBank | MXN | (13,925,000 | ) | (832,551 | ) | (803,798 | ) | 28,753 | |||||||||||
| Mexican Peso, Expiring 03/16/16 | Credit Suisse International | MXN | (13,925,000 | ) | (832,549 | ) | (803,798 | ) | 28,751 | |||||||||||
| Malaysian Ringgit, Expiring 03/16/16* | CitiBank | MYR | (1,010,000 | ) | (238,498 | ) | (234,037 | ) | 4,461 | |||||||||||
| Malaysian Ringgit, Expiring 03/16/16* | Credit Suisse International | MYR | (1,010,000 | ) | (238,499 | ) | (234,037 | ) | 4,462 | |||||||||||
| Norwegian Krone, Expiring 03/16/16 | CitiBank | NOK | (13,253,500 | ) | (1,518,149 | ) | (1,496,246 | ) | 21,903 | |||||||||||
| Norwegian Krone, Expiring 03/16/16 | Credit Suisse International | NOK | (13,253,500 | ) | (1,518,092 | ) | (1,496,246 | ) | 21,846 | |||||||||||
| New Zealand Dollar, Expiring 03/16/16 | CitiBank | NZD | (2,115,500 | ) | (1,399,192 | ) | (1,440,528 | ) | (41,336 | ) | ||||||||||
| New Zealand Dollar, Expiring 03/16/16 | Credit Suisse International | NZD | (2,115,500 | ) | (1,399,192 | ) | (1,440,528 | ) | (41,336 | ) | ||||||||||
| Philippine Peso, Expiring 03/16/16* | CitiBank | PHP | (1,300,000 | ) | (27,321 | ) | (27,515 | ) | (194 | ) | ||||||||||
| Philippine Peso, Expiring 03/16/16* | Credit Suisse International | PHP | (1,300,000 | ) | (27,321 | ) | (27,515 | ) | (194 | ) | ||||||||||
| Poland Zloty, Expiring 03/16/16 | CitiBank | PLN | (1,079,000 | ) | (270,135 | ) | (274,682 | ) | (4,547 | ) | ||||||||||
| Poland Zloty, Expiring 03/16/16 | Credit Suisse International | PLN | (1,079,000 | ) | (270,136 | ) | (274,682 | ) | (4,546 | ) | ||||||||||
| Swedish Krona, Expiring 03/16/16 | CitiBank | SEK | (19,714,500 | ) | (2,322,959 | ) | (2,340,312 | ) | (17,353 | ) | ||||||||||
| Swedish Krona, Expiring 03/16/16 | Credit Suisse International | SEK | (19,714,500 | ) | (2,323,285 | ) | (2,340,312 | ) | (17,027 | ) | ||||||||||
| Singapore Dollar, Expiring 03/16/16 | CitiBank | SGD | (331,000 | ) | (234,498 | ) | (232,892 | ) | 1,606 | |||||||||||
| Singapore Dollar, Expiring 03/16/16 | Credit Suisse International | SGD | (331,000 | ) | (234,498 | ) | (232,892 | ) | 1,606 | |||||||||||
| Turkish Lira, Expiring 03/16/16 | CitiBank | TRY | (1,218,500 | ) | (408,984 | ) | (409,436 | ) | (452 | ) | ||||||||||
| Turkish Lira, Expiring 03/16/16 | Credit Suisse International | TRY | (1,218,500 | ) | (408,952 | ) | (409,436 | ) | (484 | ) | ||||||||||
| New Taiwan Dollar, Expiring 03/16/16* | CitiBank | TWD | (2,400,000 | ) | (73,439 | ) | (73,125 | ) | 314 | |||||||||||
| The accompanying notes are an integral part of these financial statements. | (Continued) |
| AQR Funds | Annual Report | December 2015 | ||||||||||||||
102
Table of Contents
| Consolidated Schedule of Investments | December 31, 2015 |
| AQR GLOBAL MACRO FUND |
| SALES CONTRACTS | COUNTERPARTY | CURRENCY | CURRENCY AMOUNT SOLD | VALUE AT SETTLEMENT DATE | VALUE AT DECEMBER 31, 2015 | UNREALIZED APPRECIATION (DEPRECIATION) | ||||||||||||||
| New Taiwan Dollar, Expiring 03/16/16* | Credit Suisse International | TWD | (2,400,000 | ) | $ (73,440 | ) | $ (73,125 | ) | $ 315 | |||||||||||
| South African Rand, Expiring 03/16/16 | CitiBank | ZAR | (5,230,500 | ) | (352,133 | ) | (333,724 | ) | 18,409 | |||||||||||
| South African Rand, Expiring 03/16/16 | Credit Suisse International | ZAR | (5,230,500 | ) | (352,134 | ) | (333,724 | ) | 18,410 | |||||||||||
|
|
|
|
|
| |||||||||||||||
| (37,737,265 | ) | (37,585,563 | ) | 151,702 | ||||||||||||||||
|
|
|
|
|
| |||||||||||||||
| $1,760,825 | $2,270,647 | $509,822 | ||||||||||||||||||
|
|
|
|
|
| |||||||||||||||
| * | Non-deliverable forward (See Note 4). |
AUD - Australian Dollar
BRL - Brazilian Real
CAD - Canadian Dollar
CHF - Swiss Franc
CLP - Chilean Peso
CNY - Chinese Renminbi
COP - Colombian Peso
CZK - Czech Republic Koruna
EUR - Euro
GBP - British Pound
HKD - Hong Kong Dollar
HUF - Hungarian Forint
IDR - Indonesian Rupiah
ILS - Israeli Shekel
INR - Indian Rupee
JPY - Japanese Yen
KRW - Korean Won
MXN - Mexican Peso
MYR - Malaysian Ringgit
NOK - Norwegian Krone
NZD - New Zealand Dollar
PHP - Philippine Peso
PLN - Poland Zloty
SEK - Swedish Krona
SGD - Singapore Dollar
TRY - Turkish Lira
TWD - New Taiwan Dollar
USD - United States Dollar
ZAR - South African Rand
Collateral pledged to, or (received from), each counterparty at December 31, 2015 was as follows:
| COUNTERPARTY | OVER THE COUNTER | EXCHANGE TRADED/ CENTRALLY CLEARED | TOTAL | |||||||||
| Bank of America | ||||||||||||
| Cash | $(110,000 | ) | $— | $(110,000 | ) | |||||||
| ||||||||||||
| Barclays Capital | ||||||||||||
| Cash | — | 1,483,509 | 1,483,509 | |||||||||
| ||||||||||||
| CitiBank | ||||||||||||
| Cash | — | 271,494 | 271,494 | |||||||||
| Money Market Funds | 30,001 | — | 30,001 | |||||||||
| ||||||||||||
| Credit Suisse International | ||||||||||||
| Cash | (230,000 | ) | 918,817 | 688,817 | ||||||||
| ||||||||||||
| Goldman Sachs | ||||||||||||
| Cash | — | 412,115 | 412,115 | |||||||||
| ||||||||||||
| J.P. Morgan | ||||||||||||
| Cash | — | 1,218,901 | 1,218,901 | |||||||||
| ||||||||||||
| Morgan Stanley and Co., International PLC | ||||||||||||
| Cash | — | 349,732 | 349,732 | |||||||||
| ||||||||||||
| The accompanying notes are an integral part of these financial statements. | (Continued) |
| AQR Funds | Annual Report | December 2015 | ||||||||||||||
103
Table of Contents
| Consolidated Schedule of Investments | December 31, 2015 |
| AQR GLOBAL MACRO FUND |
Collateral pledged to, or (received from), each counterparty for the Subsidiary (See Note 2) at December 31, 2015 was as follows:
| COUNTERPARTY | OVER THE COUNTER | EXCHANGE TRADED/ CENTRALLY CLEARED | TOTAL | |||||||||
| CitiBank | ||||||||||||
| Money Market Funds | $60,001 | $— | $60,001 | |||||||||
| ||||||||||||
| Goldman Sachs | ||||||||||||
| Cash | — | 74,846 | 74,846 | |||||||||
| ||||||||||||
| J.P. Morgan | ||||||||||||
| Cash | — | 107,345 | 107,345 | |||||||||
| ||||||||||||
| Morgan Stanley and Co., International PLC | ||||||||||||
| Cash | — | 218,903 | 218,903 | |||||||||
| ||||||||||||
| The accompanying notes are an integral part of these financial statements. |
| AQR Funds | Annual Report | December 2015 | ||||||||||||||
104
Table of Contents
| Schedule of Investments | December 31, 2015 |
| AQR LONG-SHORT EQUITY FUND |
| LONG INVESTMENTS - 113.2% | SHARES | VALUE (Note 5) | ||||||
| COMMON STOCKS - 27.7% | ||||||||
| Belgium - 1.0% | ||||||||
| Ageas (a) | 38,649 | $ | 1,793,850 | |||||
| bpost SA (a) | 55,921 | 1,372,155 | ||||||
| Colruyt SA (a) | 6,894 | 354,650 | ||||||
| KBC Groep NV (a) | 22,451 | 1,403,775 | ||||||
| Proximus (a) | 23,115 | 752,184 | ||||||
|
| |||||||
| 5,676,614 | ||||||||
|
| |||||||
| Canada - 5.2% | ||||||||
| Aimia, Inc. (1) | 23,150 | 157,434 | ||||||
| Air Canada (1)† | 298,301 | 2,201,094 | ||||||
| Alimentation Couche-Tard, Inc., Class B (1) | 22,635 | 996,385 | ||||||
| Atco Ltd., Class I (1) | 10,443 | 269,434 | ||||||
| Bank of Montreal (1) | 6,027 | 340,094 | ||||||
| Bank of Nova Scotia/The (1) | 4,930 | 199,416 | ||||||
| Baytex Energy Corp. (1) | 280,965 | 909,679 | ||||||
| BCE, Inc. (1) | 6,626 | 255,999 | ||||||
| BlackBerry Ltd. (1)†(a) | 53,352 | 495,078 | ||||||
| Bombardier, Inc., Class B (1)† | 792,518 | 767,489 | ||||||
| Canadian Imperial Bank of Commerce (1) | 6,850 | 451,436 | ||||||
| Canadian Tire Corp. Ltd., Class A (1) | 13,228 | 1,129,595 | ||||||
| Canfor Corp. (1)† | 61,387 | 895,717 | ||||||
| CCL Industries, Inc., Class B (1) | 5,622 | 911,620 | ||||||
| CGI Group, Inc., Class A (1)† | 26,305 | 1,053,189 | ||||||
| CI Financial Corp. (1) | 21,373 | 472,656 | ||||||
| Constellation Software, Inc. (1) | 2,231 | 930,129 | ||||||
| Dollarama, Inc. (1) | 14,100 | 814,594 | ||||||
| Empire Co., Ltd., Class A (1) | 64,985 | 1,208,870 | ||||||
| Encana Corp. (1) | 77,842 | 395,483 | ||||||
| Enerplus Corp. (1) | 83,704 | 287,341 | ||||||
| Fairfax Financial Holdings Ltd. (1) | 741 | 351,789 | ||||||
| Finning International, Inc. (1) | 46,807 | 631,896 | ||||||
| George Weston Ltd. (1) | 12,895 | 996,597 | ||||||
| IGM Financial, Inc. (1) | 11,936 | 304,848 | ||||||
| Industrial Alliance Insurance & Financial Services, Inc. (1) | 6,054 | 193,079 | ||||||
| Intact Financial Corp. (1) | 4,449 | 285,132 | ||||||
| Kinross Gold Corp. (1)† | 251,123 | 455,531 | ||||||
| Linamar Corp. (1) | 28,197 | 1,522,846 | ||||||
| Magna International, Inc. (1) | 59,895 | 2,429,217 | ||||||
| MEG Energy Corp. (1)† | 23,739 | 137,593 | ||||||
| Metro, Inc. (1) | 34,588 | 968,374 | ||||||
| National Bank of Canada (1) | 4,353 | 126,812 | ||||||
| Onex Corp. (1) | 8,437 | 517,183 | ||||||
| Open Text Corp. (1)(a) | 9,380 | 449,714 | ||||||
| Progressive Waste Solutions Ltd. (1) | 29,989 | 706,541 | ||||||
| Ritchie Bros Auctioneers, Inc. (1) | 37,387 | 900,833 | ||||||
| Royal Bank of Canada (1) | 7,702 | 412,736 | ||||||
| Saputo, Inc. (1) | 3,861 | 92,360 | ||||||
| Shaw Communications, Inc., Class B (1) | 41,956 | 721,654 | ||||||
| SNC-Lavalin Group, Inc. (1) | 18,461 | 548,613 | ||||||
| Sun Life Financial, Inc. (1) | 4,823 | 150,403 | ||||||
| West Fraser Timber Co., Ltd. (1) | 23,559 | 894,380 | ||||||
|
| |||||||
| 28,940,863 | ||||||||
|
| |||||||
| SHARES | VALUE (Note 5) | |||||||
| China - 0.1% | ||||||||
| Yangzijiang Shipbuilding Holdings Ltd. | 931,400 | $ | 719,582 | |||||
|
| |||||||
| Denmark - 2.1% | ||||||||
| AP Moeller - Maersk A/S, Class B (a) | 73 | 95,214 | ||||||
| Chr Hansen Holding A/S (a) | 1,782 | 111,465 | ||||||
| DSV A/S (a) | 45,078 | 1,774,435 | ||||||
| Genmab A/S †(a) | 8,339 | 1,108,787 | ||||||
| GN Store Nord A/S (a) | 5,597 | 101,577 | ||||||
| ISS A/S (a) | 25,721 | 927,158 | ||||||
| Novo Nordisk A/S, Class B (a) | 55,864 | 3,234,426 | ||||||
| Pandora A/S (a) | 18,552 | 2,339,108 | ||||||
| TDC A/S | 203,370 | 1,012,588 | ||||||
| Vestas Wind Systems A/S (a) | 9,966 | 696,013 | ||||||
| William Demant Holding A/S † | 2,074 | 197,558 | ||||||
|
| |||||||
| 11,598,329 | ||||||||
|
| |||||||
| Finland - 1.1% | ||||||||
| Amer Sports OYJ (a) | 31,869 | 930,442 | ||||||
| Cargotec OYJ, B Shares (a) | 24,742 | 923,000 | ||||||
| Elisa OYJ (a) | 26,900 | 1,012,109 | ||||||
| Kesko OYJ, B Shares (a) | 27,757 | 972,938 | ||||||
| Metso OYJ (a) | 37,841 | 847,646 | ||||||
| Neste OYJ (a) | 13,913 | 415,246 | ||||||
| Orion OYJ, Class B (a) | 23,588 | 816,104 | ||||||
| Stora Enso OYJ, R Shares (a) | 20,666 | 186,865 | ||||||
|
| |||||||
| 6,104,350 | ||||||||
|
| |||||||
| Germany - 4.7% | ||||||||
| Allianz SE (a) | 6,523 | 1,149,862 | ||||||
| Aurubis AG (a) | 23,914 | 1,210,913 | ||||||
| Bayer AG (a) | 3,773 | 471,212 | ||||||
| Brenntag AG (a) | 10,307 | 537,075 | ||||||
| Deutsche Bank AG (a) | 15,199 | 369,103 | ||||||
| Deutsche Lufthansa AG †(a) | 95,050 | 1,497,139 | ||||||
| Evonik Industries AG (a) | 35,381 | 1,170,297 | ||||||
| Freenet AG (a) | 89,112 | 3,007,071 | ||||||
| Hannover Rueck SE (a) | 6,100 | 696,556 | ||||||
| Hella KGaA Hueck & Co. (a) | 7,886 | 327,492 | ||||||
| HOCHTIEF AG (a) | 27,773 | 2,575,877 | ||||||
| HUGO BOSS AG (a) | 4,226 | 348,684 | ||||||
| K+S AG (a) | 8,367 | 213,284 | ||||||
| KION Group AG †(a) | 27,953 | 1,386,125 | ||||||
| Krones AG (a) | 5,428 | 646,325 | ||||||
| LANXESS AG (a) | 6,695 | 308,085 | ||||||
| Merck KGaA (a) | 15,057 | 1,457,832 | ||||||
| MTU Aero Engines AG (a) | 5,091 | 496,195 | ||||||
| Muenchener Rueckversicherungs-Gesellschaft AG in Muenchen (a) | 5,432 | 1,082,256 | ||||||
| OSRAM Licht AG (a) | 27,807 | 1,161,749 | ||||||
| ProSiebenSat.1 Media SE (a) | 24,126 | 1,217,189 | ||||||
| Rheinmetall AG (a) | 20,855 | 1,386,271 | ||||||
| RHOEN-KLINIKUM AG (a) | 4,475 | 134,244 | ||||||
| Salzgitter AG (a) | 12,954 | 316,560 | ||||||
| Software AG (a) | 21,342 | 608,284 | ||||||
| STADA Arzneimittel AG (a) | 15,018 | 605,607 | ||||||
| Symrise AG (a) | 2,850 | 188,666 | ||||||
| Talanx AG (a) | 14,746 | 453,506 | ||||||
| United Internet AG (a) | 9,358 | 514,495 | ||||||
| Zalando SE 144A †(a)(b) | 15,133 | 597,669 | ||||||
|
| |||||||
| 26,135,623 | ||||||||
|
| |||||||
| The accompanying notes are an integral part of these financial statements. | (Continued) |
| AQR Funds | Annual Report | December 2015 | ||||||||||||||
105
Table of Contents
| Schedule of Investments | December 31, 2015 |
| AQR LONG-SHORT EQUITY FUND |
| SHARES | VALUE (Note 5) | |||||||
| Hong Kong - 0.2% | ||||||||
| Hongkong Land Holdings Ltd. (1) | 176,100 | $ | 1,206,285 | |||||
|
| |||||||
| Italy - 2.3% | ||||||||
| A2A SpA (a) | 562,627 | 761,828 | ||||||
| Atlantia SpA (a) | 9,182 | 242,941 | ||||||
| Autogrill SpA † | 24,563 | 234,093 | ||||||
| Azimut Holding SpA (a) | 3,770 | 93,708 | ||||||
| Banca Generali SpA | 10,739 | 337,806 | ||||||
| Banca Popolare di Milano Scarl | 266,291 | 263,751 | ||||||
| Buzzi Unicem SpA | 23,850 | 427,519 | ||||||
| Davide Campari-Milano SpA (a) | 62,433 | 539,785 | ||||||
| Enel SpA | 171,589 | 719,525 | ||||||
| Eni SpA (a) | 53,606 | 796,489 | ||||||
| FinecoBank Banca Fineco SpA | 69,458 | 571,147 | ||||||
| Finmeccanica SpA †(a) | 27,136 | 377,306 | ||||||
| Mediobanca SpA (a) | 49,729 | 476,705 | ||||||
| Moncler SpA | 28,213 | 392,610 | ||||||
| Prysmian SpA (a) | 160,779 | 3,512,882 | ||||||
| Recordati SpA | 43,544 | 1,136,099 | ||||||
| Snam SpA (a) | 38,193 | 199,327 | ||||||
| Terna Rete Elettrica Nazionale SpA (a) | 18,345 | 94,346 | ||||||
| Unipol Gruppo Finanziario SpA | 176,821 | 909,495 | ||||||
| UnipolSai SpA | 296,091 | 753,286 | ||||||
|
| |||||||
| 12,840,648 | ||||||||
|
| |||||||
| Netherlands - 2.3% | ||||||||
| Akzo Nobel NV (a) | 7,138 | 476,952 | ||||||
| Boskalis Westminster (a) | 30,130 | 1,229,069 | ||||||
| Delta Lloyd NV | 59,103 | 348,408 | ||||||
| Fugro NV CVA † | 41,216 | 676,027 | ||||||
| Heineken NV (a) | 15,766 | 1,343,531 | ||||||
| Koninklijke Ahold NV (a) | 73,177 | 1,543,555 | ||||||
| Koninklijke KPN NV | 135,482 | 512,442 | ||||||
| Koninklijke Vopak NV (a) | 6,667 | 287,113 | ||||||
| NN Group NV (a) | 98,557 | 3,477,378 | ||||||
| Randstad Holding NV (a) | 29,890 | 1,861,293 | ||||||
| Wolters Kluwer NV (a) | 30,306 | 1,017,783 | ||||||
|
| |||||||
| 12,773,551 | ||||||||
|
| |||||||
| Norway - 0.2% | ||||||||
| Orkla ASA (a) | 13,583 | 107,155 | ||||||
| Telenor ASA (a) | 10,537 | 175,637 | ||||||
| Yara International ASA (a) | 24,121 | 1,037,402 | ||||||
|
| |||||||
| 1,320,194 | ||||||||
|
| |||||||
| Portugal - 0.3% | ||||||||
| Galp Energia SGPS SA (a) | 38,825 | 453,036 | ||||||
| Jeronimo Martins SGPS SA (a) | 53,443 | 695,421 | ||||||
| NOS SGPS SA | 32,855 | 258,501 | ||||||
|
| |||||||
| 1,406,958 | ||||||||
|
| |||||||
| Singapore - 0.5% | ||||||||
| ComfortDelGro Corp. Ltd. | 265,600 | 568,722 | ||||||
| Genting Singapore PLC | 493,100 | 266,065 | ||||||
| Singapore Airlines Ltd. | 232,900 | 1,835,131 | ||||||
| Wilmar International Ltd. | 56,600 | 116,785 | ||||||
|
| |||||||
| 2,786,703 | ||||||||
|
| |||||||
| SHARES | VALUE (Note 5) | |||||||
| Spain - 2.2% | ||||||||
| Abengoa SA, B Shares | 584,599 | $ | 123,509 | |||||
| Abertis Infraestructuras SA (a) | 18,914 | 295,803 | ||||||
| ACS Actividades de Construccion y Servicios SA (a) | 23,825 | 697,060 | ||||||
| Aena SA 144A †(a)(b) | 1,171 | 134,090 | ||||||
| Almirall SA | 57,971 | 1,171,659 | ||||||
| Ebro Foods SA | 23,589 | 464,015 | ||||||
| Enagas SA (a) | 9,547 | 269,301 | ||||||
| Endesa SA (a) | 98,726 | 1,983,370 | ||||||
| Ferrovial SA (a) | 8,398 | 189,906 | ||||||
| Gamesa Corp. Tecnologica SA (a) | 84,170 | 1,440,987 | ||||||
| Gas Natural SDG SA (a) | 110,585 | 2,255,077 | ||||||
| Iberdrola SA (a) | 138,208 | 979,753 | ||||||
| Industria de Diseno Textil SA (a) | 21,969 | 754,726 | ||||||
| Mapfre SA | 52,578 | 131,611 | ||||||
| Mediaset Espana Comunicacion SA (a) | 96,841 | 1,053,612 | ||||||
| Tecnicas Reunidas SA (a) | 15,455 | 584,351 | ||||||
|
| |||||||
| 12,528,830 | ||||||||
|
| |||||||
| Sweden - 2.0% | ||||||||
| BillerudKorsnas AB | 76,801 | 1,421,325 | ||||||
| Boliden AB (a) | 39,055 | 654,335 | ||||||
| Electrolux AB, Series B (a) | 81,866 | 1,975,214 | ||||||
| Hexpol AB | 19,302 | 206,961 | ||||||
| Husqvarna AB, B Shares | 92,252 | 608,808 | ||||||
| ICA Gruppen AB | 3,993 | 145,011 | ||||||
| Securitas AB, B Shares (a) | 48,012 | 734,148 | ||||||
| SKF AB, B Shares | 23,653 | 382,027 | ||||||
| Svenska Cellulosa AB SCA, Class B (a) | 23,184 | 671,875 | ||||||
| Swedish Match AB | 19,696 | 696,005 | ||||||
| Swedish Orphan Biovitrum AB † | 76,835 | 1,218,754 | ||||||
| Tele2 AB, B Shares (a) | 114,683 | 1,143,675 | ||||||
| TeliaSonera AB (a) | 268,314 | 1,332,416 | ||||||
|
| |||||||
| 11,190,554 | ||||||||
|
| |||||||
| Switzerland - 2.9% | ||||||||
| Actelion Ltd. †(a) | 24,776 | 3,442,468 | ||||||
| Adecco SA †(a) | 24,350 | 1,666,581 | ||||||
| Baloise Holding AG | 1,576 | 199,740 | ||||||
| Clariant AG † | 12,499 | 236,993 | ||||||
| DKSH Holding AG † | 1,482 | 93,210 | ||||||
| Flughafen Zuerich AG | 2,422 | 1,817,256 | ||||||
| Galenica AG | 468 | 732,209 | ||||||
| GAM Holding AG † | 5,719 | 94,664 | ||||||
| Geberit AG (a) | 777 | 263,172 | ||||||
| Julius Baer Group Ltd. †(a) | 2,017 | 97,577 | ||||||
| Kuehne + Nagel International AG | 1,277 | 174,948 | ||||||
| Lonza Group AG † | 8,558 | 1,391,829 | ||||||
| Nestle SA (a) | 3,032 | 225,081 | ||||||
| Novartis AG (a) | 2,106 | 181,157 | ||||||
| Partners Group Holding AG | 813 | 292,382 | ||||||
| Roche Holding AG (a) | 2,459 | 681,409 | ||||||
| Sika AG | 104 | 375,835 | ||||||
| Sonova Holding AG | 1,630 | 207,097 | ||||||
| Straumann Holding AG | 752 | 228,238 | ||||||
| Sunrise Communications Group AG 144A †(b) | 1,902 | 112,119 | ||||||
| Swiss Life Holding AG † | 5,419 | 1,459,607 | ||||||
| The accompanying notes are an integral part of these financial statements. | (Continued) |
| AQR Funds | Annual Report | December 2015 | ||||||||||||||
106
Table of Contents
| Schedule of Investments | December 31, 2015 |
| AQR LONG-SHORT EQUITY FUND |
| SHARES | VALUE (Note 5) | |||||||
| Switzerland - 2.9% (continued) | ||||||||
| Swiss Re AG (a) | 17,640 | $ | 1,722,834 | |||||
| Syngenta AG (a) | 239 | 93,545 | ||||||
| Zurich Insurance Group AG †(a) | 1,879 | 482,715 | ||||||
|
| |||||||
| 16,272,666 | ||||||||
|
| |||||||
| United Kingdom - 0.5% | ||||||||
| Dialog Semiconductor PLC †(a) | 41,841 | 1,396,177 | ||||||
| Fiat Chrysler Automobiles NV †(a) | 40,087 | 556,723 | ||||||
| Subsea 7 SA † | 43,065 | 304,813 | ||||||
| Unilever NV CVA (a) | 17,068 | 743,452 | ||||||
|
| |||||||
| 3,001,165 | ||||||||
|
| |||||||
| United States - 0.1% | ||||||||
Thomson Reuters Corp. (1)(a) | 9,270 | 351,117 | ||||||
|
| |||||||
TOTAL COMMON STOCKS | 154,854,032 | |||||||
|
| |||||||
| MONEY MARKET FUNDS - 56.0% | ||||||||
| J.P. Morgan U.S. Treasury Plus Money Market Fund - IM Shares, 0.129% (c)(d) | 183,355,226 | 183,355,226 | ||||||
| J.P. Morgan U.S. Treasury Plus Money Market Fund - Institutional Shares, 0.070% (c)(d) | 129,420,068 | 129,420,068 | ||||||
|
| |||||||
TOTAL MONEY MARKET FUNDS | 312,775,294 | |||||||
|
| |||||||
| SHORT-TERM INVESTMENTS - 29.5% | PRINCIPAL AMOUNT (000’s) | |||||||
| U.S. Treasury Bill, 0.113%, 3/24/2016 (e) | $ | 4,610 | 4,608,184 | |||||
| U.S. Treasury Bill, 0.238%, 2/18/2016 (e) | 4,019 | 4,018,437 | ||||||
| U.S. Treasury Bill, 0.343%, 5/12/2016 (e) | 10,634 | 10,621,675 | ||||||
| U.S. Treasury Bill, 0.536%, 6/9/2016 (e) | 9,879 | 9,859,627 | ||||||
| U.S. Treasury Bill, 0.327%, 5/19/2016 (e) | 46,553 | 46,494,204 | ||||||
| U.S. Treasury Bill, 0.145%, 4/28/2016 (e) | 36,237 | 36,206,633 | ||||||
| U.S. Treasury Bill, 0.264%, 3/3/2016 (e) | 10,085 | 10,083,225 | ||||||
| U.S. Treasury Bill, 0.345%, 5/26/2016 (e) | 7,251 | 7,239,805 | ||||||
| U.S. Treasury Bill, 0.241%, 2/11/2016 (e) | 22,675 | 22,671,848 | ||||||
| U.S. Treasury Bill, 0.516%, 6/23/2016 (e) | 13,655 | 13,624,645 | ||||||
|
| |||||||
TOTAL SHORT-TERM INVESTMENTS | 165,428,283 | |||||||
|
| |||||||
TOTAL INVESTMENTS IN SECURITIES, AT VALUE | 633,057,609 | |||||||
|
| |||||||
SECURITIES SOLD SHORT - (22.0)% | SHARES | VALUE (Note 5) | ||||||
COMMON STOCKS - (21.7)% | ||||||||
| Austria - 0.0% (f) | ||||||||
| ams AG | (2,804 | ) | $ | (93,734 | ) | |||
|
| |||||||
| Belgium - (0.6)% | ||||||||
| Anheuser-Busch InBev SA/NV | (18,830 | ) | (2,343,342 | ) | ||||
| UCB SA | (8,560 | ) | (772,652 | ) | ||||
|
| |||||||
| (3,115,994 | ) | |||||||
|
| |||||||
| Canada - (5.8)% | ||||||||
| Agnico Eagle Mines Ltd. (1) | (64,273 | ) | (1,689,390 | ) | ||||
| Agrium, Inc. (1) | (8,125 | ) | (726,182 | ) | ||||
| AltaGas Ltd. (1) | (11,962 | ) | (267,129 | ) | ||||
| Barrick Gold Corp. (1) | (66,628 | ) | (493,077 | ) | ||||
| Canadian National Railway Co. (1) | (31,653 | ) | (1,769,429 | ) | ||||
| Canadian Natural Resources Ltd. (1) | (22,531 | ) | (492,077 | ) | ||||
| Canadian Pacific Railway Ltd. (1) | (3,136 | ) | (400,539 | ) | ||||
| Canadian Utilities Ltd., Class A (1) | (60,783 | ) | (1,403,056 | ) | ||||
| Cenovus Energy, Inc. (1) | (15,528 | ) | (196,386 | ) | ||||
| DH Corp. (1) | (4,615 | ) | (105,461 | ) | ||||
| Eldorado Gold Corp. (1) | (144,150 | ) | (427,127 | ) | ||||
| Enbridge, Inc. (1) | (69,682 | ) | (2,316,522 | ) | ||||
| First Quantum Minerals Ltd. (1) | (223,650 | ) | (837,253 | ) | ||||
| Fortis, Inc. (1) | (4,953 | ) | (133,910 | ) | ||||
| Franco-Nevada Corp. (1) | (31,761 | ) | (1,452,968 | ) | ||||
| Gildan Activewear, Inc. (1) | (56,978 | ) | (1,619,943 | ) | ||||
| Goldcorp, Inc. (1) | (71,599 | ) | (827,396 | ) | ||||
| Hudson’s Bay Co. (1) | (20,240 | ) | (264,757 | ) | ||||
| Husky Energy, Inc. (1) | (51,632 | ) | (533,970 | ) | ||||
| Imperial Oil Ltd. (1) | (47,918 | ) | (1,561,136 | ) | ||||
| Inter Pipeline Ltd. (1) | (55,449 | ) | (890,021 | ) | ||||
| Keyera Corp. (1) | (30,654 | ) | (891,906 | ) | ||||
| Manulife Financial Corp. (1) | (24,972 | ) | (374,300 | ) | ||||
| Methanex Corp. (1) | (43,367 | ) | (1,432,299 | ) | ||||
| Pembina Pipeline Corp. (1) | (98,683 | ) | (2,150,244 | ) | ||||
| Potash Corp of Saskatchewan, Inc. (1) | (19,063 | ) | (326,511 | ) | ||||
| PrairieSky Royalty Ltd. (1) | (18,797 | ) | (297,774 | ) | ||||
| Precision Drilling Corp. (1) | (194,823 | ) | (770,168 | ) | ||||
| Restaurant Brands International, Inc. (1) | (35,043 | ) | (1,310,599 | ) | ||||
| Rogers Communications, Inc., Class B (1) | (36,827 | ) | (1,270,062 | ) | ||||
| Silver Wheaton Corp. (1) | (61,369 | ) | (762,844 | ) | ||||
| Suncor Energy, Inc. (1) | (15,260 | ) | (393,934 | ) | ||||
| Teck Resources Ltd., Class B (1) | (23,346 | ) | (90,097 | ) | ||||
| Toronto-Dominion Bank/The (1) | (4,060 | ) | (159,149 | ) | ||||
| Tourmaline Oil Corp. (1)† | (36,229 | ) | (585,183 | ) | ||||
| TransAlta Corp. (1) | (28,069 | ) | (99,602 | ) | ||||
| TransCanada Corp. (1) | (82,005 | ) | (2,678,186 | ) | ||||
| Veresen, Inc. (1) | (14,966 | ) | (95,829 | ) | ||||
| Vermilion Energy, Inc. (1) | (15,357 | ) | (417,415 | ) | ||||
| Yamana Gold, Inc. (1) | (101,127 | ) | (187,827 | ) | ||||
|
| |||||||
| (32,701,658 | ) | |||||||
|
| |||||||
| Denmark - (0.6)% | ||||||||
| Carlsberg A/S, Class B | (12,978 | ) | (1,149,743 | ) | ||||
| Coloplast A/S, Class B | (5,003 | ) | (403,928 | ) | ||||
| Novozymes A/S, B Shares | (20,882 | ) | (999,807 | ) | ||||
| Tryg A/S | (33,892 | ) | (673,488 | ) | ||||
|
| |||||||
| (3,226,966 | ) | |||||||
|
| |||||||
| The accompanying notes are an integral part of these financial statements. | (Continued) |
| AQR Funds | Annual Report | December 2015 | ||||||||||||||
107
Table of Contents
| Schedule of Investments | December 31, 2015 |
| AQR LONG-SHORT EQUITY FUND |
| SHARES | VALUE (Note 5) | |||||||
| Finland - (0.9)% | ||||||||
| Kone OYJ, Class B | (5,820 | ) | $ | (246,425 | ) | |||
| Nokia OYJ | (466,695 | ) | (3,301,644 | ) | ||||
| Nokian Renkaat OYJ | (28,221 | ) | (1,007,526 | ) | ||||
| Wartsila OYJ Abp | (11,996 | ) | (547,712 | ) | ||||
|
| |||||||
| (5,103,307 | ) | |||||||
|
| |||||||
| Germany - (4.0)% | ||||||||
| adidas AG | (969 | ) | (94,050 | ) | ||||
| BASF SE | (3,699 | ) | (281,783 | ) | ||||
| Bayerische Motoren Werke AG | (23,136 | ) | (2,437,413 | ) | ||||
| Beiersdorf AG | (12,440 | ) | (1,130,689 | ) | ||||
| Bilfinger SE | (14,229 | ) | (668,685 | ) | ||||
| Commerzbank AG † | (54,493 | ) | (562,290 | ) | ||||
| Continental AG | (4,134 | ) | (1,000,056 | ) | ||||
| Daimler AG | (10,810 | ) | (903,219 | ) | ||||
| Deutsche Post AG | (32,918 | ) | (920,315 | ) | ||||
| Deutsche Telekom AG | (102,109 | ) | (1,833,944 | ) | ||||
| Duerr AG | (6,758 | ) | (536,330 | ) | ||||
| E.ON SE | (141,856 | ) | (1,362,102 | ) | ||||
| Fresenius Medical Care AG & Co. KGaA | (2,951 | ) | (247,986 | ) | ||||
| Infineon Technologies AG | (76,894 | ) | (1,121,016 | ) | ||||
| Rocket Internet SE 144A †(b) | (26,363 | ) | (803,111 | ) | ||||
| RWE AG | (214,350 | ) | (2,702,393 | ) | ||||
| SAP SE | (19,281 | ) | (1,530,009 | ) | ||||
| Siemens AG | (17,417 | ) | (1,685,023 | ) | ||||
| Telefonica Deutschland Holding AG | (134,309 | ) | (708,437 | ) | ||||
| ThyssenKrupp AG | (25,419 | ) | (503,890 | ) | ||||
| Wirecard AG | (29,355 | ) | (1,467,311 | ) | ||||
|
| |||||||
| (22,500,052 | ) | |||||||
|
| |||||||
| Hong Kong - (0.1)% | ||||||||
| Jardine Matheson Holdings Ltd. | (9,300 | ) | (451,329 | ) | ||||
|
| |||||||
| Italy - (0.3)% | ||||||||
| Banco Popolare SC † | (7,635 | ) | (105,213 | ) | ||||
| Mediaset SpA | (109,352 | ) | (453,143 | ) | ||||
| Salvatore Ferragamo SpA | (35,593 | ) | (834,233 | ) | ||||
| UniCredit SpA | (16,889 | ) | (93,374 | ) | ||||
|
| |||||||
| (1,485,963 | ) | |||||||
|
| |||||||
| Luxembourg - (0.4)% | ||||||||
| ArcelorMittal | (198,485 | ) | (837,449 | ) | ||||
| Tenaris SA | (140,719 | ) | (1,666,303 | ) | ||||
|
| |||||||
| (2,503,752 | ) | |||||||
|
| |||||||
| Netherlands - (1.1)% | ||||||||
| Aalberts Industries NV | (6,195 | ) | (213,453 | ) | ||||
| Aegon NV | (37,546 | ) | (212,340 | ) | ||||
| Altice NV, Class A † | (23,967 | ) | (344,341 | ) | ||||
| ASML Holding NV | (24,535 | ) | (2,179,972 | ) | ||||
| Gemalto NV | (14,007 | ) | (840,449 | ) | ||||
| Koninklijke Philips NV | (50,917 | ) | (1,299,619 | ) | ||||
| SBM Offshore NV † | (96,120 | ) | (1,214,259 | ) | ||||
|
| |||||||
| (6,304,433 | ) | |||||||
|
| |||||||
| Norway - (0.4)% | ||||||||
| Gjensidige Forsikring ASA | (34,759 | ) | (556,323 | ) | ||||
| Marine Harvest ASA † | (26,320 | ) | (354,131 | ) | ||||
| SHARES | VALUE (Note 5) | |||||||
| Norway - (0.4)% (continued) | ||||||||
| Norsk Hydro ASA | (24,874 | ) | $ | (92,459 | ) | |||
| Schibsted ASA, Class A | (35,012 | ) | (1,151,077 | ) | ||||
|
| |||||||
| (2,153,990 | ) | |||||||
|
| |||||||
| Portugal - (0.4)% | ||||||||
| Banco Comercial Portugues SA † | (14,433,956 | ) | (764,901 | ) | ||||
| EDP – Energias de Portugal SA | (464,128 | ) | (1,672,412 | ) | ||||
|
| |||||||
| (2,437,313 | ) | |||||||
|
| |||||||
| Singapore - (1.0)% | ||||||||
| CapitaLand Ltd. | (354,600 | ) | (833,484 | ) | ||||
| City Developments Ltd. | (50,100 | ) | (269,519 | ) | ||||
| DBS Group Holdings Ltd. | (10,100 | ) | (118,367 | ) | ||||
| Global Logistic Properties Ltd. | (373,300 | ) | (563,743 | ) | ||||
| Golden Agri-Resources Ltd. | (1,367,800 | ) | (326,717 | ) | ||||
| Hutchison Port Holdings Trust (1) | (770,400 | ) | (400,608 | ) | ||||
| Keppel Corp. Ltd. | (335,400 | ) | (1,532,166 | ) | ||||
| Oversea-Chinese Banking Corp. Ltd. | (118,400 | ) | (731,999 | ) | ||||
| Singapore Post Ltd. | (367,800 | ) | (424,617 | ) | ||||
| Singapore Press Holdings Ltd. | (37,700 | ) | (104,496 | ) | ||||
| Singapore Telecommunications Ltd. | (95,400 | ) | (245,967 | ) | ||||
|
| |||||||
| (5,551,683 | ) | |||||||
|
| |||||||
| Spain - (1.9)% | ||||||||
| Acerinox SA | (8,889 | ) | (90,669 | ) | ||||
| Amadeus IT Holding SA, A Shares | (28,065 | ) | (1,236,955 | ) | ||||
| Atresmedia Corp. de Medios de Comunicacion SA | (40,634 | ) | (432,839 | ) | ||||
| Banco de Sabadell SA | (151,624 | ) | (268,722 | ) | ||||
| Banco Popular Espanol SA | (329,405 | ) | (1,085,352 | ) | ||||
| Banco Santander SA | (352,688 | ) | (1,735,003 | ) | ||||
| Bankia SA | (451,388 | ) | (525,288 | ) | ||||
| Bankinter SA | (32,902 | ) | (233,319 | ) | ||||
| CaixaBank SA | (54,841 | ) | (190,880 | ) | ||||
| Cellnex Telecom SAU 144A (b) | (129,557 | ) | (2,422,322 | ) | ||||
| Distribuidora Internacional de Alimentacion SA † | (39,238 | ) | (231,429 | ) | ||||
| Grifols SA | (9,885 | ) | (456,903 | ) | ||||
| Obrascon Huarte Lain SA | (108,809 | ) | (620,936 | ) | ||||
| Repsol SA | (16,959 | ) | (186,706 | ) | ||||
| Telefonica SA | (64,033 | ) | (710,377 | ) | ||||
| Zardoya Otis SA | (12,950 | ) | (151,456 | ) | ||||
|
| |||||||
| (10,579,156 | ) | |||||||
|
| |||||||
| Sweden - (1.1)% | ||||||||
| Assa Abloy AB, Class B | (8,562 | ) | (179,226 | ) | ||||
| Getinge AB, B Shares | (37,523 | ) | (982,925 | ) | ||||
| Hennes & Mauritz AB, B Shares | (27,980 | ) | (995,256 | ) | ||||
| Hexagon AB, B Shares | (32,695 | ) | (1,209,481 | ) | ||||
| Meda AB, A Shares | (17,935 | ) | (226,105 | ) | ||||
| Nordea Bank AB | (19,133 | ) | (209,923 | ) | ||||
| Skandinaviska Enskilda Banken AB, Class A | (11,478 | ) | (120,708 | ) | ||||
| Svenska Handelsbanken AB, A Shares | (41,444 | ) | (550,438 | ) | ||||
| Swedbank AB, A Shares | (21,587 | ) | (475,423 | ) | ||||
| Telefonaktiebolaget LM Ericsson, B Shares | (56,850 | ) | (548,108 | ) | ||||
| The accompanying notes are an integral part of these financial statements. | (Continued) |
| AQR Funds | Annual Report | December 2015 | ||||||||||||||
108
Table of Contents
| Schedule of Investments | December 31, 2015 |
| AQR LONG-SHORT EQUITY FUND |
| SHARES | VALUE (Note 5) | |||||||
| Sweden - (1.1)% (continued) | ||||||||
| Trelleborg AB, B Shares | (11,422 | ) | $ | (221,676 | ) | |||
| Volvo AB, B Shares | (19,918 | ) | (184,691 | ) | ||||
|
| |||||||
| (5,903,960 | ) | |||||||
|
| |||||||
| Switzerland - (2.2)% | ||||||||
| Aryzta AG † | (17,099 | ) | (865,018 | ) | ||||
| Barry Callebaut AG † | (464 | ) | (504,006 | ) | ||||
| Chocoladefabriken Lindt & Spruengli AG | (33 | ) | (206,075 | ) | ||||
| Cie Financiere Richemont SA | (21,861 | ) | (1,564,656 | ) | ||||
| Credit Suisse Group AG † | (22,097 | ) | (476,013 | ) | ||||
| Dufry AG † | (22,185 | ) | (2,639,621 | ) | ||||
| LafargeHolcim Ltd. † | (46,421 | ) | (2,324,523 | ) | ||||
| OC Oerlikon Corp. AG † | (12,849 | ) | (114,375 | ) | ||||
| SGS SA | (130 | ) | (247,065 | ) | ||||
| Swatch Group AG/The | (6,450 | ) | (2,239,859 | ) | ||||
| Swisscom AG | (1,545 | ) | (773,125 | ) | ||||
| UBS Group AG | (25,303 | ) | (490,865 | ) | ||||
|
| |||||||
| (12,445,201 | ) | |||||||
|
| |||||||
| United Kingdom - (0.7)% | ||||||||
| CNH Industrial NV | (534,783 | ) | (3,662,699 | ) | ||||
|
| |||||||
| United States - (0.2)% | ||||||||
| Valeant Pharmaceuticals International, Inc. (1)† | (12,332 | ) | (1,252,718 | ) | ||||
|
| |||||||
TOTAL COMMON STOCKS SOLD SHORT | (121,473,908 | ) | ||||||
|
| |||||||
| PREFERRED STOCKS - (0.3)% | ||||||||
| Germany - (0.3)% | ||||||||
| Henkel AG & Co. KGaA | (3,835 | ) | (427,994 | ) | ||||
| Volkswagen AG | (9,210 | ) | (1,329,734 | ) | ||||
|
| |||||||
TOTAL PREFERRED STOCKS SOLD SHORT | (1,757,728 | ) | ||||||
|
| |||||||
| TOTAL SECURITIES SOLD SHORT, AT VALUE | ||||||||
(proceeds $133,544,633) | (123,231,636 | ) | ||||||
|
| |||||||
TOTAL INVESTMENTS, NET OF SECURITIES SOLD SHORT - 91.2% | 509,825,973 | |||||||
|
| |||||||
| OTHER ASSETS IN EXCESS OF LIABILITIES - 8.8% (g) | 49,182,166 | |||||||
|
| |||||||
NET ASSETS - 100.0% | $ | 559,008,139 | ||||||
|
| |||||||
| SECTOR | VALUE | % OF NET ASSETS | ||||||
| Consumer Discretionary | $ | (721,643 | ) | (0.1 | )% | |||
| Consumer Staples | 5,342,702 | 1.0 | ||||||
| Energy | (12,357,978 | ) | (2.2 | ) | ||||
| Financials | 11,293,168 | 2.0 | ||||||
| Health Care | 14,175,049 | 2.5 | ||||||
| Industrials | 23,960,090 | 4.4 | ||||||
| Information Technology | (8,990,184 | ) | (1.6 | ) | ||||
| Materials | (2,589,300 | ) | (0.5 | ) | ||||
| Telecommunication Services | 1,352,006 | 0.2 | ||||||
| Utilities | 158,486 | 0.0 | (f) | |||||
| Money Market Funds | 312,775,294 | 56.0 | ||||||
| Short-Term Investments | 165,428,283 | 29.5 | ||||||
|
|
|
| |||||
| Total Investments In Securities, At Value | 509,825,973 | 91.2 | ||||||
| Other Assets in Excess of Liabilities (g) | 49,182,166 | 8.8 | ||||||
|
|
|
| |||||
Net Assets | $ | 559,008,139 | 100.0 | % | ||||
|
|
|
| |||||
| † | Non-income producing security. |
| (a) | All or a portion of this security has been segregated as collateral for securities sold short and can be sold or replaced subject to the broker’s right to re-hypothecate. At December 31, 2015, the value of these securities was $92,655,062. In addition, $28,510,055 of cash collateral was pledged. |
| (b) | Rule 144A, Section 4(2) or other security which is restricted as to resale to institutional investors. The Fund Adviser has deemed this security to be liquid based upon procedures approved by the Board of Trustees. |
| (c) | Represents annualized seven-day yield as of the close of the reporting period. |
| (d) | All or a portion of the security is pledged as collateral to the brokers for forward foreign currency exchange and swap contracts. |
| (e) | The rate shown is the effective yield at the date of purchase. |
| (f) | Represents less than 0.05% of net assets. |
| (g) | Includes appreciation/(depreciation) on forward foreign currency exchange, futures and swap contracts. |
All securities are Level 2 with respect to ASC 820, unless otherwise noted in parentheses.
| (1) | Level 1 security (See Note 5). |
The following abbreviations are used in portfolio descriptions:
144A - Restricted Security
CVA - Dutch Certification
| The accompanying notes are an integral part of these financial statements. | (Continued) |
| AQR Funds | Annual Report | December 2015 | ||||||||||||||
109
Table of Contents
| Schedule of Investments | December 31, 2015 |
| AQR LONG-SHORT EQUITY FUND |
Total return swap contract outstanding as of December 31, 2015:
Over the Counter
| COUNTERPARTY | UNDERLYING REFERENCE INSTRUMENT | TERMINATION DATE | CURRENCY | NOTIONAL VALUE | UNREALIZED APPRECIATION (DEPRECIATION) | |||||||||
| Goldman Sachs | Swiss Market Index March Futures | 03/2016 | CHF | 11,046,131 | $414,386 | |||||||||
|
| |||||||||||||
Open futures contracts outstanding at December 31, 2015:
Exchange Traded
| NUMBER OF CONTRACTS | COUNTERPARTY | DESCRIPTION | EXPIRATION DATE | VALUE AT TRADE DATE | VALUE AT DECEMBER 31, 2015 | UNREALIZED APPRECIATION (DEPRECIATION) | ||||||||||||
| Long Contracts: | ||||||||||||||||||
| 77 | Barclays Capital | Amsterdam Index Futures | 01/2016 | $7,254,448 | $7,394,780 | $140,332 | ||||||||||||
| 143 | Barclays Capital | CAC40 Index Futures | 01/2016 | 7,162,289 | 7,208,473 | 46,184 | ||||||||||||
| 43 | Barclays Capital | DAX Index Futures | 03/2016 | 12,231,478 | 12,584,456 | 352,978 | ||||||||||||
| 254 | Barclays Capital | FTSE 100 Index Futures | 03/2016 | 22,268,511 | 23,208,213 | 939,702 | ||||||||||||
| 40 | Barclays Capital | FTSE/MIB Index Futures | 03/2016 | 4,619,298 | 4,660,419 | 41,121 | ||||||||||||
| 22 | Barclays Capital | Hang Seng Index Futures | 01/2016 | 3,125,379 | 3,109,786 | (15,593 | ) | |||||||||||
| 41 | Barclays Capital | IBEX 35 Index Futures | 01/2016 | 4,275,198 | 4,244,610 | (30,588 | ) | |||||||||||
| 79 | Barclays Capital | MSCI Singapore Index Futures | 01/2016 | 1,797,143 | 1,802,976 | 5,833 | ||||||||||||
| 302 | Barclays Capital | OMXS30 Index Futures | 01/2016 | 5,069,268 | 5,180,342 | 111,074 | ||||||||||||
| 1,818 | Barclays Capital | S&P 500 E-Mini Futures | 03/2016 | 183,491,587 | 185,017,860 | 1,526,273 | ||||||||||||
| 87 | Barclays Capital | S&P/Toronto Stock Exchange 60 Index Futures | 03/2016 | 9,476,410 | 9,568,302 | 91,892 | ||||||||||||
| 81 | Barclays Capital | SPI 200 Index Futures | 03/2016 | 7,272,856 | 7,757,320 | 484,464 | ||||||||||||
| 225 | Barclays Capital | TOPIX Index Futures | 03/2016 | 29,365,960 | 28,968,551 | (397,409 | ) | |||||||||||
|
|
|
|
|
| |||||||||||||
| $ | 297,409,825 | $ | 300,706,088 | $ | 3,296,263 | |||||||||||||
|
|
|
|
|
| |||||||||||||
Forward foreign currency exchange contracts outstanding as of December 31, 2015:
Over the Counter
| PURCHASE CONTRACTS | COUNTERPARTY | CURRENCY | CURRENCY AMOUNT PURCHASED | VALUE AT SETTLEMENT DATE | VALUE AT DECEMBER 31, 2015 | UNREALIZED APPRECIATION (DEPRECIATION) | ||||||||||||||
| Australian Dollar, Expiring 03/16/16 | CitiBank | AUD | 4,630,000 | $3,355,060 | $3,361,833 | $6,773 | ||||||||||||||
| Australian Dollar, Expiring 03/16/16 | Credit Suisse International | AUD | 4,630,000 | 3,355,118 | 3,361,833 | 6,715 | ||||||||||||||
| Canadian Dollar, Expiring 03/16/16 | CitiBank | CAD | 6,609,206 | 4,911,907 | 4,777,393 | (134,514 | ) | |||||||||||||
| Canadian Dollar, Expiring 03/16/16 | Credit Suisse International | CAD | 12,190,204 | 8,940,675 | 8,811,558 | (129,117 | ) | |||||||||||||
| Swiss Franc, Expiring 03/16/16 | CitiBank | CHF | 4,471,291 | 4,481,432 | 4,477,996 | (3,436 | ) | |||||||||||||
| Swiss Franc, Expiring 03/16/16 | Credit Suisse International | CHF | 5,405,291 | 5,417,731 | 5,413,397 | (4,334 | ) | |||||||||||||
| Danish Krone, Expiring 03/16/16 | CitiBank | DKK | 2,047,000 | 297,830 | 298,742 | 912 | ||||||||||||||
| The accompanying notes are an integral part of these financial statements. | (Continued) |
| AQR Funds | Annual Report | December 2015 | ||||||||||||||
110
Table of Contents
| Schedule of Investments | December 31, 2015 |
| AQR LONG-SHORT EQUITY FUND |
| PURCHASE CONTRACTS | COUNTERPARTY | CURRENCY | CURRENCY AMOUNT PURCHASED | VALUE AT SETTLEMENT DATE | VALUE AT DECEMBER 31, 2015 | UNREALIZED APPRECIATION (DEPRECIATION) | ||||||||||||||
| Danish Krone, Expiring 03/16/16 | Credit Suisse International | DKK | 2,047,000 | $ 298,049 | $ 298,742 | $ 693 | ||||||||||||||
| Euro, Expiring 03/16/16 | CitiBank | EUR | 9,751,940 | 10,429,465 | 10,617,394 | 187,929 | ||||||||||||||
| Euro, Expiring 03/16/16 | Credit Suisse International | EUR | 9,797,940 | 10,479,898 | 10,667,476 | 187,578 | ||||||||||||||
| British Pound, Expiring 03/16/16 | CitiBank | GBP | 6,613,001 | 9,901,560 | 9,750,059 | (151,501 | ) | |||||||||||||
| British Pound, Expiring 03/16/16 | Credit Suisse International | GBP | 6,613,000 | 9,901,659 | 9,750,058 | (151,601 | ) | |||||||||||||
| Hong Kong Dollar, Expiring 03/16/16 | CitiBank | HKD | 15,680,500 | 2,024,117 | 2,024,436 | 319 | ||||||||||||||
| Hong Kong Dollar, Expiring 03/16/16 | Credit Suisse International | HKD | 15,680,500 | 2,024,164 | 2,024,436 | 272 | ||||||||||||||
| Israeli Shekel, Expiring 03/16/16 | CitiBank | ILS | 1,408,500 | 363,765 | 362,528 | (1,237 | ) | |||||||||||||
| Israeli Shekel, Expiring 03/16/16 | Credit Suisse International | ILS | 1,593,500 | 411,624 | 410,144 | (1,480 | ) | |||||||||||||
| Japanese Yen, Expiring 03/16/16 | CitiBank | JPY | 1,374,809,501 | 11,222,087 | 11,457,832 | 235,745 | ||||||||||||||
| Japanese Yen, Expiring 03/16/16 | Credit Suisse International | JPY | 1,374,809,500 | 11,222,040 | 11,457,832 | 235,792 | ||||||||||||||
| Norwegian Krone, Expiring 03/16/16 | CitiBank | NOK | 1,410,257 | 162,063 | 159,210 | (2,853 | ) | |||||||||||||
| Norwegian Krone, Expiring 03/16/16 | Credit Suisse International | NOK | 7,560,258 | 868,179 | 853,511 | (14,668 | ) | |||||||||||||
| New Zealand Dollar, Expiring 03/16/16 | CitiBank | NZD | 132,500 | 88,261 | 90,224 | 1,963 | ||||||||||||||
| New Zealand Dollar, Expiring 03/16/16 | Credit Suisse International | NZD | 132,499 | 88,263 | 90,223 | 1,960 | ||||||||||||||
| Swedish Krona, Expiring 03/16/16 | CitiBank | SEK | 1,970,500 | 230,509 | 233,919 | 3,410 | ||||||||||||||
| Swedish Krona, Expiring 03/16/16 | Credit Suisse International | SEK | 9,802,500 | 1,151,285 | 1,163,657 | 12,372 | ||||||||||||||
| Singapore Dollar, Expiring 03/16/16 | CitiBank | SGD | 2,332,858 | 1,652,262 | 1,641,400 | (10,862 | ) | |||||||||||||
| Singapore Dollar, Expiring 03/16/16 | Credit Suisse International | SGD | 4,187,857 | 2,963,310 | 2,946,578 | (16,732 | ) | |||||||||||||
|
|
|
|
|
| |||||||||||||||
| $106,242,313 | $106,502,411 | $260,098 | ||||||||||||||||||
|
|
|
|
|
| |||||||||||||||
| SALES CONTRACTS | COUNTERPARTY | CURRENCY | CURRENCY AMOUNT SOLD | VALUE AT SETTLEMENT DATE | VALUE AT DECEMBER 31, 2015 | UNREALIZED APPRECIATION (DEPRECIATION) | ||||||||||||||
| Canadian Dollar, Expiring 03/16/16 | Credit Suisse International | CAD | (312,000 | ) | $(227,871 | ) | $(225,526 | ) | $2,345 | |||||||||||
| Swiss Franc, Expiring 03/16/16 | Credit Suisse International | CHF | (2,685,000 | ) | (2,714,530 | ) | (2,689,026 | ) | 25,504 | |||||||||||
| Danish Krone, Expiring 03/16/16 | CitiBank | DKK | (15,098,279 | ) | (2,199,031 | ) | (2,203,461 | ) | (4,430 | ) | ||||||||||
| Danish Krone, Expiring 03/16/16 | Credit Suisse International | DKK | (26,227,278 | ) | (3,827,917 | ) | (3,827,640 | ) | 277 | |||||||||||
| Euro, Expiring 03/16/16 | Credit Suisse International | EUR | (10,916,000 | ) | (11,929,042 | ) | (11,884,760 | ) | 44,282 | |||||||||||
| Hong Kong Dollar, Expiring 03/16/16 | CitiBank | HKD | (127,000 | ) | (16,388 | ) | (16,396 | ) | (8 | ) | ||||||||||
| The accompanying notes are an integral part of these financial statements. | (Continued) |
| AQR Funds | Annual Report | December 2015 | ||||||||||||||
111
Table of Contents
| Schedule of Investments | December 31, 2015 |
| AQR LONG-SHORT EQUITY FUND |
| SALES CONTRACTS | COUNTERPARTY | CURRENCY | CURRENCY AMOUNT SOLD | VALUE AT SETTLEMENT DATE | VALUE AT DECEMBER 31, 2015 | UNREALIZED APPRECIATION (DEPRECIATION) | ||||||||||||||
| Hong Kong Dollar, Expiring 03/16/16 | Credit Suisse International | HKD | (11,815,000 | ) | $ (1,525,054 | ) | $ (1,525,380 | ) | $ (326 | ) | ||||||||||
| Japanese Yen, Expiring 03/16/16 | CitiBank | JPY | (8,889,500 | ) | (72,569 | ) | (74,086 | ) | (1,517 | ) | ||||||||||
| Japanese Yen, Expiring 03/16/16 | Credit Suisse International | JPY | (8,889,500 | ) | (72,569 | ) | (74,086 | ) | (1,517 | ) | ||||||||||
| Norwegian Krone, Expiring 03/16/16 | Credit Suisse International | NOK | (1,350,000 | ) | (155,747 | ) | (152,407 | ) | 3,340 | |||||||||||
| Swedish Krona, Expiring 03/16/16 | CitiBank | SEK | (11,668,119 | ) | (1,345,949 | ) | (1,385,125 | ) | (39,176 | ) | ||||||||||
| Swedish Krona, Expiring 03/16/16 | Credit Suisse International | SEK | (22,351,119 | ) | (2,623,011 | ) | (2,653,307 | ) | (30,296 | ) | ||||||||||
| Singapore Dollar, Expiring 03/16/16 | Credit Suisse International | SGD | (1,149,000 | ) | (814,910 | ) | (808,437 | ) | 6,473 | |||||||||||
|
|
|
|
|
| |||||||||||||||
| (27,524,588 | ) | (27,519,637 | ) | 4,951 | ||||||||||||||||
|
|
|
|
|
| |||||||||||||||
| $78,717,725 | $78,982,774 | $265,049 | ||||||||||||||||||
|
|
|
|
|
| |||||||||||||||
AUD - Australian Dollar
CAD - Canadian Dollar
CHF - Swiss Franc
DKK - Danish Krone
EUR - Euro
GBP - British Pound
HKD - Hong Kong Dollar
ILS - Israeli Shekel
JPY - Japanese Yen
NOK - Norwegian Krone
NZD - New Zealand Dollar
SEK - Swedish Krona
SGD - Singapore Dollar
USD - United States Dollar
| The accompanying notes are an integral part of these financial statements. | (Continued) |
| AQR Funds | Annual Report | December 2015 | ||||||||||||||
112
Table of Contents
| Schedule of Investments | December 31, 2015 |
| AQR LONG-SHORT EQUITY FUND |
Total Return Basket Swaps* Outstanding at December 31, 2015
| COUNTERPARTY | DESCRIPTION | TERMINATION DATE** | VALUE (Note 5) | |||||
| Deutsche Bank | The Fund receives the total return on a portfolio of long and short positions and pays or receives the JPY/USD 1 Week Forward FX Swap Rate plus or minus a specified spread, which is denominated in JPY based on the local currencies of the positions within the swap. | 38 months maturity 08/22/2016 | $833,232 | |||||
|
| |||||||
| * | See the accompanying “Additional Information — Total Return Basket Swap” for further details. |
| ** | The maturity dates are measured from the commencement of investment in each underlying portfolio swap positions. |
Additional Information — Total Return Basket Swap
The following table represents the individual long and short positions and related values within the total return basket swap as of December 31, 2015.
| REFERENCE ENTITY | SHARES | NOTIONAL (a) | NET UNREALIZED APPRECIATION (DEPRECIATION) | |||||||||
| Long Positions | ||||||||||||
| Common Stocks | ||||||||||||
| Japan | ||||||||||||
| ABC-Mart, Inc. | 1,800 | $ | 103,059 | $ | (4,530 | ) | ||||||
| Ajinomoto Co., Inc. | 24,000 | 527,606 | 40,612 | |||||||||
| Alfresa Holdings Corp. | 11,100 | 219,739 | (511 | ) | ||||||||
| Alps Electric Co., Ltd. | 31,300 | 848,700 | 94 | |||||||||
| Amada Holdings Co., Ltd. | 113,100 | 1,109,879 | (30,601 | ) | ||||||||
| Aozora Bank Ltd. | 113,000 | 414,517 | (20,167 | ) | ||||||||
| Asahi Kasei Corp. | 24,000 | 199,174 | (36,883 | ) | ||||||||
| Astellas Pharma, Inc. | 44,500 | 637,051 | (3,559 | ) | ||||||||
| Bandai Namco Holdings, Inc. | 81,500 | 1,859,107 | (137,246 | ) | ||||||||
| Bank of Yokohama Ltd./The | 44,000 | 267,557 | 2,146 | |||||||||
| Bridgestone Corp. | 25,400 | 938,152 | (66,896 | ) | ||||||||
| Central Japan Railway Co. | 3,000 | 456,851 | 75,751 | |||||||||
| Chiba Bank Ltd./The | 16,000 | 124,278 | (10,738 | ) | ||||||||
| Chubu Electric Power Co., Inc. | 191,700 | 2,815,466 | (190,377 | ) | ||||||||
| Chugoku Bank Ltd./The | 17,900 | 257,781 | (18,928 | ) | ||||||||
| Dai Nippon Printing Co., Ltd. | 10,000 | 86,424 | 12,463 | |||||||||
| Daicel Corp. | 44,900 | 562,155 | 106,042 | |||||||||
| Dai-ichi Life Insurance Co., Ltd./The | 115,700 | 1,948,470 | (23,489 | ) | ||||||||
| Daiichi Sankyo Co., Ltd. | 23,800 | 473,197 | 18,028 | |||||||||
| DeNA Co., Ltd. | 82,500 | 1,397,867 | (107,869 | ) | ||||||||
| Dentsu, Inc. | 3,500 | 175,604 | 15,888 | |||||||||
| Disco Corp. | 6,000 | 546,872 | 18,157 | |||||||||
| Don Quijote Holdings Co., Ltd. | 12,500 | 489,075 | (50,091 | ) | ||||||||
| Ezaki Glico Co., Ltd. | 1,900 | 99,936 | 2,709 | |||||||||
| Fuji Electric Co., Ltd. | 61,000 | 247,324 | 8,502 | |||||||||
| Fuji Heavy Industries Ltd. | 58,100 | 1,978,379 | 415,125 | |||||||||
| FUJIFILM Holdings Corp. | 26,400 | 1,021,144 | 80,594 | |||||||||
| Fujitsu Ltd. | 59,000 | 325,513 | (31,037 | ) | ||||||||
| REFERENCE ENTITY | SHARES | NOTIONAL (a) | NET UNREALIZED APPRECIATION (DEPRECIATION) | |||||||||
| Japan (continued) | ||||||||||||
| Fukuoka Financial Group, Inc. | 19,000 | $ | 90,734 | $ | 3,480 | |||||||
| Gunma Bank Ltd./The | 74,000 | 489,334 | (59,081 | ) | ||||||||
| Hachijuni Bank Ltd./The | 43,000 | 322,271 | (59,111 | ) | ||||||||
| Hakuhodo DY Holdings, Inc. | 67,100 | 706,921 | 19,072 | |||||||||
| Haseko Corp. | 201,200 | 2,372,810 | (148,268 | ) | ||||||||
| Hikari Tsushin, Inc. | 1,400 | 93,454 | 1,886 | |||||||||
| Hino Motors Ltd. | 17,100 | 198,683 | (1,051 | ) | ||||||||
| Hiroshima Bank Ltd./The | 27,000 | 161,253 | (7,791 | ) | ||||||||
| Hitachi Chemical Co., Ltd. | 26,500 | 426,153 | (5,739 | ) | ||||||||
| Hitachi High-Technologies Corp. | 38,900 | 968,697 | 83,279 | |||||||||
| Hitachi Metals Ltd. | 12,200 | 193,964 | (43,437 | ) | ||||||||
| Hokuhoku Financial Group, Inc. | 168,000 | 401,337 | (58,862 | ) | ||||||||
| Hoshizaki Electric Co., Ltd. | 3,300 | 218,411 | (13,266 | ) | ||||||||
| Hoya Corp. | 61,300 | 2,362,252 | 144,463 | |||||||||
| Ibiden Co., Ltd. | 10,400 | 177,760 | (28,661 | ) | ||||||||
| Idemitsu Kosan Co., Ltd. | 17,300 | 273,516 | 2,717 | |||||||||
| Iida Group Holdings Co., Ltd. | 13,800 | 256,167 | (397 | ) | ||||||||
| Inpex Corp. | 71,000 | 706,617 | (14,444 | ) | ||||||||
| Isuzu Motors Ltd. | 154,100 | 1,756,480 | (96,416 | ) | ||||||||
| ITOCHU Corp. | 36,600 | 460,843 | (27,922 | ) | ||||||||
| Itochu Techno-Solutions Corp. | 47,500 | 1,003,536 | (57,128 | ) | ||||||||
| Iyo Bank Ltd./The | 16,100 | 197,558 | (41,135 | ) | ||||||||
| Izumi Co., Ltd. | 13,300 | 588,670 | (72,332 | ) | ||||||||
| Japan Airlines Co., Ltd. | 87,800 | 3,000,781 | 141,836 | |||||||||
| Japan Petroleum Exploration Co., Ltd. | 37,600 | 1,084,372 | (74,535 | ) | ||||||||
| JSR Corp. | 20,200 | 342,382 | (27,578 | ) | ||||||||
| JTEKT Corp. | 45,100 | 736,826 | 1,375 | |||||||||
| JX Holdings, Inc. | 297,500 | 1,221,901 | 26,731 | |||||||||
| The accompanying notes are an integral part of these financial statements. | (Continued) |
| AQR Funds | Annual Report | December 2015 | ||||||||||||||
113
Table of Contents
| Schedule of Investments | December 31, 2015 |
| AQR LONG-SHORT EQUITY FUND |
| REFERENCE ENTITY | SHARES | NOTIONAL (a) | NET UNREALIZED APPRECIATION (DEPRECIATION) | |||||||||
| Japan (continued) | ||||||||||||
| Kaken Pharmaceutical Co., Ltd. | 24,500 | $ | 1,943,562 | $ | (269,400 | ) | ||||||
| Kamigumi Co., Ltd. | 62,000 | 538,727 | (4,919 | ) | ||||||||
| Kaneka Corp. | 54,000 | 556,992 | 4,298 | |||||||||
| Kansai Electric Power Co., Inc./The | 22,300 | 265,977 | 1,396 | |||||||||
| KDDI Corp. | 15,100 | 384,697 | 7,453 | |||||||||
| Keisei Electric Railway Co., Ltd. | 7,000 | 86,256 | 3,052 | |||||||||
| Kewpie Corp. | 23,500 | 546,411 | 34,082 | |||||||||
| Kobayashi Pharmaceutical Co., Ltd. | 1,200 | 95,243 | 3,313 | |||||||||
| Koito Manufacturing Co., Ltd. | 17,000 | 656,728 | 40,398 | |||||||||
| Konami Holdings Corp. | 84,600 | 1,921,004 | 92,860 | |||||||||
| Konica Minolta, Inc. | 157,000 | 1,689,392 | (117,009 | ) | ||||||||
| LIXIL Group Corp. | 22,400 | 469,632 | 27,866 | |||||||||
| M3, Inc. | 9,700 | 226,335 | (25,213 | ) | ||||||||
| Mazda Motor Corp. | 54,700 | 1,171,747 | (43,025 | ) | ||||||||
| Medipal Holdings Corp. | 86,400 | 1,549,140 | (76,539 | ) | ||||||||
| MEIJI Holdings Co., Ltd. | 4,700 | 317,801 | 70,417 | |||||||||
| Miraca Holdings, Inc. | 5,300 | 234,812 | (1,604 | ) | ||||||||
| MISUMI Group, Inc. | 38,000 | 454,936 | 69,983 | |||||||||
| Mitsubishi Chemical Holdings Corp. | 37,100 | 219,346 | 16,043 | |||||||||
| Mitsubishi Electric Corp. | 288,000 | 3,098,758 | (75,667 | ) | ||||||||
| Mitsubishi Materials Corp. | 29,000 | 86,766 | 4,574 | |||||||||
| Mitsubishi Motors Corp. | 476,100 | 4,246,461 | (218,400 | ) | ||||||||
| Mitsubishi Tanabe Pharma Corp. | 123,900 | 2,144,785 | (10,157 | ) | ||||||||
| Mitsubishi UFJ Financial Group, Inc. | 47,400 | 345,566 | (51,958 | ) | ||||||||
| Mitsubishi UFJ Lease & Finance Co., Ltd. | 50,900 | 264,129 | (2,186 | ) | ||||||||
| Mitsui Chemicals, Inc. | 225,000 | 999,200 | (1,324 | ) | ||||||||
| Mixi, Inc. | 45,700 | 1,768,886 | (59,550 | ) | ||||||||
| Mizuho Financial Group, Inc. | 199,600 | 423,290 | (24,090 | ) | ||||||||
| MS&AD Insurance Group Holdings, Inc. | 47,600 | 1,390,993 | 4,861 | |||||||||
| Murata Manufacturing Co., Ltd. | 4,500 | 611,958 | 35,508 | |||||||||
| Nexon Co., Ltd. | 100,100 | 1,475,216 | 153,185 | |||||||||
| NHK Spring Co., Ltd. | 136,300 | 1,397,846 | (31,264 | ) | ||||||||
| Nintendo Co., Ltd. | 5,600 | 1,034,438 | (264,381 | ) | ||||||||
| Nippon Express Co., Ltd. | 337,000 | 1,675,309 | (91,670 | ) | ||||||||
| Nippon Shokubai Co., Ltd. | 10,700 | 775,004 | (30,444 | ) | ||||||||
| Nippon Telegraph & Telephone Corp. | 79,600 | 2,884,966 | 282,964 | |||||||||
| Nippon Yusen KK | 188,000 | 518,395 | (62,741 | ) | ||||||||
| Nisshin Seifun Group, Inc. | 30,300 | 495,237 | (302 | ) | ||||||||
| REFERENCE ENTITY | SHARES | NOTIONAL (a) | NET UNREALIZED APPRECIATION (DEPRECIATION) | |||||||||
| Japan (continued) | ||||||||||||
| Nissin Foods Holdings Co., Ltd. | 1,800 | $ | 86,889 | $ | 8,625 | |||||||
| Nitori Holdings Co., Ltd. | 2,700 | 158,127 | 68,624 | |||||||||
| Nitto Denko Corp. | 9,100 | 635,525 | 28,827 | |||||||||
| NOK Corp. | 70,300 | 2,044,174 | (401,906 | ) | ||||||||
| Nomura Research Institute Ltd. | 17,140 | 649,306 | 8,934 | |||||||||
| NSK Ltd. | 54,800 | 606,632 | (11,179 | ) | ||||||||
| NTN Corp. | 156,000 | 693,280 | (35,480 | ) | ||||||||
| NTT Data Corp. | 3,200 | 155,162 | (454 | ) | ||||||||
| Obic Co., Ltd. | 6,900 | 319,807 | 45,442 | |||||||||
| Oracle Corp. Japan | 15,400 | 703,343 | 13,682 | |||||||||
| ORIX Corp. | 59,200 | 859,384 | (28,899 | ) | ||||||||
| Osaka Gas Co., Ltd. | 36,000 | 136,026 | (5,996 | ) | ||||||||
| Otsuka Corp. | 28,400 | 1,338,607 | 56,509 | |||||||||
| Otsuka Holdings Co., Ltd. | 38,300 | 1,306,980 | 53,779 | |||||||||
| Panasonic Corp. | 130,000 | 1,494,807 | (176,931 | ) | ||||||||
| Park24 Co., Ltd. | 12,600 | 225,456 | 79,809 | |||||||||
| Pola Orbis Holdings, Inc. | 49,400 | 3,143,321 | 112,563 | |||||||||
| Recruit Holdings Co., Ltd. | 16,200 | 507,352 | (31,172 | ) | ||||||||
| Resona Holdings, Inc. | 84,400 | 443,917 | (34,051 | ) | ||||||||
| Rohm Co., Ltd. | 15,400 | 802,458 | (22,435 | ) | ||||||||
| Ryohin Keikaku Co., Ltd. | 1,000 | 196,483 | 6,029 | |||||||||
| Sankyo Co., Ltd. | 26,400 | 1,006,020 | (20,567 | ) | ||||||||
| Santen Pharmaceutical Co., Ltd. | 69,600 | 1,006,142 | 139,712 | |||||||||
| Sekisui Chemical Co., Ltd. | 105,100 | 1,281,126 | 91,088 | |||||||||
| Shimadzu Corp. | 67,000 | 1,010,636 | 110,938 | |||||||||
| Shimamura Co., Ltd. | 9,900 | 1,020,321 | 139,059 | |||||||||
| Shimizu Corp. | 32,000 | 220,907 | 40,028 | |||||||||
| Shinsei Bank Ltd. | 52,000 | 103,493 | (7,797 | ) | ||||||||
| Shionogi & Co., Ltd. | 19,200 | 869,430 | (1,010 | ) | ||||||||
| Sojitz Corp. | 1,057,300 | 2,342,504 | (123,675 | ) | ||||||||
| Sompo Japan Nipponkoa Holdings, Inc. | 40,500 | 1,385,177 | (55,372 | ) | ||||||||
| Sony Corp. | 27,500 | 750,354 | (74,492 | ) | ||||||||
| Sony Financial Holdings, Inc. | 8,100 | 147,727 | (2,841 | ) | ||||||||
| Sugi Holdings Co., Ltd. | 8,400 | 417,519 | 45,932 | |||||||||
| Sumitomo Chemical Co., Ltd. | 217,000 | 1,269,160 | (22,908 | ) | ||||||||
| Sumitomo Electric Industries Ltd. | 6,700 | 92,457 | 2,153 | |||||||||
| Sumitomo Heavy Industries Ltd. | 189,000 | 1,104,802 | (257,542 | ) | ||||||||
| Sumitomo Mitsui Financial Group, Inc. | 12,900 | 584,656 | (97,796 | ) | ||||||||
| Sumitomo Rubber Industries Ltd. | 41,700 | 699,851 | (157,611 | ) | ||||||||
| Sundrug Co., Ltd. | 8,000 | 516,830 | (2,456 | ) | ||||||||
| Suruga Bank Ltd. | 15,900 | 332,326 | (4,649 | ) | ||||||||
| The accompanying notes are an integral part of these financial statements. | (Continued) |
| AQR Funds | Annual Report | December 2015 | ||||||||||||||
114
Table of Contents
| Schedule of Investments | December 31, 2015 |
| AQR LONG-SHORT EQUITY FUND |
| REFERENCE ENTITY | SHARES | NOTIONAL (a) | NET UNREALIZED APPRECIATION (DEPRECIATION) | |||||||||
| Japan (continued) | ||||||||||||
| Suzuken Co., Ltd./Aichi Japan | 53,700 | $ | 1,999,009 | $ | 41,708 | |||||||
| Suzuki Motor Corp. | 8,300 | 229,234 | 22,952 | |||||||||
| T&D Holdings, Inc. | 85,500 | 1,127,936 | 111 | |||||||||
| Taiheiyo Cement Corp. | 158,000 | 484,609 | (23,200 | ) | ||||||||
| TDK Corp. | 6,100 | 422,260 | (31,592 | ) | ||||||||
| Teijin Ltd. | 327,000 | 1,152,029 | (37,656 | ) | ||||||||
| Toho Gas Co., Ltd. | 90,000 | 575,161 | 6,080 | |||||||||
| Tohoku Electric Power Co., Inc. | 147,700 | 1,954,597 | (108,153 | ) | ||||||||
| Tokio Marine Holdings, Inc. | 23,700 | 936,588 | (21,185 | ) | ||||||||
| Tokyo Electric Power Co., Inc. | 464,000 | 2,723,220 | (51,389 | ) | ||||||||
| Tokyo Gas Co., Ltd. | 339,000 | 1,623,428 | (30,537 | ) | ||||||||
| Toppan Printing Co., Ltd. | 56,000 | 501,902 | 14,036 | |||||||||
| Tosoh Corp. | 169,000 | 866,117 | 3,222 | |||||||||
| TOTO Ltd. | 9,500 | 323,222 | 10,533 | |||||||||
| Toyo Suisan Kaisha Ltd. | 20,300 | 727,367 | (19,860 | ) | ||||||||
| Toyoda Gosei Co., Ltd. | 9,900 | 227,934 | (3,036 | ) | ||||||||
| Toyota Boshoku Corp. | 38,800 | 811,101 | (30,158 | ) | ||||||||
| Trend Micro, Inc. | 2,300 | 84,005 | 9,322 | |||||||||
| Tsuruha Holdings, Inc. | 13,400 | 1,163,138 | (2,082 | ) | ||||||||
| West Japan Railway Co. | 6,300 | 338,949 | 96,526 | |||||||||
| Yamaguchi Financial Group, Inc. | 15,000 | 196,320 | (18,612 | ) | ||||||||
|
| |||||||||||
| (1,657,172 | ) | |||||||||||
|
| |||||||||||
Total of Long Equity Positions | (1,657,172 | ) | ||||||||||
|
| |||||||||||
| Short Positions | ||||||||||||
| Common Stocks | ||||||||||||
| Japan | ||||||||||||
| Acom Co., Ltd. | (450,400 | ) | (1,871,293 | ) | (249,647 | ) | ||||||
| Advantest Corp. | (43,200 | ) | (366,562 | ) | 8,208 | |||||||
| Aeon Co., Ltd. | (82,800 | ) | (953,412 | ) | (322,337 | ) | ||||||
| AEON Financial Service Co., Ltd. | (30,100 | ) | (620,431 | ) | (51,964 | ) | ||||||
| Aisin Seiki Co., Ltd. | (7,300 | ) | (323,325 | ) | 9,144 | |||||||
| ANA Holdings, Inc. | (177,000 | ) | (505,770 | ) | (4,894 | ) | ||||||
| Asahi Glass Co., Ltd. | (147,000 | ) | (855,685 | ) | 13,544 | |||||||
| Asahi Group Holdings Ltd. | (33,200 | ) | (1,043,012 | ) | 3,706 | |||||||
| Asics Corp. | (57,300 | ) | (1,341,326 | ) | 152,494 | |||||||
| Brother Industries Ltd. | (10,800 | ) | (126,360 | ) | 2,292 | |||||||
| Calbee, Inc. | (23,100 | ) | (967,967 | ) | (7,524 | ) | ||||||
| Canon, Inc. | (37,200 | ) | (1,177,065 | ) | 51,764 | |||||||
| Century Tokyo Leasing Corp. | (6,400 | ) | (225,510 | ) | (3,109 | ) | ||||||
| Chiyoda Corp. | (95,000 | ) | (852,811 | ) | 131,420 | |||||||
| Chugai Pharmaceutical Co., Ltd. | (41,700 | ) | (1,433,241 | ) | (20,280 | ) | ||||||
| Chugoku Electric Power Co., Inc./The | (52,800 | ) | (716,942 | ) | 19,804 | |||||||
| Citizen Holdings Co., Ltd. | (34,300 | ) | (255,534 | ) | 9,011 | |||||||
| REFERENCE ENTITY | SHARES | NOTIONAL (a) | NET UNREALIZED APPRECIATION (DEPRECIATION) | |||||||||
| Japan (continued) | ||||||||||||
| Credit Saison Co., Ltd. | (32,000 | ) | $ | (622,135 | ) | $ | (8,335 | ) | ||||
| Daihatsu Motor Co., Ltd. | (12,200 | ) | (166,249 | ) | 1,671 | |||||||
| Daikin Industries Ltd. | (22,600 | ) | (1,541,973 | ) | (103,797 | ) | ||||||
| Daiwa Securities Group, Inc. | (30,000 | ) | (232,190 | ) | 48,780 | |||||||
| Denso Corp. | (57,400 | ) | (2,722,218 | ) | (20,670 | ) | ||||||
| Eisai Co., Ltd. | (5,100 | ) | (284,065 | ) | (53,304 | ) | ||||||
| Electric Power Development Co., Ltd. | (11,600 | ) | (410,837 | ) | (2,316 | ) | ||||||
| FamilyMart Co., Ltd. | (5,200 | ) | (242,285 | ) | 304 | |||||||
| Fast Retailing Co., Ltd. | (3,700 | ) | (1,394,034 | ) | 99,732 | |||||||
| Hamamatsu Photonics KK | (41,700 | ) | (1,139,051 | ) | (4,164 | ) | ||||||
| Hirose Electric Co., Ltd. | (2,800 | ) | (377,079 | ) | 38,077 | |||||||
| Hitachi Construction Machinery Co., Ltd. | (40,300 | ) | (637,108 | ) | 10,350 | |||||||
| Hitachi Ltd. | (116,000 | ) | (718,459 | ) | 61,159 | |||||||
| Honda Motor Co., Ltd. | (59,000 | ) | (1,989,412 | ) | 103,682 | |||||||
| IHI Corp. | (798,000 | ) | (2,798,546 | ) | 595,668 | |||||||
| Isetan Mitsukoshi Holdings Ltd. | (52,500 | ) | (722,219 | ) | 37,564 | |||||||
| J Front Retailing Co., Ltd. | (23,200 | ) | (308,451 | ) | (28,822 | ) | ||||||
| Japan Airport Terminal Co., Ltd. | (41,300 | ) | (1,938,706 | ) | 110,394 | |||||||
| Japan Display, Inc. | (112,800 | ) | (381,567 | ) | 56,561 | |||||||
| Japan Tobacco, Inc. | (68,900 | ) | (2,515,495 | ) | (14,084 | ) | ||||||
| JFE Holdings, Inc. | (57,500 | ) | (930,152 | ) | 27,264 | |||||||
| JGC Corp. | (44,000 | ) | (831,074 | ) | 157,600 | |||||||
| Kakaku.com, Inc. | (40,200 | ) | (718,611 | ) | (72,107 | ) | ||||||
| Kao Corp. | (19,200 | ) | (900,446 | ) | (86,218 | ) | ||||||
| Kawasaki Heavy Industries Ltd. | (92,000 | ) | (349,995 | ) | 9,604 | |||||||
| Keihan Electric Railway Co., Ltd. | (23,000 | ) | (152,201 | ) | (1,836 | ) | ||||||
| Keikyu Corp. | (56,000 | ) | (457,774 | ) | (4,968 | ) | ||||||
| Keio Corp. | (151,000 | ) | (1,201,476 | ) | (102,518 | ) | ||||||
| Kikkoman Corp. | (11,000 | ) | (372,739 | ) | (8,383 | ) | ||||||
| Kintetsu Group Holdings Co., Ltd. | (147,000 | ) | (520,726 | ) | (76,945 | ) | ||||||
| Kirin Holdings Co., Ltd. | (86,200 | ) | (1,199,636 | ) | 29,286 | |||||||
| Kobe Steel Ltd. | (189,000 | ) | (206,240 | ) | 888 | |||||||
| Komatsu Ltd. | (34,200 | ) | (613,348 | ) | 53,753 | |||||||
| Kubota Corp. | (64,000 | ) | (1,037,516 | ) | 48,802 | |||||||
| Kyocera Corp. | (3,400 | ) | (175,299 | ) | 17,402 | |||||||
| Kyowa Hakko Kirin Co., Ltd. | (6,000 | ) | (89,386 | ) | (5,022 | ) | ||||||
| Kyushu Electric Power Co., Inc. | (279,100 | ) | (3,171,620 | ) | 129,680 | |||||||
| Mabuchi Motor Co., Ltd. | (3,100 | ) | (172,294 | ) | 4,289 | |||||||
| Makita Corp. | (16,900 | ) | (964,419 | ) | (9,472 | ) | ||||||
| Marubeni Corp. | (127,000 | ) | (679,799 | ) | 26,880 | |||||||
| Marui Group Co., Ltd. | (167,000 | ) | (1,905,598 | ) | (811,929 | ) | ||||||
| Minebea Co., Ltd. | (95,000 | ) | (1,387,039 | ) | 573,652 | |||||||
| Mitsubishi Heavy Industries Ltd. | (204,000 | ) | (1,001,475 | ) | 109,485 | |||||||
| The accompanying notes are an integral part of these financial statements. | (Continued) |
| AQR Funds | Annual Report | December 2015 | ||||||||||||||
115
Table of Contents
| Schedule of Investments | December 31, 2015 |
| AQR LONG-SHORT EQUITY FUND |
| REFERENCE ENTITY | SHARES | NOTIONAL (a) | NET UNREALIZED APPRECIATION (DEPRECIATION) | |||||||||
| Japan (continued) | ||||||||||||
| Mitsubishi Logistics Corp. | (135,000 | ) | $ | (1,787,248 | ) | $ | 8,464 | |||||
| Mitsui OSK Lines Ltd. | (1,326,000 | ) | (3,735,908 | ) | 391,368 | |||||||
| Nagoya Railroad Co., Ltd. | (73,000 | ) | (303,198 | ) | (636 | ) | ||||||
| NGK Insulators Ltd. | (18,000 | ) | (422,103 | ) | 16,379 | |||||||
| NGK Spark Plug Co., Ltd. | (105,900 | ) | (2,817,099 | ) | 28,914 | |||||||
| Nidec Corp. | (34,200 | ) | (2,512,208 | ) | 32,161 | |||||||
| Nippon Electric Glass Co., Ltd. | (126,000 | ) | (588,709 | ) | (46,352 | ) | ||||||
| Nippon Paint Holdings Co., Ltd. | (108,400 | ) | (2,557,517 | ) | (65,984 | ) | ||||||
| Nippon Steel & Sumitomo Metal Corp. | (50,900 | ) | (1,023,958 | ) | 17,036 | |||||||
| Nissan Motor Co., Ltd. | (49,600 | ) | (475,889 | ) | (43,460 | ) | ||||||
| Nomura Holdings, Inc. | (52,300 | ) | (302,222 | ) | 10,908 | |||||||
| Obayashi Corp. | (49,000 | ) | (292,030 | ) | (160,103 | ) | ||||||
| Odakyu Electric Railway Co., Ltd. | (133,000 | ) | (1,310,862 | ) | (121,123 | ) | ||||||
| Olympus Corp. | (29,200 | ) | (1,090,058 | ) | (59,507 | ) | ||||||
| Oriental Land Co., Ltd. | (46,300 | ) | (2,649,824 | ) | (151,162 | ) | ||||||
| Pigeon Corp. | (30,300 | ) | (725,829 | ) | (9,252 | ) | ||||||
| Rakuten, Inc. | (50,200 | ) | (547,329 | ) | (30,862 | ) | ||||||
| Ricoh Co., Ltd. | (338,100 | ) | (3,444,354 | ) | (36,995 | ) | ||||||
| Rinnai Corp. | (6,900 | ) | (599,114 | ) | (12,250 | ) | ||||||
| Secom Co., Ltd. | (6,800 | ) | (456,967 | ) | (3,868 | ) | ||||||
| Sega Sammy Holdings, Inc. | (15,900 | ) | (224,127 | ) | 75,409 | |||||||
| Seibu Holdings, Inc. | (31,900 | ) | (756,760 | ) | 105,288 | |||||||
| Seiko Epson Corp. | (60,000 | ) | (971,947 | ) | 47,997 | |||||||
| Seven & i Holdings Co., Ltd. | (10,300 | ) | (471,917 | ) | 336 | |||||||
| Shikoku Electric Power Co., Inc. | (56,100 | ) | (888,885 | ) | 12,532 | |||||||
| Shimano, Inc. | (15,400 | ) | (2,334,665 | ) | (30,137 | ) | ||||||
| Shiseido Co., Ltd. | (32,900 | ) | (759,103 | ) | 76,473 | |||||||
| SoftBank Group Corp. | (56,700 | ) | (3,209,861 | ) | 348,189 | |||||||
| Sohgo Security Services Co., Ltd. | (10,800 | ) | (495,362 | ) | (11,147 | ) | ||||||
| Stanley Electric Co., Ltd. | (53,500 | ) | (1,160,262 | ) | (13,398 | ) | ||||||
| Sumco Corp. | (289,500 | ) | (3,417,756 | ) | 1,233,624 | |||||||
| Sumitomo Dainippon Pharma Co., Ltd. | (49,300 | ) | (597,004 | ) | 16,178 | |||||||
| Sumitomo Metal Mining Co., Ltd. | (55,000 | ) | (674,545 | ) | 6,904 | |||||||
| REFERENCE ENTITY | SHARES | NOTIONAL (a) | NET UNREALIZED APPRECIATION (DEPRECIATION) | |||||||||
| Japan (continued) | ||||||||||||
| Suntory Beverage & Food Ltd. | (21,900 | ) | $ | (947,914 | ) | $ | (10,783 | ) | ||||
| Taisei Corp. | (122,000 | ) | (808,545 | ) | 4,935 | |||||||
| Taiyo Nippon Sanso Corp. | (16,700 | ) | (154,353 | ) | 3,322 | |||||||
| Takashimaya Co., Ltd. | (86,000 | ) | (766,213 | ) | (8,260 | ) | ||||||
| Terumo Corp. | (46,600 | ) | (1,209,283 | ) | (235,011 | ) | ||||||
| THK Co., Ltd. | (14,500 | ) | (270,058 | ) | 1,314 | |||||||
| Tobu Railway Co., Ltd. | (71,000 | ) | (334,494 | ) | (15,708 | ) | ||||||
| Tokyo Electron Ltd. | (4,800 | ) | (313,693 | ) | 22,885 | |||||||
| Toray Industries, Inc. | (12,000 | ) | (98,503 | ) | (13,007 | ) | ||||||
| Toshiba Corp. | (1,768,000 | ) | (4,389,353 | ) | 755,715 | |||||||
| Toyo Seikan Group Holdings Ltd. | (140,900 | ) | (2,507,932 | ) | (105,643 | ) | ||||||
| Toyota Industries Corp. | (21,200 | ) | (1,194,106 | ) | 60,470 | |||||||
| Toyota Motor Corp. | (10,800 | ) | (647,832 | ) | (17,221 | ) | ||||||
| Unicharm Corp. | (202,800 | ) | (4,334,473 | ) | 192,958 | |||||||
| Yahoo Japan Corp. | (175,100 | ) | (650,317 | ) | (61,447 | ) | ||||||
| Yakult Honsha Co., Ltd. | (37,700 | ) | (2,053,741 | ) | 208,525 | |||||||
| Yamaha Motor Co., Ltd. | (15,600 | ) | (349,514 | ) | (165 | ) | ||||||
| Yamato Holdings Co., Ltd. | (170,200 | ) | (3,493,685 | ) | (112,535 | ) | ||||||
| Yaskawa Electric Corp. | (146,600 | ) | (1,718,109 | ) | (276,632 | ) | ||||||
| Yokogawa Electric Corp. | (27,700 | ) | (336,140 | ) | 3,022 | |||||||
| Yokohama Rubber Co., Ltd./The | (34,400 | ) | (547,031 | ) | 18,722 | |||||||
|
| |||||||||||
| 2,726,649 | ||||||||||||
|
| |||||||||||
Total of Short Equity Positions | 2,726,649 | |||||||||||
|
| |||||||||||
Total of Long and Short Equity Positions | 1,069,477 | |||||||||||
|
| |||||||||||
Net Cash and Other Receivables/ (Payables) (b) | (236,245 | ) | ||||||||||
|
| |||||||||||
Swaps, at Value | $ | 833,232 | ||||||||||
|
| |||||||||||
| (a) | Notional value represents the market value (including any fees or commissions) of the long and short positions when they are established. |
| (b) | Cash and other receivables/(payables) includes the gains (or losses) realized within the swap when the swap resets. |
| The accompanying notes are an integral part of these financial statements. | (Continued) |
| AQR Funds | Annual Report | December 2015 | ||||||||||||||
116
Table of Contents
| Schedule of Investments | December 31, 2015 |
| AQR LONG-SHORT EQUITY FUND |
| COUNTERPARTY | DESCRIPTION | TERMINATION DATE** | VALUE (Note 5) | |||||
| Deutsche Bank | The Fund receives the total return on a portfolio of long and short positions and pays or receives the GBP/USD 1 Week Forward FX Swap Rate plus or minus a specified spread, which is denominated in GBP based on the local currencies of the positions within the swap. | 38 months maturity 08/19/2016 | $3,163,937 | |||||
|
| |||||||
| ** | The maturity dates are measured from the commencement of investment in each underlying portfolio swap positions. |
Additional Information — Total Return Basket Swap
The following table represents the individual long and short positions and related values within the total return basket swap as of December 31, 2015.
REFERENCE ENTITY | SHARES | NOTIONAL (a) | NET UNREALIZED APPRECIATION (DEPRECIATION) | |||||||||
| Long Positions | ||||||||||||
| Common Stocks | ||||||||||||
| Australia | ||||||||||||
| BHP Billiton PLC | 40,150 | $ | 460,159 | $ | (12,414 | ) | ||||||
|
| |||||||||||
| Ireland | ||||||||||||
| DCC PLC | 22,641 | 1,668,345 | 223,129 | |||||||||
| Shire PLC | 7,202 | 494,810 | (699 | ) | ||||||||
|
| |||||||||||
| 222,430 | ||||||||||||
|
| |||||||||||
| Luxembourg | ||||||||||||
| Regus PLC | 87,117 | 418,611 | 9,445 | |||||||||
|
| |||||||||||
| South Africa | ||||||||||||
| Mondi PLC | 70,705 | 1,489,459 | (103,589 | ) | ||||||||
|
| |||||||||||
| Switzerland | ||||||||||||
| Coca-Cola HBC AG | 36,526 | 777,396 | 449 | |||||||||
| Glencore PLC | 526,224 | 824,921 | (127,606 | ) | ||||||||
| Wolseley PLC | 12,466 | 686,673 | (9,608 | ) | ||||||||
|
| |||||||||||
| (136,765) | ||||||||||||
|
| |||||||||||
| United Kingdom | ||||||||||||
| AA PLC | 60,840 | 275,498 | 5,555 | |||||||||
| Aggreko PLC | 14,091 | 201,944 | (12,255 | ) | ||||||||
| Amec Foster Wheeler PLC | 46,644 | 307,096 | (12,649 | ) | ||||||||
| ASOS PLC | 19,763 | 988,754 | 15,398 | |||||||||
| AstraZeneca PLC | 8,020 | 531,672 | 10,057 | |||||||||
| BAE Systems PLC | 32,463 | 217,916 | 21,093 | |||||||||
| Barratt Developments PLC | 139,518 | 1,051,380 | 234,239 | |||||||||
| Bellway PLC | 19,914 | 769,992 | 62,680 | |||||||||
| Berkeley Group Holdings PLC | 42,684 | 2,074,739 | 245,714 | |||||||||
| Britvic PLC | 36,295 | 379,703 | 9,169 | |||||||||
| BT Group PLC | 100,569 | 636,203 | 62,105 | |||||||||
| Burberry Group PLC | 24,710 | 486,344 | (51,596 | ) | ||||||||
| Centrica PLC | 776,882 | 2,455,923 | 38,624 | |||||||||
| Close Brothers Group PLC | 8,325 | 175,464 | (11,299 | ) | ||||||||
| Compass Group PLC | 8,742 | 132,332 | 19,151 | |||||||||
| Daily Mail & General Trust PLC | 12,127 | 136,188 | (11,376 | ) | ||||||||
REFERENCE ENTITY | SHARES | NOTIONAL (a) | NET UNREALIZED APPRECIATION (DEPRECIATION) | |||||||||
| United Kingdom (continued) | ||||||||||||
| Direct Line Insurance Group PLC | 2 | $ | 11 | $ | 1 | |||||||
| Direct Line Insurance Group PLC | 22,569 | 108,155 | 27,126 | |||||||||
| Dixons Carphone PLC | 12,750 | 85,506 | 8,322 | |||||||||
| DS Smith PLC | 276,919 | 1,587,746 | 32,110 | |||||||||
| GKN PLC | 150,613 | 707,452 | (23,990 | ) | ||||||||
| Hays PLC | 100,709 | 220,628 | (4,340 | ) | ||||||||
| Howden Joinery Group PLC | 111,671 | 815,223 | 50,009 | |||||||||
| Imperial Tobacco Group PLC | 18,391 | 876,981 | 94,388 | |||||||||
| Indivior PLC | 133,754 | 386,507 | (16,886 | ) | ||||||||
| Informa PLC | 19,434 | 175,611 | 23 | |||||||||
| Intermediate Capital Group PLC | 42,115 | 339,603 | 48,636 | |||||||||
| International Consolidated Airlines Group SA | 34,718 | 280,144 | 32,008 | |||||||||
| John Wood Group PLC | 131,662 | 1,180,867 | 4,911 | |||||||||
| Just Eat PLC | 125,844 | 751,183 | 162,565 | |||||||||
| Kingfisher PLC | 241,089 | 1,236,938 | (69,227 | ) | ||||||||
| Man Group PLC | 607,608 | 1,630,332 | (67,256 | ) | ||||||||
| Marks & Spencer Group PLC | 174,069 | 1,263,458 | (104,473 | ) | ||||||||
| Meggitt PLC | 241,935 | 1,363,078 | (27,292 | ) | ||||||||
| National Grid PLC | 48,368 | 654,032 | 13,040 | |||||||||
| Next PLC | 1,634 | 157,295 | 18,148 | |||||||||
| Pearson PLC | 8,263 | 145,844 | (56,517 | ) | ||||||||
| Persimmon PLC | 47,400 | 1,217,994 | 196,106 | |||||||||
| Playtech PLC | 15,416 | 204,798 | (16,061 | ) | ||||||||
| Rentokil Initial PLC | 315,552 | 719,891 | 20,470 | |||||||||
| Rio Tinto PLC | 8,491 | 280,820 | (33,602 | ) | ||||||||
| Royal Mail PLC | 337,397 | 2,296,506 | (86,597 | ) | ||||||||
| Severn Trent PLC | 8,826 | 286,278 | (4,141 | ) | ||||||||
| Sky PLC | 5,774 | 80,448 | 14,204 | |||||||||
| Smith & Nephew PLC | 9,938 | 157,702 | 19,414 | |||||||||
| Smiths Group PLC | 105,643 | 1,541,119 | (80,192 | ) | ||||||||
| Stagecoach Group PLC | 160,369 | 844,955 | (144,253 | ) | ||||||||
| Tate & Lyle PLC | 13,403 | 118,002 | 57 | |||||||||
| Taylor Wimpey PLC | 812,757 | 2,066,297 | 363,329 | |||||||||
| The accompanying notes are an integral part of these financial statements. | (Continued) |
| AQR Funds | Annual Report | December 2015 | ||||||||||||||
117
Table of Contents
| Schedule of Investments | December 31, 2015 |
| AQR LONG-SHORT EQUITY FUND |
REFERENCE ENTITY | SHARES | NOTIONAL (a) | NET UNREALIZED APPRECIATION (DEPRECIATION) | |||||||||
| United Kingdom (continued) | ||||||||||||
| Thomas Cook Group PLC | 315,666 | $ | 619,042 | $ | (55,801 | ) | ||||||
| Vedanta Resources PLC | 52,106 | 382,599 | (172,705 | ) | ||||||||
| Vodafone Group PLC | 331,815 | 1,106,764 | (30,765 | ) | ||||||||
| Whitbread PLC | 1,429 | 91,632 | 991 | |||||||||
| William Hill PLC | 122,426 | 676,378 | 38,112 | |||||||||
| WPP PLC | 21,843 | 483,501 | 18,927 | |||||||||
|
| |||||||||||
| 793,409 | ||||||||||||
|
| |||||||||||
Total of Long Equity Positions | 772,516 | |||||||||||
|
| |||||||||||
| Short Positions | ||||||||||||
| Common Stocks | ||||||||||||
| Chile | ||||||||||||
| Antofagasta PLC | (322,167 | ) | (2,851,019 | ) | 634,894 | |||||||
|
| |||||||||||
| Ireland | ||||||||||||
| Experian PLC | (18,534 | ) | (311,024 | ) | (16,554 | ) | ||||||
|
| |||||||||||
| United Kingdom | ||||||||||||
| Aberdeen Asset Management PLC | (327,184 | ) | (1,597,812 | ) | 203,608 | |||||||
| Admiral Group PLC | (71,600 | ) | (1,649,310 | ) | (100,280 | ) | ||||||
| Anglo American PLC | (113,087 | ) | (767,439 | ) | 271,303 | |||||||
| ARM Holdings PLC | (241,435 | ) | (3,545,532 | ) | (134,427 | ) | ||||||
| Ashtead Group PLC | (46,599 | ) | (736,387 | ) | (30,532 | ) | ||||||
| Associated British Foods PLC | (41,903 | ) | (2,063,279 | ) | 1,351 | |||||||
| Aviva PLC | (128,516 | ) | (954,033 | ) | (21,465 | ) | ||||||
| Babcock International Group PLC | (34,169 | ) | (504,543 | ) | (6,801 | ) | ||||||
| Balfour Beatty PLC | (23,573 | ) | (88,838 | ) | (5,052 | ) | ||||||
| Booker Group PLC | (123,596 | ) | (329,372 | ) | (490 | ) | ||||||
| BP PLC | (321,268 | ) | (1,703,733 | ) | 34,205 | |||||||
| British American Tobacco PLC | (59,424 | ) | (3,211,822 | ) | (88,232 | ) | ||||||
| BTG PLC | (78,914 | ) | (705,997 | ) | (93,631 | ) | ||||||
| Bunzl PLC | (17,812 | ) | (495,762 | ) | 1,580 | |||||||
| Capita PLC | (64,702 | ) | (1,178,455 | ) | 27,244 | |||||||
| Cobham PLC | (304,114 | ) | (1,282,369 | ) | 12,426 | |||||||
| Croda International PLC | (4,084 | ) | (173,449 | ) | (9,535 | ) | ||||||
| Diageo PLC | (45,035 | ) | (1,229,096 | ) | (709 | ) | ||||||
| easyJet PLC | (16,114 | ) | (416,216 | ) | 2,941 | |||||||
| Essentra PLC | (34,955 | ) | (438,068 | ) | 11,962 | |||||||
| Eurasian Resources Group | (15 | ) | (50 | ) | 5 | |||||||
| G4S PLC | (48,681 | ) | (188,328 | ) | 26,620 | |||||||
| GlaxoSmithKline PLC | (6,790 | ) | (129,041 | ) | (8,089 | ) | ||||||
| Halma PLC | (14,732 | ) | (190,899 | ) | 3,306 | |||||||
| Hargreaves Lansdown PLC | (136,218 | ) | (2,272,319 | ) | (751,805 | ) | ||||||
| HSBC Holdings PLC | (36,268 | ) | (289,839 | ) | 3,532 | |||||||
| IMI PLC | (23,538 | ) | (304,000 | ) | 5,319 | |||||||
| Inmarsat PLC | (56,594 | ) | (765,585 | ) | (183,182 | ) | ||||||
| Intertek Group PLC | (11,865 | ) | (458,435 | ) | (26,922 | ) | ||||||
| ITV PLC | (181,230 | ) | (740,240 | ) | 2,389 | |||||||
REFERENCE ENTITY | SHARES | NOTIONAL (a) | NET UNREALIZED APPRECIATION (DEPRECIATION) | |||||||||
| United Kingdom (continued) | ||||||||||||
| J Sainsbury PLC | (55,477 | ) | $ | (216,427 | ) | $ | 5,159 | |||||
| Johnson Matthey PLC | (2,348 | ) | (91,706 | ) | (142 | ) | ||||||
| Legal & General Group PLC | (219,122 | ) | (863,053 | ) | (1,581 | ) | ||||||
| Lloyds Banking Group PLC | (1,159,197 | ) | (1,259,186 | ) | 11,896 | |||||||
| Melrose Industries PLC | (23,120 | ) | (100,312 | ) | 1,279 | |||||||
| Merlin Entertainments PLC | (22,810 | ) | (152,268 | ) | (674 | ) | ||||||
| Ocado Group PLC | (102,924 | ) | (516,791 | ) | 56,954 | |||||||
| Old Mutual PLC | (191,789 | ) | (582,746 | ) | 78,214 | |||||||
| Pennon Group PLC | (24,076 | ) | (309,546 | ) | 4,107 | |||||||
| Provident Financial PLC | (24,683 | ) | (1,259,701 | ) | 35,853 | |||||||
| Prudential PLC | (48,021 | ) | (1,062,042 | ) | (19,846 | ) | ||||||
| Rolls-Royce Holdings PLC (3) | (13,381,060 | ) | 872 | (20,598 | ) | |||||||
| Rolls-Royce Holdings PLC (3) | (797,637 | ) | (59 | ) | (1,117 | ) | ||||||
| Rolls-Royce Holdings PLC | (229,833 | ) | (2,536,348 | ) | 589,566 | |||||||
| Rotork PLC | (40,307 | ) | (109,736 | ) | 1,263 | |||||||
| Royal Bank of Scotland Group PLC | (79,128 | ) | (363,917 | ) | 12,188 | |||||||
| RSA Insurance Group PLC | (107,093 | ) | (638,719 | ) | (33,434 | ) | ||||||
| Schroders PLC | (4,702 | ) | (207,800 | ) | 1,857 | |||||||
| Serco Group PLC | (179,271 | ) | (531,780 | ) | 282,315 | |||||||
| Spectris PLC | (11,966 | ) | (321,244 | ) | 3,680 | |||||||
| Sports Direct International PLC | (11,241 | ) | (103,576 | ) | 8,049 | |||||||
| SSE PLC | (11,879 | ) | (271,507 | ) | 4,779 | |||||||
| St. James’s Place PLC | (110,447 | ) | (1,606,601 | ) | (30,409 | ) | ||||||
| Standard Chartered PLC | (10,774 | ) | (131,596 | ) | 42,202 | |||||||
| Standard Life PLC | (361,005 | ) | (2,217,797 | ) | 150,497 | |||||||
| Tesco PLC | (1,817,324 | ) | (5,086,691 | ) | 1,093,529 | |||||||
| Weir Group PLC/The | (21,451 | ) | (593,574 | ) | 278,485 | |||||||
|
| |||||||||||
| 1,700,710 | ||||||||||||
|
| |||||||||||
Total of Short Equity Positions | 2,319,050 | |||||||||||
|
| |||||||||||
Total of Long and Short Equity Positions | 3,091,566 | |||||||||||
|
| |||||||||||
Net Cash and Other Receivables/ (Payables) (b) | 72,371 | |||||||||||
|
| |||||||||||
Swaps, at Value | $ | 3,163,937 | ||||||||||
|
| |||||||||||
| (a) | Notional value represents the market value (including any fees or commissions) of the long and short positions when they are established. |
| (b) | Cash and other receivables/(payables) includes the gains (or losses) realized within the swap when the swap resets. |
| (3) | Level 3 Security (See Note 5). |
| The accompanying notes are an integral part of these financial statements. | (Continued) |
| AQR Funds | Annual Report | December 2015 | ||||||||||||||
118
Table of Contents
| Schedule of Investments | December 31, 2015 |
| AQR LONG-SHORT EQUITY FUND |
| COUNTERPARTY | DESCRIPTION | TERMINATION DATE** | VALUE (Note 5) | |||||
| Deutsche Bank | The Fund receives the total return on a portfolio of long and short positions and pays or receives the AUD/USD Overnight Forward FX Swap Rate plus or minus a specified spread, which is denominated in AUD based on the local currencies of the positions within the swap. | 38 months maturity 08/22/2016 | $446,640 | |||||
|
| |||||||
| ** | The maturity dates are measured from the commencement of investment in each underlying portfolio swap positions. |
Additional Information — Total Return Basket Swap
The following table represents the individual long and short positions and related values within the total return basket swap as of December 31, 2015.
REFERENCE ENTITY | SHARES | NOTIONAL (a) | NET UNREALIZED APPRECIATION (DEPRECIATION) | |||||||||
| Long Positions | ||||||||||||
| Common Stocks | ||||||||||||
| Australia | ||||||||||||
| Amcor Ltd. | 93,544 | $ | 874,071 | $ | 34,732 | |||||||
| Ansell Ltd. | 73,556 | 1,130,843 | 9,070 | |||||||||
| Aurizon Holdings Ltd. | 411,756 | 1,342,348 | (35,189 | ) | ||||||||
| Boral Ltd. | 551,595 | 2,323,960 | 34,413 | |||||||||
| Caltex Australia Ltd. | 59,969 | 1,453,184 | 185,992 | |||||||||
| Challenger Ltd. | 29,190 | 146,593 | 37,373 | |||||||||
| CIMIC Group Ltd. | 78,142 | 1,371,472 | (721 | ) | ||||||||
| Coca-Cola Amatil Ltd. | 190,093 | 1,264,458 | 17,329 | |||||||||
| Flight Centre Travel Group Ltd. | 11,888 | 331,506 | 11,352 | |||||||||
| Harvey Norman Holdings Ltd. | 259,687 | 790,077 | (5,060 | ) | ||||||||
| Iluka Resources Ltd. | 174,917 | 819,220 | (45,487 | ) | ||||||||
| Incitec Pivot Ltd. | 98,922 | 283,288 | (624 | ) | ||||||||
| Macquarie Group Ltd. | 7,781 | 322,086 | 143,397 | |||||||||
| Newcrest Mining Ltd. | 28,190 | 251,104 | 15,636 | |||||||||
| Orica Ltd. | 33,952 | 399,660 | (19,272 | ) | ||||||||
| Qantas Airways Ltd. | 734,030 | 1,819,633 | 356,084 | |||||||||
| Sonic Healthcare Ltd. | 7,318 | 100,185 | (5,437 | ) | ||||||||
| Star Entertainment Grp Ltd./The | 503,113 | 1,735,952 | 110,190 | |||||||||
| Tabcorp Holdings Ltd. | 282,123 | 959,836 | 744 | |||||||||
| Tatts Group Ltd. | 167,317 | 508,074 | 23,138 | |||||||||
| Telstra Corp. Ltd. | 262,389 | 1,058,162 | 8,107 | |||||||||
| TPG Telecom Ltd. | 51,793 | 372,720 | (1,900 | ) | ||||||||
| Treasury Wine Estates Ltd. | 449,398 | 2,090,840 | 607,410 | |||||||||
| Woodside Petroleum Ltd. | 174,989 | 4,012,314 | (366,599 | ) | ||||||||
|
| |||||||||||
| 1,114,678 | ||||||||||||
|
| |||||||||||
| New Zealand | ||||||||||||
| Fletcher Building Ltd. | 116,204 | 565,302 | 14,128 | |||||||||
| Spark New Zealand Ltd. | 142,377 | 311,663 | 9,849 | |||||||||
|
| |||||||||||
| 23,977 | ||||||||||||
|
| |||||||||||
Total of Long Equity Positions | 1,138,655 | |||||||||||
|
| |||||||||||
| Short Positions | ||||||||||||
| Common Stocks | ||||||||||||
| Australia | ||||||||||||
| ALS Ltd. | (82,018 | ) | (225,841 | ) | 2,630 | |||||||
| Alumina Ltd. | (899,406 | ) | (791,475 | ) | 40,884 | |||||||
REFERENCE ENTITY | SHARES | NOTIONAL (a) | NET UNREALIZED APPRECIATION (DEPRECIATION) | |||||||||
| Australia (continued) | ||||||||||||
| AMP Ltd. | (122,816 | ) | $ | (545,748 | ) | $ | 28,265 | |||||
| APA Group | (204,371 | ) | (1,273,910 | ) | (12,068 | ) | ||||||
| AusNet Services | (509,255 | ) | (505,198 | ) | (43,042 | ) | ||||||
| Bank of Queensland Ltd. | (51,067 | ) | (512,227 | ) | (2,918 | ) | ||||||
| Brambles Ltd. | (163,840 | ) | (1,332,165 | ) | (39,979 | ) | ||||||
| Commonwealth Bank of Australia | (16,012 | ) | (946,206 | ) | (43,728 | ) | ||||||
| Computershare Ltd. | (67,910 | ) | (566,433 | ) | (4,999 | ) | ||||||
| Crown Resorts Ltd. | (121,986 | ) | (1,112,537 | ) | 10,000 | |||||||
| CSL Ltd. | (27,875 | ) | (1,991,510 | ) | (133,671 | ) | ||||||
| Healthscope Ltd. | (163,991 | ) | (316,882 | ) | 865 | |||||||
| Insurance Australia Group Ltd. | (453,270 | ) | (1,794,287 | ) | (26,051 | ) | ||||||
| Medibank Pvt Ltd. | (473,455 | ) | (751,976 | ) | 13,711 | |||||||
| Origin Energy Ltd. | (27,193 | ) | (105,832 | ) | 13,845 | |||||||
| QBE Insurance Group Ltd. | (49,369 | ) | (456,935 | ) | 7,915 | |||||||
| Ramsay Health Care Ltd. | (27,819 | ) | (1,274,332 | ) | (93,590 | ) | ||||||
| REA Group Ltd. | (25,376 | ) | (848,340 | ) | (161,320 | ) | ||||||
| Santos Ltd. | (258,749 | ) | (841,168 | ) | 151,998 | |||||||
| Seek Ltd. | (678,100 | ) | (7,263,667 | ) | (283,695 | )�� | ||||||
| South32 Ltd. | (222,193 | ) | (175,325 | ) | 4,636 | |||||||
| Westpac Banking Corp. | (35,226 | ) | (851,087 | ) | (2,783 | ) | ||||||
| Woolworths Ltd. | (71,084 | ) | (1,280,786 | ) | 19,577 | |||||||
|
| |||||||||||
| (553,518) | ||||||||||||
|
| |||||||||||
| Rights | ||||||||||||
| Australia | ||||||||||||
| Westpac Banking Corp. | (613 | ) | (11,163 | ) | 7,695 | |||||||
|
| |||||||||||
Total of Short Equity Positions and Rights | (545,823 | ) | ||||||||||
|
| |||||||||||
Total of Long and Short Equity Positions and Rights | 592,832 | |||||||||||
|
| |||||||||||
Net Cash and Other Receivables/ (Payables) (b) | (146,192 | ) | ||||||||||
|
| |||||||||||
Swaps, at Value | $ | 446,640 | ||||||||||
|
| |||||||||||
| (a) | Notional value represents the market value (including any fees or commissions) of the long and short positions when they are established. |
| (b) | Cash and other receivables/(payables) includes the gains (or losses) realized within the swap when the swap resets. |
| The accompanying notes are an integral part of these financial statements. | (Continued) |
| AQR Funds | Annual Report | December 2015 | ||||||||||||||
119
Table of Contents
| Schedule of Investments | December 31, 2015 |
| AQR LONG-SHORT EQUITY FUND |
| COUNTERPARTY | DESCRIPTION | TERMINATION DATE** | VALUE (Note 5) | |||||
| Deutsche Bank | The Fund receives the total return on a portfolio of long and short positions and pays or receives the HKD/USD 1Week Forward FX Swap Rate plus or minus a specified spread, which is denominated in HKD based on the local currencies of the positions within the swap. | 37-38 months maturity ranging from 07/20/2016 - 08/22/2016 | $964,545 | |||||
|
| |||||||
| ** | The maturity dates are measured from the commencement of investment in each underlying portfolio swap positions. |
Additional Information — Total Return Basket Swap
The following table represents the individual long and short positions and related values within the total return basket swap as of December 31, 2015.
REFERENCE ENTITY | SHARES | NOTIONAL (a) | NET UNREALIZED APPRECIATION (DEPRECIATION) | |||||||||
| Long Positions | ||||||||||||
| Common Stocks | ||||||||||||
| Hong Kong | ||||||||||||
| BOC Hong Kong Holdings Ltd. | 124,500 | $ | 419,703 | $ | (40,847 | ) | ||||||
| CK Hutchison Holdings Ltd. | 108,000 | 1,511,031 | (59,303 | ) | ||||||||
| CLP Holdings Ltd. | 313,000 | 2,673,729 | (20,739 | ) | ||||||||
| Hang Seng Bank Ltd. | 7,200 | 141,616 | (5,152 | ) | ||||||||
| Kerry Properties Ltd. | 356,500 | 1,103,635 | (133,467 | ) | ||||||||
| MTR Corp. Ltd. | 93,500 | 378,114 | 83,571 | |||||||||
| New World Development Co., Ltd. | 758,000 | 869,108 | (124,799 | ) | ||||||||
| Orient Overseas International Ltd. | 122,500 | 603,745 | (17,400 | ) | ||||||||
| Sino Land Co., Ltd. | 790,000 | 1,239,128 | (88,291 | ) | ||||||||
| Sun Hung Kai Properties Ltd. | 72,000 | 957,052 | (91,642 | ) | ||||||||
| Swire Pacific Ltd. | 31,500 | 351,835 | 24 | |||||||||
| WH Group Ltd. | 3,204,000 | 1,867,834 | (84,582 | ) | ||||||||
| Yue Yuen Industrial Holdings Ltd. | 323,500 | 1,159,722 | (63,859 | ) | ||||||||
|
| |||||||||||
| (646,486 | ) | |||||||||||
|
| |||||||||||
Total of Long Equity Positions | (646,486 | ) | ||||||||||
|
| |||||||||||
| Short Positions | ||||||||||||
| Common Stocks | ||||||||||||
| Hong Kong | ||||||||||||
| AIA Group Ltd. | (82,000 | ) | (490,260 | ) | 304 | |||||||
| ASM Pacific Technology Ltd. | (102,600 | ) | (826,722 | ) | 25,672 | |||||||
| Bank of East Asia Ltd./The | (60,600 | ) | (218,454 | ) | (6,341 | ) | ||||||
| Cathay Pacific Airways Ltd. | (304,000 | ) | (613,655 | ) | 90,575 | |||||||
| Cheung Kong Property Holdings Ltd. | (350,500 | ) | (2,391,459 | ) | 124,080 | |||||||
| Esprit Holdings Ltd. | (698,600 | ) | (738,979 | ) | (30,030 | ) | ||||||
REFERENCE ENTITY | SHARES | NOTIONAL (a) | NET UNREALIZED APPRECIATION (DEPRECIATION) | |||||||||
| Hong Kong (continued) | ||||||||||||
| Galaxy Entertainment Group Ltd. | (359,000 | ) | $ | (1,292,947 | ) | $ | 168,084 | |||||
| Hang Lung Properties Ltd. | (109,000 | ) | (252,691 | ) | 5,712 | |||||||
| HKT Trust & HKT Ltd. | (866,000 | ) | (1,034,297 | ) | (71,243 | ) | ||||||
| Hong Kong & China Gas Co., Ltd. | (1,686,120 | ) | (3,408,878 | ) | 109,072 | |||||||
| Hysan Development Co., Ltd. | (92,000 | ) | (381,036 | ) | 5,155 | |||||||
| MGM China Holdings Ltd. | (994,000 | ) | (1,710,797 | ) | 475,383 | |||||||
| Sands China Ltd. | (100,400 | ) | (380,774 | ) | 40,398 | |||||||
| Swire Properties Ltd. | (194,400 | ) | (603,167 | ) | 44,202 | |||||||
| Techtronic Industries Co., Ltd. | (96,000 | ) | (340,388 | ) | (48,244 | ) | ||||||
| Value Partners Group Ltd. | (314,000 | ) | (372,291 | ) | 7,314 | |||||||
| Wharf Holdings Ltd./The | (34,000 | ) | (189,323 | ) | 1,864 | |||||||
| Wynn Macau Ltd. | (327,600 | ) | (382,859 | ) | 2,257 | |||||||
|
| |||||||||||
| 944,214 | ||||||||||||
|
| |||||||||||
| United States | ||||||||||||
| Samsonite International SA | (208,200 | ) | (677,054 | ) | 53,084 | |||||||
|
| |||||||||||
Total of Short Equity Positions | 997,298 | |||||||||||
|
| |||||||||||
Total of Long and Short Equity Positions | 350,812 | |||||||||||
|
| |||||||||||
Net Cash and Other Receivables/ (Payables) (b) | 613,733 | |||||||||||
|
| |||||||||||
Swaps, at Value | $ | 964,545 | ||||||||||
|
| |||||||||||
| (a) | Notional value represents the market value (including any fees or commissions) of the long and short positions when they are established. |
| (b) | Cash and other receivables/(payables) includes the gains (or losses) realized within the swap when the swap resets. |
| The accompanying notes are an integral part of these financial statements. | (Continued) |
| AQR Funds | Annual Report | December 2015 | ||||||||||||||
120
Table of Contents
| Schedule of Investments | December 31, 2015 |
| AQR LONG-SHORT EQUITY FUND |
Total Return Basket Swaps* Outstanding at December 31, 2015
| COUNTERPARTY | DESCRIPTION | TERMINATION DATE** | VALUE (Note 5) | |||||
| Goldman Sachs | The Fund receives the total return on a portfolio of long and short positions and pays or receives the LIBOR, plus or minus a specified spread, which is denominated in USD based on the local currencies of the positions within the swap. | 15-61 months maturity ranging from 02/23/2017 - 12/22/2020 | $(5,349,153 | ) | ||||
|
| |||||||
| * | See the accompanying “Additional Information — Total Return Basket Swap” for further details. |
| ** | The maturity dates are measured from the commencement of investment in each underlying portfolio swap positions. |
Additional Information — Total Return Basket Swap
The following table represents the individual long and short positions and related values within the total return basket swap as of December 31, 2015.
REFERENCE ENTITY | SHARES | NOTIONAL (a) | NET UNREALIZED APPRECIATION (DEPRECIATION) | |||||||||
| Long Positions | ||||||||||||
| Common Stocks | ||||||||||||
| Canada | ||||||||||||
| Domtar Corp. | 35,294 | $ | 1,309,007 | $ | (4,894 | ) | ||||||
|
| |||||||||||
| Ireland | ||||||||||||
| Accenture PLC | 14,408 | 1,491,571 | 14,065 | |||||||||
| Medtronic PLC | 7,237 | 563,762 | (7,092 | ) | ||||||||
| XL Group PLC | 26,035 | 1,004,915 | 15,136 | |||||||||
|
| |||||||||||
| 22,109 | ||||||||||||
|
| |||||||||||
| Puerto Rico | ||||||||||||
| Popular, Inc. | 7,858 | 211,878 | 10,818 | |||||||||
|
| |||||||||||
| Singapore | ||||||||||||
| Flextronics International Ltd. | 130,674 | 1,446,576 | 18,279 | |||||||||
|
| |||||||||||
| Switzerland | ||||||||||||
| ACE Ltd. | 3,484 | 402,750 | 4,355 | |||||||||
| Allied World Assurance Co. Holdings AG | 18,992 | 689,170 | 17,143 | |||||||||
| Garmin Ltd. | 2,567 | 91,945 | 3,471 | |||||||||
| TE Connectivity Ltd. | 10,878 | 706,214 | (3,387 | ) | ||||||||
|
| |||||||||||
| 21,582 | ||||||||||||
|
| |||||||||||
| United Kingdom | ||||||||||||
| Michael Kors Holdings Ltd. | 26,567 | 1,047,537 | 16,737 | |||||||||
|
| |||||||||||
| United States | ||||||||||||
| 3M Co. | 17,608 | 2,625,624 | 26,845 | |||||||||
| Aaron’s, Inc. | 10,465 | 235,510 | (1,198 | ) | ||||||||
| Abbott Laboratories | 72,747 | 3,292,529 | (25,461 | ) | ||||||||
| AbbVie, Inc. | 32,258 | 1,855,218 | 55,746 | |||||||||
| Activision Blizzard, Inc. | 17,700 | 687,999 | (2,832 | ) | ||||||||
| Adobe Systems, Inc. | 4,016 | 381,896 | (4,633 | ) | ||||||||
| AES Corp. | 9,918 | 91,747 | 3,168 | |||||||||
| Aetna, Inc. | 28,601 | 3,113,505 | (21,165 | ) | ||||||||
| Aflac, Inc. | 51,794 | 3,127,322 | (24,861 | ) | ||||||||
| AGCO Corp. | 15,839 | 706,103 | 12,830 | |||||||||
REFERENCE ENTITY | SHARES | NOTIONAL (a) | NET UNREALIZED APPRECIATION (DEPRECIATION) | |||||||||
| United States (continued) | ||||||||||||
| Agilent Technologies, Inc. | 89,057 | $ | 3,631,744 | $ | 91,729 | |||||||
| Akamai Technologies, Inc. | 34,068 | 1,793,880 | (881 | ) | ||||||||
| Alleghany Corp. | 1,302 | 626,286 | (4,021 | ) | ||||||||
| Allison Transmission Holdings, Inc. | 3,637 | 92,952 | 1,210 | |||||||||
| Allscripts Healthcare Solutions, Inc. | 37,237 | 565,788 | 6,917 | |||||||||
| Allstate Corp./The | 51,877 | 3,236,443 | (15,400 | ) | ||||||||
| Alphabet, Inc. | 4,081 | 3,141,676 | 33,383 | |||||||||
| Altria Group, Inc. | 73,699 | 4,307,162 | (17,144 | ) | ||||||||
| Amazon.com, Inc. | 2,996 | 2,009,267 | 15,699 | |||||||||
| Amdocs Ltd. | 55,957 | 3,073,581 | (20,007 | ) | ||||||||
| AMERCO | 976 | 383,958 | (3,806 | ) | ||||||||
| Ameren Corp. | 77,129 | 3,406,367 | (72,080 | ) | ||||||||
| American Eagle Outfitters, Inc. | 30,821 | 474,726 | 3,000 | |||||||||
| American Electric Power Co., Inc. | 12,305 | 706,553 | 10,459 | |||||||||
| American Express Co. | 5,479 | 381,174 | (110 | ) | ||||||||
| American Financial Group, Inc. | 14,030 | 1,018,709 | (7,427 | ) | ||||||||
| American International Group, Inc. | 39,431 | 2,410,683 | 32,856 | |||||||||
| American Water Works Co., Inc. | 11,120 | 676,614 | (12,194 | ) | ||||||||
| Ameriprise Financial, Inc. | 15,103 | 1,587,325 | 19,936 | |||||||||
| AmerisourceBergen Corp. | 41,105 | 4,208,580 | 54,419 | |||||||||
| Amgen, Inc. | 24,122 | 3,894,197 | 21,527 | |||||||||
| AmTrust Financial Services, Inc. | 3,517 | 221,741 | (5,164 | ) | ||||||||
| Analog Devices, Inc. | 22,638 | 1,282,344 | (30,010 | ) | ||||||||
| ANSYS, Inc. | 1,330 | 122,247 | 778 | |||||||||
| Anthem, Inc. | 25,761 | 3,581,037 | 11,077 | |||||||||
| AO Smith Corp. | 36,672 | 2,806,227 | 3,215 | |||||||||
| Apollo Education Group, Inc. | 88,605 | 677,884 | 1,717 | |||||||||
| The accompanying notes are an integral part of these financial statements. | (Continued) |
| AQR Funds | Annual Report | December 2015 | ||||||||||||||
121
Table of Contents
| Schedule of Investments | December 31, 2015 |
| AQR LONG-SHORT EQUITY FUND |
REFERENCE ENTITY | SHARES | NOTIONAL (a) | NET UNREALIZED APPRECIATION (DEPRECIATION) | |||||||||
| United States (continued) | ||||||||||||
| Apple, Inc. | 26,672 | $ | 2,902,601 | $ | (95,106 | ) | ||||||
| AptarGroup, Inc. | 1,608 | 117,080 | (259 | ) | ||||||||
| Archer-Daniels-Midland Co. | 53,348 | 1,829,303 | 127,502 | |||||||||
| Armstrong World Industries, Inc. | 15,307 | 707,642 | (7,653 | ) | ||||||||
| Arrow Electronics, Inc. | 36,102 | 1,977,008 | (21,002 | ) | ||||||||
| Aspen Insurance Holdings Ltd. | 12,377 | 605,702 | (7,893 | ) | ||||||||
| Assurant, Inc. | 21,559 | 1,747,767 | (11,406 | ) | ||||||||
| Assured Guaranty Ltd. | 105,726 | 2,675,925 | 118,413 | |||||||||
| Atwood Oceanics, Inc. | 79,066 | 960,650 | (151,805 | ) | ||||||||
| Automatic Data Processing, Inc. | 6,928 | 587,564 | (624 | ) | ||||||||
| AutoZone, Inc. | 987 | 744,631 | (12,366 | ) | ||||||||
| Avery Dennison Corp. | 33,539 | 2,122,724 | (21,170 | ) | ||||||||
| Avnet, Inc. | 70,216 | 3,076,291 | (68,238 | ) | ||||||||
| Avon Products, Inc. | 323,793 | 1,304,886 | 6,476 | |||||||||
| Axis Capital Holdings Ltd. | 24,236 | 1,364,889 | (2,341 | ) | ||||||||
| Bank of America Corp. | 35,497 | 614,098 | (16,684 | ) | ||||||||
| Baxalta, Inc. | 26,150 | 1,023,351 | (2,717 | ) | ||||||||
| Baxter International, Inc. | 71,021 | 2,673,664 | 35,787 | |||||||||
| BB&T Corp. | 2,500 | 94,838 | (313 | ) | ||||||||
| Bed Bath & Beyond, Inc. | 12,540 | 641,866 | (36,811 | ) | ||||||||
| Bemis Co., Inc. | 64,033 | 2,867,825 | (6,190 | ) | ||||||||
| Best Buy Co., Inc. | 69,870 | 2,082,126 | 45,415 | |||||||||
| Big Lots, Inc. | 39,750 | 1,512,964 | 19,001 | |||||||||
| Biogen, Inc. | 10,297 | 3,059,959 | 94,526 | |||||||||
| BioMarin Pharmaceutical, Inc. | 2,726 | 274,345 | 11,231 | |||||||||
| Bio-Rad Laboratories, Inc. | 6,606 | 913,708 | 2,280 | |||||||||
| BlackRock, Inc. | 1,357 | 454,389 | 7,697 | |||||||||
| Boeing Co./The | 18,915 | 2,754,451 | (19,531 | ) | ||||||||
| Brinker International, Inc. | 18,556 | 846,903 | 42,858 | |||||||||
| Bristol-Myers Squibb Co. | 15,194 | 1,055,567 | (10,371 | ) | ||||||||
| Broadridge Financial Solutions, Inc. | 31,338 | 1,691,272 | (7,481 | ) | ||||||||
| Brocade Communications Systems, Inc. | 500,726 | 4,416,404 | 180,261 | |||||||||
| Bruker Corp. | 4,809 | 118,910 | (2,196 | ) | ||||||||
| Brunswick Corp. | 25,347 | 1,262,752 | 17,525 | |||||||||
| Bunge Ltd. | 28,053 | 1,796,514 | 118,945 | |||||||||
| BWX Technologies, Inc. | 55,819 | 1,735,973 | 37,396 | |||||||||
| CA, Inc. | 52,663 | 1,510,162 | (6,107 | ) | ||||||||
| Cabot Corp. | 8,340 | 350,082 | (9,143 | ) | ||||||||
| Cadence Design Systems, Inc. | 78,270 | 1,666,738 | (37,939 | ) | ||||||||
| California Resources Corp. | 405,354 | 840,745 | 103,729 | |||||||||
| Campbell Soup Co. | 10,127 | 544,693 | (12,519 | ) | ||||||||
| Capital One Financial Corp. | 18,315 | 1,361,463 | (39,486 | ) | ||||||||
| Cardinal Health, Inc. | 19,400 | 1,718,156 | 13,683 | |||||||||
REFERENCE ENTITY | SHARES | NOTIONAL (a) | NET UNREALIZED APPRECIATION (DEPRECIATION) | |||||||||
| United States (continued) | ||||||||||||
| Carlisle Cos., Inc. | 29,457 | $ | 2,599,065 | $ | 13,476 | |||||||
| Carnival Corp. | 30,326 | 1,539,468 | 112,693 | |||||||||
| Carter’s, Inc. | 28,324 | 2,529,859 | (8,173 | ) | ||||||||
| CDW Corp. | 27,762 | 1,188,387 | (21,273 | ) | ||||||||
| CEB, Inc. | 17,111 | 1,061,249 | (10,805 | ) | ||||||||
| Celgene Corp. | 4,278 | 517,173 | (4,840 | ) | ||||||||
| CH Robinson Worldwide, Inc. | 8,902 | 561,642 | (9,540 | ) | ||||||||
| Charles River Laboratories International, Inc. | 33,160 | 2,632,493 | 33,239 | |||||||||
| Cheesecake Factory, Inc./The | 28,013 | 1,300,304 | (8,625 | ) | ||||||||
| Chemours Co./The | 54,918 | 259,213 | 35,148 | |||||||||
| Chico’s FAS, Inc. | 68,886 | 753,770 | (18,757 | ) | ||||||||
| Church & Dwight Co., Inc. | 16,922 | 1,454,654 | (18,315 | ) | ||||||||
| Cintas Corp. | 19,907 | 1,820,252 | (7,720 | ) | ||||||||
| Cisco Systems, Inc. | 147,985 | 3,954,159 | 64,373 | |||||||||
| CIT Group, Inc. | 3,200 | 129,600 | (2,560 | ) | ||||||||
| Citigroup, Inc. | 45,816 | 2,420,917 | (49,939 | ) | ||||||||
| Citrix Systems, Inc. | 25,065 | 1,946,523 | (50,356 | ) | ||||||||
| Clorox Co./The | 13,103 | 1,710,362 | (48,509 | ) | ||||||||
| Coach, Inc. | 26,049 | 850,239 | 2,344 | |||||||||
| Coca-Cola Co./The | 35,704 | 1,553,955 | (20,111 | ) | ||||||||
| Cognizant Technology Solutions Corp. | 3,006 | 181,701 | (1,281 | ) | ||||||||
| Colgate-Palmolive Co. | 30,810 | 2,075,982 | (23,420 | ) | ||||||||
| Comcast Corp. | 19,322 | 1,109,827 | (19,487 | ) | ||||||||
| Commerce Bancshares, Inc. | 11,767 | 512,665 | (12,096 | ) | ||||||||
| Commercial Metals Co. | 32,947 | 460,213 | (9,168 | ) | ||||||||
| Community Health Systems, Inc. | 68,306 | 1,742,486 | 69,672 | |||||||||
| CommVault Systems, Inc. | 2,381 | 95,878 | (2,186 | ) | ||||||||
| Computer Sciences Corp. | 79,978 | 2,542,993 | 70,688 | |||||||||
| Consolidated Edison, Inc. | 38,800 | 2,514,903 | (21,227 | ) | ||||||||
| Convergys Corp. | 37,267 | 957,094 | (29,519 | ) | ||||||||
| CoreLogic, Inc. | 21,096 | 750,060 | (35,750 | ) | ||||||||
| Corning, Inc. | 49,234 | 890,643 | 9,354 | |||||||||
| CR Bard, Inc. | 11,586 | 2,208,753 | (13,901 | ) | ||||||||
| Cracker Barrel Old Country Store, Inc. | 2,750 | 343,409 | 5,373 | |||||||||
| Crane Co. | 20,307 | 955,627 | 15,860 | |||||||||
| Crown Holdings, Inc. | 20,100 | 1,036,716 | (17,646 | ) | ||||||||
| CSX Corp. | 56,037 | 1,434,547 | 19,613 | |||||||||
| Cummins, Inc. | 20,885 | 1,796,901 | 41,188 | |||||||||
| CVR Energy, Inc. | 3,323 | 131,946 | (1,186 | ) | ||||||||
| CVS Health Corp. | 17,575 | 1,664,528 | 53,780 | |||||||||
| Dana Holding Corp. | 25,005 | 359,382 | (14,313 | ) | ||||||||
| Danaher Corp. | 16,533 | 1,519,217 | 16,368 | |||||||||
| Darden Restaurants, Inc. | 25,176 | 1,470,051 | 132,150 | |||||||||
| Dean Foods Co. | 64,411 | 1,132,359 | (27,710 | ) | ||||||||
| Delta Air Lines, Inc. | 33,759 | 1,722,722 | (11,478 | ) | ||||||||
| Deluxe Corp. | 11,660 | 637,143 | (1,207 | ) | ||||||||
| The accompanying notes are an integral part of these financial statements. | (Continued) |
| AQR Funds | Annual Report | December 2015 | ||||||||||||||
122
Table of Contents
| Schedule of Investments | December 31, 2015 |
| AQR LONG-SHORT EQUITY FUND |
REFERENCE ENTITY | SHARES | NOTIONAL (a) | NET UNREALIZED APPRECIATION (DEPRECIATION) | |||||||||
| United States (continued) | ||||||||||||
| DENTSPLY International, Inc. | 21,015 | $ | 1,286,057 | $ | (7,294 | ) | ||||||
| Dick’s Sporting Goods, Inc. | 12,783 | 462,617 | (10,738 | ) | ||||||||
| Dillard’s, Inc. | 4,872 | 330,419 | (10,280 | ) | ||||||||
| Discover Financial Services | 59,640 | 3,213,403 | (15,506 | ) | ||||||||
| Domino’s Pizza, Inc. | 6,673 | 729,826 | 12,545 | |||||||||
| Dover Corp. | 3,798 | 225,829 | 7,026 | |||||||||
| Dow Chemical Co./The | 15,149 | 764,953 | 14,917 | |||||||||
| DR Horton, Inc. | 16,811 | 547,153 | (8,696 | ) | ||||||||
| Dr. Pepper Snapple Group, Inc. | 38,582 | 3,610,622 | (14,780 | ) | ||||||||
| DST Systems, Inc. | 6,524 | 757,936 | (13,808 | ) | ||||||||
| DTE Energy Co. | 20,433 | 1,640,811 | (2,289 | ) | ||||||||
| Dun & Bradstreet Corp./The | 12,807 | 1,343,998 | (12,967 | ) | ||||||||
| Eaton Corp PLC | 28,307 | 1,452,636 | 20,461 | |||||||||
| eBay, Inc. | 117,054 | 3,283,365 | (66,721 | ) | ||||||||
| Edison International | 7,699 | 468,869 | (13,011 | ) | ||||||||
| Edwards Lifesciences Corp. | 20,038 | 1,622,878 | (40,276 | ) | ||||||||
| Electronic Arts, Inc. | 17,948 | 1,276,462 | (43,075 | ) | ||||||||
| Eli Lilly & Co. | 19,171 | 1,652,924 | (37,575 | ) | ||||||||
| Emerson Electric Co. | 32,441 | 1,459,845 | 91,808 | |||||||||
| Entergy Corp. | 15,186 | 1,020,955 | 17,160 | |||||||||
| EP Energy Corp. | 171,826 | 597,954 | 154,643 | |||||||||
| Equifax, Inc. | 32,574 | 3,687,377 | (59,610 | ) | ||||||||
| Estee Lauder Cos., Inc./The | 13,881 | 1,238,393 | (16,032 | ) | ||||||||
| Esterline Technologies Corp. | 5,744 | 479,955 | (14,691 | ) | ||||||||
| Exelon Corp. | 77,906 | 2,072,300 | 91,150 | |||||||||
| Expedia, Inc. | 15,224 | 1,958,872 | (66,529 | ) | ||||||||
| Expeditors International of Washington, Inc. | 9,320 | 430,438 | (10,106 | ) | ||||||||
| Express Scripts Holding Co. | 7,755 | 682,410 | (4,545 | ) | ||||||||
| F5 Networks, Inc. | 15,720 | 1,555,337 | (31,126 | ) | ||||||||
| Facebook, Inc. | 2,976 | 316,111 | (4,643 | ) | ||||||||
| FactSet Research Systems, Inc. | 10,983 | 1,784,555 | 952 | |||||||||
| Fair Isaac Corp. | 991 | 92,456 | 877 | |||||||||
| Fairchild Semiconductor International, Inc. | 31,548 | 632,537 | 20,822 | |||||||||
| FedEx Corp. | 9,351 | 1,419,856 | (26,650 | ) | ||||||||
| Fifth Third BanCorp. | 14,903 | 303,704 | (4,154 | ) | ||||||||
| First American Financial Corp. | 2,848 | 103,709 | (1,465 | ) | ||||||||
| First Solar, Inc. | 43,526 | 2,806,556 | 65,724 | |||||||||
| Fiserv, Inc. | 1,731 | 161,544 | (3,226 | ) | ||||||||
| FLIR Systems, Inc. | 10,267 | 293,925 | (5,730 | ) | ||||||||
| Flowers Foods, Inc. | 18,768 | 415,241 | (11,917 | ) | ||||||||
| Fluor Corp. | 3,740 | 172,489 | 4,114 | |||||||||
| Foot Locker, Inc. | 20,634 | 1,320,782 | 22,285 | |||||||||
| Ford Motor Co. | 77,447 | 1,082,709 | 8,519 | |||||||||
REFERENCE ENTITY | SHARES | NOTIONAL (a) | NET UNREALIZED APPRECIATION (DEPRECIATION) | |||||||||
| United States (continued) | ||||||||||||
| Franklin Resources, Inc. | 51,728 | $ | 1,849,105 | $ | 55,520 | |||||||
| GameStop Corp. | 7,706 | 223,859 | (7,783 | ) | ||||||||
| Gap, Inc./The | 29,040 | 731,808 | (14,520 | ) | ||||||||
| Gartner, Inc. | 1,043 | 94,538 | 62 | |||||||||
| General Dynamics Corp. | 26,564 | 3,670,082 | (21,251 | ) | ||||||||
| General Mills, Inc. | 32,935 | 1,906,597 | (7,565 | ) | ||||||||
| General Motors Co. | 177,172 | 6,043,337 | (17,717 | ) | ||||||||
| Genpact Ltd. | 48,146 | 1,197,195 | 5,493 | |||||||||
| Gilead Sciences, Inc. | 34,744 | 3,556,396 | (40,650 | ) | ||||||||
| Global Payments, Inc. | 4,690 | 311,485 | (8,934 | ) | ||||||||
| GNC Holdings, Inc. | 23,245 | 714,784 | 6,276 | |||||||||
| Goodyear Tire & Rubber Co./The | 83,627 | 2,717,878 | 14,217 | |||||||||
| Graham Holdings Co. | 2,622 | 1,300,486 | (28,894 | ) | ||||||||
| Groupon, Inc. | 422,689 | 1,339,924 | (42,269 | ) | ||||||||
| Guess?, Inc. | 12,796 | 248,148 | (6,559 | ) | ||||||||
| H&R Block, Inc. | 11,378 | 383,206 | (4,205 | ) | ||||||||
| Hanover Insurance Group, Inc./The | 10,411 | 857,270 | (10,439 | ) | ||||||||
| Hartford Financial Services Group, Inc./The | 15,989 | 692,603 | 2,279 | |||||||||
| HCA Holdings, Inc. | 39,914 | 2,584,032 | 115,351 | |||||||||
| HD Supply Holdings, Inc. | 36,317 | 1,057,834 | 32,766 | |||||||||
| Herman Miller, Inc. | 51,728 | 1,560,024 | (75,430 | ) | ||||||||
| HNI Corp. | 5,192 | 193,188 | (5,965 | ) | ||||||||
| HollyFrontier Corp. | 53,004 | 2,230,539 | (116,209 | ) | ||||||||
| Hologic, Inc. | 12,075 | 479,231 | (12,050 | ) | ||||||||
| Home Depot, Inc./The | 11,143 | 1,463,633 | 10,029 | |||||||||
| Honeywell International, Inc. | 7,299 | 769,115 | (13,158 | ) | ||||||||
| Hormel Foods Corp. | 8,261 | 660,398 | (7,118 | ) | ||||||||
| HP, Inc. | 255,027 | 3,034,821 | (15,302 | ) | ||||||||
| HSN, Inc. | 9,590 | 491,306 | (5,381 | ) | ||||||||
| Hubbell, Inc. | 3,750 | 350,100 | 28,800 | |||||||||
| Huntington Ingalls Industries, Inc. | 37,436 | 4,763,039 | (14,283 | ) | ||||||||
| Huntsman Corp. | 8,464 | 85,103 | 11,133 | |||||||||
| IAC/InterActiveCorp. | 28,495 | 1,753,012 | (41,888 | ) | ||||||||
| IHS, Inc. | 2,200 | 256,586 | 3,960 | |||||||||
| IMS Health Holdings, Inc. | 23,106 | 591,962 | (3,452 | ) | ||||||||
| Ingram Micro, Inc. | 115,460 | 3,567,715 | (60,040 | ) | ||||||||
| Ingredion, Inc. | 16,471 | 1,605,648 | (27,067 | ) | ||||||||
| Integrated Device Technology, Inc. | 64,806 | 1,748,466 | (40,828 | ) | ||||||||
| Intel Corp. | 58,650 | 2,047,472 | (26,979 | ) | ||||||||
| InterDigital, Inc. | 13,120 | 633,405 | 10,000 | |||||||||
| International Business Machines Corp. | 19,739 | 2,699,308 | 17,173 | |||||||||
| International Paper Co. | 56,381 | 2,126,691 | (1,128 | ) | ||||||||
| Interpublic Group of Cos., Inc./The | 65,524 | 1,473,635 | 51,764 | |||||||||
| Intuit, Inc. | 13,772 | 1,347,866 | (18,868 | ) | ||||||||
| Invesco Ltd. | 26,266 | 826,409 | 52,976 | |||||||||
| ITT Corp. | 22,736 | 807,330 | 18,442 | |||||||||
| Jabil Circuit, Inc. | 24,635 | 585,930 | (12,181 | ) | ||||||||
| The accompanying notes are an integral part of these financial statements. | (Continued) |
| AQR Funds | Annual Report | December 2015 | ||||||||||||||
123
Table of Contents
| Schedule of Investments | December 31, 2015 |
| AQR LONG-SHORT EQUITY FUND |
REFERENCE ENTITY | SHARES | NOTIONAL (a) | NET UNREALIZED APPRECIATION (DEPRECIATION) | |||||||||
| United States (continued) | ||||||||||||
| Jack Henry & Associates, Inc. | 12,606 | $ | 994,430 | $ | (10,406 | ) | ||||||
| Jack in the Box, Inc. | 19,086 | 1,460,614 | 3,473 | |||||||||
| Jacobs Engineering Group, Inc. | 22,501 | 936,042 | 7,875 | |||||||||
| Janus Capital Group, Inc. | 11,489 | 160,135 | 1,745 | |||||||||
| JetBlue Airways Corp. | 45,509 | 1,050,262 | (19,483 | ) | ||||||||
| John Wiley & Sons, Inc. | 20,427 | 919,454 | 374 | |||||||||
| Johnson & Johnson | 26,457 | 2,744,513 | (26,850 | ) | ||||||||
| JPMorgan Chase & Co. | 26,346 | 1,746,213 | (6,587 | ) | ||||||||
| Juniper Networks, Inc. | 65,060 | 1,874,910 | (79,254 | ) | ||||||||
| Kellogg Co. | 9,359 | 670,198 | 6,177 | |||||||||
| KeyCorp. | 30,673 | 399,704 | 4,873 | |||||||||
| Keysight Technologies, Inc. | 3,299 | 94,045 | (585 | ) | ||||||||
| Kimberly-Clark Corp. | 31,487 | 3,993,776 | 14,519 | |||||||||
| Kohl’s Corp. | 4,330 | 192,472 | 13,765 | |||||||||
| Kroger Co./The | 28,205 | 1,182,918 | (3,103 | ) | ||||||||
| L Brands, Inc. | 8,126 | 784,809 | (6,176 | ) | ||||||||
| L-3 Communications Holdings, Inc. | 12,258 | 1,459,048 | 5,906 | |||||||||
| Lam Research Corp. | 19,289 | 1,518,044 | 13,888 | |||||||||
| Lancaster Colony Corp. | 6,397 | 737,963 | 635 | |||||||||
| Landstar System, Inc. | 7,702 | 451,331 | 392 | |||||||||
| Lear Corp. | 13,587 | 1,662,472 | 6,419 | |||||||||
| Legg Mason, Inc. | 29,945 | 1,170,728 | 4,014 | |||||||||
| Leggett & Platt, Inc. | 10,824 | 467,798 | (12,974 | ) | ||||||||
| Leidos Holdings, Inc. | 39,864 | 2,287,868 | (45,120 | ) | ||||||||
| Lennox International, Inc. | 5,499 | 697,157 | (10,332 | ) | ||||||||
| Liberty Interactive Corp. QVC Group | 68,142 | 1,803,136 | 58,504 | |||||||||
| LifePoint Health, Inc. | 7,704 | 559,840 | 5,633 | |||||||||
| Lincoln Electric Holdings, Inc. | 16,283 | 821,879 | 23,045 | |||||||||
| Lincoln National Corp. | 45,806 | 2,301,293 | 916 | |||||||||
| Linear Technology Corp. | 16,908 | 743,222 | (25,139 | ) | ||||||||
| Lockheed Martin Corp. | 2,634 | 580,377 | (8,404 | ) | ||||||||
| Lowe’s Cos., Inc. | 29,294 | 2,194,121 | 33,395 | |||||||||
| LyondellBasell Industries NV | 21,843 | 1,916,732 | (18,575 | ) | ||||||||
| Macy’s, Inc. | 46,932 | 1,619,154 | 22,527 | |||||||||
| Mallinckrodt PLC | 16,141 | 1,174,470 | 30,133 | |||||||||
| Manhattan Associates, Inc. | 13,479 | 953,159 | (61,254 | ) | ||||||||
| ManpowerGroup, Inc. | 33,963 | 2,857,997 | 4,744 | |||||||||
| Marathon Petroleum Corp. | 64,806 | 3,325,844 | 33,699 | |||||||||
| Marvell Technology Group Ltd. | 346,397 | 2,933,983 | 121,239 | |||||||||
| Masco Corp. | 134,687 | 3,821,070 | (9,428 | ) | ||||||||
| Maxim Integrated Products, Inc. | 41,525 | 1,577,669 | 281 | |||||||||
| McDonald’s Corp. | 16,634 | 1,954,495 | 10,646 | |||||||||
| McGraw Hill Financial, Inc. | 5,405 | 515,205 | 17,620 | |||||||||
| McKesson Corp. | 21,327 | 4,052,557 | 153,768 | |||||||||
REFERENCE ENTITY | SHARES | NOTIONAL (a) | NET UNREALIZED APPRECIATION (DEPRECIATION) | |||||||||
| United States (continued) | ||||||||||||
| Mead Johnson Nutrition Co. | 14,757 | $ | 1,144,996 | $ | 20,070 | |||||||
| Medivation, Inc. | 55,409 | 2,419,157 | 259,314 | |||||||||
| Mentor Graphics Corp. | 77,397 | 1,438,087 | (12,435 | ) | ||||||||
| Merck & Co., Inc. | 44,061 | 2,322,395 | 4,907 | |||||||||
| MetLife, Inc. | 52,928 | 2,512,492 | 39,167 | |||||||||
| Mettler-Toledo International, Inc. | 2,537 | 880,040 | (19,667 | ) | ||||||||
| Michaels Cos., Inc./The | 4,398 | 96,616 | 624 | |||||||||
| Micron Technology, Inc. | 107,591 | 1,540,703 | (17,215 | ) | ||||||||
| Microsoft Corp. | 37,876 | 2,109,693 | (8,333 | ) | ||||||||
| Minerals Technologies, Inc. | 2,031 | 95,805 | (2,663 | ) | ||||||||
| Molina Healthcare, Inc. | 41,698 | 2,466,038 | 41,263 | |||||||||
| Mondelez International, Inc. | 45,423 | 2,018,613 | 18,155 | |||||||||
| Moody’s Corp. | 5,007 | 490,085 | 12,317 | |||||||||
| Morgan Stanley | 33,448 | 1,083,046 | (19,065 | ) | ||||||||
| Mosaic Co./The | 20,959 | 604,458 | (26,199 | ) | ||||||||
| Motorola Solutions, Inc. | 4,428 | 308,127 | (5,031 | ) | ||||||||
| MSCI, Inc. | 45,651 | 3,236,849 | 55,958 | |||||||||
| MSG Networks, Inc. | 80,035 | 1,664,767 | (39 | ) | ||||||||
| Murphy USA, Inc. | 12,459 | 778,248 | (21,488 | ) | ||||||||
| Nasdaq, Inc. | 48,749 | 2,755,973 | 79,756 | |||||||||
| Navient Corp. | 69,026 | 861,444 | (71,097 | ) | ||||||||
| NCR Corp. | 29,541 | 756,250 | (33,677 | ) | ||||||||
| NetApp, Inc. | 64,661 | 1,769,654 | (54,198 | ) | ||||||||
| NeuStar, Inc. | 16,505 | 408,563 | (12,938 | ) | ||||||||
| News Corp. | 44,470 | 602,858 | (8,739 | ) | ||||||||
| NIKE, Inc. | 46,272 | 3,012,770 | (120,770 | ) | ||||||||
| NiSource, Inc. | 48,226 | 929,797 | 11,092 | |||||||||
| Nordstrom, Inc. | 7,221 | 370,726 | (11,048 | ) | ||||||||
| Northrop Grumman Corp. | 17,763 | 3,344,951 | 8,882 | |||||||||
| Nu Skin Enterprises, Inc. | 33,541 | 1,272,965 | (2,096 | ) | ||||||||
| Nuance Communications, Inc. | 26,210 | 532,907 | (11,590 | ) | ||||||||
| NVIDIA Corp. | 30,010 | 980,427 | 8,703 | |||||||||
| NVR, Inc. | 261 | 431,301 | (2,478 | ) | ||||||||
| Oil States International, Inc. | 61,260 | 1,729,982 | (60,647 | ) | ||||||||
| Old Republic International Corp. | 20,920 | 393,684 | (3,944 | ) | ||||||||
| Omnicom Group, Inc. | 7,112 | 534,576 | 3,518 | |||||||||
| ON Semiconductor Corp. | 155,192 | 1,558,595 | (37,713 | ) | ||||||||
| OneMain Holdings, Inc. | 14,503 | 601,133 | 1,322 | |||||||||
| Oracle Corp. | 49,073 | 1,813,059 | (20,423 | ) | ||||||||
| Orbital ATK, Inc. | 6,546 | 576,540 | 8,279 | |||||||||
| O’Reilly Automotive, Inc. | 2,011 | 518,061 | (8,433 | ) | ||||||||
| Owens Corning | 94,653 | 4,437,333 | 14,198 | |||||||||
| Panera Bread Co. | 2,089 | 405,855 | 1,040 | |||||||||
| Parker-Hannifin Corp. | 1,511 | 143,832 | 2,705 | |||||||||
| PepsiCo, Inc. | 82,215 | 8,237,943 | (23,020 | ) | ||||||||
| Pfizer, Inc. | 110,193 | 3,562,540 | (5,510 | ) | ||||||||
| PG&E Corp. | 40,561 | 2,184,210 | (26,770 | ) | ||||||||
| The accompanying notes are an integral part of these financial statements. | (Continued) |
| AQR Funds | Annual Report | December 2015 | ||||||||||||||
124
Table of Contents
| Schedule of Investments | December 31, 2015 |
| AQR LONG-SHORT EQUITY FUND |
REFERENCE ENTITY | SHARES | NOTIONAL (a) | NET UNREALIZED APPRECIATION (DEPRECIATION) | |||||||||
| United States (continued) | ||||||||||||
| Philip Morris International, Inc. | 16,023 | $ | 1,427,329 | $ | (18,747 | ) | ||||||
| Phillips 66 | 15,903 | 1,305,179 | (4,314 | ) | ||||||||
| Pinnacle Foods, Inc. | 3,171 | 133,274 | 1,366 | |||||||||
| Pinnacle West Capital Corp. | 11,392 | 733,678 | 878 | |||||||||
| Pitney Bowes, Inc. | 62,626 | 1,241,247 | 51,980 | |||||||||
| Plantronics, Inc. | 15,102 | 738,133 | (21,997 | ) | ||||||||
| PNC Financial Services Group, Inc./The | 12,137 | 1,163,723 | (6,946 | ) | ||||||||
| Polycom, Inc. | 122,372 | 1,607,931 | (67,267 | ) | ||||||||
| Priceline Group, Inc./The | 1,224 | 1,607,744 | (47,205 | ) | ||||||||
| Principal Financial Group, Inc. | 10,234 | 468,101 | (7,776 | ) | ||||||||
| ProAssurance Corp. | 11,824 | 582,351 | (8,533 | ) | ||||||||
| Procter & Gamble Co./The | 50,715 | 4,071,907 | (44,629 | ) | ||||||||
| Progressive Corp./The | 8,886 | 286,833 | (4,258 | ) | ||||||||
| Prudential Financial, Inc. | 17,017 | 1,392,841 | (7,487 | ) | ||||||||
| PTC, Inc. | 8,531 | 289,542 | 5,886 | |||||||||
| Public Service Enterprise Group, Inc. | 172,918 | 6,590,061 | 100,136 | |||||||||
| PVH Corp. | 10,463 | 775,892 | (5,292 | ) | ||||||||
| QEP Resources, Inc. | 52,119 | 609,271 | 89,123 | |||||||||
| QUALCOMM, Inc. | 17,190 | 873,821 | (14,579 | ) | ||||||||
| Quanta Services, Inc. | 44,766 | 897,776 | 8,735 | |||||||||
| Quest Diagnostics, Inc. | 24,911 | 1,722,157 | 50,011 | |||||||||
| Quintiles Transnational Holdings, Inc. | 57,482 | 4,015,693 | (68,978 | ) | ||||||||
| Rackspace Hosting, Inc. | 87,409 | 2,185,333 | 27,862 | |||||||||
| Ralph Lauren Corp. | 10,085 | 1,139,898 | (15,622 | ) | ||||||||
| Raytheon Co. | 18,752 | 2,388,810 | (53,624 | ) | ||||||||
| Red Hat, Inc. | 7,778 | 632,575 | 11,521 | |||||||||
| Regions Financial Corp. | 50,242 | 489,444 | (7,120 | ) | ||||||||
| Reinsurance Group of America, Inc. | 23,079 | 1,999,130 | (24,722 | ) | ||||||||
| Reliance Steel & Aluminum Co. | 16,049 | 898,945 | 30,453 | |||||||||
| RenaissanceRe Holdings Ltd. | 1,091 | 121,123 | 2,367 | |||||||||
| Republic Services, Inc. | 13,021 | 571,118 | 1,675 | |||||||||
| ResMed, Inc. | 7,457 | 406,753 | (6,386 | ) | ||||||||
| Reynolds American, Inc. | 11,584 | 539,491 | (4,890 | ) | ||||||||
| Robert Half International, Inc. | 70,396 | 3,262,950 | 55,518 | |||||||||
| Rockwell Automation, Inc. | 28,025 | 2,803,061 | 72,585 | |||||||||
| Ross Stores, Inc. | 12,200 | 657,092 | (610 | ) | ||||||||
| Rovi Corp. | 52,162 | 574,825 | 294,194 | |||||||||
| Sally Beauty Holdings, Inc. | 17,574 | 501,386 | (11,247 | ) | ||||||||
| Santander Consumer USA Holdings, Inc. | 30,053 | 464,020 | 12,320 | |||||||||
| Seagate Technology PLC | 16,218 | 550,115 | 44,437 | |||||||||
| SEI Investments Co. | 11,336 | 596,407 | (2,400 | ) | ||||||||
REFERENCE ENTITY | SHARES | NOTIONAL (a) | NET UNREALIZED APPRECIATION (DEPRECIATION) | |||||||||
| United States (continued) | ||||||||||||
| Sensient Technologies Corp. | 1,607 | $ | 100,538 | $ | 414 | |||||||
| Service Corp. International | 18,266 | 477,894 | (2,612 | ) | ||||||||
| Sherwin-Williams Co./The | 1,931 | 509,343 | (8,055 | ) | ||||||||
| Skechers U.S.A., Inc. | 33,546 | 1,014,096 | (671 | ) | ||||||||
| Skyworks Solutions, Inc. | 9,249 | 720,756 | (10,156 | ) | ||||||||
| Snap-on, Inc. | 1,660 | 282,947 | 1,627 | |||||||||
| Sonoco Products Co. | 35,245 | 1,440,098 | 365 | |||||||||
| Southwest Airlines Co. | 45,871 | 1,995,847 | (20,642 | ) | ||||||||
| Spirit AeroSystems Holdings, Inc. | 78,835 | 3,819,573 | 127,695 | |||||||||
| SPX Corp. | 64,102 | 590,406 | 7,665 | |||||||||
| St. Jude Medical, Inc. | 27,607 | 1,695,665 | 9,620 | |||||||||
| Stanley Black & Decker, Inc. | 6,516 | 700,732 | (5,279 | ) | ||||||||
| Staples, Inc. | 97,695 | 931,371 | (6,199 | ) | ||||||||
| Starbucks Corp. | 16,640 | 995,207 | 3,692 | |||||||||
| State Street Corp. | 9,647 | 640,561 | (386 | ) | ||||||||
| Steel Dynamics, Inc. | 25,238 | 429,298 | 21,705 | |||||||||
| Stryker Corp. | 5,105 | 476,136 | (1,678 | ) | ||||||||
| SunTrust Banks, Inc. | 15,276 | 665,507 | (11,083 | ) | ||||||||
| Superior Energy Services, Inc. | 29,957 | 392,137 | 11,384 | |||||||||
| SUPERVALU, Inc. | 301,271 | 2,030,567 | 12,051 | |||||||||
| Synchrony Financial | 63,003 | 1,907,117 | 8,804 | |||||||||
| Synopsys, Inc. | 22,292 | 1,008,045 | 8,693 | |||||||||
| Sysco Corp. | 5,049 | 209,434 | (2,425 | ) | ||||||||
| T Rowe Price Group, Inc. | 10,615 | 770,721 | (11,855 | ) | ||||||||
| Talen Energy Corp. | 41,761 | 246,795 | 13,377 | |||||||||
| Target Corp. | 53,261 | 3,852,368 | 14,913 | |||||||||
| Tech Data Corp. | 37,369 | 2,497,087 | (16,533 | ) | ||||||||
| Teekay Corp. | 18,402 | 183,021 | (1,393 | ) | ||||||||
| Teledyne Technologies, Inc. | 2,980 | 265,493 | (1,167 | ) | ||||||||
| Telephone & Data Systems, Inc. | 28,079 | 738,184 | (11,219 | ) | ||||||||
| Teradata Corp. | 35,975 | 966,647 | (16,187 | ) | ||||||||
| Teradyne, Inc. | 79,204 | 1,635,131 | 2,016 | |||||||||
| Tesoro Corp. | 17,644 | 1,869,382 | (10,234 | ) | ||||||||
| Texas Instruments, Inc. | 28,569 | 1,617,870 | (52,003 | ) | ||||||||
| Textron, Inc. | 13,265 | 558,720 | (1,458 | ) | ||||||||
| Thermo Fisher Scientific, Inc. | 4,626 | 639,128 | 17,070 | |||||||||
| Thomson Reuters Corp. | 8,769 | 336,616 | (4,709 | ) | ||||||||
| Thor Industries, Inc. | 20,544 | 1,158,752 | (5,206 | ) | ||||||||
| Time Warner, Inc. | 6,207 | 402,121 | (715 | ) | ||||||||
| Timken Co./The | 13,209 | 360,079 | 17,567 | |||||||||
| TJX Cos., Inc./The | 16,529 | 1,167,774 | 4,298 | |||||||||
| TopBuild Corp. | 3,107 | 91,201 | 4,402 | |||||||||
| Torchmark Corp. | 2,363 | 136,465 | (1,396 | ) | ||||||||
| Total System Services, Inc. | 41,592 | 2,160,171 | (88,889 | ) | ||||||||
| Tractor Supply Co. | 1,553 | 133,356 | (575 | ) | ||||||||
| The accompanying notes are an integral part of these financial statements. | (Continued) |
| AQR Funds | Annual Report | December 2015 | ||||||||||||||
125
Table of Contents
| Schedule of Investments | December 31, 2015 |
| AQR LONG-SHORT EQUITY FUND |
REFERENCE ENTITY | SHARES | NOTIONAL (a) | NET UNREALIZED APPRECIATION (DEPRECIATION) | |||||||||
| United States (continued) | ||||||||||||
| Travelers Cos., Inc./The | 22,265 | $ | 2,521,957 | $ | (9,129 | ) | ||||||
| Trinity Industries, Inc. | 12,134 | 288,911 | 2,548 | |||||||||
| Triumph Group, Inc. | 18,001 | 611,314 | 104,226 | |||||||||
| Tupperware Brands Corp. | 6,001 | 334,007 | (51 | ) | ||||||||
| Tyson Foods, Inc. | 25,380 | 1,352,626 | 889 | |||||||||
| Union Pacific Corp. | 14,272 | 1,106,760 | 9,310 | |||||||||
| United Technologies Corp. | 10,231 | 960,384 | 22,508 | |||||||||
| United Therapeutics Corp. | 28,937 | 4,576,097 | (44,274 | ) | ||||||||
| UnitedHealth Group, Inc. | 22,360 | 2,665,759 | (35,329 | ) | ||||||||
| Universal Health Services, Inc. | 8,189 | 963,122 | 15,381 | |||||||||
| Unum Group | 40,549 | 1,341,276 | 8,600 | |||||||||
| Urban Outfitters, Inc. | 15,162 | 350,065 | (5,130 | ) | ||||||||
| US Bancorp. | 23,606 | 1,029,822 | (22,554 | ) | ||||||||
| Valero Energy Corp. | 44,401 | 3,182,664 | (43,069 | ) | ||||||||
| Validus Holdings Ltd. | 34,248 | 1,589,143 | (3,803 | ) | ||||||||
| Varian Medical Systems, Inc. | 12,193 | 956,734 | 28,461 | |||||||||
| VCA, Inc. | 2,682 | 144,138 | 3,372 | |||||||||
| Vectren Corp. | 12,348 | 516,270 | 7,532 | |||||||||
| VeriSign, Inc. | 11,796 | 1,036,294 | (5,796 | ) | ||||||||
| Verizon Communications, Inc. | 42,040 | 1,938,044 | 5,045 | |||||||||
| VF Corp. | 24,370 | 1,522,150 | (5,118 | ) | ||||||||
| Viacom, Inc. | 44,633 | 1,777,898 | 59,196 | |||||||||
| Vishay Intertechnology, Inc. | 47,181 | 565,024 | 3,507 | |||||||||
| VMware, Inc. | 12,294 | 701,742 | (6,270 | ) | ||||||||
| Voya Financial, Inc. | 8,486 | 311,521 | 1,697 | |||||||||
| Waddell & Reed Financial, Inc. | 29,624 | 869,971 | (20,948 | ) | ||||||||
| Wal-Mart Stores, Inc. | 67,526 | 3,982,683 | 156,660 | |||||||||
| Walt Disney Co./The | 4,982 | 533,893 | (10,384 | ) | ||||||||
| Waste Management, Inc. | 30,629 | 1,635,897 | (1,228 | ) | ||||||||
| Waters Corp. | 4,273 | 567,831 | 7,229 | |||||||||
| Watsco, Inc. | 4,182 | 497,399 | (7,562 | ) | ||||||||
| WellCare Health Plans, Inc. | 3,683 | 297,034 | (8,987 | ) | ||||||||
| Wells Fargo & Co. | 26,014 | 1,441,439 | (27,318 | ) | ||||||||
| Werner Enterprises, Inc. | 66,117 | 1,593,210 | (46,733 | ) | ||||||||
| WESCO International, Inc. | 8,765 | 351,882 | 30,973 | |||||||||
| Western Digital Corp. | 45,429 | 2,698,483 | 29,529 | |||||||||
| Western Refining, Inc. | 35,384 | 1,341,761 | (81,383 | ) | ||||||||
| Western Union Co./The | 71,125 | 1,290,689 | (16,841 | ) | ||||||||
| Westlake Chemical Corp. | 23,412 | 1,271,376 | 364 | |||||||||
| WGL Holdings, Inc. | 1,465 | 92,804 | (523 | ) | ||||||||
| Whirlpool Corp. | 6,241 | 917,614 | (999 | ) | ||||||||
| World Fuel Services Corp. | 32,755 | 1,282,937 | (23,179 | ) | ||||||||
| Worthington Industries, Inc. | 11,708 | 355,283 | (2,404 | ) | ||||||||
REFERENCE ENTITY | SHARES | NOTIONAL (a) | NET UNREALIZED APPRECIATION (DEPRECIATION) | |||||||||
| United States (continued) | ||||||||||||
| Wyndham Worldwide Corp. | 2,921 | $ | 212,327 | $ | (116 | ) | ||||||
| Xerox Corp. | 154,362 | 1,572,949 | 67,919 | |||||||||
| Xilinx, Inc. | 35,173 | 1,663,699 | (11,624 | ) | ||||||||
| Yelp, Inc. | 21,986 | 602,856 | 30,341 | |||||||||
| Yum! Brands, Inc. | 25,983 | 1,878,830 | 19,229 | |||||||||
| Zoetis, Inc. | 24,964 | 1,167,634 | 28,640 | |||||||||
| Zynga, Inc. | 316,857 | 823,828 | 25,348 | |||||||||
|
| |||||||||||
| 1,220,785 | ||||||||||||
|
| |||||||||||
Total of Long Equity Positions | 1,305,416 | |||||||||||
|
| |||||||||||
| Short Positions | ||||||||||||
| Common Stocks | ||||||||||||
| Canada | ||||||||||||
| lululemon athletica, Inc. | (18,785 | ) | (984,567 | ) | (1,082 | ) | ||||||
|
| |||||||||||
| Ireland | ||||||||||||
| Alkermes PLC | (6,892 | ) | (535,439 | ) | (11,647 | ) | ||||||
| Allegion PLC | (14,515 | ) | (957,986 | ) | 1,157 | |||||||
| Endo International PLC | (42,891 | ) | (2,632,650 | ) | 6,863 | |||||||
| Perrigo Co PLC | (9,304 | ) | (1,360,563 | ) | 14,274 | |||||||
|
| |||||||||||
| 10,647 | ||||||||||||
|
| |||||||||||
| Netherlands | ||||||||||||
| Chicago Bridge & Iron Co. NV | (32,008 | ) | (1,278,422 | ) | 30,430 | |||||||
| Core Laboratories NV | (30,672 | ) | (3,389,215 | ) | 53,942 | |||||||
| Frank’s International NV | (37,075 | ) | (590,644 | ) | (28,137 | ) | ||||||
| QIAGEN NV | (52,705 | ) | (1,420,873 | ) | (36,420 | ) | ||||||
| Sensata Technologies Holding NV | (110,592 | ) | (4,939,039 | ) | (154,829 | ) | ||||||
|
| |||||||||||
| (135,014 | ) | |||||||||||
|
| |||||||||||
| Norway | ||||||||||||
| Golar LNG Ltd. | (35,103 | ) | (495,303 | ) | (58,973 | ) | ||||||
|
| |||||||||||
| Panama | ||||||||||||
| Copa Holdings SA | (4,643 | ) | (227,431 | ) | 3,360 | |||||||
|
| |||||||||||
| Singapore | ||||||||||||
| Avago Technologies Ltd. | (6,190 | ) | (869,571 | ) | (28,907 | ) | ||||||
|
| |||||||||||
| Switzerland | ||||||||||||
| Weatherford International PLC | (170,140 | ) | (1,464,906 | ) | 37,431 | |||||||
|
| |||||||||||
| United Kingdom | ||||||||||||
| Aon PLC | (20,357 | ) | (1,899,071 | ) | 21,952 | |||||||
| Delphi Automotive PLC | (9,478 | ) | (791,034 | ) | (21,515 | ) | ||||||
| Ensco PLC | (26,949 | ) | (411,175 | ) | (3,570 | ) | ||||||
| Liberty Global PLC | (31,325 | ) | (1,254,485 | ) | (72,442 | ) | ||||||
| Pentair PLC | (44,392 | ) | (2,208,945 | ) | 10,210 | |||||||
| Willis Group Holdings PLC | (7,376 | ) | (340,255 | ) | (17,997 | ) | ||||||
|
| |||||||||||
| (83,362 | ) | |||||||||||
|
| |||||||||||
| The accompanying notes are an integral part of these financial statements. | (Continued) |
| AQR Funds | Annual Report | December 2015 | ||||||||||||||
126
Table of Contents
| Schedule of Investments | December 31, 2015 |
| AQR LONG-SHORT EQUITY FUND |
REFERENCE ENTITY | SHARES | NOTIONAL (a) | NET UNREALIZED APPRECIATION (DEPRECIATION) | |||||||||
| United States | ||||||||||||
| 3D Systems Corp. | (111,445 | ) | $ | (1,013,347 | ) | $ | 44,890 | |||||
| Acadia Healthcare Co., Inc. | (52,318 | ) | (3,224,948 | ) | (42,835 | ) | ||||||
| ACI Worldwide, Inc. | (6,823 | ) | (157,338 | ) | 11,326 | |||||||
| Acuity Brands, Inc. | (3,971 | ) | (937,625 | ) | 9,205 | |||||||
| Acxiom Corp. | (49,283 | ) | (1,077,819 | ) | 46,819 | |||||||
| ADT Corp./The | (56,964 | ) | (1,888,357 | ) | 9,684 | |||||||
| Advance Auto Parts, Inc. | (5,343 | ) | (817,853 | ) | 13,678 | |||||||
| AECOM | (68,339 | ) | (2,002,256 | ) | (49,964 | ) | ||||||
| Agios Pharmaceuticals, Inc. | (3,604 | ) | (200,274 | ) | (33,697 | ) | ||||||
| Air Lease Corp. | (28,796 | ) | (923,045 | ) | (41,045 | ) | ||||||
| Air Products & Chemicals, Inc. | (3,224 | ) | (427,629 | ) | 8,154 | |||||||
| Akorn, Inc. | (98,816 | ) | (3,467,453 | ) | (219,372 | ) | ||||||
| Albemarle Corp. | (50,357 | ) | (2,639,714 | ) | (180,782 | ) | ||||||
| Alcoa, Inc. | (101,734 | ) | (976,047 | ) | (28,068 | ) | ||||||
| Alere, Inc. | (17,013 | ) | (668,573 | ) | 3,535 | |||||||
| Alexion Pharmaceuticals, Inc. | (29,102 | ) | (5,406,861 | ) | (144,346 | ) | ||||||
| Align Technology, Inc. | (21,399 | ) | (1,386,013 | ) | (23,111 | ) | ||||||
| Allegheny Technologies, Inc. | (43,668 | ) | (462,073 | ) | (29,192 | ) | ||||||
| Alliance Data Systems Corp. | (12,764 | ) | (3,435,920 | ) | (94,219 | ) | ||||||
| Alliant Energy Corp. | (18,874 | ) | (1,198,843 | ) | 20,161 | |||||||
| Ally Financial, Inc. | (101,157 | ) | (1,871,832 | ) | (13,734 | ) | ||||||
| Alnylam Pharmaceuticals, Inc. | (13,270 | ) | (1,170,149 | ) | (79,089 | ) | ||||||
| AMC Networks, Inc. | (3,344 | ) | (260,377 | ) | 10,647 | |||||||
| American Airlines Group, Inc. | (39,367 | ) | (1,671,523 | ) | 4,330 | |||||||
| AMETEK, Inc. | (43,544 | ) | (2,331,781 | ) | (1,742 | ) | ||||||
| Amphenol Corp. | (41,381 | ) | (2,182,020 | ) | 20,691 | |||||||
| Anadarko Petroleum Corp. | (28,629 | ) | (1,337,833 | ) | (52,964 | ) | ||||||
| Apache Corp. | (45,787 | ) | (1,966,552 | ) | (69,596 | ) | ||||||
| Aqua America, Inc. | (50,771 | ) | (1,531,060 | ) | 18,084 | |||||||
| Arista Networks, Inc. | (41,830 | ) | (3,149,065 | ) | (106,983 | ) | ||||||
| ARRIS Group, Inc. | (125,776 | ) | (3,755,671 | ) | (89,301 | ) | ||||||
| Arthur J Gallagher & Co. | (6,633 | ) | (273,678 | ) | 2,123 | |||||||
| Artisan Partners Asset Management, Inc. | (12,672 | ) | (451,841 | ) | (5,111 | ) | ||||||
| Ascena Retail Group, Inc. | (88,764 | ) | (919,817 | ) | 45,492 | |||||||
| Ashland, Inc. | (5,782 | ) | (602,085 | ) | 8,273 | |||||||
| Associated Banc-Corp. | (4,988 | ) | (95,520 | ) | 1,995 | |||||||
| AT&T, Inc. | (34,277 | ) | (1,166,803 | ) | (12,668 | ) | ||||||
| athenahealth, Inc. | (3,637 | ) | (572,100 | ) | (13,348 | ) | ||||||
| Autodesk, Inc. | (13,555 | ) | (823,331 | ) | (2,575 | ) | ||||||
| AutoNation, Inc. | (2,348 | ) | (140,318 | ) | 236 | |||||||
| Avis Budget Group, Inc. | (123,460 | ) | (4,346,996 | ) | (133,367 | ) | ||||||
| B/E Aerospace, Inc. | (8,614 | ) | (360,151 | ) | (4,824 | ) | ||||||
| Ball Corp. | (33,585 | ) | (2,384,390 | ) | (58,247 | ) | ||||||
| Bank of Hawaii Corp. | (1,485 | ) | (94,128 | ) | 722 | |||||||
| Bank of the Ozarks, Inc. | (17,709 | ) | (904,894 | ) | 29,006 | |||||||
| BankUnited, Inc. | (5,436 | ) | (199,805 | ) | 3,783 | |||||||
REFERENCE ENTITY | SHARES | NOTIONAL (a) | NET UNREALIZED APPRECIATION (DEPRECIATION) | |||||||||
| United States (continued) | ||||||||||||
| Becton Dickinson and Co. | (9,328 | ) | $ | (1,454,332 | ) | $ | 16,980 | |||||
| Belden, Inc. | (1,960 | ) | (95,368 | ) | 1,915 | |||||||
| Bio-Techne Corp. | (27,409 | ) | (2,456,399 | ) | (10,411 | ) | ||||||
| Black Hills Corp. | (20,312 | ) | (937,985 | ) | (5,101 | ) | ||||||
| Black Knight Financial Services, Inc. | (45,372 | ) | (1,505,903 | ) | 5,905 | |||||||
| Bluebird Bio, Inc. | (18,012 | ) | (1,116,744 | ) | (39,987 | ) | ||||||
| BorgWarner, Inc. | (93,832 | ) | (3,856,562 | ) | (199,795 | ) | ||||||
| Boston Scientific Corp. | (48,940 | ) | (910,284 | ) | 7,831 | |||||||
| Brookdale Senior Living, Inc. | (57,120 | ) | (1,040,726 | ) | (13,709 | ) | ||||||
| Brown & Brown, Inc. | (18,410 | ) | (590,828 | ) | (133 | ) | ||||||
| Brown-Forman Corp. | (22,669 | ) | (2,302,424 | ) | 51,846 | |||||||
| Buffalo Wild Wings, Inc. | (6,512 | ) | (1,038,459 | ) | (1,182 | ) | ||||||
| Cabela’s, Inc. | (51,354 | ) | (2,382,313 | ) | (17,460 | ) | ||||||
| Cable One, Inc. | (1,089 | ) | (484,371 | ) | 12,116 | |||||||
| Cabot Oil & Gas Corp. | (76,019 | ) | (1,237,620 | ) | (107,157 | ) | ||||||
| CalAtlantic Group, Inc. | (24,259 | ) | (931,105 | ) | 11,204 | |||||||
| Calpine Corp. | (6,603 | ) | (83,423 | ) | (12,122 | ) | ||||||
| CarMax, Inc. | (39,610 | ) | (2,253,360 | ) | 115,608 | |||||||
| Casey’s General Stores, Inc. | (2,130 | ) | (264,759 | ) | 8,201 | |||||||
| Catalent, Inc. | (26,929 | ) | (707,110 | ) | 33,077 | |||||||
| Caterpillar, Inc. | (8,166 | ) | (554,289 | ) | (672 | ) | ||||||
| Cathay General Bancorp | (2,975 | ) | (93,926 | ) | 719 | |||||||
| CBOE Holdings, Inc. | (19,086 | ) | (1,250,413 | ) | 11,732 | |||||||
| CBS Corp. | (9,906 | ) | (461,334 | ) | (5,536 | ) | ||||||
| CDK Global, Inc. | (21,851 | ) | (1,049,941 | ) | 12,674 | |||||||
| Celanese Corp. | (4,475 | ) | (296,102 | ) | (5,199 | ) | ||||||
| CenterPoint Energy, Inc. | (5,233 | ) | (93,497 | ) | (2,581 | ) | ||||||
| CenturyLink, Inc. | (13,023 | ) | (330,784 | ) | 3,126 | |||||||
| Cerner Corp. | (17,928 | ) | (1,082,493 | ) | 3,765 | |||||||
| CF Industries Holdings, Inc. | (20,630 | ) | (878,021 | ) | 36,111 | |||||||
| Charles Schwab Corp./The | (111,565 | ) | (3,705,074 | ) | 31,238 | |||||||
| Cheniere Energy, Inc. | (64,436 | ) | (2,401,010 | ) | 769 | |||||||
| Chevron Corp. | (16,371 | ) | (1,485,496 | ) | 12,761 | |||||||
| Chipotle Mexican Grill, Inc. | (2,689 | ) | (1,492,099 | ) | 201,783 | |||||||
| Ciena Corp. | (82,091 | ) | (1,677,005 | ) | (21,458 | ) | ||||||
| Cimarex Energy Co. | (23,115 | ) | (2,211,939 | ) | 145,920 | |||||||
| Cinemark Holdings, Inc. | (2,911 | ) | (96,814 | ) | (501 | ) | ||||||
| Clean Harbors, Inc. | (17,350 | ) | (708,574 | ) | (14,054 | ) | ||||||
| CME Group, Inc. | (15,298 | ) | (1,431,720 | ) | 45,721 | |||||||
| CMS Energy Corp. | (55,880 | ) | (2,033,394 | ) | 17,243 | |||||||
| Cobalt International Energy, Inc. | (104,879 | ) | (583,127 | ) | 16,781 | |||||||
| Cognex Corp. | (14,861 | ) | (511,647 | ) | 9,791 | |||||||
| Colfax Corp. | (35,743 | ) | (829,338 | ) | (5,262 | ) | ||||||
| Columbia Pipeline Group, Inc. | (43,324 | ) | (852,183 | ) | (14,297 | ) | ||||||
| CommScope Holding Co., Inc. | (108,630 | ) | (2,822,956 | ) | 10,525 | |||||||
| The accompanying notes are an integral part of these financial statements. | (Continued) |
| AQR Funds | Annual Report | December 2015 | ||||||||||||||
127
Table of Contents
| Schedule of Investments | December 31, 2015 |
| AQR LONG-SHORT EQUITY FUND |
REFERENCE ENTITY | SHARES | NOTIONAL (a) | NET UNREALIZED APPRECIATION (DEPRECIATION) | |||||||||
| United States (continued) | ||||||||||||
| Compass Minerals International, Inc. | (10,446 | ) | $ | (788,544 | ) | $ | 2,273 | |||||
| ConAgra Foods, Inc. | (6,068 | ) | (246,543 | ) | (9,284 | ) | ||||||
| Concho Resources, Inc. | (18,105 | ) | (1,725,018 | ) | 43,788 | |||||||
| ConocoPhillips | (25,683 | ) | (1,214,292 | ) | 15,153 | |||||||
| CONSOL Energy, Inc. | (99,660 | ) | (687,654 | ) | (99,660 | ) | ||||||
| Constellation Brands, Inc. | (15,500 | ) | (2,168,295 | ) | (39,525 | ) | ||||||
| Cooper Cos., Inc./The | (10,245 | ) | (1,397,612 | ) | 22,733 | |||||||
| Copart, Inc. | (29,398 | ) | (1,139,246 | ) | 21,828 | |||||||
| CoStar Group, Inc. | (7,426 | ) | (1,528,419 | ) | (6,461 | ) | ||||||
| Costco Wholesale Corp. | (9,222 | ) | (1,481,791 | ) | (7,562 | ) | ||||||
| Covanta Holding Corp. | (144,874 | ) | (2,281,614 | ) | 37,516 | |||||||
| CST Brands, Inc. | (25,196 | ) | (974,329 | ) | (11,842 | ) | ||||||
| Cullen/Frost Bankers, Inc. | (5,855 | ) | (362,366 | ) | 11,066 | |||||||
| Cypress Semiconductor Corp. | (167,941 | ) | (1,612,234 | ) | (35,268 | ) | ||||||
| DaVita HealthCare Partners, Inc. | (22,232 | ) | (1,514,444 | ) | (35,349 | ) | ||||||
| Deckers Outdoor Corp. | (4,593 | ) | (225,365 | ) | 8,576 | |||||||
| Deere & Co. | (18,779 | ) | (1,451,060 | ) | 18,786 | |||||||
| Denbury Resources, Inc. | (45,427 | ) | (95,665 | ) | 3,903 | |||||||
| Devon Energy Corp. | (10,964 | ) | (317,737 | ) | (33,111 | ) | ||||||
| DeVry Education Group, Inc. | (37,218 | ) | (945,475 | ) | 3,488 | |||||||
| DexCom, Inc. | (18,015 | ) | (1,472,366 | ) | (3,063 | ) | ||||||
| Diamond Offshore Drilling, Inc. | (4,489 | ) | (95,178 | ) | 460 | |||||||
| Diebold, Inc. | (44,135 | ) | (1,347,944 | ) | 19,922 | |||||||
| Discovery Communications, Inc. | (63,331 | ) | (1,677,005 | ) | (12,666 | ) | ||||||
| DISH Network Corp. | (5,247 | ) | (304,997 | ) | 4,973 | |||||||
| Dolby Laboratories, Inc. | (19,940 | ) | (680,222 | ) | 9,241 | |||||||
| Dollar General Corp. | (7,634 | ) | (553,789 | ) | 5,133 | |||||||
| Dollar Tree, Inc. | (97,322 | ) | (7,452,919 | ) | (62,286 | ) | ||||||
| Dominion Resources, Inc. | (138,622 | ) | (9,362,530 | ) | (13,862 | ) | ||||||
| Donaldson Co., Inc. | (33,015 | ) | (936,841 | ) | (9,369 | ) | ||||||
| DreamWorks Animation SKG, Inc. | (10,892 | ) | (287,305 | ) | 6,618 | |||||||
| DSW, Inc. | (10,053 | ) | (245,716 | ) | 5,852 | |||||||
| Duke Energy Corp. | (13,074 | ) | (921,717 | ) | (11,636 | ) | ||||||
| Dunkin’ Brands Group, Inc. | (22,220 | ) | (949,436 | ) | 3,086 | |||||||
| E*TRADE Financial Corp. | (40,002 | ) | (1,196,867 | ) | 11,208 | |||||||
| Eagle Materials, Inc. | (23,922 | ) | (1,437,314 | ) | (8,293 | ) | ||||||
| Eastman Chemical Co. | (6,756 | ) | (462,443 | ) | 6,345 | |||||||
| Eaton Vance Corp. | (2,899 | ) | (93,266 | ) | (749 | ) | ||||||
| EchoStar Corp. | (6,673 | ) | (248,974 | ) | (12,007 | ) | ||||||
| Ecolab, Inc. | (12,061 | ) | (1,390,633 | ) | 11,096 | |||||||
| Energen Corp. | (21,148 | ) | (895,408 | ) | 28,552 | |||||||
| Envision Healthcare Holdings Inc | (72,664 | ) | (1,730,130 | ) | (156,954 | ) | ||||||
| EOG Resources, Inc. | (24,422 | ) | (1,774,456 | ) | 45,623 | |||||||
| EQT Corp. | (14,756 | ) | (743,651 | ) | (25,579 | ) | ||||||
REFERENCE ENTITY | SHARES | NOTIONAL (a) | NET UNREALIZED APPRECIATION (DEPRECIATION) | |||||||||
| United States (continued) | ||||||||||||
| Eversource Energy | (30,893 | ) | $ | (1,600,384 | ) | $ | 22,678 | |||||
| Exxon Mobil Corp. | (23,937 | ) | (1,866,129 | ) | 239 | |||||||
| FEI Co. | (11,038 | ) | (892,120 | ) | 11,398 | |||||||
| FireEye, Inc. | (42,350 | ) | (894,101 | ) | 15,762 | |||||||
| First Horizon National Corp. | (31,970 | ) | (472,803 | ) | 8,599 | |||||||
| First Republic Bank | (12,472 | ) | (830,489 | ) | 6,589 | |||||||
| FirstEnergy Corp. | (4,701 | ) | (148,223 | ) | (940 | ) | ||||||
| FleetCor Technologies, Inc. | (13,434 | ) | (1,918,241 | ) | (1,881 | ) | ||||||
| Flowserve Corp. | (6,250 | ) | (267,204 | ) | 4,204 | |||||||
| FMC Corp. | (56,832 | ) | (2,147,730 | ) | (76,107 | ) | ||||||
| FMC Technologies, Inc. | (5,496 | ) | (159,872 | ) | 433 | |||||||
| FNF Group | (20,163 | ) | (701,759 | ) | 2,708 | |||||||
| Forest City Enterprises, Inc. | (68,310 | ) | (1,456,394 | ) | (41,645 | ) | ||||||
| Fortinet, Inc. | (15,634 | ) | (494,624 | ) | 7,312 | |||||||
| Fortune Brands Home & Security, Inc. | (27,832 | ) | (1,552,644 | ) | 7,968 | |||||||
| Freeport-McMoRan, Inc. | (44,688 | ) | (273,491 | ) | (29,047 | ) | ||||||
| Frontier Communications Corp. | (307,189 | ) | (1,471,435 | ) | 36,863 | |||||||
| GATX Corp. | (4,906 | ) | (204,559 | ) | (4,191 | ) | ||||||
| General Electric Co. | (108,134 | ) | (3,303,494 | ) | (64,880 | ) | ||||||
| Genesee & Wyoming, Inc. | (30,618 | ) | (1,607,473 | ) | (36,407 | ) | ||||||
| Gentex Corp. | (75,756 | ) | (1,210,375 | ) | (2,479 | ) | ||||||
| Genworth Financial, Inc. | (64,080 | ) | (239,944 | ) | 926 | |||||||
| Graco, Inc. | (5,023 | ) | (368,720 | ) | 6,713 | |||||||
| Granite Construction, Inc. | (14,726 | ) | (639,744 | ) | 7,851 | |||||||
| Graphic Packaging Holding Co. | (76,795 | ) | (972,993 | ) | (12,287 | ) | ||||||
| Greif, Inc. | (30,987 | ) | (961,471 | ) | 6,761 | |||||||
| Hain Celestial Group, Inc./The | (18,659 | ) | (766,708 | ) | 13,071 | |||||||
| Halliburton Co. | (95,258 | ) | (3,255,918 | ) | 13,336 | |||||||
| Halyard Health, Inc. | (4,351 | ) | (146,469 | ) | 1,102 | |||||||
| Hanesbrands, Inc. | (41,312 | ) | (1,212,507 | ) | (3,305 | ) | ||||||
| Harley-Davidson, Inc. | (63,857 | ) | (2,900,385 | ) | 1,916 | |||||||
| Harman International Industries, Inc. | (13,861 | ) | (1,273,415 | ) | (32,430 | ) | ||||||
| Harris Corp. | (26,565 | ) | (2,208,083 | ) | (100,416 | ) | ||||||
| Hasbro, Inc. | (2,542 | ) | (168,763 | ) | (2,466 | ) | ||||||
| Helmerich & Payne, Inc. | (35,920 | ) | (1,883,848 | ) | (39,668 | ) | ||||||
| Henry Schein, Inc. | (1,848 | ) | (291,877 | ) | (458 | ) | ||||||
| Hershey Co./The | (1,200 | ) | (107,796 | ) | 672 | |||||||
| Hertz Global Holdings, Inc. | (195,904 | ) | (2,822,977 | ) | 35,263 | |||||||
| Hess Corp. | (5,297 | ) | (260,612 | ) | 3,814 | |||||||
| Hexcel Corp. | (58,190 | ) | (2,676,158 | ) | (26,767 | ) | ||||||
| Hill-Rom Holdings, Inc. | (11,365 | ) | (560,677 | ) | 14,476 | |||||||
| Hilton Worldwide Holdings, Inc. | (18,216 | ) | (402,527 | ) | 12,705 | |||||||
| The accompanying notes are an integral part of these financial statements. | (Continued) |
| AQR Funds | Annual Report | December 2015 | ||||||||||||||
128
Table of Contents
| Schedule of Investments | December 31, 2015 |
| AQR LONG-SHORT EQUITY FUND |
REFERENCE ENTITY | SHARES | NOTIONAL (a) | NET UNREALIZED APPRECIATION (DEPRECIATION) | |||||||||
| United States (continued) | ||||||||||||
| Howard Hughes Corp./The | (14,425 | ) | $ | (1,632,601 | ) | $ | 268 | |||||
| Huntington Bancshares, Inc. | (8,641 | ) | (96,088 | ) | 518 | |||||||
| IDEXX Laboratories, Inc. | (47,856 | ) | (3,341,784 | ) | (147,875 | ) | ||||||
| Illumina, Inc. | (37,760 | ) | (6,844,000 | ) | (403,843 | ) | ||||||
| Incyte Corp. | (12,534 | ) | (1,439,029 | ) | 79,716 | |||||||
| Ingersoll-Rand PLC | (3,654 | ) | (204,691 | ) | 2,662 | |||||||
| Intercontinental Exchange, Inc. | (500 | ) | (124,185 | ) | (3,945 | ) | ||||||
| International Flavors & Fragrances, Inc. | (5,694 | ) | (685,214 | ) | 3,984 | |||||||
| Intersil Corp. | (21,029 | ) | (274,639 | ) | 6,309 | |||||||
| Intuitive Surgical, Inc. | (858 | ) | (462,522 | ) | (6,083 | ) | ||||||
| Ionis Pharmaceuticals, Inc. | (19,132 | ) | (1,113,482 | ) | (71,362 | ) | ||||||
| IPG Photonics Corp. | (3,964 | ) | (357,236 | ) | 3,805 | |||||||
| ITC Holdings Corp. | (86,123 | ) | (3,289,816 | ) | (90,512 | ) | ||||||
| JB Hunt Transport Services, Inc. | (10,540 | ) | (764,994 | ) | (8,220 | ) | ||||||
| JC Penney Co., Inc. | (24,392 | ) | (167,163 | ) | 4,713 | |||||||
| JM Smucker Co./The | (6,940 | ) | (858,062 | ) | 2,082 | |||||||
| Johnson Controls, Inc. | (7,920 | ) | (308,009 | ) | (4,752 | ) | ||||||
| Kansas City Southern | (68,117 | ) | (4,898,975 | ) | (187,322 | ) | ||||||
| KAR Auction Services, Inc. | (18,752 | ) | (699,933 | ) | 5,547 | |||||||
| Kate Spade & Co. | (51,710 | ) | (932,331 | ) | 13,445 | |||||||
| KBR, Inc. | (38,802 | ) | (659,647 | ) | 3,117 | |||||||
| Kinder Morgan, Inc. | (170,874 | ) | (2,626,333 | ) | 76,893 | |||||||
| Kirby Corp. | (4,725 | ) | (241,731 | ) | (6,899 | ) | ||||||
| KLX, Inc. | (39,524 | ) | (1,244,611 | ) | 27,667 | |||||||
| Knowles Corp. | (45,896 | ) | (630,528 | ) | 18,735 | |||||||
| Kosmos Energy Ltd. | (219,290 | ) | (1,128,203 | ) | (12,105 | ) | ||||||
| Laboratory Corp. of America Holdings | (19,806 | ) | (2,409,994 | ) | (38,820 | ) | ||||||
| Las Vegas Sands Corp. | (22,094 | ) | (923,971 | ) | (44,630 | ) | ||||||
| Lennar Corp. | (37,555 | ) | (1,837,531 | ) | 716 | |||||||
| Leucadia National Corp. | (94,475 | ) | (1,545,611 | ) | (97,309 | ) | ||||||
| Level 3 Communications, Inc. | (125,835 | ) | (6,557,262 | ) | (283,129 | ) | ||||||
| Liberty Broadband Corp. | (25,051 | ) | (1,287,740 | ) | (11,405 | ) | ||||||
| LinkedIn Corp. | (4,560 | ) | (1,054,044 | ) | 27,679 | |||||||
| Lions Gate Entertainment Corp. | (47,803 | ) | (1,567,451 | ) | 19,111 | |||||||
| Live Nation Entertainment, Inc. | (51,897 | ) | (1,295,868 | ) | 20,759 | |||||||
| Loews Corp. | (91,692 | ) | (3,388,936 | ) | (132,036 | ) | ||||||
| Louisiana-Pacific Corp. | (192,574 | ) | (3,272,959 | ) | (195,299 | ) | ||||||
| M&T Bank Corp. | (14,331 | ) | (1,787,649 | ) | 51,018 | |||||||
| Macquarie Infrastructure Corp. | (24,878 | ) | (1,637,968 | ) | (168,175 | ) | ||||||
| Manitowoc Co., Inc./The | (79,198 | ) | (1,188,334 | ) | (27,355 | ) | ||||||
| Marathon Oil Corp. | (30,163 | ) | (385,483 | ) | 5,731 | |||||||
| Markel Corp. | (282 | ) | (248,482 | ) | (623 | ) | ||||||
REFERENCE ENTITY | SHARES | NOTIONAL (a) | NET UNREALIZED APPRECIATION (DEPRECIATION) | |||||||||
| United States (continued) | ||||||||||||
| Marriott International, Inc. | (3,148 | ) | $ | (207,862 | ) | $ | (3,179 | ) | ||||
| Marsh & McLennan Cos., Inc. | (15,775 | ) | (882,272 | ) | 7,548 | |||||||
| Martin Marietta Materials, Inc. | (22,810 | ) | (3,255,899 | ) | 140,510 | |||||||
| MasterCard, Inc. | (13,784 | ) | (1,369,165 | ) | 27,154 | |||||||
| Mattel, Inc. | (123,351 | ) | (3,311,974 | ) | (39,472 | ) | ||||||
| MAXIMUS, Inc. | (19,941 | ) | (1,139,141 | ) | 17,460 | |||||||
| McCormick & Co., Inc. | (1,090 | ) | (92,626 | ) | (634 | ) | ||||||
| MDC Holdings, Inc. | (11,688 | ) | (292,591 | ) | (5,804 | ) | ||||||
| MDU Resources Group, Inc. | (191,926 | ) | (3,274,975 | ) | (241,109 | ) | ||||||
| MEDNAX, Inc. | (10,404 | ) | (757,827 | ) | 12,277 | |||||||
| Memorial Resource Development Corp. | (106,290 | ) | (1,499,758 | ) | (216,826 | ) | ||||||
| MGM Resorts International | (90,700 | ) | (1,945,515 | ) | (115,189 | ) | ||||||
| Microchip Technology, Inc. | (6,843 | ) | (329,111 | ) | 10,638 | |||||||
| Middleby Corp./The | (22,010 | ) | (2,409,321 | ) | 35,102 | |||||||
| Mohawk Industries, Inc. | (2,700 | ) | (519,317 | ) | 7,964 | |||||||
| Molson Coors Brewing Co. | (25,003 | ) | (2,360,221 | ) | 11,940 | |||||||
| Monsanto Co. | (8,949 | ) | (862,463 | ) | (19,192 | ) | ||||||
| Monster Beverage Corp. | (31,494 | ) | (4,733,233 | ) | 41,887 | |||||||
| MSC Industrial Direct Co., Inc. | (10,398 | ) | (571,994 | ) | (13,101 | ) | ||||||
| Murphy Oil Corp. | (4,242 | ) | (95,346 | ) | 113 | |||||||
| Mylan NV | (38,555 | ) | (2,042,258 | ) | (42,411 | ) | ||||||
| Nabors Industries Ltd. | (22,209 | ) | (188,015 | ) | (984 | ) | ||||||
| National Fuel Gas Co. | (41,844 | ) | (1,690,520 | ) | (98,311 | ) | ||||||
| National Oilwell Varco, Inc. | (45,705 | ) | (1,549,662 | ) | 19,002 | |||||||
| Netflix, Inc. | (8,456 | ) | (1,035,945 | ) | 68,747 | |||||||
| NetScout Systems, Inc. | (54,732 | ) | (1,665,325 | ) | (14,948 | ) | ||||||
| NetSuite, Inc. | (37,543 | ) | (3,117,463 | ) | (59,425 | ) | ||||||
| Newell Rubbermaid, Inc. | (35,047 | ) | (1,566,818 | ) | 21,947 | |||||||
| Newfield Exploration Co. | (31,714 | ) | (1,030,990 | ) | (1,617 | ) | ||||||
| NextEra Energy, Inc. | (913 | ) | (94,539 | ) | (312 | ) | ||||||
| Nielsen Holdings PLC | (64,129 | ) | (2,972,771 | ) | (15,640 | ) | ||||||
| Noble Energy, Inc. | (45,302 | ) | (1,436,935 | ) | (54,860 | ) | ||||||
| Nordson Corp. | (15,535 | ) | (999,375 | ) | 2,805 | |||||||
| Northern Trust Corp. | (8,924 | ) | (642,260 | ) | (1,071 | ) | ||||||
| NorthStar Asset Management Group, Inc. | (123,217 | ) | (1,436,459 | ) | (59,396 | ) | ||||||
| Norwegian Cruise Line Holdings Ltd. | (12,352 | ) | (705,701 | ) | (18,126 | ) | ||||||
| NOW, Inc. | (47,570 | ) | (753,533 | ) | 975 | |||||||
| NRG Energy, Inc. | (133,038 | ) | (1,266,524 | ) | (299,334 | ) | ||||||
| Nucor Corp. | (4,900 | ) | (188,503 | ) | (8,967 | ) | ||||||
| Occidental Petroleum Corp. | (29,193 | ) | (1,938,999 | ) | (34,740 | ) | ||||||
| Oceaneering International, Inc. | (7,900 | ) | (299,728 | ) | 3,320 | |||||||
| OGE Energy Corp. | (33,213 | ) | (862,191 | ) | (10,978 | ) | ||||||
| The accompanying notes are an integral part of these financial statements. | (Continued) |
| AQR Funds | Annual Report | December 2015 | ||||||||||||||
129
Table of Contents
| Schedule of Investments | December 31, 2015 |
| AQR LONG-SHORT EQUITY FUND |
REFERENCE ENTITY | SHARES | NOTIONAL (a) | NET UNREALIZED APPRECIATION (DEPRECIATION) | |||||||||
| United States (continued) | ||||||||||||
| Old Dominion Freight Line, Inc. | (9,741 | ) | $ | (578,119 | ) | $ | 2,718 | |||||
| Olin Corp. | (5,110 | ) | (91,113 | ) | 2,915 | |||||||
| ONE Gas, Inc. | (11,670 | ) | (585,206 | ) | (277 | ) | ||||||
| ONEOK, Inc. | (69,780 | ) | (1,390,636 | ) | (330,139 | ) | ||||||
| Oshkosh Corp. | (14,221 | ) | (554,329 | ) | (858 | ) | ||||||
| Owens-Illinois, Inc. | (115,740 | ) | (1,975,061 | ) | (41,129 | ) | ||||||
| Packaging Corp. of America | (6,693 | ) | (429,383 | ) | 7,389 | |||||||
| PacWest Bancorp | (20,700 | ) | (913,328 | ) | 21,158 | |||||||
| Palo Alto Networks, Inc. | (11,802 | ) | (2,201,899 | ) | 123,095 | |||||||
| Pandora Media, Inc. | (63,370 | ) | (900,860 | ) | 51,069 | |||||||
| PAREXEL International Corp. | (17,922 | ) | (1,159,195 | ) | (61,652 | ) | ||||||
| Patterson-UTI Energy, Inc. | (110,365 | ) | (1,642,699 | ) | (21,606 | ) | ||||||
| PayPal Holdings, Inc. | (28,749 | ) | (1,025,290 | ) | (15,424 | ) | ||||||
| PBF Energy, Inc. | (13,473 | ) | (497,019 | ) | 1,078 | |||||||
| Penske Automotive Group, Inc. | (4,453 | ) | (192,402 | ) | 3,862 | |||||||
| People’s United Financial, Inc. | (17,343 | ) | (281,999 | ) | 1,909 | |||||||
| PerkinElmer, Inc. | (29,351 | ) | (1,524,491 | ) | (47,842 | ) | ||||||
| Platform Specialty Products Corp. | (161,432 | ) | (2,000,142 | ) | (71,030 | ) | ||||||
| Polaris Industries, Inc. | (8,235 | ) | (700,057 | ) | (7,741 | ) | ||||||
| PolyOne Corp. | (12,925 | ) | (419,553 | ) | 9,055 | |||||||
| Post Holdings, Inc. | (26,883 | ) | (1,667,284 | ) | 8,603 | |||||||
| PPL Corp. | (6,247 | ) | (212,030 | ) | (1,181 | ) | ||||||
| Praxair, Inc. | (11,037 | ) | (1,135,928 | ) | 5,739 | |||||||
| Premier, Inc. | (31,021 | ) | (1,072,720 | ) | (21,391 | ) | ||||||
| Prosperity Bancshares, Inc. | (1,947 | ) | (94,570 | ) | 1,387 | |||||||
| Qorvo, Inc. | (10,327 | ) | (544,749 | ) | 19,105 | |||||||
| Questar Corp. | (123,543 | ) | (2,384,988 | ) | (21,630 | ) | ||||||
| Range Resources Corp. | (73,005 | ) | (1,556,852 | ) | (239,801 | ) | ||||||
| Regal Beloit Corp. | (7,260 | ) | (416,783 | ) | (8,073 | ) | ||||||
| Regeneron Pharmaceuticals, Inc. | (5,575 | ) | (3,074,557 | ) | 48,057 | |||||||
| Rent-A-Center, Inc. | (6,256 | ) | (95,607 | ) | 1,955 | |||||||
| Rice Energy, Inc. | (92,793 | ) | (825,588 | ) | (185,856 | ) | ||||||
| Rockwell Collins, Inc. | (2,574 | ) | (230,991 | ) | (6,589 | ) | ||||||
| Rollins, Inc. | (25,346 | ) | (672,997 | ) | 16,536 | |||||||
| Roper Technologies, Inc. | (9,177 | ) | (1,694,074 | ) | (47,629 | ) | ||||||
| Rowan Cos. PLC | (11,639 | ) | (219,861 | ) | 22,580 | |||||||
| Royal Caribbean Cruises Ltd. | (6,080 | ) | (572,455 | ) | (42,902 | ) | ||||||
| RPC, Inc. | (57,913 | ) | (704,784 | ) | 12,723 | |||||||
| RPM International, Inc. | (8,066 | ) | (352,246 | ) | (3,142 | ) | ||||||
| Ryder System, Inc. | (15,809 | ) | (899,704 | ) | 1,279 | |||||||
| Sabre Corp. | (30,305 | ) | (869,456 | ) | 21,825 | |||||||
| salesforce.com, Inc. | (10,802 | ) | (847,201 | ) | 324 | |||||||
| SanDisk Corp. | (28,830 | ) | (2,157,349 | ) | (33,443 | ) | ||||||
| SBA Communications Corp. | (43,718 | ) | (4,415,955 | ) | (177,495 | ) | ||||||
| Schlumberger Ltd. | (19,759 | ) | (1,367,323 | ) | (10,867 | ) | ||||||
REFERENCE ENTITY | SHARES | NOTIONAL (a) | NET UNREALIZED APPRECIATION (DEPRECIATION) | |||||||||
| United States (continued) | ||||||||||||
| Scripps Networks Interactive, Inc. | (3,700 | ) | $ | (200,836 | ) | $ | (3,441 | ) | ||||
| Seattle Genetics, Inc. | (25,078 | ) | (1,038,982 | ) | (86,519 | ) | ||||||
| Sempra Energy | (33,297 | ) | (3,194,847 | ) | 64,596 | |||||||
| ServiceMaster Global Holdings, Inc. | (28,548 | ) | (1,105,993 | ) | (14,231 | ) | ||||||
| ServiceNow, Inc. | (22,258 | ) | (1,942,456 | ) | 15,803 | |||||||
| Signature Bank/New York NY | (5,495 | ) | (850,076 | ) | 7,308 | |||||||
| Signet Jewelers Ltd. | (5,257 | ) | (618,272 | ) | (31,966 | ) | ||||||
| Silgan Holdings, Inc. | (13,308 | ) | (715,106 | ) | 200 | |||||||
| Silicon Laboratories, Inc. | (6,914 | ) | (351,784 | ) | 16,179 | |||||||
| Sirius XM Holdings, Inc. | (462,860 | ) | (1,860,697 | ) | (23,143 | ) | ||||||
| Six Flags Entertainment Corp. | (5,628 | ) | (299,747 | ) | (9,455 | ) | ||||||
| SLM Corp. | (60,619 | ) | (392,811 | ) | (2,425 | ) | ||||||
| SM Energy Co. | (27,886 | ) | (526,914 | ) | (21,324 | ) | ||||||
| Sotheby’s | (61,616 | ) | (1,631,592 | ) | 44,364 | |||||||
| Southern Co./The | (27,723 | ) | (1,289,397 | ) | (7,762 | ) | ||||||
| Southwestern Energy Co. | (170,545 | ) | (930,977 | ) | (281,598 | ) | ||||||
| Spectra Energy Corp. | (89,969 | ) | (2,063,889 | ) | (89,969 | ) | ||||||
| Spectrum Brands Holdings, Inc. | (40,825 | ) | (4,045,420 | ) | (110,565 | ) | ||||||
| Spirit Airlines, Inc. | (24,739 | ) | (1,000,198 | ) | 14,349 | |||||||
| Splunk, Inc. | (40,224 | ) | (2,184,615 | ) | (180,958 | ) | ||||||
| Sprint Corp. | (145,470 | ) | (523,692 | ) | (2,909 | ) | ||||||
| Sprouts Farmers Market, Inc. | (177,886 | ) | (4,569,891 | ) | (160,097 | ) | ||||||
| SS&C Technologies Holdings, Inc. | (16,295 | ) | (1,116,160 | ) | 3,701 | |||||||
| Stericycle, Inc. | (23,783 | ) | (2,822,091 | ) | (46,139 | ) | ||||||
| STERIS PLC | (23,624 | ) | (1,795,939 | ) | 16,107 | |||||||
| SunPower Corp. | (48,964 | ) | (1,466,936 | ) | (2,474 | ) | ||||||
| SVB Financial Group | (3,665 | ) | (449,072 | ) | 13,304 | |||||||
| Synaptics, Inc. | (1,469 | ) | (118,447 | ) | 428 | |||||||
| Synovus Financial Corp. | (12,297 | ) | (396,947 | ) | (1,230 | ) | ||||||
| Tableau Software, Inc. | (4,732 | ) | (435,133 | ) | (10,716 | ) | ||||||
| Targa Resources Corp. | (41,934 | ) | (1,103,007 | ) | (31,727 | ) | ||||||
| Teleflex, Inc. | (1,721 | ) | (231,095 | ) | 4,869 | |||||||
| Tempur Sealy International, Inc. | (26,143 | ) | (1,931,445 | ) | 89,409 | |||||||
| Tenet Healthcare Corp. | (95,232 | ) | (2,631,260 | ) | (254,269 | ) | ||||||
| TerraForm Power, Inc. | (67,673 | ) | (838,139 | ) | (13,187 | ) | ||||||
| Tesla Motors, Inc. | (28,626 | ) | (6,681,022 | ) | (189,504 | ) | ||||||
| Tiffany & Co. | (9,538 | ) | (706,211 | ) | (21,443 | ) | ||||||
| Time, Inc. | (12,432 | ) | (193,183 | ) | (1,626 | ) | ||||||
| T-Mobile US, Inc. | (54,802 | ) | (2,148,238 | ) | 4,384 | |||||||
| Toll Brothers, Inc. | (23,083 | ) | (781,143 | ) | 12,479 | |||||||
| TransDigm Group, Inc. | (16,932 | ) | (3,719,622 | ) | (148,494 | ) | ||||||
| TreeHouse Foods, Inc. | (13,759 | ) | (1,108,838 | ) | 29,307 | |||||||
| TRI Pointe Group, Inc. | (108,002 | ) | (1,380,036 | ) | 11,650 | |||||||
| Trimble Navigation Ltd. | (42,553 | ) | (933,187 | ) | 20,425 | |||||||
| TripAdvisor, Inc. | (22,206 | ) | (1,895,948 | ) | 2,887 | |||||||
| Twenty-First Century Fox, Inc. | (18,029 | ) | (496,865 | ) | 7,198 | |||||||
| The accompanying notes are an integral part of these financial statements. | (Continued) |
| AQR Funds | Annual Report | December 2015 | ||||||||||||||
130
Table of Contents
| Schedule of Investments | December 31, 2015 |
| AQR LONG-SHORT EQUITY FUND |
REFERENCE ENTITY | SHARES | NOTIONAL (a) | NET UNREALIZED APPRECIATION (DEPRECIATION) | |||||||||
| United States (continued) | ||||||||||||
| Twitter, Inc. | (143,008 | ) | $ | (3,333,516 | ) | $ | 24,311 | |||||
| Tyco International PLC | (18,066 | ) | (565,104 | ) | (11,020 | ) | ||||||
| UGI Corp. | (14,170 | ) | (465,386 | ) | (12,993 | ) | ||||||
| Ultimate Software Group, Inc./The | (5,882 | ) | (1,166,283 | ) | 16,293 | |||||||
| Umpqua Holdings Corp. | (37,347 | ) | (606,142 | ) | 12,325 | |||||||
| Under Armour, Inc. | (47,298 | ) | (3,843,908 | ) | 31,217 | |||||||
| United Continental Holdings, Inc. | (3,900 | ) | (223,548 | ) | 78 | |||||||
| United Natural Foods, Inc. | (10,371 | ) | (417,704 | ) | 9,502 | |||||||
| United Parcel Service, Inc. | (5,444 | ) | (544,400 | ) | 20,524 | |||||||
| United Rentals, Inc. | (10,211 | ) | (683,116 | ) | (57,590 | ) | ||||||
| USG Corp. | (141,511 | ) | (3,458,529 | ) | 21,227 | |||||||
| Valley National Bancorp | (38,144 | ) | (385,146 | ) | 9,427 | |||||||
| Valspar Corp./The | (9,468 | ) | (784,340 | ) | (1,031 | ) | ||||||
| Vantiv, Inc. | (10,458 | ) | (507,631 | ) | 11,713 | |||||||
| Veeva Systems, Inc. | (50,674 | ) | (1,423,064 | ) | (38,881 | ) | ||||||
| VeriFone Systems, Inc. | (15,496 | ) | (419,937 | ) | (14,261 | ) | ||||||
| Verisk Analytics, Inc. | (80,252 | ) | (6,172,181 | ) | 2,408 | |||||||
| Vertex Pharmaceuticals, Inc. | (8,791 | ) | (1,036,811 | ) | (69,361 | ) | ||||||
| Viavi Solutions, Inc. | (38,220 | ) | (226,645 | ) | (6,115 | ) | ||||||
| Visa, Inc. | (45,394 | ) | (3,572,054 | ) | 51,749 | |||||||
| Vista Outdoor, Inc. | (29,239 | ) | (1,273,667 | ) | (27,760 | ) | ||||||
| Visteon Corp. | (15,358 | ) | (1,768,474 | ) | 9,983 | |||||||
| Vulcan Materials Co. | (9,215 | ) | (872,660 | ) | (2,488 | ) | ||||||
| VWR Corp. | (3,432 | ) | (91,722 | ) | (5,438 | ) | ||||||
| WABCO Holdings, Inc. | (2,354 | ) | (234,956 | ) | (5,764 | ) | ||||||
| Wabtec Corp. | (7,065 | ) | (501,014 | ) | (1,448 | ) | ||||||
| Walgreens Boots Alliance, Inc. | (18,348 | ) | (1,529,122 | ) | (33,302 | ) | ||||||
| Waste Connections, Inc. | (2,973 | ) | (164,199 | ) | (3,241 | ) | ||||||
| WEC Energy Group, Inc. | (132,715 | ) | (6,812,613 | ) | 3,006 | |||||||
REFERENCE ENTITY | SHARES | NOTIONAL (a) | NET UNREALIZED APPRECIATION (DEPRECIATION) | |||||||||
| United States (continued) | ||||||||||||
| Westar Energy, Inc. | (4,472 | ) | $ | (188,004 | ) | $ | (1,654 | ) | ||||
| WestRock Co. | (79,982 | ) | (3,624,804 | ) | (23,975 | ) | ||||||
| WEX, Inc. | (3,394 | ) | (294,718 | ) | (5,311 | ) | ||||||
| WhiteWave Foods Co./The | (74,449 | ) | (2,863,827 | ) | (32,984 | ) | ||||||
| Whiting Petroleum Corp. | (57,133 | ) | (524,301 | ) | (15,035 | ) | ||||||
| Whole Foods Market, Inc. | (22,769 | ) | (769,935 | ) | 7,173 | |||||||
| Williams-Sonoma, Inc. | (5,752 | ) | (342,605 | ) | 6,631 | |||||||
| WisdomTree Investments, Inc. | (216,029 | ) | (3,506,151 | ) | 118,816 | |||||||
| Workday, Inc. | (30,093 | ) | (2,423,066 | ) | 25,256 | |||||||
| WR Grace & Co. | (11,804 | ) | (1,150,876 | ) | (24,685 | ) | ||||||
| Wynn Resorts Ltd. | (29,967 | ) | (1,942,778 | ) | (130,638 | ) | ||||||
| Zebra Technologies Corp. | (29,010 | ) | (1,927,715 | ) | (92,832 | ) | ||||||
| Zions Bancorporation | (22,555 | ) | (626,580 | ) | 10,829 | |||||||
|
| |||||||||||
| (6,468,303 | ) | |||||||||||
|
| |||||||||||
Total of Short Equity Positions | (6,724,203 | ) | ||||||||||
|
| |||||||||||
Total of Long and Short Equity Positions | (5,418,787 | ) | ||||||||||
|
| |||||||||||
Net Cash and Other Receivables/ (Payables) (b) | 69,634 | |||||||||||
|
| |||||||||||
Swaps, at Value | $ | (5,349,153 | ) | |||||||||
|
| |||||||||||
| (a) | Notional value represents the market value (including any fees or commissions) of the long and short positions when they are established. |
| (b) | Cash and other receivables/(payables) includes the gains (or losses) realized within the swap when the swap resets. |
| The accompanying notes are an integral part of these financial statements. | (Continued) |
| AQR Funds | Annual Report | December 2015 | ||||||||||||||
131
Table of Contents
| Schedule of Investments | December 31, 2015 |
| AQR LONG-SHORT EQUITY FUND |
| COUNTERPARTY | DESCRIPTION | TERMINATION DATE** | VALUE (Note 5) | |||||
| Goldman Sachs | The Fund receives the total return on a portfolio of long and short positions and pays or receives the Euro Interbank Offered Rate, plus or minus a specified spread, which is denominated in EUR based on the local currencies of the positions within the swap. | 1-61 months maturity ranging from 01/14/2016 - 12/21/2020 | $(105,899 | ) | ||||
|
| |||||||
| ** | The maturity dates are measured from the commencement of investment in each underlying portfolio swap positions. |
Additional Information — Total Return Basket Swap
The following table represents the individual long and short positions and related values within the total return basket swap as of December 31, 2015.
REFERENCE ENTITY | SHARES | NOTIONAL (a) | NET UNREALIZED APPRECIATION (DEPRECIATION) | |||||||||
| Long Positions | ||||||||||||
| Common Stocks | ||||||||||||
| France | ||||||||||||
| Aeroports de Paris | 2,083 | $ | 242,314 | $ | 82 | |||||||
| Atos SE | 4,516 | 384,903 | (5,774 | ) | ||||||||
| AXA SA | 29,452 | 803,828 | 906 | |||||||||
| Cap Gemini SA | 23,667 | 2,222,647 | (26,690 | ) | ||||||||
| Christian Dior SE | 1,322 | 232,223 | (7,665 | ) | ||||||||
| Cie Generale des Etablissements Michelin | 6,093 | 584,471 | (4,524 | ) | ||||||||
| CNP Assurances | 25,848 | 344,566 | 4,107 | |||||||||
| Dassault Systemes | 3,585 | 290,688 | (4,136 | ) | ||||||||
| Eiffage SA | 17,790 | 1,131,456 | 18,279 | |||||||||
| Eutelsat Communications SA | 24,061 | 739,352 | (18,954 | ) | ||||||||
| Faurecia | 19,696 | 794,835 | (5,621 | ) | ||||||||
| Hermes International | 1,224 | 424,476 | (10,734 | ) | ||||||||
| Imerys SA | 2,424 | 166,700 | 2,620 | |||||||||
| Ingenico Group | 5,228 | 673,166 | (13,282 | ) | ||||||||
| Ipsen SA | 8,565 | 560,735 | 6,762 | |||||||||
| Lagardere SCA | 13,330 | 392,824 | 4,962 | |||||||||
| Numericable-SFR SAS | 17,488 | 679,246 | (43,942 | ) | ||||||||
| Peugeot SA | 325,711 | 5,713,241 | (3,879 | ) | ||||||||
| Safran SA | 18,127 | 1,271,987 | (26,612 | ) | ||||||||
| Sanofi | 26,135 | 2,256,601 | (29,330 | ) | ||||||||
| SCOR SE | 41,301 | 1,560,275 | (14,885 | ) | ||||||||
| SEB SA | 13,775 | 1,429,118 | (14,961 | ) | ||||||||
| Societe BIC SA | 5,307 | 887,107 | (13,814 | ) | ||||||||
| Societe Generale SA | 30,921 | 1,451,436 | (26,530 | ) | ||||||||
| Societe Television Francaise 1 | 55,968 | 615,463 | 5,995 | |||||||||
| Sodexo SA | 13,327 | 1,322,489 | (20,481 | ) | ||||||||
| Teleperformance | 10,934 | 926,431 | (7,018 | ) | ||||||||
| Thales SA | 32,080 | 2,473,591 | (72,412 | ) | ||||||||
| TOTAL SA | 14,760 | 673,072 | (11,361 | ) | ||||||||
| Valeo SA | 6,400 | 978,257 | 8,461 | |||||||||
| Veolia Environnement SA | 45,538 | 1,091,279 | (10,855 | ) | ||||||||
| Vinci SA | 15,101 | 974,157 | (6,262 | ) | ||||||||
| Vivendi SA | 97,438 | 2,056,577 | 36,104 | |||||||||
|
| |||||||||||
| (311,444 | ) | |||||||||||
|
| |||||||||||
REFERENCE ENTITY | SHARES | NOTIONAL (a) | NET UNREALIZED APPRECIATION (DEPRECIATION) | |||||||||
| Luxembourg | ||||||||||||
| SES SA | 7,692 | $ | 209,368 | $ | 3,775 | |||||||
|
| |||||||||||
Total of Long Equity Positions | (307,669 | ) | ||||||||||
|
| |||||||||||
| Short Positions | ||||||||||||
| Common Stocks | ||||||||||||
| France | ||||||||||||
| Airbus Group SE | (16,311 | ) | (1,149,600 | ) | 50,444 | |||||||
| Arkema SA | (3,389 | ) | (240,599 | ) | 3,373 | |||||||
| BNP Paribas SA | (4,515 | ) | (261,466 | ) | 6,019 | |||||||
| Bollore SA | (348,108 | ) | (1,608,777 | ) | (13,279 | ) | ||||||
| Bureau Veritas SA | (24,082 | ) | (485,181 | ) | 5,193 | |||||||
| Carrefour SA | (16,004 | ) | (473,520 | ) | 11,651 | |||||||
| Casino Guichard Perrachon SA | (29,926 | ) | (1,409,569 | ) | 34,748 | |||||||
| Cie de Saint-Gobain | (16,257 | ) | (704,682 | ) | 180 | |||||||
| Credit Agricole SA | (29,984 | ) | (352,282 | ) | (1,054 | ) | ||||||
| Danone SA | (18,253 | ) | (1,251,955 | ) | 18,536 | |||||||
| Edenred | (119,062 | ) | (2,234,409 | ) | (16,227 | ) | ||||||
| Electricite de France SA | (139,583 | ) | (2,011,413 | ) | (44,294 | ) | ||||||
| Engie | (181,390 | ) | (3,208,932 | ) | (4,069 | ) | ||||||
| Essilor International SA | (6,968 | ) | (881,397 | ) | 12,934 | |||||||
| Iliad SA | (1,479 | ) | (353,038 | ) | 477 | |||||||
| Kering | (6,693 | ) | (1,157,345 | ) | 13,010 | |||||||
| L’Oreal SA | (2,052 | ) | (358,724 | ) | 13,568 | |||||||
| LVMH Moet Hennessy Louis Vuitton SE | (6,078 | ) | (983,463 | ) | 28,790 | |||||||
| Natixis SA | (105,927 | ) | (603,452 | ) | 4,214 | |||||||
| Orange SA | (30,414 | ) | (513,787 | ) | 5,090 | |||||||
| Orpea | (2,775 | ) | (221,559 | ) | (625 | ) | ||||||
| Pernod Ricard SA | (21,721 | ) | (2,500,796 | ) | 23,636 | |||||||
| Plastic Omnium SA | (35,648 | ) | (1,109,073 | ) | (24,062 | ) | ||||||
| Remy Cointreau SA | (11,142 | ) | (783,310 | ) | (14,740 | ) | ||||||
| Renault SA | (6,831 | ) | (678,608 | ) | (5,145 | ) | ||||||
| Rexel SA | (41,670 | ) | (556,633 | ) | 1,764 | |||||||
| Schneider Electric SE | (20,858 | ) | (1,214,269 | ) | 29,453 | |||||||
| Suez Environnement Co. | (38,931 | ) | (737,437 | ) | 9,297 | |||||||
| Technip SA | (46,237 | ) | (2,313,870 | ) | 14,491 | |||||||
| The accompanying notes are an integral part of these financial statements. | (Continued) |
| AQR Funds | Annual Report | December 2015 | ||||||||||||||
132
Table of Contents
| Schedule of Investments | December 31, 2015 |
| AQR LONG-SHORT EQUITY FUND |
REFERENCE ENTITY | SHARES | NOTIONAL (a) | NET UNREALIZED APPRECIATION (DEPRECIATION) | |||||||||
| France (continued) | ||||||||||||
| Vallourec SA | (84,216 | ) | $ | (736,895 | ) | $ | (47,136 | ) | ||||
| Zodiac Aerospace | (163,600 | ) | (3,973,076 | ) | 77,707 | |||||||
|
| |||||||||||
| 193,944 | ||||||||||||
|
| |||||||||||
Total of Short Equity Positions | 193,944 | |||||||||||
|
| |||||||||||
Total of Long and Short Equity Positions | (113,725 | ) | ||||||||||
|
| |||||||||||
Net Cash and Other Receivables/ (Payables) (b) | 7,826 | |||||||||||
|
| |||||||||||
Swaps, at Value | $ | (105,899 | ) | |||||||||
|
| |||||||||||
| (a) | Notional value represents the market value (including any fees or commissions) of the long and short positions when they are established. |
| (b) | Cash and other receivables/(payables) includes the gains (or losses) realized within the swap when the swap resets. |
Collateral pledged to, or (received from), each counterparty at December 31, 2015 was as follows:
| COUNTERPARTY | OVER THE COUNTER | EXCHANGE TRADED/ CENTRALLY CLEARED | TOTAL | |||||||||
| Barclays Capital | ||||||||||||
| Cash | $— | $10,139,209 | $10,139,209 | |||||||||
| ||||||||||||
| CitiBank | ||||||||||||
| Money Market Funds | 990,003 | — | 990,003 | |||||||||
| ||||||||||||
| Credit Suisse International | ||||||||||||
| Cash | (290,000 | ) | — | (290,000 | ) | |||||||
| ||||||||||||
| Deutsche Bank | ||||||||||||
| Money Market Funds | 28,300,066 | — | 28,300,066 | |||||||||
| ||||||||||||
| Goldman Sachs | ||||||||||||
| Money Market Funds | 101,120,000 | — | 101,120,000 | |||||||||
| ||||||||||||
| The accompanying notes are an integral part of these financial statements. |
| AQR Funds | Annual Report | December 2015 | ||||||||||||||
133
Table of Contents
| Consolidated Schedule of Investments | December 31, 2015 |
| AQR MANAGED FUTURES STRATEGY FUND |
| MONEY MARKET FUNDS - 14.7% | SHARES | VALUE (Note 5) | ||||||
| BlackRock Liquidity Funds T-Fund Portfolio, Institutional Shares, 0.100% ^(a) | 25,273,449 | $ | 25,273,449 | |||||
| Dreyfus Treasury Cash Management, Class I, 0.090% ^(a) | 101,093,796 | 101,093,796 | ||||||
| J.P. Morgan U.S. Treasury Plus Money Market Fund - IM Shares, 0.129% ^(a)(b) | 1,100,838,261 | 1,100,838,261 | ||||||
| J.P. Morgan U.S. Treasury Plus Money Market Fund - Institutional Shares, 0.070% ^(a)(b) | 58,922,447 | 58,922,447 | ||||||
| UBS Money Series - UBS Select Treasury Preferred Fund, Class I, 0.140% ^(a) | 126,367,245 | 126,367,245 | ||||||
|
| |||||||
TOTAL MONEY MARKET FUNDS | 1,412,495,198 | |||||||
|
| |||||||
| SHORT-TERM INVESTMENTS - 83.5% | PRINCIPAL AMOUNT (000’s) | |||||||
| U.S. Treasury Bill, 0.083%, 01/07/2016 ^(c) | $ | 489,685 | 489,683,041 | |||||
| U.S. Treasury Bill, 0.141%, 01/28/2016 ^(c)(d) | 987,354 | 987,268,100 | ||||||
| U.S. Treasury Bill, 0.161%, 02/04/2016 ^(c) | 685,787 | 685,727,336 | ||||||
| U.S. Treasury Bill, 0.241%, 02/11/2016 ^(c) | 131,007 | 130,988,790 | ||||||
| U.S. Treasury Bill, 0.264%, 03/03/2016 ^(c) | 577,896 | 577,794,290 | ||||||
| U.S. Treasury Bill, 0.266%, 03/10/2016 (c) | 500,000 | 499,891,500 | ||||||
| U.S. Treasury Bill, 0.259%, 03/17/2016 ^(c) | 969,276 | 969,079,237 | ||||||
| U.S. Treasury Bill, 0.113%, 03/24/2016 ^(c) | 35,081 | 35,067,178 | ||||||
| U.S. Treasury Bill, 0.099%, 03/31/2016 ^(c) | 561,732 | 561,494,949 | ||||||
| U.S. Treasury Bill, 0.066%, 04/07/2016 ^(c)(d) | 334,630 | 334,498,825 | ||||||
| U.S. Treasury Bill, 0.145%, 04/28/2016 ^(c) | 10,573 | 10,564,140 | ||||||
| U.S. Treasury Bill, 0.345%, 05/26/2016 ^(c) | 166,146 | 165,889,471 | ||||||
| U.S. Treasury Bill, 0.414%, 06/02/2016 ^(c)(d) | 911,563 | 909,918,540 | ||||||
| U.S. Treasury Bill, 0.536%, 06/09/2016 ^(c) | 751,051 | 749,578,189 | ||||||
| U.S. Treasury Bill, 0.583%, 06/16/2016 ^(c) | 678,847 | 677,415,312 | ||||||
| SHORT-TERM INVESTMENTS - 83.5% (continued) | PRINCIPAL AMOUNT (000’s) | VALUE (Note 5) | ||||||
| U.S. Treasury Bill, 0.516%, 06/23/2016 ^(c) | $ | 236,930 | $ | 236,403,305 | ||||
|
| |||||||
TOTAL SHORT-TERM INVESTMENTS | 8,021,262,203 | |||||||
|
| |||||||
TOTAL INVESTMENTS IN |
| 9,433,757,401 | ||||||
|
| |||||||
| OTHER ASSETS IN EXCESS OF LIABILITIES - 1.8% (e) | 172,510,673 | |||||||
|
| |||||||
NET ASSETS - 100.0% | $ | 9,606,268,074 | ||||||
|
| |||||||
| (a) | Represents annualized seven-day yield as of the close of the reporting period. |
| (b) | All or a portion of the security is pledged as collateral to the brokers for forward foreign currency exchange and swap contracts. |
| (c) | The rate shown is the effective yield at the date of purchase. |
| (d) | All or a portion of the security is pledged as collateral to the brokers for futures contracts. |
| (e) | Includes appreciation/(depreciation) on forward foreign currency exchange, futures and swap contracts. |
| ^ | All or a portion represents positions held in the respective Subsidiary (See Note 2). |
All securities are Level 2 with respect to ASC 820 (See Note 5).
| The accompanying notes are an integral part of these financial statements. | (Continued) |
| AQR Funds | Annual Report | December 2015 | ||||||||||||||
134
Table of Contents
| Consolidated Schedule of Investments | December 31, 2015 |
| AQR MANAGED FUTURES STRATEGY FUND |
Total return swap contracts outstanding as of December 31, 2015:
Over the Counter
| COUNTERPARTY | UNDERLYING REFERENCE INSTRUMENT | TERMINATION DATE | CURRENCY | NOTIONAL VALUE | UNREALIZED APPRECIATION (DEPRECIATION) | |||||||||
| Bank of America | Bovespa Index February Futures | 02/2016 | BRL | (306,710,519 | ) | $3,509,795 | ||||||||
| CitiBank | Cotton No. 2 March Futures^ | 02/2016 | USD | 17,550,335 | (338,175 | ) | ||||||||
| Bank of America | H-SHARES Index January Futures | 01/2016 | HKD | (1,191,005,183 | ) | 3,156,209 | ||||||||
| Morgan Stanley and Co., International PLC | KOSPI Index 200 March Futures | 03/2016 | KRW | 191,151,609,850 | 1,527,270 | |||||||||
| Macquarie Capital | Live Cattle February Futures^ | 02/2016 | USD | (95,951,699 | ) | (1,997,101 | ) | |||||||
| Merrill Lynch | Live Cattle February Futures^ | 02/2016 | USD | (15,178,770 | ) | (306,990 | ) | |||||||
| Societe Generale | Live Cattle February Futures^ | 02/2016 | USD | (34,147,966 | ) | (708,674 | ) | |||||||
| Bank of America | MSCI Taiwan Stock Index January Futures | 01/2016 | USD | (132,146,900 | ) | 1,194,020 | ||||||||
| Morgan Stanley and Co., International PLC | SGX FTSE China A50 Index January Futures | 01/2016 | USD | 36,777,097 | (666,067 | ) | ||||||||
| Bank of America | SGX S&P CNX Nifty Index January Futures | 01/2016 | USD | (9,781,329 | ) | (26,503 | ) | |||||||
| CitiBank | Soybean March Futures^ | 02/2016 | USD | (105,567,925 | ) | 1,942,878 | ||||||||
| CitiBank | Soybean March Futures^ | 02/2016 | USD | 33,953,294 | (1,326,851 | ) | ||||||||
| Macquarie Capital | Soybean March Futures^ | 02/2016 | USD | (19,013,027 | ) | 431,652 | ||||||||
| CitiBank | Soybean Meal March Futures^ | 02/2016 | USD | (77,872,025 | ) | 3,346,175 | ||||||||
| Deutsche Bank | Soybean Meal March Futures^ | 02/2016 | USD | (40,901,252 | ) | 2,058,602 | ||||||||
| Societe Generale | Soybean Meal March Futures^ | 02/2016 | USD | (27,265,647 | ) | 1,379,397 | ||||||||
| Bank of America | Swiss Market Index March Futures | 03/2016 | CHF | (104,582,094 | ) | (3,103,694 | ) | |||||||
| Bank of America | Taiwan Stock Exchange January Futures | 01/2016 | TWD | (536,909,541 | ) | (534,623 | ) | |||||||
| CitiBank | Wheat March Futures^ | 02/2016 | USD | (26,608,064 | ) | 170,564 | ||||||||
| Deutsche Bank | Wheat March Futures^ | 02/2016 | USD | (9,270,529 | ) | 364,030 | ||||||||
|
| |||||||||||||
| $10,071,914 | ||||||||||||||
|
| |||||||||||||
| ^ | Represents positions held in the respective Subsidiary (See Note 2). |
Open futures contracts outstanding at December 31, 2015:
Exchange Traded
| NUMBER OF CONTRACTS | COUNTERPARTY | DESCRIPTION | EXPIRATION DATE | VALUE AT TRADE DATE | VALUE AT DECEMBER 31, 2015 | UNREALIZED APPRECIATION (DEPRECIATION) | ||||||||||||||
| Long Contracts: | ||||||||||||||||||||
| 2,085 | Goldman Sachs | Cocoa Futures^ | 03/2016 | $70,095,323 | $69,527,252 | $(568,071 | ) | |||||||||||||
| 1,366 | Morgan Stanley and Co., International PLC | Cocoa Futures^ | 03/2016 | 45,297,752 | 43,862,260 | (1,435,492 | ) | |||||||||||||
| 482 | Morgan Stanley and Co., International PLC | Cotton No. 2 Futures^ | 03/2016 | 15,204,360 | 15,250,480 | 46,120 | ||||||||||||||
| 81 | J.P. Morgan | LME Aluminum Futures^ | 01/2016 | 3,174,892 | 3,038,006 | (136,886 | ) | |||||||||||||
| 57 | J.P. Morgan | LME Aluminum Futures^ | 01/2016 | 2,225,990 | 2,138,355 | (87,635 | ) | |||||||||||||
| 33 | J.P. Morgan | LME Aluminum Futures^ | 01/2016 | 1,303,185 | 1,238,284 | (64,901 | ) | |||||||||||||
| 14 | J.P. Morgan | LME Aluminum Futures^ | 01/2016 | 568,791 | 525,455 | (43,336 | ) | |||||||||||||
| 6 | J.P. Morgan | LME Aluminum Futures^ | 01/2016 | 228,015 | 225,825 | (2,190 | ) | |||||||||||||
| 57 | J.P. Morgan | LME Aluminum Futures^ | 01/2016 | 2,153,699 | 2,145,337 | (8,362 | ) | |||||||||||||
| 15 | J.P. Morgan | LME Aluminum Futures^ | 01/2016 | 568,162 | 564,563 | (3,599 | ) | |||||||||||||
| 61 | J.P. Morgan | LME Aluminum Futures^ | 01/2016 | 2,272,552 | 2,295,888 | 23,336 | ||||||||||||||
| 32 | J.P. Morgan | LME Aluminum Futures^ | 01/2016 | 1,193,678 | 1,204,640 | 10,962 | ||||||||||||||
| The accompanying notes are an integral part of these financial statements. | (Continued) |
| AQR Funds | Annual Report | December 2015 | ||||||||||||||
135
Table of Contents
| Consolidated Schedule of Investments | December 31, 2015 |
| AQR MANAGED FUTURES STRATEGY FUND |
| NUMBER OF CONTRACTS | COUNTERPARTY | DESCRIPTION | EXPIRATION DATE | VALUE AT TRADE DATE | VALUE AT DECEMBER 31, 2015 | UNREALIZED APPRECIATION (DEPRECIATION) | ||||||||||||||
| Long Contracts: (continued) | ||||||||||||||||||||
| 115 | J.P. Morgan | LME Aluminum Futures^ | 01/2016 | $ 4,234,619 | $ 4,330,066 | $ 95,447 | ||||||||||||||
| 65 | J.P. Morgan | LME Aluminum Futures^ | 02/2016 | 2,418,598 | 2,449,395 | 30,797 | ||||||||||||||
| 11 | J.P. Morgan | LME Aluminum Futures^ | 02/2016 | 413,908 | 414,599 | 691 | ||||||||||||||
| 61 | J.P. Morgan | LME Aluminum Futures^ | 02/2016 | 2,281,168 | 2,300,051 | 18,883 | ||||||||||||||
| 32 | J.P. Morgan | LME Aluminum Futures^ | 03/2016 | 1,208,258 | 1,209,400 | 1,142 | ||||||||||||||
| 82 | J.P. Morgan | LME Aluminum Futures^ | 03/2016 | 3,098,562 | 3,098,062 | (500 | ) | |||||||||||||
| 25 | J.P. Morgan | LME Aluminum Futures^ | 03/2016 | 927,733 | 944,219 | 16,486 | ||||||||||||||
| 352 | J.P. Morgan | LME Aluminum Futures^ | 03/2016 | 13,290,616 | 13,268,200 | (22,416 | ) | |||||||||||||
| 213 | J.P. Morgan | LME Aluminum Futures^ | 03/2016 | 8,118,126 | 8,025,201 | (92,925 | ) | |||||||||||||
| 12 | J.P. Morgan | LME Copper Futures^ | 01/2016 | 1,560,440 | 1,413,114 | (147,326 | ) | |||||||||||||
| 24 | J.P. Morgan | LME Copper Futures^ | 01/2016 | 3,130,764 | 2,826,000 | (304,764 | ) | |||||||||||||
| 35 | J.P. Morgan | LME Copper Futures^ | 01/2016 | 4,546,897 | 4,121,337 | (425,560 | ) | |||||||||||||
| 8 | J.P. Morgan | LME Copper Futures^ | 01/2016 | 1,031,354 | 942,038 | (89,316 | ) | |||||||||||||
| 34 | J.P. Morgan | LME Copper Futures^ | 02/2016 | 4,233,083 | 4,004,562 | (228,521 | ) | |||||||||||||
| 25 | J.P. Morgan | LME Copper Futures^ | 02/2016 | 3,081,311 | 2,944,531 | (136,780 | ) | |||||||||||||
| 43 | J.P. Morgan | LME Copper Futures^ | 02/2016 | 5,294,502 | 5,064,594 | (229,908 | ) | |||||||||||||
| 3 | J.P. Morgan | LME Copper Futures^ | 02/2016 | 362,257 | 353,343 | (8,914 | ) | |||||||||||||
| 10 | J.P. Morgan | LME Copper Futures^ | 02/2016 | 1,183,587 | 1,177,812 | (5,775 | ) | |||||||||||||
| 59 | J.P. Morgan | LME Copper Futures^ | 02/2016 | 6,824,453 | 6,948,887 | 124,434 | ||||||||||||||
| 106 | J.P. Morgan | LME Copper Futures^ | 02/2016 | 12,250,447 | 12,484,097 | 233,650 | ||||||||||||||
| 48 | J.P. Morgan | LME Copper Futures^ | 02/2016 | 5,353,318 | 5,652,840 | 299,522 | ||||||||||||||
| 16 | J.P. Morgan | LME Copper Futures^ | 03/2016 | 1,838,039 | 1,883,900 | 45,861 | ||||||||||||||
| 22 | J.P. Morgan | LME Copper Futures^ | 03/2016 | 2,502,554 | 2,590,363 | 87,809 | ||||||||||||||
| 17 | J.P. Morgan | LME Copper Futures^ | 03/2016 | 1,967,367 | 2,001,559 | 34,192 | ||||||||||||||
| 7 | J.P. Morgan | LME Copper Futures^ | 03/2016 | 802,567 | 824,136 | 21,569 | ||||||||||||||
| 5 | J.P. Morgan | LME Copper Futures^ | 03/2016 | 584,137 | 588,643 | 4,506 | ||||||||||||||
| 3 | J.P. Morgan | LME Nickel Futures^ | 01/2016 | 191,032 | 158,107 | (32,925 | ) | |||||||||||||
| 23 | J.P. Morgan | LME Nickel Futures^ | 01/2016 | 1,453,790 | 1,212,229 | (241,561 | ) | |||||||||||||
| 11 | J.P. Morgan | LME Nickel Futures^ | 01/2016 | 697,323 | 579,832 | (117,491 | ) | |||||||||||||
| 3 | J.P. Morgan | LME Nickel Futures^ | 02/2016 | 170,512 | 158,387 | (12,125 | ) | |||||||||||||
| 8 | J.P. Morgan | LME Nickel Futures^ | 02/2016 | 455,060 | 422,395 | (32,665 | ) | |||||||||||||
| 7 | J.P. Morgan | LME Nickel Futures^ | 03/2016 | 364,577 | 370,424 | 5,847 | ||||||||||||||
| 159 | J.P. Morgan | LME Zinc Futures^ | 01/2016 | 7,439,594 | 6,344,617 | (1,094,977 | ) | |||||||||||||
| 92 | J.P. Morgan | LME Zinc Futures^ | 01/2016 | 4,198,784 | 3,672,226 | (526,558 | ) | |||||||||||||
| 24 | J.P. Morgan | LME Zinc Futures^ | 02/2016 | 994,259 | 961,458 | (32,801 | ) | |||||||||||||
| 92 | J.P. Morgan | LME Zinc Futures^ | 02/2016 | 3,818,225 | 3,686,992 | (131,233 | ) | |||||||||||||
| 34 | J.P. Morgan | LME Zinc Futures^ | 02/2016 | 1,370,283 | 1,362,711 | (7,572 | ) | |||||||||||||
| 5 | J.P. Morgan | LME Zinc Futures^ | 02/2016 | 198,294 | 200,418 | 2,124 | ||||||||||||||
| 21 | J.P. Morgan | LME Zinc Futures^ | 03/2016 | 809,602 | 843,602 | 34,000 | ||||||||||||||
| 9 | J.P. Morgan | LME Zinc Futures^ | 03/2016 | 344,272 | 361,613 | 17,341 | ||||||||||||||
| 9 | J.P. Morgan | LME Zinc Futures^ | 03/2016 | 349,447 | 361,681 | 12,234 | ||||||||||||||
| 14 | J.P. Morgan | LME Zinc Futures^ | 03/2016 | 518,041 | 563,150 | 45,109 | ||||||||||||||
| 27 | J.P. Morgan | LME Zinc Futures^ | 03/2016 | 1,024,055 | 1,086,075 | 62,020 | ||||||||||||||
| 814 | Morgan Stanley and Co., International PLC | Soybean Oil Futures^ | 03/2016 | 15,110,575 | 15,018,300 | (92,275 | ) | |||||||||||||
| 1,122 | Morgan Stanley and Co., International PLC | Sugar #11 (World Markets) Futures^ | 02/2016 | 19,284,076 | 19,151,194 | (132,882 | ) | |||||||||||||
| 418 | Barclays Capital | Amsterdam Index Futures | 01/2016 | 39,450,506 | 40,143,088 | 692,582 | ||||||||||||||
| 2,505 | Barclays Capital | CAC40 Index Futures | 01/2016 | 125,471,032 | 126,274,289 | 803,257 | ||||||||||||||
| 562 | Barclays Capital | DAX Index Futures | 03/2016 | 159,656,328 | 164,475,914 | 4,819,586 | ||||||||||||||
| 1,758 | Barclays Capital | E-Mini DJIA CBOT Futures | 03/2016 | 152,268,145 | 152,427,390 | 159,245 | ||||||||||||||
| 3,698 | Barclays Capital | Euro Stoxx 50 Index Futures | 03/2016 | 131,266,623 | 131,897,063 | 630,440 | ||||||||||||||
| 330 | Barclays Capital | FTSE/MIB Index Futures | 03/2016 | 38,163,993 | 38,448,453 | 284,460 | ||||||||||||||
| 20 | J.P. Morgan | KOSPI Index 200 Futures | 03/2016 | 2,060,547 | 2,050,659 | (9,888 | ) | |||||||||||||
| The accompanying notes are an integral part of these financial statements. | (Continued) |
| AQR Funds | Annual Report | December 2015 | ||||||||||||||
136
Table of Contents
| Consolidated Schedule of Investments | December 31, 2015 |
| AQR MANAGED FUTURES STRATEGY FUND |
| NUMBER OF CONTRACTS | COUNTERPARTY | DESCRIPTION | EXPIRATION DATE | VALUE AT TRADE DATE | VALUE AT DECEMBER 31, 2015 | UNREALIZED APPRECIATION (DEPRECIATION) | ||||||||||||||
| Long Contracts: (continued) | ||||||||||||||||||||
| 6,838 | Barclays Capital | NASDAQ 100 E-Mini Futures | 03/2016 | $ 625,524,414 | $ 627,420,690 | $ 1,896,276 | ||||||||||||||
| 2,114 | J.P. Morgan | Nikkei 225 Futures | 03/2016 | 345,101,811 | 334,701,277 | (10,400,534 | ) | |||||||||||||
| 1,539 | Barclays Capital | S&P 500 E-Mini Futures | 03/2016 | 155,435,267 | 156,624,030 | 1,188,763 | ||||||||||||||
| 5,280 | J.P. Morgan | SGX FTSE China A50 Index Futures | 01/2016 | 56,521,620 | 55,281,600 | (1,240,020 | ) | |||||||||||||
| 3,016 | Barclays Capital | TOPIX Index Futures | 03/2016 | 393,252,199 | 388,307,334 | (4,944,865 | ) | |||||||||||||
| 1,891 | Goldman Sachs | 10-Year Japanese Government Bond Futures | 03/2016 | 2,341,348,709 | 2,344,811,681 | 3,462,972 | ||||||||||||||
| 3,669 | J.P. Morgan | 3-Month Euro Euribor Futures | 06/2016 | 999,248,944 | 998,615,698 | (633,246 | ) | |||||||||||||
| 3,156 | J.P. Morgan | 3-Month Euro Euribor Futures | 09/2016 | 859,500,775 | 859,032,009 | (468,766 | ) | |||||||||||||
| 3,910 | J.P. Morgan | 3-Month Euro Euribor Futures | 12/2016 | 1,064,459,322 | 1,064,157,128 | (302,194 | ) | |||||||||||||
| 4,473 | J.P. Morgan | 3-Month Euro Euribor Futures | 03/2017 | 1,217,393,210 | 1,217,141,816 | (251,394 | ) | |||||||||||||
| 4,679 | J.P. Morgan | 3-Month Euro Euribor Futures | 06/2017 | 1,273,056,020 | 1,272,687,699 | (368,321 | ) | |||||||||||||
| 5,087 | J.P. Morgan | 3-Month Euro Euribor Futures | 09/2017 | 1,384,236,593 | 1,382,972,635 | (1,263,958 | ) | |||||||||||||
| 3,077 | J.P. Morgan | 3-Month Euro Euribor Futures | 12/2017 | 836,653,624 | 836,024,221 | (629,403 | ) | |||||||||||||
| 416 | J.P. Morgan | 90-Day Sterling Futures | 03/2016 | 76,147,426 | 76,167,793 | 20,367 | ||||||||||||||
| 3,855 | J.P. Morgan | 90-Day Sterling Futures | 06/2016 | 704,510,241 | 705,123,303 | 613,062 | ||||||||||||||
| 1,943 | J.P. Morgan | 90-Day Sterling Futures | 09/2016 | 355,251,458 | 354,931,318 | (320,140 | ) | |||||||||||||
| 2,200 | J.P. Morgan | 90-Day Sterling Futures | 12/2016 | 401,849,923 | 401,269,864 | (580,059 | ) | |||||||||||||
| 2,155 | J.P. Morgan | 90-Day Sterling Futures | 03/2017 | 393,296,648 | 392,506,114 | (790,534 | ) | |||||||||||||
| 1,861 | J.P. Morgan | 90-Day Sterling Futures | 06/2017 | 339,266,987 | 338,477,605 | (789,382 | ) | |||||||||||||
| 1,042 | J.P. Morgan | 90-Day Sterling Futures | 09/2017 | 189,793,461 | 189,307,143 | (486,318 | ) | |||||||||||||
| 1,115 | J.P. Morgan | 90-Day Sterling Futures | 12/2017 | 202,793,376 | 202,364,097 | (429,279 | ) | |||||||||||||
| 1,320 | Goldman Sachs | Canadian 10-Year Bond Futures | 03/2016 | 132,800,458 | 134,499,386 | 1,698,928 | ||||||||||||||
| 1,747 | J.P. Morgan | Canadian 3-Month Bank Acceptance Futures | 06/2016 | 313,281,170 | 313,240,370 | (40,800 | ) | |||||||||||||
| 3,525 | J.P. Morgan | Canadian 3-Month Bank Acceptance Futures | 09/2016 | 632,161,828 | 632,070,942 | (90,886 | ) | |||||||||||||
| 3,069 | Goldman Sachs | Euro-Bobl Futures | 03/2016 | 439,242,553 | 435,815,247 | (3,427,306 | ) | |||||||||||||
| 776 | Goldman Sachs | Euro-OAT Futures | 03/2016 | 128,281,350 | 126,539,863 | (1,741,487 | ) | |||||||||||||
| 6,779 | Goldman Sachs | Euro-SCHATZ Futures | 03/2016 | 823,189,553 | 821,502,881 | (1,686,672 | ) | |||||||||||||
| 433 | J.P. Morgan | Euro CHF 3-Month LIFFE Futures | 06/2016 | 109,168,088 | 108,920,078 | (248,010 | ) | |||||||||||||
| 500 | J.P. Morgan | Euro CHF 3-Month LIFFE Futures | 09/2016 | 126,045,087 | 125,773,762 | (271,325 | ) | |||||||||||||
| 485 | J.P. Morgan | Euro CHF 3-Month LIFFE Futures | 12/2016 | 122,208,193 | 121,988,444 | (219,749 | ) | |||||||||||||
| 6,307 | Goldman Sachs | Euro-BTP Italian Government Bond Futures | 03/2016 | 950,496,312 | 945,321,903 | (5,174,409 | ) | |||||||||||||
| 1,630 | Goldman Sachs | Euro-Bund Futures | 03/2016 | 283,337,292 | 279,739,878 | (3,597,414 | ) | |||||||||||||
| 1,184 | Goldman Sachs | Long Gilt Futures | 03/2016 | 204,992,406 | 203,816,521 | (1,175,885 | ) | |||||||||||||
|
|
|
|
|
| |||||||||||||||
| 19,423,800,357 | 19,393,263,891 | (30,536,466 | ) | |||||||||||||||||
|
|
|
|
|
| |||||||||||||||
| Short Contracts: | ||||||||||||||||||||
| 6,157 | Goldman Sachs | Brent Crude Futures^ | 01/2016 | $(231,356,360 | ) | $(231,934,189 | ) | $(577,829 | ) | |||||||||||
| 1,164 | Morgan Stanley and Co., International PLC | Coffee ‘C’ Futures^ | 03/2016 | (53,392,087 | ) | (55,304,550 | ) | (1,912,463 | ) | |||||||||||
| 2,704 | Morgan Stanley and Co., International PLC | Copper Futures^ | 03/2016 | (140,345,420 | ) | (144,326,000 | ) | (3,980,580 | ) | |||||||||||
| 9,449 | Morgan Stanley and Co., International PLC | Corn Futures^ | 03/2016 | (173,347,716 | ) | (169,491,437 | ) | 3,856,279 | ||||||||||||
| 4,927 | Goldman Sachs | Gas Oil Futures^ | 02/2016 | (188,201,003 | ) | (164,684,974 | ) | 23,516,029 | ||||||||||||
| 1,504 | Morgan Stanley and Co., International PLC | Gasoline RBOB Futures^ | 01/2016 | (79,115,158 | ) | (80,286,528 | ) | (1,171,370 | ) | |||||||||||
| The accompanying notes are an integral part of these financial statements. | (Continued) |
| AQR Funds | Annual Report | December 2015 | ||||||||||||||
137
Table of Contents
| Consolidated Schedule of Investments | December 31, 2015 |
| AQR MANAGED FUTURES STRATEGY FUND |
| NUMBER OF CONTRACTS | COUNTERPARTY | DESCRIPTION | EXPIRATION DATE | VALUE AT TRADE DATE | VALUE AT DECEMBER 31, 2015 | UNREALIZED APPRECIATION (DEPRECIATION) | ||||||||||||||
| Short Contracts: (continued) | ||||||||||||||||||||
| 7,379 | Morgan Stanley and Co., International PLC | Gold 100 OZ Futures^ | 02/2016 | $ (795,186,932 | ) | $ (782,321,580 | ) | $ 12,865,352 | ||||||||||||
| 1,676 | Morgan Stanley and Co., International PLC | Hard Red Winter Wheat Futures^ | 03/2016 | (40,809,656 | ) | (39,260,300 | ) | 1,549,356 | ||||||||||||
| 2,258 | Morgan Stanley and Co., International PLC | Heating Oil ULSD Futures^ | 01/2016 | (120,248,103 | ) | (106,586,181 | ) | 13,661,922 | ||||||||||||
| 1,235 | Morgan Stanley and Co., International PLC | Lean Hogs Futures^ | 02/2016 | (28,430,400 | ) | (29,541,200 | ) | (1,110,800 | ) | |||||||||||
| 107 | Morgan Stanley and Co., International PLC | Live Cattle Futures^ | 02/2016 | (5,571,208 | ) | (5,855,040 | ) | (283,832 | ) | |||||||||||
| 81 | J.P. Morgan | LME Aluminum Futures^ | 01/2016 | (3,166,643 | ) | (3,038,007 | ) | 128,636 | ||||||||||||
| 57 | J.P. Morgan | LME Aluminum Futures^ | 01/2016 | (2,216,587 | ) | (2,138,355 | ) | 78,232 | ||||||||||||
| 33 | J.P. Morgan | LME Aluminum Futures^ | 01/2016 | (1,292,993 | ) | (1,238,284 | ) | 54,709 | ||||||||||||
| 14 | J.P. Morgan | LME Aluminum Futures^ | 01/2016 | (565,686 | ) | (525,455 | ) | 40,231 | ||||||||||||
| 6 | J.P. Morgan | LME Aluminum Futures^ | 01/2016 | (228,113 | ) | (225,825 | ) | 2,288 | ||||||||||||
| 57 | J.P. Morgan | LME Aluminum Futures^ | 01/2016 | (2,150,656 | ) | (2,145,338 | ) | 5,318 | ||||||||||||
| 15 | J.P. Morgan | LME Aluminum Futures^ | 01/2016 | (563,113 | ) | (564,562 | ) | (1,449 | ) | |||||||||||
| 61 | J.P. Morgan | LME Aluminum Futures^ | 01/2016 | (2,265,315 | ) | (2,295,888 | ) | (30,573 | ) | |||||||||||
| 32 | J.P. Morgan | LME Aluminum Futures^ | 01/2016 | (1,183,361 | ) | (1,204,640 | ) | (21,279 | ) | |||||||||||
| 115 | J.P. Morgan | LME Aluminum Futures^ | 01/2016 | (4,239,343 | ) | (4,330,066 | ) | (90,723 | ) | |||||||||||
| 65 | J.P. Morgan | LME Aluminum Futures^ | 02/2016 | (2,415,463 | ) | (2,449,395 | ) | (33,932 | ) | |||||||||||
| 11 | J.P. Morgan | LME Aluminum Futures^ | 02/2016 | (413,108 | ) | (414,598 | ) | (1,490 | ) | |||||||||||
| 61 | J.P. Morgan | LME Aluminum Futures^ | 02/2016 | (2,279,978 | ) | (2,300,051 | ) | (20,073 | ) | |||||||||||
| 32 | J.P. Morgan | LME Aluminum Futures^ | 03/2016 | (1,207,922 | ) | (1,209,400 | ) | (1,478 | ) | |||||||||||
| 82 | J.P. Morgan | LME Aluminum Futures^ | 03/2016 | (3,091,199 | ) | (3,098,062 | ) | (6,863 | ) | |||||||||||
| 25 | J.P. Morgan | LME Aluminum Futures^ | 03/2016 | (921,189 | ) | (944,219 | ) | (23,030 | ) | |||||||||||
| 1,747 | J.P. Morgan | LME Aluminum Futures^ | 03/2016 | (63,170,734 | ) | (65,850,981 | ) | (2,680,247 | ) | |||||||||||
| 213 | J.P. Morgan | LME Aluminum Futures^ | 03/2016 | (8,061,528 | ) | (8,025,201 | ) | 36,327 | ||||||||||||
| 12 | J.P. Morgan | LME Copper Futures^ | 01/2016 | (1,567,171 | ) | (1,413,114 | ) | 154,057 | ||||||||||||
| 24 | J.P. Morgan | LME Copper Futures^ | 01/2016 | (3,128,941 | ) | (2,826,000 | ) | 302,941 | ||||||||||||
| 35 | J.P. Morgan | LME Copper Futures^ | 01/2016 | (4,567,397 | ) | (4,121,338 | ) | 446,059 | ||||||||||||
| 8 | J.P. Morgan | LME Copper Futures^ | 01/2016 | (1,031,980 | ) | (942,038 | ) | 89,942 | ||||||||||||
| 34 | J.P. Morgan | LME Copper Futures^ | 02/2016 | (4,232,541 | ) | (4,004,562 | ) | 227,979 | ||||||||||||
| 25 | J.P. Morgan | LME Copper Futures^ | 02/2016 | (3,078,641 | ) | (2,944,532 | ) | 134,109 | ||||||||||||
| 43 | J.P. Morgan | LME Copper Futures^ | 02/2016 | (5,289,290 | ) | (5,064,594 | ) | 224,696 | ||||||||||||
| 3 | J.P. Morgan | LME Copper Futures^ | 02/2016 | (369,374 | ) | (353,344 | ) | 16,030 | ||||||||||||
| 10 | J.P. Morgan | LME Copper Futures^ | 02/2016 | (1,186,509 | ) | (1,177,812 | ) | 8,697 | ||||||||||||
| 59 | J.P. Morgan | LME Copper Futures^ | 02/2016 | (6,844,981 | ) | (6,948,887 | ) | (103,906 | ) | |||||||||||
| 106 | J.P. Morgan | LME Copper Futures^ | 02/2016 | (12,245,632 | ) | (12,484,097 | ) | (238,465 | ) | |||||||||||
| 48 | J.P. Morgan | LME Copper Futures^ | 02/2016 | (5,367,748 | ) | (5,652,840 | ) | (285,092 | ) | |||||||||||
| 16 | J.P. Morgan | LME Copper Futures^ | 03/2016 | (1,836,798 | ) | (1,883,900 | ) | (47,102 | ) | |||||||||||
| 22 | J.P. Morgan | LME Copper Futures^ | 03/2016 | (2,506,949 | ) | (2,590,362 | ) | (83,413 | ) | |||||||||||
| 17 | J.P. Morgan | LME Copper Futures^ | 03/2016 | (1,961,297 | ) | (2,001,558 | ) | (40,261 | ) | |||||||||||
| 7 | J.P. Morgan | LME Copper Futures^ | 03/2016 | (802,482 | ) | (824,137 | ) | (21,655 | ) | |||||||||||
| 5 | J.P. Morgan | LME Copper Futures^ | 03/2016 | (585,110 | ) | (588,644 | ) | (3,534 | ) | |||||||||||
| 838 | J.P. Morgan | LME Copper Futures^ | 03/2016 | (94,706,143 | ) | (98,637,837 | ) | (3,931,694 | ) | |||||||||||
| 3 | J.P. Morgan | LME Nickel Futures^ | 01/2016 | (189,713 | ) | (158,108 | ) | 31,605 | ||||||||||||
| 23 | J.P. Morgan | LME Nickel Futures^ | 01/2016 | (1,445,494 | ) | (1,212,230 | ) | 233,264 | ||||||||||||
| 11 | J.P. Morgan | LME Nickel Futures^ | 01/2016 | (699,243 | ) | (579,832 | ) | 119,411 | ||||||||||||
| 3 | J.P. Morgan | LME Nickel Futures^ | 02/2016 | (171,392 | ) | (158,387 | ) | 13,005 | ||||||||||||
| 8 | J.P. Morgan | LME Nickel Futures^ | 02/2016 | (455,300 | ) | (422,395 | ) | 32,905 | ||||||||||||
| The accompanying notes are an integral part of these financial statements. | (Continued) |
| AQR Funds | Annual Report | December 2015 | ||||||||||||||
138
Table of Contents
| Consolidated Schedule of Investments | December 31, 2015 |
| AQR MANAGED FUTURES STRATEGY FUND |
| NUMBER OF CONTRACTS | COUNTERPARTY | DESCRIPTION | EXPIRATION DATE | VALUE AT TRADE DATE | VALUE AT DECEMBER 31, 2015 | UNREALIZED APPRECIATION (DEPRECIATION) | ||||||||||||||
| Short Contracts: (continued) | ||||||||||||||||||||
| 540 | J.P. Morgan | LME Nickel Futures^ | 03/2016 | $ (27,472,752 | ) | $ (28,557,360 | ) | $ (1,084,608 | ) | |||||||||||
| 7 | J.P. Morgan | LME Nickel Futures^ | 03/2016 | (365,360 | ) | (370,424 | ) | (5,064 | ) | |||||||||||
| 159 | J.P. Morgan | LME Zinc Futures^ | 01/2016 | (7,321,560 | ) | (6,344,616 | ) | 976,944 | ||||||||||||
| 92 | J.P. Morgan | LME Zinc Futures^ | 01/2016 | (4,185,775 | ) | (3,672,226 | ) | 513,549 | ||||||||||||
| 24 | J.P. Morgan | LME Zinc Futures^ | 02/2016 | (995,865 | ) | (961,458 | ) | 34,407 | ||||||||||||
| 92 | J.P. Morgan | LME Zinc Futures^ | 02/2016 | (3,817,961 | ) | (3,686,992 | ) | 130,969 | ||||||||||||
| 34 | J.P. Morgan | LME Zinc Futures^ | 02/2016 | (1,365,707 | ) | (1,362,712 | ) | 2,995 | ||||||||||||
| 5 | J.P. Morgan | LME Zinc Futures^ | 02/2016 | (197,958 | ) | (200,418 | ) | (2,460 | ) | |||||||||||
| 21 | J.P. Morgan | LME Zinc Futures^ | 03/2016 | (810,764 | ) | (843,601 | ) | (32,837 | ) | |||||||||||
| 9 | J.P. Morgan | LME Zinc Futures^ | 03/2016 | (343,306 | ) | (361,613 | ) | (18,307 | ) | |||||||||||
| 9 | J.P. Morgan | LME Zinc Futures^ | 03/2016 | (350,439 | ) | (361,681 | ) | (11,242 | ) | |||||||||||
| 1,007 | J.P. Morgan | LME Zinc Futures^ | 03/2016 | (39,461,415 | ) | (40,506,575 | ) | (1,045,160 | ) | |||||||||||
| 14 | J.P. Morgan | LME Zinc Futures^ | 03/2016 | (519,719 | ) | (563,150 | ) | (43,431 | ) | |||||||||||
| 27 | J.P. Morgan | LME Zinc Futures^ | 03/2016 | (1,019,267 | ) | (1,086,075 | ) | (66,808 | ) | |||||||||||
| 4,386 | Morgan Stanley and Co., International PLC | Natural Gas Futures^ | 01/2016 | (92,424,836 | ) | (102,500,820 | ) | (10,075,984 | ) | |||||||||||
| 540 | Morgan Stanley and Co., International PLC | Nymex Palladium Futures^ | 03/2016 | (29,439,109 | ) | (30,348,000 | ) | (908,891 | ) | |||||||||||
| 1,044 | Morgan Stanley and Co., International PLC | Platinum Futures^ | 04/2016 | (45,426,170 | ) | (46,625,040 | ) | (1,198,870 | ) | |||||||||||
| 1,912 | Morgan Stanley and Co., International PLC | Silver Futures^ | 03/2016 | (134,433,676 | ) | (131,956,680 | ) | 2,476,996 | ||||||||||||
| 3,705 | Morgan Stanley and Co., International PLC | Soybean Futures^ | 03/2016 | (160,919,400 | ) | (160,102,312 | ) | 817,088 | ||||||||||||
| 1,339 | Morgan Stanley and Co., International PLC | Soybean Meal Futures^ | 03/2016 | (37,421,262 | ) | (35,550,450 | ) | 1,870,812 | ||||||||||||
| 2,538 | Morgan Stanley and Co., International PLC | Wheat Futures^ | 03/2016 | (62,560,791 | ) | (59,643,000 | ) | 2,917,791 | ||||||||||||
| 4,175 | Morgan Stanley and Co., International PLC | WTI Crude Futures^ | 01/2016 | (161,915,708 | ) | (154,642,000 | ) | 7,273,708 | ||||||||||||
| 18 | J.P. Morgan | E-Mini MSCI EAFE Index Futures | 03/2016 | (1,526,492 | ) | (1,528,380 | ) | (1,888 | ) | |||||||||||
| 3,451 | J.P. Morgan | E-Mini MSCI Emerging Markets Index Futures | 03/2016 | (131,523,520 | ) | (135,883,125 | ) | (4,359,605 | ) | |||||||||||
| 593 | Barclays Capital | E-Mini Russell 2000 Futures | 03/2016 | (66,632,278 | ) | (67,097,950 | ) | (465,672 | ) | |||||||||||
| 371 | Barclays Capital | FTSE 100 Index Futures | 03/2016 | (33,065,814 | ) | (33,898,609 | ) | (832,795 | ) | |||||||||||
| 543 | J.P. Morgan | FTSE/JSE Top 40 Index Futures | 03/2016 | (15,931,191 | ) | (16,246,813 | ) | (315,622 | ) | |||||||||||
| 352 | Barclays Capital | Hang Seng Index Futures | 01/2016 | (49,964,634 | ) | (49,756,582 | ) | 208,052 | ||||||||||||
| 1,302 | Barclays Capital | H-SHARES Index Futures | 01/2016 | (82,509,680 | ) | (81,521,474 | ) | 988,206 | ||||||||||||
| 806 | Barclays Capital | IBEX 35 Index Futures | 01/2016 | (84,191,400 | ) | (83,442,813 | ) | 748,587 | ||||||||||||
| 1,625 | Barclays Capital | MSCI Singapore Index Futures | 01/2016 | (36,979,695 | ) | (37,086,536 | ) | (106,841 | ) | |||||||||||
| 512 | Barclays Capital | MSCI Taiwan Stock Index Futures | 01/2016 | (15,657,635 | ) | (15,585,280 | ) | 72,355 | ||||||||||||
| 1,570 | J.P. Morgan | OMXS30 Index Futures | 01/2016 | (26,555,571 | ) | (26,930,919 | ) | (375,348 | ) | |||||||||||
| 362 | Barclays Capital | S&P MID 400 E-Mini Futures | 03/2016 | (50,226,395 | ) | (50,444,700 | ) | (218,305 | ) | |||||||||||
| 2,203 | Barclays Capital | S&P/Toronto Stock Exchange 60 Index Futures | 03/2016 | (239,862,618 | ) | (242,287,013 | ) | (2,424,395 | ) | |||||||||||
| 1,589 | Barclays Capital | SGX S&P CNX Nifty Index Futures | 01/2016 | (25,192,814 | ) | (25,258,744 | ) | (65,930 | ) | |||||||||||
| 796 | Barclays Capital | SPI 200 Index Futures | 03/2016 | (71,884,445 | ) | (76,232,435 | ) | (4,347,990 | ) | |||||||||||
| 9,737 | J.P. Morgan | 90-Day EURODollar Futures | 06/2016 | (2,412,788,560 | ) | (2,412,341,750 | ) | 446,810 | ||||||||||||
| The accompanying notes are an integral part of these financial statements. | (Continued) |
| AQR Funds | Annual Report | December 2015 | ||||||||||||||
139
Table of Contents
| Consolidated Schedule of Investments | December 31, 2015 |
| AQR MANAGED FUTURES STRATEGY FUND |
| NUMBER OF CONTRACTS | COUNTERPARTY | DESCRIPTION | EXPIRATION DATE | VALUE AT TRADE DATE | VALUE AT DECEMBER 31, 2015 | UNREALIZED APPRECIATION (DEPRECIATION) | ||||||||||||||
| Short Contracts: (continued) | ||||||||||||||||||||
| 6,443 | J.P. Morgan | 90-Day EURODollar Futures | 09/2016 | $ (1,593,813,387 | ) | $ (1,593,595,513 | ) | $ 217,874 | ||||||||||||
| 3,535 | J.P. Morgan | 90-Day EURODollar Futures | 12/2016 | (872,803,030 | ) | (872,879,875 | ) | (76,845 | ) | |||||||||||
| 2,401 | J.P. Morgan | 90-Day EURODollar Futures | 03/2017 | (591,943,111 | ) | (591,966,550 | ) | (23,439 | ) | |||||||||||
| 2,088 | J.P. Morgan | 90-Day EURODollar Futures | 06/2017 | (513,988,131 | ) | (514,013,400 | ) | (25,269 | ) | |||||||||||
| 1,845 | J.P. Morgan | 90-Day EURODollar Futures | 09/2017 | (453,526,988 | ) | (453,616,313 | ) | (89,325 | ) | |||||||||||
| 1,678 | J.P. Morgan | 90-Day EURODollar Futures | 12/2017 | (411,951,883 | ) | (412,053,875 | ) | (101,992 | ) | |||||||||||
| 364 | J.P. Morgan | Australia 10-Year Bond Futures | 03/2016 | (33,507,508 | ) | (33,657,784 | ) | (150,276 | ) | |||||||||||
| 15,090 | J.P. Morgan | Australia 3-Year Bond Futures | 03/2016 | (1,222,763,928 | ) | (1,225,702,052 | ) | (2,938,124 | ) | |||||||||||
| 56 | J.P. Morgan | Canadian 3-Month Bank Acceptance Futures | 03/2016 | (10,034,832 | ) | (10,037,364 | ) | (2,532 | ) | |||||||||||
| 997 | Morgan Stanley and Co., International PLC | CME Ultra Long Term U.S. Treasury Bond Futures | 03/2016 | (157,551,583 | ) | (158,211,438 | ) | (659,855 | ) | |||||||||||
| 477 | Goldman Sachs | Euro-Buxl 30-Year Bond Futures | 03/2016 | (78,697,367 | ) | (78,482,692 | ) | 214,675 | ||||||||||||
| 5,759 | Morgan Stanley and Co., International PLC | U.S. Treasury 10-Year Note Futures | 03/2016 | (724,079,100 | ) | (725,094,094 | ) | (1,014,994 | ) | |||||||||||
| 9,743 | Morgan Stanley and Co., International PLC | U.S. Treasury 2-Year Note Futures | 03/2016 | (2,116,291,004 | ) | (2,116,514,515 | ) | (223,511 | ) | |||||||||||
| 3,129 | Morgan Stanley and Co., International PLC | U.S. Treasury 5-Year Note Futures | 03/2016 | (369,862,652 | ) | (370,224,258 | ) | (361,606 | ) | |||||||||||
| 1,114 | Morgan Stanley and Co., International PLC | U.S. Treasury Long Bond Futures | 03/2016 | (170,877,534 | ) | (171,277,500 | ) | (399,966 | ) | |||||||||||
|
|
|
|
|
| |||||||||||||||
| (15,588,660,680 | ) | (15,561,698,403 | ) | 26,962,277 | ||||||||||||||||
|
|
|
|
|
| |||||||||||||||
| $3,835,139,677 | $3,831,565,488 | $(3,574,189 | ) | |||||||||||||||||
|
|
|
|
|
| |||||||||||||||
| ^ | Represents positions held in the respective Subsidiary (See Note 2). |
Forward foreign currency exchange contracts outstanding as of December 31, 2015:
Over the Counter
| PURCHASE CONTRACTS | COUNTERPARTY | CURRENCY | CURRENCY AMOUNT PURCHASED | VALUE AT SETTLEMENT DATE | VALUE AT DECEMBER 31, 2015 | UNREALIZED APPRECIATION (DEPRECIATION) | ||||||||||||||
| Australian Dollar, Expiring 03/16/16 | CitiBank | AUD | 513,598,500 | $373,098,550 | $372,922,714 | $(175,836 | ) | |||||||||||||
| Australian Dollar, Expiring 03/16/16 | Credit Suisse International | AUD | 513,598,500 | 373,101,902 | 372,922,714 | (179,188 | ) | |||||||||||||
| Brazilian Real, Expiring 03/16/16* | CitiBank | BRL | 201,719,000 | 51,832,254 | 49,805,554 | (2,026,700 | ) | |||||||||||||
| Brazilian Real, Expiring 03/16/16* | Credit Suisse International | BRL | 201,719,000 | 51,832,163 | 49,805,554 | (2,026,609 | ) | |||||||||||||
| Canadian Dollar, Expiring 03/16/16 | CitiBank | CAD | 91,401,500 | 68,433,756 | 66,068,598 | (2,365,158 | ) | |||||||||||||
| Canadian Dollar, Expiring 03/16/16 | Credit Suisse International | CAD | 91,401,500 | 68,433,756 | 66,068,598 | (2,365,158 | ) | |||||||||||||
| Swiss Franc, Expiring 03/16/16 | Credit Suisse International | CHF | 66,000 | 65,356 | 66,099 | 743 | ||||||||||||||
| The accompanying notes are an integral part of these financial statements. | (Continued) |
| AQR Funds | Annual Report | December 2015 | ||||||||||||||
140
Table of Contents
| Consolidated Schedule of Investments | December 31, 2015 |
| AQR MANAGED FUTURES STRATEGY FUND |
| PURCHASE CONTRACTS | COUNTERPARTY | CURRENCY | CURRENCY AMOUNT PURCHASED | VALUE AT SETTLEMENT DATE | VALUE AT DECEMBER 31, 2015 | UNREALIZED APPRECIATION (DEPRECIATION) | ||||||||||||||
| Chilean Peso, Expiring 03/16/16* | CitiBank | CLP | 7,553,093,500 | $ 10,750,268 | $ 10,572,420 | $ (177,848 | ) | |||||||||||||
| Chilean Peso, Expiring 03/16/16* | Credit Suisse International | CLP | 7,553,093,500 | 10,750,268 | 10,572,420 | (177,848 | ) | |||||||||||||
| Colombian Peso, Expiring 03/16/16* | CitiBank | COP | 4,084,886,501 | 1,292,693 | 1,276,486 | (16,207 | ) | |||||||||||||
| Colombian Peso, Expiring 03/16/16* | Credit Suisse International | COP | 4,084,886,499 | 1,292,693 | 1,276,486 | (16,207 | ) | |||||||||||||
| Czech Republic Koruna, Expiring 03/16/16 | CitiBank | CZK | 2,943,278,500 | 118,367,222 | 118,619,116 | 251,894 | ||||||||||||||
| Czech Republic Koruna, Expiring 03/16/16 | Credit Suisse International | CZK | 2,943,278,500 | 118,366,504 | 118,619,116 | 252,612 | ||||||||||||||
| Euro, Expiring 03/16/16 | CitiBank | EUR | 1,539,472,000 | 1,683,380,402 | 1,676,095,208 | (7,285,194 | ) | |||||||||||||
| Euro, Expiring 03/16/16 | Credit Suisse International | EUR | 1,539,472,000 | 1,683,380,405 | 1,676,095,208 | (7,285,197 | ) | |||||||||||||
| British Pound, Expiring 03/16/16 | CitiBank | GBP | 105,483,000 | 158,664,250 | 155,521,759 | (3,142,491 | ) | |||||||||||||
| British Pound, Expiring 03/16/16 | Credit Suisse International | GBP | 105,483,000 | 158,665,079 | 155,521,759 | (3,143,320 | ) | |||||||||||||
| Hungarian Forint, Expiring 03/16/16 | CitiBank | HUF | 11,694,349,501 | 40,343,181 | 40,250,792 | (92,389 | ) | |||||||||||||
| Hungarian Forint, Expiring 03/16/16 | Credit Suisse International | HUF | 11,694,349,501 | 40,361,829 | 40,250,792 | (111,037 | ) | |||||||||||||
| Indonesian Rupiah, Expiring 03/16/16* | CitiBank | IDR | 521,379,158,000 | 36,910,264 | 37,152,956 | 242,692 | ||||||||||||||
| Indonesian Rupiah, Expiring 03/16/16* | Credit Suisse International | IDR | 521,379,158,000 | 36,910,264 | 37,152,956 | 242,692 | ||||||||||||||
| Israeli Shekel, Expiring 03/16/16 | CitiBank | ILS | 165,257,500 | 42,885,688 | 42,534,948 | (350,740 | ) | |||||||||||||
| Israeli Shekel, Expiring 03/16/16 | Credit Suisse International | ILS | 165,257,500 | 42,868,023 | 42,534,948 | (333,075 | ) | |||||||||||||
| Indian Rupee, Expiring 03/16/16* | CitiBank | INR | 5,269,402,000 | 77,875,616 | 78,712,325 | 836,709 | ||||||||||||||
| Indian Rupee, Expiring 03/16/16* | Credit Suisse International | INR | 5,269,402,000 | 77,875,622 | 78,712,325 | 836,703 | ||||||||||||||
| Japanese Yen, Expiring 03/16/16 | CitiBank | JPY | 137,952,898,500 | 1,132,723,181 | 1,149,716,424 | 16,993,243 | ||||||||||||||
| Japanese Yen, Expiring 03/16/16 | Credit Suisse International | JPY | 137,952,898,500 | 1,132,723,277 | 1,149,716,424 | 16,993,147 | ||||||||||||||
| Korean Won, Expiring 03/16/16* | CitiBank | KRW | 70,395,125,000 | 60,649,353 | 59,939,619 | (709,734 | ) | |||||||||||||
| Korean Won, Expiring 03/16/16* | Credit Suisse International | KRW | 70,395,125,000 | 60,649,343 | 59,939,619 | (709,724 | ) | |||||||||||||
| Mexican Peso, Expiring 03/16/16 | CitiBank | MXN | 745,566,000 | 44,590,597 | 43,036,565 | (1,554,032 | ) | |||||||||||||
| Mexican Peso, Expiring 03/16/16 | Credit Suisse International | MXN | 745,566,000 | 44,590,396 | 43,036,565 | (1,553,831 | ) | |||||||||||||
| Malaysian Ringgit, Expiring 03/16/16* | CitiBank | MYR | 117,581,000 | 27,689,101 | 27,245,802 | (443,299 | ) | |||||||||||||
| Malaysian Ringgit, Expiring 03/16/16* | Credit Suisse International | MYR | 121,925,000 | 28,722,149 | 28,252,391 | (469,758 | ) | |||||||||||||
| Norwegian Krone, Expiring 03/16/16 | CitiBank | NOK | 516,781,500 | 60,113,042 | 58,341,776 | (1,771,266 | ) | |||||||||||||
| Norwegian Krone, Expiring 03/16/16 | Credit Suisse International | NOK | 516,781,500 | 60,113,123 | 58,341,776 | (1,771,347 | ) | |||||||||||||
| The accompanying notes are an integral part of these financial statements. | (Continued) |
| AQR Funds | Annual Report | December 2015 | ||||||||||||||
141
Table of Contents
| Consolidated Schedule of Investments | December 31, 2015 |
| AQR MANAGED FUTURES STRATEGY FUND |
| PURCHASE CONTRACTS | COUNTERPARTY | CURRENCY | CURRENCY AMOUNT PURCHASED | VALUE AT SETTLEMENT DATE | VALUE AT DECEMBER 31, 2015 | UNREALIZED APPRECIATION (DEPRECIATION) | ||||||||||||||
| New Zealand Dollar, Expiring 03/16/16 | CitiBank | NZD | 478,525,001 | $ 317,678,115 | $ 325,846,517 | $ 8,168,402 | ||||||||||||||
| New Zealand Dollar, Expiring 03/16/16 | Credit Suisse International | NZD | 478,525,001 | 317,678,188 | 325,846,517 | 8,168,329 | ||||||||||||||
| Philippine Peso, Expiring 03/16/16* | CitiBank | PHP | 647,493,000 | 13,637,936 | 13,704,218 | 66,282 | ||||||||||||||
| Philippine Peso, Expiring 03/16/16* | Credit Suisse International | PHP | 647,493,000 | 13,637,936 | 13,704,219 | 66,283 | ||||||||||||||
| Poland Zloty, Expiring 03/16/16 | CitiBank | PLN | 190,103,000 | 48,405,663 | 48,394,544 | (11,119 | ) | |||||||||||||
| Poland Zloty, Expiring 03/16/16 | Credit Suisse International | PLN | 190,103,000 | 48,405,650 | 48,394,545 | (11,105 | ) | |||||||||||||
| Swedish Krona, Expiring 03/16/16 | CitiBank | SEK | 1,495,804,000 | 175,482,892 | 177,567,211 | 2,084,319 | ||||||||||||||
| Swedish Krona, Expiring 03/16/16 | Credit Suisse International | SEK | 1,495,804,000 | 175,482,813 | 177,567,211 | 2,084,398 | ||||||||||||||
| Singapore Dollar, Expiring 03/16/16 | CitiBank | SGD | 85,239,000 | 60,425,551 | 59,974,192 | (451,359 | ) | |||||||||||||
| Singapore Dollar, Expiring 03/16/16 | Credit Suisse International | SGD | 85,239,000 | 60,425,872 | 59,974,192 | (451,680 | ) | |||||||||||||
| Turkish Lira, Expiring 03/16/16 | CitiBank | TRY | 342,087,500 | 114,722,707 | 114,946,610 | 223,903 | ||||||||||||||
| Turkish Lira, Expiring 03/16/16 | Credit Suisse International | TRY | 342,087,500 | 114,719,192 | 114,946,609 | 227,417 | ||||||||||||||
| New Taiwan Dollar, Expiring 03/16/16* | CitiBank | TWD | 765,593,000 | 23,343,434 | 23,326,743 | (16,691 | ) | |||||||||||||
| New Taiwan Dollar, Expiring 03/16/16* | Credit Suisse International | TWD | 906,975,000 | 27,704,384 | 27,634,491 | (69,893 | ) | |||||||||||||
| South African Rand, Expiring 03/16/16 | CitiBank | ZAR | 822,438,000 | 53,936,719 | 52,474,657 | (1,462,062 | ) | |||||||||||||
| South African Rand, Expiring 03/16/16 | Credit Suisse International | ZAR | 822,438,000 | 53,937,092 | 52,474,658 | (1,462,434 | ) | |||||||||||||
|
|
|
|
|
| |||||||||||||||
| $9,599,925,714 | $9,613,475,946 | $13,550,232 | ||||||||||||||||||
|
|
|
|
|
| |||||||||||||||
| SALES CONTRACTS | COUNTERPARTY | CURRENCY | CURRENCY AMOUNT SOLD | VALUE AT SETTLEMENT DATE | VALUE AT DECEMBER 31, 2015 | UNREALIZED APPRECIATION (DEPRECIATION) | ||||||||||||||
| Australian Dollar, Expiring 03/16/16 | CitiBank | AUD | (756,292,000 | ) | $(543,159,218 | ) | $(549,141,917 | ) | $(5,982,699 | ) | ||||||||||
| Australian Dollar, Expiring 03/16/16 | Credit Suisse International | AUD | (756,292,000 | ) | (543,158,876 | ) | (549,141,918 | ) | (5,983,042 | ) | ||||||||||
| Brazilian Real, Expiring 03/16/16* | CitiBank | BRL | (222,022,500 | ) | (55,639,502 | ) | (54,818,603 | ) | 820,899 | |||||||||||
| Brazilian Real, Expiring 03/16/16* | Credit Suisse International | BRL | (222,022,500 | ) | (55,639,933 | ) | (54,818,603 | ) | 821,330 | |||||||||||
| Canadian Dollar, Expiring 03/16/16 | CitiBank | CAD | (1,327,274,501 | ) | (974,743,750 | ) | (959,406,190 | ) | 15,337,560 | |||||||||||
| Canadian Dollar, Expiring 03/16/16 | Credit Suisse International | CAD | (1,327,274,500 | ) | (974,743,749 | ) | (959,406,190 | ) | 15,337,559 | |||||||||||
| Swiss Franc, Expiring 03/16/16 | CitiBank | CHF | (427,000 | ) | (428,125 | ) | (427,640 | ) | 485 | |||||||||||
| Swiss Franc, Expiring 03/16/16 | Credit Suisse International | CHF | (3,704,000 | ) | (3,752,921 | ) | (3,709,552 | ) | 43,369 | |||||||||||
| Chilean Peso, Expiring 03/16/16* | CitiBank | CLP | (25,042,214,000 | ) | (35,238,417 | ) | (35,052,764 | ) | 185,653 | |||||||||||
| The accompanying notes are an integral part of these financial statements. | (Continued) |
| AQR Funds | Annual Report | December 2015 | ||||||||||||||
142
Table of Contents
| Consolidated Schedule of Investments | December 31, 2015 |
| AQR MANAGED FUTURES STRATEGY FUND |
| SALES CONTRACTS | COUNTERPARTY | CURRENCY | CURRENCY AMOUNT SOLD | VALUE AT SETTLEMENT DATE | VALUE AT DECEMBER 31, 2015 | UNREALIZED APPRECIATION (DEPRECIATION) | ||||||||||||||
| Chilean Peso, Expiring 03/16/16* | Credit Suisse International | CLP | (25,042,214,000 | ) | $ (35,238,417 | ) | $ (35,052,764 | ) | $ 185,653 | |||||||||||
| Colombian Peso, Expiring 03/16/16* | CitiBank | COP | (41,838,027,500 | ) | (12,757,228 | ) | (13,073,966 | ) | (316,738 | ) | ||||||||||
| Colombian Peso, Expiring 03/16/16* | Credit Suisse International | COP | (41,838,027,500 | ) | (12,757,228 | ) | (13,073,966 | ) | (316,738 | ) | ||||||||||
| Euro, Expiring 03/16/16 | CitiBank | EUR | (2,090,520,014 | ) | (2,228,076,894 | ) | (2,276,046,968 | ) | (47,970,074 | ) | ||||||||||
| Euro, Expiring 03/16/16 | Credit Suisse International | EUR | (2,090,520,014 | ) | (2,228,068,477 | ) | (2,276,046,967 | ) | (47,978,490 | ) | ||||||||||
| British Pound, Expiring 03/16/16 | CitiBank | GBP | (230,327,000 | ) | (345,470,106 | ) | (339,588,939 | ) | 5,881,167 | |||||||||||
| British Pound, Expiring 03/16/16 | Credit Suisse International | GBP | (230,327,000 | ) | (345,469,606 | ) | (339,588,939 | ) | 5,880,667 | |||||||||||
| Hong Kong Dollar, Expiring 03/16/16 | Credit Suisse International | HKD | (73,447,000 | ) | (9,479,551 | ) | (9,482,401 | ) | (2,850 | ) | ||||||||||
| Hungarian Forint, Expiring 03/16/16 | CitiBank | HUF | (13,904,543,001 | ) | (48,036,314 | ) | (47,858,061 | ) | 178,253 | |||||||||||
| Hungarian Forint, Expiring 03/16/16 | Credit Suisse International | HUF | (13,904,542,999 | ) | (48,046,223 | ) | (47,858,061 | ) | 188,162 | |||||||||||
| Indonesian Rupiah, Expiring 03/16/16* | CitiBank | IDR | (18,485,859,000 | ) | (1,267,884 | ) | (1,317,284 | ) | (49,400 | ) | ||||||||||
| Indonesian Rupiah, Expiring 03/16/16* | Credit Suisse International | IDR | (18,485,859,000 | ) | (1,267,884 | ) | (1,317,284 | ) | (49,400 | ) | ||||||||||
| Israeli Shekel, Expiring 03/16/16 | CitiBank | ILS | (93,172,000 | ) | (24,035,406 | ) | (23,981,158 | ) | 54,248 | |||||||||||
| Israeli Shekel, Expiring 03/16/16 | Credit Suisse International | ILS | (93,171,999 | ) | (24,031,457 | ) | (23,981,158 | ) | 50,299 | |||||||||||
| Indian Rupee, Expiring 03/16/16* | CitiBank | INR | (1,339,495,000 | ) | (19,703,181 | ) | (20,008,867 | ) | (305,686 | ) | ||||||||||
| Indian Rupee, Expiring 03/16/16* | Credit Suisse International | INR | (1,339,495,000 | ) | (19,703,179 | ) | (20,008,867 | ) | (305,688 | ) | ||||||||||
| Japanese Yen, Expiring 03/16/16 | CitiBank | JPY | (65,906,975,000 | ) | (537,620,626 | ) | (549,276,837 | ) | (11,656,211 | ) | ||||||||||
| Japanese Yen, Expiring 03/16/16 | Credit Suisse International | JPY | (65,906,975,000 | ) | (537,620,627 | ) | (549,276,837 | ) | (11,656,210 | ) | ||||||||||
| Korean Won, Expiring 03/16/16* | CitiBank | KRW | (282,049,931,000 | ) | (239,045,625 | ) | (240,158,183 | ) | (1,112,558 | ) | ||||||||||
| Korean Won, Expiring 03/16/16* | Credit Suisse International | KRW | (282,049,931,000 | ) | (239,045,753 | ) | (240,158,183 | ) | (1,112,430 | ) | ||||||||||
| Mexican Peso, Expiring 03/16/16 | CitiBank | MXN | (3,294,437,000 | ) | (193,445,536 | ) | (190,165,931 | ) | 3,279,605 | |||||||||||
| Mexican Peso, Expiring 03/16/16 | Credit Suisse International | MXN | (3,294,437,000 | ) | (193,445,149 | ) | (190,165,931 | ) | 3,279,218 | |||||||||||
| Malaysian Ringgit, Expiring 03/16/16* | CitiBank | MYR | (78,594,500 | ) | (18,428,771 | ) | (18,211,872 | ) | 216,899 | |||||||||||
| Malaysian Ringgit, Expiring 03/16/16* | Credit Suisse International | MYR | (78,594,500 | ) | (18,428,779 | ) | (18,211,871 | ) | 216,908 | |||||||||||
| Norwegian Krone, Expiring 03/16/16 | CitiBank | NOK | (3,516,835,503 | ) | (404,846,924 | ) | (397,031,290 | ) | 7,815,634 | |||||||||||
| Norwegian Krone, Expiring 03/16/16 | Credit Suisse International | NOK | (3,516,835,501 | ) | (404,848,052 | ) | (397,031,290 | ) | 7,816,762 | |||||||||||
| New Zealand Dollar, Expiring 03/16/16 | CitiBank | NZD | (96,020,000 | ) | (63,538,336 | ) | (65,383,800 | ) | (1,845,464 | ) | ||||||||||
| New Zealand Dollar, Expiring 03/16/16 | Credit Suisse International | NZD | (96,020,000 | ) | (63,538,337 | ) | (65,383,800 | ) | (1,845,463 | ) | ||||||||||
| The accompanying notes are an integral part of these financial statements. | (Continued) |
| AQR Funds | Annual Report | December 2015 | ||||||||||||||
143
Table of Contents
| Consolidated Schedule of Investments | December 31, 2015 |
| AQR MANAGED FUTURES STRATEGY FUND |
| SALES CONTRACTS | COUNTERPARTY | CURRENCY | CURRENCY AMOUNT SOLD | VALUE AT SETTLEMENT DATE | VALUE AT DECEMBER 31, 2015 | UNREALIZED APPRECIATION (DEPRECIATION) | ||||||||||||||
| Philippine Peso, Expiring 03/16/16* | CitiBank | PHP | (2,271,967,500 | ) | $ (47,613,510 | ) | $ (48,086,292 | ) | $ (472,782 | ) | ||||||||||
| Philippine Peso, Expiring 03/16/16* | Credit Suisse International | PHP | (2,271,967,500 | ) | (47,613,510 | ) | (48,086,292 | ) | (472,782 | ) | ||||||||||
| Poland Zloty, Expiring 03/16/16 | CitiBank | PLN | (712,910,000 | ) | (178,786,371 | ) | (181,485,589 | ) | (2,699,218 | ) | ||||||||||
| Poland Zloty, Expiring 03/16/16 | Credit Suisse International | PLN | (712,910,000 | ) | (178,786,227 | ) | (181,485,589 | ) | (2,699,362 | ) | ||||||||||
| Swedish Krona, Expiring 03/16/16 | CitiBank | SEK | (1,297,359,000 | ) | (151,776,076 | ) | (154,009,763 | ) | (2,233,687 | ) | ||||||||||
| Swedish Krona, Expiring 03/16/16 | Credit Suisse International | SEK | (1,297,358,999 | ) | (151,775,705 | ) | (154,009,763 | ) | (2,234,058 | ) | ||||||||||
| Singapore Dollar, Expiring 03/16/16 | CitiBank | SGD | (108,934,500 | ) | (77,041,327 | ) | (76,646,356 | ) | 394,971 | |||||||||||
| Singapore Dollar, Expiring 03/16/16 | Credit Suisse International | SGD | (108,934,500 | ) | (77,041,571 | ) | (76,646,355 | ) | 395,216 | |||||||||||
| Turkish Lira, Expiring 03/16/16 | CitiBank | TRY | (338,870,000 | ) | (112,390,767 | ) | (113,865,480 | ) | (1,474,713 | ) | ||||||||||
| Turkish Lira, Expiring 03/16/16 | Credit Suisse International | TRY | (338,870,000 | ) | (112,385,495 | ) | (113,865,480 | ) | (1,479,985 | ) | ||||||||||
| New Taiwan Dollar, Expiring 03/16/16* | CitiBank | TWD | (2,322,176,001 | ) | (70,885,157 | ) | (70,754,050 | ) | 131,107 | |||||||||||
| New Taiwan Dollar, Expiring 03/16/16* | Credit Suisse International | TWD | (2,322,176,000 | ) | (70,885,546 | ) | (70,754,050 | ) | 131,496 | |||||||||||
| South African Rand, Expiring 03/16/16 | CitiBank | ZAR | (3,170,445,000 | ) | (216,501,061 | ) | (202,286,387 | ) | 14,214,674 | |||||||||||
| South African Rand, Expiring 03/16/16 | Credit Suisse International | ZAR | (3,170,445,000 | ) | (216,489,781 | ) | (202,286,388 | ) | 14,203,393 | |||||||||||
|
|
|
|
|
| |||||||||||||||
| (13,213,738,145 | ) | (13,268,932,686 | ) | (55,194,541 | ) | |||||||||||||||
|
|
|
|
|
| |||||||||||||||
| $(3,613,812,431 | ) | $(3,655,456,740 | ) | $(41,644,309 | ) | |||||||||||||||
|
|
|
|
|
| |||||||||||||||
| * | Non-deliverable forward (See Note 4). |
AUD - Australian Dollar
BRL - Brazilian Real
CAD - Canadian Dollar
CHF - Swiss Franc
CLP - Chilean Peso
COP - Colombian Peso
CZK - Czech Republic Koruna
EUR - Euro
GBP - British Pound
HKD - Hong Kong Dollar
HUF - Hungarian Forint
IDR - Indonesian Rupiah
ILS - Israeli Shekel
INR - Indian Rupee
JPY - Japanese Yen
KRW - Korean Won
MXN - Mexican Peso
MYR - Malaysian Ringgit
NOK - Norwegian Krone
NZD - New Zealand Dollar
PHP - Philippine Peso
PLN - Poland Zloty
SEK - Swedish Krona
SGD - Singapore Dollar
TRY - Turkish Lira
TWD - New Taiwan Dollar
USD - United States Dollar
ZAR - South African Rand
| The accompanying notes are an integral part of these financial statements. | (Continued) |
| AQR Funds | Annual Report | December 2015 | ||||||||||||||
144
Table of Contents
| Consolidated Schedule of Investments | December 31, 2015 |
| AQR MANAGED FUTURES STRATEGY FUND |
Collateral pledged to, or (received from), each counterparty at December 31, 2015 was as follows:
| COUNTERPARTY | OVER THE COUNTER | EXCHANGE TRADED/ CENTRALLY CLEARED | TOTAL | |||||||||
| Bank of America | ||||||||||||
| Money Market Funds | $8,900,734 | $— | $8,900,734 | |||||||||
| ||||||||||||
| Barclays Capital | ||||||||||||
| Cash | — | 158,312,402 | 158,312,402 | |||||||||
| ||||||||||||
| CitiBank | ||||||||||||
| Money Market Funds | 101,490,246 | — | 101,490,246 | |||||||||
| ||||||||||||
| Credit Suisse International | ||||||||||||
| Money Market Funds | 22,740,128 | — | 22,740,128 | |||||||||
| ||||||||||||
| Goldman Sachs | ||||||||||||
| Cash | — | 11,836,880 | 11,836,880 | |||||||||
| U.S. Treasury Bills | — | 39,159,675 | 39,159,675 | |||||||||
| ||||||||||||
| J.P. Morgan | ||||||||||||
| Cash | — | 50,906,776 | 50,906,776 | |||||||||
| U.S. Treasury Bills | — | 82,373,833 | 82,373,833 | |||||||||
| ||||||||||||
| Morgan Stanley and Co., International PLC | ||||||||||||
| Cash | — | (1,500,059 | ) | (1,500,059 | ) | |||||||
| Money Market Funds | 25,810,103 | — | 25,810,103 | |||||||||
| U.S. Treasury Bills | — | 27,798,572 | 27,798,572 | |||||||||
| ||||||||||||
Collateral pledged to, or (received from), each counterparty for the Subsidiary (See Note 2) at December 31, 2015 was as follows:
| COUNTERPARTY | OVER THE COUNTER | EXCHANGE TRADED/ CENTRALLY CLEARED | TOTAL | |||||||||
| CitiBank | ||||||||||||
| Money Market Funds | $6,910,042 | $— | $6,910,042 | |||||||||
| ||||||||||||
| Deutsche Bank | ||||||||||||
| Money Market Funds | 130,085 | — | 130,085 | |||||||||
| ||||||||||||
| Goldman Sachs | ||||||||||||
| Cash | — | (23,074,031 | ) | (23,074,031 | ) | |||||||
| U.S. Treasury Bills | — | 48,216,525 | 48,216,525 | |||||||||
| ||||||||||||
| J.P. Morgan | ||||||||||||
| Cash | — | 22,750,100 | 22,750,100 | |||||||||
| U.S. Treasury Bills | — | 27,989,024 | 27,989,024 | |||||||||
| ||||||||||||
| Macquarie Capital | ||||||||||||
| Money Market Funds | 8,070,000 | — | 8,070,000 | |||||||||
| ||||||||||||
| Merrill Lynch | ||||||||||||
| Money Market Funds | 341,397 | — | 341,397 | |||||||||
| ||||||||||||
| Morgan Stanley and Co., International PLC | ||||||||||||
| Cash | — | (36,736,299 | ) | (36,736,299 | ) | |||||||
| U.S. Treasury Bills | — | 146,196,971 | 146,196,971 | |||||||||
| ||||||||||||
| Societe Generale | ||||||||||||
| Money Market Funds | 1,860,000 | — | 1,860,000 | |||||||||
| ||||||||||||
| The accompanying notes are an integral part of these financial statements. |
| AQR Funds | Annual Report | December 2015 | ||||||||||||||
145
Table of Contents
| Consolidated Schedule of Investments | December 31, 2015 |
| AQR MANAGED FUTURES STRATEGY HV FUND |
| MONEY MARKET FUNDS - 20.4% | SHARES | VALUE (Note 5) | ||||||
| J.P. Morgan U.S. Treasury Plus Money Market Fund - IM Shares, 0.129% ^(a)(b) | 104,569,444 | $ | 104,569,444 | |||||
| J.P. Morgan U.S. Treasury Plus Money Market Fund - Institutional Shares, 0.070% ^(a)(b) | 3,720,046 | 3,720,046 | ||||||
|
| |||||||
TOTAL MONEY MARKET FUNDS | 108,289,490 | |||||||
|
| |||||||
| SHORT-TERM INVESTMENTS - 73.7% | PRINCIPAL AMOUNT (000’s) | |||||||
| U.S. Treasury Bill, 0.141%, 01/28/2016 (c) | $ | 102,595 | 102,586,074 | |||||
| U.S. Treasury Bill, 0.161%, 02/04/2016 (c) | 2,838 | 2,837,753 | ||||||
| U.S. Treasury Bill, 0.241%, 02/11/2016 ^(c)(d) | 144,384 | 144,363,930 | ||||||
| U.S. Treasury Bill, 0.264%, 03/03/2016 ^(c) | 45,929 | 45,920,917 | ||||||
| U.S. Treasury Bill, 0.258%, 03/17/2016 ^(c) | 10,213 | 10,210,927 | ||||||
| U.S. Treasury Bill, 0.066%, 04/07/2016 ^(c) | 24,989 | 24,979,204 | ||||||
| U.S. Treasury Bill, 0.327%, 05/19/2016 ^(c) | 56,763 | 56,691,309 | ||||||
| U.S. Treasury Bill, 0.582%, 06/16/2016 (c) | 2,525 | 2,519,675 | ||||||
|
| |||||||
TOTAL SHORT-TERM | 390,109,789 | |||||||
|
| |||||||
TOTAL INVESTMENTS IN SECURITIES, AT VALUE - 94.1% | 498,399,279 | |||||||
|
| |||||||
| OTHER ASSETS IN EXCESS OF LIABILITIES - 5.9% (e) | 31,128,719 | |||||||
|
| |||||||
NET ASSETS - 100.0% |
| $ | 529,527,998 | |||||
|
| |||||||
| (a) | Represents annualized seven-day yield as of the close of the reporting period. |
| (b) | All or a portion of the security is pledged as collateral to the brokers for forward foreign currency exchange and swap contracts. |
| (c) | The rate shown is the effective yield at the date of purchase. |
| (d) | All or a portion of the security is pledged as collateral to the brokers for futures contracts. |
| (e) | Includes appreciation/(depreciation) on forward foreign currency exchange, futures and swap contracts. |
| ^ | All or a portion represents positions held in the respective Subsidiary (See Note 2). |
All securities are Level 2 with respect to ASC 820 (See Note 5).
Total return swap contracts outstanding as of December 31, 2015:
Over the Counter
| COUNTERPARTY | UNDERLYING REFERENCE INSTRUMENT | TERMINATION DATE | CURRENCY | NOTIONAL VALUE | UNREALIZED APPRECIATION (DEPRECIATION) | |||||||||
| Bank of America | Bovespa Index February Futures | 02/2016 | BRL | (23,882,679 | ) | $270,683 | ||||||||
| CitiBank | Cotton No. 2 March Futures^ | 03/2016 | USD | 1,643,345 | (29,705 | ) | ||||||||
| Bank of America | H-SHARES Index January Futures | 01/2016 | HKD | (90,662,902 | ) | 240,243 | ||||||||
| Bank of America | KOSPI Index 200 March Futures | 03/2016 | KRW | 15,060,841,200 | 73,615 | |||||||||
| Deutsche Bank | Live Cattle February Futures^ | 02/2016 | USD | (910,585 | ) | (19,655 | ) | |||||||
| Macquarie Capital | Live Cattle February Futures^ | 02/2016 | USD | (8,577,231 | ) | (177,969 | ) | |||||||
| Societe Generale | Live Cattle February Futures^ | 02/2016 | USD | (3,163,112 | ) | (65,368 | ) | |||||||
| Bank of America | MSCI Taiwan Stock Index January Futures | 01/2016 | USD | (10,136,791 | ) | 91,592 | ||||||||
| Goldman Sachs | SGX FTSE China A50 Index January Futures | 01/2016 | USD | 3,088,913 | (52,613 | ) | ||||||||
| Bank of America | SGX S&P CNX Nifty Index January Futures | 01/2016 | USD | (760,948 | ) | (2,060 | ) | |||||||
| CitiBank | Soybean March Futures^ | 03/2016 | USD | 2,608,333 | (101,930 | ) | ||||||||
| The accompanying notes are an integral part of these financial statements. | (Continued) |
| AQR Funds | Annual Report | December 2015 | ||||||||||||||
146
Table of Contents
| Consolidated Schedule of Investments | December 31, 2015 |
| AQR MANAGED FUTURES STRATEGY HV FUND |
| COUNTERPARTY | UNDERLYING REFERENCE INSTRUMENT | TERMINATION DATE | CURRENCY | NOTIONAL VALUE | UNREALIZED APPRECIATION (DEPRECIATION) | |||||||||
| CitiBank | Soybean March Futures^ | 03/2016 | USD | (7,792,158 | ) | $ 143,436 | ||||||||
| Macquarie Capital | Soybean March Futures^ | 03/2016 | USD | (1,812,416 | ) | 40,703 | ||||||||
| CitiBank | Soybean Meal March Futures^ | 03/2016 | USD | (6,130,770 | ) | 263,220 | ||||||||
| Deutsche Bank | Soybean Meal March Futures^ | 03/2016 | USD | (3,215,032 | ) | 161,782 | ||||||||
| Societe Generale | Soybean Meal March Futures^ | 03/2016 | USD | (1,951,926 | ) | 93,426 | ||||||||
| Bank of America | Swiss Market Index March Futures | 03/2016 | CHF | (8,155,896 | ) | (242,021 | ) | |||||||
| Bank of America | Taiwan Stock Exchange January Futures | 01/2016 | TWD | (41,670,591 | ) | (41,493 | ) | |||||||
| CitiBank | Wheat March Futures^ | 03/2016 | USD | (2,081,696 | ) | 13,695 | ||||||||
| Deutsche Bank | Wheat March Futures^ | 03/2016 | USD | (733,815 | ) | 28,815 | ||||||||
|
| |||||||||||||
| $688,396 | ||||||||||||||
|
| |||||||||||||
| ^ | Represents positions held in the respective Subsidiary (See Note 2). |
Open futures contracts outstanding at December 31, 2015:
Exchange Traded
| NUMBER OF CONTRACTS | COUNTERPARTY | DESCRIPTION | EXPIRATION DATE | VALUE AT TRADE DATE | VALUE AT DECEMBER 31, 2015 | UNREALIZED APPRECIATION (DEPRECIATION) | ||||||||||||||
| Long Contracts: | ||||||||||||||||||||
| 163 | Goldman Sachs | Cocoa Futures^ | 03/2016 | $5,479,285 | $5,435,463 | $(43,822 | ) | |||||||||||||
| 109 | Morgan Stanley and Co., International PLC | Cocoa Futures^ | 03/2016 | 3,615,492 | 3,499,990 | (115,502 | ) | |||||||||||||
| 35 | Morgan Stanley and Co., International PLC | Cotton No. 2 Futures^ | 03/2016 | 1,102,837 | 1,107,400 | 4,563 | ||||||||||||||
| 6 | J.P. Morgan | LME Aluminum Futures^ | 01/2016 | 235,177 | 225,037 | (10,140 | ) | |||||||||||||
| 4 | J.P. Morgan | LME Aluminum Futures^ | 01/2016 | 156,210 | 150,060 | (6,150 | ) | |||||||||||||
| 4 | J.P. Morgan | LME Aluminum Futures^ | 01/2016 | 157,962 | 150,095 | (7,867 | ) | |||||||||||||
| 1 | J.P. Morgan | LME Aluminum Futures^ | 01/2016 | 40,628 | 37,533 | (3,095 | ) | |||||||||||||
| 5 | J.P. Morgan | LME Aluminum Futures^ | 01/2016 | 188,902 | 188,188 | (714 | ) | |||||||||||||
| 5 | J.P. Morgan | LME Aluminum Futures^ | 01/2016 | 186,275 | 188,188 | 1,913 | ||||||||||||||
| 3 | J.P. Morgan | LME Aluminum Futures^ | 01/2016 | 111,907 | 112,935 | 1,028 | ||||||||||||||
| 10 | J.P. Morgan | LME Aluminum Futures^ | 01/2016 | 368,243 | 376,527 | 8,284 | ||||||||||||||
| 5 | J.P. Morgan | LME Aluminum Futures^ | 02/2016 | 186,046 | 188,415 | 2,369 | ||||||||||||||
| 1 | J.P. Morgan | LME Aluminum Futures^ | 02/2016 | 37,628 | 37,691 | 63 | ||||||||||||||
| 6 | J.P. Morgan | LME Aluminum Futures^ | 02/2016 | 224,377 | 226,234 | 1,857 | ||||||||||||||
| 1 | J.P. Morgan | LME Aluminum Futures^ | 03/2016 | 36,822 | 37,789 | 967 | ||||||||||||||
| 4 | J.P. Morgan | LME Aluminum Futures^ | 03/2016 | 151,032 | 151,175 | 143 | ||||||||||||||
| 7 | J.P. Morgan | LME Aluminum Futures^ | 03/2016 | 264,511 | 264,468 | (43 | ) | |||||||||||||
| 2 | J.P. Morgan | LME Aluminum Futures^ | 03/2016 | 74,219 | 75,538 | 1,319 | ||||||||||||||
| 29 | J.P. Morgan | LME Aluminum Futures^ | 03/2016 | 1,094,032 | 1,093,119 | (913 | ) | |||||||||||||
| 15 | J.P. Morgan | LME Aluminum Futures^ | 03/2016 | 571,699 | 565,155 | (6,544 | ) | |||||||||||||
| 3 | J.P. Morgan | LME Copper Futures^ | 01/2016 | 391,346 | 353,250 | (38,096 | ) | |||||||||||||
| 2 | J.P. Morgan | LME Copper Futures^ | 01/2016 | 259,823 | 235,505 | (24,318 | ) | |||||||||||||
| 2 | J.P. Morgan | LME Copper Futures^ | 02/2016 | 249,005 | 235,563 | (13,442 | ) | |||||||||||||
| 2 | J.P. Morgan | LME Copper Futures^ | 02/2016 | 246,505 | 235,563 | (10,942 | ) | |||||||||||||
| 3 | J.P. Morgan | LME Copper Futures^ | 02/2016 | 369,384 | 353,344 | (16,040 | ) | |||||||||||||
| 1 | J.P. Morgan | LME Copper Futures^ | 02/2016 | 118,359 | 117,782 | (577 | ) | |||||||||||||
| 4 | J.P. Morgan | LME Copper Futures^ | 02/2016 | 462,675 | 471,111 | 8,436 | ||||||||||||||
| 9 | J.P. Morgan | LME Copper Futures^ | 02/2016 | 1,040,066 | 1,059,971 | 19,905 | ||||||||||||||
| 4 | J.P. Morgan | LME Copper Futures^ | 02/2016 | 446,110 | 471,070 | 24,960 | ||||||||||||||
| The accompanying notes are an integral part of these financial statements. | (Continued) |
| AQR Funds | Annual Report | December 2015 | ||||||||||||||
147
Table of Contents
| Consolidated Schedule of Investments | December 31, 2015 |
| AQR MANAGED FUTURES STRATEGY HV FUND |
| NUMBER OF CONTRACTS | COUNTERPARTY | DESCRIPTION | EXPIRATION DATE | VALUE AT TRADE DATE | VALUE AT DECEMBER 31, 2015 | UNREALIZED APPRECIATION (DEPRECIATION) | ||||||||||||||
| Long Contracts: (continued) | ||||||||||||||||||||
| 2 | J.P. Morgan | LME Copper Futures^ | 03/2016 | $ 227,505 | $ 235,488 | $ 7,983 | ||||||||||||||
| 2 | J.P. Morgan | LME Copper Futures^ | 03/2016 | 231,455 | 235,478 | 4,023 | ||||||||||||||
| 11 | J.P. Morgan | LME Nickel Futures^ | 02/2016 | 642,297 | 580,553 | (61,744 | ) | |||||||||||||
| 4 | J.P. Morgan | LME Nickel Futures^ | 02/2016 | 229,930 | 211,168 | (18,762 | ) | |||||||||||||
| 1 | J.P. Morgan | LME Nickel Futures^ | 03/2016 | 52,082 | 52,917 | 835 | ||||||||||||||
| 4 | J.P. Morgan | LME Zinc Futures^ | 01/2016 | 187,160 | 159,613 | (27,547 | ) | |||||||||||||
| 8 | J.P. Morgan | LME Zinc Futures^ | 01/2016 | 365,112 | 319,324 | (45,788 | ) | |||||||||||||
| 3 | J.P. Morgan | LME Zinc Futures^ | 02/2016 | 124,207 | 120,182 | (4,025 | ) | |||||||||||||
| 7 | J.P. Morgan | LME Zinc Futures^ | 02/2016 | 290,517 | 280,532 | (9,985 | ) | |||||||||||||
| 3 | J.P. Morgan | LME Zinc Futures^ | 02/2016 | 120,907 | 120,239 | (668 | ) | |||||||||||||
| 1 | J.P. Morgan | LME Zinc Futures^ | 03/2016 | 38,552 | 40,171 | 1,619 | ||||||||||||||
| 1 | J.P. Morgan | LME Zinc Futures^ | 03/2016 | 38,252 | 40,179 | 1,927 | ||||||||||||||
| 1 | J.P. Morgan | LME Zinc Futures^ | 03/2016 | 37,003 | 40,225 | 3,222 | ||||||||||||||
| 2 | J.P. Morgan | LME Zinc Futures^ | 03/2016 | 75,856 | 80,450 | 4,594 | ||||||||||||||
| 63 | Morgan Stanley and Co., International PLC | Soybean Oil Futures^ | 03/2016 | 1,169,533 | 1,162,350 | (7,183 | ) | |||||||||||||
| 89 | Morgan Stanley and Co., International PLC | Sugar #11 (World Markets) Futures^ | 02/2016 | 1,528,857 | 1,519,123 | (9,734 | ) | |||||||||||||
| 33 | Barclays Capital | Amsterdam Index Futures | 01/2016 | 3,115,989 | 3,169,191 | 53,202 | ||||||||||||||
| 197 | Barclays Capital | CAC40 Index Futures | 01/2016 | 9,867,467 | 9,930,553 | 63,086 | ||||||||||||||
| 45 | Barclays Capital | DAX Index Futures | 03/2016 | 12,783,870 | 13,169,780 | 385,910 | ||||||||||||||
| 141 | Barclays Capital | E-Mini DJIA CBOT Futures | 03/2016 | 12,207,572 | 12,225,405 | 17,833 | ||||||||||||||
| 296 | Barclays Capital | Euro Stoxx 50 Index Futures | 03/2016 | 10,510,255 | 10,557,472 | 47,217 | ||||||||||||||
| 26 | Barclays Capital | FTSE/MIB Index Futures | 03/2016 | 3,008,583 | 3,029,272 | 20,689 | ||||||||||||||
| 547 | Barclays Capital | NASDAQ 100 E-Mini Futures | 03/2016 | 50,031,026 | 50,189,985 | 158,959 | ||||||||||||||
| 169 | J.P. Morgan | Nikkei 225 Futures | 03/2016 | 27,592,739 | 26,757,103 | (835,636 | ) | |||||||||||||
| 123 | Barclays Capital | S&P 500 E-Mini Futures | 03/2016 | 12,419,818 | 12,517,710 | 97,892 | ||||||||||||||
| 408 | J.P. Morgan | SGX FTSE China A50 Index Futures | 01/2016 | 4,367,028 | 4,271,760 | (95,268 | ) | |||||||||||||
| 241 | Barclays Capital | TOPIX Index Futures | 03/2016 | 31,440,849 | 31,028,537 | (412,312 | ) | |||||||||||||
| 149 | Goldman Sachs | 10-Year Japanese Government Bond Futures | 03/2016 | 184,487,903 | 184,757,769 | 269,866 | ||||||||||||||
| 286 | J.P. Morgan | 3-Month Euro Euribor Futures | 06/2016 | 77,891,517 | 77,842,488 | (49,029 | ) | |||||||||||||
| 253 | J.P. Morgan | 3-Month Euro Euribor Futures | 09/2016 | 68,901,107 | 68,864,100 | (37,007 | ) | |||||||||||||
| 311 | J.P. Morgan | 3-Month Euro Euribor Futures | 12/2016 | 84,664,164 | 84,642,677 | (21,487 | ) | |||||||||||||
| 356 | J.P. Morgan | 3-Month Euro Euribor Futures | 03/2017 | 96,890,234 | 96,870,666 | (19,568 | ) | |||||||||||||
| 374 | J.P. Morgan | 3-Month Euro Euribor Futures | 06/2017 | 101,755,938 | 101,727,976 | (27,962 | ) | |||||||||||||
| 407 | J.P. Morgan | 3-Month Euro Euribor Futures | 09/2017 | 110,747,655 | 110,648,686 | (98,969 | ) | |||||||||||||
| 247 | J.P. Morgan | 3-Month Euro Euribor Futures | 12/2017 | 67,163,174 | 67,110,166 | (53,008 | ) | |||||||||||||
| 33 | J.P. Morgan | 90-Day Sterling Futures | 03/2016 | 6,040,464 | 6,042,157 | 1,693 | ||||||||||||||
| 310 | J.P. Morgan | 90-Day Sterling Futures | 06/2016 | 56,649,875 | 56,702,523 | 52,648 | ||||||||||||||
| 156 | J.P. Morgan | 90-Day Sterling Futures | 09/2016 | 28,520,544 | 28,496,802 | (23,742 | ) | |||||||||||||
| 177 | J.P. Morgan | 90-Day Sterling Futures | 12/2016 | 32,330,588 | 32,283,984 | (46,604 | ) | |||||||||||||
| 173 | J.P. Morgan | 90-Day Sterling Futures | 03/2017 | 31,572,840 | 31,509,772 | (63,068 | ) | |||||||||||||
| 149 | J.P. Morgan | 90-Day Sterling Futures | 06/2017 | 27,162,924 | 27,100,034 | (62,890 | ) | |||||||||||||
| 82 | J.P. Morgan | 90-Day Sterling Futures | 09/2017 | 14,935,710 | 14,897,491 | (38,219 | ) | |||||||||||||
| 88 | J.P. Morgan | 90-Day Sterling Futures | 12/2017 | 16,005,446 | 15,971,337 | (34,109 | ) | |||||||||||||
| 104 | Goldman Sachs | Canadian 10-Year Bond Futures | 03/2016 | 10,464,679 | 10,596,921 | 132,242 | ||||||||||||||
| 141 | J.P. Morgan | Canadian 3-Month Bank Acceptance Futures | 06/2016 | 25,284,797 | 25,281,564 | (3,233 | ) | |||||||||||||
| 281 | J.P. Morgan | Canadian 3-Month Bank Acceptance Futures | 09/2016 | 50,393,569 | 50,386,364 | (7,205 | ) | |||||||||||||
| 247 | Goldman Sachs | Euro - Bobl Futures | 03/2016 | 35,351,225 | 35,075,388 | (275,837 | ) | |||||||||||||
| 62 | Goldman Sachs | Euro - OAT Futures | 03/2016 | 10,243,549 | 10,110,143 | (133,406 | ) | |||||||||||||
| The accompanying notes are an integral part of these financial statements. | (Continued) |
| AQR Funds | Annual Report | December 2015 | ||||||||||||||
148
Table of Contents
| Consolidated Schedule of Investments | December 31, 2015 |
| AQR MANAGED FUTURES STRATEGY HV FUND |
| NUMBER OF CONTRACTS | COUNTERPARTY | DESCRIPTION | EXPIRATION DATE | VALUE AT TRADE DATE | VALUE AT DECEMBER 31, 2015 | UNREALIZED APPRECIATION (DEPRECIATION) | ||||||||||||||
| Long Contracts: (continued) | ||||||||||||||||||||
| 545 | Goldman Sachs | Euro - SCHATZ Futures | 03/2016 | $ 66,180,208 | $ 66,045,003 | $ (135,205 | ) | |||||||||||||
| 35 | J.P. Morgan | Euro CHF 3-Month LIFFE Futures | 06/2016 | 8,823,066 | 8,804,164 | (18,902 | ) | |||||||||||||
| 41 | J.P. Morgan | Euro CHF 3-Month LIFFE Futures | 09/2016 | 10,334,147 | 10,313,448 | (20,699 | ) | |||||||||||||
| 39 | J.P. Morgan | Euro CHF 3-Month LIFFE Futures | 12/2016 | 9,825,866 | 9,809,380 | (16,486 | ) | |||||||||||||
| 509 | Goldman Sachs | Euro - BTP Italian Government Bond Futures | 03/2016 | 76,672,431 | 76,291,239 | (381,192 | ) | |||||||||||||
| 131 | Goldman Sachs | Euro - Bund Futures | 03/2016 | 22,765,675 | 22,482,162 | (283,513 | ) | |||||||||||||
| 92 | Goldman Sachs | Long Gilt Futures | 03/2016 | 15,928,424 | 15,837,094 | (91,330 | ) | |||||||||||||
|
|
|
|
|
| |||||||||||||||
| 1,548,558,697 | 1,546,190,417 | (2,368,280 | ) | |||||||||||||||||
|
|
|
|
|
| |||||||||||||||
| Short Contracts: | ||||||||||||||||||||
| 479 | Goldman Sachs | Brent Crude Futures^ | 01/2016 | $(17,999,008 | ) | $(18,043,930 | ) | $(44,922 | ) | |||||||||||
| 91 | Morgan Stanley and Co., International PLC | Coffee ‘C’ Futures^ | 03/2016 | (4,179,953 | ) | (4,323,637 | ) | (143,684 | ) | |||||||||||
| 211 | Morgan Stanley and Co., International PLC | Copper Futures^ | 03/2016 | (10,950,561 | ) | (11,262,125 | ) | (311,564 | ) | |||||||||||
| 745 | Morgan Stanley and Co., International PLC | Corn Futures^ | 03/2016 | (13,659,654 | ) | (13,363,438 | ) | 296,216 | ||||||||||||
| 382 | Goldman Sachs | Gas Oil Futures^ | 02/2016 | (14,585,992 | ) | (12,768,350 | ) | 1,817,642 | ||||||||||||
| 116 | Morgan Stanley and Co., International PLC | Gasoline RBOB Futures^ | 01/2016 | (6,102,743 | ) | (6,192,312 | ) | (89,569 | ) | |||||||||||
| 580 | Morgan Stanley and Co., International PLC | Gold 100 OZ Futures^ | 02/2016 | (62,500,587 | ) | (61,491,600 | ) | 1,008,987 | ||||||||||||
| 136 | Morgan Stanley and Co., International PLC | Hard Red Winter Wheat Futures^ | 03/2016 | (3,307,010 | ) | (3,185,800 | ) | 121,210 | ||||||||||||
| 181 | Morgan Stanley and Co., International PLC | Heating Oil ULSD Futures^ | 01/2016 | (9,645,894 | ) | (8,543,888 | ) | 1,102,006 | ||||||||||||
| 101 | Morgan Stanley and Co., International PLC | Lean Hogs Futures^ | 02/2016 | (2,329,519 | ) | (2,415,921 | ) | (86,402 | ) | |||||||||||
| 6 | J.P. Morgan | LME Aluminum Futures^ | 01/2016 | (234,566 | ) | (225,037 | ) | 9,529 | ||||||||||||
| 4 | J.P. Morgan | LME Aluminum Futures^ | 01/2016 | (155,550 | ) | (150,060 | ) | 5,490 | ||||||||||||
| 4 | J.P. Morgan | LME Aluminum Futures^ | 01/2016 | (156,726 | ) | (150,095 | ) | 6,631 | ||||||||||||
| 1 | J.P. Morgan | LME Aluminum Futures^ | 01/2016 | (40,406 | ) | (37,532 | ) | 2,874 | ||||||||||||
| 5 | J.P. Morgan | LME Aluminum Futures^ | 01/2016 | (188,621 | ) | (188,188 | ) | 433 | ||||||||||||
| 5 | J.P. Morgan | LME Aluminum Futures^ | 01/2016 | (185,682 | ) | (188,188 | ) | (2,506 | ) | |||||||||||
| 3 | J.P. Morgan | LME Aluminum Futures^ | 01/2016 | (110,940 | ) | (112,935 | ) | (1,995 | ) | |||||||||||
| 10 | J.P. Morgan | LME Aluminum Futures^ | 01/2016 | (368,657 | ) | (376,528 | ) | (7,871 | ) | |||||||||||
| 5 | J.P. Morgan | LME Aluminum Futures^ | 02/2016 | (185,805 | ) | (188,415 | ) | (2,610 | ) | |||||||||||
| 1 | J.P. Morgan | LME Aluminum Futures^ | 02/2016 | (37,555 | ) | (37,691 | ) | (136 | ) | |||||||||||
| 6 | J.P. Morgan | LME Aluminum Futures^ | 02/2016 | (224,260 | ) | (226,234 | ) | (1,974 | ) | |||||||||||
| 1 | J.P. Morgan | LME Aluminum Futures^ | 03/2016 | (36,997 | ) | (37,789 | ) | (792 | ) | |||||||||||
| 4 | J.P. Morgan | LME Aluminum Futures^ | 03/2016 | (150,990 | ) | (151,175 | ) | (185 | ) | |||||||||||
| 7 | J.P. Morgan | LME Aluminum Futures^ | 03/2016 | (263,883 | ) | (264,469 | ) | (586 | ) | |||||||||||
| 2 | J.P. Morgan | LME Aluminum Futures^ | 03/2016 | (73,695 | ) | (75,537 | ) | (1,842 | ) | |||||||||||
| 139 | J.P. Morgan | LME Aluminum Futures^ | 03/2016 | (5,026,177 | ) | (5,239,431 | ) | (213,254 | ) | |||||||||||
| 15 | J.P. Morgan | LME Aluminum Futures^ | 03/2016 | (567,713 | ) | (565,155 | ) | 2,558 | ||||||||||||
| 3 | J.P. Morgan | LME Copper Futures^ | 01/2016 | (391,118 | ) | (353,250 | ) | 37,868 | ||||||||||||
| 2 | J.P. Morgan | LME Copper Futures^ | 01/2016 | (260,994 | ) | (235,505 | ) | 25,489 | ||||||||||||
| The accompanying notes are an integral part of these financial statements. | (Continued) |
| AQR Funds | Annual Report | December 2015 | ||||||||||||||
149
Table of Contents
| Consolidated Schedule of Investments | December 31, 2015 |
| AQR MANAGED FUTURES STRATEGY HV FUND |
| NUMBER OF CONTRACTS | COUNTERPARTY | DESCRIPTION | EXPIRATION DATE | VALUE AT TRADE DATE | VALUE AT DECEMBER 31, 2015 | UNREALIZED APPRECIATION (DEPRECIATION) | ||||||||||||||
| Short Contracts: (continued) | ||||||||||||||||||||
| 2 | J.P. Morgan | LME Copper Futures^ | 02/2016 | $ (248,973 | ) | $ (235,562 | ) | $ 13,411 | ||||||||||||
| 2 | J.P. Morgan | LME Copper Futures^ | 02/2016 | (246,291 | ) | (235,562 | ) | 10,729 | ||||||||||||
| 3 | J.P. Morgan | LME Copper Futures^ | 02/2016 | (369,020 | ) | (353,344 | ) | 15,676 | ||||||||||||
| 1 | J.P. Morgan | LME Copper Futures^ | 02/2016 | (118,651 | ) | (117,781 | ) | 870 | ||||||||||||
| 4 | J.P. Morgan | LME Copper Futures^ | 02/2016 | (464,067 | ) | (471,112 | ) | (7,045 | ) | |||||||||||
| 9 | J.P. Morgan | LME Copper Futures^ | 02/2016 | (1,039,659 | ) | (1,059,970 | ) | (20,311 | ) | |||||||||||
| 4 | J.P. Morgan | LME Copper Futures^ | 02/2016 | (447,312 | ) | (471,070 | ) | (23,758 | ) | |||||||||||
| 2 | J.P. Morgan | LME Copper Futures^ | 03/2016 | (227,905 | ) | (235,488 | ) | (7,583 | ) | |||||||||||
| 2 | J.P. Morgan | LME Copper Futures^ | 03/2016 | (230,741 | ) | (235,478 | ) | (4,737 | ) | |||||||||||
| 65 | J.P. Morgan | LME Copper Futures^ | 03/2016 | (7,343,716 | ) | (7,650,907 | ) | (307,191 | ) | |||||||||||
| 11 | J.P. Morgan | LME Nickel Futures^ | 02/2016 | (642,493 | ) | (580,552 | ) | 61,941 | ||||||||||||
| 4 | J.P. Morgan | LME Nickel Futures^ | 02/2016 | (230,128 | ) | (211,168 | ) | 18,960 | ||||||||||||
| 42 | J.P. Morgan | LME Nickel Futures^ | 03/2016 | (2,136,965 | ) | (2,221,128 | ) | (84,163 | ) | |||||||||||
| 1 | J.P. Morgan | LME Nickel Futures^ | 03/2016 | (52,194 | ) | (52,917 | ) | (723 | ) | |||||||||||
| 4 | J.P. Morgan | LME Zinc Futures^ | 01/2016 | (184,190 | ) | (159,613 | ) | 24,577 | ||||||||||||
| 8 | J.P. Morgan | LME Zinc Futures^ | 01/2016 | (363,980 | ) | (319,324 | ) | 44,656 | ||||||||||||
| 3 | J.P. Morgan | LME Zinc Futures^ | 02/2016 | (124,480 | ) | (120,182 | ) | 4,298 | ||||||||||||
| 7 | J.P. Morgan | LME Zinc Futures^ | 02/2016 | (290,497 | ) | (280,532 | ) | 9,965 | ||||||||||||
| 3 | J.P. Morgan | LME Zinc Futures^ | 02/2016 | (120,504 | ) | (120,240 | ) | 264 | ||||||||||||
| 1 | J.P. Morgan | LME Zinc Futures^ | 03/2016 | (38,608 | ) | (40,172 | ) | (1,564 | ) | |||||||||||
| 1 | J.P. Morgan | LME Zinc Futures^ | 03/2016 | (38,145 | ) | (40,179 | ) | (2,034 | ) | |||||||||||
| 77 | J.P. Morgan | LME Zinc Futures^ | 03/2016 | (3,019,686 | ) | (3,097,325 | ) | (77,639 | ) | |||||||||||
| 1 | J.P. Morgan | LME Zinc Futures^ | 03/2016 | (37,123 | ) | (40,225 | ) | (3,102 | ) | |||||||||||
| 2 | J.P. Morgan | LME Zinc Futures^ | 03/2016 | (75,501 | ) | (80,450 | ) | (4,949 | ) | |||||||||||
| 311 | Morgan Stanley and Co., International PLC | Natural Gas Futures^ | 01/2016 | (6,553,035 | ) | (7,268,070 | ) | (715,035 | ) | |||||||||||
| 45 | Morgan Stanley and Co., International PLC | Nymex Palladium Futures^ | 03/2016 | (2,454,362 | ) | (2,529,000 | ) | (74,638 | ) | |||||||||||
| 83 | Morgan Stanley and Co., International PLC | Platinum Futures^ | 04/2016 | (3,611,310 | ) | (3,706,780 | ) | (95,470 | ) | |||||||||||
| 152 | Morgan Stanley and Co., International PLC | Silver Futures^ | 03/2016 | (10,686,477 | ) | (10,490,280 | ) | 196,197 | ||||||||||||
| 302 | Morgan Stanley and Co., International PLC | Soybean Futures^ | 03/2016 | (13,119,505 | ) | (13,050,175 | ) | 69,330 | ||||||||||||
| 102 | Morgan Stanley and Co., International PLC | Soybean Meal Futures^ | 03/2016 | (2,850,705 | ) | (2,708,100 | ) | 142,605 | ||||||||||||
| 198 | Morgan Stanley and Co., International PLC | Wheat Futures^ | 03/2016 | (4,878,477 | ) | (4,653,000 | ) | 225,477 | ||||||||||||
| 324 | Morgan Stanley and Co., International PLC | WTI Crude Futures^ | 01/2016 | (12,566,594 | ) | (12,000,960 | ) | 565,634 | ||||||||||||
| 1 | J.P. Morgan | E-Mini MSCI EAFE Index Futures | 03/2016 | (84,805 | ) | (84,910 | ) | (105 | ) | |||||||||||
| 276 | J.P. Morgan | E-Mini MSCI Emerging Markets Index Futures | 03/2016 | (10,516,783 | ) | (10,867,500 | ) | (350,717 | ) | |||||||||||
| 47 | Barclays Capital | E-Mini Russell 2000 Futures | 03/2016 | (5,278,070 | ) | (5,318,050 | ) | (39,980 | ) | |||||||||||
| 30 | Barclays Capital | FTSE 100 Index Futures | 03/2016 | (2,672,327 | ) | (2,741,128 | ) | (68,801 | ) | |||||||||||
| 41 | J.P. Morgan | FTSE/JSE Top 40 Index Futures | 03/2016 | (1,202,908 | ) | (1,226,740 | ) | (23,832 | ) | |||||||||||
| 28 | Barclays Capital | Hang Seng Index Futures | 01/2016 | (3,974,460 | ) | (3,957,910 | ) | 16,550 | ||||||||||||
| 113 | Barclays Capital | H-SHARES Index Futures | 01/2016 | (7,162,329 | ) | (7,075,212 | ) | 87,117 | ||||||||||||
| The accompanying notes are an integral part of these financial statements. | (Continued) |
| AQR Funds | Annual Report | December 2015 | ||||||||||||||
150
Table of Contents
| Consolidated Schedule of Investments | December 31, 2015 |
| AQR MANAGED FUTURES STRATEGY HV FUND |
| NUMBER OF CONTRACTS | COUNTERPARTY | DESCRIPTION | EXPIRATION DATE | VALUE AT TRADE DATE | VALUE AT DECEMBER 31, 2015 | UNREALIZED APPRECIATION (DEPRECIATION) | ||||||||||||||
| Short Contracts: (continued) | ||||||||||||||||||||
| 64 | Barclays Capital | IBEX 35 Index Futures | 01/2016 | $ (6,685,647 | ) | $ (6,625,732 | ) | $ 59,915 | ||||||||||||
| 127 | Barclays Capital | MSCI Singapore Index Futures | 01/2016 | (2,890,021 | ) | (2,898,456 | ) | (8,435 | ) | |||||||||||
| 56 | Barclays Capital | MSCI Taiwan Stock Index Futures | 01/2016 | (1,715,974 | ) | (1,704,640 | ) | 11,334 | ||||||||||||
| 122 | J.P. Morgan | OMXS30 Index Futures | 01/2016 | (2,063,445 | ) | (2,092,721 | ) | (29,276 | ) | |||||||||||
| 28 | Barclays Capital | S&P MID 400 E-Mini Futures | 03/2016 | (3,884,025 | ) | (3,901,800 | ) | (17,775 | ) | |||||||||||
| 176 | Barclays Capital | S&P/Toronto Stock Exchange 60 Index Futures | 03/2016 | (19,164,586 | ) | (19,356,566 | ) | (191,980 | ) | |||||||||||
| 124 | Barclays Capital | SGX S&P CNX Nifty Index Futures | 01/2016 | (1,965,959 | ) | (1,971,104 | ) | (5,145 | ) | |||||||||||
| 61 | Barclays Capital | SPI 200 Index Futures | 03/2016 | (5,508,091 | ) | (5,841,932 | ) | (333,841 | ) | |||||||||||
| 783 | J.P. Morgan | 90-Day EURODollar Futures | 06/2016 | (194,022,334 | ) | (193,988,250 | ) | 34,084 | ||||||||||||
| 521 | J.P. Morgan | 90-Day EURODollar Futures | 09/2016 | (128,879,356 | ) | (128,862,838 | ) | 16,518 | ||||||||||||
| 286 | J.P. Morgan | 90-Day EURODollar Futures | 12/2016 | (70,614,037 | ) | (70,620,550 | ) | (6,513 | ) | |||||||||||
| 195 | J.P. Morgan | 90-Day EURODollar Futures | 03/2017 | (48,075,186 | ) | (48,077,250 | ) | (2,064 | ) | |||||||||||
| 170 | J.P. Morgan | 90-Day EURODollar Futures | 06/2017 | (41,847,493 | ) | (41,849,750 | ) | (2,257 | ) | |||||||||||
| 150 | J.P. Morgan | 90-Day EURODollar Futures | 09/2017 | (36,872,045 | ) | (36,879,375 | ) | (7,330 | ) | |||||||||||
| 136 | J.P. Morgan | 90-Day EURODollar Futures | 12/2017 | (33,388,180 | ) | (33,396,500 | ) | (8,320 | ) | |||||||||||
| 28 | J.P. Morgan | Australia 10-Year Bond Futures | 03/2016 | (2,577,322 | ) | (2,589,060 | ) | (11,738 | ) | |||||||||||
| 1,196 | J.P. Morgan | Australia 3-Year Bond Futures | 03/2016 | (96,922,124 | ) | (97,146,432 | ) | (224,308 | ) | |||||||||||
| 5 | J.P. Morgan | Canadian 3-Month Bank Acceptance Futures | 03/2016 | (895,940 | ) | (896,193 | ) | (253 | ) | |||||||||||
| 81 | Morgan Stanley and Co., International PLC | CME Ultra Long Term U.S. Treasury Bond Futures | 03/2016 | (12,799,904 | ) | (12,853,687 | ) | (53,783 | ) | |||||||||||
| 39 | Goldman Sachs | Euro-Buxl 30-Year Bond Futures | 03/2016 | (6,434,073 | ) | (6,416,824 | ) | 17,249 | ||||||||||||
| 465 | Morgan Stanley and Co., International PLC | U.S. Treasury 10-Year Note Futures | 03/2016 | (58,463,620 | ) | (58,546,406 | ) | (82,786 | ) | |||||||||||
| 786 | Morgan Stanley and Co., International PLC | U.S. Treasury 2-Year Note Futures | 03/2016 | (170,726,047 | ) | (170,746,219 | ) | (20,172 | ) | |||||||||||
| 253 | Morgan Stanley and Co., International PLC | U.S. Treasury 5-Year Note Futures | 03/2016 | (29,905,630 | ) | (29,935,039 | ) | (29,409 | ) | |||||||||||
| 90 | Morgan Stanley and Co., International PLC | U.S. Treasury Long Bond Futures | 03/2016 | (13,804,701 | ) | (13,837,500 | ) | (32,799 | ) | |||||||||||
|
|
|
|
|
| |||||||||||||||
| (1,249,729,972 | ) | (1,247,537,135 | ) | 2,192,837 | ||||||||||||||||
|
|
|
|
|
| |||||||||||||||
| $298,828,725 | $298,653,282 | $(175,443 | ) | |||||||||||||||||
|
|
|
|
|
| |||||||||||||||
| ^ | Represents positions held in the respective Subsidiary (See Note 2). |
Forward foreign currency exchange contracts outstanding as of December 31, 2015:
Over the Counter
| PURCHASE CONTRACTS | COUNTERPARTY | CURRENCY | CURRENCY AMOUNT PURCHASED | VALUE AT SETTLEMENT DATE | VALUE AT DECEMBER 31, 2015 | UNREALIZED APPRECIATION (DEPRECIATION) | ||||||||||||||
| Australian Dollar, Expiring 03/16/16 | CitiBank | AUD | 40,275,000 | $29,252,728 | $29,243,587 | $(9,141 | ) | |||||||||||||
| Australian Dollar, Expiring 03/16/16 | Credit Suisse International | AUD | 40,275,000 | 29,252,993 | 29,243,587 | (9,406 | ) | |||||||||||||
| Brazilian Real, Expiring 03/16/16* | CitiBank | BRL | 15,891,500 | 4,082,056 | 3,923,701 | (158,355 | ) | |||||||||||||
| The accompanying notes are an integral part of these financial statements. | (Continued) |
| AQR Funds | Annual Report | December 2015 | ||||||||||||||
151
Table of Contents
| Consolidated Schedule of Investments | December 31, 2015 |
| AQR MANAGED FUTURES STRATEGY HV FUND |
| PURCHASE CONTRACTS | COUNTERPARTY | CURRENCY | CURRENCY AMOUNT PURCHASED | VALUE AT SETTLEMENT DATE | VALUE AT DECEMBER 31, 2015 | UNREALIZED APPRECIATION (DEPRECIATION) | ||||||||||||||
| Brazilian Real, Expiring 03/16/16* | Credit Suisse International | BRL | 15,891,500 | $ 4,082,048 | $ 3,923,701 | $ (158,347 | ) | |||||||||||||
| Canadian Dollar, Expiring 03/16/16 | CitiBank | CAD | 7,350,000 | 5,503,072 | 5,312,869 | (190,203 | ) | |||||||||||||
| Canadian Dollar, Expiring 03/16/16 | Credit Suisse International | CAD | 7,350,000 | 5,503,072 | 5,312,869 | (190,203 | ) | |||||||||||||
| Swiss Franc, Expiring 03/16/16 | Credit Suisse International | CHF | 5,000 | 4,951 | 5,007 | 56 | ||||||||||||||
| Chilean Peso, Expiring 03/16/16* | CitiBank | CLP | 626,766,500 | 891,395 | 877,314 | (14,081 | ) | |||||||||||||
| Chilean Peso, Expiring 03/16/16* | Credit Suisse International | CLP | 636,508,500 | 905,020 | 890,950 | (14,070 | ) | |||||||||||||
| Colombian Peso, Expiring 03/16/16* | CitiBank | COP | 363,621,000 | 115,071 | 113,628 | (1,443 | ) | |||||||||||||
| Colombian Peso, Expiring 03/16/16* | Credit Suisse International | COP | 363,621,000 | 115,071 | 113,628 | (1,443 | ) | |||||||||||||
| Czech Republic Koruna, Expiring 03/16/16 | CitiBank | CZK | 231,376,500 | 9,305,078 | 9,324,866 | 19,788 | ||||||||||||||
| Czech Republic Koruna, Expiring 03/16/16 | Credit Suisse International | CZK | 231,376,500 | 9,305,022 | 9,324,866 | 19,844 | ||||||||||||||
| Euro, Expiring 03/16/16 | CitiBank | EUR | 121,525,000 | 132,874,445 | 132,309,954 | (564,491 | ) | |||||||||||||
| Euro, Expiring 03/16/16 | Credit Suisse International | EUR | 121,525,000 | 132,874,445 | 132,309,954 | (564,491 | ) | |||||||||||||
| British Pound, Expiring 03/16/16 | CitiBank | GBP | 8,284,999 | 12,461,963 | 12,215,216 | (246,747 | ) | |||||||||||||
| British Pound, Expiring 03/16/16 | Credit Suisse International | GBP | 8,284,999 | 12,462,027 | 12,215,216 | (246,811 | ) | |||||||||||||
| Hungarian Forint, Expiring 03/16/16 | CitiBank | HUF | 916,785,500 | 3,162,695 | 3,155,485 | (7,210 | ) | |||||||||||||
| Hungarian Forint, Expiring 03/16/16 | Credit Suisse International | HUF | 916,785,500 | 3,164,155 | 3,155,485 | (8,670 | ) | |||||||||||||
| Indonesian Rupiah, Expiring 03/16/16* | CitiBank | IDR | 40,955,607,000 | 2,899,385 | 2,918,455 | 19,070 | ||||||||||||||
| Indonesian Rupiah, Expiring 03/16/16* | Credit Suisse International | IDR | 40,955,607,000 | 2,899,385 | 2,918,455 | 19,070 | ||||||||||||||
| Israeli Shekel, Expiring 03/16/16 | CitiBank | ILS | 12,837,500 | 3,331,115 | 3,304,191 | (26,924 | ) | |||||||||||||
| Israeli Shekel, Expiring 03/16/16 | Credit Suisse International | ILS | 12,837,500 | 3,329,774 | 3,304,191 | (25,583 | ) | |||||||||||||
| Indian Rupee, Expiring 03/16/16* | CitiBank | INR | 413,756,500 | 6,114,844 | 6,180,539 | 65,695 | ||||||||||||||
| Indian Rupee, Expiring 03/16/16* | Credit Suisse International | INR | 413,756,500 | 6,114,845 | 6,180,539 | 65,694 | ||||||||||||||
| Japanese Yen, Expiring 03/16/16 | CitiBank | JPY | 10,739,732,502 | 88,187,942 | 89,506,251 | 1,318,309 | ||||||||||||||
| Japanese Yen, Expiring 03/16/16 | Credit Suisse International | JPY | 10,739,732,502 | 88,187,967 | 89,506,251 | 1,318,284 | ||||||||||||||
| Korean Won, Expiring 03/16/16* | CitiBank | KRW | 5,543,052,000 | 4,775,651 | 4,719,765 | (55,886 | ) | |||||||||||||
| Korean Won, Expiring 03/16/16* | Credit Suisse International | KRW | 5,543,052,000 | 4,775,651 | 4,719,765 | (55,886 | ) | |||||||||||||
| Mexican Peso, Expiring 03/16/16 | CitiBank | MXN | 57,653,000 | 3,450,059 | 3,327,924 | (122,135 | ) | |||||||||||||
| The accompanying notes are an integral part of these financial statements. | (Continued) |
| AQR Funds | Annual Report | December 2015 | ||||||||||||||
152
Table of Contents
| Consolidated Schedule of Investments | December 31, 2015 |
| AQR MANAGED FUTURES STRATEGY HV FUND |
| PURCHASE CONTRACTS | COUNTERPARTY | CURRENCY | CURRENCY AMOUNT PURCHASED | VALUE AT SETTLEMENT DATE | VALUE AT DECEMBER 31, 2015 | UNREALIZED APPRECIATION (DEPRECIATION) | ||||||||||||||
| Mexican Peso, Expiring 03/16/16 | Credit Suisse International | MXN | 57,653,000 | $ 3,450,047 | $ 3,327,924 | $ (122,123 | ) | |||||||||||||
| Malaysian Ringgit, Expiring 03/16/16* | CitiBank | MYR | 9,168,500 | 2,158,988 | 2,124,519 | (34,469 | ) | |||||||||||||
| Malaysian Ringgit, Expiring 03/16/16* | Credit Suisse International | MYR | 9,517,500 | 2,241,984 | 2,205,389 | (36,595 | ) | |||||||||||||
| Norwegian Krone, Expiring 03/16/16 | CitiBank | NOK | 42,872,000 | 4,987,153 | 4,840,011 | (147,142 | ) | |||||||||||||
| Norwegian Krone, Expiring 03/16/16 | Credit Suisse International | NOK | 42,872,000 | 4,987,160 | 4,840,011 | (147,149 | ) | |||||||||||||
| New Zealand Dollar, Expiring 03/16/16 | CitiBank | NZD | 37,417,000 | 24,838,792 | 25,478,709 | 639,917 | ||||||||||||||
| New Zealand Dollar, Expiring 03/16/16 | Credit Suisse International | NZD | 37,417,000 | 24,838,798 | 25,478,710 | 639,912 | ||||||||||||||
| Philippine Peso, Expiring 03/16/16* | CitiBank | PHP | 51,364,000 | 1,081,877 | 1,087,121 | 5,244 | ||||||||||||||
| Philippine Peso, Expiring 03/16/16* | Credit Suisse International | PHP | 51,364,000 | 1,081,877 | 1,087,121 | 5,244 | ||||||||||||||
| Poland Zloty, Expiring 03/16/16 | CitiBank | PLN | 15,307,000 | 3,896,555 | 3,896,705 | 150 | ||||||||||||||
| Poland Zloty, Expiring 03/16/16 | Credit Suisse International | PLN | 15,307,000 | 3,896,555 | 3,896,704 | 149 | ||||||||||||||
| Swedish Krona, Expiring 03/16/16 | CitiBank | SEK | 117,268,500 | 13,755,991 | 13,920,969 | 164,978 | ||||||||||||||
| Swedish Krona, Expiring 03/16/16 | Credit Suisse International | SEK | 117,268,500 | 13,755,985 | 13,920,969 | 164,984 | ||||||||||||||
| Singapore Dollar, Expiring 03/16/16 | CitiBank | SGD | 6,698,000 | 4,748,105 | 4,712,717 | (35,388 | ) | |||||||||||||
| Singapore Dollar, Expiring 03/16/16 | Credit Suisse International | SGD | 6,698,000 | 4,748,131 | 4,712,717 | (35,414 | ) | |||||||||||||
| Turkish Lira, Expiring 03/16/16 | CitiBank | TRY | 26,842,500 | 9,001,838 | 9,019,487 | 17,649 | ||||||||||||||
| Turkish Lira, Expiring 03/16/16 | Credit Suisse International | TRY | 26,842,500 | 9,001,572 | 9,019,488 | 17,916 | ||||||||||||||
| New Taiwan Dollar, Expiring 03/16/16* | CitiBank | TWD | 61,346,000 | 1,870,503 | 1,869,142 | (1,361 | ) | |||||||||||||
| New Taiwan Dollar, Expiring 03/16/16* | Credit Suisse International | TWD | 72,588,000 | 2,217,264 | 2,211,673 | (5,591 | ) | |||||||||||||
| South African Rand, Expiring 03/16/16 | CitiBank | ZAR | 65,819,000 | 4,320,031 | 4,199,501 | (120,530 | ) | |||||||||||||
| South African Rand, Expiring 03/16/16 | Credit Suisse International | ZAR | 65,819,000 | 4,319,964 | 4,199,501 | (120,463 | ) | |||||||||||||
|
|
|
|
|
| |||||||||||||||
| $754,583,095 | $755,607,297 | $1,024,202 | ||||||||||||||||||
|
|
|
|
|
| |||||||||||||||
| SALES CONTRACTS | COUNTERPARTY | CURRENCY | CURRENCY AMOUNT SOLD | VALUE AT SETTLEMENT DATE | VALUE AT DECEMBER 31, 2015 | UNREALIZED APPRECIATION (DEPRECIATION) | ||||||||||||||
| Australian Dollar, Expiring 03/16/16 | CitiBank | AUD | (59,103,000 | ) | $(42,449,706 | ) | $(42,914,556 | ) | $(464,850 | ) | ||||||||||
| Australian Dollar, Expiring 03/16/16 | Credit Suisse International | AUD | (59,103,000 | ) | (42,449,679 | ) | (42,914,555 | ) | (464,876 | ) | ||||||||||
| Brazilian Real, Expiring 03/16/16* | CitiBank | BRL | (17,490,500 | ) | (4,383,172 | ) | (4,318,503 | ) | 64,669 | |||||||||||
| Brazilian Real, Expiring 03/16/16* | Credit Suisse International | BRL | (17,490,500 | ) | (4,383,207 | ) | (4,318,503 | ) | 64,704 | |||||||||||
| The accompanying notes are an integral part of these financial statements. | (Continued) |
| AQR Funds | Annual Report | December 2015 | ||||||||||||||
153
Table of Contents
| Consolidated Schedule of Investments | December 31, 2015 |
| AQR MANAGED FUTURES STRATEGY HV FUND |
| SALES CONTRACTS | COUNTERPARTY | CURRENCY | CURRENCY AMOUNT SOLD | VALUE AT SETTLEMENT DATE | VALUE AT DECEMBER 31, 2015 | UNREALIZED APPRECIATION (DEPRECIATION) | ||||||||||||||
| Canadian Dollar, Expiring 03/16/16 | CitiBank | CAD | (103,204,500 | ) | $ (75,806,410 | ) | $ (74,600,268 | ) | $ 1,206,142 | |||||||||||
| Canadian Dollar, Expiring 03/16/16 | Credit Suisse International | CAD | (103,204,500 | ) | (75,806,346 | ) | (74,600,269 | ) | 1,206,077 | |||||||||||
| Swiss Franc, Expiring 03/16/16 | CitiBank | CHF | (30,000 | ) | (30,079 | ) | (30,044 | ) | 35 | |||||||||||
| Swiss Franc, Expiring 03/16/16 | Credit Suisse International | CHF | (279,000 | ) | (282,691 | ) | (279,416 | ) | 3,275 | |||||||||||
| Chilean Peso, Expiring 03/16/16* | CitiBank | CLP | (1,991,968,000 | ) | (2,802,883 | ) | (2,788,252 | ) | 14,631 | |||||||||||
| Chilean Peso, Expiring 03/16/16* | Credit Suisse International | CLP | (1,991,968,000 | ) | (2,802,883 | ) | (2,788,252 | ) | 14,631 | |||||||||||
| Colombian Peso, Expiring 03/16/16* | CitiBank | COP | (3,291,018,000 | ) | (1,003,670 | ) | (1,028,410 | ) | (24,740 | ) | ||||||||||
| Colombian Peso, Expiring 03/16/16* | Credit Suisse International | COP | (3,291,018,000 | ) | (1,003,670 | ) | (1,028,410 | ) | (24,740 | ) | ||||||||||
| Euro, Expiring 03/16/16 | CitiBank | EUR | (164,332,002 | ) | (175,158,071 | ) | (178,915,940 | ) | (3,757,869 | ) | ||||||||||
| Euro, Expiring 03/16/16 | Credit Suisse International | EUR | (164,332,001 | ) | (175,157,408 | ) | (178,915,939 | ) | (3,758,531 | ) | ||||||||||
| British Pound, Expiring 03/16/16 | CitiBank | GBP | (17,944,000 | ) | (26,916,252 | ) | (26,456,230 | ) | 460,022 | |||||||||||
| British Pound, Expiring 03/16/16 | Credit Suisse International | GBP | (17,944,000 | ) | (26,916,213 | ) | (26,456,230 | ) | 459,983 | |||||||||||
| Hong Kong Dollar, Expiring 03/16/16 | Credit Suisse International | HKD | (5,666,000 | ) | (731,283 | ) | (731,511 | ) | (228 | ) | ||||||||||
| Hungarian Forint, Expiring 03/16/16 | CitiBank | HUF | (1,089,573,000 | ) | (3,764,493 | ) | (3,750,202 | ) | 14,291 | |||||||||||
| Hungarian Forint, Expiring 03/16/16 | Credit Suisse International | HUF | (1,089,573,000 | ) | (3,765,256 | ) | (3,750,202 | ) | 15,054 | |||||||||||
| Indonesian Rupiah, Expiring 03/16/16* | CitiBank | IDR | (1,598,920,000 | ) | (109,665 | ) | (113,937 | ) | (4,272 | ) | ||||||||||
| Indonesian Rupiah, Expiring 03/16/16* | Credit Suisse International | IDR | (1,598,920,000 | ) | (109,665 | ) | (113,937 | ) | (4,272 | ) | ||||||||||
| Israeli Shekel, Expiring 03/16/16 | CitiBank | ILS | (7,227,500 | ) | (1,864,389 | ) | (1,860,256 | ) | 4,133 | |||||||||||
| Israeli Shekel, Expiring 03/16/16 | Credit Suisse International | ILS | (7,227,500 | ) | (1,864,126 | ) | (1,860,256 | ) | 3,870 | |||||||||||
| Indian Rupee, Expiring 03/16/16* | CitiBank | INR | (108,591,000 | ) | (1,597,534 | ) | (1,622,091 | ) | (24,557 | ) | ||||||||||
| Indian Rupee, Expiring 03/16/16* | Credit Suisse International | INR | (108,591,000 | ) | (1,597,534 | ) | (1,622,091 | ) | (24,557 | ) | ||||||||||
| Japanese Yen, Expiring 03/16/16 | CitiBank | JPY | (5,143,850,500 | ) | (41,958,498 | ) | (42,869,483 | ) | (910,985 | ) | ||||||||||
| Japanese Yen, Expiring 03/16/16 | Credit Suisse International | JPY | (5,143,850,500 | ) | (41,958,498 | ) | (42,869,483 | ) | (910,985 | ) | ||||||||||
| Korean Won, Expiring 03/16/16* | CitiBank | KRW | (21,967,355,501 | ) | (18,618,854 | ) | (18,704,632 | ) | (85,778 | ) | ||||||||||
| Korean Won, Expiring 03/16/16* | Credit Suisse International | KRW | (21,967,355,498 | ) | (18,618,864 | ) | (18,704,632 | ) | (85,768 | ) | ||||||||||
| Mexican Peso, Expiring 03/16/16 | CitiBank | MXN | (255,828,500 | ) | (15,022,752 | ) | (14,767,279 | ) | 255,473 | |||||||||||
| Mexican Peso, Expiring 03/16/16 | Credit Suisse International | MXN | (255,828,500 | ) | (15,022,722 | ) | (14,767,279 | ) | 255,443 | |||||||||||
| Malaysian Ringgit, Expiring 03/16/16* | CitiBank | MYR | (6,158,500 | ) | (1,444,190 | ) | (1,427,044 | ) | 17,146 | |||||||||||
| The accompanying notes are an integral part of these financial statements. | (Continued) |
| AQR Funds | Annual Report | December 2015 | ||||||||||||||
154
Table of Contents
| Consolidated Schedule of Investments | December 31, 2015 |
| AQR MANAGED FUTURES STRATEGY HV FUND |
| SALES CONTRACTS | COUNTERPARTY | CURRENCY | CURRENCY AMOUNT SOLD | VALUE AT SETTLEMENT DATE | VALUE AT DECEMBER 31, 2015 | UNREALIZED APPRECIATION (DEPRECIATION) | ||||||||||||||
| Malaysian Ringgit, Expiring 03/16/16* | Credit Suisse International | MYR | (6,158,500 | ) | $ (1,444,192 | ) | $ (1,427,044 | ) | $ 17,148 | |||||||||||
| Norwegian Krone, Expiring 03/16/16 | CitiBank | NOK | (275,787,500 | ) | (31,748,123 | ) | (31,134,885 | ) | 613,238 | |||||||||||
| Norwegian Krone, Expiring 03/16/16 | Credit Suisse International | NOK | (275,787,500 | ) | (31,748,056 | ) | (31,134,883 | ) | 613,173 | |||||||||||
| New Zealand Dollar, Expiring 03/16/16 | CitiBank | NZD | (7,800,000 | ) | (5,161,519 | ) | (5,311,327 | ) | (149,808 | ) | ||||||||||
| New Zealand Dollar, Expiring 03/16/16 | Credit Suisse International | NZD | (7,800,000 | ) | (5,161,519 | ) | (5,311,327 | ) | (149,808 | ) | ||||||||||
| Philippine Peso, Expiring 03/16/16* | CitiBank | PHP | (177,409,000 | ) | (3,717,975 | ) | (3,754,871 | ) | (36,896 | ) | ||||||||||
| Philippine Peso, Expiring 03/16/16* | Credit Suisse International | PHP | (177,409,000 | ) | (3,717,975 | ) | (3,754,871 | ) | (36,896 | ) | ||||||||||
| Poland Zloty, Expiring 03/16/16 | CitiBank | PLN | (55,853,500 | ) | (14,006,316 | ) | (14,218,632 | ) | (212,316 | ) | ||||||||||
| Poland Zloty, Expiring 03/16/16 | Credit Suisse International | PLN | (55,853,499 | ) | (14,006,305 | ) | (14,218,632 | ) | (212,327 | ) | ||||||||||
| Swedish Krona, Expiring 03/16/16 | CitiBank | SEK | (102,047,000 | ) | (11,938,037 | ) | (12,114,021 | ) | (175,984 | ) | ||||||||||
| Swedish Krona, Expiring 03/16/16 | Credit Suisse International | SEK | (102,047,000 | ) | (11,938,008 | ) | (12,114,021 | ) | (176,013 | ) | ||||||||||
| Singapore Dollar, Expiring 03/16/16 | CitiBank | SGD | (8,535,500 | ) | (6,036,635 | ) | (6,005,582 | ) | 31,053 | |||||||||||
| Singapore Dollar, Expiring 03/16/16 | Credit Suisse International | SGD | (8,535,500 | ) | (6,036,656 | ) | (6,005,582 | ) | 31,074 | |||||||||||
| Turkish Lira, Expiring 03/16/16 | CitiBank | TRY | (26,608,000 | ) | (8,827,224 | ) | (8,940,693 | ) | (113,469 | ) | ||||||||||
| Turkish Lira, Expiring 03/16/16 | Credit Suisse International | TRY | (26,608,000 | ) | (8,826,853 | ) | (8,940,693 | ) | (113,840 | ) | ||||||||||
| New Taiwan Dollar, Expiring 03/16/16* | CitiBank | TWD | (182,337,500 | ) | (5,565,742 | ) | (5,555,615 | ) | 10,127 | |||||||||||
| New Taiwan Dollar, Expiring 03/16/16* | Credit Suisse International | TWD | (182,337,500 | ) | (5,565,773 | ) | (5,555,615 | ) | 10,158 | |||||||||||
| South African Rand, Expiring 03/16/16 | CitiBank | ZAR | (248,322,500 | ) | (16,958,438 | ) | (15,843,915 | ) | 1,114,523 | |||||||||||
| South African Rand, Expiring 03/16/16 | Credit Suisse International | ZAR | (248,322,500 | ) | (16,957,634 | ) | (15,843,916 | ) | 1,113,718 | |||||||||||
|
|
|
|
|
| |||||||||||||||
| (1,034,763,643 | ) | (1,039,074,217 | ) | (4,310,574 | ) | |||||||||||||||
|
|
|
|
|
| |||||||||||||||
| $(280,180,548 | ) | $(283,466,920 | ) | $(3,286,372 | ) | |||||||||||||||
|
|
|
|
|
| |||||||||||||||
| * | Non-deliverable forward (See Note 4). |
AUD - Australian Dollar
BRL - Brazilian Real
CAD - Canadian Dollar
CHF - Swiss Franc
CLP - Chilean Peso
COP - Colombian Peso
CZK - Czech Republic Koruna
EUR - Euro
GBP - British Pound
HKD - Hong Kong Dollar
HUF - Hungarian Forint
IDR - Indonesian Rupiah
ILS - Israeli Shekel
INR - Indian Rupee
JPY - Japanese Yen
KRW - Korean Won
MXN - Mexican Peso
MYR - Malaysian Ringgit
NOK - Norwegian Krone
NZD - New Zealand Dollar
PHP - Philippine Peso
PLN - Poland Zloty
SEK - Swedish Krona
SGD - Singapore Dollar
TRY - Turkish Lira
TWD - New Taiwan Dollar
USD - United States Dollar
ZAR - South African Rand
| The accompanying notes are an integral part of these financial statements. | (Continued) |
| AQR Funds | Annual Report | December 2015 | ||||||||||||||
155
Table of Contents
| Consolidated Schedule of Investments | December 31, 2015 |
| AQR MANAGED FUTURES STRATEGY HV FUND |
Collateral pledged to, or (received from), each counterparty at December 31, 2015 was as follows:
| COUNTERPARTY | OVER THE COUNTER | EXCHANGE TRADED/ CENTRALLY CLEARED | TOTAL | |||||||||
| Bank of America | ||||||||||||
| Money Market Funds | $880,005 | $— | $880,005 | |||||||||
| ||||||||||||
| Barclays Capital | ||||||||||||
| Cash | — | 11,114,129 | 11,114,129 | |||||||||
| ||||||||||||
| CitiBank | ||||||||||||
| Money Market Funds | 7,910,020 | — | 7,910,020 | |||||||||
| ||||||||||||
| Credit Suisse International | ||||||||||||
| Money Market Funds | 1,800,010 | — | 1,800,010 | |||||||||
| ||||||||||||
| Goldman Sachs | ||||||||||||
| Cash | — | 3,950,365 | 3,950,365 | |||||||||
| Money Market Funds | 290,000 | — | 290,000 | |||||||||
| ||||||||||||
| J.P. Morgan | ||||||||||||
| Cash | — | 7,623,080 | 7,623,080 | |||||||||
| ||||||||||||
| Morgan Stanley and Co., International PLC | ||||||||||||
| Cash | — | 2,130,236 | 2,130,236 | |||||||||
| ||||||||||||
Collateral pledged to, or (received from), each counterparty for the Subsidiary (See Note 2) at December 31, 2015 was as follows:
| COUNTERPARTY | OVER THE COUNTER | EXCHANGE TRADED/ CENTRALLY CLEARED | TOTAL | |||||||||
| CitiBank | ||||||||||||
| Money Market Funds | $560,022 | $— | $560,022 | |||||||||
| ||||||||||||
| Deutsche Bank | ||||||||||||
| Money Market Funds | 190,008 | — | 190,008 | |||||||||
| ||||||||||||
| Goldman Sachs | ||||||||||||
| Cash | — | 1,611,926 | 1,611,926 | |||||||||
| ||||||||||||
| J.P. Morgan | ||||||||||||
| Cash | — | 2,892,877 | 2,892,877 | |||||||||
| ||||||||||||
| Macquarie Capital | ||||||||||||
| Money Market Funds | 680,001 | — | 680,001 | |||||||||
| ||||||||||||
| Morgan Stanley and Co., International PLC | ||||||||||||
| Cash | — | (2,696,723 | ) | (2,696,723 | ) | |||||||
| U.S. Treasury Bills | — | 11,164,967 | 11,164,967 | |||||||||
| ||||||||||||
| Societe Generale | ||||||||||||
| Money Market Funds | 110,000 | — | 110,000 | |||||||||
| ||||||||||||
| The accompanying notes are an integral part of these financial statements. |
| AQR Funds | Annual Report | December 2015 | ||||||||||||||
156
Table of Contents
| Consolidated Schedule of Investments | December 31, 2015 |
| AQR MULTI-STRATEGY ALTERNATIVE FUND |
| LONG INVESTMENTS - 92.0% | SHARES | VALUE (Note 5) | ||||||
| COMMON STOCKS - 4.3% | ||||||||
| Canada - 0.0% (a) | ||||||||
| Mitel Networks Corp. (1)† | 23,602 | $ | 181,499 | |||||
|
| |||||||
| China - 0.0% (a) | ||||||||
| Sihuan Pharmaceutical Holdings Group Ltd. (3)(b)(c) | 816,000 | 408,524 | ||||||
|
| |||||||
| Ireland - 0.6% | ||||||||
| Avolon Holdings Ltd. (1)† | 71,213 | 2,204,754 | ||||||
| King Digital Entertainment PLC (1) | 697,146 | 12,464,971 | ||||||
|
| |||||||
| 14,669,725 | ||||||||
|
| |||||||
| United States - 3.7% | ||||||||
| AGL Resources, Inc. (1) | 15,373 | 980,951 | ||||||
| Airgas, Inc. (1) | 31,102 | 4,302,029 | ||||||
| BioMed Realty Trust, Inc. REIT (1) | 400,815 | 9,495,307 | ||||||
| Boulder Brands, Inc. (1)† | 269,773 | 2,962,108 | ||||||
| Constant Contact, Inc. (1)† | 225,975 | 6,607,509 | ||||||
| Dyax Corp. (1)† | 70,075 | 2,636,222 | ||||||
| Fairchild Semiconductor International, Inc. (1)† | 78,555 | 1,626,874 | ||||||
| Herbalife Ltd. (1)†(b) | 2,771 | 148,581 | ||||||
| SHARES | VALUE (Note 5) | |||||||
| United States - 3.7% (continued) | ||||||||
| Humana, Inc. (1) | 8,742 | $ | 1,560,534 | |||||
| Keurig Green Mountain, Inc. (1) | 38,299 | 3,446,144 | ||||||
| MedAssets, Inc. (1)† | 125,790 | 3,891,943 | ||||||
| PartnerRe Ltd. (1) | 9,264 | 1,294,551 | ||||||
| Pep Boys - Manny, Moe & Jack/The (1)† | 107,112 | 1,971,932 | ||||||
| Pepco Holdings, Inc. (1) | 67,067 | 1,744,413 | ||||||
| Piedmont Natural Gas Co., Inc. (1) | 97,997 | 5,587,789 | ||||||
| Precision Castparts Corp. (1) | 46,514 | 10,791,713 | ||||||
| Rite Aid Corp. (1)† | 1,241,942 | 9,736,825 | ||||||
| SolarWinds, Inc. (1)† | 143,087 | 8,427,824 | ||||||
| Solera Holdings, Inc. (1) | 14,716 | 806,878 | ||||||
| StanCorp Financial Group, Inc. (1) | 13,243 | 1,508,113 | ||||||
| SunEdison, Inc. (1)† | 101,808 | 518,203 | ||||||
| Symetra Financial Corp. (1) | 166,164 | 5,279,030 | ||||||
| TECO Energy, Inc. (1) | 48,528 | 1,293,271 | ||||||
| UTi Worldwide, Inc. (1)† | 711,862 | 5,004,390 | ||||||
|
| |||||||
| 91,623,134 | ||||||||
|
| |||||||
TOTAL COMMON STOCKS | 106,882,882 | |||||||
|
| |||||||
| CONVERTIBLE PREFERRED STOCKS - 11.0% | SHARES | VALUE (Note 5) | ||||||
| Israel - 2.3% | ||||||||
| Teva Pharmaceutical Industries Ltd., $1,000.00 par, 7.000% 12/15/18 (1) | 55,350 | $ | 56,310,787 | |||||
|
| |||||||
| Netherlands - 1.2% | ||||||||
| Fiat Chrysler Automobiles NV, Series FCAU, $100.00 par, 7.875% 12/15/16 | 25,012,500 | 29,061,398 | ||||||
|
| |||||||
| United States - 7.5% | ||||||||
| Allergan PLC, Series A, $1,000.00 par, 5.500% 03/01/18 (1) | 32,175 | 33,146,041 | ||||||
| Anthem, Inc., $50.00 par, 5.250% 05/01/18 (b) | 534,750 | 24,625,238 | ||||||
| Black Hills Corp., $50.00 par, 7.750% 11/01/18 | 49,266 | 2,730,814 | ||||||
| Bunge Ltd., Perpetual Preferred Stock, $100.00 par, 4.875% 12/31/49 (1)(d) | 30,900 | 2,874,936 | ||||||
| Crown Castle International Corp., Series A, $100.00 par, 4.500% 11/01/16 | 109,200 | 11,661,468 | ||||||
| Dominion Resources, Inc., $50.00 par, 6.375% 07/01/17 (1) | 137,625 | 6,617,010 | ||||||
| Dominion Resources, Inc., Series A, $49.00 par, 6.125% 04/01/16 (1) | 167,375 | 8,884,265 | ||||||
| Dominion Resources, Inc., Series B, $49.00 par, 6.000% 07/01/16 (1) | 276,600 | 14,845,122 | ||||||
| Post Holdings, Inc., Perpetual Preferred Stock, $100.00 par, 2.500% 12/31/49 (d) | 37,627 | 4,494,075 | ||||||
| Southwestern Energy Co., Series B, $50.00 par, 6.250% 01/15/18 (1) | 429,825 | 7,973,254 | ||||||
| Stericycle, Inc., $100.00 par, 5.250% 09/15/18 (1) | 103,200 | 9,448,992 | ||||||
| T-Mobile US, Inc., $50.00 par, 5.500% 12/15/17 (1) | 329,050 | 22,279,976 | ||||||
| Tyson Foods, Inc., $50.00 par, 4.750% 07/15/17 (1) | 310,450 | 18,838,106 | ||||||
| Welltower, Inc., Perpetual Preferred Stock, Series I, $50.00 par, 6.500% 12/31/49 (1)(d) | 221,875 | 13,514,406 | ||||||
| Weyerhaeuser Co., Series A, $50.00 par, 6.375% 07/01/16 (1) | 95,253 | 4,789,321 | ||||||
| WPX Energy, Inc., Series A, $50.00 par, 6.250% 07/31/18 (1)(b) | 65,450 | 2,057,094 | ||||||
|
| |||||||
| 188,780,118 | ||||||||
|
| |||||||
TOTAL CONVERTIBLE PREFERRED STOCKS |
| 274,152,303 | ||||||
|
| |||||||
| The accompanying notes are an integral part of these financial statements. | (Continued) |
| AQR Funds | Annual Report | December 2015 | ||||||||||||||
157
Table of Contents
| Consolidated Schedule of Investments | December 31, 2015 |
| AQR MULTI-STRATEGY ALTERNATIVE FUND |
| CORPORATE BONDS - 0.0% (a) | INTEREST RATE | MATURITY DATE | PRINCIPAL AMOUNT (000’s) | VALUE (Note 5) | ||||||||||||
| United States - 0.0% (a) | ||||||||||||||||
Sabine Oil & Gas Corp. (e) | 7.250 | % | 06/15/19 | $ | 3,950,000 | $ | 246,875 | |||||||||
|
| |||||||||||||||
| CONVERTIBLE BONDS - 22.2% | ||||||||||||||||
| Canada - 0.3% | ||||||||||||||||
| Element Financial Corp. 144A (f) | 4.250 | % | 06/30/20 | 7,675 | 5,695,929 | |||||||||||
| Element Financial Corp. 144A (b)(f) | 5.125 | % | 06/30/19 | 3,281 | 2,769,513 | |||||||||||
|
| |||||||||||||||
| 8,465,442 | ||||||||||||||||
|
| |||||||||||||||
| Mexico - 0.3% | ||||||||||||||||
| Cemex SAB de CV (b) | �� | 3.720 | % | 03/15/20 | 7,050 | 5,529,844 | ||||||||||
| Cemex SAB de CV | 3.750 | % | 03/15/18 | 350 | 326,594 | |||||||||||
| Cemex SAB de CV | 3.250 | % | 03/15/16 | 2,250 | 2,235,937 | |||||||||||
|
| |||||||||||||||
| 8,092,375 | ||||||||||||||||
|
| |||||||||||||||
| Monaco - 0.2% | ||||||||||||||||
| Scorpio Tankers, Inc. 144A (f) | 2.375 | % | 07/01/19 | 4,525 | 4,182,797 | |||||||||||
|
| |||||||||||||||
| Norway - 0.2% | ||||||||||||||||
| Ship Finance International Ltd. | 3.250 | % | 02/01/18 | 5,500 | 5,847,187 | |||||||||||
|
| |||||||||||||||
| United States - 21.2% | ||||||||||||||||
| Acorda Therapeutics, Inc. | 1.750 | % | 06/15/21 | 4,025 | 4,628,750 | |||||||||||
| Allscripts Healthcare Solutions, Inc. | 1.250 | % | 07/01/20 | 375 | 401,250 | |||||||||||
| Alpha Natural Resources, Inc. (e) | 4.875 | % | 12/15/20 | 200 | 250 | |||||||||||
| Anthem, Inc. | 2.750 | % | 10/15/42 | 9,325 | 17,799,094 | |||||||||||
| Ares Capital Corp. 144A (3)(c)(f) | 5.750 | % | 02/01/16 | 417 | 416,739 | |||||||||||
| CalAtlantic Group, Inc. (b) | 1.250 | % | 08/01/32 | 3,575 | 3,968,250 | |||||||||||
| Cheniere Energy, Inc. (b) | 4.250 | % | 03/15/45 | 10,500 | 5,460,000 | |||||||||||
| Ciena Corp. | 4.000 | % | 12/15/20 | 1,166 | 1,514,342 | |||||||||||
| Ciena Corp. 144A (f) | 3.750 | % | 10/15/18 | 275 | 341,000 | |||||||||||
| Colony Capital, Inc. | 3.875 | % | 01/15/21 | 3,150 | 2,931,469 | |||||||||||
| Dycom Industries, Inc. 144A (b)(f) | 0.750 | % | 09/15/21 | 3,700 | 3,635,250 | |||||||||||
| Equinix, Inc. | 4.750 | % | 06/15/16 | 4,450 | 17,580,281 | |||||||||||
| General Cable Corp. (b)(g) | 4.500 | % | 11/15/29 | 1,595 | 977,934 | |||||||||||
| Herbalife Ltd. (b) | 2.000 | % | 08/15/19 | 3,000 | 2,510,625 | |||||||||||
| Hologic, Inc., Series 2010 (g) | 2.000 | % | 12/15/37 | 1,650 | 2,792,625 | |||||||||||
| Horizon Pharma Investment Ltd. 144A (b)(f) | 2.500 | % | 03/15/22 | 2,525 | 2,520,266 | |||||||||||
| Intel Corp. | 3.250 | % | 08/01/39 | 19,000 | 31,599,375 | |||||||||||
| Lam Research Corp. | 0.500 | % | 05/15/16 | 5,075 | 6,603,844 | |||||||||||
| Lennar Corp. 144A (f) | 2.750 | % | 12/15/20 | 2,650 | 5,857,825 | |||||||||||
| Lennar Corp. 144A (b)(f) | 3.250 | % | 11/15/21 | 3,325 | 6,930,547 | |||||||||||
| LinkedIn Corp. (b) | 0.500 | % | 11/01/19 | 13,425 | 14,079,469 | |||||||||||
| Medicines Co./The | 1.375 | % | 06/01/17 | 4,550 | 6,475,219 | |||||||||||
| Medicines Co./The 144A (f) | 2.500 | % | 01/15/22 | 5,975 | 7,573,312 | |||||||||||
| Mentor Graphics Corp. | 4.000 | % | 04/01/31 | 3,375 | 3,524,766 | |||||||||||
| Meritor, Inc. | 7.875 | % | 03/01/26 | 1,600 | 1,908,000 | |||||||||||
| MGIC Investment Corp. (b) | 5.000 | % | 05/01/17 | 4,625 | 4,757,969 | |||||||||||
| MGIC Investment Corp. (b) | 2.000 | % | 04/01/20 | 13,700 | 19,043,000 | |||||||||||
| Microchip Technology, Inc. | 2.125 | % | 12/15/37 | 15,700 | 29,879,062 | |||||||||||
| Micron Technology, Inc., Series C | 2.375 | % | 05/01/32 | 7,775 | 12,201,891 | |||||||||||
| Micron Technology, Inc., Series F | 2.125 | % | 02/15/33 | 4,400 | 6,468,000 | |||||||||||
| Molina Healthcare, Inc. | 1.125 | % | 01/15/20 | 4,500 | 6,997,500 | |||||||||||
| NorthStar Realty Finance LP 144A (f) | 5.375 | % | 06/15/33 | 100 | 124,616 | |||||||||||
| Novellus Systems, Inc. | 2.625 | % | 05/15/41 | 13,650 | 32,120,156 | |||||||||||
| NRG Yield, Inc. 144A (b)(f) | 3.500 | % | 02/01/19 | 4,200 | 3,848,250 | |||||||||||
| NRG Yield, Inc. 144A (b)(f) | 3.250 | % | 06/01/20 | 4,575 | 3,840,141 | |||||||||||
| The accompanying notes are an integral part of these financial statements. | (Continued) |
| AQR Funds | Annual Report | December 2015 | ||||||||||||||
158
Table of Contents
| Consolidated Schedule of Investments | December 31, 2015 |
| AQR MULTI-STRATEGY ALTERNATIVE FUND |
| INTEREST RATE | MATURITY DATE | PRINCIPAL AMOUNT (000’s) | VALUE (Note 5) | |||||||||||||
| United States - 21.2% (continued) | ||||||||||||||||
| NVIDIA Corp. (b) | 1.000 | % | 12/01/18 | $ | 24,825 | $ | 41,349,141 | |||||||||
| ON Semiconductor Corp., Series B | 2.625 | % | 12/15/26 | 3,064 | 3,416,360 | |||||||||||
| Palo Alto Networks, Inc. | 0.000 | % | 07/01/19 | 15,225 | 25,292,531 | |||||||||||
| Pandora Media, Inc. 144A (b)(f) | 1.750 | % | 12/01/20 | 3,575 | 3,796,203 | |||||||||||
| Priceline Group, Inc./The (b) | 1.000 | % | 03/15/18 | 6,100 | 8,673,437 | |||||||||||
| Prospect Capital Corp. (b) | 4.750 | % | 04/15/20 | 1,100 | 952,875 | |||||||||||
| Radian Group, Inc. | 2.250 | % | 03/01/19 | 2,775 | 3,574,547 | |||||||||||
| SanDisk Corp. (b) | 1.500 | % | 08/15/17 | 10,615 | 16,645,647 | |||||||||||
| SL Green Operating Partnership LP 144A (f) | 3.000 | % | 10/15/17 | 5,575 | 7,940,891 | |||||||||||
| Spirit Realty Capital, Inc. | 2.875 | % | 05/15/19 | 4,025 | 3,846,390 | |||||||||||
| Spirit Realty Capital, Inc. | 3.750 | % | 05/15/21 | 4,475 | 4,234,469 | |||||||||||
| Starwood Property Trust, Inc. (b) | 3.750 | % | 10/15/17 | 1,650 | 1,623,188 | |||||||||||
| Starwood Property Trust, Inc. (b) | 4.550 | % | 03/01/18 | 5,925 | 6,024,984 | |||||||||||
| Starwood Property Trust, Inc. | 4.000 | % | 01/15/19 | 4,350 | 4,515,844 | |||||||||||
| Stillwater Mining Co. (b) | 1.750 | % | 10/15/32 | 5,725 | 5,435,172 | |||||||||||
| SunEdison, Inc. | 2.750 | % | 01/01/21 | 4,925 | 2,465,578 | |||||||||||
| SunEdison, Inc. (b) | 2.000 | % | 10/01/18 | 5,950 | 3,246,469 | |||||||||||
| SunEdison, Inc. 144A (f) | 0.250 | % | 01/15/20 | 8,325 | 3,205,125 | |||||||||||
| SunPower Corp. 144A (b)(f) | 4.000 | % | 01/15/23 | 3,950 | 4,735,062 | |||||||||||
| Take-Two Interactive Software, Inc. | 1.750 | % | 12/01/16 | 2,450 | 4,474,312 | |||||||||||
| Tesla Motors, Inc. | 1.500 | % | 06/01/18 | 8,500 | 16,739,688 | |||||||||||
| Trinity Industries, Inc. (b) | 3.875 | % | 06/01/36 | 5,975 | 7,151,328 | |||||||||||
| TTM Technologies, Inc. | 1.750 | % | 12/15/20 | 2,875 | 2,591,094 | |||||||||||
| UTi Worldwide, Inc. | 4.500 | % | 03/01/19 | 5,100 | 5,029,875 | |||||||||||
| Vector Group Ltd. (h) | 1.750 | % | 04/15/20 | 1,900 | 2,171,938 | |||||||||||
| VeriSign, Inc. | 4.297 | % | 08/15/37 | 21,619 | 55,358,152 | |||||||||||
| Vishay Intertechnology, Inc. (b) | 2.250 | % | 11/15/40 | 1,875 | 1,814,063 | |||||||||||
| WebMD Health Corp. (b) | 2.500 | % | 01/31/18 | 4,775 | 4,912,281 | |||||||||||
| WebMD Health Corp. | 1.500 | % | 12/01/20 | 1,675 | 1,870,766 | |||||||||||
|
| |||||||||||||||
| 524,398,477 | ||||||||||||||||
|
| |||||||||||||||
TOTAL CONVERTIBLE BONDS | 550,986,278 | |||||||||||||||
|
| |||||||||||||||
| MONEY MARKET FUNDS - 50.2% | SHARES | VALUE (Note 5) | ||||||
| BlackRock Liquidity Funds T-Fund Portfolio, Institutional Shares, 0.100% ^(i) | 1,000,216 | $ | 1,000,216 | |||||
| Dreyfus Treasury Cash Management, Class I, 0.090% ^(i) | 4,000,863 | 4,000,863 | ||||||
| J.P. Morgan U.S. Treasury Plus Money Market Fund - IM Shares, 0.129% ^(i)(j) | 764,959,056 | 764,959,056 | ||||||
| J.P. Morgan U.S. Treasury Plus Money Market Fund - Institutional Shares, 0.070% ^(i)(j) | 475,204,153 | 475,204,153 | ||||||
| UBS Money Series - UBS Select Treasury Preferred Fund, Class I, 0.140% ^(i) | 5,001,412 | 5,001,412 | ||||||
|
| |||||||
TOTAL MONEY MARKET FUNDS | 1,250,165,700 | |||||||
|
| |||||||
| SHORT-TERM INVESTMENTS - 4.3% | PRINCIPAL (000’s) | VALUE (Note 5) | ||||||
| U.S. Treasury Bill, 0.258%, 3/17/2016 ^(k) | $ | 1,858 | $ | 1,857,623 | ||||
| U.S. Treasury Bill, 0.238%, 2/18/2016 ^(k) | 8,096 | 8,094,867 | ||||||
| U.S. Treasury Bill, 0.066%, 4/7/2016 ^(k) | 5,000 | 4,998,040 | ||||||
| U.S. Treasury Bill, 0.536%, 6/9/2016 ^(k) | 1,853 | 1,849,366 | ||||||
| U.S. Treasury Bill, 0.327%, 5/19/2016 ^(k) | 32,518 | 32,476,930 | ||||||
| U.S. Treasury Bill, 0.145%, 4/28/2016 ^(k) | 2,481 | 2,478,921 | ||||||
| U.S. Treasury Bill, 0.161%, 2/4/2016 ^(k) | 16,427 | 16,425,571 | ||||||
| U.S. Treasury Bill, 0.345%, 5/26/2016 ^(k) | 11,300 | 11,282,553 | ||||||
| U.S. Treasury Bill, 0.141%, 1/28/2016 ^(k) | 25,758 | 25,755,759 | ||||||
| The accompanying notes are an integral part of these financial statements. | (Continued) |
| AQR Funds | Annual Report | December 2015 | ||||||||||||||
159
Table of Contents
| Consolidated Schedule of Investments | December 31, 2015 |
| AQR MULTI-STRATEGY ALTERNATIVE FUND |
| SHORT-TERM INVESTMENTS - 4.3% (continued) | PRINCIPAL (000’s) | VALUE (Note 5) | ||||||
| U.S. Treasury Bill, 0.516%, 6/23/2016 ^(k) | $ | 1,590 | $ | 1,586,465 | ||||
|
| |||||||
TOTAL SHORT-TERM INVESTMENTS | 106,806,095 | |||||||
|
| |||||||
TOTAL INVESTMENTS IN SECURITIES, AT VALUE | 2,289,240,133 | |||||||
|
| |||||||
| SECURITIES SOLD SHORT - (23.7)% | SHARES | |||||||
| COMMON STOCKS - (23.7)% | ||||||||
| Canada - (0.1)% | ||||||||
| Element Financial Corp. (1) | (267,849 | ) | (3,232,694 | ) | ||||
|
| |||||||
| Israel - (1.7)% | ||||||||
| Teva Pharmaceutical Industries Ltd. ADR (1) | (628,776 | ) | (41,272,857 | ) | ||||
|
| |||||||
| Italy - 0.0% (a) | ||||||||
| Ferrari NV (1)† | (19,413 | ) | (931,824 | ) | ||||
|
| |||||||
| Mexico - (0.1)% | ||||||||
| Cemex SAB de CV ADR (1)† | (244,392 | ) | (1,361,263 | ) | ||||
|
| |||||||
| Monaco - (0.1)% | ||||||||
| Scorpio Tankers, Inc. (1) | (212,674 | ) | (1,705,645 | ) | ||||
|
| |||||||
| Norway - (0.1)% | ||||||||
| Ship Finance International Ltd. (1) | (212,619 | ) | (3,523,097 | ) | ||||
|
| |||||||
| United Kingdom - (1.0)% | ||||||||
| Fiat Chrysler Automobiles NV (1)† | (1,728,135 | ) | (24,176,609 | ) | ||||
|
| |||||||
| United States - (20.6)% | ||||||||
| Acorda Therapeutics, Inc. (1)† | (69,985 | ) | (2,993,958 | ) | ||||
| Allergan PLC (1)† | (83,789 | ) | (26,184,062 | ) | ||||
| Allscripts Healthcare Solutions, Inc. (1)† | (14,619 | ) | (224,840 | ) | ||||
| Anthem, Inc. (1) | (219,124 | ) | (30,554,651 | ) | ||||
| Black Hills Corp. (1) | (42,390 | ) | (1,968,168 | ) | ||||
| Bunge Ltd. (1) | (20,658 | ) | (1,410,528 | ) | ||||
| CalAtlantic Group, Inc. (1) | (51,768 | ) | (1,963,043 | ) | ||||
| Cheniere Energy, Inc. (1)† | (40,974 | ) | (1,526,281 | ) | ||||
| Ciena Corp. (1)† | (44,628 | ) | (923,353 | ) | ||||
| Colony Capital, Inc., Class A REIT (1) | (36,809 | ) | (717,039 | ) | ||||
| Crown Castle International Corp. REIT (1) | (79,484 | ) | (6,871,392 | ) | ||||
| Dominion Resources, Inc. (1) | (296,906 | ) | (20,082,722 | ) | ||||
| Dycom Industries, Inc. (1)† | (25,968 | ) | (1,816,721 | ) | ||||
| Equinix, Inc. REIT (1) | (58,024 | ) | (17,546,458 | ) | ||||
| General Cable Corp. (1) | (40,140 | ) | (539,080 | ) | ||||
| Hologic, Inc. (1)† | (70,929 | ) | (2,744,243 | ) | ||||
| Horizon Pharma PLC (1)† | (69,613 | ) | (1,508,514 | ) | ||||
| Intel Corp. (1) | (752,248 | ) | (25,914,944 | ) | ||||
| Lam Research Corp. (1) | (452,940 | ) | (35,972,495 | ) | ||||
| Lennar Corp., Class A (1) | (238,257 | ) | (11,653,150 | ) | ||||
| LinkedIn Corp., Class A (1)† | (25,980 | ) | (5,847,578 | ) | ||||
| Medicines Co./The (1)† | (279,303 | ) | (10,429,174 | ) | ||||
| SHARES | VALUE (Note 5) | |||||||
| United States - (20.6)% (continued) | ||||||||
| Mentor Graphics Corp. (1) | (61,678 | ) | $ | (1,136,109 | ) | |||
| Meritor, Inc. (1)† | (86,667 | ) | (723,669 | ) | ||||
| MGIC Investment Corp. (1)† | (1,602,932 | ) | (14,153,890 | ) | ||||
| Microchip Technology, Inc. (1) | (608,365 | ) | (28,313,307 | ) | ||||
| Micron Technology, Inc. (1)† | (1,030,765 | ) | (14,595,632 | ) | ||||
| Molina Healthcare, Inc. (1)† | (97,130 | ) | (5,840,427 | ) | ||||
| NorthStar Realty Finance Corp. REIT (1) | (7,317 | ) | (124,608 | ) | ||||
| NRG Yield, Inc., Class A (1) | (51,385 | ) | (714,765 | ) | ||||
| NRG Yield, Inc., Class C (1) | (53,079 | ) | (783,446 | ) | ||||
| NVIDIA Corp. (1) | (1,083,470 | ) | (35,711,171 | ) | ||||
| ON Semiconductor Corp. (1)† | (154,659 | ) | (1,515,658 | ) | ||||
| Palo Alto Networks, Inc. (1)† | (122,183 | ) | (21,521,314 | ) | ||||
| Pandora Media, Inc. (1)† | (99,896 | ) | (1,339,605 | ) | ||||
| Post Holdings, Inc. (1)† | (64,657 | ) | (3,989,337 | ) | ||||
| Priceline Group, Inc./The (1)† | (5,360 | ) | (6,833,732 | ) | ||||
| Prospect Capital Corp. (1) | (1,331 | ) | (9,290 | ) | ||||
| Radian Group, Inc. (1) | (181,946 | ) | (2,436,257 | ) | ||||
| SL Green Realty Corp. REIT (1) | (63,976 | ) | (7,228,008 | ) | ||||
| Southwestern Energy Co. (1)† | (906,369 | ) | (6,444,284 | ) | ||||
| Spirit Realty Capital, Inc. REIT (1) | (163,475 | ) | (1,638,019 | ) | ||||
| Starwood Property Trust, Inc. REIT (1) | (177,634 | ) | (3,652,155 | ) | ||||
| Stericycle, Inc. (1)† | (55,292 | ) | (6,668,215 | ) | ||||
| Stillwater Mining Co. (1)† | (239,443 | ) | (2,052,027 | ) | ||||
| SunEdison, Inc. (1)† | (487,386 | ) | (2,480,795 | ) | ||||
| SunPower Corp. (1)† | (108,692 | ) | (3,261,847 | ) | ||||
| Take-Two Interactive Software, Inc. (1)† | (126,393 | ) | (4,403,532 | ) | ||||
| Tesla Motors, Inc. (1)† | (63,482 | ) | (15,236,315 | ) | ||||
| T-Mobile US, Inc. (1)† | (490,065 | ) | (19,171,343 | ) | ||||
| Trinity Industries, Inc. (1) | (150,850 | ) | (3,623,417 | ) | ||||
| TTM Technologies, Inc. (1)† | (196,669 | ) | (1,280,315 | ) | ||||
| Tyson Foods, Inc., Class A (1) | (275,644 | ) | (14,700,095 | ) | ||||
| Vector Group Ltd. (1) | (31,233 | ) | (736,787 | ) | ||||
| VeriSign, Inc. (1)† | (629,044 | ) | (54,953,284 | ) | ||||
| Vishay Intertechnology, Inc. (1) | (124,670 | ) | (1,502,274 | ) | ||||
| WebMD Health Corp. (1)† | (57,174 | ) | (2,761,504 | ) | ||||
| Welltower, Inc. REIT (1) | (105,864 | ) | (7,201,928 | ) | ||||
| Weyerhaeuser Co. REIT (1) | (81,847 | ) | (2,453,773 | ) | ||||
| WPX Energy, Inc. (1)† | (281,889 | ) | (1,618,043 | ) | ||||
|
| |||||||
| (512,202,571 | ) | |||||||
|
| |||||||
TOTAL COMMON STOCKS SOLD SHORT |
| (588,406,560 | ) | |||||
|
| |||||||
TOTAL SECURITIES SOLD SHORT, AT VALUE | (588,406,560 | ) | ||||||
|
| |||||||
TOTAL INVESTMENTS, NET OF |
| 1,700,833,573 | ||||||
|
| |||||||
| OTHER ASSETS IN EXCESS OF LIABILITIES - 31.7% (l) | 787,914,161 | |||||||
|
| |||||||
NET ASSETS - 100.0% | $ | 2,488,747,734 | ||||||
|
| |||||||
| The accompanying notes are an integral part of these financial statements. | (Continued) |
| AQR Funds | Annual Report | December 2015 | ||||||||||||||
160
Table of Contents
| Consolidated Schedule of Investments | December 31, 2015 |
| AQR MULTI-STRATEGY ALTERNATIVE FUND |
| SECTOR | VALUE | % OF NET ASSETS | ||||||
| Consumer Discretionary | $ | 12,408,405 | 0.5 | % | ||||
| Consumer Staples | 26,346,591 | 1.1 | ||||||
| Energy | 10,950,106 | 0.4 | ||||||
| Financials | 66,309,390 | 2.7 | ||||||
| Health Care | 50,014,579 | 2.0 | ||||||
| Industrials | 32,781,134 | 1.3 | ||||||
| Information Technology | 100,703,729 | 4.0 | ||||||
| Materials | 14,416,286 | 0.6 | ||||||
| Telecommunication Services | 3,108,633 | 0.1 | ||||||
| Utilities | 26,822,925 | 1.1 | ||||||
| Money Market Funds | 1,250,165,700 | 50.2 | ||||||
| Other Investments | 106,806,095 | 4.3 | ||||||
|
|
|
| |||||
| Total Investments In Securities, At Value | 1,700,833,573 | 68.3 | ||||||
| Other Assets in Excess of Liabilities (l) | 787,914,161 | 31.7 | ||||||
|
|
|
| |||||
Net Assets | $ | 2,488,747,734 | 100.0 | % | ||||
|
|
|
| |||||
| † | Non-income producing security. |
| (a) | Represents less than 0.05% of net assets. |
| (b) | All or a portion of this security has been segregated as collateral for securities sold short and can be sold or replaced subject to the broker’s right to re-hypothecate. At December 31, 2015, the value of these securities was $180,195,228. In addition, $555,127,262 of cash collateral was pledged. |
| (c) | Security fair valued as of December 31, 2015 using procedures approved by the Board of Trustees. The total value of positions fair valued was $825,263 or 0.0% of total net assets. |
| (d) | Security is perpetual and, thus, does not have a predetermined maturity date. The date shown, if applicable, reflects the next |
| call date. The rate shown represents the variable dividend rate in effect as of the close of the reporting period. |
| (e) | Defaulted security. |
| (f) | Rule 144A, Section 4(2) or other security which is restricted as to resale to institutional investors. The Fund Adviser has deemed this security to be liquid based upon procedures approved by the Board of Trustees. |
| (g) | Represents a step bond. The rate shown reflects the rate as of close of the reporting period. |
| (h) | Indicates a variable rate security. The interest rate shown represents the rate as of the close of the reporting period. |
| (i) | Represents annualized seven-day yield as of the close of the reporting period. |
| (j) | All or a portion of the security is pledged as collateral to the brokers for forward foreign currency exchange and swap contracts. |
| (k) | The rate shown is the effective yield at the date of purchase. |
| (l) | Includes appreciation/(depreciation) on forward foreign currency exchange, futures and swap contracts. |
| ^ | All or a portion represents positions held in the respective Subsidiary (See Note 2). |
All securities are Level 2 with respect to ASC 820, unless otherwise noted in parentheses.
| (1) | Level 1 security (See Note 5). |
| (3) | Level 3 security (See Note 5). |
The following abbreviations are used in portfolio descriptions:
144A - Restricted Security
ADR - American Depositary Receipt
REIT - Real Estate Investment Trust
Credit default swap contracts sell protection as of December 31, 2015:
| COUNTERPARTY | REFERENCE ENTITY | FIXED ANNUAL RATE RECEIVED BY FUND | CURRENCY | CREDIT SPREAD | NOTIONAL AMOUNT | UPFRONT PREMIUM (RECEIVED) PAID | TERMINATION DATE | UNREALIZED APPRECIATION (DEPRECIATION) | ||||||||||||||||||||
| Exchange Cleared | ||||||||||||||||||||||||||||
| CitiBank | Markit CDX North America High Yield Index Series 25 | 5.000% | USD | 4.726% | 15,125,000 | $321,995 | 12/20/2020 | $(127,930 | ) | |||||||||||||||||||
|
|
|
| |||||||||||||||||||||||||
| The accompanying notes are an integral part of these financial statements. | (Continued) |
| AQR Funds | Annual Report | December 2015 | ||||||||||||||
161
Table of Contents
| Consolidated Schedule of Investments | December 31, 2015 |
| AQR MULTI-STRATEGY ALTERNATIVE FUND |
Total return swap contracts outstanding as of December 31, 2015:
Over the Counter
| COUNTERPARTY | UNDERLYING REFERENCE INSTRUMENT | TERMINATION DATE | CURRENCY | NOTIONAL VALUE | UNREALIZED APPRECIATION (DEPRECIATION) | |||||||||
| Morgan Stanley and Co., International PLC | Bovespa Index February Futures | 02/2016 | BRL | (105,840,502 | ) | $1,307,377 | ||||||||
| Goldman Sachs | CNX Nifty Index January Futures | 01/2016 | INR | (1,200,371,749 | ) | (38,985 | ) | |||||||
| CitiBank | Corn March Futures^ | 02/2016 | USD | 18,050,297 | (794,421 | ) | ||||||||
| Deutsche Bank | Corn March Futures^ | 02/2016 | USD | 11,002,532 | (490,758 | ) | ||||||||
| Deutsche Bank | Corn March Futures^ | 02/2016 | USD | (5,974,692 | ) | 91,118 | ||||||||
| Macquarie Capital | Corn March Futures^ | 02/2016 | USD | 205,325 | (8,013 | ) | ||||||||
| Societe Generale | Corn March Futures^ | 02/2016 | USD | 672,699 | (26,949 | ) | ||||||||
| CitiBank | Cotton No. 2 March Futures^ | 02/2016 | USD | 1,289,630 | (24,030 | ) | ||||||||
| Bank of America | H-SHARES Index January Futures | 01/2016 | HKD | 205,684,266 | (555,470 | ) | ||||||||
| Morgan Stanley and Co., International PLC | KOSPI Index 200 March Futures | 03/2016 | KRW | 36,111,474,943 | 267,248 | |||||||||
| Macquarie Capital | Live Cattle February Futures^ | 02/2016 | USD | (5,789,864 | ) | (119,896 | ) | |||||||
| Merrill Lynch | Live Cattle February Futures^ | 02/2016 | USD | (965,770 | ) | (19,190 | ) | |||||||
| Societe Generale | Live Cattle February Futures^ | 02/2016 | USD | (2,091,003 | ) | (43,077 | ) | |||||||
| Morgan Stanley and Co., International PLC | MSCI Taiwan Stock Index January Futures | 01/2016 | USD | (8,700,839 | ) | 55,879 | ||||||||
| Morgan Stanley and Co., International PLC | SGX FTSE China A50 Index January Futures | 01/2016 | USD | 2,035,154 | (35,384 | ) | ||||||||
| Morgan Stanley and Co., International PLC | SGX S&P CNX Nifty Index January Futures | 01/2016 | USD | (14,713,525 | ) | (22,067 | ) | |||||||
| Deutsche Bank | Soybean March Futures^ | 02/2016 | USD | 12,550,978 | (321,579 | ) | ||||||||
| Deutsche Bank | Soybean March Futures^ | 02/2016 | USD | (6,274,052 | ) | 94,587 | ||||||||
| Societe Generale | Soybean March Futures^ | 02/2016 | USD | 7,639,653 | (207,103 | ) | ||||||||
| CitiBank | Soybean Meal March Futures^ | 02/2016 | USD | (4,993,560 | ) | 214,560 | ||||||||
| Deutsche Bank | Soybean Meal March Futures^ | 02/2016 | USD | (2,711,684 | ) | 136,334 | ||||||||
| Societe Generale | Soybean Meal March Futures^ | 02/2016 | USD | (2,467,279 | ) | 130,879 | ||||||||
| Morgan Stanley and Co., International PLC | Swiss Market Index March Futures | 03/2016 | CHF | (169,375,953 | ) | (5,232,380 | ) | |||||||
| Morgan Stanley and Co., International PLC | Taiwan Stock Exchange January Futures | 01/2016 | TWD | (108,595,501 | ) | (120,383 | ) | |||||||
| Bank of America | Tel Aviv 25 Index January Futures | 01/2016 | ILS | 21,273,893 | 72,491 | |||||||||
| Bank of America | U.S. Treasury 2-Year Note March Futures | 03/2016 | USD | (112,020,742 | ) | 145,039 | ||||||||
| Bank of America | U.S. Treasury 5-Year Note March Futures | 03/2016 | USD | (8,774,683 | ) | 18,980 | ||||||||
| CitiBank | Wheat March Futures^ | 02/2016 | USD | (1,965,477 | ) | 14,977 | ||||||||
| Deutsche Bank | Wheat March Futures^ | 02/2016 | USD | (538,131 | ) | 21,131 | ||||||||
| Goldman Sachs | WIG20 Index March Futures | 03/2016 | PLN | (13,030,866 | ) | (146,195 | ) | |||||||
|
| |||||||||||||
| $(5,635,280 | ) | |||||||||||||
|
| |||||||||||||
| ^ | Represents positions held in the respective Subsidiary (See Note 2). |
| The accompanying notes are an integral part of these financial statements. | (Continued) |
| AQR Funds | Annual Report | December 2015 | ||||||||||||||
162
Table of Contents
| Consolidated Schedule of Investments | December 31, 2015 |
| AQR MULTI-STRATEGY ALTERNATIVE FUND |
Open futures contracts outstanding at December 31, 2015:
Exchange Traded
| NUMBER OF CONTRACTS | COUNTERPARTY | DESCRIPTION | EXPIRATION DATE | VALUE AT TRADE DATE | VALUE AT DECEMBER 31, 2015 | UNREALIZED APPRECIATION (DEPRECIATION) | ||||||||||||||
| Long Contracts: | ||||||||||||||||||||
| 331 | Goldman Sachs | Brent Crude Futures^ | 01/2016 | $12,439,962 | $12,468,770 | $28,808 | ||||||||||||||
| 140 | Goldman Sachs | Cocoa Futures^ | 03/2016 | 4,709,250 | 4,668,497 | (40,753 | ) | |||||||||||||
| 96 | Morgan Stanley and Co., International PLC | Cocoa Futures^ | 03/2016 | 3,179,252 | 3,082,560 | (96,692 | ) | |||||||||||||
| 32 | Morgan Stanley and Co., International PLC | Cotton No. 2 Futures^ | 03/2016 | 1,009,141 | 1,012,480 | 3,339 | ||||||||||||||
| 5 | J.P. Morgan | LME Aluminum Futures^ | 01/2016 | 195,981 | 187,531 | (8,450 | ) | |||||||||||||
| 5 | J.P. Morgan | LME Aluminum Futures^ | 01/2016 | 195,262 | 187,575 | (7,687 | ) | |||||||||||||
| 2 | J.P. Morgan | LME Aluminum Futures^ | 01/2016 | 78,981 | 75,048 | (3,933 | ) | |||||||||||||
| 2 | J.P. Morgan | LME Aluminum Futures^ | 01/2016 | 79,905 | 75,065 | (4,840 | ) | |||||||||||||
| 1 | J.P. Morgan | LME Aluminum Futures^ | 01/2016 | 38,765 | 37,628 | (1,137 | ) | |||||||||||||
| 1 | J.P. Morgan | LME Aluminum Futures^ | 01/2016 | 38,002 | 37,637 | (365 | ) | |||||||||||||
| 3 | J.P. Morgan | LME Aluminum Futures^ | 01/2016 | 113,396 | 112,913 | (483 | ) | |||||||||||||
| 2 | J.P. Morgan | LME Aluminum Futures^ | 01/2016 | 75,755 | 75,275 | (480 | ) | |||||||||||||
| 3 | J.P. Morgan | LME Aluminum Futures^ | 01/2016 | 111,765 | 112,913 | 1,148 | ||||||||||||||
| 3 | J.P. Morgan | LME Aluminum Futures^ | 01/2016 | 111,907 | 112,935 | 1,028 | ||||||||||||||
| 9 | J.P. Morgan | LME Aluminum Futures^ | 01/2016 | 331,391 | 338,875 | 7,484 | ||||||||||||||
| 4 | J.P. Morgan | LME Aluminum Futures^ | 02/2016 | 148,837 | 150,732 | 1,895 | ||||||||||||||
| 1 | J.P. Morgan | LME Aluminum Futures^ | 02/2016 | 37,628 | 37,691 | 63 | ||||||||||||||
| 3 | J.P. Morgan | LME Aluminum Futures^ | 02/2016 | 112,189 | 113,118 | 929 | ||||||||||||||
| 3 | J.P. Morgan | LME Aluminum Futures^ | 03/2016 | 113,362 | 113,344 | (18 | ) | |||||||||||||
| 2 | J.P. Morgan | LME Aluminum Futures^ | 03/2016 | 74,219 | 75,538 | 1,319 | ||||||||||||||
| 18 | J.P. Morgan | LME Aluminum Futures^ | 03/2016 | 679,240 | 678,487 | (753 | ) | |||||||||||||
| 13 | J.P. Morgan | LME Aluminum Futures^ | 03/2016 | 495,472 | 489,801 | (5,671 | ) | |||||||||||||
| 6 | J.P. Morgan | LME Copper Futures^ | 01/2016 | 774,018 | 705,863 | (68,155 | ) | |||||||||||||
| 5 | J.P. Morgan | LME Copper Futures^ | 01/2016 | 648,265 | 588,275 | (59,990 | ) | |||||||||||||
| 4 | J.P. Morgan | LME Copper Futures^ | 01/2016 | 514,010 | 470,710 | (43,300 | ) | |||||||||||||
| 1 | J.P. Morgan | LME Copper Futures^ | 01/2016 | 130,677 | 117,778 | (12,899 | ) | |||||||||||||
| 1 | J.P. Morgan | LME Copper Futures^ | 01/2016 | 130,449 | 117,750 | (12,699 | ) | |||||||||||||
| 2 | J.P. Morgan | LME Copper Futures^ | 01/2016 | 259,823 | 235,505 | (24,318 | ) | |||||||||||||
| 2 | J.P. Morgan | LME Copper Futures^ | 02/2016 | 249,005 | 235,563 | (13,442 | ) | |||||||||||||
| 11 | J.P. Morgan | LME Copper Futures^ | 02/2016 | 1,354,495 | 1,295,594 | (58,901 | ) | |||||||||||||
| 26 | J.P. Morgan | LME Copper Futures^ | 02/2016 | 3,198,497 | 3,062,313 | (136,184 | ) | |||||||||||||
| 11 | J.P. Morgan | LME Copper Futures^ | 02/2016 | 1,329,485 | 1,295,593 | (33,892 | ) | |||||||||||||
| 26 | J.P. Morgan | LME Copper Futures^ | 02/2016 | 3,031,027 | 3,062,313 | 31,286 | ||||||||||||||
| 15 | J.P. Morgan | LME Copper Futures^ | 02/2016 | 1,735,031 | 1,766,667 | 31,636 | ||||||||||||||
| 7 | J.P. Morgan | LME Copper Futures^ | 02/2016 | 808,842 | 824,421 | 15,579 | ||||||||||||||
| 4 | J.P. Morgan | LME Copper Futures^ | 02/2016 | 446,110 | 471,070 | 24,960 | ||||||||||||||
| 2 | J.P. Morgan | LME Copper Futures^ | 02/2016 | 225,655 | 235,529 | 9,874 | ||||||||||||||
| 8 | J.P. Morgan | LME Copper Futures^ | 03/2016 | 923,224 | 942,004 | 18,780 | ||||||||||||||
| 11 | J.P. Morgan | LME Copper Futures^ | 03/2016 | 1,267,227 | 1,295,220 | 27,993 | ||||||||||||||
| 10 | J.P. Morgan | LME Copper Futures^ | 03/2016 | 1,152,687 | 1,177,438 | 24,751 | ||||||||||||||
| 29 | J.P. Morgan | LME Copper Futures^ | 03/2016 | 3,331,446 | 3,414,569 | 83,123 | ||||||||||||||
| 1 | J.P. Morgan | LME Copper Futures^ | 03/2016 | 113,752 | 117,743 | 3,991 | ||||||||||||||
| 1 | J.P. Morgan | LME Copper Futures^ | 03/2016 | 115,727 | 117,738 | 2,011 | ||||||||||||||
| 1 | J.P. Morgan | LME Copper Futures^ | 03/2016 | 114,652 | 117,733 | 3,081 | ||||||||||||||
| 82 | J.P. Morgan | LME Copper Futures^ | 03/2016 | 9,311,019 | 9,651,913 | 340,894 | ||||||||||||||
| 1 | J.P. Morgan | LME Nickel Futures^ | 01/2016 | 63,393 | 52,712 | (10,681 | ) | |||||||||||||
| 1 | J.P. Morgan | LME Nickel Futures^ | 02/2016 | 56,882 | 52,799 | (4,083 | ) | |||||||||||||
| 2 | J.P. Morgan | LME Nickel Futures^ | 03/2016 | 104,165 | 105,836 | 1,671 | ||||||||||||||
| The accompanying notes are an integral part of these financial statements. | (Continued) |
| AQR Funds | Annual Report | December 2015 | ||||||||||||||
163
Table of Contents
| Consolidated Schedule of Investments | December 31, 2015 |
| AQR MULTI-STRATEGY ALTERNATIVE FUND |
| NUMBER OF CONTRACTS | COUNTERPARTY | DESCRIPTION | EXPIRATION DATE | VALUE AT TRADE DATE | VALUE AT DECEMBER 31, 2015 | UNREALIZED APPRECIATION (DEPRECIATION) | ||||||||||||||
| Long Contracts: (continued) | ||||||||||||||||||||
| 8 | J.P. Morgan | LME Zinc Futures^ | 01/2016 | $ 374,319 | $ 319,226 | $ (55,093 | ) | |||||||||||||
| 6 | J.P. Morgan | LME Zinc Futures^ | 01/2016 | 272,751 | 239,493 | (33,258 | ) | |||||||||||||
| 3 | J.P. Morgan | LME Zinc Futures^ | 02/2016 | 124,207 | 120,182 | (4,025 | ) | |||||||||||||
| 6 | J.P. Morgan | LME Zinc Futures^ | 02/2016 | 249,015 | 240,456 | (8,559 | ) | |||||||||||||
| 2 | J.P. Morgan | LME Zinc Futures^ | 02/2016 | 80,605 | 80,160 | (445 | ) | |||||||||||||
| 1 | J.P. Morgan | LME Zinc Futures^ | 02/2016 | 39,659 | 40,084 | 425 | ||||||||||||||
| 1 | J.P. Morgan | LME Zinc Futures^ | 03/2016 | 38,002 | 40,164 | 2,162 | ||||||||||||||
| 2 | J.P. Morgan | LME Zinc Futures^ | 03/2016 | 77,105 | 80,343 | 3,238 | ||||||||||||||
| 2 | J.P. Morgan | LME Zinc Futures^ | 03/2016 | 74,006 | 80,450 | 6,444 | ||||||||||||||
| 2 | J.P. Morgan | LME Zinc Futures^ | 03/2016 | 75,856 | 80,450 | 4,594 | ||||||||||||||
| 206 | Morgan Stanley and Co., International PLC | Silver Futures^ | 03/2016 | 14,509,257 | 14,217,090 | (292,167 | ) | |||||||||||||
| 54 | Morgan Stanley and Co., International PLC | Soybean Oil Futures^ | 03/2016 | 1,002,330 | 996,300 | (6,030 | ) | |||||||||||||
| 75 | Morgan Stanley and Co., International PLC | Sugar #11 (World Markets) Futures^ | 02/2016 | 1,291,416 | 1,280,160 | (11,256 | ) | |||||||||||||
| 2 | Morgan Stanley and Co., International PLC | WTI Crude Futures^ | 01/2016 | 73,971 | 74,080 | 109 | ||||||||||||||
| 16 | Barclays Capital | Amsterdam Index Futures | 01/2016 | 1,518,382 | 1,536,577 | 18,195 | ||||||||||||||
| 585 | J.P. Morgan | BIST 30 Futures | 02/2016 | 1,847,353 | 1,786,754 | (60,599 | ) | |||||||||||||
| 724 | Barclays Capital | CAC40 Index Futures | 01/2016 | 36,263,669 | 36,496,042 | 232,373 | ||||||||||||||
| 75 | Barclays Capital | DAX Index Futures | 03/2016 | 21,639,699 | 21,949,632 | 309,933 | ||||||||||||||
| 100 | Barclays Capital | E-Mini DJIA CBOT Futures | 03/2016 | 8,661,658 | 8,670,500 | 8,842 | ||||||||||||||
| 2,714 | Barclays Capital | Euro Stoxx 50 Index | 03/2016 | 95,701,836 | 96,800,603 | 1,098,767 | ||||||||||||||
| 503 | J.P. Morgan | FTSE/JSE Top 40 Index Futures | 03/2016 | 14,384,838 | 15,049,995 | 665,157 | ||||||||||||||
| 62 | Barclays Capital | FTSE/MIB Index Futures | 03/2016 | 7,235,538 | 7,223,648 | (11,890 | ) | |||||||||||||
| 77 | J.P. Morgan | KOSPI Index 200 Futures | 03/2016 | 7,803,142 | 7,895,037 | 91,895 | ||||||||||||||
| 387 | Barclays Capital | NASDAQ 100 E-Mini Futures | 03/2016 | 35,404,693 | 35,509,185 | 104,492 | ||||||||||||||
| 120 | J.P. Morgan | Nikkei 225 Futures | 03/2016 | 19,601,764 | 18,999,126 | (602,638 | ) | |||||||||||||
| 302 | J.P. Morgan | SGX FTSE China A50 Index Futures | 01/2016 | 3,232,574 | 3,161,940 | (70,634 | ) | |||||||||||||
| 1,485 | Barclays Capital | TOPIX Index Futures | 03/2016 | 194,065,275 | 191,192,437 | (2,872,838 | ) | |||||||||||||
| 45 | J.P. Morgan | 3-Month Euro Euribor Futures | 12/2016 | 12,256,312 | 12,247,333 | (8,979 | ) | |||||||||||||
| 254 | J.P. Morgan | 3-Month Euro Euribor Futures | 03/2017 | 69,132,772 | 69,115,587 | (17,185 | ) | |||||||||||||
| 267 | J.P. Morgan | 3-Month Euro Euribor Futures | 06/2017 | 72,648,832 | 72,623,982 | (24,850 | ) | |||||||||||||
| 290 | J.P. Morgan | 3-Month Euro Euribor Futures | 09/2017 | 78,911,900 | 78,840,586 | (71,314 | ) | |||||||||||||
| 175 | J.P. Morgan | 3-Month Euro Euribor Futures | 12/2017 | 47,583,424 | 47,547,689 | (35,735 | ) | |||||||||||||
| 290 | J.P. Morgan | 90-Day Sterling Futures | 03/2016 | 52,998,764 | 53,097,740 | 98,976 | ||||||||||||||
| 2,600 | J.P. Morgan | 90-Day Sterling Futures | 06/2016 | 474,484,924 | 475,569,543 | 1,084,619 | ||||||||||||||
| 1,705 | J.P. Morgan | 90-Day Sterling Futures | 09/2016 | 311,370,909 | 311,455,428 | 84,519 | ||||||||||||||
| 2,512 | J.P. Morgan | 90-Day Sterling Futures | 12/2016 | 458,547,433 | 458,177,227 | (370,206 | ) | |||||||||||||
| 125 | J.P. Morgan | 90-Day Sterling Futures | 03/2017 | 22,812,904 | 22,767,176 | (45,728 | ) | |||||||||||||
| 108 | J.P. Morgan | 90-Day Sterling Futures | 06/2017 | 19,688,751 | 19,642,978 | (45,773 | ) | |||||||||||||
| 59 | J.P. Morgan | 90-Day Sterling Futures | 09/2017 | 10,746,522 | 10,718,926 | (27,596 | ) | |||||||||||||
| 63 | J.P. Morgan | 90-Day Sterling Futures | 12/2017 | 11,458,864 | 11,434,026 | (24,838 | ) | |||||||||||||
| 580 | Goldman Sachs | Canadian 10-Year Bond Futures | 03/2016 | 57,967,286 | 59,098,215 | 1,130,929 | ||||||||||||||
| 373 | J.P. Morgan | Canadian 3-Month Bank Acceptance Futures | 09/2016 | 66,869,609 | 66,882,968 | 13,359 | ||||||||||||||
| 189 | J.P. Morgan | Canadian 3-Month Bank Acceptance Futures | 12/2016 | 33,858,848 | 33,877,809 | 18,961 | ||||||||||||||
| 176 | Goldman Sachs | Euro - Bobl Futures | 03/2016 | 25,189,537 | 24,992,989 | (196,548 | ) | |||||||||||||
| 45 | Goldman Sachs | Euro - OAT Futures | 03/2016 | 7,441,112 | 7,338,007 | (103,105 | ) | |||||||||||||
| The accompanying notes are an integral part of these financial statements. | (Continued) |
| AQR Funds | Annual Report | December 2015 | ||||||||||||||
164
Table of Contents
| Consolidated Schedule of Investments | December 31, 2015 |
| AQR MULTI-STRATEGY ALTERNATIVE FUND |
| NUMBER OF CONTRACTS | COUNTERPARTY | DESCRIPTION | EXPIRATION DATE | VALUE AT TRADE DATE | VALUE AT DECEMBER 31, 2015 | UNREALIZED APPRECIATION (DEPRECIATION) | ||||||||||||||
| Long Contracts: (continued) | ||||||||||||||||||||
| 389 | Goldman Sachs | Euro - SCHATZ Futures | 03/2016 | $ 47,237,446 | $ 47,140,378 | $ (97,068 | ) | |||||||||||||
| 25 | J.P. Morgan | Euro CHF 3-Month LIFFE Futures | 06/2016 | 6,302,197 | 6,288,688 | (13,509 | ) | |||||||||||||
| 30 | J.P. Morgan | Euro CHF 3-Month LIFFE Futures | 09/2016 | 7,561,024 | 7,546,426 | (14,598 | ) | |||||||||||||
| 28 | J.P. Morgan | Euro CHF 3-Month LIFFE Futures | 12/2016 | 7,051,951 | 7,042,632 | (9,319 | ) | |||||||||||||
| 362 | Goldman Sachs | Euro - BTP Italian Government Bond Futures | 03/2016 | 54,537,305 | 54,258,210 | (279,095 | ) | |||||||||||||
| 179 | Goldman Sachs | Euro - Bund Futures | 03/2016 | 30,912,214 | 30,719,900 | (192,314 | ) | |||||||||||||
| 605 | Morgan Stanley and Co., International PLC | U.S. Treasury 10-Year Note Futures | 03/2016 | 76,566,583 | 76,173,281 | (393,302 | ) | |||||||||||||
|
|
|
|
|
| |||||||||||||||
| 2,585,539,568 | 2,584,532,900 | (1,006,668 | ) | |||||||||||||||||
|
|
|
|
|
| |||||||||||||||
| Short Contracts: | ||||||||||||||||||||
| 79 | Morgan Stanley and Co., International PLC | Coffee ‘C’ Futures^ | 03/2016 | $(3,625,049 | ) | $(3,753,488 | ) | $(128,439 | ) | |||||||||||
| 180 | Morgan Stanley and Co., International PLC | Copper Futures^ | 03/2016 | (9,339,630 | ) | (9,607,500 | ) | (267,870 | ) | |||||||||||
| 649 | Morgan Stanley and Co., International PLC | Corn Futures^ | 03/2016 | (11,976,151 | ) | (11,641,438 | ) | 334,713 | ||||||||||||
| 334 | Goldman Sachs | Gas Oil Futures^ | 02/2016 | (12,777,437 | ) | (11,163,950 | ) | 1,613,487 | ||||||||||||
| 101 | Morgan Stanley and Co., International PLC | Gasoline RBOB Futures^ | 01/2016 | (5,310,146 | ) | (5,391,582 | ) | (81,436 | ) | |||||||||||
| 398 | Morgan Stanley and Co., International PLC | Gold 100 OZ Futures^ | 02/2016 | (42,907,144 | ) | (42,195,960 | ) | 711,184 | ||||||||||||
| 116 | Morgan Stanley and Co., International PLC | Hard Red Winter Wheat Futures^ | 03/2016 | (2,818,125 | ) | (2,717,300 | ) | 100,825 | ||||||||||||
| 158 | Morgan Stanley and Co., International PLC | Heating Oil ULSD Futures^ | 01/2016 | (8,437,545 | ) | (7,458,201 | ) | 979,344 | ||||||||||||
| 86 | Morgan Stanley and Co., International PLC | Lean Hogs Futures^ | 02/2016 | (1,984,992 | ) | (2,057,120 | ) | (72,128 | ) | |||||||||||
| 30 | Morgan Stanley and Co., International PLC | Live Cattle Futures^ | 02/2016 | (1,583,184 | ) | (1,641,600 | ) | (58,416 | ) | |||||||||||
| 5 | J.P. Morgan | LME Aluminum Futures^ | 01/2016 | (195,472 | ) | (187,531 | ) | 7,941 | ||||||||||||
| 5 | J.P. Morgan | LME Aluminum Futures^ | 01/2016 | (194,437 | ) | (187,575 | ) | 6,862 | ||||||||||||
| 2 | J.P. Morgan | LME Aluminum Futures^ | 01/2016 | (78,363 | ) | (75,047 | ) | 3,316 | ||||||||||||
| 2 | J.P. Morgan | LME Aluminum Futures^ | 01/2016 | (79,626 | ) | (75,065 | ) | 4,561 | ||||||||||||
| 1 | J.P. Morgan | LME Aluminum Futures^ | 01/2016 | (38,872 | ) | (37,629 | ) | 1,243 | ||||||||||||
| 1 | J.P. Morgan | LME Aluminum Futures^ | 01/2016 | (38,019 | ) | (37,638 | ) | 381 | ||||||||||||
| 3 | J.P. Morgan | LME Aluminum Futures^ | 01/2016 | (113,268 | ) | (112,913 | ) | 355 | ||||||||||||
| 2 | J.P. Morgan | LME Aluminum Futures^ | 01/2016 | (75,082 | ) | (75,275 | ) | (193 | ) | |||||||||||
| 3 | J.P. Morgan | LME Aluminum Futures^ | 01/2016 | (111,409 | ) | (112,913 | ) | (1,504 | ) | |||||||||||
| 3 | J.P. Morgan | LME Aluminum Futures^ | 01/2016 | (110,940 | ) | (112,935 | ) | (1,995 | ) | |||||||||||
| 9 | J.P. Morgan | LME Aluminum Futures^ | 01/2016 | (331,758 | ) | (338,875 | ) | (7,117 | ) | |||||||||||
| The accompanying notes are an integral part of these financial statements. | (Continued) |
| AQR Funds | Annual Report | December 2015 | ||||||||||||||
165
Table of Contents
| Consolidated Schedule of Investments | December 31, 2015 |
| AQR MULTI-STRATEGY ALTERNATIVE FUND |
| NUMBER OF CONTRACTS | COUNTERPARTY | DESCRIPTION | EXPIRATION DATE | VALUE AT TRADE DATE | VALUE AT DECEMBER 31, 2015 | UNREALIZED APPRECIATION (DEPRECIATION) | ||||||||||||||
| Short Contracts: (continued) | ||||||||||||||||||||
| 4 | J.P. Morgan | LME Aluminum Futures^ | 02/2016 | $ (148,644 | ) | $ (150,732 | ) | $ (2,088 | ) | |||||||||||
| 1 | J.P. Morgan | LME Aluminum Futures^ | 02/2016 | (37,555 | ) | (37,691 | ) | (136 | ) | |||||||||||
| 3 | J.P. Morgan | LME Aluminum Futures^ | 02/2016 | (112,130 | ) | (113,117 | ) | (987 | ) | |||||||||||
| 3 | J.P. Morgan | LME Aluminum Futures^ | 03/2016 | (113,093 | ) | (113,344 | ) | (251 | ) | |||||||||||
| 2 | J.P. Morgan | LME Aluminum Futures^ | 03/2016 | (73,695 | ) | (75,537 | ) | (1,842 | ) | |||||||||||
| 113 | J.P. Morgan | LME Aluminum Futures^ | 03/2016 | (4,086,029 | ) | (4,259,394 | ) | (173,365 | ) | |||||||||||
| 13 | J.P. Morgan | LME Aluminum Futures^ | 03/2016 | (492,018 | ) | (489,801 | ) | 2,217 | ||||||||||||
| 6 | J.P. Morgan | LME Copper Futures^ | 01/2016 | (773,820 | ) | (705,862 | ) | 67,958 | ||||||||||||
| 5 | J.P. Morgan | LME Copper Futures^ | 01/2016 | (643,696 | ) | (588,275 | ) | 55,421 | ||||||||||||
| 4 | J.P. Morgan | LME Copper Futures^ | 01/2016 | (511,319 | ) | (470,710 | ) | 40,609 | ||||||||||||
| 1 | J.P. Morgan | LME Copper Futures^ | 01/2016 | (131,272 | ) | (117,778 | ) | 13,494 | ||||||||||||
| 1 | J.P. Morgan | LME Copper Futures^ | 01/2016 | (130,373 | ) | (117,750 | ) | 12,623 | ||||||||||||
| 2 | J.P. Morgan | LME Copper Futures^ | 01/2016 | (260,994 | ) | (235,505 | ) | 25,489 | ||||||||||||
| 2 | J.P. Morgan | LME Copper Futures^ | 02/2016 | (248,973 | ) | (235,562 | ) | 13,411 | ||||||||||||
| 11 | J.P. Morgan | LME Copper Futures^ | 02/2016 | (1,355,723 | ) | (1,295,594 | ) | 60,129 | ||||||||||||
| 26 | J.P. Morgan | LME Copper Futures^ | 02/2016 | (3,201,173 | ) | (3,062,312 | ) | 138,861 | ||||||||||||
| 11 | J.P. Morgan | LME Copper Futures^ | 02/2016 | (1,325,894 | ) | (1,295,594 | ) | 30,300 | ||||||||||||
| 26 | J.P. Morgan | LME Copper Futures^ | 02/2016 | (3,043,075 | ) | (3,062,313 | ) | (19,238 | ) | |||||||||||
| 15 | J.P. Morgan | LME Copper Futures^ | 02/2016 | (1,740,249 | ) | (1,766,666 | ) | (26,417 | ) | |||||||||||
| 7 | J.P. Morgan | LME Copper Futures^ | 02/2016 | (808,529 | ) | (824,422 | ) | (15,893 | ) | |||||||||||
| 4 | J.P. Morgan | LME Copper Futures^ | 02/2016 | (447,312 | ) | (471,070 | ) | (23,758 | ) | |||||||||||
| 2 | J.P. Morgan | LME Copper Futures^ | 02/2016 | (225,375 | ) | (235,528 | ) | (10,153 | ) | |||||||||||
| 8 | J.P. Morgan | LME Copper Futures^ | 03/2016 | (920,962 | ) | (942,004 | ) | (21,042 | ) | |||||||||||
| 11 | J.P. Morgan | LME Copper Futures^ | 03/2016 | (1,263,335 | ) | (1,295,220 | ) | (31,885 | ) | |||||||||||
| 10 | J.P. Morgan | LME Copper Futures^ | 03/2016 | (1,152,311 | ) | (1,177,437 | ) | (25,126 | ) | |||||||||||
| 29 | J.P. Morgan | LME Copper Futures^ | 03/2016 | (3,329,197 | ) | (3,414,569 | ) | (85,372 | ) | |||||||||||
| 1 | J.P. Morgan | LME Copper Futures^ | 03/2016 | (113,952 | ) | (117,744 | ) | (3,792 | ) | |||||||||||
| 1 | J.P. Morgan | LME Copper Futures^ | 03/2016 | (115,370 | ) | (117,738 | ) | (2,368 | ) | |||||||||||
| 1 | J.P. Morgan | LME Copper Futures^ | 03/2016 | (114,640 | ) | (117,734 | ) | (3,094 | ) | |||||||||||
| 70 | J.P. Morgan | LME Copper Futures^ | 03/2016 | (8,036,751 | ) | (8,239,438 | ) | (202,687 | ) | |||||||||||
| 1 | J.P. Morgan | LME Nickel Futures^ | 01/2016 | (63,568 | ) | (52,712 | ) | 10,856 | ||||||||||||
| 1 | J.P. Morgan | LME Nickel Futures^ | 02/2016 | (56,913 | ) | (52,800 | ) | 4,113 | ||||||||||||
| 36 | J.P. Morgan | LME Nickel Futures^ | 03/2016 | (1,833,320 | ) | (1,903,824 | ) | (70,504 | ) | |||||||||||
| 2 | J.P. Morgan | LME Nickel Futures^ | 03/2016 | (104,389 | ) | (105,836 | ) | (1,447 | ) | |||||||||||
| 8 | J.P. Morgan | LME Zinc Futures^ | 01/2016 | (368,380 | ) | (319,226 | ) | 49,154 | ||||||||||||
| 6 | J.P. Morgan | LME Zinc Futures^ | 01/2016 | (272,985 | ) | (239,493 | ) | 33,492 | ||||||||||||
| 3 | J.P. Morgan | LME Zinc Futures^ | 02/2016 | (124,480 | ) | (120,182 | ) | 4,298 | ||||||||||||
| 6 | J.P. Morgan | LME Zinc Futures^ | 02/2016 | (248,997 | ) | (240,456 | ) | 8,541 | ||||||||||||
| 2 | J.P. Morgan | LME Zinc Futures^ | 02/2016 | (80,336 | ) | (80,160 | ) | 176 | ||||||||||||
| 1 | J.P. Morgan | LME Zinc Futures^ | 02/2016 | (39,592 | ) | (40,084 | ) | (492 | ) | |||||||||||
| 1 | J.P. Morgan | LME Zinc Futures^ | 03/2016 | (38,051 | ) | (40,164 | ) | (2,113 | ) | |||||||||||
| 2 | J.P. Morgan | LME Zinc Futures^ | 03/2016 | (77,216 | ) | (80,343 | ) | (3,127 | ) | |||||||||||
| 68 | J.P. Morgan | LME Zinc Futures^ | 03/2016 | (2,660,819 | ) | (2,735,300 | ) | (74,481 | ) | |||||||||||
| 2 | J.P. Morgan | LME Zinc Futures^ | 03/2016 | (74,246 | ) | (80,450 | ) | (6,204 | ) | |||||||||||
| 2 | J.P. Morgan | LME Zinc Futures^ | 03/2016 | (75,501 | ) | (80,450 | ) | (4,949 | ) | |||||||||||
| 371 | Morgan Stanley and Co., International PLC | Natural Gas Futures^ | 01/2016 | (7,817,420 | ) | (8,670,270 | ) | (852,850 | ) | |||||||||||
| 38 | Morgan Stanley and Co., International PLC | Nymex Palladium Futures^ | 03/2016 | (2,073,722 | ) | (2,135,600 | ) | (61,878 | ) | |||||||||||
| 73 | Morgan Stanley and Co., International PLC | Platinum Futures^ | 04/2016 | (3,174,246 | ) | (3,260,180 | ) | (85,934 | ) | |||||||||||
| 210 | Morgan Stanley and Co., International PLC | Soybean Futures^ | 03/2016 | (9,120,792 | ) | (9,074,625 | ) | 46,167 | ||||||||||||
| The accompanying notes are an integral part of these financial statements. | (Continued) |
| AQR Funds | Annual Report | December 2015 | ||||||||||||||
166
Table of Contents
| Consolidated Schedule of Investments | December 31, 2015 |
| AQR MULTI-STRATEGY ALTERNATIVE FUND |
| NUMBER OF CONTRACTS | COUNTERPARTY | DESCRIPTION | EXPIRATION DATE | VALUE AT TRADE DATE | VALUE AT DECEMBER 31, 2015 | UNREALIZED APPRECIATION (DEPRECIATION) | ||||||||||||||
| Short Contracts: (continued) | ||||||||||||||||||||
| 82 | Morgan Stanley and Co., International PLC | Soybean Meal Futures^ | 03/2016 | $ (2,291,039 | ) | $ (2,177,100 | ) | $ 113,939 | ||||||||||||
| 171 | Morgan Stanley and Co., International PLC | Wheat Futures^ | 03/2016 | (4,213,366 | ) | (4,018,500 | ) | 194,866 | ||||||||||||
| 1 | J.P. Morgan | E-Mini MSCI EAFE Index Futures | 03/2016 | (84,805 | ) | (84,910 | ) | (105 | ) | |||||||||||
| 196 | Barclays Capital | E-Mini MSCI Emerging Markets Index Futures | 03/2016 | (7,524,852 | ) | (7,717,500 | ) | (192,648 | ) | |||||||||||
| 1,003 | Barclays Capital | E-Mini Russell 2000 Futures | 03/2016 | (113,020,734 | ) | (113,489,450 | ) | (468,716 | ) | |||||||||||
| 384 | Barclays Capital | FTSE 100 Index Futures | 03/2016 | (34,329,403 | ) | (35,086,431 | ) | (757,028 | ) | |||||||||||
| 344 | Barclays Capital | FTSE Bursa Malaysia KLCI Index Futures | 01/2016 | (6,715,048 | ) | (6,764,225 | ) | (49,177 | ) | |||||||||||
| 20 | Barclays Capital | Hang Seng Index Futures | 01/2016 | (2,838,900 | ) | (2,827,079 | ) | 11,821 | ||||||||||||
| 80 | Barclays Capital | H-SHARES Index Futures | 01/2016 | (5,070,587 | ) | (5,009,000 | ) | 61,587 | ||||||||||||
| 270 | Barclays Capital | IBEX 35 Index Futures | 01/2016 | (28,083,535 | ) | (27,952,307 | ) | 131,228 | ||||||||||||
| 84 | J.P. Morgan | Mexican Stock Exchange Price and Quotation Index Futures | 03/2016 | (2,080,591 | ) | (2,102,571 | ) | (21,980 | ) | |||||||||||
| 41 | Barclays Capital | MSCI Singapore Index Futures | 01/2016 | (933,808 | ) | (935,722 | ) | (1,914 | ) | |||||||||||
| 1,087 | Barclays Capital | MSCI Taiwan Stock Index Futures | 01/2016 | (33,292,776 | ) | (33,088,280 | ) | 204,496 | ||||||||||||
| 86 | J.P. Morgan | OMXS30 Index Futures | 01/2016 | (1,454,836 | ) | (1,475,196 | ) | (20,360 | ) | |||||||||||
| 1,343 | Barclays Capital | S&P 500 E-Mini Futures | 03/2016 | (136,213,940 | ) | (136,677,110 | ) | (463,170 | ) | |||||||||||
| 20 | Barclays Capital | S&P MID 400 E-Mini Futures | 03/2016 | (2,775,198 | ) | (2,787,000 | ) | (11,802 | ) | |||||||||||
| 125 | Barclays Capital | S&P/Toronto Stock Exchange 60 Index Futures | 03/2016 | (13,612,807 | ) | (13,747,561 | ) | (134,754 | ) | |||||||||||
| 2,261 | Barclays Capital | SET50 Index Futures | 03/2016 | (10,013,572 | ) | (9,985,219 | ) | 28,353 | ||||||||||||
| 205 | Barclays Capital | SGX S&P CNX Nifty Index Futures | 01/2016 | (3,250,171 | ) | (3,258,680 | ) | (8,509 | ) | |||||||||||
| 217 | Barclays Capital | SPI 200 Index Futures | 03/2016 | (20,093,163 | ) | (20,781,958 | ) | (688,795 | ) | |||||||||||
| 262 | Goldman Sachs | 10-Year Japanese Government Bond Futures | 03/2016 | (324,282,055 | ) | (324,876,076 | ) | (594,021 | ) | |||||||||||
| 61 | J.P. Morgan | 3-Month Euro Euribor Futures | 03/2016 | (16,605,465 | ) | (16,600,282 | ) | 5,183 | ||||||||||||
| 1,215 | J.P. Morgan | 3-Month Euro Euribor Futures | 06/2016 | (330,700,402 | ) | (330,694,487 | ) | 5,915 | ||||||||||||
| 378 | J.P. Morgan | 3-Month Euro Euribor Futures | 09/2016 | (102,891,714 | ) | (102,887,864 | ) | 3,850 | ||||||||||||
| 342 | J.P. Morgan | 90-Day EURODollar Futures | 06/2016 | (84,731,557 | ) | (84,730,500 | ) | 1,057 | ||||||||||||
| 693 | J.P. Morgan | 90-Day EURODollar Futures | 09/2016 | (171,451,288 | ) | (171,404,887 | ) | 46,401 | ||||||||||||
| 1,381 | J.P. Morgan | 90-Day EURODollar Futures | 12/2016 | (341,121,761 | ) | (341,003,425 | ) | 118,336 | ||||||||||||
| 138 | J.P. Morgan | 90-Day EURODollar Futures | 03/2017 | (34,022,469 | ) | (34,023,900 | ) | (1,431 | ) | |||||||||||
| 120 | J.P. Morgan | 90-Day EURODollar Futures | 06/2017 | (29,539,443 | ) | (29,541,000 | ) | (1,557 | ) | |||||||||||
| 106 | J.P. Morgan | 90-Day EURODollar Futures | 09/2017 | (26,056,250 | ) | (26,061,425 | ) | (5,175 | ) | |||||||||||
| 96 | J.P. Morgan | 90-Day EURODollar Futures | 12/2017 | (23,568,107 | ) | (23,574,000 | ) | (5,893 | ) | |||||||||||
| 2,825 | J.P. Morgan | Australia 10-Year Bond Futures | 03/2016 | (260,078,720 | ) | (261,217,697 | ) | (1,138,977 | ) | |||||||||||
| 854 | J.P. Morgan | Australia 3-Year Bond Futures | 03/2016 | (69,206,300 | ) | (69,367,101 | ) | (160,801 | ) | |||||||||||
| 106 | J.P. Morgan | Canadian 3-Month Bank Acceptance Futures | 03/2016 | (18,993,328 | ) | (18,999,295 | ) | (5,967 | ) | |||||||||||
| 158 | J.P. Morgan | Canadian 3-Month Bank Acceptance Futures | 06/2016 | (28,317,526 | ) | (28,329,695 | ) | (12,169 | ) | |||||||||||
| 57 | Morgan Stanley and Co., International PLC | CME Ultra Long Term U.S. Treasury Bond Futures | 03/2016 | (9,007,078 | ) | (9,045,188 | ) | (38,110 | ) | |||||||||||
| 27 | Goldman Sachs | Euro-Buxl 30-Year Bond Futures | 03/2016 | (4,454,938 | ) | (4,442,417 | ) | 12,521 | ||||||||||||
| 453 | Goldman Sachs | Long Gilt Futures | 03/2016 | (78,369,151 | ) | (77,980,476 | ) | 388,675 | ||||||||||||
| The accompanying notes are an integral part of these financial statements. | (Continued) |
| AQR Funds | Annual Report | December 2015 | ||||||||||||||
167
Table of Contents
| Consolidated Schedule of Investments | December 31, 2015 |
| AQR MULTI-STRATEGY ALTERNATIVE FUND |
| NUMBER OF CONTRACTS | COUNTERPARTY | DESCRIPTION | EXPIRATION DATE | VALUE AT TRADE DATE | VALUE AT DECEMBER 31, 2015 | UNREALIZED APPRECIATION (DEPRECIATION) | ||||||||||||||
| Short Contracts: (continued) | ||||||||||||||||||||
| 562 | Morgan Stanley and Co., International PLC | U.S. Treasury 2-Year Note Futures | 03/2016 | $ (122,072,322 | ) | $ (122,085,719 | ) | $ (13,397 | ) | |||||||||||
| 187 | Morgan Stanley and Co., International PLC | U.S. Treasury 5-Year Note Futures | 03/2016 | (22,104,723 | ) | (22,125,899 | ) | (21,176 | ) | |||||||||||
| 64 | Morgan Stanley and Co., International PLC | U.S. Treasury Long Bond Futures | 03/2016 | (9,817,290 | ) | (9,840,000 | ) | (22,710 | ) | |||||||||||
|
|
|
|
|
| |||||||||||||||
| (2,700,674,099 | ) | (2,702,237,263 | ) | (1,563,164 | ) | |||||||||||||||
|
|
|
|
|
| |||||||||||||||
| $(115,134,531 | ) | $(117,704,363 | ) | $(2,569,832 | ) | |||||||||||||||
|
|
|
|
|
| |||||||||||||||
| ^ | Represents positions held in the respective Subsidiary (See Note 2). |
Forward foreign currency exchange contracts outstanding as of December 31, 2015:
Over the Counter
| PURCHASE CONTRACTS | COUNTERPARTY | CURRENCY | CURRENCY AMOUNT PURCHASED | VALUE AT SETTLEMENT DATE | VALUE AT DECEMBER 31, 2015 | UNREALIZED APPRECIATION (DEPRECIATION) | ||||||||||||||
| Australian Dollar, Expiring 03/16/16 | CitiBank | AUD | 136,350,500 | $98,722,942 | $99,003,791 | $280,849 | ||||||||||||||
| Australian Dollar, Expiring 03/16/16 | Credit Suisse International | AUD | 136,350,500 | 98,723,201 | 99,003,790 | 280,589 | ||||||||||||||
| Brazilian Real, Expiring 03/16/16* | CitiBank | BRL | 106,992,000 | 27,174,785 | 26,416,927 | (757,858 | ) | |||||||||||||
| Brazilian Real, Expiring 03/16/16* | Credit Suisse International | BRL | 106,992,000 | 27,174,860 | 26,416,926 | (757,934 | ) | |||||||||||||
| Canadian Dollar, Expiring 03/16/16 | CitiBank | CAD | 27,888,500 | 20,859,883 | 20,158,904 | (700,979 | ) | |||||||||||||
| Canadian Dollar, Expiring 03/16/16 | Credit Suisse International | CAD | 27,888,500 | 20,859,882 | 20,158,904 | (700,978 | ) | |||||||||||||
| Swiss Franc, Expiring 03/16/16 | CitiBank | CHF | 29,130,000 | 29,491,555 | 29,173,675 | (317,880 | ) | |||||||||||||
| Swiss Franc, Expiring 03/16/16 | Credit Suisse International | CHF | 29,130,000 | 29,492,754 | 29,173,675 | (319,079 | ) | |||||||||||||
| Chilean Peso, Expiring 03/16/16* | CitiBank | CLP | 350,847,000 | 499,909 | 491,098 | (8,811 | ) | |||||||||||||
| Chilean Peso, Expiring 03/16/16* | Credit Suisse International | CLP | 350,847,000 | 499,909 | 491,097 | (8,812 | ) | |||||||||||||
| Colombian Peso, Expiring 03/16/16* | CitiBank | COP | 195,642,500 | 61,913 | 61,136 | (777 | ) | |||||||||||||
| Colombian Peso, Expiring 03/16/16* | Credit Suisse International | COP | 195,642,500 | 61,913 | 61,136 | (777 | ) | |||||||||||||
| Czech Republic Koruna, Expiring 03/16/16 | CitiBank | CZK | 398,741,500 | 16,038,090 | 16,069,959 | 31,869 | ||||||||||||||
| Czech Republic Koruna, Expiring 03/16/16 | Credit Suisse International | CZK | 398,741,500 | 16,038,071 | 16,069,959 | 31,888 | ||||||||||||||
| Euro, Expiring 03/16/16 | CitiBank | EUR | 96,289,500 | 105,276,143 | 104,834,884 | (441,259 | ) | |||||||||||||
| The accompanying notes are an integral part of these financial statements. | (Continued) |
| AQR Funds | Annual Report | December 2015 | ||||||||||||||
168
Table of Contents
| Consolidated Schedule of Investments | December 31, 2015 |
| AQR MULTI-STRATEGY ALTERNATIVE FUND |
| PURCHASE CONTRACTS | COUNTERPARTY | CURRENCY | CURRENCY AMOUNT PURCHASED | VALUE AT SETTLEMENT DATE | VALUE AT DECEMBER 31, 2015 | UNREALIZED APPRECIATION (DEPRECIATION) | ||||||||||||||
| Euro, Expiring 03/16/16 | Credit Suisse International | EUR | 96,289,500 | $ 105,276,166 | $ 104,834,883 | $ (441,283 | ) | |||||||||||||
| Euro, Expiring 04/05/16 | Credit Suisse International | EUR | 3,562 | 3,886 | 3,880 | (6 | ) | |||||||||||||
| Euro, Expiring 04/05/17 | Credit Suisse International | EUR | 3,562 | 3,963 | 3,941 | (22 | ) | |||||||||||||
| British Pound, Expiring 03/16/16 | CitiBank | GBP | 9,936,000 | 14,953,137 | 14,649,414 | (303,723 | ) | |||||||||||||
| British Pound, Expiring 03/16/16 | Credit Suisse International | GBP | 9,936,000 | 14,953,130 | 14,649,414 | (303,716 | ) | |||||||||||||
| Hong Kong Dollar, Expiring 03/16/16 | CitiBank | HKD | 5,010,000 | 646,702 | 646,818 | 116 | ||||||||||||||
| Hong Kong Dollar, Expiring 03/16/16 | Credit Suisse International | HKD | 5,010,000 | 646,703 | 646,818 | 115 | ||||||||||||||
| Hungarian Forint, Expiring 03/16/16 | CitiBank | HUF | 304,000,000 | 1,049,740 | 1,046,339 | (3,401 | ) | |||||||||||||
| Hungarian Forint, Expiring 03/16/16 | Credit Suisse International | HUF | 304,000,000 | 1,050,762 | 1,046,338 | (4,424 | ) | |||||||||||||
| Indonesian Rupiah, Expiring 03/16/16* | CitiBank | IDR | 13,192,753,000 | 934,110 | 940,102 | 5,992 | ||||||||||||||
| Indonesian Rupiah, Expiring 03/16/16* | Credit Suisse International | IDR | 13,192,753,000 | 934,110 | 940,102 | 5,992 | ||||||||||||||
| Israeli Shekel, Expiring 03/16/16 | CitiBank | ILS | 9,007,000 | 2,337,629 | 2,318,275 | (19,354 | ) | |||||||||||||
| Israeli Shekel, Expiring 03/16/16 | Credit Suisse International | ILS | 9,007,000 | 2,336,646 | 2,318,275 | (18,371 | ) | |||||||||||||
| Indian Rupee, Expiring 03/16/16* | CitiBank | INR | 833,374,500 | 12,308,377 | 12,448,633 | 140,256 | ||||||||||||||
| Indian Rupee, Expiring 03/16/16* | Credit Suisse International | INR | 833,374,500 | 12,308,375 | 12,448,630 | 140,255 | ||||||||||||||
| Japanese Yen, Expiring 03/16/16 | CitiBank | JPY | 28,722,152,502 | 234,965,118 | 239,373,955 | 4,408,837 | ||||||||||||||
| Japanese Yen, Expiring 03/16/16 | Credit Suisse International | JPY | 28,722,152,500 | 234,965,138 | 239,373,952 | 4,408,814 | ||||||||||||||
| Korean Won, Expiring 03/16/16* | CitiBank | KRW | 9,448,731,000 | 8,139,663 | 8,045,349 | (94,314 | ) | |||||||||||||
| Korean Won, Expiring 03/16/16* | Credit Suisse International | KRW | 10,577,899,999 | 9,095,011 | 9,006,807 | (88,204 | ) | |||||||||||||
| Mexican Peso, Expiring 03/16/16 | CitiBank | MXN | 106,588,000 | 6,267,828 | 6,152,617 | (115,211 | ) | |||||||||||||
| Mexican Peso, Expiring 03/16/16 | Credit Suisse International | MXN | 106,588,000 | 6,267,856 | 6,152,616 | (115,240 | ) | |||||||||||||
| Malaysian Ringgit, Expiring 03/16/16* | CitiBank | MYR | 43,249,000 | 10,039,356 | 10,021,633 | (17,723 | ) | |||||||||||||
| Malaysian Ringgit, Expiring 03/16/16* | Credit Suisse International | MYR | 43,466,000 | 10,090,961 | 10,071,915 | (19,046 | ) | |||||||||||||
| Norwegian Krone, Expiring 03/16/16 | CitiBank | NOK | 207,032,500 | 24,149,351 | 23,372,825 | (776,526 | ) | |||||||||||||
| Norwegian Krone, Expiring 03/16/16 | Credit Suisse International | NOK | 207,032,500 | 24,149,380 | 23,372,825 | (776,555 | ) | |||||||||||||
| New Zealand Dollar, Expiring 03/16/16 | CitiBank | NZD | 144,622,000 | 95,975,777 | 98,478,814 | 2,503,037 | ||||||||||||||
| New Zealand Dollar, Expiring 03/16/16 | Credit Suisse International | NZD | 144,621,998 | 95,975,889 | 98,478,812 | 2,502,923 | ||||||||||||||
| Philippine Peso, Expiring 03/16/16* | CitiBank | PHP | 33,078,500 | 696,701 | 700,108 | 3,407 | ||||||||||||||
| The accompanying notes are an integral part of these financial statements. | (Continued) |
| AQR Funds | Annual Report | December 2015 | ||||||||||||||
169
Table of Contents
| Consolidated Schedule of Investments | December 31, 2015 |
| AQR MULTI-STRATEGY ALTERNATIVE FUND |
| PURCHASE CONTRACTS | COUNTERPARTY | CURRENCY | CURRENCY AMOUNT PURCHASED | VALUE AT SETTLEMENT DATE | VALUE AT DECEMBER 31, 2015 | UNREALIZED APPRECIATION (DEPRECIATION) | ||||||||||||||
| Philippine Peso, Expiring 03/16/16* | Credit Suisse International | PHP | 33,078,500 | $ 696,700 | $ 700,106 | $ 3,406 | ||||||||||||||
| Poland Zloty, Expiring 03/16/16 | CitiBank | PLN | 7,778,500 | 1,990,646 | 1,980,174 | (10,472 | ) | |||||||||||||
| Poland Zloty, Expiring 03/16/16 | Credit Suisse International | PLN | 7,778,500 | 1,990,650 | 1,980,174 | (10,476 | ) | |||||||||||||
| Swedish Krona, Expiring 03/16/16 | CitiBank | SEK | 331,648,502 | 38,389,298 | 39,370,065 | 980,767 | ||||||||||||||
| Swedish Krona, Expiring 03/16/16 | Credit Suisse International | SEK | 331,648,500 | 38,389,049 | 39,370,064 | 981,015 | ||||||||||||||
| Singapore Dollar, Expiring 03/16/16 | CitiBank | SGD | 4,393,500 | 3,115,366 | 3,091,268 | (24,098 | ) | |||||||||||||
| Singapore Dollar, Expiring 03/16/16 | Credit Suisse International | SGD | 4,393,500 | 3,115,376 | 3,091,268 | (24,108 | ) | |||||||||||||
| Turkish Lira, Expiring 03/16/16 | CitiBank | TRY | 187,794,500 | 62,965,402 | 63,101,812 | 136,410 | ||||||||||||||
| Turkish Lira, Expiring 03/16/16 | Credit Suisse International | TRY | 187,794,500 | 62,965,567 | 63,101,811 | 136,244 | ||||||||||||||
| New Taiwan Dollar, Expiring 03/16/16* | CitiBank | TWD | 415,260,499 | 12,702,432 | 12,652,513 | (49,919 | ) | |||||||||||||
| New Taiwan Dollar, Expiring 03/16/16* | Credit Suisse International | TWD | 422,198,498 | 12,916,574 | 12,863,906 | (52,668 | ) | |||||||||||||
| South African Rand, Expiring 03/16/16 | CitiBank | ZAR | 49,577,500 | 3,244,099 | 3,163,233 | (80,866 | ) | |||||||||||||
| South African Rand, Expiring 03/16/16 | Credit Suisse International | ZAR | 49,577,500 | 3,244,120 | 3,163,232 | (80,888 | ) | |||||||||||||
|
|
|
|
|
| |||||||||||||||
| $1,667,222,554 | $1,676,759,577 | $9,537,023 | ||||||||||||||||||
|
|
|
|
|
| |||||||||||||||
| SALES CONTRACTS | COUNTERPARTY | CURRENCY | CURRENCY AMOUNT SOLD | VALUE AT SETTLEMENT DATE | VALUE AT DECEMBER 31, 2015 | UNREALIZED APPRECIATION (DEPRECIATION) | ||||||||||||||
| Australian Dollar, Expiring 03/16/16 | CitiBank | AUD | (44,131,000 | ) | $(31,713,260 | ) | $(32,043,420 | ) | $(330,160 | ) | ||||||||||
| Australian Dollar, Expiring 03/16/16 | Credit Suisse International | AUD | (44,131,000 | ) | (31,713,241 | ) | (32,043,420 | ) | (330,179 | ) | ||||||||||
| Brazilian Real, Expiring 03/16/16* | CitiBank | BRL | (2,083,000 | ) | (520,363 | ) | (514,304 | ) | 6,059 | |||||||||||
| Brazilian Real, Expiring 03/16/16* | Credit Suisse International | BRL | (2,746,000 | ) | (690,535 | ) | (678,002 | ) | 12,533 | |||||||||||
| Canadian Dollar, Expiring 03/16/16 | CitiBank | CAD | (116,041,000 | ) | (84,427,295 | ) | (83,878,998 | ) | 548,297 | |||||||||||
| Canadian Dollar, Expiring 03/16/16 | Credit Suisse International | CAD | (117,801,000 | ) | (85,693,525 | ) | (85,151,194 | ) | 542,331 | |||||||||||
| Swiss Franc, Expiring 03/16/16 | CitiBank | CHF | (97,311,000 | ) | (96,857,071 | ) | (97,456,899 | ) | (599,828 | ) | ||||||||||
| Swiss Franc, Expiring 03/16/16 | Credit Suisse International | CHF | (103,133,000 | ) | (102,604,237 | ) | (103,287,627 | ) | (683,390 | ) | ||||||||||
| Chilean Peso, Expiring 03/16/16* | CitiBank | CLP | (3,809,053,000 | ) | (5,363,450 | ) | (5,331,711 | ) | 31,739 | |||||||||||
| Chilean Peso, Expiring 03/16/16* | Credit Suisse International | CLP | (3,809,053,000 | ) | (5,363,449 | ) | (5,331,711 | ) | 31,738 | |||||||||||
| Colombian Peso, Expiring 03/16/16* | CitiBank | COP | (2,275,978,000 | ) | (693,341 | ) | (711,222 | ) | (17,881 | ) | ||||||||||
| Colombian Peso, Expiring 03/16/16* | Credit Suisse International | COP | (2,275,978,000 | ) | (693,340 | ) | (711,221 | ) | (17,881 | ) | ||||||||||
| The accompanying notes are an integral part of these financial statements. | (Continued) |
| AQR Funds | Annual Report | December 2015 | ||||||||||||||
170
Table of Contents
| Consolidated Schedule of Investments | December 31, 2015 |
| AQR MULTI-STRATEGY ALTERNATIVE FUND |
| SALES CONTRACTS | COUNTERPARTY | CURRENCY | CURRENCY AMOUNT SOLD | VALUE AT SETTLEMENT DATE | VALUE AT DECEMBER 31, 2015 | UNREALIZED APPRECIATION (DEPRECIATION) | ||||||||||||||
| Euro, Expiring 03/16/16 | CitiBank | EUR | (176,375,003 | ) | $ (187,932,646 | ) | $ (192,027,720 | ) | $ (4,095,074 | ) | ||||||||||
| Euro, Expiring 03/16/16 | Credit Suisse International | EUR | (176,375,002 | ) | (187,931,890 | ) | (192,027,718 | ) | (4,095,828 | ) | ||||||||||
| Euro, Expiring 04/05/16 | Credit Suisse International | EUR | (3,562 | ) | (4,730 | ) | (3,880 | ) | 850 | |||||||||||
| Euro, Expiring 04/05/17 | Credit Suisse International | EUR | (3,562 | ) | (4,751 | ) | (3,941 | ) | 810 | |||||||||||
| British Pound, Expiring 03/16/16 | CitiBank | GBP | (82,893,499 | ) | (124,344,046 | ) | (122,216,307 | ) | 2,127,739 | |||||||||||
| British Pound, Expiring 03/16/16 | Credit Suisse International | GBP | (82,893,499 | ) | (124,344,880 | ) | (122,216,307 | ) | 2,128,573 | |||||||||||
| Hong Kong Dollar, Expiring 03/16/16 | Credit Suisse International | HKD | (33,274,000 | ) | (4,294,189 | ) | (4,295,851 | ) | (1,662 | ) | ||||||||||
| Hungarian Forint, Expiring 03/16/16 | CitiBank | HUF | (2,854,273,500 | ) | (9,818,200 | ) | (9,824,128 | ) | (5,928 | ) | ||||||||||
| Hungarian Forint, Expiring 03/16/16 | Credit Suisse International | HUF | (2,854,273,500 | ) | (9,822,196 | ) | (9,824,126 | ) | (1,930 | ) | ||||||||||
| Indonesian Rupiah, Expiring 03/16/16* | Credit Suisse International | IDR | (435,151,000 | ) | (30,862 | ) | (31,008 | ) | (146 | ) | ||||||||||
| Israeli Shekel, Expiring 03/16/16 | CitiBank | ILS | (45,183,001 | ) | (11,681,418 | ) | (11,629,467 | ) | 51,951 | |||||||||||
| Israeli Shekel, Expiring 03/16/16 | Credit Suisse International | ILS | (45,183,000 | ) | (11,681,164 | ) | (11,629,466 | ) | 51,698 | |||||||||||
| Indian Rupee, Expiring 03/16/16* | CitiBank | INR | (68,188,000 | ) | (1,002,965 | ) | (1,018,567 | ) | (15,602 | ) | ||||||||||
| Indian Rupee, Expiring 03/16/16* | Credit Suisse International | INR | (68,188,000 | ) | (1,002,965 | ) | (1,018,567 | ) | (15,602 | ) | ||||||||||
| Japanese Yen, Expiring 03/16/16 | CitiBank | JPY | (3,942,043,500 | ) | (32,126,420 | ) | (32,853,475 | ) | (727,055 | ) | ||||||||||
| Japanese Yen, Expiring 03/16/16 | Credit Suisse International | JPY | (3,942,043,500 | ) | (32,126,419 | ) | (32,853,475 | ) | (727,056 | ) | ||||||||||
| Korean Won, Expiring 03/16/16* | CitiBank | KRW | (40,464,100,500 | ) | (34,246,894 | ) | (34,454,130 | ) | (207,236 | ) | ||||||||||
| Korean Won, Expiring 03/16/16* | Credit Suisse International | KRW | (41,283,716,500 | ) | (34,941,475 | ) | (35,152,011 | ) | (210,536 | ) | ||||||||||
| Mexican Peso, Expiring 03/16/16 | CitiBank | MXN | (1,588,117,001 | ) | (94,894,824 | ) | (91,671,429 | ) | 3,223,395 | |||||||||||
| Mexican Peso, Expiring 03/16/16 | Credit Suisse International | MXN | (1,588,117,001 | ) | (94,894,631 | ) | (91,671,428 | ) | 3,223,203 | |||||||||||
| Malaysian Ringgit, Expiring 03/16/16* | CitiBank | MYR | (64,639,500 | ) | (15,259,746 | ) | (14,978,229 | ) | 281,517 | |||||||||||
| Malaysian Ringgit, Expiring 03/16/16* | Credit Suisse International | MYR | (66,483,500 | ) | (15,689,774 | ) | (15,405,519 | ) | 284,255 | |||||||||||
| Norwegian Krone, Expiring 03/16/16 | CitiBank | �� | NOK | (1,217,516,000 | ) | (140,032,170 | ) | (137,450,828 | ) | 2,581,342 | ||||||||||
| Norwegian Krone, Expiring 03/16/16 | Credit Suisse International | NOK | (1,217,515,998 | ) | (140,032,579 | ) | (137,450,828 | ) | 2,581,751 | |||||||||||
| New Zealand Dollar, Expiring 03/16/16 | CitiBank | NZD | (48,280,000 | ) | (31,675,932 | ) | (32,875,754 | ) | (1,199,822 | ) | ||||||||||
| New Zealand Dollar, Expiring 03/16/16 | Credit Suisse International | NZD | (48,280,000 | ) | (31,675,932 | ) | (32,875,754 | ) | (1,199,822 | ) | ||||||||||
| Philippine Peso, Expiring 03/16/16* | CitiBank | PHP | (123,457,000 | ) | (2,587,130 | ) | (2,612,973 | ) | (25,843 | ) | ||||||||||
| Philippine Peso, Expiring 03/16/16* | Credit Suisse International | PHP | (123,457,000 | ) | (2,587,128 | ) | (2,612,972 | ) | (25,844 | ) | ||||||||||
| The accompanying notes are an integral part of these financial statements. | (Continued) |
| AQR Funds | Annual Report | December 2015 | ||||||||||||||
171
Table of Contents
| Consolidated Schedule of Investments | December 31, 2015 |
| AQR MULTI-STRATEGY ALTERNATIVE FUND |
| SALES CONTRACTS | COUNTERPARTY | CURRENCY | CURRENCY AMOUNT SOLD | VALUE AT SETTLEMENT DATE | VALUE AT DECEMBER 31, 2015 | UNREALIZED APPRECIATION (DEPRECIATION) | ||||||||||||||
| Poland Zloty, Expiring 03/16/16 | CitiBank | PLN | (45,591,500 | ) | $ (11,427,146 | ) | $ (11,606,233 | ) | $ (179,087 | ) | ||||||||||
| Poland Zloty, Expiring 03/16/16 | Credit Suisse International | PLN | (45,591,500 | ) | (11,427,119 | ) | (11,606,233 | ) | (179,114 | ) | ||||||||||
| Swedish Krona, Expiring 03/16/16 | CitiBank | SEK | (218,211,500 | ) | (25,866,997 | ) | (25,903,935 | ) | (36,938 | ) | ||||||||||
| Swedish Krona, Expiring 03/16/16 | Credit Suisse International | SEK | (218,211,500 | ) | (25,866,996 | ) | (25,903,933 | ) | (36,937 | ) | ||||||||||
| Singapore Dollar, Expiring 03/16/16 | CitiBank | SGD | (12,823,000 | ) | (9,075,226 | ) | (9,022,269 | ) | 52,957 | |||||||||||
| Singapore Dollar, Expiring 03/16/16 | Credit Suisse International | SGD | (12,823,000 | ) | (9,075,257 | ) | (9,022,268 | ) | 52,989 | |||||||||||
| Turkish Lira, Expiring 03/16/16 | CitiBank | TRY | (19,763,500 | ) | (6,582,830 | ) | (6,640,837 | ) | (58,007 | ) | ||||||||||
| Turkish Lira, Expiring 03/16/16 | Credit Suisse International | TRY | (19,763,500 | ) | (6,582,525 | ) | (6,640,837 | ) | (58,312 | ) | ||||||||||
| New Taiwan Dollar, Expiring 03/16/16* | CitiBank | TWD | (70,457,000 | ) | (2,146,568 | ) | (2,146,744 | ) | (176 | ) | ||||||||||
| New Taiwan Dollar, Expiring 03/16/16* | Credit Suisse International | TWD | (131,873,000 | ) | (4,010,483 | ) | (4,018,019 | ) | (7,536 | ) | ||||||||||
| South African Rand, Expiring 03/16/16 | CitiBank | ZAR | (187,162,001 | ) | (12,667,510 | ) | (11,941,643 | ) | 725,867 | |||||||||||
| South African Rand, Expiring 03/16/16 | Credit Suisse International | ZAR | (187,162,001 | ) | (12,663,626 | ) | (11,941,642 | ) | 721,984 | |||||||||||
|
|
|
|
|
| |||||||||||||||
| (1,960,393,346 | ) | (1,956,220,180 | ) | 4,173,166 | ||||||||||||||||
|
|
|
|
|
| |||||||||||||||
| $(293,170,792 | ) | $(279,460,603 | ) | $13,710,189 | ||||||||||||||||
|
|
|
|
|
| |||||||||||||||
| * | Non-deliverable forward (See Note 4). |
AUD - Australian Dollar
BRL - Brazilian Real
CAD - Canadian Dollar
CHF - Swiss Franc
CLP - Chilean Peso
COP - Colombian Peso
CZK - Czech Republic Koruna
EUR - Euro
GBP - British Pound
HKD - Hong Kong Dollar
HUF - Hungarian Forint
IDR - Indonesian Rupiah
ILS - Israeli Shekel
INR - Indian Rupee
JPY - Japanese Yen
KRW - Korean Won
MXN - Mexican Peso
MYR - Malaysian Ringgit
NOK - Norwegian Krone
NZD - New Zealand Dollar
PHP - Philippine Peso
PLN - Poland Zloty
SEK - Swedish Krona
SGD - Singapore Dollar
TRY - Turkish Lira
TWD - New Taiwan Dollar
USD - United States Dollar
ZAR - South African Rand
| The accompanying notes are an integral part of these financial statements. | (Continued) |
| AQR Funds | Annual Report | December 2015 | ||||||||||||||
172
Table of Contents
| Consolidated Schedule of Investments | December 31, 2015 |
| AQR MULTI-STRATEGY ALTERNATIVE FUND |
Total Return Basket Swaps* Outstanding at December 31, 2015
Over the Counter
| COUNTERPARTY | DESCRIPTION | TERMINATION DATE** | VALUE (Note 5) | |||||
| Bank of America | The Fund receives the total return on a portfolio of long and short positions and pays or receives the Federal Funds Effective Rate plus or minus a specified spread, which is denominated in USD based on the local currencies of the positions within the swap. | 66-67 months maturity 08/12/2019 | $25,733 | |||||
|
| |||||||
| * | See the accompanying “Additional Information — Total Return Basket Swap” for further details. |
| ** | The maturity dates are measured from the commencement of investment in each underlying portfolio swap positions. |
Additional Information — Total Return Basket Swaps
The following table represents the individual short positions and related values within the total return basket swaps as of December 31, 2015.
| REFERENCE ENTITY | SHARES | NOTIONAL (a) | NET UNREALIZED APPRECIATION (DEPRECIATION) | |||||||||
| Short Positions | ||||||||||||
| Common Stock | ||||||||||||
| United States | ||||||||||||
| Herbalife Ltd. | (22,591 | ) | $ | (1,270,518 | ) | $ | 59,188 | |||||
|
| |||||||||||
Net Cash and Other Receivables/ (Payables) (b) | (33,455 | ) | ||||||||||
|
| |||||||||||
Swaps, at Value | $ | 25,733 | ||||||||||
|
| |||||||||||
| (a) | Notional value represents the market value (including any fees or commissions) of the short positions when they are established. |
| (b) | Cash and other receivables/(payables) includes the gains (or losses) realized within the swap when the swap resets. |
| The accompanying notes are an integral part of these financial statements. | (Continued) |
| AQR Funds | Annual Report | December 2015 | ||||||||||||||
173
Table of Contents
| Consolidated Schedule of Investments | December 31, 2015 |
| AQR MULTI-STRATEGY ALTERNATIVE FUND |
| COUNTERPARTY | DESCRIPTION | TERMINATION DATE** | VALUE (Note 5) | |||||
| Deutsche Bank | The Fund receives the total return on a portfolio of long and short positions and pays or receives the GBP/USD 1 Week Forward FX Swap Rate plus or minus a specified spread, which is denominated in GBP based on the local currencies of the positions within the swap. | 49 months maturity 12/21/2016 | $39,465,513 | |||||
|
| |||||||
| ** | The maturity dates are measured from the commencement of investment in each underlying portfolio swap position. |
Additional Information — Total Return Basket Swaps
The following table represents the individual long and short positions and related values within the total return basket swap as of December 31, 2015.
| REFERENCE ENTITY | SHARES | NOTIONAL (a) | NET UNREALIZED APPRECIATION (DEPRECIATION) | |||||||||
| Long Positions | ||||||||||||
| Common Stocks | ||||||||||||
| Australia | ||||||||||||
| BHP Billiton PLC | 414,089 | $ | 4,958,860 | $ | (341,014 | ) | ||||||
|
| |||||||||||
| Germany | ||||||||||||
| TUI AG | 46,568 | 864,419 | (32,943 | ) | ||||||||
|
| |||||||||||
| Ireland | ||||||||||||
| DCC PLC | 69,365 | 3,550,669 | 2,244,221 | |||||||||
| Shire PLC | 21,836 | 1,643,589 | (145,478 | ) | ||||||||
|
| |||||||||||
| 2,098,743 | ||||||||||||
|
| |||||||||||
| Luxembourg | ||||||||||||
| Regus PLC | 163,195 | 768,891 | 32,979 | |||||||||
|
| |||||||||||
| Netherlands | ||||||||||||
| Royal Dutch Shell PLC | 38,535 | 1,178,982 | (306,196 | ) | ||||||||
|
| |||||||||||
| South Africa | ||||||||||||
| Investec PLC | 540,658 | 3,953,342 | (141,162 | ) | ||||||||
| Mondi PLC | 119,723 | 1,969,896 | 376,763 | |||||||||
|
| |||||||||||
| 235,601 | ||||||||||||
|
| |||||||||||
| Switzerland | ||||||||||||
| Coca-Cola HBC AG | 15,617 | 354,631 | (22,057 | ) | ||||||||
| Glencore PLC | 1,839,268 | 2,675,332 | (238,065 | ) | ||||||||
| Wolseley PLC | 53,026 | 3,151,994 | (271,999 | ) | ||||||||
|
| |||||||||||
| (532,121) | ||||||||||||
|
| |||||||||||
| United Kingdom | ||||||||||||
| 3i Group PLC | 21,400 | 165,725 | (14,132 | ) | ||||||||
| AA PLC | 241,581 | 1,062,652 | 53,344 | |||||||||
| Anglo American PLC | 127,349 | 642,539 | (83,832 | ) | ||||||||
| AstraZeneca PLC | 90,828 | 5,918,409 | 216,782 | |||||||||
| Auto Trader Group PLC | 52,341 | 261,669 | 79,587 | |||||||||
| Aviva PLC | 141,924 | 1,042,443 | 34,828 | |||||||||
| BAE Systems PLC | 258,708 | 1,780,603 | 124,139 | |||||||||
| Balfour Beatty PLC | 33,560 | 124,804 | 8,865 | |||||||||
| Barclays PLC | 41,786 | 158,445 | (23,946 | ) | ||||||||
| Barratt Developments PLC | 802,832 | 4,757,431 | 2,640,436 | |||||||||
| Bellway PLC | 579 | 22,162 | 2,048 | |||||||||
| Berkeley Group Holdings PLC | 95,619 | 3,795,709 | 1,402,476 | |||||||||
| Booker Group PLC | 444,101 | 1,166,296 | 18,953 | |||||||||
| BP PLC | 378,910 | 2,170,760 | (201,684 | ) | ||||||||
| REFERENCE ENTITY | SHARES | NOTIONAL (a) | NET UNREALIZED APPRECIATION (DEPRECIATION) | |||||||||
| United Kingdom (continued) | ||||||||||||
| Britvic PLC | 92,382 | $ | 990,262 | $ | (461 | ) | ||||||
| BT Group PLC | 1,648,816 | 10,997,760 | 450,919 | |||||||||
| Close Brothers Group PLC | 110,140 | 2,501,684 | (329,780 | ) | ||||||||
| Compass Group PLC | 15,699 | 260,436 | 11,600 | |||||||||
| Direct Line Insurance Group PLC | 865,544 | 4,219,952 | 968,216 | |||||||||
| Dixons Carphone PLC | 104,976 | 667,346 | 105,181 | |||||||||
| DS Smith PLC | 800,255 | 3,942,983 | 738,162 | |||||||||
| easyJet PLC | 16,313 | 420,380 | (2,000 | ) | ||||||||
| G4S PLC | 291,563 | 1,191,037 | (222,526 | ) | ||||||||
| GKN PLC | 726,008 | 3,747,589 | (453,061 | ) | ||||||||
| Greene King PLC | 19,705 | 238,399 | 31,363 | |||||||||
| Halma PLC | 24,310 | 248,652 | 60,904 | |||||||||
| Hays PLC | 1,462,826 | 3,074,945 | 66,697 | |||||||||
| Howden Joinery Group PLC | 375,826 | 2,631,292 | 280,625 | |||||||||
| Imperial Tobacco Group PLC | 181,842 | 8,481,253 | 1,123,215 | |||||||||
| Inchcape PLC | 651,966 | 6,033,781 | 1,488,392 | |||||||||
| Indivior PLC | 41,983 | 121,196 | (5,178 | ) | ||||||||
| Informa PLC | 85,972 | 734,376 | 42,591 | |||||||||
| Inmarsat PLC | 30,280 | 410,362 | 97,265 | |||||||||
| Intermediate Capital Group PLC | 485,085 | 4,000,696 | 471,083 | |||||||||
| International Consolidated Airlines Group SA | 212,703 | 1,858,774 | 53,654 | |||||||||
| ITV PLC | 610,066 | 1,860,425 | 623,368 | |||||||||
| John Wood Group PLC | 39,738 | 336,940 | 20,950 | |||||||||
| Jupiter Fund Management PLC | 20,631 | 135,074 | 2,036 | |||||||||
| Just Eat PLC | 116,894 | 714,962 | 133,800 | |||||||||
| Kingfisher PLC | 1,183,974 | 6,198,287 | (463,728 | ) | ||||||||
| Man Group PLC | 1,300,741 | 3,163,056 | 183,111 | |||||||||
| Melrose Industries PLC | 134,293 | 545,342 | 29,894 | |||||||||
| Merlin Entertainments PLC | 109,890 | 718,423 | 18,396 | |||||||||
| Micro Focus International PLC | 4,079 | 75,456 | 20,335 | |||||||||
| National Grid PLC | 17,069 | 231,978 | 3,430 | |||||||||
| Next PLC | 7,891 | 792,146 | 55,117 | |||||||||
| Persimmon PLC | 94,170 | 2,312,647 | 496,759 | |||||||||
| Playtech PLC | 99,824 | 1,195,033 | 27,103 | |||||||||
| Premier Oil PLC | 312,893 | 734,951 | (511,083 | ) | ||||||||
| Provident Financial PLC | 36,199 | 1,171,449 | 623,394 | |||||||||
| Reckitt Benckiser Group PLC | 15,090 | 1,199,079 | 197,144 | |||||||||
| Rentokil Initial PLC | 1,389,345 | 2,678,232 | 581,506 | |||||||||
| The accompanying notes are an integral part of these financial statements. | (Continued) |
| AQR Funds | Annual Report | December 2015 | ||||||||||||||
174
Table of Contents
| Consolidated Schedule of Investments | December 31, 2015 |
| AQR MULTI-STRATEGY ALTERNATIVE FUND |
| REFERENCE ENTITY | SHARES | NOTIONAL (a) | NET UNREALIZED APPRECIATION (DEPRECIATION) | |||||||||
| United Kingdom (continued) | ||||||||||||
| Rio Tinto PLC | 124,521 | $ | 4,337,967 | $ | (712,504 | ) | ||||||
| Royal Mail PLC | 61,914 | 444,062 | (38,533 | ) | ||||||||
| Sage Group PLC/The | 366,623 | 2,694,516 | 562,954 | |||||||||
| Smith & Nephew PLC | 152,160 | 2,522,553 | 189,253 | |||||||||
| Spectris PLC | 18,360 | 561,166 | (73,912 | ) | ||||||||
| SSE PLC | 56,586 | 1,295,405 | (24,837 | ) | ||||||||
| Stagecoach Group PLC | 34,156 | 179,318 | (30,079 | ) | ||||||||
| TalkTalk Telecom Group PLC | 27,558 | 87,931 | 519 | |||||||||
| Tate & Lyle PLC | 4,656 | 41,386 | (375 | ) | ||||||||
| Taylor Wimpey PLC | 2,331,069 | 5,821,094 | 1,147,319 | |||||||||
| Travis Perkins PLC | 141,778 | 3,745,303 | 367,744 | |||||||||
| UBM PLC | 90,726 | 708,964 | (5,801 | ) | ||||||||
| United Utilities Group PLC | 33,980 | 490,689 | (22,808 | ) | ||||||||
| Vedanta Resources PLC | 55,166 | 320,136 | (97,916 | ) | ||||||||
| Vodafone Group PLC | 1,840,993 | 6,306,698 | (336,787 | ) | ||||||||
| Whitbread PLC | 5,159 | 377,518 | (43,130 | ) | ||||||||
| William Hill PLC | 288,096 | 1,414,689 | 266,668 | |||||||||
| WPP PLC | 166,824 | 3,145,133 | 692,116 | |||||||||
|
| |||||||||||
| 13,116,148 | ||||||||||||
|
| |||||||||||
Total of Long Equity | 14,271,197 | |||||||||||
|
| |||||||||||
| Short Positions | ||||||||||||
| Common Stocks | ||||||||||||
| Chile | ||||||||||||
| Antofagasta PLC | (321,312 | ) | (3,380,245 | ) | 1,170,002 | |||||||
|
| |||||||||||
| Ireland | ||||||||||||
| Experian PLC | (200,255 | ) | (3,284,658 | ) | (254,731 | ) | ||||||
|
| |||||||||||
| United Kingdom | ||||||||||||
| Aberdeen Asset Management PLC | (1,523,465 | ) | (8,957,188 | ) | 2,465,363 | |||||||
| Admiral Group PLC | (520,705 | ) | (10,637,410 | ) | (2,086,341 | ) | ||||||
| Aggreko PLC | (250,931 | ) | (5,919,350 | ) | 2,541,390 | |||||||
| Amec Foster Wheeler PLC | (206,952 | ) | (2,450,014 | ) | 1,143,596 | |||||||
| ARM Holdings PLC | (59,992 | ) | (842,804 | ) | (71,596 | ) | ||||||
| Ashtead Group PLC | (93,641 | ) | (1,447,749 | ) | (93,379 | ) | ||||||
| ASOS PLC | (49,170 | ) | (2,139,276 | ) | (359,038 | ) | ||||||
| Associated British Foods PLC | (6,050 | ) | (320,339 | ) | 22,635 | |||||||
| Babcock International Group PLC | (20,563 | ) | (296,004 | ) | (11,725 | ) | ||||||
| British American Tobacco PLC | (109,787 | ) | (5,821,727 | ) | (275,188 | ) | ||||||
| BTG PLC | (158,867 | ) | (1,438,492 | ) | (171,294 | ) | ||||||
| Bunzl PLC | (6,633 | ) | (177,423 | ) | (6,605 | ) | ||||||
| Burberry Group PLC | (379,675 | ) | (8,713,162 | ) | 2,033,151 | |||||||
| Cable & Wireless Communications PLC | (514,401 | ) | (448,642 | ) | (114,123 | ) | ||||||
| Capita PLC | (70,905 | ) | (1,154,278 | ) | (107,300 | ) | ||||||
| Centrica PLC | (1,885,342 | ) | (7,155,549 | ) | 1,101,768 | |||||||
| Cobham PLC | (19,675 | ) | (77,128 | ) | (5,032 | ) | ||||||
| Croda International PLC | (75,437 | ) | (2,608,321 | ) | (771,629 | ) | ||||||
| REFERENCE ENTITY | SHARES | NOTIONAL (a) | NET UNREALIZED APPRECIATION (DEPRECIATION) | |||||||||
| United Kingdom (continued) | ||||||||||||
| Daily Mail & General Trust PLC | (16,522 | ) | $ | (231,681 | ) | $ | 61,636 | |||||
| Diageo PLC | (338,552 | ) | (9,048,014 | ) | (197,082 | ) | ||||||
| Drax Group PLC | (589,866 | ) | (3,357,080 | ) | 1,233,336 | |||||||
| Essentra PLC | (30,189 | ) | (410,456 | ) | 42,449 | |||||||
| Eurasian Resources Group | (2,433 | ) | (8,027 | ) | 736 | |||||||
| GlaxoSmithKline PLC | (222,257 | ) | (4,596,704 | ) | 108,037 | |||||||
| Hargreaves Lansdown PLC | (655,576 | ) | (10,053,866 | ) | (4,500,329 | ) | ||||||
| Henderson Group PLC | (159,285 | ) | (634,121 | ) | (89,833 | ) | ||||||
| HSBC Holdings PLC | (29,064 | ) | (223,786 | ) | (5,652 | ) | ||||||
| ICAP PLC | (167,812 | ) | (1,030,294 | ) | (229,317 | ) | ||||||
| IMI PLC | (113,300 | ) | (2,269,973 | ) | 832,278 | |||||||
| InterContinental Hotels Group PLC | (3,967 | ) | (140,625 | ) | (14,003 | ) | ||||||
| Intertek Group PLC | (135,283 | ) | (5,309,916 | ) | (224,047 | ) | ||||||
| J Sainsbury PLC | (1,195,336 | ) | (4,770,788 | ) | 218,705 | |||||||
| Johnson Matthey PLC | (38,368 | ) | (1,769,674 | ) | 268,799 | |||||||
| Ladbrokes PLC | (44,349 | ) | (79,738 | ) | 1,511 | |||||||
| Legal & General Group PLC | (95,873 | ) | (364,866 | ) | (13,439 | ) | ||||||
| Lloyds Banking Group PLC | (1,598,853 | ) | (1,913,064 | ) | 192,706 | |||||||
| Marks & Spencer Group PLC | (602,239 | ) | (4,204,826 | ) | 195,001 | |||||||
| Meggitt PLC | (44,063 | ) | (346,034 | ) | 102,751 | |||||||
| Ocado Group PLC | (245,318 | ) | (1,384,751 | ) | 288,736 | |||||||
| Old Mutual PLC | (1,067,740 | ) | (3,319,876 | ) | 511,014 | |||||||
| Pearson PLC | (84,172 | ) | (1,534,440 | ) | 624,502 | |||||||
| Pennon Group PLC | (308 | ) | (3,483 | ) | (424 | ) | ||||||
| Petrofac Ltd. | (509,502 | ) | (6,861,828 | ) | 885,525 | |||||||
| Prudential PLC | (150,148 | ) | (3,232,218 | ) | (150,540 | ) | ||||||
| Rolls-Royce Holdings PLC (3) | (6,390,181 | ) | 416 | (9,837 | ) | |||||||
| Rolls-Royce Holdings PLC | (48,824 | ) | (600,146 | ) | 186,586 | |||||||
| Rolls-Royce Holdings PLC (3) | (7,522,765 | ) | (554 | ) | (10,536 | ) | ||||||
| Rotork PLC | (92,532 | ) | (311,831 | ) | 62,813 | |||||||
| Royal Bank of Scotland Group PLC | (288,689 | ) | (1,460,689 | ) | 177,449 | |||||||
| RSA Insurance Group PLC | (439,502 | ) | (2,860,555 | ) | 102,087 | |||||||
| Schroders PLC | (2,115 | ) | (94,160 | ) | 1,525 | |||||||
| Serco Group PLC | (344,061 | ) | (621,862 | ) | 143,083 | |||||||
| Severn Trent PLC | (17,235 | ) | (560,679 | ) | 9,735 | |||||||
| Sky PLC | (169,808 | ) | (2,331,634 | ) | (451,987 | ) | ||||||
| Smiths Group PLC | (40,937 | ) | (652,961 | ) | 86,848 | |||||||
| Spirax-Sarco Engineering PLC | (11,610 | ) | (509,502 | ) | (51,989 | ) | ||||||
| Sports Direct International PLC | (721,151 | ) | (7,117,013 | ) | 988,598 | |||||||
| St James’s Place PLC | (231,210 | ) | (3,077,109 | ) | (349,810 | ) | ||||||
| Standard Chartered PLC | (494,035 | ) | (7,755,346 | ) | 3,656,262 | |||||||
| Standard Life PLC | (825,297 | ) | (5,614,128 | ) | 888,054 | |||||||
| Tesco PLC | (3,540,076 | ) | (11,252,565 | ) | 3,474,042 | |||||||
| Thomas Cook Group PLC | (247,380 | ) | (427,116 | ) | (14,283 | ) | ||||||
| The accompanying notes are an integral part of these financial statements. | (Continued) |
| AQR Funds | Annual Report | December 2015 | ||||||||||||||
175
Table of Contents
| Consolidated Schedule of Investments | December 31, 2015 |
| AQR MULTI-STRATEGY ALTERNATIVE FUND |
| REFERENCE ENTITY | SHARES | NOTIONAL (a) | NET UNREALIZED APPRECIATION (DEPRECIATION) | |||||||||
| United Kingdom (continued) | ||||||||||||
| Weir Group PLC/The | (158,290 | ) | $ | (4,234,655 | ) | $ | 1,909,566 | |||||
| WM Morrison Supermarkets PLC | (826,111 | ) | (2,208,116 | ) | 408,119 | |||||||
|
| |||||||||||
| 16,584,034 | ||||||||||||
|
| |||||||||||
Total of Short Equity Positions | 17,499,305 | |||||||||||
|
| |||||||||||
Total of Long and Short Equity Positions | 31,770,502 | |||||||||||
|
| |||||||||||
Net Cash and Other Receivables/ (Payables) (b) | 7,695,011 | |||||||||||
|
| |||||||||||
Swaps, at Value | $ | 39,465,513 | ||||||||||
|
| |||||||||||
| (a) | Notional value represents the market value (including any fees or commissions) of the long and short positions when they are established. |
| (b) | Cash and other receivables/(payables) includes the gains (or losses) realized within the swap when the swap resets. |
| (3) | Level 3 security (See Note 5). |
| COUNTERPARTY | DESCRIPTION | TERMINATION DATE** | VALUE (Note 5) | |||||
| Deutsche Bank | The Fund receives the total return on a portfolio of long and short positions and pays or receives the EUR/USD 1 Week Forward FX Swap rate plus or minus a specified spread, which is denominated in EUR based on the local currencies of the positions within the swap. | 24-49 months maturity ranging from 12/21/2016 - 12/22/2016 | $16,837,625 | |||||
|
| |||||||
| ** | The maturity dates are measured from the commencement of investment in each underlying portfolio swap position. |
Additional Information — Total Return Basket Swaps
The following table represents the individual long and short positions and related values within the total return basket swap as of December 31, 2015.
| REFERENCE ENTITY | SHARES | NOTIONAL (a) | NET UNREALIZED APPRECIATION (DEPRECIATION) | |||||||||
| Long Positions | ||||||||||||
| Common Stocks | ||||||||||||
| France | ||||||||||||
| Aeroports de Paris | 10,158 | $ | 1,039,943 | $ | 142,128 | |||||||
| Air France-KLM | 1,115 | 7,650 | 837 | |||||||||
| Atos SE | 93,158 | 6,452,122 | 1,368,724 | |||||||||
| AXA SA | 10,811 | 285,340 | 10,055 | |||||||||
| BNP Paribas SA | 363 | 22,182 | (1,644 | ) | ||||||||
| Cap Gemini SA | 58,276 | 3,906,083 | 1,501,091 | |||||||||
| Christian Dior SE | 1,630 | 326,529 | (49,653 | ) | ||||||||
| Cie Generale des Etablissements Michelin | 67,784 | 5,319,689 | 1,132,168 | |||||||||
| CNP Assurances | 68,778 | 1,141,356 | (213,587 | ) | ||||||||
| Credit Agricole SA | 175,993 | 2,223,942 | (150,015 | ) | ||||||||
| Dassault Systemes | 5,074 | 396,960 | 8,609 | |||||||||
| Eiffage SA | 28,920 | 1,561,056 | 307,990 | |||||||||
| Etablissements Maurel et Prom | 10,053 | 70,394 | (37,831 | ) | ||||||||
| REFERENCE ENTITY | SHARES | NOTIONAL (a) | NET UNREALIZED APPRECIATION (DEPRECIATION) | |||||||||
| France (continued) | ||||||||||||
| Groupe Eurotunnel SE | 55,815 | $ | 625,523 | $ | 68,876 | |||||||
| Havas SA | 26,740 | 216,842 | 8,153 | |||||||||
| Iliad SA | 25,109 | 5,515,358 | 470,082 | |||||||||
| Imerys SA | 11,524 | 735,717 | 69,251 | |||||||||
| Ingenico Group SA | 7,812 | 885,417 | 100,621 | |||||||||
| Ipsen SA | 9,393 | 592,088 | 30,270 | |||||||||
| Lagardere SCA | 250,640 | 6,871,717 | 607,741 | |||||||||
| Natixis SA | 73,262 | 449,055 | (34,605 | ) | ||||||||
| Numericable-SFR SAS | 3,510 | 155,215 | (27,704 | ) | ||||||||
| Orange SA | 245,719 | 3,913,255 | 196,575 | |||||||||
| Orpea | 5,902 | 439,043 | 33,507 | |||||||||
| Peugeot SA | 895,304 | 15,278,423 | 415,291 | |||||||||
| Rexel SA | 180,595 | 3,270,296 | (865,533 | ) | ||||||||
| Safran SA | 4,778 | 363,452 | (35,190 | ) | ||||||||
| Sanofi | 69,375 | 6,848,107 | (935,846 | ) | ||||||||
| SCOR SE | 70,494 | 2,196,280 | 441,446 | |||||||||
| SEB SA | 8,620 | 800,248 | 84,691 | |||||||||
| Societe BIC SA | 19,204 | 1,862,356 | 1,297,758 | |||||||||
| The accompanying notes are an integral part of these financial statements. | (Continued) |
| AQR Funds | Annual Report | December 2015 | ||||||||||||||
176
Table of Contents
| Consolidated Schedule of Investments | December 31, 2015 |
| AQR MULTI-STRATEGY ALTERNATIVE FUND |
| REFERENCE ENTITY | SHARES | NOTIONAL (a) | NET UNREALIZED APPRECIATION (DEPRECIATION) | |||||||||
| France (continued) | ||||||||||||
| Societe Generale SA | 52,298 | $ | 2,380,188 | $ | 29,816 | |||||||
| Societe Television Francaise 1 | 137,312 | 2,056,910 | (532,223 | ) | ||||||||
| Sodexo SA | 418 | 40,143 | 694 | |||||||||
| Suez Environnement Co. | 247,528 | 3,445,400 | 1,184,199 | |||||||||
| Teleperformance | 5,932 | 436,537 | 62,270 | |||||||||
| Thales SA | 32,132 | 1,819,474 | 585,598 | |||||||||
| Valeo SA | 46,422 | 2,445,512 | 4,711,585 | |||||||||
| Vinci SA | 5,790 | 364,385 | 6,723 | |||||||||
| Vivendi SA | 333,191 | 7,752,715 | (596,755 | ) | ||||||||
|
| |||||||||||
| 11,396,163 | ||||||||||||
|
| |||||||||||
| Luxembourg | ||||||||||||
| SES SA | 81,611 | 2,632,362 | (370,944 | ) | ||||||||
|
| |||||||||||
| Portugal | ||||||||||||
| Galp Energia SGPS SA | 67,151 | 764,205 | 19,358 | |||||||||
| NOS SGPS SA | 58,438 | 444,061 | 15,724 | |||||||||
| Sonae SGPS SA | 83,491 | 101,609 | (6,721 | ) | ||||||||
|
| |||||||||||
| 28,361 | ||||||||||||
|
| |||||||||||
Total of Long Equity Positions | 11,053,580 | |||||||||||
|
| |||||||||||
| Short Positions | ||||||||||||
| Common Stocks | ||||||||||||
| France | ||||||||||||
| Accor SA | (38,711 | ) | (1,269,015 | ) | (407,557 | ) | ||||||
| Air Liquide SA | (575 | ) | (67,773 | ) | 3,220 | |||||||
| Airbus Group SE | (18,230 | ) | (1,245,747 | ) | 17,275 | |||||||
| Arkema SA | (28,671 | ) | (2,018,820 | ) | 11,889 | |||||||
| Bollore SA | (579 | ) | 121 | (2,783 | ) | |||||||
| Bollore SA | (350,521 | ) | (1,898,191 | ) | 264,891 | |||||||
| Bureau Veritas SA | (112,648 | ) | (2,456,754 | ) | 211,522 | |||||||
| Carrefour SA | (68,853 | ) | (2,145,737 | ) | 158,667 | |||||||
| Casino Guichard Perrachon SA | (93,879 | ) | (5,934,056 | ) | 1,621,191 | |||||||
| Cie de Saint-Gobain | (35,053 | ) | (1,266,624 | ) | (252,407 | ) | ||||||
| Danone SA | (3 | ) | (209 | ) | 6 | |||||||
| Edenred | (227,876 | ) | (4,909,546 | ) | 601,993 | |||||||
| Electricite de France SA | (232,687 | ) | (5,068,159 | ) | 1,641,265 | |||||||
| Engie | (112,664 | ) | (1,805,601 | ) | (190,042 | ) | ||||||
| Essilor International SA | (28,692 | ) | (3,045,161 | ) | (530,895 | ) | ||||||
| Eutelsat Communications SA | (22,323 | ) | (449,383 | ) | (218,978 | ) | ||||||
| Faurecia | (26,170 | ) | (1,073,608 | ) | 24,983 | |||||||
| Hermes International | (2,849 | ) | (1,060,732 | ) | 97,699 | |||||||
| JCDecaux SA | (22,771 | ) | (842,055 | ) | (30,867 | ) | ||||||
| Kering | (30,464 | ) | (5,270,059 | ) | 61,477 | |||||||
| Legrand SA | (21,389 | ) | (987,286 | ) | (222,589 | ) | ||||||
| L’Oreal SA | (1,224 | ) | (213,644 | ) | 7,762 | |||||||
| REFERENCE ENTITY | SHARES | NOTIONAL (a) | NET UNREALIZED APPRECIATION (DEPRECIATION) | |||||||||
| France (continued) | ||||||||||||
| LVMH Moet Hennessy Louis Vuitton SE | (5,952 | ) | $ | (899,274 | ) | $ | (35,608 | ) | ||||
| Pernod Ricard SA | (27,948 | ) | (2,608,308 | ) | (579,007 | ) | ||||||
| Plastic Omnium SA | (14,413 | ) | (358,458 | ) | (99,685 | ) | ||||||
| Publicis Groupe SA | (5,929 | ) | (487,292 | ) | 93,041 | |||||||
| Remy Cointreau SA | (62,159 | ) | (4,026,866 | ) | (425,293 | ) | ||||||
| Renault SA | (51,574 | ) | (5,282,200 | ) | 119,875 | |||||||
| Schneider Electric SE | (37,988 | ) | (2,614,162 | ) | 456,293 | |||||||
| Technip SA | (172,813 | ) | (10,134,877 | ) | 1,540,839 | |||||||
| TOTAL SA | (50,294 | ) | (2,321,833 | ) | 67,083 | |||||||
| Vallourec SA | (53,256 | ) | (483,116 | ) | (12,685 | ) | ||||||
| Veolia Environnement SA | (99,021 | ) | (2,213,477 | ) | (135,873 | ) | ||||||
| Zodiac Aerospace | (141,009 | ) | (4,162,803 | ) | 805,333 | |||||||
|
| |||||||||||
| 4,662,035 | ||||||||||||
|
| |||||||||||
| Luxembourg | ||||||||||||
| Eurofins Scientific SE | (539 | ) | (195,243 | ) | 7,229 | |||||||
|
| |||||||||||
| Portugal | ||||||||||||
| Banco Comercial Portugues SA | (13,093,490 | ) | (812,171 | ) | 118,306 | |||||||
| EDP - Energias de Portugal SA | (504,723 | ) | (1,847,703 | ) | 29,013 | |||||||
| Jeronimo Martins SGPS SA | (140,778 | ) | (1,851,345 | ) | 19,487 | |||||||
|
| |||||||||||
| 166,806 | ||||||||||||
|
| |||||||||||
Total of Short Equity Positions | 4,836,070 | |||||||||||
|
| |||||||||||
Total of Long and Short |
| 15,889,650 | ||||||||||
|
| |||||||||||
Net Cash and Other Receivables/ (Payables) (b) | 947,975 | |||||||||||
|
| |||||||||||
Swaps, at Value | $ | 16,837,625 | ||||||||||
|
| |||||||||||
| (a) | Notional value represents the market value (including any fees or commissions) of the long and short positions when they are established. |
| (b) | Cash and other receivables/(payables) includes the gains (or losses) realized within the swap when the swap resets. |
| The accompanying notes are an integral part of these financial statements. | (Continued) |
| AQR Funds | Annual Report | December 2015 | ||||||||||||||
177
Table of Contents
| Consolidated Schedule of Investments | December 31, 2015 |
| AQR MULTI-STRATEGY ALTERNATIVE FUND |
| COUNTERPARTY | DESCRIPTION | TERMINATION DATE** | VALUE (Note 5) | |||||
| Deutsche Bank | The Fund receives the total return on a portfolio of long and short positions and pays or receives the AUD/USD Overnight Forward FX Swap Rate plus or minus a specified spread, which is denominated in AUD based on the local currencies of the positions within the swap. | 37 months maturity 10/20/2016 | $771 | |||||
|
| |||||||
| ** | The maturity dates are measured from the commencement of investment in each underlying portfolio swap position. |
Additional Information — Total Return Basket Swaps
The following table represents the individual long and short positions and related values within the total return basket swap as of December 31, 2015.
| REFERENCE ENTITY | SHARES | NOTIONAL (a) | NET UNREALIZED APPRECIATION (DEPRECIATION) | |||||||||
| Long Positions | ||||||||||||
| Common Stocks | ||||||||||||
| Australia | ||||||||||||
| Asciano Ltd. | 331,134 | $ | 2,120,664 | $ | (15,414 | ) | ||||||
| Recall Holdings Ltd. | 600,909 | 3,095,887 | (72,960 | ) | ||||||||
| Veda Group Ltd. | 4,282,690 | 8,575,759 | 118,251 | |||||||||
|
| |||||||||||
| 29,877 | ||||||||||||
|
| |||||||||||
Total of Long Equity Positions | 29,877 | |||||||||||
|
| |||||||||||
Net Cash and Other Receivables/ (Payables) (b) | (29,106 | ) | ||||||||||
|
| |||||||||||
Swaps, at Value | $ | 771 | ||||||||||
|
| |||||||||||
| (a) | Notional value represents the market value (including any fees or commissions) of the long and short positions when they are established. |
| (b) | Cash and other receivables/(payables) includes the gains (or losses) realized within the swap when the swap resets. |
| The accompanying notes are an integral part of these financial statements. | (Continued) |
| AQR Funds | Annual Report | December 2015 | ||||||||||||||
178
Table of Contents
| Consolidated Schedule of Investments | December 31, 2015 |
| AQR MULTI-STRATEGY ALTERNATIVE FUND |
| COUNTERPARTY | DESCRIPTION | TERMINATION DATE** | VALUE (Note 5) | |||||
| Deutsche Bank | The Fund receives the total return on a portfolio of long and short positions and pays or receives the GBP/USD 1 Week Forward FX Swap Rate plus or minus a specified spread, which is denominated in GBP based on the local currencies of the positions within the swap. | 49 months maturity 12/21/2016 | $3,544,798 | |||||
|
| |||||||
| ** | The maturity dates are measured from the commencement of investment in each underlying portfolio swap position. |
Additional Information — Total Return Basket Swaps
The following table represents the individual long and short positions and related values within the total return basket swap as of December 31, 2015.
| REFERENCE ENTITY | SHARES | NOTIONAL (a) | NET UNREALIZED APPRECIATION (DEPRECIATION) | |||||||||
| Long Positions | ||||||||||||
| Common Stocks | ||||||||||||
| United Kingdom | ||||||||||||
| Amlin PLC | 614,206 | $ | 5,949,913 | $ | 55,716 | |||||||
| BG Group PLC | 1,388,765 | 22,314,544 | (2,183,229 | ) | ||||||||
| Cable & Wireless Communications PLC | 162,749 | 177,129 | 921 | |||||||||
| Pace PLC | 1,016,134 | 5,946,837 | 275,791 | |||||||||
| Rexam PLC | 999,434 | 8,079,699 | 834,755 | |||||||||
| SABMiller PLC | 393,389 | 22,730,108 | 804,008 | |||||||||
| Telecity Group PLC | 358,341 | 5,823,999 | 798,227 | |||||||||
|
| |||||||||||
| 586,189 | ||||||||||||
|
| |||||||||||
Total of Long Equity Positions | 586,189 | |||||||||||
|
| |||||||||||
| Short Positions | ||||||||||||
| Common Stocks | ||||||||||||
| Netherlands | ||||||||||||
| Royal Dutch Shell PLC | (629,999 | ) | (17,179,753 | ) | 2,821,490 | |||||||
| Royal Dutch Shell PLC | (5,177 | ) | 1,094 | (118,348 | ) | |||||||
|
| |||||||||||
| 2,703,142 | ||||||||||||
|
| |||||||||||
Total of Long and Short Equity Positions | 3,289,331 | |||||||||||
|
| |||||||||||
Net Cash and Other Receivables/ (Payables) (b) | 255,467 | |||||||||||
|
| |||||||||||
Swaps, at Value | $ | 3,544,798 | ||||||||||
|
| |||||||||||
| (a) | Notional value represents the market value (including any fees or commissions) of the long and short positions when they are established. |
| (b) | Cash and other receivables/(payables) includes the gains (or losses) realized within the swap when the swap resets. |
| The accompanying notes are an integral part of these financial statements. | (Continued) |
| AQR Funds | Annual Report | December 2015 | ||||||||||||||
179
Table of Contents
| Consolidated Schedule of Investments | December 31, 2015 |
| AQR MULTI-STRATEGY ALTERNATIVE FUND |
| COUNTERPARTY | DESCRIPTION | TERMINATION DATE** | VALUE (Note 5) | |||||
| Deutsche Bank | The Fund receives the total return on a portfolio of long and short positions and pays or receives the Federal Funds Effective Rate plus or minus a specified spread, which is denominated in USD based on the local currencies of the positions within the swap. | 25 months maturity 11/22/2016 | $65,906 | |||||
|
| |||||||
| ** | The maturity dates are measured from the commencement of investment in each underlying portfolio swap position. |
Additional Information — Total Return Basket Swaps
The following table represents the individual long and short positions and related values within the total return basket swap as of December 31, 2015.
| REFERENCE ENTITY | SHARES | NOTIONAL (a) | NET UNREALIZED APPRECIATION (DEPRECIATION) | |||||||||
| Long Positions | ||||||||||||
| Common Stocks | ||||||||||||
| Israel | ||||||||||||
| EZchip Semiconductor Ltd. | 140,460 | $ | 3,421,606 | $ | 50,566 | |||||||
|
| |||||||||||
| United States | ||||||||||||
| National Penn Bancshares, Inc. | 27,130 | 325,422 | 9,091 | |||||||||
|
| |||||||||||
Total of Long Equity Positions | 59,657 | |||||||||||
|
| |||||||||||
| Short Positions | ||||||||||||
| Common Stocks | ||||||||||||
| United Kingdom | ||||||||||||
| Liberty Global PLC | (542 | ) | (21,156 | ) | (1,803 | ) | ||||||
| Liberty Global PLC | (1,314 | ) | (49,299 | ) | (4,273 | ) | ||||||
|
| |||||||||||
| (6,076) | ||||||||||||
|
| |||||||||||
| United States | ||||||||||||
| ARRIS Group, Inc. | (150,719 | ) | (4,852,623 | ) | 245,144 | |||||||
| Ball Corp. | (46,020 | ) | (3,202,407 | ) | (144,627 | ) | ||||||
| REFERENCE ENTITY | SHARES | NOTIONAL (a) | NET UNREALIZED APPRECIATION (DEPRECIATION) | |||||||||
| United States (continued) | ||||||||||||
| BB&T Corp. | (5,908 | ) | $ | (215,023 | ) | $ | (8,359 | ) | ||||
| Equinix, Inc. | (11,942 | ) | (3,270,202 | ) | (341,059 | ) | ||||||
| Iron Mountain, Inc. | (79,245 | ) | (2,369,890 | ) | 229,483 | |||||||
|
| |||||||||||
| (19,418) | ||||||||||||
|
| |||||||||||
Total of Short Equity Positions | (25,494 | ) | ||||||||||
|
| |||||||||||
Total of Long and Short Equity Positions | 34,163 | |||||||||||
|
| |||||||||||
Net Cash and Other Receivables/ (Payables) (b) | 31,743 | |||||||||||
|
| |||||||||||
Swaps, at Value | $ | 65,906 | ||||||||||
|
| |||||||||||
| (a) | Notional value represents the market value (including any fees or commissions) of the long and short positions when they are established. |
| (b) | Cash and other receivables/(payables) includes the gains (or losses) realized within the swap when the swap resets. |
| The accompanying notes are an integral part of these financial statements. | (Continued) |
| AQR Funds | Annual Report | December 2015 | ||||||||||||||
180
Table of Contents
| Consolidated Schedule of Investments | December 31, 2015 |
| AQR MULTI-STRATEGY ALTERNATIVE FUND |
| COUNTERPARTY | DESCRIPTION | TERMINATION DATE** | VALUE (Note 5) | |||||
| Deutsche Bank | The Fund receives the total return on a portfolio of long and short positions and pays or receives the EUR/USD 1 Week Forward FX Swap Rate plus or minus a specified spread, which is denominated in EUR based on the local currencies of the positions within the swap. | 12 months maturity ranging from 04/26/2016 - 11/24/2016 | $519,059 | |||||
|
| |||||||
| ** | The maturity dates are measured from the commencement of investment in each underlying portfolio swap position. |
Additional Information — Total Return Basket Swaps
The following table represents the individual long and short positions and related values within the total return basket swap as of December 31, 2015.
| REFERENCE ENTITY | SHARES | NOTIONAL (a) | NET UNREALIZED APPRECIATION (DEPRECIATION) | |||||||||
| Long Positions | ||||||||||||
| Common Stocks | ||||||||||||
| France | ||||||||||||
| Alcatel-Lucent | 2,117,309 | $ | 7,796,087 | $ | 568,823 | |||||||
|
| |||||||||||
| Italy | ||||||||||||
| Enel Green Power SpA | 586,748 | 1,262,865 | (70,260 | ) | ||||||||
|
| |||||||||||
Total of Long Equity Positions | 498,563 | |||||||||||
|
| |||||||||||
| Short Positions | ||||||||||||
| Common Stocks | ||||||||||||
| Finland | ||||||||||||
| Nokia OYJ | (887,686 | ) | (6,239,593 | ) | (40,361 | ) | ||||||
|
| |||||||||||
| REFERENCE ENTITY | SHARES | NOTIONAL (a) | NET UNREALIZED APPRECIATION (DEPRECIATION) | |||||||||
| Italy | ||||||||||||
| Enel SpA | (285,160 | ) | $ | (1,278,960 | ) | $ | 83,197 | |||||
|
| |||||||||||
Total of Short Equity Positions | 42,836 | |||||||||||
|
| |||||||||||
Total of Long and Short Equity Positions | 541,399 | |||||||||||
|
| |||||||||||
Net Cash and Other Receivables/ (Payables) (b) | (22,340 | ) | ||||||||||
|
| |||||||||||
Swaps, at Value | $ | 519,059 | ||||||||||
|
| |||||||||||
| (a) | Notional value represents the market value (including any fees or commissions) of the long and short positions when they are established. |
| (b) | Cash and other receivables/(payables) includes the gains (or losses) realized within the swap when the swap resets. |
| The accompanying notes are an integral part of these financial statements. | (Continued) |
| AQR Funds | Annual Report | December 2015 | ||||||||||||||
181
Table of Contents
| Consolidated Schedule of Investments | December 31, 2015 |
| AQR MULTI-STRATEGY ALTERNATIVE FUND |
| COUNTERPARTY | DESCRIPTION | TERMINATION DATE** | VALUE (Note 5) | |||||
| Goldman Sachs | The Fund receives the total return on a portfolio of long and short positions and pays or receives the Hong Kong Interbank Offered Rate plus or minus a specified spread, which is denominated in HKD based on the local currencies of the positions within the swap. | 5 - 12 months maturity ranging from 04/25/2016 -12/12/2016 | $232,119 | |||||
|
| |||||||
| ** | The maturity dates are measured from the commencement of investment in each underlying swap position. |
Additional Information — Total Return Basket Swap
The following table represents the individual long and short positions and related values within the total return basket swap as of December 31, 2015.
| REFERENCE ENTITY | SHARES | NOTIONAL (a) | NET UNREALIZED APPRECIATION (DEPRECIATION) | |||||||||
| Long Positions | ||||||||||||
| Common Stocks | ||||||||||||
| China | ||||||||||||
| Air China Ltd. | 3,816,000 | $ | 4,033,348 | $ | (1,040,472 | ) | ||||||
| ANTA Sports Products Ltd. | 1,323,000 | 3,138,537 | 478,366 | |||||||||
| AviChina Industry & Technology Co., Ltd. | 1,207,000 | 970,420 | (27,295 | ) | ||||||||
| Bank of China Ltd. | 3,599,000 | 2,538,185 | (941,261 | ) | ||||||||
| Bank of Communications Co., Ltd. | 1,499,000 | 1,498,657 | (447,443 | ) | ||||||||
| Beijing Capital International Airport Co., Ltd. | 964,000 | 1,065,895 | (30,507 | ) | ||||||||
| China Cinda Asset Management Co., Ltd. | 1,376,000 | 504,199 | 2,250 | |||||||||
| China CITIC Bank Corp. Ltd. | 249,000 | 227,070 | (66,586 | ) | ||||||||
| China Communications Construction Co., Ltd. | 2,181,000 | 3,713,711 | (1,503,904 | ) | ||||||||
| China Communications Services Corp. Ltd. | 44,000 | 17,487 | (1,028 | ) | ||||||||
| China Construction Bank Corp. | 3,414,000 | 3,422,012 | (1,093,158 | ) | ||||||||
| China Galaxy Securities Co., Ltd. | 732,500 | 662,114 | 3,608 | |||||||||
| China International Marine Containers Group Co., Ltd. | 164,300 | 419,783 | (120,702 | ) | ||||||||
| China Longyuan Power Group Corp. Ltd. | 1,341,000 | 1,452,422 | (444,018 | ) | ||||||||
| China Medical System Holdings Ltd. | 288,000 | 512,680 | (90,597 | ) | ||||||||
| China Mengniu Dairy Co., Ltd. | 1,091,000 | 1,906,548 | (135,483 | ) | ||||||||
| China Petroleum & Chemical Corp. | 218,000 | 132,938 | (2,024 | ) | ||||||||
| China Shenhua Energy Co., Ltd. | 714,000 | 1,521,179 | (406,267 | ) | ||||||||
| REFERENCE ENTITY | SHARES | NOTIONAL (a) | NET UNREALIZED APPRECIATION (DEPRECIATION) | |||||||||
| China (continued) | ||||||||||||
| China Southern Airlines Co., Ltd. | 946,000 | $ | 592,859 | $ | 136,412 | |||||||
| China Telecom Corp. Ltd. | 1,918,000 | 1,422,075 | (527,391 | ) | ||||||||
| Chongqing Rural Commercial Bank Co., Ltd. | 227,000 | 135,352 | 989 | |||||||||
| CNOOC Ltd. | 89,000 | 100,091 | (7,462 | ) | ||||||||
| CSPC Pharmaceutical Group Ltd. | 846,000 | 834,842 | 27,662 | |||||||||
| Dongfeng Motor Group Co., Ltd. | 2,018,000 | 3,085,343 | (412,061 | ) | ||||||||
| ENN Energy Holdings Ltd. | 62,000 | 322,381 | 6,505 | |||||||||
| Geely Automobile Holdings Ltd. | 7,845,000 | 3,811,865 | 333,492 | |||||||||
| GOME Electrical Appliances Holding Ltd. | 18,743,000 | 3,568,128 | (461,165 | ) | ||||||||
| Great Wall Motor Co., Ltd. | 955,500 | 1,522,059 | (418,431 | ) | ||||||||
| Huadian Power International Corp. Ltd. | 1,266,000 | 992,010 | (172,812 | ) | ||||||||
| Industrial & Commercial Bank of China Ltd. | 469,000 | 282,266 | (1,138 | ) | ||||||||
| Kingsoft Corp. Ltd. | 75,000 | 159,640 | 22,485 | |||||||||
| People’s Insurance Co. Group of China Ltd./The | 2,832,000 | 1,847,139 | (468,309 | ) | ||||||||
| PICC Property & Casualty Co., Ltd. | 1,744,000 | 3,771,080 | (329,268 | ) | ||||||||
| Semiconductor Manufacturing International Corp. | 10,725,000 | 1,089,101 | 1,579 | |||||||||
| Shandong Weigao Group Medical Polymer Co., Ltd. | 76,000 | 67,423 | (15,455 | ) | ||||||||
| The accompanying notes are an integral part of these financial statements. | (Continued) |
| AQR Funds | Annual Report | December 2015 | ||||||||||||||
182
Table of Contents
| Consolidated Schedule of Investments | December 31, 2015 |
| AQR MULTI-STRATEGY ALTERNATIVE FUND |
| REFERENCE ENTITY | SHARES | NOTIONAL (a) | NET UNREALIZED APPRECIATION (DEPRECIATION) | |||||||||
| China (continued) | ||||||||||||
| Sinopec Engineering Group Co., Ltd. | 31,000 | $ | 25,408 | $ | 962 | |||||||
| Sinopec Shanghai Petrochemical Co., Ltd. | 5,211,000 | 2,572,862 | (511,879 | ) | ||||||||
| Sinopharm Group Co., Ltd. | 49,200 | 211,941 | (15,524 | ) | ||||||||
| Tencent Holdings Ltd. | 3,200 | 62,583 | 73 | |||||||||
| Weichai Power Co., Ltd. | 1,251,000 | 1,438,201 | (60,525 | ) | ||||||||
| Zhejiang Expressway Co., Ltd. | 1,116,000 | 1,768,576 | (435,131 | ) | ||||||||
| Zhuzhou CSR Times Electric Co., Ltd. | 501,000 | 3,721,825 | (832,779 | ) | ||||||||
| ZTE Corp. | 11,000 | 25,322 | (351 | ) | ||||||||
|
| |||||||||||
| (10,006,043) | ||||||||||||
|
| |||||||||||
| Hong Kong | ||||||||||||
| Beijing Enterprises Holdings Ltd. | 12,500 | 76,567 | (1,214 | ) | ||||||||
| China Agri-Industries Holdings Ltd. | 305,000 | 110,915 | (6,868 | ) | ||||||||
| China Mobile Ltd. | 25,775 | 317,294 | (27,168 | ) | ||||||||
| China Power International Development Ltd. | 1,445,000 | 894,144 | (62,353 | ) | ||||||||
| China Resources Cement Holdings Ltd. | 968,000 | 537,060 | (241,383 | ) | ||||||||
| China Resources Power Holdings Co., Ltd. | 442,000 | 1,133,384 | (278,242 | ) | ||||||||
| China Taiping Insurance Holdings Co., Ltd. | 7,200 | 22,196 | (95 | ) | ||||||||
| CITIC Ltd. | 610,000 | 1,113,608 | (38,030 | ) | ||||||||
| Guangdong Investment Ltd. | 1,342,000 | 1,931,181 | (35,971 | ) | ||||||||
| Sino Biopharmaceutical Ltd. | 3,868,999 | 2,978,063 | 519,964 | |||||||||
|
| |||||||||||
| (171,360) | ||||||||||||
|
| |||||||||||
Total of Long Equity Positions | (10,177,403 | ) | ||||||||||
|
| |||||||||||
| Short Positions | ||||||||||||
| Common Stocks | ||||||||||||
| China | ||||||||||||
| AAC Technologies Holdings, Inc. | (374,094 | ) | (2,021,196 | ) | (412,418 | ) | ||||||
| Aluminum Corp. of China Ltd. | (660,000 | ) | (319,557 | ) | 102,904 | |||||||
| Anhui Conch Cement Co., Ltd. | (499,000 | ) | (1,655,521 | ) | 321,656 | |||||||
| BBMG Corp. | (448,000 | ) | (414,283 | ) | 111,666 | |||||||
| Byd Co., Ltd. | (696,000 | ) | (3,887,291 | ) | 90,725 | |||||||
| CGN Power Co., Ltd. | (5,033,000 | ) | (2,502,679 | ) | 628,784 | |||||||
| China Merchants Bank Co., Ltd. | (1,107,000 | ) | (3,120,385 | ) | 529,074 | |||||||
| China Minsheng Banking Corp. Ltd. | (934,000 | ) | (891,458 | ) | (29,932 | ) | ||||||
| REFERENCE ENTITY | SHARES | NOTIONAL (a) | NET UNREALIZED APPRECIATION (DEPRECIATION) | |||||||||
| China (continued) | ||||||||||||
| China Oilfield Services Ltd. | (4,040,000 | ) | $ | (6,720,740 | ) | $ | 3,249,145 | |||||
| China Pacific Insurance Group Co., Ltd. | (633,400 | ) | (3,055,406 | ) | 463,298 | |||||||
| China Railway Group Ltd. | (270,000 | ) | (223,702 | ) | 20,071 | |||||||
| China Shipping Container Lines Co., Ltd. | (6,029,000 | ) | (2,871,785 | ) | 1,204,531 | |||||||
| CITIC Securities Co., Ltd. | (517,500 | ) | (1,043,276 | ) | (155,849 | ) | ||||||
| CRRC Corp. Ltd. | (2,708,000 | ) | (3,504,410 | ) | 177,735 | |||||||
| Datang International Power Generation Co., Ltd. | (314,000 | ) | (101,048 | ) | 5,989 | |||||||
| Fosun International Ltd. | (241,000 | ) | (443,111 | ) | 68,623 | |||||||
| GF Securities Co., Ltd. | (177,200 | ) | (447,010 | ) | 5,032 | |||||||
| Huaneng Power International, Inc. | (788,000 | ) | (784,921 | ) | 110,163 | |||||||
| Huatai Securities Co., Ltd. | (678,200 | ) | (1,491,421 | ) | (76,381 | ) | ||||||
| Jiangsu Expressway Co., Ltd. | (270,000 | ) | (346,548 | ) | (15,822 | ) | ||||||
| Lenovo Group Ltd. | (1,796,000 | ) | (2,330,440 | ) | 517,929 | |||||||
| New China Life Insurance Co., Ltd. | (170,000 | ) | (733,715 | ) | 23,305 | |||||||
| PetroChina Co., Ltd. | (32,000 | ) | (25,201 | ) | 4,253 | |||||||
| Ping An Insurance Group Co. of China Ltd. | (78,500 | ) | (437,174 | ) | 4,270 | |||||||
| Shanghai Fosun Pharmaceutical Group Co., Ltd. | (523,000 | ) | (1,998,854 | ) | 485,808 | |||||||
| Shenzhou International Group Holdings Ltd. | (45,000 | ) | (238,776 | ) | (19,109 | ) | ||||||
| Sinotrans Ltd. | (1,510,000 | ) | (862,993 | ) | 59,203 | |||||||
| Tingyi Cayman Islands Holding Corp. | (1,336,000 | ) | (2,377,947 | ) | 479,918 | |||||||
| Want Want China Holdings Ltd. | (3,263,000 | ) | (3,388,659 | ) | 966,904 | |||||||
| Zijin Mining Group Co., Ltd. | (8,048,000 | ) | (2,379,400 | ) | 272,526 | |||||||
|
| |||||||||||
| 9,194,001 | ||||||||||||
|
| |||||||||||
| Hong Kong | ||||||||||||
| Beijing Enterprises Water Group Ltd. | (5,376,000 | ) | (4,566,430 | ) | 816,751 | |||||||
| Brilliance China Automotive Holdings Ltd. | (3,202,000 | ) | (4,113,813 | ) | 108,919 | |||||||
| China Gas Holdings Ltd. | (2,620,000 | ) | (4,469,975 | ) | 705,351 | |||||||
| China Resources Beer Holdings Co., Ltd. | (32,000 | ) | (62,138 | ) | (6,140 | ) | ||||||
| China Resources Gas Group Ltd. | (456,000 | ) | (1,588,352 | ) | 229,333 | |||||||
| China State Construction International Holdings Ltd. | (164,000 | ) | (258,040 | ) | (25,567 | ) | ||||||
| The accompanying notes are an integral part of these financial statements. | (Continued) |
| AQR Funds | Annual Report | December 2015 | ||||||||||||||
183
Table of Contents
| Consolidated Schedule of Investments | December 31, 2015 |
| AQR MULTI-STRATEGY ALTERNATIVE FUND |
| REFERENCE ENTITY | SHARES | NOTIONAL (a) | NET UNREALIZED APPRECIATION (DEPRECIATION) | |||||||||
| Hong Kong (continued) | ||||||||||||
| China Unicom Hong Kong Ltd. | (338,000 | ) | $ | (439,192 | ) | $ | 30,886 | |||||
|
| |||||||||||
| 1,859,533 | ||||||||||||
|
| |||||||||||
Total of Short Equity Positions | 11,053,534 | |||||||||||
|
| |||||||||||
Total of Long and Short Equity Positions | 876,131 | |||||||||||
|
| |||||||||||
Net Cash and Other Receivables/ (Payables) (b) | (644,012 | ) | ||||||||||
|
| |||||||||||
Swaps, at Value | $ | 232,119 | ||||||||||
|
| |||||||||||
| (a) | Notional value represents the market value (including any fees or commissions) of the long and short positions when they are established. |
| (b) | Cash and other receivables/(payables) includes the gains (or losses) realized within the swap when the swap resets. |
| COUNTERPARTY | DESCRIPTION | TERMINATION DATE** | VALUE (Note 5) | |||||
| Goldman Sachs | The Fund receives the total return on a portfolio of long and short positions and pays or receives the Warsaw Interbank Offered Rate plus or minus a specified spread, which is denominated in PLN based on the local currencies of the positions within the swaps. | 12 months maturity ranging from 04/25/2016 - 12/09/2016 | $(1,429,710 | ) | ||||
|
| |||||||
| ** | The maturity dates are measured from the commencement of investment in each underlying swap position. |
Additional Information — Total Return Basket Swap
The following table represents the individual long and short positions and related values within the total return basket swap as of December 31, 2015.
| REFERENCE ENTITY | SHARES | NOTIONAL (a) | NET UNREALIZED APPRECIATION (DEPRECIATION) | |||||||||
| Long Positions | ||||||||||||
| Common Stocks | ||||||||||||
| Poland | ||||||||||||
| Energa SA | 141,285 | $ | 930,529 | $ | (475,702 | ) | ||||||
| KGHM Polska Miedz SA | 37,731 | 808,535 | (199,926 | ) | ||||||||
| PGE Polska Grupa Energetyczna SA | 644,962 | 3,534,309 | (1,443,296 | ) | ||||||||
| Polskie Gornictwo Naftowe i Gazownictwo SA | 616,834 | 933,510 | (128,439 | ) | ||||||||
|
| |||||||||||
| (2,247,363) | ||||||||||||
|
| |||||||||||
Total of Long Equity Positions | (2,247,363 | ) | ||||||||||
|
| |||||||||||
| Short Positions | ||||||||||||
| Common Stocks | ||||||||||||
| Poland | ||||||||||||
| Bank Pekao SA | (11,136 | ) | (549,603 | ) | 142,885 | |||||||
| Mbank SA | (4,347 | ) | (514,334 | ) | 167,181 | |||||||
| Polski Koncern Naftowy Orlen SA | (4,113 | ) | (70,601 | ) | (201 | ) | ||||||
| Powszechna Kasa Oszczednosci Bank Polski SA | (207,740 | ) | (1,914,120 | ) | 471,232 | |||||||
| REFERENCE ENTITY | SHARES | NOTIONAL (a) | NET UNREALIZED APPRECIATION (DEPRECIATION) | |||||||||
| Poland (continued) | ||||||||||||
| Powszechny Zaklad Ubezpieczen SA | (15,828 | ) | $ | (140,836 | ) | $ | 4,288 | |||||
|
| |||||||||||
| 785,385 | ||||||||||||
|
| |||||||||||
Total of Short Equity Positions | 785,385 | |||||||||||
|
| |||||||||||
Total of Long and Short Equity Positions | (1,461,978 | ) | ||||||||||
|
| |||||||||||
Net Cash and Other Receivables/ (Payables) (b) | 32,268 | |||||||||||
|
| |||||||||||
Swaps, at Value | $ | (1,429,710 | ) | |||||||||
|
| |||||||||||
| (a) | Notional value represents the market value (including any fees or commissions) of the long and short positions when they are established. |
| (b) | Cash and other receivables/(payables) includes the gains (or losses) realized within the swap when the swap resets. |
| The accompanying notes are an integral part of these financial statements. | (Continued) |
| AQR Funds | Annual Report | December 2015 | ||||||||||||||
184
Table of Contents
| Consolidated Schedule of Investments | December 31, 2015 |
| AQR MULTI-STRATEGY ALTERNATIVE FUND |
| COUNTERPARTY | DESCRIPTION | TERMINATION DATE** | VALUE (Note 5) | |||||
| Goldman Sachs | The Fund receives the total return on a portfolio of long and short positions and pays or receives the LIBOR plus or minus a specified spread, which is denominated in USD based on the local currencies of the positions within the swaps. | 8-12 months maturity ranging from 04/25/2016 - 12/21/2016 | $(1,758,504 | ) | ||||
|
| |||||||
| ** | The maturity dates are measured from the commencement of investment in each underlying swap position. |
Additional Information — Total Return Basket Swap
The following table represents the individual long and short positions and related values within the total return basket swap as of December 31, 2015.
| REFERENCE ENTITY | SHARES | NOTIONAL (a) | NET UNREALIZED APPRECIATION (DEPRECIATION) | |||||||||
| Long Positions | ||||||||||||
| Common Stocks | ||||||||||||
| Brazil | ||||||||||||
| Banco do Brasil SA | 18,300 | $ | 85,179 | $ | (16,998 | ) | ||||||
| BRF SA | 195,320 | 3,411,713 | (676,616 | ) | ||||||||
| Cia Energetica de Minas Gerais | 464,261 | 1,542,543 | (846,151 | ) | ||||||||
| EDP - Energias do Brasil SA | 186,000 | 684,721 | (118,670 | ) | ||||||||
| JBS SA | 986,993 | 4,620,452 | (1,539,412 | ) | ||||||||
| Porto Seguro SA | 25,000 | 297,372 | (115,445 | ) | ||||||||
| Qualicorp SA | 71,300 | 322,079 | (67,427 | ) | ||||||||
| TOTVS SA | 2,700 | 22,645 | (1,468 | ) | ||||||||
|
| |||||||||||
| (3,382,187) | ||||||||||||
|
| |||||||||||
| Indonesia | ||||||||||||
| Bank Negara Indonesia Persero Tbk PT | 605,600 | 336,138 | (119,322 | ) | ||||||||
| Indofood Sukses Makmur Tbk PT | 1,202,600 | 690,727 | (243,096 | ) | ||||||||
| Telekomunikasi Indonesia Persero Tbk PT | 1,951,800 | 386,818 | 50,340 | |||||||||
| United Tractors Tbk PT | 808,800 | 1,142,043 | (157,238 | ) | ||||||||
|
| |||||||||||
| (469,316) | ||||||||||||
|
| |||||||||||
| Korea, Republic of | ||||||||||||
| Amorepacific Corp. | 3,777 | 1,283,427 | 42,025 | |||||||||
| BGF retail Co., Ltd. | 1,817 | 280,985 | (17,935 | ) | ||||||||
| BNK Financial Group, Inc. | 2,269 | 26,920 | (10,756 | ) | ||||||||
| Coway Co., Ltd. | 1,516 | 112,946 | (5,004 | ) | ||||||||
| Daewoo International Corp. | 6,363 | 100,681 | (13,059 | ) | ||||||||
| Daewoo Securities Co., Ltd. | 250,861 | 2,807,075 | (821,283 | ) | ||||||||
| DGB Financial Group, Inc. | 14,313 | 129,126 | (7,193 | ) | ||||||||
| Dongbu Insurance Co., Ltd. | 22,209 | 1,060,315 | 268,482 | |||||||||
| REFERENCE ENTITY | SHARES | NOTIONAL (a) | NET UNREALIZED APPRECIATION (DEPRECIATION) | |||||||||
| Korea, Republic of (continued) | ||||||||||||
| Hana Financial Group, Inc. | 7,588 | $ | 170,458 | $ | (18,828 | ) | ||||||
| Hanwha Corp. | 122,614 | 4,720,166 | (654,826 | ) | ||||||||
| Hanwha Life Insurance Co., Ltd. | 212,786 | 1,468,636 | (131,743 | ) | ||||||||
| Hyosung Corp. | 18,915 | 2,141,254 | (270,492 | ) | ||||||||
| Hyundai Development Co-Engineering & Construction | 21,180 | 1,179,393 | (487,270 | ) | ||||||||
| Hyundai Engineering & Construction Co., Ltd. | 15,971 | 842,138 | (458,733 | ) | ||||||||
| Hyundai Marine & Fire Insurance Co., Ltd. | 7,842 | 179,748 | 60,532 | |||||||||
| Hyundai Mobis Co., Ltd. | 9,431 | 2,053,445 | (80,201 | ) | ||||||||
| Hyundai Wia Corp. | 18,184 | 1,589,874 | 129,432 | |||||||||
| Kia Motors Corp. | 35,247 | 1,615,183 | (43,520 | ) | ||||||||
| Korea Aerospace Industries Ltd. | 1,233 | 100,374 | (18,980 | ) | ||||||||
| Korea Electric Power Corp. | 45,027 | 1,841,281 | 66,387 | |||||||||
| Korean Air Lines Co., Ltd. | 80,399 | 3,354,719 | (1,467,383 | ) | ||||||||
| LG Chem Ltd. | 1,063 | 279,174 | 14,302 | |||||||||
| LG Display Co., Ltd. | 52,863 | 1,100,005 | (5,088 | ) | ||||||||
| Lotte Chemical Corp. | 14,368 | 2,970,625 | (38,874 | ) | ||||||||
| LS Industrial Systems Co., Ltd. | 2,937 | 119,896 | (5,501 | ) | ||||||||
| NCSoft Corp. | 21,003 | 3,910,064 | (123,735 | ) | ||||||||
| NH Investment & Securities Co., Ltd. | 43,110 | 380,557 | (15,797 | ) | ||||||||
| Orion Corp. | 695 | 565,171 | 121,323 | |||||||||
| Samsung Card Co., Ltd. | 23,992 | 913,721 | (285,614 | ) | ||||||||
| Samsung Electro-Mechanics Co., Ltd. | 2,012 | 115,246 | (8,344 | ) | ||||||||
| Samsung Electronics Co., Ltd. | 2,756 | 3,074,938 | (135,438 | ) | ||||||||
| Samsung Securities Co., Ltd. | 18,623 | 738,065 | (84,468 | ) | ||||||||
| Shinsegae Co., Ltd. | 8,856 | 1,724,720 | (1,692 | ) | ||||||||
| The accompanying notes are an integral part of these financial statements. | (Continued) |
| AQR Funds | Annual Report | December 2015 | ||||||||||||||
185
Table of Contents
| Consolidated Schedule of Investments | December 31, 2015 |
| AQR MULTI-STRATEGY ALTERNATIVE FUND |
| REFERENCE ENTITY | SHARES | NOTIONAL (a) | NET UNREALIZED APPRECIATION (DEPRECIATION) | |||||||||
| Korea, Republic of (continued) | ||||||||||||
| SK Hynix, Inc. | 106,189 | $ | 4,216,357 | $ | (1,473,181 | ) | ||||||
| SK Innovation Co., Ltd. | 8,304 | 751,221 | 159,487 | |||||||||
| SK Networks Co., Ltd. | 69,705 | 524,127 | (200,769 | ) | ||||||||
| S-Oil Corp. | 43,383 | 2,187,159 | 718,907 | |||||||||
| Woori Bank | 37,688 | 289,017 | (7,138 | ) | ||||||||
|
| |||||||||||
| (5,311,968) | ||||||||||||
|
| |||||||||||
| Malaysia | ||||||||||||
| AirAsia Bhd | 1,326,400 | 435,238 | (38,428 | ) | ||||||||
|
| |||||||||||
| Mexico | ||||||||||||
| America Movil SAB de CV | 38,655 | 847,704 | (304,215 | ) | ||||||||
|
| |||||||||||
| Taiwan | ||||||||||||
| AU Optronics Corp. | 1,120,000 | 324,850 | 5,342 | |||||||||
| Chicony Electronics Co., Ltd. | 12,597 | 33,067 | (5,513 | ) | ||||||||
| China Airlines Ltd. | 3,184,000 | 1,458,179 | (297,697 | ) | ||||||||
| China Life Insurance Co., Ltd. | 311,000 | 242,968 | (5,479 | ) | ||||||||
| Compal Electronics, Inc. | 194,000 | 148,088 | (39,526 | ) | ||||||||
| Eva Airways Corp. | 2,019,000 | 1,262,090 | (121,904 | ) | ||||||||
| Feng TAY Enterprise Co., Ltd. | 99,060 | 609,049 | (105,278 | ) | ||||||||
| Foxconn Technology Co., Ltd. | 184,770 | 580,044 | (190,822 | ) | ||||||||
| Fubon Financial Holding Co., Ltd. | 1,714,297 | 3,179,825 | (847,988 | ) | ||||||||
| Hon Hai Precision Industry Co., Ltd. | 10,000 | 26,058 | (1,585 | ) | ||||||||
| HTC Corp. | 318,000 | 680,366 | 71,001 | |||||||||
| Innolux Corp. | 7,337,000 | 2,439,665 | (234,383 | ) | ||||||||
| Inotera Memories, Inc. | 3,096,842 | 2,560,238 | 51,948 | |||||||||
| Kinsus Interconnect Technology Corp. | 228,000 | 476,827 | (15,937 | ) | ||||||||
| Largan Precision Co., Ltd. | 18,000 | 1,773,563 | (541,916 | ) | ||||||||
| Pegatron Corp. | 786,000 | 2,224,240 | (514,715 | ) | ||||||||
| Pou Chen Corp. | 51,000 | 80,661 | (14,110 | ) | ||||||||
| Powertech Technology, Inc. | 342,000 | 680,389 | (6,037 | ) | ||||||||
| Siliconware Precision Industries Co., Ltd. | 255,000 | 354,698 | 47,992 | |||||||||
| Wan Hai Lines Ltd. | 694,000 | 565,660 | (183,216 | ) | ||||||||
| Zhen Ding Technology Holding Ltd. | 282,000 | 809,748 | (166,775 | ) | ||||||||
|
| |||||||||||
| (3,116,598) | ||||||||||||
|
| |||||||||||
Total of Long Common Stocks | (12,622,712 | ) | ||||||||||
|
| |||||||||||
| Preferred Stocks | ||||||||||||
| Brazil | ||||||||||||
| Braskem SA | 100,300 | 368,824 | 331,407 | |||||||||
| Cia Energetica de Sao Paulo | 252,100 | 1,787,116 | (933,242 | ) | ||||||||
| REFERENCE ENTITY | SHARES | NOTIONAL (a) | NET UNREALIZED APPRECIATION (DEPRECIATION) | |||||||||
| Brazil (continued) | ||||||||||||
| Gerdau SA | 40,472 | $ | 59,087 | $ | (11,518 | ) | ||||||
| Oi SA | 156,000 | 98,401 | (21,510 | ) | ||||||||
| Suzano Papel e Celulose SA | 457,900 | 2,050,516 | 112,682 | |||||||||
|
| |||||||||||
| (522,181) | ||||||||||||
|
| |||||||||||
Total of Long Equity Positions | (13,144,893 | ) | ||||||||||
|
| |||||||||||
| Short Positions | ||||||||||||
| Common Stocks | ||||||||||||
| Brazil | ||||||||||||
| CCR SA | (197,300 | ) | (667,378 | ) | 41,503 | |||||||
| Cia de Saneamento Basico do Estado de Sao Paulo | (238,132 | ) | (1,394,688 | ) | 299,281 | |||||||
| EcoRodovias Infraestrutura e Logistica SA | (281,800 | ) | (441,124 | ) | 78,568 | |||||||
| Kroton Educacional SA | (46,300 | ) | (127,082 | ) | 15,552 | |||||||
| Tim Participacoes SA | (255,603 | ) | (3,803,090 | ) | 1,635,576 | |||||||
|
| |||||||||||
| 2,070,480 | ||||||||||||
|
| |||||||||||
| Chile | ||||||||||||
| Banco Santander Chile | (65,667 | ) | (1,428,655 | ) | 270,289 | |||||||
| Sociedad Quimica y Minera de Chile SA | (96,030 | ) | (1,700,570 | ) | (124,961 | ) | ||||||
|
| |||||||||||
| 145,328 | ||||||||||||
|
| |||||||||||
| Korea, Republic of | ||||||||||||
| Cheil Worldwide, Inc. | (3,344 | ) | (61,015 | ) | 2,530 | |||||||
| Daewoo Engineering & Construction Co., Ltd. | (354,846 | ) | (2,344,225 | ) | 665,977 | |||||||
| Dongsuh Cos., Inc. | (2,787 | ) | (79,840 | ) | 6,212 | |||||||
| Doosan Corp. | (5,712 | ) | (573,214 | ) | 144,020 | |||||||
| Doosan Heavy Industries & Construction Co., Ltd. | (16,178 | ) | (316,580 | ) | 35,073 | |||||||
| E-MART, Inc. | (4,171 | ) | (723,137 | ) | 53,860 | |||||||
| GS Engineering & Construction Corp. | (78,039 | ) | (1,741,430 | ) | 448,436 | |||||||
| GS Holdings Corp. | (33,103 | ) | (1,407,244 | ) | (11,179 | ) | ||||||
| Hankook Tire Co., Ltd. | (11,481 | ) | (430,447 | ) | (27,482 | ) | ||||||
| Hanon Systems | (402 | ) | (13,961 | ) | (3,693 | ) | ||||||
| Hanwha Chemical Corp. | (145,587 | ) | (2,374,335 | ) | (942,725 | ) | ||||||
| Hotel Shilla Co., Ltd. | (22,886 | ) | (2,312,490 | ) | 813,934 | |||||||
| Hyundai Glovis Co., Ltd. | (22,435 | ) | (4,292,113 | ) | 636,721 | |||||||
| Hyundai Heavy Industries Co., Ltd. | (37,661 | ) | (3,637,445 | ) | 853,792 | |||||||
| Hyundai Motor Co. | (25,469 | ) | (3,125,373 | ) | (86,875 | ) | ||||||
| Industrial Bank of Korea | (78,475 | ) | (888,750 | ) | 68,179 | |||||||
| Kangwon Land, Inc. | (15,547 | ) | (579,286 | ) | 71,856 | |||||||
| The accompanying notes are an integral part of these financial statements. | (Continued) |
| AQR Funds | Annual Report | December 2015 | ||||||||||||||
186
Table of Contents
| Consolidated Schedule of Investments | December 31, 2015 |
| AQR MULTI-STRATEGY ALTERNATIVE FUND |
| REFERENCE ENTITY | SHARES | NOTIONAL (a) | NET UNREALIZED APPRECIATION (DEPRECIATION) | |||||||||
| Korea, Republic of (continued) | ||||||||||||
| KCC Corp. | (3,349 | ) | $ | (1,209,867 | ) | $ | 28,442 | |||||
| Korea Investment Holdings Co., Ltd. | (749 | ) | (33,722 | ) | 2,422 | |||||||
| Korea Zinc Co., Ltd. | (77 | ) | (30,485 | ) | (184 | ) | ||||||
| LG Electronics, Inc. | (6,806 | ) | (301,325 | ) | (8,107 | ) | ||||||
| Lotte Confectionery Co., Ltd. | (189 | ) | (295,804 | ) | (70,629 | ) | ||||||
| Lotte Shopping Co. | (4,537 | ) | (888,164 | ) | (4,349 | ) | ||||||
| NAVER Corp. | (1,285 | ) | (775,519 | ) | 58,952 | |||||||
| POSCO | (10,079 | ) | (1,816,559 | ) | 404,680 | |||||||
| Samsung C&T Corp | (30,387 | ) | (3,882,470 | ) | 295,679 | |||||||
| Samsung Fire & Marine Insurance Co., Ltd. | (1,061 | ) | (249,241 | ) | (28,111 | ) | ||||||
| Samsung Heavy Industries Co., Ltd. | (151,337 | ) | (2,439,921 | ) | 1,061,413 | |||||||
| Samsung Life Insurance Co., Ltd. | (2,450 | ) | (218,650 | ) | (10,302 | ) | ||||||
| Samsung SDI Co., Ltd. | (34,797 | ) | (3,223,140 | ) | (122,066 | ) | ||||||
| Samsung SDS Co., Ltd. | (14,308 | ) | (3,340,318 | ) | 262,855 | |||||||
|
| |||||||||||
| 4,599,331 | ||||||||||||
|
| |||||||||||
| Mexico | ||||||||||||
| Grupo Aeroportuario del Sureste SAB de CV | (836 | ) | (127,183 | ) | 9,583 | |||||||
| Grupo Financiero Santander Mexico SAB de CV | (347,101 | ) | (3,420,625 | ) | 411,259 | |||||||
|
| |||||||||||
| 420,842 | ||||||||||||
|
| |||||||||||
| South Africa | ||||||||||||
| Anglogold Ashanti Ltd. | (118,951 | ) | (1,169,960 | ) | 325,408 | |||||||
|
| |||||||||||
| Taiwan | ||||||||||||
| Advanced Semiconductor Engineering, Inc. | (1,186,000 | ) | (1,362,762 | ) | 379 | |||||||
| Chang Hwa Commercial Bank Ltd. | (919,130 | ) | (526,469 | ) | 88,751 | |||||||
| Delta Electronics Inc. | (216,000 | ) | (1,032,168 | ) | 16,194 | |||||||
| REFERENCE ENTITY | SHARES | NOTIONAL (a) | NET UNREALIZED APPRECIATION (DEPRECIATION) | |||||||||
| Taiwan (continued) | ||||||||||||
| E.Sun Financial Holding Co., Ltd. | (917,435 | ) | $ | (514,948 | ) | $ | (17,698 | ) | ||||
| Formosa Chemicals & Fibre Corp. | (799,000 | ) | (2,077,021 | ) | 284,695 | |||||||
| Formosa Petrochemical Corp. | (218,000 | ) | (580,517 | ) | 59,075 | |||||||
| Formosa Plastics Corp. | (103,000 | ) | (270,055 | ) | 29,609 | |||||||
| Hotai Motor Co., Ltd. | (83,000 | ) | (1,176,298 | ) | 221,739 | |||||||
| MediaTek, Inc. | (476,000 | ) | (4,973,449 | ) | 1,373,223 | |||||||
| President Chain Store Corp. | (2,000 | ) | (13,423 | ) | 941 | |||||||
| Quanta Computer, Inc. | (1,629,000 | ) | (3,968,718 | ) | 1,355,402 | |||||||
| SinoPac Financial Holdings Co., Ltd. | (641,135 | ) | (261,906 | ) | 79,862 | |||||||
| Taishin Financial Holding Co., Ltd. | (1,744,000 | ) | (804,036 | ) | 201,461 | |||||||
| Wistron Corp. | (1,007,000 | ) | (524,545 | ) | (40,418 | ) | ||||||
|
| |||||||||||
| 3,653,215 | ||||||||||||
|
| |||||||||||
Total of Short Common Stocks | 11,214,604 | |||||||||||
|
| |||||||||||
| Preferred Stocks | ||||||||||||
| Brazil | ||||||||||||
| Vale SA | (276,901 | ) | (1,031,096 | ) | 313,692 | |||||||
|
| |||||||||||
Total of Short Equity Positions | 11,528,296 | |||||||||||
|
| |||||||||||
Total of Long and Short Equity Positions |
| (1,616,597 | ) | |||||||||
|
| |||||||||||
Net Cash and Other Receivables/ (Payables) (b) | (141,907 | ) | ||||||||||
|
| |||||||||||
Swaps, at Value | $ | (1,758,504 | ) | |||||||||
|
| |||||||||||
| (a) | Notional value represents the market value (including any fees or commissions) of the long and short positions when they are established. |
| (b) | Cash and other receivables/(payables) includes the gains (or losses) realized within the swap when the swap resets. |
| The accompanying notes are an integral part of these financial statements. | (Continued) |
| AQR Funds | Annual Report | December 2015 | ||||||||||||||
187
Table of Contents
| Consolidated Schedule of Investments | December 31, 2015 |
| AQR MULTI-STRATEGY ALTERNATIVE FUND |
| COUNTERPARTY | DESCRIPTION | TERMINATION DATE** | VALUE (Note 5) | |||||
| Goldman Sachs | The Fund receives the total return on a portfolio of long and short positions and pays or receives the Rand Overnight Deposit Rate plus or minus a specified spread, which is denominated in ZAR based on the local currencies of the positions within the swaps. | 12-13 months maturity ranging from 04/29/2016 - 12/14/2016 | $1,786,820 | |||||
|
| |||||||
| ** | The maturity dates are measured from the commencement of investment in each underlying swap position. |
Additional Information — Total Return Basket Swap
The following table represents the individual long and short positions and related values within the total return basket swap as of December 31, 2015.
| REFERENCE ENTITY | SHARES | NOTIONAL (a) | NET UNREALIZED APPRECIATION (DEPRECIATION) | |||||||||
| Long Positions | ||||||||||||
| Common Stocks | ||||||||||||
| Malta | ||||||||||||
| Brait SE | 75,431 | $ | 660,940 | $ | 152,867 | |||||||
|
| |||||||||||
| South Africa | ||||||||||||
| Barloworld Ltd. | 6,727 | 31,015 | (3,956 | ) | ||||||||
| Foschini Group Ltd./The | 92,829 | 1,133,821 | (404,383 | ) | ||||||||
| Investec Ltd. | 2,922 | 22,419 | (1,777 | ) | ||||||||
| Kumba Iron Ore Ltd. | 11,565 | 30,301 | 506 | |||||||||
| Mondi Ltd. | 41,639 | 829,048 | (5,046 | ) | ||||||||
| Netcare Ltd. | 68,618 | 196,805 | (46,519 | ) | ||||||||
| RMB Holdings Ltd. | 166,344 | 779,998 | (183,598 | ) | ||||||||
| Telkom SA SOC Ltd. | 202,962 | 865,191 | (21,939 | ) | ||||||||
|
| |||||||||||
| (666,712) | ||||||||||||
|
| |||||||||||
Total of Long Equity Positions | (513,845 | ) | ||||||||||
|
| |||||||||||
| Short Positions | ||||||||||||
| Common Stocks | ||||||||||||
| South Africa | ||||||||||||
| Anglo American Platinum Ltd. | (18,526 | ) | (347,416 | ) | 124,293 | |||||||
| Coronation Fund Managers Ltd. | (136,604 | ) | (541,359 | ) | 73,499 | |||||||
| Discovery Ltd. | (66,117 | ) | (540,676 | ) | (26,385 | ) | ||||||
| Impala Platinum Holdings Ltd. | (1,069,672 | ) | (3,851,278 | ) | 2,120,853 | |||||||
| REFERENCE ENTITY | SHARES | NOTIONAL (a) | NET UNREALIZED APPRECIATION (DEPRECIATION) | |||||||||
| South Africa (continued) | ||||||||||||
| Imperial Holdings Ltd. | (45,949 | ) | $ | (579,517 | ) | $ | 223,337 | |||||
| Massmart Holdings Ltd. | (46,838 | ) | (421,128 | ) | 117,911 | |||||||
| MR PRICE GROUP LTD | (8,555 | ) | (105,883 | ) | (4,754 | ) | ||||||
| MTN Group Ltd. | (17,378 | ) | (227,891 | ) | 78,191 | |||||||
| Nedbank Group Ltd. | (11,212 | ) | (176,708 | ) | 39,743 | |||||||
| Sanlam Ltd. | (78,008 | ) | (349,741 | ) | 44,598 | |||||||
| Shoprite Holdings Ltd. | (4,808 | ) | (50,240 | ) | 5,684 | |||||||
| SPAR Group Ltd./The | (25,181 | ) | (308,879 | ) | 9,268 | |||||||
| Tiger Brands Ltd. | (32,151 | ) | (596,606 | ) | (61,951 | ) | ||||||
| Tsogo Sun Holdings Ltd. | (40,722 | ) | (61,560 | ) | (2,430 | ) | ||||||
|
| |||||||||||
| 2,741,857 | ||||||||||||
|
| |||||||||||
Total of Short Equity Positions | 2,741,857 | |||||||||||
|
| |||||||||||
Total of Long and Short Equity Positions | 2,228,012 | |||||||||||
|
| |||||||||||
Net Cash and Other Receivables/ (Payables) (b) | (441,192 | ) | ||||||||||
|
| |||||||||||
Swaps, at Value | $ | 1,786,820 | ||||||||||
|
| |||||||||||
| (a) | Notional value represents the market value (including any fees or commissions) of the long and short positions when they are established. |
| (b) | Cash and other receivables/(payables) includes the gains (or losses) realized within the swap when the swap resets. |
| The accompanying notes are an integral part of these financial statements. | (Continued) |
| AQR Funds | Annual Report | December 2015 | ||||||||||||||
188
Table of Contents
| Consolidated Schedule of Investments | December 31, 2015 |
| AQR MULTI-STRATEGY ALTERNATIVE FUND |
| COUNTERPARTY | DESCRIPTION | TERMINATION DATE** | VALUE (Note 5) | |||||
| Goldman Sachs | The Fund receives the total return on a portfolio of long and short positions and pays or receives the Mexico Equilibrium Interbank Interest Rate plus or minus a specified spread, which is denominated in MXN based on the local currencies of the positions within the swaps. | 12 months maturity ranging from 04/26/2016 - 12/13/2016 | $327,859 | |||||
|
| |||||||
| ** | The maturity dates are measured from the commencement of investment in each underlying swap position. |
Additional Information — Total Return Basket Swap
The following table represents the individual long and short positions and related values within the total return basket swap as of December 31, 2015.
| REFERENCE ENTITY | SHARES | NOTIONAL (a) | NET UNREALIZED APPRECIATION (DEPRECIATION) | |||||||||
| Long Positions | ||||||||||||
| Common Stocks | ||||||||||||
| Mexico | ||||||||||||
| Alfa SAB de CV | 158,800 | $ | 325,674 | $ | (11,474 | ) | ||||||
| Arca Continental SAB de CV | 95,700 | 538,380 | 42,889 | |||||||||
| El Puerto de Liverpool SAB de CV | 11,500 | 154,094 | (13,895 | ) | ||||||||
| Gruma SAB de CV | 169,100 | 1,927,066 | 444,917 | |||||||||
| Grupo Lala SAB de CV | 8,700 | 20,160 | 67 | |||||||||
| Grupo Mexico SAB de CV | 568,000 | 1,377,306 | (164,813 | ) | ||||||||
| OHL Mexico SAB de CV | 131,700 | 185,840 | (47,984 | ) | ||||||||
|
| |||||||||||
| 249,707 | ||||||||||||
|
| |||||||||||
Total of Long Equity Positions | 249,707 | |||||||||||
|
| |||||||||||
| Short Positions | ||||||||||||
| Common Stocks | ||||||||||||
| Mexico | ||||||||||||
| Coca-Cola Femsa SAB de CV | (21,400 | ) | (145,284 | ) | (8,562 | ) | ||||||
| Grupo Financiero Banorte SAB de CV | (490,400 | ) | (2,332,276 | ) | (370,622 | ) | ||||||
| REFERENCE ENTITY | SHARES | NOTIONAL (a) | NET UNREALIZED APPRECIATION (DEPRECIATION) | |||||||||
| Mexico (continued) | ||||||||||||
| Grupo Financiero Inbursa SAB de CV | (678,000 | ) | $ | (1,452,726 | ) | $ | 229,261 | |||||
| Industrias Penoles SAB de CV | (56,335 | ) | (812,019 | ) | 232,734 | |||||||
| Mexichem SAB de CV | (58,800 | ) | (156,526 | ) | 25,173 | |||||||
|
| |||||||||||
| 107,984 | ||||||||||||
|
| |||||||||||
Total of Short Equity Positions | 107,984 | |||||||||||
|
| |||||||||||
Total of Long and Short Equity Positions | 357,691 | |||||||||||
|
| |||||||||||
Net Cash and Other Receivables/ (Payables) (b) | (29,832 | ) | ||||||||||
|
| |||||||||||
Swaps, at Value | $ | 327,859 | ||||||||||
|
| |||||||||||
| (a) | Notional value represents the market value (including any fees or commissions) of the long and short positions when they are established. |
| (b) | Cash and other receivables/(payables) includes the gains (or losses) realized within the swap when the swap resets. |
| The accompanying notes are an integral part of these financial statements. | (Continued) |
| AQR Funds | Annual Report | December 2015 | ||||||||||||||
189
Table of Contents
| Consolidated Schedule of Investments | December 31, 2015 |
| AQR MULTI-STRATEGY ALTERNATIVE FUND |
| COUNTERPARTY | DESCRIPTION | TERMINATION DATE** | VALUE (Note 5) | |||||
| J.P. Morgan | The Fund receives the total return on a portfolio of long and short positions and pays or receives the LIBOR plus or minus a specified spread, which is denominated in EUR based on the local currencies of the positions within the swap. | 1-19 months maturity ranging from 01/19/2016 - 02/06/2017 | $3,260,757 | |||||
|
| |||||||
| ** | The maturity dates are measured from the commencement of investment in each underlying portfolio swap positions. |
Additional Information — Total Return Basket Swaps
The following table represents the individual long and short positions and related values within the total return basket swaps as of December 31, 2015.
| REFERENCE ENTITY | SHARES | NOTIONAL (a) | NET UNREALIZED APPRECIATION (DEPRECIATION) | |||||||||
| Long Positions | ||||||||||||
| Common Stocks | ||||||||||||
| Belgium | ||||||||||||
| Ageas | 52,054 | $ | 2,188,976 | $ | 227,052 | |||||||
| bpost SA | 135,351 | 3,306,982 | 14,177 | |||||||||
| KBC Groep NV | 36,255 | 2,182,444 | 84,443 | |||||||||
| Proximus | 140,079 | 4,485,779 | 72,522 | |||||||||
| Umicore SA | 8,694 | 365,999 | (1,406 | ) | ||||||||
|
| |||||||||||
| 396,788 | ||||||||||||
|
| |||||||||||
| Finland | ||||||||||||
| Amer Sports OYJ | 15,110 | 396,072 | 45,077 | |||||||||
| Huhtamaki OYJ | 97 | 2,944 | 576 | |||||||||
| Kesko OYJ | 96,076 | 3,320,082 | 47,571 | |||||||||
| Metso OYJ | 30,971 | 685,305 | 8,451 | |||||||||
| Neste OYJ | 9,576 | 280,004 | 5,800 | |||||||||
| Orion Oyj | 57,767 | 1,926,770 | 71,869 | |||||||||
| Outokumpu OYJ | 144,784 | 438,439 | (14,309 | ) | ||||||||
| Sampo OYJ | 28,268 | 1,414,546 | 20,966 | |||||||||
| Stora Enso OYJ | 102,392 | 1,037,465 | (111,622 | ) | ||||||||
| UPM-Kymmene OYJ | 184,504 | 3,396,472 | 28,903 | |||||||||
|
| |||||||||||
| 103,282 | ||||||||||||
|
| |||||||||||
| Germany | ||||||||||||
| Allianz SE | 2,492 | 429,415 | 9,870 | |||||||||
| Aurubis AG | 105,208 | 5,244,966 | 82,364 | |||||||||
| Axel Springer SE | 6,396 | 349,587 | 6,098 | |||||||||
| Brenntag AG | 53,016 | 2,765,292 | (2,747 | ) | ||||||||
| Commerzbank AG | 27,685 | 299,725 | (14,055 | ) | ||||||||
| Deutsche Lufthansa AG | 234,762 | 3,665,900 | 31,852 | |||||||||
| Deutsche Post AG | 97,627 | 2,718,666 | 10,771 | |||||||||
| Duerr AG | 1,597 | 127,688 | (947 | ) | ||||||||
| Evonik Industries AG | 11,525 | 386,477 | (5,265 | ) | ||||||||
| Freenet AG | 91,329 | 3,076,130 | 5,754 | |||||||||
| GEA Group AG | 52,627 | 2,106,351 | 19,825 | |||||||||
| Hannover Rueck SE | 30,702 | 3,515,084 | (9,237 | ) | ||||||||
| HeidelbergCement AG | 43,623 | 3,476,010 | 79,158 | |||||||||
| Hella KGaA Hueck & Co. | 10,814 | 422,153 | 26,934 | |||||||||
| HOCHTIEF AG | 31,888 | 2,912,071 | 45,462 | |||||||||
| REFERENCE ENTITY | SHARES | NOTIONAL (a) | NET UNREALIZED APPRECIATION (DEPRECIATION) | |||||||||
| Germany (continued) | ||||||||||||
| KION Group AG | 49,142 | $ | 2,178,152 | $ | 258,687 | |||||||
| Krones AG | 2,865 | 310,949 | 30,194 | |||||||||
| LANXESS AG | 15,028 | 690,104 | 1,443 | |||||||||
| Merck KGaA | 58,017 | 5,514,525 | 102,730 | |||||||||
| MTU Aero Engines AG | 11,005 | 1,033,785 | 38,817 | |||||||||
| Muenchener Rueckversicherungs-Gesellschaft AG in Muenchen | 23,860 | 4,739,960 | 13,839 | |||||||||
| OSRAM Licht AG | 101,533 | 4,242,278 | (331 | ) | ||||||||
| ProSiebenSat.1 Media SE | 118,095 | 5,945,896 | 12,153 | |||||||||
| Rheinmetall AG | 32,849 | 1,996,004 | 187,531 | |||||||||
| RHOEN-KLINIKUM AG | 98,466 | 2,907,677 | 46,178 | |||||||||
| Rocket Internet SE | 3,280 | 97,479 | 2,442 | |||||||||
| Salzgitter AG | 60,790 | 1,798,038 | (312,497 | ) | ||||||||
| Software AG | 19,270 | 551,656 | (2,428 | ) | ||||||||
| Suedzucker AG | 60,467 | 1,053,056 | 145,423 | |||||||||
| Symrise AG | 19,665 | 1,284,928 | 16,864 | |||||||||
| Talanx AG | 19,062 | 596,633 | (10,390 | ) | ||||||||
| TUI AG | 12,952 | 232,807 | 1,164 | |||||||||
| United Internet AG | 54,753 | 2,943,741 | 66,532 | |||||||||
| Zalando SE | 75,145 | 2,621,294 | 346,516 | |||||||||
|
| |||||||||||
| 1,230,704 | ||||||||||||
|
| |||||||||||
| Italy | ||||||||||||
| A2A SpA | 1,187,597 | 1,585,548 | 22,524 | |||||||||
| Atlantia SpA | 121,779 | 3,198,528 | 23,554 | |||||||||
| Autogrill SpA | 145,087 | 1,263,315 | 119,411 | |||||||||
| Banca Generali SpA | 14,888 | 470,179 | (1,862 | ) | ||||||||
| Banca Monte dei Paschi di Siena SpA | 2,411,688 | 4,367,565 | (1,174,940 | ) | ||||||||
| Banca Popolare di Milano Scarl | 10,063,634 | 10,414,118 | (446,474 | ) | ||||||||
| Banco Popolare SC | 322,396 | 5,186,244 | (743,523 | ) | ||||||||
| Enel SpA | 600,909 | 2,497,045 | 22,749 | |||||||||
| Eni SpA | 73,208 | 1,073,968 | 13,772 | |||||||||
| FinecoBank Banca Fineco SpA | 144,610 | 1,064,676 | 124,439 | |||||||||
| The accompanying notes are an integral part of these financial statements. | (Continued) |
| AQR Funds | Annual Report | December 2015 | ||||||||||||||
190
Table of Contents
| Consolidated Schedule of Investments | December 31, 2015 |
| AQR MULTI-STRATEGY ALTERNATIVE FUND |
| REFERENCE ENTITY | SHARES | NOTIONAL (a) | NET UNREALIZED APPRECIATION (DEPRECIATION) | |||||||||
| Italy (continued) | ||||||||||||
| Finmeccanica SpA | 514,758 | $ | 6,769,509 | $ | 387,821 | |||||||
| Hera SpA | 767,761 | 1,985,407 | 49,311 | |||||||||
| Intesa Sanpaolo SpA | 1,659,659 | 5,812,646 | (300,918 | ) | ||||||||
| Luxottica Group SpA | 5,425 | 386,594 | (33,073 | ) | ||||||||
| Mediobanca SpA | 698,693 | 6,605,186 | 92,526 | |||||||||
| Moncler SpA | 99,253 | 1,801,090 | (419,894 | ) | ||||||||
| Prysmian SpA | 159,047 | 3,359,460 | 115,579 | |||||||||
| Recordati SpA | 56,480 | 1,326,106 | 147,505 | |||||||||
| Snam SpA | 517,486 | 2,635,954 | 64,775 | |||||||||
| Telecom Italia SpA | 46,547 | 54,196 | 4,794 | |||||||||
| Terna Rete Elettrica Nazionale SpA | 262,558 | 1,307,701 | 42,606 | |||||||||
| UniCredit SpA | 557,861 | 3,110,187 | (25,945 | ) | ||||||||
| Unione di Banche Italiane SpA | 265,365 | 1,799,623 | (26,600 | ) | ||||||||
| Unipol Gruppo Finanziario SpA | 261,352 | 1,262,079 | 82,209 | |||||||||
| UnipolSai SpA | 323,433 | 789,732 | 33,115 | |||||||||
|
| |||||||||||
| (1,826,539) | ||||||||||||
|
| |||||||||||
| Netherlands | ||||||||||||
| Aalberts Industries NV | 1,840 | 56,624 | 6,774 | |||||||||
| Aegon NV | 196,935 | 1,130,319 | (16,561 | ) | ||||||||
| Akzo Nobel NV | 10,682 | 723,843 | (10,086 | ) | ||||||||
| ASM International NV | 11,848 | 437,259 | 27,225 | |||||||||
| Boskalis Westminster | 80,147 | 3,232,853 | 36,520 | |||||||||
| Delta Lloyd NV | 75,883 | 450,514 | (3,188 | ) | ||||||||
| Heineken NV | 1,976 | 155,606 | 12,783 | |||||||||
| Koninklijke Ahold NV | 327,536 | 7,031,572 | (122,709 | ) | ||||||||
| Koninklijke DSM NV | 32,940 | 1,682,963 | (31,172 | ) | ||||||||
| Koninklijke Philips NV | 57,820 | 1,490,421 | (14,608 | ) | ||||||||
| NN Group NV | 89,276 | 2,683,767 | 466,151 | |||||||||
| Randstad Holding NV | 41,494 | 2,692,659 | (108,768 | ) | ||||||||
| Wolters Kluwer NV | 157,334 | 5,321,718 | (37,886 | ) | ||||||||
|
| |||||||||||
| 204,475 | ||||||||||||
|
| |||||||||||
| Spain | ||||||||||||
| Abengoa SA | 3,155,180 | 3,554,192 | (2,887,595 | ) | ||||||||
| Acciona SA | 8,016 | 627,466 | 58,977 | |||||||||
| Acerinox SA | 64,597 | 643,659 | 15,238 | |||||||||
| ACS Actividades de Construccion y Servicios SA | 158,109 | 4,469,737 | 156,137 | |||||||||
| Almirall SA | 50,398 | 941,958 | 76,642 | |||||||||
| Applus Services SA | 19,377 | 188,041 | (12,697 | ) | ||||||||
| Banco Santander SA | 722,668 | 4,008,863 | (453,791 | ) | ||||||||
| Bankinter SA | 112,284 | 837,218 | (40,976 | ) | ||||||||
| Distribuidora Internacional de Alimentacion SA | 27,121 | 169,671 | (9,709 | ) | ||||||||
| Ebro Foods SA | 56,054 | 1,073,760 | 28,868 | |||||||||
| Enagas SA | 190,170 | 5,227,553 | 136,750 | |||||||||
| Endesa SA | 405,452 | 7,827,532 | 317,856 | |||||||||
| Ferrovial SA | 172,710 | 3,858,803 | 46,727 | |||||||||
| Gamesa Corp. Tecnologica SA | 232,792 | 3,450,997 | 534,393 | |||||||||
| REFERENCE ENTITY | SHARES | NOTIONAL (a) | NET UNREALIZED APPRECIATION (DEPRECIATION) | |||||||||
| Spain (continued) | ||||||||||||
| Iberdrola SA | 48,635 | $ | 334,926 | $ | 9,846 | |||||||
| Industria de Diseno Textil SA | 76,575 | 2,856,259 | (225,591 | ) | ||||||||
| Mapfre SA | 183,836 | 602,331 | (142,159 | ) | ||||||||
| Mediaset Espana Comunicacion SA | 177,451 | 2,072,703 | (142,069 | ) | ||||||||
| Obrascon Huarte Lain SA | 83,103 | 549,972 | (75,731 | ) | ||||||||
| Red Electrica Corp. SA | 40,343 | 3,304,430 | 65,407 | |||||||||
| Repsol SA | 279,350 | 3,057,371 | 18,069 | |||||||||
| Tecnicas Reunidas SA | 10,000 | 463,191 | (85,093 | ) | ||||||||
|
| |||||||||||
| (2,610,501) | ||||||||||||
|
| |||||||||||
| United Kingdom | ||||||||||||
| Dialog Semiconductor PLC | 44,860 | 1,755,613 | (258,695 | ) | ||||||||
| RELX NV | 113,316 | 1,826,725 | 81,777 | |||||||||
|
| |||||||||||
| (176,918) | ||||||||||||
|
| |||||||||||
Total of Long Equity Positions | (2,678,709 | ) | ||||||||||
|
| |||||||||||
| Rights | ||||||||||||
| Italy | ||||||||||||
| Unione di Banche Italiane SpA | 265,870 | — | — | |||||||||
|
| |||||||||||
Total of Long Equity Positions and Rights | (2,678,709 | ) | ||||||||||
|
| |||||||||||
| Short Positions | ||||||||||||
| Common Stocks | ||||||||||||
| Belgium | ||||||||||||
| Anheuser-Busch InBev SA/NV | (71,848 | ) | (7,753,927 | ) | (1,187,359 | ) | ||||||
| Colruyt SA | (14,084 | ) | (683,664 | ) | (40,863 | ) | ||||||
| Solvay SA | (6,538 | ) | (746,254 | ) | 48,458 | |||||||
| Telenet Group Holding NV | (1,954 | ) | (107,907 | ) | 2,305 | |||||||
| UCB SA | (13,307 | ) | (1,174,312 | ) | (26,819 | ) | ||||||
|
| |||||||||||
| (1,204,278) | ||||||||||||
|
| |||||||||||
| Finland | ||||||||||||
| Cargotec OYJ | (37,936 | ) | (1,366,309 | ) | (48,893 | ) | ||||||
| Elisa OYJ | (23,507 | ) | (859,452 | ) | (24,995 | ) | ||||||
| Kone OYJ | (97,781 | ) | (4,058,692 | ) | (81,460 | ) | ||||||
| Nokia OYJ | (496,996 | ) | (3,441,903 | ) | (74,106 | ) | ||||||
| Nokian Renkaat OYJ | (236,594 | ) | (8,255,689 | ) | (191,020 | ) | ||||||
| Wartsila OYJ Abp | (927 | ) | (42,879 | ) | 554 | |||||||
| YIT OYJ | (7,062 | ) | (38,939 | ) | (1,048 | ) | ||||||
|
| |||||||||||
| (420,968) | ||||||||||||
|
| |||||||||||
| Germany | ||||||||||||
| adidas AG | (42,368 | ) | (4,054,865 | ) | (57,334 | ) | ||||||
| BASF SE | (29,682 | ) | (2,225,179 | ) | (35,939 | ) | ||||||
| The accompanying notes are an integral part of these financial statements. | (Continued) |
| AQR Funds | Annual Report | December 2015 | ||||||||||||||
191
Table of Contents
| Consolidated Schedule of Investments | December 31, 2015 |
| AQR MULTI-STRATEGY ALTERNATIVE FUND |
| REFERENCE ENTITY | SHARES | NOTIONAL (a) | NET UNREALIZED APPRECIATION (DEPRECIATION) | |||||||||
| Germany (continued) | ||||||||||||
| Bayer AG | (18,166 | ) | $ | (2,731,194 | ) | $ | 462,435 | |||||
| Bayerische Motoren Werke AG | (81,567 | ) | (8,540,698 | ) | (52,509 | ) | ||||||
| Beiersdorf AG | (7,623 | ) | (631,538 | ) | (61,327 | ) | ||||||
| Bilfinger SE | (39,733 | ) | (1,807,176 | ) | (60,058 | ) | ||||||
| Continental AG | (84 | ) | (20,782 | ) | 462 | |||||||
| Daimler AG | (22,944 | ) | (1,904,165 | ) | (12,899 | ) | ||||||
| Deutsche Bank AG | (16,553 | ) | (387,672 | ) | (14,312 | ) | ||||||
| Deutsche Telekom AG | (475,973 | ) | (8,427,133 | ) | (121,652 | ) | ||||||
| E.ON SE | (328 | ) | (3,376 | ) | 227 | |||||||
| Fraport AG Frankfurt Airport Services Worldwide | (19,775 | ) | (1,268,622 | ) | 7,529 | |||||||
| Fresenius Medical Care AG & Co. KGaA | (8,266 | ) | (707,337 | ) | 12,707 | |||||||
| HUGO BOSS AG | (23 | ) | (2,050 | ) | 153 | |||||||
| Infineon Technologies AG | (65,034 | ) | (721,210 | ) | (226,902 | ) | ||||||
| K+S AG | (149,428 | ) | (3,701,692 | ) | (107,398 | ) | ||||||
| Linde AG | (1,258 | ) | (201,438 | ) | 19,709 | |||||||
| MAN SE | (12,612 | ) | (1,254,269 | ) | (13,134 | ) | ||||||
| METRO AG | (6,995 | ) | (219,259 | ) | (3,583 | ) | ||||||
| RWE AG | (545,655 | ) | (6,703,612 | ) | (175,671 | ) | ||||||
| SAP SE | (176,737 | ) | (13,779,288 | ) | (245,356 | ) | ||||||
| Siemens AG | (5,822 | ) | (553,632 | ) | (9,622 | ) | ||||||
| STADA Arzneimittel AG | (224 | ) | (8,622 | ) | (411 | ) | ||||||
| Telefonica Deutschland Holding AG | (559,357 | ) | (3,247,458 | ) | 297,026 | |||||||
| ThyssenKrupp AG | (199,344 | ) | (3,814,717 | ) | (136,952 | ) | ||||||
| Wacker Chemie AG | (26,620 | ) | (2,198,601 | ) | (27,113 | ) | ||||||
| Wirecard AG | (33,683 | ) | (1,635,885 | ) | (47,762 | ) | ||||||
|
| |||||||||||
| (609,686) | ||||||||||||
|
| |||||||||||
| Italy | ||||||||||||
| Assicurazioni Generali SpA | (101,984 | ) | (1,855,261 | ) | (7,650 | ) | ||||||
| Azimut Holding SpA | (156,349 | ) | (4,000,394 | ) | 114,152 | |||||||
| Banca Mediolanum SpA | (248,092 | ) | (1,981,106 | ) | 10,228 | |||||||
| Banca Popolare dell’Emilia Romagna SC | (658,129 | ) | (5,731,381 | ) | 739,381 | |||||||
| Buzzi Unicem SpA | (77,708 | ) | (1,161,419 | ) | (231,521 | ) | ||||||
| Davide Campari-Milano SpA | (129,658 | ) | (1,081,933 | ) | (39,067 | ) | ||||||
| Enel Green Power SpA | (1,675,826 | ) | (3,335,784 | ) | (70,446 | ) | ||||||
| Mediaset SpA | (553,663 | ) | (2,264,500 | ) | (29,820 | ) | ||||||
| Saipem SpA | (127,782 | ) | (1,039,509 | ) | 6,676 | |||||||
| Salvatore Ferragamo SpA | (261,341 | ) | (5,979,686 | ) | (145,658 | ) | ||||||
| Tod’s SpA | (1,755 | ) | (136,550 | ) | (1,961 | ) | ||||||
|
| |||||||||||
| 344,314 | ||||||||||||
|
| |||||||||||
| REFERENCE ENTITY | SHARES | NOTIONAL (a) | NET UNREALIZED APPRECIATION (DEPRECIATION) | |||||||||
| Luxembourg | ||||||||||||
| APERAM SA | (27,772 | ) | $ | (943,797 | ) | $ | (43,634 | ) | ||||
| ArcelorMittal | (1,955,732 | ) | (8,867,250 | ) | 615,619 | |||||||
| Tenaris SA | (642,486 | ) | (7,576,209 | ) | (31,694 | ) | ||||||
|
| |||||||||||
| 540,291 | ||||||||||||
|
| |||||||||||
| Netherlands | ||||||||||||
| Altice NV | (363,260 | ) | (12,346,950 | ) | 7,127,887 | |||||||
| Altice NV | (24,966 | ) | 7,570 | (371,460 | ) | |||||||
| ASML Holding NV | (46,615 | ) | (4,091,284 | ) | (50,529 | ) | ||||||
| Fugro NV | (143,920 | ) | (2,331,116 | ) | (29,468 | ) | ||||||
| Gemalto NV | (24,510 | ) | (1,486,569 | ) | 15,919 | |||||||
| Koninklijke KPN NV | (416,557 | ) | (1,535,050 | ) | (40,521 | ) | ||||||
| Koninklijke Vopak NV | (71,818 | ) | (3,159,113 | ) | 66,283 | |||||||
| QIAGEN NV | (62,807 | ) | (1,667,639 | ) | (34,694 | ) | ||||||
| SBM Offshore NV | (369,959 | ) | (4,702,036 | ) | 28,441 | |||||||
|
| |||||||||||
| 6,711,858 | ||||||||||||
|
| |||||||||||
| Spain | ||||||||||||
| Abertis Infraestructuras SA | (37,354 | ) | (564,573 | ) | (19,621 | ) | ||||||
| Aena SA | (34,897 | ) | (3,767,528 | ) | (228,500 | ) | ||||||
| Amadeus IT Holding SA | (46,792 | ) | (1,942,297 | ) | (120,044 | ) | ||||||
| Atresmedia Corp. de Medios de Comunicacion SA | (78,040 | ) | (1,260,139 | ) | 428,846 | |||||||
| Banco Bilbao Vizcaya Argentaria SA | (195,550 | ) | (1,959,780 | ) | 530,938 | |||||||
| Banco de Sabadell SA | (2,154,388 | ) | (3,792,427 | ) | (25,776 | ) | ||||||
| Banco Popular Espanol SA | (1,382,741 | ) | (4,539,230 | ) | (16,743 | ) | ||||||
| Bankia SA | (5,659,811 | ) | (6,674,480 | ) | 88,062 | |||||||
| CaixaBank SA | (424,538 | ) | (1,725,636 | ) | 247,984 | |||||||
| Cellnex Telecom SAU | (136,435 | ) | (2,392,224 | ) | (158,696 | ) | ||||||
| Gas Natural SDG SA | (52,901 | ) | (1,096,390 | ) | 17,619 | |||||||
| Telefonica SA | (414,174 | ) | (5,190,500 | ) | 595,684 | |||||||
| Zardoya Otis SA | (60,201 | ) | (684,923 | ) | (19,154 | ) | ||||||
|
| |||||||||||
| 1,320,599 | ||||||||||||
|
| |||||||||||
| Switzerland | ||||||||||||
| STMicroelectronics NV | (23,869 | ) | (165,139 | ) | 4,587 | |||||||
|
| |||||||||||
| United Kingdom | ||||||||||||
| CNH Industrial NV | (685,117 | ) | (4,630,392 | ) | (61,936 | ) | ||||||
| Fiat Chrysler Automobiles NV | (25,643 | ) | (371,126 | ) | 15,000 | |||||||
| Unilever NV | (11,572 | ) | (477,821 | ) | (26,235 | ) | ||||||
|
| |||||||||||
| (73,171) | ||||||||||||
|
| |||||||||||
Total of Short Common Stocks | 6,613,546 | |||||||||||
|
| |||||||||||
| The accompanying notes are an integral part of these financial statements. | (Continued) |
| AQR Funds | Annual Report | December 2015 | ||||||||||||||
192
Table of Contents
| Consolidated Schedule of Investments | December 31, 2015 |
| AQR MULTI-STRATEGY ALTERNATIVE FUND |
| REFERENCE ENTITY | SHARES | NOTIONAL (a) | NET UNREALIZED APPRECIATION (DEPRECIATION) | |||||||||
| Preferred Stocks | ||||||||||||
| Germany | ||||||||||||
| FUCHS PETROLUB SE | (39,570 | ) | $ | (1,837,798 | ) | $ | (25,414 | ) | ||||
| Henkel AG & Co. KGaA | (1,729 | ) | (203,263 | ) | 10,303 | |||||||
| Volkswagen AG | (22,959 | ) | (2,398,947 | ) | (915,860 | ) | ||||||
|
| |||||||||||
| (930,971) | ||||||||||||
|
| |||||||||||
| Rights | ||||||||||||
| Italy | ||||||||||||
| Mediolanum SpA (3) | (238,411 | ) | — | — | ||||||||
|
| |||||||||||
Total of Short Equity Positions and Rights | 5,682,575 | |||||||||||
|
| |||||||||||
Total of Long and Short Equity Positions | 3,003,866 | |||||||||||
|
| |||||||||||
Net Cash and Other Receivables/ (Payables) (b) | 256,891 | |||||||||||
|
| |||||||||||
Swaps, at Value | $ | 3,260,757 | ||||||||||
|
| |||||||||||
| (a) | Notional value represents the market value (including any fees or commissions) of the long and short positions when they are established. |
| (b) | Cash and other receivables/(payables) includes the gains (or losses) realized within the swap when the swap resets. |
| (3) | Level 3 security (See Note 5). |
| COUNTERPARTY | DESCRIPTION | TERMINATION DATE** | VALUE (Note 5) | |||||
| J.P. Morgan | The Fund receives the total return on a portfolio of long and short positions and pays or receives the LIBOR plus or minus a specified spread, which is denominated in CHF based on the local currencies of the positions within the swap. | 1-14 months maturity ranging from 01/19/2016 - 01/30/2017 | $(642,719 | ) | ||||
|
| |||||||
| ** | The maturity dates are measured from the commencement of investment in each underlying portfolio swap positions. |
Additional Information — Total Return Basket Swaps
The following table represents the individual long and short positions and related values within the total return basket swaps as of December 31, 2015.
| REFERENCE ENTITY | SHARES | NOTIONAL (a) | NET UNREALIZED APPRECIATION (DEPRECIATION) | |||||||||
| Long Positions | ||||||||||||
| Common Stocks | ||||||||||||
| Austria | ||||||||||||
| ams AG | 2,337 | $ | 76,569 | $ | 1,553 | |||||||
|
| |||||||||||
| Switzerland | ||||||||||||
| Adecco SA | 34,214 | 2,308,878 | 32,822 | |||||||||
| Aryzta AG | 37,094 | 1,877,564 | (1,022 | ) | ||||||||
| Baloise Holding AG | 21,172 | 2,644,013 | 39,292 | |||||||||
| Bucher Industries AG | 2,068 | 462,853 | 3,225 | |||||||||
| Clariant AG | 49,339 | 924,858 | 10,655 | |||||||||
| DKSH Holding AG | 4,669 | 301,498 | (7,843 | ) | ||||||||
| Flughafen Zuerich AG | 3,718 | 2,755,882 | 33,778 | |||||||||
| GAM Holding AG | 75,079 | 1,236,662 | 6,092 | |||||||||
| REFERENCE ENTITY | SHARES | NOTIONAL (a) | NET UNREALIZED APPRECIATION (DEPRECIATION) | |||||||||
| Switzerland (continued) | ||||||||||||
| Geberit AG | 2,492 | $ | 804,760 | $ | 39,288 | |||||||
| Georg Fischer AG | 803 | 506,025 | 39,133 | |||||||||
| Givaudan SA | 1,689 | 2,978,787 | 86,684 | |||||||||
| Helvetia Holding AG | 2,067 | 1,149,354 | 15,005 | |||||||||
| Lonza Group AG | 77,565 | 12,059,094 | 555,683 | |||||||||
| Novartis AG | 38,034 | 3,161,938 | 109,720 | |||||||||
| OC Oerlikon Corp. AG | 339,596 | 3,044,980 | (22,087 | ) | ||||||||
| Partners Group Holding AG | 8,786 | 3,138,017 | 21,729 | |||||||||
| Schindler Holding AG | 3,754 | 614,906 | 13,134 | |||||||||
| Sika AG | 740 | 2,642,505 | 31,704 | |||||||||
| Straumann Holding AG | 7,425 | 2,214,238 | 39,305 | |||||||||
| The accompanying notes are an integral part of these financial statements. | (Continued) |
| AQR Funds | Annual Report | December 2015 | ||||||||||||||
193
Table of Contents
| Consolidated Schedule of Investments | December 31, 2015 |
| AQR MULTI-STRATEGY ALTERNATIVE FUND |
| REFERENCE ENTITY | SHARES | NOTIONAL (a) | NET UNREALIZED APPRECIATION (DEPRECIATION) | |||||||||
| Switzerland (continued) | ||||||||||||
| Sunrise Communications Group AG | 11,333 | $ | 657,373 | $ | 10,685 | |||||||
| Swiss Life Holding AG | 49,749 | 13,029,453 | 370,433 | |||||||||
| Swiss Re AG | 82,464 | 8,031,885 | 22,069 | |||||||||
| Swisscom AG | 3,133 | 1,520,013 | 47,754 | |||||||||
| Transocean Ltd. | 15,650 | 225,517 | (29,885 | ) | ||||||||
| UBS Group AG | 8,284 | 165,158 | (4,452 | ) | ||||||||
| Zurich Insurance Group AG | 4,217 | 1,076,433 | 6,914 | |||||||||
|
| |||||||||||
| 1,469,815 | ||||||||||||
|
| |||||||||||
Total of Long Equity Positions | 1,471,368 | |||||||||||
|
| |||||||||||
| Short Positions | ||||||||||||
| Common Stocks | ||||||||||||
| Switzerland | ||||||||||||
| ABB Ltd. | (785 | ) | (14,103 | ) | 93 | |||||||
| Barry Callebaut AG | (1,862 | ) | (1,949,054 | ) | (73,489 | ) | ||||||
| Chocoladefabriken Lindt & Spruengli AG | (48 | ) | (274,337 | ) | (25,409 | ) | ||||||
| Cie Financiere Richemont SA | (129,909 | ) | (9,174,719 | ) | (123,251 | ) | ||||||
| Credit Suisse Group AG | (173,811 | ) | (3,646,667 | ) | (97,563 | ) | ||||||
| Dufry AG | (7,859 | ) | (893,112 | ) | (41,970 | ) | ||||||
| EMS-Chemie Holding AG | (884 | ) | (379,747 | ) | (9,299 | ) | ||||||
| Galenica AG | (1,520 | ) | (1,577,239 | ) | (800,876 | ) | ||||||
| Julius Baer Group Ltd. | (53,921 | ) | (2,417,638 | ) | (190,907 | ) | ||||||
| REFERENCE ENTITY | SHARES | NOTIONAL (a) | NET UNREALIZED APPRECIATION (DEPRECIATION) | |||||||||
| Switzerland (continued) | ||||||||||||
| Kuehne + Nagel International AG | (12,738 | ) | $ | (1,704,857 | ) | $ | (40,239 | ) | ||||
| LafargeHolcim Ltd. | (120,077 | ) | (5,821,946 | ) | (190,889 | ) | ||||||
| Nestle SA | (20,000 | ) | (1,485,746 | ) | 1,041 | |||||||
| Roche Holding AG | (8,746 | ) | (2,374,086 | ) | (49,504 | ) | ||||||
| SGS SA | (2,439 | ) | (4,528,276 | ) | (107,045 | ) | ||||||
| Sonova Holding AG | (9,615 | ) | (1,182,314 | ) | (39,306 | ) | ||||||
| Swatch Group AG/The | (41,553 | ) | (14,088,565 | ) | (341,338 | ) | ||||||
| Syngenta AG | (150 | ) | (54,664 | ) | (4,046 | ) | ||||||
|
| |||||||||||
| (2,133,997) | ||||||||||||
|
| |||||||||||
Total of Short Equity Positions | (2,133,997 | ) | ||||||||||
|
| |||||||||||
Total of Long and Short Equity Positions | (662,629 | ) | ||||||||||
|
| |||||||||||
Net Cash and Other Receivables/ (Payables) (b) | 19,910 | |||||||||||
|
| |||||||||||
Swaps, at Value | $ | (642,719 | ) | |||||||||
|
| |||||||||||
| (a) | Notional value represents the market value (including any fees or commissions) of the long and short positions when they are established. |
| (b) | Cash and other receivables/(payables) includes the gains (or losses) realized within the swap when the swap resets. |
| The accompanying notes are an integral part of these financial statements. | (Continued) |
| AQR Funds | Annual Report | December 2015 | ||||||||||||||
194
Table of Contents
| Consolidated Schedule of Investments | December 31, 2015 |
| AQR MULTI-STRATEGY ALTERNATIVE FUND |
| COUNTERPARTY | DESCRIPTION | TERMINATION DATE** | VALUE (Note 5) | |||||
| J.P. Morgan | The Fund receives the total return on a portfolio of long and short positions and pays or receives the Copenhagen Interbank Rate plus or minus a specified spread, which is denominated in DKK based on the local currencies of the positions within the swap. | 1-15 months maturity ranging from 01/19/2016 - 01/30/2017 | $(141,705 | ) | ||||
|
| |||||||
| ** | The maturity dates are measured from the commencement of investment in each underlying portfolio swap positions. |
Additional Information — Total Return Basket Swaps
The following table represents the individual long and short positions and related values within the total return basket swaps as of December 31, 2015.
| REFERENCE ENTITY | SHARES | NOTIONAL (a) | NET UNREALIZED APPRECIATION (DEPRECIATION) | |||||||||
| Long Positions | ||||||||||||
| Common Stocks | ||||||||||||
| Denmark | ||||||||||||
| AP Moeller - Maersk A/S | 1,887 | $ | 2,423,916 | $ | 37,307 | |||||||
| Danske Bank A/S | 42,851 | 1,119,278 | 30,513 | |||||||||
| DSV A/S | 105,424 | 4,064,435 | 85,441 | |||||||||
| GN Store Nord A/S | 14,421 | 251,894 | 9,825 | |||||||||
| H Lundbeck A/S | 20,206 | 578,171 | 111,769 | |||||||||
| ISS A/S | 58,086 | 1,983,656 | 110,155 | |||||||||
| Jyske Bank A/S | 28,599 | 1,247,037 | 46,545 | |||||||||
| Novo Nordisk A/S | 71,592 | 4,018,980 | 126,068 | |||||||||
| Pandora A/S | 83,315 | 9,963,013 | 541,664 | |||||||||
| TDC A/S | 619,434 | 2,983,820 | 100,368 | |||||||||
| Topdanmark A/S | 3,452 | 95,641 | 2,439 | |||||||||
| Vestas Wind Systems A/S | 3,963 | 237,404 | 39,367 | |||||||||
|
| |||||||||||
| 1,241,461 | ||||||||||||
|
| |||||||||||
Total of Long Equity Positions | 1,241,461 | |||||||||||
|
| |||||||||||
| Short Positions | ||||||||||||
| Common Stocks | ||||||||||||
| Denmark | ||||||||||||
| Carlsberg A/S | (43,068 | ) | (3,895,838 | ) | 80,371 | |||||||
| Chr Hansen Holding A/S | (32,146 | ) | (1,938,378 | ) | (72,367 | ) | ||||||
| REFERENCE ENTITY | SHARES | NOTIONAL (a) | NET UNREALIZED APPRECIATION (DEPRECIATION) | |||||||||
| Denmark (continued) | ||||||||||||
| Coloplast A/S | (3,049 | ) | $ | (250,233 | ) | $ | 4,065 | |||||
| FLSmidth & Co. A/S | (20,170 | ) | (691,970 | ) | (8,837 | ) | ||||||
| Novozymes A/S | (36,816 | ) | (1,720,615 | ) | (42,094 | ) | ||||||
| Tryg A/S | (5,755 | ) | (114,222 | ) | (139 | ) | ||||||
| William Demant Holding A/S | (18,109 | ) | (1,679,643 | ) | (45,321 | ) | ||||||
|
| |||||||||||
| (84,322) | ||||||||||||
|
| |||||||||||
Total of Short Equity Positions | (84,322 | ) | ||||||||||
|
| |||||||||||
Total of Long and Short Equity Positions | 1,157,139 | |||||||||||
|
| |||||||||||
Net Cash and Other Receivables/ (Payables) (b) | (1,298,844 | ) | ||||||||||
|
| |||||||||||
Swaps, at Value | $ | (141,705 | ) | |||||||||
|
| |||||||||||
| (a) | Notional value represents the market value (including any fees or commissions) of the long and short positions when they are established. |
| (b) | Cash and other receivables/(payables) includes the gains (or losses) realized within the swap when the swap resets. |
| The accompanying notes are an integral part of these financial statements. | (Continued) |
| AQR Funds | Annual Report | December 2015 | ||||||||||||||
195
Table of Contents
| Consolidated Schedule of Investments | December 31, 2015 |
| AQR MULTI-STRATEGY ALTERNATIVE FUND |
| COUNTERPARTY | DESCRIPTION | TERMINATION DATE** | VALUE (Note 5) | |||||
| J.P. Morgan | The Fund receives the total return on a portfolio of long and short positions and pays or receives the LIBOR plus or minus a specified spread, which is denominated in JPY based on the local currencies of the positions within the swap | 1-18 months maturity ranging from 01/19/2016 - 01/30/2017 | $(1,140,261 | ) | ||||
|
| |||||||
| ** | The maturity dates are measured from the commencement of investment in each underlying portfolio swap positions. |
Additional Information — Total Return Basket Swaps
The following table represents the individual long and short positions and related values within the total return basket swaps as of December 31, 2015.
| REFERENCE ENTITY | SHARES | NOTIONAL (a) | NET UNREALIZED APPRECIATION (DEPRECIATION) | |||||||||
| Long Positions | ||||||||||||
| Common Stocks | ||||||||||||
| Japan | ||||||||||||
| Air Water, Inc. | 20,000 | $ | 317,838 | $ | 3,827 | |||||||
| Ajinomoto Co., Inc. | 186,000 | 4,295,449 | 108,236 | |||||||||
| Alfresa Holdings Corp. | 172,900 | 3,454,097 | (39,271 | ) | ||||||||
| Amada Holdings Co., Ltd. | 182,300 | 1,860,037 | (120,405 | ) | ||||||||
| ANA Holdings, Inc. | 345,000 | 1,006,098 | (10,737 | ) | ||||||||
| Asahi Group Holdings Ltd. | 9,100 | 290,732 | (5,862 | ) | ||||||||
| Asahi Kasei Corp. | 471,000 | 3,054,846 | 130,106 | |||||||||
| Astellas Pharma, Inc. | 278,300 | 3,897,143 | 64,670 | |||||||||
| Bandai Namco Holdings, Inc. | 371,700 | 8,049,852 | (196,897 | ) | ||||||||
| Bank of Kyoto Ltd./The | 160,000 | 1,453,774 | 30,012 | |||||||||
| Bank of Yokohama Ltd./The | 563,000 | 3,393,905 | 57,061 | |||||||||
| Benesse Holdings, Inc. | 39,200 | 1,110,577 | 18,305 | |||||||||
| Bridgestone Corp. | 40,200 | 1,429,139 | (50,222 | ) | ||||||||
| Brother Industries Ltd. | 162,600 | 1,887,241 | (19,331 | ) | ||||||||
| Central Japan Railway Co. | 7,600 | 1,348,178 | 1,080 | |||||||||
| Chiba Bank Ltd./The | 527,000 | 3,661,423 | 78,291 | |||||||||
| Chubu Electric Power Co., Inc. | 294,000 | 4,036,209 | (10,251 | ) | ||||||||
| Chugai Pharmaceutical Co., Ltd. | 6,800 | 246,387 | (9,362 | ) | ||||||||
| Chugoku Bank Ltd./The | 75,800 | 990,828 | 20,628 | |||||||||
| Citizen Holdings Co., Ltd. | 52,200 | 372,650 | 2,525 | |||||||||
| COLOPL, Inc. | 5,100 | 104,476 | (3,915 | ) | ||||||||
| Dai Nippon Printing Co., Ltd. | 280,000 | 2,795,626 | (26,807 | ) | ||||||||
| Daicel Corp. | 335,900 | 5,069,685 | (70,853 | ) | ||||||||
| Don Quijote Holdings Co., Ltd. | 151,900 | 5,655,129 | (320,592 | ) | ||||||||
| East Japan Railway Co. | 25,300 | 2,427,076 | (44,678 | ) | ||||||||
| Ezaki Glico Co., Ltd. | 21,400 | 967,853 | 188,257 | |||||||||
| FamilyMart Co., Ltd. | 21,700 | 1,034,513 | (24,707 | ) | ||||||||
| REFERENCE ENTITY | SHARES | NOTIONAL (a) | NET UNREALIZED APPRECIATION (DEPRECIATION) | |||||||||
| Japan (continued) | ||||||||||||
| FANUC Corp. | 14,100 | $ | 2,443,820 | $ | (14,533 | ) | ||||||
| Fuji Electric Co., Ltd. | 721,000 | 3,101,306 | (77,526 | ) | ||||||||
| Fuji Heavy Industries Ltd. | 70,900 | 2,935,979 | (15,163 | ) | ||||||||
| FUJIFILM Holdings Corp. | 121,800 | 4,943,829 | 139,189 | |||||||||
| Fujitsu Ltd. | 1,580,000 | 7,982,087 | (96,116 | ) | ||||||||
| Fukuoka Financial Group, Inc. | 1,097,000 | 5,275,817 | 163,790 | |||||||||
| Gree, Inc. | 150,900 | 715,653 | 830 | |||||||||
| GungHo Online Entertainment, Inc. | 661,900 | 2,323,996 | (525,858 | ) | ||||||||
| Gunma Bank Ltd./The | 124,000 | 847,142 | (126,177 | ) | ||||||||
| Hachijuni Bank Ltd./The | 204,000 | 1,508,616 | (260,138 | ) | ||||||||
| Hakuhodo DY Holdings, Inc. | 162,600 | 1,800,665 | (41,405 | ) | ||||||||
| Haseko Corp. | 87,900 | 993,017 | (21,162 | ) | ||||||||
| Hikari Tsushin, Inc. | 12,100 | 827,560 | (3,552 | ) | ||||||||
| Hiroshima Bank Ltd./The | 26,000 | 146,525 | 1,254 | |||||||||
| Hisamitsu Pharmaceutical Co., Inc. | 5,400 | 227,791 | (1,084 | ) | ||||||||
| Hitachi High-Technologies Corp. | 180,200 | 4,805,357 | 67,811 | |||||||||
| Hitachi Metals Ltd. | 54,700 | 644,768 | 30,132 | |||||||||
| Hokuhoku Financial Group, Inc. | 832,000 | 1,904,951 | (208,883 | ) | ||||||||
| Hokuriku Electric Power Co. | 27,900 | 430,825 | (18,506 | ) | ||||||||
| Hoshizaki Electric Co., Ltd. | 18,900 | 1,235,913 | (60,988 | ) | ||||||||
| Hoya Corp. | 226,500 | 9,266,366 | (4,196 | ) | ||||||||
| Idemitsu Kosan Co., Ltd. | 20,400 | 324,535 | 1,196 | |||||||||
| Isetan Mitsukoshi Holdings Ltd. | 143,400 | 2,635,939 | (765,854 | ) | ||||||||
| Isuzu Motors Ltd. | 127,100 | 1,547,191 | (177,989 | ) | ||||||||
| ITOCHU Corp. | 210,400 | 2,453,487 | 35,219 | |||||||||
| The accompanying notes are an integral part of these financial statements. | (Continued) |
| AQR Funds | Annual Report | December 2015 | ||||||||||||||
196
Table of Contents
| Consolidated Schedule of Investments | December 31, 2015 |
| AQR MULTI-STRATEGY ALTERNATIVE FUND |
| REFERENCE ENTITY | SHARES | NOTIONAL (a) | NET UNREALIZED APPRECIATION (DEPRECIATION) | |||||||||
| Japan (continued) | ||||||||||||
| Itochu Techno-Solutions Corp. | 38,000 | $ | 873,621 | $ | (116,495 | ) | ||||||
| Iyo Bank Ltd./The | 34,900 | 375,306 | (36,228 | ) | ||||||||
| Izumi Co., Ltd. | 14,200 | 572,237 | (20,960 | ) | ||||||||
| J Front Retailing Co., Ltd. | 261,100 | 3,970,929 | (175,157 | ) | ||||||||
| Japan Airlines Co., Ltd. | 404,200 | 14,602,452 | (134,961 | ) | ||||||||
| Japan Petroleum Exploration Co., Ltd. | 39,800 | 1,046,523 | 22,401 | |||||||||
| Japan Tobacco, Inc. | 191,500 | 6,470,626 | 560,061 | |||||||||
| Joyo Bank Ltd./The | 116,000 | 627,947 | (79,400 | ) | ||||||||
| JSR Corp. | 80,700 | 1,373,301 | (115,644 | ) | ||||||||
| JTEKT Corp. | 327,500 | 5,490,632 | (130,083 | ) | ||||||||
| Kajima Corp. | 1,076,000 | 6,544,232 | (140,474 | ) | ||||||||
| Kaken Pharmaceutical Co., Ltd. | 41,200 | 2,984,515 | (169,190 | ) | ||||||||
| Kamigumi Co., Ltd. | 195,000 | 1,643,610 | 35,303 | |||||||||
| Kaneka Corp. | 105,000 | 1,089,427 | 1,970 | |||||||||
| Kansai Electric Power Co., Inc./The | 131,000 | 1,634,902 | (64,238 | ) | ||||||||
| Kao Corp. | 20,300 | 1,025,111 | 18,081 | |||||||||
| Kawasaki Heavy Industries Ltd. | 749,000 | 2,791,919 | (20,698 | ) | ||||||||
| KDDI Corp. | 45,100 | 1,175,252 | (3,997 | ) | ||||||||
| Keihan Electric Railway Co., Ltd. | 10,000 | 62,394 | 4,578 | |||||||||
| Keio Corp. | 23,000 | 199,023 | (401 | ) | ||||||||
| Keisei Electric Railway Co., Ltd. | 109,000 | 1,371,283 | 19,368 | |||||||||
| Kewpie Corp. | 9,000 | 197,503 | 24,813 | |||||||||
| Keyence Corp. | 2,000 | 950,345 | 148,865 | |||||||||
| Kobe Steel Ltd. | 4,055,000 | 4,284,959 | 120,863 | |||||||||
| Koito Manufacturing Co., Ltd. | 59,200 | 2,340,921 | 86,719 | |||||||||
| Konami Corp. | 94,700 | 2,308,633 | (54,342 | ) | ||||||||
| Konica Minolta, Inc. | 1,001,400 | 9,923,544 | 105,659 | |||||||||
| Kurita Water Industries Ltd. | 97,300 | 2,059,441 | (21,840 | ) | ||||||||
| Mabuchi Motor Co., Ltd. | 30,000 | 1,679,819 | (53,972 | ) | ||||||||
| Marubeni Corp. | 32,900 | 189,798 | (20,656 | ) | ||||||||
| Medipal Holdings Corp. | 277,100 | 4,777,197 | (54,305 | ) | ||||||||
| MEIJI Holdings Co., Ltd. | 91,800 | 7,569,576 | 13,071 | |||||||||
| Miraca Holdings, Inc. | 39,900 | 1,772,787 | (17,126 | ) | ||||||||
| Mitsubishi Chemical Holdings Corp. | 610,900 | 3,879,204 | (3,215 | ) | ||||||||
| Mitsubishi Corp. | 2,800 | 50,736 | (4,164 | ) | ||||||||
| Mitsubishi Electric Corp. | 607,000 | 6,328,224 | 43,361 | |||||||||
| Mitsubishi Motors Corp. | 245,100 | 2,114,707 | (41,029 | ) | ||||||||
| Mitsubishi Tanabe Pharma Corp. | 265,300 | 4,617,862 | (47,106 | ) | ||||||||
| Mitsubishi UFJ Lease & Finance Co., Ltd. | 240,500 | 1,242,643 | (4,972 | ) | ||||||||
| REFERENCE ENTITY | SHARES | NOTIONAL (a) | NET UNREALIZED APPRECIATION (DEPRECIATION) | |||||||||
| Japan (continued) | ||||||||||||
| Mitsui & Co., Ltd. | 139,100 | $ | 1,637,650 | $ | 15,142 | |||||||
| Mixi, Inc. | 60,700 | 2,118,654 | 151,732 | |||||||||
| MS&AD Insurance Group Holdings, Inc. | 68,500 | 2,050,245 | (41,505 | ) | ||||||||
| Murata Manufacturing Co., Ltd. | 4,500 | 619,605 | 27,861 | |||||||||
| Nagoya Railroad Co., Ltd. | 98,000 | 401,183 | 6,703 | |||||||||
| Nankai Electric Railway Co., Ltd. | 71,000 | 353,600 | 66,612 | |||||||||
| Nexon Co., Ltd. | 265,900 | 4,340,813 | (15,222 | ) | ||||||||
| NHK Spring Co., Ltd. | 466,400 | 4,660,696 | 15,563 | |||||||||
| Nintendo Co., Ltd. | 38,400 | 6,635,980 | (1,355,592 | ) | ||||||||
| Nippon Express Co., Ltd. | 812,000 | 3,763,225 | 52,547 | |||||||||
| Nippon Shokubai Co., Ltd. | 25,800 | 1,875,979 | (80,685 | ) | ||||||||
| Nippon Yusen KK | 798,000 | 2,100,670 | (166,564 | ) | ||||||||
| Nitto Denko Corp. | 53,000 | 4,029,202 | (159,901 | ) | ||||||||
| NOK Corp. | 145,200 | 3,463,622 | (71,626 | ) | ||||||||
| NSK Ltd. | 128,100 | 1,429,222 | (37,297 | ) | ||||||||
| NTN Corp. | 215,000 | 1,025,579 | (118,996 | ) | ||||||||
| Obayashi Corp. | 292,000 | 2,349,822 | 344,522 | |||||||||
| Obic Co., Ltd. | 18,100 | 880,645 | 77,472 | |||||||||
| Omron Corp. | 53,200 | 1,836,826 | (62,770 | ) | ||||||||
| Oracle Corp. Japan | 12,300 | 586,397 | (13,709 | ) | ||||||||
| ORIX Corp. | 382,000 | 5,759,139 | (400,265 | ) | ||||||||
| Osaka Gas Co., Ltd. | 951,000 | 3,397,712 | 37,243 | |||||||||
| Otsuka Corp. | 83,800 | 4,253,009 | (136,437 | ) | ||||||||
| Otsuka Holdings Co., Ltd. | 82,200 | 3,016,680 | (96,201 | ) | ||||||||
| Panasonic Corp. | 405,300 | 4,068,651 | 40,083 | |||||||||
| Park24 Co., Ltd. | 5,900 | 124,316 | 18,626 | |||||||||
| Pigeon Corp. | 600 | 16,668 | (2,112 | ) | ||||||||
| Pola Orbis Holdings, Inc. | 13,500 | 825,694 | 64,072 | |||||||||
| Renesas Electronics Corp. | 300 | 1,642 | 242 | |||||||||
| Resona Holdings, Inc. | 1,857,500 | 9,018,030 | 2,429 | |||||||||
| Rohm Co., Ltd. | 108,200 | 5,590,433 | (110,009 | ) | ||||||||
| Sankyo Co., Ltd. | 79,700 | 3,133,096 | (158,072 | ) | ||||||||
| Sanrio Co., Ltd. | 15,600 | 437,021 | (70,524 | ) | ||||||||
| Santen Pharmaceutical Co., Ltd. | 336,700 | 5,496,554 | 46,679 | |||||||||
| Secom Co., Ltd. | 20,200 | 1,366,748 | 2,201 | |||||||||
| Sega Sammy Holdings, Inc. | 235,800 | 2,240,492 | (34,973 | ) | ||||||||
| Seiko Epson Corp. | 21,100 | 320,399 | 4,523 | |||||||||
| Sekisui Chemical Co., Ltd. | 390,000 | 5,156,191 | (64,247 | ) | ||||||||
| Seven & i Holdings Co., Ltd. | 98,300 | 4,440,392 | 60,230 | |||||||||
| Sharp Corp. | 1,433,000 | 1,554,368 | (76,379 | ) | ||||||||
| Shimadzu Corp. | 174,000 | 2,595,794 | 316,952 | |||||||||
| Shimamura Co., Ltd. | 39,300 | 4,486,553 | 115,836 | |||||||||
| Shimizu Corp. | 403,000 | 3,373,060 | (86,903 | ) | ||||||||
| The accompanying notes are an integral part of these financial statements. | (Continued) |
| AQR Funds | Annual Report | December 2015 | ||||||||||||||
197
Table of Contents
| Consolidated Schedule of Investments | December 31, 2015 |
| AQR MULTI-STRATEGY ALTERNATIVE FUND |
| REFERENCE ENTITY | SHARES | NOTIONAL (a) | NET UNREALIZED APPRECIATION (DEPRECIATION) | |||||||||
| Japan (continued) | ||||||||||||
| Shin-Etsu Chemical Co., Ltd. | 43,600 | $ | 2,395,262 | $ | (24,910 | ) | ||||||
| Shionogi & Co., Ltd. | 123,900 | 5,505,106 | 98,919 | |||||||||
| Showa Shell Sekiyu KK | 55,600 | 479,686 | (25,981 | ) | ||||||||
| SMC Corp. | 700 | 167,367 | 14,446 | |||||||||
| Sohgo Security Services Co., Ltd. | 11,300 | 518,350 | 11,608 | |||||||||
| Sojitz Corp. | 1,227,100 | 2,816,123 | (240,955 | ) | ||||||||
| Sompo Japan Nipponkoa Holdings, Inc. | 19,000 | 636,121 | (12,262 | ) | ||||||||
| Sony Corp. | 69,300 | 1,900,726 | (197,554 | ) | ||||||||
| Sugi Holdings Co., Ltd. | 8,800 | 394,715 | 90,805 | |||||||||
| Sumitomo Chemical Co., Ltd. | 837,590 | 4,911,617 | (101,258 | ) | ||||||||
| Sumitomo Corp. | 46,200 | 469,921 | 1,104 | |||||||||
| Sumitomo Electric Industries Ltd. | 129,000 | 1,818,761 | 2,826 | |||||||||
| Sumitomo Heavy Industries Ltd. | 1,845,000 | 8,212,628 | 58,246 | |||||||||
| Sumitomo Rubber Industries Ltd. | 89,700 | 1,211,219 | (44,817 | ) | ||||||||
| Sundrug Co., Ltd. | 3,400 | 187,403 | 31,206 | |||||||||
| Suntory Beverage & Food Ltd. | 29,200 | 1,132,967 | 145,296 | |||||||||
| Suzuken Co., Ltd./Aichi Japan | 47,120 | 1,809,389 | (18,726 | ) | ||||||||
| Suzuki Motor Corp. | 45,000 | 1,368,846 | (1,574 | ) | ||||||||
| Taiheiyo Cement Corp. | 330,923 | 1,056,496 | (90,098 | ) | ||||||||
| Taisei Corp. | 919,000 | 6,262,097 | (208,673 | ) | ||||||||
| Takashimaya Co., Ltd. | 411,000 | 3,624,983 | 76,273 | |||||||||
| Takeda Pharmaceutical Co., Ltd. | 40,800 | 1,994,295 | 39,971 | |||||||||
| TDK Corp. | 24,000 | 1,535,648 | 1,407 | |||||||||
| Teijin Ltd. | 1,087,000 | 3,762,233 | (57,881 | ) | ||||||||
| THK Co., Ltd. | 130,100 | 2,364,208 | 47,077 | |||||||||
| Toho Co., Ltd. | 11,600 | 327,180 | (6,182 | ) | ||||||||
| Toho Gas Co., Ltd. | 89,000 | 572,430 | 2,352 | |||||||||
| Tohoku Electric Power Co., Inc. | 226,700 | 2,850,069 | (16,021 | ) | ||||||||
| Tokio Marine Holdings, Inc. | 3,800 | 161,976 | (15,202 | ) | ||||||||
| Tokyo Electric Power Co., Inc. | 339,300 | 2,069,168 | (115,391 | ) | ||||||||
| Tokyo Gas Co., Ltd. | 663,000 | 3,040,745 | 74,555 | |||||||||
| Tokyu Corp. | 129,000 | 1,026,087 | (6,678 | ) | ||||||||
| Toppan Printing Co., Ltd. | 301,000 | 2,772,334 | 829 | |||||||||
| Tosoh Corp. | 147,000 | 807,128 | (50,958 | ) | ||||||||
| Toyo Seikan Group Holdings Ltd. | 170,800 | 3,250,011 | (81,816 | ) | ||||||||
| Toyo Suisan Kaisha Ltd. | 67,600 | 2,356,635 | (603 | ) | ||||||||
| Toyoda Gosei Co., Ltd. | 58,700 | 1,374,303 | (40,820 | ) | ||||||||
| Toyota Boshoku Corp. | 96,200 | 1,991,376 | (55,119 | ) | ||||||||
| Toyota Industries Corp. | 5,900 | 300,107 | 15,386 | |||||||||
| REFERENCE ENTITY | SHARES | NOTIONAL (a) | NET UNREALIZED APPRECIATION (DEPRECIATION) | |||||||||
| Japan (continued) | ||||||||||||
| USS Co., Ltd. | 278,600 | $ | 4,302,170 | $ | (115,975 | ) | ||||||
| West Japan Railway Co. | 67,000 | 4,611,440 | 19,804 | |||||||||
| Yamaguchi Financial Group, Inc. | 175,000 | 2,250,788 | (177,527 | ) | ||||||||
| Yamaha Corp. | 80,400 | 1,926,659 | 15,353 | |||||||||
| Yamazaki Baking Co., Ltd. | 227,000 | 4,836,006 | 268,269 | |||||||||
|
| |||||||||||
| (5,140,109) | ||||||||||||
|
| |||||||||||
| Total of Long Equity Positions | (5,140,109) | |||||||||||
|
| |||||||||||
| Short Positions | ||||||||||||
| Common Stocks | ||||||||||||
| Japan | ||||||||||||
| ABC-Mart, Inc. | (32,449 | ) | (1,765,772 | ) | (10,425 | ) | ||||||
| Acom Co., Ltd. | (750,830 | ) | (3,710,608 | ) | 174,941 | |||||||
| Advantest Corp. | (194,600 | ) | (1,666,003 | ) | 51,753 | |||||||
| Aeon Co., Ltd. | (243,400 | ) | (3,727,333 | ) | (22,877 | ) | ||||||
| AEON Financial Service Co., Ltd. | (308,800 | ) | (6,875,539 | ) | (22,659 | ) | ||||||
| Aisin Seiki Co., Ltd. | (25,600 | ) | (1,056,400 | ) | (45,383 | ) | ||||||
| Alps Electric Co., Ltd. | (33,500 | ) | (1,015,357 | ) | 106,903 | |||||||
| Aozora Bank Ltd. | (368,000 | ) | (1,276,736 | ) | (7,520 | ) | ||||||
| Asahi Glass Co., Ltd. | (165,000 | ) | (962,313 | ) | 17,052 | |||||||
| Asics Corp. | (225,500 | ) | (4,786,167 | ) | 107,604 | |||||||
| Calbee, Inc. | (2,900 | ) | (123,388 | ) | 923 | |||||||
| Canon, Inc. | (96,500 | ) | (3,012,603 | ) | 93,475 | |||||||
| Casio Computer Co., Ltd. | (100 | ) | (2,052 | ) | (285 | ) | ||||||
| Century Tokyo Leasing Corp. | (100 | ) | (3,567 | ) | (5 | ) | ||||||
| Chiyoda Corp. | (185,000 | ) | (1,622,348 | ) | 217,534 | |||||||
| Chugoku Electric Power Co., Inc./The | (33,400 | ) | (436,028 | ) | (4,965 | ) | ||||||
| Credit Saison Co., Ltd. | (127,913 | ) | (2,547,904 | ) | 27,735 | |||||||
| Daido Steel Co., Ltd. | (137,000 | ) | (544,850 | ) | (2,731 | ) | ||||||
| Daihatsu Motor Co., Ltd. | (171,600 | ) | (2,361,436 | ) | 46,548 | |||||||
| Dai-ichi Life Insurance Co., Ltd./The | (22,500 | ) | (448,406 | ) | 74,058 | |||||||
| Daiichi Sankyo Co., Ltd. | (158,000 | ) | (3,321,193 | ) | 60,119 | |||||||
| Daikin Industries Ltd. | (135,900 | ) | (9,743,711 | ) | (152,756 | ) | ||||||
| Daiwa Securities Group, Inc. | (236,000 | ) | (1,590,634 | ) | 147,802 | |||||||
| DeNA Co., Ltd. | (131,900 | ) | (2,039,118 | ) | (23,315 | ) | ||||||
| Denso Corp. | (129,300 | ) | (6,208,401 | ) | 29,736 | |||||||
| Dentsu, Inc. | (100 | ) | (5,396 | ) | (75 | ) | ||||||
| Disco Corp. | (13,600 | ) | (1,288,866 | ) | 8,134 | |||||||
| Eisai Co., Ltd. | (18,300 | ) | (1,070,977 | ) | (139,583 | ) | ||||||
| Electric Power Development Co., Ltd. | (10,500 | ) | (368,242 | ) | (5,733 | ) | ||||||
| Fast Retailing Co., Ltd. | (29,200 | ) | (10,502,499 | ) | 288,004 | |||||||
| GS Yuasa Corp. | (52,853 | ) | (196,569 | ) | 146 | |||||||
| The accompanying notes are an integral part of these financial statements. | (Continued) |
| AQR Funds | Annual Report | December 2015 | ||||||||||||||
198
Table of Contents
| Consolidated Schedule of Investments | December 31, 2015 |
| AQR MULTI-STRATEGY ALTERNATIVE FUND |
| REFERENCE ENTITY | SHARES | NOTIONAL (a) | NET UNREALIZED APPRECIATION (DEPRECIATION) | |||||||||
| Japan (continued) | ||||||||||||
| Hamamatsu Photonics KK | (6,300 | ) | $ | (166,781 | ) | $ | (5,935 | ) | ||||
| Hino Motors Ltd. | (52,700 | ) | (578,085 | ) | (30,993 | ) | ||||||
| Hirose Electric Co., Ltd. | (3,000 | ) | (374,001 | ) | 10,785 | |||||||
| Hitachi Capital Corp. | (40,200 | ) | (1,085,380 | ) | 5,294 | |||||||
| Hitachi Chemical Co., Ltd. | (15,400 | ) | (266,504 | ) | 22,188 | |||||||
| Hitachi Construction Machinery Co., Ltd. | (154,095 | ) | (2,320,722 | ) | (75,811 | ) | ||||||
| Hitachi Ltd. | (1,470,000 | ) | (8,440,439 | ) | 110,867 | |||||||
| Hokkaido Electric Power Co., Inc. | (4,600 | ) | (45,472 | ) | (1,790 | ) | ||||||
| Honda Motor Co., Ltd. | (169,800 | ) | (5,481,418 | ) | 54,348 | |||||||
| Ibiden Co., Ltd. | (2,000 | ) | (28,047 | ) | (626 | ) | ||||||
| IHI Corp. | (383,000 | ) | (1,556,438 | ) | 499,167 | |||||||
| Iida Group Holdings Co., Ltd. | (17,300 | ) | (349,500 | ) | 28,861 | |||||||
| Inpex Corp. | (517,300 | ) | (5,495,228 | ) | 452,116 | |||||||
| Japan Airport Terminal Co., Ltd. | (13,900 | ) | (735,358 | ) | 120,018 | |||||||
| Japan Display, Inc. | (625,100 | ) | (1,747,630 | ) | (53,446 | ) | ||||||
| JFE Holdings, Inc. | (33,300 | ) | (538,723 | ) | 15,833 | |||||||
| JGC Corp. | (49,000 | ) | (783,533 | ) | 33,528 | |||||||
| JX Holdings, Inc. | (354,800 | ) | (1,536,642 | ) | 47,518 | |||||||
| Kakaku.com, Inc. | (453,900 | ) | (8,913,151 | ) | (14,882 | ) | ||||||
| Kansai Paint Co., Ltd. | (146,400 | ) | (2,240,018 | ) | 20,922 | |||||||
| Keikyu Corp. | (146,000 | ) | (1,214,751 | ) | 8,317 | |||||||
| Kikkoman Corp. | (117,000 | ) | (4,025,424 | ) | (28,326 | ) | ||||||
| Kintetsu Group Holdings Co., Ltd. | (366,000 | ) | (1,467,836 | ) | (20,242 | ) | ||||||
| Kirin Holdings Co., Ltd. | (60,300 | ) | (868,061 | ) | 49,359 | |||||||
| Komatsu Ltd. | (50,100 | ) | (800,985 | ) | (18,774 | ) | ||||||
| Kose Corp. | (6,300 | ) | (656,161 | ) | 73,658 | |||||||
| Kubota Corp. | (654,000 | ) | (10,439,228 | ) | 335,812 | |||||||
| Kuraray Co., Ltd. | (144,000 | ) | (1,821,005 | ) | 76,761 | |||||||
| Kyocera Corp. | (100,600 | ) | (4,660,575 | ) | (11,342 | ) | ||||||
| Kyowa Hakko Kirin Co., Ltd. | (11,000 | ) | (202,103 | ) | 29,022 | |||||||
| Kyushu Electric Power Co., Inc. | (846,600 | ) | (9,143,471 | ) | (83,713 | ) | ||||||
| Kyushu Financial Group, Inc. | (6,000 | ) | (44,632 | ) | 2,350 | |||||||
| Lawson, Inc. | (2,200 | ) | (156,849 | ) | (21,727 | ) | ||||||
| LIXIL Group Corp. | (139,600 | ) | (3,158,099 | ) | 57,624 | |||||||
| M3, Inc. | (379,700 | ) | (8,093,727 | ) | 220,957 | |||||||
| Makita Corp. | (70,700 | ) | (3,959,091 | ) | (115,113 | ) | ||||||
| Marui Group Co., Ltd. | (161,700 | ) | (2,627,618 | ) | (3,663 | ) | ||||||
| Maruichi Steel Tube Ltd. | (13,900 | ) | (360,573 | ) | (49,776 | ) | ||||||
| Mazda Motor Corp. | (386,900 | ) | (7,944,804 | ) | (38,784 | ) | ||||||
| Minebea Co., Ltd. | (697,000 | ) | (9,712,743 | ) | 3,745,050 | |||||||
| MISUMI Group, Inc. | (37,900 | ) | (524,197 | ) | 659 | |||||||
| Mitsubishi Gas Chemical Co., Inc. | (41,000 | ) | (226,757 | ) | 17,103 | |||||||
| Mitsubishi Heavy Industries Ltd. | (8,000 | ) | (42,895 | ) | 7,915 | |||||||
| REFERENCE ENTITY | SHARES | NOTIONAL (a) | NET UNREALIZED APPRECIATION (DEPRECIATION) | |||||||||
| Japan (continued) | ||||||||||||
| Mitsubishi Logistics Corp. | (131,000 | ) | $ | (1,728,651 | ) | $ | 2,572 | |||||
| Mitsubishi Materials Corp. | (254,000 | ) | (959,323 | ) | 159,312 | |||||||
| Mitsubishi UFJ Financial Group, Inc. | (220,400 | ) | (1,601,022 | ) | 235,809 | |||||||
| Mitsui Chemicals, Inc. | (1,175,025 | ) | (5,093,854 | ) | (117,391 | ) | ||||||
| Mitsui OSK Lines Ltd. | (2,967,000 | ) | (7,405,924 | ) | (77,674 | ) | ||||||
| Mizuho Financial Group, Inc. | (2,511,500 | ) | (5,051,598 | ) | 28,597 | |||||||
| Nabtesco Corp. | (5,600 | ) | (114,153 | ) | 388 | |||||||
| NGK Insulators Ltd. | (167,000 | ) | (3,796,104 | ) | 31,892 | |||||||
| NGK Spark Plug Co., Ltd. | (175,900 | ) | (4,687,838 | ) | 56,661 | |||||||
| NH Foods Ltd. | (13,000 | ) | (275,821 | ) | 21,023 | |||||||
| Nidec Corp. | (150,100 | ) | (10,642,230 | ) | (242,420 | ) | ||||||
| Nikon Corp. | (484,795 | ) | (6,473,956 | ) | (19,134 | ) | ||||||
| Nippon Electric Glass Co., Ltd. | (128,000 | ) | (654,947 | ) | 9,805 | |||||||
| Nippon Paint Holdings Co., Ltd. | (282,300 | ) | (6,661,445 | ) | (170,789 | ) | ||||||
| Nippon Steel & Sumitomo Metal Corp. | (69,300 | ) | (1,449,682 | ) | 78,764 | |||||||
| Nissan Chemical Industries Ltd. | (29,000 | ) | (663,257 | ) | 4,924 | |||||||
| Nissan Motor Co., Ltd. | (672,500 | ) | (7,058,629 | ) | 17,055 | |||||||
| Nisshin Seifun Group, Inc. | (17,400 | ) | (264,884 | ) | (19,336 | ) | ||||||
| Nissin Foods Holdings Co., Ltd. | (8,900 | ) | (421,907 | ) | (50,360 | ) | ||||||
| Nitori Holdings Co., Ltd. | (3,000 | ) | (253,922 | ) | 1,976 | |||||||
| Nomura Research Institute Ltd. | (4,700 | ) | (185,343 | ) | 4,845 | |||||||
| Odakyu Electric Railway Co., Ltd. | (93,000 | ) | (988,158 | ) | (13,155 | ) | ||||||
| Oji Holdings Corp. | (216,000 | ) | (949,435 | ) | 81,333 | |||||||
| Olympus Corp. | (39,200 | ) | (1,513,452 | ) | (29,800 | ) | ||||||
| Ono Pharmaceutical Co., Ltd. | (66,645 | ) | (12,074,351 | ) | 190,768 | |||||||
| Oriental Land Co., Ltd. | (17,100 | ) | (1,033,781 | ) | (709 | ) | ||||||
| Rakuten, Inc. | (392,200 | ) | (4,531,041 | ) | 13,778 | |||||||
| Recruit Holdings Co., Ltd. | (14,200 | ) | (448,300 | ) | 30,908 | |||||||
| Ricoh Co., Ltd. | (992,100 | ) | (9,913,978 | ) | (301,482 | ) | ||||||
| Rinnai Corp. | (23,100 | ) | (2,056,530 | ) | 9,790 | |||||||
| Ryohin Keikaku Co., Ltd. | (32,400 | ) | (6,624,170 | ) | 62,800 | |||||||
| Seibu Holdings, Inc. | (14,400 | ) | (305,850 | ) | 11,769 | |||||||
| Sekisui House Ltd. | (13,900 | ) | (233,565 | ) | (146 | ) | ||||||
| Seven Bank Ltd. | (266,300 | ) | (1,203,938 | ) | 36,080 | |||||||
| Shikoku Electric Power Co., Inc. | (305,973 | ) | (4,697,129 | ) | (82,556 | ) | ||||||
| Shimano, Inc. | (27,100 | ) | (4,283,999 | ) | 122,562 | |||||||
| Shinsei Bank Ltd. | (3,223,000 | ) | (5,819,293 | ) | (111,963 | ) | ||||||
| Shiseido Co., Ltd. | (7,100 | ) | (166,256 | ) | 18,941 | |||||||
| The accompanying notes are an integral part of these financial statements. | (Continued) |
| AQR Funds | Annual Report | December 2015 | ||||||||||||||
199
Table of Contents
| Consolidated Schedule of Investments | December 31, 2015 |
| AQR MULTI-STRATEGY ALTERNATIVE FUND |
| REFERENCE ENTITY | SHARES | NOTIONAL (a) | NET UNREALIZED APPRECIATION (DEPRECIATION) | |||||||||
| Japan (continued) | ||||||||||||
| SoftBank Group Corp. | (96,200 | ) | $ | (4,877,587 | ) | $ | 22,334 | |||||
| Sony Financial Holdings, Inc. | (6,500 | ) | (117,190 | ) | 923 | |||||||
| Stanley Electric Co., Ltd. | (40,900 | ) | (854,153 | ) | (43,094 | ) | ||||||
| Sumco Corp. | (277,200 | ) | (2,117,107 | ) | 25,772 | |||||||
| Sumitomo Dainippon Pharma Co., Ltd. | (55,800 | ) | (675,447 | ) | 18,042 | |||||||
| Sumitomo Metal Mining Co., Ltd. | (308,000 | ) | (4,518,522 | ) | 779,735 | |||||||
| Sumitomo Mitsui Financial Group, Inc. | (63,200 | ) | (2,383,657 | ) | (1,577 | ) | ||||||
| Sumitomo Mitsui Trust Holdings, Inc. | (1,380,000 | ) | (5,247,312 | ) | 20,794 | |||||||
| Suruga Bank Ltd. | (33,700 | ) | (695,332 | ) | 822 | |||||||
| Sysmex Corp. | (25,200 | ) | (1,587,291 | ) | (29,155 | ) | ||||||
| Taisho Pharmaceutical Holdings Co., Ltd. | (2,300 | ) | (155,441 | ) | (6,998 | ) | ||||||
| Taiyo Nippon Sanso Corp. | (292,116 | ) | (2,547,144 | ) | (94,683 | ) | ||||||
| Terumo Corp. | (227,900 | ) | (7,073,013 | ) | 9,611 | |||||||
| Tobu Railway Co., Ltd. | (90,000 | ) | (403,559 | ) | (40,359 | ) | ||||||
| Tokyo Electron Ltd. | (26,000 | ) | (1,365,636 | ) | (209,570 | ) | ||||||
| TonenGeneral Sekiyu KK | (13,000 | ) | (116,374 | ) | 6,628 | |||||||
| Toray Industries, Inc. | (203,000 | ) | (1,766,767 | ) | (119,615 | ) | ||||||
| Toshiba Corp. | (847,000 | ) | (1,575,502 | ) | (165,273 | ) | ||||||
| TOTO Ltd. | (36,700 | ) | (1,258,993 | ) | (30,353 | ) | ||||||
| Toyota Motor Corp. | (9,900 | ) | (628,869 | ) | 19,237 | |||||||
| Trend Micro, Inc. | (2,300 | ) | (80,814 | ) | (12,513 | ) | ||||||
| Tsumura & Co. | (3,400 | ) | (95,049 | ) | 636 | |||||||
| Tsuruha Holdings, Inc. | (200 | ) | (16,076 | ) | (1,253 | ) | ||||||
| REFERENCE ENTITY | SHARES | NOTIONAL (a) | NET UNREALIZED APPRECIATION (DEPRECIATION) | |||||||||
| Japan (continued) | ||||||||||||
| Unicharm Corp. | (167,700 | ) | $ | (3,312,584 | ) | $ | (112,131 | ) | ||||
| Yahoo Japan Corp. | (3,806,100 | ) | (15,833,483 | ) | 362,049 | |||||||
| Yakult Honsha Co., Ltd. | (73,568 | ) | (3,593,139 | ) | (7,625 | ) | ||||||
| Yamada Denki Co., Ltd. | (1,320,570 | ) | (5,724,492 | ) | 20,252 | |||||||
| Yamaha Motor Co., Ltd. | (51,100 | ) | (1,222,103 | ) | 76,681 | |||||||
| Yamato Holdings Co., Ltd. | (86,800 | ) | (1,839,083 | ) | (47 | ) | ||||||
| Yaskawa Electric Corp. | (1,094,700 | ) | (15,310,175 | ) | 414,932 | |||||||
| Yokogawa Electric Corp. | (169,300 | ) | (2,012,941 | ) | (23,051 | ) | ||||||
| Yokohama Rubber Co., Ltd./The | (56,900 | ) | (1,143,797 | ) | 269,937 | |||||||
|
| |||||||||||
| 7,631,769 | ||||||||||||
|
| |||||||||||
Total of Short Equity Positions | 7,631,769 | |||||||||||
|
| |||||||||||
Total of Long and Short Equity Positions | 2,491,660 | |||||||||||
|
| |||||||||||
Net Cash and Other Receivables/ (Payables) (b) | (3,631,921 | ) | ||||||||||
|
| |||||||||||
| Swaps, at Value | $(1,140,261) | |||||||||||
|
| |||||||||||
| (a) | Notional value represents the market value (including any fees or commissions) of the long and short positions when they are established. |
| (b) | Cash and other receivables/(payables) includes the gains (or losses) realized within the swap when the swap resets. |
| The accompanying notes are an integral part of these financial statements. | (Continued) |
| AQR Funds | Annual Report | December 2015 | ||||||||||||||
200
Table of Contents
| Consolidated Schedule of Investments | December 31, 2015 |
| AQR MULTI-STRATEGY ALTERNATIVE FUND |
| COUNTERPARTY | DESCRIPTION | TERMINATION DATE** | VALUE (Note 5) | |||||
| J.P. Morgan | The Fund receives the total return on a portfolio of long and short positions and pays or receives the Norway Interbank Offered Rate plus or minus a specified spread, which is denominated in NOK based on the local currencies of the positions within the swap. | 1-14 months maturity ranging from 01/19/2016 - 01/30/2017 | $493,416 | |||||
|
| |||||||
| ** | The maturity dates are measured from the commencement of investment in each underlying portfolio swap positions. |
Additional Information — Total Return Basket Swaps
The following table represents the individual long and short positions and related values within the total return basket swaps as of December 31, 2015.
| REFERENCE ENTITY | SHARES | NOTIONAL (a) | NET UNREALIZED APPRECIATION (DEPRECIATION) | |||||||||
| Long Positions | ||||||||||||
| Common Stocks | ||||||||||||
| Norway | ||||||||||||
| DNB ASA | 252,529 | $ | 3,031,058 | $ | 80,408 | |||||||
| Gjensidige Forsikring ASA | 18,579 | 290,801 | 6,559 | |||||||||
| Norsk Hydro ASA | 541,299 | 1,945,504 | 66,559 | |||||||||
| Orkla ASA | 218,381 | 1,676,872 | 45,919 | |||||||||
| Yara International ASA | 54,351 | 2,292,421 | 45,121 | |||||||||
|
| |||||||||||
| 244,566 | ||||||||||||
|
| |||||||||||
| United Kingdom | ||||||||||||
| Subsea 7 SA | 223,972 | 1,898,033 | (312,763 | ) | ||||||||
|
| |||||||||||
Total of Long Equity Positions | (68,197 | ) | ||||||||||
|
| |||||||||||
| Short Positions | ||||||||||||
| Common Stocks | ||||||||||||
| Norway | ||||||||||||
| Marine Harvest ASA | (73,046 | ) | (903,039 | ) | (79,783 | ) | ||||||
| Schibsted ASA | (100,157 | ) | (3,191,755 | ) | (101,071 | ) | ||||||
| Schibsted ASA | (38,450 | ) | (1,058,266 | ) | (165,511 | ) | ||||||
| Seadrill Ltd. | (190,883 | ) | (708,465 | ) | 49,268 | |||||||
| REFERENCE ENTITY | SHARES | NOTIONAL (a) | NET UNREALIZED APPRECIATION (DEPRECIATION) | |||||||||
| Norway (continued) | ||||||||||||
| Statoil ASA | (149,917 | ) | $ | (2,234,393 | ) | $ | 143,534 | |||||
| Telenor ASA | (20,149 | ) | (375,578 | ) | 39,723 | |||||||
| TGS Nopec Geophysical Co. ASA | (79,428 | ) | (1,253,409 | ) | (10,844 | ) | ||||||
|
| |||||||||||
| (124,684) | ||||||||||||
|
| |||||||||||
Total of Short Equity Positions | (124,684 | ) | ||||||||||
|
| |||||||||||
Total of Long and Short Equity Positions | (192,881 | ) | ||||||||||
|
| |||||||||||
Net Cash and Other Receivables/ (Payables) (b) | 686,297 | |||||||||||
|
| |||||||||||
Swaps, at Value | $ | 493,416 | ||||||||||
|
| |||||||||||
| (a) | Notional value represents the market value (including any fees or commissions) of the long and short positions when they are established. |
| (b) | Cash and other receivables/(payables) includes the gains (or losses) realized within the swap when the swap resets. |
| The accompanying notes are an integral part of these financial statements. | (Continued) |
| AQR Funds | Annual Report | December 2015 | ||||||||||||||
201
Table of Contents
| Consolidated Schedule of Investments | December 31, 2015 |
| AQR MULTI-STRATEGY ALTERNATIVE FUND |
| COUNTERPARTY | DESCRIPTION | TERMINATION DATE** | VALUE (Note 5) | |||||
| J.P. Morgan | The Fund receives the total return on a portfolio of long and short positions and pays or receives the LIBOR plus or minus a specified spread, which is denominated in USD based on the local currencies of the positions within the swap. | 10 months maturity 05/16/2016 | $(148,574 | ) | ||||
|
| |||||||
| ** | The maturity dates are measured from the commencement of investment in each underlying portfolio swap positions. |
Additional Information — Total Return Basket Swaps
The following table represents the individual long positions and related values within the total return basket swaps as of December 31, 2015.
| REFERENCE ENTITY | SHARES | NOTIONAL (a) | NET (DEPRECIATION) | |||||||||
| Long Positions | ||||||||||||
| Common Stocks | ||||||||||||
| United States | ||||||||||||
| International Game Technology PLC | 77,280 | $ | 1,398,768 | $ | (148,378 | ) | ||||||
|
| |||||||||||
Net Cash and Other Receivables/ (Payables) (b) | (196 | ) | ||||||||||
|
| |||||||||||
Swaps, at Value | $ | (148,574 | ) | |||||||||
|
| |||||||||||
| (a) | Notional value represents the market value (including any fees or commissions) of the long positions when they are established. |
| (b) | Cash and other receivables/(payables) includes the gains (or losses) realized within the swap when the swap resets. |
| The accompanying notes are an integral part of these financial statements. | (Continued) |
| AQR Funds | Annual Report | December 2015 | ||||||||||||||
202
Table of Contents
| Consolidated Schedule of Investments | December 31, 2015 |
| AQR MULTI-STRATEGY ALTERNATIVE FUND |
| COUNTERPARTY | DESCRIPTION | TERMINATION DATE** | VALUE (Note 5) | |||||
| J.P. Morgan | The Fund receives the total return on a portfolio of long and short positions and pays or receives the Stockholm Interbank Offered Rate plus or minus a specified spread, which is denominated in SEK based on the local currencies of the positions within the swap. | 1-19 months maturity ranging from 01/19/2016 - 01/30/2017 | $(441,865 | ) | ||||
|
| |||||||
| ** | The maturity dates are measured from the commencement of investment in each underlying portfolio swap positions. |
Additional Information — Total Return Basket Swaps
The following table represents the individual long and short positions and related values within the total return basket swaps as of December 31, 2015.
| REFERENCE ENTITY | SHARES | NOTIONAL (a) | NET UNREALIZED APPRECIATION (DEPRECIATION) | |||||||||
| Long Positions | ||||||||||||
| Common Stocks | ||||||||||||
| Sweden | ||||||||||||
| BillerudKorsnas AB | 28,206 | $ | 457,986 | $ | 64,011 | |||||||
| Boliden AB | 442,497 | 7,209,078 | 204,603 | |||||||||
| Electrolux AB | 464,831 | 10,929,197 | 285,971 | |||||||||
| Hexpol AB | 17,970 | 193,205 | (526 | ) | ||||||||
| Husqvarna AB | 492,878 | 3,786,430 | (533,732 | ) | ||||||||
| Meda AB | 110,291 | 1,331,174 | 59,253 | |||||||||
| NCC AB | 5,524 | 179,268 | (7,897 | ) | ||||||||
| Securitas AB | 188,888 | 2,816,922 | 71,349 | |||||||||
| Skandinaviska Enskilda Banken AB | 189,003 | 1,950,053 | 37,598 | |||||||||
| Skanska AB | 186,278 | 3,546,069 | 66,533 | |||||||||
| SKF AB | 13,059 | 229,689 | (18,769 | ) | ||||||||
| SSAB AB | 76,875 | 191,582 | 12,660 | |||||||||
| Svenska Cellulosa AB SCA | 199,379 | 5,634,689 | 143,338 | |||||||||
| Swedbank AB | 10,825 | 235,819 | 2,586 | |||||||||
| Swedish Match AB | 68,541 | 2,351,917 | 70,144 | |||||||||
| Tele2 AB | 147,049 | 1,416,058 | 50,387 | |||||||||
| Telefonaktiebolaget LM Ericsson | 421,898 | 4,006,918 | 60,730 | |||||||||
| Trelleborg AB | 44,881 | 850,635 | 20,407 | |||||||||
|
| |||||||||||
| 588,646 | ||||||||||||
|
| |||||||||||
Total of Long Equity Positions | 588,646 | |||||||||||
|
| |||||||||||
| Short Positions | ||||||||||||
| Common Stocks | ||||||||||||
| Luxembourg | ||||||||||||
| Millicom International Cellular SA | (18,966 | ) | (1,340,647 | ) | 252,376 | |||||||
|
| |||||||||||
| REFERENCE ENTITY | SHARES | NOTIONAL (a) | NET UNREALIZED APPRECIATION (DEPRECIATION) | |||||||||
| Sweden | ||||||||||||
| Alfa Laval AB | (143,044 | ) | $ | (2,555,285 | ) | $ | (56,135 | ) | ||||
| Assa Abloy AB | (53,791 | ) | (1,105,423 | ) | (20,569 | ) | ||||||
| Atlas Copco AB | (228,195 | ) | (5,543,977 | ) | (52,461 | ) | ||||||
| Elekta AB | (62,802 | ) | (520,311 | ) | (13,309 | ) | ||||||
| Getinge AB | (80,239 | ) | (2,028,182 | ) | (73,700 | ) | ||||||
| Hennes & Mauritz AB | (118,917 | ) | (4,414,265 | ) | 184,353 | |||||||
| Hexagon AB | (92,131 | ) | (3,380,954 | ) | (27,233 | ) | ||||||
| Modern Times Group MTG AB | (56,922 | ) | (1,506,121 | ) | 52,688 | |||||||
| Sandvik AB | (677,276 | ) | (5,860,616 | ) | (43,204 | ) | ||||||
| Svenska Handelsbanken AB | (37,733 | ) | (498,360 | ) | (2,790 | ) | ||||||
| TeliaSonera AB | (180,215 | ) | (949,375 | ) | 54,448 | |||||||
| Volvo AB | (543,661 | ) | (7,033,252 | ) | 1,992,123 | |||||||
|
| |||||||||||
| 1,994,211 | ||||||||||||
|
| |||||||||||
Total of Short Equity Positions | 2,246,587 | |||||||||||
|
| |||||||||||
Total of Long and Short Equity Positions | 2,835,233 | |||||||||||
|
| |||||||||||
Net Cash and Other Receivables/ (Payables) (b) | (3,277,098 | ) | ||||||||||
|
| |||||||||||
Swaps, at Value | $ | (441,865 | ) | |||||||||
|
| |||||||||||
| (a) | Notional value represents the market value (including any fees or commissions) of the long and short positions when they are established. |
| (b) | Cash and other receivables/(payables) includes the gains (or losses) realized within the swap when the swap resets. |
| The accompanying notes are an integral part of these financial statements. | (Continued) |
| AQR Funds | Annual Report | December 2015 | ||||||||||||||
203
Table of Contents
| Consolidated Schedule of Investments | December 31, 2015 |
| AQR MULTI-STRATEGY ALTERNATIVE FUND |
| COUNTERPARTY | DESCRIPTION | TERMINATION DATE** | VALUE (Note 5) | |||||
| Morgan Stanley Capital Services, Inc. | The Fund receives the total return on a portfolio of long and short positions and pays or receives the Federal Funds Effective Rate plus or minus a specified spread, which is denominated in USD based on the local currencies of the positions within the swap. | 1-25 months maturity ranging from 01/13/2016 - 11/09/2017 | $79,136,935 | |||||
|
| |||||||
| ** | The maturity dates are measured from the commencement of investment in each underlying portfolio swap positions. |
Additional Information — Total Return Basket Swaps
The following table represents the individual long and short positions and related values within the total return basket swaps as of December 31, 2015.
| REFERENCE ENTITY | SHARES | NOTIONAL (a) | NET UNREALIZED APPRECIATION (DEPRECIATION) | |||||||||
| Long Positions | ||||||||||||
| Common Stocks | ||||||||||||
| Ireland | ||||||||||||
| Accenture PLC | 7,845 | $ | 848,202 | $ | (28,400 | ) | ||||||
| Alkermes PLC | 55,566 | 3,853,459 | 557,370 | |||||||||
| Allegion PLC | 16,753 | 1,077,326 | 27,032 | |||||||||
| XL Group PLC | 114,090 | 4,160,563 | 309,483 | |||||||||
|
| |||||||||||
| 865,485 | ||||||||||||
|
| |||||||||||
| Norway | ||||||||||||
| Seadrill Ltd. | 50,838 | 194,331 | (21,991 | ) | ||||||||
|
| |||||||||||
| Puerto Rico | ||||||||||||
| Popular, Inc. | 20,953 | 615,919 | (22,111 | ) | ||||||||
|
| |||||||||||
| Singapore | ||||||||||||
| Flextronics International Ltd. | 1,558,968 | 17,057,022 | 419,009 | |||||||||
|
| |||||||||||
| Switzerland | ||||||||||||
| Allied World Assurance Co. Holdings AG | 131,454 | 5,441,867 | (553,093 | ) | ||||||||
| TE Connectivity Ltd. | 130,729 | 8,141,202 | 305,199 | |||||||||
| Transocean Ltd. | 407,897 | 5,668,057 | (618,292 | ) | ||||||||
|
| |||||||||||
| (866,186 | ) | |||||||||||
|
| |||||||||||
| United Kingdom | ||||||||||||
| Delphi Automotive PLC | 98,097 | 7,688,416 | 721,440 | |||||||||
| Liberty Global PLC | 182,822 | 8,111,812 | (367,472 | ) | ||||||||
| Michael Kors Holdings Ltd. | 45,403 | 1,844,353 | (25,509 | ) | ||||||||
| Noble Corp. PLC | 463,036 | 5,927,549 | (1,042,519 | ) | ||||||||
| Willis Group Holdings PLC | 27,135 | 1,263,017 | 54,930 | |||||||||
|
| |||||||||||
| (659,130 | ) | |||||||||||
|
| |||||||||||
| United States | ||||||||||||
| 3M Co. | 4,198 | 654,247 | (21,860 | ) | ||||||||
| Aaron’s, Inc. | 40,712 | 1,150,433 | (238,892 | ) | ||||||||
| Abbott Laboratories | 555,241 | 25,384,866 | (448,993 | ) | ||||||||
| AbbVie, Inc. | 3,168 | 183,199 | 4,473 | |||||||||
| Acuity Brands, Inc. | 19,803 | 3,864,389 | 765,552 | |||||||||
| REFERENCE ENTITY | SHARES | NOTIONAL (a) | NET UNREALIZED APPRECIATION (DEPRECIATION) | |||||||||
| United States (continued) | ||||||||||||
| Adobe Systems, Inc. | 26,065 | $ | 2,268,730 | $ | 179,816 | |||||||
| Advance Auto Parts, Inc. | 13,859 | 2,201,030 | (115,112 | ) | ||||||||
| Advanced Micro Devices, Inc. | 2,734 | 5,835 | 2,012 | |||||||||
| Aetna, Inc. | 141,389 | 15,843,798 | (556,819 | ) | ||||||||
| Aflac, Inc. | 85,520 | 5,179,736 | (57,088 | ) | ||||||||
| AGCO Corp. | 104,274 | 5,009,084 | (276,087 | ) | ||||||||
| Agilent Technologies, Inc. | 266,080 | 9,971,918 | 1,152,887 | |||||||||
| Air Products & Chemicals, Inc. | 15,463 | 2,087,458 | (75,567 | ) | ||||||||
| Akamai Technologies, Inc. | 118,088 | 8,186,491 | (1,971,520 | ) | ||||||||
| Alaska Air Group, Inc. | 11,482 | 861,241 | 63,175 | |||||||||
| Alleghany Corp. | 7,312 | 3,537,074 | (42,450 | ) | ||||||||
| Alliant Energy Corp. | 84,991 | 4,998,863 | 308,825 | |||||||||
| Allison Transmission Holdings, Inc. | 36,304 | 1,023,921 | (84,010 | ) | ||||||||
| Allstate Corp./The | 196,991 | 12,894,375 | (663,203 | ) | ||||||||
| Alnylam Pharmaceuticals, Inc. | 16,902 | 1,491,766 | 99,388 | |||||||||
| Alphabet, Inc. | 6,242 | 4,719,029 | 137,309 | |||||||||
| Amazon.com, Inc. | 7,190 | 3,872,277 | 987,373 | |||||||||
| Amdocs Ltd. | 243,667 | 13,949,710 | (652,801 | ) | ||||||||
| AMERCO | 10,967 | 3,970,143 | 301,503 | |||||||||
| Ameren Corp. | 57,586 | 2,348,511 | 140,932 | |||||||||
| American Eagle Outfitters, Inc. | 337,714 | 5,431,292 | (196,725 | ) | ||||||||
| American Electric Power Co., Inc. | 248,316 | 13,673,092 | 796,281 | |||||||||
| American Financial Group, Inc. | 78,118 | 5,359,429 | 271,317 | |||||||||
| American International Group, Inc. | 22,320 | 1,402,990 | (19,819 | ) | ||||||||
| Ameriprise Financial, Inc. | 7,564 | 901,974 | (97,013 | ) | ||||||||
| AmerisourceBergen Corp. | 187,748 | 19,944,822 | (473,477 | ) | ||||||||
| The accompanying notes are an integral part of these financial statements. | (Continued) |
| AQR Funds | Annual Report | December 2015 | ||||||||||||||
204
Table of Contents
| Consolidated Schedule of Investments | December 31, 2015 |
| AQR MULTI-STRATEGY ALTERNATIVE FUND |
| REFERENCE ENTITY | SHARES | NOTIONAL (a) | NET UNREALIZED APPRECIATION (DEPRECIATION) | |||||||||
| United States (continued) | ||||||||||||
| Amgen, Inc. | 64,200 | $ | 10,421,275 | $ | 311 | |||||||
| Anadarko Petroleum Corp. | 87,182 | 6,315,435 | (2,080,133 | ) | ||||||||
| Analog Devices, Inc. | 41,805 | 2,418,173 | (105,520 | ) | ||||||||
| ANSYS, Inc. | 2,958 | 277,559 | (3,944 | ) | ||||||||
| Antero Resources Corp. | 8,721 | 187,477 | 2,641 | |||||||||
| Anthem, Inc. | 100,824 | 15,648,648 | (1,589,750 | ) | ||||||||
| AO Smith Corp. | 65,436 | 4,490,191 | 522,861 | |||||||||
| Apollo Education Group, Inc. | 182,858 | 2,103,474 | (700,953 | ) | ||||||||
| Applied Materials, Inc. | 6,042 | 115,000 | (2,196 | ) | ||||||||
| AptarGroup, Inc. | 185 | 13,637 | (197 | ) | ||||||||
| Aramark | 1,711 | 54,489 | 691 | |||||||||
| Archer-Daniels-Midland Co. | 335,900 | 15,730,390 | (3,409,578 | ) | ||||||||
| Arrow Electronics, Inc. | 59,616 | 3,292,564 | (62,569 | ) | ||||||||
| Arthur J Gallagher & Co. | 56,956 | 2,599,884 | (268,105 | ) | ||||||||
| Ascena Retail Group, Inc. | 120,818 | 1,458,134 | (268,077 | ) | ||||||||
| Ashland, Inc. | 91,825 | 10,314,133 | (883,705 | ) | ||||||||
| Aspen Insurance Holdings Ltd. | 76,697 | 3,723,737 | (19,272 | ) | ||||||||
| Associated Banc-Corp. | 19,237 | 375,075 | (14,381 | ) | ||||||||
| Assurant, Inc. | 158,608 | 11,823,359 | 950,929 | |||||||||
| Atmel Corp. | 222,562 | 1,932,491 | (16,232 | ) | ||||||||
| Atmos Energy Corp. | 5,300 | 284,080 | 50,032 | |||||||||
| AutoNation, Inc. | 6,330 | 409,582 | (31,934 | ) | ||||||||
| Avery Dennison Corp. | 90,126 | 5,440,516 | 206,780 | |||||||||
| Avnet, Inc. | 153,955 | 6,519,204 | 76,228 | |||||||||
| Axis Capital Holdings Ltd. | 51,270 | 2,769,336 | 113,063 | |||||||||
| Bank of America Corp. | 29,689 | 525,813 | (26,147 | ) | ||||||||
| Bank of New York Mellon Corp./The | 37,646 | 1,645,846 | (94,078 | ) | ||||||||
| Baxter International, Inc. | 72,047 | 2,711,161 | 37,432 | |||||||||
| Bemis Co., Inc. | 75,631 | 3,251,658 | 128,291 | |||||||||
| Best Buy Co., Inc. | 196,025 | 6,427,853 | (458,892 | ) | ||||||||
| Big Lots, Inc. | 126,562 | 5,511,531 | (633,831 | ) | ||||||||
| Biogen, Inc. | 30,388 | 10,518,286 | (1,208,922 | ) | ||||||||
| BioMarin Pharmaceutical, Inc. | 5,859 | 683,939 | (70,150 | ) | ||||||||
| Bio-Rad Laboratories, Inc. | 8,769 | 1,234,494 | (18,585 | ) | ||||||||
| Boeing Co./The | 27,279 | 3,733,559 | 210,712 | |||||||||
| BOK Financial Corp. | 2,370 | 158,711 | (17,008 | ) | ||||||||
| Booz Allen Hamilton Holding Corp. | 24,438 | 649,220 | 104,692 | |||||||||
| Boston Scientific Corp. | 353,463 | 6,175,950 | 341,908 | |||||||||
| Brinker International, Inc. | 58,838 | 3,051,412 | (230,130 | ) | ||||||||
| Broadridge Financial Solutions, Inc. | 78,538 | 4,219,580 | 267 | |||||||||
| REFERENCE ENTITY | SHARES | NOTIONAL (a) | NET UNREALIZED APPRECIATION (DEPRECIATION) | |||||||||
| United States (continued) | ||||||||||||
| Brocade Communications Systems, Inc. | 1,648,240 | $ | 16,980,312 | $ | (1,849,469 | ) | ||||||
| Brown & Brown, Inc. | 6,008 | 198,264 | (5,407 | ) | ||||||||
| Bunge Ltd. | 225,969 | 17,531,187 | (2,102,024 | ) | ||||||||
| BWX Technologies, Inc. | 134,361 | 3,743,377 | 525,272 | |||||||||
| CA, Inc. | 264,574 | 7,933,034 | (376,800 | ) | ||||||||
| Cable One, Inc. | 863 | 384,267 | (10,019 | ) | ||||||||
| Cabot Corp. | 82,976 | 3,003,669 | 388,390 | |||||||||
| Cabot Oil & Gas Corp. | 71,922 | 1,331,852 | (59,552 | ) | ||||||||
| California Resources Corp. | 835,322 | 3,221,285 | (1,274,984 | ) | ||||||||
| Capital One Financial Corp. | 153,944 | 13,316,926 | (2,205,248 | ) | ||||||||
| Cardinal Health, Inc. | 87,660 | 7,458,676 | 366,732 | |||||||||
| Carlisle Cos., Inc. | 45,673 | 4,510,649 | (459,911 | ) | ||||||||
| Carnival Corp. | 382,885 | 19,720,372 | 1,139,202 | |||||||||
| Carter’s, Inc. | 82,288 | 8,189,679 | (863,578 | ) | ||||||||
| Casey’s General Stores, Inc. | 8,225 | 866,396 | 124,305 | |||||||||
| Catalent, Inc. | 3,905 | 98,045 | (303 | ) | ||||||||
| CDK Global, Inc. | 38,676 | 1,907,620 | (71,670 | ) | ||||||||
| CDW Corp. | 52,337 | 1,967,258 | 232,989 | |||||||||
| CEB, Inc. | 23,324 | 1,873,988 | (442,128 | ) | ||||||||
| CenterPoint Energy, Inc. | 119,427 | 2,191,668 | 1,011 | |||||||||
| CenturyLink, Inc. | 39,614 | 1,083,541 | (86,853 | ) | ||||||||
| CF Industries Holdings, Inc. | 184,193 | 11,138,929 | (3,622,013 | ) | ||||||||
| Charles River Laboratories International, Inc. | 61,282 | 4,455,688 | 470,772 | |||||||||
| Charter Communications, Inc. | 9,458 | 1,752,284 | (20,524 | ) | ||||||||
| Cheesecake Factory, Inc./The | 21,208 | 1,107,943 | (130,043 | ) | ||||||||
| Chesapeake Energy Corp. | 57,445 | 234,702 | 23,801 | |||||||||
| Chico’s FAS, Inc. | 319,644 | 4,718,771 | (1,308,170 | ) | ||||||||
| Cinemark Holdings, Inc. | 69,627 | 2,739,390 | (411,759 | ) | ||||||||
| Cintas Corp. | 49,494 | 4,223,773 | 282,655 | |||||||||
| Cisco Systems, Inc. | 439,734 | 12,202,220 | (261,244 | ) | ||||||||
| Citigroup, Inc. | 81,963 | 4,772,721 | (531,136 | ) | ||||||||
| Citizens Financial Group, Inc. | 415,258 | 10,534,188 | 341,419 | |||||||||
| Citrix Systems, Inc. | 134,592 | 9,658,207 | 523,678 | |||||||||
| Cleco Corp. | 32,096 | 1,719,627 | (43,895 | ) | ||||||||
| Columbia Pipeline Group, Inc. | 17,450 | 335,005 | 13,995 | |||||||||
| Comcast Corp. | 51,505 | 3,156,020 | (249,593 | ) | ||||||||
| Comerica, Inc. | 20,464 | 934,884 | (78,875 | ) | ||||||||
| Commercial Metals Co. | 311,083 | 4,745,149 | (486,422 | ) | ||||||||
| Community Health Systems, Inc. | 71,645 | 2,756,447 | (855,705 | ) | ||||||||
| Computer Sciences Corp. | 322,189 | 11,385,127 | (855,990 | ) | ||||||||
| The accompanying notes are an integral part of these financial statements. | (Continued) |
| AQR Funds | Annual Report | December 2015 | ||||||||||||||
205
Table of Contents
| Consolidated Schedule of Investments | December 31, 2015 |
| AQR MULTI-STRATEGY ALTERNATIVE FUND |
| REFERENCE ENTITY | SHARES | NOTIONAL (a) | NET UNREALIZED APPRECIATION (DEPRECIATION) | |||||||||
| United States (continued) | ||||||||||||
| ConAgra Foods, Inc. | 292,010 | $ | 12,229,768 | $ | 81,373 | |||||||
| ConocoPhillips | 10,963 | 582,859 | (70,996 | ) | ||||||||
| Consolidated Edison, Inc. | 170,371 | 10,659,067 | 290,678 | |||||||||
| Constellation Brands, Inc. | 4,631 | 657,887 | 1,753 | |||||||||
| Convergys Corp. | 57,302 | 1,409,449 | 16,797 | |||||||||
| CoreLogic, Inc. | 94,278 | 3,763,440 | (571,187 | ) | ||||||||
| Costco Wholesale Corp. | 26,446 | 3,838,017 | 433,012 | |||||||||
| Coty, Inc. | 46,487 | 1,290,879 | (99,418 | ) | ||||||||
| CR Bard, Inc. | 109,732 | 20,384,864 | 402,766 | |||||||||
| Cracker Barrel Old Country Store, Inc. | 10,618 | 1,468,686 | (122,005 | ) | ||||||||
| Crane Co. | 99,136 | 5,345,803 | (603,136 | ) | ||||||||
| Credit Acceptance Corp. | 2,561 | 571,557 | (23,452 | ) | ||||||||
| Crown Holdings, Inc. | 204,031 | 10,444,577 | (100,205 | ) | ||||||||
| CSRA, Inc. | 200,990 | 5,643,907 | 385,793 | |||||||||
| CSX Corp. | 703,806 | 21,494,108 | (3,230,342 | ) | ||||||||
| Cummins, Inc. | 44,125 | 5,266,047 | (1,382,606 | ) | ||||||||
| CVS Health Corp. | 20,705 | 2,278,792 | (254,464 | ) | ||||||||
| Darden Restaurants, Inc. | 216,380 | 13,260,325 | 510,099 | |||||||||
| Dean Foods Co. | 114,188 | 2,078,061 | (119,737 | ) | ||||||||
| Deckers Outdoor Corp. | 56,147 | 3,522,943 | (872,804 | ) | ||||||||
| Delta Air Lines, Inc. | 7,973 | 365,001 | 39,151 | |||||||||
| Deluxe Corp. | 3,678 | 210,609 | (10,011 | ) | ||||||||
| DENTSPLY International, Inc. | 21,841 | 1,232,156 | 96,869 | |||||||||
| Devon Energy Corp. | 220,330 | 10,505,378 | (3,454,818 | ) | ||||||||
| Dick’s Sporting Goods, Inc. | 99,047 | 4,859,315 | (1,358,004 | ) | ||||||||
| Dillard’s, Inc. | 27,202 | 2,675,797 | (888,353 | ) | ||||||||
| Discover Financial Services | 207,062 | 11,938,175 | (835,510 | ) | ||||||||
| DISH Network Corp. | 94,536 | 6,167,058 | (761,490 | ) | ||||||||
| Dollar General Corp. | 55,796 | 4,473,115 | (463,056 | ) | ||||||||
| Domino’s Pizza, Inc. | 23,089 | 2,566,723 | 1,928 | |||||||||
| Dow Chemical Co./The | 215,297 | 10,976,195 | 107,295 | |||||||||
| DR Horton, Inc. | 94,695 | 2,869,243 | 163,838 | |||||||||
| Dr Pepper Snapple Group, Inc. | 67,566 | 5,339,791 | 957,360 | |||||||||
| DST Systems, Inc. | 73,606 | 9,157,149 | (761,648 | ) | ||||||||
| DTE Energy Co. | 64,726 | 4,962,259 | 228,119 | |||||||||
| Eagle Materials, Inc. | 1,677 | 100,115 | 1,226 | |||||||||
| East West Bancorp, Inc. | 47,777 | 1,958,401 | 27,211 | |||||||||
| Eaton Corp. PLC | 54,865 | 3,084,934 | (229,759 | ) | ||||||||
| eBay, Inc. | 186,823 | 4,818,016 | 315,880 | |||||||||
| EchoStar Corp. | 20,524 | 947,605 | (144,912 | ) | ||||||||
| Edgewell Personal Care Co. | 5,419 | 475,050 | (50,363 | ) | ||||||||
| Edison International | 67,128 | 4,032,749 | (58,100 | ) | ||||||||
| Edwards Lifesciences Corp. | 225,394 | 17,565,940 | 235,678 | |||||||||
| REFERENCE ENTITY | SHARES | NOTIONAL (a) | NET UNREALIZED APPRECIATION (DEPRECIATION) | |||||||||
| United States (continued) | ||||||||||||
| Electronic Arts, Inc. | 157,156 | $ | 11,566,706 | $ | (766,945 | ) | ||||||
| Eli Lilly & Co. | 40,191 | 3,359,886 | 26,608 | |||||||||
| Emerson Electric Co. | 44,822 | 2,164,744 | (20,908 | ) | ||||||||
| Endurance Specialty Holdings Ltd. | 22,867 | 1,463,850 | (591 | ) | ||||||||
| Energen Corp. | 23,486 | 1,331,272 | (368,581 | ) | ||||||||
| Entergy Corp. | 115,411 | 8,109,679 | (220,183 | ) | ||||||||
| EP Energy Corp. | 680,593 | 4,607,186 | (1,626,188 | ) | ||||||||
| EQT Corp. | 13,659 | 751,574 | (39,531 | ) | ||||||||
| Equifax, Inc. | 51,781 | 5,232,264 | 534,586 | |||||||||
| Estee Lauder Cos., Inc./The | 10,831 | 878,743 | 75,035 | |||||||||
| Everest Re Group Ltd. | 46,994 | 8,727,874 | (123,743 | ) | ||||||||
| Exelon Corp. | 108,830 | 3,017,737 | 4,473 | |||||||||
| Expedia, Inc. | 52,419 | 6,206,270 | 309,412 | |||||||||
| Fair Isaac Corp. | 23,543 | 2,140,506 | 76,773 | |||||||||
| Fairchild Semiconductor International, Inc. | 43,804 | 661,631 | 245,550 | |||||||||
| Fidelity National Information Services, Inc. | 68,554 | 4,373,745 | (219,373 | ) | ||||||||
| Fifth Third Bancorp | 7,530 | 151,769 | (416 | ) | ||||||||
| FireEye, Inc. | 141,202 | 4,241,692 | (1,313,163 | ) | ||||||||
| First Niagara Financial Group, Inc. | 89,120 | 926,465 | 40,487 | |||||||||
| First Solar, Inc. | 152,611 | 7,516,684 | 2,554,116 | |||||||||
| FirstEnergy Corp. | 175,358 | 5,771,172 | (207,063 | ) | ||||||||
| Fiserv, Inc. | 30,889 | 2,698,154 | 126,954 | |||||||||
| FMC Technologies, Inc. | 10,892 | 363,782 | (47,805 | ) | ||||||||
| Foot Locker, Inc. | 95,727 | 6,662,894 | (432,024 | ) | ||||||||
| Fortinet, Inc. | 65,539 | 2,785,644 | (742,793 | ) | ||||||||
| Four Corners Property Trust, Inc. | 71,934 | 1,545,731 | 192,194 | |||||||||
| Fulton Financial Corp. | 55,802 | 730,516 | (4,532 | ) | ||||||||
| GameStop Corp. | 228,271 | 9,976,920 | (3,576,201 | ) | ||||||||
| Gartner, Inc. | 22,498 | 1,945,560 | 95,008 | |||||||||
| General Dynamics Corp. | 147,331 | 21,479,725 | (1,242,339 | ) | ||||||||
| General Motors Co. | 208,971 | 6,949,582 | 157,522 | |||||||||
| Genpact Ltd. | 143,740 | 3,339,242 | 251,383 | |||||||||
| Genuine Parts Co. | 3,128 | 267,384 | 1,280 | |||||||||
| Gilead Sciences, Inc. | 83,904 | 9,892,539 | (1,402,294 | ) | ||||||||
| GNC Holdings, Inc. | 163,585 | 6,307,080 | (1,232,673 | ) | ||||||||
| Goldman Sachs Group, Inc./The | 76,291 | 16,100,740 | (2,350,814 | ) | ||||||||
| Goodyear Tire & Rubber Co./The | 287,914 | 8,732,624 | 673,526 | |||||||||
| GoPro, Inc. | 12,027 | 221,361 | (4,754 | ) | ||||||||
| Graham Holdings Co. | 10,052 | 6,645,747 | (1,770,829 | ) | ||||||||
| Graphic Packaging Holding Co. | 18,370 | 247,967 | (12,280 | ) | ||||||||
| Great Plains Energy, Inc. | 63,325 | 1,627,921 | 101,484 | |||||||||
| Groupon, Inc. | 1,169,950 | 5,185,856 | (1,594,110 | ) | ||||||||
| Guess?, Inc. | 99,566 | 2,198,686 | (318,880 | ) | ||||||||
| The accompanying notes are an integral part of these financial statements. | (Continued) |
| AQR Funds | Annual Report | December 2015 | ||||||||||||||
206
Table of Contents
| Consolidated Schedule of Investments | December 31, 2015 |
| AQR MULTI-STRATEGY ALTERNATIVE FUND |
| REFERENCE ENTITY | SHARES | NOTIONAL (a) | NET UNREALIZED APPRECIATION (DEPRECIATION) | |||||||||
| United States (continued) | ||||||||||||
| H&R Block, Inc. | 9,279 | $ | 305,340 | $ | 3,744 | |||||||
| Hanover Insurance Group, Inc./The | 53,296 | 4,221,864 | 113,233 | |||||||||
| Harman International Industries, Inc. | 119,360 | 12,536,516 | (1,291,611 | ) | ||||||||
| Harsco Corp. | 99,831 | 1,398,044 | (611,376 | ) | ||||||||
| Hartford Financial Services Group, Inc./The | 62,125 | 2,901,203 | (201,251 | ) | ||||||||
| Hasbro, Inc. | 50,711 | 3,949,552 | (533,659 | ) | ||||||||
| HCA Holdings, Inc. | 200,900 | 17,363,175 | (3,776,308 | ) | ||||||||
| HD Supply Holdings, Inc. | 267,284 | 8,960,661 | (934,123 | ) | ||||||||
| Helix Energy Solutions Group, Inc. | 128,781 | 1,018,082 | (340,694 | ) | ||||||||
| Herman Miller, Inc. | 40,333 | 1,249,872 | (92,315 | ) | ||||||||
| Hertz Global Holdings, Inc. | 112,491 | 1,707,137 | (106,390 | ) | ||||||||
| Hess Corp. | 67,997 | 3,992,299 | (695,805 | ) | ||||||||
| Hill-Rom Holdings, Inc. | 33,643 | 1,863,781 | (246,899 | ) | ||||||||
| Hilton Worldwide Holdings, Inc. | 329,835 | 8,738,789 | (1,680,320 | ) | ||||||||
| HNI Corp. | 15,183 | 693,574 | (146,075 | ) | ||||||||
| HollyFrontier Corp. | 380,154 | 18,620,888 | (3,456,545 | ) | ||||||||
| Hologic, Inc. | 244,646 | 9,431,063 | 34,290 | |||||||||
| Home Depot, Inc./The | 17,448 | 1,986,629 | 320,869 | |||||||||
| Hormel Foods Corp. | 11,251 | 692,700 | 197,029 | |||||||||
| Howard Hughes Corp./The | 2,585 | 287,227 | 5,292 | |||||||||
| HP, Inc. | 754,824 | 9,875,119 | (938,002 | ) | ||||||||
| Hubbell, Inc. | 16,551 | 1,685,341 | (13,028 | ) | ||||||||
| Huntington Bancshares, Inc. | 183,130 | 2,126,327 | (100,909 | ) | ||||||||
| Huntington Ingalls Industries, Inc. | 129,491 | 14,994,783 | 1,431,150 | |||||||||
| Hyatt Hotels Corp. | 13,364 | 724,172 | (95,796 | ) | ||||||||
| IAC/InterActiveCorp. | 168,792 | 13,108,891 | (2,972,932 | ) | ||||||||
| IDACORP, Inc. | 13,348 | 823,983 | 83,681 | |||||||||
| IDEX Corp. | 2,058 | 156,861 | 803 | |||||||||
| Illinois Tool Works, Inc. | 10,508 | 968,392 | 5,489 | |||||||||
| IMS Health Holdings, Inc. | 83,629 | 2,424,921 | (294,891 | ) | ||||||||
| Ingersoll-Rand PLC | 105,219 | 6,858,691 | (1,041,133 | ) | ||||||||
| Ingram Micro, Inc. | 344,312 | 9,332,853 | 1,127,345 | |||||||||
| Ingredion, Inc. | 47,236 | 3,995,992 | 531,106 | |||||||||
| Integrated Device Technology, Inc. | 383,930 | 7,911,687 | 2,204,868 | |||||||||
| International Game Technology PLC | 220,269 | 3,945,480 | (381,527 | ) | ||||||||
| International Paper Co. | 549 | 20,691 | 7 | |||||||||
| Interpublic Group of Cos., Inc./The | 227,685 | 4,509,490 | 791,017 | |||||||||
| Intersil Corp. | 108,550 | 1,297,288 | 87,810 | |||||||||
| Invesco Ltd. | 154,157 | 5,831,193 | (670,016 | ) | ||||||||
| Ionis Pharmaceuticals, Inc. | 111,556 | 4,930,258 | 1,978,405 | |||||||||
| REFERENCE ENTITY | SHARES | NOTIONAL (a) | NET UNREALIZED APPRECIATION (DEPRECIATION) | |||||||||
| United States (continued) | ||||||||||||
| ITT Corp. | 225,406 | $ | 8,440,877 | $ | (254,131 | ) | ||||||
| Jabil Circuit, Inc. | 525,561 | 10,526,376 | 1,713,940 | |||||||||
| Jack Henry & Associates, Inc. | 5,886 | 416,598 | 42,863 | |||||||||
| Jack in the Box, Inc. | 23,832 | 1,796,027 | 32,126 | |||||||||
| John Wiley & Sons, Inc. | 55,024 | 2,827,952 | (350,221 | ) | ||||||||
| Johnson Controls, Inc. | 104,075 | 4,870,485 | (760,564 | ) | ||||||||
| JPMorgan Chase & Co. | 46,012 | 3,178,808 | (140,635 | ) | ||||||||
| Juniper Networks, Inc. | 259,097 | 7,886,716 | (735,638 | ) | ||||||||
| KAR Auction Services, Inc. | 50,912 | 1,948,118 | (62,847 | ) | ||||||||
| Kate Spade & Co. | 21,786 | 417,647 | (30,510 | ) | ||||||||
| KBR, Inc. | 455,890 | 8,270,961 | (557,302 | ) | ||||||||
| KeyCorp. | 277,793 | 4,078,571 | (414,481 | ) | ||||||||
| Keysight Technologies, Inc. | 83,542 | 2,624,939 | (258,194 | ) | ||||||||
| Kimberly-Clark Corp. | 79,406 | 8,945,051 | 1,163,333 | |||||||||
| Kirby Corp. | 3,864 | 207,071 | (3,747 | ) | ||||||||
| Kroger Co./The | 120,895 | 4,710,069 | 346,969 | |||||||||
| L Brands, Inc. | 40,792 | 3,395,205 | 513,484 | |||||||||
| L-3 Communications Holdings, Inc. | 60,115 | 7,198,123 | (13,779 | ) | ||||||||
| Lancaster Colony Corp. | 3,729 | 386,425 | 44,126 | |||||||||
| Laredo Petroleum, Inc. | 14,858 | 116,152 | 2,563 | |||||||||
| Lear Corp. | 75,091 | 7,558,221 | 1,665,207 | |||||||||
| Leggett & Platt, Inc. | 113,098 | 4,956,196 | (203,818 | ) | ||||||||
| Leidos Holdings, Inc. | 115,790 | 5,182,759 | 1,331,587 | |||||||||
| Lennox International, Inc. | 9,742 | 1,166,362 | 50,414 | |||||||||
| Liberty Broadband Corp. | 24,402 | 1,324,567 | (59,079 | ) | ||||||||
| Liberty Interactive Corp. QVC Group | 79,367 | 2,201,301 | (32,995 | ) | ||||||||
| LifePoint Health, Inc. | 18,124 | 1,369,096 | (38,795 | ) | ||||||||
| Lincoln Electric Holdings, Inc. | 78,537 | 4,590,934 | (515,649 | ) | ||||||||
| Lincoln National Corp. | 70,255 | 3,704,319 | (173,303 | ) | ||||||||
| LinkedIn Corp. | 1,544 | 375,586 | (28,063 | ) | ||||||||
| Live Nation Entertainment, Inc. | 133,458 | 3,480,076 | (201,013 | ) | ||||||||
| Lockheed Martin Corp. | 20,346 | 4,133,290 | 284,844 | |||||||||
| Lowe’s Cos., Inc. | 164,671 | 11,106,301 | 1,415,282 | |||||||||
| Lumentum Holdings, Inc. | 3,483 | 61,711 | 14,985 | |||||||||
| LyondellBasell Industries NV | 160,777 | 15,397,329 | (1,425,808 | ) | ||||||||
| M&T Bank Corp. | 14,198 | 1,677,239 | 43,274 | |||||||||
| Macy’s, Inc. | 214,358 | 12,797,880 | (5,299,637 | ) | ||||||||
| Mallinckrodt PLC | 166,624 | 14,218,992 | (1,783,843 | ) | ||||||||
| Manhattan Associates, Inc. | 36,144 | 2,365,377 | 26,272 | |||||||||
| ManpowerGroup, Inc. | 90,070 | 8,049,142 | (457,142 | ) | ||||||||
| Marathon Oil Corp. | 362,085 | 6,880,666 | (2,322,016 | ) | ||||||||
| Marathon Petroleum Corp. | 477,006 | 26,348,842 | (1,620,851 | ) | ||||||||
| The accompanying notes are an integral part of these financial statements. | (Continued) |
| AQR Funds | Annual Report | December 2015 | ||||||||||||||
207
Table of Contents
| Consolidated Schedule of Investments | December 31, 2015 |
| AQR MULTI-STRATEGY ALTERNATIVE FUND |
| REFERENCE ENTITY | SHARES | NOTIONAL (a) | NET UNREALIZED APPRECIATION (DEPRECIATION) | |||||||||
| United States (continued) | ||||||||||||
| Marvell Technology Group Ltd. | 1,900,989 | $ | 20,263,800 | $ | (3,497,077 | ) | ||||||
| Masco Corp. | 536,871 | 13,168,642 | 2,024,808 | |||||||||
| Maxim Integrated Products, Inc. | 184,900 | 6,643,063 | 383,137 | |||||||||
| MAXIMUS, Inc. | 2,938 | 178,988 | (13,726 | ) | ||||||||
| McGraw Hill Financial, Inc. | 66,114 | 6,640,228 | (122,710 | ) | ||||||||
| McKesson Corp. | 106,024 | 22,960,630 | (2,049,517 | ) | ||||||||
| Medivation, Inc. | 178,315 | 7,831,141 | 788,606 | |||||||||
| Mentor Graphics Corp. | 31,450 | 571,756 | 7,553 | |||||||||
| Merck & Co., Inc. | 80,910 | 4,734,662 | (460,996 | ) | ||||||||
| MetLife, Inc. | 95,353 | 4,975,304 | (378,336 | ) | ||||||||
| Michaels Cos., Inc./The | 43,692 | 1,074,915 | (108,885 | ) | ||||||||
| Micron Technology, Inc. | 155,985 | 2,720,774 | (512,027 | ) | ||||||||
| Microsoft Corp. | 108,792 | 5,179,414 | 856,366 | |||||||||
| Minerals Technologies, Inc. | 39,770 | 2,116,068 | (292,216 | ) | ||||||||
| Mohawk Industries, Inc. | 69,613 | 13,651,000 | (466,994 | ) | ||||||||
| Molina Healthcare, Inc. | 18,222 | 1,144,552 | (48,863 | ) | ||||||||
| Molson Coors Brewing Co. | 32,867 | 2,882,996 | 203,872 | |||||||||
| Mondelez International, Inc. | 305,126 | 12,952,392 | 729,457 | |||||||||
| Monster Beverage Corp. | 39,365 | 5,670,528 | 193,282 | |||||||||
| Mosaic Co./The | 177,454 | 5,746,060 | (850,104 | ) | ||||||||
| MSCI, Inc. | 25,768 | 1,599,587 | 259,059 | |||||||||
| MSG Networks, Inc. | 76,319 | 1,590,369 | (2,933 | ) | ||||||||
| Murphy Oil Corp. | 175,886 | 4,900,893 | (952,253 | ) | ||||||||
| Murphy USA, Inc. | 100,676 | 5,637,772 | 477,288 | |||||||||
| Nabors Industries Ltd. | 1,257,311 | 14,309,102 | (3,609,385 | ) | ||||||||
| Nasdaq, Inc. | 109,826 | 5,848,784 | 539,794 | |||||||||
| NCR Corp. | 270,306 | 6,962,285 | (350,600 | ) | ||||||||
| NetApp, Inc. | 9,877 | 273,110 | (11,073 | ) | ||||||||
| NeuStar, Inc. | 13,593 | 348,916 | (23,092 | ) | ||||||||
| New York Times Co./The | 6,639 | 87,615 | 1,480 | |||||||||
| News Corp. | 480,926 | 6,812,121 | (386,949 | ) | ||||||||
| NIKE, Inc. | 184,050 | 10,471,343 | 1,031,782 | |||||||||
| NiSource, Inc. | 211,408 | 4,060,939 | 63,631 | |||||||||
| Nordstrom, Inc. | 17,735 | 998,357 | (114,977 | ) | ||||||||
| Northern Trust Corp. | 2,779 | 207,233 | (6,894 | ) | ||||||||
| Northrop Grumman Corp. | 84,302 | 14,122,900 | 1,794,161 | |||||||||
| NorthStar Asset Management Group, Inc. | 274,851 | 4,485,487 | (1,148,796 | ) | ||||||||
| NOW, Inc. | 15,344 | 254,305 | (11,563 | ) | ||||||||
| Nucor Corp. | 84,963 | 3,552,408 | (128,400 | ) | ||||||||
| NVR, Inc. | 686 | 1,115,090 | 12,008 | |||||||||
| Oil States International, Inc. | 206,225 | 6,275,681 | (656,050 | ) | ||||||||
| Old Dominion Freight Line, Inc. | 14,281 | 975,206 | (131,627 | ) | ||||||||
| REFERENCE ENTITY | SHARES | NOTIONAL (a) | NET UNREALIZED APPRECIATION (DEPRECIATION) | |||||||||
| United States (continued) | ||||||||||||
| Old Republic International Corp. | 69,495 | $ | 1,202,329 | $ | 92,363 | |||||||
| Omnicom Group, Inc. | 57,444 | 4,131,609 | 214,604 | |||||||||
| ON Semiconductor Corp. | 349,880 | 3,790,390 | (361,566 | ) | ||||||||
| OPKO Health, Inc. | 217,135 | 1,978,999 | 203,208 | |||||||||
| Orbital ATK, Inc. | 118,646 | 8,790,372 | 1,809,462 | |||||||||
| Owens Corning | 168,208 | 7,412,366 | 498,456 | |||||||||
| Owens-Illinois, Inc. | 80,101 | 1,658,540 | (263,181 | ) | ||||||||
| PACCAR, Inc. | 55,329 | 3,310,271 | (687,676 | ) | ||||||||
| Packaging Corp. of America | 32,690 | 2,139,335 | (78,230 | ) | ||||||||
| Parker-Hannifin Corp. | 22,951 | 2,506,440 | (280,652 | ) | ||||||||
| Patterson-UTI Energy, Inc. | 23,770 | 367,514 | (9,062 | ) | ||||||||
| PBF Energy, Inc. | 78,280 | 2,580,804 | 300,683 | |||||||||
| People’s United Financial, Inc. | 337,765 | 5,403,597 | 51,307 | |||||||||
| PepsiCo, Inc. | 126,415 | 12,319,351 | 312,036 | |||||||||
| Pfizer, Inc. | 395,737 | 13,912,431 | (1,138,040 | ) | ||||||||
| PG&E Corp. | 166,695 | 8,607,149 | 259,358 | |||||||||
| Phillips 66 | 60,233 | 5,054,023 | (126,964 | ) | ||||||||
| Pilgrim’s Pride Corp. | 277,965 | 5,766,384 | 373,863 | |||||||||
| Pinnacle Foods, Inc. | 60,890 | 2,681,820 | (96,431 | ) | ||||||||
| Pinnacle West Capital Corp. | 168,577 | 10,357,732 | 512,113 | |||||||||
| Pitney Bowes, Inc. | 57,264 | 1,174,575 | 7,927 | |||||||||
| Plantronics, Inc. | 7,914 | 419,203 | (43,921 | ) | ||||||||
| PNC Financial Services Group, Inc./The | 133,404 | 12,918,088 | (203,353 | ) | ||||||||
| PNM Resources, Inc. | 103,219 | 2,751,063 | 404,342 | |||||||||
| Polycom, Inc. | 301,262 | 3,400,528 | 392,361 | |||||||||
| PPG Industries, Inc. | 73,373 | 7,934,131 | (683,412 | ) | ||||||||
| ProAssurance Corp. | 23,143 | 1,145,686 | (22,557 | ) | ||||||||
| Procter & Gamble Co./The | 101,124 | 8,078,485 | (48,228 | ) | ||||||||
| Prudential Financial, Inc. | 26,683 | 2,334,945 | (162,682 | ) | ||||||||
| PTC, Inc. | 46,595 | 1,706,289 | (92,704 | ) | ||||||||
| Public Service Enterprise Group, Inc. | 435,465 | 17,805,589 | (957,448 | ) | ||||||||
| PulteGroup, Inc. | 109,315 | 2,098,080 | (150,087 | ) | ||||||||
| PVH Corp. | 36,294 | 3,365,746 | (692,693 | ) | ||||||||
| QEP Resources, Inc. | 316,328 | 4,713,138 | (474,342 | ) | ||||||||
| Quintiles Transnational Holdings, Inc. | 54,187 | 3,708,879 | 11,600 | |||||||||
| Rackspace Hosting, Inc. | 124,378 | 3,646,844 | (497,593 | ) | ||||||||
| Raymond James Financial, Inc. | 30,710 | 1,565,039 | 215,220 | |||||||||
| Raytheon Co. | 53,619 | 5,904,576 | 772,598 | |||||||||
| Red Hat, Inc. | 25,404 | 1,970,183 | 133,522 | |||||||||
| Regal Beloit Corp. | 10,630 | 691,494 | (69,426 | ) | ||||||||
| Regions Financial Corp. | 73,110 | 745,825 | (43,969 | ) | ||||||||
| Reinsurance Group of America, Inc. | 60,342 | 5,784,503 | (622,245 | ) | ||||||||
| The accompanying notes are an integral part of these financial statements. | (Continued) |
| AQR Funds | Annual Report | December 2015 | ||||||||||||||
208
Table of Contents
| Consolidated Schedule of Investments | December 31, 2015 |
| AQR MULTI-STRATEGY ALTERNATIVE FUND |
| REFERENCE ENTITY | SHARES | NOTIONAL (a) | NET UNREALIZED APPRECIATION (DEPRECIATION) | |||||||||
| United States (continued) | ||||||||||||
| Reliance Steel & Aluminum Co. | 108,599 | $ | 6,328,072 | $ | (39,103 | ) | ||||||
| Republic Services, Inc. | 138,939 | 5,737,689 | 374,237 | |||||||||
| Robert Half International, Inc. | 38,761 | 2,028,715 | (201,522 | ) | ||||||||
| Rockwell Automation, Inc. | 52,369 | 5,652,649 | (279,066 | ) | ||||||||
| Ross Stores, Inc. | 93,861 | 4,943,628 | 107,032 | |||||||||
| Rowan Cos. PLC | 294,253 | 5,757,119 | (769,531 | ) | ||||||||
| RPC, Inc. | 48,716 | 598,224 | (16,068 | ) | ||||||||
| Ryder System, Inc. | 25,521 | 2,294,865 | (844,506 | ) | ||||||||
| Sabre Corp. | 68,799 | 1,973,577 | (49,269 | ) | ||||||||
| Scotts Miracle-Gro Co./The | 4,420 | 292,874 | (7,739 | ) | ||||||||
| Sealed Air Corp. | 1,957 | 88,903 | (1,621 | ) | ||||||||
| Sears Holdings Corp. | 18,059 | 415,257 | (43,964 | ) | ||||||||
| SEI Investments Co. | 126,567 | 6,306,290 | 325,821 | |||||||||
| Sempra Energy | 28,840 | 2,891,288 | (180,040 | ) | ||||||||
| Sensient Technologies Corp. | 20,704 | 1,339,752 | (39,126 | ) | ||||||||
| Service Corp. International | 38,831 | 1,086,801 | (76,418 | ) | ||||||||
| ServiceMaster Global Holdings, Inc. | 8,148 | 287,687 | 32,040 | |||||||||
| Sherwin-Williams Co./The | 8,170 | 2,231,760 | (110,828 | ) | ||||||||
| Signature Bank | 28,291 | 4,042,399 | 296,592 | |||||||||
| Signet Jewelers Ltd. | 15,098 | 2,057,385 | (189,913 | ) | ||||||||
| Skechers U.S.A., Inc. | 210,311 | 7,461,066 | (1,107,571 | ) | ||||||||
| Snap-on, Inc. | 24,932 | 4,003,815 | 270,278 | |||||||||
| Sonoco Products Co. | 14,451 | 591,639 | (1,026 | ) | ||||||||
| Spirit AeroSystems Holdings, Inc. | 289,982 | 15,417,981 | (898,583 | ) | ||||||||
| Spirit Airlines, Inc. | 12,795 | 494,204 | 15,677 | |||||||||
| Sprint Corp. | 74,889 | 275,962 | (4,864 | ) | ||||||||
| SPX Corp. | 116,035 | 1,460,457 | (377,851 | ) | ||||||||
| SPX FLOW, Inc. | 9,852 | 470,357 | (195,388 | ) | ||||||||
| SS&C Technologies Holdings, Inc. | 35,311 | 2,507,534 | (96,852 | ) | ||||||||
| St Jude Medical, Inc. | 83,579 | 5,497,524 | (334,849 | ) | ||||||||
| Stanley Black & Decker, Inc. | 7,532 | 768,587 | 35,303 | |||||||||
| Staples, Inc. | 643,386 | 9,203,787 | (3,110,921 | ) | ||||||||
| Starbucks Corp. | 63,384 | 3,576,638 | 228,304 | |||||||||
| Starwood Hotels & Resorts Worldwide, Inc. | 147,523 | 11,213,012 | (992,619 | ) | ||||||||
| Steel Dynamics, Inc. | 435,808 | 8,370,486 | (582,597 | ) | ||||||||
| Stifel Financial Corp. | 50,232 | 2,304,324 | (176,496 | ) | ||||||||
| Stryker Corp. | 37,016 | 3,626,034 | (185,767 | ) | ||||||||
| SunTrust Banks, Inc. | 134,670 | 5,836,088 | (66,825 | ) | ||||||||
| Superior Energy Services, Inc. | 576,219 | 10,448,376 | (2,686,707 | ) | ||||||||
| SUPERVALU, Inc. | 833,343 | 6,184,700 | (534,635 | ) | ||||||||
| SVB Financial Group | 21,525 | 2,622,678 | (63,355 | ) | ||||||||
| Synopsys, Inc. | 80,605 | 4,058,768 | (382,374 | ) | ||||||||
| Sysco Corp. | 39,661 | 1,538,078 | 88,023 | |||||||||
| REFERENCE ENTITY | SHARES | NOTIONAL (a) | NET UNREALIZED APPRECIATION (DEPRECIATION) | |||||||||
| United States (continued) | ||||||||||||
| Talen Energy Corp. | 99,598 | $ | 1,033,126 | $ | (412,630 | ) | ||||||
| Targa Resources Corp. | 52,394 | 2,327,744 | (909,962 | ) | ||||||||
| Target Corp. | 127,088 | 10,152,691 | (924,831 | ) | ||||||||
| TCF Financial Corp. | 86,192 | 1,320,194 | (103,163 | ) | ||||||||
| Tech Data Corp. | 109,195 | 6,999,506 | 248,858 | |||||||||
| TEGNA, Inc. | 105,735 | 3,060,242 | (361,884 | ) | ||||||||
| Teleflex, Inc. | 36,315 | 4,813,996 | (40,389 | ) | ||||||||
| Telephone & Data Systems, Inc. | 88,533 | 2,502,425 | (210,305 | ) | ||||||||
| Teradyne, Inc. | 311,080 | 5,954,895 | 475,128 | |||||||||
| TerraForm Power, Inc. | 74,623 | 870,260 | 68,498 | |||||||||
| Tesoro Corp. | 13,193 | 1,418,947 | (28,800 | ) | ||||||||
| Textron, Inc. | 36,096 | 1,560,439 | (44,046 | ) | ||||||||
| Thermo Fisher Scientific, Inc. | 37,928 | 5,182,953 | 197,133 | |||||||||
| Thomson Reuters Corp. | 19,442 | 775,392 | (39,513 | ) | ||||||||
| Thor Industries, Inc. | 8,020 | 442,626 | 7,697 | |||||||||
| Time, Inc. | 67,340 | 1,293,009 | (237,791 | ) | ||||||||
| Timken Co./The | 175,135 | 5,768,053 | (760,944 | ) | ||||||||
| TJX Cos., Inc./The | 129,943 | 8,907,883 | 306,375 | |||||||||
| Toll Brothers, Inc. | 216,247 | 7,976,505 | (775,480 | ) | ||||||||
| TopBuild Corp. | 40,104 | 1,175,745 | 58,255 | |||||||||
| Torchmark Corp. | 40,872 | 2,398,324 | (62,081 | ) | ||||||||
| Toro Co./The | 9,646 | 651,715 | 53,119 | |||||||||
| Total System Services, Inc. | 74,517 | 3,481,037 | 229,910 | |||||||||
| Travelers Cos., Inc./The | 113,342 | 11,701,264 | 1,090,514 | |||||||||
| Trinity Industries, Inc. | 8,922 | 222,468 | (8,161 | ) | ||||||||
| Trustmark Corp. | 17,704 | 421,242 | (13,342 | ) | ||||||||
| Tyco International PLC | 125,456 | 4,765,467 | (764,675 | ) | ||||||||
| Tyler Technologies, Inc. | 14,608 | 2,136,670 | 409,797 | |||||||||
| UGI Corp. | 72,204 | 2,576,580 | (138,973 | ) | ||||||||
| Ulta Salon Cosmetics & Fragrance, Inc. | 8,115 | 1,353,709 | 147,566 | |||||||||
| United Continental Holdings, Inc. | 292,140 | 16,113,413 | 626,209 | |||||||||
| United States Steel Corp. | 134,867 | 1,087,551 | (11,312 | ) | ||||||||
| United Therapeutics Corp. | 51,966 | 8,077,709 | 60,686 | |||||||||
| UnitedHealth Group, Inc. | 77,043 | 9,364,635 | (301,297 | ) | ||||||||
| Universal Health Services, Inc. | 91,001 | 12,330,927 | (1,457,218 | ) | ||||||||
| Unum Group | 209,672 | 7,517,290 | (537,309 | ) | ||||||||
| US Bancorp | 128,673 | 5,804,464 | (313,987 | ) | ||||||||
| Valero Energy Corp. | 221,953 | 14,719,923 | 974,374 | |||||||||
| Validus Holdings Ltd. | 99,081 | 4,462,836 | 123,624 | |||||||||
| Valmont Industries, Inc. | 5,625 | 629,257 | (32,894 | ) | ||||||||
| VCA, Inc. | 23,821 | 1,314,220 | (4,065 | ) | ||||||||
| Vectren Corp. | 22,663 | 925,649 | 35,716 | |||||||||
| VeriFone Systems, Inc. | 15,427 | 449,954 | (17,689 | ) | ||||||||
| Verizon Communications, Inc. | 17,432 | 818,781 | (13,074 | ) | ||||||||
| VF Corp. | 47,636 | 3,528,093 | (562,752 | ) | ||||||||
| Viacom, Inc. | 13,269 | 572,133 | (25,981 | ) | ||||||||
| The accompanying notes are an integral part of these financial statements. | (Continued) |
| AQR Funds | Annual Report | December 2015 | ||||||||||||||
209
Table of Contents
| Consolidated Schedule of Investments | December 31, 2015 |
| AQR MULTI-STRATEGY ALTERNATIVE FUND |
| REFERENCE ENTITY | SHARES | NOTIONAL (a) | NET UNREALIZED APPRECIATION (DEPRECIATION) | |||||||||
| United States (continued) | ||||||||||||
| Viavi Solutions, Inc. | 153,713 | $ | 891,560 | $ | 44,552 | |||||||
| Vista Outdoor, Inc. | 4,424 | 200,426 | (3,514 | ) | ||||||||
| Visteon Corp. | 47,835 | 5,261,985 | 215,122 | |||||||||
| VMware, Inc. | 2,886 | 164,459 | (1,198 | ) | ||||||||
| Voya Financial, Inc. | 118,141 | 5,015,669 | (655,084 | ) | ||||||||
| VWR Corp. | 430 | 11,411 | 762 | |||||||||
| WABCO Holdings, Inc. | 37,602 | 4,491,167 | (645,987 | ) | ||||||||
| Wal-Mart Stores, Inc. | 190,273 | 12,439,497 | (775,762 | ) | ||||||||
| Waste Management, Inc. | 333,194 | 16,872,740 | 909,824 | |||||||||
| Watsco, Inc. | 5,043 | 628,025 | (37,338 | ) | ||||||||
| Wells Fargo & Co. | 264,931 | 15,060,163 | (658,514 | ) | ||||||||
| Werner Enterprises, Inc. | 46,019 | 1,210,387 | (134,003 | ) | ||||||||
| WESCO International, Inc. | 26,347 | 1,262,837 | (112,000 | ) | ||||||||
| Western Digital Corp. | 114,550 | 8,361,304 | (1,482,576 | ) | ||||||||
| Western Refining, Inc. | 84,389 | 3,841,837 | (835,901 | ) | ||||||||
| Westlake Chemical Corp. | 84,432 | 5,004,604 | (418,258 | ) | ||||||||
| WGL Holdings, Inc. | 32,042 | 1,796,240 | 222,086 | |||||||||
| Whirlpool Corp. | 124,630 | 20,424,229 | (2,119,821 | ) | ||||||||
| White Mountains Insurance Group Ltd. | 840 | 666,986 | (56,465 | ) | ||||||||
| Worthington Industries, Inc. | 79,721 | 2,265,693 | 137,098 | |||||||||
| WPX Energy, Inc. | 433,178 | 3,991,538 | (1,505,097 | ) | ||||||||
| WW Grainger, Inc. | 8,657 | 1,924,317 | (170,495 | ) | ||||||||
| Wyndham Worldwide Corp. | 17,799 | 1,347,984 | (54,887 | ) | ||||||||
| Xerox Corp. | 812,465 | 8,540,874 | 95,629 | |||||||||
| Xilinx, Inc. | 187,584 | 8,400,136 | 410,685 | |||||||||
| Xylem, Inc. | 38,536 | 1,338,228 | 68,336 | |||||||||
| Yelp, Inc. | 72,202 | 1,698,135 | 381,283 | |||||||||
| Yum! Brands, Inc. | 213,285 | 16,399,758 | (819,289 | ) | ||||||||
| Zoetis, Inc. | 364,005 | 17,427,512 | 15,607 | |||||||||
| Zynga, Inc. | 1,797,650 | 4,444,881 | 372,821 | |||||||||
|
| |||||||||||
| (104,276,927 | ) | |||||||||||
|
| |||||||||||
Total of Long Equity Positions | (104,561,851 | ) | ||||||||||
|
| |||||||||||
| Short Positions | ||||||||||||
| Common Stocks | ||||||||||||
| Canada | ||||||||||||
| lululemon athletica, Inc. | (174,428 | ) | (10,248,906 | ) | 1,096,669 | |||||||
|
| |||||||||||
| Ireland | ||||||||||||
| Endo International PLC | (86,176 | ) | (6,732,350 | ) | 1,456,656 | |||||||
| Jazz Pharmaceuticals PLC | (49,797 | ) | (8,983,522 | ) | 1,984,055 | |||||||
| Medtronic PLC | (67,993 | ) | (4,755,202 | ) | (474,820 | ) | ||||||
| Perrigo Co. PLC | (7,807 | ) | (1,162,307 | ) | 32,634 | |||||||
|
| |||||||||||
| 2,998,525 | ||||||||||||
|
| |||||||||||
| REFERENCE ENTITY | SHARES | NOTIONAL (a) | NET UNREALIZED APPRECIATION (DEPRECIATION) | |||||||||
| Netherlands | ||||||||||||
| Core Laboratories NV | (69,167 | ) | $ | (7,170,931 | ) | $ | (350,288 | ) | ||||
| Frank’s International NV | (25,460 | ) | (427,645 | ) | 2,717 | |||||||
| QIAGEN NV | (78,202 | ) | (2,062,832 | ) | (99,454 | ) | ||||||
| Sensata Technologies Holding NV | (320,324 | ) | (15,539,310 | ) | 785,187 | |||||||
|
| |||||||||||
| 338,162 | ||||||||||||
|
| |||||||||||
| Norway | ||||||||||||
| Golar LNG Ltd. | (250,881 | ) | (9,632,665 | ) | 5,671,254 | |||||||
|
| |||||||||||
| Panama | ||||||||||||
| Copa Holdings SA | (21,504 | ) | (1,515,798 | ) | 478,015 | |||||||
|
| |||||||||||
| Singapore | ||||||||||||
| Avago Technologies Ltd. | (72,550 | ) | (8,964,456 | ) | (1,566,176 | ) | ||||||
|
| |||||||||||
| Sweden | ||||||||||||
| Autoliv, Inc. | (4,312 | ) | (523,409 | ) | (14,599 | ) | ||||||
|
| |||||||||||
| Switzerland | ||||||||||||
| ACE Ltd. | (22,212 | ) | (2,426,027 | ) | (169,445 | ) | ||||||
| Garmin Ltd. | (63,350 | ) | (2,496,009 | ) | 141,290 | |||||||
| Weatherford International PLC | (361,408 | ) | (3,603,393 | ) | 571,180 | |||||||
|
| |||||||||||
| 543,025 | ||||||||||||
|
| |||||||||||
| United Kingdom | ||||||||||||
| Aon PLC | (70,864 | ) | (6,484,047 | ) | (50,322 | ) | ||||||
| Ensco PLC | (137,493 | ) | (2,443,332 | ) | 327,315 | |||||||
| Pentair PLC | (110,622 | ) | (6,253,759 | ) | 774,652 | |||||||
| STERIS PLC | (82,261 | ) | (5,985,639 | ) | (211,905 | ) | ||||||
|
| |||||||||||
| 839,740 | ||||||||||||
|
| |||||||||||
| United States | ||||||||||||
| 3D Systems Corp. | (30,704 | ) | (315,953 | ) | 49,136 | |||||||
| Abercrombie & Fitch Co. | (121,416 | ) | (2,533,496 | ) | (744,736 | ) | ||||||
| Acadia Healthcare Co., Inc. | (97,972 | ) | (6,787,240 | ) | 667,909 | |||||||
| ACI Worldwide, Inc. | (131,063 | ) | (3,115,040 | ) | 310,292 | |||||||
| Activision Blizzard, Inc. | (14,399 | ) | (499,293 | ) | (58,093 | ) | ||||||
| Acxiom Corp. | (8,368 | ) | (187,063 | ) | 12,005 | |||||||
| ADT Corp./The | (390,715 | ) | (12,751,160 | ) | (134,620 | ) | ||||||
| ADTRAN, Inc. | (43,630 | ) | (714,223 | ) | (37,086 | ) | ||||||
| AECOM | (3,635 | ) | (106,741 | ) | (2,418 | ) | ||||||
| AES Corp. | (75,477 | ) | (774,708 | ) | 52,393 | |||||||
| Agios Pharmaceuticals, Inc. | (39,919 | ) | (3,166,886 | ) | 575,344 | |||||||
| Air Lease Corp. | (15,902 | ) | (542,538 | ) | 10,139 | |||||||
| Akorn, Inc. | (422,149 | ) | (15,705,503 | ) | (44,876 | ) | ||||||
| Albemarle Corp. | (377,637 | ) | (18,642,265 | ) | (2,509,184 | ) | ||||||
| Alcoa, Inc. | (318,857 | ) | (2,940,191 | ) | (206,928 | ) | ||||||
| Alere, Inc. | (11,955 | ) | (495,900 | ) | 28,579 | |||||||
| Alexion Pharmaceuticals, Inc. | (143,926 | ) | (25,614,816 | ) | (1,839,069 | ) | ||||||
| Align Technology, Inc. | (164,003 | ) | (10,292,226 | ) | (507,371 | ) | ||||||
| The accompanying notes are an integral part of these financial statements. | (Continued) |
| AQR Funds | Annual Report | December 2015 | ||||||||||||||
210
Table of Contents
| Consolidated Schedule of Investments | December 31, 2015 |
| AQR MULTI-STRATEGY ALTERNATIVE FUND |
| REFERENCE ENTITY | SHARES | NOTIONAL (a) | NET UNREALIZED APPRECIATION (DEPRECIATION) | |||||||||
| United States (continued) | ||||||||||||
| Allegheny Technologies, Inc. | (98,084 | ) | $ | (2,122,064 | ) | $ | 1,018,619 | |||||
| Alliance Data Systems Corp. | (77,726 | ) | (22,706,303 | ) | 1,209,623 | |||||||
| Allscripts Healthcare Solutions, Inc. | (75,620 | ) | (1,117,094 | ) | (45,941 | ) | ||||||
| Ally Financial, Inc. | (251,503 | ) | (5,245,408 | ) | 557,392 | |||||||
| AMC Networks, Inc. | (34,488 | ) | (2,886,726 | ) | 311,162 | |||||||
| American Airlines Group, Inc. | (79,707 | ) | (3,522,748 | ) | 147,157 | |||||||
| American Express Co. | (88,333 | ) | (6,874,290 | ) | 730,729 | |||||||
| AMETEK, Inc. | (60,776 | ) | (3,334,095 | ) | 77,109 | |||||||
| Amphenol Corp. | (174,170 | ) | (9,205,988 | ) | 109,089 | |||||||
| AmTrust Financial Services, Inc. | (10,266 | ) | (639,613 | ) | 7,433 | |||||||
| Apache Corp. | (53,392 | ) | (2,473,866 | ) | 99,524 | |||||||
| Apple, Inc. | (7,060 | ) | (792,349 | ) | 49,214 | |||||||
| Arch Capital Group Ltd. | (33,727 | ) | (2,353,708 | ) | 1,250 | |||||||
| Arista Networks, Inc. | (53,477 | ) | (3,754,812 | ) | (407,838 | ) | ||||||
| Armstrong World Industries, Inc. | (4,204 | ) | (221,146 | ) | 28,897 | |||||||
| ARRIS Group, Inc. | (267,817 | ) | (7,822,085 | ) | (365,080 | ) | ||||||
| Artisan Partners Asset Management, Inc. | (7,376 | ) | (281,519 | ) | 15,540 | |||||||
| Assured Guaranty Ltd. | (38,599 | ) | (960,796 | ) | (59,375 | ) | ||||||
| AT&T, Inc. | (140,290 | ) | (4,797,669 | ) | (29,710 | ) | ||||||
| athenahealth, Inc. | (27,603 | ) | (3,200,568 | ) | (1,242,687 | ) | ||||||
| Atwood Oceanics, Inc. | (97,241 | ) | (2,070,345 | ) | 1,075,570 | |||||||
| Autodesk, Inc. | (58,917 | ) | (3,133,189 | ) | (456,624 | ) | ||||||
| Automatic Data Processing, Inc. | (3,413 | ) | (299,012 | ) | 9,862 | |||||||
| AutoZone, Inc. | (7,344 | ) | (5,008,604 | ) | (439,983 | ) | ||||||
| Avis Budget Group, Inc. | (257,850 | ) | (11,158,501 | ) | 1,801,124 | |||||||
| Avon Products, Inc. | (220,979 | ) | (829,481 | ) | (65,484 | ) | ||||||
| B/E Aerospace, Inc. | (241,336 | ) | (12,462,689 | ) | 2,237,283 | |||||||
| Ball Corp. | (3,925 | ) | (269,952 | ) | (15,513 | ) | ||||||
| BancorpSouth, Inc. | (70,721 | ) | (1,835,161 | ) | 138,564 | |||||||
| Bank of Hawaii Corp. | (11,087 | ) | (746,044 | ) | 48,672 | |||||||
| Bank of the Ozarks, Inc. | (22,532 | ) | (1,167,774 | ) | 53,341 | |||||||
| BankUnited, Inc. | (27,295 | ) | (1,000,089 | ) | 15,831 | |||||||
| BB&T Corp. | (9,755 | ) | (376,489 | ) | 7,653 | |||||||
| Becton Dickinson and Co. | (40,361 | ) | (5,539,567 | ) | (679,659 | ) | ||||||
| Bed Bath & Beyond, Inc. | (55,224 | ) | (3,638,738 | ) | 974,180 | |||||||
| Belden, Inc. | (31,439 | ) | (2,086,607 | ) | 587,595 | |||||||
| Bio-Techne Corp. | (67,940 | ) | (6,701,807 | ) | 587,207 | |||||||
| Black Hills Corp. | (30,629 | ) | (1,265,164 | ) | (156,941 | ) | ||||||
| Black Knight Financial Services, Inc. | (30,927 | ) | (1,055,088 | ) | 32,641 | |||||||
| BlackRock, Inc. | (10,458 | ) | (3,265,491 | ) | (295,667 | ) | ||||||
| Bluebird Bio, Inc. | (44,528 | ) | (4,369,267 | ) | 1,509,679 | |||||||
| BorgWarner, Inc. | (369,196 | ) | (17,478,160 | ) | 1,517,816 | |||||||
| Boston Beer Co., Inc./The | (15,422 | ) | (3,398,640 | ) | 284,784 | |||||||
| REFERENCE ENTITY | SHARES | NOTIONAL (a) | NET UNREALIZED APPRECIATION (DEPRECIATION) | |||||||||
| United States (continued) | ||||||||||||
| Bristol-Myers Squibb Co. | (10,162 | ) | $ | (676,801 | ) | $ | (22,243 | ) | ||||
| Brookdale Senior Living, Inc. | (295,991 | ) | (9,285,273 | ) | 3,821,279 | |||||||
| Brown-Forman Corp. | (95,727 | ) | (9,735,004 | ) | 231,227 | |||||||
| Bruker Corp. | (47,634 | ) | (990,275 | ) | (165,802 | ) | ||||||
| Brunswick Corp. | (615 | ) | (32,626 | ) | 1,562 | |||||||
| Buffalo Wild Wings, Inc. | (18,928 | ) | (3,290,884 | ) | 269,029 | |||||||
| Cabela’s, Inc. | (436,199 | ) | (20,135,502 | ) | (248,077 | ) | ||||||
| Cadence Design Systems, Inc. | (316,038 | ) | (6,257,552 | ) | (319,198 | ) | ||||||
| CalAtlantic Group, Inc. | (97,469 | ) | (3,824,391 | ) | 128,367 | |||||||
| Calpine Corp. | (303,083 | ) | (4,733,498 | ) | 347,887 | |||||||
| Campbell Soup Co. | (86,766 | ) | (4,117,914 | ) | (441,639 | ) | ||||||
| CarMax, Inc. | (295,629 | ) | (19,268,663 | ) | 3,313,566 | |||||||
| Carpenter Technology Corp. | (82,275 | ) | (3,060,062 | ) | 569,598 | |||||||
| Caterpillar, Inc. | (17,463 | ) | (1,266,534 | ) | 79,748 | |||||||
| Cathay General Bancorp | (6,591 | ) | (208,189 | ) | 1,693 | |||||||
| CBOE Holdings, Inc. | (9,984 | ) | (688,929 | ) | 40,967 | |||||||
| CBS Corp. | (131,733 | ) | (5,652,986 | ) | (555,590 | ) | ||||||
| Celanese Corp. | (57,428 | ) | (3,767,336 | ) | (99,291 | ) | ||||||
| Celgene Corp. | (28,541 | ) | (3,308,953 | ) | (109,117 | ) | ||||||
| Centene Corp. | (1,066 | ) | (63,239 | ) | (6,914 | ) | ||||||
| Cerner Corp. | (82,415 | ) | (5,152,193 | ) | 193,283 | |||||||
| CH Robinson Worldwide, Inc. | (47,413 | ) | (3,100,336 | ) | 159,782 | |||||||
| Charles Schwab Corp./The | (170,847 | ) | (5,935,338 | ) | 309,347 | |||||||
| Chemours Co./The | (6,671 | ) | (45,768 | ) | 10,012 | |||||||
| Cheniere Energy, Inc. | (346,488 | ) | (21,718,150 | ) | 8,811,472 | |||||||
| Chevron Corp. | (32,760 | ) | (2,838,518 | ) | (108,572 | ) | ||||||
| Chipotle Mexican Grill, Inc. | (20,791 | ) | (14,613,603 | ) | 4,637,041 | |||||||
| Church & Dwight Co., Inc. | (15,109 | ) | (1,282,466 | ) | 15 | |||||||
| Ciena Corp. | (466,572 | ) | (11,893,394 | ) | 2,240,019 | |||||||
| Cimarex Energy Co. | (61,832 | ) | (6,814,545 | ) | 1,288,001 | |||||||
| Cincinnati Financial Corp. | (82,692 | ) | (4,613,132 | ) | (279,754 | ) | ||||||
| CIT Group, Inc. | (201,735 | ) | (8,856,863 | ) | 847,984 | |||||||
| CLARCOR, Inc. | (1,104 | ) | (66,163 | ) | 11,316 | |||||||
| Clean Harbors, Inc. | (6,722 | ) | (339,327 | ) | 59,355 | |||||||
| Clorox Co./The | (1,634 | ) | (207,226 | ) | (15 | ) | ||||||
| CME Group, Inc. | (85,782 | ) | (8,342,332 | ) | 570,483 | |||||||
| CMS Energy Corp. | (66,762 | ) | (2,266,521 | ) | (142,252 | ) | ||||||
| CNO Financial Group, Inc. | (34,260 | ) | (665,910 | ) | 11,887 | |||||||
| Coach, Inc. | (165,267 | ) | (5,181,069 | ) | (228,120 | ) | ||||||
| Cobalt International Energy, Inc. | (100,828 | ) | (793,528 | ) | 249,057 | |||||||
| Coca-Cola Co./The | (90,124 | ) | (3,689,897 | ) | (181,830 | ) | ||||||
| Cognex Corp. | (29,782 | ) | (1,354,672 | ) | 348,933 | |||||||
| Cognizant Technology Solutions Corp. | (62,159 | ) | (4,131,853 | ) | 401,070 | |||||||
| The accompanying notes are an integral part of these financial statements. | (Continued) |
| AQR Funds | Annual Report | December 2015 | ||||||||||||||
211
Table of Contents
| Consolidated Schedule of Investments | December 31, 2015 |
| AQR MULTI-STRATEGY ALTERNATIVE FUND |
| REFERENCE ENTITY | SHARES | NOTIONAL (a) | NET UNREALIZED APPRECIATION (DEPRECIATION) | |||||||||
| United States (continued) | ||||||||||||
| Colfax Corp. | (158,715 | ) | $ | (6,389,131 | ) | $ | 2,683,136 | |||||
| Colgate-Palmolive Co. | (103,427 | ) | (6,823,232 | ) | (67,074 | ) | ||||||
| Commerce Bancshares, Inc. | (28,077 | ) | (1,270,725 | ) | 76,329 | |||||||
| CommScope Holding Co., Inc. | (44,234 | ) | (1,239,260 | ) | 94,041 | |||||||
| CommVault Systems, Inc. | (58,001 | ) | (2,253,161 | ) | (29,178 | ) | ||||||
| Compass Minerals International, Inc. | (38,623 | ) | (3,181,049 | ) | 273,896 | |||||||
| Concho Resources, Inc. | (81,354 | ) | (8,496,425 | ) | 941,893 | |||||||
| CONSOL Energy, Inc. | (760,119 | ) | (12,008,036 | ) | 6,003,096 | |||||||
| Cooper Cos., Inc./The | (22,461 | ) | (3,593,490 | ) | 579,224 | |||||||
| Copart, Inc. | (2,137 | ) | (83,872 | ) | 2,644 | |||||||
| Corning, Inc. | (40,244 | ) | (757,762 | ) | 22,102 | |||||||
| CoStar Group, Inc. | (28,821 | ) | (6,230,003 | ) | 272,990 | |||||||
| Covanta Holding Corp. | (176,022 | ) | (3,312,892 | ) | 586,312 | |||||||
| Cree, Inc. | (83,931 | ) | (2,074,774 | ) | (163,665 | ) | ||||||
| CST Brands, Inc. | (4,571 | ) | (170,962 | ) | (7,947 | ) | ||||||
| Cullen/Frost Bankers, Inc. | (84,584 | ) | (5,897,578 | ) | 822,538 | |||||||
| CVR Energy, Inc. | (39,619 | ) | (1,604,152 | ) | 45,145 | |||||||
| Cypress Semiconductor Corp | (1,061,988 | ) | (11,275,526 | ) | 857,424 | |||||||
| Dana Holding Corp. | (43,317 | ) | (820,447 | ) | 222,672 | |||||||
| Danaher Corp. | (33,580 | ) | (3,020,885 | ) | (98,025 | ) | ||||||
| DaVita HealthCare Partners, Inc. | (92,272 | ) | (6,875,073 | ) | 442,792 | |||||||
| Deere & Co. | (24,326 | ) | (1,930,300 | ) | 74,956 | |||||||
| Denbury Resources, Inc. | (98,076 | ) | (321,264 | ) | 123,151 | |||||||
| DeVry Education Group, Inc. | (61,864 | ) | (1,553,821 | ) | (11,957 | ) | ||||||
| DexCom, Inc. | (14,805 | ) | (1,266,227 | ) | 53,698 | |||||||
| Diamond Offshore Drilling, Inc. | (55,525 | ) | (1,087,346 | ) | (84,231 | ) | ||||||
| Diebold, Inc. | (108,143 | ) | (3,647,441 | ) | 393,418 | |||||||
| Discovery Communications, Inc. | (526,455 | ) | (16,239,456 | ) | 2,193,637 | |||||||
| Dolby Laboratories, Inc. | (99,682 | ) | (3,428,273 | ) | 73,974 | |||||||
| Dollar Tree, Inc. | (148,741 | ) | (10,556,713 | ) | (929,067 | ) | ||||||
| Dominion Resources, Inc. | (258,486 | ) | (17,778,732 | ) | 294,739 | |||||||
| Donaldson Co., Inc. | (124,058 | ) | (3,815,298 | ) | 259,796 | |||||||
| Dover Corp. | (914 | ) | (58,811 | ) | 2,774 | |||||||
| DreamWorks Animation SKG, Inc. | (104,092 | ) | (2,662,673 | ) | (19,777 | ) | ||||||
| Dril-Quip, Inc. | (24,366 | ) | (1,532,594 | ) | 89,396 | |||||||
| DSW, Inc. | (36,001 | ) | (829,899 | ) | (29,085 | ) | ||||||
| Duke Energy Corp. | (62,273 | ) | (4,405,236 | ) | (40,434 | ) | ||||||
| Dun & Bradstreet Corp./The | (5,151 | ) | (624,247 | ) | 88,904 | |||||||
| Dunkin’ Brands Group, Inc. | (277,209 | ) | (13,743,466 | ) | 1,937,134 | |||||||
| E*TRADE Financial Corp. | (255,859 | ) | (7,598,944 | ) | 15,283 | |||||||
| REFERENCE ENTITY | SHARES | NOTIONAL (a) | NET UNREALIZED APPRECIATION (DEPRECIATION) | |||||||||
| United States (continued) | ||||||||||||
| Eastman Chemical Co. | (46,436 | ) | $ | (3,552,675 | ) | $ | 417,780 | |||||
| Eaton Vance Corp. | (45,322 | ) | (1,600,870 | ) | 131,078 | |||||||
| Ecolab, Inc. | (101,239 | ) | (11,487,556 | ) | (92,161 | ) | ||||||
| EI du Pont de Nemours & Co. | (18,306 | ) | (998,477 | ) | (220,702 | ) | ||||||
| Envision Healthcare Holdings Inc | (183,698 | ) | (6,963,184 | ) | 2,192,547 | |||||||
| EOG Resources, Inc. | (383 | ) | (32,862 | ) | 5,749 | |||||||
| Esterline Technologies Corp. | (30,460 | ) | (2,513,370 | ) | 46,110 | |||||||
| Eversource Energy | (62,692 | ) | (3,028,935 | ) | (172,745 | ) | ||||||
| Expeditors International of Washington, Inc. | (86,783 | ) | (4,072,077 | ) | 158,163 | |||||||
| Express Scripts Holding Co. | (374 | ) | (34,939 | ) | 2,248 | |||||||
| Exxon Mobil Corp. | (118,407 | ) | (9,393,517 | ) | 163,691 | |||||||
| F5 Networks, Inc. | (4,564 | ) | (539,784 | ) | 97,259 | |||||||
| Facebook, Inc. | (17,885 | ) | (1,627,989 | ) | (243,855 | ) | ||||||
| FactSet Research Systems, Inc. | (9,576 | ) | (1,580,232 | ) | 23,461 | |||||||
| Fastenal Co. | (26,976 | ) | (1,117,885 | ) | 16,725 | |||||||
| Federated Investors, Inc. | (134,979 | ) | (4,347,115 | ) | 479,967 | |||||||
| FedEx Corp. | (1,737 | ) | (275,681 | ) | 16,885 | |||||||
| FEI Co. | (65,358 | ) | (5,203,200 | ) | (11,714 | ) | ||||||
| First American Financial Corp. | (38,625 | ) | (1,502,031 | ) | 115,394 | |||||||
| First Horizon National Corp. | (498,423 | ) | (7,924,744 | ) | 687,642 | |||||||
| First Republic Bank | (61,328 | ) | (3,885,849 | ) | (165,478 | ) | ||||||
| FirstMerit Corp. | (34,289 | ) | (704,296 | ) | 64,806 | |||||||
| FleetCor Technologies, Inc. | (64,829 | ) | (9,484,443 | ) | 218,434 | |||||||
| FLIR Systems, Inc. | (51,264 | ) | (1,485,191 | ) | 46,210 | |||||||
| Flowers Foods, Inc. | (48,961 | ) | (1,024,264 | ) | (27,908 | ) | ||||||
| Flowserve Corp. | (168,664 | ) | (7,782,145 | ) | 684,764 | |||||||
| Fluor Corp. | (22,208 | ) | (1,034,513 | ) | (14,149 | ) | ||||||
| FMC Corp. | (305,533 | ) | (13,480,172 | ) | 1,524,665 | |||||||
| FNF Group | (24,638 | ) | (911,812 | ) | 57,613 | |||||||
| Ford Motor Co. | (482,375 | ) | (6,863,075 | ) | 66,411 | |||||||
| Fortune Brands Home & Security, Inc. | (23,602 | ) | (1,056,867 | ) | (253,044 | ) | ||||||
| Fossil Group, Inc. | (92,710 | ) | (6,292,767 | ) | 2,903,289 | |||||||
| Franklin Resources, Inc. | (218,202 | ) | (9,378,452 | ) | 1,344,254 | |||||||
| Freeport-McMoRan, Inc. | (1,109,462 | ) | (14,949,017 | ) | 7,437,959 | |||||||
| Frontier Communications Corp. | (815,642 | ) | (4,068,662 | ) | 259,614 | |||||||
| FTI Consulting, Inc. | (89,688 | ) | (3,744,260 | ) | 635,674 | |||||||
| Gap, Inc./The | (73,481 | ) | (1,960,680 | ) | 145,699 | |||||||
| GATX Corp. | (39,645 | ) | (2,100,789 | ) | 413,894 | |||||||
| General Electric Co. | (117,833 | ) | (3,539,856 | ) | (130,641 | ) | ||||||
| General Mills, Inc. | (39,667 | ) | (2,269,349 | ) | (17,850 | ) | ||||||
| Genesee & Wyoming, Inc. | (85,977 | ) | (6,005,400 | ) | 1,389,295 | |||||||
| The accompanying notes are an integral part of these financial statements. | (Continued) |
| AQR Funds | Annual Report | December 2015 | ||||||||||||||
212
Table of Contents
| Consolidated Schedule of Investments | December 31, 2015 |
| AQR MULTI-STRATEGY ALTERNATIVE FUND |
| REFERENCE ENTITY | SHARES | NOTIONAL (a) | NET UNREALIZED APPRECIATION (DEPRECIATION) | |||||||||
| United States (continued) | ||||||||||||
| Gentex Corp. | (345,411 | ) | $ | (5,610,170 | ) | $ | 80,139 | |||||
| Genworth Financial, Inc. | (788,765 | ) | (4,154,957 | ) | 1,212,863 | |||||||
| Global Payments, Inc. | (28,061 | ) | (1,575,198 | ) | (235,017 | ) | ||||||
| Graco, Inc. | (55,381 | ) | (3,884,365 | ) | (106,944 | ) | ||||||
| Granite Construction, Inc. | (334 | ) | (13,315 | ) | (1,017 | ) | ||||||
| Greif, Inc. | (20,305 | ) | (694,436 | ) | 68,839 | |||||||
| Hain Celestial Group, Inc./The | (138,049 | ) | (8,259,751 | ) | 2,683,952 | |||||||
| Halliburton Co. | (43,247 | ) | (1,801,931 | ) | 329,803 | |||||||
| Halyard Health, Inc. | (78,104 | ) | (2,531,338 | ) | (78,117 | ) | ||||||
| Hancock Holding Co. | (106,146 | ) | (3,027,728 | ) | 356,033 | |||||||
| Hanesbrands, Inc. | (126,627 | ) | (3,710,864 | ) | (15,769 | ) | ||||||
| Harley-Davidson, Inc. | (35,093 | ) | (1,999,965 | ) | 407,094 | |||||||
| Harris Corp. | (63,110 | ) | (4,841,200 | ) | (643,059 | ) | ||||||
| Helmerich & Payne, Inc. | (85,650 | ) | (5,064,600 | ) | 478,042 | |||||||
| Henry Schein, Inc. | (12,354 | ) | (1,821,350 | ) | (132,929 | ) | ||||||
| Hershey Co./The | (51,774 | ) | (4,699,368 | ) | 77,503 | |||||||
| Hexcel Corp. | (222,508 | ) | (10,795,833 | ) | 460,336 | |||||||
| HMS Holdings Corp. | (56,530 | ) | (661,401 | ) | (36,179 | ) | ||||||
| Honeywell International, Inc. | (19,895 | ) | (1,972,407 | ) | (88,118 | ) | ||||||
| HSN, Inc. | (184 | ) | (11,409 | ) | 2,086 | |||||||
| Huntsman Corp. | (47,926 | ) | (947,839 | ) | 402,920 | |||||||
| IDEXX Laboratories, Inc. | (216,426 | ) | (14,979,481 | ) | (802,303 | ) | ||||||
| IHS, Inc. | (3,758 | ) | (443,860 | ) | (1,200 | ) | ||||||
| Illumina, Inc. | (161,084 | ) | (31,835,086 | ) | 915,818 | |||||||
| Incyte Corp. | (32,833 | ) | (3,742,188 | ) | 181,449 | |||||||
| Intel Corp. | (139,659 | ) | (4,504,205 | ) | (307,047 | ) | ||||||
| Intercontinental Exchange, Inc. | (739 | ) | (188,238 | ) | (1,138 | ) | ||||||
| InterDigital, Inc. | (60,987 | ) | (3,473,820 | ) | 483,017 | |||||||
| International Business Machines Corp. | (40,871 | ) | (6,344,767 | ) | 720,100 | |||||||
| International Flavors & Fragrances, Inc. | (9,163 | ) | (1,082,578 | ) | (13,683 | ) | ||||||
| Intrexon Corp. | (15,931 | ) | (561,235 | ) | 80,915 | |||||||
| Intuit, Inc. | (28 | ) | (2,740 | ) | 38 | |||||||
| Intuitive Surgical, Inc. | (13,040 | ) | (6,586,430 | ) | (535,497 | ) | ||||||
| IPG Photonics Corp. | (105,207 | ) | (8,540,313 | ) | (839,943 | ) | ||||||
| ITC Holdings Corp. | (248,904 | ) | (8,227,576 | ) | (1,541,906 | ) | ||||||
| Itron, Inc. | (1,895 | ) | (67,471 | ) | (1,090 | ) | ||||||
| Jacobs Engineering Group, Inc. | (17,830 | ) | (794,436 | ) | 46,467 | |||||||
| Janus Capital Group, Inc. | (14,252 | ) | (245,134 | ) | 44,324 | |||||||
| Jarden Corp. | (41,204 | ) | (1,972,489 | ) | (381,083 | ) | ||||||
| JB Hunt Transport Services, Inc. | (85,967 | ) | (7,247,878 | ) | 941,339 | |||||||
| JC Penney Co., Inc. | (103,082 | ) | (1,012,327 | ) | 325,801 | |||||||
| JetBlue Airways Corp. | (105,795 | ) | (2,460,174 | ) | 63,917 | |||||||
| JM Smucker Co./The | (40,118 | ) | (4,337,352 | ) | (610,802 | ) | ||||||
| Johnson & Johnson | (79,210 | ) | (7,547,997 | ) | (588,454 | ) | ||||||
| Joy Global, Inc. | (302,952 | ) | (7,308,818 | ) | 3,488,593 | |||||||
| REFERENCE ENTITY | SHARES | NOTIONAL (a) | NET UNREALIZED APPRECIATION (DEPRECIATION) | |||||||||
| United States (continued) | ||||||||||||
| Kansas City Southern | (188,343 | ) | $ | (17,879,405 | ) | $ | 3,815,834 | |||||
| KB Home | (64,419 | ) | (1,032,408 | ) | 238,122 | |||||||
| Kellogg Co. | (768 | ) | (49,167 | ) | (6,336 | ) | ||||||
| Kennametal, Inc. | (55,044 | ) | (1,778,472 | ) | 721,627 | |||||||
| Keurig Green Mountain, Inc. | (224,132 | ) | (14,163,383 | ) | (6,004,014 | ) | ||||||
| Kinder Morgan, Inc. | (539,999 | ) | (16,986,170 | ) | 8,929,385 | |||||||
| KLX, Inc. | (96,879 | ) | (3,750,432 | ) | 767,527 | |||||||
| Knowles Corp. | (65,772 | ) | (1,160,499 | ) | 283,758 | |||||||
| Kohl’s Corp. | (142,354 | ) | (7,917,438 | ) | 1,137,116 | |||||||
| Kosmos Energy Ltd. | (63,343 | ) | (424,662 | ) | 95,278 | |||||||
| Laboratory Corp. of America Holdings | (65,620 | ) | (7,988,127 | ) | (125,130 | ) | ||||||
| Lam Research Corp. | (14,687 | ) | (1,135,405 | ) | (31,036 | ) | ||||||
| Landstar System, Inc. | (35,057 | ) | (2,374,197 | ) | 318,104 | |||||||
| Las Vegas Sands Corp. | (239,705 | ) | (12,553,625 | ) | 2,044,958 | |||||||
| Legg Mason, Inc. | (52,941 | ) | (2,467,294 | ) | 390,418 | |||||||
| Lennar Corp. | (238,803 | ) | (12,399,379 | ) | 719,524 | |||||||
| Leucadia National Corp. | (46,669 | ) | (918,343 | ) | 106,769 | |||||||
| Level 3 Communications, Inc. | (80,004 | ) | (3,828,045 | ) | (520,972 | ) | ||||||
| Lexmark International, Inc. | (14,287 | ) | (466,436 | ) | 2,823 | |||||||
| Linear Technology Corp. | (98,228 | ) | (4,219,690 | ) | 47,946 | |||||||
| Lions Gate Entertainment Corp. | (301,659 | ) | (11,321,956 | ) | 1,551,221 | |||||||
| Loews Corp. | (27,574 | ) | (1,013,689 | ) | (45,152 | ) | ||||||
| LPL Financial Holdings, Inc. | (41,483 | ) | (1,908,612 | ) | 139,363 | |||||||
| Manitowoc Co., Inc./The | (30,120 | ) | (532,842 | ) | 70,500 | |||||||
| Markel Corp. | (378 | ) | (330,104 | ) | (3,803 | ) | ||||||
| Marriott International, Inc. | (110,889 | ) | (8,284,894 | ) | 850,895 | |||||||
| Marsh & McLennan Cos., Inc. | (295,196 | ) | (16,291,672 | ) | (76,946 | ) | ||||||
| MasterCard, Inc. | (103,950 | ) | (10,008,857 | ) | (111,715 | ) | ||||||
| Mattel, Inc. | (461,567 | ) | (10,763,373 | ) | (1,777,403 | ) | ||||||
| McCormick & Co., Inc. | (40,830 | ) | (3,304,235 | ) | (189,180 | ) | ||||||
| McDonald’s Corp. | (832 | ) | (84,839 | ) | (13,453 | ) | ||||||
| MDC Holdings, Inc. | (107,630 | ) | (3,179,743 | ) | 431,949 | |||||||
| MDU Resources Group, Inc. | (44,053 | ) | (766,674 | ) | (40,377 | ) | ||||||
| Mead Johnson Nutrition Co. | (68,203 | ) | (5,515,144 | ) | 130,518 | |||||||
| MEDNAX, Inc. | (102,842 | ) | (7,999,051 | ) | 629,393 | |||||||
| Memorial Resource Development Corp. | (88,287 | ) | (1,651,038 | ) | 225,203 | |||||||
| Mercury General Corp. | (6,237 | ) | (348,156 | ) | 57,698 | |||||||
| Mettler-Toledo International, Inc. | (16,365 | ) | (5,191,027 | ) | (358,836 | ) | ||||||
| MGM Resorts International | (249,298 | ) | (5,030,501 | ) | (633,550 | ) | ||||||
| The accompanying notes are an integral part of these financial statements. | (Continued) |
| AQR Funds | Annual Report | December 2015 | ||||||||||||||
213
Table of Contents
| Consolidated Schedule of Investments | December 31, 2015 |
| AQR MULTI-STRATEGY ALTERNATIVE FUND |
| REFERENCE ENTITY | SHARES | NOTIONAL (a) | NET UNREALIZED APPRECIATION (DEPRECIATION) | |||||||||
| United States (continued) | ||||||||||||
| Microchip Technology, Inc. | (104,623 | ) | $ | (4,612,633 | ) | $ | (256,521 | ) | ||||
| Middleby Corp./The | (40,570 | ) | (4,646,150 | ) | 269,864 | |||||||
| Monsanto Co. | (72,697 | ) | (7,149,627 | ) | (12,481 | ) | ||||||
| Moody’s Corp. | (38,614 | ) | (4,037,872 | ) | 163,343 | |||||||
| Motorola Solutions, Inc. | (3,978 | ) | (279,281 | ) | 6,987 | |||||||
| MSC Industrial Direct Co., Inc. | (83,866 | ) | (5,825,780 | ) | 1,106,641 | |||||||
| Mylan NV | (307,042 | ) | (14,416,983 | ) | (2,184,778 | ) | ||||||
| National Fuel Gas Co. | (31,110 | ) | (1,698,386 | ) | 368,433 | |||||||
| National Instruments Corp. | (49,433 | ) | (1,431,314 | ) | 13,081 | |||||||
| National Oilwell Varco, Inc. | (224,066 | ) | (8,885,541 | ) | 1,381,571 | |||||||
| Navient Corp. | (268,391 | ) | (3,378,770 | ) | 305,693 | |||||||
| Netflix, Inc. | (65,166 | ) | (7,208,573 | ) | (245,114 | ) | ||||||
| NetScout Systems, Inc. | (20,136 | ) | (692,728 | ) | 74,553 | |||||||
| NetSuite, Inc. | (189,243 | ) | (17,198,172 | ) | 1,184,430 | |||||||
| Newell Rubbermaid, Inc. | (84,864 | ) | (3,648,784 | ) | (92,021 | ) | ||||||
| Newfield Exploration Co. | (48,530 | ) | (1,847,093 | ) | 266,956 | |||||||
| NewMarket Corp. | (3,011 | ) | (1,343,997 | ) | 197,619 | |||||||
| NextEra Energy, Inc. | (50 | ) | (4,973 | ) | (222 | ) | ||||||
| Nielsen Holdings PLC | (191,365 | ) | (8,758,530 | ) | (159,079 | ) | ||||||
| Noble Energy, Inc. | (107,675 | ) | (3,994,742 | ) | 449,005 | |||||||
| Nordson Corp. | (61,039 | ) | (4,313,984 | ) | 398,332 | |||||||
| Norfolk Southern Corp. | (33,073 | ) | (2,640,252 | ) | (157,393 | ) | ||||||
| Norwegian Cruise Line Holdings Ltd. | (6,343 | ) | (368,381 | ) | (3,319 | ) | ||||||
| NRG Energy, Inc. | (271,940 | ) | (3,344,526 | ) | 143,793 | |||||||
| Nu Skin Enterprises, Inc. | (45,397 | ) | (1,816,432 | ) | 96,339 | |||||||
| Nuance Communications, Inc. | (53,427 | ) | (902,916 | ) | (159,747 | ) | ||||||
| NVIDIA Corp. | (77,394 | ) | (1,531,629 | ) | (1,019,278 | ) | ||||||
| Occidental Petroleum Corp. | (5,027 | ) | (375,110 | ) | 35,235 | |||||||
| Oceaneering International, Inc. | (28,407 | ) | (1,216,138 | ) | 150,308 | |||||||
| OGE Energy Corp. | (156,131 | ) | (4,315,880 | ) | 211,196 | |||||||
| Olin Corp. | (29,375 | ) | (562,270 | ) | 55,257 | |||||||
| ONE Gas, Inc. | (17,118 | ) | (769,052 | ) | (89,758 | ) | ||||||
| ONEOK, Inc. | (265,863 | ) | (9,612,903 | ) | 3,056,721 | |||||||
| Oracle Corp. | (136,925 | ) | (5,179,200 | ) | 177,330 | |||||||
| O’Reilly Automotive, Inc. | (12,800 | ) | (3,178,729 | ) | (65,047 | ) | ||||||
| Oshkosh Corp. | (77,170 | ) | (3,171,269 | ) | 158,552 | |||||||
| Owens & Minor, Inc. | (106,384 | ) | (3,676,933 | ) | (150,764 | ) | ||||||
| PacWest Bancorp | (28,330 | ) | (1,324,227 | ) | 103,204 | |||||||
| Palo Alto Networks, Inc. | (7,633 | ) | (1,466,070 | ) | 121,594 | |||||||
| Pandora Media, Inc. | (115,974 | ) | (2,159,696 | ) | 604,484 | |||||||
| Panera Bread Co. | (12,205 | ) | (2,214,475 | ) | (162,815 | ) | ||||||
| PAREXEL International Corp. | (23,324 | ) | (1,514,017 | ) | (74,814 | ) | ||||||
| Patterson Cos., Inc. | (14,074 | ) | (641,897 | ) | 5,612 | |||||||
| REFERENCE ENTITY | SHARES | NOTIONAL (a) | NET UNREALIZED APPRECIATION (DEPRECIATION) | |||||||||
| United States (continued) | ||||||||||||
| Paychex, Inc. | (59,250 | ) | $ | (2,927,072 | ) | $ | (206,661 | ) | ||||
| PayPal Holdings, Inc. | (3,261 | ) | (115,757 | ) | (2,291 | ) | ||||||
| Penske Automotive Group, Inc. | (6,564 | ) | (336,113 | ) | 58,193 | |||||||
| PerkinElmer, Inc. | (18,718 | ) | (971,496 | ) | (31,227 | ) | ||||||
| Platform Specialty Products Corp. | (659,970 | ) | (9,145,351 | ) | 677,936 | |||||||
| Polaris Industries, Inc. | (15,131 | ) | (1,800,951 | ) | 500,441 | |||||||
| PolyOne Corp. | (11,506 | ) | (408,218 | ) | 42,788 | |||||||
| Post Holdings, Inc. | (197,283 | ) | (10,525,048 | ) | (1,647,313 | ) | ||||||
| PPL Corp. | (220,421 | ) | (7,329,992 | ) | (192,977 | ) | ||||||
| Praxair, Inc. | (43,113 | ) | (4,855,757 | ) | 440,986 | |||||||
| Premier, Inc. | (12,526 | ) | (428,227 | ) | (13,565 | ) | ||||||
| Priceline Group, Inc./The | (2,921 | ) | (3,716,898 | ) | (7,231 | ) | ||||||
| Primerica, Inc. | (1,654 | ) | (75,301 | ) | (2,818 | ) | ||||||
| Principal Financial Group, Inc. | (193,176 | ) | (9,820,453 | ) | 1,131,396 | |||||||
| Progressive Corp./The | (105,333 | ) | (3,214,763 | ) | (134,826 | ) | ||||||
| Prosperity Bancshares, Inc. | (39,567 | ) | (2,160,484 | ) | 266,807 | |||||||
| Qorvo, Inc. | (104,427 | ) | (5,612,647 | ) | 297,313 | |||||||
| QUALCOMM, Inc. | (330,870 | ) | (21,298,509 | ) | 4,759,972 | |||||||
| Quanta Services, Inc. | (69,400 | ) | (1,784,746 | ) | 379,396 | |||||||
| Quest Diagnostics, Inc. | (73,837 | ) | (5,322,909 | ) | 70,145 | |||||||
| Questar Corp. | (58,793 | ) | (1,116,458 | ) | (28,830 | ) | ||||||
| Ralph Lauren Corp. | (12,813 | ) | (1,527,585 | ) | 99,192 | |||||||
| Range Resources Corp. | (410,430 | ) | (16,087,224 | ) | 5,986,542 | |||||||
| Regal Entertainment Group | (72,058 | ) | (1,397,937 | ) | 38,203 | |||||||
| Regeneron Pharmaceuticals, Inc. | (35,366 | ) | (18,884,930 | ) | (314,211 | ) | ||||||
| RenaissanceRe Holdings Ltd. | (11,489 | ) | (1,227,179 | ) | (73,261 | ) | ||||||
| Rent-A-Center, Inc. | (211,410 | ) | (5,518,171 | ) | 2,353,363 | |||||||
| ResMed, Inc. | (93,993 | ) | (5,107,169 | ) | 60,685 | |||||||
| Rice Energy, Inc. | (268,779 | ) | (5,033,739 | ) | 2,104,047 | |||||||
| Rockwell Collins, Inc. | (111,548 | ) | (9,839,481 | ) | (456,400 | ) | ||||||
| Rollins, Inc. | (1,608 | ) | (44,146 | ) | 2,499 | |||||||
| Roper Technologies, Inc. | (22,503 | ) | (3,889,605 | ) | (381,240 | ) | ||||||
| Rovi Corp. | (162,283 | ) | (1,714,266 | ) | (989,369 | ) | ||||||
| Royal Caribbean Cruises Ltd. | (54,339 | ) | (5,298,377 | ) | (201,273 | ) | ||||||
| RPM International, Inc. | (6,225 | ) | (282,217 | ) | 7,944 | |||||||
| RR Donnelley & Sons Co. | (43,653 | ) | (746,027 | ) | 103,455 | |||||||
| salesforce.com, Inc. | (100,336 | ) | (7,407,807 | ) | (458,536 | ) | ||||||
| Sally Beauty Holdings, Inc. | (109,754 | ) | (2,960,411 | ) | (100,628 | ) | ||||||
| Santander Consumer USA Holdings, Inc. | (67,523 | ) | (1,335,479 | ) | 265,239 | |||||||
| SBA Communications Corp. | (77,277 | ) | (8,839,930 | ) | 720,436 | |||||||
| SCANA Corp. | (56,722 | ) | (3,007,321 | ) | (423,793 | ) | ||||||
| Schlumberger Ltd. | (74,899 | ) | (5,982,962 | ) | 758,756 | |||||||
| The accompanying notes are an integral part of these financial statements. | (Continued) |
| AQR Funds | Annual Report | December 2015 | ||||||||||||||
214
Table of Contents
| Consolidated Schedule of Investments | December 31, 2015 |
| AQR MULTI-STRATEGY ALTERNATIVE FUND |
| REFERENCE ENTITY | SHARES | NOTIONAL (a) | NET UNREALIZED APPRECIATION (DEPRECIATION) | |||||||||
| United States (continued) | ||||||||||||
| Scripps Networks Interactive, Inc. | (190,928 | ) | $ | (11,329,697 | ) | $ | 788,562 | |||||
| Seagate Technology PLC | (58,983 | ) | (2,756,355 | ) | 594,038 | |||||||
| Seattle Genetics, Inc. | (160,735 | ) | (7,838,857 | ) | 625,070 | |||||||
| Semtech Corp. | (78,549 | ) | (1,340,598 | ) | (145,549 | ) | ||||||
| ServiceNow, Inc. | (95,140 | ) | (7,649,006 | ) | (586,313 | ) | ||||||
| Silgan Holdings, Inc. | (13,935 | ) | (735,070 | ) | (13,518 | ) | ||||||
| Silicon Laboratories, Inc. | (32,594 | ) | (1,612,101 | ) | 29,988 | |||||||
| Sirius XM Holdings, Inc. | (4,534,245 | ) | (17,664,058 | ) | (790,319 | ) | ||||||
| Six Flags Entertainment Corp. | (146,320 | ) | (6,882,995 | ) | (1,155,826 | ) | ||||||
| Skyworks Solutions, Inc. | (22,138 | ) | (1,868,928 | ) | 168,065 | |||||||
| SLM Corp. | (32,014 | ) | (222,503 | ) | 13,772 | |||||||
| SM Energy Co. | (42,399 | ) | (1,430,022 | ) | 596,457 | |||||||
| SolarWinds, Inc. | (4,902 | ) | (220,487 | ) | (68,241 | ) | ||||||
| Sotheby’s | (314,205 | ) | (12,646,642 | ) | 4,552,721 | |||||||
| Southern Co./The | (391,497 | ) | (17,076,479 | ) | (1,241,666 | ) | ||||||
| Southwest Airlines Co. | (36,503 | ) | (1,747,322 | ) | 175,503 | |||||||
| Southwestern Energy Co. | (763,570 | ) | (14,326,940 | ) | 8,897,957 | |||||||
| Spectra Energy Corp. | (446,005 | ) | (13,107,383 | ) | 2,430,024 | |||||||
| Spectrum Brands Holdings, Inc. | (26,218 | ) | (2,586,181 | ) | (82,811 | ) | ||||||
| Splunk, Inc. | (247,123 | ) | (16,405,445 | ) | 1,872,142 | |||||||
| Sprouts Farmers Market, Inc. | (558,730 | ) | (13,043,282 | ) | (1,813,349 | ) | ||||||
| State Street Corp. | (19,899 | ) | (1,395,429 | ) | 74,932 | |||||||
| Stericycle, Inc. | (57,183 | ) | (7,285,335 | ) | 389,066 | |||||||
| SunEdison, Inc. | (1,600,392 | ) | (15,236,582 | ) | 7,090,587 | |||||||
| SunPower Corp. | (60,780 | ) | (1,588,602 | ) | (235,406 | ) | ||||||
| Synaptics, Inc. | (22,354 | ) | (1,912,239 | ) | 116,318 | |||||||
| Synchrony Financial | (126,124 | ) | (4,050,550 | ) | 215,119 | |||||||
| Synovus Financial Corp. | (68,548 | ) | (2,142,810 | ) | (76,774 | ) | ||||||
| T Rowe Price Group, Inc. | (72,332 | ) | (5,449,976 | ) | 278,961 | |||||||
| Tableau Software, Inc. | (14,777 | ) | (1,414,348 | ) | 22,059 | |||||||
| Teekay Corp. | (20,234 | ) | (589,939 | ) | 390,230 | |||||||
| Teledyne Technologies, Inc. | (722 | ) | (68,543 | ) | 4,502 | |||||||
| Tempur Sealy International, Inc. | (8,993 | ) | (682,566 | ) | 48,919 | |||||||
| Tenet Healthcare Corp. | (484,422 | ) | (22,539,793 | ) | 7,861,806 | |||||||
| Teradata Corp. | (114,535 | ) | (3,971,086 | ) | 945,072 | |||||||
| Tesla Motors, Inc. | (26,027 | ) | (6,938,705 | ) | 691,965 | |||||||
| Tiffany & Co. | (87,089 | ) | (7,928,453 | ) | 1,284,433 | |||||||
| Time Warner, Inc. | (33,747 | ) | (2,464,743 | ) | 282,324 | |||||||
| TimkenSteel Corp. | (3,659 | ) | (69,817 | ) | 39,154 | |||||||
| T-Mobile US, Inc. | (146,470 | ) | (5,511,666 | ) | (218,240 | ) | ||||||
| Tractor Supply Co. | (26,227 | ) | (2,453,011 | ) | 210,603 | |||||||
| TransDigm Group, Inc. | (113,689 | ) | (25,696,178 | ) | (276,074 | ) | ||||||
| TreeHouse Foods, Inc. | (62,900 | ) | (5,077,970 | ) | 142,836 | |||||||
| TRI Pointe Group, Inc. | (59,778 | ) | (790,881 | ) | 33,494 | |||||||
| REFERENCE ENTITY | SHARES | NOTIONAL (a) | NET UNREALIZED APPRECIATION (DEPRECIATION) | |||||||||
| United States (continued) | ||||||||||||
| Trimble Navigation Ltd. | (245,122 | ) | $ | (5,386,728 | ) | $ | 128,861 | |||||
| TripAdvisor, Inc. | (171,400 | ) | (15,316,072 | ) | 704,222 | |||||||
| Triumph Group, Inc. | (89,614 | ) | (5,143,394 | ) | 1,581,238 | |||||||
| Tupperware Brands Corp. | (31,691 | ) | (1,936,736 | ) | 173,132 | |||||||
| Twenty-First Century Fox, Inc. | (184,967 | ) | (5,101,393 | ) | 77,689 | |||||||
| Twitter, Inc. | (268,791 | ) | (7,681,409 | ) | 1,461,585 | |||||||
| Tyson Foods, Inc. | (122,823 | ) | (5,431,918 | ) | (1,118,232 | ) | ||||||
| Ultimate Software Group, Inc./The | (32,968 | ) | (5,911,872 | ) | (533,702 | ) | ||||||
| Umpqua Holdings Corp. | (183,042 | ) | (3,301,929 | ) | 391,561 | |||||||
| Under Armour, Inc. | (291,239 | ) | (26,849,826 | ) | 3,373,050 | |||||||
| Union Pacific Corp. | (28,683 | ) | (2,458,311 | ) | 215,300 | |||||||
| Unit Corp. | (3,582 | ) | (63,070 | ) | 19,369 | |||||||
| United Natural Foods, Inc. | (149,728 | ) | (7,628,463 | ) | 1,735,169 | |||||||
| United Parcel Service, Inc. | (35,676 | ) | (3,494,821 | ) | 61,719 | |||||||
| United Rentals, Inc. | (111,965 | ) | (8,179,387 | ) | 57,446 | |||||||
| United Technologies Corp. | (66,063 | ) | (6,107,734 | ) | (238,938 | ) | ||||||
| Urban Outfitters, Inc. | (36,510 | ) | (1,164,092 | ) | 333,490 | |||||||
| USG Corp. | (496,853 | ) | (13,266,805 | ) | 1,198,245 | |||||||
| Valley National Bancorp | (286,566 | ) | (2,958,603 | ) | 135,928 | |||||||
| Valspar Corp./The | (32,629 | ) | (2,571,570 | ) | (135,006 | ) | ||||||
| Vantiv, Inc. | (26,701 | ) | (1,084,595 | ) | (181,567 | ) | ||||||
| Varian Medical Systems, Inc. | (49,716 | ) | (4,338,218 | ) | 321,165 | |||||||
| Veeva Systems, Inc. | (90,027 | ) | (2,422,205 | ) | (175,074 | ) | ||||||
| VeriSign, Inc. | (16,030 | ) | (1,043,232 | ) | (357,148 | ) | ||||||
| Verisk Analytics, Inc. | (129,789 | ) | (9,719,711 | ) | (258,467 | ) | ||||||
| Vertex Pharmaceuticals, Inc. | (53,381 | ) | (6,728,289 | ) | 11,357 | |||||||
| Visa, Inc. | (105,281 | ) | (7,841,597 | ) | (322,944 | ) | ||||||
| Vishay Intertechnology, Inc. | (25,981 | ) | (279,331 | ) | (33,740 | ) | ||||||
| Wabtec Corp. | (46,670 | ) | (3,796,356 | ) | 477,186 | |||||||
| Waddell & Reed Financial, Inc. | (16,203 | ) | (699,576 | ) | 235,198 | |||||||
| Walgreens Boots Alliance, Inc. | (35,629 | ) | (2,978,513 | ) | (55,474 | ) | ||||||
| Walt Disney Co./The | (54,951 | ) | (5,744,828 | ) | (29,423 | ) | ||||||
| Waste Connections, Inc. | (11,938 | ) | (582,663 | ) | (89,685 | ) | ||||||
| Waters Corp. | (24,086 | ) | (3,106,969 | ) | (134,525 | ) | ||||||
| Webster Financial Corp. | (27,124 | ) | (1,056,480 | ) | 47,738 | |||||||
| WEC Energy Group, Inc. | (275,274 | ) | (13,774,178 | ) | (350,131 | ) | ||||||
| WellCare Health Plans, Inc. | (14,520 | ) | (1,193,108 | ) | 57,499 | |||||||
| Wendy’s Co./The | (123,048 | ) | (1,197,574 | ) | (127,653 | ) | ||||||
| West Pharmaceutical Services, Inc. | (558 | ) | (33,459 | ) | (144 | ) | ||||||
| The accompanying notes are an integral part of these financial statements. | (Continued) |
| AQR Funds | Annual Report | December 2015 | ||||||||||||||
215
Table of Contents
| Consolidated Schedule of Investments | December 31, 2015 |
| AQR MULTI-STRATEGY ALTERNATIVE FUND |
| REFERENCE ENTITY | SHARES | NOTIONAL (a) | NET UNREALIZED APPRECIATION (DEPRECIATION) | |||||||||
| United States (continued) | ||||||||||||
| Westar Energy, Inc. | (80,274 | ) | $ | (3,046,177 | ) | $ | (358,244 | ) | ||||
| Western Union Co./The | (481,251 | ) | (9,182,869 | ) | 563,663 | |||||||
| WestRock Co. | (23,136 | ) | (1,173,687 | ) | 118,223 | |||||||
| WEX, Inc. | (9,066 | ) | (933,469 | ) | 132,035 | |||||||
| WhiteWave Foods Co./The | (13,992 | ) | (554,019 | ) | 9,590 | |||||||
| Whiting Petroleum Corp. | (198,712 | ) | (3,450,375 | ) | 1,574,534 | |||||||
| Whole Foods Market, Inc. | (187,563 | ) | (5,698,331 | ) | (585,030 | ) | ||||||
| Williams-Sonoma, Inc. | (2,131 | ) | (135,792 | ) | 11,320 | |||||||
| WisdomTree Investments, Inc. | (585,838 | ) | (11,060,410 | ) | 1,874,470 | |||||||
| Woodward, Inc. | (68,227 | ) | (3,242,862 | ) | (145,291 | ) | ||||||
| Workday, Inc. | (189,847 | ) | (15,490,885 | ) | 363,876 | |||||||
| World Fuel Services Corp. | (16,752 | ) | (820,345 | ) | 176,064 | |||||||
| WR Berkley Corp. | (9,152 | ) | (508,028 | ) | 6,956 | |||||||
| WR Grace & Co. | (52,291 | ) | (5,211,474 | ) | 3,813 | |||||||
| Wynn Resorts Ltd. | (5,391 | ) | (361,076 | ) | (11,928 | ) | ||||||
| Xcel Energy, Inc. | (190,170 | ) | (6,662,471 | ) | (166,533 | ) | ||||||
| Yahoo!, Inc. | (178,849 | ) | (5,922,142 | ) | (26,376 | ) | ||||||
| Zebra Technologies Corp. | (78,848 | ) | (7,200,143 | ) | 1,708,379 | |||||||
| Zillow Group, Inc. | (70,316 | ) | (1,990,930 | ) | 339,911 | |||||||
| Zimmer Biomet Holdings, Inc. | (132,318 | ) | (13,066,217 | ) | (508,287 | ) | ||||||
| REFERENCE ENTITY | SHARES | NOTIONAL (a) | NET UNREALIZED APPRECIATION (DEPRECIATION) | |||||||||
| United States (continued) | ||||||||||||
| Zions Bancorporation | (306,522 | ) | $ | (9,635,738 | ) | $ | 1,267,687 | |||||
|
| |||||||||||
| 162,652,811 | ||||||||||||
|
| |||||||||||
Total of Short Equity Positions | 173,037,426 | |||||||||||
|
| |||||||||||
| Rights | ||||||||||||
| United States | ||||||||||||
| Leap Wireless International, Inc. (3) | (110,787 | ) | (279,183 | ) | (198,256 | ) | ||||||
|
| |||||||||||
Total of Short Equity Positions and Rights | 172,839,170 | |||||||||||
|
| |||||||||||
Total of Long and Short Equity Positions and Rights | 68,277,319 | |||||||||||
|
| |||||||||||
Net Cash and Other Receivables/ (Payables) (b) | 10,859,616 | |||||||||||
|
| |||||||||||
Swaps, at Value | $ | 79,136,935 | ||||||||||
|
| |||||||||||
| (a) | Notional value represents the market value (including any fees or commissions) of the long and short positions when they are established. |
| (b) | Cash and other receivables/(payables) includes the gains (or losses) realized within the swap when the swap resets. |
| (3) | Level 3 security (See Note 5). |
| The accompanying notes are an integral part of these financial statements. | (Continued) |
| AQR Funds | Annual Report | December 2015 | ||||||||||||||
216
Table of Contents
| Consolidated Schedule of Investments | December 31, 2015 |
| AQR MULTI-STRATEGY ALTERNATIVE FUND |
| COUNTERPARTY | DESCRIPTION | TERMINATION DATE** | VALUE (Note 5) | |||||
| Morgan Stanley Capital Services, Inc. | The Fund receives the total return on a portfolio of long and short positions and pays or receives the Euro Overnight Index Average plus or minus a specified spread, which is denominated in EUR based on the local currencies of the positions within the swap. | 4-16 months maturity 04/05/2016 | $799,857 | |||||
|
| |||||||
| ** | The maturity dates are measured from the commencement of investment in each underlying portfolio swap position. |
Additional Information — Total Return Basket Swaps
The following table represents the individual long and short positions and related values within the total return basket swap as of December 31, 2015.
| REFERENCE ENTITY | SHARES | NOTIONAL (a) | NET UNREALIZED APPRECIATION (DEPRECIATION) | |||||||||
| Long Positions | ||||||||||||
| Common Stocks | ||||||||||||
| Belgium | ||||||||||||
| Delhaize Group | 82,024 | $ | 7,274,110 | $ | 709,005 | |||||||
|
| |||||||||||
| France | ||||||||||||
| Alcatel-Lucent | 20,082 | 72,982 | 6,357 | |||||||||
|
| |||||||||||
| Germany | ||||||||||||
| Deutsche Wohnen AG | 68,214 | 1,840,027 | 46,214 | |||||||||
| Wincor Nixdorf AG | 80,263 | 4,182,920 | (158,819 | ) | ||||||||
|
| |||||||||||
| (112,605 | ) | |||||||||||
|
| |||||||||||
| Italy | ||||||||||||
| Ansaldo STS SpA | 842,829 | 8,616,046 | 414,734 | |||||||||
| Enel Green Power SpA | 6,001 | 12,211 | (14 | ) | ||||||||
| Italcementi SpA | 372,119 | 4,043,950 | 97,842 | |||||||||
|
| |||||||||||
| 512,562 | ||||||||||||
|
| |||||||||||
| Netherlands | ||||||||||||
| TNT Express NV | 2,382,726 | 19,739,274 | 415,812 | |||||||||
| USG People NV | 88,295 | 1,649,933 | (7,298 | ) | ||||||||
|
| |||||||||||
| 408,514 | ||||||||||||
|
| |||||||||||
Total of Long Equity Positions | 1,523,833 | |||||||||||
|
| |||||||||||
| Short Positions | ||||||||||||
| Common Stocks | ||||||||||||
| Finland | ||||||||||||
| Nokia OYJ | (287,504 | ) | (1,870,973 | ) | (162,980 | ) | ||||||
|
| |||||||||||
| REFERENCE ENTITY | SHARES | NOTIONAL (a) | NET UNREALIZED APPRECIATION (DEPRECIATION) | |||||||||
| Germany | ||||||||||||
| Vonovia SE | (43,385 | ) | $ | (1,288,252 | ) | $ | (52,045 | ) | ||||
|
| |||||||||||
| Italy | ||||||||||||
| Enel SpA | (3,001 | ) | (12,677 | ) | 93 | |||||||
|
| |||||||||||
| Netherlands | ||||||||||||
| Koninklijke Ahold NV | (415,752 | ) | (8,172,757 | ) | (596,886 | ) | ||||||
|
| |||||||||||
| United Kingdom | ||||||||||||
| Dialog Semiconductor PLC | (17,584 | ) | (705,929 | ) | 119,175 | |||||||
|
| |||||||||||
Total of Short Equity Positions | (692,643 | ) | ||||||||||
|
| |||||||||||
Total of Long and Short Equity Positions | 831,190 | |||||||||||
|
| |||||||||||
Net Cash and Other Receivables/ (Payables) (b) | (31,333 | ) | ||||||||||
|
| |||||||||||
Swaps, at Value | $ | 799,857 | ||||||||||
|
| |||||||||||
| (a) | Notional value represents the market value (including any fees or commissions) of the long and short positions when they are established. |
| (b) | Cash and other receivables/(payables) includes the gains (or losses) realized within the swap when the swap resets. |
| The accompanying notes are an integral part of these financial statements. | (Continued) |
| AQR Funds | Annual Report | December 2015 | ||||||||||||||
217
Table of Contents
| Consolidated Schedule of Investments | December 31, 2015 |
| AQR MULTI-STRATEGY ALTERNATIVE FUND |
| COUNTERPARTY | DESCRIPTION | TERMINATION DATE** | VALUE (Note 5) | |||||
| Morgan Stanley Capital Services, Inc. | The Fund receives the total return on a portfolio of long and short positions and pays or receives the Federal Funds Effective Rate plus or minus a specified spread, which is denominated in USD based on the local currencies of the positions within the swap. | 1-25 months maturity ranging from 01/13/2016 - 11/09/2017 | $1,533,636 | |||||
|
| |||||||
| ** | The maturity dates are measured from the commencement of investment in each underlying portfolio swap position. |
Additional Information — Total Return Basket Swaps
The following table represents the individual long and short positions and related values within the total return basket swap as of December 31, 2015.
| REFERENCE ENTITY | SHARES | NOTIONAL (a) | NET UNREALIZED APPRECIATION (DEPRECIATION) | |||||||||
| Long Positions | ||||||||||||
| Common Stocks | ||||||||||||
| France | ||||||||||||
| Alcatel-Lucent | 534,818 | $ | 1,919,997 | $ | 128,356 | |||||||
|
| |||||||||||
| Ireland | ||||||||||||
| Avolon Holdings Ltd. | 99,215 | 2,974,013 | 97,684 | |||||||||
| King Digital Entertainment PLC | 20,821 | 370,799 | 1,481 | |||||||||
|
| |||||||||||
| 99,165 | ||||||||||||
|
| |||||||||||
| Israel | ||||||||||||
| EZchip Semiconductor Ltd. | 34,114 | 855,318 | (12,020 | ) | ||||||||
|
| |||||||||||
| Netherlands | ||||||||||||
| NXP Semiconductors NV | 1,021 | 91,255 | (5,235 | ) | ||||||||
|
| |||||||||||
| United States | ||||||||||||
| AGL Resources, Inc. | 217,703 | 13,396,606 | 495,023 | |||||||||
| Airgas, Inc. | 75,073 | 10,327,796 | 56,301 | |||||||||
| Allergan PLC | 71,333 | 22,067,661 | 223,901 | |||||||||
| American Residential Properties, Inc. | 139,255 | 2,525,157 | 106,763 | |||||||||
| Astoria Financial Corp. | 449,750 | 7,181,384 | (52,847 | ) | ||||||||
| Atmel Corp. | 157,004 | 1,316,209 | 35,596 | |||||||||
| Avangrid, Inc. | 2,442 | 89,304 | 4,469 | |||||||||
| Baker Hughes, Inc. | 447,986 | 26,575,851 | (5,901,297 | ) | ||||||||
| Baxalta, Inc. | 52,956 | 2,018,948 | 47,925 | |||||||||
| BioMed Realty Trust, Inc. | 132,303 | 3,105,883 | 28,375 | |||||||||
| Boulder Brands, Inc. | 156,416 | 1,713,498 | 3,950 | |||||||||
| Broadcom Corp. | 479,126 | 25,233,618 | 2,469,447 | |||||||||
| Cablevision Systems Corp. | 648,715 | 20,914,777 | (220,769 | ) | ||||||||
| Cameron International Corp. | 237,478 | 14,838,088 | 170,522 | |||||||||
| Chubb Corp./The | 260,036 | 32,085,478 | 2,405,697 | |||||||||
| Cigna Corp. | 208,910 | 29,542,918 | 1,026,883 | |||||||||
| Cleco Corp. | 319,778 | 17,228,039 | (532,429 | ) | ||||||||
| Constant Contact, Inc. | 60,454 | 1,889,198 | (121,523 | ) | ||||||||
| REFERENCE ENTITY | SHARES | NOTIONAL (a) | NET UNREALIZED APPRECIATION (DEPRECIATION) | |||||||||
| United States (continued) | ||||||||||||
| Diamond Foods, Inc. | 53,927 | $ | 2,142,200 | $ | (63,314 | ) | ||||||
| EMC Corp. | 135,653 | 3,854,051 | (370,482 | ) | ||||||||
| Expedia, Inc. | 100 | 12,580 | (150 | ) | ||||||||
| Fairchild Semiconductor International, Inc. | 215,414 | 4,193,186 | 268,038 | |||||||||
| First Niagara Financial Group, Inc. | 1,295,959 | 13,744,759 | 316,397 | |||||||||
| Hawaiian Electric Industries, Inc. | 472,595 | 14,123,449 | (441,824 | ) | ||||||||
| Health Net, Inc. | 344,400 | 22,141,637 | 1,435,987 | |||||||||
| Heartland Payment Systems, Inc. | 53,700 | 5,056,995 | 34,839 | |||||||||
| Humana, Inc. | 157,267 | 28,536,657 | (462,925 | ) | ||||||||
| Inland Real Estate Corp. | 384,868 | 4,108,844 | (21,546 | ) | ||||||||
| Jarden Corp. | 302,482 | 16,748,315 | 529,457 | |||||||||
| Keurig Green Mountain, Inc. | 131,846 | 11,783,835 | 79,668 | |||||||||
| KLA-Tencor Corp. | 267,901 | 17,843,835 | 735,099 | |||||||||
| MedAssets, Inc. | 27,799 | 857,474 | 2,627 | |||||||||
| Media General, Inc. | 599,734 | 8,704,147 | 981,557 | |||||||||
| National Penn Bancshares, Inc. | 623,953 | 7,681,914 | 11,427 | |||||||||
| Norfolk Southern Corp. | 21,730 | 2,075,884 | (237,744 | ) | ||||||||
| Office Depot, Inc. | 2,567,530 | 20,477,881 | (5,997,012 | ) | ||||||||
| PartnerRe Ltd. | 51,812 | 7,137,950 | 102,259 | |||||||||
| Pep Boys-Manny, Moe & Jack/The | 162,446 | 2,433,733 | 556,897 | |||||||||
| Pepco Holdings, Inc. | 956,553 | 25,364,665 | (484,722 | ) | ||||||||
| Piedmont Natural Gas Co., Inc. | 105,611 | 6,141,661 | (119,721 | ) | ||||||||
| Pinnacle Entertainment, Inc. | 43,189 | 1,727,992 | (383,950 | ) | ||||||||
| Plum Creek Timber Co., Inc. | 184,406 | 8,709,045 | 90,809 | |||||||||
| PMC-Sierra, Inc. | 1,321,661 | 15,331,268 | 26,433 | |||||||||
| Precision Castparts Corp. | 121,727 | 28,049,306 | 192,575 | |||||||||
| The accompanying notes are an integral part of these financial statements. | (Continued) |
| AQR Funds | Annual Report | December 2015 | ||||||||||||||
218
Table of Contents
| Consolidated Schedule of Investments | December 31, 2015 |
| AQR MULTI-STRATEGY ALTERNATIVE FUND |
| REFERENCE ENTITY | SHARES | NOTIONAL (a) | NET UNREALIZED APPRECIATION (DEPRECIATION) | |||||||||
| United States (continued) | ||||||||||||
| Rentrak Corp. | 4,537 | $ | 219,143 | $ | (3,500 | ) | ||||||
| Rite Aid Corp. | 898,793 | 7,084,915 | (38,378 | ) | ||||||||
| SanDisk Corp. | 132,512 | 10,003,196 | 66,391 | |||||||||
| Sirona Dental Systems, Inc. | 6,059 | 670,589 | (6,704 | ) | ||||||||
| SolarWinds, Inc. | 42,613 | 2,475,487 | 34,418 | |||||||||
| Solera Holdings, Inc. | 215,383 | 11,638,651 | 170,799 | |||||||||
| StanCorp Financial Group, Inc. | 76,301 | 8,676,281 | 12,877 | |||||||||
| Starwood Hotels & Resorts Worldwide, Inc. | 28,935 | 2,050,979 | (46,363 | ) | ||||||||
| Symetra Financial Corp. | 295,549 | 9,315,567 | 74,025 | |||||||||
| TECO Energy, Inc. | 387,477 | 10,246,526 | 79,736 | |||||||||
| Time Warner Cable, Inc. | 129,030 | 24,292,961 | (346,283 | ) | ||||||||
| Wilshire Bancorp, Inc. | 172,327 | 2,097,061 | (106,684 | ) | ||||||||
|
| |||||||||||
| (3,083,000 | ) | |||||||||||
|
| |||||||||||
| Total Common Stocks | (2,872,734) | |||||||||||
|
| |||||||||||
| Rights | ||||||||||||
| United States | ||||||||||||
| Furiex Pharmaceuticals, Inc. (3) | 44,784 | 447,840 | (447,840 | ) | ||||||||
|
| |||||||||||
Total of Long Equity Positions and Rights | (3,320,574 | ) | ||||||||||
|
| |||||||||||
| Short Positions | ||||||||||||
| Common Stocks | ||||||||||||
| Canada | ||||||||||||
| Mitel Networks Corp. | (23,159 | ) | (214,221 | ) | 36,128 | |||||||
|
| |||||||||||
| Finland | ||||||||||||
| Nokia OYJ | (294,483 | ) | (1,987,760 | ) | (79,510 | ) | ||||||
|
| |||||||||||
| Ireland | ||||||||||||
| Shire PLC | (8,949 | ) | (2,242,303 | ) | 407,759 | |||||||
|
| |||||||||||
| Singapore | ||||||||||||
| Avago Technologies Ltd. | (81,516 | ) | (10,863,816 | ) | (968,232 | ) | ||||||
|
| |||||||||||
| Switzerland | ||||||||||||
| ACE Ltd. | (153,345 | ) | (16,237,888 | ) | (1,680,475 | ) | ||||||
|
| |||||||||||
| United Kingdom | ||||||||||||
| STERIS PLC | (129 | ) | (8,883 | ) | (836 | ) | ||||||
| Willis Group Holdings PLC | (3 | ) | (147 | ) | 2 | |||||||
|
| |||||||||||
| (834 | ) | |||||||||||
|
| |||||||||||
| United States | ||||||||||||
| Aetna, Inc. | (131,712 | ) | (14,492,940 | ) | 252,238 | |||||||
| American Homes 4 Rent | (154,336 | ) | (2,493,419 | ) | (77,819 | ) | ||||||
| Anthem, Inc. | (105,525 | ) | (15,243,109 | ) | 528,703 | |||||||
| REFERENCE ENTITY | SHARES | NOTIONAL (a) | NET UNREALIZED APPRECIATION (DEPRECIATION) | |||||||||
| United States (continued) | ||||||||||||
| Ball Corp. | (15,289 | ) | $ | (1,013,815 | ) | $ | (98,154 | ) | ||||
| BB&T Corp. | (134,843 | ) | (5,125,473 | ) | 27,059 | |||||||
| Centene Corp. | (212,522 | ) | (13,003,650 | ) | (982,423 | ) | ||||||
| Charter Communications, Inc. | (64,867 | ) | (12,054,968 | ) | 177,820 | |||||||
| comScore, Inc. | (4,546 | ) | (191,558 | ) | 4,490 | |||||||
| DENTSPLY International, Inc. | (11,882 | ) | (729,861 | ) | 6,841 | |||||||
| Diebold, Inc. | (34,853 | ) | (1,184,752 | ) | 136,026 | |||||||
| Gaming and Leisure Properties, Inc. | (36,711 | ) | (1,290,759 | ) | 270,193 | |||||||
| Global Payments, Inc. | (37,081 | ) | (2,387,018 | ) | (5,078 | ) | ||||||
| Gramercy Property Trust | (1,865 | ) | (13,956 | ) | (442 | ) | ||||||
| Halliburton Co. | (495,614 | ) | (20,511,255 | ) | 3,640,555 | |||||||
| Iron Mountain, Inc. | (24,232 | ) | (759,916 | ) | 105,409 | |||||||
| KeyCorp. | (889,794 | ) | (11,432,728 | ) | (303,655 | ) | ||||||
| Lam Research Corp. | (133,834 | ) | (10,147,719 | ) | (481,377 | ) | ||||||
| Microsemi Corp. | (101,900 | ) | (3,635,783 | ) | 314,862 | |||||||
| New York Community Bancorp., Inc. | (449,750 | ) | (7,367,298 | ) | 27,378 | |||||||
| Newell Rubbermaid, Inc. | (261,400 | ) | (11,220,603 | ) | (301,909 | ) | ||||||
| Nexstar Broadcasting Group, Inc. | (61,413 | ) | (3,168,564 | ) | (436,379 | ) | ||||||
| NextEra Energy, Inc. | (116,703 | ) | (11,897,036 | ) | (227,239 | ) | ||||||
| Pandora Media, Inc. | (54,696 | ) | (689,170 | ) | (44,304 | ) | ||||||
| Pfizer, Inc. | (801,989 | ) | (25,720,743 | ) | (167,462 | ) | ||||||
| Schlumberger Ltd. | (175,254 | ) | (12,548,474 | ) | 324,507 | |||||||
| Snyder’s-Lance, Inc. | (41,900 | ) | (1,503,861 | ) | 66,691 | |||||||
| Staples, Inc. | (547,049 | ) | (7,656,256 | ) | 2,475,702 | |||||||
| Towers Watson & Co. | (4,402 | ) | (564,438 | ) | (1,043 | ) | ||||||
| Western Digital Corp. | (2,333 | ) | (147,037 | ) | 6,941 | |||||||
| Weyerhaeuser Co. | (302,392 | ) | (9,051,781 | ) | (13,931 | ) | ||||||
|
| |||||||||||
| 5,224,200 | ||||||||||||
|
| |||||||||||
Total of Short Equity Positions | 2,939,036 | |||||||||||
|
| |||||||||||
Total of Long and Short Equity Positions and Rights | (381,538 | ) | ||||||||||
|
| |||||||||||
Net Cash and Other Receivables/ (Payables) (b) | 1,915,174 | |||||||||||
|
| |||||||||||
Swaps, at Value | $ | 1,533,636 | ||||||||||
|
| |||||||||||
| (a) | Notional value represents the market value (including any fees or commissions) of the long and short positions when they are established. |
| (b) | Cash and other receivables/(payables) includes the gains (or losses) realized within the swap when the swap resets. |
| (3) | Level 3 security (See Note 5). |
| The accompanying notes are an integral part of these financial statements. | (Continued) |
| AQR Funds | Annual Report | December 2015 | ||||||||||||||
219
Table of Contents
| Consolidated Schedule of Investments | December 31, 2015 |
| AQR MULTI-STRATEGY ALTERNATIVE FUND |
| COUNTERPARTY | DESCRIPTION | TERMINATION DATE** | VALUE (Note 5) | |||||
| Morgan Stanley Capital Services, Inc. | The Fund receives the total return on a portfolio of long and short positions and pays or receives the CAD/USD Overnight Forward FX Swap Rate plus or minus a specified spread, which is denominated in CAD based on the local currencies of the positions within the swap. | 14 months maturity 01/12/2017 | $38,016 | |||||
|
| |||||||
| ** | The maturity dates are measured from the commencement of investment in each underlying portfolio swap position. |
Additional Information — Total Return Basket Swaps
The following table represents the individual long and short positions and related values within the total return basket swap as of December 31, 2015.
| REFERENCE ENTITY | SHARES | NOTIONAL (a) | NET UNREALIZED APPRECIATION (DEPRECIATION) | |||||||||
| Short Positions | ||||||||||||
| Common Stocks | ||||||||||||
| Canada | ||||||||||||
| Canadian Pacific Railway Ltd. | (9,801 | ) | $ | (1,362,577 | ) | $ | 110,766 | |||||
|
| |||||||||||
Net Cash and Other Receivables/ (Payables) (b) | (72,750 | ) | ||||||||||
|
| |||||||||||
Swaps, at Value | $ | 38,016 | ||||||||||
|
| |||||||||||
| (a) | Notional value represents the market value (including any fees or commissions) of the long and short positions when they are established. |
| (b) | Cash and other receivables/(payables) includes the gains (or losses) realized within the swap when the swap resets. |
Collateral pledged to, or (received from), each counterparty at December 31, 2015 was as follows:
| COUNTERPARTY | OVER THE COUNTER | EXCHANGE TRADED/ CENTRALLY CLEARED | TOTAL | |||||||||
| Bank of America | ||||||||||||
| Money Market Funds | $2,340,210 | $— | $2,340,210 | |||||||||
| ||||||||||||
| Barclays Capital | ||||||||||||
| Cash | — | 54,972,394 | 54,972,394 | |||||||||
| ||||||||||||
| CitiBank | ||||||||||||
| Cash | — | 1,494,021 | 1,494,021 | |||||||||
| Money Market Funds | 8,380,198 | — | 8,380,198 | |||||||||
| ||||||||||||
| Credit Suisse International | ||||||||||||
| Cash | (4,170,000 | ) | — | (4,170,000 | ) | |||||||
| ||||||||||||
| Deutsche Bank | ||||||||||||
| Cash | (600,000 | ) | — | (600,000 | ) | |||||||
| ||||||||||||
| Goldman Sachs | ||||||||||||
| Cash | — | 4,551,365 | 4,551,365 | |||||||||
| Money Market Funds | 30,190,000 | — | 30,190,000 | |||||||||
| ||||||||||||
| J.P. Morgan | ||||||||||||
| Cash | — | 14,859,719 | 14,859,719 | |||||||||
| Money Market Funds | 110,700,000 | — | 110,700,000 | |||||||||
| ||||||||||||
| Morgan Stanley Capital Services, Inc. | ||||||||||||
| Cash | — | 915,704 | 915,704 | |||||||||
| Money Market Funds | 322,453,137 | — | 322,453,137 | |||||||||
| ||||||||||||
| The accompanying notes are an integral part of these financial statements. | (Continued) |
| AQR Funds | Annual Report | December 2015 | ||||||||||||||
220
Table of Contents
| Consolidated Schedule of Investments | December 31, 2015 |
| AQR MULTI-STRATEGY ALTERNATIVE FUND |
Collateral pledged to, or (received from), each counterparty for the Subsidiary (See Note 2) at December 31, 2015 was as follows:
| COUNTERPARTY | OVER THE COUNTER | EXCHANGE TRADED/ CENTRALLY CLEARED | TOTAL | |||||||||
| CitiBank | ||||||||||||
| Money Market Funds | $2,630,008 | $— | $2,630,008 | |||||||||
| ||||||||||||
| Deutsche Bank | ||||||||||||
| Money Market Funds | 830,045 | — | 830,045 | |||||||||
| ||||||||||||
| Goldman Sachs | ||||||||||||
| Cash | — | (400,814 | ) | (400,814 | ) | |||||||
| ||||||||||||
| J.P. Morgan | ||||||||||||
| Cash | — | 1,422,383 | 1,422,383 | |||||||||
| ||||||||||||
| Macquarie Capital | ||||||||||||
| Money Market Funds | 480,002 | — | 480,002 | |||||||||
| ||||||||||||
| Morgan Stanley Capital Services, Inc. | ||||||||||||
| Cash | — | 9,910,814 | 9,910,814 | |||||||||
| ||||||||||||
| Societe Generale | ||||||||||||
| Money Market Funds | 670,000 | — | 670,000 | |||||||||
| ||||||||||||
| The accompanying notes are an integral part of these financial statements. |
| AQR Funds | Annual Report | December 2015 | ||||||||||||||
221
Table of Contents
| Consolidated Schedule of Investments | December 31, 2015 |
| AQR RISK-BALANCED COMMODITIES STRATEGY FUND |
| MONEY MARKET FUNDS - 38.9% | SHARES | VALUE (Note 5) | ||||||
| BlackRock Liquidity Funds T-Fund Portfolio, Institutional Shares, 0.100% ^(a) | 2,245,052 | $ | 2,245,052 | |||||
| Dreyfus Treasury Cash Management, Class I, 0.090% ^(a) | 8,980,208 | 8,980,208 | ||||||
| J.P. Morgan U.S. Treasury Plus Money Market Fund - IM Shares, 0.129% ^(a)(b) | 15,983,784 | 15,983,784 | ||||||
| J.P. Morgan U.S. Treasury Plus Money Market Fund - Institutional Shares, 0.070% ^(a)(b) | 1,470,129 | 1,470,129 | ||||||
| UBS Money Series - UBS Select Treasury Preferred Fund, Class I, 0.140% ^(a) | 11,225,261 | 11,225,261 | ||||||
|
| |||||||
TOTAL MONEY MARKET FUNDS | 39,904,434 | |||||||
|
| |||||||
| SHORT-TERM INVESTMENTS -51.3% | PRINCIPAL AMOUNT (000’s) | VALUE (Note 5) | ||||||
| U.S. Treasury Bill, 0.327%, 5/19/2016 ^(c) | $ | 30,723 | 30,684,197 | |||||
| U.S. Treasury Bill, 0.536%, 6/9/2016 (c) | 2,641 | 2,635,821 | ||||||
| U.S. Treasury Bill, 0.415%, 6/2/2016 ^(c) | 910 | 908,359 | ||||||
| U.S. Treasury Bill, 0.144%, 4/28/2016 (c) | 1,125 | 1,124,057 | ||||||
| U.S. Treasury Bill, 0.241%, 2/11/2016 ^(c) | 16,071 | 16,068,766 | ||||||
| U.S. Treasury Bill, 0.238%, 2/18/2016 (c) | 1,162 | 1,161,837 | ||||||
|
| |||||||
TOTAL SHORT-TERM INVESTMENTS | 52,583,037 | |||||||
|
| |||||||
TOTAL INVESTMENTS IN SECURITIES, AT VALUE - 90.2% | 92,487,471 | |||||||
|
| |||||||
| OTHER ASSETS IN EXCESS OF LIABILITIES - 9.8% (d) | 10,038,917 | |||||||
|
| |||||||
NET ASSETS - 100.0% | $ | 102,526,388 | ||||||
|
| |||||||
| (a) | Represents annualized seven-day yield as of the close of the reporting period. |
| (b) | A portion of the security is pledged as collateral to the brokers for swap contracts. |
| (c) | The rate shown is the effective yield at the date of purchase. |
| (d) | Includes appreciation/(depreciation) on futures and swap contracts. |
| ^ | All or a portion represents positions held in the respective Subsidiary (See Note 2). |
All securities are Level 2 with respect to ASC 820 (See Note 5).
Total return swap contracts outstanding as of December 31, 2015:
Over the Counter
| COUNTERPARTY | UNDERLYING REFERENCE INSTRUMENT | TERMINATION DATE | CURRENCY | NOTIONAL VALUE | UNREALIZED APPRECIATION (DEPRECIATION) | |||||||||
| Societe Generale | Cocoa March Futures^ | 02/2016 | USD | (161,910 | ) | $1,360 | ||||||||
| Societe Generale | Cocoa March Futures^ | 02/2016 | USD | 166,936 | (6,386 | ) | ||||||||
| CitiBank | Corn March Futures^ | 02/2016 | USD | 615,744 | (41,744 | ) | ||||||||
| Deutsche Bank | Corn March Futures^ | 02/2016 | USD | 2,663,502 | (224,002 | ) | ||||||||
| CitiBank | Cotton No. 2 March Futures^ | 02/2016 | USD | 1,441,928 | 13,511 | |||||||||
| Deutsche Bank | Cotton No. 2 March Futures^ | 02/2016 | USD | 927,940 | 21,260 | |||||||||
| Macquarie Capital | Cotton No. 2 March Futures^ | 02/2016 | USD | (155,263 | ) | (800 | ) | |||||||
| Macquarie Capital | Cotton No. 2 March Futures^ | 02/2016 | USD | 310,538 | 5,862 | |||||||||
| Macquarie Capital | Lean Hogs February Futures^ | 02/2016 | USD | (222,279 | ) | (5,475 | ) | |||||||
| Macquarie Capital | Lean Hogs February Futures^ | 02/2016 | USD | 222,279 | (6,999 | ) | ||||||||
| Deutsche Bank | Live Cattle February Futures^ | 02/2016 | USD | 2,386,924 | (88,684 | ) | ||||||||
| Societe Generale | Live Cattle February Futures^ | 02/2016 | USD | 1,183,744 | (34,624 | ) | ||||||||
| Societe Generale | Natural Gas January Futures^ | 01/2016 | USD | 601,132 | 53,228 | |||||||||
| Societe Generale | Natural Gas January Futures^ | 01/2016 | USD | (697,683 | ) | 43,323 | ||||||||
| Societe Generale | Natural Gas February Futures^ | 02/2016 | USD | (611,744 | ) | (49,896 | ) | |||||||
| The accompanying notes are an integral part of these financial statements. | (Continued) |
| AQR Funds | Annual Report | December 2015 | ||||||||||||||
222
Table of Contents
| Consolidated Schedule of Investments | December 31, 2015 |
| AQR RISK-BALANCED COMMODITIES STRATEGY FUND |
| COUNTERPARTY | UNDERLYING REFERENCE INSTRUMENT | TERMINATION DATE | CURRENCY | NOTIONAL VALUE | UNREALIZED APPRECIATION (DEPRECIATION) | |||||||||
| CitiBank | Soybean March Futures^ | 02/2016 | USD | 3,868,020 | $ (22,107 | ) | ||||||||
| Deutsche Bank | Soybean March Futures^ | 02/2016 | USD | 647,375 | 812 | |||||||||
| Deutsche Bank | Soybean March Futures^ | 02/2016 | USD | (441,360 | ) | 9,228 | ||||||||
| Macquarie Capital | Soybean March Futures^ | 02/2016 | USD | 735,257 | (644 | ) | ||||||||
| Societe Generale | Soybean March Futures^ | 02/2016 | USD | 561,411 | 352 | |||||||||
| Societe Generale | Soybean Meal March Futures^ | 02/2016 | USD | (432,790 | ) | 34,540 | ||||||||
| Macquarie Capital | Soybean Oil March Futures^ | 02/2016 | USD | 2,724,480 | 6,120 | |||||||||
| CitiBank | Wheat March Futures^ | 02/2016 | USD | 781,464 | (76,406 | ) | ||||||||
| CitiBank | Wheat March Futures^ | 02/2016 | USD | (1,864,600 | ) | 78,541 | ||||||||
| Deutsche Bank | Wheat March Futures^ | 02/2016 | USD | (1,418,708 | ) | 55,708 | ||||||||
|
| |||||||||||||
| $(233,922 | ) | |||||||||||||
|
| |||||||||||||
| ^ | Represents positions held in the respective Subsidiary (See Note 2). |
Open futures contracts outstanding at December 31, 2015:
Exchange Traded
| NUMBER OF CONTRACTS | COUNTERPARTY | DESCRIPTION | EXPIRATION DATE | VALUE AT TRADE DATE | VALUE AT DECEMBER 31, 2015 | UNREALIZED APPRECIATION (DEPRECIATION) | ||||||||||||||
| Long Contracts: | ||||||||||||||||||||
| 25 | Goldman Sachs | Brent Crude Futures^ | 02/2016 | $981,427 | $963,250 | $(18,177 | ) | |||||||||||||
| 67 | Morgan Stanley and Co., International PLC | Coffee ‘C’ Futures^ | 03/2016 | 3,211,244 | 3,183,338 | (27,906 | ) | |||||||||||||
| 247 | Morgan Stanley and Co., International PLC | Corn Futures^ | 03/2016 | 4,869,823 | 4,430,562 | (439,261 | ) | |||||||||||||
| 14 | Morgan Stanley and Co., International PLC | Cotton No. 2 Futures^ | 03/2016 | 440,821 | 442,960 | 2,139 | ||||||||||||||
| 64 | Goldman Sachs | Gas Oil Futures^ | 03/2016 | 2,378,147 | 2,190,400 | (187,747 | ) | |||||||||||||
| 43 | Morgan Stanley and Co., International PLC | Gasoline RBOB Futures^ | 02/2016 | 2,300,319 | 2,344,550 | 44,231 | ||||||||||||||
| 133 | Morgan Stanley and Co., International PLC | Gold 100 OZ Futures^ | 02/2016 | 14,766,173 | 14,100,660 | (665,513 | ) | |||||||||||||
| 5 | Morgan Stanley and Co., International PLC | Heating Oil ULSD Futures^ | 02/2016 | 245,733 | 241,269 | (4,464 | ) | |||||||||||||
| 78 | Morgan Stanley and Co., International PLC | Lean Hogs Futures^ | 02/2016 | 1,820,221 | �� | 1,865,760 | 45,539 | |||||||||||||
| 24 | J.P. Morgan | LME Aluminum Futures^ | 01/2016 | 942,059 | 900,780 | (41,279 | ) | |||||||||||||
| 15 | J.P. Morgan | LME Aluminum Futures^ | 01/2016 | 597,206 | 563,906 | (33,300 | ) | |||||||||||||
| 15 | J.P. Morgan | LME Aluminum Futures^ | 01/2016 | 563,041 | 564,563 | 1,522 | ||||||||||||||
| 2 | J.P. Morgan | LME Aluminum Futures^ | 02/2016 | 74,955 | 75,412 | 457 | ||||||||||||||
| 24 | J.P. Morgan | LME Aluminum Futures^ | 02/2016 | 893,559 | 905,850 | 12,291 | ||||||||||||||
| 29 | J.P. Morgan | LME Aluminum Futures^ | 02/2016 | 1,061,117 | 1,094,119 | 33,002 | ||||||||||||||
| 29 | J.P. Morgan | LME Aluminum Futures^ | 03/2016 | 1,076,334 | 1,094,569 | 18,235 | ||||||||||||||
| 224 | J.P. Morgan | LME Aluminum Futures^ | 03/2016 | 8,797,141 | 8,443,400 | (353,741 | ) | |||||||||||||
| 30 | J.P. Morgan | LME Aluminum Futures^ | 03/2016 | 1,107,881 | 1,130,752 | 22,871 | ||||||||||||||
| 4 | J.P. Morgan | LME Aluminum Futures^ | 03/2016 | 152,210 | 150,733 | (1,477 | ) | |||||||||||||
| The accompanying notes are an integral part of these financial statements. | (Continued) |
| AQR Funds | Annual Report | December 2015 | ||||||||||||||
223
Table of Contents
| Consolidated Schedule of Investments | December 31, 2015 |
| AQR RISK-BALANCED COMMODITIES STRATEGY FUND |
| NUMBER OF CONTRACTS | COUNTERPARTY | DESCRIPTION | EXPIRATION DATE | VALUE AT TRADE DATE | VALUE AT DECEMBER 31, 2015 | UNREALIZED APPRECIATION (DEPRECIATION) | ||||||||||||||
| Long Contracts: (continued) | ||||||||||||||||||||
| 9 | J.P. Morgan | LME Copper Futures^ | 01/2016 | $ 1,154,513 | $ 1,059,098 | $ (95,415 | ) | |||||||||||||
| 4 | J.P. Morgan | LME Copper Futures^ | 01/2016 | 533,510 | 471,025 | (62,485 | ) | |||||||||||||
| 15 | J.P. Morgan | LME Copper Futures^ | 01/2016 | 1,950,550 | 1,766,392 | (184,158 | ) | |||||||||||||
| 2 | J.P. Morgan | LME Copper Futures^ | 01/2016 | 257,839 | 235,510 | (22,329 | ) | |||||||||||||
| 6 | J.P. Morgan | LME Copper Futures^ | 02/2016 | 756,502 | 706,630 | (49,872 | ) | |||||||||||||
| 5 | J.P. Morgan | LME Copper Futures^ | 02/2016 | 600,387 | 588,906 | (11,481 | ) | |||||||||||||
| 5 | J.P. Morgan | LME Copper Futures^ | 02/2016 | 577,012 | 588,872 | 11,860 | ||||||||||||||
| 1 | J.P. Morgan | LME Copper Futures^ | 03/2016 | 115,202 | 117,747 | 2,545 | ||||||||||||||
| 2 | J.P. Morgan | LME Copper Futures^ | 03/2016 | 229,664 | 235,467 | 5,803 | ||||||||||||||
| 91 | J.P. Morgan | LME Copper Futures^ | 03/2016 | 11,725,599 | 10,711,269 | (1,014,330 | ) | |||||||||||||
| 5 | J.P. Morgan | LME Copper Futures^ | 03/2016 | 576,990 | 588,594 | 11,604 | ||||||||||||||
| 8 | J.P. Morgan | LME Copper Futures^ | 03/2016 | 937,274 | 940,970 | 3,696 | ||||||||||||||
| 7 | J.P. Morgan | LME Lead Futures^ | 01/2016 | 291,217 | 314,463 | 23,246 | ||||||||||||||
| 4 | J.P. Morgan | LME Lead Futures^ | 01/2016 | 180,095 | 179,680 | (415 | ) | |||||||||||||
| 2 | J.P. Morgan | LME Lead Futures^ | 01/2016 | 87,092 | 89,834 | 2,742 | ||||||||||||||
| 2 | J.P. Morgan | LME Lead Futures^ | 01/2016 | 87,555 | 89,832 | 2,277 | ||||||||||||||
| 5 | J.P. Morgan | LME Lead Futures^ | 01/2016 | 215,637 | 224,570 | 8,933 | ||||||||||||||
| 2 | J.P. Morgan | LME Lead Futures^ | 02/2016 | 83,083 | 89,835 | 6,752 | ||||||||||||||
| 3 | J.P. Morgan | LME Lead Futures^ | 02/2016 | 121,446 | 134,787 | 13,341 | ||||||||||||||
| 4 | J.P. Morgan | LME Lead Futures^ | 03/2016 | 163,899 | 179,716 | 15,817 | ||||||||||||||
| 8 | J.P. Morgan | LME Lead Futures^ | 03/2016 | 330,655 | 359,425 | 28,770 | ||||||||||||||
| 1 | J.P. Morgan | LME Lead Futures^ | 03/2016 | 41,002 | 44,927 | 3,925 | ||||||||||||||
| 56 | J.P. Morgan | LME Lead Futures^ | 03/2016 | 2,445,345 | 2,515,450 | 70,105 | ||||||||||||||
| 3 | J.P. Morgan | LME Lead Futures^ | 03/2016 | 129,178 | 134,760 | 5,582 | ||||||||||||||
| 10 | J.P. Morgan | LME Lead Futures^ | 03/2016 | 404,308 | 448,937 | 44,629 | ||||||||||||||
| 5 | J.P. Morgan | LME Lead Futures^ | 03/2016 | 215,365 | 224,188 | 8,823 | ||||||||||||||
| 2 | J.P. Morgan | LME Nickel Futures^ | 01/2016 | 127,146 | 105,424 | (21,722 | ) | |||||||||||||
| 4 | J.P. Morgan | LME Nickel Futures^ | 01/2016 | 250,465 | 210,934 | (39,531 | ) | |||||||||||||
| 2 | J.P. Morgan | LME Nickel Futures^ | 01/2016 | 125,540 | 105,504 | (20,036 | ) | |||||||||||||
| 1 | J.P. Morgan | LME Nickel Futures^ | 02/2016 | 58,394 | 52,778 | (5,616 | ) | |||||||||||||
| 3 | J.P. Morgan | LME Nickel Futures^ | 02/2016 | 169,081 | 158,409 | (10,672 | ) | |||||||||||||
| 6 | J.P. Morgan | LME Nickel Futures^ | 02/2016 | 325,458 | 316,898 | (8,560 | ) | |||||||||||||
| 6 | J.P. Morgan | LME Nickel Futures^ | 03/2016 | 318,640 | 317,137 | (1,503 | ) | |||||||||||||
| 1 | J.P. Morgan | LME Nickel Futures^ | 03/2016 | 53,991 | 52,860 | (1,131 | ) | |||||||||||||
| 2 | J.P. Morgan | LME Nickel Futures^ | 03/2016 | 105,906 | 105,727 | (179 | ) | |||||||||||||
| 4 | J.P. Morgan | LME Nickel Futures^ | 03/2016 | 206,308 | 211,533 | 5,225 | ||||||||||||||
| 34 | J.P. Morgan | LME Nickel Futures^ | 03/2016 | 2,011,613 | 1,798,056 | (213,557 | ) | |||||||||||||
| 8 | J.P. Morgan | LME Nickel Futures^ | 03/2016 | 416,708 | 423,096 | 6,388 | ||||||||||||||
| 3 | J.P. Morgan | LME Nickel Futures^ | 03/2016 | 155,539 | 158,661 | 3,122 | ||||||||||||||
| 3 | J.P. Morgan | LME Nickel Futures^ | 03/2016 | 156,337 | 158,704 | 2,367 | ||||||||||||||
| 11 | J.P. Morgan | LME Zinc Futures^ | 01/2016 | 461,202 | 438,405 | (22,797 | ) | |||||||||||||
| 7 | J.P. Morgan | LME Zinc Futures^ | 01/2016 | 319,442 | 279,577 | (39,865 | ) | |||||||||||||
| 5 | J.P. Morgan | LME Zinc Futures^ | 01/2016 | 215,012 | 200,037 | (14,975 | ) | |||||||||||||
| 2 | J.P. Morgan | LME Zinc Futures^ | 01/2016 | 87,505 | 80,046 | (7,459 | ) | |||||||||||||
| 5 | J.P. Morgan | LME Zinc Futures^ | 01/2016 | 215,012 | 200,171 | (14,841 | ) | |||||||||||||
| 2 | J.P. Morgan | LME Zinc Futures^ | 02/2016 | 83,255 | 80,122 | (3,133 | ) | |||||||||||||
| 1 | J.P. Morgan | LME Zinc Futures^ | 02/2016 | 40,352 | 40,087 | (265 | ) | |||||||||||||
| 5 | J.P. Morgan | LME Zinc Futures^ | 02/2016 | 189,012 | 200,531 | 11,519 | ||||||||||||||
| 9 | J.P. Morgan | LME Zinc Futures^ | 03/2016 | 349,683 | 361,247 | 11,564 | ||||||||||||||
| 2 | J.P. Morgan | LME Zinc Futures^ | 03/2016 | 76,756 | 80,289 | 3,533 | ||||||||||||||
| 5 | J.P. Morgan | LME Zinc Futures^ | 03/2016 | 191,262 | 200,896 | 9,634 | ||||||||||||||
| 57 | J.P. Morgan | LME Zinc Futures^ | 03/2016 | 2,469,581 | 2,292,825 | (176,756 | ) | |||||||||||||
| 11 | J.P. Morgan | LME Zinc Futures^ | 03/2016 | 409,104 | 442,475 | 33,371 | ||||||||||||||
| 5 | J.P. Morgan | LME Zinc Futures^ | 03/2016 | 192,887 | 201,125 | 8,238 | ||||||||||||||
| The accompanying notes are an integral part of these financial statements. | (Continued) |
| AQR Funds | Annual Report | December 2015 | ||||||||||||||
224
Table of Contents
| Consolidated Schedule of Investments | December 31, 2015 |
| AQR RISK-BALANCED COMMODITIES STRATEGY FUND |
| NUMBER OF CONTRACTS | COUNTERPARTY | DESCRIPTION | EXPIRATION DATE | VALUE AT TRADE DATE | VALUE AT DECEMBER 31, 2015 | UNREALIZED APPRECIATION (DEPRECIATION) | ||||||||||||||
| Long Contracts: (continued) | ||||||||||||||||||||
| 69 | Morgan Stanley and Co., International PLC | Natural Gas Futures^ | 02/2016 | $ 1,391,050 | $ 1,630,470 | $ 239,420 | ||||||||||||||
| 134 | Morgan Stanley and Co., International PLC | Silver Futures^ | 03/2016 | 10,264,037 | 9,248,010 | (1,016,027 | ) | |||||||||||||
| 78 | Morgan Stanley and Co., International PLC | Soybean Futures^ | 03/2016 | 3,401,483 | 3,370,575 | (30,908 | ) | |||||||||||||
| 108 | Morgan Stanley and Co., International PLC | Soybean Meal Futures^ | 03/2016 | 3,088,828 | 2,867,400 | (221,428 | ) | |||||||||||||
| 150 | Morgan Stanley and Co., International PLC | Soybean Oil Futures^ | 03/2016 | 2,760,597 | 2,767,500 | 6,903 | ||||||||||||||
| 240 | Morgan Stanley and Co., International PLC | Sugar #11 (World Markets) Futures^ | 02/2016 | 3,617,718 | 4,096,512 | 478,794 | ||||||||||||||
| 175 | Morgan Stanley and Co., International PLC | WTI Crude Futures^ | 02/2016 | 6,786,441 | 6,679,750 | (106,691 | ) | |||||||||||||
|
|
|
|
|
| |||||||||||||||
| 111,581,675 | 107,661,488 | (3,920,187 | ) | |||||||||||||||||
|
|
|
|
|
| |||||||||||||||
| Short Contracts: | ||||||||||||||||||||
| 14 | Morgan Stanley and Co., International PLC | Cocoa Futures^ | 03/2016 | $(465,995 | ) | $(449,540 | ) | $16,455 | ||||||||||||
| 1 | Morgan Stanley and Co., International PLC | Live Cattle Futures^ | 02/2016 | (49,281 | ) | (54,720 | ) | (5,439 | ) | |||||||||||
| 24 | J.P. Morgan | LME Aluminum Futures^ | 01/2016 | (941,278 | ) | (900,780 | ) | 40,498 | ||||||||||||
| 15 | J.P. Morgan | LME Aluminum Futures^ | 01/2016 | (596,963 | ) | (563,906 | ) | 33,057 | ||||||||||||
| 15 | J.P. Morgan | LME Aluminum Futures^ | 01/2016 | (566,206 | ) | (564,563 | ) | 1,643 | ||||||||||||
| 2 | J.P. Morgan | LME Aluminum Futures^ | 02/2016 | (74,753 | ) | (75,411 | ) | (658 | ) | |||||||||||
| 24 | J.P. Morgan | LME Aluminum Futures^ | 02/2016 | (897,241 | ) | (905,850 | ) | (8,609 | ) | |||||||||||
| 29 | J.P. Morgan | LME Aluminum Futures^ | 02/2016 | (1,061,329 | ) | (1,094,119 | ) | (32,790 | ) | |||||||||||
| 29 | J.P. Morgan | LME Aluminum Futures^ | 03/2016 | (1,072,912 | ) | (1,094,569 | ) | (21,657 | ) | |||||||||||
| 92 | J.P. Morgan | LME Aluminum Futures^ | 03/2016 | (3,476,186 | ) | (3,467,825 | ) | 8,361 | ||||||||||||
| 30 | J.P. Morgan | LME Aluminum Futures^ | 03/2016 | (1,104,344 | ) | (1,130,753 | ) | (26,409 | ) | |||||||||||
| 4 | J.P. Morgan | LME Aluminum Futures^ | 03/2016 | (152,288 | ) | (150,733 | ) | 1,555 | ||||||||||||
| 9 | J.P. Morgan | LME Copper Futures^ | 01/2016 | (1,153,323 | ) | (1,059,097 | ) | 94,226 | ||||||||||||
| 4 | J.P. Morgan | LME Copper Futures^ | 01/2016 | (531,501 | ) | (471,025 | ) | 60,476 | ||||||||||||
| 15 | J.P. Morgan | LME Copper Futures^ | 01/2016 | (1,951,838 | ) | (1,766,392 | ) | 185,446 | ||||||||||||
| 2 | J.P. Morgan | LME Copper Futures^ | 01/2016 | (257,495 | ) | (235,509 | ) | 21,986 | ||||||||||||
| 6 | J.P. Morgan | LME Copper Futures^ | 02/2016 | (759,442 | ) | (706,631 | ) | 52,811 | ||||||||||||
| 5 | J.P. Morgan | LME Copper Futures^ | 02/2016 | (601,408 | ) | (588,906 | ) | 12,502 | ||||||||||||
| 5 | J.P. Morgan | LME Copper Futures^ | 02/2016 | (575,693 | ) | (588,872 | ) | (13,179 | ) | |||||||||||
| 1 | J.P. Morgan | LME Copper Futures^ | 03/2016 | (114,849 | ) | (117,748 | ) | (2,899 | ) | |||||||||||
| 2 | J.P. Morgan | LME Copper Futures^ | 03/2016 | (229,295 | ) | (235,467 | ) | (6,172 | ) | |||||||||||
| 25 | J.P. Morgan | LME Copper Futures^ | 03/2016 | (3,089,189 | ) | (2,942,656 | ) | 146,533 | ||||||||||||
| 5 | J.P. Morgan | LME Copper Futures^ | 03/2016 | (579,363 | ) | (588,594 | ) | (9,231 | ) | |||||||||||
| 8 | J.P. Morgan | LME Copper Futures^ | 03/2016 | (939,980 | ) | (940,970 | ) | (990 | ) | |||||||||||
| 7 | J.P. Morgan | LME Lead Futures^ | 01/2016 | (291,876 | ) | (314,463 | ) | (22,587 | ) | |||||||||||
| 4 | J.P. Morgan | LME Lead Futures^ | 01/2016 | (182,988 | ) | (179,680 | ) | 3,308 | ||||||||||||
| 2 | J.P. Morgan | LME Lead Futures^ | 01/2016 | (87,834 | ) | (89,834 | ) | (2,000 | ) | |||||||||||
| 2 | J.P. Morgan | LME Lead Futures^ | 01/2016 | (87,919 | ) | (89,832 | ) | (1,913 | ) | |||||||||||
| The accompanying notes are an integral part of these financial statements. | (Continued) |
| AQR Funds | Annual Report | December 2015 | ||||||||||||||
225
Table of Contents
| Consolidated Schedule of Investments | December 31, 2015 |
| AQR RISK-BALANCED COMMODITIES STRATEGY FUND |
| NUMBER OF CONTRACTS | COUNTERPARTY | DESCRIPTION | EXPIRATION DATE | VALUE AT TRADE DATE | VALUE AT DECEMBER 31, 2015 | UNREALIZED APPRECIATION (DEPRECIATION) | ||||||||||||||
| Short Contracts: (continued) | ||||||||||||||||||||
| 5 | J.P. Morgan | LME Lead Futures^ | 01/2016 | $ (215,260 | ) | $ (224,570 | ) | $ (9,310 | ) | |||||||||||
| 2 | J.P. Morgan | LME Lead Futures^ | 02/2016 | (82,994 | ) | (89,835 | ) | (6,841 | ) | |||||||||||
| 3 | J.P. Morgan | LME Lead Futures^ | 02/2016 | (121,493 | ) | (134,788 | ) | (13,295 | ) | |||||||||||
| 4 | J.P. Morgan | LME Lead Futures^ | 03/2016 | (164,488 | ) | (179,716 | ) | (15,228 | ) | |||||||||||
| 8 | J.P. Morgan | LME Lead Futures^ | 03/2016 | (332,580 | ) | (359,426 | ) | (26,846 | ) | |||||||||||
| 1 | J.P. Morgan | LME Lead Futures^ | 03/2016 | (40,885 | ) | (44,928 | ) | (4,043 | ) | |||||||||||
| 27 | J.P. Morgan | LME Lead Futures^ | 03/2016 | (1,131,998 | ) | (1,212,806 | ) | (80,808 | ) | |||||||||||
| 3 | J.P. Morgan | LME Lead Futures^ | 03/2016 | (129,011 | ) | (134,759 | ) | (5,748 | ) | |||||||||||
| 10 | J.P. Morgan | LME Lead Futures^ | 03/2016 | (405,554 | ) | (448,938 | ) | (43,384 | ) | |||||||||||
| 5 | J.P. Morgan | LME Lead Futures^ | 03/2016 | (215,613 | ) | (224,188 | ) | (8,575 | ) | |||||||||||
| 2 | J.P. Morgan | LME Nickel Futures^ | 01/2016 | (127,675 | ) | (105,424 | ) | 22,251 | ||||||||||||
| 4 | J.P. Morgan | LME Nickel Futures^ | 01/2016 | (249,830 | ) | (210,933 | ) | 38,897 | ||||||||||||
| 2 | J.P. Morgan | LME Nickel Futures^ | 01/2016 | (125,995 | ) | (105,504 | ) | 20,491 | ||||||||||||
| 1 | J.P. Morgan | LME Nickel Futures^ | 02/2016 | (58,197 | ) | (52,777 | ) | 5,420 | ||||||||||||
| 3 | J.P. Morgan | LME Nickel Futures^ | 02/2016 | (169,433 | ) | (158,409 | ) | 11,024 | ||||||||||||
| 6 | J.P. Morgan | LME Nickel Futures^ | 02/2016 | (322,664 | ) | (316,897 | ) | 5,767 | ||||||||||||
| 6 | J.P. Morgan | LME Nickel Futures^ | 03/2016 | (322,185 | ) | (317,137 | ) | 5,048 | ||||||||||||
| 1 | J.P. Morgan | LME Nickel Futures^ | 03/2016 | (54,148 | ) | (52,860 | ) | 1,288 | ||||||||||||
| 2 | J.P. Morgan | LME Nickel Futures^ | 03/2016 | (105,024 | ) | (105,727 | ) | (703 | ) | |||||||||||
| 4 | J.P. Morgan | LME Nickel Futures^ | 03/2016 | (206,498 | ) | (211,532 | ) | (5,034 | ) | |||||||||||
| 23 | J.P. Morgan | LME Nickel Futures^ | 03/2016 | (1,225,907 | ) | (1,216,332 | ) | 9,575 | ||||||||||||
| 8 | J.P. Morgan | LME Nickel Futures^ | 03/2016 | (417,174 | ) | (423,096 | ) | (5,922 | ) | |||||||||||
| 3 | J.P. Morgan | LME Nickel Futures^ | 03/2016 | (155,599 | ) | (158,661 | ) | (3,062 | ) | |||||||||||
| 3 | J.P. Morgan | LME Nickel Futures^ | 03/2016 | (156,209 | ) | (158,705 | ) | (2,496 | ) | |||||||||||
| 11 | J.P. Morgan | LME Zinc Futures^ | 01/2016 | (461,088 | ) | (438,405 | ) | 22,683 | ||||||||||||
| 7 | J.P. Morgan | LME Zinc Futures^ | 01/2016 | (321,108 | ) | (279,577 | ) | 41,531 | ||||||||||||
| 5 | J.P. Morgan | LME Zinc Futures^ | 01/2016 | (218,320 | ) | (200,037 | ) | 18,283 | ||||||||||||
| 2 | J.P. Morgan | LME Zinc Futures^ | 01/2016 | (87,553 | ) | (80,046 | ) | 7,507 | ||||||||||||
| 5 | J.P. Morgan | LME Zinc Futures^ | 01/2016 | (214,656 | ) | (200,172 | ) | 14,484 | ||||||||||||
| 2 | J.P. Morgan | LME Zinc Futures^ | 02/2016 | (83,022 | ) | (80,122 | ) | 2,900 | ||||||||||||
| 1 | J.P. Morgan | LME Zinc Futures^ | 02/2016 | (40,381 | ) | (40,087 | ) | 294 | ||||||||||||
| 5 | J.P. Morgan | LME Zinc Futures^ | 02/2016 | (188,182 | ) | (200,531 | ) | (12,349 | ) | |||||||||||
| 9 | J.P. Morgan | LME Zinc Futures^ | 03/2016 | (350,978 | ) | (361,247 | ) | (10,269 | ) | |||||||||||
| 2 | J.P. Morgan | LME Zinc Futures^ | 03/2016 | (76,673 | ) | (80,289 | ) | (3,616 | ) | |||||||||||
| 5 | J.P. Morgan | LME Zinc Futures^ | 03/2016 | (190,726 | ) | (200,897 | ) | (10,171 | ) | |||||||||||
| 53 | J.P. Morgan | LME Zinc Futures^ | 03/2016 | (2,218,529 | ) | (2,131,925 | ) | 86,604 | ||||||||||||
| 11 | J.P. Morgan | LME Zinc Futures^ | 03/2016 | (407,843 | ) | (442,475 | ) | (34,632 | ) | |||||||||||
| 5 | J.P. Morgan | LME Zinc Futures^ | 03/2016 | (192,360 | ) | (201,125 | ) | (8,765 | ) | |||||||||||
| 44 | Morgan Stanley and Co., International PLC | Wheat Futures^ | 03/2016 | (1,071,791 | ) | (1,034,000 | ) | 37,791 | ||||||||||||
|
|
|
|
|
| |||||||||||||||
| (34,552,393 | ) | (33,987,328 | ) | 565,065 | ||||||||||||||||
|
|
|
|
|
| |||||||||||||||
| $77,029,282 | $73,674,160 | $(3,355,122 | ) | |||||||||||||||||
|
|
|
|
|
| |||||||||||||||
| ^ | Represents positions held in the respective Subsidiary (Note 2). |
USD - United States Dollar
| The accompanying notes are an integral part of these financial statements. | (Continued) |
| AQR Funds | Annual Report | December 2015 | ||||||||||||||
226
Table of Contents
| Consolidated Schedule of Investments | December 31, 2015 |
| AQR RISK-BALANCED COMMODITIES STRATEGY FUND |
Collateral pledged to, or (received from), each counterparty for the Subsidiary (See Note 2) at December 31, 2015 was as follows:
| COUNTERPARTY | OVER THE COUNTER | EXCHANGE TRADED/ CENTRALLY CLEARED | TOTAL | |||||||||
| CitiBank | ||||||||||||
| Money Market Funds | $700,103 | $— | $700,103 | |||||||||
| ||||||||||||
| Deutsche Bank | ||||||||||||
| Money Market Funds | 900,025 | — | 900,025 | |||||||||
| ||||||||||||
| Goldman Sachs | ||||||||||||
| Cash | — | 500,912 | 500,912 | |||||||||
| ||||||||||||
| Macquarie Capital | ||||||||||||
| Money Market Funds | 260,000 | — | 260,000 | |||||||||
| ||||||||||||
| J.P. Morgan | ||||||||||||
| Cash | — | 3,084,407 | 3,084,407 | |||||||||
| ||||||||||||
| Morgan Stanley and Co., International PLC | ||||||||||||
| Cash | — | 5,890,407 | 5,890,407 | |||||||||
| ||||||||||||
| Societe Generale | ||||||||||||
| Money Market Funds | 100,000 | — | 100,000 | |||||||||
| ||||||||||||
| The accompanying notes are an integral part of these financial statements. |
| AQR Funds | Annual Report | December 2015 | ||||||||||||||
227
Table of Contents
| Consolidated Schedule of Investments | December 31, 2015 |
| AQR RISK PARITY FUND |
| GOVERNMENT RELATED OBLIGATIONS - 12.0% | INTEREST RATE | MATURITY DATE | CURRENCY | PRINCIPAL AMOUNT (000’s) | VALUE (Note 5) | |||||||||||||||
| Sovereign Debt - 12.0% | ||||||||||||||||||||
| Deutsche Bundesrepublik Inflation Linked Bond (Germany) | 0.100 | % | 04/15/23 | EUR | 4,354 | $ | 4,953,207 | |||||||||||||
| Deutsche Bundesrepublik Inflation Linked Bond (Germany) | 0.100 | % | 04/15/26 | EUR | 10,190 | 11,633,565 | ||||||||||||||
| Deutsche Bundesrepublik Inflation Linked Bond (Germany) | 1.750 | % | 04/15/20 | EUR | 7,238 | 8,660,852 | ||||||||||||||
| France Government Bond OAT (France) | 0.100 | % | 07/25/21 | EUR | 2,322 | 2,621,013 | ||||||||||||||
| France Government Bond OAT (France) | 0.100 | % | 03/01/25 | EUR | 2,803 | 3,119,674 | ||||||||||||||
| France Government Bond OAT (France) | 0.250 | % | 07/25/24 | EUR | 2,847 | 3,251,132 | ||||||||||||||
| France Government Bond OAT (France) | 1.198 | % | 07/25/22 | EUR | 2,823 | 3,417,492 | ||||||||||||||
| France Government Bond OAT (France) | 2.250 | % | 07/25/20 | EUR | 6,597 | 8,185,969 | ||||||||||||||
| United Kingdom Index Linked Treasury Gilt (United Kingdom) | 0.125 | % | 03/22/24 | GBP | 5,781 | 9,035,943 | ||||||||||||||
| United Kingdom Index Linked Treasury Gilt (United Kingdom) | 0.125 | % | 03/22/26 | GBP | 4,723 | 7,422,680 | ||||||||||||||
|
| |||||||||||||||||||
TOTAL GOVERNMENT RELATED OBLIGATIONS | 62,301,527 | |||||||||||||||||||
|
| |||||||||||||||||||
| U.S. TREASURY OBLIGATIONS - 18.2% | ||||||||||||||||||||
| U.S. Treasury Inflation Protected Securities - 18.2% | ||||||||||||||||||||
| U.S. Treasury Inflation Protected Securities | 0.125 | % | 04/15/19 | USD | 28,100 | 28,354,581 | ||||||||||||||
| U.S. Treasury Inflation Protected Securities | 0.125 | % | 04/15/20 | USD | 32,600 | 32,687,169 | ||||||||||||||
| U.S. Treasury Inflation Protected Securities | 0.125 | % | 07/15/24 | USD | 9,200 | 8,751,905 | ||||||||||||||
| U.S. Treasury Inflation Protected Securities | 0.250 | % | 01/15/25 | USD | 12,200 | 11,693,128 | ||||||||||||||
| U.S. Treasury Inflation Protected Securities | 0.375 | % | 07/15/25 | USD | 13,100 | 12,720,280 | ||||||||||||||
|
| |||||||||||||||||||
TOTAL U.S. TREASURY OBLIGATIONS | 94,207,063 | |||||||||||||||||||
|
| |||||||||||||||||||
| MONEY MARKET FUNDS - 43.6% | SHARES | |||||||||||||||||||
| BlackRock Liquidity Funds T-Fund Portfolio, Institutional Shares, 0.100% ^(a) | 13,574,800 | 13,574,800 | ||||||||||||||||||
| Dreyfus Treasury Cash Management, Class I, 0.090% ^(a) | 54,299,200 | 54,299,200 | ||||||||||||||||||
| J.P. Morgan U.S. Treasury Plus Money Market Fund - IM Shares, 0.129% ^(a)(b) | 84,457,775 | 84,457,775 | ||||||||||||||||||
| J.P. Morgan U.S. Treasury Plus Money Market Fund - Institutional Shares, 0.070% ^(a)(b) | 5,484,376 | 5,484,376 | ||||||||||||||||||
| UBS Money Series - UBS Select Treasury Preferred Fund, Class I, 0.140% ^(a) | 67,874,845 | 67,874,845 | ||||||||||||||||||
|
| |||||||||||||||||||
TOTAL MONEY MARKET FUNDS | 225,690,996 | |||||||||||||||||||
|
| |||||||||||||||||||
| SHORT-TERM INVESTMENTS - 20.8% | PRINCIPAL AMOUNT (000’s) | |||||||||||||||||||
| U.S. Treasury Bill, 0.066%, 04/07/2016 (c) | $ | 6,369 | 6,367,503 | |||||||||||||||||
| U.S. Treasury Bill, 0.099%, 03/31/2016 (c) | 4,774 | 4,772,985 | ||||||||||||||||||
| U.S. Treasury Bill, 0.141%, 01/28/2016 ^(c) | 9,656 | 9,656,160 | ||||||||||||||||||
| U.S. Treasury Bill, 0.161%, 02/04/2016 ^(c) | 55,425 | 55,428,177 | ||||||||||||||||||
| U.S. Treasury Bill, 0.238%, 02/18/2016 ^(c) | 3,162 | 3,162,557 | ||||||||||||||||||
| U.S. Treasury Bill, 0.264%, 03/03/2016 (c)(d) | 23,352 | 23,358,888 | ||||||||||||||||||
| U.S. Treasury Bill, 0.345%, 05/26/2016 ^(c) | 1,686 | 1,685,394 | ||||||||||||||||||
| U.S. Treasury Bill, 0.414%, 06/02/2016 ^(c) | 2,924 | 2,923,716 | ||||||||||||||||||
|
| |||||||||||||||||||
TOTAL SHORT-TERM INVESTMENTS | 107,355,380 | |||||||||||||||||||
|
| |||||||||||||||||||
TOTAL INVESTMENTS IN SECURITIES, AT VALUE - 94.6% (cost $493,883,647) | 489,554,966 | |||||||||||||||||||
|
| |||||||||||||||||||
| OTHER ASSETS IN EXCESS OF LIABILITIES - 5.4% (e) | 28,223,000 | |||||||||||||||||||
|
| |||||||||||||||||||
| NET ASSETS - 100.0% | $517,777,966 | |||||||||||||||||||
|
| |||||||||||||||||||
| The accompanying notes are an integral part of these financial statements. | (Continued) |
| AQR Funds | Annual Report | December 2015 | ||||||||||||||
228
Table of Contents
| Consolidated Schedule of Investments | December 31, 2015 |
| AQR RISK PARITY FUND |
All securities are United States companies, unless noted otherwise in parentheses.
| (a) | Represents annualized seven-day yield as of the close of the reporting period. |
| (b) | All or a portion of the security is pledged as collateral to the brokers for forward foreign currency exchange and swap contracts. |
| (c) | The rate shown is the effective yield at the date of purchase. |
| (d) | All or a portion of the security is pledged as collateral to the brokers for futures contracts. |
| (e) | Includes appreciation/(depreciation) on forward foreign currency exchange, futures and swap contracts. |
| ^ | All or a portion represents positions held in the respective Subsidiary (See Note 2). |
All securities are Level 2 with respect to ASC 820 (See Note 5).
The following abbreviations are used in portfolio descriptions:
EUR - Euro
GBP - British Pound
USD - United States Dollar
Credit default swap contracts sell protection as of December 31, 2015:
| COUNTERPARTY | REFERENCE ENTITY | FIXED ANNUAL RATE RECEIVED BY FUND | CURRENCY | CREDIT SPREAD | NOTIONAL AMOUNT | UPFRONT PREMIUM (RECEIVED) PAID | TERMINATION DATE | UNREALIZED APPRECIATION (DEPRECIATION) | ||||||||||||||||||||
| Exchange Cleared | ||||||||||||||||||||||||||||
| CitiBank | iTraxx Europe Crossover Series 24.V1 | 5.000 | % | EUR | 3.146 | % | 50,475,000 | $3,920,495 | 12/20/2020 | $655,761 | ||||||||||||||||||
| CitiBank | iTraxx Europe Series 24.V1 | 1.000 | % | EUR | 0.771 | % | 117,750,000 | 1,144,309 | 12/20/2020 | 319,774 | ||||||||||||||||||
| CitiBank | Markit CDX Emerging Market Index Series 24.V2 | 1.000 | % | USD | 3.575 | % | 20,500,000 | (2,333,705 | ) | 12/20/2020 | 102,278 | |||||||||||||||||
| CitiBank | Markit CDX North America High Yield Index Series 25.V1 | 5.000 | % | USD | 4.726 | % | 44,300,000 | 95,571 | 12/20/2020 | 472,831 | ||||||||||||||||||
| CitiBank | Markit CDX North America Investment Grade Index Series 25.V1 | 1.000 | % | USD | 0.885 | % | 129,375,000 | 939,812 | 12/20/2020 | (202,989 | ) | |||||||||||||||||
|
|
|
| |||||||||||||||||||||||||
| $3,766,482 | $1,347,655 | |||||||||||||||||||||||||||
|
|
|
| |||||||||||||||||||||||||
| The accompanying notes are an integral part of these financial statements. | (Continued) |
| AQR Funds | Annual Report | December 2015 | ||||||||||||||
229
Table of Contents
| Consolidated Schedule of Investments | December 31, 2015 |
| AQR RISK PARITY FUND |
Forward effective interest rate swap contracts outstanding as of December 31, 2015:
COUNTERPARTY | PAYMENTS MADE BY THE FUND | PAYMENTS RECEIVED BY THE FUND | CURRENCY | NOTIONAL AMOUNT | UPFRONT PREMIUM (RECEIVED) PAID | TERMINATION DATE | UNREALIZED APPRECIATION (DEPRECIATION) | |||||||||||||||||
| Exchange Cleared | ||||||||||||||||||||||||
| CitiBank | 0.500% | ( | 1) | CZK | 10,000,000 | $235 | 03/17/2021 | $3,505 | ||||||||||||||||
| CitiBank | 0.500% | ( | 1) | CZK | 10,000,000 | 1,399 | 03/17/2021 | 2,341 | ||||||||||||||||
| CitiBank | 0.500% | ( | 1) | CZK | 10,000,000 | (580 | ) | 03/17/2021 | 4,321 | |||||||||||||||
| CitiBank | 0.500% | ( | 1) | CZK | 50,000,000 | 13,593 | 03/17/2021 | 5,109 | ||||||||||||||||
| CitiBank | 0.500% | ( | 1) | CZK | 20,000,000 | 2,577 | 03/17/2021 | 4,904 | ||||||||||||||||
| CitiBank | (1) | 0.500 | % | CZK | 186,000,000 | (46,592 | ) | 03/17/2021 | (22,978 | ) | ||||||||||||||
| CitiBank | (1) | 0.500 | % | CZK | 10,000,000 | 2,935 | 03/17/2021 | (6,675 | ) | |||||||||||||||
| CitiBank | (1) | 0.500 | % | CZK | 30,000,000 | 2,703 | 03/17/2021 | (13,924 | ) | |||||||||||||||
| CitiBank | (1) | 0.500 | % | CZK | 10,000,000 | 574 | 03/17/2021 | (4,314 | ) | |||||||||||||||
| CitiBank | (1) | 0.500 | % | CZK | 30,000,000 | 1,568 | 03/17/2021 | (12,789 | ) | |||||||||||||||
| CitiBank | (1) | 0.500 | % | CZK | 10,000,000 | 2,892 | 03/17/2021 | (6,632 | ) | |||||||||||||||
| CitiBank | (1) | 0.500 | % | CZK | 50,000,000 | (24,476 | ) | 03/17/2021 | 5,774 | |||||||||||||||
| CitiBank | 1.500% | ( | 2) | HKD | 35,000,000 | 15,659 | 03/17/2021 | 8,614 | ||||||||||||||||
| CitiBank | 1.500% | ( | 2) | HKD | 6,000,000 | 12,093 | 03/17/2021 | (7,932 | ) | |||||||||||||||
| CitiBank | 1.500% | ( | 2) | HKD | 8,000,000 | 13,250 | 03/17/2021 | (7,702 | ) | |||||||||||||||
| CitiBank | 1.500% | ( | 2) | HKD | 5,000,000 | 2,885 | 03/17/2021 | 582 | ||||||||||||||||
| CitiBank | 1.500% | ( | 2) | HKD | 5,000,000 | 3,506 | 03/17/2021 | (39 | ) | |||||||||||||||
| CitiBank | 1.500% | ( | 2) | HKD | 11,000,000 | 1,507 | 03/17/2021 | 6,122 | ||||||||||||||||
| CitiBank | (2) | 1.500 | % | HKD | 7,000,000 | 2,810 | 03/17/2021 | (7,665 | ) | |||||||||||||||
| CitiBank | (2) | 1.500 | % | HKD | 7,000,000 | (3,276 | ) | 03/17/2021 | (1,579 | ) | ||||||||||||||
| CitiBank | (2) | 2.000 | % | HKD | 128,000,000 | 143,374 | 03/17/2021 | 168,974 | ||||||||||||||||
| CitiBank | (2) | 2.000 | % | HKD | 27,000,000 | 21,743 | 03/17/2021 | 44,143 | ||||||||||||||||
| CitiBank | (2) | 2.000 | % | HKD | 21,000,000 | 58,945 | 03/17/2021 | (7,700 | ) | |||||||||||||||
| CitiBank | (2) | 2.000 | % | HKD | 25,000,000 | 65,396 | 03/17/2021 | (4,391 | ) | |||||||||||||||
| CitiBank | 2.000% | ( | 3) | HUF | 200,000,000 | 6,361 | 03/17/2021 | (4,169 | ) | |||||||||||||||
| CitiBank | 2.000% | ( | 3) | HUF | 100,000,000 | (573 | ) | 03/17/2021 | 1,669 | |||||||||||||||
| CitiBank | 2.000% | ( | 3) | HUF | 100,000,000 | 1,084 | 03/17/2021 | 12 | ||||||||||||||||
| CitiBank | 2.000% | ( | 3) | HUF | 100,000,000 | 4,160 | 03/17/2021 | (3,064 | ) | |||||||||||||||
| CitiBank | 2.000% | ( | 3) | HUF | 600,000,000 | 33,612 | 03/17/2021 | (27,038 | ) | |||||||||||||||
| CitiBank | (3) | 2.000 | % | HUF | 300,000,000 | 2,827 | 03/17/2021 | (6,114 | ) | |||||||||||||||
| CitiBank | (3) | 2.000 | % | HUF | 100,000,000 | (1,762 | ) | 03/17/2021 | 666 | |||||||||||||||
| CitiBank | (3) | 2.000 | % | HUF | 100,000,000 | 966 | 03/17/2021 | (2,062 | ) | |||||||||||||||
| CitiBank | (3) | 2.000 | % | HUF | 100,000,000 | 1,222 | 03/17/2021 | (2,318 | ) | |||||||||||||||
| CitiBank | (3) | 2.500 | % | HUF | 300,000,000 | 21,257 | 03/17/2021 | 250 | ||||||||||||||||
| CitiBank | (3) | 2.500 | % | HUF | 100,000,000 | 6,738 | 03/17/2021 | 431 | ||||||||||||||||
| CitiBank | (3) | 2.500 | % | HUF | 2,330,000,000 | 10,100 | 03/17/2021 | 156,938 | ||||||||||||||||
| CitiBank | (3) | 2.500 | % | HUF | 600,000,000 | (37 | ) | 03/17/2021 | 43,051 | |||||||||||||||
| CitiBank | 2.000% | ( | 4) | PLN | 4,000,000 | (6,641 | ) | 03/17/2021 | 7,897 | |||||||||||||||
| CitiBank | 2.000% | ( | 4) | PLN | 5,000,000 | 6,672 | 03/17/2021 | (5,101 | ) | |||||||||||||||
| CitiBank | 2.000% | ( | 4) | PLN | 18,000,000 | 66,119 | 03/17/2021 | (60,465 | ) | |||||||||||||||
| CitiBank | 2.000% | ( | 4) | PLN | 2,000,000 | 1,516 | 03/17/2021 | (888 | ) | |||||||||||||||
| CitiBank | 2.000% | ( | 4) | PLN | 3,000,000 | 5,780 | 03/17/2021 | (4,838 | ) | |||||||||||||||
| CitiBank | 2.000% | ( | 4) | PLN | 2,000,000 | (235 | ) | 03/17/2021 | 863 | |||||||||||||||
| CitiBank | 2.000% | ( | 4) | PLN | 1,000,000 | 409 | 03/17/2021 | (95 | ) | |||||||||||||||
| CitiBank | (4) | 2.000 | % | PLN | 1,000,000 | 891 | 03/17/2021 | (1,206 | ) | |||||||||||||||
| CitiBank | (4) | 2.000 | % | PLN | 6,000,000 | 15,400 | 03/17/2021 | (17,284 | ) | |||||||||||||||
| CitiBank | (4) | 2.000 | % | PLN | 9,000,000 | 9,905 | 03/17/2021 | (12,732 | ) | |||||||||||||||
| CitiBank | (4) | 2.000 | % | PLN | 4,000,000 | 3,697 | 03/17/2021 | (4,953 | ) | |||||||||||||||
| CitiBank | (4) | 2.500 | % | PLN | 10,000,000 | 58,312 | 03/17/2021 | (879 | ) | |||||||||||||||
| CitiBank | (4) | 2.500 | % | PLN | 2,000,000 | 10,140 | 03/17/2021 | 1,347 | ||||||||||||||||
| CitiBank | (4) | 2.500 | % | PLN | 15,000,000 | 27,945 | 03/17/2021 | 58,204 | ||||||||||||||||
| CitiBank | (4) | 2.500 | % | PLN | 63,800,000 | 193,367 | 03/17/2021 | 173,053 | ||||||||||||||||
| The accompanying notes are an integral part of these financial statements. | (Continued) |
| AQR Funds | Annual Report | December 2015 | ||||||||||||||
230
Table of Contents
| Consolidated Schedule of Investments | December 31, 2015 |
| AQR RISK PARITY FUND |
| COUNTERPARTY | PAYMENTS MADE BY THE FUND | PAYMENTS RECEIVED BY THE FUND | CURRENCY | NOTIONAL AMOUNT | UPFRONT PREMIUM (RECEIVED) PAID | TERMINATION DATE | UNREALIZED APPRECIATION (DEPRECIATION) | |||||||||||||||||
| Exchange Cleared (continued) | ||||||||||||||||||||||||
| CitiBank | 2.500% | ( | 5) | SGD | 2,000,000 | $ (670 | ) | 03/17/2021 | $ 10,606 | |||||||||||||||
| CitiBank | 2.500% | ( | 5) | SGD | 3,000,000 | 15,236 | 03/17/2021 | (331 | ) | |||||||||||||||
| CitiBank | 2.500% | ( | 5) | SGD | 6,000,000 | 15,003 | 03/17/2021 | 14,806 | ||||||||||||||||
| CitiBank | 2.500% | ( | 5) | SGD | 1,000,000 | 5,060 | 03/17/2021 | (92 | ) | |||||||||||||||
| CitiBank | 2.500% | ( | 5) | SGD | 4,000,000 | 5,086 | 03/17/2021 | 14,786 | ||||||||||||||||
| CitiBank | 2.500% | ( | 5) | SGD | 2,000,000 | (1,336 | ) | 03/17/2021 | 11,272 | |||||||||||||||
| CitiBank | 2.500% | ( | 5) | SGD | 6,000,000 | 15,762 | 03/17/2021 | 14,046 | ||||||||||||||||
| CitiBank | (5) | 2.500 | % | SGD | 14,300,000 | (142,803 | ) | 03/17/2021 | 71,759 | |||||||||||||||
| CitiBank | (5) | 2.500 | % | SGD | 14,300,000 | (108,010 | ) | 03/17/2021 | 36,966 | |||||||||||||||
| CitiBank | (5) | 2.500 | % | SGD | 200,000 | (1,378 | ) | 03/17/2021 | 384 | |||||||||||||||
| CitiBank | (5) | 2.500 | % | SGD | 7,000,000 | 27,518 | 03/17/2021 | (62,295 | ) | |||||||||||||||
| CitiBank | (5) | 2.500 | % | SGD | 2,000,000 | 2,118 | 03/17/2021 | (12,054 | ) | |||||||||||||||
| CitiBank | (5) | 2.500 | % | SGD | 10,000,000 | (47,026 | ) | 03/17/2021 | (2,656 | ) | ||||||||||||||
| CitiBank | (5) | 2.500 | % | SGD | 1,000,000 | 4,984 | 03/17/2021 | (9,952 | ) | |||||||||||||||
| CitiBank | (5) | 2.500 | % | SGD | 7,000,000 | 19,263 | 03/17/2021 | (54,040 | ) | |||||||||||||||
| CitiBank | (5) | 2.500 | % | SGD | 5,000,000 | (13,014 | ) | 03/17/2021 | (11,826 | ) | ||||||||||||||
| CitiBank | (5) | 2.500 | % | SGD | 19,000,000 | (212,435 | ) | 03/17/2021 | 118,041 | |||||||||||||||
| CitiBank | (6) | 8.000 | % | ZAR | 40,000,000 | 21,513 | 03/17/2021 | (138,601 | ) | |||||||||||||||
| CitiBank | (6) | 8.000 | % | ZAR | 260,300,000 | (250,230 | ) | 03/17/2021 | (511,721 | ) | ||||||||||||||
| CitiBank | (6) | 8.000 | % | ZAR | 30,000,000 | (7,464 | ) | 03/17/2021 | (80,352 | ) | ||||||||||||||
| CitiBank | (6) | 8.000 | % | ZAR | 40,000,000 | (1,775 | ) | 03/17/2021 | (115,313 | ) | ||||||||||||||
| CitiBank | (6) | 8.000 | % | ZAR | 10,000,000 | 7,212 | 03/17/2021 | (36,484 | ) | |||||||||||||||
| CitiBank | (6) | 8.000 | % | ZAR | 30,000,000 | (3,849 | ) | 03/17/2021 | (83,967 | ) | ||||||||||||||
| CitiBank | (6) | 8.000 | % | ZAR | 30,000,000 | (7,938 | ) | 03/17/2021 | (79,878 | ) | ||||||||||||||
| CitiBank | (6) | 8.000 | % | ZAR | 20,000,000 | (3,377 | ) | 03/17/2021 | (55,167 | ) | ||||||||||||||
| CitiBank | 8.000% | ( | 6) | ZAR | 10,000,000 | 3,463 | 03/17/2021 | 25,809 | ||||||||||||||||
| CitiBank | 8.000% | ( | 6) | ZAR | 10,000,000 | 5,248 | 03/17/2021 | 24,024 | ||||||||||||||||
| CitiBank | 9.000% | ( | 6) | ZAR | 10,000,000 | (7,010 | ) | 03/17/2021 | 10,726 | |||||||||||||||
| CitiBank | 9.000% | ( | 6) | ZAR | 20,000,000 | (5,022 | ) | 03/17/2021 | 12,455 | |||||||||||||||
| CitiBank | 9.000% | ( | 6) | ZAR | 10,000,000 | (6,564 | ) | 03/17/2021 | 10,281 | |||||||||||||||
| CitiBank | 9.000% | ( | 6) | ZAR | 20,000,000 | (7,780 | ) | 03/17/2021 | 15,212 | |||||||||||||||
| CitiBank | 9.000% | ( | 6) | ZAR | 10,000,000 | (2,063 | ) | 03/17/2021 | 5,779 | |||||||||||||||
|
|
|
| |||||||||||||||||||||
| $91,674 | $(416,533 | ) | ||||||||||||||||||||||
|
|
|
| |||||||||||||||||||||
Interest rate swap contracts outstanding as of December 31, 2015:
| COUNTERPARTY | PAYMENTS MADE BY THE FUND | PAYMENTS RECEIVED BY THE FUND | CURRENCY | NOTIONAL AMOUNT | UPFRONT PREMIUM (RECEIVED) PAID | TERMINATION DATE | UNREALIZED APPRECIATION (DEPRECIATION) | |||||||||||||||||
| Over the Counter | ||||||||||||||||||||||||
| CitiBank | 1.845% | ( | 7) | KRW* | 3,000,000,000 | $— | 03/17/2021 | $(12,329 | ) | |||||||||||||||
| CitiBank | 1.855% | ( | 7) | KRW* | 1,000,000,000 | — | 03/17/2021 | (4,516 | ) | |||||||||||||||
| CitiBank | 1.868% | ( | 7) | KRW* | 10,000,000,000 | — | 03/17/2021 | (50,453 | ) | |||||||||||||||
| CitiBank | 1.935% | ( | 7) | KRW* | 2,000,000,000 | — | 03/17/2021 | (15,543 | ) | |||||||||||||||
| CitiBank | 1.935% | ( | 7) | KRW* | 1,000,000,000 | — | 03/17/2021 | (7,771 | ) | |||||||||||||||
| CitiBank | 1.960% | ( | 7) | KRW* | 3,000,000,000 | — | 03/17/2021 | (26,366 | ) | |||||||||||||||
| CitiBank | (7) | 1.713 | % | KRW* | 6,000,000,000 | — | 03/17/2021 | (7,690 | ) | |||||||||||||||
| CitiBank | (7) | 1.739 | % | KRW* | 4,000,000,000 | — | 03/17/2021 | (814 | ) | |||||||||||||||
| CitiBank | (7) | 1.740 | % | KRW* | 5,000,000,000 | — | 03/17/2021 | (814 | ) | |||||||||||||||
| CitiBank | (7) | 1.765 | % | KRW* | 1,000,000,000 | — | 03/17/2021 | 854 | ||||||||||||||||
| CitiBank | (7) | 1.843 | % | KRW* | 11,400,000,000 | — | 03/17/2021 | 45,689 | ||||||||||||||||
| The accompanying notes are an integral part of these financial statements. | (Continued) |
| AQR Funds | Annual Report | December 2015 | ||||||||||||||
231
Table of Contents
| Consolidated Schedule of Investments | December 31, 2015 |
| AQR RISK PARITY FUND |
| COUNTERPARTY | PAYMENTS MADE BY THE FUND | PAYMENTS RECEIVED BY THE FUND | CURRENCY | NOTIONAL AMOUNT | UPFRONT PREMIUM (RECEIVED) PAID | TERMINATION DATE | UNREALIZED APPRECIATION (DEPRECIATION) | |||||||||||||||||
| Over the Counter (continued) | ||||||||||||||||||||||||
| CitiBank | (7) | 1.860 | % | KRW* | 15,200,000,000 | $ — | 03/17/2021 | $ 71,742 | ||||||||||||||||
| CitiBank | (7) | 1.860 | % | KRW* | 11,400,000,000 | — | 03/17/2021 | 53,806 | ||||||||||||||||
| CitiBank | (7) | 1.888 | % | KRW* | 3,000,000,000 | — | 03/17/2021 | 17,516 | ||||||||||||||||
| CitiBank | (7) | 1.920 | % | KRW* | 9,000,000,000 | — | 03/17/2021 | 64,450 | ||||||||||||||||
|
|
|
| |||||||||||||||||||||
| $— | $127,761 | |||||||||||||||||||||||
|
|
|
| |||||||||||||||||||||
| * | Non-deliverable swap (See Note 4). |
| (1) | 6 Month Prague Interbank Offered Rate |
| (2) | 3 Month Hong Kong Interbank Offered Rate |
| (3) | 6 Month Budapest Interbank Offered Rate |
| (4) | 6 Month Warsaw Interbank Offered Rate |
| (5) | 6 Month Singapore Interbank Offered Rate |
| (6) | 3 Month Johannesburg Interbank Agreed Rate |
| (7) | 3 Month Korean Certificate of Deposit |
Total return swap contracts outstanding as of December 31, 2015:
Over the Counter
| COUNTERPARTY | UNDERLYING REFERENCE INSTRUMENT | TERMINATION DATE | CURRENCY | NOTIONAL VALUE | UNREALIZED APPRECIATION (DEPRECIATION) | |||||||||
| Morgan Stanley and Co., International PLC | Bovespa Index February Futures | 02/2016 | BRL | 3,691,445 | $(46,084 | ) | ||||||||
| CitiBank | Corn March Futures^ | 02/2016 | USD | 636,172 | (44,234 | ) | ||||||||
| Deutsche Bank | Corn March Futures^ | 02/2016 | USD | 3,593,587 | (328,962 | ) | ||||||||
| Macquarie Capital | Corn March Futures^ | 02/2016 | USD | 219,079 | (21,767 | ) | ||||||||
| CitiBank | Cotton No. 2 March Futures^ | 02/2016 | USD | 1,123,910 | 15,130 | |||||||||
| Deutsche Bank | Cotton No. 2 March Futures^ | 02/2016 | USD | 61,982 | 1,298 | |||||||||
| Macquarie Capital | Cotton No. 2 March Futures^ | 02/2016 | USD | 248,854 | 4,266 | |||||||||
| Bank of America | Hang Seng Index January Futures | 01/2016 | HKD | 8,831,389 | (8,693 | ) | ||||||||
| Societe Generale | Hard Red Winter Wheat March Futures^ | 02/2016 | USD | 73,587 | (3,312 | ) | ||||||||
| Bank of America | H-SHARES Index January Futures | 01/2016 | HKD | 56,005,665 | (151,257 | ) | ||||||||
| Goldman Sachs | H-SHARES Index January Futures | 01/2016 | HKD | 3,952,043 | (9,037 | ) | ||||||||
| Morgan Stanley and Co., International PLC | KOSPI Index 200 March Futures | 03/2016 | KRW | 4,413,097,479 | 29,692 | |||||||||
| Deutsche Bank | Lean Hogs February Futures^ | 02/2016 | USD | 371,902 | (13,102 | ) | ||||||||
| Macquarie Capital | Lean Hogs February Futures^ | 02/2016 | USD | (177,716 | ) | (2,473 | ) | |||||||
| Macquarie Capital | Lean Hogs February Futures^ | 02/2016 | USD | 836,907 | (23,627 | ) | ||||||||
| Merrill Lynch | Lean Hogs February Futures^ | 02/2016 | USD | 388,720 | (6,000 | ) | ||||||||
| Societe Generale | Lean Hogs February Futures^ | 02/2016 | USD | 24,199 | (279 | ) | ||||||||
| Deutsche Bank | Live Cattle February Futures^ | 02/2016 | USD | 2,841,560 | (105,560 | ) | ||||||||
| Merrill Lynch | Live Cattle February Futures^ | 02/2016 | USD | 564,610 | (17,410 | ) | ||||||||
| Morgan Stanley and Co., International PLC | MSCI Taiwan Stock Index January Futures | 01/2016 | USD | 2,452,183 | (16,983 | ) | ||||||||
| Morgan Stanley and Co., International PLC | SGX S&P CNX Nifty Index January Futures | 01/2016 | USD | 190,582 | 170 | |||||||||
| CitiBank | Soybean March Futures^ | 02/2016 | USD | 1,868,801 | (10,664 | ) | ||||||||
| The accompanying notes are an integral part of these financial statements. | (Continued) |
| AQR Funds | Annual Report | December 2015 | ||||||||||||||
232
Table of Contents
| Consolidated Schedule of Investments | December 31, 2015 |
| AQR RISK PARITY FUND |
| COUNTERPARTY | UNDERLYING REFERENCE INSTRUMENT | TERMINATION DATE | CURRENCY | NOTIONAL VALUE | UNREALIZED APPRECIATION (DEPRECIATION) | |||||||||
| Deutsche Bank | Soybean March Futures^ | 02/2016 | USD | 301,962 | $ 525 | |||||||||
| Macquarie Capital | Soybean March Futures^ | 02/2016 | USD | 821,019 | 19 | |||||||||
| Societe Generale | Soybean March Futures^ | 02/2016 | USD | 2,071,432 | 2,768 | |||||||||
| Macquarie Capital | Soybean Oil March Futures^ | 02/2016 | USD | 111,433 | (733 | ) | ||||||||
| Morgan Stanley and Co., International PLC | Swiss Market Index March Futures | 03/2016 | CHF | 2,738,947 | 60,218 | |||||||||
| CitiBank | Wheat March Futures^ | 02/2016 | USD | 599,575 | (59,030 | ) | ||||||||
| CitiBank | Wheat March Futures^ | 02/2016 | USD | (596,419 | ) | 55,876 | ||||||||
| Merrill Lynch | Wheat March Futures^ | 03/2016 | USD | (155,700 | ) | 14,688 | ||||||||
| Merrill Lynch | Wheat March Futures^ | 03/2016 | USD | 156,000 | (14,988 | ) | ||||||||
|
| |||||||||||||
| $(699,545 | ) | |||||||||||||
|
| |||||||||||||
| ^ | Represents positions held in the respective Subsidiary (See Note 2). |
Open futures contracts outstanding at December 31, 2015:
Exchange Traded
| NUMBER OF CONTRACTS | COUNTERPARTY | DESCRIPTION | EXPIRATION DATE | VALUE AT TRADE DATE | VALUE AT DECEMBER 31, 2015 | UNREALIZED APPRECIATION (DEPRECIATION) | ||||||||||||||
| Long Contracts: | ||||||||||||||||||||
| 4 | Barclays Capital | KOSPI Index 200 Futures | 03/2016 | $405,201 | $410,132 | $4,931 | ||||||||||||||
| 154 | Goldman Sachs | Brent Crude Futures^ | 02/2016 | 6,397,347 | 5,933,620 | (463,727 | ) | |||||||||||||
| 7 | Morgan Stanley and Co., International PLC | Cocoa Futures^ | 03/2016 | 214,777 | 224,770 | 9,993 | ||||||||||||||
| 42 | Morgan Stanley and Co., International PLC | Coffee ‘C’ Futures^ | 03/2016 | 2,122,353 | 1,995,525 | (126,828 | ) | |||||||||||||
| 172 | Morgan Stanley and Co., International PLC | Corn Futures^ | 03/2016 | 3,419,577 | 3,085,250 | (334,327 | ) | |||||||||||||
| 34 | Morgan Stanley and Co., International PLC | Cotton No. 2 Futures^ | 03/2016 | 1,058,225 | 1,075,760 | 17,535 | ||||||||||||||
| 5 | Morgan Stanley and Co., International PLC | Feeder Cattle Futures^ | 03/2016 | 425,334 | 409,125 | (16,209 | ) | |||||||||||||
| 80 | Goldman Sachs | Gas Oil Futures^ | 03/2016 | 3,087,614 | 2,738,000 | (349,614 | ) | |||||||||||||
| 36 | Morgan Stanley and Co., International PLC | Gasoline RBOB Futures^ | 02/2016 | 1,927,427 | 1,962,879 | 35,452 | ||||||||||||||
| 83 | Morgan Stanley and Co., International PLC | Gold 100 OZ Futures^ | 02/2016 | 9,467,424 | 8,799,660 | (667,764 | ) | |||||||||||||
| 5 | Morgan Stanley and Co., International PLC | Hard Red Winter Wheat Futures^ | 03/2016 | 121,903 | 117,125 | (4,778 | ) | |||||||||||||
| 30 | Morgan Stanley and Co., International PLC | Heating Oil ULSD Futures^ | 02/2016 | 1,670,718 | 1,447,614 | (223,104 | ) | |||||||||||||
| The accompanying notes are an integral part of these financial statements. | (Continued) |
| AQR Funds | Annual Report | December 2015 | ||||||||||||||
233
Table of Contents
| Consolidated Schedule of Investments | December 31, 2015 |
| AQR RISK PARITY FUND |
| NUMBER OF CONTRACTS | COUNTERPARTY | DESCRIPTION | EXPIRATION DATE | VALUE AT TRADE DATE | VALUE AT DECEMBER 31, 2015 | UNREALIZED APPRECIATION (DEPRECIATION) | ||||||||||||||
| Long Contracts: (continued) | ||||||||||||||||||||
| 8 | Morgan Stanley and Co., International PLC | Lean Hogs Futures^ | 02/2016 | $ 195,810 | $ 191,360 | $ (4,450 | ) | |||||||||||||
| 13 | Morgan Stanley and Co., International PLC | Live Cattle Futures^ | 02/2016 | 738,008 | 711,360 | (26,648 | ) | |||||||||||||
| 10 | J.P. Morgan | LME Aluminum Futures^ | 01/2016 | 390,484 | 375,150 | (15,334 | ) | |||||||||||||
| 11 | J.P. Morgan | LME Aluminum Futures^ | 01/2016 | 434,406 | 413,532 | (20,874 | ) | |||||||||||||
| 3 | J.P. Morgan | LME Aluminum Futures^ | 01/2016 | 116,376 | 112,886 | (3,490 | ) | |||||||||||||
| 3 | J.P. Morgan | LME Aluminum Futures^ | 01/2016 | 115,621 | 112,913 | (2,708 | ) | |||||||||||||
| 1 | J.P. Morgan | LME Aluminum Futures^ | 01/2016 | 38,023 | 37,637 | (386 | ) | |||||||||||||
| 2 | J.P. Morgan | LME Aluminum Futures^ | 01/2016 | 75,854 | 75,275 | (579 | ) | |||||||||||||
| 4 | J.P. Morgan | LME Aluminum Futures^ | 01/2016 | 148,552 | 150,550 | 1,998 | ||||||||||||||
| 3 | J.P. Morgan | LME Aluminum Futures^ | 01/2016 | 111,102 | 112,935 | 1,833 | ||||||||||||||
| 1 | J.P. Morgan | LME Aluminum Futures^ | 02/2016 | 37,477 | 37,705 | 228 | ||||||||||||||
| 7 | J.P. Morgan | LME Aluminum Futures^ | 02/2016 | 262,517 | 264,206 | 1,689 | ||||||||||||||
| 13 | J.P. Morgan | LME Aluminum Futures^ | 02/2016 | 475,673 | 490,467 | 14,794 | ||||||||||||||
| 9 | J.P. Morgan | LME Aluminum Futures^ | 03/2016 | 334,035 | 339,694 | 5,659 | ||||||||||||||
| 160 | J.P. Morgan | LME Aluminum Futures^ | 03/2016 | 6,348,334 | 6,030,999 | (317,335 | ) | |||||||||||||
| 17 | J.P. Morgan | LME Aluminum Futures^ | 03/2016 | 631,167 | 641,007 | 9,840 | ||||||||||||||
| 1 | J.P. Morgan | LME Aluminum Futures^ | 03/2016 | 36,752 | 37,691 | 939 | ||||||||||||||
| 1 | J.P. Morgan | LME Copper Futures^ | 01/2016 | 128,752 | 117,655 | (11,097 | ) | |||||||||||||
| 13 | J.P. Morgan | LME Copper Futures^ | 01/2016 | 1,667,630 | 1,529,808 | (137,822 | ) | |||||||||||||
| 7 | J.P. Morgan | LME Copper Futures^ | 01/2016 | 930,323 | 824,294 | (106,029 | ) | |||||||||||||
| 1 | J.P. Morgan | LME Copper Futures^ | 01/2016 | 131,432 | 117,801 | (13,631 | ) | |||||||||||||
| 1 | J.P. Morgan | LME Copper Futures^ | 01/2016 | 130,656 | 117,813 | (12,843 | ) | |||||||||||||
| 1 | J.P. Morgan | LME Copper Futures^ | 01/2016 | 129,177 | 117,787 | (11,390 | ) | |||||||||||||
| 2 | J.P. Morgan | LME Copper Futures^ | 01/2016 | 262,583 | 235,556 | (27,027 | ) | |||||||||||||
| 1 | J.P. Morgan | LME Copper Futures^ | 01/2016 | 130,037 | 117,760 | (12,277 | ) | |||||||||||||
| 1 | J.P. Morgan | LME Copper Futures^ | 01/2016 | 130,449 | 117,750 | (12,699 | ) | |||||||||||||
| 2 | J.P. Morgan | LME Copper Futures^ | 01/2016 | 259,823 | 235,505 | (24,318 | ) | |||||||||||||
| 2 | J.P. Morgan | LME Copper Futures^ | 01/2016 | 257,839 | 235,510 | (22,329 | ) | |||||||||||||
| 1 | J.P. Morgan | LME Copper Futures^ | 02/2016 | 126,176 | 117,772 | (8,404 | ) | |||||||||||||
| 1 | J.P. Morgan | LME Copper Futures^ | 02/2016 | 121,579 | 117,781 | (3,798 | ) | |||||||||||||
| 2 | J.P. Morgan | LME Copper Futures^ | 02/2016 | 230,805 | 235,549 | 4,744 | ||||||||||||||
| 3 | J.P. Morgan | LME Copper Futures^ | 03/2016 | 342,009 | 353,231 | 11,222 | ||||||||||||||
| 1 | J.P. Morgan | LME Copper Futures^ | 03/2016 | 114,652 | 117,733 | 3,081 | ||||||||||||||
| 67 | J.P. Morgan | LME Copper Futures^ | 03/2016 | 8,712,452 | 7,886,319 | (826,133 | ) | |||||||||||||
| 7 | J.P. Morgan | LME Copper Futures^ | 03/2016 | 811,142 | 824,031 | 12,889 | ||||||||||||||
| 5 | J.P. Morgan | LME Lead Futures^ | 01/2016 | 202,833 | 224,623 | 21,790 | ||||||||||||||
| 4 | J.P. Morgan | LME Lead Futures^ | 01/2016 | 166,410 | 179,693 | 13,283 | ||||||||||||||
| 4 | J.P. Morgan | LME Lead Futures^ | 01/2016 | 182,511 | 179,680 | (2,831 | ) | |||||||||||||
| 2 | J.P. Morgan | LME Lead Futures^ | 02/2016 | 83,006 | 89,835 | 6,829 | ||||||||||||||
| 1 | J.P. Morgan | LME Lead Futures^ | 02/2016 | 40,502 | 44,929 | 4,427 | ||||||||||||||
| 2 | J.P. Morgan | LME Lead Futures^ | 03/2016 | 81,941 | 89,855 | 7,914 | ||||||||||||||
| 37 | J.P. Morgan | LME Lead Futures^ | 03/2016 | 1,660,265 | 1,661,994 | 1,729 | ||||||||||||||
| 6 | J.P. Morgan | LME Lead Futures^ | 03/2016 | 258,052 | 269,518 | 11,466 | ||||||||||||||
| 3 | J.P. Morgan | LME Nickel Futures^ | 01/2016 | 177,802 | 158,050 | (19,752 | ) | |||||||||||||
| 2 | J.P. Morgan | LME Nickel Futures^ | 01/2016 | 121,205 | 105,379 | (15,826 | ) | |||||||||||||
| 1 | J.P. Morgan | LME Nickel Futures^ | 01/2016 | 61,853 | 52,731 | (9,122 | ) | |||||||||||||
| 1 | J.P. Morgan | LME Nickel Futures^ | 01/2016 | 62,616 | 52,733 | (9,883 | ) | |||||||||||||
| 2 | J.P. Morgan | LME Nickel Futures^ | 01/2016 | 126,008 | 105,488 | (20,520 | ) | |||||||||||||
| 2 | J.P. Morgan | LME Nickel Futures^ | 02/2016 | 108,486 | 105,633 | (2,853 | ) | |||||||||||||
| 1 | J.P. Morgan | LME Nickel Futures^ | 03/2016 | 51,577 | 52,883 | 1,306 | ||||||||||||||
| 23 | J.P. Morgan | LME Nickel Futures^ | 03/2016 | 1,444,518 | 1,216,332 | (228,186 | ) | |||||||||||||
| 10 | J.P. Morgan | LME Nickel Futures^ | 03/2016 | 520,885 | 528,870 | 7,985 | ||||||||||||||
| The accompanying notes are an integral part of these financial statements. | (Continued) |
| AQR Funds | Annual Report | December 2015 | ||||||||||||||
234
Table of Contents
| Consolidated Schedule of Investments | December 31, 2015 |
| AQR RISK PARITY FUND |
| NUMBER OF CONTRACTS | COUNTERPARTY | DESCRIPTION | EXPIRATION DATE | VALUE AT TRADE DATE | VALUE AT DECEMBER 31, 2015 | UNREALIZED APPRECIATION (DEPRECIATION) | ||||||||||||||
| Long Contracts: (continued) | ||||||||||||||||||||
| 6 | J.P. Morgan | LME Zinc Futures^ | 01/2016 | $ 248,450 | $ 238,984 | $ (9,466 | ) | |||||||||||||
| 6 | J.P. Morgan | LME Zinc Futures^ | 01/2016 | 251,565 | 239,130 | (12,435 | ) | |||||||||||||
| 3 | J.P. Morgan | LME Zinc Futures^ | 01/2016 | 136,401 | 119,819 | (16,582 | ) | |||||||||||||
| 1 | J.P. Morgan | LME Zinc Futures^ | 01/2016 | 43,628 | 40,027 | (3,601 | ) | |||||||||||||
| 1 | J.P. Morgan | LME Zinc Futures^ | 01/2016 | 43,603 | 40,030 | (3,573 | ) | |||||||||||||
| 1 | J.P. Morgan | LME Zinc Futures^ | 01/2016 | 43,002 | 40,034 | (2,968 | ) | |||||||||||||
| 5 | J.P. Morgan | LME Zinc Futures^ | 02/2016 | 208,137 | 200,303 | (7,834 | ) | |||||||||||||
| 2 | J.P. Morgan | LME Zinc Futures^ | 02/2016 | 80,855 | 80,175 | (680 | ) | |||||||||||||
| 2 | J.P. Morgan | LME Zinc Futures^ | 02/2016 | 75,605 | 80,213 | 4,608 | ||||||||||||||
| 60 | J.P. Morgan | LME Zinc Futures^ | 03/2016 | 2,666,196 | 2,413,500 | (252,696 | ) | |||||||||||||
| 47 | Morgan Stanley and Co., International PLC | Natural Gas Futures^ | 02/2016 | 1,029,224 | 1,110,610 | 81,386 | ||||||||||||||
| 93 | Morgan Stanley and Co., International PLC | Silver Futures^ | 03/2016 | 7,145,227 | 6,418,395 | (726,832 | ) | |||||||||||||
| 35 | Morgan Stanley and Co., International PLC | Soybean Futures^ | 03/2016 | 1,535,857 | 1,512,438 | (23,419 | ) | |||||||||||||
| 27 | Morgan Stanley and Co., International PLC | Soybean Meal Futures^ | 03/2016 | 790,216 | 716,850 | (73,366 | ) | |||||||||||||
| 153 | Morgan Stanley and Co., International PLC | Soybean Oil Futures^ | 03/2016 | 2,795,920 | 2,822,850 | 26,930 | ||||||||||||||
| 196 | Morgan Stanley and Co., International PLC | Sugar #11 (World Markets) Futures^ | 02/2016 | 2,880,088 | 3,345,485 | 465,397 | ||||||||||||||
| 59 | Morgan Stanley and Co., International PLC | Wheat Futures^ | 03/2016 | 1,528,199 | 1,386,500 | (141,699 | ) | |||||||||||||
| 220 | Morgan Stanley and Co., International PLC | WTI Crude Futures^ | 02/2016 | 8,859,693 | 8,397,400 | (462,293 | ) | |||||||||||||
| 8 | Barclays Capital | Amsterdam Index Futures | 01/2016 | 757,716 | 768,289 | 10,573 | ||||||||||||||
| 41 | Barclays Capital | CAC40 Index Futures | 01/2016 | 2,058,599 | 2,066,765 | 8,166 | ||||||||||||||
| 9 | Barclays Capital | DAX Index Futures | 03/2016 | 2,589,025 | 2,633,956 | 44,931 | ||||||||||||||
| 46 | Barclays Capital | E-Mini Russell 2000 Futures | 03/2016 | 5,156,795 | 5,204,900 | 48,105 | ||||||||||||||
| 277 | Barclays Capital | Euro Stoxx 50 Index Futures | 03/2016 | 9,786,695 | 9,879,796 | 93,101 | ||||||||||||||
| 51 | Barclays Capital | FTSE 100 Index Futures | 03/2016 | 4,549,859 | 4,659,917 | 110,058 | ||||||||||||||
| 34 | J.P. Morgan | FTSE/JSE Top 40 Index Futures | 03/2016 | 974,975 | 1,017,296 | 42,321 | ||||||||||||||
| 7 | Barclays Capital | FTSE/MIB Index Futures | 03/2016 | 820,704 | 815,574 | (5,130 | ) | |||||||||||||
| 14 | Barclays Capital | Hang Seng Index Futures | 01/2016 | 1,989,458 | 1,978,955 | (10,503 | ) | |||||||||||||
| 7 | Barclays Capital | H-SHARES Index Futures | 01/2016 | 444,607 | 438,287 | (6,320 | ) | |||||||||||||
| 2 | Barclays Capital | IBEX 35 Index Futures | 01/2016 | 214,046 | 207,054 | (6,992 | ) | |||||||||||||
| 4 | J.P. Morgan | KOSPI Index 200 Futures | 03/2016 | 410,666 | 410,132 | (534 | ) | |||||||||||||
| 16 | Barclays Capital | MSCI Taiwan Stock Index Futures | 01/2016 | 488,928 | 487,040 | (1,888 | ) | |||||||||||||
| 485 | Barclays Capital | S&P 500 E-Mini Futures | 03/2016 | 48,749,212 | 49,358,450 | 609,238 | ||||||||||||||
| 42 | Barclays Capital | S&P MID 400 E-Mini Futures | 03/2016 | 5,816,172 | 5,852,700 | 36,528 | ||||||||||||||
| 38 | Barclays Capital | SPI 200 Index Futures | 03/2016 | 3,418,790 | 3,639,237 | 220,447 | ||||||||||||||
| 71 | Barclays Capital | TOPIX Index Futures | 03/2016 | 9,276,610 | 9,141,188 | (135,422 | ) | |||||||||||||
| 13 | Goldman Sachs | 10-Year Japanese Government Bond Futures | 03/2016 | 16,092,391 | 16,119,806 | 27,415 | ||||||||||||||
| 125 | J.P. Morgan | Australia 10-Year Bond Futures | 03/2016 | 11,508,297 | 11,558,305 | 50,008 | ||||||||||||||
| 112 | Goldman Sachs | Canadian 10-Year Bond Futures | 03/2016 | 11,184,589 | 11,412,069 | 227,480 | ||||||||||||||
| 643 | Goldman Sachs | Euro-Bund Futures | 03/2016 | 111,828,495 | 110,351,375 | (1,477,120 | ) | |||||||||||||
| The accompanying notes are an integral part of these financial statements. | (Continued) |
| AQR Funds | Annual Report | December 2015 | ||||||||||||||
235
Table of Contents
| Consolidated Schedule of Investments | December 31, 2015 |
| AQR RISK PARITY FUND |
| NUMBER OF CONTRACTS | COUNTERPARTY | DESCRIPTION | EXPIRATION DATE | VALUE AT TRADE DATE | VALUE AT DECEMBER 31, 2015 | UNREALIZED APPRECIATION (DEPRECIATION) | ||||||||||||||
| Long Contracts: (continued) | ||||||||||||||||||||
| 20 | Goldman Sachs | Long Gilt Futures | 03/2016 | $ 3,457,209 | $ 3,442,847 | $ (14,362 | ) | |||||||||||||
| 1,648 | Morgan Stanley and Co., International PLC | U.S. Treasury 10-Year Note Futures | 03/2016 | 208,094,217 | 207,493,500 | (600,717 | ) | |||||||||||||
|
|
|
|
|
| |||||||||||||||
| 550,805,998 | 545,012,889 | (5,793,109 | ) | |||||||||||||||||
|
|
|
|
|
| |||||||||||||||
| Short Contracts: | ||||||||||||||||||||
| 10 | J.P. Morgan | LME Aluminum Futures^ | 01/2016 | $(390,476 | ) | $(375,151 | ) | $15,325 | ||||||||||||
| 11 | J.P. Morgan | LME Aluminum Futures^ | 01/2016 | (434,211 | ) | (413,532 | ) | 20,679 | ||||||||||||
| 3 | J.P. Morgan | LME Aluminum Futures^ | 01/2016 | (115,866 | ) | (112,886 | ) | 2,980 | ||||||||||||
| 3 | J.P. Morgan | LME Aluminum Futures^ | 01/2016 | (115,343 | ) | (112,913 | ) | 2,430 | ||||||||||||
| 1 | J.P. Morgan | LME Aluminum Futures^ | 01/2016 | (37,922 | ) | (37,637 | ) | 285 | ||||||||||||
| 2 | J.P. Morgan | LME Aluminum Futures^ | 01/2016 | (75,545 | ) | (75,275 | ) | 270 | ||||||||||||
| 4 | J.P. Morgan | LME Aluminum Futures^ | 01/2016 | (148,490 | ) | (150,550 | ) | (2,060 | ) | |||||||||||
| 3 | J.P. Morgan | LME Aluminum Futures^ | 01/2016 | (111,368 | ) | (112,935 | ) | (1,567 | ) | |||||||||||
| 1 | J.P. Morgan | LME Aluminum Futures^ | 02/2016 | (37,377 | ) | (37,706 | ) | (329 | ) | |||||||||||
| 7 | J.P. Morgan | LME Aluminum Futures^ | 02/2016 | (263,328 | ) | (264,207 | ) | (879 | ) | |||||||||||
| 13 | J.P. Morgan | LME Aluminum Futures^ | 02/2016 | (475,768 | ) | (490,467 | ) | (14,699 | ) | |||||||||||
| 9 | J.P. Morgan | LME Aluminum Futures^ | 03/2016 | (332,973 | ) | (339,694 | ) | (6,721 | ) | |||||||||||
| 35 | J.P. Morgan | LME Aluminum Futures^ | 03/2016 | (1,301,953 | ) | (1,319,281 | ) | (17,328 | ) | |||||||||||
| 17 | J.P. Morgan | LME Aluminum Futures^ | 03/2016 | (628,976 | ) | (641,006 | ) | (12,030 | ) | |||||||||||
| 1 | J.P. Morgan | LME Aluminum Futures^ | 03/2016 | (36,888 | ) | (37,692 | ) | (804 | ) | |||||||||||
| 1 | J.P. Morgan | LME Copper Futures^ | 01/2016 | (129,647 | ) | (117,655 | ) | 11,992 | ||||||||||||
| 13 | J.P. Morgan | LME Copper Futures^ | 01/2016 | (1,665,912 | ) | (1,529,808 | ) | 136,104 | ||||||||||||
| 7 | J.P. Morgan | LME Copper Futures^ | 01/2016 | (930,008 | ) | (824,294 | ) | 105,714 | ||||||||||||
| 1 | J.P. Morgan | LME Copper Futures^ | 01/2016 | (130,310 | ) | (117,801 | ) | 12,509 | ||||||||||||
| 1 | J.P. Morgan | LME Copper Futures^ | 01/2016 | (129,623 | ) | (117,813 | ) | 11,810 | ||||||||||||
| 1 | J.P. Morgan | LME Copper Futures^ | 01/2016 | (128,485 | ) | (117,787 | ) | 10,698 | ||||||||||||
| 2 | J.P. Morgan | LME Copper Futures^ | 01/2016 | (261,033 | ) | (235,557 | ) | 25,476 | ||||||||||||
| 1 | J.P. Morgan | LME Copper Futures^ | 01/2016 | (130,123 | ) | (117,760 | ) | 12,363 | ||||||||||||
| 1 | J.P. Morgan | LME Copper Futures^ | 01/2016 | (130,128 | ) | (117,750 | ) | 12,378 | ||||||||||||
| 2 | J.P. Morgan | LME Copper Futures^ | 01/2016 | (260,745 | ) | (235,505 | ) | 25,240 | ||||||||||||
| 2 | J.P. Morgan | LME Copper Futures^ | 01/2016 | (257,495 | ) | (235,509 | ) | 21,986 | ||||||||||||
| 1 | J.P. Morgan | LME Copper Futures^ | 02/2016 | (126,079 | ) | (117,772 | ) | 8,307 | ||||||||||||
| 1 | J.P. Morgan | LME Copper Futures^ | 02/2016 | (120,947 | ) | (117,781 | ) | 3,166 | ||||||||||||
| 2 | J.P. Morgan | LME Copper Futures^ | 02/2016 | (230,277 | ) | (235,549 | ) | (5,272 | ) | |||||||||||
| 3 | J.P. Morgan | LME Copper Futures^ | 03/2016 | (340,203 | ) | (353,231 | ) | (13,028 | ) | |||||||||||
| 1 | J.P. Morgan | LME Copper Futures^ | 03/2016 | (114,640 | ) | (117,734 | ) | (3,094 | ) | |||||||||||
| 19 | J.P. Morgan | LME Copper Futures^ | 03/2016 | (2,261,942 | ) | (2,236,419 | ) | 25,523 | ||||||||||||
| 7 | J.P. Morgan | LME Copper Futures^ | 03/2016 | (804,023 | ) | (824,031 | ) | (20,008 | ) | |||||||||||
| 5 | J.P. Morgan | LME Lead Futures^ | 01/2016 | (203,738 | ) | (224,623 | ) | (20,885 | ) | |||||||||||
| 4 | J.P. Morgan | LME Lead Futures^ | 01/2016 | (166,786 | ) | (179,693 | ) | (12,907 | ) | |||||||||||
| 4 | J.P. Morgan | LME Lead Futures^ | 01/2016 | (180,901 | ) | (179,680 | ) | 1,221 | ||||||||||||
| 2 | J.P. Morgan | LME Lead Futures^ | 02/2016 | (83,010 | ) | (89,835 | ) | (6,825 | ) | |||||||||||
| 1 | J.P. Morgan | LME Lead Futures^ | 02/2016 | (40,422 | ) | (44,929 | ) | (4,507 | ) | |||||||||||
| 2 | J.P. Morgan | LME Lead Futures^ | 03/2016 | (81,995 | ) | (89,854 | ) | (7,859 | ) | |||||||||||
| 17 | J.P. Morgan | LME Lead Futures^ | 03/2016 | (732,218 | ) | (763,618 | ) | (31,400 | ) | |||||||||||
| 6 | J.P. Morgan | LME Lead Futures^ | 03/2016 | (257,957 | ) | (269,519 | ) | (11,562 | ) | |||||||||||
| 3 | J.P. Morgan | LME Nickel Futures^ | 01/2016 | (179,253 | ) | (158,049 | ) | 21,204 | ||||||||||||
| 2 | J.P. Morgan | LME Nickel Futures^ | 01/2016 | (121,451 | ) | (105,379 | ) | 16,072 | ||||||||||||
| 1 | J.P. Morgan | LME Nickel Futures^ | 01/2016 | (61,497 | ) | (52,731 | ) | 8,766 | ||||||||||||
| 1 | J.P. Morgan | LME Nickel Futures^ | 01/2016 | (62,458 | ) | (52,734 | ) | 9,724 | ||||||||||||
| 2 | J.P. Morgan | LME Nickel Futures^ | 01/2016 | (125,563 | ) | (105,488 | ) | 20,075 | ||||||||||||
| 2 | J.P. Morgan | LME Nickel Futures^ | 02/2016 | (107,555 | ) | (105,633 | ) | 1,922 | ||||||||||||
| 1 | J.P. Morgan | LME Nickel Futures^ | 03/2016 | (51,625 | ) | (52,884 | ) | (1,259 | ) | |||||||||||
| 14 | J.P. Morgan | LME Nickel Futures^ | 03/2016 | (750,685 | ) | (740,376 | ) | 10,309 | ||||||||||||
| The accompanying notes are an integral part of these financial statements. | (Continued) |
| AQR Funds | Annual Report | December 2015 | ||||||||||||||
236
Table of Contents
| Consolidated Schedule of Investments | December 31, 2015 |
| AQR RISK PARITY FUND |
| NUMBER OF CONTRACTS | COUNTERPARTY | DESCRIPTION | EXPIRATION DATE | VALUE AT TRADE DATE | VALUE AT DECEMBER 31, 2015 | UNREALIZED APPRECIATION (DEPRECIATION) | ||||||||||||||
| Short Contracts: (continued) | ||||||||||||||||||||
| 10 | J.P. Morgan | LME Nickel Futures^ | 03/2016 | $ (521,468 | ) | $ (528,870 | ) | $ (7,402 | ) | |||||||||||
| 6 | J.P. Morgan | LME Zinc Futures^ | 01/2016 | (250,782 | ) | (238,984 | ) | 11,798 | ||||||||||||
| 6 | J.P. Morgan | LME Zinc Futures^ | 01/2016 | (251,503 | ) | (239,130 | ) | 12,373 | ||||||||||||
| 3 | J.P. Morgan | LME Zinc Futures^ | 01/2016 | (136,943 | ) | (119,819 | ) | 17,124 | ||||||||||||
| 1 | J.P. Morgan | LME Zinc Futures^ | 01/2016 | (43,681 | ) | (40,026 | ) | 3,655 | ||||||||||||
| 1 | J.P. Morgan | LME Zinc Futures^ | 01/2016 | (43,414 | ) | (40,031 | ) | 3,383 | ||||||||||||
| 1 | J.P. Morgan | LME Zinc Futures^ | 01/2016 | (42,931 | ) | (40,034 | ) | 2,897 | ||||||||||||
| 5 | J.P. Morgan | LME Zinc Futures^ | 02/2016 | (207,554 | ) | (200,304 | ) | 7,250 | ||||||||||||
| 2 | J.P. Morgan | LME Zinc Futures^ | 02/2016 | (80,511 | ) | (80,174 | ) | 337 | ||||||||||||
| 2 | J.P. Morgan | LME Zinc Futures^ | 02/2016 | (75,273 | ) | (80,213 | ) | (4,940 | ) | |||||||||||
| 50 | J.P. Morgan | LME Zinc Futures^ | 03/2016 | (2,222,679 | ) | (2,011,250 | ) | 211,429 | ||||||||||||
|
|
|
|
|
| |||||||||||||||
| (19,741,957 | ) | (19,124,548 | ) | 617,409 | ||||||||||||||||
|
|
|
|
|
| |||||||||||||||
| $531,064,041 | $525,888,341 | $(5,175,700 | ) | |||||||||||||||||
|
|
|
|
|
| |||||||||||||||
| ^ | Represents positions held in the respective Subsidiary (See Note 2). |
| Forward | foreign currency exchange contracts outstanding as of December 31, 2015: |
| Over | the Counter |
| PURCHASE CONTRACTS | COUNTERPARTY | CURRENCY | CURRENCY AMOUNT PURCHASED | VALUE AT SETTLEMENT DATE | VALUE AT DECEMBER 31, 2015 | UNREALIZED APPRECIATION (DEPRECIATION) | ||||||||||||||
| Brazilian Real, Expiring 03/16/16* | CitiBank | BRL | 19,237,000 | $4,833,335 | $4,749,723 | $(83,612 | ) | |||||||||||||
| Brazilian Real, Expiring 03/16/16* | Credit Suisse International | BRL | 19,237,000 | 4,833,388 | 4,749,723 | (83,665 | ) | |||||||||||||
| Swiss Franc, Expiring 03/16/16 | Credit Suisse International | CHF | 109,000 | 110,373 | 109,163 | (1,210 | ) | |||||||||||||
| Chinese Renminbi, Expiring 03/16/16* | CitiBank | CNY | 56,202,000 | 8,632,642 | 8,466,642 | (166,000 | ) | |||||||||||||
| Chinese Renminbi, Expiring 03/16/16* | Credit Suisse International | CNY | 56,202,000 | 8,632,796 | 8,466,642 | (166,154 | ) | |||||||||||||
Euro, Expiring 03/16/16 | CitiBank | EUR | 15,130,500 | 16,595,382 | 16,473,284 | (122,098 | ) | |||||||||||||
Euro, Expiring 03/16/16 | Credit Suisse International | EUR | 22,232,266 | 24,370,975 | 24,205,309 | (165,666 | ) | |||||||||||||
| British Pound, Expiring 03/16/16 | Credit Suisse International | GBP | 1,906,644 | 2,870,838 | 2,811,113 | (59,725 | ) | |||||||||||||
| Hong Kong Dollar, Expiring 03/16/16 | CitiBank | HKD | 2,804,500 | 362,011 | 362,076 | 65 | ||||||||||||||
| Hong Kong Dollar, Expiring 03/16/16 | Credit Suisse International | HKD | 2,804,500 | 362,012 | 362,076 | 64 | ||||||||||||||
| Hungarian Forint, Expiring 03/16/16 | CitiBank | HUF | 2,034,208,500 | 7,018,717 | 7,001,544 | (17,173 | ) | |||||||||||||
| Hungarian Forint, Expiring 03/16/16 | Credit Suisse International | HUF | 2,034,208,500 | 7,018,943 | 7,001,544 | (17,399 | ) | |||||||||||||
| Indian Rupee, Expiring 03/16/16* | CitiBank | INR | 319,595,500 | 4,718,269 | 4,773,997 | 55,728 | ||||||||||||||
| Indian Rupee, Expiring 03/16/16* | Credit Suisse International | INR | 319,595,500 | 4,718,269 | 4,773,997 | 55,728 | ||||||||||||||
| The accompanying notes are an integral part of these financial statements. | (Continued) |
| AQR Funds | Annual Report | December 2015 | ||||||||||||||
237
Table of Contents
| Consolidated Schedule of Investments | December 31, 2015 |
| AQR RISK PARITY FUND |
| PURCHASE CONTRACTS | COUNTERPARTY | CURRENCY | CURRENCY AMOUNT PURCHASED | VALUE AT SETTLEMENT DATE | VALUE AT DECEMBER 31, 2015 | UNREALIZED APPRECIATION (DEPRECIATION) | ||||||||||||||
| Korean Won, Expiring 03/16/16* | CitiBank | KRW | 9,072,046,000 | $ 7,809,648 | $ 7,724,611 | $ (85,037 | ) | |||||||||||||
| Korean Won, Expiring 03/16/16* | Credit Suisse International | KRW | 9,072,045,999 | 7,809,745 | 7,724,611 | (85,134 | ) | |||||||||||||
| Mexican Peso, Expiring 03/16/16 | CitiBank | MXN | 92,965,500 | 5,584,851 | 5,366,280 | (218,571 | ) | |||||||||||||
| Mexican Peso, Expiring 03/16/16 | Credit Suisse International | MXN | 92,965,500 | 5,584,841 | 5,366,280 | (218,561 | ) | |||||||||||||
| Poland Zloty, Expiring 03/16/16 | CitiBank | PLN | 20,480,000 | 5,124,820 | 5,213,596 | 88,776 | ||||||||||||||
| Poland Zloty, Expiring 03/16/16 | Credit Suisse International | PLN | 20,480,000 | 5,124,830 | 5,213,596 | 88,766 | ||||||||||||||
| Turkish Lira, Expiring 03/16/16 | CitiBank | TRY | 34,397,000 | 11,533,704 | 11,557,915 | 24,211 | ||||||||||||||
| Turkish Lira, Expiring 03/16/16 | Credit Suisse International | TRY | 34,397,000 | 11,533,456 | 11,557,916 | 24,460 | ||||||||||||||
| South African Rand, Expiring 03/16/16 | CitiBank | ZAR | 47,854,501 | 3,278,931 | 3,053,300 | (225,631 | ) | |||||||||||||
| South African Rand, Expiring 03/16/16 | Credit Suisse International | ZAR | 47,854,501 | 3,278,972 | 3,053,300 | (225,672 | ) | |||||||||||||
|
|
|
|
|
| |||||||||||||||
| $161,741,748 | $160,138,238 | $(1,603,510 | ) | |||||||||||||||||
|
|
|
|
|
| |||||||||||||||
| SALES CONTRACTS | COUNTERPARTY | CURRENCY | CURRENCY AMOUNT SOLD | VALUE AT SETTLEMENT DATE | VALUE AT DECEMBER 31, 2015 | UNREALIZED APPRECIATION (DEPRECIATION) | ||||||||||||||
| Brazilian Real, Expiring 03/16/16* | CitiBank | BRL | (3,683,000 | ) | $(922,989 | ) | $(909,353 | ) | $13,636 | |||||||||||
| Brazilian Real, Expiring 03/16/16* | Credit Suisse International | BRL | (3,683,000 | ) | (922,989 | ) | (909,353 | ) | 13,636 | |||||||||||
| Swiss Franc, Expiring 03/16/16 | CitiBank | CHF | (436,500 | ) | (437,650 | ) | (437,155 | ) | 495 | |||||||||||
| Swiss Franc, Expiring 03/16/16 | Credit Suisse International | CHF | (710,500 | ) | (716,281 | ) | (711,565 | ) | 4,716 | |||||||||||
| Chinese Renminbi, Expiring 03/16/16* | CitiBank | CNY | (14,240,000 | ) | (2,157,755 | ) | (2,145,207 | ) | 12,548 | |||||||||||
| Chinese Renminbi, Expiring 03/16/16* | Credit Suisse International | CNY | (14,240,000 | ) | (2,154,492 | ) | (2,145,207 | ) | 9,285 | |||||||||||
| Euro, Expiring 03/16/16 | CitiBank | EUR | (55,186,330 | ) | (58,747,412 | ) | (60,083,940 | ) | (1,336,528 | ) | ||||||||||
| Euro, Expiring 03/16/16 | Credit Suisse International | EUR | (56,932,702 | ) | (60,656,977 | ) | (61,985,297 | ) | (1,328,320 | ) | ||||||||||
| British Pound, Expiring 03/16/16 | CitiBank | GBP | (6,616,728 | ) | (9,927,103 | ) | (9,755,555 | ) | 171,548 | |||||||||||
| British Pound, Expiring 03/16/16 | Credit Suisse International | GBP | (6,960,200 | ) | (10,445,387 | ) | (10,261,962 | ) | 183,425 | |||||||||||
| Hong Kong Dollar, Expiring 03/16/16 | Credit Suisse International | HKD | (5,659,000 | ) | (730,238 | ) | (730,608 | ) | (370 | ) | ||||||||||
| Hungarian Forint, Expiring 03/16/16 | CitiBank | HUF | (1,084,004,500 | ) | (3,757,657 | ) | (3,731,036 | ) | 26,621 | |||||||||||
| Hungarian Forint, Expiring 03/16/16 | Credit Suisse International | HUF | (1,084,004,500 | ) | (3,756,467 | ) | (3,731,036 | ) | 25,431 | |||||||||||
| Indian Rupee, Expiring 03/16/16* | CitiBank | INR | (124,057,000 | ) | (1,825,474 | ) | (1,853,116 | ) | (27,642 | ) | ||||||||||
| Indian Rupee, Expiring 03/16/16* | Credit Suisse International | INR | (124,057,000 | ) | (1,825,473 | ) | (1,853,116 | ) | (27,643 | ) | ||||||||||
| The accompanying notes are an integral part of these financial statements. | (Continued) |
| AQR Funds | Annual Report | December 2015 | ||||||||||||||
238
Table of Contents
| Consolidated Schedule of Investments | December 31, 2015 |
| AQR RISK PARITY FUND |
| SALES CONTRACTS | COUNTERPARTY | CURRENCY | CURRENCY AMOUNT SOLD | VALUE AT SETTLEMENT DATE | VALUE AT DECEMBER 31, 2015 | UNREALIZED APPRECIATION (DEPRECIATION) | ||||||||||||||
| Korean Won, Expiring 03/16/16* | CitiBank | KRW | (3,669,960,000 | ) | $ (3,104,908 | ) | $ (3,124,874 | ) | $ (19,966 | ) | ||||||||||
| Korean Won, Expiring 03/16/16* | Credit Suisse International | KRW | (3,669,960,000 | ) | (3,104,906 | ) | (3,124,874 | ) | (19,968 | ) | ||||||||||
| Mexican Peso, Expiring 03/16/16 | CitiBank | MXN | (52,731,000 | ) | (3,063,234 | ) | (3,043,810 | ) | 19,424 | |||||||||||
| Mexican Peso, Expiring 03/16/16 | Credit Suisse International | MXN | (52,731,000 | ) | (3,063,229 | ) | (3,043,810 | ) | 19,419 | |||||||||||
| Poland Zloty, Expiring 03/16/16 | CitiBank | PLN | (12,588,500 | ) | (3,165,133 | ) | (3,204,657 | ) | (39,524 | ) | ||||||||||
| Poland Zloty, Expiring 03/16/16 | Credit Suisse International | PLN | (12,588,500 | ) | (3,164,892 | ) | (3,204,657 | ) | (39,765 | ) | ||||||||||
| Turkish Lira, Expiring 03/16/16 | CitiBank | TRY | (12,995,000 | ) | (4,301,062 | ) | (4,366,518 | ) | (65,456 | ) | ||||||||||
| Turkish Lira, Expiring 03/16/16 | Credit Suisse International | TRY | (12,995,000 | ) | (4,300,895 | ) | (4,366,518 | ) | (65,623 | ) | ||||||||||
| South African Rand, Expiring 03/16/16 | CitiBank | ZAR | (24,720,500 | ) | (1,654,254 | ) | (1,577,262 | ) | 76,992 | |||||||||||
| South African Rand, Expiring 03/16/16 | Credit Suisse International | ZAR | (24,720,500 | ) | (1,653,711 | ) | (1,577,262 | ) | 76,449 | |||||||||||
|
|
|
|
|
| |||||||||||||||
| (189,560,568 | ) | (191,877,748 | ) | (2,317,180 | ) | |||||||||||||||
|
|
|
|
|
| |||||||||||||||
| $(27,818,820 | ) | $(31,739,510 | ) | $(3,920,690 | ) | |||||||||||||||
|
|
|
|
|
| |||||||||||||||
| * | Non-deliverable forward (See Note 4). |
BRL - Brazilian Real
CHF - Swiss Franc
CNY - Chinese Renminbi
CZK - Czech Republic Koruna
EUR - Euro
GBP - British Pound
HKD - Hong Kong Dollar
HUF - Hungarian Forint
INR - Indian Rupee
KRW - Korean Won
MXN - Mexican Peso
PLN - Poland Zloty
SGD - Singapore Dollar
TRY - Turkish Lira
USD - United States Dollar
ZAR - South African Rand
| The accompanying notes are an integral part of these financial statements. | (Continued) |
| AQR Funds | Annual Report | December 2015 | ||||||||||||||
239
Table of Contents
| Consolidated Schedule of Investments | December 31, 2015 |
| AQR RISK PARITY FUND |
Collateral pledged to, or (received from), each counterparty at December 31, 2015 was as follows:
| COUNTERPARTY | OVER THE COUNTER | EXCHANGE TRADED/ CENTRALLY CLEARED | TOTAL | |||||||||
| Bank of America | ||||||||||||
| Money Market Funds | $212,082 | $— | $212,082 | |||||||||
| ||||||||||||
| Barclays Capital | ||||||||||||
| Cash | — | 4,715,270 | 4,715,270 | |||||||||
| ||||||||||||
| CitiBank | ||||||||||||
| Cash | — | 10,642,183 | 10,642,183 | |||||||||
| Money Market Funds | 3,980,004 | — | 3,980,004 | |||||||||
| ||||||||||||
| Credit Suisse International | ||||||||||||
| Money Market Funds | 2,200,015 | — | 2,200,015 | |||||||||
| ||||||||||||
| Goldman Sachs | ||||||||||||
| Cash | — | 1,245,723 | 1,245,723 | |||||||||
| Money Market Funds | 60,000 | — | 60,000 | |||||||||
| U.S. Treasury Bills | — | 2,469,555 | 2,469,555 | |||||||||
| ||||||||||||
| J.P. Morgan | ||||||||||||
| Cash | — | 182,023 | 182,023 | |||||||||
| ||||||||||||
| Morgan Stanley and Co., International PLC | ||||||||||||
| Cash | — | 3,538,779 | 3,538,779 | |||||||||
| Money Market Funds | 1,601,663 | — | 1,601,663 | |||||||||
| ||||||||||||
Collateral pledged to, or (received from), each counterparty for the Subsidiary (See Note 2) at December 31, 2015 was as follows:
| COUNTERPARTY | OVER THE COUNTER | EXCHANGE TRADED/ CENTRALLY CLEARED | TOTAL | |||||||||
| CitiBank | ||||||||||||
| Money Market Funds | $200,139 | $— | $200,139 | |||||||||
| ||||||||||||
| Deutsche Bank | ||||||||||||
| Money Market Funds | 920,037 | — | 920,037 | |||||||||
| ||||||||||||
| Goldman Sachs | ||||||||||||
| Cash | — | 1,835,671 | 1,835,671 | |||||||||
| ||||||||||||
| J.P. Morgan | ||||||||||||
| Cash | — | 2,720,760 | 2,720,760 | |||||||||
| ||||||||||||
| Macquarie Capital | ||||||||||||
| Money Market Funds | 190,001 | — | 190,001 | |||||||||
| ||||||||||||
| Merrill Lynch | ||||||||||||
| Money Market Funds | 290,363 | — | 290,363 | |||||||||
| ||||||||||||
| Morgan Stanley and Co., International PLC | ||||||||||||
| Cash | — | 9,153,692 | 9,153,692 | |||||||||
| ||||||||||||
| Societe Generale | ||||||||||||
| Money Market Funds | 120,000 | — | 120,000 | |||||||||
| ||||||||||||
| The accompanying notes are an integral part of these financial statements. |
| AQR Funds | Annual Report | December 2015 | ||||||||||||||
240
Table of Contents
| Consolidated Schedule of Investments | December 31, 2015 |
| AQR RISK PARITY II HV FUND |
| GOVERNMENT RELATED OBLIGATIONS - 13.9% | INTEREST RATE | MATURITY DATE | CURRENCY | PRINCIPAL AMOUNT (000’s) | VALUE (Note 5) | |||||||||||||||
| Sovereign Debt - 13.9% | ||||||||||||||||||||
| Deutsche Bundesrepublik Inflation Linked Bond (Germany) | 0.100 | % | 04/15/23 | EUR | 518 | $ | 589,667 | |||||||||||||
| Deutsche Bundesrepublik Inflation Linked Bond (Germany) | 0.101 | % | 04/15/26 | EUR | 1,110 | 1,267,022 | ||||||||||||||
| Deutsche Bundesrepublik Inflation Linked Bond (Germany) | 1.750 | % | 04/15/20 | EUR | 724 | 866,085 | ||||||||||||||
| France Government Bond OAT (France) | 0.100 | % | 07/25/21 | EUR | 202 | 227,914 | ||||||||||||||
| France Government Bond OAT (France) | 0.100 | % | 03/01/25 | EUR | 300 | 334,251 | ||||||||||||||
| France Government Bond OAT (France) | 0.250 | % | 07/25/24 | EUR | 305 | 348,336 | ||||||||||||||
| France Government Bond OAT (France) | 1.198 | % | 07/25/22 | EUR | 326 | 394,326 | ||||||||||||||
| France Government Bond OAT (France) | 2.250 | % | 07/25/20 | EUR | 733 | 909,552 | ||||||||||||||
| United Kingdom Index Linked Treasury Gilt (United Kingdom) | 0.125 | % | 03/22/24 | GBP | 685 | 1,070,927 | ||||||||||||||
| United Kingdom Index Linked Treasury Gilt (United Kingdom) | 0.125 | % | 03/22/26 | GBP | 502 | 789,647 | ||||||||||||||
|
| |||||||||||||||||||
TOTAL GOVERNMENT RELATED OBLIGATIONS | 6,797,727 | |||||||||||||||||||
|
| |||||||||||||||||||
| U.S. TREASURY OBLIGATIONS - 21.2% | ||||||||||||||||||||
| U.S. Treasury Inflation Protected Securities - 21.2% | ||||||||||||||||||||
| U.S. Treasury Inflation Protected Securities (a) | 0.125 | % | 04/15/19 | USD | 3,140 | 3,168,448 | ||||||||||||||
| U.S. Treasury Inflation Protected Securities (a) | 0.125 | % | 04/15/20 | USD | 3,600 | 3,609,626 | ||||||||||||||
| U.S. Treasury Inflation Protected Securities | 0.125 | % | 07/15/24 | USD | 970 | 922,755 | ||||||||||||||
| U.S. Treasury Inflation Protected Securities | 0.250 | % | 01/15/25 | USD | 1,300 | 1,245,989 | ||||||||||||||
| U.S. Treasury Inflation Protected Securities | 0.375 | % | 07/15/25 | USD | 1,430 | 1,388,550 | ||||||||||||||
|
| |||||||||||||||||||
TOTAL U.S. TREASURY OBLIGATIONS | 10,335,368 | |||||||||||||||||||
|
| |||||||||||||||||||
| MONEY MARKET FUNDS - 51.9% | SHARES | |||||||
| BlackRock Liquidity Funds T-Fund Portfolio, Institutional Shares, 0.100% ^(b) | 240,036 | 240,036 | ||||||
| Dreyfus Treasury Cash Management, Class I, 0.090% ^(b) | 960,143 | 960,143 | ||||||
| J.P. Morgan U.S. Treasury Plus Money Market Fund - IM Shares, 0.129% ^(b)(c) | 22,193,796 | 22,193,796 | ||||||
| J.P. Morgan U.S. Treasury Plus Money Market Fund - Institutional Shares, 0.070% ^(b)(c) | 740,031 | 740,031 | ||||||
| UBS Money Series - UBS Select Treasury Preferred Fund, Class I, 0.140% ^(b) | 1,200,179 | 1,200,179 | ||||||
|
| |||||||
TOTAL MONEY MARKET FUNDS | 25,334,185 | |||||||
|
| |||||||
| SHORT-TERM INVESTMENTS - 20.9% | PRINCIPAL AMOUNT (000’s) | |||||||
| U.S. Treasury Bill, 0.067%, 04/07/2016 (d) | $ | 815 | 814,680 | |||||
| U.S. Treasury Bill, 0.141%, 01/28/2016 ^(d) | 3,143 | 3,142,727 | ||||||
| U.S. Treasury Bill, 0.160%, 02/04/2016 (d) | 941 | 940,918 | ||||||
| U.S. Treasury Bill, 0.264%, 03/03/2016 (d) | 1,557 | 1,557,726 | ||||||
| U.S. Treasury Bill, 0.327%, 05/19/2016 ^(d) | 3,481 | 3,480,598 | ||||||
| U.S. Treasury Bill, 0.342%, 05/26/2016 ^(d) | 250 | 249,614 | ||||||
|
| |||||||
TOTAL SHORT-TERM INVESTMENTS | 10,186,263 | |||||||
|
| |||||||
| REPURCHASE AGREEMENTS - 5.2% | ||||||||
| CitiBank, 0.25%, dated 12/30/15, due 01/06/16, repurchase price $1,303,524, collateralized by U.S. Treasury Inflation Indexed Note, 0.125%, due 04/15/20 | 1,303 | 1,303,461 | ||||||
| J.P. Morgan Securities, Inc., 0.40%, dated 12/30/15, due 01/06/16, repurchase price $1,222,595, collateralized by U.S. Treasury Inflation Indexed Note, 0.125%, due 04/15/19 | 1,223 | 1,222,500 | ||||||
|
| |||||||
TOTAL REPURCHASE AGREEMENTS | 2,525,961 | |||||||
|
| |||||||
TOTAL INVESTMENTS IN SECURITIES, AT VALUE - 113.1% | 55,179,504 | |||||||
|
| |||||||
LIABILITIES IN EXCESS OF OTHER ASSETS - (13.1%) (e) | (6,383,573 | ) | ||||||
|
| |||||||
NET ASSETS - 100.0% | $ | 48,795,931 | ||||||
|
| |||||||
| The accompanying notes are an integral part of these financial statements. | (Continued) |
| AQR Funds | Annual Report | December 2015 | ||||||||||||||
241
Table of Contents
| Consolidated Schedule of Investments | December 31, 2015 |
| AQR RISK PARITY II HV FUND |
All securities are United States companies, unless noted otherwise in parentheses.
| (a) | On December 31, 2015, securities valued at $6,778,074 were pledged as collateral for repurchase agreements and reverse repurchase agreements outstanding. |
| (b) | Represents annualized seven-day yield as of the close of the reporting period. |
| (c) | All or a portion of the security is pledged as collateral to the brokers for forward foreign currency exchange and swap contracts. |
| (d) | The rate shown is the effective yield at the date of purchase. |
| (e) | Includes appreciation/(depreciation) on forward foreign currency exchange, futures and swap contracts. |
| ^ | All or a portion represents positions held in the respective Subsidiary (See Note 2). |
All securities are Level 2 with respect to ASC 820 (See Note 5).
The following abbreviations are used in portfolio descriptions:
EUR - Euro
GBP - British Pound
USD - United States Dollar
Reverse repurchase agreements at December 31, 2015:
Over the Counter
| COUNTERPARTY | TRADE DATE | RATE | �� | DUE DATE | PRINCIPAL AMOUNT AND VALUE OF REVERSE REPURCHASE AGREEMENT | |||||||||||
| CitiBank | 12/23/2015 | 0.52 | % | 1/20/2016 | $299,246 | |||||||||||
| CitiBank | 11/16/2015 | 0.52 | % | 1/20/2016 | 4,594,164 | |||||||||||
| J.P. Morgan Securities, Inc. | 11/16/2015 | 0.52 | % | 1/20/2016 | 4,040,000 | |||||||||||
| J.P. Morgan Securities, Inc. | 12/23/2015 | 0.60 | % | 1/20/2016 | 299,625 | |||||||||||
|
| |||||||||||||||
| $9,233,035 | ||||||||||||||||
|
| |||||||||||||||
The weighted average daily balance of the reverse repurchase agreements during the period ended December 31, 2015 was $12,723,419 at a net weighted average interest rate of 0.315%.
Total return swap contracts outstanding as of December 31, 2015:
Over the Counter
| COUNTERPARTY | UNDERLYING REFERENCE INSTRUMENT | TERMINATION DATE | CURRENCY | NOTIONAL VALUE | UNREALIZED APPRECIATION (DEPRECIATION) | |||||||||
| Goldman Sachs | Bovespa Index February Futures | 02/2016 | BRL | 686,045 | $(7,066 | ) | ||||||||
| CitiBank | Corn March Futures^ | 02/2016 | USD | 96,501 | (6,814 | ) | ||||||||
| Deutsche Bank | Corn March Futures^ | 02/2016 | USD | 417,177 | (40,490 | ) | ||||||||
| Macquarie Capital | Corn March Futures^ | 02/2016 | USD | 39,560 | (3,685 | ) | ||||||||
| CitiBank | Cotton No. 2 March Futures^ | 02/2016 | USD | 185,931 | 3,910 | |||||||||
| Deutsche Bank | Cotton No. 2 March Futures^ | 02/2016 | USD | 31,135 | 505 | |||||||||
| Macquarie Capital | Cotton No. 2 March Futures^ | 02/2016 | USD | 30,894 | 746 | |||||||||
| Bank of America | Hang Seng Index January Futures | 01/2016 | HKD | 1,103,929 | (1,087 | ) | ||||||||
| Bank of America | H-SHARES Index January Futures | 01/2016 | HKD | 8,425,467 | (22,734 | ) | ||||||||
| Goldman Sachs | H-SHARES Index January Futures | 01/2016 | HKD | 497,340 | (1,560 | ) | ||||||||
| Bank of America | KOSPI Index 200 March Futures | 03/2016 | KRW | 239,090,500 | 1,143 | |||||||||
| Deutsche Bank | Lean Hogs February Futures^ | 02/2016 | USD | 99,667 | (3,987 | ) | ||||||||
| Macquarie Capital | Lean Hogs February Futures^ | 02/2016 | USD | 123,022 | (3,422 | ) | ||||||||
| Macquarie Capital | Lean Hogs February Futures^ | 02/2016 | USD | (25,388 | ) | (339 | ) | |||||||
| Deutsche Bank | Live Cattle February Futures^ | 02/2016 | USD | (148,968 | ) | (15,183 | ) | |||||||
| Deutsche Bank | Live Cattle February Futures^ | 02/2016 | USD | 623,637 | (21,704 | ) | ||||||||
| The accompanying notes are an integral part of these financial statements. | (Continued) |
| AQR Funds | Annual Report | December 2015 | ||||||||||||||
242
Table of Contents
| Consolidated Schedule of Investments | December 31, 2015 |
| AQR RISK PARITY II HV FUND |
| COUNTERPARTY | UNDERLYING REFERENCE INSTRUMENT | TERMINATION DATE | CURRENCY | NOTIONAL VALUE | UNREALIZED APPRECIATION (DEPRECIATION) | |||||||||
| Goldman Sachs | MSCI Taiwan Stock Index January Futures | 01/2016 | USD | 215,024 | $ (1,944 | ) | ||||||||
| Goldman Sachs | SGX S&P CNX Nifty Index January Futures | 01/2016 | USD | 63,506 | 78 | |||||||||
| CitiBank | Soybean March Futures^ | 02/2016 | USD | 347,690 | (1,990 | ) | ||||||||
| Deutsche Bank | Soybean March Futures^ | 02/2016 | USD | (42,787 | ) | (425 | ) | |||||||
| Deutsche Bank | Soybean March Futures^ | 02/2016 | USD | 129,713 | (75 | ) | ||||||||
| Macquarie Capital | Soybean March Futures^ | 02/2016 | USD | 302,260 | 227 | |||||||||
| Macquarie Capital | Soybean Oil March Futures^ | 02/2016 | USD | 37,020 | (120 | ) | ||||||||
| Societe Generale | Soybean March Futures^ | 02/2016 | USD | 43,118 | 95 | |||||||||
| Goldman Sachs | Swiss Market Index March Futures | 03/2016 | CHF | 595,367 | 16,982 | |||||||||
| Goldman Sachs | Taiwan Stock Exchange January Futures | 01/2016 | TWD | 6,442,582 | 5,416 | |||||||||
| CitiBank | Wheat March Futures^ | 02/2016 | USD | (77,794 | ) | 7,288 | ||||||||
| CitiBank | Wheat March Futures^ | 02/2016 | USD | 78,599 | (8,093 | ) | ||||||||
|
| |||||||||||||
| $(104,328 | ) | |||||||||||||
|
| |||||||||||||
| ^ | Represents positions held in the respective Subsidiary (See Note 2). |
Open futures contracts outstanding at December 31, 2015:
Exchange Traded
| NUMBER OF CONTRACTS | COUNTERPARTY | DESCRIPTION | EXPIRATION DATE | VALUE AT TRADE DATE | VALUE AT DECEMBER 31, 2015 | UNREALIZED APPRECIATION (DEPRECIATION) | ||||||||||||||
| Long Contracts: | ||||||||||||||||||||
| 26 | Goldman Sachs | Brent Crude Futures^ | 02/2016 | $1,057,033 | $1,001,781 | $(55,252 | ) | |||||||||||||
| 1 | Morgan Stanley and Co., International PLC | Cocoa Futures^ | 03/2016 | 30,682 | 32,110 | 1,428 | ||||||||||||||
| 6 | Morgan Stanley and Co., International PLC | Coffee ‘C’ Futures^ | 03/2016 | 310,264 | 285,075 | (25,189 | ) | |||||||||||||
| 20 | Morgan Stanley and Co., International PLC | Corn Futures^ | 03/2016 | 393,666 | 358,750 | (34,916 | ) | |||||||||||||
| 2 | Morgan Stanley and Co., International PLC | Cotton No. 2 Futures^ | 03/2016 | 62,414 | 63,280 | 866 | ||||||||||||||
| 1 | Morgan Stanley and Co., International PLC | Feeder Cattle Futures^ | 03/2016 | 85,067 | 81,825 | (3,242 | ) | |||||||||||||
| 11 | Goldman Sachs | Gas Oil Futures^ | 03/2016 | 418,017 | 376,475 | (41,542 | ) | |||||||||||||
| 7 | Morgan Stanley and Co., International PLC | Gasoline RBOB Futures^ | 02/2016 | 373,528 | 381,671 | 8,143 | ||||||||||||||
| 13 | Morgan Stanley and Co., International PLC | Gold 100 OZ Futures^ | 02/2016 | 1,461,857 | 1,378,260 | (83,597 | ) | |||||||||||||
| 1 | Morgan Stanley and Co., International PLC | Hard Red Winter Wheat Futures^ | 03/2016 | 23,942 | 23,425 | (517 | ) | |||||||||||||
| 6 | Morgan Stanley and Co., International PLC | Heating Oil ULSD Futures^ | 02/2016 | 329,781 | 289,523 | (40,258 | ) | |||||||||||||
| The accompanying notes are an integral part of these financial statements. | (Continued) |
| AQR Funds | Annual Report | December 2015 | ||||||||||||||
243
Table of Contents
| Consolidated Schedule of Investments | December 31, 2015 |
| AQR RISK PARITY II HV FUND |
| NUMBER OF CONTRACTS | COUNTERPARTY | DESCRIPTION | EXPIRATION DATE | VALUE AT TRADE DATE | VALUE AT DECEMBER 31, 2015 | UNREALIZED APPRECIATION (DEPRECIATION) | ||||||||||||||
| Long Contracts: (continued) | ||||||||||||||||||||
| 4 | Morgan Stanley and Co., International PLC | Lean Hogs Futures^ | 02/2016 | $ 95,196 | $ 95,680 | $ 484 | ||||||||||||||
| 2 | Morgan Stanley and Co., International PLC | Live Cattle Futures^ | 02/2016 | 111,230 | 109,440 | (1,790 | ) | |||||||||||||
| 1 | J.P. Morgan | LME Aluminum Futures^ | 01/2016 | 39,253 | 37,533 | (1,720 | ) | |||||||||||||
| 1 | J.P. Morgan | LME Aluminum Futures^ | 01/2016 | 37,138 | 37,638 | 500 | ||||||||||||||
| 1 | J.P. Morgan | LME Aluminum Futures^ | 02/2016 | 37,502 | 37,743 | 241 | ||||||||||||||
| 1 | J.P. Morgan | LME Aluminum Futures^ | 02/2016 | 36,590 | 37,728 | 1,138 | ||||||||||||||
| 1 | J.P. Morgan | LME Aluminum Futures^ | 03/2016 | 37,115 | 37,744 | 629 | ||||||||||||||
| 27 | J.P. Morgan | LME Aluminum Futures^ | 03/2016 | 1,079,176 | 1,017,731 | (61,445 | ) | |||||||||||||
| 3 | J.P. Morgan | LME Aluminum Futures^ | 03/2016 | 111,382 | 113,118 | 1,736 | ||||||||||||||
| 3 | J.P. Morgan | LME Aluminum Futures^ | 03/2016 | 110,257 | 113,075 | 2,818 | ||||||||||||||
| 1 | J.P. Morgan | LME Aluminum Futures^ | 03/2016 | 38,165 | 37,683 | (482 | ) | |||||||||||||
| 2 | J.P. Morgan | LME Copper Futures^ | 01/2016 | 256,558 | 235,355 | (21,203 | ) | |||||||||||||
| 1 | J.P. Morgan | LME Copper Futures^ | 01/2016 | 133,213 | 117,756 | (15,457 | ) | |||||||||||||
| 1 | J.P. Morgan | LME Copper Futures^ | 01/2016 | 130,449 | 117,750 | (12,699 | ) | |||||||||||||
| 10 | J.P. Morgan | LME Copper Futures^ | 03/2016 | 1,304,057 | 1,177,062 | (126,995 | ) | |||||||||||||
| 1 | J.P. Morgan | LME Copper Futures^ | 03/2016 | 115,877 | 117,718 | 1,841 | ||||||||||||||
| 1 | J.P. Morgan | LME Lead Futures^ | 01/2016 | 41,603 | 44,924 | 3,321 | ||||||||||||||
| 1 | J.P. Morgan | LME Lead Futures^ | 02/2016 | 41,503 | 44,918 | 3,415 | ||||||||||||||
| 6 | J.P. Morgan | LME Lead Futures^ | 03/2016 | 270,567 | 269,513 | (1,054 | ) | |||||||||||||
| 1 | J.P. Morgan | LME Lead Futures^ | 03/2016 | 43,009 | 44,920 | 1,911 | ||||||||||||||
| 1 | J.P. Morgan | LME Nickel Futures^ | 01/2016 | 63,004 | 52,744 | (10,260 | ) | |||||||||||||
| 3 | J.P. Morgan | LME Nickel Futures^ | 03/2016 | 190,529 | 158,652 | (31,877 | ) | |||||||||||||
| 2 | J.P. Morgan | LME Nickel Futures^ | 03/2016 | 104,177 | 105,774 | 1,597 | ||||||||||||||
| 1 | J.P. Morgan | LME Zinc Futures^ | 01/2016 | 41,927 | 39,855 | (2,072 | ) | |||||||||||||
| 1 | J.P. Morgan | LME Zinc Futures^ | 02/2016 | 41,627 | 40,060 | (1,567 | ) | |||||||||||||
| 12 | J.P. Morgan | LME Zinc Futures^ | 03/2016 | 528,659 | 482,700 | (45,959 | ) | |||||||||||||
| 1 | J.P. Morgan | LME Zinc Futures^ | 03/2016 | 38,153 | 40,217 | 2,064 | ||||||||||||||
| 1 | J.P. Morgan | LME Zinc Futures^ | 03/2016 | 40,359 | 40,225 | (134 | ) | |||||||||||||
| 8 | Morgan Stanley and Co., International PLC | Natural Gas Futures^ | 02/2016 | 173,709 | 189,040 | 15,331 | ||||||||||||||
| 13 | Morgan Stanley and Co., International PLC | Silver Futures^ | 03/2016 | 998,886 | 897,195 | (101,691 | ) | |||||||||||||
| 5 | Morgan Stanley and Co., International PLC | Soybean Futures^ | 03/2016 | 220,359 | 216,063 | (4,296 | ) | |||||||||||||
| 4 | Morgan Stanley and Co., International PLC | Soybean Meal Futures^ | 03/2016 | 117,490 | 106,200 | (11,290 | ) | |||||||||||||
| 20 | Morgan Stanley and Co., International PLC | Soybean Oil Futures^ | 03/2016 | 367,068 | 369,000 | 1,932 | ||||||||||||||
| 27 | Morgan Stanley and Co., International PLC | Sugar #11 (World Markets) Futures^ | 02/2016 | 380,538 | 460,858 | 80,320 | ||||||||||||||
| 8 | Morgan Stanley and Co., International PLC | Wheat Futures^ | 03/2016 | 206,991 | 188,000 | (18,991 | ) | |||||||||||||
| 29 | Morgan Stanley and Co., International PLC | WTI Crude Futures^ | 02/2016 | 1,166,423 | 1,106,930 | (59,493 | ) | |||||||||||||
| The accompanying notes are an integral part of these financial statements. | (Continued) |
| AQR Funds | Annual Report | December 2015 | ||||||||||||||
244
Table of Contents
| Consolidated Schedule of Investments | December 31, 2015 |
| AQR RISK PARITY II HV FUND |
| NUMBER OF CONTRACTS | COUNTERPARTY | DESCRIPTION | EXPIRATION DATE | VALUE AT TRADE DATE | VALUE AT DECEMBER 31, 2015 | UNREALIZED APPRECIATION (DEPRECIATION) | ||||||||||||||
| Long Contracts: (continued) | ||||||||||||||||||||
| 1 | Barclays Capital | Amsterdam Index Futures | 01/2016 | $ 93,977 | $ 96,036 | $ 2,059 | ||||||||||||||
| 7 | Barclays Capital | CAC40 Index Futures | 01/2016 | 351,368 | 352,862 | 1,494 | ||||||||||||||
| 1 | Barclays Capital | DAX Index Futures | 03/2016 | 284,086 | 292,662 | 8,576 | ||||||||||||||
| 7 | Barclays Capital | E-Mini Russell 2000 Futures | 03/2016 | 784,015 | 792,050 | 8,035 | ||||||||||||||
| 41 | Barclays Capital | Euro Stoxx 50 Index Futures | 03/2016 | 1,450,797 | 1,462,352 | 11,555 | ||||||||||||||
| 9 | Barclays Capital | FTSE 100 Index Futures | 03/2016 | 798,096 | 822,338 | 24,242 | ||||||||||||||
| 8 | J.P. Morgan | FTSE/JSE Top 40 Index Futures | 03/2016 | 231,168 | 239,364 | 8,196 | ||||||||||||||
| 1 | Barclays Capital | FTSE/MIB Index Futures | 03/2016 | 117,528 | 116,511 | (1,017 | ) | |||||||||||||
| 3 | Barclays Capital | Hang Seng Index Futures | 01/2016 | 426,236 | 424,061 | (2,175 | ) | |||||||||||||
| 3 | Barclays Capital | H-SHARES Index Futures | 01/2016 | 191,874 | 187,838 | (4,036 | ) | |||||||||||||
| 1 | Barclays Capital | IBEX 35 Index Futures | 01/2016 | 107,023 | 103,527 | (3,496 | ) | |||||||||||||
| 5 | Barclays Capital | KOSPI Index 200 Futures | 03/2016 | 506,937 | 512,665 | 5,728 | ||||||||||||||
| 4 | Barclays Capital | MSCI Taiwan Stock Index Futures | 01/2016 | 122,955 | 121,760 | (1,195 | ) | |||||||||||||
| 79 | Barclays Capital | S&P 500 E-Mini Futures | 03/2016 | 7,938,618 | 8,039,830 | 101,212 | ||||||||||||||
| 7 | Barclays Capital | S&P MID 400 E-Mini Futures | 03/2016 | 967,762 | 975,450 | 7,688 | ||||||||||||||
| 1 | Barclays Capital | SGX S&P CNX Nifty Index Futures | 01/2016 | 15,886 | 15,896 | 10 | ||||||||||||||
| 5 | Barclays Capital | SPI 200 Index Futures | 03/2016 | 450,057 | 478,847 | 28,790 | ||||||||||||||
| 11 | Barclays Capital | TOPIX Index Futures | 03/2016 | 1,433,879 | 1,416,240 | (17,639 | ) | |||||||||||||
| 28 | Goldman Sachs | 10-Year Japanese Government Bond Futures | 03/2016 | 3,466,854 | 3,472,424 | 5,570 | ||||||||||||||
| 22 | J.P. Morgan | Australia 10-Year Bond Futures | 03/2016 | 2,025,479 | 2,034,262 | 8,783 | ||||||||||||||
| 15 | Goldman Sachs | Canadian 10-Year Bond Futures | 03/2016 | 1,497,584 | 1,528,402 | 30,818 | ||||||||||||||
| 102 | Goldman Sachs | Euro-Bund Futures | 03/2016 | 17,716,896 | 17,505,194 | (211,702 | ) | |||||||||||||
| 3 | Goldman Sachs | Long Gilt Futures | 03/2016 | 518,581 | 516,427 | (2,154 | ) | |||||||||||||
| 267 | Morgan Stanley and Co., International PLC | U.S. Treasury 10-Year Note Futures | 03/2016 | 33,718,306 | 33,616,968 | (101,338 | ) | |||||||||||||
|
|
|
|
|
| |||||||||||||||
| 88,511,952 | 87,734,683 | (777,269 | ) | |||||||||||||||||
|
|
|
|
|
| |||||||||||||||
| Short Contracts: | ||||||||||||||||||||
| 1 | J.P. Morgan | LME Aluminum Futures^ | 01/2016 | $(39,220 | ) | $(37,533 | ) | $1,687 | ||||||||||||
| 1 | J.P. Morgan | LME Aluminum Futures^ | 01/2016 | (37,122 | ) | (37,637 | ) | (515 | ) | |||||||||||
| 1 | J.P. Morgan | LME Aluminum Futures^ | 02/2016 | (37,618 | ) | (37,743 | ) | (125 | ) | |||||||||||
| 1 | J.P. Morgan | LME Aluminum Futures^ | 02/2016 | (36,598 | ) | (37,729 | ) | (1,131 | ) | |||||||||||
| 1 | J.P. Morgan | LME Aluminum Futures^ | 03/2016 | (36,997 | ) | (37,744 | ) | (747 | ) | |||||||||||
| 10 | J.P. Morgan | LME Aluminum Futures^ | 03/2016 | (372,675 | ) | (376,937 | ) | (4,262 | ) | |||||||||||
| 3 | J.P. Morgan | LME Aluminum Futures^ | 03/2016 | (110,996 | ) | (113,119 | ) | (2,123 | ) | |||||||||||
| 3 | J.P. Morgan | LME Aluminum Futures^ | 03/2016 | (110,663 | ) | (113,075 | ) | (2,412 | ) | |||||||||||
| 1 | J.P. Morgan | LME Aluminum Futures^ | 03/2016 | (38,198 | ) | (37,684 | ) | 514 | ||||||||||||
| 2 | J.P. Morgan | LME Copper Futures^ | 01/2016 | (256,294 | ) | (235,355 | ) | 20,939 | ||||||||||||
| 1 | J.P. Morgan | LME Copper Futures^ | 01/2016 | (133,372 | ) | (117,756 | ) | 15,616 | ||||||||||||
| 1 | J.P. Morgan | LME Copper Futures^ | 01/2016 | (130,128 | ) | (117,750 | ) | 12,378 | ||||||||||||
| 3 | J.P. Morgan | LME Copper Futures^ | 03/2016 | (357,976 | ) | (353,119 | ) | 4,857 | ||||||||||||
| 1 | J.P. Morgan | LME Copper Futures^ | 03/2016 | (114,860 | ) | (117,718 | ) | (2,858 | ) | |||||||||||
| 1 | J.P. Morgan | LME Lead Futures^ | 01/2016 | (41,697 | ) | (44,924 | ) | (3,227 | ) | |||||||||||
| 1 | J.P. Morgan | LME Lead Futures^ | 02/2016 | (41,505 | ) | (44,917 | ) | (3,412 | ) | |||||||||||
| 3 | J.P. Morgan | LME Lead Futures^ | 03/2016 | (126,367 | ) | (134,756 | ) | (8,389 | ) | |||||||||||
| 1 | J.P. Morgan | LME Lead Futures^ | 03/2016 | (42,993 | ) | (44,920 | ) | (1,927 | ) | |||||||||||
| 1 | J.P. Morgan | LME Nickel Futures^ | 01/2016 | (62,782 | ) | (52,744 | ) | 10,038 | ||||||||||||
| 2 | J.P. Morgan | LME Nickel Futures^ | 03/2016 | (104,155 | ) | (105,768 | ) | (1,613 | ) | |||||||||||
| 2 | J.P. Morgan | LME Nickel Futures^ | 03/2016 | (104,293 | ) | (105,773 | ) | (1,480 | ) | |||||||||||
| 1 | J.P. Morgan | LME Zinc Futures^ | 01/2016 | (41,917 | ) | (39,855 | ) | 2,062 | ||||||||||||
| 1 | J.P. Morgan | LME Zinc Futures^ | 02/2016 | (41,511 | ) | (40,061 | ) | 1,450 | ||||||||||||
| 9 | J.P. Morgan | LME Zinc Futures^ | 03/2016 | (395,487 | ) | (362,025 | ) | 33,462 | ||||||||||||
| 1 | J.P. Morgan | LME Zinc Futures^ | 03/2016 | (37,972 | ) | (40,217 | ) | (2,245 | ) | |||||||||||
| The accompanying notes are an integral part of these financial statements. | (Continued) |
| AQR Funds | Annual Report | December 2015 | ||||||||||||||
245
Table of Contents
| Consolidated Schedule of Investments | December 31, 2015 |
| AQR RISK PARITY II HV FUND |
| NUMBER OF CONTRACTS | COUNTERPARTY | DESCRIPTION | EXPIRATION DATE | VALUE AT TRADE DATE | VALUE AT DECEMBER 31, 2015 | UNREALIZED APPRECIATION (DEPRECIATION) | ||||||||||||||
| Short Contracts: (continued) | ||||||||||||||||||||
| 1 | J.P. Morgan | LME Zinc Futures^ | 03/2016 | $(40,323 | ) | $(40,225 | ) | $98 | ||||||||||||
|
|
|
|
|
| |||||||||||||||
| (2,893,719 | ) | (2,827,084 | ) | 66,635 | ||||||||||||||||
|
|
|
|
|
| |||||||||||||||
| $85,618,233 | $84,907,599 | $(710,634 | ) | |||||||||||||||||
|
|
|
|
|
| |||||||||||||||
| ^ | Represents positions held in the respective Subsidiary (See Note 2). |
Forward foreign currency exchange contracts outstanding as of December 31, 2015:
Over the Counter
| PURCHASE CONTRACTS | COUNTERPARTY | CURRENCY | CURRENCY AMOUNT PURCHASED | VALUE AT SETTLEMENT DATE | VALUE AT DECEMBER 31, 2015 | UNREALIZED APPRECIATION (DEPRECIATION) | ||||||||||||||
| Euro, Expiring 03/16/16 | Credit Suisse International | EUR | 1,865,280 | $2,038,188 | $2,030,817 | $(7,371 | ) | |||||||||||||
| British Pound, Expiring 03/16/16 | Credit Suisse International | GBP | 337,914 | 506,610 | 498,213 | (8,397 | ) | |||||||||||||
| Hong Kong Dollar, Expiring 03/16/16 | CitiBank | HKD | 624,500 | 80,613 | 80,626 | 13 | ||||||||||||||
| Hong Kong Dollar, Expiring 03/16/16 | Credit Suisse International | HKD | 624,500 | 80,618 | 80,626 | 8 | ||||||||||||||
|
|
|
|
|
| |||||||||||||||
| $2,706,029 | $2,690,282 | $(15,747 | ) | |||||||||||||||||
|
|
|
|
|
| |||||||||||||||
SALES CONTRACTS | COUNTERPARTY | CURRENCY | CURRENCY AMOUNT SOLD | VALUE AT SETTLEMENT DATE | VALUE AT DECEMBER 31, 2015 | UNREALIZED APPRECIATION (DEPRECIATION) | ||||||||||||||
| Brazilian Real, Expiring 03/16/16* | CitiBank | BRL | (15,000 | ) | $(3,762 | ) | $(3,704 | ) | $58 | |||||||||||
| Brazilian Real, Expiring 03/16/16* | Credit Suisse International | BRL | (15,000 | ) | (3,762 | ) | (3,704 | ) | 58 | |||||||||||
| Swiss Franc, Expiring 03/16/16 | CitiBank | CHF | (26,498 | ) | (26,567 | ) | (26,538 | ) | 29 | |||||||||||
Swiss Franc, Expiring 03/16/16 | Credit Suisse International | CHF | (63,502 | ) | (64,048 | ) | (63,597 | ) | 451 | |||||||||||
| Euro, Expiring 03/16/16 | CitiBank | EUR | (2,974,569 | ) | (3,166,292 | ) | (3,238,552 | ) | (72,260 | ) | ||||||||||
| Euro, Expiring 03/16/16 | Credit Suisse International | EUR | (3,547,701 | ) | (3,792,598 | ) | (3,862,547 | ) | (69,949 | ) | ||||||||||
| British Pound, Expiring 03/16/16 | CitiBank | GBP | (750,145 | ) | (1,125,446 | ) | (1,105,997 | ) | 19,449 | |||||||||||
| British Pound, Expiring 03/16/16 | Credit Suisse International | GBP | (864,163 | ) | (1,295,189 | ) | (1,274,103 | ) | 21,086 | |||||||||||
| Hong Kong Dollar, Expiring 03/16/16 | Credit Suisse International | HKD | (887,000 | ) | (114,474 | ) | (114,516 | ) | (42 | ) | ||||||||||
|
|
|
|
|
| |||||||||||||||
| (9,592,138 | ) | (9,693,258 | ) | (101,120 | ) | |||||||||||||||
|
|
|
|
|
| |||||||||||||||
| $(6,886,109 | ) | $(7,002,976 | ) | $(116,867 | ) | |||||||||||||||
|
|
|
|
|
| |||||||||||||||
| * | Non-deliverable forward (See Note 4). |
| The accompanying notes are an integral part of these financial statements. | (Continued) |
| AQR Funds | Annual Report | December 2015 | ||||||||||||||
246
Table of Contents
| Consolidated Schedule of Investments | December 31, 2015 |
| AQR RISK PARITY II HV FUND |
BRL - Brazilian Real
CHF - Swiss Franc
EUR - Euro
GBP - British Pound
HKD - Hong Kong Dollar
KRW - Korean Won
TWD - New Taiwan Dollar
USD - United States Dollar
Collateral pledged to, or (received from), each counterparty at December 31, 2015 was as follows:
| COUNTERPARTY | OVER THE COUNTER | EXCHANGE TRADED/ CENTRALLY CLEARED | TOTAL | |||||||||
| Bank of America | ||||||||||||
| Money Market Funds | $120,000 | $— | $120,000 | |||||||||
| ||||||||||||
| Barclays Capital | ||||||||||||
| Cash | — | 632,528 | 632,528 | |||||||||
| ||||||||||||
| CitiBank | ||||||||||||
| Money Market Funds | 280,000 | — | 280,000 | |||||||||
| U.S. Treasury Inflation Protected Securities | 3,609,626 | — | 3,609,626 | |||||||||
| ||||||||||||
| Credit Suisse International | ||||||||||||
| Money Market Funds | 120,003 | — | 120,003 | |||||||||
| ||||||||||||
| Goldman Sachs | ||||||||||||
| Cash | — | 576,027 | 576,027 | |||||||||
| Money Market Funds | 140,000 | — | 140,000 | |||||||||
| ||||||||||||
| J.P. Morgan | ||||||||||||
| Cash | — | 28,716 | 28,716 | |||||||||
| U.S. Treasury Inflation Protected Securities | 3,168,448 | — | 3,168,448 | |||||||||
| ||||||||||||
| Morgan Stanley and Co., International PLC | ||||||||||||
| Cash | — | 577,673 | 577,673 | |||||||||
| ||||||||||||
Collateral pledged to, or (received from), each counterparty for the Subsidiary (See Note 2) at December 31, 2015 was as follows:
| COUNTERPARTY | OVER THE COUNTER | EXCHANGE TRADED/ CENTRALLY CLEARED | TOTAL | |||||||||
| CitiBank | ||||||||||||
| Money Market Funds | $150,009 | $— | $150,009 | |||||||||
| ||||||||||||
| Deutsche Bank | ||||||||||||
| Money Market Funds | 210,019 | — | 210,019 | |||||||||
| ||||||||||||
| Goldman Sachs | ||||||||||||
| Cash | — | 263,390 | 263,390 | |||||||||
| ||||||||||||
| J.P. Morgan | ||||||||||||
| Cash | — | 430,667 | 430,667 | |||||||||
| ||||||||||||
| Morgan Stanley and Co., International PLC | ||||||||||||
| Cash | — | 802,985 | 802,985 | |||||||||
| ||||||||||||
| The accompanying notes are an integral part of these financial statements. |
| AQR Funds | Annual Report | December 2015 | ||||||||||||||
247
Table of Contents
| Consolidated Schedule of Investments | December 31, 2015 |
| AQR RISK PARITY II MV FUND |
| GOVERNMENT RELATED OBLIGATIONS - 11.3% | INTEREST RATE | MATURITY DATE | CURRENCY | PRINCIPAL AMOUNT (000’s) | VALUE (Note 5) | |||||||||||||||
| Sovereign Debt - 11.3% | ||||||||||||||||||||
| Deutsche Bundesrepublik Inflation Linked Bond (Germany) | 0.100 | % | 04/15/23 | EUR | 726 | $ | 825,535 | |||||||||||||
| Deutsche Bundesrepublik Inflation Linked Bond (Germany) | 0.100 | % | 04/15/26 | EUR | 1,715 | 1,958,125 | ||||||||||||||
| Deutsche Bundesrepublik Inflation Linked Bond (Germany) | 1.750 | % | 04/15/20 | EUR | 1,206 | 1,443,475 | ||||||||||||||
| France Government Bond OAT (France) | 0.100 | % | 07/25/21 | EUR | 404 | 455,828 | ||||||||||||||
| France Government Bond OAT (France) | 0.100 | % | 03/01/25 | EUR | 400 | 445,668 | ||||||||||||||
| France Government Bond OAT (France) | 0.250 | % | 07/25/24 | EUR | 407 | 464,447 | ||||||||||||||
| France Government Bond OAT (France) | 1.198 | % | 07/25/22 | EUR | 434 | 525,768 | ||||||||||||||
| France Government Bond OAT (France) | 2.250 | % | 07/25/20 | EUR | 1,099 | 1,364,328 | ||||||||||||||
| United Kingdom Index Linked Treasury Gilt (United Kingdom) | 0.125 | % | 03/22/24 | GBP | 964 | 1,505,990 | ||||||||||||||
| United Kingdom Index Linked Treasury Gilt (United Kingdom) | 0.125 | % | 03/22/26 | GBP | 804 | 1,263,435 | ||||||||||||||
|
| |||||||||||||||||||
TOTAL GOVERNMENT RELATED OBLIGATIONS | 10,252,599 | |||||||||||||||||||
|
| |||||||||||||||||||
| U.S. TREASURY OBLIGATIONS - 17.0% | ||||||||||||||||||||
| U.S. Treasury Inflation Protected Securities - 17.0% | ||||||||||||||||||||
| U.S. Treasury Inflation Protected Securities | 0.125 | % | 04/15/19 | USD | 4,600 | 4,641,675 | ||||||||||||||
| U.S. Treasury Inflation Protected Securities | 0.125 | % | 04/15/20 | USD | 5,400 | 5,414,439 | ||||||||||||||
| U.S. Treasury Inflation Protected Securities | 0.125 | % | 07/15/24 | USD | 1,500 | 1,426,941 | ||||||||||||||
| U.S. Treasury Inflation Protected Securities | 0.250 | % | 01/15/25 | USD | 1,900 | 1,821,061 | ||||||||||||||
| U.S. Treasury Inflation Protected Securities | 0.375 | % | 07/15/25 | USD | 2,100 | 2,039,129 | ||||||||||||||
|
| |||||||||||||||||||
TOTAL U.S. TREASURY OBLIGATIONS | 15,343,245 | |||||||||||||||||||
|
| |||||||||||||||||||
| MONEY MARKET FUNDS - 47.7% | SHARES | |||||||
| BlackRock Liquidity Funds T-Fund Portfolio, Institutional Shares, 0.100% ^(a) | 657,712 | 657,712 | ||||||
| Dreyfus Treasury Cash Management, Class I, 0.090% ^(a) | 2,630,847 | 2,630,847 | ||||||
| J.P. Morgan U.S. Treasury Plus Money Market Fund - IM Shares, 0.129% ^(a) | 35,548,297 | 35,548,297 | ||||||
| J.P. Morgan U.S. Treasury Plus Money Market Fund - Institutional Shares, 0.070% ^(a)(b) | 900,039 | 900,039 | ||||||
| UBS Money Series - UBS Select Treasury Preferred Fund, Class I, 0.140% ^(a) | 3,288,559 | 3,288,559 | ||||||
|
| |||||||
TOTAL MONEY MARKET FUNDS | 43,025,454 | |||||||
|
| |||||||
| SHORT-TERM INVESTMENTS - 20.9% | | PRINCIPAL AMOUNT (000’s) | | |||||
| U.S. Treasury Bill, 0.066%, 04/07/2016 (c) | $ | 2,940 | 2,939,847 | |||||
| U.S. Treasury Bill, 0.098%, 03/31/2016 (c) | 1,569 | 1,568,338 | ||||||
| U.S. Treasury Bill, 0.141%, 01/28/2016 (c)^ | 7,269 | 7,269,367 | ||||||
| U.S. Treasury Bill, 0.161%, 02/04/2016 (c)^ | 3,512 | 3,512,695 | ||||||
| U.S. Treasury Bill, 0.263%, 03/03/2016 (c)(d)^ | 3,578 | 3,579,370 | ||||||
|
| |||||||
TOTAL SHORT-TERM INVESTMENTS | 18,869,617 | |||||||
|
| |||||||
TOTAL INVESTMENTS IN SECURITIES, AT VALUE - 96.9% | 87,490,915 | |||||||
|
| |||||||
| OTHER ASSETS IN EXCESS OF LIABILITIES - 3.1% (e) | 2,767,802 | |||||||
|
| |||||||
NET ASSETS - 100.0% | $ | 90,258,717 | ||||||
|
| |||||||
All securities are United States companies, unless noted otherwise in parentheses.
| (a) | Represents annualized seven-day yield as of the close of the reporting period. |
| (b) | All or a portion of the security is pledged as collateral to the brokers for forward foreign currency exchange and swap contracts. |
| (c) | The rate shown is the effective yield at the date of purchase. |
| (d) | All or a portion of the security is pledged as collateral to the brokers for futures contracts. |
| (e) | Includes appreciation/(depreciation) on forward foreign currency exchange, futures and swap contracts. |
| ^ | All or a portion represents positions held in the respective Subsidiary (See Note 2). |
| The accompanying notes are an integral part of these financial statements. | (Continued) |
| AQR Funds | Annual Report | December 2015 | ||||||||||||||
248
Table of Contents
| Consolidated Schedule of Investments | December 31, 2015 |
| AQR RISK PARITY II MV FUND |
All securities are Level 2 with respect to ASC 820 (See Note 5).
The following abbreviations are used in portfolio descriptions:
EUR - Euro
GBP - British Pound
USD - United States Dollar
Total return swap contracts outstanding as of December 31, 2015:
Over the Counter
| COUNTERPARTY | UNDERLYING REFERENCE INSTRUMENT | TERMINATION DATE | CURRENCY | NOTIONAL VALUE | UNREALIZED APPRECIATION (DEPRECIATION) | |||||||||
| Goldman Sachs | Bovespa Index February Futures | 02/2016 | BRL | 1,145,426 | $(12,297 | ) | ||||||||
| Macquarie Capital | Brent Crude January Futures^ | 01/2016 | USD | (54,035 | ) | 11,960 | ||||||||
| Macquarie Capital | Brent Crude January Futures^ | 01/2016 | USD | 54,035 | (16,755 | ) | ||||||||
| Macquarie Capital | Brent Crude January Futures^ | 02/2016 | USD | 49,860 | (12,190 | ) | ||||||||
| Macquarie Capital | Brent Crude January Futures^ | 02/2016 | USD | (49,860 | ) | 4,830 | ||||||||
| Macquarie Capital | Brent Crude February Futures^ | 03/2016 | USD | 43,365 | (4,835 | ) | ||||||||
| Bank of America | CNX Nifty Index January Futures | 01/2016 | INR | 595,286 | 17 | |||||||||
| Macquarie Capital | Coffee ‘C’ March Futures^ | 02/2016 | USD | 48,534 | (1,022 | ) | ||||||||
| CitiBank | Corn March Futures^ | 02/2016 | USD | 115,639 | (8,014 | ) | ||||||||
| Deutsche Bank | Corn March Futures^ | 02/2016 | USD | 555,856 | (53,606 | ) | ||||||||
| Macquarie Capital | Corn March Futures^ | 02/2016 | USD | 99,691 | (10,003 | ) | ||||||||
| Societe Generale | Corn March Futures^ | 02/2016 | USD | 19,682 | (1,744 | ) | ||||||||
| CitiBank | Cotton No. 2 March Futures^ | 02/2016 | USD | (30,820 | ) | (819 | ) | |||||||
| CitiBank | Cotton No. 2 March Futures^ | 02/2016 | USD | 250,147 | 2,971 | |||||||||
| Deutsche Bank | Cotton No. 2 March Futures^ | 02/2016 | USD | 92,837 | 2,083 | |||||||||
| Macquarie Capital | Cotton No. 2 March Futures^ | 02/2016 | USD | 62,152 | 1,128 | |||||||||
| Macquarie Capital | Gas Oil January Futures^ | 01/2016 | USD | (50,188 | ) | 16,725 | ||||||||
| Macquarie Capital | Gas Oil January Futures^ | 01/2016 | USD | 50,188 | (17,562 | ) | ||||||||
| Macquarie Capital | Gasoline RBOB December Futures^ | 01/2016 | USD | (59,459 | ) | 3,858 | ||||||||
| Macquarie Capital | Gasoline RBOB December Futures^ | 01/2016 | USD | 59,459 | (6,241 | ) | ||||||||
| Macquarie Capital | Gasoline RBOB January Futures^ | 02/2016 | USD | 57,483 | (4,101 | ) | ||||||||
| Macquarie Capital | Gasoline RBOB January Futures^ | 02/2016 | USD | (57,483 | ) | (1,012 | ) | |||||||
| Macquarie Capital | Gasoline RBOB February Futures^ | 03/2016 | USD | 53,640 | 884 | |||||||||
| Macquarie Capital | Gold 100 OZ February Futures^ | 02/2016 | USD | 114,370 | (8,350 | ) | ||||||||
| Societe Generale | Gold 100 OZ February Futures^ | 01/2016 | USD | 114,170 | (8,150 | ) | ||||||||
| Bank of America | Hang Seng Index January Futures | 01/2016 | HKD | 3,311,776 | (3,261 | ) | ||||||||
| Societe Generale | Hard Red Winter Wheat March Futures^ | 02/2016 | USD | 24,385 | (960 | ) | ||||||||
| Macquarie Capital | Heating Oil ULSD December Futures^ | 01/2016 | USD | 69,804 | (23,575 | ) | ||||||||
| Macquarie Capital | Heating Oil ULSD December Futures^ | 01/2016 | USD | (69,804 | ) | 17,394 | ||||||||
| Macquarie Capital | Heating Oil ULSD January Futures^ | 02/2016 | USD | (64,367 | ) | 8,408 | ||||||||
| Macquarie Capital | Heating Oil ULSD January Futures^ | 02/2016 | USD | 64,367 | (17,163 | ) | ||||||||
| Macquarie Capital | Heating Oil ULSD February Futures^ | 03/2016 | USD | 56,505 | (8,251 | ) | ||||||||
| Bank of America | H-SHARES Index January Futures | 01/2016 | HKD | 8,921,287 | (24,098 | ) | ||||||||
| Goldman Sachs | H-SHARES Index January Futures | 01/2016 | HKD | 4,939,407 | (11,212 | ) | ||||||||
| Bank of America | KOSPI Index 200 March Futures | 03/2016 | KRW | 598,036,300 | 2,595 | |||||||||
| Deutsche Bank | Lean Hogs February Futures^ | 02/2016 | USD | 223,677 | (8,397 | ) | ||||||||
| Macquarie Capital | Lean Hogs February Futures^ | 02/2016 | USD | (25,388 | ) | (615 | ) | |||||||
| Macquarie Capital | Lean Hogs February Futures^ | 02/2016 | USD | 98,777 | (3,097 | ) | ||||||||
| Deutsche Bank | Live Cattle February Futures^ | 02/2016 | USD | 852,468 | (31,650 | ) | ||||||||
| Deutsche Bank | Live Cattle February Futures^ | 02/2016 | USD | (149,620 | ) | (14,532 | ) | |||||||
| Goldman Sachs | MSCI Taiwan Stock Index January Futures | 01/2016 | USD | 368,518 | (3,238 | ) | ||||||||
| Goldman Sachs | SGX S&P CNX Nifty Index January Futures | 01/2016 | USD | 127,012 | 156 | |||||||||
| Macquarie Capital | Silver March Futures^ | 03/2016 | USD | 77,900 | (8,885 | ) | ||||||||
| CitiBank | Soybean March Futures^ | 02/2016 | USD | 434,613 | (2,488 | ) | ||||||||
| Deutsche Bank | Soybean March Futures^ | 02/2016 | USD | 172,486 | 365 | |||||||||
| Macquarie Capital | Soybean March Futures^ | 02/2016 | USD | 216,498 | (436 | ) | ||||||||
| The accompanying notes are an integral part of these financial statements. | (Continued) |
| AQR Funds | Annual Report | December 2015 | ||||||||||||||
249
Table of Contents
| Consolidated Schedule of Investments | December 31, 2015 |
| AQR RISK PARITY II MV FUND |
| COUNTERPARTY | UNDERLYING REFERENCE INSTRUMENT | TERMINATION DATE | CURRENCY | NOTIONAL VALUE | UNREALIZED APPRECIATION (DEPRECIATION) | |||||||||
| Societe Generale | Soybean March Futures^ | 02/2016 | USD | 215,803 | $ 260 | |||||||||
| CitiBank | Soybean Meal March Futures^ | 02/2016 | USD | 28,545 | (1,995 | ) | ||||||||
| Macquarie Capital | Soybean Oil March Futures^ | 02/2016 | USD | 54,882 | 468 | |||||||||
| CitiBank | Sugar #11 (World Markets) February Futures^ | 02/2016 | USD | 16,828 | 241 | |||||||||
| Goldman Sachs | Swiss Market Index March Futures | 03/2016 | CHF | 678,713 | 21,130 | |||||||||
| Goldman Sachs | Taiwan Stock Exchange January Futures | 01/2016 | TWD | 4,841,092 | 3,783 | |||||||||
| CitiBank | Wheat March Futures^ | 02/2016 | USD | 156,597 | (15,585 | ) | ||||||||
| CitiBank | Wheat March Futures^ | 02/2016 | USD | (155,588 | ) | 14,576 | ||||||||
| Macquarie Capital | WTI Crude January Futures^ | 01/2016 | USD | (46,600 | ) | 7,415 | ||||||||
| Macquarie Capital | WTI Crude January Futures^ | 01/2016 | USD | 46,600 | (9,560 | ) | ||||||||
|
| |||||||||||||
| $(234,452 | ) | |||||||||||||
|
| |||||||||||||
| ^ | Represents positions held in the respective Subsidiary (See Note 2). |
Open futures contracts outstanding at December 31, 2015:
Exchange Traded
| NUMBER OF CONTRACTS | COUNTERPARTY | DESCRIPTION | EXPIRATION DATE | VALUE AT TRADE DATE | VALUE AT DECEMBER 31, 2015 | UNREALIZED APPRECIATION (DEPRECIATION) | ||||||||||||||
| Long Contracts: | ||||||||||||||||||||
| 36 | Goldman Sachs | Brent Crude Futures^ | 02/2016 | $1,476,511 | $1,387,080 | $(89,431 | ) | |||||||||||||
| 2 | Morgan Stanley and Co., International PLC | Cocoa Futures^ | 03/2016 | 61,365 | 64,220 | 2,855 | ||||||||||||||
| 8 | Morgan Stanley and Co., International PLC | Coffee ‘C’ Futures^ | 03/2016 | 406,181 | 380,100 | (26,081 | ) | |||||||||||||
| 36 | Morgan Stanley and Co., International PLC | Corn Futures^ | 03/2016 | 712,513 | 645,750 | (66,763 | ) | |||||||||||||
| 3 | Morgan Stanley and Co., International PLC | Cotton No. 2 Futures^ | 03/2016 | 93,613 | 94,920 | 1,307 | ||||||||||||||
| 1 | Morgan Stanley and Co., International PLC | Feeder Cattle Futures^ | 03/2016 | 85,067 | 81,825 | (3,242 | ) | |||||||||||||
| 17 | Goldman Sachs | Gas Oil Futures^ | 03/2016 | 646,936 | 581,825 | (65,111 | ) | |||||||||||||
| 8 | Morgan Stanley and Co., International PLC | Gasoline RBOB Futures^ | 02/2016 | 428,411 | 436,195 | 7,784 | ||||||||||||||
| 16 | Morgan Stanley and Co., International PLC | Gold 100 OZ Futures^ | 02/2016 | 1,818,635 | 1,696,320 | (122,315 | ) | |||||||||||||
| 1 | Morgan Stanley and Co., International PLC | Hard Red Winter Wheat Futures^ | 03/2016 | 25,182 | 23,425 | (1,757 | ) | |||||||||||||
| 7 | Morgan Stanley and Co., International PLC | Heating Oil ULSD Futures^ | 02/2016 | 385,374 | 337,777 | (47,597 | ) | |||||||||||||
| 4 | Morgan Stanley and Co., International PLC | Lean Hogs Futures^ | 02/2016 | 98,624 | 95,680 | (2,944 | ) | |||||||||||||
| The accompanying notes are an integral part of these financial statements. | (Continued) |
| AQR Funds | Annual Report | December 2015 | ||||||||||||||
250
Table of Contents
| Consolidated Schedule of Investments | December 31, 2015 |
| AQR RISK PARITY II MV FUND |
| NUMBER OF CONTRACTS | COUNTERPARTY | DESCRIPTION | EXPIRATION DATE | VALUE AT TRADE DATE | VALUE AT DECEMBER 31, 2015 | UNREALIZED APPRECIATION (DEPRECIATION) | ||||||||||||||
| Long Contracts: (continued) | ||||||||||||||||||||
| 3 | Morgan Stanley and Co., International PLC | Live Cattle Futures^ | 02/2016 | $ 172,373 | $ 164,160 | $ (8,213 | ) | |||||||||||||
| 5 | J.P. Morgan | LME Aluminum Futures^ | 01/2016 | 200,387 | 187,662 | (12,725 | ) | |||||||||||||
| 3 | J.P. Morgan | LME Aluminum Futures^ | 01/2016 | 119,107 | 112,728 | (6,379 | ) | |||||||||||||
| 1 | J.P. Morgan | LME Aluminum Futures^ | 01/2016 | 39,792 | 37,593 | (2,199 | ) | |||||||||||||
| 2 | J.P. Morgan | LME Aluminum Futures^ | 01/2016 | 76,047 | 75,275 | (772 | ) | |||||||||||||
| 1 | J.P. Morgan | LME Aluminum Futures^ | 01/2016 | 37,927 | 37,637 | (290 | ) | |||||||||||||
| 1 | J.P. Morgan | LME Aluminum Futures^ | 01/2016 | 37,034 | 37,645 | 611 | ||||||||||||||
| 1 | J.P. Morgan | LME Aluminum Futures^ | 01/2016 | 36,828 | 37,653 | 825 | ||||||||||||||
| 1 | J.P. Morgan | LME Aluminum Futures^ | 02/2016 | 37,477 | 37,705 | 228 | ||||||||||||||
| 1 | J.P. Morgan | LME Aluminum Futures^ | 02/2016 | 37,502 | 37,743 | 241 | ||||||||||||||
| 3 | J.P. Morgan | LME Aluminum Futures^ | 02/2016 | 109,771 | 113,185 | 3,414 | ||||||||||||||
| 3 | J.P. Morgan | LME Aluminum Futures^ | 03/2016 | 111,345 | 113,231 | 1,886 | ||||||||||||||
| 43 | J.P. Morgan | LME Aluminum Futures^ | 03/2016 | 1,707,468 | 1,620,831 | (86,637 | ) | |||||||||||||
| 3 | J.P. Morgan | LME Aluminum Futures^ | 03/2016 | 111,382 | 113,118 | 1,736 | ||||||||||||||
| 1 | J.P. Morgan | LME Aluminum Futures^ | 03/2016 | 36,752 | 37,691 | 939 | ||||||||||||||
| 3 | J.P. Morgan | LME Copper Futures^ | 01/2016 | 389,516 | 353,033 | (36,483 | ) | |||||||||||||
| 1 | J.P. Morgan | LME Copper Futures^ | 01/2016 | 130,037 | 117,760 | (12,277 | ) | |||||||||||||
| 1 | J.P. Morgan | LME Copper Futures^ | 02/2016 | 126,176 | 117,772 | (8,404 | ) | |||||||||||||
| 2 | J.P. Morgan | LME Copper Futures^ | 03/2016 | 228,006 | 235,488 | 7,482 | ||||||||||||||
| 14 | J.P. Morgan | LME Copper Futures^ | 03/2016 | 1,826,667 | 1,647,888 | (178,779 | ) | |||||||||||||
| 1 | J.P. Morgan | LME Lead Futures^ | 01/2016 | 41,373 | 44,925 | 3,552 | ||||||||||||||
| 1 | J.P. Morgan | LME Lead Futures^ | 01/2016 | 41,602 | 44,923 | 3,321 | ||||||||||||||
| 1 | J.P. Morgan | LME Lead Futures^ | 01/2016 | 44,627 | 44,921 | 294 | ||||||||||||||
| 7 | J.P. Morgan | LME Lead Futures^ | 03/2016 | 315,595 | 314,431 | (1,164 | ) | |||||||||||||
| 1 | J.P. Morgan | LME Lead Futures^ | 03/2016 | 43,009 | 44,920 | 1,911 | ||||||||||||||
| 1 | J.P. Morgan | LME Nickel Futures^ | 01/2016 | 60,692 | 52,681 | (8,011 | ) | |||||||||||||
| 1 | J.P. Morgan | LME Nickel Futures^ | 01/2016 | 63,842 | 52,712 | (11,130 | ) | |||||||||||||
| 5 | J.P. Morgan | LME Nickel Futures^ | 03/2016 | 318,121 | 264,420 | (53,701 | ) | |||||||||||||
| 1 | J.P. Morgan | LME Nickel Futures^ | 03/2016 | 52,088 | 52,887 | 799 | ||||||||||||||
| 2 | J.P. Morgan | LME Zinc Futures^ | 01/2016 | 88,230 | 79,710 | (8,520 | ) | |||||||||||||
| 1 | J.P. Morgan | LME Zinc Futures^ | 01/2016 | 45,536 | 39,939 | (5,597 | ) | |||||||||||||
| 1 | J.P. Morgan | LME Zinc Futures^ | 02/2016 | 41,627 | 40,060 | (1,567 | ) | |||||||||||||
| 10 | J.P. Morgan | LME Zinc Futures^ | 03/2016 | 449,802 | 402,250 | (47,552 | ) | |||||||||||||
| 1 | J.P. Morgan | LME Zinc Futures^ | 03/2016 | 38,153 | 40,217 | 2,064 | ||||||||||||||
| 1 | J.P. Morgan | LME Zinc Futures^ | 03/2016 | 40,359 | 40,225 | (134 | ) | |||||||||||||
| 11 | Morgan Stanley and Co., International PLC | Natural Gas Futures^ | 02/2016 | 239,022 | 259,930 | 20,908 | ||||||||||||||
| 17 | Morgan Stanley and Co., International PLC | Silver Futures^ | 03/2016 | 1,313,360 | 1,173,255 | (140,105 | ) | |||||||||||||
| 7 | Morgan Stanley and Co., International PLC | Soybean Futures^ | 03/2016 | 304,432 | 302,488 | (1,944 | ) | |||||||||||||
| 6 | Morgan Stanley and Co., International PLC | Soybean Meal Futures^ | 03/2016 | 176,235 | 159,300 | (16,935 | ) | |||||||||||||
| 29 | Morgan Stanley and Co., International PLC | Soybean Oil Futures^ | 03/2016 | 528,984 | 535,050 | 6,066 | ||||||||||||||
| 40 | Morgan Stanley and Co., International PLC | Sugar #11 (World Markets) Futures^ | 02/2016 | 563,366 | 682,752 | 119,386 | ||||||||||||||
| The accompanying notes are an integral part of these financial statements. | (Continued) |
| AQR Funds | Annual Report | December 2015 | ||||||||||||||
251
Table of Contents
| Consolidated Schedule of Investments | December 31, 2015 |
| AQR RISK PARITY II MV FUND |
| NUMBER OF CONTRACTS | COUNTERPARTY | DESCRIPTION | EXPIRATION DATE | VALUE AT TRADE DATE | VALUE AT DECEMBER 31, 2015 | UNREALIZED APPRECIATION (DEPRECIATION) | ||||||||||||||
| Long Contracts: (continued) | ||||||||||||||||||||
| 12 | Morgan Stanley and Co., International PLC | Wheat Futures^ | 03/2016 | $ 309,387 | $ 282,000 | $ (27,387 | ) | |||||||||||||
| 40 | Morgan Stanley and Co., International PLC | WTI Crude Futures^ | 02/2016 | 1,611,371 | 1,526,800 | (84,571 | ) | |||||||||||||
| 2 | Barclays Capital | Amsterdam Index Futures | 01/2016 | 187,954 | 192,072 | 4,118 | ||||||||||||||
| 10 | Barclays Capital | CAC40 Index Futures | 01/2016 | 501,020 | 504,089 | 3,069 | ||||||||||||||
| 2 | Barclays Capital | DAX Index Futures | 03/2016 | 575,798 | 585,324 | 9,526 | ||||||||||||||
| 11 | Barclays Capital | E-Mini Russell 2000 Futures | 03/2016 | 1,236,094 | 1,244,650 | 8,556 | ||||||||||||||
| 61 | Barclays Capital | Euro Stoxx 50 Index Futures | 03/2016 | 2,153,465 | 2,175,695 | 22,230 | ||||||||||||||
| 12 | Barclays Capital | FTSE 100 Index Futures | 03/2016 | 1,063,195 | 1,096,451 | 33,256 | ||||||||||||||
| 11 | J.P. Morgan | FTSE/JSE Top 40 Index Futures | 03/2016 | 313,154 | 329,125 | 15,971 | ||||||||||||||
| 2 | Barclays Capital | FTSE/MIB Index Futures | 03/2016 | 232,990 | 233,021 | 31 | ||||||||||||||
| 2 | Barclays Capital | Hang Seng Index Futures | 01/2016 | 284,512 | 282,708 | (1,804 | ) | |||||||||||||
| 2 | Barclays Capital | H-SHARES Index Futures | 01/2016 | 126,688 | 125,225 | (1,463 | ) | |||||||||||||
| 1 | Barclays Capital | IBEX 35 Index Futures | 01/2016 | 104,186 | 103,527 | (659 | ) | |||||||||||||
| 5 | Barclays Capital | KOSPI Index 200 Futures | 03/2016 | 506,937 | 512,665 | 5,728 | ||||||||||||||
| 5 | Barclays Capital | MSCI Taiwan Stock Index Futures | 01/2016 | 152,608 | 152,200 | (408 | ) | |||||||||||||
| 116 | Barclays Capital | S&P 500 E-Mini Futures | 03/2016 | 11,670,316 | 11,805,320 | 135,004 | ||||||||||||||
| 10 | Barclays Capital | S&P MID 400 E-Mini Futures | 03/2016 | 1,384,621 | 1,393,500 | 8,879 | ||||||||||||||
| 1 | Barclays Capital | SGX S&P CNX Nifty Index Futures | 01/2016 | 15,886 | 15,896 | 10 | ||||||||||||||
| 9 | Barclays Capital | SPI 200 Index Futures | 03/2016 | 807,876 | 861,925 | 54,049 | ||||||||||||||
| 16 | Barclays Capital | TOPIX Index Futures | 03/2016 | 2,088,970 | 2,059,985 | (28,985 | ) | |||||||||||||
| 7 | Goldman Sachs | 10-Year Japanese Government Bond Futures | 03/2016 | 867,045 | 868,106 | 1,061 | ||||||||||||||
| 4 | Goldman Sachs | 10-Year Japanese Government Bond Futures | 03/2016 | 4,950,319 | 4,959,940 | 9,621 | ||||||||||||||
| 30 | J.P. Morgan | Australia 10-Year Bond Futures | 03/2016 | 2,762,064 | 2,773,994 | 11,930 | ||||||||||||||
| 26 | Goldman Sachs | Canadian 10-Year Bond Futures | 03/2016 | 2,595,812 | 2,649,231 | 53,419 | ||||||||||||||
| 149 | Goldman Sachs | Euro - Bund Futures | 03/2016 | 25,900,257 | 25,571,314 | (328,943 | ) | |||||||||||||
| 20 | Goldman Sachs | Long Gilt Futures | 03/2016 | 3,468,296 | 3,442,847 | (25,449 | ) | |||||||||||||
| 378 | Morgan Stanley and Co., International PLC | U.S. Treasury 10-Year Note Futures | 03/2016 | 47,714,741 | 47,592,563 | (122,178 | ) | |||||||||||||
|
|
|
|
|
| |||||||||||||||
| 130,205,623 | 129,073,084 | (1,132,539 | ) | |||||||||||||||||
|
|
|
|
|
| |||||||||||||||
| Short Contracts: | ||||||||||||||||||||
| 5 | J.P. Morgan | LME Aluminum Futures^ | 01/2016 | $(199,658 | ) | $(187,662 | ) | $11,996 | ||||||||||||
| 3 | J.P. Morgan | LME Aluminum Futures^ | 01/2016 | (118,922 | ) | (112,728 | ) | 6,194 | ||||||||||||
| 1 | J.P. Morgan | LME Aluminum Futures^ | 01/2016 | (39,797 | ) | (37,593 | ) | 2,204 | ||||||||||||
| 2 | J.P. Morgan | LME Aluminum Futures^ | 01/2016 | (75,844 | ) | (75,275 | ) | 569 | ||||||||||||
| 1 | J.P. Morgan | LME Aluminum Futures^ | 01/2016 | (37,772 | ) | (37,637 | ) | 135 | ||||||||||||
| 1 | J.P. Morgan | LME Aluminum Futures^ | 01/2016 | (37,122 | ) | (37,644 | ) | (522 | ) | |||||||||||
| 1 | J.P. Morgan | LME Aluminum Futures^ | 01/2016 | (36,754 | ) | (37,653 | ) | (899 | ) | |||||||||||
| 1 | J.P. Morgan | LME Aluminum Futures^ | 02/2016 | (37,377 | ) | (37,706 | ) | (329 | ) | |||||||||||
| 1 | J.P. Morgan | LME Aluminum Futures^ | 02/2016 | (37,618 | ) | (37,744 | ) | (126 | ) | |||||||||||
| 3 | J.P. Morgan | LME Aluminum Futures^ | 02/2016 | (109,793 | ) | (113,185 | ) | (3,392 | ) | |||||||||||
| 3 | J.P. Morgan | LME Aluminum Futures^ | 03/2016 | (110,991 | ) | (113,231 | ) | (2,240 | ) | |||||||||||
| 18 | J.P. Morgan | LME Aluminum Futures^ | 03/2016 | (692,072 | ) | (678,488 | ) | 13,584 | ||||||||||||
| 3 | J.P. Morgan | LME Aluminum Futures^ | 03/2016 | (110,996 | ) | (113,119 | ) | (2,123 | ) | |||||||||||
| 1 | J.P. Morgan | LME Aluminum Futures^ | 03/2016 | (36,888 | ) | (37,692 | ) | (804 | ) | |||||||||||
| 3 | J.P. Morgan | LME Copper Futures^ | 01/2016 | (388,967 | ) | (353,033 | ) | 35,934 | ||||||||||||
| 1 | J.P. Morgan | LME Copper Futures^ | 01/2016 | (130,122 | ) | (117,759 | ) | 12,363 | ||||||||||||
| 1 | J.P. Morgan | LME Copper Futures^ | 02/2016 | (126,079 | ) | (117,772 | ) | 8,307 | ||||||||||||
| The accompanying notes are an integral part of these financial statements. | (Continued) |
| AQR Funds | Annual Report | December 2015 | ||||||||||||||
252
Table of Contents
| Consolidated Schedule of Investments | December 31, 2015 |
| AQR RISK PARITY II MV FUND |
| NUMBER OF CONTRACTS | COUNTERPARTY | DESCRIPTION | EXPIRATION DATE | VALUE AT TRADE DATE | VALUE AT DECEMBER 31, 2015 | UNREALIZED APPRECIATION (DEPRECIATION) | ||||||||||||||
| Short Contracts: (continued) | ||||||||||||||||||||
| 2 | J.P. Morgan | LME Copper Futures^ | 03/2016 | $(226,802 | ) | $(235,487 | ) | $(8,685 | ) | |||||||||||
| 3 | J.P. Morgan | LME Copper Futures^ | 03/2016 | (355,229 | ) | (353,119 | ) | 2,110 | ||||||||||||
| 1 | J.P. Morgan | LME Lead Futures^ | 01/2016 | (40,903 | ) | (44,925 | ) | (4,022 | ) | |||||||||||
| 1 | J.P. Morgan | LME Lead Futures^ | 01/2016 | (41,697 | ) | (44,924 | ) | (3,227 | ) | |||||||||||
| 1 | J.P. Morgan | LME Lead Futures^ | 01/2016 | (44,708 | ) | (44,921 | ) | (213 | ) | |||||||||||
| 3 | J.P. Morgan | LME Lead Futures^ | 03/2016 | (129,575 | ) | (134,756 | ) | (5,181 | ) | |||||||||||
| 1 | J.P. Morgan | LME Lead Futures^ | 03/2016 | (42,993 | ) | (44,920 | ) | (1,927 | ) | |||||||||||
| 1 | J.P. Morgan | LME Nickel Futures^ | 01/2016 | (59,878 | ) | (52,680 | ) | 7,198 | ||||||||||||
| 1 | J.P. Morgan | LME Nickel Futures^ | 01/2016 | (63,417 | ) | (52,712 | ) | 10,705 | ||||||||||||
| 2 | J.P. Morgan | LME Nickel Futures^ | 03/2016 | (115,990 | ) | (105,768 | ) | 10,222 | ||||||||||||
| 1 | J.P. Morgan | LME Nickel Futures^ | 03/2016 | (52,147 | ) | (52,887 | ) | (740 | ) | |||||||||||
| 2 | J.P. Morgan | LME Zinc Futures^ | 01/2016 | (86,239 | ) | (79,710 | ) | 6,529 | ||||||||||||
| 1 | J.P. Morgan | LME Zinc Futures^ | 01/2016 | (45,873 | ) | (39,940 | ) | 5,933 | ||||||||||||
| 1 | J.P. Morgan | LME Zinc Futures^ | 02/2016 | (41,511 | ) | (40,061 | ) | 1,450 | ||||||||||||
| 6 | J.P. Morgan | LME Zinc Futures^ | 03/2016 | (260,596 | ) | (241,350 | ) | 19,246 | ||||||||||||
| 1 | J.P. Morgan | LME Zinc Futures^ | 03/2016 | (37,972 | ) | (40,217 | ) | (2,245 | ) | |||||||||||
| 1 | J.P. Morgan | LME Zinc Futures^ | 03/2016 | (40,323 | ) | (40,225 | ) | 98 | ||||||||||||
|
|
|
|
|
| |||||||||||||||
| (4,012,625 | ) | (3,894,523 | ) | 118,102 | ||||||||||||||||
|
|
|
|
|
| |||||||||||||||
| $126,192,998 | $125,178,561 | $(1,014,437 | ) | |||||||||||||||||
|
|
|
|
|
| |||||||||||||||
| ^ | Represents positions held in the respective Subsidiary (See Note 2). |
Forward foreign currency exchange contracts outstanding as of December 31, 2015:
Over the Counter
| PURCHASE CONTRACTS | COUNTERPARTY | CURRENCY | CURRENCY AMOUNT PURCHASED | VALUE AT SETTLEMENT DATE | VALUE AT DECEMBER 31, 2015 | UNREALIZED APPRECIATION (DEPRECIATION) | ||||||||||||||
| Euro, Expiring 03/16/16 | Credit Suisse International | EUR | 1,309,283 | $1,435,277 | $1,425,477 | $(9,800 | ) | |||||||||||||
| British Pound, Expiring 03/16/16 | Credit Suisse International | GBP | 114,464 | 171,896 | 168,763 | (3,133 | ) | |||||||||||||
| Hong Kong Dollar, Expiring 03/16/16 | CitiBank | HKD | 885,500 | 114,304 | 114,323 | 19 | ||||||||||||||
| Hong Kong Dollar, Expiring 03/16/16 | Credit Suisse International | HKD | 885,500 | 114,309 | 114,323 | 14 | ||||||||||||||
|
|
|
|
|
| |||||||||||||||
| $1,835,786 | $1,822,886 | $(12,900 | ) | |||||||||||||||||
|
|
|
|
|
| |||||||||||||||
| The accompanying notes are an integral part of these financial statements. | (Continued) |
| AQR Funds | Annual Report | December 2015 | ||||||||||||||
253
Table of Contents
| Consolidated Schedule of Investments | December 31, 2015 |
| AQR RISK PARITY II MV FUND |
| SALES CONTRACTS | COUNTERPARTY | CURRENCY | CURRENCY AMOUNT SOLD | VALUE AT SETTLEMENT DATE | VALUE AT DECEMBER 31, 2015 | UNREALIZED APPRECIATION (DEPRECIATION) | ||||||||||||||
| Brazilian Real, Expiring 03/16/16* | CitiBank | BRL | (25,000 | ) | $(6,270 | ) | $(6,173 | ) | $97 | |||||||||||
| Brazilian Real, Expiring 03/16/16* | Credit Suisse International | BRL | (25,000 | ) | (6,270 | ) | (6,173 | ) | 97 | |||||||||||
| Swiss Franc, Expiring 03/16/16 | CitiBank | CHF | (50,000 | ) | (50,132 | ) | (50,075 | ) | 57 | |||||||||||
| Swiss Franc, Expiring 03/16/16 | Credit Suisse International | CHF | (91,000 | ) | (91,670 | ) | (91,136 | ) | 534 | |||||||||||
| Euro, Expiring 03/16/16 | CitiBank | EUR | (4,056,923 | ) | (4,318,408 | ) | (4,416,961 | ) | (98,553 | ) | ||||||||||
| Euro, Expiring 03/16/16 | Credit Suisse International | EUR | (4,274,771 | ) | (4,556,626 | ) | (4,654,143 | ) | (97,517 | ) | ||||||||||
| British Pound, Expiring 03/16/16 | CitiBank | GBP | (1,045,024 | ) | (1,567,854 | ) | (1,540,760 | ) | 27,094 | |||||||||||
| British Pound, Expiring 03/16/16 | Credit Suisse International | GBP | (1,045,024 | ) | (1,567,866 | ) | (1,540,760 | ) | 27,106 | |||||||||||
| Hong Kong Dollar, Expiring 03/16/16 | Credit Suisse International | HKD | (1,230,000 | ) | (158,738 | ) | (158,800 | ) | (62 | ) | ||||||||||
|
|
|
|
|
| |||||||||||||||
| (12,323,834 | ) | (12,464,981 | ) | (141,147 | ) | |||||||||||||||
|
|
|
|
|
| |||||||||||||||
| $(10,488,048 | ) | $(10,642,095 | ) | $(154,047 | ) | |||||||||||||||
|
|
|
|
|
| �� | ||||||||||||||
| * | Non-deliverable forward (See Note 4). |
BRL - Brazilian Real
CHF - Swiss Franc
EUR - Euro
GBP - British Pound
HKD - Hong Kong Dollar
INR - Indian Rupee
KRW - Korean Won
TWD - New Taiwan Dollar
USD - United States Dollar
Collateral pledged to, or (received from), each counterparty at December 31, 2015 was as follows:
| COUNTERPARTY | OVER THE COUNTER | EXCHANGE TRADED/ CENTRALLY CLEARED | TOTAL | |||||||||
| Bank of America | ||||||||||||
| Money Market Funds | $130,000 | $— | $130,000 | |||||||||
| ||||||||||||
| Barclays Capital | ||||||||||||
| Cash | — | 891,327 | 891,327 | |||||||||
| ||||||||||||
| CitiBank | ||||||||||||
| Money Market Funds | 360,000 | — | 360,000 | |||||||||
| ||||||||||||
| Credit Suisse International | ||||||||||||
| Money Market Funds | 160,000 | — | 160,000 | |||||||||
| ||||||||||||
| Goldman Sachs | ||||||||||||
| Cash | — | 298,719 | 298,719 | |||||||||
| Money Market Funds | 250,000 | — | 250,000 | |||||||||
| U.S. Treasury Bills | — | 646,634 | 646,634 | |||||||||
| ||||||||||||
| J.P. Morgan | ||||||||||||
| Cash | — | 35,125 | 35,125 | |||||||||
| ||||||||||||
| Morgan Stanley and Co., International PLC | ||||||||||||
| Cash | — | 796,632 | 796,632 | |||||||||
| ||||||||||||
| The accompanying notes are an integral part of these financial statements. | (Continued) |
| AQR Funds | Annual Report | December 2015 | ||||||||||||||
254
Table of Contents
| Consolidated Schedule of Investments | December 31, 2015 |
| AQR RISK PARITY II MV FUND |
Collateral pledged to, or (received from), each counterparty for the Subsidiary (See Note 2) at December 31, 2015 was as follows:
| COUNTERPARTY | OVER THE COUNTER | EXCHANGE TRADED/ CENTRALLY CLEARED | TOTAL | |||||||||
| CitiBank | ||||||||||||
| Money Market Funds | $160,013 | $— | $160,013 | |||||||||
| ||||||||||||
| Deutsche Bank | ||||||||||||
| Money Market Funds | 200,026 | — | 200,026 | |||||||||
| ||||||||||||
| Goldman Sachs | ||||||||||||
| Cash | — | 389,444 | 389,444 | |||||||||
| ||||||||||||
| J.P. Morgan | ||||||||||||
| Cash | — | 630,422 | 630,422 | |||||||||
| ||||||||||||
| Macquarie Capital | ||||||||||||
| Money Market Funds | 110,000 | — | 110,000 | |||||||||
| ||||||||||||
| Morgan Stanley and Co., International PLC | ||||||||||||
| Cash | — | 1,098,233 | 1,098,233 | |||||||||
| ||||||||||||
| The accompanying notes are an integral part of these financial statements. |
| AQR Funds | Annual Report | December 2015 | ||||||||||||||
255
Table of Contents
| Consolidated Schedule of Investments | December 31, 2015 |
| AQR STYLE PREMIA ALTERNATIVE FUND |
| LONG INVESTMENTS - 118.1% | SHARES | VALUE (Note 5) | ||||||
| COMMON STOCKS - 36.7% | ||||||||
| Belgium - 1.0% | ||||||||
| Ageas (a) | 64,253 | $ | 2,982,231 | |||||
| bpost SA (a) | 170,934 | 4,194,273 | ||||||
| Colruyt SA (a) | 12,592 | 647,774 | ||||||
| KBC Groep NV (a) | 95,905 | 5,996,573 | ||||||
| Proximus (a) | 108,210 | 3,521,254 | ||||||
| Umicore SA (a) | 5,328 | 223,436 | ||||||
|
| |||||||
| 17,565,541 | ||||||||
|
| |||||||
| Denmark - 1.1% | ||||||||
| AP Moeller - Maersk A/S, Class B (a) | 827 | 1,078,660 | ||||||
| Chr Hansen Holding A/S (a) | 6,783 | 424,279 | ||||||
| Danske Bank A/S (a) | 47,752 | 1,281,296 | ||||||
| DSV A/S (a) | 27,480 | 1,081,714 | ||||||
| FLSmidth & Co. A/S | 6,360 | 220,978 | ||||||
| GN Store Nord A/S (a) | 11,747 | 213,190 | ||||||
| H Lundbeck A/S † | 23,002 | 785,410 | ||||||
| ISS A/S (a) | 62,335 | 2,246,974 | ||||||
| Jyske Bank A/S †(a) | 31,038 | 1,403,902 | ||||||
| Novo Nordisk A/S, Class B (a) | 125,605 | 7,272,305 | ||||||
| Pandora A/S (a) | 11,143 | 1,404,952 | ||||||
| TDC A/S | 119,306 | 594,030 | ||||||
| Tryg A/S (a) | 19,815 | 393,756 | ||||||
| Vestas Wind Systems A/S (a) | 19,304 | 1,348,168 | ||||||
| William Demant Holding A/S †(a) | 9,756 | 929,303 | ||||||
|
| |||||||
| 20,678,917 | ||||||||
|
| |||||||
| Finland - 0.6% | ||||||||
| Amer Sports OYJ | 9,238 | 269,711 | ||||||
| Cargotec OYJ, B Shares | 9,540 | 355,890 | ||||||
| Elisa OYJ (a) | 37,470 | 1,409,804 | ||||||
| Huhtamaki OYJ | 7,516 | 272,737 | ||||||
| Kesko OYJ, B Shares (a) | 20,595 | 721,895 | ||||||
| Metso OYJ (a) | 10,655 | 238,674 | ||||||
| Neste OYJ (a) | 73,330 | 2,188,600 | ||||||
| Orion OYJ, Class B (a) | 54,787 | 1,895,536 | ||||||
| Sampo OYJ, A Shares (a) | 12,928 | 656,513 | ||||||
| Stora Enso OYJ, R Shares (a) | 115,885 | 1,047,849 | ||||||
| UPM-Kymmene OYJ (a) | 141,443 | 2,625,934 | ||||||
|
| |||||||
| 11,683,143 | ||||||||
|
| |||||||
| Germany - 4.1% | ||||||||
| Allianz SE (a) | 54,153 | 9,545,985 | ||||||
| Aurubis AG (a) | 67,542 | 3,420,068 | ||||||
| Axel Springer SE (a) | 7,343 | 408,348 | ||||||
| Brenntag AG (a) | 29,669 | 1,545,985 | ||||||
| Daimler AG (a) | 80,032 | 6,686,995 | ||||||
| Deutsche Lufthansa AG †(a) | 225,568 | 3,552,936 | ||||||
| Deutsche Post AG (a) | 41,046 | 1,147,556 | ||||||
| Duerr AG | 5,583 | 443,079 | ||||||
| Evonik Industries AG (a) | 64,029 | 2,117,887 | ||||||
| Fraport AG Frankfurt Airport Services Worldwide | 3,325 | 212,042 | ||||||
| Freenet AG (a) | 97,491 | 3,289,819 | ||||||
| Fresenius Medical Care AG & Co. KGaA (a) | 75,740 | 6,364,779 | ||||||
| GEA Group AG (a) | 7,761 | 313,551 | ||||||
| Hannover Rueck SE (a) | 74,002 | 8,450,254 | ||||||
| SHARES | VALUE (Note 5) | |||||||
| Germany - 4.1% (continued) | ||||||||
| HeidelbergCement AG (a) | 15,206 | $ | 1,239,252 | |||||
| Hella KGaA Hueck & Co. | 17,764 | 737,709 | ||||||
| HOCHTIEF AG (a) | 16,196 | 1,502,139 | ||||||
| K+S AG (a) | 44,723 | 1,140,040 | ||||||
| KION Group AG †(a) | 43,732 | 2,168,569 | ||||||
| Krones AG | 5,572 | 663,472 | ||||||
| Linde AG (a) | 7,774 | 1,123,020 | ||||||
| Merck KGaA (a) | 37,190 | 3,600,768 | ||||||
| MTU Aero Engines AG (a) | 7,182 | 699,994 | ||||||
| Muenchener Rueckversicherungs-Gesellschaft AG in Muenchen (a) | 31,828 | 6,341,320 | ||||||
| OSRAM Licht AG (a) | 29,128 | 1,216,939 | ||||||
| ProSiebenSat.1 Media SE (a) | 31,168 | 1,572,467 | ||||||
| RHOEN-KLINIKUM AG (a) | 38,225 | 1,146,702 | ||||||
| Software AG | 22,236 | 633,764 | ||||||
| Suedzucker AG (a) | 44,301 | 878,063 | ||||||
| Symrise AG (a) | 29,670 | 1,964,108 | ||||||
| Talanx AG (a) | 33,413 | 1,027,601 | ||||||
| United Internet AG | 3,868 | 212,659 | ||||||
|
| |||||||
| 75,367,870 | ||||||||
|
| |||||||
| Italy - 1.6% | ||||||||
| A2A SpA | 1,229,733 | 1,665,127 | ||||||
| Atlantia SpA | 26,831 | 709,906 | ||||||
| Autogrill SpA † | 58,093 | 553,645 | ||||||
| Banca Generali SpA | 22,841 | 718,487 | ||||||
| Banca Popolare di Milano Scarl | 2,172,212 | 2,151,493 | ||||||
| Buzzi Unicem SpA | 25,838 | 463,154 | ||||||
| Davide Campari-Milano SpA | 71,046 | 614,251 | ||||||
| Enel SpA | 133,452 | 559,605 | ||||||
| Eni SpA (a) | 133,741 | 1,987,151 | ||||||
| FinecoBank Banca Fineco SpA | 451,643 | 3,713,820 | ||||||
| Finmeccanica SpA † | 89,406 | 1,243,124 | ||||||
| Hera SpA | 308,144 | 816,642 | ||||||
| Intesa Sanpaolo SpA | 878,786 | 2,918,449 | ||||||
| Luxottica Group SpA | 13,167 | 858,029 | ||||||
| Mediobanca SpA | 344,388 | 3,301,324 | ||||||
| Prysmian SpA | 47,588 | 1,039,756 | ||||||
| Recordati SpA | 72,426 | 1,889,655 | ||||||
| Snam SpA | 292,120 | 1,524,557 | ||||||
| Telecom Italia SpA † | 224,383 | 284,364 | ||||||
| Terna Rete Elettrica Nazionale SpA | 523,517 | 2,692,390 | ||||||
| UnipolSai SpA | 83,115 | 211,453 | ||||||
|
| |||||||
| 29,916,382 | ||||||||
|
| |||||||
| Japan - 19.5% | ||||||||
| ABC-Mart, Inc. (a) | 58,300 | 3,191,233 | ||||||
| Air Water, Inc. (a) | 107,000 | 1,720,908 | ||||||
| Aisin Seiki Co., Ltd. (a) | 36,400 | 1,566,598 | ||||||
| Ajinomoto Co., Inc. (a) | 23,000 | 544,542 | ||||||
| Alfresa Holdings Corp. (a) | 169,600 | 3,349,650 | ||||||
| Alps Electric Co., Ltd. | 48,800 | 1,323,360 | ||||||
| ANA Holdings, Inc. (a) | 2,820,000 | 8,135,998 | ||||||
| Aozora Bank Ltd. (a) | 1,695,000 | 5,915,252 | ||||||
| Asahi Group Holdings Ltd. (a) | 8,100 | 253,566 | ||||||
| Asahi Kasei Corp. (a) | 376,000 | 2,542,552 | ||||||
| Astellas Pharma, Inc. (a) | 209,000 | 2,975,275 | ||||||
| Bandai Namco Holdings, Inc. (a) | 189,900 | 4,012,042 | ||||||
| The accompanying notes are an integral part of these financial statements. | (Continued) |
| AQR Funds | Annual Report | December 2015 | ||||||||||||||
256
Table of Contents
| Consolidated Schedule of Investments | December 31, 2015 |
| AQR STYLE PREMIA ALTERNATIVE FUND |
| SHARES | VALUE (Note 5) | |||||||
| Japan - 19.5% (continued) | ||||||||
| Bank of Yokohama Ltd./The (a) | 155,000 | $ | 950,088 | |||||
| Benesse Holdings, Inc. (a) | 57,500 | 1,655,885 | ||||||
| Bridgestone Corp. (a) | 55,000 | 1,886,578 | ||||||
| Brother Industries Ltd. (a) | 183,900 | 2,112,599 | ||||||
| Canon, Inc. (a) | 46,000 | 1,391,501 | ||||||
| Central Japan Railway Co. (a) | 38,400 | 6,817,304 | ||||||
| Century Tokyo Leasing Corp. | 9,300 | 332,211 | ||||||
| Chiba Bank Ltd./The (a) | 99,000 | 702,527 | ||||||
| Chubu Electric Power Co., Inc. (a) | 175,700 | 2,405,989 | ||||||
| Chugoku Bank Ltd./The (a) | 108,500 | 1,447,797 | ||||||
| Dai Nippon Printing Co., Ltd. (a) | 109,000 | 1,077,862 | ||||||
| Daicel Corp. (a) | 184,600 | 2,747,200 | ||||||
| Daihatsu Motor Co., Ltd. (a) | 44,300 | 597,608 | ||||||
| Daiichi Sankyo Co., Ltd. (a) | 205,300 | 4,237,332 | ||||||
| Don Quijote Holdings Co., Ltd. (a) | 31,500 | 1,106,240 | ||||||
| East Japan Railway Co. (a) | 38,700 | 3,644,222 | ||||||
| Electric Power Development Co., Ltd. (a) | 55,000 | 1,958,916 | ||||||
| Ezaki Glico Co., Ltd. (a) | 28,700 | 1,550,484 | ||||||
| FamilyMart Co., Ltd. (a) | 82,600 | 3,843,781 | ||||||
| Fuji Electric Co., Ltd. (a) | 138,000 | 578,754 | ||||||
| Fuji Heavy Industries Ltd. (a) | 64,900 | 2,673,638 | ||||||
| FUJIFILM Holdings Corp. (a) | 77,300 | 3,225,922 | ||||||
| Fujitsu Ltd. (a) | 138,000 | 688,775 | ||||||
| Fukuoka Financial Group, Inc. (a) | 275,000 | 1,363,621 | ||||||
| Gunma Bank Ltd./The (a) | 282,000 | 1,639,615 | ||||||
| Hachijuni Bank Ltd./The (a) | 35,000 | 214,200 | ||||||
| Hakuhodo DY Holdings, Inc. (a) | 240,300 | 2,599,939 | ||||||
| Hankyu Hanshin Holdings, Inc. | 41,000 | 266,495 | ||||||
| Haseko Corp. (a) | 196,400 | 2,171,471 | ||||||
| Hikari Tsushin, Inc. (a) | 13,800 | 939,777 | ||||||
| Hino Motors Ltd. (a) | 17,500 | 202,256 | ||||||
| Hisamitsu Pharmaceutical Co., Inc. | 5,000 | 209,914 | ||||||
| Hitachi Chemical Co., Ltd. (a) | 44,900 | 712,323 | ||||||
| Hitachi High-Technologies Corp. (a) | 86,100 | 2,328,411 | ||||||
| Hitachi Metals Ltd. (a) | 93,900 | 1,158,557 | ||||||
| Hokuhoku Financial Group, Inc. | 1,370,000 | 2,792,805 | ||||||
| Hokuriku Electric Power Co. (a) | 27,100 | 400,496 | ||||||
| Hoya Corp. (a) | 76,200 | 3,116,015 | ||||||
| Ibiden Co., Ltd. (a) | 38,100 | 546,217 | ||||||
| Idemitsu Kosan Co., Ltd. (a) | 111,400 | 1,778,744 | ||||||
| ITOCHU Corp. (a) | 376,600 | 4,454,594 | ||||||
| Itochu Techno-Solutions Corp. (a) | 147,500 | 2,938,846 | ||||||
| Izumi Co., Ltd. (a) | 24,700 | 958,912 | ||||||
| Japan Airlines Co., Ltd. (a) | 408,600 | 14,624,980 | ||||||
| Japan Petroleum Exploration Co., Ltd. (a) | 12,400 | 333,031 | ||||||
| JSR Corp. (a) | 49,800 | 776,101 | ||||||
| JTEKT Corp. (a) | 21,600 | 353,551 | ||||||
| Kaken Pharmaceutical Co., Ltd. | 18,900 | 1,291,496 | ||||||
| Kamigumi Co., Ltd. (a) | 93,000 | 800,712 | ||||||
| Kaneka Corp. (a) | 356,000 | 3,700,356 | ||||||
| Kao Corp. (a) | 17,700 | 909,581 | ||||||
| KDDI Corp. (a) | 272,800 | 7,084,669 | ||||||
| Keihan Electric Railway Co., Ltd. | 44,000 | 294,679 | ||||||
| Kewpie Corp. (a) | 129,100 | 3,189,005 | ||||||
| Kobayashi Pharmaceutical Co., Ltd. (a) | 4,900 | 402,435 | ||||||
| SHARES | VALUE (Note 5) | |||||||
| Japan - 19.5% (continued) | ||||||||
| Konami Holdings Corp. | 40,400 | $ | 961,704 | |||||
| Konica Minolta, Inc. (a) | 64,400 | 644,978 | ||||||
| Kose Corp. (a) | 15,400 | 1,423,898 | ||||||
| Kuraray Co., Ltd. | 17,000 | 205,918 | ||||||
| Kurita Water Industries Ltd. (a) | 36,800 | 770,645 | ||||||
| Lawson, Inc. (a) | 16,600 | 1,347,438 | ||||||
| Mabuchi Motor Co., Ltd. (a) | 26,100 | 1,414,487 | ||||||
| Makita Corp. (a) | 17,800 | 1,025,754 | ||||||
| Marubeni Corp. (a) | 202,600 | 1,041,586 | ||||||
| Maruichi Steel Tube Ltd. (a) | 14,300 | 422,158 | ||||||
| McDonald’s Holdings Co., Japan Ltd. | 9,800 | 213,116 | ||||||
| Medipal Holdings Corp. (a) | 131,500 | 2,241,286 | ||||||
| MEIJI Holdings Co., Ltd. (a) | 39,200 | 3,237,906 | ||||||
| Miraca Holdings, Inc. (a) | 24,500 | 1,078,038 | ||||||
| Mitsubishi Chemical Holdings Corp. (a) | 266,200 | 1,688,965 | ||||||
| Mitsubishi Corp. (a) | 148,800 | 2,475,008 | ||||||
| Mitsubishi Electric Corp. (a) | 149,000 | 1,564,030 | ||||||
| Mitsubishi Gas Chemical Co., Inc. (a) | 57,000 | 291,471 | ||||||
| Mitsubishi Tanabe Pharma Corp. (a) | 327,200 | 5,637,209 | ||||||
| Mitsubishi UFJ Financial Group, Inc. (a) | 322,300 | 1,996,406 | ||||||
| Mitsubishi UFJ Lease & Finance Co., Ltd. (a) | 197,300 | 1,015,353 | ||||||
| Mitsui & Co., Ltd. (a) | 282,500 | 3,356,676 | ||||||
| Mixi, Inc. | 45,700 | 1,709,336 | ||||||
| Mizuho Financial Group, Inc. | 2,483,000 | 4,966,001 | ||||||
| MS&AD Insurance Group Holdings, Inc. (a) | 82,100 | 2,407,556 | ||||||
| Murata Manufacturing Co., Ltd. (a) | 7,800 | 1,122,274 | ||||||
| Nagoya Railroad Co., Ltd. (a) | 408,000 | 1,698,141 | ||||||
| Nexon Co., Ltd. (a) | 127,300 | 2,070,883 | ||||||
| NH Foods Ltd. (a) | 77,000 | 1,509,190 | ||||||
| NHK Spring Co., Ltd. (a) | 249,200 | 2,498,550 | ||||||
| Nippon Express Co., Ltd. (a) | 195,000 | 916,349 | ||||||
| Nippon Shokubai Co., Ltd. (a) | 20,100 | 1,398,660 | ||||||
| Nippon Telegraph & Telephone Corp. (a) | 205,300 | 8,170,553 | ||||||
| Nippon Yusen KK (a) | 831,000 | 2,014,088 | ||||||
| Nisshin Seifun Group, Inc. (a) | 86,500 | 1,412,935 | ||||||
| Nissin Foods Holdings Co., Ltd. (a) | 26,900 | 1,427,413 | ||||||
| Nitori Holdings Co., Ltd. (a) | 76,400 | 6,416,215 | ||||||
| NOK Corp. (a) | 106,600 | 2,490,267 | ||||||
| Nomura Research Institute Ltd. (a) | 38,350 | 1,472,785 | ||||||
| NTT Data Corp. (a) | 39,900 | 1,929,010 | ||||||
| Obayashi Corp. (a) | 204,000 | 1,882,349 | ||||||
| Obic Co., Ltd. | 4,300 | 227,619 | ||||||
| Oracle Corp. Japan (a) | 23,600 | 1,098,817 | ||||||
| ORIX Corp. (a) | 262,600 | 3,683,875 | ||||||
| Osaka Gas Co., Ltd. (a) | 878,000 | 3,171,283 | ||||||
| Otsuka Corp. (a) | 64,100 | 3,148,834 | ||||||
| Otsuka Holdings Co., Ltd. (a) | 233,700 | 8,303,113 | ||||||
| Park24 Co., Ltd. (a) | 104,000 | 2,519,653 | ||||||
| Pola Orbis Holdings, Inc. (a) | 26,500 | 1,746,578 | ||||||
| Resona Holdings, Inc. (a) | 1,453,600 | 7,059,025 | ||||||
| Rohm Co., Ltd. (a) | 32,600 | 1,651,218 | ||||||
| Sankyo Co., Ltd. (a) | 71,000 | 2,650,273 | ||||||
| Santen Pharmaceutical Co., Ltd. (a) | 215,600 | 3,549,513 | ||||||
| Secom Co., Ltd. (a) | 24,200 | 1,640,028 | ||||||
| Seibu Holdings, Inc. (a) | 38,000 | 776,048 | ||||||
| The accompanying notes are an integral part of these financial statements. | (Continued) |
| AQR Funds | Annual Report | December 2015 | ||||||||||||||
257
Table of Contents
| Consolidated Schedule of Investments | December 31, 2015 |
| AQR STYLE PREMIA ALTERNATIVE FUND |
| SHARES | VALUE (Note 5) | |||||||
| Japan - 19.5% (continued) | ||||||||
| Seiko Epson Corp. (a) | 96,200 | $ | 1,481,399 | |||||
| Sekisui Chemical Co., Ltd. (a) | 208,000 | 2,715,704 | ||||||
| Sekisui House Ltd. | 30,200 | 507,775 | ||||||
| Seven & i Holdings Co., Ltd. (a) | 61,600 | 2,820,329 | ||||||
| Seven Bank Ltd. (a) | 253,500 | 1,111,724 | ||||||
| Shimadzu Corp. (a) | 50,000 | 836,996 | ||||||
| Shimamura Co., Ltd. (a) | 53,000 | 6,206,784 | ||||||
| Shimano, Inc. (a) | 9,600 | 1,474,162 | ||||||
| Shimizu Corp. (a) | 238,000 | 1,940,708 | ||||||
| Shinsei Bank Ltd. | 703,000 | 1,293,724 | ||||||
| Sojitz Corp. (a) | 951,000 | 1,995,750 | ||||||
| Sugi Holdings Co., Ltd. (a) | 16,100 | 888,281 | ||||||
| Sumitomo Chemical Co., Ltd. (a) | 248,000 | 1,424,288 | ||||||
| Sumitomo Corp. (a) | 119,600 | 1,219,362 | ||||||
| Sumitomo Heavy Industries Ltd. (a) | 650,000 | 2,913,858 | ||||||
| Sumitomo Rubber Industries Ltd. (a) | 416,100 | 5,410,703 | ||||||
| Sundrug Co., Ltd. | 5,100 | 327,913 | ||||||
| Suntory Beverage & Food Ltd. | 4,900 | 214,503 | ||||||
| Suzuken Co., Ltd. (a) | 42,910 | 1,630,673 | ||||||
| Sysmex Corp. (a) | 13,800 | 885,197 | ||||||
| Taisei Corp. (a) | 391,000 | 2,575,505 | ||||||
| Taisho Pharmaceutical Holdings Co., Ltd. (a) | 9,100 | 642,692 | ||||||
| Takashimaya Co., Ltd. (a) | 49,000 | 441,269 | ||||||
| Teijin Ltd. (a) | 279,000 | 950,795 | ||||||
| THK Co., Ltd. (a) | 23,500 | 435,551 | ||||||
| Toho Gas Co., Ltd. (a) | 491,000 | 3,170,993 | ||||||
| Tohoku Electric Power Co., Inc. (a) | 260,600 | 3,257,843 | ||||||
| Tokio Marine Holdings, Inc. (a) | 64,000 | 2,471,976 | ||||||
| Tokyo Electric Power Co., Inc. †(a) | 679,500 | 3,912,736 | ||||||
| Tokyo Gas Co., Ltd. (a) | 623,000 | 2,927,347 | ||||||
| TonenGeneral Sekiyu KK (a) | 12,000 | 101,304 | ||||||
| Toppan Printing Co., Ltd. (a) | 93,000 | 856,824 | ||||||
| Tosoh Corp. | 152,000 | 781,890 | ||||||
| Toyo Suisan Kaisha Ltd. (a) | 88,600 | 3,087,936 | ||||||
| Toyoda Gosei Co., Ltd. (a) | 68,600 | 1,558,381 | ||||||
| Toyota Industries Corp. (a) | 6,400 | 342,230 | ||||||
| Tsuruha Holdings, Inc. | 3,000 | 259,938 | ||||||
| USS Co., Ltd. (a) | 85,100 | 1,278,698 | ||||||
| West Japan Railway Co. (a) | 121,000 | 8,363,888 | ||||||
| Yamada Denki Co., Ltd. (a) | 291,000 | 1,256,983 | ||||||
| Yamaguchi Financial Group, Inc. (a) | 292,000 | 3,459,385 | ||||||
| Yamaha Corp. (a) | 26,000 | 628,014 | ||||||
| Yamazaki Baking Co., Ltd. (a) | 272,000 | 6,116,136 | ||||||
| Yokohama Rubber Co., Ltd./The (a) | 35,700 | 548,274 | ||||||
|
| |||||||
| 357,236,876 | ||||||||
|
| |||||||
| Netherlands - 1.2% | ||||||||
| Aalberts Industries NV (a) | 10,551 | 363,542 | ||||||
| Boskalis Westminster (a) | 54,361 | 2,217,505 | ||||||
| Heineken NV (a) | 23,925 | 2,038,816 | ||||||
| Koninklijke Ahold NV (a) | 268,461 | 5,662,768 | ||||||
| NN Group NV (a) | 163,499 | 5,768,720 | ||||||
| QIAGEN NV †(a) | 8,021 | 217,403 | ||||||
| SBM Offshore NV †(a) | 98,080 | 1,239,019 | ||||||
| Wolters Kluwer NV (a) | 134,773 | 4,526,153 | ||||||
|
| |||||||
| 22,033,926 | ||||||||
|
| |||||||
| SHARES | VALUE (Note 5) | |||||||
| Norway - 0.5% | ||||||||
| DNB ASA (a) | 188,255 | $ | 2,319,532 | |||||
| Gjensidige Forsikring ASA (a) | 18,849 | 301,681 | ||||||
| Marine Harvest ASA †(a) | 37,880 | 509,669 | ||||||
| Orkla ASA (a) | 88,996 | 702,082 | ||||||
| Telenor ASA (a) | 54,568 | 909,571 | ||||||
| Yara International ASA (a) | 114,456 | 4,922,554 | ||||||
|
| |||||||
| 9,665,089 | ||||||||
|
| |||||||
| Portugal - 0.1% | ||||||||
| EDP - Energias de Portugal SA | 228,929 | 824,909 | ||||||
| NOS SGPS SA | 33,262 | 261,703 | ||||||
|
| |||||||
| 1,086,612 | ||||||||
|
| |||||||
| Spain - 1.5% | ||||||||
| ACS Actividades de Construccion y Servicios SA (a) | 18,021 | 527,249 | ||||||
| Almirall SA | 49,209 | 994,569 | ||||||
| Amadeus IT Holding SA, A Shares (a) | 25,681 | 1,131,881 | ||||||
| Banco de Sabadell SA | 229,123 | 406,073 | ||||||
| Bankinter SA (a) | 28,770 | 204,017 | ||||||
| Ebro Foods SA | 131,042 | 2,577,703 | ||||||
| Enagas SA (a) | 55,874 | 1,576,090 | ||||||
| Endesa SA (a) | 250,123 | 5,024,883 | ||||||
| Ferrovial SA (a) | 125,283 | 2,833,052 | ||||||
| Gamesa Corp. Tecnologica SA | 51,821 | 887,174 | ||||||
| Gas Natural SDG SA (a) | 45,323 | 924,238 | ||||||
| Iberdrola SA (a) | 801,747 | 5,683,563 | ||||||
| Industria de Diseno Textil SA | 17,879 | 614,218 | ||||||
| Mediaset Espana Comunicacion SA | 28,082 | 305,527 | ||||||
| Red Electrica Corp. SA (a) | 16,280 | 1,359,863 | ||||||
| Tecnicas Reunidas SA (a) | 60,426 | 2,284,695 | ||||||
|
| |||||||
| 27,334,795 | ||||||||
|
| |||||||
| Sweden - 1.1% | ||||||||
| Assa Abloy AB, Class B (a) | 28,559 | 597,817 | ||||||
| BillerudKorsnas AB | 11,434 | 211,605 | ||||||
| Boliden AB (a) | 176,330 | 2,954,267 | ||||||
| Electrolux AB, Series B (a) | 40,891 | 986,594 | ||||||
| Husqvarna AB, B Shares | 111,921 | 738,611 | ||||||
| ICA Gruppen AB | 96,540 | 3,505,981 | ||||||
| Securitas AB, B Shares (a) | 210,826 | 3,223,724 | ||||||
| Skandinaviska Enskilda Banken AB, Class A (a) | 129,781 | 1,364,842 | ||||||
| Skanska AB, B Shares (a) | 26,986 | 523,356 | ||||||
| SKF AB, B Shares | 21,993 | 355,216 | ||||||
| Svenska Cellulosa AB SCA, Class B (a) | 99,007 | 2,869,234 | ||||||
| Swedbank AB, A Shares (a) | 9,873 | 217,439 | ||||||
| Swedish Match AB (a) | 10,825 | 382,527 | ||||||
| Tele2 AB, B Shares (a) | 98,009 | 977,393 | ||||||
| TeliaSonera AB | 223,665 | 1,110,695 | ||||||
|
| |||||||
| 20,019,301 | ||||||||
|
| |||||||
| Switzerland - 3.6% | ||||||||
| Adecco SA †(a) | 19,680 | 1,346,953 | ||||||
| Baloise Holding AG (a) | 7,134 | 904,152 | ||||||
| Barry Callebaut AG †(a) | 443 | 481,196 | ||||||
| Bucher Industries AG (a) | 2,384 | 537,297 | ||||||
| Chocoladefabriken Lindt & Spruengli AG (a) | 81 | 505,821 | ||||||
| The accompanying notes are an integral part of these financial statements. | (Continued) |
| AQR Funds | Annual Report | December 2015 | ||||||||||||||
258
Table of Contents
| Consolidated Schedule of Investments | December 31, 2015 |
| AQR STYLE PREMIA ALTERNATIVE FUND |
| SHARES | VALUE (Note 5) | |||||||
| Switzerland - 3.6% (continued) | ||||||||
| DKSH Holding AG †(a) | 3,291 | $ | 206,986 | |||||
| Flughafen Zuerich AG (a) | 1,328 | 996,414 | ||||||
| Galenica AG (a) | 4,122 | 6,449,075 | ||||||
| GAM Holding AG †(a) | 15,042 | 248,984 | ||||||
| Geberit AG (a) | 613 | 207,625 | ||||||
| Georg Fischer AG (a) | 608 | 412,773 | ||||||
| Givaudan SA †(a) | 1,489 | 2,702,479 | ||||||
| Helvetia Holding AG (a) | 1,429 | 804,968 | ||||||
| Kuehne + Nagel International AG | 2,099 | 287,561 | ||||||
| Lonza Group AG †(a) | 22,102 | 3,594,557 | ||||||
| Nestle SA (a) | 83,587 | 6,205,102 | ||||||
| Novartis AG (a) | 101,682 | 8,746,612 | ||||||
| Partners Group Holding AG (a) | 2,498 | 898,366 | ||||||
| Roche Holding AG (a) | 12,408 | 3,438,361 | ||||||
| Schindler Holding AG (a) | 3,884 | 649,789 | ||||||
| Sonova Holding AG (a) | 1,671 | 212,306 | ||||||
| Straumann Holding AG (a) | 2,557 | 776,069 | ||||||
| Swiss Life Holding AG †(a) | 13,611 | 3,666,121 | ||||||
| Swiss Re AG (a) | 154,114 | 15,051,745 | ||||||
| Swisscom AG (a) | 6,652 | 3,328,689 | ||||||
| Zurich Insurance Group AG †(a) | 9,781 | 2,512,739 | ||||||
|
| |||||||
| 65,172,740 | ||||||||
|
| |||||||
| United Kingdom - 0.8% | ||||||||
| CNH Industrial NV | 29,033 | 198,845 | ||||||
| Fiat Chrysler Automobiles NV †(a) | 262,613 | 3,647,132 | ||||||
| RELX NV (a) | 75,276 | 1,267,821 | ||||||
| Unilever NV CVA (a) | 196,657 | 8,566,036 | ||||||
|
| |||||||
| 13,679,834 | ||||||||
|
| |||||||
TOTAL COMMON STOCKS | 671,441,026 | |||||||
|
| |||||||
| PREFERRED STOCKS - 0.4% | ||||||||
| Germany - 0.4% | ||||||||
Henkel AG & Co. KGaA (a) | 65,266 | 7,283,817 | ||||||
|
| |||||||
| MONEY MARKET FUNDS - 60.8% | ||||||||
| BlackRock Liquidity Funds T-Fund Portfolio, Institutional Shares, 0.100% (b) | 3,833,739 | 3,833,739 | ||||||
| Dreyfus Treasury Cash Management, Class I, 0.090% (b) | 15,334,957 | 15,334,957 | ||||||
| J.P. Morgan U.S. Treasury Plus Money Market Fund - IM Shares, 0.129% ^(b)(c) | 786,442,101 | 786,442,101 | ||||||
| J.P. Morgan U.S. Treasury Plus Money Market Fund - Institutional Shares, 0.070% ^(b)(c) | 286,480,085 | 286,480,085 | ||||||
| UBS Money Series - UBS Select Treasury Preferred Fund, Class I, 0.140% (b) | 19,168,697 | 19,168,697 | ||||||
|
| |||||||
TOTAL MONEY MARKET FUNDS (cost $1,111,259,579) | 1,111,259,579 | |||||||
|
| |||||||
| SHORT-TERM INVESTMENTS - 20.2% | PRINCIPAL (000’s) | VALUE (Note 5) | ||||||
| U.S. Treasury Bill, 0.536%, 6/9/2016 ^(d) | $ | 23,325 | $ | 23,279,260 | ||||
| U.S. Treasury Bill, 0.327%, 5/19/2016 ^(d) | 201,548 | 201,293,445 | ||||||
| U.S. Treasury Bill, 0.342%, 5/12/2016 ^(d) | 12,411 | 12,396,616 | ||||||
| U.S. Treasury Bill, 0.258%, 3/17/2016 ^(d) | 2,160 | 2,159,562 | ||||||
| U.S. Treasury Bill, 0.145%, 4/28/2016 ^(d) | 3,645 | 3,641,945 | ||||||
| U.S. Treasury Bill, 0.582%, 6/16/2016 ^(d) | 8,916 | 8,897,196 | ||||||
| U.S. Treasury Bill, 0.066%, 4/7/2016 ^(d) | 45,478 | 45,460,172 | ||||||
| U.S. Treasury Bill, 0.516%, 6/23/2016 ^(d) | 10,201 | 10,178,323 | ||||||
| U.S. Treasury Bill, 0.345%, 5/26/2016 (d) | 2,056 | 2,052,826 | ||||||
| U.S. Treasury Bill, 0.263%, 3/3/2016 ^(d) | 8,549 | 8,547,496 | ||||||
| U.S. Treasury Bill, 0.113%, 3/24/2016 ^(d) | 7,888 | 7,884,892 | ||||||
| U.S. Treasury Bill, 0.238%, 2/18/2016 ^(d) | 10,330 | 10,328,554 | ||||||
| U.S. Treasury Bill, 0.241%, 2/11/2016 ^(d) | 33,609 | 33,604,328 | ||||||
|
| |||||||
TOTAL SHORT-TERM INVESTMENTS | 369,724,615 | |||||||
|
| |||||||
TOTAL INVESTMENTS IN SECURITIES, AT VALUE | 2,159,709,037 | |||||||
|
| |||||||
| SECURITIES SOLD SHORT - (26.7)% | SHARES | |||||||
| COMMON STOCKS - (26.5)% | ||||||||
| Austria - (0.1)% | ||||||||
| ams AG | (40,628 | ) | (1,358,137 | ) | ||||
|
| |||||||
| Belgium - (0.4)% | ||||||||
| Anheuser-Busch InBev SA/NV | (16,635 | ) | (2,070,180 | ) | ||||
| Telenet Group Holding NV † | (25,308 | ) | (1,367,755 | ) | ||||
| UCB SA | (42,199 | ) | (3,809,013 | ) | ||||
|
| |||||||
| (7,246,948 | ) | |||||||
|
| |||||||
| Denmark - (0.1)% | ||||||||
| Carlsberg A/S, Class B | (2,460 | ) | (217,936 | ) | ||||
| Novozymes A/S, B Shares | (18,111 | ) | (867,134 | ) | ||||
|
| |||||||
| (1,085,070 | ) | |||||||
|
| |||||||
| Finland - (0.8)% | ||||||||
| Kone OYJ, Class B | (15,001 | ) | (635,158 | ) | ||||
| Nokia OYJ | (1,188,350 | ) | (8,407,008 | ) | ||||
| Nokian Renkaat OYJ | (173,207 | ) | (6,183,711 | ) | ||||
| Wartsila OYJ Abp | (5,392 | ) | (246,188 | ) | ||||
|
| |||||||
| (15,472,065 | ) | |||||||
|
| |||||||
| The accompanying notes are an integral part of these financial statements. | (Continued) |
| AQR Funds | Annual Report | December 2015 | ||||||||||||||
259
Table of Contents
| Consolidated Schedule of Investments | December 31, 2015 |
| AQR STYLE PREMIA ALTERNATIVE FUND |
SHARES | VALUE (Note 5) | |||||||
| Germany - (3.9)% | ||||||||
| adidas AG | (42,959 | ) | $ | (4,169,561 | ) | |||
| BASF SE | (34,405 | ) | (2,620,906 | ) | ||||
| Bayer AG | (46,664 | ) | (5,827,885 | ) | ||||
| Bayerische Motoren Werke AG | (61,276 | ) | (6,455,520 | ) | ||||
| Beiersdorf AG | (29,160 | ) | (2,650,393 | ) | ||||
| Bilfinger SE | (70,691 | ) | (3,322,090 | ) | ||||
| Commerzbank AG † | (282,484 | ) | (2,914,834 | ) | ||||
| Continental AG | (4,465 | ) | (1,080,128 | ) | ||||
| Deutsche Bank AG | (56,326 | ) | (1,367,859 | ) | ||||
| Deutsche Telekom AG | (173,618 | ) | (3,118,292 | ) | ||||
| E.ON SE | (894,471 | ) | (8,588,717 | ) | ||||
| HUGO BOSS AG | (2,979 | ) | (245,795 | ) | ||||
| Infineon Technologies AG | (89,165 | ) | (1,299,911 | ) | ||||
| LANXESS AG | (48,807 | ) | (2,245,963 | ) | ||||
| METRO AG | (43,236 | ) | (1,377,384 | ) | ||||
| Rheinmetall AG | (18,323 | ) | (1,217,964 | ) | ||||
| Rocket Internet SE 144A †(e) | (36,539 | ) | (1,113,108 | ) | ||||
| RWE AG | (753,341 | ) | (9,497,660 | ) | ||||
| Salzgitter AG | (48,555 | ) | (1,186,551 | ) | ||||
| SAP SE | (14,836 | ) | (1,177,284 | ) | ||||
| Siemens AG | (18,882 | ) | (1,826,756 | ) | ||||
| STADA Arzneimittel AG | (27,526 | ) | (1,109,997 | ) | ||||
| Telefonica Deutschland Holding AG | (221,563 | ) | (1,168,675 | ) | ||||
| ThyssenKrupp AG | (156,315 | ) | (3,098,690 | ) | ||||
| Wacker Chemie AG | (3,819 | ) | (319,309 | ) | ||||
| Wirecard AG | (40,939 | ) | (2,046,338 | ) | ||||
| Zalando SE 144A †(e) | (16,455 | ) | (649,881 | ) | ||||
|
| |||||||
| (71,697,451 | ) | |||||||
|
| |||||||
| Italy - (0.5)% | ||||||||
| Azimut Holding SpA | (59,055 | ) | (1,467,883 | ) | ||||
| Banca Mediolanum SpA | (297,936 | ) | (2,366,846 | ) | ||||
| Banca Popolare dell’Emilia Romagna SC | (434,681 | ) | (3,297,116 | ) | ||||
| Banco Popolare SC † | (31,927 | ) | (439,964 | ) | ||||
| Mediaset SpA | (354,200 | ) | (1,467,767 | ) | ||||
|
| |||||||
| (9,039,576) | ||||||||
|
| |||||||
| Japan - (14.4)% | ||||||||
| Acom Co., Ltd. † | (514,900 | ) | (2,424,670 | ) | ||||
| Advantest Corp. | (169,000 | ) | (1,401,892 | ) | ||||
| Aeon Co., Ltd. | (240,800 | ) | (3,710,151 | ) | ||||
| AEON Financial Service Co., Ltd. | (84,800 | ) | (1,894,324 | ) | ||||
| Amada Holdings Co., Ltd. | (111,400 | ) | (1,063,056 | ) | ||||
| Asahi Glass Co., Ltd. | (157,000 | ) | (899,430 | ) | ||||
| Asics Corp. | (61,900 | ) | (1,284,271 | ) | ||||
| Calbee, Inc. | (10,400 | ) | (439,182 | ) | ||||
| Chiyoda Corp. | (191,000 | ) | (1,450,375 | ) | ||||
| Chugai Pharmaceutical Co., Ltd. | (93,200 | ) | (3,248,637 | ) | ||||
| Citizen Holdings Co., Ltd. | (60,500 | ) | (434,830 | ) | ||||
| Credit Saison Co., Ltd. | (125,100 | ) | (2,464,746 | ) | ||||
| Dai-ichi Life Insurance Co., Ltd./The | (178,200 | ) | (2,964,836 | ) | ||||
| Daikin Industries Ltd. | (44,100 | ) | (3,211,436 | ) | ||||
| Daiwa Securities Group, Inc. | (220,000 | ) | (1,345,013 | ) | ||||
| Denso Corp. | (117,300 | ) | (5,605,239 | ) | ||||
| Dentsu, Inc. | (32,600 | ) | (1,783,618 | ) | ||||
| Eisai Co., Ltd. | (3,300 | ) | (218,298 | ) | ||||
| FANUC Corp. | (19,100 | ) | (3,290,736 | ) | ||||
SHARES | VALUE (Note 5) | |||||||
| Japan - (14.4)% (continued) | ||||||||
| Fast Retailing Co., Ltd. | (19,000 | ) | $ | (6,646,418 | ) | |||
| Hamamatsu Photonics KK | (34,000 | ) | (932,117 | ) | ||||
| Hirose Electric Co., Ltd. | (7,400 | ) | (895,934 | ) | ||||
| Hitachi Construction Machinery Co., Ltd. | (75,100 | ) | (1,167,978 | ) | ||||
| Hitachi Ltd. | (624,000 | ) | (3,535,818 | ) | ||||
| Honda Motor Co., Ltd. | (49,700 | ) | (1,588,488 | ) | ||||
| IHI Corp. | (2,775,000 | ) | (7,660,384 | ) | ||||
| Inpex Corp. | (412,600 | ) | (4,022,401 | ) | ||||
| Isetan Mitsukoshi Holdings Ltd. | (50,200 | ) | (654,660 | ) | ||||
| Japan Airport Terminal Co., Ltd. | (55,500 | ) | (2,456,933 | ) | ||||
| Japan Display, Inc. † | (1,558,200 | ) | (4,489,580 | ) | ||||
| Japan Tobacco, Inc. | (57,700 | ) | (2,118,385 | ) | ||||
| JFE Holdings, Inc. | (133,400 | ) | (2,094,700 | ) | ||||
| JGC Corp. | (128,000 | ) | (1,959,197 | ) | ||||
| Kajima Corp. | (110,000 | ) | (654,659 | ) | ||||
| Kakaku.com, Inc. | (266,900 | ) | (5,249,817 | ) | ||||
| Kansai Electric Power Co., Inc./The † | (168,600 | ) | (2,021,480 | ) | ||||
| Kansai Paint Co., Ltd. | (68,300 | ) | (1,035,275 | ) | ||||
| Kawasaki Heavy Industries Ltd. | (342,000 | ) | (1,265,364 | ) | ||||
| Keikyu Corp. | (96,000 | ) | (793,272 | ) | ||||
| Keio Corp. | (37,000 | ) | (319,522 | ) | ||||
| Kikkoman Corp. | (138,000 | ) | (4,781,346 | ) | ||||
| Kintetsu Group Holdings Co., Ltd. | (346,000 | ) | (1,406,762 | ) | ||||
| Kobe Steel Ltd. | (1,207,000 | ) | (1,311,425 | ) | ||||
| Koito Manufacturing Co., Ltd. | (25,300 | ) | (1,037,488 | ) | ||||
| Komatsu Ltd. | (123,700 | ) | (2,024,035 | ) | ||||
| Kubota Corp. | (99,000 | ) | (1,529,416 | ) | ||||
| Kyocera Corp. | (16,200 | ) | (752,337 | ) | ||||
| Kyowa Hakko Kirin Co., Ltd. | (81,000 | ) | (1,274,507 | ) | ||||
| Kyushu Electric Power Co., Inc. † | (717,400 | ) | (7,819,019 | ) | ||||
| LIXIL Group Corp. | (34,600 | ) | (768,456 | ) | ||||
| M3, Inc. | (39,400 | ) | (816,927 | ) | ||||
| Marui Group Co., Ltd. | (130,600 | ) | (2,125,203 | ) | ||||
| Mazda Motor Corp. | (314,200 | ) | (6,483,441 | ) | ||||
| Minebea Co., Ltd. | (174,000 | ) | (1,489,783 | ) | ||||
| MISUMI Group, Inc. | (36,400 | ) | (502,817 | ) | ||||
| Mitsubishi Heavy Industries Ltd. | (697,000 | ) | (3,047,634 | ) | ||||
| Mitsubishi Logistics Corp. | (212,000 | ) | (2,793,349 | ) | ||||
| Mitsubishi Materials Corp. | (581,000 | ) | (1,829,946 | ) | ||||
| Mitsubishi Motors Corp. | (83,400 | ) | (705,609 | ) | ||||
| Mitsui Chemicals, Inc. | (127,000 | ) | (563,246 | ) | ||||
| Mitsui OSK Lines Ltd. | (1,844,000 | ) | (4,651,080 | ) | ||||
| Nabtesco Corp. | (10,800 | ) | (219,403 | ) | ||||
| NGK Insulators Ltd. | (65,000 | ) | (1,465,113 | ) | ||||
| NGK Spark Plug Co., Ltd. | (221,600 | ) | (5,834,388 | ) | ||||
| Nidec Corp. | (28,200 | ) | (2,044,951 | ) | ||||
| Nintendo Co., Ltd. | (23,200 | ) | (3,190,235 | ) | ||||
| Nippon Electric Glass Co., Ltd. | (423,000 | ) | (2,131,993 | ) | ||||
| Nippon Paint Holdings Co., Ltd. | (183,600 | ) | (4,443,494 | ) | ||||
| Nippon Steel & Sumitomo Metal Corp. | (85,900 | ) | (1,699,305 | ) | ||||
| Nissan Motor Co., Ltd. | (219,400 | ) | (2,297,281 | ) | ||||
| Nitto Denko Corp. | (29,900 | ) | (2,182,870 | ) | ||||
| Nomura Holdings, Inc. | (390,400 | ) | (2,174,550 | ) | ||||
| NSK Ltd. | (43,200 | ) | (469,408 | ) | ||||
| Odakyu Electric Railway Co., Ltd. | (144,000 | ) | (1,550,420 | ) | ||||
| The accompanying notes are an integral part of these financial statements. | (Continued) |
| AQR Funds | Annual Report | December 2015 | ||||||||||||||
260
Table of Contents
| Consolidated Schedule of Investments | December 31, 2015 |
| AQR STYLE PREMIA ALTERNATIVE FUND |
SHARES | VALUE (Note 5) | |||||||
| Japan - (14.4)% (continued) | ||||||||
| Olympus Corp. | (85,200 | ) | $ | (3,354,211 | ) | |||
| Omron Corp. | (27,300 | ) | (910,371 | ) | ||||
| Ono Pharmaceutical Co., Ltd. | (27,700 | ) | (4,939,234 | ) | ||||
| Oriental Land Co., Ltd. | (46,700 | ) | (2,825,185 | ) | ||||
| Panasonic Corp. | (163,300 | ) | (1,655,456 | ) | ||||
| Pigeon Corp. | (31,400 | ) | (761,767 | ) | ||||
| Rakuten, Inc. | (495,300 | ) | (5,704,744 | ) | ||||
| Recruit Holdings Co., Ltd. | (71,400 | ) | (2,098,716 | ) | ||||
| Ricoh Co., Ltd. | (41,200 | ) | (424,228 | ) | ||||
| Sega Sammy Holdings, Inc. | (20,600 | ) | (192,679 | ) | ||||
| Shikoku Electric Power Co., Inc. | (124,800 | ) | (1,949,534 | ) | ||||
| Shin-Etsu Chemical Co., Ltd. | (35,200 | ) | (1,913,678 | ) | ||||
| Shionogi & Co., Ltd. | (12,300 | ) | (556,332 | ) | ||||
| Shiseido Co., Ltd. | (20,400 | ) | (423,272 | ) | ||||
| Shizuoka Bank Ltd./The | (177,000 | ) | (1,716,552 | ) | ||||
| SoftBank Group Corp. | (76,600 | ) | (3,866,033 | ) | ||||
| Sompo Japan Nipponkoa Holdings, Inc. | (14,700 | ) | (482,670 | ) | ||||
| Sony Corp. | (81,400 | ) | (2,000,551 | ) | ||||
| Sony Financial Holdings, Inc. | (33,500 | ) | (599,223 | ) | ||||
| Stanley Electric Co., Ltd. | (60,400 | ) | (1,325,030 | ) | ||||
| Sumco Corp. | (371,900 | ) | (2,805,798 | ) | ||||
| Sumitomo Mitsui Trust Holdings, Inc. | (721,000 | ) | (2,730,666 | ) | ||||
| Suruga Bank Ltd. | (17,900 | ) | (368,894 | ) | ||||
| Suzuki Motor Corp. | (68,900 | ) | (2,093,445 | ) | ||||
| T&D Holdings, Inc. | (55,000 | ) | (725,644 | ) | ||||
| Taiheiyo Cement Corp. | (167,000 | ) | (487,692 | ) | ||||
| Taiyo Nippon Sanso Corp. | (170,500 | ) | (1,541,961 | ) | ||||
| TDK Corp. | (3,000 | ) | (192,132 | ) | ||||
| Terumo Corp. | (81,400 | ) | (2,522,865 | ) | ||||
| Tobu Railway Co., Ltd. | (199,000 | ) | (981,552 | ) | ||||
| Toho Co., Ltd. | (7,700 | ) | (213,076 | ) | ||||
| Tokyo Electron Ltd. | (32,300 | ) | (1,956,890 | ) | ||||
| Tokyu Corp. | (205,000 | ) | (1,619,991 | ) | ||||
| Toray Industries, Inc. | (83,000 | ) | (771,279 | ) | ||||
| Toshiba Corp. † | (2,782,000 | ) | (5,717,635 | ) | ||||
| TOTO Ltd. | (15,000 | ) | (526,980 | ) | ||||
| Toyo Seikan Group Holdings Ltd. | (181,800 | ) | (3,372,235 | ) | ||||
| Toyota Boshoku Corp. | (18,200 | ) | (366,319 | ) | ||||
| Toyota Motor Corp. | (33,200 | ) | (2,044,423 | ) | ||||
| Toyota Tsusho Corp. | (19,900 | ) | (465,517 | ) | ||||
| Trend Micro, Inc. | (10,400 | ) | (422,002 | ) | ||||
| Yahoo Japan Corp. | (1,350,800 | ) | (5,490,873 | ) | ||||
| Yakult Honsha Co., Ltd. | (89,400 | ) | (4,375,656 | ) | ||||
| Yamaha Motor Co., Ltd. | (101,300 | ) | (2,270,671 | ) | ||||
| Yamato Holdings Co., Ltd. | (198,100 | ) | (4,197,369 | ) | ||||
| Yaskawa Electric Corp. | (383,900 | ) | (5,223,608 | ) | ||||
| Yokogawa Electric Corp. | (380,700 | ) | (4,578,276 | ) | ||||
|
| |||||||
| (263,877,274 | ) | |||||||
|
| |||||||
| Luxembourg - (0.7)% | ||||||||
| APERAM SA † | (14,991 | ) | (533,004 | ) | ||||
| ArcelorMittal | (1,979,044 | ) | (8,349,990 | ) | ||||
| Millicom International Cellular SA SDR | (21,006 | ) | (1,205,326 | ) | ||||
| Tenaris SA | (205,187 | ) | (2,429,691 | ) | ||||
|
| |||||||
| (12,518,011 | ) | |||||||
|
| |||||||
SHARES | VALUE (Note 5) | |||||||
| Netherlands - (1.3)% | ||||||||
| Aegon NV | (96,087 | ) | $ | (543,416 | ) | |||
| ASML Holding NV | (120,649 | ) | (10,719,846 | ) | ||||
| Delta Lloyd NV | (266,926 | ) | (1,573,512 | ) | ||||
| Fugro NV CVA † | (230,231 | ) | (3,776,263 | ) | ||||
| Koninklijke DSM NV | (8,891 | ) | (445,843 | ) | ||||
| Koninklijke KPN NV | (992,138 | ) | (3,752,628 | ) | ||||
| Koninklijke Philips NV | (35,064 | ) | (894,983 | ) | ||||
| Koninklijke Vopak NV | (7,597 | ) | (327,163 | ) | ||||
| Randstad Holding NV | (17,385 | ) | (1,082,589 | ) | ||||
|
| |||||||
| (23,116,243 | ) | |||||||
|
| |||||||
| Norway - (0.3)% | ||||||||
| DNO ASA † | (372,542 | ) | (251,446 | ) | ||||
| Norsk Hydro ASA | (195,814 | ) | (727,860 | ) | ||||
| Schibsted ASA, B Shares † | (13,231 | ) | (421,113 | ) | ||||
| Schibsted ASA, Class A | (90,961 | ) | (2,990,492 | ) | ||||
| Statoil ASA | (75,255 | ) | (1,049,565 | ) | ||||
|
| |||||||
| (5,440,476 | ) | |||||||
|
| |||||||
| Portugal - (0.1)% | ||||||||
| Banco Espirito Santo SA (3)†(f) | (216,618 | ) | (2 | ) | ||||
| Jeronimo Martins SGPS SA | (156,031 | ) | (2,030,336 | ) | ||||
| Sonae SGPS SA | (184,377 | ) | (209,544 | ) | ||||
|
| |||||||
| (2,239,882 | ) | |||||||
|
| |||||||
| Spain - (1.7)% | ||||||||
| Abertis Infraestructuras SA | (60,787 | ) | (950,671 | ) | ||||
| Acciona SA | (8,461 | ) | (724,550 | ) | ||||
| Aena SA 144A †(e) | (35,798 | ) | (4,099,200 | ) | ||||
| Atresmedia Corp. de Medios de Comunicacion SA | (30,293 | ) | (322,685 | ) | ||||
| Banco Bilbao Vizcaya Argentaria SA | (403,034 | ) | (2,944,884 | ) | ||||
| Banco Popular Espanol SA | (471,434 | ) | (1,553,321 | ) | ||||
| Banco Santander SA | (1,837,157 | ) | (9,037,658 | ) | ||||
| Bankia SA | (2,203,903 | ) | (2,564,719 | ) | ||||
| CaixaBank SA | (645,678 | ) | (2,247,355 | ) | ||||
| Cellnex Telecom SAU 144A (e) | (52,366 | ) | (979,085 | ) | ||||
| Distribuidora Internacional de Alimentacion SA † | (112,575 | ) | (663,978 | ) | ||||
| Mapfre SA | (149,933 | ) | (375,307 | ) | ||||
| Telefonica SA | (289,402 | ) | (3,210,605 | ) | ||||
| Zardoya Otis SA | (119,240 | ) | (1,394,564 | ) | ||||
|
| |||||||
| (31,068,582 | ) | |||||||
|
| |||||||
| Sweden - (0.5)% | ||||||||
| Alfa Laval AB | (30,307 | ) | (553,287 | ) | ||||
| Atlas Copco AB, A Shares | (46,283 | ) | (1,135,082 | ) | ||||
| Elekta AB, B Shares | (98,648 | ) | (838,198 | ) | ||||
| Getinge AB, B Shares | (32,957 | ) | (863,317 | ) | ||||
| Hennes & Mauritz AB, B Shares | (11,824 | ) | (420,583 | ) | ||||
| Hexagon AB, B Shares | (13,424 | ) | (496,592 | ) | ||||
| Sandvik AB | (126,186 | ) | (1,099,964 | ) | ||||
| Telefonaktiebolaget LM Ericsson, B Shares | (443,503 | ) | (4,275,948 | ) | ||||
| Volvo AB, B Shares | (22,854 | ) | (211,915 | ) | ||||
|
| |||||||
| (9,894,886 | ) | |||||||
|
| |||||||
| The accompanying notes are an integral part of these financial statements. | (Continued) |
| AQR Funds | Annual Report | December 2015 | ||||||||||||||
261
Table of Contents
| Consolidated Schedule of Investments | December 31, 2015 |
| AQR STYLE PREMIA ALTERNATIVE FUND |
SHARES | VALUE (Note 5) | |||||||
| Switzerland - (1.7)% | ||||||||
| Aryzta AG † | (46,502 | ) | $ | (2,352,481 | ) | |||
| Cie Financiere Richemont SA | (97,891 | ) | (7,006,347 | ) | ||||
| Clariant AG † | (11,341 | ) | (215,036 | ) | ||||
| Credit Suisse Group AG † | (154,861 | ) | (3,336,010 | ) | ||||
| Dufry AG † | (8,173 | ) | (972,442 | ) | ||||
| EMS-Chemie Holding AG | (509 | ) | (224,009 | ) | ||||
| LafargeHolcim Ltd. † | (126,171 | ) | (6,317,991 | ) | ||||
| SGS SA | (844 | ) | (1,604,022 | ) | ||||
| Sika AG | (280 | ) | (1,011,863 | ) | ||||
| STMicroelectronics NV | (198,828 | ) | (1,337,390 | ) | ||||
| Sunrise Communications Group AG 144A †(e) | (5,402 | ) | (318,437 | ) | ||||
| Swatch Group AG/The | (9,485 | ) | (3,293,809 | ) | ||||
| Syngenta AG | (2,115 | ) | (827,818 | ) | ||||
| UBS Group AG | (113,746 | ) | (2,206,612 | ) | ||||
|
| |||||||
| (31,024,267 | ) | |||||||
|
| |||||||
TOTAL COMMON STOCKS SOLD SHORT | (485,078,868 | ) | ||||||
|
| |||||||
| PREFERRED STOCKS - (0.2)% | ||||||||
| Germany - (0.2)% | ||||||||
Volkswagen AG | (22,583 | ) | (3,260,520 | ) | ||||
|
| |||||||
TOTAL SECURITIES SOLD SHORT, AT VALUE | (488,339,388 | ) | ||||||
|
| |||||||
TOTAL INVESTMENTS, NET OF SECURITIES SOLD SHORT - 91.4% | 1,671,369,649 | |||||||
|
| |||||||
| OTHER ASSETS IN EXCESS OF LIABILITIES - 8.6% (g) | 157,377,770 | |||||||
|
| |||||||
NET ASSETS - 100.0% | $ | 1,828,747,419 | ||||||
|
| |||||||
| † | Non-income producing security. |
| (a) | All or a portion of this security has been segregated as collateral for securities sold short and can be sold or replaced subject to the broker’s right to re-hypothecate. At December 31, 2015, the value of these securities was $542,453,737. |
| (b) | Represents annualized seven-day yield as of the close of the reporting period. |
| (c) | All or a portion of the security is pledged as collateral to the brokers for forward foreign currency exchange and swap contracts. |
| (d) | The rate shown is the effective yield at the date of purchase. |
| (e) | Rule 144A, Section 4(2) or other security which is restricted as to resale to institutional investors. The Fund Adviser has deemed this security to be liquid based upon procedures approved by the Board of Trustees. |
| (f) | Security fair valued as of December 31, 2015 using procedures approved by the Board of Trustees. The total value of positions fair valued was $(2) or 0.0% of total net assets. |
| (g) | Includes appreciation/(depreciation) on forward foreign currency exchange, futures and swap contracts. |
| ^ | All or a portion represents positions held in the respective Subsidiary (See Note 2). |
All securities are Level 2 with respect to ASC 820, unless otherwise noted in parentheses.
| (3) | Level 3 security (See Note 5). |
The following abbreviations are used in portfolio descriptions:
144A - Restricted Security
CVA - Dutch Certification
SDR - Special Drawing Rights
| SECTOR | VALUE | % OF NET ASSETS | ||||||
| Consumer Discretionary | $ | (12,208,856 | ) | (0.7 | )% | |||
| Consumer Staples | 52,484,534 | 2.9 | ||||||
| Energy | (1,943,984 | ) | (0.1 | ) | ||||
| Financials | 72,457,887 | 4.0 | ||||||
| Health Care | 58,294,580 | 3.2 | ||||||
| Industrials | 42,207,794 | 2.3 | ||||||
| Information Technology | (42,360,507 | ) | (2.3 | ) | ||||
| Materials | (4,864,265 | ) | (0.3 | ) | ||||
| Telecommunication Services | 13,061,760 | 0.7 | ||||||
| Utilities | 13,256,512 | 0.7 | ||||||
| Money Market Funds | 1,111,259,579 | 60.8 | ||||||
| Short-Term Investments | 369,724,615 | 20.2 | ||||||
|
|
|
| |||||
| Total Investments In Securities, At Value | 1,671,369,649 | 91.4 | ||||||
| Other Assets in Excess of Liabilities (g) | 157,377,770 | 8.6 | ||||||
|
|
|
| |||||
Net Assets | $ | 1,828,747,419 | 100.0 | % | ||||
|
|
|
| |||||
| The accompanying notes are an integral part of these financial statements. | (Continued) |
| AQR Funds | Annual Report | December 2015 | ||||||||||||||
262
Table of Contents
| Consolidated Schedule of Investments | December 31, 2015 |
| AQR STYLE PREMIA ALTERNATIVE FUND |
Total return swap contracts outstanding as of December 31, 2015:
Over the Counter
| COUNTERPARTY | UNDERLYING REFERENCE INSTRUMENT | TERMINATION DATE | CURRENCY | NOTIONAL VALUE | UNREALIZED APPRECIATION (DEPRECIATION) | |||||||||
| Goldman Sachs | BIST 30 January Futures | 02/2016 | TRY | 4,300,298 | $(45,096 | ) | ||||||||
| Bank of America | Bovespa Index January Futures | 02/2016 | BRL | (154,095,271 | ) | 1,770,687 | ||||||||
| Bank of America | CNX Nifty Index January Futures | 01/2016 | INR | (297,326,513 | ) | (13,236 | ) | |||||||
| CitiBank | Corn March Futures^ | 02/2016 | USD | 10,409,392 | (418,205 | ) | ||||||||
| Deutsche Bank | Corn March Futures^ | 02/2016 | USD | 21,461,513 | (958,951 | ) | ||||||||
| Macquarie Capital | Corn March Futures^ | 02/2016 | USD | 5,157,696 | (206,945 | ) | ||||||||
| Societe Generale | Corn March Futures^ | 02/2016 | USD | 16,654,088 | (671,775 | ) | ||||||||
| Bank of America | Hang Seng Index January Futures | 01/2016 | HKD | 496,765,869 | (489,034 | ) | ||||||||
| Bank of America | H-SHARES Index January Futures | 01/2016 | HKD | (78,277,373 | ) | 207,437 | ||||||||
| Bank of America | KOSPI Index 200 January Futures | 03/2016 | KRW | 42,749,195,472 | 143,121 | |||||||||
| Bank of America | MSCI Taiwan Stock Index January Futures | 01/2016 | USD | 8,392,601 | (82,481 | ) | ||||||||
| Bank of America | SGX S&P CNX Nifty Index January Futures | 01/2016 | USD | (4,137,656 | ) | (11,200 | ) | |||||||
| Deutsche Bank | Soybean March Futures^ | 02/2016 | USD | (3,870,010 | ) | 24,098 | ||||||||
| Deutsche Bank | Soybean March Futures^ | 02/2016 | USD | 23,416,485 | (600,285 | ) | ||||||||
| Macquarie Capital | Soybean March Futures^ | 02/2016 | USD | 14,502,597 | (328,897 | ) | ||||||||
| Societe Generale | Soybean March Futures^ | 02/2016 | USD | 10,206,076 | (223,989 | ) | ||||||||
| Bank of America | Swiss Market Index January Futures | 03/2016 | CHF | (104,502,412 | ) | (3,095,851 | ) | |||||||
| Bank of America | Taiwan Stock Exchange January Futures | 01/2016 | TWD | 66,878,204 | 80,314 | |||||||||
| Bank of America | Tel Aviv 25 Index January Futures | 01/2016 | ILS | 33,055,029 | 109,327 | |||||||||
| Goldman Sachs | WIG20 Index January Futures | 03/2016 | PLN | 4,978,754 | 57,380 | |||||||||
|
| |||||||||||||
| $(4,753,581 | ) | |||||||||||||
|
| |||||||||||||
| ^ | Represents positions held in the respective Subsidiary (See Note 2). |
Open futures contracts outstanding at December 31, 2015:
Exchange Traded
| NUMBER OF CONTRACTS | COUNTERPARTY | DESCRIPTION | EXPIRATION DATE | VALUE AT TRADE DATE | VALUE AT DECEMBER 31, 2015 | UNREALIZED APPRECIATION (DEPRECIATION) | ||||||||||||||
| Long Contracts: | ||||||||||||||||||||
| 71 | J.P. Morgan | KOSPI Index 200 Futures | 03/2016 | $7,236,080 | $7,279,838 | $43,758 | ||||||||||||||
| 456 | Goldman Sachs | Brent Crude Futures^ | 01/2016 | 17,019,864 | 17,177,520 | 157,656 | ||||||||||||||
| 81 | Morgan Stanley and Co., International PLC | Corn Futures^ | 03/2016 | 1,496,500 | 1,452,938 | (43,562 | ) | |||||||||||||
| 264 | Morgan Stanley and Co., International PLC | Gold 100 OZ Futures^ | 02/2016 | 28,475,309 | 27,989,280 | (486,029 | ) | |||||||||||||
| 4 | J.P. Morgan | LME Copper Futures^ | 01/2016 | 515,918 | 470,575 | (45,343 | ) | |||||||||||||
| 2 | J.P. Morgan | LME Copper Futures^ | 01/2016 | 257,503 | 235,310 | (22,193 | ) | |||||||||||||
| 30 | J.P. Morgan | LME Copper Futures^ | 01/2016 | 4,004,707 | 3,531,675 | (473,032 | ) | |||||||||||||
| 10 | J.P. Morgan | LME Copper Futures^ | 01/2016 | 1,317,940 | 1,177,338 | (140,602 | ) | |||||||||||||
| 5 | J.P. Morgan | LME Copper Futures^ | 01/2016 | 657,984 | 588,725 | (69,259 | ) | |||||||||||||
| 1 | J.P. Morgan | LME Copper Futures^ | 01/2016 | 131,292 | 117,779 | (13,513 | ) | |||||||||||||
| 16 | J.P. Morgan | LME Copper Futures^ | 02/2016 | 1,999,021 | 1,884,348 | (114,673 | ) | |||||||||||||
| 76 | J.P. Morgan | LME Copper Futures^ | 02/2016 | 9,460,911 | 8,951,375 | (509,536 | ) | |||||||||||||
| 64 | J.P. Morgan | LME Copper Futures^ | 02/2016 | 7,880,699 | 7,538,000 | (342,699 | ) | |||||||||||||
| 45 | J.P. Morgan | LME Copper Futures^ | 02/2016 | 5,535,860 | 5,300,156 | (235,704 | ) | |||||||||||||
| 18 | J.P. Morgan | LME Copper Futures^ | 02/2016 | 2,188,419 | 2,120,062 | (68,357 | ) | |||||||||||||
| The accompanying notes are an integral part of these financial statements. | (Continued) |
| AQR Funds | Annual Report | December 2015 | ||||||||||||||
263
Table of Contents
| Consolidated Schedule of Investments | December 31, 2015 |
| AQR STYLE PREMIA ALTERNATIVE FUND |
| NUMBER OF CONTRACTS | COUNTERPARTY | DESCRIPTION | EXPIRATION DATE | VALUE AT TRADE DATE | VALUE AT DECEMBER 31, 2015 | UNREALIZED APPRECIATION (DEPRECIATION) | ||||||||||||||
| Long Contracts: (continued) | ||||||||||||||||||||
| 10 | J.P. Morgan | LME Copper Futures^ | 02/2016 | $ 1,183,587 | $ 1,177,813 | $ (5,774 | ) | |||||||||||||
| 52 | J.P. Morgan | LME Copper Futures^ | 02/2016 | 6,062,053 | 6,124,625 | 62,572 | ||||||||||||||
| 20 | J.P. Morgan | LME Copper Futures^ | 02/2016 | 2,313,374 | 2,355,555 | 42,181 | ||||||||||||||
| 464 | J.P. Morgan | LME Copper Futures^ | 03/2016 | 52,690,767 | 54,615,700 | 1,924,933 | ||||||||||||||
| 1,015 | Morgan Stanley and Co., International PLC | Silver Futures^ | 03/2016 | 71,493,920 | 70,050,225 | (1,443,695 | ) | |||||||||||||
| 384 | Morgan Stanley and Co., International PLC | Soybean Futures^ | 03/2016 | 16,661,760 | 16,593,600 | (68,160 | ) | |||||||||||||
| 147 | Morgan Stanley and Co., International PLC | WTI Crude Futures^ | 01/2016 | 5,450,430 | 5,444,880 | (5,550 | ) | |||||||||||||
| 2,358 | J.P. Morgan | BIST 30 Futures | 02/2016 | 7,446,252 | 7,201,991 | (244,261 | ) | |||||||||||||
| 2,294 | Barclays Capital | CAC40 Index Futures | 01/2016 | 114,901,550 | 115,638,012 | 736,462 | ||||||||||||||
| 63 | Barclays Capital | FTSE Bursa Malaysia KLCI Index Futures | 01/2016 | 1,230,357 | 1,238,797 | 8,440 | ||||||||||||||
| 514 | Barclays Capital | FTSE/JSE Top 40 Index Futures | 03/2016 | �� | 14,618,637 | 15,379,119 | 760,482 | |||||||||||||
| 507 | Barclays Capital | Hang Seng Index Futures | 01/2016 | 72,033,947 | 71,666,441 | (367,506 | ) | |||||||||||||
| 423 | Barclays Capital | IBEX 35 Index Futures | 01/2016 | 44,226,887 | 43,791,948 | (434,939 | ) | |||||||||||||
| 275 | Barclays Capital | KOSPI Index 200 Futures | 03/2016 | 27,953,099 | 28,196,559 | 243,460 | ||||||||||||||
| 60 | J.P. Morgan | Mexican Stock Exchange Price and Quotation Index Futures | 03/2016 | 1,492,863 | 1,501,836 | 8,973 | ||||||||||||||
| 261 | Barclays Capital | MSCI Taiwan Stock Index Futures | 01/2016 | 7,994,507 | 7,944,840 | (49,667 | ) | |||||||||||||
| 435 | Barclays Capital | S&P 500 E-Mini Futures | 03/2016 | 43,868,600 | 44,269,950 | 401,350 | ||||||||||||||
| 127 | Barclays Capital | SET50 Index Futures | 03/2016 | 562,740 | 560,868 | (1,872 | ) | |||||||||||||
| 2,078 | Barclays Capital | TOPIX Index Futures | 03/2016 | 271,596,129 | 267,540,663 | (4,055,466 | ) | |||||||||||||
| 313 | Goldman Sachs | 10-Year Japanese Government Bond Futures | 03/2016 | 387,870,752 | 388,115,313 | 244,561 | ||||||||||||||
| 3,897 | J.P. Morgan | 90-Day EURODollar Futures | 06/2016 | 966,282,854 | 965,481,750 | (801,104 | ) | |||||||||||||
| 5,077 | J.P. Morgan | 90-Day EURODollar Futures | 09/2016 | 1,258,223,239 | 1,255,732,487 | (2,490,752 | ) | |||||||||||||
| 2,221 | J.P. Morgan | 90-Day EURODollar Futures | 12/2016 | 548,881,034 | 548,420,425 | (460,609 | ) | |||||||||||||
| 813 | J.P. Morgan | Australia 3-Year Bond Futures | 03/2016 | 65,737,505 | 66,036,830 | 299,325 | ||||||||||||||
| 2,427 | Goldman Sachs | Canadian 10-Year Bond Futures | 03/2016 | 243,148,888 | 247,295,461 | 4,146,573 | ||||||||||||||
| 74 | Goldman Sachs | Euro - Bobl Futures | 03/2016 | 10,592,684 | 10,508,416 | (84,268 | ) | |||||||||||||
| 5,183 | Goldman Sachs | Euro - SCHATZ Futures | 03/2016 | 629,401,016 | 628,094,030 | (1,306,986 | ) | |||||||||||||
| 1,174 | Goldman Sachs | Long Gilt Futures | 03/2016 | 203,325,299 | 202,095,097 | (1,230,202 | ) | |||||||||||||
| 111 | Morgan Stanley and Co., International PLC | U.S. Treasury 10-Year Note Futures | 03/2016 | 13,973,764 | 13,975,593 | 1,829 | ||||||||||||||
| 6,776 | Morgan Stanley and Co., International PLC | U.S. Treasury 2-Year Note Futures | 03/2016 | 1,474,238,196 | 1,471,980,125 | (2,258,071 | ) | |||||||||||||
| 30 | Morgan Stanley and Co., International PLC | U.S. Treasury 5-Year Note Futures | 03/2016 | 3,557,166 | 3,549,610 | (7,556 | ) | |||||||||||||
|
|
|
|
|
| |||||||||||||||
| 6,657,191,863 | 6,648,393,478 | (8,798,385 | ) | |||||||||||||||||
|
|
|
|
|
| |||||||||||||||
| Short Contracts: | ||||||||||||||||||||
| 4 | J.P. Morgan | LME Copper Futures^ | 01/2016 | $(515,988 | ) | $(470,575 | ) | $45,413 | ||||||||||||
| 2 | J.P. Morgan | LME Copper Futures^ | 01/2016 | (259,294 | ) | (235,310 | ) | 23,984 | ||||||||||||
| 30 | J.P. Morgan | LME Copper Futures^ | 01/2016 | (3,989,927 | ) | (3,531,675 | ) | 458,252 | ||||||||||||
| 10 | J.P. Morgan | LME Copper Futures^ | 01/2016 | (1,315,701 | ) | (1,177,338 | ) | 138,363 | ||||||||||||
| 5 | J.P. Morgan | LME Copper Futures^ | 01/2016 | (659,019 | ) | (588,725 | ) | 70,294 | ||||||||||||
| 1 | J.P. Morgan | LME Copper Futures^ | 01/2016 | (130,673 | ) | (117,779 | ) | 12,894 | ||||||||||||
| The accompanying notes are an integral part of these financial statements. | (Continued) |
| AQR Funds | Annual Report | December 2015 | ||||||||||||||
264
Table of Contents
| Consolidated Schedule of Investments | December 31, 2015 |
| AQR STYLE PREMIA ALTERNATIVE FUND |
| NUMBER OF CONTRACTS | COUNTERPARTY | DESCRIPTION | EXPIRATION DATE | VALUE AT TRADE DATE | VALUE AT DECEMBER 31, 2015 | UNREALIZED APPRECIATION (DEPRECIATION) | ||||||||||||||
| Short Contracts: (continued) | ||||||||||||||||||||
| 16 | J.P. Morgan | LME Copper Futures^ | 02/2016 | $ (2,000,761 | ) | $ (1,884,348 | ) | $ 116,413 | ||||||||||||
| 76 | J.P. Morgan | LME Copper Futures^ | 02/2016 | (9,461,814 | ) | (8,951,375 | ) | 510,439 | ||||||||||||
| 64 | J.P. Morgan | LME Copper Futures^ | 02/2016 | (7,887,843 | ) | (7,538,000 | ) | 349,843 | ||||||||||||
| 45 | J.P. Morgan | LME Copper Futures^ | 02/2016 | (5,540,492 | ) | (5,300,156 | ) | 240,336 | ||||||||||||
| 18 | J.P. Morgan | LME Copper Futures^ | 02/2016 | (2,173,456 | ) | (2,120,063 | ) | 53,393 | ||||||||||||
| 10 | J.P. Morgan | LME Copper Futures^ | 02/2016 | (1,186,509 | ) | (1,177,812 | ) | 8,697 | ||||||||||||
| 52 | J.P. Morgan | LME Copper Futures^ | 02/2016 | (6,086,150 | ) | (6,124,625 | ) | (38,475 | ) | |||||||||||
| 20 | J.P. Morgan | LME Copper Futures^ | 02/2016 | (2,320,333 | ) | (2,355,555 | ) | (35,222 | ) | |||||||||||
| 2,328 | Morgan Stanley and Co., International PLC | Natural Gas Futures^ | 01/2016 | (49,057,182 | ) | (54,405,360 | ) | (5,348,178 | ) | |||||||||||
| 761 | Barclays Capital | Amsterdam Index Futures | 01/2016 | (71,676,609 | ) | (73,083,469 | ) | (1,406,860 | ) | |||||||||||
| 215 | Barclays Capital | DAX Index Futures | 03/2016 | (60,651,022 | ) | (62,922,281 | ) | (2,271,259 | ) | |||||||||||
| 19 | Barclays Capital | Euro Stoxx 50 Index | 03/2016 | (672,935 | ) | (677,675 | ) | (4,740 | ) | |||||||||||
| 1,077 | Barclays Capital | FTSE 100 Index Futures | 03/2016 | (95,815,205 | ) | (98,406,475 | ) | (2,591,270 | ) | |||||||||||
| 293 | Barclays Capital | FTSE/MIB Index Futures | 03/2016 | (33,604,329 | ) | (34,137,566 | ) | (533,237 | ) | |||||||||||
| 419 | Barclays Capital | H-SHARES Index Futures | 01/2016 | (26,652,741 | ) | (26,234,637 | ) | 418,104 | ||||||||||||
| 211 | Barclays Capital | MSCI Singapore Index Futures | 01/2016 | (4,797,720 | ) | (4,815,544 | ) | (17,824 | ) | |||||||||||
| 5,405 | Barclays Capital | OMXS30 Index Futures | 01/2016 | (91,594,167 | ) | (92,714,404 | ) | (1,120,237 | ) | |||||||||||
| 892 | Barclays Capital | S&P/Toronto Stock Exchange 60 Index Futures | 03/2016 | (97,181,522 | ) | (98,102,594 | ) | (921,072 | ) | |||||||||||
| 794 | Barclays Capital | SGX S&P CNX Nifty Index Futures | 01/2016 | (12,588,481 | ) | (12,621,424 | ) | (32,943 | ) | |||||||||||
| 80 | Barclays Capital | SPI 200 Index Futures | 03/2016 | (7,481,742 | ) | (7,661,551 | ) | (179,809 | ) | |||||||||||
| 2,855 | J.P. Morgan | 3-Month Euro Euribor Futures | 06/2016 | (775,966,661 | ) | (777,064,001 | ) | (1,097,340 | ) | |||||||||||
| 2,817 | J.P. Morgan | 3-Month Euro Euribor Futures | 09/2016 | (766,118,531 | ) | (766,759,559 | ) | (641,028 | ) | |||||||||||
| 1,765 | J.P. Morgan | 3-Month Euro Euribor Futures | 12/2016 | (480,469,459 | ) | (480,367,603 | ) | 101,856 | ||||||||||||
| 2,120 | J.P. Morgan | 90-Day Sterling Futures | 06/2016 | (387,908,758 | ) | (387,772,089 | ) | 136,669 | ||||||||||||
| 3,920 | J.P. Morgan | 90-Day Sterling Futures | 09/2016 | (716,480,324 | ) | (716,073,477 | ) | 406,847 | ||||||||||||
| 1,308 | J.P. Morgan | 90-Day Sterling Futures | 12/2016 | (238,864,201 | ) | (238,573,173 | ) | 291,028 | ||||||||||||
| 4,350 | J.P. Morgan | Australia 10-Year Bond Futures | 03/2016 | (400,519,234 | ) | (402,229,019 | ) | (1,709,785 | ) | |||||||||||
| 110 | J.P. Morgan | Canadian 3-Month Bank Acceptance Futures | 03/2016 | (19,687,819 | ) | (19,716,250 | ) | (28,431 | ) | |||||||||||
| 266 | J.P. Morgan | Canadian 3-Month Bank Acceptance Futures | 06/2016 | (47,590,451 | ) | (47,694,298 | ) | (103,847 | ) | |||||||||||
| 107 | J.P. Morgan | Canadian 3-Month Bank Acceptance Futures | 09/2016 | (19,195,382 | ) | (19,186,267 | ) | 9,115 | ||||||||||||
| 2,229 | Goldman Sachs | Euro - Bund Futures | 03/2016 | (384,907,705 | ) | (382,539,993 | ) | 2,367,712 | ||||||||||||
| 344 | Goldman Sachs | Euro - Buxl 30-Year Bond Futures | 03/2016 | (57,779,997 | ) | (56,599,678 | ) | 1,180,319 | ||||||||||||
| 570 | Morgan Stanley and Co., International PLC | U.S. Treasury Long Bond Futures | 03/2016 | (87,545,843 | ) | (87,637,500 | ) | (91,657 | ) | |||||||||||
|
|
|
|
|
| |||||||||||||||
| (4,978,335,980 | ) | (4,989,569,223 | ) | (11,233,243 | ) | |||||||||||||||
|
|
|
|
|
| |||||||||||||||
| $1,678,855,883 | $1,658,824,255 | $(20,031,628 | ) | |||||||||||||||||
|
|
|
|
|
| |||||||||||||||
| ^ | Represents positions held in the respective Subsidiary (See Note 2). |
| The accompanying notes are an integral part of these financial statements. | (Continued) |
| AQR Funds | Annual Report | December 2015 | ||||||||||||||
265
Table of Contents
| Consolidated Schedule of Investments | December 31, 2015 |
| AQR STYLE PREMIA ALTERNATIVE FUND |
Forward foreign currency exchange contracts outstanding as of December 31, 2015:
Over the Counter
| PURCHASE CONTRACTS | COUNTERPARTY | CURRENCY | CURRENCY AMOUNT PURCHASED | VALUE AT SETTLEMENT DATE | VALUE AT DECEMBER 31, 2015 | UNREALIZED APPRECIATION (DEPRECIATION) | ||||||||||||||
| Australian Dollar, Expiring 03/16/16 | CitiBank | AUD | 35,764,995 | $25,776,380 | $25,968,881 | $192,501 | ||||||||||||||
| Australian Dollar, Expiring 03/16/16 | Credit Suisse International | AUD | 35,764,994 | 25,776,380 | 25,968,881 | 192,501 | ||||||||||||||
| Brazilian Real, Expiring 03/16/16* | CitiBank | BRL | 36,000,000 | 9,014,997 | 8,888,602 | (126,395 | ) | |||||||||||||
| Brazilian Real, Expiring 03/16/16* | Credit Suisse International | BRL | 36,000,000 | 9,015,020 | 8,888,602 | (126,418 | ) | |||||||||||||
| Canadian Dollar, Expiring 03/16/16 | CitiBank | CAD | 72,079,175 | 53,893,266 | 52,101,662 | (1,791,604 | ) | |||||||||||||
| Canadian Dollar, Expiring 03/16/16 | Credit Suisse International | CAD | 72,079,175 | 53,893,265 | 52,101,661 | (1,791,604 | ) | |||||||||||||
| Swiss Franc, Expiring 03/16/16 | CitiBank | CHF | 11,765,000 | 11,872,756 | 11,782,639 | (90,117 | ) | |||||||||||||
| Swiss Franc, Expiring 03/16/16 | Credit Suisse International | CHF | 5,957,000 | 6,021,277 | 5,965,931 | (55,346 | ) | |||||||||||||
| Euro, Expiring 03/16/16 | CitiBank | EUR | 18,264,814 | 19,447,569 | 19,885,758 | 438,189 | ||||||||||||||
| Euro, Expiring 03/16/16 | Credit Suisse International | EUR | 18,264,814 | 19,447,489 | 19,885,758 | 438,269 | ||||||||||||||
| British Pound, Expiring 03/16/16 | CitiBank | GBP | 22,416,500 | 33,641,774 | 33,050,383 | (591,391 | ) | |||||||||||||
| British Pound, Expiring 03/16/16 | Credit Suisse International | GBP | 22,416,500 | 33,641,774 | 33,050,382 | (591,392 | ) | |||||||||||||
| Hong Kong Dollar, Expiring 03/16/16 | CitiBank | HKD | 5,506,500 | 710,792 | 710,919 | 127 | ||||||||||||||
| Hong Kong Dollar, Expiring 03/16/16 | Credit Suisse International | HKD | 5,506,500 | 710,792 | 710,919 | 127 | ||||||||||||||
| Hungarian Forint, Expiring 03/16/16 | CitiBank | HUF | 990,500,000 | 3,418,624 | 3,409,204 | (9,420 | ) | |||||||||||||
| Hungarian Forint, Expiring 03/16/16 | Credit Suisse International | HUF | 990,500,000 | 3,418,630 | 3,409,204 | (9,426 | ) | |||||||||||||
| Israeli Shekel, Expiring 03/16/16 | CitiBank | ILS | 10,500,000 | 2,736,263 | 2,702,552 | (33,711 | ) | |||||||||||||
| Israeli Shekel, Expiring 03/16/16 | Credit Suisse International | ILS | 10,500,000 | 2,733,717 | 2,702,552 | (31,165 | ) | |||||||||||||
| Indian Rupee, Expiring 03/16/16* | CitiBank | INR | 1,385,124,345 | 20,447,893 | 20,690,460 | 242,567 | ||||||||||||||
| Indian Rupee, Expiring 03/16/16* | Credit Suisse International | INR | 1,385,124,345 | 20,447,894 | 20,690,460 | 242,566 | ||||||||||||||
| Japanese Yen, Expiring 03/16/16 | CitiBank | JPY | 14,821,973,178 | 121,022,167 | 123,528,147 | 2,505,980 | ||||||||||||||
| Japanese Yen, Expiring 03/16/16 | Credit Suisse International | JPY | 14,821,973,178 | 121,022,166 | 123,528,147 | 2,505,981 | ||||||||||||||
| Korean Won, Expiring 03/16/16* | CitiBank | KRW | 3,850,000,000 | 3,289,082 | 3,278,175 | (10,907 | ) | |||||||||||||
| Korean Won, Expiring 03/16/16* | Credit Suisse International | KRW | 3,850,000,000 | 3,289,077 | 3,278,175 | (10,902 | ) | |||||||||||||
| Mexican Peso, Expiring 03/16/16 | CitiBank | MXN | 17,500,000 | 1,040,491 | 1,010,159 | (30,332 | ) | |||||||||||||
| Mexican Peso, Expiring 03/16/16 | Credit Suisse International | MXN | 17,500,000 | 1,040,257 | 1,010,159 | (30,098 | ) | |||||||||||||
| Norwegian Krone, Expiring 03/16/16 | CitiBank | NOK | 2,880,000 | 331,863 | 325,136 | (6,727 | ) | |||||||||||||
| The accompanying notes are an integral part of these financial statements. | (Continued) |
| AQR Funds | Annual Report | December 2015 | ||||||||||||||
266
Table of Contents
| Consolidated Schedule of Investments | December 31, 2015 |
| AQR STYLE PREMIA ALTERNATIVE FUND |
| PURCHASE CONTRACTS | COUNTERPARTY | CURRENCY | CURRENCY AMOUNT PURCHASED | VALUE AT SETTLEMENT DATE | VALUE AT DECEMBER 31, 2015 | UNREALIZED APPRECIATION (DEPRECIATION) | ||||||||||||||
| New Zealand Dollar, Expiring 03/16/16 | CitiBank | NZD | 69,943,929 | $ 46,239,730 | $ 47,627,575 | $ 1,387,845 | ||||||||||||||
| New Zealand Dollar, Expiring 03/16/16 | Credit Suisse International | NZD | 69,943,928 | 46,239,730 | 47,627,575 | 1,387,845 | ||||||||||||||
| Poland Zloty, Expiring 03/16/16 | CitiBank | PLN | 50,495,225 | 12,661,943 | 12,854,575 | 192,632 | ||||||||||||||
| Poland Zloty, Expiring 03/16/16 | Credit Suisse International | PLN | 50,495,225 | 12,662,081 | 12,854,575 | 192,494 | ||||||||||||||
| Swedish Krona, Expiring 03/16/16 | CitiBank | SEK | 51,375,500 | 6,053,673 | 6,098,797 | 45,124 | ||||||||||||||
| Swedish Krona, Expiring 03/16/16 | Credit Suisse International | SEK | 51,375,500 | 6,053,673 | 6,098,797 | 45,124 | ||||||||||||||
| Singapore Dollar, Expiring 03/16/16 | CitiBank | SGD | 9,050,000 | 6,433,821 | 6,367,584 | (66,237 | ) | |||||||||||||
| Singapore Dollar, Expiring 03/16/16 | Credit Suisse International | SGD | 9,050,000 | 6,433,834 | 6,367,584 | (66,250 | ) | |||||||||||||
| Turkish Lira, Expiring 03/16/16 | CitiBank | TRY | 142,456,475 | 47,764,902 | 47,867,547 | 102,645 | ||||||||||||||
| Turkish Lira, Expiring 03/16/16 | Credit Suisse International | TRY | 142,456,475 | 47,763,630 | 47,867,546 | 103,916 | ||||||||||||||
| New Taiwan Dollar, Expiring 03/16/16* | CitiBank | TWD | 175,368,158 | 5,366,190 | 5,343,267 | (22,923 | ) | |||||||||||||
| New Taiwan Dollar, Expiring 03/16/16* | Credit Suisse International | TWD | 175,368,158 | 5,366,255 | 5,343,267 | (22,988 | ) | |||||||||||||
| South African Rand, Expiring 03/16/16 | CitiBank | ZAR | 71,161,496 | 4,762,058 | 4,540,373 | (221,685 | ) | |||||||||||||
| South African Rand, Expiring 03/16/16 | Credit Suisse International | ZAR | 71,161,496 | 4,762,073 | 4,540,373 | (221,700 | ) | |||||||||||||
|
|
|
|
|
| |||||||||||||||
| $865,665,248 | $869,922,943 | $4,257,695 | ||||||||||||||||||
|
|
|
|
|
| |||||||||||||||
| SALES CONTRACTS | COUNTERPARTY | CURRENCY | CURRENCY AMOUNT SOLD | VALUE AT SETTLEMENT DATE | VALUE AT DECEMBER 31, 2015 | UNREALIZED APPRECIATION (DEPRECIATION) | ||||||||||||||
| Australian Dollar, Expiring 03/16/16 | CitiBank | AUD | (2,950,000 | ) | $(2,116,572 | ) | $(2,141,988 | ) | $(25,416 | ) | ||||||||||
| Australian Dollar, Expiring 03/16/16 | Credit Suisse International | AUD | (2,950,000 | ) | (2,116,589 | ) | (2,141,988 | ) | (25,399 | ) | ||||||||||
| Brazilian Real, Expiring 03/16/16* | CitiBank | BRL | (54,164,715 | ) | (13,658,243 | ) | (13,373,572 | ) | 284,671 | |||||||||||
| Brazilian Real, Expiring 03/16/16* | Credit Suisse International | BRL | (54,164,715 | ) | (13,658,368 | ) | (13,373,572 | ) | 284,796 | |||||||||||
| Canadian Dollar, Expiring 03/16/16 | CitiBank | CAD | (444,500 | ) | (333,677 | ) | (321,302 | ) | 12,375 | |||||||||||
| Canadian Dollar, Expiring 03/16/16 | Credit Suisse International | CAD | (444,500 | ) | (333,677 | ) | (321,302 | ) | 12,375 | |||||||||||
| Swiss Franc, Expiring 03/16/16 | CitiBank | CHF | (150,429,612 | ) | (150,752,538 | ) | (150,655,150 | ) | 97,388 | |||||||||||
| Swiss Franc, Expiring 03/16/16 | Credit Suisse International | CHF | (139,876,610 | ) | (140,031,371 | ) | (140,086,327 | ) | (54,956 | ) | ||||||||||
| Danish Krone, Expiring 03/16/16 | CitiBank | DKK | (81,387,212 | ) | (11,939,483 | ) | (11,877,749 | ) | 61,734 | |||||||||||
| Danish Krone, Expiring 03/16/16 | Credit Suisse International | DKK | (49,471,211 | ) | (7,205,373 | ) | (7,219,889 | ) | (14,516 | ) | ||||||||||
| Euro, Expiring 03/16/16 | CitiBank | EUR | (10,952,500 | ) | (11,741,226 | ) | (11,924,499 | ) | (183,273 | ) | ||||||||||
| The accompanying notes are an integral part of these financial statements. | (Continued) |
| AQR Funds | Annual Report | December 2015 | ||||||||||||||
267
Table of Contents
| Consolidated Schedule of Investments | December 31, 2015 |
| AQR STYLE PREMIA ALTERNATIVE FUND |
| SALES CONTRACTS | COUNTERPARTY | CURRENCY | CURRENCY AMOUNT SOLD | VALUE AT SETTLEMENT DATE | VALUE AT DECEMBER 31, 2015 | UNREALIZED APPRECIATION (DEPRECIATION) | ||||||||||||||
| Euro, Expiring 03/16/16 | Credit Suisse International | EUR | (10,364,500 | ) | $ (11,101,679 | ) | $ (11,284,316 | ) | $ (182,637 | ) | ||||||||||
| British Pound, Expiring 03/16/16 | CitiBank | GBP | (32,762,376 | ) | (49,153,524 | ) | (48,304,109 | ) | 849,415 | |||||||||||
| British Pound, Expiring 03/16/16 | Credit Suisse International | GBP | (32,762,375 | ) | (49,153,915 | ) | (48,304,108 | ) | 849,807 | |||||||||||
| Hong Kong Dollar, Expiring 03/16/16 | CitiBank | HKD | (23,099,000 | ) | (2,981,622 | ) | (2,982,205 | ) | (583 | ) | ||||||||||
| Hungarian Forint, Expiring 03/16/16 | CitiBank | HUF | (60,000,000 | ) | (205,909 | ) | (206,514 | ) | (605 | ) | ||||||||||
| Hungarian Forint, Expiring 03/16/16 | Credit Suisse International | HUF | (60,000,000 | ) | (205,908 | ) | (206,514 | ) | (606 | ) | ||||||||||
| Israeli Shekel, Expiring 03/16/16 | CitiBank | ILS | (52,879,546 | ) | (13,670,832 | ) | (13,610,449 | ) | 60,383 | |||||||||||
| Israeli Shekel, Expiring 03/16/16 | Credit Suisse International | ILS | (52,879,545 | ) | (13,670,869 | ) | (13,610,449 | ) | 60,420 | |||||||||||
| Japanese Yen, Expiring 03/16/16 | CitiBank | JPY | (1,525,824,500 | ) | (12,589,261 | ) | (12,716,409 | ) | (127,148 | ) | ||||||||||
| Japanese Yen, Expiring 03/16/16 | Credit Suisse International | JPY | (177,593,500 | ) | (1,448,306 | ) | (1,480,086 | ) | (31,780 | ) | ||||||||||
Korean Won, Expiring 03/16/16* | CitiBank | KRW | (46,039,834,480 | ) | (39,485,060 | ) | (39,201,722 | ) | 283,338 | |||||||||||
| Korean Won, Expiring 03/16/16* | Credit Suisse International | KRW | (46,039,834,480 | ) | (39,485,427 | ) | (39,201,722 | ) | 283,705 | |||||||||||
| Mexican Peso, Expiring 03/16/16 | CitiBank | MXN | (747,932,830 | ) | (44,624,918 | ) | (43,173,186 | ) | 1,451,732 | |||||||||||
| Mexican Peso, Expiring 03/16/16 | Credit Suisse International | MXN | (747,932,829 | ) | (44,624,828 | ) | (43,173,186 | ) | 1,451,642 | |||||||||||
| Norwegian Krone, Expiring 03/16/16 | CitiBank | NOK | (629,819,700 | ) | (72,555,300 | ) | (71,103,164 | ) | 1,452,136 | |||||||||||
| Norwegian Krone, Expiring 03/16/16 | Credit Suisse International | NOK | (629,819,698 | ) | (72,555,372 | ) | (71,103,164 | ) | 1,452,208 | |||||||||||
| New Zealand Dollar, Expiring 03/16/16 | CitiBank | NZD | (46,250,000 | ) | (30,630,057 | ) | (31,493,448 | ) | (863,391 | ) | ||||||||||
| New Zealand Dollar, Expiring 03/16/16 | Credit Suisse International | NZD | (46,250,000 | ) | (30,630,057 | ) | (31,493,448 | ) | (863,391 | ) | ||||||||||
| Poland Zloty, Expiring 03/16/16 | CitiBank | PLN | (2,000,000 | ) | (499,475 | ) | (509,140 | ) | (9,665 | ) | ||||||||||
| Poland Zloty, Expiring 03/16/16 | Credit Suisse International | PLN | (2,000,000 | ) | (499,470 | ) | (509,140 | ) | (9,670 | ) | ||||||||||
| Swedish Krona, Expiring 03/16/16 | CitiBank | SEK | (539,536,135 | ) | (62,333,088 | ) | (64,048,448 | ) | (1,715,360 | ) | ||||||||||
| Swedish Krona, Expiring 03/16/16 | Credit Suisse International | SEK | (530,209,133 | ) | (61,231,946 | ) | (62,941,239 | ) | (1,709,293 | ) | ||||||||||
| Singapore Dollar, Expiring 03/16/16 | CitiBank | SGD | (12,422,250 | ) | (8,777,950 | ) | (8,740,299 | ) | 37,651 | |||||||||||
| Singapore Dollar, Expiring 03/16/16 | Credit Suisse International | SGD | (12,422,249 | ) | (8,777,954 | ) | (8,740,300 | ) | 37,654 | |||||||||||
| Turkish Lira, Expiring 03/16/16 | CitiBank | TRY | (2,950,000 | ) | (961,362 | ) | (991,245 | ) | (29,883 | ) | ||||||||||
| Turkish Lira, Expiring 03/16/16 | Credit Suisse International | TRY | (2,950,000 | ) | (961,360 | ) | (991,245 | ) | (29,885 | ) | ||||||||||
| South African Rand, Expiring 03/16/16 | CitiBank | ZAR | (26,500,000 | ) | (1,805,822 | ) | (1,690,801 | ) | 115,021 | |||||||||||
| South African Rand, Expiring 03/16/16 | Credit Suisse International | ZAR | (26,500,000 | ) | (1,804,405 | ) | (1,690,801 | ) | 113,604 | |||||||||||
|
|
|
|
|
| |||||||||||||||
| (1,030,312,793 | ) | (1,026,938,195 | ) | 3,374,598 | ||||||||||||||||
|
|
|
|
|
| |||||||||||||||
| $(164,647,545 | ) | $(157,015,252 | ) | $7,632,293 | ||||||||||||||||
|
|
|
|
|
| |||||||||||||||
| * | Non-deliverable forward (See Note 4). |
| The accompanying notes are an integral part of these financial statements. | (Continued) |
| AQR Funds | Annual Report | December 2015 | ||||||||||||||
268
Table of Contents
| Consolidated Schedule of Investments | December 31, 2015 |
| AQR STYLE PREMIA ALTERNATIVE FUND |
AUD - Australian Dollar
BRL - Brazilian Real
CAD - Canadian Dollar
CHF - Swiss Franc
DKK - Danish Krone
EUR - Euro
GBP - British Pound
HKD - Hong Kong Dollar
HUF - Hungarian Forint
ILS - Israeli Shekel
INR - Indian Rupee
JPY - Japanese Yen
KRW - Korean Won
MXN - Mexican Peso
NOK - Norwegian Krone
NZD - New Zealand Dollar
PLN - Poland Zloty
SEK - Swedish Krona
SGD - Singapore Dollar
TRY - Turkish Lira
TWD - New Taiwan Dollar
USD - United States Dollar
ZAR - South African Rand
Total Return Basket Swaps* Outstanding at December 31, 2015
Over the Counter
| COUNTERPARTY | DESCRIPTION | TERMINATION DATE** | VALUE (Note 5) | |||||
| Goldman Sachs | The Fund receives the total return on a portfolio of long and short positions and pays or receives the London Interbank Offered Rate (“LIBOR”) plus or minus a specified spread, which is denominated in USD based on the local currencies of the positions within the swaps. | 15-61 months maturity ranging from 02/23/2017 - 12/22/2020 | $(17,382,794 | ) | ||||
|
| |||||||
| * | See the accompanying “Additional Information — Total Return Basket Swap” for further details. |
| ** | The maturity dates are measured from the commencement of investment in each underlying swap position. |
Additional Information — Total Return Basket Swap
The following table represents the individual long and short positions and related values within the total return basket swap as of December 31, 2015.
| REFERENCE ENTITY | SHARES | NOTIONAL (a) | NET UNREALIZED APPRECIATION (DEPRECIATION) | |||||||||
| Long Positions | ||||||||||||
| Common Stocks | ||||||||||||
| Ireland | ||||||||||||
| Accenture PLC | 49,754 | $ | 5,137,598 | $ | 61,695 | |||||||
| Alkermes PLC | 12,866 | 999,560 | 21,744 | |||||||||
| King Digital Entertainment PLC | 23,823 | 425,955 | — | |||||||||
| XL Group PLC | 28,560 | 1,096,418 | 22,562 | |||||||||
|
| |||||||||||
| 106,001 | ||||||||||||
|
| |||||||||||
| Netherlands | ||||||||||||
| Frank’s International NV | 26,688 | 420,870 | 24,553 | |||||||||
|
| |||||||||||
| Panama | ||||||||||||
| Copa Holdings SA | 16,869 | 820,339 | (6,242 | ) | ||||||||
|
| |||||||||||
| Puerto Rico | ||||||||||||
| Popular, Inc. | 48,425 | 1,305,538 | 66,826 | |||||||||
|
| |||||||||||
| Singapore | ||||||||||||
| Avago Technologies Ltd. | 23,667 | 3,324,740 | 110,525 | |||||||||
| REFERENCE ENTITY | SHARES | NOTIONAL (a) | NET UNREALIZED APPRECIATION (DEPRECIATION) | |||||||||
| Singapore (continued) | ||||||||||||
| Flextronics International Ltd. | 320,563 | $ | 3,531,001 | $ | 62,510 | |||||||
|
| |||||||||||
| 173,035 | ||||||||||||
|
| |||||||||||
| Sweden | ||||||||||||
| Autoliv, Inc. | 9,648 | 1,198,185 | 5,596 | |||||||||
|
| |||||||||||
| Switzerland | ||||||||||||
| ACE Ltd. | 30,403 | 3,514,587 | 38,004 | |||||||||
| Allied World Assurance Co. Holdings AG | 85,936 | 3,045,572 | 150,388 | |||||||||
| TE Connectivity Ltd. | 35,882 | 2,274,560 | 43,776 | |||||||||
|
| |||||||||||
| 232,168 | ||||||||||||
|
| |||||||||||
| United Kingdom | ||||||||||||
| Delphi Automotive PLC | 76,856 | 6,414,402 | 174,463 | |||||||||
| Noble Corp. PLC | 181,530 | 2,171,099 | (255,957 | ) | ||||||||
| Willis Group Holdings PLC | 4,430 | 204,356 | 10,809 | |||||||||
|
| |||||||||||
| (70,685) | ||||||||||||
|
| |||||||||||
| The accompanying notes are an integral part of these financial statements. | (Continued) |
| AQR Funds | Annual Report | December 2015 | ||||||||||||||
269
Table of Contents
| Consolidated Schedule of Investments | December 31, 2015 |
| AQR STYLE PREMIA ALTERNATIVE FUND |
| REFERENCE ENTITY | SHARES | NOTIONAL (a) | NET UNREALIZED APPRECIATION (DEPRECIATION) | |||||||||
| United States | ||||||||||||
| 3M Co. | 13,878 | $ | 2,065,740 | $ | 24,842 | |||||||
| Aaron’s, Inc. | 70,065 | 1,555,443 | 13,312 | |||||||||
| Abbott Laboratories | 113,677 | 5,145,021 | (39,787 | ) | ||||||||
| AbbVie, Inc. | 40,406 | 2,278,090 | 115,561 | |||||||||
| Activision Blizzard, Inc. | 209,574 | 8,146,141 | (33,532 | ) | ||||||||
| Acuity Brands, Inc. | 6,067 | 1,411,791 | 6,674 | |||||||||
| Advance Auto Parts, Inc. | 6,315 | 966,637 | (16,166 | ) | ||||||||
| Aetna, Inc. | 117,886 | 12,833,070 | (87,236 | ) | ||||||||
| Aflac, Inc. | 119,528 | 7,217,101 | (57,373 | ) | ||||||||
| AGCO Corp. | 147,417 | 6,571,850 | 119,408 | |||||||||
| Air Lease Corp. | 29,941 | 943,740 | 58,684 | |||||||||
| Air Products & Chemicals, Inc. | 4,266 | 556,116 | (1,067 | ) | ||||||||
| Akamai Technologies, Inc. | 35,527 | 1,868,365 | 1,421 | |||||||||
| Alaska Air Group, Inc. | 106,824 | 8,666,631 | (66,231 | ) | ||||||||
| Alleghany Corp. | 1,767 | 846,163 | (1,661 | ) | ||||||||
| Allstate Corp./The | 95,604 | 5,962,821 | (26,769 | ) | ||||||||
| Alphabet, Inc. | 6,613 | 5,090,886 | 54,094 | |||||||||
| Amazon.com, Inc. | 3,333 | 2,235,276 | 17,465 | |||||||||
| AMC Networks, Inc. | 24,436 | 1,904,542 | (79,661 | ) | ||||||||
| Amdocs Ltd. | 175,310 | 9,617,507 | (50,840 | ) | ||||||||
| AMERCO | 8,484 | 3,337,606 | (33,088 | ) | ||||||||
| Ameren Corp. | 64,782 | 2,852,351 | (51,826 | ) | ||||||||
| American Airlines Group, Inc. | 130,666 | 5,548,078 | (14,373 | ) | ||||||||
| American Eagle Outfitters, Inc. | 301,424 | 4,590,688 | 81,384 | |||||||||
| American Electric Power Co., Inc. | 267,199 | 15,342,567 | 227,119 | |||||||||
| American Financial Group, Inc. | 38,386 | 2,722,335 | 44,528 | |||||||||
| Ameriprise Financial, Inc. | 56,318 | 5,919,022 | 74,340 | |||||||||
| AmerisourceBergen Corp. | 105,650 | 10,812,221 | 144,741 | |||||||||
| Amgen, Inc. | 24,089 | 3,888,687 | 21,680 | |||||||||
| AmTrust Financial Services, Inc. | 95,944 | 5,937,974 | (29,743 | ) | ||||||||
| Analog Devices, Inc. | 11,536 | 647,400 | (9,229 | ) | ||||||||
| ANSYS, Inc. | 4,954 | 452,597 | 5,648 | |||||||||
| Anthem, Inc. | 117,825 | 16,378,853 | 50,665 | |||||||||
| AO Smith Corp. | 59,341 | 4,540,180 | 5,934 | |||||||||
| Apple, Inc. | 49,420 | 5,385,792 | (183,842 | ) | ||||||||
| Arch Capital Group Ltd. | 49,436 | 3,457,059 | (8,898 | ) | ||||||||
| Archer-Daniels-Midland Co. | 143,512 | 4,921,026 | 342,994 | |||||||||
| Arrow Electronics, Inc. | 29,849 | 1,633,337 | (16,118 | ) | ||||||||
| Ashland, Inc. | 13,136 | 1,357,343 | (8,276 | ) | ||||||||
| Aspen Insurance Holdings Ltd. | 62,706 | 3,037,479 | (8,779 | ) | ||||||||
| Associated Banc-Corp. | 10,986 | 210,272 | (4,285 | ) | ||||||||
| Assurant, Inc. | 42,104 | 3,405,793 | (14,736 | ) | ||||||||
| Assured Guaranty Ltd. | 164,001 | 4,150,865 | 183,681 | |||||||||
| AT&T, Inc. | 98,948 | 3,367,200 | 37,600 | |||||||||
| REFERENCE ENTITY | SHARES | NOTIONAL (a) | NET UNREALIZED APPRECIATION (DEPRECIATION) | |||||||||
| United States (continued) | ||||||||||||
| Atmos Energy Corp. | 39,226 | $ | 2,476,730 | $ | (3,923 | ) | ||||||
| Atwood Oceanics, Inc. | 188,673 | 2,292,377 | (362,252 | ) | ||||||||
| AutoNation, Inc. | 22,811 | 1,363,185 | (2,281 | ) | ||||||||
| AutoZone, Inc. | 5,454 | 4,119,461 | (73,084 | ) | ||||||||
| Avery Dennison Corp. | 49,739 | 3,137,039 | (20,393 | ) | ||||||||
| Avis Budget Group, Inc. | 21,885 | 763,568 | 30,639 | |||||||||
| Avnet, Inc. | 92,707 | 4,061,494 | (89,926 | ) | ||||||||
| Axis Capital Holdings Ltd. | 75,521 | 4,210,296 | 35,495 | |||||||||
| Bank of Hawaii Corp. | 10,042 | 634,253 | (2,611 | ) | ||||||||
| Bank of New York Mellon Corp./The | 57,306 | 2,364,446 | (2,292 | ) | ||||||||
| Bank of the Ozarks, Inc. | 9,281 | 474,909 | (15,871 | ) | ||||||||
| BankUnited, Inc. | 6,412 | 237,244 | (6,027 | ) | ||||||||
| Baxter International, Inc. | 46,998 | 1,764,305 | 28,669 | |||||||||
| BB&T Corp. | 85,368 | 3,229,471 | (1,707 | ) | ||||||||
| Becton Dickinson and Co. | 28,584 | 4,456,531 | (52,023 | ) | ||||||||
| Bed Bath & Beyond, Inc. | 26,631 | 1,377,089 | (92,143 | ) | ||||||||
| Bemis Co., Inc. | 59,934 | 2,668,262 | 10,189 | |||||||||
| Best Buy Co., Inc. | 130,509 | 3,889,168 | 84,831 | |||||||||
| Big Lots, Inc. | 64,354 | 2,422,928 | 57,275 | |||||||||
| Biogen, Inc. | 4,617 | 1,372,034 | 42,384 | |||||||||
| BioMarin Pharmaceutical, Inc. | 4,829 | 485,991 | 19,895 | |||||||||
| Bio-Rad Laboratories, Inc. | 11,291 | 1,555,222 | 10,388 | |||||||||
| BlackRock, Inc. | 6,573 | 2,170,470 | 67,768 | |||||||||
| Boeing Co./The | 63,786 | 9,284,690 | (61,872 | ) | ||||||||
| BOK Financial Corp. | 8,057 | 492,927 | (11,199 | ) | ||||||||
| Booz Allen Hamilton Holding Corp. | 55,508 | 1,630,825 | 81,597 | |||||||||
| Boston Scientific Corp. | 128,851 | 2,396,629 | (20,616 | ) | ||||||||
| Brinker International, Inc. | 129,724 | 5,860,930 | 359,335 | |||||||||
| Broadridge Financial Solutions, Inc. | 77,383 | 4,168,622 | (10,834 | ) | ||||||||
| Brocade Communications Systems, Inc. | 561,464 | 4,952,112 | 202,127 | |||||||||
| Buffalo Wild Wings, Inc. | 3,342 | 524,193 | 9,358 | |||||||||
| Bunge Ltd. | 109,443 | 7,008,730 | 464,038 | |||||||||
| BWX Technologies, Inc. | 9,833 | 305,315 | 7,080 | |||||||||
| CA, Inc. | 114,143 | 3,253,075 | 6,849 | |||||||||
| Cadence Design Systems, Inc. | 101,557 | 2,167,226 | (53,825 | ) | ||||||||
| California Resources Corp. | 211,166 | 422,332 | 69,685 | |||||||||
| Campbell Soup Co. | 15,510 | 824,201 | (9,151 | ) | ||||||||
| Capital One Financial Corp. | 122,812 | 9,134,757 | (270,186 | ) | ||||||||
| Cardinal Health, Inc. | 69,232 | 6,089,647 | 90,694 | |||||||||
| Carlisle Cos., Inc. | 24,892 | 2,190,994 | 16,678 | |||||||||
| Carnival Corp. | 164,615 | 8,306,473 | 661,752 | |||||||||
| Carter’s, Inc. | 23,292 | 2,080,209 | (6,522 | ) | ||||||||
| The accompanying notes are an integral part of these financial statements. | (Continued) |
| AQR Funds | Annual Report | December 2015 | ||||||||||||||
270
Table of Contents
| Consolidated Schedule of Investments | December 31, 2015 |
| AQR STYLE PREMIA ALTERNATIVE FUND |
| REFERENCE ENTITY | SHARES | NOTIONAL (a) | NET UNREALIZED APPRECIATION (DEPRECIATION) | |||||||||
| United States (continued) | ||||||||||||
| Casey’s General Stores, Inc. | 29,233 | $ | 3,633,662 | $ | (112,547 | ) | ||||||
| Catalent, Inc. | 7,937 | 209,219 | (10,556 | ) | ||||||||
| CDW Corp. | 83,642 | 3,570,677 | (54,367 | ) | ||||||||
| Celanese Corp. | 95,107 | 6,269,453 | 134,101 | |||||||||
| Celgene Corp. | 12,096 | 1,356,808 | 91,809 | |||||||||
| Centene Corp. | 134,184 | 8,300,622 | 530,027 | |||||||||
| CenturyLink, Inc. | 17,227 | 437,566 | (4,134 | ) | ||||||||
| CF Industries Holdings, Inc. | 121,341 | 5,004,103 | (52,177 | ) | ||||||||
| Charles River Laboratories International, Inc. | 53,353 | 4,235,161 | 53,887 | |||||||||
| Cheesecake Factory, Inc./The | 56,327 | 2,604,560 | (7,323 | ) | ||||||||
| Chevron Corp. | 41,875 | 3,791,363 | (24,288 | ) | ||||||||
| Church & Dwight Co., Inc. | 19,283 | 1,643,683 | (6,942 | ) | ||||||||
| Cimarex Energy Co. | 3,626 | 347,153 | (23,061 | ) | ||||||||
| Cinemark Holdings, Inc. | 25,997 | 867,000 | 2,080 | |||||||||
| Cintas Corp. | 59,392 | 5,376,164 | 31,478 | |||||||||
| Cisco Systems, Inc. | 381,818 | 10,202,177 | 166,091 | |||||||||
| Citigroup, Inc. | 42,927 | 2,268,263 | (46,790 | ) | ||||||||
| Cleco Corp. | 4,448 | 231,474 | 756 | |||||||||
| Clorox Co./The | 45,897 | 6,028,112 | (206,995 | ) | ||||||||
| CME Group, Inc. | 28,725 | 2,728,013 | (125,528 | ) | ||||||||
| CMS Energy Corp. | 80,295 | 2,906,679 | (9,635 | ) | ||||||||
| Cognizant Technology Solutions Corp. | 32,833 | 1,983,770 | (13,133 | ) | ||||||||
| Comcast Corp. | 113,338 | 6,506,168 | (110,505 | ) | ||||||||
| Commerce Bancshares, Inc. | 12,065 | 518,192 | (4,947 | ) | ||||||||
| Commercial Metals Co. | 252,360 | 3,457,332 | (2,524 | ) | ||||||||
| Community Health Systems, Inc. | 34,105 | 870,019 | 34,787 | |||||||||
| Computer Sciences Corp. | 57,844 | 1,815,145 | 75,197 | |||||||||
| ConAgra Foods, Inc. | 29,467 | 1,197,244 | 45,085 | |||||||||
| ConocoPhillips | 105,579 | 4,991,775 | (62,292 | ) | ||||||||
| Consolidated Edison, Inc. | 257,690 | 16,548,852 | 12,885 | |||||||||
| Constellation Brands, Inc. | 40,807 | 5,708,491 | 104,058 | |||||||||
| Convergys Corp. | 152,888 | 3,927,693 | (122,310 | ) | ||||||||
| Cooper Cos., Inc./The | 6,790 | 926,428 | (15,210 | ) | ||||||||
| CoreLogic, Inc. | 36,743 | 1,319,441 | (75,323 | ) | ||||||||
| Corning, Inc. | 82,545 | 1,493,239 | 15,684 | |||||||||
| Costco Wholesale Corp. | 21,999 | 3,534,799 | 18,039 | |||||||||
| Coty, Inc. | 17,181 | 473,337 | (32,988 | ) | ||||||||
| CR Bard, Inc. | 22,517 | 4,292,191 | (26,570 | ) | ||||||||
| Cracker Barrel Old Country Store, Inc. | 10,562 | 1,316,131 | 23,448 | |||||||||
| Crane Co. | 4,893 | 223,708 | 10,373 | |||||||||
| Credit Acceptance Corp. | 15,541 | 3,289,719 | 36,366 | |||||||||
| Crown Holdings, Inc. | 42,393 | 2,073,018 | 76,307 | |||||||||
| REFERENCE ENTITY | SHARES | NOTIONAL (a) | NET UNREALIZED APPRECIATION (DEPRECIATION) | |||||||||
| United States (continued) | ||||||||||||
| CST Brands, Inc. | 61,221 | $ | 2,367,416 | $ | 28,774 | |||||||
| CSX Corp. | 149,790 | 3,834,624 | 52,426 | |||||||||
| Cummins, Inc. | 52,383 | 4,502,843 | 107,385 | |||||||||
| CVR Energy, Inc. | 6,056 | 239,151 | (848 | ) | ||||||||
| CVS Health Corp. | 57,343 | 5,430,956 | 175,470 | |||||||||
| Danaher Corp. | 47,620 | 4,375,802 | 47,144 | |||||||||
| Darden Restaurants, Inc. | 109,471 | 6,392,012 | 574,723 | |||||||||
| Dean Foods Co. | 68,584 | 1,205,021 | (28,805 | ) | ||||||||
| Deckers Outdoor Corp. | 33,748 | 1,663,776 | (70,871 | ) | ||||||||
| Deere & Co. | 43,801 | 3,368,735 | (28,033 | ) | ||||||||
| Delta Air Lines, Inc. | 159,082 | 8,117,954 | (54,088 | ) | ||||||||
| Deluxe Corp. | 84,509 | 4,595,599 | 13,521 | |||||||||
| DENTSPLY International, Inc. | 23,120 | 1,393,211 | 13,641 | |||||||||
| Devon Energy Corp. | 47,574 | 1,378,695 | 143,673 | |||||||||
| DeVry Education Group, Inc. | 22,774 | 567,756 | 8,654 | |||||||||
| Dick’s Sporting Goods, Inc. | 15,043 | 544,406 | (12,636 | ) | ||||||||
| Dillard’s, Inc. | 18,325 | 1,242,801 | (38,666 | ) | ||||||||
| Discover Financial Services | 50,206 | 2,705,099 | (13,054 | ) | ||||||||
| Dollar General Corp. | 17,424 | 1,246,513 | 5,750 | |||||||||
| Domino’s Pizza, Inc. | 15,007 | 1,641,316 | 28,213 | |||||||||
| Dover Corp. | 8,954 | 532,405 | 16,565 | |||||||||
| Dow Chemical Co./The | 153,758 | 7,726,339 | 189,122 | |||||||||
| DR Horton, Inc. | 184,743 | 5,823,099 | 94,219 | |||||||||
| Dr. Pepper Snapple Group, Inc. | 120,834 | 11,241,187 | 20,542 | |||||||||
| Dril-Quip, Inc. | 18,032 | 1,046,217 | 21,819 | |||||||||
| DST Systems, Inc. | 46,024 | 5,345,227 | (95,730 | ) | ||||||||
| DTE Energy Co. | 79,047 | 6,319,808 | 18,971 | |||||||||
| Dun & Bradstreet Corp./The | 8,938 | 930,267 | (1,341 | ) | ||||||||
| East West Bancorp, Inc. | 33,269 | 1,406,946 | (24,286 | ) | ||||||||
| Eastman Chemical Co. | 18,226 | 1,217,497 | 12,940 | |||||||||
| eBay, Inc. | 255,250 | 7,159,763 | (145,493 | ) | ||||||||
| Edison International | 142,533 | 8,680,260 | (240,881 | ) | ||||||||
| Edwards Lifesciences Corp. | 64,038 | 5,186,438 | (128,716 | ) | ||||||||
| Electronic Arts, Inc. | 107,720 | 7,661,046 | (258,528 | ) | ||||||||
| Eli Lilly & Co. | 83,795 | 7,224,805 | (164,238 | ) | ||||||||
| Endurance Specialty Holdings Ltd. | 55,586 | 3,516,370 | 40,578 | |||||||||
| Energen Corp. | 19,109 | 853,599 | (70,321 | ) | ||||||||
| Entergy Corp. | 87,613 | 5,890,222 | 99,003 | |||||||||
| EOG Resources, Inc. | 35,935 | 2,634,036 | (90,197 | ) | ||||||||
| EP Energy Corp. | 261,365 | 909,550 | 235,228 | |||||||||
| Equifax, Inc. | 68,678 | 7,774,350 | (125,681 | ) | ||||||||
| Everest Re Group Ltd. | 8,020 | 1,458,918 | 9,464 | |||||||||
| Eversource Energy | 32,615 | 1,686,848 | (21,200 | ) | ||||||||
| Exelon Corp. | 125,114 | 3,328,032 | 146,383 | |||||||||
| Expedia, Inc. | 25,817 | 3,321,873 | (112,820 | ) | ||||||||
| Express Scripts Holding Co. | 6,113 | 529,691 | 4,646 | |||||||||
| The accompanying notes are an integral part of these financial statements. | (Continued) |
| AQR Funds | Annual Report | December 2015 | ||||||||||||||
271
Table of Contents
| Consolidated Schedule of Investments | December 31, 2015 |
| AQR STYLE PREMIA ALTERNATIVE FUND |
| REFERENCE ENTITY | SHARES | NOTIONAL (a) | NET UNREALIZED APPRECIATION (DEPRECIATION) | |||||||||
| United States (continued) | ||||||||||||
| Exxon Mobil Corp. | 47,857 | $ | 3,730,932 | $ | (479 | ) | ||||||
| FactSet Research Systems, Inc. | 18,774 | 3,033,878 | 18,211 | |||||||||
| Fair Isaac Corp. | 22,991 | 2,135,864 | 29,428 | |||||||||
| FedEx Corp. | �� | 30,674 | 4,657,540 | (87,421 | ) | |||||||
| Fidelity National Information Services, Inc. | 19,230 | 1,151,492 | 13,846 | |||||||||
| Fifth Third BanCorp. | 74,723 | 1,515,756 | (13,824 | ) | ||||||||
| First American Financial Corp. | 100,050 | 3,519,759 | 72,036 | |||||||||
| First Solar, Inc. | 92,786 | 5,982,841 | 140,107 | |||||||||
| Fiserv, Inc. | 54,899 | 5,100,666 | (79,604 | ) | ||||||||
| Flowers Foods, Inc. | 30,052 | 666,854 | (21,036 | ) | ||||||||
| FNF Group | 72,049 | 2,382,660 | 115,278 | |||||||||
| Foot Locker, Inc. | 102,252 | 6,545,151 | 110,432 | |||||||||
| Fulton Financial Corp. | 35,389 | 469,258 | (8,847 | ) | ||||||||
| GameStop Corp. | 213,974 | 6,215,945 | (216,114 | ) | ||||||||
| Gartner, Inc. | 3,701 | 334,903 | 777 | |||||||||
| GATX Corp. | 11,626 | 469,690 | 24,996 | |||||||||
| General Dynamics Corp. | 65,499 | 9,049,342 | (52,399 | ) | ||||||||
| General Mills, Inc. | 45,186 | 2,585,995 | 19,430 | |||||||||
| General Motors Co. | 105,988 | 3,615,251 | (10,599 | ) | ||||||||
| Genpact Ltd. | 135,908 | 3,321,592 | 73,390 | |||||||||
| Gilead Sciences, Inc. | 69,585 | 7,122,721 | (81,414 | ) | ||||||||
| Global Payments, Inc. | 45,106 | 2,894,903 | 14,885 | |||||||||
| Goodyear Tire & Rubber Co./The | 251,103 | 8,160,848 | 42,688 | |||||||||
| Graham Holdings Co. | 10,535 | 5,225,255 | (116,096 | ) | ||||||||
| Graphic Packaging Holding Co. | 20,503 | 259,773 | 3,280 | |||||||||
| H&R Block, Inc. | 33,835 | 1,139,563 | (12,519 | ) | ||||||||
| Halyard Health, Inc. | 17,869 | 597,539 | (536 | ) | ||||||||
| Hanesbrands, Inc. | 85,473 | 2,508,633 | 6,838 | |||||||||
| Hanover Insurance Group, Inc./The | 41,569 | 3,351,293 | 29,930 | |||||||||
| Harman International Industries, Inc. | 23,444 | 2,140,437 | 68,222 | |||||||||
| Harris Corp. | 13,684 | 1,137,414 | 51,726 | |||||||||
| Hartford Financial Services Group, Inc./The | 109,511 | 4,742,921 | 16,427 | |||||||||
| Hasbro, Inc. | 13,693 | 909,078 | 13,282 | |||||||||
| HCA Holdings, Inc. | 70,988 | 4,595,763 | 205,155 | |||||||||
| Helmerich & Payne, Inc. | 48,714 | 2,523,385 | 85,250 | |||||||||
| Hess Corp. | 37,160 | 1,828,272 | (26,755 | ) | ||||||||
| Hill-Rom Holdings, Inc. | 24,310 | 1,184,383 | (16,045 | ) | ||||||||
| HollyFrontier Corp. | 105,729 | 4,468,108 | (250,578 | ) | ||||||||
| Home Depot, Inc./The | 28,468 | 3,739,272 | 25,621 | |||||||||
| Honeywell International, Inc. | 15,766 | 1,613,019 | 19,865 | |||||||||
| Hormel Foods Corp. | 92,074 | 7,318,962 | (37,750 | ) | ||||||||
| HP, Inc. | 272,884 | 3,247,320 | (16,373 | ) | ||||||||
| HSN, Inc. | 21,809 | 1,101,354 | 3,708 | |||||||||
| Hubbell, Inc. | 2,171 | 202,685 | 16,673 | |||||||||
| REFERENCE ENTITY | SHARES | NOTIONAL (a) | NET UNREALIZED APPRECIATION (DEPRECIATION) | |||||||||
| United States (continued) | ||||||||||||
| Huntington Ingalls Industries, Inc. | 73,119 | $ | 9,285,382 | $ | (10,237 | ) | ||||||
| IAC/InterActiveCorp. | 30,980 | 1,905,890 | (45,541 | ) | ||||||||
| IDACORP, Inc. | 27,666 | 1,909,231 | (27,943 | ) | ||||||||
| IDEX Corp. | 2,712 | 206,627 | 1,139 | |||||||||
| Illinois Tool Works, Inc. | 5,844 | 540,862 | 760 | |||||||||
| Ingersoll-Rand PLC | 7,877 | 420,789 | 14,730 | |||||||||
| Ingram Micro, Inc. | 157,339 | 4,861,775 | (81,816 | ) | ||||||||
| Ingredion, Inc. | 63,640 | 6,213,173 | (113,916 | ) | ||||||||
| Integrated Device Technology, Inc. | 7,494 | 202,188 | (4,721 | ) | ||||||||
| Intel Corp. | 164,753 | 5,751,527 | (75,786 | ) | ||||||||
| Intercontinental Exchange, Inc. | 14,072 | 3,495,063 | 111,028 | |||||||||
| InterDigital, Inc. | 43,863 | 2,081,299 | 69,742 | |||||||||
| International Business Machines Corp. | 15,329 | 2,096,241 | 13,336 | |||||||||
| International Flavors & Fragrances, Inc. | 10,979 | 1,296,510 | 17,017 | |||||||||
| International Game Technology PLC | 183,619 | 2,757,957 | 212,998 | |||||||||
| Interpublic Group of Cos., Inc./The | 90,228 | 2,029,228 | 71,280 | |||||||||
| Intrexon Corp. | 89,211 | 2,838,694 | (148,982 | ) | ||||||||
| Intuit, Inc. | 11,758 | 1,150,755 | (16,108 | ) | ||||||||
| IPG Photonics Corp. | 2,529 | 227,913 | (2,428 | ) | ||||||||
| ITT Corp. | 39,362 | 1,365,861 | 63,766 | |||||||||
| Jabil Circuit, Inc. | 240,122 | 5,676,484 | (84,043 | ) | ||||||||
| Jack Henry & Associates, Inc. | 21,113 | 1,630,346 | 17,735 | |||||||||
| Jarden Corp. | 40,403 | 2,308,223 | (404 | ) | ||||||||
| JetBlue Airways Corp. | 369,129 | 8,397,685 | (36,913 | ) | ||||||||
| JM Smucker Co./The | 9,925 | 1,227,127 | (2,978 | ) | ||||||||
| John Wiley & Sons, Inc. | 9,566 | 427,026 | 3,731 | |||||||||
| Johnson & Johnson | 4,394 | 455,394 | (4,042 | ) | ||||||||
| JPMorgan Chase & Co. | 145,289 | 9,629,755 | (36,322 | ) | ||||||||
| Juniper Networks, Inc. | 137,708 | 4,008,680 | (207,939 | ) | ||||||||
| KeyCorp. | 94,973 | 1,234,649 | 18,045 | |||||||||
| Kimberly-Clark Corp. | 35,088 | 4,415,474 | 51,228 | |||||||||
| Kohl’s Corp. | 60,747 | 2,700,204 | 193,175 | |||||||||
| Kroger Co./The | 255,328 | 10,708,456 | (28,086 | ) | ||||||||
| L Brands, Inc. | 31,985 | 3,089,111 | (24,309 | ) | ||||||||
| L-3 Communications Holdings, Inc. | 16,403 | 1,929,813 | 30,510 | |||||||||
| Lam Research Corp. | 46,646 | 3,671,040 | 33,585 | |||||||||
| Lancaster Colony Corp. | 5,957 | 666,171 | 21,624 | |||||||||
| Landstar System, Inc. | 4,400 | 251,900 | 6,160 | |||||||||
| Lear Corp. | 122,447 | 14,947,105 | 93,060 | |||||||||
| Leggett & Platt, Inc. | 48,448 | 2,096,829 | (61,044 | ) | ||||||||
| Leidos Holdings, Inc. | 35,722 | 2,042,584 | (32,864 | ) | ||||||||
| Lennar Corp. | 27,942 | 1,360,217 | 6,427 | |||||||||
| Lennox International, Inc. | 8,483 | 1,071,742 | (12,216 | ) | ||||||||
| Lexmark International, Inc. | 52,490 | 1,656,584 | 46,716 | |||||||||
| The accompanying notes are an integral part of these financial statements. | (Continued) |
| AQR Funds | Annual Report | December 2015 | ||||||||||||||
272
Table of Contents
| Consolidated Schedule of Investments | December 31, 2015 |
| AQR STYLE PREMIA ALTERNATIVE FUND |
| REFERENCE ENTITY | SHARES | NOTIONAL (a) | NET UNREALIZED APPRECIATION (DEPRECIATION) | |||||||||
| United States (continued) | ||||||||||||
| Liberty Interactive Corp. QVC Group | 32,665 | $ | 862,356 | $ | 30,052 | |||||||
| LifePoint Health, Inc. | 11,591 | 807,545 | 43,234 | |||||||||
| Lincoln Electric Holdings, Inc. | 11,814 | 595,426 | 17,603 | |||||||||
| Lincoln National Corp. | 72,499 | 3,642,350 | 1,450 | |||||||||
| Lockheed Martin Corp. | 28,750 | 6,187,575 | 55,488 | |||||||||
| Lowe’s Cos., Inc. | 59,276 | 4,439,772 | 67,575 | |||||||||
| LyondellBasell Industries NV | 167,908 | 14,723,853 | (132,647 | ) | ||||||||
| M&T Bank Corp. | 16,295 | 2,032,638 | (58,010 | ) | ||||||||
| Mallinckrodt PLC | 61,609 | 4,412,437 | 185,443 | |||||||||
| Manhattan Associates, Inc. | 33,700 | 2,416,964 | (187,035 | ) | ||||||||
| ManpowerGroup, Inc. | 28,528 | 2,400,631 | 3,994 | |||||||||
| Marathon Oil Corp. | 105,816 | 1,352,328 | (20,105 | ) | ||||||||
| Marathon Petroleum Corp. | 174,989 | 8,980,435 | 90,994 | |||||||||
| Marriott International, Inc. | 28,485 | 1,880,865 | 28,770 | |||||||||
| Marvell Technology Group Ltd. | 184,927 | 1,566,332 | 64,724 | |||||||||
| Maxim Integrated Products, Inc. | 5,426 | 203,963 | 2,225 | |||||||||
| MAXIMUS, Inc. | 26,031 | 1,443,159 | 21,085 | |||||||||
| McCormick & Co., Inc. | 21,419 | 1,816,117 | 16,493 | |||||||||
| McGraw Hill Financial, Inc. | 28,259 | 2,693,648 | 92,124 | |||||||||
| McKesson Corp. | 12,306 | 2,338,386 | 88,726 | |||||||||
| Medivation, Inc. | 18,895 | 824,956 | 88,429 | |||||||||
| Mentor Graphics Corp. | 162,293 | 2,909,913 | 79,524 | |||||||||
| Merck & Co., Inc. | 45,830 | 2,413,408 | 7,333 | |||||||||
| MetLife, Inc. | 196,401 | 9,323,155 | 145,337 | |||||||||
| Michaels Cos., Inc./The | 21,151 | 463,841 | 3,807 | |||||||||
| Micron Technology, Inc. | 79,922 | 1,144,483 | (12,788 | ) | ||||||||
| Microsoft Corp. | 83,162 | 4,632,123 | (18,296 | ) | ||||||||
| Minerals Technologies, Inc. | 24,387 | 1,159,114 | (40,726 | ) | ||||||||
| Mohawk Industries, Inc. | 17,739 | 3,429,658 | (70,069 | ) | ||||||||
| Molina Healthcare, Inc. | 61,716 | 3,640,010 | 70,973 | |||||||||
| Monster Beverage Corp. | 9,962 | 1,497,189 | (13,249 | ) | ||||||||
| Moody’s Corp. | 9,180 | 898,538 | 22,583 | |||||||||
| Mosaic Co./The | 140,098 | 4,040,426 | (175,123 | ) | ||||||||
| MSCI, Inc. | 36,733 | 2,604,002 | 45,549 | |||||||||
| MSG Networks, Inc. | 57,471 | 1,187,926 | 7,471 | |||||||||
| Murphy Oil Corp. | 134,044 | 2,922,159 | 87,129 | |||||||||
| Murphy USA, Inc. | 88,207 | 5,509,409 | (151,716 | ) | ||||||||
| Mylan NV | 31,161 | 1,650,598 | 34,277 | |||||||||
| Nasdaq, Inc. | 115,944 | 6,502,140 | 242,323 | |||||||||
| Navient Corp. | 164,965 | 2,058,763 | (169,914 | ) | ||||||||
| NeuStar, Inc. | 51,541 | 1,256,054 | (20,616 | ) | ||||||||
| Newell Rubbermaid, Inc. | 4,534 | 203,214 | (3,355 | ) | ||||||||
| Newfield Exploration Co. | 101,248 | 3,301,697 | (5,062 | ) | ||||||||
| NewMarket Corp. | 1,544 | 575,912 | 11,935 | |||||||||
| REFERENCE ENTITY | SHARES | NOTIONAL (a) | NET UNREALIZED APPRECIATION (DEPRECIATION) | |||||||||
| United States (continued) | ||||||||||||
| NextEra Energy, Inc. | 30,134 | $ | 3,116,157 | $ | 14,464 | |||||||
| NIKE, Inc. | 80,466 | 5,239,141 | (210,016 | ) | ||||||||
| NiSource, Inc. | 120,577 | 2,324,725 | 27,733 | |||||||||
| Northern Trust Corp. | 47,305 | 3,404,541 | 5,677 | |||||||||
| Northrop Grumman Corp. | 74,263 | 13,984,466 | 37,132 | |||||||||
| Norwegian Cruise Line Holdings Ltd. | 59,159 | 3,378,570 | 88,147 | |||||||||
| Nu Skin Enterprises, Inc. | 6,566 | 248,851 | (66 | ) | ||||||||
| NVIDIA Corp. | 59,929 | 1,957,880 | 17,379 | |||||||||
| NVR, Inc. | 2,223 | 3,676,820 | (24,431 | ) | ||||||||
| Old Republic International Corp. | 41,043 | 756,422 | 8,209 | |||||||||
| Omnicom Group, Inc. | 20,182 | 1,486,808 | 40,162 | |||||||||
| ON Semiconductor Corp. | 127,856 | 1,273,446 | (20,457 | ) | ||||||||
| ONE Gas, Inc. | 15,101 | 741,157 | 16,460 | |||||||||
| OneMain Holdings, Inc. | 18,245 | 758,810 | (912 | ) | ||||||||
| OPKO Health, Inc. | 36,663 | 368,097 | 367 | |||||||||
| Oracle Corp. | 67,732 | 2,501,343 | (27,093 | ) | ||||||||
| Orbital ATK, Inc. | 39,779 | 3,502,939 | 50,917 | |||||||||
| O’Reilly Automotive, Inc. | 16,112 | 4,098,087 | (14,984 | ) | ||||||||
| Oshkosh Corp. | 10,773 | 414,114 | 6,464 | |||||||||
| Owens Corning | 109,682 | 5,141,892 | 16,452 | |||||||||
| PACCAR, Inc. | 75,902 | 3,448,987 | 148,768 | |||||||||
| Packaging Corp. of America | 15,354 | 951,334 | 16,736 | |||||||||
| Panera Bread Co. | 1,614 | 312,067 | 2,308 | |||||||||
| PAREXEL International Corp. | 5,545 | 358,651 | 19,075 | |||||||||
| Parker-Hannifin Corp. | 23,848 | 2,270,091 | 42,688 | |||||||||
| Paychex, Inc. | 6,770 | 361,180 | (3,114 | ) | ||||||||
| Penske Automotive Group, Inc. | 10,345 | 447,318 | (9,311 | ) | ||||||||
| People’s United Financial, Inc. | 245,011 | 3,983,879 | (26,951 | ) | ||||||||
| PepsiCo, Inc. | 79,405 | 7,956,381 | (22,233 | ) | ||||||||
| Pfizer, Inc. | 233,331 | 7,543,591 | (11,667 | ) | ||||||||
| PG&E Corp. | 235,032 | 12,656,473 | (155,121 | ) | ||||||||
| Phillips 66 | 77,322 | 6,323,393 | 1,546 | |||||||||
| Pilgrim’s Pride Corp. | 185,493 | 3,925,032 | 172,508 | |||||||||
| Pinnacle Foods, Inc. | 125,284 | 5,196,780 | 122,778 | |||||||||
| Pinnacle West Capital Corp. | 134,771 | 8,570,088 | 119,946 | |||||||||
| Plantronics, Inc. | 20,762 | 1,019,414 | (34,880 | ) | ||||||||
| PNC Financial Services Group, Inc./The | 136,305 | 13,041,662 | (50,433 | ) | ||||||||
| Polycom, Inc. | 34,017 | 447,324 | (19,050 | ) | ||||||||
| PPG Industries, Inc. | 12,582 | 1,236,056 | 7,298 | |||||||||
| Primerica, Inc. | 4,606 | 219,015 | (1,474 | ) | ||||||||
| Progressive Corp./The | 86,000 | 2,707,280 | 27,520 | |||||||||
| Prosperity Bancshares, Inc. | 4,250 | 205,573 | (2,168 | ) | ||||||||
| Public Service Enterprise Group, Inc. | 466,754 | 17,787,995 | 270,717 | |||||||||
| The accompanying notes are an integral part of these financial statements. | (Continued) |
| AQR Funds | Annual Report | December 2015 | ||||||||||||||
273
Table of Contents
| Consolidated Schedule of Investments | December 31, 2015 |
| AQR STYLE PREMIA ALTERNATIVE FUND |
| REFERENCE ENTITY | SHARES | NOTIONAL (a) | NET UNREALIZED APPRECIATION (DEPRECIATION) | |||||||||
| United States (continued) | ||||||||||||
| PulteGroup, Inc. | 64,346 | $ | 1,142,142 | $ | 4,504 | |||||||
| Quest Diagnostics, Inc. | 17,242 | 1,187,112 | 39,484 | |||||||||
| Quintiles Transnational Holdings, Inc. | 108,477 | 7,578,203 | (130,172 | ) | ||||||||
| Rackspace Hosting, Inc. | 110,199 | 2,741,751 | 48,488 | |||||||||
| Raytheon Co. | 55,463 | 7,069,869 | (163,061 | ) | ||||||||
| Regal Beloit Corp. | 3,518 | 201,828 | 4,046 | |||||||||
| Regal Entertainment Group | 17,764 | 331,476 | 3,730 | |||||||||
| Reinsurance Group of America, Inc. | 85,887 | 7,431,802 | (84,169 | ) | ||||||||
| Reliance Steel & Aluminum Co. | 88,103 | 4,932,006 | 170,039 | |||||||||
| RenaissanceRe Holdings Ltd. | 20,887 | 2,318,875 | 45,325 | |||||||||
| Republic Services, Inc. | 208,920 | 9,159,053 | 31,338 | |||||||||
| ResMed, Inc. | 4,567 | 252,053 | (6,851 | ) | ||||||||
| Robert Half International, Inc. | 12,113 | 554,897 | 16,110 | |||||||||
| Rockwell Automation, Inc. | 11,375 | 1,137,728 | 29,461 | |||||||||
| Ross Stores, Inc. | 63,892 | 3,441,223 | (3,195 | ) | ||||||||
| Rowan Cos. PLC | 258,607 | 4,885,086 | (501,698 | ) | ||||||||
| Royal Caribbean Cruises Ltd. | 79,414 | 7,460,945 | 576,546 | |||||||||
| RPM International, Inc. | 4,587 | 200,314 | 1,789 | |||||||||
| RR Donnelley & Sons Co. | 26,987 | 396,979 | 270 | |||||||||
| Ryder System, Inc. | 71,724 | 4,064,599 | 11,476 | |||||||||
| Sabre Corp. | 27,357 | 787,061 | (21,886 | ) | ||||||||
| SCANA Corp. | 85,463 | 5,249,992 | (80,335 | ) | ||||||||
| Scotts Miracle-Gro Co./The | 9,405 | 612,266 | (5,549 | ) | ||||||||
| Seagate Technology PLC | 56,263 | 1,908,441 | 154,161 | |||||||||
| SEI Investments Co. | 33,104 | 1,736,967 | (2,317 | ) | ||||||||
| Sensient Technologies Corp. | 29,355 | 1,820,597 | 23,484 | |||||||||
| ServiceMaster Global Holdings, Inc. | 24,799 | 949,058 | 24,055 | |||||||||
| Sherwin-Williams Co./The | 11,904 | 3,133,133 | (42,854 | ) | ||||||||
| Signature Bank/New York NY | 5,666 | 876,530 | (7,536 | ) | ||||||||
| Skechers U.S.A., Inc. | 204,123 | 6,170,638 | (4,082 | ) | ||||||||
| Skyworks Solutions, Inc. | 47,859 | 3,723,430 | (46,423 | ) | ||||||||
| SM Energy Co. | 39,665 | 796,870 | (17,056 | ) | ||||||||
| Snap-on, Inc. | 26,618 | 4,537,038 | 26,086 | |||||||||
| Sonoco Products Co. | 37,184 | 1,510,786 | 8,924 | |||||||||
| Southwest Airlines Co. | 120,323 | 5,235,254 | (54,145 | ) | ||||||||
| Spectrum Brands Holdings, Inc. | 15,518 | 1,536,592 | 43,140 | |||||||||
| Spirit AeroSystems Holdings, Inc. | 226,739 | 10,983,237 | 369,585 | |||||||||
| REFERENCE ENTITY | SHARES | NOTIONAL (a) | NET UNREALIZED APPRECIATION (DEPRECIATION) | |||||||||
| United States (continued) | ||||||||||||
| SS&C Technologies Holdings, Inc. | 17,098 | $ | 1,175,487 | $ | (8,207 | ) | ||||||
| Stanley Black & Decker, Inc. | 18,940 | 2,036,808 | (15,341 | ) | ||||||||
| State Street Corp. | 57,066 | 3,789,182 | (2,283 | ) | ||||||||
| Steel Dynamics, Inc. | 152,353 | 2,591,525 | 131,024 | |||||||||
| STERIS PLC | 58,284 | 4,287,954 | 103,163 | |||||||||
| Stryker Corp. | 25,723 | 2,384,779 | 5,916 | |||||||||
| SunTrust Banks, Inc. | 167,569 | 7,245,684 | (67,028 | ) | ||||||||
| Superior Energy Services, Inc. | 181,358 | 2,373,976 | 68,916 | |||||||||
| SUPERVALU, Inc. | 226,035 | 1,523,476 | 9,041 | |||||||||
| Synaptics, Inc. | 9,844 | 785,847 | 5,020 | |||||||||
| Synchrony Financial | 103,296 | 3,099,913 | 41,318 | |||||||||
| Synopsys, Inc. | 83,213 | 3,762,892 | 32,453 | |||||||||
| Sysco Corp. | 21,036 | 867,735 | (5,259 | ) | ||||||||
| Talen Energy Corp. | 110,779 | 649,165 | 40,988 | |||||||||
| Target Corp. | 121,165 | 8,763,864 | 33,926 | |||||||||
| Tech Data Corp. | 72,647 | 4,840,470 | (18,162 | ) | ||||||||
| TEGNA, Inc. | 282,046 | 7,333,196 | (135,382 | ) | ||||||||
| Teleflex, Inc. | 35,038 | 4,620,111 | (14,366 | ) | ||||||||
| Telephone & Data Systems, Inc. | 26,017 | 679,044 | (5,464 | ) | ||||||||
| Teradyne, Inc. | 10,179 | 209,891 | 509 | |||||||||
| Tesoro Corp. | 97,622 | 10,343,051 | (56,621 | ) | ||||||||
| Thermo Fisher Scientific, Inc. | 5,487 | 758,084 | 20,247 | |||||||||
| Thomson Reuters Corp. | 31,342 | 1,186,608 | (313 | ) | ||||||||
| Thor Industries, Inc. | 11,055 | 618,417 | 2,322 | |||||||||
| Time Warner, Inc. | 25,761 | 1,670,858 | (4,895 | ) | ||||||||
| Time, Inc. | 154,838 | 2,378,312 | 48,000 | |||||||||
| TJX Cos., Inc./The | 10,657 | 752,917 | 2,771 | |||||||||
| TopBuild Corp. | 11,161 | 325,343 | 18,081 | |||||||||
| Torchmark Corp. | 70,667 | 4,027,312 | 12,013 | |||||||||
| Toro Co./The | 8,737 | 675,370 | (36,958 | ) | ||||||||
| Total System Services, Inc. | 132,944 | 7,018,114 | (397,503 | ) | ||||||||
| Tractor Supply Co. | 5,120 | 439,654 | (1,894 | ) | ||||||||
| Travelers Cos., Inc./The | 119,464 | 13,531,687 | (48,980 | ) | ||||||||
| Trinity Industries, Inc. | 138,741 | 3,303,423 | 29,136 | |||||||||
| Trustmark Corp. | 22,289 | 525,352 | (11,813 | ) | ||||||||
| Tupperware Brands Corp. | 17,011 | 945,641 | 1,021 | |||||||||
| Tyler Technologies, Inc. | 8,822 | 1,568,728 | (30,877 | ) | ||||||||
| Tyson Foods, Inc. | 183,154 | 9,685,184 | 82,419 | |||||||||
| UGI Corp. | 63,244 | 2,074,403 | 60,714 | |||||||||
| United Parcel Service, Inc. | 17,214 | 1,721,400 | (64,897 | ) | ||||||||
| United Therapeutics Corp. | 40,438 | 6,394,865 | (61,870 | ) | ||||||||
| UnitedHealth Group, Inc. | 117,260 | 13,979,737 | (185,271 | ) | ||||||||
| Universal Health Services, Inc. | 11,880 | 1,379,506 | 40,036 | |||||||||
| Unum Group | 51,437 | 1,701,022 | 11,316 | |||||||||
| US Bancorp. | 126,148 | 5,529,067 | (146,332 | ) | ||||||||
| The accompanying notes are an integral part of these financial statements. | (Continued) |
| AQR Funds | Annual Report | December 2015 | ||||||||||||||
274
Table of Contents
| Consolidated Schedule of Investments | December 31, 2015 |
| AQR STYLE PREMIA ALTERNATIVE FUND |
| REFERENCE ENTITY | SHARES | NOTIONAL (a) | NET UNREALIZED APPRECIATION (DEPRECIATION) | |||||||||
| United States (continued) | ||||||||||||
| Valero Energy Corp. | 212,056 | $ | 15,200,174 | $ | (205,694 | ) | ||||||
| Validus Holdings Ltd. | 122,491 | 5,646,835 | 23,273 | |||||||||
| Valmont Industries, Inc. | 3,084 | 316,357 | 10,609 | |||||||||
| Vectren Corp. | 21,182 | 885,619 | 12,921 | |||||||||
| VeriSign, Inc. | 62,451 | 5,486,320 | (30,601 | ) | ||||||||
| Verizon Communications, Inc. | 69,398 | 3,199,248 | 8,328 | |||||||||
| VF Corp. | 14,970 | 935,026 | (3,144 | ) | ||||||||
| Visa, Inc. | 34,191 | 2,690,490 | (38,978 | ) | ||||||||
| Voya Financial, Inc. | 160,868 | 5,905,464 | 32,174 | |||||||||
| Wabtec Corp. | 4,942 | 347,521 | 3,954 | |||||||||
| Wal-Mart Stores, Inc. | 107,054 | 6,314,045 | 248,365 | |||||||||
| Walt Disney Co./The | 23,427 | 2,624,058 | (162,349 | ) | ||||||||
| Waste Connections, Inc. | 15,322 | 846,234 | 16,701 | |||||||||
| Waste Management, Inc. | 256,455 | 13,663,922 | 23,081 | |||||||||
| Waters Corp. | 19,144 | 2,513,607 | 62,792 | |||||||||
| Wells Fargo & Co. | 171,730 | 9,525,863 | (190,620 | ) | ||||||||
| Wendy’s Co./The | 171,054 | 1,796,067 | 46,185 | |||||||||
| Werner Enterprises, Inc. | 144,687 | 3,570,875 | (186,646 | ) | ||||||||
| West Pharmaceutical Services, Inc. | 3,330 | 206,627 | (6,094 | ) | ||||||||
| Westar Energy, Inc. | 20,566 | 864,595 | 7,609 | |||||||||
| Western Digital Corp. | 31,115 | 1,848,231 | 20,225 | |||||||||
| Western Refining, Inc. | 99,793 | 3,784,151 | (229,524 | ) | ||||||||
| Western Union Co./The | 63,805 | 1,156,785 | (14,037 | ) | ||||||||
| Westlake Chemical Corp. | 12,148 | 652,226 | 7,653 | |||||||||
| WestRock Co. | 82,177 | 3,687,282 | 61,633 | |||||||||
| WGL Holdings, Inc. | 66,316 | 4,189,845 | (12,600 | ) | ||||||||
| Whirlpool Corp. | 41,471 | 6,097,481 | (6,635 | ) | ||||||||
| White Mountains Insurance Group Ltd. | 597 | 459,965 | (26,059 | ) | ||||||||
| Williams-Sonoma, Inc. | 3,364 | 201,605 | (5,113 | ) | ||||||||
| World Fuel Services Corp. | 60,466 | 2,368,453 | (42,931 | ) | ||||||||
| WR Berkley Corp. | 18,358 | 985,641 | 19,459 | |||||||||
| Wyndham Worldwide Corp. | 38,537 | 2,785,069 | 14,644 | |||||||||
| Xcel Energy, Inc. | 352,388 | 12,826,923 | (172,670 | ) | ||||||||
| Xerox Corp. | 68,992 | 703,028 | 30,356 | |||||||||
| Xilinx, Inc. | 4,395 | 207,005 | (571 | ) | ||||||||
| Zebra Technologies Corp. | 2,797 | 185,861 | 8,950 | |||||||||
|
| |||||||||||
| 3,374,248 | ||||||||||||
|
| |||||||||||
Total of Long Equity Positions | 3,905,500 | |||||||||||
|
| |||||||||||
| Short Positions | ||||||||||||
| Common Stocks | ||||||||||||
| Ireland | ||||||||||||
| Allegion PLC | (11,978 | ) | (785,996 | ) | (3,593 | ) | ||||||
| Endo International PLC | (136,507 | ) | (8,378,800 | ) | 21,841 | |||||||
| Jazz Pharmaceuticals PLC | (15,996 | ) | (2,221,684 | ) | (26,713 | ) | ||||||
| REFERENCE ENTITY | SHARES | NOTIONAL (a) | NET UNREALIZED APPRECIATION (DEPRECIATION) | |||||||||
| Ireland (continued) | ||||||||||||
| Medtronic PLC | (61,567 | ) | $ | (4,796,069 | ) | $ | 60,336 | |||||
|
| |||||||||||
| 51,871 | ||||||||||||
|
| |||||||||||
| Netherlands | ||||||||||||
| Core Laboratories NV | (16,834 | ) | (1,879,853 | ) | 49,324 | |||||||
| QIAGEN NV | (92,415 | ) | (2,483,191 | ) | (72,084 | ) | ||||||
| Sensata Technologies Holding NV | (121,911 | ) | (5,444,545 | ) | (170,675 | ) | ||||||
|
| |||||||||||
| (193,435 | ) | |||||||||||
|
| |||||||||||
| Norway | ||||||||||||
| Golar LNG Ltd. | (167,264 | ) | (2,360,095 | ) | (281,004 | ) | ||||||
|
| |||||||||||
| Switzerland | ||||||||||||
| Weatherford International PLC | (897,665 | ) | (7,728,896 | ) | 197,486 | |||||||
|
| |||||||||||
| United Kingdom | ||||||||||||
| Aon PLC | (88,797 | ) | (8,282,096 | ) | 94,125 | |||||||
| Ensco PLC | (197,499 | ) | (3,039,510 | ) | — | |||||||
| Liberty Global PLC | (30,876 | ) | (1,236,584 | ) | (71,324 | ) | ||||||
| Michael Kors Holdings Ltd. | (74,505 | ) | (2,937,732 | ) | (46,938 | ) | ||||||
| Pentair PLC | (52,958 | ) | (2,625,658 | ) | 2,648 | |||||||
|
| |||||||||||
| (21,489 | ) | |||||||||||
|
| |||||||||||
| United States | ||||||||||||
| Abercrombie & Fitch Co. | (176,359 | ) | (4,567,698 | ) | (193,995 | ) | ||||||
| Acadia Healthcare Co., Inc. | (15,874 | ) | (976,410 | ) | (15,080 | ) | ||||||
| ACI Worldwide, Inc. | (9,477 | ) | (218,540 | ) | 15,732 | |||||||
| Acxiom Corp. | (108,758 | ) | (2,378,537 | ) | 103,320 | |||||||
| Adobe Systems, Inc. | (30,580 | ) | (2,880,636 | ) | 7,951 | |||||||
| ADT Corp./The | (92,129 | ) | (3,054,076 | ) | 15,662 | |||||||
| AECOM | (44,669 | ) | (1,306,122 | ) | (35,289 | ) | ||||||
| AES Corp. | (196,286 | ) | (1,805,831 | ) | (72,626 | ) | ||||||
| Agilent Technologies, Inc. | (102,316 | ) | (4,172,446 | ) | (105,385 | ) | ||||||
| Agios Pharmaceuticals, Inc. | (33,508 | ) | (1,862,040 | ) | (313,300 | ) | ||||||
| Akorn, Inc. | (224,280 | ) | (7,869,985 | ) | (497,902 | ) | ||||||
| Albemarle Corp. | (189,366 | ) | (9,926,566 | ) | (679,824 | ) | ||||||
| Alcoa, Inc. | (681,836 | ) | (6,238,799 | ) | (490,922 | ) | ||||||
| Alere, Inc. | (64,574 | ) | (2,519,032 | ) | (5,166 | ) | ||||||
| Alexion Pharmaceuticals, Inc. | (31,739 | ) | (5,896,789 | ) | (157,425 | ) | ||||||
| Align Technology, Inc. | (92,191 | ) | (5,971,211 | ) | (99,566 | ) | ||||||
| Allegheny Technologies, Inc. | (258,186 | ) | (2,703,207 | ) | (201,385 | ) | ||||||
| Alliance Data Systems Corp. | (17,769 | ) | (4,780,927 | ) | (133,445 | ) | ||||||
| Alliant Energy Corp. | (6,133 | ) | (390,733 | ) | 7,728 | |||||||
| Allison Transmission Holdings, Inc. | (21,343 | ) | (542,966 | ) | (9,604 | ) | ||||||
| Allscripts Healthcare Solutions, Inc. | (211,007 | ) | (3,137,674 | ) | (107,614 | ) | ||||||
| The accompanying notes are an integral part of these financial statements. | (Continued) |
| AQR Funds | Annual Report | December 2015 | ||||||||||||||
275
Table of Contents
| Consolidated Schedule of Investments | December 31, 2015 |
| AQR STYLE PREMIA ALTERNATIVE FUND |
| REFERENCE ENTITY | SHARES | NOTIONAL (a) | NET UNREALIZED APPRECIATION (DEPRECIATION) | |||||||||
| United States (continued) | ||||||||||||
| Ally Financial, Inc. | (63,508 | ) | $ | (1,170,452 | ) | $ | (13,337 | ) | ||||
| Alnylam Pharmaceuticals, Inc. | (56,311 | ) | (4,965,504 | ) | (335,614 | ) | ||||||
| American Express Co. | (71,684 | ) | (4,987,056 | ) | 1,434 | |||||||
| American International Group, Inc. | (53,842 | ) | (3,237,519 | ) | (99,069 | ) | ||||||
| AMETEK, Inc. | (21,049 | ) | (1,127,174 | ) | (842 | ) | ||||||
| Amphenol Corp. | (33,134 | ) | (1,747,156 | ) | 16,567 | |||||||
| Anadarko Petroleum Corp. | (101,637 | ) | (4,749,497 | ) | (188,028 | ) | ||||||
| Apache Corp. | (67,792 | ) | (2,911,666 | ) | (103,044 | ) | ||||||
| Apollo Education Group, Inc. | (53,502 | ) | (406,615 | ) | (3,745 | ) | ||||||
| Applied Materials, Inc. | (353,309 | ) | (6,380,761 | ) | (215,518 | ) | ||||||
| Arista Networks, Inc. | (15,947 | ) | (1,161,898 | ) | (79,416 | ) | ||||||
| Armstrong World Industries, Inc. | (33,413 | ) | (1,545,351 | ) | 17,375 | |||||||
| ARRIS Group, Inc. | (49,067 | ) | (1,465,141 | ) | (34,838 | ) | ||||||
| Arthur J Gallagher & Co. | (62,742 | ) | (2,588,735 | ) | 20,077 | |||||||
| Artisan Partners Asset Management, Inc. | (69,025 | ) | (2,443,485 | ) | (45,557 | ) | ||||||
| Ascena Retail Group, Inc. | (115,265 | ) | (1,126,139 | ) | (9,221 | ) | ||||||
| Autodesk, Inc. | (122,322 | ) | (7,429,838 | ) | (23,241 | ) | ||||||
| Automatic Data Processing, Inc. | (29,318 | ) | (2,486,460 | ) | 2,639 | |||||||
| Avon Products, Inc. | (844,780 | ) | (3,404,463 | ) | (16,896 | ) | ||||||
| B/E Aerospace, Inc. | (314,119 | ) | (13,133,315 | ) | (175,907 | ) | ||||||
| Ball Corp. | (15,055 | ) | (1,061,679 | ) | (33,272 | ) | ||||||
| BancorpSouth, Inc. | (31,891 | ) | (774,951 | ) | 9,886 | |||||||
| Bank of America Corp. | (605,840 | ) | (10,481,032 | ) | 284,745 | |||||||
| Belden, Inc. | (26,863 | ) | (1,307,154 | ) | 26,326 | |||||||
| Bio-Techne Corp. | (29,919 | ) | (2,681,341 | ) | (11,369 | ) | ||||||
| Black Hills Corp. | (40,103 | ) | (1,741,673 | ) | (120,309 | ) | ||||||
| Black Knight Financial Services, Inc. | (74,730 | ) | (2,479,541 | ) | 8,968 | |||||||
| Bluebird Bio, Inc. | (39,591 | ) | (2,454,642 | ) | (87,892 | ) | ||||||
| BorgWarner, Inc. | (243,191 | ) | (9,987,854 | ) | (525,293 | ) | ||||||
| Bristol-Myers Squibb Co. | (32,032 | ) | (2,219,177 | ) | 15,696 | |||||||
| Brookdale Senior Living, Inc. | (329,692 | ) | (6,006,988 | ) | (79,126 | ) | ||||||
| Brown & Brown, Inc. | (66,522 | ) | (2,106,087 | ) | (29,270 | ) | ||||||
| Brown-Forman Corp. | (3,393 | ) | (344,356 | ) | 7,499 | |||||||
| Bruker Corp. | (178,770 | ) | (4,195,732 | ) | (143,016 | ) | ||||||
| Brunswick Corp. | (14,270 | ) | (698,659 | ) | (22,119 | ) | ||||||
| Cabela’s, Inc. | (76,407 | ) | (3,544,521 | ) | (25,978 | ) | ||||||
| Cabot Oil & Gas Corp. | (149,372 | ) | (2,292,860 | ) | (349,530 | ) | ||||||
| CalAtlantic Group, Inc. | (51,815 | ) | (1,968,970 | ) | 4,145 | |||||||
| Calpine Corp. | (183,652 | ) | (2,295,650 | ) | (361,794 | ) | ||||||
| CarMax, Inc. | (72,158 | ) | (4,123,830 | ) | 229,462 | |||||||
| Carpenter Technology Corp. | (84,147 | ) | (2,349,384 | ) | (197,745 | ) | ||||||
| Caterpillar, Inc. | (137,196 | ) | (8,904,020 | ) | (419,820 | ) | ||||||
| Cathay General Bancorp | (7,201 | ) | (227,336 | ) | 1,728 | |||||||
| REFERENCE ENTITY | SHARES | NOTIONAL (a) | NET UNREALIZED APPRECIATION (DEPRECIATION) | |||||||||
| United States (continued) | ||||||||||||
| CBOE Holdings, Inc. | (26,282 | ) | $ | (1,709,381 | ) | $ | 3,679 | |||||
| CBS Corp. | (87,454 | ) | (4,068,360 | ) | (53,347 | ) | ||||||
| CDK Global, Inc. | (7,696 | ) | (369,793 | ) | 4,464 | |||||||
| CEB, Inc. | (10,905 | ) | (673,820 | ) | 4,362 | |||||||
| CenterPoint Energy, Inc. | (245,530 | ) | (4,380,255 | ) | (127,676 | ) | ||||||
| Cerner Corp. | (55,673 | ) | (3,361,536 | ) | 11,691 | |||||||
| CH Robinson Worldwide, Inc. | (32,996 | ) | (2,118,343 | ) | 71,931 | |||||||
| Charles Schwab Corp./The | (291,740 | ) | (9,688,685 | ) | 81,687 | |||||||
| Cheniere Energy, Inc. | (189,093 | ) | (7,049,387 | ) | 5,673 | |||||||
| Chico’s FAS, Inc. | (117,365 | ) | (1,288,668 | ) | 36,383 | |||||||
| Chipotle Mexican Grill, Inc. | (16,251 | ) | (9,017,517 | ) | 1,219,475 | |||||||
| Ciena Corp. | (158,840 | ) | (3,135,502 | ) | (150,898 | ) | ||||||
| Cincinnati Financial Corp. | (18,006 | ) | (1,074,058 | ) | 8,643 | |||||||
| CIT Group, Inc. | (25,399 | ) | (1,028,660 | ) | 20,319 | |||||||
| Citrix Systems, Inc. | (12,870 | ) | (999,484 | ) | 25,869 | |||||||
| CLARCOR, Inc. | (4,358 | ) | (211,624 | ) | (4,881 | ) | ||||||
| Clean Harbors, Inc. | (23,335 | ) | (953,001 | ) | (18,901 | ) | ||||||
| CNO Financial Group, Inc. | (24,512 | ) | (462,051 | ) | (5,883 | ) | ||||||
| Coach, Inc. | (109,208 | ) | (3,564,549 | ) | (9,829 | ) | ||||||
| Cobalt International Energy, Inc. | (767,575 | ) | (4,267,717 | ) | 122,812 | |||||||
| Coca-Cola Co./The | (142,493 | ) | (6,197,021 | ) | 75,521 | |||||||
| Cognex Corp. | (80,725 | ) | (2,771,289 | ) | 45,206 | |||||||
| Colfax Corp. | (187,240 | ) | (4,347,713 | ) | (24,341 | ) | ||||||
| Colgate-Palmolive Co. | (224,167 | ) | (15,093,164 | ) | 159,159 | |||||||
| Columbia Pipeline Group, Inc. | (89,985 | ) | (1,770,005 | ) | (29,695 | ) | ||||||
| Comerica, Inc. | (54,924 | ) | (2,323,834 | ) | 26,364 | |||||||
| CommScope Holding Co., Inc. | (20,329 | ) | (525,301 | ) | (1,016 | ) | ||||||
| CommVault Systems, Inc. | (73,501 | ) | (2,956,210 | ) | 63,946 | |||||||
| Compass Minerals International, Inc. | (6,166 | ) | (455,914 | ) | (8,201 | ) | ||||||
| Concho Resources, Inc. | (7,588 | ) | (724,426 | ) | 19,805 | |||||||
| CONSOL Energy, Inc. | (179,309 | ) | (1,237,232 | ) | (179,309 | ) | ||||||
| Copart, Inc. | (8,425 | ) | (323,352 | ) | 3,117 | |||||||
| CoStar Group, Inc. | (12,615 | ) | (2,596,419 | ) | (10,975 | ) | ||||||
| Covanta Holding Corp. | (221,889 | ) | (3,503,627 | ) | 66,567 | |||||||
| Cypress Semiconductor Corp. | (543,946 | ) | (5,221,882 | ) | (114,229 | ) | ||||||
| Dana Holding Corp. | (89,886 | ) | (1,201,776 | ) | (38,651 | ) | ||||||
| DaVita HealthCare Partners, Inc. | (93,628 | ) | (6,377,939 | ) | (148,869 | ) | ||||||
| Denbury Resources, Inc. | (282,906 | ) | (543,180 | ) | (28,291 | ) | ||||||
| DexCom, Inc. | (16,825 | ) | (1,375,107 | ) | (2,860 | ) | ||||||
| Diebold, Inc. | (69,509 | ) | (2,120,720 | ) | 29,194 | |||||||
| Discovery Communications, Inc. | (363,271 | ) | (9,619,416 | ) | (72,654 | ) | ||||||
| DISH Network Corp. | (24,320 | ) | (1,413,965 | ) | 23,347 | |||||||
| The accompanying notes are an integral part of these financial statements. | (Continued) |
| AQR Funds | Annual Report | December 2015 | ||||||||||||||
276
Table of Contents
| Consolidated Schedule of Investments | December 31, 2015 |
| AQR STYLE PREMIA ALTERNATIVE FUND |
| REFERENCE ENTITY | SHARES | NOTIONAL (a) | NET UNREALIZED APPRECIATION (DEPRECIATION) | |||||||||
| United States (continued) | ||||||||||||
| Dolby Laboratories, Inc. | (12,554 | ) | $ | (427,966 | ) | $ | 5,524 | |||||
| Dollar Tree, Inc. | (73,487 | ) | (5,627,634 | ) | (47,032 | ) | ||||||
| Dominion Resources, Inc. | (199,475 | ) | (13,472,542 | ) | (19,948 | ) | ||||||
| Donaldson Co., Inc. | (88,003 | ) | (2,464,084 | ) | (58,082 | ) | ||||||
| DSW, Inc. | (92,487 | ) | (2,174,369 | ) | (32,370 | ) | ||||||
| Duke Energy Corp. | (124,801 | ) | (8,798,471 | ) | (111,073 | ) | ||||||
| Dunkin’ Brands Group, Inc. | (85,452 | ) | (3,669,309 | ) | 29,908 | |||||||
| E*TRADE Financial Corp. | (91,496 | ) | (2,740,305 | ) | 28,364 | |||||||
| Eaton Corp. PLC | (47,693 | ) | (2,390,850 | ) | (91,094 | ) | ||||||
| Eaton Vance Corp. | (31,636 | ) | (1,008,872 | ) | (17,083 | ) | ||||||
| Ecolab, Inc. | (36,471 | ) | (4,205,106 | ) | 33,553 | |||||||
| EI du Pont de Nemours & Co. | (94,925 | ) | (6,191,958 | ) | (130,047 | ) | ||||||
| Emerson Electric Co. | (149,834 | ) | (6,742,530 | ) | (424,030 | ) | ||||||
| Envision Healthcare Holdings Inc | (290,062 | ) | (6,906,376 | ) | (626,534 | ) | ||||||
| EQT Corp. | (6,872 | ) | (328,138 | ) | (30,099 | ) | ||||||
| Estee Lauder Cos., Inc./The | (33,430 | ) | (2,982,290 | ) | 38,445 | |||||||
| Esterline Technologies Corp. | (52,497 | ) | (4,339,402 | ) | 87,145 | |||||||
| Expeditors International of Washington, Inc. | (67,528 | ) | (3,127,222 | ) | 81,709 | |||||||
| F5 Networks, Inc. | (16,870 | ) | (1,669,118 | ) | 33,403 | |||||||
| Facebook, Inc. | (31,953 | ) | (3,394,048 | ) | 49,847 | |||||||
| Fairchild Semiconductor International, Inc. | (23,805 | ) | (477,290 | ) | (15,711 | ) | ||||||
| Fastenal Co. | (109,988 | ) | (4,398,420 | ) | (91,290 | ) | ||||||
| Federated Investors, Inc. | (17,058 | ) | (492,123 | ) | 3,412 | |||||||
| FEI Co. | (40,892 | ) | (3,304,074 | ) | 41,301 | |||||||
| FireEye, Inc. | (254,310 | ) | (5,378,657 | ) | 104,267 | |||||||
| First Horizon National Corp. | (109,628 | ) | (1,620,302 | ) | 28,503 | |||||||
| First Republic Bank | (21,071 | ) | (1,401,643 | ) | 9,693 | |||||||
| FirstEnergy Corp. | (93,912 | ) | (2,961,045 | ) | (18,782 | ) | ||||||
| FirstMerit Corp. | (24,200 | ) | (458,348 | ) | 7,018 | |||||||
| FleetCor Technologies, Inc. | (32,080 | ) | (4,580,703 | ) | (4,491 | ) | ||||||
| FLIR Systems, Inc. | (12,966 | ) | (368,883 | ) | 4,927 | |||||||
| Flowserve Corp. | (117,554 | ) | (4,796,203 | ) | (150,469 | ) | ||||||
| Fluor Corp. | (67,368 | ) | (3,107,012 | ) | (74,105 | ) | ||||||
| FMC Corp. | (228,330 | ) | (8,571,508 | ) | (363,045 | ) | ||||||
| FMC Technologies, Inc. | (67,169 | ) | (1,950,588 | ) | 2,015 | |||||||
| Ford Motor Co. | (433,693 | ) | (6,063,028 | ) | (47,706 | ) | ||||||
| Fortinet, Inc. | (47,134 | ) | (1,480,950 | ) | 11,783 | |||||||
| Fortune Brands Home & Security, Inc. | (14,010 | ) | (774,753 | ) | (2,802 | ) | ||||||
| Fossil Group, Inc. | (16,337 | ) | (617,539 | ) | 20,258 | |||||||
| Franklin Resources, Inc. | (63,989 | ) | (2,268,410 | ) | (87,665 | ) | ||||||
| Freeport-McMoRan, Inc. | (1,206,652 | ) | (7,384,710 | ) | (784,324 | ) | ||||||
| REFERENCE ENTITY | SHARES | NOTIONAL (a) | NET UNREALIZED APPRECIATION (DEPRECIATION) | |||||||||
| United States (continued) | ||||||||||||
| Frontier Communications Corp. | (395,748 | ) | $ | (1,895,633 | ) | $ | 47,490 | |||||
| FTI Consulting, Inc. | (13,857 | ) | (482,916 | ) | 2,633 | |||||||
| Gap, Inc./The | (56,978 | ) | (1,435,846 | ) | 28,489 | |||||||
| General Electric Co. | (540,881 | ) | (16,523,915 | ) | (324,529 | ) | ||||||
| Genesee & Wyoming, Inc. | (97,207 | ) | (5,076,150 | ) | (142,894 | ) | ||||||
| Genworth Financial, Inc. | (1,906,388 | ) | (6,939,252 | ) | (171,575 | ) | ||||||
| GNC Holdings, Inc. | (105,109 | ) | (3,232,102 | ) | (28,379 | ) | ||||||
| Graco, Inc. | (19,574 | ) | (1,359,414 | ) | (51,284 | ) | ||||||
| Greif, Inc. | (16,798 | ) | (517,042 | ) | (504 | ) | ||||||
| Groupon, Inc. | (94,512 | ) | (299,603 | ) | 9,451 | |||||||
| Guess?, Inc. | (55,761 | ) | (1,114,662 | ) | 61,895 | |||||||
| Hain Celestial Group, Inc./The | (72,200 | ) | (2,967,420 | ) | 51,262 | |||||||
| Halliburton Co. | (136,247 | ) | (4,656,922 | ) | 19,075 | |||||||
| Harley-Davidson, Inc. | (30,306 | ) | (1,376,499 | ) | 909 | |||||||
| Harsco Corp. | (226,780 | ) | (1,884,542 | ) | 97,515 | |||||||
| HD Supply Holdings, Inc. | (50,880 | ) | (1,480,608 | ) | (47,318 | ) | ||||||
| Henry Schein, Inc. | (12,945 | ) | (2,009,064 | ) | (38,706 | ) | ||||||
| Hershey Co./The | (43,579 | ) | (3,914,702 | ) | 24,404 | |||||||
| Hertz Global Holdings, Inc. | (321,042 | ) | (4,626,215 | ) | 57,788 | |||||||
| Hexcel Corp. | (33,311 | ) | (1,531,973 | ) | (15,323 | ) | ||||||
| Hilton Worldwide Holdings, Inc. | (301,139 | ) | (6,661,195 | ) | 216,820 | |||||||
| HMS Holdings Corp. | (36,991 | ) | (462,757 | ) | 6,288 | |||||||
| Hologic, Inc. | (46,075 | ) | (1,769,280 | ) | (13,362 | ) | ||||||
| Huntington Bancshares, Inc. | (42,502 | ) | (472,622 | ) | 2,550 | |||||||
| Huntsman Corp. | (207,734 | ) | (2,044,103 | ) | (317,833 | ) | ||||||
| IDEXX Laboratories, Inc. | (87,461 | ) | (6,107,402 | ) | (270,254 | ) | ||||||
| IHS, Inc. | (14,001 | ) | (1,632,937 | ) | (25,202 | ) | ||||||
| Illumina, Inc. | (61,697 | ) | (11,182,581 | ) | (659,849 | ) | ||||||
| IMS Health Holdings, Inc. | (15,441 | ) | (393,900 | ) | 618 | |||||||
| Incyte Corp. | (32,818 | ) | (3,767,835 | ) | 208,722 | |||||||
| Intersil Corp. | (43,612 | ) | (569,573 | ) | 13,084 | |||||||
| Intuitive Surgical, Inc. | (11,096 | ) | (5,981,521 | ) | (78,671 | ) | ||||||
| Invesco Ltd. | (27,965 | ) | (872,228 | ) | (64,040 | ) | ||||||
| Ionis Pharmaceuticals, Inc. | (10,624 | ) | (618,317 | ) | (39,628 | ) | ||||||
| ITC Holdings Corp. | (436,861 | ) | (16,460,922 | ) | (685,872 | ) | ||||||
| Itron, Inc. | (63,198 | ) | (2,262,488 | ) | (24,015 | ) | ||||||
| Jacobs Engineering Group, Inc. | (29,871 | ) | (1,242,634 | ) | (10,455 | ) | ||||||
| Janus Capital Group, Inc. | (49,472 | ) | (681,724 | ) | (15,336 | ) | ||||||
| JB Hunt Transport Services, Inc. | (20,190 | ) | (1,465,390 | ) | (15,748 | ) | ||||||
| Johnson Controls, Inc. | (25,135 | ) | (977,500 | ) | (15,081 | ) | ||||||
| Joy Global, Inc. | (176,542 | ) | (2,095,554 | ) | (130,641 | ) | ||||||
| Kansas City Southern | (142,743 | ) | (10,266,077 | ) | (392,543 | ) | ||||||
| Kate Spade & Co. | (388,558 | )�� | (7,005,701 | ) | 101,025 | |||||||
| The accompanying notes are an integral part of these financial statements. | (Continued) |
| AQR Funds | Annual Report | December 2015 | ||||||||||||||
277
Table of Contents
| Consolidated Schedule of Investments | December 31, 2015 |
| AQR STYLE PREMIA ALTERNATIVE FUND |
| REFERENCE ENTITY | SHARES | NOTIONAL (a) | NET UNREALIZED APPRECIATION (DEPRECIATION) | |||||||||
| United States (continued) | ||||||||||||
| KBR, Inc. | (352,821 | ) | $ | (5,997,957 | ) | $ | 28,226 | |||||
| Kellogg Co. | (73,969 | ) | (5,296,920 | ) | (48,820 | ) | ||||||
| Kennametal, Inc. | (53,755 | ) | (964,365 | ) | (67,731 | ) | ||||||
| Keysight Technologies, Inc. | (10,570 | ) | (300,822 | ) | 1,374 | |||||||
| Kinder Morgan, Inc. | (572,227 | ) | (8,795,129 | ) | 257,502 | |||||||
| KLX, Inc. | (66,408 | ) | (2,091,188 | ) | 46,486 | |||||||
| Kosmos Energy Ltd. | (145,709 | ) | (747,487 | ) | (10,200 | ) | ||||||
| Laboratory Corp. of America Holdings | (20,460 | ) | (2,489,573 | ) | (40,102 | ) | ||||||
| Las Vegas Sands Corp. | (81,322 | ) | (3,400,886 | ) | (164,270 | ) | ||||||
| Legg Mason, Inc. | (25,478 | ) | (995,425 | ) | (4,076 | ) | ||||||
| Leucadia National Corp. | (211,018 | ) | (3,452,254 | ) | (217,349 | ) | ||||||
| Level 3 Communications, Inc. | (98,507 | ) | (5,133,200 | ) | (221,641 | ) | ||||||
| Liberty Broadband Corp. | (21,933 | ) | (1,123,847 | ) | (13,598 | ) | ||||||
| Linear Technology Corp. | (83,686 | ) | (3,623,604 | ) | 69,459 | |||||||
| LinkedIn Corp. | (32,441 | ) | (7,498,737 | ) | 196,917 | |||||||
| Lions Gate Entertainment Corp. | (62,729 | ) | (2,073,193 | ) | 41,401 | |||||||
| Live Nation Entertainment, Inc. | (103,206 | ) | (2,577,054 | ) | 41,282 | |||||||
| Loews Corp. | (163,717 | ) | (6,050,980 | ) | (235,752 | ) | ||||||
| Macy’s, Inc. | (59,914 | ) | (2,067,033 | ) | (28,759 | ) | ||||||
| Manitowoc Co., Inc./The | (309,579 | ) | (4,457,938 | ) | (294,100 | ) | ||||||
| Marsh & McLennan Cos., Inc. | (190,969 | ) | (10,652,251 | ) | 63,020 | |||||||
| Masco Corp. | (35,636 | ) | (1,010,993 | ) | 2,495 | |||||||
| MasterCard, Inc. | (73,069 | ) | (7,257,944 | ) | 143,946 | |||||||
| Mattel, Inc. | (188,000 | ) | (5,047,800 | ) | (60,160 | ) | ||||||
| McDonald’s Corp. | (31,554 | ) | (3,707,595 | ) | (20,195 | ) | ||||||
| MDC Holdings, Inc. | (18,543 | ) | (461,350 | ) | (12,053 | ) | ||||||
| MDU Resources Group, Inc. | (269,181 | ) | (4,506,090 | ) | (425,306 | ) | ||||||
| Mead Johnson Nutrition Co. | (112,079 | ) | (8,696,210 | ) | (152,427 | ) | ||||||
| MEDNAX, Inc. | (3,384 | ) | (246,491 | ) | 3,993 | |||||||
| Memorial Resource Development Corp. | (109,497 | ) | (1,514,344 | ) | (254,033 | ) | ||||||
| MGM Resorts International | (410,517 | ) | (8,805,590 | ) | (521,357 | ) | ||||||
| Middleby Corp./The | (5,304 | ) | (584,713 | ) | 12,570 | |||||||
| Molson Coors Brewing Co. | (42,395 | ) | (3,973,259 | ) | (8,479 | ) | ||||||
| Mondelez International, Inc. | (29,954 | ) | (1,328,759 | ) | (14,378 | ) | ||||||
| Monsanto Co. | (87,807 | ) | (8,406,642 | ) | (244,103 | ) | ||||||
| Morgan Stanley | (40,656 | ) | (1,316,441 | ) | 23,174 | |||||||
| Motorola Solutions, Inc. | (20,013 | ) | (1,372,091 | ) | 2,201 | |||||||
| MSC Industrial Direct Co., Inc. | (9,645 | ) | (530,571 | ) | (12,153 | ) | ||||||
| Nabors Industries Ltd. | (60,237 | ) | (505,991 | ) | (6,626 | ) | ||||||
| National Fuel Gas Co. | (14,448 | ) | (580,087 | ) | (37,565 | ) | ||||||
| National Instruments Corp. | (19,099 | ) | (563,421 | ) | 15,470 | |||||||
| REFERENCE ENTITY | SHARES | NOTIONAL (a) | NET UNREALIZED APPRECIATION (DEPRECIATION) | |||||||||
| United States (continued) | ||||||||||||
| National Oilwell Varco, Inc. | (23,696 | ) | $ | (797,844 | ) | $ | 4,265 | |||||
| NCR Corp. | (61,445 | ) | (1,572,992 | ) | 70,047 | |||||||
| NetApp, Inc. | (68,420 | ) | (1,936,286 | ) | 121,103 | |||||||
| Netflix, Inc. | (6,604 | ) | (809,056 | ) | 53,691 | |||||||
| NetScout Systems, Inc. | (21,692 | ) | (652,495 | ) | (13,449 | ) | ||||||
| NetSuite, Inc. | (57,223 | ) | (4,730,053 | ) | (112,157 | ) | ||||||
| New York Times Co./The | (75,538 | ) | (1,010,698 | ) | (3,022 | ) | ||||||
| News Corp. | (19,640 | ) | (262,390 | ) | — | |||||||
| Nielsen Holdings PLC | (93,720 | ) | (4,334,550 | ) | (32,802 | ) | ||||||
| Noble Energy, Inc. | (101,172 | ) | (3,158,590 | ) | (173,004 | ) | ||||||
| Nordson Corp. | (18,783 | ) | (1,206,244 | ) | 1,315 | |||||||
| Nordstrom, Inc. | (74,767 | ) | (3,838,538 | ) | 114,394 | |||||||
| NorthStar Asset Management Group, Inc. | (377,291 | ) | (4,346,392 | ) | (233,920 | ) | ||||||
| NRG Energy, Inc. | (477,481 | ) | (4,545,619 | ) | (1,074,332 | ) | ||||||
| Nuance Communications, Inc. | (34,788 | ) | (712,632 | ) | 20,699 | |||||||
| Nucor Corp. | (69,439 | ) | (2,671,318 | ) | (127,073 | ) | ||||||
| Occidental Petroleum Corp. | (113,597 | ) | (7,545,113 | ) | (135,180 | ) | ||||||
| Oceaneering International, Inc. | (7,458 | ) | (281,017 | ) | 1,193 | |||||||
| Ocwen Financial Corp. | (60,158 | ) | (400,652 | ) | (18,649 | ) | ||||||
| OGE Energy Corp. | (364,122 | ) | (9,292,393 | ) | (280,374 | ) | ||||||
| Oil States International, Inc. | (35,350 | ) | (998,284 | ) | 34,997 | |||||||
| Old Dominion Freight Line, Inc. | (11,159 | ) | (670,767 | ) | 11,605 | |||||||
| Olin Corp. | (114,760 | ) | (2,036,990 | ) | 56,232 | |||||||
| ONEOK, Inc. | (226,825 | ) | (4,504,745 | ) | (1,088,760 | ) | ||||||
| Owens & Minor, Inc. | (23,085 | ) | (835,215 | ) | 4,617 | |||||||
| Owens-Illinois, Inc. | (207,451 | ) | (3,514,220 | ) | (99,576 | ) | ||||||
| PacWest Bancorp | (15,947 | ) | (703,582 | ) | 16,266 | |||||||
| Palo Alto Networks, Inc. | (15,182 | ) | (2,832,506 | ) | 158,348 | |||||||
| Pandora Media, Inc. | (137,782 | ) | (2,102,553 | ) | 254,897 | |||||||
| Patterson Cos., Inc. | (15,221 | ) | (675,812 | ) | (12,329 | ) | ||||||
| Patterson-UTI Energy, Inc. | (89,467 | ) | (1,330,374 | ) | (18,788 | ) | ||||||
| PayPal Holdings, Inc. | (127,883 | ) | (4,544,962 | ) | (84,403 | ) | ||||||
| PBF Energy, Inc. | (13,930 | ) | (513,878 | ) | 1,114 | |||||||
| PerkinElmer, Inc. | (13,240 | ) | (687,686 | ) | (21,581 | ) | ||||||
| Pitney Bowes, Inc. | (67,519 | ) | (1,338,227 | ) | (56,041 | ) | ||||||
| Platform Specialty Products Corp. | (644,673 | ) | (7,987,498 | ) | (283,656 | ) | ||||||
| PNM Resources, Inc. | (26,385 | ) | (782,051 | ) | (24,538 | ) | ||||||
| Polaris Industries, Inc. | (7,954 | ) | (676,170 | ) | (7,477 | ) | ||||||
| PolyOne Corp. | (19,007 | ) | (593,969 | ) | (9,694 | ) | ||||||
| Post Holdings, Inc. | (55,330 | ) | (3,431,567 | ) | 17,706 | |||||||
| PPL Corp. | (33,762 | ) | (1,145,207 | ) | (7,090 | ) | ||||||
| Praxair, Inc. | (71,099 | ) | (7,317,509 | ) | 36,971 | |||||||
| Premier, Inc. | (15,194 | ) | (522,977 | ) | (12,915 | ) | ||||||
| Priceline Group, Inc./The | (2,694 | ) | (3,539,216 | ) | 104,500 | |||||||
| The accompanying notes are an integral part of these financial statements. | (Continued) |
| AQR Funds | Annual Report | December 2015 | ||||||||||||||
278
Table of Contents
| Consolidated Schedule of Investments | December 31, 2015 |
| AQR STYLE PREMIA ALTERNATIVE FUND |
| REFERENCE ENTITY | SHARES | NOTIONAL (a) | NET UNREALIZED APPRECIATION (DEPRECIATION) | |||||||||
| United States (continued) | ||||||||||||
| Principal Financial Group, Inc. | (80,712 | ) | $ | (3,650,604 | ) | $ | 20,178 | |||||
| Procter & Gamble Co./The | (79,472 | ) | (6,380,807 | ) | 69,935 | |||||||
| Prudential Financial, Inc. | (102,542 | ) | (8,393,063 | ) | 45,118 | |||||||
| PTC, Inc. | (9,756 | ) | (331,119 | ) | (6,732 | ) | ||||||
| PVH Corp. | (13,889 | ) | (1,029,036 | ) | 6,111 | |||||||
| QEP Resources, Inc. | (28,134 | ) | (328,886 | ) | (48,109 | ) | ||||||
| Qorvo, Inc. | (12,195 | ) | (643,286 | ) | 22,561 | |||||||
| QUALCOMM, Inc. | (151,919 | ) | (7,222,229 | ) | (371,442 | ) | ||||||
| Quanta Services, Inc. | (107,889 | ) | (2,142,676 | ) | (42,077 | ) | ||||||
| Questar Corp. | (88,284 | ) | (1,676,513 | ) | (43,259 | ) | ||||||
| Ralph Lauren Corp. | (6,560 | ) | (739,640 | ) | 8,331 | |||||||
| Range Resources Corp. | (108,096 | ) | (2,288,392 | ) | (371,850 | ) | ||||||
| Red Hat, Inc. | (10,817 | ) | (853,029 | ) | (42,727 | ) | ||||||
| Regeneron Pharmaceuticals, Inc. | (1,428 | ) | (787,528 | ) | 12,309 | |||||||
| Regions Financial Corp. | (532,981 | ) | (5,185,905 | ) | 69,288 | |||||||
| Rice Energy, Inc. | (160,591 | ) | (1,369,841 | ) | (380,601 | ) | ||||||
| Rockwell Collins, Inc. | (11,760 | ) | (1,055,342 | ) | (30,106 | ) | ||||||
| Roper Technologies, Inc. | (26,661 | ) | (4,921,621 | ) | (138,371 | ) | ||||||
| Rovi Corp. | (29,711 | ) | (327,415 | ) | (167,570 | ) | ||||||
| RPC, Inc. | (61,783 | ) | (769,198 | ) | 30,892 | |||||||
| salesforce.com, Inc. | (65,518 | ) | (5,138,577 | ) | 1,966 | |||||||
| Sally Beauty Holdings, Inc. | (97,063 | ) | (2,769,207 | ) | 62,120 | |||||||
| SanDisk Corp. | (106,148 | ) | (7,943,055 | ) | (123,132 | ) | ||||||
| Santander Consumer USA Holdings, Inc. | (12,681 | ) | (195,795 | ) | (5,199 | ) | ||||||
| SBA Communications Corp. | (58,196 | ) | (5,878,378 | ) | (236,276 | ) | ||||||
| Schlumberger Ltd. | (67,249 | ) | (4,653,631 | ) | (36,987 | ) | ||||||
| Scripps Networks Interactive, Inc. | (35,980 | ) | (1,952,994 | ) | (33,461 | ) | ||||||
| Sealed Air Corp. | (29,314 | ) | (1,262,554 | ) | (44,850 | ) | ||||||
| Seattle Genetics, Inc. | (95,517 | ) | (3,957,269 | ) | (329,534 | ) | ||||||
| Sempra Energy | (94,860 | ) | (9,101,817 | ) | 184,028 | |||||||
| Semtech Corp. | (79,518 | ) | (1,549,011 | ) | 44,530 | |||||||
| Service Corp. International | (31,819 | ) | (821,567 | ) | (6,364 | ) | ||||||
| ServiceNow, Inc. | (24,556 | ) | (2,143,002 | ) | 17,435 | |||||||
| Signet Jewelers Ltd. | (13,847 | ) | (1,612,068 | ) | (100,668 | ) | ||||||
| Silicon Laboratories, Inc. | (11,406 | ) | (580,337 | ) | 26,690 | |||||||
| Sirius XM Holdings, Inc. | (1,892,673 | ) | (7,608,545 | ) | (94,634 | ) | ||||||
| Six Flags Entertainment Corp. | (69,759 | ) | (3,715,364 | ) | (117,195 | ) | ||||||
| SLM Corp. | (428,958 | ) | (2,779,648 | ) | (17,158 | ) | ||||||
| Sotheby’s | (81,586 | ) | (2,160,397 | ) | 58,742 | |||||||
| Southern Co./The | (43,070 | ) | (2,003,186 | ) | (12,060 | ) | ||||||
| Southwestern Energy Co. | (579,686 | ) | (2,985,383 | ) | (1,136,185 | ) | ||||||
| Spectra Energy Corp. | (207,834 | ) | (4,767,712 | ) | (207,834 | ) | ||||||
| Spirit Airlines, Inc. | (62,079 | ) | (2,509,854 | ) | 36,006 | |||||||
| REFERENCE ENTITY | SHARES | NOTIONAL (a) | NET UNREALIZED APPRECIATION (DEPRECIATION) | |||||||||
| United States (continued) | ||||||||||||
| Splunk, Inc. | (141,923 | ) | $ | (7,706,419 | ) | $ | (640,073 | ) | ||||
| Sprint Corp. | (213,822 | ) | (769,759 | ) | (4,276 | ) | ||||||
| Sprouts Farmers Market, Inc. | (413,586 | ) | (10,625,024 | ) | (372,227 | ) | ||||||
| SPX Corp. | (23,366 | ) | (213,098 | ) | (4,907 | ) | ||||||
| Starbucks Corp. | (26,945 | ) | (1,603,632 | ) | (13,877 | ) | ||||||
| Stericycle, Inc. | (9,975 | ) | (1,183,634 | ) | (19,352 | ) | ||||||
| Stifel Financial Corp. | (6,127 | ) | (261,929 | ) | 2,390 | |||||||
| SunEdison, Inc. | (736,290 | ) | (4,601,813 | ) | 854,096 | |||||||
| SunPower Corp. | (45,304 | ) | (1,253,109 | ) | (106,464 | ) | ||||||
| SVB Financial Group | (11,473 | ) | (1,405,787 | ) | 41,647 | |||||||
| Synovus Financial Corp. | (93,381 | ) | (3,014,339 | ) | (9,338 | ) | ||||||
| T Rowe Price Group, Inc. | (12,244 | ) | (869,446 | ) | (5,877 | ) | ||||||
| Tableau Software, Inc. | (39,759 | ) | (3,586,659 | ) | (159,434 | ) | ||||||
| Targa Resources Corp. | (124,632 | ) | (3,292,777 | ) | (79,764 | ) | ||||||
| TCF Financial Corp. | (31,329 | ) | (446,438 | ) | 4,073 | |||||||
| Teekay Corp. | (113,180 | ) | (822,819 | ) | (294,268 | ) | ||||||
| Tempur Sealy International, Inc. | (75,389 | ) | (5,569,739 | ) | 257,830 | |||||||
| Tenet Healthcare Corp. | (272,686 | ) | (7,534,314 | ) | (728,072 | ) | ||||||
| Teradata Corp. | (138,242 | ) | (3,707,650 | ) | 55,297 | |||||||
| TerraForm Power, Inc. | (160,448 | ) | (1,987,951 | ) | (30,485 | ) | ||||||
| Texas Instruments, Inc. | (30,077 | ) | (1,700,253 | ) | 51,732 | |||||||
| Tiffany & Co. | (102,876 | ) | (7,533,609 | ) | (314,801 | ) | ||||||
| T-Mobile US, Inc. | (47,874 | ) | (1,876,661 | ) | 3,830 | |||||||
| Toll Brothers, Inc. | (28,044 | ) | (950,131 | ) | 16,266 | |||||||
| TransDigm Group, Inc. | (15,548 | ) | (3,415,585 | ) | (136,356 | ) | ||||||
| TreeHouse Foods, Inc. | (23,735 | ) | (1,912,804 | ) | 50,556 | |||||||
| TRI Pointe Group, Inc. | (16,207 | ) | (206,315 | ) | 972 | |||||||
| Trimble Navigation Ltd. | (440,808 | ) | (9,666,919 | ) | 211,588 | |||||||
| TripAdvisor, Inc. | (58,793 | ) | (5,019,746 | ) | 7,643 | |||||||
| Triumph Group, Inc. | (15,871 | ) | (538,979 | ) | (91,893 | ) | ||||||
| Twenty-First Century Fox, Inc. | (82,780 | ) | (2,275,622 | ) | 27,317 | |||||||
| Twitter, Inc. | (253,360 | ) | (5,905,822 | ) | 43,071 | |||||||
| Tyco International PLC | (128,109 | ) | (4,007,250 | ) | (78,146 | ) | ||||||
| Ulta Salon Cosmetics & Fragrance, Inc. | (8,246 | ) | (1,529,056 | ) | 3,546 | |||||||
| Ultimate Software Group, Inc./The | (1,836 | ) | (364,042 | ) | 5,086 | |||||||
| Umpqua Holdings Corp. | (124,033 | ) | (2,013,056 | ) | 40,931 | |||||||
| Under Armour, Inc. | (26,720 | ) | (2,171,534 | ) | 17,635 | |||||||
| Union Pacific Corp. | (137,738 | ) | (10,651,280 | ) | (119,832 | ) | ||||||
| United Continental Holdings, Inc. | (12,968 | ) | (743,326 | ) | 259 | |||||||
| United Natural Foods, Inc. | (20,382 | ) | (822,618 | ) | 20,382 | |||||||
| United Rentals, Inc. | (73,169 | ) | (4,895,006 | ) | (412,673 | ) | ||||||
| United Technologies Corp. | (72,911 | ) | (6,844,156 | ) | (160,404 | ) | ||||||
| Urban Outfitters, Inc. | (108,381 | ) | (2,496,014 | ) | 30,347 | |||||||
| USG Corp. | (311,555 | ) | (7,614,404 | ) | 46,733 | |||||||
| Vantiv, Inc. | (7,038 | ) | (341,625 | ) | 7,883 | |||||||
| Varian Medical Systems, Inc. | (2,666 | ) | (209,148 | ) | (6,265 | ) | ||||||
| The accompanying notes are an integral part of these financial statements. | (Continued) |
| AQR Funds | Annual Report | December 2015 | ||||||||||||||
279
Table of Contents
| Consolidated Schedule of Investments | December 31, 2015 |
| AQR STYLE PREMIA ALTERNATIVE FUND |
| REFERENCE ENTITY | SHARES | NOTIONAL (a) | NET UNREALIZED APPRECIATION (DEPRECIATION) | |||||||||
| United States (continued) | ||||||||||||
| VCA, Inc. | (4,050 | ) | $ | (217,607 | ) | $ | (5,144 | ) | ||||
| Veeva Systems, Inc. | (104,230 | ) | (2,905,932 | ) | (101,103 | ) | ||||||
| VeriFone Systems, Inc. | (170,283 | ) | (4,590,830 | ) | (180,500 | ) | ||||||
| Verisk Analytics, Inc. | (11,194 | ) | (860,931 | ) | 336 | |||||||
| Vertex Pharmaceuticals, Inc. | (82,303 | ) | (9,706,816 | ) | (649,371 | ) | ||||||
| Viacom, Inc. | (77,329 | ) | (3,077,694 | ) | (105,167 | ) | ||||||
| Viavi Solutions, Inc. | (569,147 | ) | (3,375,042 | ) | (91,064 | ) | ||||||
| Vista Outdoor, Inc. | (4,858 | ) | (208,165 | ) | (8,064 | ) | ||||||
| Visteon Corp. | (55,901 | ) | (6,437,000 | ) | 36,336 | |||||||
| Waddell & Reed Financial, Inc. | (62,384 | ) | (1,829,723 | ) | 41,797 | |||||||
| Walgreens Boots Alliance, Inc. | (13,274 | ) | (1,106,255 | ) | (24,092 | ) | ||||||
| Watsco, Inc. | (1,704 | ) | (202,554 | ) | 2,965 | |||||||
| Webster Financial Corp. | (7,157 | ) | (271,179 | ) | 5,010 | |||||||
| WEC Energy Group, Inc. | (131,797 | ) | (6,755,914 | ) | (6,590 | ) | ||||||
| WellCare Health Plans, Inc. | (17,463 | ) | (1,408,391 | ) | 42,610 | |||||||
| WESCO International, Inc. | (15,695 | ) | (628,428 | ) | (57,130 | ) | ||||||
| WEX, Inc. | (22,046 | ) | (1,906,759 | ) | (42,108 | ) | ||||||
| WhiteWave Foods Co./The | (218,537 | ) | (8,341,557 | ) | (161,717 | ) | ||||||
| Whiting Petroleum Corp. | (481,388 | ) | (4,679,091 | ) | 134,789 | |||||||
| Whole Foods Market, Inc. | (83,046 | ) | (2,772,075 | ) | (9,966 | ) | ||||||
| WisdomTree Investments, Inc. | (388,209 | ) | (6,300,632 | ) | 213,515 | |||||||
| Workday, Inc. | (75,105 | ) | (6,047,455 | ) | 63,088 | |||||||
| REFERENCE ENTITY | SHARES | NOTIONAL (a) | NET UNREALIZED APPRECIATION (DEPRECIATION) | |||||||||
| United States (continued) | ||||||||||||
| Worthington Industries, Inc. | (23,226 | ) | $ | (683,773 | ) | $ | (16,258 | ) | ||||
| WPX Energy, Inc. | (44,166 | ) | (251,746 | ) | (1,767 | ) | ||||||
| WR Grace & Co. | (64,641 | ) | (6,260,481 | ) | (177,116 | ) | ||||||
| WW Grainger, Inc. | (3,431 | ) | (668,530 | ) | (26,556 | ) | ||||||
| Xylem, Inc. | (35,855 | ) | (1,307,273 | ) | (1,434 | ) | ||||||
| Yahoo!, Inc. | (268,461 | ) | (8,920,959 | ) | (8,054 | ) | ||||||
| Yelp, Inc. | (47,242 | ) | (1,295,376 | ) | (65,194 | ) | ||||||
| Yum! Brands, Inc. | (75,376 | ) | (5,442,147 | ) | (64,070 | ) | ||||||
| Zions Bancorporation | (264,635 | ) | (7,346,268 | ) | 121,732 | |||||||
| Zoetis, Inc. | (75,413 | ) | (3,524,049 | ) | (89,741 | ) | ||||||
| Zynga, Inc. | (1,320,446 | ) | (3,433,160 | ) | (105,636 | ) | ||||||
|
| |||||||||||
| (21,973,463 | ) | |||||||||||
|
| |||||||||||
Total of Short Equity Positions | (22,220,034 | ) | ||||||||||
|
| |||||||||||
Total of Long and Short Equity Positions | (18,314,534 | ) | ||||||||||
|
| |||||||||||
Net Cash and Other Receivables/ (Payables) (b) | 931,740 | |||||||||||
|
| |||||||||||
Swaps, at Value | $ | (17,382,794 | ) | |||||||||
|
| |||||||||||
| (a) | Notional value represents the market value (including any fees or commissions) of the long and short positions when they are established. |
| (b) | Cash and other receivables/(payables) includes the gains (or losses) realized within the swap when the swap resets. |
| The accompanying notes are an integral part of these financial statements. | (Continued) |
| AQR Funds | Annual Report | December 2015 | ||||||||||||||
280
Table of Contents
| Consolidated Schedule of Investments | December 31, 2015 |
| AQR STYLE PREMIA ALTERNATIVE FUND |
Total Return Basket Swaps Outstanding at December 31, 2015
| COUNTERPARTY | DESCRIPTION | TERMINATION DATE** | VALUE (Note 5) | |||||
| Goldman Sachs | The Fund receives the total return on a portfolio of long and short positions and pays or receives the LIBOR plus or minus a specified spread, which is denominated in GBP based on the local currencies of the positions within the swaps. | 2-61 months maturity ranging from 01/20/2016 - 12/21/2020 | $(262,903 | ) | ||||
|
| |||||||
| ** | The maturity dates are measured from the commencement of investment in each underlying swap position. |
Additional Information — Total Return Basket Swap
The following table represents the individual long and short positions and related values within the total return basket swap as of December 31, 2015.
| REFERENCE ENTITY | SHARES | NOTIONAL (a) | NET UNREALIZED APPRECIATION (DEPRECIATION) | |||||||||
| Long Positions | ||||||||||||
| Common Stocks | ||||||||||||
| Germany | ||||||||||||
| TUI AG | 45,486 | $ | 819,422 | $ | (7,266 | ) | ||||||
|
| |||||||||||
| Ireland | ||||||||||||
| DCC PLC | 29,009 | 2,390,513 | 32,956 | |||||||||
| Shire PLC | 53,568 | 3,512,996 | 162,166 | |||||||||
|
| |||||||||||
| 195,122 | ||||||||||||
|
| |||||||||||
| Luxembourg | ||||||||||||
| Regus PLC | 59,982 | 290,887 | 3,839 | |||||||||
|
| |||||||||||
| South Africa | ||||||||||||
| Investec PLC | 139,932 | 968,316 | 18,344 | |||||||||
| Mondi PLC | 142,685 | 2,828,977 | (32,246 | ) | ||||||||
|
| |||||||||||
| (13,902 | ) | |||||||||||
|
| |||||||||||
| Switzerland | ||||||||||||
| Glencore PLC | 926,264 | 1,103,135 | 124,284 | |||||||||
| Wolseley PLC | 23,556 | 1,284,959 | (5,565 | ) | ||||||||
|
| |||||||||||
| 118,719 | ||||||||||||
|
| |||||||||||
| United Kingdom | ||||||||||||
| AA PLC | 64,467 | 281,682 | 16,127 | |||||||||
| Amlin PLC | 80,877 | 789,294 | 1,512 | |||||||||
| Ashtead Group PLC | 121,369 | 2,016,813 | (19,341 | ) | ||||||||
| Associated British Foods PLC | 60,848 | 3,054,154 | (59,997 | ) | ||||||||
| Aviva PLC | 423,396 | 3,157,804 | 55,973 | |||||||||
| Babcock International Group PLC | 74,445 | 1,090,738 | 23,343 | |||||||||
| BAE Systems PLC | 356,845 | 2,610,704 | 16,573 | |||||||||
| Barclays PLC | 169,596 | 546,938 | (1,048 | ) | ||||||||
| Barratt Developments PLC | 601,029 | 5,449,046 | 89,264 | |||||||||
| Berkeley Group Holdings PLC | 58,020 | 3,066,453 | 87,718 | |||||||||
| Betfair Group PLC | 6,456 | 363,990 | 7,211 | |||||||||
| Britvic PLC | 47,309 | 492,939 | 13,940 | |||||||||
| BT Group PLC | 904,372 | 6,276,850 | 2,725 | |||||||||
| REFERENCE ENTITY | SHARES | NOTIONAL (a) | NET UNREALIZED APPRECIATION (DEPRECIATION) | |||||||||
| United Kingdom (continued) | ||||||||||||
| Bunzl PLC | 67,602 | $ | 1,846,449 | $ | 29,124 | |||||||
| Close Brothers Group PLC | 80,590 | 1,600,414 | (11,220 | ) | ||||||||
| Cobham PLC | 78,656 | 331,790 | (3,332 | ) | ||||||||
| Compass Group PLC | 106,732 | 1,813,908 | 35,568 | |||||||||
| Direct Line Insurance Group PLC | 665,306 | 4,000,475 | (12,557 | ) | ||||||||
| Dixons Carphone PLC | 200,889 | 1,445,131 | 33,228 | |||||||||
| easyJet PLC | 147,029 | 3,717,111 | 53,739 | |||||||||
| G4S PLC | 227,726 | 723,412 | 33,046 | |||||||||
| GKN PLC | 371,822 | 1,641,959 | 45,320 | |||||||||
| Greene King PLC | 70,061 | 960,037 | (900 | ) | ||||||||
| Hays PLC | 98,138 | 204,489 | 6,277 | |||||||||
| Henderson Group PLC | 75,682 | 335,787 | 8,189 | |||||||||
| Howden Joinery Group PLC | 196,250 | 1,517,485 | 3,069 | |||||||||
| HSBC Holdings PLC | 521,718 | 4,089,254 | 29,300 | |||||||||
| ICAP PLC | 45,512 | 337,422 | 4,195 | |||||||||
| Imperial Tobacco Group PLC | 131,144 | 6,798,956 | 127,762 | |||||||||
| Inchcape PLC | 187,366 | 2,118,297 | 43,471 | |||||||||
| Indivior PLC | 669,688 | 1,875,979 | (25,334 | ) | ||||||||
| Inmarsat PLC | 100,039 | 1,666,477 | 10,621 | |||||||||
| Intermediate Capital Group PLC | 387,240 | 3,447,529 | 122,262 | |||||||||
| International Consolidated Airlines Group SA | 782,035 | 6,899,084 | 132,247 | |||||||||
| ITV PLC | 677,357 | 2,670,418 | 87,340 | |||||||||
| J Sainsbury PLC | 135,075 | 509,237 | 5,156 | |||||||||
| Just Eat PLC | 107,764 | 743,647 | 38,822 | |||||||||
| Kingfisher PLC | 458,252 | 2,225,333 | (5,797 | ) | ||||||||
| Legal & General Group PLC | 197,621 | 767,230 | 12,563 | |||||||||
| Man Group PLC | 1,843,419 | 4,594,344 | 147,867 | |||||||||
| Marks & Spencer Group PLC | 276,489 | 1,866,866 | (25,948 | ) | ||||||||
| Meggitt PLC | 62,684 | 335,170 | 10,925 | |||||||||
| The accompanying notes are an integral part of these financial statements. | (Continued) |
| AQR Funds | Annual Report | December 2015 | ||||||||||||||
281
Table of Contents
| Consolidated Schedule of Investments | December 31, 2015 |
| AQR STYLE PREMIA ALTERNATIVE FUND |
| REFERENCE ENTITY | SHARES | NOTIONAL (a) | NET UNREALIZED APPRECIATION (DEPRECIATION) | |||||||||
| United Kingdom (continued) | ||||||||||||
| Merlin Entertainments PLC | 54,844 | $ | 359,079 | $ | 8,654 | |||||||
| Micro Focus International PLC | 32,940 | 744,670 | 28,897 | |||||||||
| National Grid PLC | 417,070 | 5,691,953 | 60,104 | |||||||||
| Next PLC | 17,096 | 1,866,810 | (31,198 | ) | ||||||||
| Pennon Group PLC | 16,419 | 205,218 | 3,081 | |||||||||
| Persimmon PLC | 181,068 | 5,215,014 | 186,850 | |||||||||
| Playtech PLC | 135,760 | 1,619,937 | 42,160 | |||||||||
| Provident Financial PLC | 68,199 | 3,383,823 | (2,335 | ) | ||||||||
| Rentokil Initial PLC | 568,184 | 1,318,266 | 14,830 | |||||||||
| Rexam PLC | 47,938 | 421,150 | 6,433 | |||||||||
| Rightmove PLC | 53,681 | 3,189,186 | 73,009 | |||||||||
| Royal Mail PLC | 279,708 | 1,830,673 | 1,381 | |||||||||
| Sage Group PLC/The | 135,013 | 1,172,098 | 27,501 | |||||||||
| Sky PLC | 332,835 | 5,407,078 | 49,003 | |||||||||
| Smith & Nephew PLC | 36,077 | 595,270 | 47,697 | |||||||||
| SSE PLC | 160,986 | 3,518,400 | 96,340 | |||||||||
| Standard Chartered PLC | 84,252 | 682,755 | 16,297 | |||||||||
| Taylor Wimpey PLC | 2,373,633 | 6,924,801 | 170,851 | |||||||||
| Telecity Group PLC | 13,168 | 238,388 | 4,960 | |||||||||
| Travis Perkins PLC | 40,450 | 1,153,624 | 19,850 | |||||||||
| United Utilities Group PLC | 73,969 | 1,009,086 | 9,416 | |||||||||
| Vodafone Group PLC | 2,664,655 | 8,435,937 | 204,917 | |||||||||
| Whitbread PLC | 24,650 | 1,622,263 | (24,536 | ) | ||||||||
| WPP PLC | 173,381 | 3,910,445 | 77,627 | |||||||||
|
| |||||||||||
| 2,260,792 | ||||||||||||
|
| |||||||||||
Total of Long Equity Positions | 2,557,304 | |||||||||||
|
| |||||||||||
| Short Positions | ||||||||||||
| Common Stocks | ||||||||||||
| Australia | ||||||||||||
| BHP Billiton PLC | (133,123 | ) | (1,372,623 | ) | (111,941 | ) | ||||||
|
| |||||||||||
| Chile | ||||||||||||
| Antofagasta PLC | (183,447 | ) | (1,121,286 | ) | (140,610 | ) | ||||||
|
| |||||||||||
| Ireland | ||||||||||||
| Experian PLC | (202,440 | ) | (3,484,736 | ) | (93,272 | ) | ||||||
|
| |||||||||||
| Netherlands | ||||||||||||
| Royal Dutch Shell PLC | (183,367 | ) | (3,917,109 | ) | (235,999 | ) | ||||||
|
| |||||||||||
| Switzerland | ||||||||||||
| Coca-Cola HBC AG | (22,660 | ) | (503,240 | ) | 20,680 | |||||||
|
| |||||||||||
| United Kingdom | ||||||||||||
| Aberdeen Asset Management PLC | (234,068 | ) | (997,370 | ) | (46 | ) | ||||||
| Admiral Group PLC | (86,740 | ) | (2,142,251 | ) | 22,705 | |||||||
| Aggreko PLC | (14,692 | ) | (197,941 | ) | 162 | |||||||
| Amec Foster Wheeler PLC | (97,052 | ) | (561,212 | ) | (51,444 | ) | ||||||
| REFERENCE ENTITY | SHARES | NOTIONAL (a) | NET UNREALIZED APPRECIATION (DEPRECIATION) | |||||||||
| United Kingdom (continued) | ||||||||||||
| Anglo American PLC | (384,507 | ) | $ | (1,491,516 | ) | $ | (195,398 | ) | ||||
| ARM Holdings PLC | (199,083 | ) | (3,052,657 | ) | 18,229 | |||||||
| ASOS PLC | (74,134 | ) | (3,563,789 | ) | (202,939 | ) | ||||||
| AstraZeneca PLC | (83,589 | ) | (5,462,630 | ) | (183,585 | ) | ||||||
| Balfour Beatty PLC | (51,134 | ) | (198,968 | ) | (4,698 | ) | ||||||
| Booker Group PLC | (243,742 | ) | (640,257 | ) | (10,260 | ) | ||||||
| BP PLC | (1,052,016 | ) | (5,277,013 | ) | (189,983 | ) | ||||||
| British American Tobacco PLC | (130,602 | ) | (7,185,773 | ) | (67,082 | ) | ||||||
| BTG PLC | (46,436 | ) | (451,357 | ) | (19,175 | ) | ||||||
| Burberry Group PLC | (136,391 | ) | (2,414,874 | ) | 15,207 | |||||||
| Capita PLC | (109,779 | ) | (1,958,286 | ) | 5,042 | |||||||
| Centrica PLC | (1,891,572 | ) | (5,951,917 | ) | (121,869 | ) | ||||||
| Croda International PLC | (16,265 | ) | (722,146 | ) | (6,606 | ) | ||||||
| Diageo PLC | (409,732 | ) | (11,074,223 | ) | (114,639 | ) | ||||||
| Drax Group PLC | (840,877 | ) | (2,793,172 | ) | (234,308 | ) | ||||||
| DS Smith PLC | (77,472 | ) | (457,156 | ) | 3,978 | |||||||
| GlaxoSmithKline PLC | (341,175 | ) | (6,745,857 | ) | (144,459 | ) | ||||||
| Hargreaves Lansdown PLC | (329,982 | ) | (7,169,743 | ) | (156,062 | ) | ||||||
| IMI PLC | (157,284 | ) | (1,978,718 | ) | (17,102 | ) | ||||||
| InterContinental Hotels Group PLC | (9,243 | ) | (350,689 | ) | (9,589 | ) | ||||||
| Intertek Group PLC | (42,095 | ) | (1,698,926 | ) | (23,036 | ) | ||||||
| John Wood Group PLC | (42,573 | ) | (373,373 | ) | (10,049 | ) | ||||||
| Johnson Matthey PLC | (13,057 | ) | (503,457 | ) | (7,305 | ) | ||||||
| Lloyds Banking Group PLC | (4,800,885 | ) | (5,047,211 | ) | (118,517 | ) | ||||||
| Melrose Industries PLC | (198,049 | ) | (832,501 | ) | (15,830 | ) | ||||||
| Ocado Group PLC | (280,450 | ) | (1,399,054 | ) | 146,079 | |||||||
| Old Mutual PLC | (1,248,798 | ) | (3,161,284 | ) | (123,881 | ) | ||||||
| Pearson PLC | (38,829 | ) | (430,207 | ) | 10,448 | |||||||
| Petrofac Ltd. | (233,579 | ) | (2,717,311 | ) | (22,500 | ) | ||||||
| Prudential PLC | (208,744 | ) | (4,626,172 | ) | (76,724 | ) | ||||||
| Reckitt Benckiser Group PLC | (29,734 | ) | (2,706,377 | ) | (44,801 | ) | ||||||
| Rio Tinto PLC | (82,870 | ) | (2,270,080 | ) | (142,703 | ) | ||||||
| Rolls-Royce Holdings PLC (3) | (16,642,338 | ) | 1,084 | (25,618 | ) | |||||||
| Rolls-Royce Holdings PLC | (200,281 | ) | (1,692,892 | ) | (3,573 | ) | ||||||
| Rotork PLC | (90,699 | ) | (234,530 | ) | (9,556 | ) | ||||||
| Royal Bank of Scotland Group PLC | (878,157 | ) | (3,814,321 | ) | (89,141 | ) | ||||||
| RSA Insurance Group PLC | (335,705 | ) | (2,099,036 | ) | (7,965 | ) | ||||||
| SABMiller PLC | (131,262 | ) | (7,836,841 | ) | (15,781 | ) | ||||||
| Serco Group PLC | (2,286,840 | ) | (3,161,179 | ) | (21,078 | ) | ||||||
| Severn Trent PLC | (20,770 | ) | (661,930 | ) | (2,016 | ) | ||||||
| Smiths Group PLC | (17,401 | ) | (237,752 | ) | (2,885 | ) | ||||||
| Spectris PLC | (7,836 | ) | (202,097 | ) | (5,861 | ) | ||||||
| Spirax-Sarco Engineering PLC | (6,624 | ) | (301,716 | ) | (18,639 | ) | ||||||
| The accompanying notes are an integral part of these financial statements. | (Continued) |
| AQR Funds | Annual Report | December 2015 | ||||||||||||||
282
Table of Contents
| Consolidated Schedule of Investments | December 31, 2015 |
| AQR STYLE PREMIA ALTERNATIVE FUND |
| REFERENCE ENTITY | SHARES | NOTIONAL (a) | NET UNREALIZED APPRECIATION (DEPRECIATION) | |||||||||
| United Kingdom (continued) | ||||||||||||
| Sports Direct International PLC | (108,334 | ) | $ | (920,876 | ) | $ | 242 | |||||
| St. James’s Place PLC | (195,697 | ) | (2,851,593 | ) | (48,964 | ) | ||||||
| Standard Life PLC | (491,023 | ) | (2,730,218 | ) | (81,631 | ) | ||||||
| Tate & Lyle PLC | (37,934 | ) | (329,345 | ) | (4,791 | ) | ||||||
| Tesco PLC | (6,798,938 | ) | (14,514,226 | ) | (424,917 | ) | ||||||
| Thomas Cook Group PLC | (907,718 | ) | (1,585,514 | ) | (34,121 | ) | ||||||
| Weir Group PLC/The | (117,801 | ) | (1,646,063 | ) | (84,292 | ) | ||||||
| William Hill PLC | (129,126 | ) | (723,131 | ) | (30,461 | ) | ||||||
| WM Morrison Supermarkets PLC | (583,959 | ) | (1,276,398 | ) | 4,022 | |||||||
|
| |||||||||||
| (2,999,766 | ) | |||||||||||
|
| |||||||||||
Total of Short Equity Positions | (3,560,908 | ) | ||||||||||
|
| |||||||||||
Total of Long and Short Equity Positions | (1,003,604 | ) | ||||||||||
|
| |||||||||||
Net Cash and Other Receivables/ (Payables) (b) | 740,701 | |||||||||||
|
| |||||||||||
Swaps, at Value | $ | (262,903 | ) | |||||||||
|
| |||||||||||
| (a) | Notional value represents the market value (including any fees or commissions) of the long and short positions when they are established. |
| (b) | Cash and other receivables/(payables) includes the gains (or losses) realized within the swap when the swap resets. |
| (3) | Level 3 security (See Note 5) |
Total Return Basket Swaps Outstanding at December 31, 2015
| COUNTERPARTY | DESCRIPTION | TERMINATION DATE** | VALUE (Note 5) | |||||
| Goldman Sachs | The Fund receives the total return on a portfolio of long and short positions and pays or receives the Euro Interbank Offered Rate plus or minus a specified spread, which is denominated in EUR based on the local currencies of the positions within the swaps. | 1-61 months maturity ranging from 01/14/2016 - 12/21/2020 | $(524,571 | ) | ||||
|
| |||||||
| ** | The maturity dates are measured from the commencement of investment in each underlying swap position. |
Additional Information — Total Return Basket Swap
The following table represents the individual long and short positions and related values within the total return basket swap as of December 31, 2015.
| REFERENCE ENTITY | SHARES | NOTIONAL (a) | NET UNREALIZED APPRECIATION (DEPRECIATION) | |||||||||
| Long Positions | ||||||||||||
| Common Stocks | ||||||||||||
| France | ||||||||||||
| Aeroports de Paris | 6,125 | $ | 712,478 | $ | 280 | |||||||
| Air Liquide SA | 19,385 | 2,231,966 | (55,678 | ) | ||||||||
| Atos SE | 16,853 | 1,445,799 | (30,948 | ) | ||||||||
| AXA SA | 76,381 | 2,084,653 | 2,349 | |||||||||
| REFERENCE ENTITY | SHARES | NOTIONAL (a) | NET UNREALIZED APPRECIATION (DEPRECIATION) | |||||||||
| France (continued) | ||||||||||||
| BNP Paribas SA | 52,948 | $ | 3,066,245 | $ | (70,589 | ) | ||||||
| Cap Gemini SA | 56,685 | 5,323,478 | (63,925 | ) | ||||||||
| Christian Dior SE | 9,140 | 1,605,535 | (52,992 | ) | ||||||||
| Cie Generale des Etablissements Michelin | 50,507 | 4,832,328 | (24,941 | ) | ||||||||
| CNP Assurances | 15,830 | 208,143 | 5,393 | |||||||||
| The accompanying notes are an integral part of these financial statements. | (Continued) |
| AQR Funds | Annual Report | December 2015 | ||||||||||||||
283
Table of Contents
| Consolidated Schedule of Investments | December 31, 2015 |
| AQR STYLE PREMIA ALTERNATIVE FUND |
| REFERENCE ENTITY | SHARES | NOTIONAL (a) | NET UNREALIZED APPRECIATION (DEPRECIATION) | |||||||||
| France (continued) | ||||||||||||
| Credit Agricole SA | 103,348 | $ | 1,195,943 | $ | 21,924 | |||||||
| Danone SA | 6,562 | 450,081 | (6,664 | ) | ||||||||
| Dassault Systemes | 13,349 | 1,084,200 | (17,203 | ) | ||||||||
| Eiffage SA | 11,609 | 737,825 | 12,443 | |||||||||
| Electricite de France SA | 141,987 | 1,991,075 | 100,036 | |||||||||
| Eutelsat Communications SA | 59,858 | 1,826,569 | (34,394 | ) | ||||||||
| Imerys SA | 11,998 | 805,810 | 32,266 | |||||||||
| Ingenico Group | 1,667 | 214,646 | (4,235 | ) | ||||||||
| Ipsen SA | 6,671 | 433,901 | 8,104 | |||||||||
| Lagardere SCA | 37,991 | 1,119,379 | 14,327 | |||||||||
| L’Oreal SA | 41,700 | 7,289,859 | (275,716 | ) | ||||||||
| Orpea | 5,960 | 481,792 | (4,598 | ) | ||||||||
| Peugeot SA | 243,647 | 4,273,771 | (2,901 | ) | ||||||||
| Publicis Groupe SA | 5,237 | 343,479 | 4,757 | |||||||||
| Rexel SA | 27,364 | 352,443 | 11,930 | |||||||||
| Safran SA | 19,162 | 1,344,614 | (28,131 | ) | ||||||||
| Sanofi | 63,314 | 5,463,136 | (67,405 | ) | ||||||||
| SCOR SE | 95,412 | 3,618,260 | (48,159 | ) | ||||||||
| SEB SA | 14,282 | 1,480,282 | (14,075 | ) | ||||||||
| Societe BIC SA | 12,134 | 2,028,533 | (31,823 | ) | ||||||||
| Societe Generale SA | 99,620 | 4,676,177 | (85,473 | ) | ||||||||
| Societe Television Francaise 1 | 17,819 | 197,584 | �� | 274 | ||||||||
| Sodexo SA | 3,778 | 377,298 | (8,199 | ) | ||||||||
| Suez Environnement Co. | 107,667 | 2,059,741 | (46,009 | ) | ||||||||
| Teleperformance | 28,215 | 2,394,850 | (22,323 | ) | ||||||||
| Thales SA | 50,371 | 3,883,954 | (113,698 | ) | ||||||||
| Valeo SA | 10,734 | 1,626,561 | 28,351 | |||||||||
| Veolia Environnement SA | 68,235 | 1,637,895 | (18,967 | ) | ||||||||
| Vinci SA | 54,301 | 3,490,888 | (10,478 | ) | ||||||||
| Vivendi SA | 123,269 | 2,601,779 | 45,675 | |||||||||
|
| |||||||||||
| (851,415 | ) | |||||||||||
|
| |||||||||||
| Luxembourg | ||||||||||||
| SES SA | 20,614 | 561,092 | 10,116 | |||||||||
|
| |||||||||||
Total of Long Equity Positions | (841,299 | ) | ||||||||||
|
| |||||||||||
| REFERENCE ENTITY | SHARES | NOTIONAL (a) | NET UNREALIZED APPRECIATION (DEPRECIATION) | |||||||||
| Short Positions | ||||||||||||
| Common Stocks | ||||||||||||
| France | ||||||||||||
| Accor SA | (6,449 | ) | $ | (282,368 | ) | $ | 3,062 | |||||
| Airbus Group SE | (48,017 | ) | (3,398,845 | ) | 163,105 | |||||||
| Arkema SA | (12,221 | ) | (867,617 | ) | 12,164 | |||||||
| Bollore SA | (564,491 | ) | (2,605,636 | ) | (24,686 | ) | ||||||
| Bureau Veritas SA | (48,872 | ) | (984,640 | ) | 10,553 | |||||||
| Carrefour SA | (64,030 | ) | (1,894,717 | ) | 46,837 | |||||||
| Casino Guichard Perrachon SA | (82,369 | ) | (3,879,729 | ) | 95,642 | |||||||
| Cie de Saint-Gobain | (50,148 | ) | (2,163,398 | ) | (9,780 | ) | ||||||
| Edenred | (60,853 | ) | (1,137,280 | ) | (13,028 | ) | ||||||
| Engie | (178,462 | ) | (3,157,134 | ) | (4,003 | ) | ||||||
| Essilor International SA | (3,664 | ) | (463,467 | ) | 6,801 | |||||||
| Faurecia | (6,451 | ) | (254,526 | ) | (3,964 | ) | ||||||
| Hermes International | (8,370 | ) | (2,902,670 | ) | 73,400 | |||||||
| Iliad SA | (15,338 | ) | (3,603,408 | ) | (52,838 | ) | ||||||
| Kering | (3,637 | ) | (625,811 | ) | 3,975 | |||||||
| Legrand SA | (5,705 | ) | (325,769 | ) | 3,064 | |||||||
| LVMH Moet Hennessy Louis Vuitton SE | (13,464 | ) | (2,178,570 | ) | 63,776 | |||||||
| Orange SA | (108,062 | ) | (1,837,756 | ) | 30,340 | |||||||
| Plastic Omnium SA | (66,130 | ) | (2,048,129 | ) | (53,930 | ) | ||||||
| Remy Cointreau SA | (50,412 | ) | (3,544,087 | ) | (66,689 | ) | ||||||
| Renault SA | (15,417 | ) | (1,531,561 | ) | (11,611 | ) | ||||||
| Schneider Electric SE | (57,325 | ) | (3,330,045 | ) | 73,758 | |||||||
| Technip SA | (117,578 | ) | (5,884,036 | ) | 36,850 | |||||||
| TOTAL SA | (154,818 | ) | (7,050,468 | ) | 109,761 | |||||||
| Vallourec SA | (264,308 | ) | (2,312,711 | ) | (147,935 | ) | ||||||
| Zodiac Aerospace | (38,831 | ) | (943,023 | ) | 18,444 | |||||||
|
| |||||||||||
| 363,068 | ||||||||||||
|
| |||||||||||
Total of Short Equity Positions | 363,068 | |||||||||||
|
| |||||||||||
Total of Long and Short Equity Positions | (478,231 | ) | ||||||||||
|
| |||||||||||
Net Cash and Other Receivables/ (Payables) (b) | (46,340 | ) | ||||||||||
|
| |||||||||||
Swaps, at Value | $ | (524,571 | ) | |||||||||
|
| |||||||||||
| (a) | Notional value represents the market value (including any fees or commissions) of the long and short positions when they are established. |
| (b) | Cash and other receivables/(payables) includes the gains (or losses) realized within the swap when the swap resets. |
| The accompanying notes are an integral part of these financial statements. | (Continued) |
| AQR Funds | Annual Report | December 2015 | ||||||||||||||
284
Table of Contents
| Consolidated Schedule of Investments | December 31, 2015 |
| AQR STYLE PREMIA ALTERNATIVE FUND |
Collateral pledged to, or (received from), each counterparty at December 31, 2015 was as follows:
| COUNTERPARTY | OVER THE COUNTER | EXCHANGE TRADED/ CENTRALLY CLEARED | TOTAL | |||||||||
| Bank of America | ||||||||||||
| Money Market Funds | $5,850,068 | $— | $5,850,068 | |||||||||
| ||||||||||||
| Barclays Capital | ||||||||||||
| Cash | — | 83,202,953 | 83,202,953 | |||||||||
| ||||||||||||
| CitiBank | ||||||||||||
| Money Market Funds | 7,030,000 | — | 7,030,000 | |||||||||
| ||||||||||||
| Credit Suisse International | ||||||||||||
| Cash | (1,120,000 | ) | — | (1,120,000 | ) | |||||||
| ||||||||||||
| Goldman Sachs | ||||||||||||
| Cash | — | 12,884,794 | 12,884,794 | |||||||||
| Money Market Funds | 280,630,000 | — | 280,630,000 | |||||||||
| ||||||||||||
| J.P. Morgan | ||||||||||||
| Cash | — | 28,058,870 | 28,058,870 | |||||||||
| ||||||||||||
| Morgan Stanley and Co., International PLC | ||||||||||||
| Cash | — | 7,042,216 | 7,042,216 | |||||||||
| ||||||||||||
Collateral pledged to, or (received from), each counterparty for the Subsidiary (See Note 2) at December 31, 2015 was as follows:
| COUNTERPARTY | OVER THE COUNTER | EXCHANGE TRADED/ CENTRALLY CLEARED | TOTAL | |||||||||
| CitiBank | ||||||||||||
| Cash | $1,270,000 | $— | $1,270,000 | |||||||||
| ||||||||||||
| Goldman Sachs | ||||||||||||
| Cash | — | 2,227,018 | 2,227,018 | |||||||||
| ||||||||||||
| J.P. Morgan | ||||||||||||
| Cash | — | 4,186,681 | 4,186,681 | |||||||||
| ||||||||||||
| Macquarie Capital | ||||||||||||
| Money Market Funds | 1,910,004 | — | 1,910,004 | |||||||||
| ||||||||||||
| Morgan Stanley and Co., International PLC | ||||||||||||
| Cash | — | 18,753,556 | 18,753,556 | |||||||||
| ||||||||||||
| Societe Generale | ||||||||||||
| Cash | 3,040,000 | — | 3,040,000 | |||||||||
| ||||||||||||
| The accompanying notes are an integral part of these financial statements. |
| AQR Funds | Annual Report | December 2015 | ||||||||||||||
285
Table of Contents
| Consolidated Schedule of Investments | December 31, 2015 |
| AQR STYLE PREMIA ALTERNATIVE LV FUND |
| LONG INVESTMENTS - 109.2% | SHARES | VALUE (Note 5) | ||||||
| COMMON STOCKS - 19.7% | ||||||||
| Belgium - 0.5% | ||||||||
| Ageas (a) | 4,951 | $ | 229,795 | |||||
| bpost SA (a) | 7,864 | 192,962 | ||||||
| Colruyt SA (a) | 1,961 | 100,880 | ||||||
| KBC Groep NV (a) | 5,308 | 331,889 | ||||||
| Proximus (a) | 3,054 | 99,380 | ||||||
|
| |||||||
| 954,906 | ||||||||
|
| |||||||
| Denmark - 0.6% | ||||||||
| AP Moeller - Maersk A/S, Class B (a) | 21 | 27,390 | ||||||
| Danske Bank A/S (a) | 2,992 | 80,282 | ||||||
| DSV A/S (a) | 2,648 | 104,235 | ||||||
| FLSmidth & Co. A/S (a) | 420 | 14,593 | ||||||
| GN Store Nord A/S (a) | 666 | 12,087 | ||||||
| H Lundbeck A/S † | 2,875 | 98,168 | ||||||
| ISS A/S (a) | 5,399 | 194,616 | ||||||
| Jyske Bank A/S †(a) | 2,451 | 110,863 | ||||||
| Novo Nordisk A/S, Class B (a) | 4,581 | 265,232 | ||||||
| TDC A/S | 14,944 | 74,407 | ||||||
| Vestas Wind Systems A/S | 1,461 | 102,034 | ||||||
| William Demant Holding A/S †(a) | 997 | 94,969 | ||||||
|
| |||||||
| 1,178,876 | ||||||||
|
| |||||||
| Finland - 0.4% | ||||||||
| Amer Sports OYJ (a) | 1,884 | 55,005 | ||||||
| Cargotec OYJ, B Shares | 1,316 | 49,093 | ||||||
| Elisa OYJ (a) | 4,006 | 150,725 | ||||||
| Huhtamaki OYJ (a) | 1,096 | 39,771 | ||||||
| Kesko OYJ, B Shares (a) | 2,659 | 93,203 | ||||||
| Metso OYJ (a) | 531 | 11,895 | ||||||
| Neste OYJ (a) | 6,266 | 187,015 | ||||||
| Orion OYJ, Class B (a) | 2,265 | 78,365 | ||||||
| Stora Enso OYJ, R Shares (a) | 6,075 | 54,931 | ||||||
| UPM-Kymmene OYJ (a) | 3,985 | 73,983 | ||||||
|
| |||||||
| 793,986 | ||||||||
|
| |||||||
| Germany - 2.1% | ||||||||
| adidas AG | 577 | 56,003 | ||||||
| Allianz SE (a) | 1,665 | 293,503 | ||||||
| Aurubis AG (a) | 4,248 | 215,102 | ||||||
| Axel Springer SE (a) | 487 | 27,082 | ||||||
| Brenntag AG (a) | 1,374 | 71,596 | ||||||
| Daimler AG (a) | 1,315 | 109,874 | ||||||
| Deutsche Lufthansa AG †(a) | 11,387 | 179,357 | ||||||
| Duerr AG (a) | 265 | 21,031 | ||||||
| Evonik Industries AG (a) | 5,394 | 178,417 | ||||||
| Freenet AG (a) | 6,926 | 233,717 | ||||||
| Fresenius Medical Care AG & Co. KGaA (a) | 1,735 | 145,800 | ||||||
| Hannover Rueck SE (a) | 3,680 | 420,217 | ||||||
| HeidelbergCement AG (a) | 147 | 11,980 | ||||||
| Hella KGaA Hueck & Co. (a) | 3,077 | 127,783 | ||||||
| HOCHTIEF AG (a) | 1,705 | 158,135 | ||||||
| K+S AG (a) | 8,298 | 211,526 | ||||||
| KION Group AG †(a) | 3,224 | 159,871 | ||||||
| Krones AG (a) | 528 | 62,870 | ||||||
| MAN SE (a) | 119 | 11,959 | ||||||
| Merck KGaA (a) | 1,078 | 104,373 | ||||||
| SHARES | VALUE (Note 5) | |||||||
| Germany - 2.1% (continued) | ||||||||
| MTU Aero Engines AG (a) | 348 | $ | 33,918 | |||||
| Muenchener Rueckversicherungs-Gesellschaft AG in Muenchen (a) | 1,527 | 304,235 | ||||||
| OSRAM Licht AG (a) | 2,690 | 112,386 | ||||||
| ProSiebenSat.1 Media SE (a) | 1,700 | 85,767 | ||||||
| Rheinmetall AG | 587 | 39,019 | ||||||
| RHOEN-KLINIKUM AG (a) | 2,769 | 83,066 | ||||||
| Software AG (a) | 3,807 | 108,506 | ||||||
| STADA Arzneimittel AG (a) | 1,912 | 77,102 | ||||||
| Suedzucker AG (a) | 4,514 | 89,469 | ||||||
| Symrise AG (a) | 499 | 33,033 | ||||||
| Talanx AG (a) | 1,972 | 60,648 | ||||||
| United Internet AG (a) | 542 | 29,799 | ||||||
| Zalando SE 144A †(a)(b) | 603 | 23,815 | ||||||
|
| |||||||
| 3,880,959 | ||||||||
|
| |||||||
| Italy - 1.0% | ||||||||
| A2A SpA | 142,743 | 193,282 | ||||||
| Assicurazioni Generali SpA (a) | 761 | 13,901 | ||||||
| Autogrill SpA † | 2,903 | 27,667 | ||||||
| Banca Generali SpA | 1,355 | 42,623 | ||||||
| Banca Popolare di Milano Scarl | 97,782 | 96,849 | ||||||
| Buzzi Unicem SpA | 5,313 | 95,237 | ||||||
| Davide Campari-Milano SpA (a) | 9,089 | 78,582 | ||||||
| Enel SpA | 3,257 | 13,658 | ||||||
| Eni SpA (a) | 4,869 | 72,345 | ||||||
| FinecoBank Banca Fineco SpA | 22,177 | 182,359 | ||||||
| Finmeccanica SpA †(a) | 2,736 | 38,042 | ||||||
| Intesa Sanpaolo SpA | 12,873 | 42,751 | ||||||
| Mediobanca SpA (a) | 29,864 | 286,278 | ||||||
| Prysmian SpA (a) | 4,287 | 93,667 | ||||||
| Recordati SpA | 8,361 | 218,146 | ||||||
| Snam SpA (a) | 14,914 | 77,835 | ||||||
| Terna Rete Elettrica Nazionale SpA (a) | 34,054 | 175,136 | ||||||
| UnipolSai SpA | 22,779 | 57,952 | ||||||
|
| |||||||
| 1,806,310 | ||||||||
|
| |||||||
| Japan - 11.2% | ||||||||
| ABC-Mart, Inc. (a) | 1,500 | 82,107 | ||||||
| Air Water, Inc. (a) | 2,000 | 32,167 | ||||||
| Aisin Seiki Co., Ltd. (a) | 1,000 | 43,038 | ||||||
| Ajinomoto Co., Inc. (a) | 1,000 | 23,676 | ||||||
| Alfresa Holdings Corp. (a) | 12,700 | 250,829 | ||||||
| Alps Electric Co., Ltd. | 2,200 | 59,660 | ||||||
| Amada Holdings Co., Ltd. | 7,100 | 67,753 | ||||||
| ANA Holdings, Inc. (a) | 146,000 | 421,225 | ||||||
| Aozora Bank Ltd. (a) | 102,000 | 355,962 | ||||||
| Asahi Group Holdings Ltd. (a) | 1,800 | 56,348 | ||||||
| Asahi Kasei Corp. (a) | 19,000 | 128,480 | ||||||
| Astellas Pharma, Inc. (a) | 6,700 | 95,380 | ||||||
| Bandai Namco Holdings, Inc. (a) | 10,700 | 226,060 | ||||||
| Bank of Yokohama Ltd./The (a) | 4,000 | 24,518 | ||||||
| Benesse Holdings, Inc. (a) | 800 | 23,038 | ||||||
| Bridgestone Corp. (a) | 9,500 | 325,863 | ||||||
| Brother Industries Ltd. (a) | 6,300 | 72,373 | ||||||
| Canon, Inc. (a) | 2,700 | 81,675 | ||||||
| Central Japan Railway Co. (a) | 1,300 | 230,794 | ||||||
| Century Tokyo Leasing Corp. (a) | 1,500 | 53,582 | ||||||
| The accompanying notes are an integral part of these financial statements. | (Continued) |
| AQR Funds | Annual Report | December 2015 | ||||||||||||||
286
Table of Contents
| Consolidated Schedule of Investments | December 31, 2015 |
| AQR STYLE PREMIA ALTERNATIVE LV FUND |
| SHARES | VALUE (Note 5) | |||||||
| Japan - 11.2% (continued) | ||||||||
| Chubu Electric Power Co., Inc. (a) | 16,300 | $ | 223,208 | |||||
| Chugoku Bank Ltd./The (a) | 7,000 | 93,406 | ||||||
| Citizen Holdings Co., Ltd. (a) | 7,500 | 53,905 | ||||||
| Dai Nippon Printing Co., Ltd. (a) | 1,000 | 9,889 | ||||||
| Daicel Corp. (a) | 4,400 | 65,480 | ||||||
| Daihatsu Motor Co., Ltd. (a) | 4,000 | 53,960 | ||||||
| Daiichi Sankyo Co., Ltd. (a) | 14,300 | 295,148 | ||||||
| Dentsu, Inc. (a) | 500 | 27,356 | ||||||
| Don Quijote Holdings Co., Ltd. (a) | 1,500 | 52,678 | ||||||
| East Japan Railway Co. (a) | 2,000 | 188,332 | ||||||
| Electric Power Development Co., Ltd. (a) | 900 | 32,055 | ||||||
| Ezaki Glico Co., Ltd. (a) | 4,200 | 226,900 | ||||||
| FamilyMart Co., Ltd. (a) | 6,800 | 316,437 | ||||||
| Fuji Heavy Industries Ltd. (a) | 3,100 | 127,708 | ||||||
| FUJIFILM Holdings Corp. (a) | 3,600 | 150,237 | ||||||
| Fujitsu Ltd. (a) | 4,000 | 19,965 | ||||||
| Fukuoka Financial Group, Inc. (a) | 12,000 | 59,503 | ||||||
| Gunma Bank Ltd./The (a) | 12,000 | 69,771 | ||||||
| Hakuhodo DY Holdings, Inc. (a) | 9,600 | 103,868 | ||||||
| Hankyu Hanshin Holdings, Inc. (a) | 5,000 | 32,499 | ||||||
| Haseko Corp. (a) | 20,300 | 224,444 | ||||||
| Hikari Tsushin, Inc. (a) | 500 | 34,050 | ||||||
| Hiroshima Bank Ltd./The | 4,000 | 22,735 | ||||||
| Hisamitsu Pharmaceutical Co., Inc. | 1,200 | 50,379 | ||||||
| Hitachi High-Technologies Corp. (a) | 2,900 | 78,425 | ||||||
| Hitachi Metals Ltd. (a) | 3,000 | 37,015 | ||||||
| Hokuhoku Financial Group, Inc. | 77,000 | 156,968 | ||||||
| Hoshizaki Electric Co., Ltd. (a) | 400 | 24,866 | ||||||
| Hoya Corp. (a) | 2,000 | 81,785 | ||||||
| Ibiden Co., Ltd. (a) | 6,400 | 91,753 | ||||||
| Idemitsu Kosan Co., Ltd. (a) | 4,200 | 67,062 | ||||||
| Iida Group Holdings Co., Ltd. | 1,500 | 27,801 | ||||||
| Isetan Mitsukoshi Holdings Ltd. | 5,400 | 70,422 | ||||||
| ITOCHU Corp. (a) | 24,500 | 289,797 | ||||||
| Itochu Techno-Solutions Corp. (a) | 8,800 | 175,335 | ||||||
| Izumi Co., Ltd. (a) | 2,800 | 108,703 | ||||||
| J Front Retailing Co., Ltd. | 1,800 | 26,168 | ||||||
| Japan Airlines Co., Ltd. (a) | 23,200 | 830,395 | ||||||
| Japan Petroleum Exploration Co., Ltd. (a) | 2,000 | 53,715 | ||||||
| JSR Corp. (a) | 2,300 | 35,844 | ||||||
| JTEKT Corp. (a) | 2,200 | 36,010 | ||||||
| JX Holdings, Inc. | 2,900 | 12,172 | ||||||
| Kajima Corp. | 8,000 | 47,612 | ||||||
| Kaken Pharmaceutical Co., Ltd. (a) | 2,200 | 150,333 | ||||||
| Kamigumi Co., Ltd. (a) | 5,000 | 43,049 | ||||||
| Kaneka Corp. (a) | 25,000 | 259,856 | ||||||
| Kao Corp. (a) | 400 | 20,556 | ||||||
| KDDI Corp. (a) | 14,800 | 384,359 | ||||||
| Keihan Electric Railway Co., Ltd. (a) | 13,000 | 87,064 | ||||||
| Kewpie Corp. (a) | 12,300 | 303,832 | ||||||
| Kobayashi Pharmaceutical Co., Ltd. (a) | 300 | 24,639 | ||||||
| Konami Holdings Corp. (a) | 10,000 | 238,045 | ||||||
| Konica Minolta, Inc. | 3,500 | 35,053 | ||||||
| Kose Corp. | 1,100 | 101,707 | ||||||
| Kuraray Co., Ltd. (a) | 6,600 | 79,945 | ||||||
| Kurita Water Industries Ltd. (a) | 1,700 | 35,600 | ||||||
| Lawson, Inc. | 900 | 73,054 | ||||||
| Mabuchi Motor Co., Ltd. (a) | 600 | 32,517 | ||||||
| SHARES | VALUE (Note 5) | |||||||
| Japan - 11.2% (continued) | ||||||||
| Marubeni Corp. (a) | 11,300 | $ | 58,094 | |||||
| Maruichi Steel Tube Ltd. (a) | 1,000 | 29,522 | ||||||
| Medipal Holdings Corp. (a) | 12,500 | 213,050 | ||||||
| MEIJI Holdings Co., Ltd. (a) | 2,000 | 165,199 | ||||||
| Miraca Holdings, Inc. (a) | 1,300 | 57,202 | ||||||
| Mitsubishi Chemical Holdings Corp. (a) | 14,600 | 92,633 | ||||||
| Mitsubishi Corp. (a) | 2,600 | 43,246 | ||||||
| Mitsubishi Electric Corp. (a) | 7,000 | 73,478 | ||||||
| Mitsubishi Gas Chemical Co., Inc. (a) | 15,000 | 76,703 | ||||||
| Mitsubishi Tanabe Pharma Corp. (a) | 19,600 | 337,681 | ||||||
| Mitsubishi UFJ Financial Group, Inc. (a) | 14,500 | 89,817 | ||||||
| Mitsubishi UFJ Lease & Finance Co., Ltd. | 11,400 | 58,667 | ||||||
| Mitsui & Co., Ltd. (a) | 10,200 | 121,197 | ||||||
| Mitsui Chemicals, Inc. | 7,000 | 31,045 | ||||||
| Mixi, Inc. | 900 | 33,663 | ||||||
| Mizuho Financial Group, Inc. | 78,900 | 157,800 | ||||||
| MS&AD Insurance Group Holdings, Inc. (a) | 13,000 | 381,221 | ||||||
| Nagoya Railroad Co., Ltd. (a) | 10,000 | 41,621 | ||||||
| Nankai Electric Railway Co., Ltd. | 4,000 | 23,674 | ||||||
| Nexon Co., Ltd. (a) | 9,000 | 146,410 | ||||||
| NH Foods Ltd. (a) | 2,000 | 39,200 | ||||||
| NHK Spring Co., Ltd. (a) | 20,000 | 200,526 | ||||||
| Nippon Express Co., Ltd. (a) | 20,000 | 93,985 | ||||||
| Nippon Shokubai Co., Ltd. (a) | 2,600 | 180,921 | ||||||
| Nippon Telegraph & Telephone Corp. (a) | 8,500 | 338,284 | ||||||
| Nippon Yusen KK (a) | 68,000 | 164,811 | ||||||
| Nisshin Seifun Group, Inc. (a) | 9,800 | 160,078 | ||||||
| Nissin Foods Holdings Co., Ltd. (a) | 700 | 37,145 | ||||||
| Nitori Holdings Co., Ltd. (a) | 2,900 | 243,547 | ||||||
| NOK Corp. (a) | 5,300 | 123,813 | ||||||
| Nomura Research Institute Ltd. (a) | 3,100 | 119,052 | ||||||
| NTN Corp. | 4,000 | 16,867 | ||||||
| NTT Data Corp. (a) | 2,800 | 135,369 | ||||||
| Obayashi Corp. (a) | 21,000 | 193,771 | ||||||
| Obic Co., Ltd. (a) | 500 | 26,467 | ||||||
| Oji Holdings Corp. | 3,000 | 12,057 | ||||||
| Oracle Corp. Japan (a) | 2,200 | 102,432 | ||||||
| ORIX Corp. (a) | 9,100 | 127,659 | ||||||
| Osaka Gas Co., Ltd. (a) | 41,000 | 148,090 | ||||||
| Otsuka Corp. (a) | 3,700 | 181,758 | ||||||
| Otsuka Holdings Co., Ltd. (a) | 8,400 | 298,443 | ||||||
| Park24 Co., Ltd. (a) | 7,000 | 169,592 | ||||||
| Pola Orbis Holdings, Inc. (a) | 4,000 | 263,634 | ||||||
| Renesas Electronics Corp. † | 2,800 | 17,584 | ||||||
| Resona Holdings, Inc. (a) | 61,700 | 299,630 | ||||||
| Rohm Co., Ltd. (a) | 1,300 | 65,846 | ||||||
| Sankyo Co., Ltd. (a) | 4,300 | 160,510 | ||||||
| Santen Pharmaceutical Co., Ltd. (a) | 10,500 | 172,866 | ||||||
| Secom Co., Ltd. (a) | 400 | 27,108 | ||||||
| Sekisui Chemical Co., Ltd. (a) | 7,600 | 99,228 | ||||||
| Sekisui House Ltd. (a) | 5,000 | 84,069 | ||||||
| Seven & i Holdings Co., Ltd. (a) | 5,300 | 242,658 | ||||||
| Shimadzu Corp. (a) | 7,000 | 117,179 | ||||||
| Shimamura Co., Ltd. (a) | 3,100 | 363,038 | ||||||
| Shimizu Corp. (a) | 24,000 | 195,702 | ||||||
| Shinsei Bank Ltd. | 145,000 | 266,842 | ||||||
| The accompanying notes are an integral part of these financial statements. | (Continued) |
| AQR Funds | Annual Report | December 2015 | ||||||||||||||
287
Table of Contents
| Consolidated Schedule of Investments | December 31, 2015 |
| AQR STYLE PREMIA ALTERNATIVE LV FUND |
| SHARES | VALUE (Note 5) | |||||||
| Japan - 11.2% (continued) | ||||||||
| Sojitz Corp. (a) | 95,800 | $ | 201,044 | |||||
| Sompo Japan Nipponkoa Holdings, Inc. | 1,400 | 45,969 | ||||||
| Sugi Holdings Co., Ltd. (a) | 1,900 | 104,828 | ||||||
| Sumitomo Chemical Co., Ltd. (a) | 31,000 | 178,036 | ||||||
| Sumitomo Corp. (a) | 8,700 | 88,699 | ||||||
| Sumitomo Heavy Industries Ltd. | 16,000 | 71,726 | ||||||
| Sumitomo Rubber Industries Ltd. (a) | 22,400 | 291,276 | ||||||
| Sundrug Co., Ltd. (a) | 1,000 | 64,297 | ||||||
| Suzuken Co., Ltd. (a) | 4,270 | 162,269 | ||||||
| Taisei Corp. (a) | 21,000 | 138,326 | ||||||
| Taisho Pharmaceutical Holdings Co., Ltd. (a) | 200 | 14,125 | ||||||
| Takashimaya Co., Ltd. (a) | 5,000 | 45,027 | ||||||
| TDK Corp. (a) | 200 | 12,809 | ||||||
| Teijin Ltd. (a) | 21,000 | 71,565 | ||||||
| Toho Gas Co., Ltd. (a) | 39,000 | 251,871 | ||||||
| Tohoku Electric Power Co., Inc. (a) | 7,100 | 88,759 | ||||||
| Tokyo Electric Power Co., Inc. †(a) | 41,800 | 240,695 | ||||||
| Tokyo Gas Co., Ltd. (a) | 19,000 | 89,277 | ||||||
| Tokyu Corp. | 3,000 | 23,707 | ||||||
| Toppan Printing Co., Ltd. (a) | 4,000 | 36,853 | ||||||
| Tosoh Corp. | 29,000 | 149,176 | ||||||
| Toyo Suisan Kaisha Ltd. (a) | 3,700 | 128,954 | ||||||
| Toyoda Gosei Co., Ltd. (a) | 5,500 | 124,943 | ||||||
| Toyota Boshoku Corp. | 1,300 | 26,166 | ||||||
| Toyota Industries Corp. (a) | 200 | 10,695 | ||||||
| Tsuruha Holdings, Inc. (a) | 800 | 69,317 | ||||||
| USS Co., Ltd. (a) | 2,100 | 31,554 | ||||||
| West Japan Railway Co. (a) | 5,700 | 394,001 | ||||||
| Yamada Denki Co., Ltd. (a) | 37,500 | 161,982 | ||||||
| Yamaguchi Financial Group, Inc. (a) | 21,000 | 248,791 | ||||||
| Yamazaki Baking Co., Ltd. (a) | 12,000 | 269,830 | ||||||
| Yokohama Rubber Co., Ltd./The (a) | 6,700 | 102,897 | ||||||
|
| |||||||
| 20,971,046 | ||||||||
|
| |||||||
| Netherlands - 0.8% | ||||||||
| Aalberts Industries NV (a) | 541 | 18,641 | ||||||
| ASM International NV (a) | 1,405 | 55,081 | ||||||
| Boskalis Westminster (a) | 2,334 | 95,209 | ||||||
| Heineken NV (a) | 2,251 | 191,823 | ||||||
| Koninklijke Ahold NV (a) | 16,679 | 351,818 | ||||||
| NN Group NV (a) | 12,550 | 442,800 | ||||||
| Randstad Holding NV (a) | 1,566 | 97,517 | ||||||
| SBM Offshore NV †(a) | 10,791 | 136,320 | ||||||
| Wolters Kluwer NV (a) | 4,660 | 156,499 | ||||||
|
| |||||||
| 1,545,708 | ||||||||
|
| |||||||
| Norway - 0.2% | ||||||||
| DNB ASA (a) | 5,780 | 71,217 | ||||||
| Gjensidige Forsikring ASA (a) | 745 | 11,924 | ||||||
| Marine Harvest ASA †(a) | 1,311 | 17,639 | ||||||
| Orkla ASA (a) | 10,217 | 80,601 | ||||||
| Telenor ASA (a) | 1,627 | 27,120 | ||||||
| Yara International ASA (a) | 5,560 | 239,126 | ||||||
|
| |||||||
| 447,627 | ||||||||
|
| |||||||
| SHARES | VALUE (Note 5) | |||||||
| Portugal - 0.0% (c) | ||||||||
| EDP - Energias de Portugal SA | 5,599 | $ | 20,175 | |||||
| NOS SGPS SA | 1,511 | 11,889 | ||||||
|
| |||||||
| 32,064 | ||||||||
|
| |||||||
| Spain - 0.6% | ||||||||
| Almirall SA | 5,666 | 114,516 | ||||||
| Amadeus IT Holding SA, A Shares (a) | 273 | 12,032 | ||||||
| Banco de Sabadell SA | 6,642 | 11,772 | ||||||
| Ebro Foods SA | 10,738 | 211,225 | ||||||
| Enagas SA (a) | 1,371 | 38,673 | ||||||
| Endesa SA (a) | 11,296 | 226,933 | ||||||
| Ferrovial SA (a) | 2,727 | 61,666 | ||||||
| Iberdrola SA (a) | 25,260 | 179,068 | ||||||
| Red Electrica Corp. SA (a) | 471 | 39,342 | ||||||
| Repsol SA (a) | 1,579 | 17,384 | ||||||
| Tecnicas Reunidas SA | 4,793 | 181,222 | ||||||
|
| |||||||
| 1,093,833 | ||||||||
|
| |||||||
| Sweden - 0.6% | ||||||||
| BillerudKorsnas AB | 1,528 | 28,278 | ||||||
| Boliden AB (a) | 4,298 | 72,010 | ||||||
| Electrolux AB, Series B (a) | 3,476 | 83,867 | ||||||
| ICA Gruppen AB | 4,887 | 177,478 | ||||||
| Modern Times Group MTG, B Shares | 852 | 21,755 | ||||||
| Securitas AB, B Shares (a) | 10,405 | 159,102 | ||||||
| Skandinaviska Enskilda Banken AB, Class A (a) | 2,812 | 29,572 | ||||||
| SKF AB, B Shares (a) | 734 | 11,855 | ||||||
| Svenska Cellulosa AB SCA, Class B (a) | 9,861 | 285,773 | ||||||
| Swedish Match AB (a) | 1,101 | 38,906 | ||||||
| Tele2 AB, B Shares (a) | 8,039 | 80,169 | ||||||
| TeliaSonera AB | 15,662 | 77,776 | ||||||
|
| |||||||
| 1,066,541 | ||||||||
|
| |||||||
| Switzerland - 1.5% | ||||||||
| Adecco SA †(a) | 1,020 | 69,812 | ||||||
| Baloise Holding AG (a) | 413 | 52,343 | ||||||
| Barry Callebaut AG †(a) | 53 | 57,570 | ||||||
| Bucher Industries AG (a) | 270 | 60,852 | ||||||
| Credit Suisse Group AG †(a) | 3,352 | 72,209 | ||||||
| Flughafen Zuerich AG (a) | 109 | 81,784 | ||||||
| Galenica AG (a) | 231 | 361,411 | ||||||
| Georg Fischer AG (a) | 18 | 12,220 | ||||||
| Givaudan SA †(a) | 21 | 38,114 | ||||||
| Helvetia Holding AG (a) | 108 | 60,837 | ||||||
| Kuehne + Nagel International AG (a) | 87 | 11,919 | ||||||
| Lonza Group AG †(a) | 1,233 | 200,529 | ||||||
| Nestle SA (a) | 3,903 | 289,740 | ||||||
| Novartis AG (a) | 3,470 | 298,487 | ||||||
| Partners Group Holding AG (a) | 177 | 63,655 | ||||||
| Roche Holding AG (a) | 315 | 87,289 | ||||||
| Straumann Holding AG (a) | 39 | 11,837 | ||||||
| Swiss Life Holding AG †(a) | 815 | 219,520 | ||||||
| Swiss Re AG (a) | 6,478 | 632,682 | ||||||
| Swisscom AG (a) | 326 | 163,132 | ||||||
| UBS Group AG | 4,216 | 81,788 | ||||||
|
| |||||||
| 2,927,730 | ||||||||
|
| |||||||
| The accompanying notes are an integral part of these financial statements. | (Continued) |
| AQR Funds | Annual Report | December 2015 | ||||||||||||||
288
Table of Contents
| Consolidated Schedule of Investments | December 31, 2015 |
| AQR STYLE PREMIA ALTERNATIVE LV FUND |
| SHARES | VALUE (Note 5) | |||||||
| United Kingdom - 0.2% | ||||||||
| Fiat Chrysler Automobiles NV †(a) | 13,944 | $ | 193,652 | |||||
| Subsea 7 SA † | 4,277 | 30,273 | ||||||
| Unilever NV CVA (a) | 3,965 | 172,708 | ||||||
|
| |||||||
| 396,633 | ||||||||
|
| |||||||
TOTAL COMMON STOCKS | ||||||||
(cost $36,206,438) | 37,096,219 | |||||||
|
| |||||||
| PREFERRED STOCKS - 0.1% | ||||||||
| Germany - 0.1% | ||||||||
| FUCHS PETROLUB SE (a) | 253 | 11,913 | ||||||
| Henkel AG & Co. KGaA (a) | 1,700 | 189,723 | ||||||
|
| |||||||
TOTAL PREFERRED STOCKS | 201,636 | |||||||
|
| |||||||
| MONEY MARKET FUNDS - 62.2% | ||||||||
| BlackRock Liquidity Funds T-Fund Portfolio, Institutional Shares, 0.100% (d) | 58,644 | 58,644 | ||||||
| Dreyfus Treasury Cash Management, Class I, 0.090% (d) | 234,578 | 234,578 | ||||||
| J.P. Morgan U.S. Treasury Plus Money Market Fund - IM Shares, 0.129% ^(d)(e) | 101,443,362 | 101,443,362 | ||||||
| J.P. Morgan U.S. Treasury Plus Money Market Fund - Institutional Shares, 0.070% (d)(e) | 14,800,003 | 14,800,003 | ||||||
| UBS Money Series - UBS Select Treasury Preferred Fund, Class I, 0.140% (d) | 293,222 | 293,222 | ||||||
|
| |||||||
TOTAL MONEY MARKET FUNDS | 116,829,809 | |||||||
|
| |||||||
| SHORT-TERM INVESTMENTS - 27.2% | | PRINCIPAL AMOUNT (000’s) | | |||||
| U.S. Treasury Bill, 0.343%, 5/12/2016 ^(f) | $ | 17,661 | 17,640,531 | |||||
| U.S. Treasury Bill, 0.066%, 4/7/2016 ^(f) | 8,423 | 8,419,699 | ||||||
| U.S. Treasury Bill, 0.327%, 5/19/2016 ^(f) | 12,610 | 12,594,073 | ||||||
| U.S. Treasury Bill, 0.583%, 6/16/2016 ^(f) | 1,205 | 1,202,459 | ||||||
| U.S. Treasury Bill, 0.264%, 3/3/2016 ^(f) | 1,100 | 1,099,806 | ||||||
| U.S. Treasury Bill, 0.516%, 6/23/2016 (f) | 1,037 | 1,034,695 | ||||||
| U.S. Treasury Bill, 0.345%, 5/26/2016 (f) | 1,312 | 1,309,974 | ||||||
| U.S. Treasury Bill, 0.241%, 2/11/2016 (f) | 2,382 | 2,381,669 | ||||||
| U.S. Treasury Bill, 0.113%, 3/24/2016 ^(f) | 2,478 | 2,477,024 | ||||||
SHORT-TERM | PRINCIPAL | VALUE (Note 5) | ||||||
| U.S. Treasury Bill, 0.259%, 3/17/2016 (f) | $ | 2,914 | $ | 2,913,408 | ||||
|
| |||||||
TOTAL SHORT-TERM INVESTMENTS | 51,073,338 | |||||||
|
| |||||||
TOTAL INVESTMENTS IN SECURITIES, AT VALUE | ||||||||
(cost $204,306,898) |
| 205,201,002 | ||||||
|
| |||||||
| SECURITIES SOLD SHORT - (14.7)% | SHARES | |||||||
| COMMON STOCKS - (14.6)% | ||||||||
| Austria - (0.1)% | ||||||||
| ams AG | (3,880 | ) | (129,703 | ) | ||||
|
| |||||||
| Belgium - (0.3)% | ||||||||
| Anheuser-Busch InBev SA/NV | (1,702 | ) | (211,809 | ) | ||||
| Solvay SA | (354 | ) | (37,782 | ) | ||||
| Telenet Group Holding NV † | (1,740 | ) | (94,037 | ) | ||||
| UCB SA | (1,594 | ) | (143,880 | ) | ||||
|
| |||||||
| (487,508 | ) | |||||||
|
| |||||||
| Denmark - (0.1)% | ||||||||
| Novozymes A/S, B Shares | (3,115 | ) | (149,143 | ) | ||||
| Pandora A/S | (541 | ) | (68,211 | ) | ||||
|
| |||||||
| (217,354 | ) | |||||||
|
| |||||||
| Finland - (0.4)% | ||||||||
| Kone OYJ, Class B | (734 | ) | (31,078 | ) | ||||
| Nokia OYJ | (46,142 | ) | (326,433 | ) | ||||
| Nokian Renkaat OYJ | (6,823 | ) | (243,590 | ) | ||||
| Wartsila OYJ Abp | (1,482 | ) | (67,665 | ) | ||||
|
| |||||||
| (668,766 | ) | |||||||
|
| |||||||
| Germany - (1.8)% | ||||||||
| BASF SE | (1,078 | ) | (82,120 | ) | ||||
| Bayer AG | (2,119 | ) | (264,643 | ) | ||||
| Bayerische Motoren Werke AG | (3,131 | ) | (329,855 | ) | ||||
| Beiersdorf AG | (986 | ) | (89,619 | ) | ||||
| Bilfinger SE | (1,273 | ) | (59,824 | ) | ||||
| Commerzbank AG † | (13,867 | ) | (143,088 | ) | ||||
| Deutsche Bank AG | (11,716 | ) | (284,519 | ) | ||||
| Deutsche Post AG | (3,151 | ) | (88,095 | ) | ||||
| Deutsche Telekom AG | (9,017 | ) | (161,951 | ) | ||||
| E.ON SE | (47,450 | ) | (455,615 | ) | ||||
| HUGO BOSS AG | (1,532 | ) | (126,404 | ) | ||||
| Infineon Technologies AG | (15,680 | ) | (228,594 | ) | ||||
| LANXESS AG | (2,131 | ) | (98,063 | ) | ||||
| Linde AG | (218 | ) | (31,492 | ) | ||||
| METRO AG | (1,505 | ) | (47,945 | ) | ||||
| Rocket Internet SE 144A †(b) | (4,553 | ) | (138,701 | ) | ||||
| RWE AG | (32,223 | ) | (406,248 | ) | ||||
| Salzgitter AG | (1,260 | ) | (30,791 | ) | ||||
| Siemens AG | (461 | ) | (44,600 | ) | ||||
| Telefonica Deutschland Holding AG | (4,143 | ) | (21,853 | ) | ||||
| ThyssenKrupp AG | (6,040 | ) | (119,733 | ) | ||||
| Wirecard AG | (2,414 | ) | (120,664 | ) | ||||
|
| |||||||
| (3,374,417 | ) | |||||||
|
| |||||||
| The accompanying notes are an integral part of these financial statements. | (Continued) |
| AQR Funds | Annual Report | December 2015 | ||||||||||||||
289
Table of Contents
| Consolidated Schedule of Investments | December 31, 2015 |
| AQR STYLE PREMIA ALTERNATIVE LV FUND |
SHARES | VALUE (Note 5) | |||||||
| Italy - (0.3)% | ||||||||
| Azimut Holding SpA | (8,347 | ) | $ | (207,475 | ) | |||
| Banca Mediolanum SpA | (6,396 | ) | (50,811 | ) | ||||
| Banca Popolare dell’Emilia Romagna SC | (12,842 | ) | (97,408 | ) | ||||
| Banco Popolare SC † | (2,313 | ) | (31,874 | ) | ||||
| Mediaset SpA | (19,641 | ) | (81,390 | ) | ||||
|
| |||||||
| (468,958 | ) | |||||||
|
| |||||||
| Japan - (8.5)% | ||||||||
| Acom Co., Ltd. † | (15,400 | ) | (72,519 | ) | ||||
| Advantest Corp. | (4,200 | ) | (34,840 | ) | ||||
| Aeon Co., Ltd. | (6,800 | ) | (104,772 | ) | ||||
| AEON Financial Service Co., Ltd. | (1,800 | ) | (40,210 | ) | ||||
| Asics Corp. | (8,700 | ) | (180,503 | ) | ||||
| Calbee, Inc. | (7,600 | ) | (320,941 | ) | ||||
| Chiyoda Corp. | (7,000 | ) | (53,155 | ) | ||||
| Chugai Pharmaceutical Co., Ltd. | (8,900 | ) | (310,224 | ) | ||||
| Chugoku Electric Power Co., Inc./The | (4,400 | ) | (58,095 | ) | ||||
| Credit Saison Co., Ltd. | (4,500 | ) | (88,660 | ) | ||||
| Dai-ichi Life Insurance Co., Ltd./The | (15,300 | ) | (254,557 | ) | ||||
| Daikin Industries Ltd. | (1,100 | ) | (80,104 | ) | ||||
| Daiwa Securities Group, Inc. | (4,000 | ) | (24,455 | ) | ||||
| DeNA Co., Ltd. | (2,800 | ) | (43,782 | ) | ||||
| Denso Corp. | (7,100 | ) | (339,277 | ) | ||||
| Disco Corp. | (400 | ) | (37,669 | ) | ||||
| Eisai Co., Ltd. | (1,100 | ) | (72,766 | ) | ||||
| FANUC Corp. | (1,200 | ) | (206,748 | ) | ||||
| Fast Retailing Co., Ltd. | (1,100 | ) | (384,793 | ) | ||||
| Hachijuni Bank Ltd./The | (4,000 | ) | (24,480 | ) | ||||
| Hamamatsu Photonics KK | (7,000 | ) | (191,907 | ) | ||||
| Hirose Electric Co., Ltd. | (200 | ) | (24,214 | ) | ||||
| Hitachi Capital Corp. | (400 | ) | (10,747 | ) | ||||
| Hitachi Chemical Co., Ltd. | (700 | ) | (11,105 | ) | ||||
| Hitachi Construction Machinery Co., Ltd. | (12,500 | ) | (194,404 | ) | ||||
| Hitachi Ltd. | (31,000 | ) | (175,658 | ) | ||||
| Honda Motor Co., Ltd. | (4,300 | ) | (137,435 | ) | ||||
| IHI Corp. | (146,000 | ) | (403,033 | ) | ||||
| Inpex Corp. | (25,000 | ) | (243,723 | ) | ||||
| Isuzu Motors Ltd. | (1,600 | ) | (17,236 | ) | ||||
| Iyo Bank Ltd./The | (3,000 | ) | (29,147 | ) | ||||
| Japan Airport Terminal Co., Ltd. | (4,900 | ) | (216,918 | ) | ||||
| Japan Display, Inc. † | (63,200 | ) | (182,096 | ) | ||||
| JFE Holdings, Inc. | (8,100 | ) | (127,189 | ) | ||||
| JGC Corp. | (8,000 | ) | (122,450 | ) | ||||
| Kakaku.com, Inc. | (9,400 | ) | (184,894 | ) | ||||
| Kansai Electric Power Co., Inc./The † | (7,400 | ) | (88,724 | ) | ||||
| Kansai Paint Co., Ltd. | (8,700 | ) | (131,872 | ) | ||||
| Kawasaki Heavy Industries Ltd. | (24,000 | ) | (88,797 | ) | ||||
| Keikyu Corp. | (10,000 | ) | (82,632 | ) | ||||
| Keio Corp. | (6,000 | ) | (51,814 | ) | ||||
| Keisei Electric Railway Co., Ltd. | (5,000 | ) | (63,791 | ) | ||||
| Keyence Corp. | (100 | ) | (54,960 | ) | ||||
| Kikkoman Corp. | (9,000 | ) | (311,827 | ) | ||||
| Kintetsu Group Holdings Co., Ltd. | (4,000 | ) | (16,263 | ) | ||||
| Kobe Steel Ltd. | (201,000 | ) | (218,390 | ) | ||||
| Koito Manufacturing Co., Ltd. | (1,800 | ) | (73,813 | ) | ||||
| Komatsu Ltd. | (8,500 | ) | (139,081 | ) | ||||
| Kubota Corp. | (8,000 | ) | (123,589 | ) | ||||
| Kyocera Corp. | (1,500 | ) | (69,661 | ) | ||||
SHARES | VALUE (Note 5) | |||||||
| Japan - (8.5)% (continued) | ||||||||
| Kyowa Hakko Kirin Co., Ltd. | (4,000 | ) | $ | (62,939 | ) | |||
| Kyushu Electric Power Co., Inc. † | (31,200 | ) | (340,052 | ) | ||||
| LIXIL Group Corp. | (2,000 | ) | (44,419 | ) | ||||
| M3, Inc. | (5,700 | ) | (118,185 | ) | ||||
| Mazda Motor Corp. | (12,300 | ) | (253,808 | ) | ||||
| Minebea Co., Ltd. | (16,000 | ) | (136,991 | ) | ||||
| MISUMI Group, Inc. | (7,500 | ) | (103,602 | ) | ||||
| Mitsubishi Heavy Industries Ltd. | (38,000 | ) | (166,155 | ) | ||||
| Mitsubishi Logistics Corp. | (17,000 | ) | (223,995 | ) | ||||
| Mitsubishi Materials Corp. | (25,000 | ) | (78,741 | ) | ||||
| Mitsubishi Motors Corp. | (5,700 | ) | (48,225 | ) | ||||
| Mitsui OSK Lines Ltd. | (41,000 | ) | (103,413 | ) | ||||
| Murata Manufacturing Co., Ltd. | (200 | ) | (28,776 | ) | ||||
| Nabtesco Corp. | (4,200 | ) | (85,324 | ) | ||||
| NGK Insulators Ltd. | (5,000 | ) | (112,701 | ) | ||||
| NGK Spark Plug Co., Ltd. | (15,200 | ) | (400,193 | ) | ||||
| Nidec Corp. | (2,300 | ) | (166,787 | ) | ||||
| Nintendo Co., Ltd. | (700 | ) | (96,257 | ) | ||||
| Nippon Electric Glass Co., Ltd. | (7,000 | ) | (35,281 | ) | ||||
| Nippon Paint Holdings Co., Ltd. | (16,500 | ) | (399,334 | ) | ||||
| Nippon Steel & Sumitomo Metal Corp. | (6,800 | ) | (134,520 | ) | ||||
| Nitto Denko Corp. | (1,200 | ) | (87,607 | ) | ||||
| Nomura Holdings, Inc. | (15,800 | ) | (88,007 | ) | ||||
| NSK Ltd. | (5,500 | ) | (59,763 | ) | ||||
| Odakyu Electric Railway Co., Ltd. | (8,000 | ) | (86,134 | ) | ||||
| Olympus Corp. | (6,100 | ) | (240,149 | ) | ||||
| Omron Corp. | (6,200 | ) | (206,751 | ) | ||||
| Ono Pharmaceutical Co., Ltd. | (1,400 | ) | (249,636 | ) | ||||
| Oriental Land Co., Ltd. | (4,900 | ) | (296,433 | ) | ||||
| Panasonic Corp. | (8,000 | ) | (81,100 | ) | ||||
| Pigeon Corp. | (9,200 | ) | (223,193 | ) | ||||
| Rakuten, Inc. | (29,300 | ) | (337,470 | ) | ||||
| Recruit Holdings Co., Ltd. | (5,300 | ) | (155,787 | ) | ||||
| Ricoh Co., Ltd. | (1,700 | ) | (17,505 | ) | ||||
| Rinnai Corp. | (300 | ) | (26,581 | ) | ||||
| Sega Sammy Holdings, Inc. | (3,800 | ) | (35,543 | ) | ||||
| Seiko Epson Corp. | (4,800 | ) | (73,916 | ) | ||||
| Seven Bank Ltd. | (27,800 | ) | (121,917 | ) | ||||
| Shikoku Electric Power Co., Inc. | (7,600 | ) | (118,722 | ) | ||||
| Shin-Etsu Chemical Co., Ltd. | (2,400 | ) | (130,478 | ) | ||||
| Shionogi & Co., Ltd. | (900 | ) | (40,707 | ) | ||||
| Shizuoka Bank Ltd./The | (15,000 | ) | (145,471 | ) | ||||
| SMC Corp. | (100 | ) | (25,973 | ) | ||||
| SoftBank Group Corp. | (2,500 | ) | (126,176 | ) | ||||
| Sony Corp. | (5,700 | ) | (140,088 | ) | ||||
| Stanley Electric Co., Ltd. | (6,500 | ) | (142,594 | ) | ||||
| Sumco Corp. | (27,300 | ) | (205,965 | ) | ||||
| Sumitomo Dainippon Pharma Co., Ltd. | (3,600 | ) | (42,413 | ) | ||||
| Sumitomo Metal Mining Co., Ltd. | (6,000 | ) | (72,833 | ) | ||||
| Sumitomo Mitsui Financial Group, Inc. | (3,000 | ) | (113,223 | ) | ||||
| Sumitomo Mitsui Trust Holdings, Inc. | (26,000 | ) | (98,471 | ) | ||||
| Suruga Bank Ltd. | (3,000 | ) | (61,826 | ) | ||||
| Suzuki Motor Corp. | (2,600 | ) | (78,998 | ) | ||||
| Sysmex Corp. | (800 | ) | (51,316 | ) | ||||
| T&D Holdings, Inc. | (9,500 | ) | (125,339 | ) | ||||
| Taiyo Nippon Sanso Corp. | (10,100 | ) | (91,342 | ) | ||||
| Terumo Corp. | (3,400 | ) | (105,378 | ) | ||||
| Tobu Railway Co., Ltd. | (4,000 | ) | (19,730 | ) | ||||
| The accompanying notes are an integral part of these financial statements. | (Continued) |
| AQR Funds | Annual Report | December 2015 | ||||||||||||||
290
Table of Contents
| Consolidated Schedule of Investments | December 31, 2015 |
| AQR STYLE PREMIA ALTERNATIVE LV FUND |
SHARES | VALUE (Note 5) | |||||||
| Japan - (8.5)% (continued) | ||||||||
| Tokio Marine Holdings, Inc. | (1,400 | ) | $ | (54,074 | ) | |||
| Tokyo Electron Ltd. | (1,700 | ) | (102,994 | ) | ||||
| Toray Industries, Inc. | (1,000 | ) | (9,293 | ) | ||||
| Toshiba Corp. † | (130,000 | ) | (267,179 | ) | ||||
| Toyo Seikan Group Holdings Ltd. | (4,300 | ) | (79,761 | ) | ||||
| Unicharm Corp. | (4,400 | ) | (89,855 | ) | ||||
| Yahoo Japan Corp. | (54,500 | ) | (221,537 | ) | ||||
| Yakult Honsha Co., Ltd. | (7,100 | ) | (347,507 | ) | ||||
| Yamaha Corp. | (500 | ) | (12,077 | ) | ||||
| Yamaha Motor Co., Ltd. | (7,800 | ) | (174,839 | ) | ||||
| Yamato Holdings Co., Ltd. | (9,500 | ) | (201,287 | ) | ||||
| Yaskawa Electric Corp. | (22,200 | ) | (302,069 | ) | ||||
| Yokogawa Electric Corp. | (10,100 | ) | (121,462 | ) | ||||
|
| |||||||
| (15,968,087 | ) | |||||||
|
| |||||||
| Luxembourg - (0.4)% | ||||||||
| APERAM SA † | (2,591 | ) | (92,123 | ) | ||||
| ArcelorMittal | (73,962 | ) | (312,060 | ) | ||||
| Millicom International Cellular SA SDR | (1,157 | ) | (66,389 | ) | ||||
| Tenaris SA | (25,630 | ) | (303,494 | ) | ||||
|
| |||||||
| (774,066 | ) | |||||||
|
| |||||||
| Netherlands - (0.7)% | ||||||||
| Aegon NV | (17,693 | ) | (100,062 | ) | ||||
| Altice NV, Class A † | (8,772 | ) | (126,030 | ) | ||||
| ASML Holding NV | (6,666 | ) | (592,284 | ) | ||||
| Delta Lloyd NV | (18,323 | ) | (108,013 | ) | ||||
| Fugro NV CVA † | (6,584 | ) | (107,991 | ) | ||||
| Koninklijke DSM NV | (1,164 | ) | (58,370 | ) | ||||
| Koninklijke KPN NV | (34,249 | ) | (129,542 | ) | ||||
| Koninklijke Vopak NV | (4,260 | ) | (183,456 | ) | ||||
|
| |||||||
| (1,405,748 | ) | |||||||
|
| |||||||
| Norway - (0.2)% | ||||||||
| Norsk Hydro ASA | (34,841 | ) | (129,508 | ) | ||||
| Schibsted ASA, Class A | (4,739 | ) | (155,802 | ) | ||||
| Statoil ASA | (8,852 | ) | (123,457 | ) | ||||
|
| |||||||
| (408,767 | ) | |||||||
|
| |||||||
| Portugal - 0.0% (c) | ||||||||
| Banco Comercial Portugues SA † | (715,150 | ) | (37,898 | ) | ||||
| Galp Energia SGPS SA | (2,434 | ) | (28,402 | ) | ||||
|
| |||||||
| (66,300 | ) | |||||||
|
| |||||||
| Spain - (0.8)% | ||||||||
| Abertis Infraestructuras SA | (9,966 | ) | (155,862 | ) | ||||
| Aena SA 144A †(b) | (995 | ) | (113,937 | ) | ||||
| Atresmedia Corp. de Medios de Comunicacion SA | (4,842 | ) | (51,578 | ) | ||||
| Banco Bilbao Vizcaya Argentaria SA | (24,794 | ) | (181,165 | ) | ||||
| Banco Popular Espanol SA | (30,369 | ) | (100,062 | ) | ||||
| Banco Santander SA | (29,457 | ) | (144,910 | ) | ||||
| Bankia SA | (119,061 | ) | (138,553 | ) | ||||
| CaixaBank SA | (10,534 | ) | (36,665 | ) | ||||
| Cellnex Telecom SAU 144A (b) | (10,585 | ) | (197,907 | ) | ||||
| Distribuidora Internacional de Alimentacion SA † | (1,981 | ) | (11,684 | ) | ||||
SHARES | VALUE (Note 5) | |||||||
| Spain - (0.8)% (continued) | ||||||||
| Mapfre SA | (31,612 | ) | $ | (79,130 | ) | |||
| Obrascon Huarte Lain SA | (9,067 | ) | (51,742 | ) | ||||
| Telefonica SA | (24,300 | ) | (269,582 | ) | ||||
| Zardoya Otis SA | (2,900 | ) | (33,917 | ) | ||||
|
| |||||||
| (1,566,694 | ) | |||||||
|
| |||||||
| Sweden - (0.2)% | ||||||||
| Alfa Laval AB | (2,008 | ) | (36,658 | ) | ||||
| Atlas Copco AB, A Shares | (3,671 | ) | (90,031 | ) | ||||
| Hexagon AB, B Shares | (1,338 | ) | (49,496 | ) | ||||
| Sandvik AB | (3,186 | ) | (27,772 | ) | ||||
| Telefonaktiebolaget LM Ericsson, B Shares | (22,619 | ) | (218,077 | ) | ||||
| Trelleborg AB, B Shares | (1,569 | ) | (30,451 | ) | ||||
|
| |||||||
| (452,485 | ) | |||||||
|
| |||||||
| Switzerland - (0.7)% | ||||||||
| Aryzta AG † | (4,092 | ) | (207,009 | ) | ||||
| Cie Financiere Richemont SA | (4,378 | ) | (313,346 | ) | ||||
| Dufry AG † | (588 | ) | (69,962 | ) | ||||
| Julius Baer Group Ltd. † | (488 | ) | (23,608 | ) | ||||
| LafargeHolcim Ltd. † | (6,274 | ) | (314,169 | ) | ||||
| OC Oerlikon Corp. AG † | (5,303 | ) | (47,204 | ) | ||||
| SGS SA | (55 | ) | (104,528 | ) | ||||
| STMicroelectronics NV | (14,813 | ) | (99,638 | ) | ||||
| Sunrise Communications Group AG 144A †(b) | (935 | ) | (55,116 | ) | ||||
| Zurich Insurance Group AG † | (92 | ) | (23,635 | ) | ||||
|
| |||||||
| (1,258,215 | ) | |||||||
|
| |||||||
| United Kingdom - (0.1)% | ||||||||
| CNH Industrial NV | (5,865 | ) | (40,169 | ) | ||||
| RELX NV | (11,529 | ) | (194,175 | ) | ||||
|
| |||||||
| (234,344 | ) | |||||||
|
| |||||||
TOTAL COMMON STOCKS SOLD SHORT |
| (27,481,412 | ) | |||||
|
| |||||||
| PREFERRED STOCKS - (0.1)% | ||||||||
| Germany - (0.1)% | ||||||||
Volkswagen AG | (1,776 | ) | (256,418 | ) | ||||
|
| |||||||
TOTAL SECURITIES SOLD SHORT, AT VALUE | ||||||||
(proceeds $28,335,852) |
| (27,737,830 | ) | |||||
|
| |||||||
TOTAL INVESTMENTS, NET OF SECURITIES SOLD SHORT - 94.5% | ||||||||
(cost $175,971,046) |
| 177,463,172 | ||||||
|
| |||||||
| OTHER ASSETS IN EXCESS OF LIABILITIES - 5.5% (g) | 10,329,281 | |||||||
|
| |||||||
| NET ASSETS - 100.0% | $187,792,453 | |||||||
|
| |||||||
| The accompanying notes are an integral part of these financial statements. | (Continued) |
| AQR Funds | Annual Report | December 2015 | ||||||||||||||
291
Table of Contents
| Consolidated Schedule of Investments | December 31, 2015 |
| AQR STYLE PREMIA ALTERNATIVE LV FUND |
| SECTOR | VALUE | % OF NET ASSETS | ||||||
| Consumer Discretionary | $ | (664,612 | ) | (0.4 | )% | |||
| Consumer Staples | 3,153,267 | 1.7 | ||||||
| Energy | (233,017 | ) | (0.1 | ) | ||||
| Financials | 3,675,333 | 2.0 | ||||||
| Health Care | 2,728,632 | 1.4 | ||||||
| Industrials | 2,088,595 | 1.1 | ||||||
| Information Technology | (2,095,370 | ) | (1.1 | ) | ||||
| Materials | (263,954 | ) | (0.1 | ) | ||||
| Telecommunication Services | 600,550 | 0.3 | ||||||
| Utilities | 570,601 | 0.3 | ||||||
| Money Market Funds | 116,829,809 | 62.2 | ||||||
| Short-Term Investments | 51,073,338 | 27.2 | ||||||
|
|
|
| |||||
| Total Investments In Securities, At Value | 177,463,172 | 94.5 | ||||||
| Other Assets in Excess of Liabilities (g) | 10,329,281 | 5.5 | ||||||
|
|
|
| |||||
Net Assets | $ | 187,792,453 | 100.0 | % | ||||
|
|
|
| |||||
| † | Non-income producing security. |
| (a) | All or a portion of this security has been segregated as collateral for securities sold short and can be sold or replaced subject to the broker’s right to re-hypothecate. At December 31, 2015, the value of these securities was $28,102,034. |
| (b) | Rule 144A, Section 4(2) or other security which is restricted as to resale to institutional investors. The Fund Adviser has deemed this security to be liquid based upon procedures approved by the Board of Trustees. |
| (c) | Represents less than 0.05% of net assets. |
| (d) | Represents annualized seven-day yield as of the close of the reporting period. |
| (e) | All or a portion of the security is pledged as collateral to the brokers for forward foreign currency exchange and swap contracts. |
| (f) | The rate shown is the effective yield at the date of purchase. |
| (g) | Includes appreciation/(depreciation) on forward foreign currency exchange, futures and swap contracts. |
| ^ | All or a portion represents positions held in the respective Subsidiary (See Note 2). |
All securities are Level 2 with respect to ASC 820 (See Note 5).
The following abbreviations are used in portfolio descriptions:
144A - Restricted Security
CVA - Dutch Certification
SDR - Special Drawing Rights
Total return swap contracts outstanding as of December 31, 2015:
Over the Counter
| COUNTERPARTY | UNDERLYING REFERENCE INSTRUMENT | TERMINATION DATE | CURRENCY | NOTIONAL VALUE | UNREALIZED APPRECIATION (DEPRECIATION) | |||||||||
| Goldman Sachs | BIST 30 February Futures | 02/2016 | TRY | 220,528 | $(2,312 | ) | ||||||||
| Bank of America | Bovespa Index February Futures | 02/2016 | BRL | (8,271,798 | ) | 94,917 | ||||||||
| CitiBank | Corn March Futures^ | 02/2016 | USD | (259,578 | ) | 8,446 | ||||||||
| CitiBank | Corn March Futures^ | 02/2016 | USD | 635,537 | (25,643 | ) | ||||||||
| Macquarie Capital | Corn March Futures^ | 02/2016 | USD | 1,962,240 | (78,803 | ) | ||||||||
| Societe Generale | Corn March Futures^ | 02/2016 | USD | 747,669 | (30,169 | ) | ||||||||
| Bank of America | Hang Seng Index January Futures | 01/2016 | HKD | 16,558,859 | (16,301 | ) | ||||||||
| Bank of America | H-SHARES Index January Futures | 01/2016 | HKD | (4,458,667 | ) | 11,794 | ||||||||
| Morgan Stanley and Co., International PLC | KOSPI Index 200 March Futures | 03/2016 | KRW | 2,863,404,316 | 18,530 | |||||||||
| Bank of America | MSCI Taiwan Stock Index January Futures | 01/2016 | USD | 799,295 | (7,855 | ) | ||||||||
| CitiBank | Soybean March Futures^ | 02/2016 | USD | 264,198 | (4,923 | ) | ||||||||
| Macquarie Capital | Soybean March Futures^ | 02/2016 | USD | 442,139 | (10,014 | ) | ||||||||
| Societe Generale | Soybean March Futures^ | 02/2016 | USD | 1,148,668 | (25,143 | ) | ||||||||
| Bank of America | Swiss Market Index March Futures | 03/2016 | CHF | (5,607,739 | ) | (165,823 | ) | |||||||
| Bank of America | Taiwan Stock Exchange January Futures | 01/2016 | TWD | 4,777,015 | 5,737 | |||||||||
| Bank of America | Tel Aviv 25 Index January Futures | 01/2016 | ILS | 1,809,825 | 6,354 | |||||||||
| Goldman Sachs | WIG20 Index March Futures | 03/2016 | PLN | 177,813 | 2,049 | |||||||||
|
| |||||||||||||
| $(219,159 | ) | |||||||||||||
|
| |||||||||||||
| ^ | Represents positions held in the respective Subsidiary (See Note 2). |
| The accompanying notes are an integral part of these financial statements. | (Continued) |
| AQR Funds | Annual Report | December 2015 | ||||||||||||||
292
Table of Contents
| Consolidated Schedule of Investments | December 31, 2015 |
| AQR STYLE PREMIA ALTERNATIVE LV FUND |
Open futures contracts outstanding at December 31, 2015:
Exchange Traded
| NUMBER OF CONTRACTS | COUNTERPARTY | DESCRIPTION | EXPIRATION DATE | VALUE AT TRADE DATE | VALUE AT DECEMBER 31, 2015 | UNREALIZED APPRECIATION (DEPRECIATION) | ||||||||||||||
| Long Contracts: | ||||||||||||||||||||
| 6 | J.P. Morgan | KOSPI Index 200 Futures | 03/2016 | $610,270 | $615,198 | $4,928 | ||||||||||||||
| 25 | Goldman Sachs | Brent Crude Futures^ | 01/2016 | 932,269 | 941,750 | 9,481 | ||||||||||||||
| 1 | Morgan Stanley and Co., International PLC | Corn Futures^ | 03/2016 | 18,327 | 17,938 | (389 | ) | |||||||||||||
| 16 | Morgan Stanley and Co., International PLC | Gold 100 OZ Futures^ | 02/2016 | 1,726,917 | 1,696,320 | (30,597 | ) | |||||||||||||
| 2 | J.P. Morgan | LME Copper Futures^ | 01/2016 | 266,980 | 235,445 | (31,535 | ) | |||||||||||||
| 1 | J.P. Morgan | LME Copper Futures^ | 01/2016 | 131,993 | 117,734 | (14,259 | ) | |||||||||||||
| 1 | J.P. Morgan | LME Copper Futures^ | 02/2016 | 124,939 | 117,772 | (7,167 | ) | |||||||||||||
| 7 | J.P. Morgan | LME Copper Futures^ | 02/2016 | 871,400 | 824,469 | (46,931 | ) | |||||||||||||
| 6 | J.P. Morgan | LME Copper Futures^ | 02/2016 | 738,816 | 706,688 | (32,128 | ) | |||||||||||||
| 6 | J.P. Morgan | LME Copper Futures^ | 02/2016 | 738,115 | 706,688 | (31,427 | ) | |||||||||||||
| 1 | J.P. Morgan | LME Copper Futures^ | 02/2016 | 121,579 | 117,781 | (3,798 | ) | |||||||||||||
| 1 | J.P. Morgan | LME Copper Futures^ | 02/2016 | 118,359 | 117,782 | (577 | ) | |||||||||||||
| 2 | J.P. Morgan | LME Copper Futures^ | 02/2016 | 233,156 | 235,563 | 2,407 | ||||||||||||||
| 1 | J.P. Morgan | LME Copper Futures^ | 02/2016 | 115,669 | 117,778 | 2,109 | ||||||||||||||
| 1 | J.P. Morgan | LME Copper Futures^ | 03/2016 | 116,640 | 117,724 | 1,084 | ||||||||||||||
| 27 | J.P. Morgan | LME Copper Futures^ | 03/2016 | 3,066,606 | 3,178,069 | 111,463 | ||||||||||||||
| 51 | Morgan Stanley and Co., International PLC | Silver Futures^ | 03/2016 | 3,592,305 | 3,519,765 | (72,540 | ) | |||||||||||||
| 24 | Morgan Stanley and Co., International PLC | Soybean Futures^ | 03/2016 | 1,041,360 | 1,037,100 | (4,260 | ) | |||||||||||||
| 8 | Morgan Stanley and Co., International PLC | WTI Crude Futures^ | 01/2016 | 295,185 | 296,320 | 1,135 | ||||||||||||||
| 235 | J.P. Morgan | BIST 30 Futures | 02/2016 | 742,099 | 717,756 | (24,343 | ) | |||||||||||||
| 128 | Barclays Capital | CAC40 Index Futures | 01/2016 | 6,411,577 | 6,452,338 | 40,761 | ||||||||||||||
| 2 | J.P. Morgan | FTSE Bursa Malaysia KLCI Index Futures | 01/2016 | 39,068 | 39,327 | 259 | ||||||||||||||
| 26 | Barclays Capital | FTSE/JSE Top 40 Index Futures | 03/2016 | 739,464 | 777,932 | 38,468 | ||||||||||||||
| 39 | Barclays Capital | Hang Seng Index Futures | 01/2016 | 5,541,073 | 5,512,803 | (28,270 | ) | |||||||||||||
| 22 | Barclays Capital | IBEX 35 Index Futures | 01/2016 | 2,301,615 | 2,277,596 | (24,019 | ) | |||||||||||||
| 7 | Barclays Capital | KOSPI Index 200 Futures | 03/2016 | 711,273 | 717,730 | 6,457 | ||||||||||||||
| 1 | J.P. Morgan | Mexican Stock Exchange Price and Quotation Index Futures | 03/2016 | 25,279 | 25,030 | (249 | ) | |||||||||||||
| 2 | Barclays Capital | MSCI Taiwan Stock Index Futures | 01/2016 | 61,439 | 60,880 | (559 | ) | |||||||||||||
| 22 | J.P. Morgan | S&P 500 E-Mini Futures | 03/2016 | 2,268,866 | 2,238,940 | (29,926 | ) | |||||||||||||
| 110 | Barclays Capital | TOPIX Index Futures | 03/2016 | 14,377,815 | 14,162,403 | (215,412 | ) | |||||||||||||
| 33 | Goldman Sachs | 10-Year Japanese Government Bond Futures | 03/2016 | 4,087,700 | 4,092,500 | 4,800 | ||||||||||||||
| 14 | Goldman Sachs | 10-Year Japanese Government Bond Futures | 03/2016 | 17,350,360 | 17,359,791 | 9,431 | ||||||||||||||
| 269 | J.P. Morgan | 90-Day EURODollar Futures | 06/2016 | 66,788,993 | 66,644,750 | (144,243 | ) | |||||||||||||
| 287 | J.P. Morgan | 90-Day EURODollar Futures | 09/2016 | 71,171,518 | 70,985,862 | (185,656 | ) | |||||||||||||
| 115 | J.P. Morgan | 90-Day EURODollar Futures | 12/2016 | 28,420,139 | 28,396,375 | (23,764 | ) | |||||||||||||
| The accompanying notes are an integral part of these financial statements. | (Continued) |
| AQR Funds | Annual Report | December 2015 | ||||||||||||||
293
Table of Contents
| Consolidated Schedule of Investments | December 31, 2015 |
| AQR STYLE PREMIA ALTERNATIVE LV FUND |
| NUMBER OF CONTRACTS | COUNTERPARTY | DESCRIPTION | EXPIRATION DATE | VALUE AT TRADE DATE | VALUE AT DECEMBER 31, 2015 | UNREALIZED APPRECIATION (DEPRECIATION) | ||||||||||||||
| Long Contracts: (continued) | ||||||||||||||||||||
| 130 | J.P. Morgan | Australia 3-Year Bond Futures | 03/2016 | $ 10,511,521 | $ 10,559,394 | $ 47,873 | ||||||||||||||
| 134 | Goldman Sachs | Canadian 10-Year Bond Futures | 03/2016 | 13,421,660 | 13,653,725 | 232,065 | ||||||||||||||
| 3 | J.P. Morgan | Canadian 3-Month Bank Acceptance Futures | 06/2016 | 537,506 | 537,905 | 399 | ||||||||||||||
| 18 | J.P. Morgan | Canadian 3-Month Bank Acceptance Futures | 09/2016 | 3,224,712 | 3,227,596 | 2,884 | ||||||||||||||
| 9 | Goldman Sachs | Euro - Bobl Futures | 03/2016 | 1,288,337 | 1,278,051 | (10,286 | ) | |||||||||||||
| 307 | Goldman Sachs | Euro - SCHATZ Futures | 03/2016 | 37,280,823 | 37,203,331 | (77,492 | ) | |||||||||||||
| 63 | Goldman Sachs | Long Gilt Futures | 03/2016 | 10,911,192 | 10,844,967 | (66,225 | ) | |||||||||||||
| 7 | Morgan Stanley and Co., International PLC | U.S. Treasury 10-Year Note Futures | 03/2016 | 881,228 | 881,343 | 115 | ||||||||||||||
| 351 | Morgan Stanley and Co., International PLC | U.S. Treasury 2-Year Note Futures | 03/2016 | 76,366,006 | 76,249,266 | (116,740 | ) | |||||||||||||
| 5 | Morgan Stanley and Co., International PLC | U.S. Treasury 5-Year Note Futures | 03/2016 | 592,883 | 591,601 | (1,282 | ) | |||||||||||||
|
|
|
|
|
| |||||||||||||||
| 390,915,031 | 390,207,076 | (707,955 | ) | |||||||||||||||||
|
|
|
|
|
| |||||||||||||||
| Short Contracts: | ||||||||||||||||||||
| 2 | J.P. Morgan | LME Copper Futures^ | 01/2016 | $(265,995 | ) | $(235,445 | ) | $30,550 | ||||||||||||
| 1 | J.P. Morgan | LME Copper Futures^ | 01/2016 | (131,570 | ) | (117,734 | ) | 13,836 | ||||||||||||
| 1 | J.P. Morgan | LME Copper Futures^ | 02/2016 | (125,048 | ) | (117,772 | ) | 7,276 | ||||||||||||
| 7 | J.P. Morgan | LME Copper Futures^ | 02/2016 | (871,483 | ) | (824,469 | ) | 47,014 | ||||||||||||
| 6 | J.P. Morgan | LME Copper Futures^ | 02/2016 | (739,485 | ) | (706,687 | ) | 32,798 | ||||||||||||
| 6 | J.P. Morgan | LME Copper Futures^ | 02/2016 | (738,732 | ) | (706,687 | ) | 32,045 | ||||||||||||
| 1 | J.P. Morgan | LME Copper Futures^ | 02/2016 | (120,748 | ) | (117,782 | ) | 2,966 | ||||||||||||
| 1 | J.P. Morgan | LME Copper Futures^ | 02/2016 | (118,651 | ) | (117,781 | ) | 870 | ||||||||||||
| 2 | J.P. Morgan | LME Copper Futures^ | 02/2016 | (234,083 | ) | (235,563 | ) | (1,480 | ) | |||||||||||
| 1 | J.P. Morgan | LME Copper Futures^ | 02/2016 | (116,017 | ) | (117,778 | ) | (1,761 | ) | |||||||||||
| 1 | J.P. Morgan | LME Copper Futures^ | 03/2016 | (116,760 | ) | (117,723 | ) | (963 | ) | |||||||||||
| 1 | J.P. Morgan | LME Copper Futures^ | 03/2016 | (116,623 | ) | (117,707 | ) | (1,084 | ) | |||||||||||
| 61 | Morgan Stanley and Co., International PLC | Natural Gas Futures^ | 01/2016 | (1,284,762 | ) | (1,425,569 | ) | (140,807 | ) | |||||||||||
| 40 | Barclays Capital | Amsterdam Index Futures | 01/2016 | (3,767,834 | ) | (3,841,444 | ) | (73,610 | ) | |||||||||||
| 12 | Barclays Capital | DAX Index Futures | 03/2016 | (3,388,000 | ) | (3,511,942 | ) | (123,942 | ) | |||||||||||
| 4 | Barclays Capital | Euro Stoxx 50 Index Futures | 03/2016 | (141,671 | ) | (142,669 | ) | (998 | ) | |||||||||||
| 59 | Barclays Capital | FTSE 100 Index Futures | 03/2016 | (5,293,040 | ) | (5,390,884 | ) | (97,844 | ) | |||||||||||
| 16 | Barclays Capital | FTSE/MIB Index Futures | 03/2016 | (1,835,489 | ) | (1,864,168 | ) | (28,679 | ) | |||||||||||
| 22 | Barclays Capital | H-SHARES Index Futures | 01/2016 | (1,399,157 | ) | (1,377,475 | ) | 21,682 | ||||||||||||
| 16 | J.P. Morgan | MSCI Singapore Index Futures | 01/2016 | (363,649 | ) | (365,160 | ) | (1,511 | ) | |||||||||||
| 288 | Barclays Capital | OMXS30 Index Futures | 01/2016 | (4,879,536 | ) | (4,940,193 | ) | (60,657 | ) | |||||||||||
| 48 | J.P. Morgan | S&P/Toronto Stock Exchange 60 Index Futures | 03/2016 | (5,225,957 | ) | (5,279,063 | ) | (53,106 | ) | |||||||||||
| 7 | J.P. Morgan | SET50 Index Futures | 03/2016 | (31,032 | ) | (30,914 | ) | 118 | ||||||||||||
| 71 | J.P. Morgan | SGX S&P CNX Nifty Index Futures | 01/2016 | (1,126,662 | ) | (1,128,616 | ) | (1,954 | ) | |||||||||||
| 5 | J.P. Morgan | SPI 200 Index Futures | 03/2016 | (460,868 | ) | (478,847 | ) | (17,979 | ) | |||||||||||
| 113 | J.P. Morgan | 3-Month Euro Euribor Futures | 06/2016 | (30,732,738 | ) | (30,755,949 | ) | (23,211 | ) | |||||||||||
| 181 | J.P. Morgan | 3-Month Euro Euribor Futures | 09/2016 | (49,230,774 | ) | (49,266,411 | ) | (35,637 | ) | |||||||||||
| 87 | J.P. Morgan | 3-Month Euro Euribor Futures | 12/2016 | (23,683,546 | ) | (23,678,176 | ) | 5,370 | ||||||||||||
| 281 | J.P. Morgan | 90-Day Sterling Futures | 06/2016 | (51,418,180 | ) | (51,398,093 | ) | 20,087 | ||||||||||||
| 222 | J.P. Morgan | 90-Day Sterling Futures | 09/2016 | (40,582,739 | ) | (40,553,140 | ) | 29,599 | ||||||||||||
| 70 | J.P. Morgan | 90-Day Sterling Futures | 12/2016 | (12,783,310 | ) | (12,767,677 | ) | 15,633 | ||||||||||||
| The accompanying notes are an integral part of these financial statements. | (Continued) |
| AQR Funds | Annual Report | December 2015 | ||||||||||||||
294
Table of Contents
| Consolidated Schedule of Investments | December 31, 2015 |
| AQR STYLE PREMIA ALTERNATIVE LV FUND |
| NUMBER OF CONTRACTS | COUNTERPARTY | DESCRIPTION | EXPIRATION DATE | VALUE AT TRADE DATE | VALUE AT DECEMBER 31, 2015 | UNREALIZED APPRECIATION (DEPRECIATION) | ||||||||||||||
| Short Contracts: (continued) | ||||||||||||||||||||
| 265 | J.P. Morgan | Australia 10-Year Bond Futures | 03/2016 | $(24,399,294 | ) | $(24,503,607 | ) | $(104,313 | ) | |||||||||||
| 3 | J.P. Morgan | Canadian 3-Month Bank Acceptance Futures | 03/2016 | (536,921 | ) | (537,716 | ) | (795 | ) | |||||||||||
| 123 | Goldman Sachs | Euro - Bund Futures | 03/2016 | (21,248,576 | ) | (21,109,206 | ) | 139,370 | ||||||||||||
| 19 | Goldman Sachs | Euro-Buxl 30-Year Bond Futures | 03/2016 | (3,191,541 | ) | (3,126,145 | ) | 65,396 | ||||||||||||
| 31 | Morgan Stanley and Co., International PLC | U.S. Treasury Long Bond Futures | 03/2016 | (4,759,622 | ) | (4,766,250 | ) | (6,628 | ) | |||||||||||
|
|
|
|
|
| |||||||||||||||
| (295,460,093 | ) | (295,772,442 | ) | (312,349 | ) | |||||||||||||||
|
|
|
|
|
| |||||||||||||||
| $95,454,938 | $94,434,634 | $(1,020,304 | ) | |||||||||||||||||
|
|
|
|
|
| |||||||||||||||
| ^ | Represents positions held in the respective Subsidiary (See Note 2). |
Forward foreign currency exchange contracts outstanding as of December 31, 2015:
Over the Counter
| PURCHASE CONTRACTS | COUNTERPARTY | CURRENCY | CURRENCY AMOUNT PURCHASED | VALUE AT SETTLEMENT DATE | VALUE AT DECEMBER 31, 2015 | UNREALIZED APPRECIATION (DEPRECIATION) | ||||||||||||||
| Australian Dollar, Expiring 03/16/16 | CitiBank | AUD | 2,046,500 | $1,474,905 | $1,485,960 | $11,055 | ||||||||||||||
| Australian Dollar, Expiring 03/16/16 | Credit Suisse International | AUD | 2,046,500 | 1,474,905 | 1,485,960 | 11,055 | ||||||||||||||
| Brazilian Real, Expiring 03/16/16* | CitiBank | BRL | 2,050,000 | 513,449 | 506,157 | (7,292 | ) | |||||||||||||
| Brazilian Real, Expiring 03/16/16* | Credit Suisse International | BRL | 2,050,000 | 513,450 | 506,157 | (7,293 | ) | |||||||||||||
| Canadian Dollar, Expiring 03/16/16 | CitiBank | CAD | 4,029,000 | 3,012,465 | 2,912,319 | (100,146 | ) | |||||||||||||
| Canadian Dollar, Expiring 03/16/16 | Credit Suisse International | CAD | 4,029,000 | 3,012,465 | 2,912,319 | (100,146 | ) | |||||||||||||
| Swiss Franc, Expiring 03/16/16 | CitiBank | CHF | 467,000 | 472,041 | 467,700 | (4,341 | ) | |||||||||||||
| Swiss Franc, Expiring 03/16/16 | Credit Suisse International | CHF | 892,000 | 900,737 | 893,337 | (7,400 | ) | |||||||||||||
| Euro, Expiring 03/16/16 | CitiBank | EUR | 1,081,500 | 1,151,437 | 1,177,480 | 26,043 | ||||||||||||||
| Euro, Expiring 03/16/16 | Credit Suisse International | EUR | 1,187,500 | 1,267,384 | 1,292,887 | 25,503 | ||||||||||||||
| British Pound, Expiring 03/16/16 | CitiBank | GBP | 1,302,000 | 1,953,811 | 1,919,640 | (34,171 | ) | |||||||||||||
| British Pound, Expiring 03/16/16 | Credit Suisse International | GBP | 1,302,000 | 1,953,811 | 1,919,640 | (34,171 | ) | |||||||||||||
| Hong Kong Dollar, Expiring 03/16/16 | CitiBank | HKD | 33,000 | 4,260 | 4,260 | — | ||||||||||||||
| Hong Kong Dollar, Expiring 03/16/16 | Credit Suisse International | HKD | 55,000 | 7,097 | 7,101 | 4 | ||||||||||||||
| Hungarian Forint, Expiring 03/16/16 | CitiBank | HUF | 57,000,000 | 196,730 | 196,188 | (542 | ) | |||||||||||||
| Hungarian Forint, Expiring 03/16/16 | Credit Suisse International | HUF | 57,000,000 | 196,730 | 196,188 | (542 | ) | |||||||||||||
| The accompanying notes are an integral part of these financial statements. | (Continued) |
| AQR Funds | Annual Report | December 2015 | ||||||||||||||
295
Table of Contents
| Consolidated Schedule of Investments | December 31, 2015 |
| AQR STYLE PREMIA ALTERNATIVE LV FUND |
| PURCHASE CONTRACTS | COUNTERPARTY | CURRENCY | CURRENCY AMOUNT PURCHASED | VALUE AT SETTLEMENT DATE | VALUE AT DECEMBER 31, 2015 | UNREALIZED APPRECIATION (DEPRECIATION) | ||||||||||||||
| Israeli Shekel, Expiring 03/16/16 | CitiBank | ILS | 800,000 | $ 209,113 | $ 205,909 | $ (3,204 | ) | |||||||||||||
| Israeli Shekel, Expiring 03/16/16 | Credit Suisse International | ILS | 800,000 | 208,872 | 205,909 | (2,963 | ) | |||||||||||||
| Indian Rupee, Expiring 03/16/16* | CitiBank | INR | 75,150,000 | 1,109,460 | 1,122,562 | 13,102 | ||||||||||||||
| Indian Rupee, Expiring 03/16/16* | Credit Suisse International | INR | 75,150,000 | 1,109,460 | 1,122,562 | 13,102 | ||||||||||||||
| Japanese Yen, Expiring 03/16/16 | CitiBank | JPY | 780,862,500 | 6,374,469 | 6,507,804 | 133,335 | ||||||||||||||
| Japanese Yen, Expiring 03/16/16 | Credit Suisse International | JPY | 780,862,500 | 6,374,469 | 6,507,804 | 133,335 | ||||||||||||||
| Korean Won, Expiring 03/16/16* | CitiBank | KRW | 230,000,000 | 196,148 | 195,838 | (310 | ) | |||||||||||||
| Korean Won, Expiring 03/16/16* | Credit Suisse International | KRW | 230,000,000 | 196,147 | 195,838 | (309 | ) | |||||||||||||
| Mexican Peso, Expiring 03/16/16 | CitiBank | MXN | 2,800,000 | 167,318 | 161,625 | (5,693 | ) | |||||||||||||
| Mexican Peso, Expiring 03/16/16 | Credit Suisse International | MXN | 2,800,000 | 167,302 | 161,625 | (5,677 | ) | |||||||||||||
| Norwegian Krone, Expiring 03/16/16 | Credit Suisse International | NOK | 796,000 | 91,391 | 89,864 | (1,527 | ) | |||||||||||||
| New Zealand Dollar, Expiring 03/16/16 | CitiBank | NZD | 3,914,500 | 2,587,866 | 2,665,537 | 77,671 | ||||||||||||||
| New Zealand Dollar, Expiring 03/16/16 | Credit Suisse International | NZD | 3,914,500 | 2,587,865 | 2,665,537 | 77,672 | ||||||||||||||
| Poland Zloty, Expiring 03/16/16 | CitiBank | PLN | 2,690,000 | 674,180 | 684,794 | 10,614 | ||||||||||||||
| Poland Zloty, Expiring 03/16/16 | Credit Suisse International | PLN | 2,690,000 | 674,181 | 684,794 | 10,613 | ||||||||||||||
| Swedish Krona, Expiring 03/16/16 | CitiBank | SEK | 3,118,500 | 367,459 | 370,198 | 2,739 | ||||||||||||||
| Swedish Krona, Expiring 03/16/16 | Credit Suisse International | SEK | 3,118,500 | 367,459 | 370,198 | 2,739 | ||||||||||||||
| Singapore Dollar, Expiring 03/16/16 | CitiBank | SGD | 465,000 | 330,596 | 327,174 | (3,422 | ) | |||||||||||||
| Singapore Dollar, Expiring 03/16/16 | Credit Suisse International | SGD | 465,000 | 330,597 | 327,174 | (3,423 | ) | |||||||||||||
| Turkish Lira, Expiring 03/16/16 | CitiBank | TRY | 7,640,000 | 2,561,577 | 2,567,158 | 5,581 | ||||||||||||||
| Turkish Lira, Expiring 03/16/16 | Credit Suisse International | TRY | 7,640,000 | 2,561,508 | 2,567,158 | 5,650 | ||||||||||||||
| New Taiwan Dollar, Expiring 03/16/16* | CitiBank | TWD | 9,450,000 | 289,166 | 287,931 | (1,235 | ) | |||||||||||||
| New Taiwan Dollar, Expiring 03/16/16* | Credit Suisse International | TWD | 9,450,000 | 289,169 | 287,931 | (1,238 | ) | |||||||||||||
| South African Rand, Expiring 03/16/16 | CitiBank | ZAR | 3,930,000 | 263,372 | 250,749 | (12,623 | ) | |||||||||||||
| South African Rand, Expiring 03/16/16 | Credit Suisse International | ZAR | 3,930,000 | 263,373 | 250,749 | (12,624 | ) | |||||||||||||
|
|
|
|
|
| |||||||||||||||
| $48,458,194 | $48,667,715 | $209,521 | ||||||||||||||||||
|
|
|
|
|
| |||||||||||||||
| The accompanying notes are an integral part of these financial statements. | (Continued) |
| AQR Funds | Annual Report | December 2015 | ||||||||||||||
296
Table of Contents
| Consolidated Schedule of Investments | December 31, 2015 |
| AQR STYLE PREMIA ALTERNATIVE LV FUND |
| SALES CONTRACTS | COUNTERPARTY | CURRENCY | CURRENCY AMOUNT SOLD | VALUE AT SETTLEMENT DATE | VALUE AT DECEMBER 31, 2015 | UNREALIZED APPRECIATION (DEPRECIATION) | ||||||||||||||
| Australian Dollar, Expiring 03/16/16 | CitiBank | AUD | (275,500 | ) | $(197,666 | ) | $(200,040 | ) | $(2,374 | ) | ||||||||||
| Australian Dollar, Expiring 03/16/16 | Credit Suisse International | AUD | (275,500 | ) | (197,668 | ) | (200,040 | ) | (2,372 | ) | ||||||||||
| Brazilian Real, Expiring 03/16/16* | CitiBank | BRL | (2,985,000 | ) | (752,586 | ) | (737,013 | ) | 15,573 | |||||||||||
| Brazilian Real, Expiring 03/16/16* | Credit Suisse International | BRL | (2,985,000 | ) | (752,593 | ) | (737,013 | ) | 15,580 | |||||||||||
| Canadian Dollar, Expiring 03/16/16 | CitiBank | CAD | (72,500 | ) | (53,345 | ) | (52,406 | ) | 939 | |||||||||||
| Canadian Dollar, Expiring 03/16/16 | Credit Suisse International | CAD | (72,500 | ) | (53,346 | ) | (52,406 | ) | 940 | |||||||||||
| Swiss Franc, Expiring 03/16/16 | CitiBank | CHF | (7,797,000 | ) | (7,808,542 | ) | (7,808,690 | ) | (148 | ) | ||||||||||
| Swiss Franc, Expiring 03/16/16 | Credit Suisse International | CHF | (7,811,000 | ) | (7,822,665 | ) | (7,822,711 | ) | (46 | ) | ||||||||||
| Danish Krone, Expiring 03/16/16 | CitiBank | DKK | (2,728,000 | ) | (397,327 | ) | (398,127 | ) | (800 | ) | ||||||||||
| Danish Krone, Expiring 03/16/16 | Credit Suisse International | DKK | (3,788,000 | ) | (552,592 | ) | (552,824 | ) | (232 | ) | ||||||||||
| Euro, Expiring 03/16/16 | CitiBank | EUR | (577,500 | ) | (619,019 | ) | (628,752 | ) | (9,733 | ) | ||||||||||
| Euro, Expiring 03/16/16 | Credit Suisse International | EUR | (602,500 | ) | (646,038 | ) | (655,970 | ) | (9,932 | ) | ||||||||||
| British Pound, Expiring 03/16/16 | CitiBank | GBP | (1,839,000 | ) | (2,759,059 | ) | (2,711,380 | ) | 47,679 | |||||||||||
| British Pound, Expiring 03/16/16 | Credit Suisse International | GBP | (1,839,000 | ) | (2,759,081 | ) | (2,711,380 | ) | 47,701 | |||||||||||
| Hong Kong Dollar, Expiring 03/16/16 | Credit Suisse International | HKD | (726,000 | ) | (93,704 | ) | (93,730 | ) | (26 | ) | ||||||||||
| Hungarian Forint, Expiring 03/16/16 | CitiBank | HUF | (5,000,000 | ) | (17,159 | ) | (17,209 | ) | (50 | ) | ||||||||||
| Hungarian Forint, Expiring 03/16/16 | Credit Suisse International | HUF | (5,000,000 | ) | (17,159 | ) | (17,209 | ) | (50 | ) | ||||||||||
| Israeli Shekel, Expiring 03/16/16 | CitiBank | ILS | (3,045,000 | ) | (787,298 | ) | (783,740 | ) | 3,558 | |||||||||||
| Israeli Shekel, Expiring 03/16/16 | Credit Suisse International | ILS | (3,045,000 | ) | (787,299 | ) | (783,740 | ) | 3,559 | |||||||||||
| Japanese Yen, Expiring 03/16/16 | CitiBank | JPY | (22,334,000 | ) | (182,138 | ) | (186,134 | ) | (3,996 | ) | ||||||||||
| Japanese Yen, Expiring 03/16/16 | Credit Suisse International | JPY | (50,864,000 | ) | (416,486 | ) | (423,906 | ) | (7,420 | ) | ||||||||||
| Korean Won, Expiring 03/16/16* | CitiBank | KRW | (2,458,500,000 | ) | (2,109,469 | ) | (2,093,349 | ) | 16,120 | |||||||||||
| Korean Won, Expiring 03/16/16* | Credit Suisse International | KRW | (2,458,500,000 | ) | (2,109,490 | ) | (2,093,349 | ) | 16,141 | |||||||||||
| Mexican Peso, Expiring 03/16/16 | CitiBank | MXN | (41,495,000 | ) | (2,477,856 | ) | (2,395,232 | ) | 82,624 | |||||||||||
| Mexican Peso, Expiring 03/16/16 | Credit Suisse International | MXN | (41,495,000 | ) | (2,477,851 | ) | (2,395,230 | ) | 82,621 | |||||||||||
| Norwegian Krone, Expiring 03/16/16 | CitiBank | NOK | (34,200,500 | ) | (3,940,302 | ) | (3,861,047 | ) | 79,255 | |||||||||||
| Norwegian Krone, Expiring 03/16/16 | Credit Suisse International | NOK | (34,200,500 | ) | (3,940,307 | ) | (3,861,048 | ) | 79,259 | |||||||||||
| New Zealand Dollar, Expiring 03/16/16 | CitiBank | NZD | (2,645,000 | ) | (1,752,657 | ) | (1,801,085 | ) | (48,428 | ) | ||||||||||
| The accompanying notes are an integral part of these financial statements. | (Continued) |
| AQR Funds | Annual Report | December 2015 | ||||||||||||||
297
Table of Contents
| Consolidated Schedule of Investments | December 31, 2015 |
| AQR STYLE PREMIA ALTERNATIVE LV FUND |
| SALES CONTRACTS | COUNTERPARTY | CURRENCY | CURRENCY AMOUNT SOLD | VALUE AT SETTLEMENT DATE | VALUE AT DECEMBER 31, 2015 | UNREALIZED APPRECIATION (DEPRECIATION) | ||||||||||||||
| New Zealand Dollar, Expiring 03/16/16 | Credit Suisse International | NZD | (2,645,000 | ) | $ (1,752,657 | ) | $ (1,801,085 | ) | $ (48,428 | ) | ||||||||||
| Poland Zloty, Expiring 03/16/16 | CitiBank | PLN | (150,000 | ) | (37,461 | ) | (38,186 | ) | (725 | ) | ||||||||||
| Poland Zloty, Expiring 03/16/16 | Credit Suisse International | PLN | (150,000 | ) | (37,460 | ) | (38,185 | ) | (725 | ) | ||||||||||
| Swedish Krona, Expiring 03/16/16 | CitiBank | SEK | (28,871,000 | ) | (3,332,266 | ) | (3,427,283 | ) | (95,017 | ) | ||||||||||
| Swedish Krona, Expiring 03/16/16 | Credit Suisse International | SEK | (29,513,000 | ) | (3,408,975 | ) | (3,503,495 | ) | (94,520 | ) | ||||||||||
| Singapore Dollar, Expiring 03/16/16 | CitiBank | SGD | (640,500 | ) | (452,596 | ) | (450,656 | ) | 1,940 | |||||||||||
| Singapore Dollar, Expiring 03/16/16 | Credit Suisse International | SGD | (640,500 | ) | (452,598 | ) | (450,657 | ) | 1,941 | |||||||||||
| Turkish Lira, Expiring 03/16/16 | CitiBank | TRY | (300,000 | ) | (98,704 | ) | (100,805 | ) | (2,101 | ) | ||||||||||
| Turkish Lira, Expiring 03/16/16 | Credit Suisse International | TRY | (300,000 | ) | (98,703 | ) | (100,805 | ) | (2,102 | ) | ||||||||||
| South African Rand, Expiring 03/16/16 | CitiBank | ZAR | (1,600,000 | ) | (109,292 | ) | (102,086 | ) | 7,206 | |||||||||||
| South African Rand, Expiring 03/16/16 | Credit Suisse International | ZAR | (1,600,000 | ) | (109,188 | ) | (102,086 | ) | 7,102 | |||||||||||
|
|
|
|
|
| |||||||||||||||
| (56,370,602 | ) | (56,190,089 | ) | 180,513 | ||||||||||||||||
|
|
|
|
|
| |||||||||||||||
| $(7,912,408 | ) | $(7,522,374 | ) | $390,034 | ||||||||||||||||
|
|
|
|
|
| |||||||||||||||
| * | Non-deliverable forward (See Note 4). |
AUD - Australian Dollar
BRL - Brazilian Real
CAD - Canadian Dollar
CHF - Swiss Franc
DKK - Danish Krone
EUR - Euro
GBP - British Pound
HKD - Hong Kong Dollar
HUF - Hungarian Forint
ILS - Israeli Shekel
INR - Indian Rupee
JPY - Japanese Yen
KRW - Korean Won
MXN - Mexican Peso
NOK - Norwegian Krone
NZD - New Zealand Dollar
PLN - Poland Zloty
SEK - Swedish Krona
SGD - Singapore Dollar
TRY - Turkish Lira
TWD - New Taiwan Dollar
USD - United States Dollar
ZAR - South African Rand
| The accompanying notes are an integral part of these financial statements. | (Continued) |
| AQR Funds | Annual Report | December 2015 | ||||||||||||||
298
Table of Contents
| Consolidated Schedule of Investments | December 31, 2015 |
| AQR STYLE PREMIA ALTERNATIVE LV FUND |
Total Return Basket Swaps* Outstanding at December 31, 2015
Over the Counter
| COUNTERPARTY | DESCRIPTION | TERMINATION DATE** | VALUE (Note 5) | |||||
| Goldman Sachs | The Fund receives the total return on a portfolio of long and short positions and pays or receives the LIBOR plus or minus a specified spread, which is denominated in USD based on the local currencies of the positions within the swaps. | 9 - 12 months maturity ranging from 01/11/2016 - 10/03/2016 | $1,155,438 | |||||
|
| |||||||
| * | See the accompanying “Additional Information — Total Return Basket Swap” for further details. |
| ** | The maturity dates are measured from the commencement of investment in each underlying swap position. |
Additional Information — Total Return Basket Swap
The following table represents the individual long and short positions and related values within the total return basket swap as of December 31, 2015.
| REFERENCE ENTITY | SHARES | NOTIONAL (a) | NET UNREALIZED APPRECIATION (DEPRECIATION) | |||||||||
| Long Positions | ||||||||||||
| Common Stocks | ||||||||||||
| Ireland | ||||||||||||
| Accenture PLC | 2,392 | $ | 242,336 | $ | 7,628 | |||||||
| Alkermes PLC | 1,348 | 81,670 | 25,335 | |||||||||
| King Digital Entertainment PLC | 4,592 | 63,258 | 18,847 | |||||||||
| XL Group PLC | 1,345 | 48,409 | 4,288 | |||||||||
|
| |||||||||||
| 56,098 | ||||||||||||
|
| |||||||||||
| Netherlands | ||||||||||||
| Frank’s International NV | 2,487 | 39,884 | 1,624 | |||||||||
|
| |||||||||||
| Panama | ||||||||||||
| Copa Holdings SA | 1,290 | 52,152 | 10,104 | |||||||||
|
| |||||||||||
| Puerto Rico | ||||||||||||
| Popular, Inc. | 6,364 | 189,123 | (8,767 | ) | ||||||||
|
| |||||||||||
| Singapore | ||||||||||||
| Avago Technologies Ltd. | 1,118 | 139,195 | 23,082 | |||||||||
| Flextronics International Ltd. | 17,921 | 191,785 | 9,109 | |||||||||
|
| |||||||||||
| 32,191 | ||||||||||||
|
| |||||||||||
| Sweden | ||||||||||||
| Autoliv, Inc. | 283 | 31,210 | 4,100 | |||||||||
|
| |||||||||||
| Switzerland | ||||||||||||
| ACE Ltd. | 200 | 20,684 | 2,686 | |||||||||
| Allied World Assurance Co. Holdings AG | 3,347 | 127,127 | (2,653 | ) | ||||||||
| TE Connectivity Ltd. | 1,300 | 75,946 | 8,047 | |||||||||
|
| |||||||||||
| 8,080 | ||||||||||||
|
| |||||||||||
| REFERENCE ENTITY | SHARES | NOTIONAL (a) | NET UNREALIZED APPRECIATION (DEPRECIATION) | |||||||||
| United Kingdom | ||||||||||||
| Delphi Automotive PLC | 2,595 | $ | 201,397 | $ | 21,073 | |||||||
| Noble Corp. PLC | 9,576 | 116,686 | (15,659 | ) | ||||||||
|
| |||||||||||
| 5,414 | ||||||||||||
|
| |||||||||||
| United States | ||||||||||||
| 3M Co. | 475 | 67,526 | 4,028 | |||||||||
| Aaron’s, Inc. | 7,868 | 257,793 | (81,628 | ) | ||||||||
| Abbott Laboratories | 5,781 | 239,929 | 19,695 | |||||||||
| AbbVie, Inc. | 1,972 | 106,661 | 10,160 | |||||||||
| ACI Worldwide, Inc. | 729 | 16,335 | (734 | ) | ||||||||
| Activision Blizzard, Inc. | 9,589 | 315,475 | 55,716 | |||||||||
| Acuity Brands, Inc. | 200 | 35,232 | 11,528 | |||||||||
| Advance Auto Parts, Inc. | 200 | 35,368 | (5,266 | ) | ||||||||
| Aetna, Inc. | 5,910 | 651,379 | (12,390 | ) | ||||||||
| Aflac, Inc. | 8,684 | 534,997 | (14,825 | ) | ||||||||
| AGCO Corp. | 10,479 | 476,713 | (1,071 | ) | ||||||||
| Air Lease Corp. | 3,806 | 126,337 | 1,088 | |||||||||
| Air Products & Chemicals, Inc. | 221 | 29,453 | (699 | ) | ||||||||
| Akamai Technologies, Inc. | 1,195 | 86,812 | (23,919 | ) | ||||||||
| Alaska Air Group, Inc. | 5,234 | 414,827 | 6,562 | |||||||||
| Alleghany Corp. | 54 | 25,658 | 150 | |||||||||
| Allstate Corp./The | 2,544 | 152,863 | 5,094 | |||||||||
| Alphabet, Inc. | 248 | 179,965 | 12,981 | |||||||||
| Amazon.com, Inc. | 130 | 67,004 | 20,862 | |||||||||
| AMC Networks, Inc. | 3,468 | 249,326 | 9,664 | |||||||||
| Amdocs Ltd. | 9,812 | 566,671 | (31,230 | ) | ||||||||
| AMERCO | 531 | 213,974 | (7,149 | ) | ||||||||
| Ameren Corp. | 6,608 | 289,200 | (3,536 | ) | ||||||||
| American Airlines Group, Inc. | 8,663 | 360,476 | 6,402 | |||||||||
| American Eagle Outfitters, Inc. | 19,273 | 298,488 | 243 | |||||||||
| American Electric Power Co., Inc. | 18,062 | 1,024,342 | 28,131 | |||||||||
| The accompanying notes are an integral part of these financial statements. | (Continued) |
| AQR Funds | Annual Report | December 2015 | ||||||||||||||
299
Table of Contents
| Consolidated Schedule of Investments | December 31, 2015 |
| AQR STYLE PREMIA ALTERNATIVE LV FUND |
| REFERENCE ENTITY | SHARES | NOTIONAL (a) | NET UNREALIZED APPRECIATION (DEPRECIATION) | |||||||||
| United States (continued) | ||||||||||||
| American Financial Group, Inc. | 2,767 | $ | 195,993 | $ | 3,453 | |||||||
| American International Group, Inc. | 2,115 | 125,053 | 6,013 | |||||||||
| Ameriprise Financial, Inc. | 2,307 | 254,023 | (8,513 | ) | ||||||||
| AmerisourceBergen Corp. | 5,795 | 563,144 | 37,856 | |||||||||
| Amgen, Inc. | 1,702 | 245,492 | 30,794 | |||||||||
| AmTrust Financial Services, Inc. | 6,624 | 418,768 | (10,862 | ) | ||||||||
| Analog Devices, Inc. | 739 | 42,921 | (2,039 | ) | ||||||||
| Anthem, Inc. | 5,923 | 838,589 | (12,686 | ) | ||||||||
| AO Smith Corp. | 3,753 | 262,502 | 25,016 | |||||||||
| Apple, Inc. | 2,282 | 260,843 | (20,639 | ) | ||||||||
| AptarGroup, Inc. | 164 | 11,105 | 809 | |||||||||
| Arch Capital Group Ltd. | 2,493 | 186,221 | (12,334 | ) | ||||||||
| Archer-Daniels-Midland Co. | 7,204 | 315,032 | (50,789 | ) | ||||||||
| Arrow Electronics, Inc. | 3,000 | 168,014 | (5,474 | ) | ||||||||
| Ashland, Inc. | 480 | 50,549 | (1,253 | ) | ||||||||
| Aspen Insurance Holdings Ltd. | 3,756 | 179,660 | 1,754 | |||||||||
| Associated Banc-Corp. | 635 | 11,741 | 166 | |||||||||
| Assurant, Inc. | 3,812 | 302,163 | 4,856 | |||||||||
| Assured Guaranty Ltd. | 14,490 | 377,842 | 5,129 | |||||||||
| Atmos Energy Corp. | 1,080 | 63,029 | 5,054 | |||||||||
| Atwood Oceanics, Inc. | 11,448 | 176,733 | (59,620 | ) | ||||||||
| AutoNation, Inc. | 1,937 | 115,663 | (102 | ) | ||||||||
| AutoZone, Inc. | 295 | 222,033 | (3,170 | ) | ||||||||
| Avery Dennison Corp. | 3,651 | 213,100 | 15,672 | |||||||||
| Avnet, Inc. | 7,700 | 337,545 | (7,677 | ) | ||||||||
| Axis Capital Holdings Ltd. | 5,289 | 286,907 | 10,441 | |||||||||
| Bank of Hawaii Corp. | 306 | 19,243 | 5 | |||||||||
| Bank of New York Mellon Corp./The | 9,196 | 382,732 | (3,673 | ) | ||||||||
| Bank of the Ozarks, Inc. | 516 | 26,246 | (725 | ) | ||||||||
| Baxalta, Inc. | 6,514 | 254,871 | (630 | ) | ||||||||
| Baxter International, Inc. | 1,514 | 52,675 | 5,084 | |||||||||
| BB&T Corp. | 1,617 | 58,417 | 2,721 | |||||||||
| Becton Dickinson and Co. | 597 | 80,701 | 11,291 | |||||||||
| Bed Bath & Beyond, Inc. | 791 | 45,625 | (7,460 | ) | ||||||||
| Bemis Co., Inc. | 7,053 | 304,458 | 10,740 | |||||||||
| Best Buy Co., Inc. | 9,251 | 321,758 | (40,065 | ) | ||||||||
| Big Lots, Inc. | 2,968 | 136,587 | (22,200 | ) | ||||||||
| Biogen, Inc. | 229 | 65,038 | 5,116 | |||||||||
| BioMarin Pharmaceutical, Inc. | 179 | 19,455 | (703 | ) | ||||||||
| Bio-Rad Laboratories, Inc. | 1,549 | 212,517 | 2,267 | |||||||||
| Boeing Co./The | 4,692 | 674,431 | 3,985 | |||||||||
| BOK Financial Corp. | 991 | 61,025 | (1,773 | ) | ||||||||
| Booz Allen Hamilton Holding Corp. | 2,000 | 54,340 | 7,360 | |||||||||
| Boston Scientific Corp. | 6,332 | 105,272 | 11,490 | |||||||||
| REFERENCE ENTITY | SHARES | NOTIONAL (a) | NET UNREALIZED APPRECIATION (DEPRECIATION) | |||||||||
| United States (continued) | ||||||||||||
| Brinker International, Inc. | 7,215 | $ | 366,362 | $ | (20,402 | ) | ||||||
| Bristol-Myers Squibb Co. | 758 | 52,921 | (778 | ) | ||||||||
| Broadridge Financial Solutions, Inc. | 4,305 | 243,578 | (12,270 | ) | ||||||||
| Brocade Communications Systems, Inc. | 33,439 | 343,386 | (36,416 | ) | ||||||||
| Bunge Ltd. | 5,761 | 421,487 | (28,126 | ) | ||||||||
| CA, Inc. | 6,672 | 183,285 | 7,267 | |||||||||
| Cabot Corp. | 1,432 | 57,087 | 1,453 | |||||||||
| Cadence Design Systems, Inc. | 7,835 | 167,255 | (4,209 | ) | ||||||||
| California Resources Corp. | 17,031 | 60,358 | (20,676 | ) | ||||||||
| Campbell Soup Co. | 350 | 17,979 | 413 | |||||||||
| Capital One Financial Corp. | 6,622 | 503,464 | (25,488 | ) | ||||||||
| Cardinal Health, Inc. | 2,205 | 180,309 | 16,531 | |||||||||
| Carlisle Cos., Inc. | 3,124 | 277,851 | (783 | ) | ||||||||
| Carnival Corp. | 9,245 | 472,131 | 31,537 | |||||||||
| Carter’s, Inc. | 1,646 | 150,520 | (3,977 | ) | ||||||||
| Casey’s General Stores, Inc. | 2,574 | 274,939 | 35,100 | |||||||||
| Catalent, Inc. | 2,732 | 69,845 | (1,463 | ) | ||||||||
| CDK Global, Inc. | 720 | 35,570 | (1,392 | ) | ||||||||
| CDW Corp. | 3,648 | 156,193 | (2,831 | ) | ||||||||
| Celanese Corp. | 5,599 | 361,270 | 15,710 | |||||||||
| Celgene Corp. | 731 | 83,736 | 3,809 | |||||||||
| Centene Corp. | 6,750 | 384,173 | 60,045 | |||||||||
| CenturyLink, Inc. | 1,463 | 37,549 | (739 | ) | ||||||||
| CF Industries Holdings, Inc. | 4,874 | 221,886 | (22,978 | ) | ||||||||
| Charles River Laboratories International, Inc. | 5,250 | 355,949 | 66,098 | |||||||||
| Cheesecake Factory, Inc./The | 5,141 | 265,823 | (28,771 | ) | ||||||||
| Church & Dwight Co., Inc. | 2,028 | 174,475 | (2,339 | ) | ||||||||
| Cinemark Holdings, Inc. | 3,843 | 125,738 | 2,733 | |||||||||
| Cintas Corp. | 2,913 | 263,646 | 1,582 | |||||||||
| Cisco Systems, Inc. | 20,348 | 553,580 | (1,030 | ) | ||||||||
| Citigroup, Inc. | 2,156 | 108,237 | 3,336 | |||||||||
| Citrix Systems, Inc. | 1,364 | 103,524 | (338 | ) | ||||||||
| Clorox Co./The | 2,707 | 321,164 | 22,164 | |||||||||
| CME Group, Inc. | 139 | 12,493 | 100 | |||||||||
| CMS Energy Corp. | 2,941 | 105,938 | 174 | |||||||||
| Cognizant Technology Solutions Corp. | 2,047 | 127,170 | (4,309 | ) | ||||||||
| Comcast Corp. | 4,635 | 272,125 | (10,572 | ) | ||||||||
| Commerce Bancshares, Inc. | 295 | 12,863 | (314 | ) | ||||||||
| Commercial Metals Co. | 21,515 | 305,078 | (10,538 | ) | ||||||||
| Computer Sciences Corp. | 3,571 | 116,469 | 231 | |||||||||
| ConAgra Foods, Inc. | 2,139 | 87,809 | 2,371 | |||||||||
| The accompanying notes are an integral part of these financial statements. | (Continued) |
| AQR Funds | Annual Report | December 2015 | ||||||||||||||
300
Table of Contents
| Consolidated Schedule of Investments | December 31, 2015 |
| AQR STYLE PREMIA ALTERNATIVE LV FUND |
| REFERENCE ENTITY | SHARES | NOTIONAL (a) | NET UNREALIZED APPRECIATION (DEPRECIATION) | |||||||||
| United States (continued) | ||||||||||||
| ConocoPhillips | 4,882 | $ | 238,494 | $ | (10,553 | ) | ||||||
| Consolidated Edison, Inc. | 10,739 | 713,102 | (22,906 | ) | ||||||||
| Constellation Brands, Inc. | 2,257 | 299,720 | 21,767 | |||||||||
| Convergys Corp. | 12,892 | 304,858 | 16,024 | |||||||||
| CoreLogic, Inc. | 3,794 | 143,247 | (14,783 | ) | ||||||||
| Corning, Inc. | 4,300 | 71,251 | 7,353 | |||||||||
| Costco Wholesale Corp. | 508 | 73,939 | 8,103 | |||||||||
| Coty, Inc. | 4,215 | 117,590 | (9,559 | ) | ||||||||
| CR Bard, Inc. | 1,729 | 326,187 | 1,355 | |||||||||
| Cracker Barrel Old Country Store, Inc. | 2,033 | 280,874 | (23,029 | ) | ||||||||
| Credit Acceptance Corp. | 1,058 | 220,591 | 5,843 | |||||||||
| Crown Holdings, Inc. | 5,285 | 263,617 | 4,332 | |||||||||
| CST Brands, Inc. | 2,968 | 101,859 | 14,308 | |||||||||
| CSX Corp. | 6,368 | 169,069 | (3,820 | ) | ||||||||
| Cummins, Inc. | 3,276 | 351,244 | (62,923 | ) | ||||||||
| CVR Energy, Inc. | 302 | 12,414 | (530 | ) | ||||||||
| CVS Health Corp. | 1,465 | 144,629 | (1,396 | ) | ||||||||
| Danaher Corp. | 3,070 | 266,049 | 19,093 | |||||||||
| Darden Restaurants, Inc. | 7,235 | 392,954 | 67,482 | |||||||||
| Dean Foods Co. | 17,660 | 310,554 | (7,685 | ) | ||||||||
| Deckers Outdoor Corp. | 1,669 | 96,799 | (18,022 | ) | ||||||||
| Delta Air Lines, Inc. | 7,617 | 359,369 | 26,736 | |||||||||
| Deluxe Corp. | 5,395 | 299,721 | (5,477 | ) | ||||||||
| DENTSPLY International, Inc. | 3,882 | 226,045 | 10,175 | |||||||||
| Devon Energy Corp. | 3,414 | 125,370 | (16,122 | ) | ||||||||
| DeVry Education Group, Inc. | 658 | 18,312 | (1,658 | ) | ||||||||
| Dick’s Sporting Goods, Inc. | 5,117 | 223,823 | (42,937 | ) | ||||||||
| Dillard’s, Inc. | 908 | 75,159 | (15,494 | ) | ||||||||
| Discover Financial Services | 981 | 51,160 | 1,441 | |||||||||
| Dollar General Corp. | 488 | 33,988 | 1,085 | |||||||||
| Dow Chemical Co./The | 8,071 | 415,093 | 402 | |||||||||
| DR Horton, Inc. | 12,163 | 369,889 | 19,692 | |||||||||
| Dr. Pepper Snapple Group, Inc. | 5,858 | 491,581 | 54,385 | |||||||||
| Dril-Quip, Inc. | 2,112 | 129,134 | (4,040 | ) | ||||||||
| DST Systems, Inc. | 2,292 | 252,310 | 9,116 | |||||||||
| DTE Energy Co. | 6,193 | 501,501 | (4,884 | ) | ||||||||
| Dun & Bradstreet Corp./The | 398 | 42,033 | (669 | ) | ||||||||
| East West Bancorp, Inc. | 1,102 | 43,166 | 2,633 | |||||||||
| Eastman Chemical Co. | 1,703 | 114,895 | 74 | |||||||||
| eBay, Inc. | 13,218 | 331,605 | 31,626 | |||||||||
| EchoStar Corp. | 317 | 13,280 | (882 | ) | ||||||||
| Edison International | 9,054 | 573,787 | (37,699 | ) | ||||||||
| Edwards Lifesciences Corp. | 1,198 | 82,279 | 12,339 | |||||||||
| Electronic Arts, Inc. | 3,914 | 275,758 | (6,788 | ) | ||||||||
| Eli Lilly & Co. | 3,707 | 309,118 | 3,234 | |||||||||
| Endurance Specialty Holdings Ltd. | 1,821 | 112,119 | 4,407 | |||||||||
| REFERENCE ENTITY | SHARES | NOTIONAL (a) | NET UNREALIZED APPRECIATION (DEPRECIATION) | |||||||||
| United States (continued) | ||||||||||||
| Energen Corp. | 2,552 | $ | 132,844 | $ | (28,237 | ) | ||||||
| Entergy Corp. | 2,025 | 130,893 | 7,536 | |||||||||
| EOG Resources, Inc. | 2,667 | 202,324 | (13,528 | ) | ||||||||
| EP Energy Corp. | 12,721 | 67,505 | (11,787 | ) | ||||||||
| Equifax, Inc. | 4,980 | 515,374 | 39,248 | |||||||||
| Everest Re Group Ltd. | 500 | 86,915 | 4,630 | |||||||||
| Eversource Energy | 1,645 | 82,617 | 1,393 | |||||||||
| Exelon Corp. | 9,807 | 289,310 | (16,970 | ) | ||||||||
| Expedia, Inc. | 661 | 82,876 | (714 | ) | ||||||||
| FactSet Research Systems, Inc. | 1,335 | 224,811 | (7,780 | ) | ||||||||
| Fair Isaac Corp. | 1,074 | 90,294 | 10,855 | |||||||||
| Fidelity National Information Services, Inc. | 1,133 | 78,063 | (9,403 | ) | ||||||||
| Fifth Third BanCorp. | 3,117 | 58,326 | 4,326 | |||||||||
| First American Financial Corp. | 6,650 | 259,701 | (20,966 | ) | ||||||||
| First Solar, Inc. | 5,947 | 316,035 | 76,408 | |||||||||
| FirstMerit Corp. | 1,281 | 22,958 | 933 | |||||||||
| Fiserv, Inc. | 1,814 | 164,828 | 1,081 | |||||||||
| Flowers Foods, Inc. | 11,250 | 275,846 | (34,083 | ) | ||||||||
| FNF Group | 9,667 | 341,927 | (6,772 | ) | ||||||||
| Foot Locker, Inc. | 6,452 | 461,032 | (41,071 | ) | ||||||||
| FTI Consulting, Inc. | 1,517 | 64,725 | (12,146 | ) | ||||||||
| Fulton Financial Corp. | 4,577 | 61,103 | (1,556 | ) | ||||||||
| GameStop Corp. | 12,263 | 484,376 | (140,521 | ) | ||||||||
| GATX Corp. | 1,140 | 51,456 | (2,949 | ) | ||||||||
| General Dynamics Corp. | 3,261 | 454,508 | (6,577 | ) | ||||||||
| General Mills, Inc. | 2,305 | 134,432 | (1,526 | ) | ||||||||
| General Motors Co. | 9,356 | 318,928 | (731 | ) | ||||||||
| Genpact Ltd. | 12,265 | 292,987 | 13,393 | |||||||||
| Gilead Sciences, Inc. | 3,179 | 326,884 | (5,201 | ) | ||||||||
| Global Payments, Inc. | 4,272 | 271,721 | 3,866 | |||||||||
| Goodyear Tire & Rubber Co./The | 14,548 | 454,044 | 21,239 | |||||||||
| Graham Holdings Co. | 597 | 342,928 | (53,401 | ) | ||||||||
| Graphic Packaging Holding Co. | 7,839 | 102,793 | (2,219 | ) | ||||||||
| H&R Block, Inc. | 2,631 | 96,408 | (8,769 | ) | ||||||||
| Hanover Insurance Group, Inc./The | 3,462 | 278,154 | 3,445 | |||||||||
| Harman International Industries, Inc. | 891 | 83,891 | 50 | |||||||||
| Harris Corp. | 138 | 10,143 | 1,849 | |||||||||
| Hartford Financial Services Group, Inc./The | 6,872 | 310,643 | (11,985 | ) | ||||||||
| Hasbro, Inc. | 584 | 42,086 | (2,748 | ) | ||||||||
| HCA Holdings, Inc. | 3,196 | 240,724 | (24,579 | ) | ||||||||
| Helmerich & Payne, Inc. | 2,542 | 137,706 | (1,582 | ) | ||||||||
| Herman Miller, Inc. | 3,449 | 102,069 | (3,083 | ) | ||||||||
| Hess Corp. | 1,798 | 92,734 | (5,567 | ) | ||||||||
| Hill-Rom Holdings, Inc. | 2,466 | 129,892 | (11,376 | ) | ||||||||
| HNI Corp. | 1,039 | 41,089 | (3,623 | ) | ||||||||
| HollyFrontier Corp. | 6,785 | 321,469 | (50,815 | ) | ||||||||
| Home Depot, Inc./The | 628 | 77,855 | 5,198 | |||||||||
| The accompanying notes are an integral part of these financial statements. | (Continued) |
| AQR Funds | Annual Report | December 2015 | ||||||||||||||
301
Table of Contents
| Consolidated Schedule of Investments | December 31, 2015 |
| AQR STYLE PREMIA ALTERNATIVE LV FUND |
| REFERENCE ENTITY | SHARES | NOTIONAL (a) | NET UNREALIZED APPRECIATION (DEPRECIATION) | |||||||||
| United States (continued) | ||||||||||||
| Hormel Foods Corp. | 4,598 | $ | 290,402 | $ | 73,208 | |||||||
| HP, Inc. | 18,313 | 247,115 | (30,289 | ) | ||||||||
| HSN, Inc. | 416 | 24,565 | (3,486 | ) | ||||||||
| Huntington Bancshares, Inc. | 10,077 | 105,033 | 6,418 | |||||||||
| Huntington Ingalls Industries, Inc. | 4,592 | 508,439 | 74,056 | |||||||||
| IAC/InterActiveCorp. | 1,124 | 74,809 | (7,313 | ) | ||||||||
| IDACORP, Inc. | 1,928 | 123,562 | 7,542 | |||||||||
| Illinois Tool Works, Inc. | 400 | 32,972 | 4,100 | |||||||||
| Ingram Micro, Inc. | 12,386 | 355,422 | 20,865 | |||||||||
| Ingredion, Inc. | 4,996 | 454,076 | 24,741 | |||||||||
| Integrated Device Technology, Inc. | 1,870 | 42,371 | 6,904 | |||||||||
| Intel Corp. | 4,100 | 118,121 | 23,124 | |||||||||
| Intercontinental Exchange, Inc. | 1,152 | 278,509 | 16,702 | |||||||||
| InterDigital, Inc. | 2,317 | 111,594 | 2,032 | |||||||||
| International Business Machines Corp. | 1,177 | 163,643 | (1,664 | ) | ||||||||
| International Flavors & Fragrances, Inc. | 721 | 78,235 | 8,025 | |||||||||
| International Game Technology PLC | 10,465 | 172,811 | (3,487 | ) | ||||||||
| Interpublic Group of Cos., Inc./The | 5,012 | 98,257 | 18,422 | |||||||||
| Intrexon Corp. | 9,395 | 310,852 | (27,592 | ) | ||||||||
| IPG Photonics Corp. | 598 | 45,364 | 7,953 | |||||||||
| ITT Corp. | 4,485 | 166,890 | (3,995 | ) | ||||||||
| Jabil Circuit, Inc. | 20,591 | 475,179 | 4,385 | |||||||||
| Jack Henry & Associates, Inc. | 2,388 | 181,733 | 4,674 | |||||||||
| Jack in the Box, Inc. | 212 | 16,018 | 244 | |||||||||
| Janus Capital Group, Inc. | 5,396 | 75,604 | 426 | |||||||||
| JetBlue Airways Corp. | 17,302 | 433,187 | (41,297 | ) | ||||||||
| JM Smucker Co./The | 480 | 58,709 | 494 | |||||||||
| John Wiley & Sons, Inc. | 2,036 | 97,995 | (6,314 | ) | ||||||||
| Johnson & Johnson | 1,261 | 123,308 | 6,222 | |||||||||
| Johnson Controls, Inc. | 3,294 | 144,595 | (14,515 | ) | ||||||||
| JPMorgan Chase & Co. | 5,531 | 341,183 | 24,029 | |||||||||
| Juniper Networks, Inc. | 7,887 | 238,487 | (20,806 | ) | ||||||||
| KAR Auction Services, Inc. | 326 | 12,314 | (242 | ) | ||||||||
| KeyCorp. | 5,146 | 68,337 | (461 | ) | ||||||||
| Kimberly-Clark Corp. | 603 | 69,314 | 7,448 | |||||||||
| Kohl’s Corp. | 1,066 | 50,848 | (75 | ) | ||||||||
| Kroger Co./The | 11,514 | 419,160 | 62,471 | |||||||||
| L Brands, Inc. | 926 | 86,402 | 2,328 | |||||||||
| L-3 Communications Holdings, Inc. | 1,580 | 167,047 | 21,779 | |||||||||
| Lam Research Corp. | 2,686 | 178,738 | 34,584 | |||||||||
| Lancaster Colony Corp. | 468 | 52,966 | 1,069 | |||||||||
| Landstar System, Inc. | 500 | 33,690 | (4,365 | ) | ||||||||
| Lear Corp. | 6,577 | 736,464 | 71,389 | |||||||||
| Leggett & Platt, Inc. | 1,897 | 79,407 | 305 | |||||||||
| Leidos Holdings, Inc. | 4,327 | 209,476 | 33,961 | |||||||||
| REFERENCE ENTITY | SHARES | NOTIONAL (a) | NET UNREALIZED APPRECIATION (DEPRECIATION) | |||||||||
| United States (continued) | ||||||||||||
| Lennar Corp. | 450 | $ | 22,120 | $ | (110 | ) | ||||||
| Lennox International, Inc. | 916 | 111,346 | 3,062 | |||||||||
| Lexmark International, Inc. | 1,000 | 28,540 | 3,910 | |||||||||
| LifePoint Health, Inc. | 807 | 56,535 | 2,699 | |||||||||
| Lincoln Electric Holdings, Inc. | 410 | 21,942 | (667 | ) | ||||||||
| Lincoln National Corp. | 2,029 | 97,372 | 4,606 | |||||||||
| Lockheed Martin Corp. | 949 | 198,321 | 7,754 | |||||||||
| Lowe’s Cos., Inc. | 1,592 | 109,343 | 11,713 | |||||||||
| LyondellBasell Industries NV | 7,523 | 686,403 | (32,654 | ) | ||||||||
| M&T Bank Corp. | 104 | 12,610 | (8 | ) | ||||||||
| Mallinckrodt PLC | 4,163 | 279,064 | 31,620 | |||||||||
| Manhattan Associates, Inc. | 2,357 | 156,063 | (101 | ) | ||||||||
| ManpowerGroup, Inc. | 2,150 | 185,817 | (4,594 | ) | ||||||||
| Marathon Oil Corp. | 2,711 | 42,776 | (8,645 | ) | ||||||||
| Marathon Petroleum Corp. | 8,409 | 401,199 | 34,723 | |||||||||
| Marriott International, Inc. | 550 | 37,770 | (898 | ) | ||||||||
| Marvell Technology Group Ltd. | 11,445 | 100,360 | 585 | |||||||||
| Masco Corp. | 3,861 | 108,321 | 945 | |||||||||
| MAXIMUS, Inc. | 2,415 | 149,137 | (13,294 | ) | ||||||||
| McCormick & Co., Inc. | 351 | 29,270 | 761 | |||||||||
| McGraw Hill Financial, Inc. | 619 | 54,636 | 6,385 | |||||||||
| McKesson Corp. | 484 | 92,697 | 2,762 | |||||||||
| MEDNAX, Inc. | 1,225 | 89,101 | (1,317 | ) | ||||||||
| Mentor Graphics Corp. | 12,367 | 280,814 | (53,014 | ) | ||||||||
| Merck & Co., Inc. | 2,166 | 109,415 | 4,993 | |||||||||
| MetLife, Inc. | 10,530 | 504,791 | 2,860 | |||||||||
| Mettler-Toledo International, Inc. | 35 | 10,075 | 1,795 | |||||||||
| Michaels Cos., Inc./The | 2,902 | 66,988 | (2,825 | ) | ||||||||
| Microsoft Corp. | 4,300 | 188,942 | 49,622 | |||||||||
| Minerals Technologies, Inc. | 2,923 | 143,395 | (9,346 | ) | ||||||||
| Mohawk Industries, Inc. | 556 | 103,996 | 1,305 | |||||||||
| Molina Healthcare, Inc. | 8,367 | 528,556 | (25,448 | ) | ||||||||
| Mosaic Co./The | 10,014 | 316,824 | (40,537 | ) | ||||||||
| MSCI, Inc. | 2,427 | 151,241 | 23,818 | |||||||||
| MSG Networks, Inc. | 9,202 | 186,917 | 4,484 | |||||||||
| Murphy Oil Corp. | 8,600 | 213,747 | (20,677 | ) | ||||||||
| Murphy USA, Inc. | 3,587 | 207,096 | 10,778 | |||||||||
| Mylan NV | 2,820 | 143,840 | 8,638 | |||||||||
| Nasdaq, Inc. | 6,333 | 352,192 | 16,199 | |||||||||
| NCR Corp. | 918 | 22,876 | (422 | ) | ||||||||
| NeuStar, Inc. | 6,804 | 178,404 | (15,312 | ) | ||||||||
| Newfield Exploration Co. | 3,824 | 133,037 | (8,528 | ) | ||||||||
| NewMarket Corp. | 62 | 22,952 | 653 | |||||||||
| News Corp. | 4,706 | 68,513 | (5,641 | ) | ||||||||
| NextEra Energy, Inc. | 2,860 | 280,214 | 16,912 | |||||||||
| NIKE, Inc. | 2,286 | 142,416 | 459 | |||||||||
| The accompanying notes are an integral part of these financial statements. | (Continued) |
| AQR Funds | Annual Report | December 2015 | ||||||||||||||
302
Table of Contents
| Consolidated Schedule of Investments | December 31, 2015 |
| AQR STYLE PREMIA ALTERNATIVE LV FUND |
| REFERENCE ENTITY | SHARES | NOTIONAL (a) | NET UNREALIZED APPRECIATION (DEPRECIATION) | |||||||||
| United States (continued) | ||||||||||||
| NiSource, Inc. | 22,670 | $ | 444,288 | $ | (1,996 | ) | ||||||
| Northern Trust Corp. | 1,672 | 114,838 | 5,697 | |||||||||
| Northrop Grumman Corp. | 3,563 | 609,154 | 63,576 | |||||||||
| Norwegian Cruise Line Holdings Ltd. | 1,499 | 90,959 | (3,118 | ) | ||||||||
| Nu Skin Enterprises, Inc. | 1,335 | 54,825 | (4,242 | ) | ||||||||
| Nuance Communications, Inc. | 6,752 | 136,725 | (2,427 | ) | ||||||||
| NVIDIA Corp. | 3,470 | 87,502 | 26,869 | |||||||||
| NVR, Inc. | 187 | 302,210 | 5,031 | |||||||||
| Old Republic International Corp. | 8,998 | 168,032 | (400 | ) | ||||||||
| Omnicom Group, Inc. | 1,667 | 112,877 | 13,248 | |||||||||
| ON Semiconductor Corp. | 6,840 | 66,546 | 486 | |||||||||
| ONE Gas, Inc. | 808 | 40,177 | 361 | |||||||||
| OneMain Holdings, Inc. | 2,978 | 130,124 | (6,418 | ) | ||||||||
| OPKO Health, Inc. | 11,110 | 117,348 | (5,693 | ) | ||||||||
| Oracle Corp. | 2,300 | 82,915 | 1,104 | |||||||||
| Orbital ATK, Inc. | 1,249 | 95,233 | 16,353 | |||||||||
| O’Reilly Automotive, Inc. | 744 | 189,547 | (1,003 | ) | ||||||||
| Oshkosh Corp. | 2,433 | 94,045 | 940 | |||||||||
| Owens Corning | 9,360 | 418,604 | 21,596 | |||||||||
| PACCAR, Inc. | 4,708 | 244,554 | (21,395 | ) | ||||||||
| Packaging Corp. of America | 188 | 11,512 | 341 | |||||||||
| Panera Bread Co. | 126 | 24,029 | 513 | |||||||||
| PAREXEL International Corp. | 1,106 | 74,058 | 1,283 | |||||||||
| Parker-Hannifin Corp. | 728 | 70,204 | 398 | |||||||||
| Patterson-UTI Energy, Inc. | 16,621 | 253,561 | (2,917 | ) | ||||||||
| Penske Automotive Group, Inc. | 2,226 | 107,446 | (13,197 | ) | ||||||||
| People’s United Financial, Inc. | 14,514 | 233,028 | 1,373 | |||||||||
| PepsiCo, Inc. | 2,037 | 190,157 | 13,380 | |||||||||
| Pfizer, Inc. | 12,026 | 386,942 | 1,258 | |||||||||
| PG&E Corp. | 11,977 | 632,149 | 4,908 | |||||||||
| Phillips 66 | 2,837 | 227,288 | 4,779 | |||||||||
| Pilgrim’s Pride Corp. | 8,097 | 165,653 | 13,210 | |||||||||
| Pinnacle Foods, Inc. | 6,767 | 297,232 | (9,905 | ) | ||||||||
| Pinnacle West Capital Corp. | 7,158 | 458,171 | 3,377 | |||||||||
| Plantronics, Inc. | 1,985 | 100,707 | (6,578 | ) | ||||||||
| PNC Financial Services Group, Inc./The | 7,588 | 674,944 | 48,269 | |||||||||
| PNM Resources, Inc. | 1,057 | 32,897 | (585 | ) | ||||||||
| Polycom, Inc. | 5,787 | 66,887 | 5,972 | |||||||||
| Post Holdings, Inc. | 1,185 | 73,779 | (665 | ) | ||||||||
| PPG Industries, Inc. | 400 | 35,336 | 4,192 | |||||||||
| PPL Corp. | 2,678 | 92,143 | (743 | ) | ||||||||
| Procter & Gamble Co./The | 920 | 66,856 | 6,201 | |||||||||
| Progressive Corp./The | 3,121 | 96,263 | 2,985 | |||||||||
| Prudential Financial, Inc. | 1,022 | 84,892 | (1,691 | ) | ||||||||
| REFERENCE ENTITY | SHARES | NOTIONAL (a) | NET UNREALIZED APPRECIATION (DEPRECIATION) | |||||||||
| United States (continued) | ||||||||||||
| Public Service Enterprise Group, Inc. | 25,816 | $ | 1,056,997 | $ | (58,176 | ) | ||||||
| PVH Corp. | 950 | 86,339 | (16,372 | ) | ||||||||
| QEP Resources, Inc. | 7,438 | 103,974 | (4,305 | ) | ||||||||
| Quest Diagnostics, Inc. | 704 | 44,802 | 5,281 | |||||||||
| Quintiles Transnational Holdings, Inc. | 7,211 | 504,633 | (9,526 | ) | ||||||||
| Rackspace Hosting, Inc. | 6,306 | 168,013 | (8,345 | ) | ||||||||
| Raytheon Co. | 3,373 | 389,864 | 30,176 | |||||||||
| Regal Entertainment Group | 1,885 | 34,278 | 1,292 | |||||||||
| Regeneron Pharmaceuticals, Inc. | 150 | 82,517 | (1,086 | ) | ||||||||
| Reinsurance Group of America, Inc. | 3,858 | 352,332 | (22,280 | ) | ||||||||
| Reliance Steel & Aluminum Co. | 7,747 | 440,637 | 7,992 | |||||||||
| RenaissanceRe Holdings Ltd. | 552 | 60,155 | 2,326 | |||||||||
| Republic Services, Inc. | 10,392 | 435,833 | 21,311 | |||||||||
| ResMed, Inc. | 677 | 36,915 | (567 | ) | ||||||||
| Robert Half International, Inc. | 2,222 | 112,623 | (7,878 | ) | ||||||||
| Rockwell Automation, Inc. | 1,080 | 110,671 | 148 | |||||||||
| Ross Stores, Inc. | 1,600 | 78,528 | 7,568 | |||||||||
| Rowan Cos. PLC | 14,751 | 262,950 | (12,921 | ) | ||||||||
| Royal Caribbean Cruises Ltd. | 3,207 | 293,203 | 31,378 | |||||||||
| Ryder System, Inc. | 6,146 | 440,031 | (90,754 | ) | ||||||||
| Sabre Corp. | 1,430 | 41,461 | (1,464 | ) | ||||||||
| SCANA Corp. | 8,089 | 461,645 | 27,658 | |||||||||
| Scotts Miracle-Gro Co./The | 1,393 | 85,653 | 4,210 | |||||||||
| SEI Investments Co. | 1,014 | 48,783 | 4,350 | |||||||||
| Sensient Technologies Corp. | 2,581 | 159,876 | 2,262 | |||||||||
| Service Corp. International | 4,774 | 134,941 | (10,722 | ) | ||||||||
| ServiceMaster Global Holdings, Inc. | 800 | 26,978 | 4,414 | |||||||||
| Sherwin-Williams Co./The | 236 | 53,869 | 7,396 | |||||||||
| Skechers U.S.A., Inc. | 10,778 | 377,065 | (51,462 | ) | ||||||||
| Skyworks Solutions, Inc. | 4,101 | 329,195 | (14,115 | ) | ||||||||
| SM Energy Co. | 3,680 | 95,870 | (23,521 | ) | ||||||||
| Snap-on, Inc. | 1,068 | 165,414 | 17,673 | |||||||||
| Sonoco Products Co. | 4,415 | 174,796 | 5,645 | |||||||||
| Southwest Airlines Co. | 4,274 | 165,295 | 18,744 | |||||||||
| Spectrum Brands Holdings, Inc. | 900 | 83,754 | 7,866 | |||||||||
| Spirit AeroSystems Holdings, Inc. | 15,482 | 781,365 | (6,181 | ) | ||||||||
| Spirit Airlines, Inc. | 965 | 35,457 | 2,998 | |||||||||
| Sprint Corp. | 7,721 | 29,650 | (1,700 | ) | ||||||||
| The accompanying notes are an integral part of these financial statements. | (Continued) |
| AQR Funds | Annual Report | December 2015 | ||||||||||||||
303
Table of Contents
| Consolidated Schedule of Investments | December 31, 2015 |
| AQR STYLE PREMIA ALTERNATIVE LV FUND |
| REFERENCE ENTITY | SHARES | NOTIONAL (a) | NET UNREALIZED APPRECIATION (DEPRECIATION) | |||||||||
| United States (continued) | ||||||||||||
| SS&C Technologies Holdings, Inc. | 1,513 | $ | 107,969 | $ | (4,676 | ) | ||||||
| St. Jude Medical, Inc. | 590 | 37,225 | (781 | ) | ||||||||
| Stanley Black & Decker, Inc. | 1,325 | 138,706 | 2,711 | |||||||||
| Starbucks Corp. | 611 | 35,290 | 1,388 | |||||||||
| State Street Corp. | 2,004 | 133,328 | (343 | ) | ||||||||
| STERIS PLC | 3,731 | 250,000 | 31,093 | |||||||||
| Stryker Corp. | 1,917 | 182,498 | (4,332 | ) | ||||||||
| SunTrust Banks, Inc. | 9,768 | 380,981 | 37,481 | |||||||||
| Superior Energy Services, Inc. | 4,209 | 57,327 | (631 | ) | ||||||||
| SUPERVALU, Inc. | 23,858 | 162,638 | (881 | ) | ||||||||
| Synaptics, Inc. | 1,213 | 102,061 | (4,608 | ) | ||||||||
| Synchrony Financial | 5,896 | 184,243 | (4,945 | ) | ||||||||
| Synopsys, Inc. | 5,538 | 260,617 | (8,029 | ) | ||||||||
| Sysco Corp. | 400 | 15,892 | 508 | |||||||||
| Talen Energy Corp. | 10,429 | 105,530 | (40,557 | ) | ||||||||
| Target Corp. | 6,807 | 525,118 | (30,862 | ) | ||||||||
| Tech Data Corp. | 6,742 | 470,661 | (23,127 | ) | ||||||||
| TEGNA, Inc. | 12,818 | 296,291 | 30,824 | |||||||||
| Teledyne Technologies, Inc. | 651 | 57,537 | 206 | |||||||||
| Teleflex, Inc. | 2,520 | 322,716 | 8,538 | |||||||||
| Telephone & Data Systems, Inc. | 3,919 | 101,494 | (32 | ) | ||||||||
| Teradyne, Inc. | 2,213 | 42,378 | 3,365 | |||||||||
| Tesoro Corp. | 4,198 | 428,546 | 13,797 | |||||||||
| Texas Instruments, Inc. | 215 | 10,294 | 1,490 | |||||||||
| Textron, Inc. | 1,793 | 77,193 | (1,869 | ) | ||||||||
| Thomson Reuters Corp. | 3,084 | 124,388 | (7,658 | ) | ||||||||
| Thor Industries, Inc. | 2,412 | 125,898 | 9,535 | |||||||||
| Time Warner, Inc. | 451 | 30,582 | (1,416 | ) | ||||||||
| Time, Inc. | 10,567 | 189,967 | (24,382 | ) | ||||||||
| TJX Cos., Inc./The | 425 | 30,483 | (346 | ) | ||||||||
| T-Mobile US, Inc. | 4,411 | 174,138 | (1,580 | ) | ||||||||
| TopBuild Corp. | 2,745 | 81,145 | 3,329 | |||||||||
| Torchmark Corp. | 5,189 | �� | 294,558 | 2,046 | ||||||||
| Toro Co./The | 1,001 | 74,577 | (1,434 | ) | ||||||||
| Total System Services, Inc. | 8,956 | 428,682 | 17,327 | |||||||||
| Transocean Ltd. | 2,076 | 26,877 | (1,176 | ) | ||||||||
| Travelers Cos., Inc./The | 5,294 | 546,487 | 50,994 | |||||||||
| Trinity Industries, Inc. | 13,384 | 335,675 | (14,192 | ) | ||||||||
| Trustmark Corp. | 3,201 | 75,477 | (1,726 | ) | ||||||||
| Tupperware Brands Corp. | 2,058 | 108,765 | 5,762 | |||||||||
| Tyler Technologies, Inc. | 498 | 86,295 | 517 | |||||||||
| Tyson Foods, Inc. | 9,981 | 445,194 | 87,093 | |||||||||
| UGI Corp. | 2,001 | 68,695 | (1,141 | ) | ||||||||
| Ulta Salon Cosmetics & Fragrance, Inc. | 67 | 11,172 | 1,223 | |||||||||
| United Parcel Service, Inc. | 1,205 | 123,208 | (7,250 | ) | ||||||||
| United Therapeutics Corp. | 2,752 | 399,680 | 31,310 | |||||||||
| REFERENCE ENTITY | SHARES | NOTIONAL (a) | NET UNREALIZED APPRECIATION (DEPRECIATION) | |||||||||
| United States (continued) | ||||||||||||
| UnitedHealth Group, Inc. | 4,610 | $ | 535,775 | $ | 6,545 | |||||||
| Universal Health Services, Inc. | 1,218 | 146,171 | (633 | ) | ||||||||
| Unum Group | 1,721 | 56,941 | 351 | |||||||||
| US Bancorp. | 4,438 | 182,374 | 6,995 | |||||||||
| Valero Energy Corp. | 11,013 | 677,940 | 100,789 | |||||||||
| Validus Holdings Ltd. | 6,089 | 272,162 | 9,698 | |||||||||
| Valmont Industries, Inc. | 572 | 59,123 | 1,521 | |||||||||
| Valspar Corp./The | 300 | 21,861 | 3,024 | |||||||||
| Vantiv, Inc. | 2,235 | 103,847 | 2,137 | |||||||||
| Varian Medical Systems, Inc. | 394 | 29,673 | 2,163 | |||||||||
| Vectren Corp. | 900 | 36,792 | 1,386 | |||||||||
| VeriSign, Inc. | 3,586 | 278,158 | 35,115 | |||||||||
| Verizon Communications, Inc. | 2,485 | 111,389 | 3,468 | |||||||||
| VF Corp. | 194 | 13,574 | (1,498 | ) | ||||||||
| Visa, Inc. | 643 | 44,540 | 5,325 | |||||||||
| Vishay Intertechnology, Inc. | 1,018 | 9,969 | 2,298 | |||||||||
| Voya Financial, Inc. | 3,300 | 131,344 | (9,541 | ) | ||||||||
| VWR Corp. | 1,999 | 55,209 | 1,382 | |||||||||
| Wabtec Corp. | 547 | 47,558 | (8,656 | ) | ||||||||
| Wal-Mart Stores, Inc. | 4,788 | 299,198 | (5,694 | ) | ||||||||
| Walt Disney Co./The | 1,030 | 110,428 | (2,196 | ) | ||||||||
| Waste Connections, Inc. | 1,715 | 98,144 | (1,556 | ) | ||||||||
| Waste Management, Inc. | 12,562 | 633,414 | 37,020 | |||||||||
| Waters Corp. | 1,469 | 172,911 | 24,787 | |||||||||
| WellCare Health Plans, Inc. | 1,949 | 160,657 | (8,226 | ) | ||||||||
| Wells Fargo & Co. | 6,055 | 311,370 | 17,779 | |||||||||
| Werner Enterprises, Inc. | 14,562 | 371,121 | (30,516 | ) | ||||||||
| West Pharmaceutical Services, Inc. | 963 | 58,876 | (884 | ) | ||||||||
| Western Digital Corp. | 3,870 | 260,130 | (27,737 | ) | ||||||||
| Western Refining, Inc. | �� | 5,996 | 256,114 | (42,536 | ) | |||||||
| Western Union Co./The | 2,631 | 47,910 | (789 | ) | ||||||||
| Westlake Chemical Corp. | 3,426 | 195,783 | (9,683 | ) | ||||||||
| WGL Holdings, Inc. | 5,748 | 325,898 | 36,168 | |||||||||
| Whirlpool Corp. | 2,568 | 392,715 | (15,552 | ) | ||||||||
| White Mountains Insurance Group Ltd. | 80 | 59,953 | (1,808 | ) | ||||||||
| Woodward, Inc. | 1,485 | 62,728 | 11,017 | |||||||||
| World Fuel Services Corp. | 4,877 | 178,628 | 8,942 | |||||||||
| WR Berkley Corp. | 400 | 21,760 | 140 | |||||||||
| Wyndham Worldwide Corp. | 970 | 75,399 | (4,929 | ) | ||||||||
| Xcel Energy, Inc. | 22,228 | 788,981 | 9,226 | |||||||||
| Xilinx, Inc. | 1,242 | 60,310 | (1,973 | ) | ||||||||
|
| |||||||||||
| 432,265 | ||||||||||||
|
| |||||||||||
Total of Long Equity Positions | 541,109 | |||||||||||
|
| |||||||||||
| The accompanying notes are an integral part of these financial statements. | (Continued) |
| AQR Funds | Annual Report | December 2015 | ||||||||||||||
304
Table of Contents
| Consolidated Schedule of Investments | December 31, 2015 |
| AQR STYLE PREMIA ALTERNATIVE LV FUND |
| REFERENCE ENTITY | SHARES | NOTIONAL (a) | NET UNREALIZED APPRECIATION (DEPRECIATION) | |||||||||
| Short Positions | ||||||||||||
| Common Stocks | ||||||||||||
| Canada | ||||||||||||
| lululemon athletica, Inc. | (2,085 | ) | $ | (109,259 | ) | $ | (141 | ) | ||||
|
| |||||||||||
| Ireland | ||||||||||||
| Allegion PLC | (3,675 | ) | (240,975 | ) | (1,281 | ) | ||||||
| Endo International PLC | (5,841 | ) | (376,759 | ) | 19,173 | |||||||
| Jazz Pharmaceuticals PLC | (1,315 | ) | (174,915 | ) | (9,922 | ) | ||||||
| Medtronic PLC | (2,837 | ) | (201,055 | ) | (17,167 | ) | ||||||
|
| |||||||||||
| (9,197 | ) | |||||||||||
|
| |||||||||||
| Netherlands | ||||||||||||
| Chicago Bridge & Iron Co. NV | (993 | ) | (39,636 | ) | 919 | |||||||
| Core Laboratories NV | (1,174 | ) | (127,762 | ) | 102 | |||||||
| QIAGEN NV | (5,471 | ) | (140,415 | ) | (10,858 | ) | ||||||
| Sensata Technologies Holding NV | (8,290 | ) | (370,910 | ) | (10,928 | ) | ||||||
|
| |||||||||||
| (20,765 | ) | |||||||||||
|
| |||||||||||
| Norway | ||||||||||||
| Golar LNG Ltd. | (20,031 | ) | (458,295 | ) | 142,005 | |||||||
|
| |||||||||||
| Switzerland | ||||||||||||
| Weatherford International PLC | (53,493 | ) | (477,786 | ) | 28,980 | |||||||
|
| |||||||||||
| United Kingdom | ||||||||||||
| Aon PLC | (6,600 | ) | (600,066 | ) | (8,520 | ) | ||||||
| Ensco PLC | (16,106 | ) | (234,377 | ) | (13,495 | ) | ||||||
| Liberty Global PLC | (3,170 | ) | (130,337 | ) | (3,944 | ) | ||||||
| Michael Kors Holdings Ltd. | (2,891 | ) | (118,714 | ) | 2,901 | |||||||
| Pentair PLC | (3,878 | ) | (209,464 | ) | 17,387 | |||||||
|
| |||||||||||
| (5,671 | ) | |||||||||||
|
| |||||||||||
| United States | ||||||||||||
| 3D Systems Corp. | (4,948 | ) | (44,965 | ) | 1,967 | |||||||
| Abercrombie & Fitch Co. | (6,534 | ) | (143,552 | ) | (32,866 | ) | ||||||
| Acadia Healthcare Co., Inc. | (2,811 | ) | (191,289 | ) | 15,714 | |||||||
| Acxiom Corp. | (4,659 | ) | (91,875 | ) | (5,591 | ) | ||||||
| Adobe Systems, Inc. | (1,051 | ) | (88,138 | ) | (10,593 | ) | ||||||
| ADT Corp./The | (5,213 | ) | (162,279 | ) | (9,645 | ) | ||||||
| AECOM | (4,378 | ) | (117,469 | ) | (14,003 | ) | ||||||
| AES Corp. | (14,037 | ) | (145,001 | ) | 10,667 | |||||||
| Agilent Technologies, Inc. | (5,311 | ) | (192,347 | ) | (29,706 | ) | ||||||
| Agios Pharmaceuticals, Inc. | (3,603 | ) | (235,777 | ) | 1,870 | |||||||
| Akorn, Inc. | (14,535 | ) | (407,200 | ) | (135,100 | ) | ||||||
| Albemarle Corp. | (8,636 | ) | (388,662 | ) | (95,041 | ) | ||||||
| Alcoa, Inc. | (24,367 | ) | (227,961 | ) | (12,541 | ) | ||||||
| Alere, Inc. | (5,809 | ) | (256,616 | ) | 29,542 | |||||||
| Alexion Pharmaceuticals, Inc. | (1,478 | ) | (254,112 | ) | (27,816 | ) | ||||||
| REFERENCE ENTITY | SHARES | NOTIONAL (a) | NET UNREALIZED APPRECIATION (DEPRECIATION) | |||||||||
| United States (continued) | ||||||||||||
| Align Technology, Inc. | (6,122 | ) | $ | (369,553 | ) | $ | (33,581 | ) | ||||
| Allegheny Technologies, Inc. | (11,541 | ) | (170,816 | ) | 40,979 | |||||||
| Alliance Data Systems Corp. | (959 | ) | (257,423 | ) | (7,807 | ) | ||||||
| Alliant Energy Corp. | (350 | ) | (21,653 | ) | (204 | ) | ||||||
| Allison Transmission Holdings, Inc. | (3,141 | ) | (82,172 | ) | 851 | |||||||
| Allscripts Healthcare Solutions, Inc. | (5,668 | ) | (72,214 | ) | (14,960 | ) | ||||||
| Ally Financial, Inc. | (652 | ) | (13,517 | ) | 1,364 | |||||||
| Alnylam Pharmaceuticals, Inc. | (3,667 | ) | (300,344 | ) | (44,868 | ) | ||||||
| American Express Co. | (1,292 | ) | (94,060 | ) | 4,202 | |||||||
| AMETEK, Inc. | (466 | ) | (25,064 | ) | 91 | |||||||
| Amphenol Corp. | (4,421 | ) | (236,532 | ) | 5,623 | |||||||
| Anadarko Petroleum Corp. | (4,235 | ) | (246,207 | ) | 40,471 | |||||||
| Apache Corp. | (2,470 | ) | (101,205 | ) | (8,636 | ) | ||||||
| Apollo Education Group, Inc. | (5,071 | ) | (44,468 | ) | 5,574 | |||||||
| Applied Materials, Inc. | (14,048 | ) | (229,959 | ) | (32,317 | ) | ||||||
| Arista Networks, Inc. | (2,673 | ) | (192,465 | ) | (15,601 | ) | ||||||
| Armstrong World Industries, Inc. | (1,700 | ) | (86,207 | ) | 8,466 | |||||||
| ARRIS Group, Inc. | (2,546 | ) | (67,247 | ) | (10,584 | ) | ||||||
| Arthur J Gallagher & Co. | (7,043 | ) | (297,452 | ) | 9,112 | |||||||
| Artisan Partners Asset Management, Inc. | (4,409 | ) | (159,363 | ) | 374 | |||||||
| Ascena Retail Group, Inc. | (3,151 | ) | (32,577 | ) | 1,539 | |||||||
| Autodesk, Inc. | (6,463 | ) | (307,031 | ) | (86,759 | ) | ||||||
| Automatic Data Processing, Inc. | (2,280 | ) | (194,135 | ) | 974 | |||||||
| Avis Budget Group, Inc. | (333 | ) | (12,203 | ) | 118 | |||||||
| Avon Products, Inc. | (47,941 | ) | (162,872 | ) | (31,289 | ) | ||||||
| B/E Aerospace, Inc. | (17,748 | ) | (792,170 | ) | 40,188 | |||||||
| Ball Corp. | (5,102 | ) | (345,270 | ) | (25,798 | ) | ||||||
| BancorpSouth, Inc. | (2,300 | ) | (54,648 | ) | (529 | ) | ||||||
| Bank of America Corp. | (16,859 | ) | (259,162 | ) | (24,575 | ) | ||||||
| BankUnited, Inc. | (1,788 | ) | (64,779 | ) | 304 | |||||||
| Belden, Inc. | (3,503 | ) | (168,491 | ) | 1,467 | |||||||
| Bio-Techne Corp. | (2,888 | ) | (266,047 | ) | 6,127 | |||||||
| Black Hills Corp. | (2,772 | ) | (117,382 | ) | (11,322 | ) | ||||||
| Black Knight Financial Services, Inc. | (7,955 | ) | (258,408 | ) | (4,585 | ) | ||||||
| BlackRock, Inc. | (88 | ) | (29,578 | ) | (388 | ) | ||||||
| Bluebird Bio, Inc. | (2,182 | ) | (202,964 | ) | 62,836 | |||||||
| BorgWarner, Inc. | (12,848 | ) | (532,458 | ) | (22,962 | ) | ||||||
| Brookdale Senior Living, Inc. | (17,853 | ) | (396,387 | ) | 66,820 | |||||||
| Brown & Brown, Inc. | (5,377 | ) | (168,432 | ) | (4,170 | ) | ||||||
| Brown-Forman Corp. | (851 | ) | (86,058 | ) | 1,570 | |||||||
| Bruker Corp. | (11,185 | ) | (198,244 | ) | (73,216 | ) | ||||||
| Brunswick Corp. | (923 | ) | (43,950 | ) | (2,671 | ) | ||||||
| Buffalo Wild Wings, Inc. | (512 | ) | (82,547 | ) | 806 | |||||||
| BWX Technologies, Inc. | (5,079 | ) | (142,381 | ) | (18,978 | ) | ||||||
| The accompanying notes are an integral part of these financial statements. | (Continued) |
| AQR Funds | Annual Report | December 2015 | ||||||||||||||
305
Table of Contents
| Consolidated Schedule of Investments | December 31, 2015 |
| AQR STYLE PREMIA ALTERNATIVE LV FUND |
| REFERENCE ENTITY | SHARES | NOTIONAL (a) | NET UNREALIZED APPRECIATION (DEPRECIATION) | |||||||||
| United States (continued) | ||||||||||||
| Cabela’s, Inc. | (10,440 | ) | $ | (402,883 | ) | $ | (84,979 | ) | ||||
| Cable One, Inc. | (124 | ) | (55,033 | ) | 1,259 | |||||||
| Cabot Oil & Gas Corp. | (17,682 | ) | (332,086 | ) | 19,291 | |||||||
| CalAtlantic Group, Inc. | (8,732 | ) | (347,893 | ) | 16,775 | |||||||
| Calpine Corp. | (18,688 | ) | (271,831 | ) | 1,416 | |||||||
| CarMax, Inc. | (3,545 | ) | (207,878 | ) | 16,554 | |||||||
| Carpenter Technology Corp. | (7,758 | ) | (240,030 | ) | 5,196 | |||||||
| Caterpillar, Inc. | (5,272 | ) | (360,067 | ) | 1,782 | |||||||
| CBOE Holdings, Inc. | (1,946 | ) | (134,558 | ) | 8,263 | |||||||
| CBS Corp. | (3,457 | ) | (140,848 | ) | (22,080 | ) | ||||||
| CEB, Inc. | (772 | ) | (54,285 | ) | 6,892 | |||||||
| CenterPoint Energy, Inc. | (8,833 | ) | (161,194 | ) | (980 | ) | ||||||
| Cerner Corp. | (3,446 | ) | (219,529 | ) | 12,183 | |||||||
| CH Robinson Worldwide, Inc. | (3,761 | ) | (252,147 | ) | 18,890 | |||||||
| Charles Schwab Corp./The | (12,807 | ) | (366,880 | ) | (54,854 | ) | ||||||
| Chemours Co./The | (9,409 | ) | (52,078 | ) | 1,646 | |||||||
| Cheniere Energy, Inc. | (9,098 | ) | (437,356 | ) | 98,456 | |||||||
| Chevron Corp. | (1,186 | ) | (108,363 | ) | 1,670 | |||||||
| Chico’s FAS, Inc. | (4,734 | ) | (76,328 | ) | 25,816 | |||||||
| Chipotle Mexican Grill, Inc. | (742 | ) | (498,556 | ) | 142,507 | |||||||
| Ciena Corp. | (5,749 | ) | (118,947 | ) | — | |||||||
| Cimarex Energy Co. | (925 | ) | (87,664 | ) | 4,988 | |||||||
| Cincinnati Financial Corp. | (1,300 | ) | (69,498 | ) | (7,423 | ) | ||||||
| Clean Harbors, Inc. | (831 | ) | (37,548 | ) | 2,937 | |||||||
| Cleco Corp. | (1,000 | ) | (53,090 | ) | 880 | |||||||
| CNO Financial Group, Inc. | (4,694 | ) | (90,760 | ) | 1,151 | |||||||
| Coach, Inc. | (3,000 | ) | (85,440 | ) | (12,750 | ) | ||||||
| Cobalt International Energy, Inc. | (42,471 | ) | (302,304 | ) | 72,961 | |||||||
| Coca-Cola Co./The | (3,737 | ) | (154,343 | ) | (6,199 | ) | ||||||
| Cognex Corp. | (8,662 | ) | (300,270 | ) | 7,754 | |||||||
| Colfax Corp. | (11,536 | ) | (324,441 | ) | 55,075 | |||||||
| Colgate-Palmolive Co. | (10,024 | ) | (644,815 | ) | (22,984 | ) | ||||||
| Columbia Pipeline Group, Inc. | (14,364 | ) | (281,975 | ) | (5,305 | ) | ||||||
| Comerica, Inc. | (2,469 | ) | (101,201 | ) | (2,077 | ) | ||||||
| CommScope Holding Co., Inc. | (8,344 | ) | (239,900 | ) | 23,874 | |||||||
| CommVault Systems, Inc. | (5,715 | ) | (205,092 | ) | (19,793 | ) | ||||||
| Compass Minerals International, Inc. | (1,093 | ) | (84,968 | ) | 2,698 | |||||||
| Concho Resources, Inc. | (578 | ) | (55,965 | ) | 2,292 | |||||||
| Copart, Inc. | (1,557 | ) | (59,052 | ) | (129 | ) | ||||||
| CoStar Group, Inc. | (1,014 | ) | (180,297 | ) | (29,287 | ) | ||||||
| Covanta Holding Corp. | (22,244 | ) | (380,597 | ) | 36,037 | |||||||
| Cree, Inc. | (2,448 | ) | (67,600 | ) | 2,312 | |||||||
| Cypress Semiconductor Corp. | (39,325 | ) | (372,822 | ) | (12,956 | ) | ||||||
| REFERENCE ENTITY | SHARES | NOTIONAL (a) | NET UNREALIZED APPRECIATION (DEPRECIATION) | |||||||||
| United States (continued) | ||||||||||||
| Dana Holding Corp. | (6,493 | ) | $ | (102,626 | ) | $ | 13,022 | |||||
| DaVita HealthCare Partners, Inc. | (5,293 | ) | (384,999 | ) | 16,024 | |||||||
| Deere & Co. | (2,084 | ) | (161,801 | ) | 2,854 | |||||||
| Denbury Resources, Inc. | (35,155 | ) | (103,376 | ) | 32,363 | |||||||
| DexCom, Inc. | (2,245 | ) | (191,167 | ) | 7,301 | |||||||
| Diamond Offshore Drilling, Inc. | (1,586 | ) | (33,635 | ) | 170 | |||||||
| Diebold, Inc. | (2,400 | ) | (71,673 | ) | (543 | ) | ||||||
| Discovery Communications, Inc. | (18,497 | ) | (511,055 | ) | 17,555 | |||||||
| DISH Network Corp. | (1,222 | ) | (71,607 | ) | 1,733 | |||||||
| Dolby Laboratories, Inc. | (3,683 | ) | (122,619 | ) | (1,314 | ) | ||||||
| Dollar Tree, Inc. | (6,316 | ) | (406,550 | ) | (81,171 | ) | ||||||
| Dominion Resources, Inc. | (9,838 | ) | (694,305 | ) | 28,863 | |||||||
| Donaldson Co., Inc. | (10,690 | ) | (308,409 | ) | 2,034 | |||||||
| Dover Corp. | (750 | ) | (44,926 | ) | (1,057 | ) | ||||||
| DreamWorks Animation SKG, Inc. | (2,483 | ) | (58,439 | ) | (5,548 | ) | ||||||
| DSW, Inc. | (5,758 | ) | (145,242 | ) | 7,856 | |||||||
| Duke Energy Corp. | (3,967 | ) | (283,055 | ) | (149 | ) | ||||||
| Dunkin’ Brands Group, Inc. | (6,724 | ) | (294,605 | ) | 8,230 | |||||||
| E*TRADE Financial Corp. | (3,200 | ) | (84,704 | ) | (10,144 | ) | ||||||
| Eaton Corp PLC | (766 | ) | (38,942 | ) | (921 | ) | ||||||
| Eaton Vance Corp. | (3,436 | ) | (117,837 | ) | 6,408 | |||||||
| Ecolab, Inc. | (1,339 | ) | (148,980 | ) | (4,174 | ) | ||||||
| Emerson Electric Co. | (5,904 | ) | (265,806 | ) | (16,583 | ) | ||||||
| Envision Healthcare Holdings Inc | (16,998 | ) | (540,525 | ) | 99,087 | |||||||
| EQT Corp. | (646 | ) | (34,178 | ) | 502 | |||||||
| Estee Lauder Cos., Inc./The | (900 | ) | (71,793 | ) | (7,461 | ) | ||||||
| Esterline Technologies Corp. | (3,703 | ) | (270,622 | ) | (29,321 | ) | ||||||
| Expeditors International of Washington, Inc. | (1,168 | ) | (54,686 | ) | 2,009 | |||||||
| Express Scripts Holding Co. | (453 | ) | (38,771 | ) | (826 | ) | ||||||
| Exxon Mobil Corp. | (1,438 | ) | (108,594 | ) | (3,498 | ) | ||||||
| F5 Networks, Inc. | (693 | ) | (67,413 | ) | 220 | |||||||
| Facebook, Inc. | (1,277 | ) | (117,068 | ) | (16,583 | ) | ||||||
| Fairchild Semiconductor International, Inc. | (2,193 | ) | (37,750 | ) | (7,667 | ) | ||||||
| Fastenal Co. | (4,271 | ) | (152,813 | ) | (21,529 | ) | ||||||
| FedEx Corp. | (1,056 | ) | (172,914 | ) | 15,581 | |||||||
| FEI Co. | (2,351 | ) | (177,534 | ) | (10,052 | ) | ||||||
| FireEye, Inc. | (15,102 | ) | (351,812 | ) | 38,597 | |||||||
| First Horizon National Corp. | (17,956 | ) | (257,132 | ) | (3,589 | ) | ||||||
| First Republic Bank | (800 | ) | (50,208 | ) | (2,640 | ) | ||||||
| FirstEnergy Corp. | (1,871 | ) | (58,072 | ) | (1,295 | ) | ||||||
| FleetCor Technologies, Inc. | (2,436 | ) | (353,440 | ) | 5,263 | |||||||
| FLIR Systems, Inc. | (2,912 | ) | (83,500 | ) | 1,761 | |||||||
| Flowserve Corp. | (7,459 | ) | (312,558 | ) | (1,317 | ) | ||||||
| The accompanying notes are an integral part of these financial statements. | (Continued) |
| AQR Funds | Annual Report | December 2015 | ||||||||||||||
306
Table of Contents
| Consolidated Schedule of Investments | December 31, 2015 |
| AQR STYLE PREMIA ALTERNATIVE LV FUND |
| REFERENCE ENTITY | SHARES | NOTIONAL (a) | NET UNREALIZED APPRECIATION (DEPRECIATION) | |||||||||
| United States (continued) | ||||||||||||
| Fluor Corp. | (3,826 | ) | $ | (166,914 | ) | $ | (13,750 | ) | ||||
| FMC Corp. | (14,493 | ) | (516,634 | ) | (50,477 | ) | ||||||
| FMC Technologies, Inc. | (3,351 | ) | (107,012 | ) | 9,800 | |||||||
| Ford Motor Co. | (13,513 | ) | (186,038 | ) | (4,361 | ) | ||||||
| Fortinet, Inc. | (2,544 | ) | (90,140 | ) | 10,843 | |||||||
| Fortune Brands Home & Security, Inc. | (1,200 | ) | (59,172 | ) | (7,428 | ) | ||||||
| Fossil Group, Inc. | (1,492 | ) | (70,218 | ) | 15,670 | |||||||
| Franklin Resources, Inc. | (4,845 | ) | (188,950 | ) | 10,557 | |||||||
| Freeport-McMoRan, Inc. | (53,493 | ) | (526,304 | ) | 164,156 | |||||||
| Frontier Communications Corp. | (14,318 | ) | (70,486 | ) | 3,621 | |||||||
| Gap, Inc./The | (5,333 | ) | (139,448 | ) | 7,723 | |||||||
| Gartner, Inc. | (1,645 | ) | (149,284 | ) | 82 | |||||||
| General Electric Co. | (12,960 | ) | (324,438 | ) | (79,266 | ) | ||||||
| Genesee & Wyoming, Inc. | (5,195 | ) | (324,094 | ) | 45,174 | |||||||
| Gentex Corp. | (1,922 | ) | (32,264 | ) | 1,493 | |||||||
| Genworth Financial, Inc. | (93,301 | ) | (448,131 | ) | 100,118 | |||||||
| GNC Holdings, Inc. | (7,693 | ) | (249,853 | ) | 11,216 | |||||||
| Graco, Inc. | (1,554 | ) | (109,050 | ) | (2,946 | ) | ||||||
| Granite Construction, Inc. | (610 | ) | (26,945 | ) | 770 | |||||||
| Great Plains Energy, Inc. | (436 | ) | (12,116 | ) | 209 | |||||||
| Greif, Inc. | (3,556 | ) | (114,842 | ) | 5,282 | |||||||
| Groupon, Inc. | (12,133 | ) | (38,385 | ) | 1,137 | |||||||
| Guess?, Inc. | (1,946 | ) | (42,520 | ) | 5,780 | |||||||
| Hain Celestial Group, Inc./The | (9,052 | ) | (398,746 | ) | 33,136 | |||||||
| Halliburton Co. | (9,164 | ) | (343,181 | ) | 31,239 | |||||||
| Halyard Health, Inc. | (1,123 | ) | (32,036 | ) | (5,483 | ) | ||||||
| Hanesbrands, Inc. | (1,676 | ) | (48,035 | ) | (1,290 | ) | ||||||
| Harley-Davidson, Inc. | (642 | ) | (34,603 | ) | 5,463 | |||||||
| Harsco Corp. | (14,055 | ) | (126,812 | ) | 16,059 | |||||||
| HD Supply Holdings, Inc. | (4,735 | ) | (144,426 | ) | 2,234 | |||||||
| Henry Schein, Inc. | (370 | ) | (48,511 | ) | (10,020 | ) | ||||||
| Hershey Co./The | (2,771 | ) | (249,833 | ) | 2,466 | |||||||
| Hertz Global Holdings, Inc. | (10,198 | ) | (181,863 | ) | 36,746 | |||||||
| Hexcel Corp. | (2,013 | ) | (90,644 | ) | (2,860 | ) | ||||||
| Hilton Worldwide Holdings, Inc. | (11,945 | ) | (280,947 | ) | 25,324 | |||||||
| Hologic, Inc. | (509 | ) | (19,841 | ) | 148 | |||||||
| Honeywell International, Inc. | (518 | ) | (53,099 | ) | (550 | ) | ||||||
| Hubbell, Inc. | (433 | ) | (40,657 | ) | (3,093 | ) | ||||||
| Huntsman Corp. | (11,394 | ) | (137,782 | ) | 8,232 | |||||||
| IDEX Corp. | (186 | ) | (12,934 | ) | (1,315 | ) | ||||||
| IDEXX Laboratories, Inc. | (5,348 | ) | (392,788 | ) | 2,812 | |||||||
| IHS, Inc. | (1,104 | ) | (125,852 | ) | (4,895 | ) | ||||||
| Illumina, Inc. | (3,632 | ) | (542,763 | ) | (154,382 | ) | ||||||
| IMS Health Holdings, Inc. | (932 | ) | (25,616 | ) | 1,878 | |||||||
| Incyte Corp. | (1,820 | ) | (201,093 | ) | 3,714 | |||||||
| Intersil Corp. | (6,997 | ) | (82,298 | ) | (6,984 | ) | ||||||
| Intuit, Inc. | (988 | ) | (93,591 | ) | (1,751 | ) | ||||||
| Intuitive Surgical, Inc. | (369 | ) | (177,020 | ) | (24,513 | ) | ||||||
| REFERENCE ENTITY | SHARES | NOTIONAL (a) | NET UNREALIZED APPRECIATION (DEPRECIATION) | |||||||||
| United States (continued) | ||||||||||||
| Invesco Ltd. | (555 | ) | $ | (16,981 | ) | $ | (1,600 | ) | ||||
| Ionis Pharmaceuticals, Inc. | (199 | ) | (12,322 | ) | (2 | ) | ||||||
| ITC Holdings Corp. | (27,100 | ) | (905,093 | ) | (158,582 | ) | ||||||
| Itron, Inc. | (2,926 | ) | (93,404 | ) | (12,459 | ) | ||||||
| Jacobs Engineering Group, Inc. | (430 | ) | (16,238 | ) | (1,801 | ) | ||||||
| JB Hunt Transport Services, Inc. | (881 | ) | (65,827 | ) | 1,197 | |||||||
| Joy Global, Inc. | (19,953 | ) | (279,802 | ) | 28,195 | |||||||
| Kansas City Southern | (8,695 | ) | (757,648 | ) | 108,393 | |||||||
| Kate Spade & Co. | (21,370 | ) | (416,331 | ) | 36,586 | |||||||
| KBR, Inc. | (16,446 | ) | (275,250 | ) | (3,016 | ) | ||||||
| Kellogg Co. | (3,679 | ) | (251,003 | ) | (14,878 | ) | ||||||
| Kennametal, Inc. | (4,826 | ) | (120,378 | ) | 27,719 | |||||||
| Keysight Technologies, Inc. | (420 | ) | (12,858 | ) | 959 | |||||||
| Kinder Morgan, Inc. | (20,574 | ) | (517,917 | ) | 210,953 | |||||||
| KLX, Inc. | (3,795 | ) | (136,126 | ) | 19,278 | |||||||
| Knowles Corp. | (3,825 | ) | (52,551 | ) | 1,564 | |||||||
| Kosmos Energy Ltd. | (14,589 | ) | (84,723 | ) | 8,860 | |||||||
| Las Vegas Sands Corp. | (1,300 | ) | (54,145 | ) | (2,847 | ) | ||||||
| Legg Mason, Inc. | (1,007 | ) | (41,851 | ) | 2,346 | |||||||
| Leucadia National Corp. | (16,498 | ) | (316,115 | ) | 29,215 | |||||||
| Level 3 Communications, Inc. | (6,029 | ) | (282,577 | ) | (45,160 | ) | ||||||
| Liberty Broadband Corp. | (2,486 | ) | (130,144 | ) | 1,220 | |||||||
| Linear Technology Corp. | (1,953 | ) | (77,413 | ) | (5,530 | ) | ||||||
| LinkedIn Corp. | (1,794 | ) | (359,609 | ) | (44,184 | ) | ||||||
| Lions Gate Entertainment Corp. | (4,448 | ) | (165,463 | ) | 21,392 | |||||||
| Live Nation Entertainment, Inc. | (6,103 | ) | (155,124 | ) | 5,173 | |||||||
| Loews Corp. | (8,387 | ) | (306,159 | ) | (15,901 | ) | ||||||
| Macy’s, Inc. | (3,714 | ) | (151,113 | ) | 21,197 | |||||||
| Manitowoc Co., Inc./The | (16,809 | ) | (252,978 | ) | (5,040 | ) | ||||||
| Marsh & McLennan Cos., Inc. | (13,071 | ) | (697,645 | ) | (27,142 | ) | ||||||
| MasterCard, Inc. | (3,529 | ) | (332,661 | ) | (10,922 | ) | ||||||
| Mattel, Inc. | (14,011 | ) | (333,287 | ) | (47,392 | ) | ||||||
| McDonald’s Corp. | (2,522 | ) | (275,792 | ) | (22,157 | )�� | ||||||
| MDC Holdings, Inc. | (469 | ) | (12,691 | ) | 718 | |||||||
| MDU Resources Group, Inc. | (17,995 | ) | (314,477 | ) | (15,191 | ) | ||||||
| Mead Johnson Nutrition Co. | (6,588 | ) | (516,424 | ) | (3,699 | ) | ||||||
| Memorial Resource Development Corp. | (6,966 | ) | (118,996 | ) | 6,495 | |||||||
| Mercury General Corp. | (1,789 | ) | (89,487 | ) | 6,173 | |||||||
| MGM Resorts International | (16,120 | ) | (316,108 | ) | (50,138 | ) | ||||||
| Micron Technology, Inc. | (3,879 | ) | (55,685 | ) | 758 | |||||||
| Middleby Corp./The | (1,320 | ) | (143,238 | ) | 850 | |||||||
| Molson Coors Brewing Co. | (1,392 | ) | (115,028 | ) | (15,708 | ) | ||||||
| Monsanto Co. | (3,395 | ) | (302,586 | ) | (31,890 | ) | ||||||
| The accompanying notes are an integral part of these financial statements. | (Continued) |
| AQR Funds | Annual Report | December 2015 | ||||||||||||||
307
Table of Contents
| Consolidated Schedule of Investments | December 31, 2015 |
| AQR STYLE PREMIA ALTERNATIVE LV FUND |
| REFERENCE ENTITY | SHARES | NOTIONAL (a) | NET UNREALIZED APPRECIATION (DEPRECIATION) | |||||||||
| United States (continued) | ||||||||||||
| Monster Beverage Corp. | (443 | ) | $ | (62,213 | ) | $ | (3,776 | ) | ||||
| Morgan Stanley | (2,593 | ) | (84,353 | ) | 1,870 | |||||||
| Motorola Solutions, Inc. | (1,015 | ) | (69,777 | ) | 300 | |||||||
| MSC Industrial Direct Co., Inc. | (210 | ) | (12,648 | ) | 831 | |||||||
| Nabors Industries Ltd. | (4,848 | ) | (47,674 | ) | 6,417 | |||||||
| National Fuel Gas Co. | (300 | ) | (14,937 | ) | 2,112 | |||||||
| National Instruments Corp. | (4,339 | ) | (122,670 | ) | (1,816 | ) | ||||||
| National Oilwell Varco, Inc. | (5,342 | ) | (183,040 | ) | 4,137 | |||||||
| Navient Corp. | (11,785 | ) | (136,914 | ) | 1,976 | |||||||
| NetApp, Inc. | (5,034 | ) | (161,563 | ) | 28,011 | |||||||
| Netflix, Inc. | (506 | ) | (56,794 | ) | (1,082 | ) | ||||||
| NetScout Systems, Inc. | (4,770 | ) | (163,273 | ) | 16,834 | |||||||
| NetSuite, Inc. | (5,069 | ) | (431,008 | ) | 2,070 | |||||||
| New York Times Co./The | (3,000 | ) | (34,950 | ) | (5,310 | ) | ||||||
| Nielsen Holdings PLC | (4,090 | ) | (190,876 | ) | 282 | |||||||
| Noble Energy, Inc. | (3,994 | ) | (125,339 | ) | (6,183 | ) | ||||||
| Nordson Corp. | (2,032 | ) | (130,780 | ) | 427 | |||||||
| Nordstrom, Inc. | (4,918 | ) | (277,743 | ) | 32,777 | |||||||
| NorthStar Asset Management Group, Inc. | (22,843 | ) | (327,519 | ) | 50,205 | |||||||
| NRG Energy, Inc. | (17,018 | ) | (223,539 | ) | 23,237 | |||||||
| Nucor Corp. | (7,321 | ) | (297,984 | ) | 2,948 | |||||||
| Occidental Petroleum Corp. | (5,146 | ) | (352,382 | ) | 4,461 | |||||||
| Ocwen Financial Corp. | (5,500 | ) | (38,060 | ) | (275 | ) | ||||||
| OGE Energy Corp. | (19,276 | ) | (523,322 | ) | 16,556 | |||||||
| Oil States International, Inc. | (6,520 | ) | (179,707 | ) | 2,037 | |||||||
| Old Dominion Freight Line, Inc. | (1,730 | ) | (105,763 | ) | 3,572 | |||||||
| Olin Corp. | (13,576 | ) | (257,347 | ) | 23,025 | |||||||
| ONEOK, Inc. | (11,583 | ) | (377,231 | ) | 91,594 | |||||||
| Owens & Minor, Inc. | (807 | ) | (26,542 | ) | (2,494 | ) | ||||||
| Owens-Illinois, Inc. | (14,598 | ) | (282,188 | ) | 27,891 | |||||||
| PacWest Bancorp | (2,726 | ) | (120,034 | ) | 2,544 | |||||||
| Palo Alto Networks, Inc. | (389 | ) | (68,150 | ) | (368 | ) | ||||||
| Pandora Media, Inc. | (5,947 | ) | (100,383 | ) | 20,634 | |||||||
| Patterson Cos., Inc. | (2,795 | ) | (128,085 | ) | 1,723 | |||||||
| Paychex, Inc. | (550 | ) | (27,854 | ) | (1,236 | ) | ||||||
| PayPal Holdings, Inc. | (7,337 | ) | (262,502 | ) | (3,097 | ) | ||||||
| PerkinElmer, Inc. | (704 | ) | (32,776 | ) | (4,938 | ) | ||||||
| Pitney Bowes, Inc. | (4,202 | ) | (83,591 | ) | (3,180 | ) | ||||||
| Platform Specialty Products Corp. | (39,420 | ) | (496,415 | ) | (9,344 | ) | ||||||
| Polaris Industries, Inc. | (341 | ) | (40,025 | ) | 10,716 | |||||||
| PolyOne Corp. | (610 | ) | (18,672 | ) | (701 | ) | ||||||
| Praxair, Inc. | (3,253 | ) | (344,681 | ) | 11,574 | |||||||
| Premier, Inc. | (2,777 | ) | (95,346 | ) | (2,599 | ) | ||||||
| Priceline Group, Inc./The | (62 | ) | (76,745 | ) | (2,301 | ) | ||||||
| Principal Financial Group, Inc. | (4,466 | ) | (213,650 | ) | 12,769 | |||||||
| PTC, Inc. | (3,158 | ) | (106,850 | ) | (2,512 | ) | ||||||
| PulteGroup, Inc. | (2,588 | ) | (46,820 | ) | 702 | |||||||
| REFERENCE ENTITY | SHARES | NOTIONAL (a) | NET UNREALIZED APPRECIATION (DEPRECIATION) | |||||||||
| United States (continued) | ||||||||||||
| Qorvo, Inc. | (2,198 | ) | $ | (120,508 | ) | $ | 8,630 | |||||
| QUALCOMM, Inc. | (4,468 | ) | (242,429 | ) | 19,096 | |||||||
| Quanta Services, Inc. | (17,015 | ) | (362,877 | ) | 18,323 | |||||||
| Questar Corp. | (10,946 | ) | (217,473 | ) | 4,245 | |||||||
| Ralph Lauren Corp. | (315 | ) | (35,816 | ) | 700 | |||||||
| Range Resources Corp. | (8,614 | ) | (244,626 | ) | 32,636 | |||||||
| Regions Financial Corp. | (28,412 | ) | (257,094 | ) | (15,661 | ) | ||||||
| Rent-A-Center, Inc. | (2,608 | ) | (40,674 | ) | 1,632 | |||||||
| Rice Energy, Inc. | (18,618 | ) | (232,762 | ) | 29,825 | |||||||
| Rockwell Collins, Inc. | (1,487 | ) | (130,124 | ) | (7,126 | ) | ||||||
| Rollins, Inc. | (2,243 | ) | (60,589 | ) | 2,496 | |||||||
| Roper Technologies, Inc. | (1,472 | ) | (230,473 | ) | (48,897 | ) | ||||||
| Rovi Corp. | (3,316 | ) | (55,387 | ) | 143 | |||||||
| RPC, Inc. | (6,142 | ) | (74,713 | ) | 1,316 | |||||||
| RR Donnelley & Sons Co. | (3,637 | ) | (53,906 | ) | 370 | |||||||
| salesforce.com, Inc. | (2,175 | ) | (159,574 | ) | (10,946 | ) | ||||||
| Sally Beauty Holdings, Inc. | (8,379 | ) | (204,226 | ) | (29,465 | ) | ||||||
| SanDisk Corp. | (2,938 | ) | (153,498 | ) | (69,761 | ) | ||||||
| Santander Consumer USA Holdings, Inc. | (2,200 | ) | (46,926 | ) | 12,056 | |||||||
| SBA Communications Corp. | (3,181 | ) | (343,732 | ) | 9,504 | |||||||
| Schlumberger Ltd. | (3,347 | ) | (250,560 | ) | 17,107 | |||||||
| Scripps Networks Interactive, Inc. | (961 | ) | (51,047 | ) | (2,010 | ) | ||||||
| Seagate Technology PLC | (2,556 | ) | (95,117 | ) | 1,414 | |||||||
| Sealed Air Corp. | (1,352 | ) | (63,158 | ) | 2,859 | |||||||
| Seattle Genetics, Inc. | (4,019 | ) | (155,868 | ) | (24,505 | ) | ||||||
| Sempra Energy | (6,547 | ) | (647,188 | ) | 31,704 | |||||||
| Semtech Corp. | (4,387 | ) | (64,413 | ) | (18,589 | ) | ||||||
| ServiceNow, Inc. | (1,343 | ) | (96,921 | ) | (19,329 | ) | ||||||
| Signet Jewelers Ltd. | (1,077 | ) | (149,873 | ) | 16,659 | |||||||
| Silicon Laboratories, Inc. | (1,469 | ) | (64,390 | ) | (6,915 | ) | ||||||
| Sirius XM Holdings, Inc. | (80,496 | ) | (311,883 | ) | (15,736 | ) | ||||||
| Six Flags Entertainment Corp. | (5,272 | ) | (248,496 | ) | (41,147 | ) | ||||||
| SLM Corp. | (46,325 | ) | (324,285 | ) | 22,246 | |||||||
| Sotheby’s | (3,324 | ) | (106,776 | ) | 21,150 | |||||||
| Southern Co./The | (3,928 | ) | (177,078 | ) | (6,714 | ) | ||||||
| Southwestern Energy Co. | (18,565 | ) | (205,608 | ) | 73,611 | |||||||
| Spectra Energy Corp. | (10,663 | ) | (286,112 | ) | 30,840 | |||||||
| Splunk, Inc. | (7,861 | ) | (435,739 | ) | (26,567 | ) | ||||||
| Sprouts Farmers Market, Inc. | (21,476 | ) | (467,152 | ) | (103,895 | ) | ||||||
| Staples, Inc. | (7,621 | ) | (97,462 | ) | 25,291 | |||||||
| Steel Dynamics, Inc. | (5,976 | ) | (107,309 | ) | 518 | |||||||
| Stericycle, Inc. | (1,899 | ) | (233,828 | ) | 4,808 | |||||||
| Stifel Financial Corp. | (2,344 | ) | (103,200 | ) | 3,908 | |||||||
| SunEdison, Inc. | (43,999 | ) | (339,195 | ) | 115,240 | |||||||
| SunPower Corp. | (6,616 | ) | (192,320 | ) | (6,227 | ) | ||||||
| SVB Financial Group | (1,340 | ) | (159,672 | ) | 346 | |||||||
| Synovus Financial Corp. | (2,581 | ) | (77,893 | ) | (5,680 | ) | ||||||
| T Rowe Price Group, Inc. | (356 | ) | (26,180 | ) | 730 | |||||||
| Tableau Software, Inc. | (2,947 | ) | (251,648 | ) | (26,018 | ) | ||||||
| The accompanying notes are an integral part of these financial statements. | (Continued) |
| AQR Funds | Annual Report | December 2015 | ||||||||||||||
308
Table of Contents
| Consolidated Schedule of Investments | December 31, 2015 |
| AQR STYLE PREMIA ALTERNATIVE LV FUND |
| REFERENCE ENTITY | SHARES | NOTIONAL (a) | NET UNREALIZED APPRECIATION (DEPRECIATION) | |||||||||
| United States (continued) | ||||||||||||
| Targa Resources Corp. | (6,154 | ) | $ | (318,811 | ) | $ | 152,284 | |||||
| TCF Financial Corp. | (3,302 | ) | (47,680 | ) | 1,055 | |||||||
| Teekay Corp. | (7,822 | ) | (233,683 | ) | 156,480 | |||||||
| Tempur Sealy International, Inc. | (3,275 | ) | (247,194 | ) | 16,438 | |||||||
| Tenet Healthcare Corp. | (17,648 | ) | (615,690 | ) | 80,955 | |||||||
| Teradata Corp. | (8,057 | ) | (229,053 | ) | 16,187 | |||||||
| TerraForm Power, Inc. | (15,366 | ) | (147,888 | ) | (45,416 | ) | ||||||
| Tesla Motors, Inc. | (323 | ) | (75,511 | ) | (2,012 | ) | ||||||
| Thermo Fisher Scientific, Inc. | (386 | ) | (51,012 | ) | (3,742 | ) | ||||||
| Tiffany & Co. | (5,914 | ) | (461,046 | ) | 9,867 | |||||||
| Timken Co./The | (2,482 | ) | (70,908 | ) | (53 | ) | ||||||
| Toll Brothers, Inc. | (1,016 | ) | (36,631 | ) | 2,798 | |||||||
| TransDigm Group, Inc. | (1,435 | ) | (329,539 | ) | 1,713 | |||||||
| TreeHouse Foods, Inc. | (2,402 | ) | (197,853 | ) | 9,392 | |||||||
| TRI Pointe Group, Inc. | (2,956 | ) | (39,039 | ) | 1,586 | |||||||
| Trimble Navigation Ltd. | (22,640 | ) | (384,321 | ) | (101,307 | ) | ||||||
| TripAdvisor, Inc. | (3,050 | ) | (211,502 | ) | (48,511 | ) | ||||||
| Triumph Group, Inc. | (619 | ) | (24,339 | ) | (266 | ) | ||||||
| Twenty-First Century Fox, Inc. | (1,909 | ) | (54,395 | ) | 2,546 | |||||||
| Twitter, Inc. | (12,348 | ) | (346,953 | ) | 61,220 | |||||||
| Tyco International PLC | (11,385 | ) | (394,369 | ) | 31,301 | |||||||
| Ultimate Software Group, Inc./The | (168 | ) | (31,416 | ) | (1,430 | ) | ||||||
| Umpqua Holdings Corp. | (5,100 | ) | (83,895 | ) | 2,805 | |||||||
| Under Armour, Inc. | (1,682 | ) | (161,770 | ) | 26,184 | |||||||
| Union Pacific Corp. | (4,703 | ) | (424,417 | ) | 56,642 | |||||||
| United Continental Holdings, Inc. | (800 | ) | (44,336 | ) | (1,504 | ) | ||||||
| United Natural Foods, Inc. | (2,365 | ) | (98,814 | ) | 5,727 | |||||||
| United Rentals, Inc. | (3,400 | ) | (219,870 | ) | (26,766 | ) | ||||||
| United Technologies Corp. | (3,575 | ) | (348,388 | ) | 4,938 | |||||||
| Urban Outfitters, Inc. | (6,189 | ) | (179,894 | ) | 39,094 | |||||||
| USG Corp. | (19,118 | ) | (491,256 | ) | 26,880 | |||||||
| VCA, Inc. | (216 | ) | (11,734 | ) | (146 | ) | ||||||
| Veeva Systems, Inc. | (11,198 | ) | (269,835 | ) | (53,228 | ) | ||||||
| VeriFone Systems, Inc. | (7,407 | ) | (199,518 | ) | (8,026 | ) | ||||||
| Verisk Analytics, Inc. | (951 | ) | (71,457 | ) | (1,656 | ) | ||||||
| Vertex Pharmaceuticals, Inc. | (4,194 | ) | (464,422 | ) | (63,309 | ) | ||||||
| Viacom, Inc. | (2,119 | ) | (96,923 | ) | 9,705 | |||||||
| Viavi Solutions, Inc. | (35,767 | ) | (204,115 | ) | (13,706 | ) | ||||||
| Vista Outdoor, Inc. | (1,421 | ) | (63,067 | ) | (181 | ) | ||||||
| Visteon Corp. | (2,025 | ) | (204,039 | ) | (27,824 | ) | ||||||
| WABCO Holdings, Inc. | (723 | ) | (77,246 | ) | 3,312 | |||||||
| Waddell & Reed Financial, Inc. | (2,875 | ) | (99,072 | ) | 16,674 | |||||||
| REFERENCE ENTITY | SHARES | NOTIONAL (a) | NET UNREALIZED APPRECIATION (DEPRECIATION) | |||||||||
| United States (continued) | ||||||||||||
| Walgreens Boots Alliance, Inc. | (532 | ) | $ | (48,145 | ) | $ | 2,842 | |||||
| WEC Energy Group, Inc. | (10,773 | ) | (560,995 | ) | 8,232 | |||||||
| Wendy’s Co./The | (9,404 | ) | (102,421 | ) | 1,140 | |||||||
| WESCO International, Inc. | (2,566 | ) | (114,099 | ) | 2,016 | |||||||
| Westar Energy, Inc. | (896 | ) | (38,055 | ) | 56 | |||||||
| WestRock Co. | (4,427 | ) | (203,311 | ) | 1,352 | |||||||
| WEX, Inc. | (2,425 | ) | (218,522 | ) | 4,152 | |||||||
| WhiteWave Foods Co./The | (17,026 | ) | (693,719 | ) | 31,237 | |||||||
| Whiting Petroleum Corp. | (20,576 | ) | (310,448 | ) | 116,211 | |||||||
| Whole Foods Market, Inc. | (5,318 | ) | (168,406 | ) | (9,747 | ) | ||||||
| Williams-Sonoma, Inc. | (852 | ) | (50,776 | ) | 1,010 | |||||||
| WisdomTree Investments, Inc. | (23,425 | ) | (391,908 | ) | 24,604 | |||||||
| Workday, Inc. | (4,169 | ) | (308,545 | ) | (23,641 | ) | ||||||
| Worthington Industries, Inc. | (4,693 | ) | (127,558 | ) | (13,889 | ) | ||||||
| WPX Energy, Inc. | (2,309 | ) | (19,061 | ) | 5,807 | |||||||
| WR Grace & Co. | (3,170 | ) | (305,183 | ) | (10,518 | ) | ||||||
| Wynn Resorts Ltd. | (3,438 | ) | (242,062 | ) | 4,187 | |||||||
| Xerox Corp. | (3,160 | ) | (32,700 | ) | (891 | ) | ||||||
| Xylem, Inc. | (1,850 | ) | (60,481 | ) | (7,044 | ) | ||||||
| Yahoo!, Inc. | (11,406 | ) | (367,814 | ) | (11,549 | ) | ||||||
| Yelp, Inc. | (2,512 | ) | (64,108 | ) | (8,238 | ) | ||||||
| Yum! Brands, Inc. | (3,666 | ) | (281,683 | ) | 13,882 | |||||||
| Zebra Technologies Corp. | (583 | ) | (40,900 | ) | 294 | |||||||
| Zions Bancorporation | (13,326 | ) | (369,185 | ) | 5,385 | |||||||
| Zoetis, Inc. | (4,920 | ) | (214,638 | ) | (21,128 | ) | ||||||
| Zynga, Inc. | (62,196 | ) | (145,231 | ) | (21,455 | ) | ||||||
|
| |||||||||||
| 900,686 | ||||||||||||
|
| |||||||||||
Total of Short Equity Positions | 1,035,897 | |||||||||||
|
| |||||||||||
Total of Long and Short Equity Positions | 1,577,006 | |||||||||||
|
| |||||||||||
Net Cash and Other Receivables/ (Payables) (b) | (421,568 | ) | ||||||||||
|
| |||||||||||
Swaps, at Value | $ | 1,155,438 | ||||||||||
|
| |||||||||||
| (a) | Notional value represents the market value (including any fees or commissions) of the long and short positions when they are established. |
| (b) | Cash and other receivables/(payables) includes the gains (or losses) realized within the swap when the swap resets. |
| The accompanying notes are an integral part of these financial statements. | (Continued) |
| AQR Funds | Annual Report | December 2015 | ||||||||||||||
309
Table of Contents
| Consolidated Schedule of Investments | December 31, 2015 |
| AQR STYLE PREMIA ALTERNATIVE LV FUND |
Total Return Basket Swaps Outstanding at December 31, 2015
| COUNTERPARTY | DESCRIPTION | TERMINATION DATE** | VALUE (Note 5) | |||||
| Goldman Sachs | The Fund receives the total return on a portfolio of long and short positions and pays or receives the LIBOR plus or minus a specified spread, which is denominated in GBP based on the local currencies of the positions within the swaps. | 2-12 months maturity ranging from 01/20/2016 - 09/30/2016 | $329,732 | |||||
|
| |||||||
| ** | The maturity dates are measured from the commencement of investment in each underlying swap position. |
Additional Information — Total Return Basket Swap
The following table represents the individual long and short positions and related values within the total return basket swap as of December 31, 2015.
| REFERENCE ENTITY | SHARES | NOTIONAL (a) | NET UNREALIZED APPRECIATION (DEPRECIATION) | |||||||||
| Long Positions | ||||||||||||
| Common Stocks | ||||||||||||
| Germany | ||||||||||||
| TUI AG | 7,284 | $ | 132,266 | $ | (2,209 | ) | ||||||
|
| |||||||||||
| Ireland | ||||||||||||
| DCC PLC | 1,671 | 127,175 | 12,423 | |||||||||
| Shire PLC | 1,920 | 132,922 | (1,196 | ) | ||||||||
|
| |||||||||||
| 11,227 | ||||||||||||
|
| |||||||||||
| Luxembourg | ||||||||||||
| Regus PLC | 9,442 | 44,772 | 1,622 | |||||||||
|
| |||||||||||
| South Africa | ||||||||||||
| Investec PLC | 4,222 | 32,074 | (2,304 | ) | ||||||||
| Mondi PLC | 6,405 | 133,137 | (7,594 | ) | ||||||||
|
| |||||||||||
| (9,898 | ) | |||||||||||
|
| |||||||||||
| Switzerland | ||||||||||||
| Coca-Cola HBC AG | 853 | 18,588 | (423 | ) | ||||||||
| Glencore PLC | 78,754 | 105,222 | (863 | ) | ||||||||
| Wolseley PLC | 962 | 57,437 | (5,188 | ) | ||||||||
|
| |||||||||||
| (6,474 | ) | |||||||||||
|
| |||||||||||
| United Kingdom | ||||||||||||
| AA PLC | 5,636 | 23,694 | 2,342 | |||||||||
| Aggreko PLC | 7,414 | 102,479 | (2,674 | ) | ||||||||
| Amlin PLC | 2,220 | 21,462 | 245 | |||||||||
| Ashtead Group PLC | 726 | 10,115 | 1,834 | |||||||||
| Aviva PLC | 13,329 | 88,733 | 12,441 | |||||||||
| Babcock International Group PLC | 4,155 | 60,392 | 1,788 | |||||||||
| Barclays PLC | 31,773 | 117,393 | (15,123 | ) | ||||||||
| Barratt Developments PLC | 25,750 | 248,301 | (11,022 | ) | ||||||||
| Bellway PLC | 1,323 | 52,289 | 3,030 | |||||||||
| Berkeley Group Holdings PLC | 3,755 | 187,124 | 17,011 | |||||||||
| Betfair Group PLC | 300 | 14,289 | 2,960 | |||||||||
| REFERENCE ENTITY | SHARES | NOTIONAL (a) | NET UNREALIZED APPRECIATION (DEPRECIATION) | |||||||||
| United Kingdom (continued) | ||||||||||||
| Britvic PLC | 4,087 | $ | 42,772 | $ | 1,017 | |||||||
| BT Group PLC | 43,812 | 279,002 | 25,210 | |||||||||
| Bunzl PLC | 1,811 | 47,578 | 2,667 | |||||||||
| Close Brothers Group PLC | 7,321 | 160,070 | (15,704 | ) | ||||||||
| Compass Group PLC | 4,266 | 65,367 | 8,556 | |||||||||
| Direct Line Insurance Group PLC | 36,155 | 204,757 | 11,960 | |||||||||
| Dixons Carphone PLC | 11,778 | 73,026 | 13,650 | |||||||||
| DS Smith PLC | 13,982 | 81,138 | 651 | |||||||||
| easyJet PLC | 9,819 | 258,928 | (7,100 | ) | ||||||||
| G4S PLC | 9,663 | 33,345 | (1,246 | ) | ||||||||
| Greene King PLC | 4,514 | 57,187 | 4,610 | |||||||||
| Howden Joinery Group PLC | 13,956 | 97,407 | 10,725 | |||||||||
| HSBC Holdings PLC | 6,665 | 49,444 | 3,171 | |||||||||
| Imperial Tobacco Group PLC | 4,233 | 218,026 | 5,552 | |||||||||
| Inchcape PLC | 12,321 | 131,074 | 11,082 | |||||||||
| Indivior PLC | 55,146 | 183,572 | (31,180 | ) | ||||||||
| Inmarsat PLC | 3,988 | 60,171 | 6,685 | |||||||||
| Intermediate Capital Group PLC | 27,716 | 220,717 | 34,785 | |||||||||
| International Consolidated Airlines Group SA | 40,097 | 354,082 | 6,432 | |||||||||
| ITV PLC | 24,961 | 91,697 | 9,928 | |||||||||
| J Sainsbury PLC | 20,304 | 79,232 | (1,910 | ) | ||||||||
| John Wood Group PLC | 6,035 | 50,940 | 3,412 | |||||||||
| Jupiter Fund Management PLC | 6,319 | 41,563 | 432 | |||||||||
| Just Eat PLC | 7,041 | 42,264 | 8,861 | |||||||||
| Kingfisher PLC | 35,231 | 184,573 | (13,933 | ) | ||||||||
| Legal & General Group PLC | 8,137 | 29,241 | 2,866 | |||||||||
| Man Group PLC | 81,564 | 193,391 | 16,433 | |||||||||
| Marks & Spencer Group PLC | 18,675 | 138,326 | (13,984 | ) | ||||||||
| The accompanying notes are an integral part of these financial statements. | (Continued) |
| AQR Funds | Annual Report | December 2015 | ||||||||||||||
310
Table of Contents
| Consolidated Schedule of Investments | December 31, 2015 |
| AQR STYLE PREMIA ALTERNATIVE LV FUND |
| REFERENCE ENTITY | SHARES | NOTIONAL (a) | NET UNREALIZED APPRECIATION (DEPRECIATION) | |||||||||
| United Kingdom (continued) | ||||||||||||
| Meggitt PLC | 6,966 | $ | 43,551 | $ | (5,090 | ) | ||||||
| Merlin Entertainments PLC | 1,933 | 10,662 | 2,299 | |||||||||
| Micro Focus International PLC | 3,705 | 71,561 | 15,448 | |||||||||
| National Grid PLC | 11,353 | 149,149 | 7,427 | |||||||||
| Next PLC | 113 | 12,655 | (522 | ) | ||||||||
| Persimmon PLC | 5,676 | 174,511 | (5,177 | ) | ||||||||
| Playtech PLC | 10,346 | 123,619 | 3,046 | |||||||||
| Provident Financial PLC | 3,460 | 162,952 | 8,604 | |||||||||
| Rentokil Initial PLC | 49,065 | 107,258 | 7,861 | |||||||||
| Rexam PLC | 1,142 | 8,784 | 1,402 | |||||||||
| Rightmove PLC | 3,493 | 195,468 | 16,801 | |||||||||
| Royal Mail PLC | 30,081 | 202,261 | (5,234 | ) | ||||||||
| Sage Group PLC/The | 14,915 | 120,956 | 11,565 | |||||||||
| Sky PLC | 25,503 | 399,863 | 18,202 | |||||||||
| Smith & Nephew PLC | 689 | 11,889 | 390 | |||||||||
| SSE PLC | 5,755 | 124,295 | 4,926 | |||||||||
| Stagecoach Group PLC | 6,329 | 30,366 | (2,713 | ) | ||||||||
| Taylor Wimpey PLC | 90,030 | 266,665 | 2,467 | |||||||||
| Telecity Group PLC | 40 | 649 | 90 | |||||||||
| Travis Perkins PLC | 1,727 | 51,524 | (1,423 | ) | ||||||||
| United Utilities Group PLC | 5,302 | 71,694 | 1,311 | |||||||||
| Vodafone Group PLC | 75,638 | 236,411 | 8,866 | |||||||||
| Whitbread PLC | 329 | 23,601 | (2,276 | ) | ||||||||
| William Hill PLC | 35,162 | 183,375 | 21,833 | |||||||||
| WPP PLC | 10,382 | 216,081 | 22,724 | |||||||||
|
| |||||||||||
| 249,287 | ||||||||||||
|
| |||||||||||
Total of Long Equity Positions | 243,555 | |||||||||||
|
| |||||||||||
| Short Positions | ||||||||||||
| Common Stocks | ||||||||||||
| Australia | ||||||||||||
| BHP Billiton PLC | (5,150 | ) | (77,765 | ) | 20,333 | |||||||
|
| |||||||||||
| Chile | ||||||||||||
| Antofagasta PLC | (12,946 | ) | (95,481 | ) | 6,428 | |||||||
|
| |||||||||||
| Ireland | ||||||||||||
| Experian PLC | (12,580 | ) | (205,425 | ) | (16,919 | ) | ||||||
|
| |||||||||||
| Netherlands | ||||||||||||
| Royal Dutch Shell PLC | (5,770 | ) | (139,536 | ) | 8,850 | |||||||
|
| |||||||||||
| United Kingdom | ||||||||||||
| Aberdeen Asset Management PLC | (29,637 | ) | (142,422 | ) | 16,132 | |||||||
| Admiral Group PLC | (3,246 | ) | (71,823 | ) | (7,495 | ) | ||||||
| Amec Foster Wheeler PLC | (11,619 | ) | (123,661 | ) | 50,314 | |||||||
| Anglo American PLC | (11,524 | ) | (102,016 | ) | 51,458 | |||||||
| ARM Holdings PLC | (7,578 | ) | (106,884 | ) | (8,620 | ) | ||||||
| ASOS PLC | (2,939 | ) | (120,413 | ) | (28,917 | ) | ||||||
| REFERENCE ENTITY | SHARES | NOTIONAL (a) | NET UNREALIZED APPRECIATION (DEPRECIATION) | |||||||||
| United Kingdom (continued) | ||||||||||||
| Associated British Foods PLC | (4,254 | ) | $ | (213,911 | ) | $ | 4,583 | |||||
| AstraZeneca PLC | (3,733 | ) | (239,483 | ) | (12,671 | ) | ||||||
| Auto Trader Group PLC | (6,912 | ) | (44,066 | ) | (1,000 | ) | ||||||
| Booker Group PLC | (12,448 | ) | (33,121 | ) | (101 | ) | ||||||
| BP PLC | (43,727 | ) | (233,557 | ) | 6,321 | |||||||
| British American Tobacco PLC | (6,797 | ) | (373,659 | ) | (3,806 | ) | ||||||
| BTG PLC | (10,030 | ) | (93,048 | ) | (8,585 | ) | ||||||
| Burberry Group PLC | (6,119 | ) | (123,041 | ) | 15,384 | |||||||
| Cable & Wireless Communications PLC | (22,682 | ) | (18,863 | ) | (5,951 | ) | ||||||
| Capita PLC | (8,992 | ) | (163,022 | ) | 3,032 | |||||||
| Centrica PLC | (89,089 | ) | (288,514 | ) | 2,452 | |||||||
| Croda International PLC | (763 | ) | (30,838 | ) | (3,348 | ) | ||||||
| Diageo PLC | (17,094 | ) | (447,547 | ) | (19,252 | ) | ||||||
| Drax Group PLC | (28,982 | ) | (103,623 | ) | (724 | ) | ||||||
| GlaxoSmithKline PLC | (13,010 | ) | (253,369 | ) | (9,379 | ) | ||||||
| Hargreaves Lansdown PLC | (13,880 | ) | (248,981 | ) | (59,164 | ) | ||||||
| ICAP PLC | (4,123 | ) | (29,871 | ) | (1,076 | ) | ||||||
| IMI PLC | (5,036 | ) | (71,382 | ) | 7,478 | |||||||
| Informa PLC | (1,326 | ) | (11,194 | ) | (790 | ) | ||||||
| InterContinental Hotels Group PLC | (7,495 | ) | (274,903 | ) | (17,241 | ) | ||||||
| Intertek Group PLC | (2,207 | ) | (80,655 | ) | (9,625 | ) | ||||||
| Johnson Matthey PLC | (299 | ) | (11,219 | ) | (477 | ) | ||||||
| Lloyds Banking Group PLC | (160,136 | ) | (181,658 | ) | 9,352 | |||||||
| Melrose Industries PLC | (18,713 | ) | (75,337 | ) | (4,819 | ) | ||||||
| Ocado Group PLC | (18,524 | ) | (88,199 | ) | 5,438 | |||||||
| Old Mutual PLC | (48,588 | ) | (137,935 | ) | 10,116 | |||||||
| Pearson PLC | (1,490 | ) | (20,297 | ) | 4,189 | |||||||
| Pennon Group PLC | (5,899 | ) | (72,913 | ) | (1,924 | ) | ||||||
| Petrofac Ltd. | (22,003 | ) | (253,631 | ) | (4,457 | ) | ||||||
| Prudential PLC | (7,031 | ) | (145,264 | ) | (13,141 | ) | ||||||
| Reckitt Benckiser Group PLC | (752 | ) | (69,979 | ) | 399 | |||||||
| Rio Tinto PLC | (1,230 | ) | (35,906 | ) | 94 | |||||||
| Rolls-Royce Holdings PLC (3) | (231,379 | ) | 15 | (356 | ) | |||||||
| Rolls-Royce Holdings PLC | (4,926 | ) | (49,805 | ) | 8,080 | |||||||
| Rotork PLC | (13,065 | ) | (33,994 | ) | (1,166 | ) | ||||||
| Royal Bank of Scotland Group PLC | (62,527 | ) | (292,546 | ) | 14,609 | |||||||
| RSA Insurance Group PLC | (18,183 | ) | (110,197 | ) | (3,926 | ) | ||||||
| SABMiller PLC | (5,484 | ) | (288,836 | ) | (39,239 | ) | ||||||
| Serco Group PLC | (193,522 | ) | (287,427 | ) | 18,131 | |||||||
| Severn Trent PLC | (2,224 | ) | (73,601 | ) | 2,508 | |||||||
| Smiths Group PLC | (910 | ) | (13,276 | ) | 692 | |||||||
| Spectris PLC | (445 | ) | (11,175 | ) | (634 | ) | ||||||
| Spirax-Sarco Engineering PLC | (813 | ) | (34,523 | ) | (4,796 | ) | ||||||
| The accompanying notes are an integral part of these financial statements. | (Continued) |
| AQR Funds | Annual Report | December 2015 | ||||||||||||||
311
Table of Contents
| Consolidated Schedule of Investments | December 31, 2015 |
| AQR STYLE PREMIA ALTERNATIVE LV FUND |
| REFERENCE ENTITY | SHARES | NOTIONAL (a) | NET UNREALIZED APPRECIATION (DEPRECIATION) | |||||||||
| United Kingdom (continued) | ||||||||||||
| Sports Direct International PLC | (3,741 | ) | $ | (42,017 | ) | $ | 10,225 | |||||
| St. James’s Place PLC | (6,530 | ) | (83,744 | ) | (13,041 | ) | ||||||
| Standard Chartered PLC | (8,813 | ) | (75,503 | ) | 2,380 | |||||||
| Standard Life PLC | (48,405 | ) | (284,797 | ) | 7,605 | |||||||
| Tate & Lyle PLC | (8,781 | ) | (76,835 | ) | (511 | ) | ||||||
| Tesco PLC | (316,750 | ) | (784,637 | ) | 88,649 | |||||||
| Thomas Cook Group PLC | (49,914 | ) | (87,079 | ) | (1,982 | ) | ||||||
| UBM PLC | (3,309 | ) | (23,850 | ) | (1,796 | ) | ||||||
| Weir Group PLC/The | (3,600 | ) | (60,300 | ) | 7,421 | |||||||
|
| |||||||||||
| 57,032 | ||||||||||||
|
| |||||||||||
Total of Short Equity Positions | 75,724 | |||||||||||
|
| |||||||||||
Total of Long and Short Equity Positions | 319,279 | |||||||||||
|
| |||||||||||
Net Cash and Other Receivables/ (Payables) (b) | 10,453 | |||||||||||
|
| |||||||||||
Swaps, at Value | $ | 329,732 | ||||||||||
|
| |||||||||||
| (a) | Notional value represents the market value (including any fees or commissions) of the long and short positions when they are established. |
| (b) | Cash and other receivables/(payables) includes the gains (or losses) realized within the swap when the swap resets. |
| (3) | Level 3 security (See Note 5). |
Total Return Basket Swaps Outstanding at December 31, 2015
| COUNTERPARTY | DESCRIPTION | TERMINATION DATE** | VALUE (Note 5) | |||||
| Goldman Sachs | The Fund receives the total return on a portfolio of long and short positions and pays or receives the Euro Interbank Offered Rate plus or minus a specified spread, which is denominated in EUR based on the local currencies of the positions within the swaps. | 1-12 months maturity ranging from 01/14/2016 - 09/30/2016 | $43,730 | |||||
|
| |||||||
| ** | The maturity dates are measured from the commencement of investment in each underlying swap position. |
Additional Information — Total Return Basket Swap
The following table represents the individual long and short positions and related values within the total return basket swap as of December 31, 2015.
| REFERENCE ENTITY | SHARES | NOTIONAL (a) | NET UNREALIZED APPRECIATION (DEPRECIATION) | |||||||||
| Long Positions | ||||||||||||
| Common Stocks | ||||||||||||
| France | ||||||||||||
| Aeroports de Paris | 659 | $ | 71,132 | $ | 5,555 | |||||||
| Atos SE | 1,473 | 116,886 | 6,776 | |||||||||
| AXA SA | 3,978 | 101,087 | 7,607 | |||||||||
| BNP Paribas SA | 3,712 | 220,025 | (10,010 | ) | ||||||||
| Cap Gemini SA | 3,283 | 287,502 | 17,113 | |||||||||
| Christian Dior SE | 833 | 149,268 | (7,773 | ) | ||||||||
| Cie Generale des Etablissements Michelin | 3,503 | 336,094 | (2,669 | ) | ||||||||
| REFERENCE ENTITY | SHARES | NOTIONAL (a) | NET UNREALIZED APPRECIATION (DEPRECIATION) | |||||||||
| France (continued) | ||||||||||||
| Credit Agricole SA | 2,267 | $ | 25,841 | $ | 874 | |||||||
| Dassault Systemes | 352 | 25,331 | 2,805 | |||||||||
| Eiffage SA | 1,684 | 103,181 | 5,653 | |||||||||
| Electricite de France SA | 10,800 | 183,205 | (24,148 | ) | ||||||||
| Eutelsat Communications SA | 3,246 | 100,668 | (3,481 | ) | ||||||||
| Imerys SA | 1,156 | 73,746 | 7,002 | |||||||||
| Ipsen SA | 1,519 | 97,456 | 3,190 | |||||||||
| Lagardere SCA | 3,412 | 97,379 | 4,440 | |||||||||
| L’Oreal SA | 1,160 | 191,139 | 3,979 | |||||||||
| The accompanying notes are an integral part of these financial statements. | (Continued) |
| AQR Funds | Annual Report | December 2015 | ||||||||||||||
312
Table of Contents
| Consolidated Schedule of Investments | December 31, 2015 |
| AQR STYLE PREMIA ALTERNATIVE LV FUND |
| REFERENCE ENTITY | SHARES | NOTIONAL (a) | NET UNREALIZED APPRECIATION (DEPRECIATION) | |||||||||
| France (continued) | ||||||||||||
| Orpea | 624 | $ | 49,255 | $ | 706 | |||||||
| Peugeot SA | 15,478 | 238,811 | 32,502 | |||||||||
| Publicis Groupe SA | 182 | 11,911 | 192 | |||||||||
| Safran SA | 607 | 45,619 | (3,916 | ) | ||||||||
| Sanofi | 2,060 | 194,237 | (18,680 | ) | ||||||||
| SCOR SE | 8,111 | 290,994 | 12,501 | |||||||||
| SEB SA | 1,892 | 172,518 | 21,716 | |||||||||
| Societe BIC SA | 513 | 77,312 | 7,104 | |||||||||
| Societe Generale SA | 5,435 | 252,376 | (1,919 | ) | ||||||||
| Societe Television Francaise 1 | 1,143 | 15,603 | (2,911 | ) | ||||||||
| Sodexo SA | 614 | 60,865 | (879 | ) | ||||||||
| Suez Environnement Co. | 3,530 | 66,622 | (599 | ) | ||||||||
| Teleperformance | 1,964 | 150,109 | 15,038 | |||||||||
| Thales SA | 3,442 | 239,497 | 18,136 | |||||||||
| Veolia Environnement SA | 15,357 | 362,310 | 2,047 | |||||||||
| Vinci SA | 3,140 | 202,654 | (1,397 | ) | ||||||||
| Vivendi SA | 3,852 | 89,079 | (6,350 | ) | ||||||||
|
| |||||||||||
| 90,204 | ||||||||||||
|
| |||||||||||
Total of Long Equity Positions | 90,204 | |||||||||||
|
| |||||||||||
| Short Positions | ||||||||||||
| Common Stocks | ||||||||||||
| France | ||||||||||||
| Accor SA | (518 | ) | (23,135 | ) | 700 | |||||||
| Airbus Group SE | (785 | ) | (46,318 | ) | (6,581 | ) | ||||||
| Arkema SA | (626 | ) | (39,591 | ) | (4,228 | ) | ||||||
| Bollore SA | (23,820 | ) | (115,600 | ) | 4,608 | |||||||
| Bureau Veritas SA | (1,302 | ) | (27,252 | ) | 1,301 | |||||||
| Carrefour SA | (411 | ) | (12,210 | ) | 349 | |||||||
| Casino Guichard Perrachon SA | (6,438 | ) | (347,217 | ) | 51,451 | |||||||
| Cie de Saint-Gobain | (1,688 | ) | (71,636 | ) | (1,514 | ) | ||||||
| Edenred | (8,279 | ) | (157,586 | ) | 1,088 | |||||||
| Engie | (8,422 | ) | (140,673 | ) | (8,507 | ) | ||||||
| Hermes International | (954 | ) | (336,980 | ) | 14,505 | |||||||
| Iliad SA | (499 | ) | (103,158 | ) | (15,792 | ) | ||||||
| REFERENCE ENTITY | SHARES | NOTIONAL (a) | NET UNREALIZED APPRECIATION (DEPRECIATION) | |||||||||
| France (continued) | ||||||||||||
| Ingenico Group | (543 | ) | $ | (68,657 | ) | $ | 119 | |||||
| Kering | (341 | ) | (61,851 | ) | 3,548 | |||||||
| LVMH Moet Hennessy Louis Vuitton SE | (76 | ) | (13,572 | ) | 1,634 | |||||||
| Natixis SA | (21,205 | ) | (124,902 | ) | 4,944 | |||||||
| Orange SA | (4,623 | ) | (67,655 | ) | (9,668 | ) | ||||||
| Pernod Ricard SA | (606 | ) | (69,728 | ) | 617 | |||||||
| Plastic Omnium SA | (6,262 | ) | (148,958 | ) | (50,091 | ) | ||||||
| Remy Cointreau SA | (2,762 | ) | (169,354 | ) | (28,475 | ) | ||||||
| Renault SA | (636 | ) | (44,179 | ) | (19,482 | ) | ||||||
| Rexel SA | (2,148 | ) | (28,659 | ) | 56 | |||||||
| Schneider Electric SE | (2,157 | ) | (126,374 | ) | 3,848 | |||||||
| Technip SA | (7,402 | ) | (344,241 | ) | (23,862 | ) | ||||||
| TOTAL SA | (4,470 | ) | (204,764 | ) | 4,368 | |||||||
| Valeo SA | (430 | ) | (56,727 | ) | (9,569 | ) | ||||||
| Vallourec SA | (16,643 | ) | (172,365 | ) | 17,422 | |||||||
| Zodiac Aerospace | (7,757 | ) | (197,838 | ) | 13,142 | |||||||
|
| |||||||||||
| (54,069 | ) | |||||||||||
|
| |||||||||||
| Luxembourg | ||||||||||||
| SES SA | (2,756 | ) | (78,507 | ) | 2,139 | |||||||
|
| |||||||||||
Total of Short Equity Positions | (51,930 | ) | ||||||||||
|
| |||||||||||
Total of Long and Short Equity Positions | 38,274 | |||||||||||
|
| |||||||||||
Net Cash and Other Receivables/ (Payables) (b) | 5,456 | |||||||||||
|
| |||||||||||
Swaps, at Value | $ | 43,730 | ||||||||||
|
| |||||||||||
| (a) | Notional value represents the market value (including any fees or commissions) of the long and short positions when they are established. |
| (b) | Cash and other receivables/(payables) includes the gains (or losses) realized within the swap when the swap resets. |
| The accompanying notes are an integral part of these financial statements. | (Continued) |
| AQR Funds | Annual Report | December 2015 | ||||||||||||||
313
Table of Contents
| Consolidated Schedule of Investments | December 31, 2015 |
| AQR STYLE PREMIA ALTERNATIVE LV FUND |
Collateral pledged to, or (received from), each counterparty at December 31, 2015 was as follows:
| COUNTERPARTY | OVER THE COUNTER | EXCHANGE TRADED/ CENTRALLY CLEARED | TOTAL | |||||||||
| Bank of America | ||||||||||||
| Money Market Funds | $140,000 | $ — | $140,000 | |||||||||
| ||||||||||||
| Barclays Capital | ||||||||||||
| Cash | — | 3,989,848 | 3,989,848 | |||||||||
| ||||||||||||
| CitiBank | ||||||||||||
| Money Market Funds | 370,002 | — | 370,002 | |||||||||
| ||||||||||||
| Goldman Sachs | ||||||||||||
| Cash | — | 683,496 | 683,496 | |||||||||
| Money Market Funds | 13,700,000 | — | 13,700,000 | |||||||||
| ||||||||||||
| J.P. Morgan | ||||||||||||
| Cash | — | 2,311,649 | 2,311,649 | |||||||||
| ||||||||||||
| Morgan Stanley and Co., International PLC | ||||||||||||
| Cash | — | 371,502 | 371,502 | |||||||||
| Money Market Funds | 370,000 | — | 370,000 | |||||||||
| ||||||||||||
Collateral pledged to, or (received from), each counterparty for the Subsidiary (See Note 2) at December 31, 2015 was as follows:
| COUNTERPARTY | OVER THE COUNTER | EXCHANGE TRADED/ CENTRALLY CLEARED | TOTAL | |||||||||
| CitiBank | ||||||||||||
| Money Market Funds | $100,000 | $ — | $100,000 | |||||||||
| ||||||||||||
| Goldman Sachs | ||||||||||||
| Cash | — | 112,269 | 112,269 | |||||||||
| ||||||||||||
| J.P. Morgan | ||||||||||||
| Cash | — | 236,297 | 236,297 | |||||||||
| ||||||||||||
| Macquarie Capital | ||||||||||||
| Money Market Funds | 270,000 | — | 270,000 | |||||||||
| ||||||||||||
| Morgan Stanley and Co., International PLC | ||||||||||||
| Cash | — | �� | 757,900 | 757,900 | ||||||||
| ||||||||||||
| Societe Generale | ||||||||||||
| Money Market Funds | 110,000 | — | 110,000 | |||||||||
| ||||||||||||
| The accompanying notes are an integral part of these financial statements. |
| AQR Funds | Annual Report | December 2015 | ||||||||||||||
314
Table of Contents
| Statements of Assets and Liabilities | December 31, 2015 |
| AQR DIVERSIFIED ARBITRAGE FUND | AQR EQUITY MARKET NEUTRAL FUND | AQR GLOBAL MACRO FUND** | AQR LONG-SHORT EQUITY FUND | |||||||||||||
| ASSETS: | ||||||||||||||||
| Investments in securities, at cost | $ | 1,522,832,066 | $ | 304,169,426 | $ | 46,801,121 | $ | 635,324,814 | ||||||||
| Investments in securities, at value | $ | 1,300,405,223 | $ | 304,396,044 | $ | 46,801,090 | $ | 633,057,609 | ||||||||
| Cash | — | 8,160,579 | — | — | ||||||||||||
| Foreign currency, at value‡ | 14,051,942 | 75,190 | 9,025 | 1,639,410 | ||||||||||||
| Due from brokers | — | 10,693,408 | — | 28,510,055 | ||||||||||||
| Unrealized appreciation on forward foreign currency exchange contracts | 1,467,728 | 54,341 | 816,404 | 964,654 | ||||||||||||
| OTC swaps, at value | 4,438,467 | 6,076,500 | 124,582 | 5,822,740 | ||||||||||||
| Deposits with brokers for exchange-traded and centrally cleared derivatives | 7,468,949 | 803 | 5,513,779 | 15,595,156 | ||||||||||||
| Variation margin on exchange-traded and centrally cleared derivatives | 377,552 | — | 185,825 | — | ||||||||||||
| Receivables: | ||||||||||||||||
Securities sold | 19,336,872 | 10,919,937 | 7,332 | 27,016,296 | ||||||||||||
Foreign tax reclaim | 62,954 | 9,494 | — | 32,324 | ||||||||||||
Dividends and interest | 4,480,253 | 18,507 | 1,095 | 35,480 | ||||||||||||
Capital shares sold | 651,077 | 3,662,707 | 112,244 | 9,428,875 | ||||||||||||
| Prepaid expenses | 73,660 | 47,560 | 26,576 | 56,167 | ||||||||||||
| Total Assets | 1,352,814,677 | 344,115,070 | 53,597,952 | 722,158,766 | ||||||||||||
| LIABILITIES: | ||||||||||||||||
| Securities sold short, at value (proceeds $440,499,377, $65,907,566, $— and $133,544,633, respectively) | 346,044,320 | 63,604,605 | — | 123,231,636 | ||||||||||||
| Options written, at value (proceeds $2,388,431, $—, $— and $—, respectively) | 201,436 | — | — | — | ||||||||||||
| Due to custodian | 2,330,779 | — | 833 | 7,108,051 | ||||||||||||
| Due to brokers | 21,215,234 | — | 357,150 | 290,000 | ||||||||||||
| Unrealized depreciation on forward foreign currency exchange contracts | 364,388 | 124,079 | 306,582 | 699,605 | ||||||||||||
| OTC swaps, at value | 3,110,613 | 376,337 | 18,100 | 5,455,052 | ||||||||||||
| Variation margin on exchange-traded and centrally cleared derivatives | 45,775 | — | 59,605 | 2,159,684 | ||||||||||||
| Payables: | ||||||||||||||||
Securities purchased | 14,468,570 | 10,414,011 | 6,785 | 22,388,434 | ||||||||||||
Accrued investment advisory fees | 675,705 | 162,237 | 2,640 | 392,026 | ||||||||||||
Accrued distribution fees—Class N | 40,287 | 16,849 | 5,585 | 18,087 | ||||||||||||
Accrued Trustee fees | 848 | 129 | 46 | 259 | ||||||||||||
Capital shares redeemed | 6,034,334 | 20,396 | 351,458 | 1,083,989 | ||||||||||||
Dividends and interest payable on securities sold short | 1,152,681 | 88,005 | — | 149,062 | ||||||||||||
Other accrued expenses and liabilities | 840,462 | 93,147 | 93,825 | 174,742 | ||||||||||||
| Total Liabilities | 396,525,432 | 74,899,795 | 1,202,609 | 163,150,627 | ||||||||||||
| Net Assets | $ | 956,289,245 | $ | 269,215,275 | $ | 52,395,343 | $ | 559,008,139 | ||||||||
| NET ASSETS CONSIST OF: | ||||||||||||||||
| Paid-in capital ($0.001 par value common stock, unlimited authorized shares) | $ | 1,281,360,982 | $ | 264,413,937 | $ | 52,382,146 | $ | 549,447,650 | ||||||||
| Undistributed accumulated net investment income (loss) | 10,112,228 | (3,291,781 | ) | 74,854 | 4,505,240 | |||||||||||
| Undistributed accumulated net realized gain (loss) | (209,622,795 | ) | (13,863 | ) | (933,701 | ) | (6,781,370 | ) | ||||||||
| Net unrealized appreciation (depreciation) | (125,561,170 | ) | 8,106,982 | 872,044 | 11,836,619 | |||||||||||
| Net Assets | $ | 956,289,245 | $ | 269,215,275 | $ | 52,395,343 | $ | 559,008,139 | ||||||||
| NET ASSETS: | ||||||||||||||||
| Class I | $ | 772,394,365 | $ | 179,312,297 | $ | 31,452,943 | $ | 452,667,319 | ||||||||
| Class N | 183,028,595 | 89,755,173 | 20,838,180 | 90,140,983 | ||||||||||||
| Class R6 | 866,285 | 147,805 | 104,220 | 16,199,837 | ||||||||||||
| SHARES OUTSTANDING: | ||||||||||||||||
| Class I | 83,828,615 | 15,613,151 | 3,276,016 | 37,352,680 | ||||||||||||
| Class N | 19,881,331 | 7,826,988 | 2,181,378 | 7,468,130 | ||||||||||||
| Class R6 | 94,204 | 12,859 | 10,855 | 1,335,480 | ||||||||||||
| NET ASSET VALUE: | ||||||||||||||||
| Class I | $ | 9.21 | $ | 11.48 | $ | 9.60 | $ | 12.12 | ||||||||
| Class N | $ | 9.21 | $ | 11.47 | $ | 9.55 | $ | 12.07 | ||||||||
Class R6 | $ | 9.20 | $ | 11.49 | $ | 9.60 | $ | 12.13 | ||||||||
‡ Foreign currency at cost | $ | 14,234,162 | $ | 75,105 | $ | 9,029 | $ | 1,638,674 | ||||||||
| ** | Consolidated financial statement, see Note 2 in the Notes to Financial Statements for additional information. |
| The accompanying notes are an integral part of these financial statements. |
| AQR Funds | Annual Report | December 2015 | ||||||||||||||
315
Table of Contents
| Statements of Assets and Liabilities | December 31, 2015 |
| AQR MANAGED FUTURES STRATEGY FUND** | AQR MANAGED FUTURES STRATEGY HV FUND** | AQR MULTI- STRATEGY ALTERNATIVE FUND** | AQR RISK- BALANCED COMMODITIES STRATEGY FUND** | |||||||||||||
| ASSETS: | ||||||||||||||||
| Investments in securities, at cost | $ | 9,432,505,947 | $ | 498,365,340 | $ | 2,258,088,906 | $ | 92,484,468 | ||||||||
| Investments in securities, at value | $ | 9,433,757,401 | $ | 498,399,279 | $ | 2,289,240,133 | $ | 92,487,471 | ||||||||
| Cash | 32,458,700 | — | — | — | ||||||||||||
| Foreign currency, at value‡ | 6,660,275 | 397,903 | 43,999,912 | — | ||||||||||||
| Due from brokers | 6,739,685 | 525,553 | 555,856,015 | — | ||||||||||||
| Unrealized appreciation on forward foreign currency exchange contracts | 154,800,955 | 12,115,744 | 36,246,359 | — | ||||||||||||
| OTC swaps, at value | 19,080,592 | 1,421,210 | 150,639,420 | 323,845 | ||||||||||||
| Deposits with brokers for exchange-traded and centrally cleared derivatives | 183,363,263 | 28,223,657 | 75,974,987 | 6,025,704 | ||||||||||||
| Variation margin on exchange-traded and centrally cleared derivatives | 15,649,652 | 288,312 | 10,452,406 | 207,417 | ||||||||||||
| Receivables: | ||||||||||||||||
Securities sold | 4,902,679 | 376,990 | 22,303,294 | — | ||||||||||||
Foreign tax reclaim | — | — | 1,137,954 | — | ||||||||||||
Dividends and interest | 77,042 | 5,298 | 3,460,479 | 2,462 | ||||||||||||
Capital shares sold | 37,023,864 | 8,396,542 | 39,170,855 | 4,517,681 | ||||||||||||
| Prepaid expenses | 467,362 | 66,879 | 101,718 | 21,226 | ||||||||||||
| Total Assets | 9,894,981,470 | 550,217,367 | 3,228,583,532 | 103,585,806 | ||||||||||||
| LIABILITIES: | ||||||||||||||||
| Securities sold short, at value (proceeds $—, $—, $589,365,032 and $—, respectively) | — | — | 588,406,560 | — | ||||||||||||
| Due to custodian | — | 22,396 | 68,691,851 | 393 | ||||||||||||
| Due to brokers | 9,970,434 | 732,397 | 6,971,517 | 209,968 | ||||||||||||
| Unrealized depreciation on forward foreign currency exchange contracts | 196,445,264 | 15,402,116 | 22,536,170 | — | ||||||||||||
| OTC swaps, at value | 9,008,678 | 732,814 | 13,909,218 | 557,767 | ||||||||||||
| Deposits from brokers for exchange-traded and centrally cleared derivatives | 916,506 | — | — | — | ||||||||||||
| Variation margin on exchange-traded and centrally cleared derivatives | 19,174,829 | 2,061,522 | 1,077,575 | 112,518 | ||||||||||||
| Payables: | ||||||||||||||||
Securities purchased | 4,922,703 | 378,504 | 26,877,161 | — | ||||||||||||
Accrued investment advisory fees | 8,638,430 | 521,411 | 3,476,742 | 21,574 | ||||||||||||
Accrued distribution fees—Class N | 332,208 | 28,744 | 20,597 | 511 | ||||||||||||
Accrued Trustee fees | 555 | 183 | 265 | 22 | ||||||||||||
Capital shares redeemed | 36,328,292 | 607,592 | 6,392,514 | 30,330 | ||||||||||||
Dividends and interest payable on securities sold short | — | — | 474,485 | — | ||||||||||||
Other accrued expenses and liabilities | 2,975,497 | 201,690 | 1,001,143 | 126,335 | ||||||||||||
| Total Liabilities | 288,713,396 | 20,689,369 | 739,835,798 | 1,059,418 | ||||||||||||
| Net Assets | $ | 9,606,268,074 | $ | 529,527,998 | $ | 2,488,747,734 | $ | 102,526,388 | ||||||||
| NET ASSETS CONSIST OF: | ||||||||||||||||
| Paid-in capital ($0.001 par value common stock, unlimited authorized shares) | $ | 9,785,961,957 | $ | 542,782,280 | $ | 2,535,288,815 | $ | 114,755,156 | ||||||||
| Undistributed accumulated net investment income (loss) | 71,429,074 | 6,500,488 | (135,227,340 | ) | (8,630,097 | ) | ||||||||||
| Undistributed accumulated net realized gain (loss) | (217,765,086 | ) | (17,062,698 | ) | (87,864,258 | ) | (12,630 | ) | ||||||||
| Net unrealized appreciation (depreciation) | (33,357,871 | ) | (2,692,072 | ) | 176,550,517 | (3,586,041 | ) | |||||||||
| Net Assets | $ | 9,606,268,074 | $ | 529,527,998 | $ | 2,488,747,734 | $ | 102,526,388 | ||||||||
| NET ASSETS: | ||||||||||||||||
| Class I | $ | 7,778,072,372 | $ | 258,690,940 | $ | 2,284,284,742 | $ | 71,321,022 | ||||||||
| Class N | 1,588,010,689 | 137,114,766 | 103,503,675 | 2,082,770 | ||||||||||||
| Class R6 | 240,185,013 | 133,722,292 | 100,959,317 | 29,122,596 | ||||||||||||
| SHARES OUTSTANDING: | ||||||||||||||||
| Class I | 763,949,205 | 24,165,693 | 234,044,091 | 12,690,552 | ||||||||||||
| Class N | 157,339,524 | 12,859,668 | 10,628,943 | 374,027 | ||||||||||||
| Class R6 | 23,597,686 | 12,494,290 | 10,345,164 | 5,175,399 | ||||||||||||
| NET ASSET VALUE: | ||||||||||||||||
| Class I | $ | 10.18 | $ | 10.70 | $ | 9.76 | $ | 5.62 | ||||||||
| Class N | $ | 10.09 | $ | 10.66 | $ | 9.74 | $ | 5.57 | ||||||||
Class R6 | $ | 10.18 | $ | 10.70 | $ | 9.76 | $ | 5.63 | ||||||||
‡ Foreign currency at cost | $ | 6,666,152 | $ | 397,604 | $ | 44,409,449 | $ | — | ||||||||
| ** | Consolidated financial statement, see Note 2 in the Notes to Financial Statements for additional information. |
| The accompanying notes are an integral part of these financial statements. |
| AQR Funds | Annual Report | December 2015 | ||||||||||||||
316
Table of Contents
| Statements of Assets and Liabilities | December 31, 2015 |
| AQR RISK PARITY FUND** | AQR RISK PARITY II HV FUND** | AQR RISK PARITY II MV FUND** | AQR STYLE PREMIA ALTERNATIVE FUND** | |||||||||||||
| ASSETS: | ||||||||||||||||
| Investments in securities, at cost | $ | 493,883,647 | $ | 55,533,202 | $ | 88,163,217 | $ | 2,144,164,425 | ||||||||
| Investments in securities, at value | $ | 489,554,966 | $ | 55,179,504 | $ | 87,490,915 | $ | 2,159,709,037 | ||||||||
| Cash | 96,276 | — | — | 1,662,461 | ||||||||||||
| Foreign currency, at value‡ | 1,506,539 | 33,224 | 120,501 | 4,560,601 | ||||||||||||
| Due from brokers | 28,536 | 8,060 | 12,572 | 4,546,472 | ||||||||||||
| Unrealized appreciation on forward foreign currency exchange contracts | 991,423 | 41,152 | 55,018 | 19,468,488 | ||||||||||||
| OTC swaps, at value | 438,707 | 36,390 | 121,247 | 2,392,364 | ||||||||||||
| Deposits with brokers for exchange-traded and centrally cleared derivatives | 32,390,982 | 2,593,664 | 3,126,288 | 135,536,497 | ||||||||||||
| Variation margin on exchange-traded and centrally cleared derivatives | 1,450,286 | 137,468 | 213,756 | 4,265,113 | ||||||||||||
| Receivables: | ||||||||||||||||
Securities sold | 290,532 | 11,829 | 17,555 | 775,021 | ||||||||||||
Foreign tax reclaim | — | — | — | 543,452 | ||||||||||||
Dividends and interest | 280,448 | 30,128 | 46,400 | 495,626 | ||||||||||||
Capital shares sold | 144,238 | 654,549 | 239,259 | 33,354,373 | ||||||||||||
Due from Investment Adviser | — | 5,604 | — | — | ||||||||||||
| Prepaid expenses | 42,909 | 29,911 | 38,998 | 98,350 | ||||||||||||
| Total Assets | 527,215,842 | 58,761,483 | 91,482,509 | 2,367,407,855 | ||||||||||||
| LIABILITIES: | ||||||||||||||||
| Securities sold short, at value (proceeds $—, $—, $— and $507,957,986, respectively) | — | — | — | 488,339,388 | ||||||||||||
| Reverse repurchase agreements, at value | — | 9,233,035 | — | — | ||||||||||||
| Due to custodian | — | 13,813 | 23,795 | — | ||||||||||||
| Due to brokers | 522,677 | 67,128 | 78,924 | 2,936,832 | ||||||||||||
| Unrealized depreciation on forward foreign currency exchange contracts | 4,912,113 | 158,019 | 209,065 | 11,836,195 | ||||||||||||
| OTC swaps, at value | 1,010,491 | 140,718 | 355,699 | 25,316,213 | ||||||||||||
| Deposits from brokers for exchange-traded and centrally cleared derivatives | 25,366 | — | 25,071 | — | ||||||||||||
| Variation margin on exchange-traded and centrally cleared derivatives | 168,222 | 129,781 | 189,507 | 3,477,149 | ||||||||||||
| Payables: | ||||||||||||||||
Securities purchased | 402,541 | 11,828 | 17,554 | 769,413 | ||||||||||||
Accrued investment advisory fees | 274,376 | — | 27,090 | 1,619,627 | ||||||||||||
Accrued distribution fees—Class N | 5,089 | 1,212 | 911 | 16,530 | ||||||||||||
Accrued Trustee fees | 339 | 31 | 65 | 524 | ||||||||||||
Capital shares redeemed | 1,841,462 | 103,805 | 181,208 | 3,298,199 | ||||||||||||
Dividends and interest payable on securities sold short | — | — | — | 523,529 | ||||||||||||
Interest payable for reverse repurchase agreements | — | 5,562 | — | — | ||||||||||||
Other accrued expenses and liabilities | 275,200 | 100,620 | 114,903 | 526,837 | ||||||||||||
| Total Liabilities | 9,437,876 | 9,965,552 | 1,223,792 | 538,660,436 | ||||||||||||
| Net Assets | $ | 517,777,966 | $ | 48,795,931 | $ | 90,258,717 | $ | 1,828,747,419 | ||||||||
| NET ASSETS CONSIST OF: | ||||||||||||||||
| Paid-in capital ($0.001 par value common stock, unlimited authorized shares) | $ | 549,689,907 | $ | 54,285,687 | $ | 97,259,781 | $ | 1,824,131,241 | ||||||||
| Undistributed accumulated net investment income (loss) | (11,483,741 | ) | (2,528,445 | ) | (2,860,613 | ) | 36,181,849 | |||||||||
| Undistributed accumulated net realized gain (loss) | (8,717,711 | ) | (1,732,875 | ) | (2,214,645 | ) | (31,450,825 | ) | ||||||||
| Net unrealized appreciation (depreciation) | (11,710,489 | ) | (1,228,436 | ) | (1,925,806 | ) | (114,846 | ) | ||||||||
| Net Assets | $ | 517,777,966 | $ | 48,795,931 | $ | 90,258,717 | $ | 1,828,747,419 | ||||||||
| NET ASSETS: | ||||||||||||||||
| Class I | $ | 492,976,807 | $ | 40,889,441 | $ | 85,917,605 | $ | 1,341,231,769 | ||||||||
| Class N | 22,004,769 | 5,493,253 | 4,241,790 | 92,947,603 | ||||||||||||
| Class R6 | 2,796,390 | 2,413,237 | 99,322 | 394,568,047 | ||||||||||||
| SHARES OUTSTANDING: | ||||||||||||||||
| Class I | 54,203,404 | 5,250,810 | 10,090,660 | 132,222,963 | ||||||||||||
| Class N | 2,424,293 | 704,394 | 499,865 | 9,168,045 | ||||||||||||
| Class R6 | 307,370 | 310,087 | 11,671 | 38,861,071 | ||||||||||||
| NET ASSET VALUE: | ||||||||||||||||
| Class I | $ | 9.09 | �� | $ | 7.79 | $ | 8.51 | $ | 10.14 | |||||||
| Class N | $ | 9.08 | $ | 7.80 | $ | 8.49 | $ | 10.14 | ||||||||
Class R6 | $ | 9.10 | $ | 7.78 | $ | 8.51 | $ | 10.15 | ||||||||
‡ Foreign currency at cost | $ | 1,309,229 | $ | 34,118 | $ | 122,221 | $ | 4,546,926 | ||||||||
| ** | Consolidated financial statement, see Note 2 in the Notes to Financial Statements for additional information. |
| The accompanying notes are an integral part of these financial statements. |
| AQR Funds | Annual Report | December 2015 | ||||||||||||||
317
Table of Contents
| Statements of Assets and Liabilities | December 31, 2015 |
| AQR STYLE PREMIA ALTERNATIVE LV FUND** | ||||
| ASSETS: | ||||
| Investments in securities, at cost | $ | 204,306,898 | ||
| Investments in securities, at value | $ | 205,201,002 | ||
| Cash | 99,077 | |||
| Foreign currency, at value‡ | 128,940 | |||
| Due from brokers | 15,523 | |||
| Unrealized appreciation on forward foreign currency exchange contracts | 1,069,551 | |||
| OTC swaps, at value | 1,676,727 | |||
| Deposits with brokers for exchange-traded and centrally cleared derivatives | 7,334,701 | |||
| Variation margin on exchange-traded and centrally cleared derivatives | 249,243 | |||
| Receivables: | ||||
Securities sold | 4,048,560 | |||
Foreign tax reclaim | 6,754 | |||
Dividends and interest | 37,194 | |||
Capital shares sold | 776,060 | |||
| Prepaid expenses | 36,832 | |||
| Total Assets | 220,680,164 | |||
| LIABILITIES: | ||||
| Securities sold short, at value (proceeds $28,335,852) | 27,737,830 | |||
| Due to brokers | 89,691 | |||
| Unrealized depreciation on forward foreign currency exchange contracts | 679,517 | |||
| OTC swaps, at value | 366,986 | |||
| Variation margin on exchange-traded and centrally cleared derivatives | 141,289 | |||
| Payables: | ||||
Securities purchased | 3,650,333 | |||
Accrued investment advisory fees | 43,277 | |||
Accrued distribution fees—Class N | 2,606 | |||
Accrued Trustee fees | 103 | |||
Capital shares redeemed | 2,474 | |||
Dividends and interest payable on securities sold short | 28,140 | |||
Other accrued expenses and liabilities | 145,465 | |||
| Total Liabilities | 32,887,711 | |||
| Net Assets | $ | 187,792,453 | ||
| NET ASSETS CONSIST OF: | ||||
| Paid-in capital ($0.001 par value common stock, unlimited authorized shares) | $ | 187,737,223 | ||
| Undistributed accumulated net investment income (loss) | (822,566 | ) | ||
| Undistributed accumulated net realized gain (loss) | (1,290,191 | ) | ||
| Net unrealized appreciation (depreciation) | 2,167,987 | |||
| Net Assets | $ | 187,792,453 | ||
| NET ASSETS: | ||||
| Class I | $ | 152,172,386 | ||
| Class N | 13,444,266 | |||
| Class R6 | 22,175,801 | |||
| SHARES OUTSTANDING: | ||||
| Class I | 14,645,410 | |||
| Class N | 1,294,548 | |||
| Class R6 | 2,132,230 | |||
| NET ASSET VALUE: | ||||
| Class I | $ | 10.39 | ||
| Class N | $ | 10.39 | ||
| Class R6 | $ | 10.40 | ||
‡ Foreign currency at cost | $ | 127,689 | ||
| ** | Consolidated financial statement, see Note 2 in the Notes to Financial Statements for additional information. |
| The accompanying notes are an integral part of these financial statements. |
| AQR Funds | Annual Report | December 2015 | ||||||||||||||
318
Table of Contents
| Statements of Operations | December 31, 2015 |
AQR DIVERSIFIED | AQR EQUITY MARKET NEUTRAL FUND | AQR GLOBAL | AQR LONG-SHORT EQUITY FUND | |||||||||||||
| FOR THE YEAR ENDED DECEMBER 31, 2015 | FOR THE YEAR ENDED DECEMBER 31, 2015 | FOR THE YEAR ENDED DECEMBER 31, 2015 | FOR THE YEAR ENDED DECEMBER 31, 2015 | |||||||||||||
| INVESTMENT INCOME: | ||||||||||||||||
Dividend income† | $21,355,053 | $318,508 | $1,124 | $916,690 | ||||||||||||
Interest income | 28,373,263 | 22,797 | 32,145 | 80,241 | ||||||||||||
| Total Income | 49,728,316 | 341,305 | 33,269 | 996,931 | ||||||||||||
| EXPENSES: | ||||||||||||||||
Investment advisory fees | 16,045,390 | 716,461 | 891,411 | 2,130,776 | ||||||||||||
Custody fees | 120,608 | 1,986 | 13,211 | 13,156 | ||||||||||||
Administration & accounting fees | 404,073 | 21,040 | 22,170 | 65,652 | ||||||||||||
Legal fees | 165,499 | 14,244 | 14,378 | 2,789 | ||||||||||||
Audit & tax fees | 291,499 | 51,668 | 61,079 | 38,824 | ||||||||||||
Shareholder reporting fees | 199,947 | 15,575 | 8,165 | 37,222 | ||||||||||||
Transfer agent fees | 1,509,659 | 48,436 | 66,337 | 149,274 | ||||||||||||
Trustee fees | 77,407 | 1,465 | 2,800 | 5,549 | ||||||||||||
Offering costs | — | 33,729 | 23,348 | — | ||||||||||||
Distribution fees—Class N | 841,937 | 56,881 | 99,335 | 81,183 | ||||||||||||
Dividends and interest on securities sold short (Note 4) | 19,555,290 | 425,541 | — | 1,037,015 | ||||||||||||
Registration fees | 207,683 | 62,105 | 57,689 | 56,602 | ||||||||||||
Pricing fee | 343,214 | 22,045 | 40,641 | 24,400 | ||||||||||||
Other expenses | 207,188 | 18,195 | 8,706 | 34,554 | ||||||||||||
| Total Expenses | 39,969,394 | 1,489,371 | 1,309,270 | 3,676,996 | ||||||||||||
Less fee waivers and/or reimbursements | (364,207 | ) | (191,780 | ) | (198,491 | ) | (98,562 | ) | ||||||||
| Net Expenses | 39,605,187 | 1,297,591 | 1,110,779 | 3,578,434 | ||||||||||||
| Net Investment Income (Loss) | 10,123,129 | (956,286 | ) | (1,077,510 | ) | (2,581,503 | ) | |||||||||
| REALIZED GAIN (LOSS) AND CHANGE IN UNREALIZED APPRECIATION (DEPRECIATION): | ||||||||||||||||
| Net realized gain (loss) from: | ||||||||||||||||
Investments in securities | (33,161,251 | ) | (513,067 | ) | (28,811 | ) | (1,148,140 | ) | ||||||||
Foreign currency and foreign currency transactions | (123,231 | ) | (49,511 | ) | (37,888 | ) | (138,699 | ) | ||||||||
Forward foreign currency exchange contracts | 14,688,702 | 183,996 | 2,362,397 | (2,242,959 | ) | |||||||||||
Futures contracts | (11,342,833 | ) | 172,181 | 371,148 | (1,896,816 | ) | ||||||||||
Securities sold short | (48,040,305 | ) | 399,981 | — | 271,826 | |||||||||||
Swap contracts | 21,486,113 | 3,165,894 | (1,278,467 | ) | 32,625,929 | |||||||||||
Written options | 854,357 | — | — | — | ||||||||||||
| Net realized gain (loss) | (55,638,448 | ) | 3,359,474 | 1,388,379 | 27,471,141 | |||||||||||
| Net change in unrealized appreciation (depreciation) on: | ||||||||||||||||
Investments in securities | (106,849,272 | ) | 235,429 | (31 | ) | (2,267,205 | ) | |||||||||
Foreign currency and foreign currency translations | (18,906 | ) | (49,428 | ) | (14,878 | ) | (49,192 | ) | ||||||||
Forward foreign currency exchange contracts | (5,362,743 | ) | (76,949 | ) | 271,754 | 410,684 | ||||||||||
Futures contracts | 11,906,666 | 7,134 | (397,478 | ) | 2,366,022 | |||||||||||
Securities sold short | 99,571,995 | 2,283,578 | — | 10,312,997 | ||||||||||||
Swap contracts | (20,508,082 | ) | 5,370,356 | 220,697 | (3,123,427 | ) | ||||||||||
Written options | 588,688 | — | — | — | ||||||||||||
| Net change in unrealized appreciation (depreciation) | (20,671,654 | ) | 7,770,120 | 80,064 | 7,649,879 | |||||||||||
| Net realized gain (loss) and net change in unrealized appreciation (depreciation) | (76,310,102 | ) | 11,129,594 | 1,468,443 | 35,121,020 | |||||||||||
| Net increase (decrease) in net assets resulting from operations | $(66,186,973 | ) | $10,173,308 | $390,933 | $32,539,517 | |||||||||||
† Net of foreign taxes withheld of | $51,975 | $42,822 | $— | $132,899 | ||||||||||||
| ** | Consolidated financial statement, see Note 2 in the Notes to Financial Statements for additional information. |
| The accompanying notes are an integral part of these financial statements. |
| AQR Funds | Annual Report | December 2015 | ||||||||||||||
319
Table of Contents
| Statements of Operations | December 31, 2015 |
AQR MANAGED | AQR MANAGED FUTURES STRATEGY HV FUND** | AQR MULTI- STRATEGY ALTERNATIVE FUND** | AQR RISK- BALANCED COMMODITIES STRATEGY FUND** | |||||||||||||
| FOR THE YEAR ENDED DECEMBER 31, 2015 | FOR THE YEAR ENDED DECEMBER 31, 2015 | FOR THE YEAR ENDED DECEMBER 31, 2015 | FOR THE YEAR ENDED DECEMBER 31, 2015 | |||||||||||||
| INVESTMENT INCOME: | ||||||||||||||||
Dividend income† | $124,012 | $5,461 | $7,953,397 | $4,568 | ||||||||||||
Interest income | 8,075,995 | 333,125 | 10,920,077 | 43,446 | ||||||||||||
| Total Income | 8,200,007 | 338,586 | 18,873,474 | 48,014 | ||||||||||||
| EXPENSES: | ||||||||||||||||
Investment advisory fees | 90,939,668 | 5,082,624 | 35,092,728 | 730,109 | ||||||||||||
Custody fees | 954,878 | 24,457 | 122,069 | 14,861 | ||||||||||||
Administration & accounting fees | 3,138,272 | 125,437 | 702,112 | 32,724 | ||||||||||||
Legal fees | 376,204 | 5,266 | 90,005 | 5,722 | ||||||||||||
Audit & tax fees | 114,561 | 118,114 | 260,602 | 111,135 | ||||||||||||
Shareholder reporting fees | 1,056,007 | 66,038 | 185,983 | 10,622 | ||||||||||||
Transfer agent fees | 6,813,829 | 208,397 | 1,574,721 | 46,073 | ||||||||||||
Trustee fees | 344,746 | 12,620 | 77,106 | 3,496 | ||||||||||||
Distribution fees—Class N | 3,692,900 | 169,319 | 220,860 | 7,985 | ||||||||||||
Dividends and interest on securities sold short (Note 4) | — | — | 8,627,210 | — | ||||||||||||
Recoupment of waiver | 15,571 | — | — | — | ||||||||||||
Registration fees | 330,372 | 58,612 | 111,926 | 69,994 | ||||||||||||
Pricing fee | — | — | 26,983 | — | ||||||||||||
Other expenses | 661,135 | 43,870 | 127,045 | 13,386 | ||||||||||||
| Total Expenses | 108,438,143 | 5,914,754 | 47,219,350 | 1,046,107 | ||||||||||||
Less fee waivers and/or reimbursements | — | (123,348 | ) | (171,586 | ) | (188,168 | ) | |||||||||
| Net Expenses | 108,438,143 | 5,791,406 | 47,047,764 | 857,939 | ||||||||||||
| Net Investment Income (Loss) | (100,238,136 | ) | (5,452,820 | ) | (28,174,290 | ) | (809,925 | ) | ||||||||
| REALIZED GAIN (LOSS) AND CHANGE IN UNREALIZED APPRECIATION (DEPRECIATION): | ||||||||||||||||
| Net realized gain (loss) from: | ||||||||||||||||
Investments in securities | 44,532 | 1,057 | 58,706,668 | 40,891 | ||||||||||||
Foreign currency and foreign currency transactions | 8,252,256 | 704,502 | (5,919,886 | ) | (144 | ) | ||||||||||
Forward foreign currency exchange contracts | 71,394,607 | 1,411,097 | (538,403 | ) | — | |||||||||||
Futures contracts | 603,319,327 | 27,896,482 | (8,775,695 | ) | (10,569,395 | ) | ||||||||||
Securities sold short | — | — | (51,285,970 | ) | — | |||||||||||
Swap contracts | (185,944,737 | ) | (7,709,393 | ) | 130,061,230 | (11,644,594 | ) | |||||||||
Written options | — | — | 103,616 | — | ||||||||||||
| Net realized gain (loss) | 497,065,985 | 22,303,745 | 122,351,560 | (22,173,242 | ) | |||||||||||
| Net change in unrealized appreciation (depreciation) on: | ||||||||||||||||
Investments in securities | 957,025 | 30,575 | (55,084,825 | ) | 3,001 | |||||||||||
Foreign currency and foreign currency translations | 976,333 | 65,038 | (1,916,823 | ) | — | |||||||||||
Forward foreign currency exchange contracts | (108,211,860 | ) | (6,025,948 | ) | 8,637,965 | — | ||||||||||
Futures contracts | (213,038,005 | ) | (8,210,433 | ) | 4,163,436 | (2,632,951 | ) | |||||||||
Securities sold short | — | — | 70,384,102 | — | ||||||||||||
Swap contracts | 4,165,241 | (1,428,549 | ) | 57,534,641 | 5,127,621 | |||||||||||
Written options | — | — | 135,144 | — | ||||||||||||
| Net change in unrealized appreciation (depreciation) | (315,151,266 | ) | (15,569,317 | ) | 83,853,640 | 2,497,671 | ||||||||||
| Net realized gain (loss) and net change in unrealized appreciation (depreciation) | 181,914,719 | 6,734,428 | 206,205,200 | (19,675,571 | ) | |||||||||||
| Net increase (decrease) in net assets resulting from operations | $81,676,583 | $1,281,608 | $178,030,910 | $(20,485,496 | ) | |||||||||||
† Net of foreign taxes withheld of | $5,430 | $— | $31,894 | $— | ||||||||||||
| ** | Consolidated financial statement, see Note 2 in the Notes to Financial Statements for additional information. |
| The accompanying notes are an integral part of these financial statements. |
| AQR Funds | Annual Report | December 2015 | ||||||||||||||
320
Table of Contents
| Statements of Operations | December 31, 2015 |
| AQR RISK PARITY FUND** | AQR RISK PARITY II HV FUND** | AQR RISK PARITY II MV FUND** | AQR STYLE PREMIA ALTERNATIVE FUND** | |||||||||||||
| FOR THE YEAR ENDED DECEMBER 31, 2015 | FOR THE YEAR ENDED DECEMBER 31, 2015 | FOR THE YEAR ENDED DECEMBER 31, 2015 | FOR THE YEAR ENDED DECEMBER 31, 2015 | |||||||||||||
| INVESTMENT INCOME: | ||||||||||||||||
Dividend income† | $22,429 | $1,475 | $2,679 | $8,194,413 | ||||||||||||
Interest income | 1,336,145 | 194,491 | 135,440 | 236,996 | ||||||||||||
| Total Income | 1,358,574 | 195,966 | 138,119 | 8,431,409 | ||||||||||||
| EXPENSES: | ||||||||||||||||
Investment advisory fees | 4,688,773 | 545,967 | 770,489 | 13,486,209 | ||||||||||||
Custody fees | 77,826 | 22,800 | 21,164 | 34,556 | ||||||||||||
Administration & accounting fees | 228,807 | 21,034 | 37,597 | 354,689 | ||||||||||||
Legal fees | 35,545 | 4,599 | 9,051 | 25,596 | ||||||||||||
Audit & tax fees | 115,588 | 113,362 | 113,362 | 121,760 | ||||||||||||
Shareholder reporting fees | 49,124 | 6,760 | 10,885 | 112,576 | ||||||||||||
Transfer agent fees | 502,912 | 30,706 | 97,627 | 626,527 | ||||||||||||
Trustee fees | 27,500 | 2,487 | 4,543 | 34,930 | ||||||||||||
Distribution fees—Class N | 84,916 | 22,286 | 18,260 | 105,500 | ||||||||||||
Dividends and interest on securities sold short and reverse repurchase agreements (Note 4) | — | 29,902 | — | 7,661,515 | ||||||||||||
Registration fees | 96,426 | 47,613 | 58,107 | 85,733 | ||||||||||||
Pricing fee | 6,835 | — | — | 28,447 | ||||||||||||
Other expenses | 49,610 | 6,465 | 11,682 | 81,520 | ||||||||||||
| Total Expenses | 5,963,862 | 853,981 | 1,152,767 | 22,759,558 | ||||||||||||
Less fee waivers and/or reimbursements | (74,070 | ) | (175,338 | ) | (177,754 | ) | (383,801 | ) | ||||||||
| Net Expenses | 5,889,792 | 678,643 | 975,013 | 22,375,757 | ||||||||||||
| Net Investment Income (Loss) | (4,531,218 | ) | (482,677 | ) | (836,894 | ) | (13,944,348 | ) | ||||||||
| REALIZED GAIN (LOSS) AND CHANGE IN UNREALIZED APPRECIATION (DEPRECIATION): | ||||||||||||||||
| Net realized gain (loss) from: | ||||||||||||||||
Investments in securities | (11,991,155 | ) | (1,658,490 | ) | (2,100,238 | ) | (10,086,510 | ) | ||||||||
Foreign currency and foreign currency transactions | (174,161 | ) | 45,070 | (152,552 | ) | (2,092,753 | ) | |||||||||
Forward foreign currency exchange contracts | (5,018 | ) | 964,687 | 1,586,462 | (1,982,878 | ) | ||||||||||
Futures contracts | (21,342,362 | ) | (5,124,475 | ) | (3,690,753 | ) | 21,491,048 | |||||||||
Securities sold short | — | — | — | (5,127,011 | ) | |||||||||||
Swap contracts | (11,686,126 | ) | (2,023,753 | ) | (3,127,541 | ) | 142,825,033 | |||||||||
| Net realized gain (loss) | (45,198,822 | ) | (7,796,961 | ) | (7,484,622 | ) | 145,026,929 | |||||||||
| Net change in unrealized appreciation (depreciation) on: | ||||||||||||||||
Investments in securities | 2,249,761 | 503,843 | 690,178 | 24,529,994 | ||||||||||||
Foreign currency and foreign currency translations | 644,719 | 63,093 | 157,758 | (43,130 | ) | |||||||||||
Forward foreign currency exchange contracts | (2,037,144 | ) | (254,631 | ) | (357,840 | ) | 5,169,539 | |||||||||
Futures contracts | (9,986,653 | ) | (1,417,178 | ) | (2,184,580 | ) | (16,873,925 | ) | ||||||||
Securities sold short | — | — | — | 11,289,053 | ||||||||||||
Swap contracts | 7,963,686 | 1,463,160 | 2,182,645 | (39,304,760 | ) | |||||||||||
| Net change in unrealized appreciation (depreciation) | (1,165,631 | ) | 358,287 | 488,161 | (15,233,229 | ) | ||||||||||
| Net realized gain (loss) and net change in unrealized appreciation (depreciation) | (46,364,453 | ) | (7,438,674 | ) | (6,996,461 | ) | 129,793,700 | |||||||||
| Net increase (decrease) in net assets resulting from operations | $(50,895,671 | ) | $(7,921,351 | ) | $(7,833,355 | ) | $115,849,352 | |||||||||
† Net of foreign taxes withheld of | $1,235 | $44 | $59 | $1,227,516 | ||||||||||||
| ** | Consolidated financial statement, see Note 2 in the Notes to Financial Statements for additional information. |
| The accompanying notes are an integral part of these financial statements. |
| AQR Funds | Annual Report | December 2015 | ||||||||||||||
321
Table of Contents
| Statements of Operations | December 31, 2015 |
| AQR STYLE PREMIA ALTERNATIVE LV FUND** | ||||
| FOR THE YEAR ENDED DECEMBER 31, 2015 | ||||
| INVESTMENT INCOME: | ||||
Dividend income† | $268,730 | |||
Interest income | 26,805 | |||
| Total Income | 295,535 | |||
| EXPENSES: | ||||
Investment advisory fees | 495,593 | |||
Custody fees | 6,669 | |||
Administration & accounting fees | 24,226 | |||
Legal fees | 59,914 | |||
Audit & tax fees | 108,571 | |||
Shareholder reporting fees | 19,299 | |||
Transfer agent fees | 43,353 | |||
Trustee fees | 2,476 | |||
Offering costs | 37,969 | |||
Distribution fees—Class N | 25,482 | |||
Dividends and interest on securities sold short (Note 4) | 245,988 | |||
Registration fees | 59,207 | |||
Pricing fee | 21,221 | |||
Other expenses | 23,118 | |||
| Total Expenses | 1,173,086 | |||
Less fee waivers and/or reimbursements | (300,473 | ) | ||
| Net Expenses | 872,613 | |||
| Net Investment Income (Loss) | (577,078 | ) | ||
| REALIZED GAIN (LOSS) AND CHANGE IN UNREALIZED APPRECIATION (DEPRECIATION): | ||||
| Net realized gain (loss) from: | ||||
Investments in securities | (120,173 | ) | ||
Foreign currency and foreign currency transactions | (40,948 | ) | ||
Forward foreign currency exchange contracts | (447,375 | ) | ||
Futures contracts | 364,604 | |||
Securities sold short | (534,828 | ) | ||
Swap contracts | 2,582,481 | |||
| Net realized gain (loss) | 1,803,761 | |||
| Net change in unrealized appreciation (depreciation) on: | ||||
Investments in securities | 1,375,946 | |||
Foreign currency and foreign currency translations | (5,255 | ) | ||
Forward foreign currency exchange contracts | 293,841 | |||
Futures contracts | (890,724 | ) | ||
Securities sold short | 103,941 | |||
Swap contracts | 963,663 | |||
| Net change in unrealized appreciation (depreciation) | 1,841,412 | |||
| Net realized gain (loss) and net change in unrealized appreciation (depreciation) | 3,645,173 | |||
| Net increase (decrease) in net assets resulting from operations | $3,068,095 | |||
† Net of foreign taxes withheld of | $42,094 | |||
| ** | Consolidated financial statement, see Note 2 in the Notes to Financial Statements for additional information. |
| The accompanying notes are an integral part of these financial statements. |
| AQR Funds | Annual Report | December 2015 | ||||||||||||||
322
Table of Contents
| Statements of Changes in Net Assets | December 31, 2015 |
| AQR DIVERSIFIED ARBITRAGE FUND | AQR EQUITY MARKET NEUTRAL FUND | |||||||||||||||
| FOR THE YEAR ENDED DECEMBER 31, 2015 | FOR THE YEAR ENDED DECEMBER 31, 2014 | FOR THE YEAR ENDED DECEMBER 31, 2015 | FOR THE PERIOD 10/07/14*- 12/31/14 | |||||||||||||
| OPERATIONS: | ||||||||||||||||
Net investment income (loss) | $10,123,129 | $55,467,850 | $(956,286 | ) | $(13,080 | ) | ||||||||||
Net realized gain (loss) | (55,638,448 | ) | (75,174,297 | ) | 3,359,474 | (14,861 | ) | |||||||||
Net change in unrealized appreciation (depreciation) | (20,671,654 | ) | (126,353,990 | ) | 7,770,120 | 336,862 | ||||||||||
Net increase (decrease) in net assets resulting from operations | (66,186,973 | ) | (146,060,437 | ) | 10,173,308 | 308,921 | ||||||||||
| DISTRIBUTIONS TO SHAREHOLDERS: | ||||||||||||||||
| Net investment income: | ||||||||||||||||
Class I | (40,065,363 | ) | (30,805,978 | ) | (3,278,442 | ) | (84,782 | ) | ||||||||
Class N | (7,997,308 | ) | (11,376,648 | ) | (1,906,094 | ) | (66,536 | ) | ||||||||
Class R6 | (37,869 | ) | (1,920 | ) | (3,572 | ) | (176,241 | ) | ||||||||
Total | (48,100,540 | ) | (42,184,546 | ) | (5,188,108 | ) | (327,559 | ) | ||||||||
| Net realized gain: | ||||||||||||||||
Class I | — | — | (142,370 | ) | — | |||||||||||
Class N | — | — | (85,124 | ) | — | |||||||||||
Class R6 | — | — | (154 | ) | — | |||||||||||
Total | — | — | (227,648 | ) | — | |||||||||||
| Return of capital: | ||||||||||||||||
Class I | — | — | — | (708 | ) | |||||||||||
Class N | — | — | — | (613 | ) | |||||||||||
Class R6 | — | — | — | (1,779 | ) | |||||||||||
Total | — | — | — | (3,100 | ) | |||||||||||
Total distributions | (48,100,540 | ) | (42,184,546 | ) | (5,415,756 | ) | (330,659 | ) | ||||||||
| CAPITAL TRANSACTIONS: | ||||||||||||||||
| CLASS I | ||||||||||||||||
Proceeds from shares sold | 411,629,572 | 761,610,218 | 181,517,201 | 1,787,490 | ||||||||||||
Reinvestment of distributions | 32,791,578 | 23,069,874 | 3,185,521 | 85,490 | ||||||||||||
Cost of shares redeemed | (1,125,689,923 | ) | (978,469,368 | ) | (9,905,135 | ) | (412,526 | ) | ||||||||
Net increase (decrease) from capital transactions | (681,268,773 | ) | (193,789,276 | ) | 174,797,587 | 1,460,454 | ||||||||||
| CLASS N | ||||||||||||||||
Proceeds from shares sold | 61,092,221 | 197,396,546 | 104,772,329 | 1,175,276 | ||||||||||||
Reinvestment of distributions | 7,939,623 | 10,346,737 | 1,973,213 | 67,149 | ||||||||||||
Cost of shares redeemed | (543,339,575 | ) | (313,338,405 | ) | (19,614,748 | ) | (530 | ) | ||||||||
Net increase (decrease) from capital transactions | (474,307,731 | ) | (105,595,122 | ) | 87,130,794 | 1,241,895 | ||||||||||
| CLASS R6 | ||||||||||||||||
Proceeds from shares sold | 1,113,193 | 100,000 | (a) | — | 3,030,000 | |||||||||||
Reinvestment of distributions | 37,869 | 1,920 | 3,726 | 178,020 | ||||||||||||
Cost of shares redeemed | (305,690 | ) | — | (3,363,015 | ) | — | ||||||||||
Net increase (decrease) from capital transactions | 845,372 | 101,920 | (3,359,289 | ) | 3,208,020 | |||||||||||
| Net increase (decrease) in net assets resulting from capital transactions | (1,154,731,132 | ) | (299,282,478 | ) | 258,569,092 | 5,910,369 | ||||||||||
Total increase (decrease) in net assets | (1,269,018,645 | ) | (487,527,461 | ) | 263,326,644 | 5,888,631 | ||||||||||
| NET ASSETS: | ||||||||||||||||
Beginning of period | 2,225,307,890 | 2,712,835,351 | 5,888,631 | — | ||||||||||||
End of period | $956,289,245 | $2,225,307,890 | $269,215,275 | $5,888,631 | ||||||||||||
Undistributed accumulated net investment income (loss) | $10,112,228 | $(8,055,847 | ) | $(3,291,781 | ) | $(332,715 | ) | |||||||||
| The accompanying notes are an integral part of these financial statements. | (continued on p. 324) |
| AQR Funds | Annual Report | December 2015 | ||||||||||||||
323
Table of Contents
| Statements of Changes in Net Assets | December 31, 2015 |
| AQR DIVERSIFIED ARBITRAGE FUND | AQR EQUITY MARKET NEUTRAL FUND | |||||||||||||||
| FOR THE YEAR ENDED DECEMBER 31, 2015 | FOR THE YEAR ENDED DECEMBER 31, 2014 | FOR THE YEAR ENDED DECEMBER 31, 2015 | FOR THE PERIOD 10/07/14*- 12/31/14 | |||||||||||||
| CHANGES IN SHARES OUTSTANDING: | ||||||||||||||||
| CLASS I | ||||||||||||||||
Shares outstanding, beginning of period | 152,568,773 | 172,057,279 | 144,471 | — | ||||||||||||
Shares sold | 41,096,650 | 69,963,023 | 16,108,285 | 177,332 | ||||||||||||
Shares issued on reinvestment of distributions | 3,575,962 | 2,279,632 | 274,141 | 8,506 | ||||||||||||
Shares redeemed | (113,412,770 | ) | (91,731,161 | ) | (913,746 | ) | (41,367 | ) | ||||||||
Shares outstanding, end of period | 83,828,615 | 152,568,773 | 15,613,151 | 144,471 | ||||||||||||
| CLASS N | ||||||||||||||||
Shares outstanding, beginning of period | 67,172,038 | 76,969,086 | 123,239 | — | ||||||||||||
Shares sold | 6,110,275 | 18,245,229 | 9,253,007 | 116,610 | ||||||||||||
Shares issued on reinvestment of distributions | 866,771 | 1,025,444 | 169,958 | 6,682 | ||||||||||||
Shares redeemed | (54,267,753 | ) | (29,067,721 | ) | (1,719,216 | ) | (53 | ) | ||||||||
Shares outstanding, end of period | 19,881,331 | 67,172,038 | 7,826,988 | 123,239 | ||||||||||||
| CLASS R6 | ||||||||||||||||
Shares outstanding, beginning of period | 9,281 | — | (a) | 320,778 | — | |||||||||||
Shares sold | 111,175 | 9,091 | — | 303,065 | ||||||||||||
Shares issued on reinvestment of distributions | 4,139 | 190 | 320 | 17,713 | ||||||||||||
Shares redeemed | (30,391 | ) | — | (308,239 | ) | — | ||||||||||
Shares outstanding, end of period | 94,204 | 9,281 | 12,859 | 320,778 | ||||||||||||
| * | Commencement of operations. |
| (a) | Commencement of offering class of shares effective September 2, 2014. |
| The accompanying notes are an integral part of these financial statements. |
| AQR Funds | Annual Report | December 2015 | ||||||||||||||
324
Table of Contents
| Statements of Changes in Net Assets | December 31, 2015 |
| AQR GLOBAL MACRO FUND** | AQR LONG-SHORT EQUITY FUND | |||||||||||||||
| FOR THE YEAR ENDED DECEMBER 31, 2015 | FOR THE PERIOD 4/08/14*- 12/31/14 | FOR THE YEAR ENDED DECEMBER 31, 2015 | FOR THE YEAR ENDED DECEMBER 31, 2014 | |||||||||||||
| OPERATIONS: | ||||||||||||||||
Net investment income (loss) | $(1,077,510 | ) | $(328,106 | ) | $(2,581,503 | ) | $(258,798 | ) | ||||||||
Net realized gain (loss) | 1,388,379 | (295,608 | ) | 27,471,141 | (18,912 | ) | ||||||||||
Net change in unrealized appreciation (depreciation) | 80,064 | 791,980 | 7,649,879 | 3,842,313 | ||||||||||||
Net increase (decrease) in net assets resulting from operations | 390,933 | 168,266 | 32,539,517 | 3,564,603 | ||||||||||||
| DISTRIBUTIONS TO SHAREHOLDERS: | ||||||||||||||||
| Net investment income: | ||||||||||||||||
Class I | — | — | (17,673,255 | ) | (2,729,179 | ) | ||||||||||
Class N | — | — | (3,926,547 | ) | (654,639 | ) | ||||||||||
Class R6 | — | — | (740,867 | ) | (27,208 | ) | ||||||||||
Total | — | — | (22,340,669 | ) | (3,411,026 | ) | ||||||||||
| Net realized gain: | ||||||||||||||||
Class I | (1,495,562 | ) | (63,628 | ) | (606,302 | ) | (354,882 | ) | ||||||||
Class N | (1,247,409 | ) | (1,903 | ) | (137,481 | ) | (84,612 | ) | ||||||||
Class R6 | (5,243 | ) | (187 | ) | (25,262 | ) | (3,512 | ) | ||||||||
Total | (2,748,214 | ) | (65,718 | ) | (769,045 | ) | (443,006 | ) | ||||||||
| Return of capital: | ||||||||||||||||
Class I | — | — | — | (117,680 | ) | |||||||||||
Class N | — | — | — | (18,740 | ) | |||||||||||
Class R6 | — | — | — | (1,022 | ) | |||||||||||
Total | — | — | — | (137,442 | ) | |||||||||||
Total distributions | (2,748,214 | ) | (65,718 | ) | (23,109,714 | ) | (3,991,474 | ) | ||||||||
| CAPITAL TRANSACTIONS: | ||||||||||||||||
| CLASS I | ||||||||||||||||
Proceeds from shares sold | 14,970,480 | 48,818,406 | 424,856,199 | 43,091,168 | ||||||||||||
Reinvestment of distributions | 1,453,010 | 62,389 | 18,090,946 | 3,161,208 | ||||||||||||
Cost of shares redeemed | (19,541,806 | ) | (13,522,273 | ) | (42,029,793 | ) | (7,568,381 | ) | ||||||||
Net increase (decrease) from capital transactions | (3,118,316 | ) | 35,358,522 | 400,917,352 | 38,683,995 | |||||||||||
| CLASS N | ||||||||||||||||
Proceeds from shares sold | 92,106,568 | 1,083,274 | 94,735,102 | 11,177,580 | ||||||||||||
Reinvestment of distributions | 1,247,361 | 1,903 | 4,042,317 | 749,097 | ||||||||||||
Cost of shares redeemed | (72,106,801 | ) | (27,865 | ) | (20,804,635 | ) | (2,007,478 | ) | ||||||||
Net increase (decrease) from capital transactions | 21,247,128 | 1,057,312 | 77,972,784 | 9,919,199 | ||||||||||||
| CLASS R6 | ||||||||||||||||
Proceeds from shares sold | — | 100,000 | (a) | 15,455,318 | 417,885 | (a) | ||||||||||
Reinvestment of distributions | 5,243 | 187 | 766,129 | 31,742 | ||||||||||||
Cost of shares redeemed | — | — | (315,394 | ) | — | |||||||||||
Net increase (decrease) from capital transactions | 5,243 | 100,187 | 15,906,053 | 449,627 | ||||||||||||
| Net increase (decrease) in net assets resulting from capital transactions | 18,134,055 | 36,516,021 | 494,796,189 | 49,052,821 | ||||||||||||
Total increase (decrease) in net assets | 15,776,774 | 36,618,569 | 504,225,992 | 48,625,950 | ||||||||||||
| NET ASSETS: | ||||||||||||||||
Beginning of period | 36,618,569 | — | 54,782,147 | 6,156,197 | ||||||||||||
End of period | $52,395,343 | $36,618,569 | $559,008,139 | $54,782,147 | ||||||||||||
Undistributed accumulated net investment income (loss) | $74,854 | $(1,356,611 | ) | $4,505,240 | $(3,498,829 | ) | ||||||||||
| The accompanying notes are an integral part of these financial statements. | (continued on p. 326) |
| AQR Funds | Annual Report | December 2015 | ||||||||||||||
325
Table of Contents
| Statements of Changes in Net Assets | December 31, 2015 |
| AQR GLOBAL MACRO FUND** | AQR LONG-SHORT EQUITY FUND | |||||||||||||||
| FOR THE YEAR ENDED DECEMBER 31, 2015 | FOR THE PERIOD 4/08/14*- 12/31/14 | FOR THE YEAR ENDED DECEMBER 31, 2015 | FOR THE YEAR ENDED DECEMBER 31, 2014 | |||||||||||||
| CHANGES IN SHARES OUTSTANDING: | ||||||||||||||||
| CLASS I | ||||||||||||||||
Shares outstanding, beginning of period | 3,569,196 | — | 4,018,314 | 513,771 | ||||||||||||
Shares sold | 1,496,068 | 4,933,146 | 35,398,027 | 3,887,179 | ||||||||||||
Shares issued on reinvestment of distributions | 151,830 | 6,308 | 1,487,742 | 288,168 | ||||||||||||
Shares redeemed | (1,941,078 | ) | (1,370,258 | ) | (3,551,403 | ) | (670,804 | ) | ||||||||
Shares outstanding, end of period | 3,276,016 | 3,569,196 | 37,352,680 | 4,018,314 | ||||||||||||
| CLASS N | ||||||||||||||||
Shares outstanding, beginning of period | 105,875 | — | 985,542 | 89,144 | ||||||||||||
Shares sold | 9,137,851 | 108,567 | 7,884,421 | 1,003,577 | ||||||||||||
Shares issued on reinvestment of distributions | 131,025 | 193 | 333,800 | 68,411 | ||||||||||||
Shares redeemed | (7,193,373 | ) | (2,885 | ) | (1,735,633 | ) | (175,590 | ) | ||||||||
Shares outstanding, end of period | 2,181,378 | 105,875 | 7,468,130 | 985,542 | ||||||||||||
| CLASS R6 | ||||||||||||||||
Shares outstanding, beginning of period | 10,307 | — | (a) | 39,315 | — | (a) | ||||||||||
Shares sold | — | 10,288 | 1,260,159 | 36,421 | ||||||||||||
Shares issued on reinvestment of distributions | 548 | 19 | 62,953 | 2,894 | ||||||||||||
Shares redeemed | — | — | (26,947 | ) | — | |||||||||||
Shares outstanding, end of period | 10,855 | 10,307 | 1,335,480 | 39,315 | ||||||||||||
| * | Commencement of operations. |
| ** | Consolidated financial statement, see Note 2 in the Notes to Financial Statements for additional information. |
| (a) | Commencement of offering class of shares effective September 2, 2014. |
| The accompanying notes are an integral part of these financial statements. |
| AQR Funds | Annual Report | December 2015 | ||||||||||||||
326
Table of Contents
| Statements of Changes in Net Assets | December 31, 2015 |
AQR MANAGED FUTURES STRATEGY FUND** | AQR MANAGED FUTURES STRATEGY HV FUND** | |||||||||||||||
| FOR THE YEAR ENDED DECEMBER 31, 2015 | FOR THE YEAR ENDED DECEMBER 31, 2014 | FOR THE YEAR ENDED DECEMBER 31, 2015 | FOR THE YEAR ENDED DECEMBER 31, 2014 | |||||||||||||
| OPERATIONS: | ||||||||||||||||
Net investment income (loss) | $(100,238,136 | ) | $(78,263,966 | ) | $(5,452,820 | ) | $(2,137,166 | ) | ||||||||
Net realized gain (loss) | 497,065,985 | 682,159,727 | 22,303,745 | 27,982,546 | ||||||||||||
Net change in unrealized appreciation (depreciation) | (315,151,266 | ) | 25,849,767 | (15,569,317 | ) | 10,799,494 | ||||||||||
Net increase (decrease) in net assets resulting from operations | 81,676,583 | 629,745,528 | 1,281,608 | 36,644,874 | ||||||||||||
| DISTRIBUTIONS TO SHAREHOLDERS: | ||||||||||||||||
| Net investment income: | ||||||||||||||||
Class I | (333,412,139 | ) | (220,437,134 | ) | (10,861,577 | ) | (13,390,213 | ) | ||||||||
Class N | (62,161,470 | ) | (46,941,973 | ) | (5,846,098 | ) | (636,578 | ) | ||||||||
Class R6 | (9,756,818 | ) | (4,374 | ) | (5,368,164 | ) | (8,393 | ) | ||||||||
Total | (405,330,427 | ) | (267,383,481 | ) | (22,075,839 | ) | (14,035,184 | ) | ||||||||
| Net realized gain: | ||||||||||||||||
Class I | (150,600,543 | ) | (263,407,986 | ) | (6,374,127 | ) | (4,057,424 | ) | ||||||||
Class N | (29,875,741 | ) | (60,693,546 | ) | (3,527,619 | ) | (198,548 | ) | ||||||||
Class R6 | (4,339,168 | ) | (5,125 | ) | (3,115,965 | ) | (2,529 | ) | ||||||||
Total | (184,815,452 | ) | (324,106,657 | ) | (13,017,711 | ) | (4,258,501 | ) | ||||||||
Total distributions | (590,145,879 | ) | (591,490,138 | ) | (35,093,550 | ) | (18,293,685 | ) | ||||||||
| CAPITAL TRANSACTIONS: | ||||||||||||||||
| CLASS I | ||||||||||||||||
Proceeds from shares sold | 4,675,004,433 | 2,628,023,103 | 260,007,721 | 186,205,825 | ||||||||||||
Reinvestment of distributions | 364,985,185 | 376,407,901 | 15,296,145 | 12,480,048 | ||||||||||||
Cost of shares redeemed | (2,479,666,459 | ) | (1,916,986,986 | ) | (146,144,807 | ) | (106,972,499 | ) | ||||||||
Net increase (decrease) from capital transactions | 2,560,323,159 | 1,087,444,018 | 129,159,059 | 91,713,374 | ||||||||||||
| CLASS N | ||||||||||||||||
Proceeds from shares sold | 757,841,192 | 501,774,445 | 165,922,423 | 9,131,352 | ||||||||||||
Reinvestment of distributions | 91,102,480 | 106,513,303 | 9,373,717 | 835,126 | ||||||||||||
Cost of shares redeemed | (498,673,872 | ) | (703,673,411 | ) | (38,822,595 | ) | (2,754,447 | ) | ||||||||
Net increase (decrease) from capital transactions | 350,269,800 | (95,385,663 | ) | 136,473,545 | 7,212,031 | |||||||||||
| CLASS R6 | ||||||||||||||||
Proceeds from shares sold | 272,280,313 | 100,000 | (a) | 107,102,117 | 45,055,679 | (a) | ||||||||||
Reinvestment of distributions | 11,617,386 | 9,499 | 5,273,052 | 10,922 | ||||||||||||
Cost of shares redeemed | (24,442,841 | ) | — | (15,732,433 | ) | — | ||||||||||
Net increase (decrease) from capital transactions | 259,454,858 | 109,499 | 96,642,736 | 45,066,601 | ||||||||||||
| Net increase (decrease) in net assets resulting from capital transactions | 3,170,047,817 | 992,167,854 | 362,275,340 | 143,992,006 | ||||||||||||
Total increase (decrease) in net assets | 2,661,578,521 | 1,030,423,244 | 328,463,398 | 162,343,195 | ||||||||||||
| NET ASSETS: | ||||||||||||||||
Beginning of period | 6,944,689,553 | 5,914,266,309 | 201,064,600 | 38,721,405 | ||||||||||||
End of period | $9,606,268,074 | $6,944,689,553 | $529,527,998 | $201,064,600 | ||||||||||||
Undistributed accumulated net investment income (loss) | $71,429,074 | $(353,785,167 | ) | $6,500,488 | $(13,004,528 | ) | ||||||||||
| The accompanying notes are an integral part of these financial statements. | (continued on p. 328) |
| AQR Funds | Annual Report | December 2015 | ||||||||||||||
327
Table of Contents
| Statements of Changes in Net Assets | December 31, 2015 |
AQR MANAGED FUTURES STRATEGY FUND** | AQR MANAGED FUTURES STRATEGY HV FUND** | |||||||||||||||
| FOR THE YEAR ENDED DECEMBER 31, 2015 | FOR THE YEAR ENDED DECEMBER 31, 2014 | FOR THE YEAR ENDED DECEMBER 31, 2015 | FOR THE YEAR ENDED DECEMBER 31, 2014 | |||||||||||||
| CHANGES IN SHARES OUTSTANDING: | ||||||||||||||||
| CLASS I | ||||||||||||||||
Shares outstanding, beginning of period | 530,096,760 | 425,328,151 | 13,022,456 | 3,432,251 | ||||||||||||
Shares sold | 425,915,818 | 256,868,757 | 22,257,187 | 18,621,473 | ||||||||||||
Shares issued on reinvestment of distributions | 35,817,977 | 36,088,959 | 1,426,879 | 1,142,862 | ||||||||||||
Shares redeemed | (227,881,350 | ) | (188,189,107 | ) | (12,540,829 | ) | (10,174,130 | ) | ||||||||
Shares outstanding, end of period | 763,949,205 | 530,096,760 | 24,165,693 | 13,022,456 | ||||||||||||
| CLASS N | ||||||||||||||||
Shares outstanding, beginning of period | 124,354,461 | 133,922,115 | 835,483 | 152,311 | ||||||||||||
Shares sold | 69,839,741 | 49,711,170 | 14,517,195 | 867,382 | ||||||||||||
Shares issued on reinvestment of distributions | 9,020,048 | 10,291,143 | 877,689 | 76,617 | ||||||||||||
Shares redeemed | (45,874,726 | ) | (69,569,967 | ) | (3,370,699 | ) | (260,827 | ) | ||||||||
Shares outstanding, end of period | 157,339,524 | 124,354,461 | 12,859,668 | 835,483 | ||||||||||||
| CLASS R6 | ||||||||||||||||
Shares outstanding, beginning of period | 10,639 | — | (a) | 4,047,305 | — | (a) | ||||||||||
Shares sold | 24,725,163 | 9,728 | 9,320,019 | 4,046,305 | ||||||||||||
Shares issued on reinvestment of distributions | 1,140,077 | 911 | 492,349 | 1,000 | ||||||||||||
Shares redeemed | (2,278,193 | ) | — | (1,365,383 | ) | — | ||||||||||
Shares outstanding, end of period | 23,597,686 | 10,639 | 12,494,290 | 4,047,305 | ||||||||||||
| ** | Consolidated financial statement, see Note 2 in the Notes to Financial Statements for additional information. |
| (a) | Commencement of offering class of shares effective September 2, 2014. |
| The accompanying notes are an integral part of these financial statements. |
| AQR Funds | Annual Report | December 2015 | ||||||||||||||
328
Table of Contents
| Statements of Changes in Net Assets | December 31, 2015 |
| AQR MULTI-STRATEGY ALTERNATIVE FUND** | AQR RISK-BALANCED COMMODITIES STRATEGY FUND** | |||||||||||||||
| FOR THE YEAR ENDED DECEMBER 31, 2015 | FOR THE YEAR ENDED DECEMBER 31, 2014 | FOR THE YEAR ENDED DECEMBER 31, 2015 | FOR THE YEAR ENDED DECEMBER 31, 2014 | |||||||||||||
| OPERATIONS: | ||||||||||||||||
Net investment income (loss) | $(28,174,290 | ) | $(22,634,499 | ) | $(809,925 | ) | $(546,638 | ) | ||||||||
Net realized gain (loss) | 122,351,560 | 152,291,322 | (22,173,242 | ) | (8,047,811 | ) | ||||||||||
Net change in unrealized appreciation (depreciation) | 83,853,640 | (21,553,831 | ) | 2,497,671 | (5,345,941 | ) | ||||||||||
Net increase (decrease) in net assets resulting from operations | 178,030,910 | 108,102,992 | (20,485,496 | ) | (13,940,390 | ) | ||||||||||
| DISTRIBUTIONS TO SHAREHOLDERS: | ||||||||||||||||
| Net investment income: | ||||||||||||||||
Class I | (157,002,548 | ) | (103,622,431 | ) | — | — | ||||||||||
Class N | (6,675,209 | ) | (5,415,268 | ) | — | — | ||||||||||
Class R6 | (5,408,560 | ) | (7,433 | ) | — | — | ||||||||||
Total | (169,086,317 | ) | (109,045,132 | ) | — | — | ||||||||||
| Net realized gain: | ||||||||||||||||
Class I | (33,179,441 | ) | — | — | — | |||||||||||
Class N | (1,461,342 | ) | — | — | — | |||||||||||
Class R6 | (1,132,757 | ) | — | — | — | |||||||||||
Total | (35,773,540 | ) | — | — | — | |||||||||||
Total distributions | (204,859,857 | ) | (109,045,132 | ) | — | — | ||||||||||
| CAPITAL TRANSACTIONS: | ||||||||||||||||
| CLASS I | ||||||||||||||||
Proceeds from shares sold | 1,169,866,016 | 590,215,635 | 80,849,012 | 69,600,700 | ||||||||||||
Reinvestment of distributions | 156,410,369 | 88,204,896 | — | — | ||||||||||||
Cost of shares redeemed | (460,959,852 | ) | (687,354,210 | ) | (40,454,118 | ) | (40,288,267 | ) | ||||||||
Net increase (decrease) from capital transactions | 865,316,533 | (8,933,679 | ) | 40,394,894 | 29,312,433 | |||||||||||
| CLASS N | ||||||||||||||||
Proceeds from shares sold | 46,717,322 | 47,448,202 | 1,419,312 | 12,707,985 | ||||||||||||
Reinvestment of distributions | 8,127,028 | 5,370,558 | — | — | ||||||||||||
Cost of shares redeemed | (35,225,745 | ) | (43,303,801 | ) | (3,390,548 | ) | (9,284,044 | ) | ||||||||
Net increase (decrease) from capital transactions | 19,618,605 | 9,514,959 | (1,971,236 | ) | 3,423,941 | |||||||||||
| CLASS R6 | ||||||||||||||||
Proceeds from shares sold | 72,737,226 | 35,242,596 | (a) | 20,111,252 | 15,656,186 | (a) | ||||||||||
Reinvestment of distributions | 3,351,013 | 7,433 | — | — | ||||||||||||
Cost of shares redeemed | (8,953,831 | ) | — | (2,211,786 | ) | — | ||||||||||
Net increase (decrease) from capital transactions | 67,134,408 | 35,250,029 | 17,899,466 | 15,656,186 | ||||||||||||
| Net increase (decrease) in net assets resulting from capital transactions | 952,069,546 | 35,831,309 | 56,323,124 | �� | 48,392,560 | |||||||||||
Total increase (decrease) in net assets | 925,240,599 | 34,889,169 | 35,837,628 | 34,452,170 | ||||||||||||
| NET ASSETS: | ||||||||||||||||
Beginning of period | 1,563,507,135 | 1,528,617,966 | 66,688,760 | 32,236,590 | ||||||||||||
End of period | $2,488,747,734 | $1,563,507,135 | $102,526,388 | $66,688,760 | ||||||||||||
Undistributed accumulated net investment income (loss) | $(135,227,340 | ) | $(118,003,854 | ) | $(8,630,097 | ) | $(2,974,242 | ) | ||||||||
| The accompanying notes are an integral part of these financial statements. | (continued on p. 330) |
| AQR Funds | Annual Report | December 2015 | ||||||||||||||
329
Table of Contents
| Statements of Changes in Net Assets | December 31, 2015 |
| AQR MULTI-STRATEGY ALTERNATIVE FUND** | AQR RISK-BALANCED COMMODITIES STRATEGY FUND** | |||||||||||||||
| FOR THE YEAR ENDED DECEMBER 31, 2015 | FOR THE YEAR ENDED DECEMBER 31, 2014 | FOR THE YEAR ENDED DECEMBER 31, 2015 | FOR THE YEAR ENDED DECEMBER 31, 2014 | |||||||||||||
| CHANGES IN SHARES OUTSTANDING: | ||||||||||||||||
| CLASS I | ||||||||||||||||
Shares outstanding, beginning of period | 147,968,675 | 148,651,004 | 6,649,535 | 3,422,135 | ||||||||||||
Shares sold | 116,000,850 | 60,196,339 | 12,903,642 | 8,654,189 | ||||||||||||
Shares issued on reinvestment of distributions | 16,042,089 | 9,130,942 | — | — | ||||||||||||
Shares redeemed | (45,967,523 | ) | (70,009,610 | ) | (6,862,625 | ) | (5,426,789 | ) | ||||||||
Shares outstanding, end of period | 234,044,091 | 147,968,675 | 12,690,552 | 6,649,535 | ||||||||||||
| CLASS N | ||||||||||||||||
Shares outstanding, beginning of period | 8,674,153 | 7,646,878 | 686,315 | 467,151 | ||||||||||||
Shares sold | 4,641,085 | 4,877,478 | 220,408 | 1,401,956 | ||||||||||||
Shares issued on reinvestment of distributions | 836,114 | 557,112 | — | — | ||||||||||||
Shares redeemed | (3,522,409 | ) | (4,407,315 | ) | (532,696 | ) | (1,182,792 | ) | ||||||||
Shares outstanding, end of period | 10,628,943 | 8,674,153 | 374,027 | 686,315 | ||||||||||||
| CLASS R6 | ||||||||||||||||
Shares outstanding, beginning of period | 3,611,564 | — | (a) | 2,214,833 | — | (a) | ||||||||||
Shares sold | 7,257,387 | 3,610,795 | 3,321,846 | 2,214,833 | ||||||||||||
Shares issued on reinvestment of distributions | 344,047 | 769 | — | — | ||||||||||||
Shares redeemed | (867,834 | ) | — | (361,280 | ) | — | ||||||||||
Shares outstanding, end of period | 10,345,164 | 3,611,564 | 5,175,399 | 2,214,833 | ||||||||||||
| ** | Consolidated financial statement, see Note 2 in the Notes to Financial Statements for additional information. |
| (a) | Commencement of offering class of shares effective September 2, 2014. |
| The accompanying notes are an integral part of these financial statements. |
| AQR Funds | Annual Report | December 2015 | ||||||||||||||
330
Table of Contents
| Statements of Changes in Net Assets | December 31, 2015 |
| AQR RISK PARITY FUND** | AQR RISK PARITY II HV FUND** | |||||||||||||||
| FOR THE YEAR ENDED DECEMBER 31, 2015 | FOR THE YEAR ENDED DECEMBER 31, 2014 | FOR THE YEAR ENDED DECEMBER 31, 2015 | FOR THE YEAR ENDED DECEMBER 31, 2014 | |||||||||||||
| OPERATIONS: | ||||||||||||||||
Net investment income (loss) | $(4,531,218 | ) | $(2,906,307 | ) | $(482,677 | ) | $(130,646 | ) | ||||||||
Net realized gain (loss) | (45,198,822 | ) | 86,083,279 | (7,796,961 | ) | 5,493,583 | ||||||||||
Net change in unrealized appreciation (depreciation) | (1,165,631 | ) | (23,418,545 | ) | 358,287 | (1,961,715 | ) | |||||||||
Net increase (decrease) in net assets resulting from operations | (50,895,671 | ) | 59,758,427 | (7,921,351 | ) | 3,401,222 | ||||||||||
| DISTRIBUTIONS TO SHAREHOLDERS: | ||||||||||||||||
| Net investment income: | ||||||||||||||||
Class I | — | (15,918,499 | ) | (137,937 | ) | (210,221 | ) | |||||||||
Class N | — | (829,910 | ) | — | (9,382 | ) | ||||||||||
Class R6 | — | (2,479 | ) | (9,369 | ) | (567 | ) | |||||||||
Total | — | (16,750,888 | ) | (147,306 | ) | (220,170 | ) | |||||||||
| Net realized gain: | ||||||||||||||||
Class I | (12,535,697 | ) | (60,212,532 | ) | (2,013,017 | ) | (4,493,162 | ) | ||||||||
Class N | (576,410 | ) | (3,765,221 | ) | (314,049 | ) | (889,329 | ) | ||||||||
Class R6 | (68,124 | ) | (9,157 | ) | (131,274 | ) | (10,388 | ) | ||||||||
Total | (13,180,231 | ) | (63,986,910 | ) | (2,458,340 | ) | (5,392,879 | ) | ||||||||
Total distributions | (13,180,231 | ) | (80,737,798 | ) | (2,605,646 | ) | (5,613,049 | ) | ||||||||
| CAPITAL TRANSACTIONS: | ||||||||||||||||
| CLASS I | ||||||||||||||||
Proceeds from shares sold | 163,806,681 | 152,916,166 | 31,920,624 | 36,625,458 | ||||||||||||
Reinvestment of distributions | 12,321,075 | 73,481,484 | 2,110,673 | 4,581,805 | ||||||||||||
Cost of shares redeemed | (206,762,569 | ) | (476,525,839 | ) | (27,142,112 | ) | (14,267,310 | ) | ||||||||
Net increase (decrease) from capital transactions | (30,634,813 | ) | (250,128,189 | ) | 6,889,185 | 26,939,953 | ||||||||||
| CLASS N | ||||||||||||||||
Proceeds from shares sold | 6,056,561 | 11,002,195 | 4,174,086 | 2,602,504 | ||||||||||||
Reinvestment of distributions | 573,734 | 4,401,999 | 314,049 | 898,711 | ||||||||||||
Cost of shares redeemed | (17,543,068 | ) | (58,203,755 | ) | (5,237,521 | ) | (4,362,269 | ) | ||||||||
Net increase (decrease) from capital transactions | (10,912,773 | ) | (42,799,561 | ) | (749,386 | ) | (861,054 | ) | ||||||||
| CLASS R6 | ||||||||||||||||
Proceeds from shares sold | 3,728,681 | 100,000 | (a) | 3,295,675 | 100,000 | (a) | ||||||||||
Reinvestment of distributions | 68,124 | 11,636 | 140,643 | 10,955 | ||||||||||||
Cost of shares redeemed | (650,157 | ) | — | (460,254 | ) | — | ||||||||||
Net increase (decrease) from capital transactions | 3,146,648 | 111,636 | 2,976,064 | 110,955 | ||||||||||||
| Net increase (decrease) in net assets resulting from capital transactions | (38,400,938 | ) | (292,816,114 | ) | 9,115,863 | 26,189,854 | ||||||||||
Total increase (decrease) in net assets | (102,476,840 | ) | (313,795,485 | ) | (1,411,134 | ) | 23,978,027 | |||||||||
| NET ASSETS: | ||||||||||||||||
Beginning of period | 620,254,806 | 934,050,291 | 50,207,065 | 26,229,038 | ||||||||||||
End of period | $517,777,966 | $620,254,806 | $48,795,931 | $50,207,065 | ||||||||||||
Undistributed accumulated net investment income (loss) | $(11,483,741 | ) | $1,562,779 | $(2,528,445 | ) | $678,142 | ||||||||||
| The accompanying notes are an integral part of these financial statements. | (continued on p. 332) |
| AQR Funds | Annual Report | December 2015 | ||||||||||||||
331
Table of Contents
| Statements of Changes in Net Assets | December 31, 2015 |
| AQR RISK PARITY FUND** | AQR RISK PARITY II HV FUND** | |||||||||||||||
| FOR THE YEAR ENDED DECEMBER 31, 2015 | FOR THE YEAR ENDED DECEMBER 31, 2014 | FOR THE YEAR ENDED DECEMBER 31, 2015 | FOR THE YEAR ENDED DECEMBER 31, 2014 | |||||||||||||
| CHANGES IN SHARES OUTSTANDING: | ||||||||||||||||
| CLASS I | ||||||||||||||||
Shares outstanding, beginning of period | 57,585,796 | 79,392,512 | 4,427,252 | 1,780,470 | ||||||||||||
Shares sold | 16,155,868 | 13,463,455 | 3,429,710 | 3,475,987 | ||||||||||||
Shares issued on reinvestment of distributions | 1,356,946 | 7,232,430 | 270,252 | 477,769 | ||||||||||||
Shares redeemed | (20,895,206 | ) | (42,502,601 | ) | (2,876,404 | ) | (1,306,974 | ) | ||||||||
Shares outstanding, end of period | 54,203,404 | 57,585,796 | 5,250,810 | 4,427,252 | ||||||||||||
| CLASS N | ||||||||||||||||
Shares outstanding, beginning of period | 3,571,499 | 7,343,876 | 819,606 | 877,168 | ||||||||||||
Shares sold | 595,100 | 966,513 | 417,890 | 249,127 | ||||||||||||
Shares issued on reinvestment of distributions | 63,326 | 433,268 | 40,160 | 93,616 | ||||||||||||
Shares redeemed | (1,805,632 | ) | (5,172,158 | ) | (573,262 | ) | (400,305 | ) | ||||||||
Shares outstanding, end of period | 2,424,293 | 3,571,499 | 704,394 | 819,606 | ||||||||||||
| CLASS R6 | ||||||||||||||||
Shares outstanding, beginning of period | 9,472 | — | (a) | 9,937 | — | (a) | ||||||||||
Shares sold | 354,328 | 8,327 | 330,887 | 8,795 | ||||||||||||
Shares issued on reinvestment of distributions | 7,503 | 1,145 | 18,031 | 1,142 | ||||||||||||
Shares redeemed | (63,933 | ) | — | (48,768 | ) | — | ||||||||||
Shares outstanding, end of period | 307,370 | 9,472 | 310,087 | 9,937 | ||||||||||||
| ** | Consolidated financial statement, see Note 2 in the Notes to Financial Statements for additional information. |
| (a) | Commencement of offering class of shares effective September 2, 2014. |
| The accompanying notes are an integral part of these financial statements. |
| AQR Funds | Annual Report | December 2015 | ||||||||||||||
332
Table of Contents
| Statements of Changes in Net Assets | December 31, 2015 |
| AQR RISK PARITY II MV FUND** | AQR STYLE PREMIA ALTERNATIVE FUND** | |||||||||||||||
| FOR THE YEAR ENDED DECEMBER 31, 2015 | FOR THE YEAR ENDED DECEMBER 31, 2014 | FOR THE YEAR ENDED DECEMBER 31, 2015 | FOR THE YEAR ENDED DECEMBER 31, 2014 | |||||||||||||
| OPERATIONS: | ||||||||||||||||
Net investment income (loss) | $(836,894 | ) | $(294,310 | ) | $(13,944,348 | ) | $(4,735,914 | ) | ||||||||
Net realized gain (loss) | (7,484,622 | ) | 6,194,745 | 145,026,929 | 49,452,901 | |||||||||||
Net change in unrealized appreciation (depreciation) | 488,161 | (2,721,264 | ) | (15,233,229 | ) | 14,840,794 | ||||||||||
Net increase (decrease) in net assets resulting from operations | (7,833,355 | ) | 3,179,171 | 115,849,352 | 59,557,781 | |||||||||||
| DISTRIBUTIONS TO SHAREHOLDERS: | ||||||||||||||||
| Net investment income: | ||||||||||||||||
Class I | (226,926 | ) | (165,150 | ) | (63,874,268 | ) | (44,246,577 | ) | ||||||||
Class N | — | — | (3,935,997 | ) | (2,622,452 | ) | ||||||||||
Class R6 | (323 | ) | (232 | ) | (20,714,913 | ) | (3,291,780 | ) | ||||||||
Total | (227,249 | ) | (165,382 | ) | (88,525,178 | ) | (50,160,809 | ) | ||||||||
| Net realized gain: | ||||||||||||||||
Class I | (4,531,332 | ) | (6,594,470 | ) | (2,856,032 | ) | (14,958,495 | ) | ||||||||
Class N | (232,047 | ) | (477,309 | ) | (180,968 | ) | (680,314 | ) | ||||||||
Class R6 | (4,866 | ) | (6,436 | ) | (918,104 | ) | (300,202 | ) | ||||||||
Total | (4,768,245 | ) | (7,078,215 | ) | (3,955,104 | ) | (15,939,011 | ) | ||||||||
Total distributions | (4,995,494 | ) | (7,243,597 | ) | (92,480,282 | ) | (66,099,820 | ) | ||||||||
| CAPITAL TRANSACTIONS: | ||||||||||||||||
| CLASS I | ||||||||||||||||
Proceeds from shares sold | 57,846,534 | 89,277,763 | 1,212,906,493 | 576,188,151 | ||||||||||||
Reinvestment of distributions | 4,373,088 | 5,960,913 | 61,353,974 | 52,644,301 | ||||||||||||
Cost of shares redeemed | (70,812,276 | ) | (22,497,423 | ) | (335,771,223 | ) | (589,197,151 | ) | ||||||||
Cost of shares redeemed on in kind (See Note 15) | — | — | — | (52,771,157 | ) | |||||||||||
Net increase (decrease) from capital transactions | (8,592,654 | ) | 72,741,253 | 938,489,244 | (13,135,856 | ) | ||||||||||
| CLASS N | ||||||||||||||||
Proceeds from shares sold | 1,827,231 | 6,316,708 | 76,216,175 | 19,158,791 | ||||||||||||
Reinvestment of distributions | 232,047 | 477,309 | 4,116,723 | 3,302,766 | ||||||||||||
Cost of shares redeemed | (4,760,078 | ) | (8,457,919 | ) | (14,178,162 | ) | (11,013,561 | ) | ||||||||
Net increase (decrease) from capital transactions | (2,700,800 | ) | (1,663,902 | ) | 66,154,736 | 11,447,996 | ||||||||||
| CLASS R6 | ||||||||||||||||
Proceeds from shares sold | 11,115 | 100,000 | (a) | 300,087,686 | 74,748,363 | (a) | ||||||||||
Reinvestment of distributions | 5,189 | 6,668 | 18,986,659 | 3,591,982 | ||||||||||||
Cost of shares redeemed | — | — | (7,472,854 | ) | (192,537 | ) | ||||||||||
Net increase (decrease) from capital transactions | 16,304 | 106,668 | 311,601,491 | 78,147,808 | ||||||||||||
| Net increase (decrease) in net assets resulting from capital transactions | (11,277,150 | ) | 71,184,019 | 1,316,245,471 | 76,459,948 | |||||||||||
Total increase (decrease) in net assets | (24,105,999 | ) | 67,119,593 | 1,339,614,541 | 69,917,909 | |||||||||||
| NET ASSETS: | ||||||||||||||||
Beginning of period | 114,364,716 | 47,245,123 | 489,132,878 | 419,214,969 | ||||||||||||
End of period | $90,258,717 | $114,364,716 | $1,828,747,419 | $489,132,878 | ||||||||||||
Undistributed accumulated net investment income (loss) | $(2,860,613 | ) | $1,024,360 | $36,181,849 | $(27,093,370 | ) | ||||||||||
| The accompanying notes are an integral part of these financial statements. | (continued on p. 334) |
| AQR Funds | Annual Report | December 2015 | ||||||||||||||
333
Table of Contents
| Statements of Changes in Net Assets | December 31, 2015 |
| AQR RISK PARITY II MV FUND** | AQR STYLE PREMIA ALTERNATIVE FUND** | |||||||||||||||
| FOR THE YEAR ENDED DECEMBER 31, 2015 | FOR THE YEAR ENDED DECEMBER 31, 2014 | FOR THE YEAR ENDED DECEMBER 31, 2015 | FOR THE YEAR ENDED DECEMBER 31, 2014 | |||||||||||||
| CHANGES IN SHARES OUTSTANDING: | ||||||||||||||||
| CLASS I | ||||||||||||||||
Shares outstanding, beginning of period | 10,758,104 | 3,779,116 | 39,308,249 | 39,620,574 | ||||||||||||
Shares sold | 6,110,780 | 8,554,703 | 120,523,767 | 56,129,013 | ||||||||||||
Shares issued on reinvestment of distributions | 512,672 | 600,898 | 5,974,097 | 5,292,887 | ||||||||||||
Shares redeemed | (7,290,896 | ) | (2,176,613 | ) | (33,583,150 | ) | (56,706,868 | ) | ||||||||
Shares redeemed in kind (See Note 15) | — | — | — | (5,027,357 | ) | |||||||||||
Shares outstanding, end of period | 10,090,660 | 10,758,104 | 132,222,963 | 39,308,249 | ||||||||||||
| CLASS N | ||||||||||||||||
Shares outstanding, beginning of period | 790,138 | 940,172 | 2,694,354 | 1,568,834 | ||||||||||||
Shares sold | 184,037 | 606,458 | 7,463,692 | 1,868,292 | ||||||||||||
Shares issued on reinvestment of distributions | 27,300 | 48,262 | 401,240 | 333,070 | ||||||||||||
Shares redeemed | (501,610 | ) | (804,754 | ) | (1,391,241 | ) | (1,075,842 | ) | ||||||||
Shares outstanding, end of period | 499,865 | 790,138 | 9,168,045 | 2,694,354 | ||||||||||||
| CLASS R6 | ||||||||||||||||
Shares outstanding, beginning of period | 9,763 | — | (a) | 7,587,508 | — | (a) | ||||||||||
Shares sold | 1,300 | 9,091 | 30,135,455 | 7,239,589 | ||||||||||||
Shares issued on reinvestment of distributions | 608 | 672 | 1,846,951 | 365,410 | ||||||||||||
Shares redeemed | — | — | (708,843 | ) | (17,491 | ) | ||||||||||
Shares outstanding, end of period | 11,671 | 9,763 | 38,861,071 | 7,587,508 | ||||||||||||
| ** | Consolidated financial statement, see Note 2 in the Notes to Financial Statements for additional information. |
| (a) | Commencement of offering class of shares effective September 2, 2014. |
| The accompanying notes are an integral part of these financial statements. |
| AQR Funds | Annual Report | December 2015 | ||||||||||||||
334
Table of Contents
| Statements of Changes in Net Assets | December 31, 2015 |
| AQR STYLE PREMIA ALTERNATIVE LV FUND** | ||||||||
| FOR THE YEAR ENDED DECEMBER 31, 2015 | FOR THE PERIOD 9/17/14*- 12/31/14 | |||||||
| OPERATIONS: | ||||||||
Net investment income (loss) | $(577,078 | ) | $(37,387 | ) | ||||
Net realized gain (loss) | 1,803,761 | 482,110 | ||||||
Net change in unrealized appreciation (depreciation) | 1,841,412 | 326,575 | ||||||
Net increase (decrease) in net assets resulting from operations | 3,068,095 | 771,298 | ||||||
| DISTRIBUTIONS TO SHAREHOLDERS: | ||||||||
| Net investment income: | ||||||||
Class I | (2,291,598 | ) | (38,445 | ) | ||||
Class N | (161,010 | ) | (75,553 | ) | ||||
Class R6 | (350,210 | ) | (218,868 | ) | ||||
Total | (2,802,818 | ) | (332,866 | ) | ||||
| Net realized gain: | ||||||||
Class I | (467,704 | ) | (13,618 | ) | ||||
Class N | (39,469 | ) | (27,510 | ) | ||||
Class R6 | (70,896 | ) | (76,360 | ) | ||||
Total | (578,069 | ) | (117,488 | ) | ||||
Total distributions | (3,380,887 | ) | (450,354 | ) | ||||
| CAPITAL TRANSACTIONS: | ||||||||
| CLASS I | ||||||||
Proceeds from shares sold | 158,309,029 | 28,178,979 | ||||||
Reinvestment of distributions | 2,746,926 | 52,063 | ||||||
Cost of shares redeemed | (36,778,993 | ) | (140,561 | ) | ||||
Net increase (decrease) from capital transactions | 124,276,962 | 28,090,481 | ||||||
| CLASS N | ||||||||
Proceeds from shares sold | 6,450,074 | 8,671,505 | ||||||
Reinvestment of distributions | 199,845 | 103,063 | ||||||
Cost of shares redeemed | (1,965,686 | ) | (115,319 | ) | ||||
Net increase (decrease) from capital transactions | 4,684,233 | 8,659,249 | ||||||
| CLASS R6 | ||||||||
Proceeds from shares sold | 22,000,001 | 23,000,000 | ||||||
Reinvestment of distributions | 421,106 | 295,228 | ||||||
Cost of shares redeemed | (23,642,959 | ) | — | |||||
Net increase (decrease) from capital transactions | (1,221,852 | ) | 23,295,228 | |||||
Net increase (decrease) in net assets resulting from capital transactions | 127,739,343 | 60,044,958 | ||||||
Total increase (decrease) in net assets | 127,426,551 | 60,365,902 | ||||||
| NET ASSETS: | ||||||||
Beginning of period | 60,365,902 | — | ||||||
End of period | $187,792,453 | $60,365,902 | ||||||
Undistributed accumulated net investment income (loss) | $(822,566 | ) | $(795,466 | ) | ||||
| The accompanying notes are an integral part of these financial statements. | (continued on p. 336) |
| AQR Funds | Annual Report | December 2015 | ||||||||||||||
335
Table of Contents
| Statements of Changes in Net Assets | December 31, 2015 |
| AQR STYLE PREMIA ALTERNATIVE LV FUND** | ||||||||
| FOR THE YEAR ENDED DECEMBER 31, 2015 | FOR THE PERIOD 9/17/14*- 12/31/14 | |||||||
| CHANGES IN SHARES OUTSTANDING: | ||||||||
| CLASS I | ||||||||
Shares outstanding, beginning of period | 2,760,295 | — | ||||||
Shares sold | 15,255,549 | 2,768,876 | ||||||
Shares issued on reinvestment of distributions | 263,115 | 5,114 | ||||||
Shares redeemed | (3,633,549 | ) | (13,695 | ) | ||||
Shares outstanding, end of period | 14,645,410 | 2,760,295 | ||||||
| CLASS N | ||||||||
Shares outstanding, beginning of period | 843,532 | — | ||||||
Shares sold | 624,669 | 844,737 | ||||||
Shares issued on reinvestment of distributions | 19,161 | 10,134 | ||||||
Shares redeemed | (192,814 | ) | (11,339 | ) | ||||
Shares outstanding, end of period | 1,294,548 | 843,532 | ||||||
| CLASS R6 | ||||||||
Shares outstanding, beginning of period | 2,329,001 | — | ||||||
Shares sold | 2,091,933 | 2,300,000 | ||||||
Shares issued on reinvestment of distributions | 40,297 | 29,001 | ||||||
Shares redeemed | (2,329,001 | ) | — | |||||
Shares outstanding, end of period | 2,132,230 | 2,329,001 | ||||||
| * | Commencement of operations. |
| ** | Consolidated financial statement, see Note 2 in the Notes to Financial Statements for additional information. |
| The accompanying notes are an integral part of these financial statements. |
| AQR Funds | Annual Report | December 2015 | ||||||||||||||
336
Table of Contents
| Statements of Cash Flows | December 31, 2015 |
AQR FUND | AQR FUND | AQR LONG-SHORT | ||||||||||
| CASH FLOWS FROM OPERATING ACTIVITIES: | ||||||||||||
Net increase (decrease) in net assets resulting from operations | $ | (66,186,973 | ) | $ | 10,173,308 | $ | 32,539,517 | |||||
| Adjustments to reconcile net increase (decrease) in net assets resulting from operations to net cash provided (used) in operating activities: | ||||||||||||
Payments to purchase securities | (2,672,110,634 | ) | (78,350,020 | ) | (169,460,971 | ) | ||||||
Payments to cover short securities | (1,736,115,808 | ) | (16,062,082 | ) | (30,407,588 | ) | ||||||
Proceeds from sale of securities | 3,820,400,354 | 4,416,957 | 11,191,209 | |||||||||
Proceeds from securities sold short | 1,278,879,125 | 80,488,190 | 164,224,048 | |||||||||
Proceeds from written options | 1,047,339 | — | — | |||||||||
Payments to close written options | (150,509 | ) | — | — | ||||||||
(Purchases) sales of short-term investments, net | 193,651,893 | (225,327,491 | ) | (428,285,450 | ) | |||||||
Realized (gain) loss on investments in securities | 33,161,251 | 513,067 | 1,148,140 | |||||||||
Realized (gain) loss on securities sold short | 48,040,305 | (399,981 | ) | (271,826 | ) | |||||||
Realized (gain) loss on written options | (854,357 | ) | — | — | ||||||||
Realized (gain) loss on paydowns | (81,462 | ) | — | — | ||||||||
Change in unrealized (appreciation) depreciation on investments in securities | 106,849,272 | (235,429 | ) | 2,267,205 | ||||||||
Change in unrealized (appreciation) depreciation on securities sold short | (99,571,995 | ) | (2,283,578 | ) | (10,312,997 | ) | ||||||
Change in unrealized (appreciation) depreciation on written options | (588,688 | ) | — | — | ||||||||
Amortization (accretion) of bond premium (discount) | (1,142,030 | ) | (22,797 | ) | (90,663 | ) | ||||||
| (Increases) decreases in operating assets: | ||||||||||||
Due from brokers | 261,972,388 | (8,711,739 | ) | (28,018,909 | ) | |||||||
Due from custodian | 2,320,125 | — | — | |||||||||
Unrealized appreciation on forward foreign currency exchange contracts | 4,998,355 | (47,130 | ) | (964,654 | ) | |||||||
OTC swaps, at value | 19,176,280 | (5,746,693 | ) | (2,331,625 | ) | |||||||
Deposits with brokers for exchange-traded and centrally cleared derivatives | (7,159,146 | ) | (803 | ) | (14,664,915 | ) | ||||||
Variation margin on exchange-traded and centrally cleared derivatives | (377,552 | ) | — | — | ||||||||
Receivable for securities sold | 111,584 | (10,913,743 | ) | (26,959,547 | ) | |||||||
Foreign tax reclaim | 39,891 | (9,398 | ) | (32,324 | ) | |||||||
Dividends and interest | 8,876,764 | (18,475 | ) | (35,325 | ) | |||||||
Due from Investment Adviser | — | 22,189 | — | |||||||||
Prepaid expenses | 183,188 | 14,801 | (27,851 | ) | ||||||||
| Increases (decreases) in operating liabilities | ||||||||||||
Due to custodian | — | (34,336 | ) | — | ||||||||
Due to brokers | 9,925,234 | — | 290,000 | |||||||||
Unrealized depreciation on forward foreign currency exchange contracts | 364,388 | 124,079 | 553,970 | |||||||||
OTC swaps, at value | (10,425,098 | ) | 376,337 | 5,455,052 | ||||||||
Deposits from brokers for exchange-traded and centrally cleared derivatives | (12,413,572 | ) | (7,134 | ) | — | |||||||
Variation margin on exchange-traded and centrally cleared derivatives | 45,775 | — | 2,159,684 | |||||||||
Payable for securities purchased | 768,079 | 10,407,840 | 22,331,683 | |||||||||
Accrued investment advisory fees | (1,271,914 | ) | 162,237 | 366,452 | ||||||||
Accrued distribution fees—Class N | (106,548 | ) | 16,599 | 15,924 | ||||||||
Accrued Trustees fees | 848 | 104 | 259 | |||||||||
Dividends and Interest payable on securities sold short and reverse repurchase agreements | (164,187 | ) | 87,241 | 149,062 | ||||||||
Other accrued expenses and liabilities | (457,406 | ) | 55,494 | 102,123 | ||||||||
Net cash provided by (used in) operating activities | $ | 1,181,634,559 | $ | (241,312,386 | ) | $ | (469,070,317 | ) | ||||
| CASH FLOWS FROM FINANCING ACTIVITIES | ||||||||||||
Proceeds from shares sold | 475,617,829 | 282,639,323 | 525,980,446 | |||||||||
Payments on shares redeemed | (1,673,629,667 | ) | (32,862,502 | ) | (62,302,323 | ) | ||||||
Cash distributions paid | (7,331,470 | ) | (253,296 | ) | (210,322 | ) | ||||||
Due to custodian | 2,330,779 | — | 7,104,454 | |||||||||
Net cash provided by (used in) financing activities | $ | (1,203,012,529 | ) | $ | 249,523,525 | $ | 470,572,255 | |||||
| Net change in cash and foreign currency | (21,377,970 | ) | 8,211,139 | 1,501,938 | ||||||||
Cash, beginning of period | 35,429,912 | 24,630 | 137,472 | |||||||||
Cash, end of period | $ | 14,051,942 | $ | 8,235,769 | $ | 1,639,410 | ||||||
Supplemental disclosure of cash flow information:
Cash paid during the period for interest in the amount of $10,161,121, $109,356 and $235,945.
| The accompanying notes are an integral part of these financial statements. |
| AQR Funds | Annual Report | December 2015 | ||||||||||||||
337
Table of Contents
| Statements of Cash Flows | December 31, 2015 |
AQR FUND** | AQR RISK | AQR STYLE | ||||||||||
| CASH FLOWS FROM OPERATING ACTIVITIES: | ||||||||||||
Net increase (decrease) in net assets resulting from operations | $ | 178,030,910 | $ | (7,921,351 | ) | $ | 115,849,352 | |||||
| Adjustments to reconcile net increase (decrease) in net assets resulting from operations to net cash provided (used) in operating activities: | ||||||||||||
Payments to purchase securities | (1,060,122,868 | ) | (52,568,586 | ) | (560,099,796 | ) | ||||||
Payments to cover short securities | (533,501,432 | ) | — | (170,161,349 | ) | |||||||
Proceeds from sale of securities | 828,530,161 | 55,219,203 | 91,134,577 | |||||||||
Proceeds from securities sold short | 716,298,435 | — | 503,099,838 | |||||||||
(Purchases) sales of short-term investments, net | (704,367,135 | ) | (7,028,161 | ) | (1,091,416,690 | ) | ||||||
Realized (gain) loss on investments in securities | (58,706,668 | ) | 1,658,490 | 10,086,510 | ||||||||
Realized (gain) loss on securities sold short | 51,285,970 | — | 5,127,011 | |||||||||
Realized (gain) loss on written options | (103,616 | ) | — | — | ||||||||
Change in unrealized (appreciation) depreciation on investments in securities | 55,084,825 | (503,843 | ) | (24,529,994 | ) | |||||||
Change in unrealized (appreciation) depreciation on securities sold short | (70,384,102 | ) | — | (11,289,053 | ) | |||||||
Change in unrealized (appreciation) depreciation on written options | (135,144 | ) | ||||||||||
Amortization (accretion) of bond premium (discount) | (296,237 | ) | 29,911 | (238,304 | ) | |||||||
| (Increases) decreases in operating assets: | ||||||||||||
Due from brokers | (13,081,475 | ) | 1,653,587 | 32,134,786 | ||||||||
Repurchase Agreements | — | (2,525,961 | ) | — | ||||||||
Unrealized appreciation on forward foreign currency exchange contracts | (31,174,135 | ) | 96,612 | (17,005,734 | ) | |||||||
OTC swaps, at value | (66,245,321 | ) | 540,711 | 14,675,562 | ||||||||
Deposits with brokers for exchange-traded and centrally cleared derivatives | (73,685,309 | ) | (1,394,881 | ) | (133,298,215 | ) | ||||||
Variation margin on exchange-traded and centrally cleared derivatives | (10,452,406 | ) | (137,468 | ) | (4,265,113 | ) | ||||||
Receivable for securities sold | (20,658,379 | ) | (4,367 | ) | 790,658 | |||||||
Foreign tax reclaim | 47,943 | — | (265,617 | ) | ||||||||
Dividends and interest | (1,524,672 | ) | 18,301 | (349,802 | ) | |||||||
Due from Investment Adviser | — | (5,604 | ) | — | ||||||||
Prepaid expenses | 10,455 | 1,329 | (46,546 | ) | ||||||||
| Increases (decreases) in operating liabilities | ||||||||||||
Due to brokers | (1,854,383 | ) | (245,610 | ) | (899,341 | ) | ||||||
Unrealized depreciation on forward foreign currency exchange contracts | 22,536,170 | 158,019 | 11,836,195 | |||||||||
OTC swaps, at value | 11,574,672 | (2,003,871 | ) | 24,629,198 | ||||||||
Deposits from brokers for exchange-traded and centrally cleared derivatives | (9,022,946 | ) | (362,458 | ) | (5,395,985 | ) | ||||||
Variation margin on exchange-traded and centrally cleared derivatives | 1,077,575 | — | 3,477,149 | |||||||||
Payable for securities purchased | 25,834,637 | 4,364 | (106,696 | ) | ||||||||
Accrued investment advisory fees | 1,176,436 | (21,503 | ) | 1,193,614 | ||||||||
Accrued distribution fees—Class N | 3,286 | (504 | ) | 11,140 | ||||||||
Accrued Trustees fees | 265 | 31 | 524 | |||||||||
Dividends on securities sold short | — | — | 360,717 | |||||||||
Dividends and Interest payable on securities sold short and reverse repurchase agreements | 118,501 | 5,562 | — | |||||||||
Other accrued expenses and liabilities | 247,075 | (22,792 | ) | 327,859 | ||||||||
Net cash provided by (used in) operating activities | $ | (763,458,912 | ) | $ | (15,360,840 | ) | $ | (1,204,633,545 | ) | |||
| CASH FLOWS FROM FINANCING ACTIVITIES | ||||||||||||
Proceeds from shares sold | 1,257,935,203 | 38,943,909 | 1,612,429,490 | |||||||||
Net change in reverse repurchase agreements | — | 9,233,035 | — | |||||||||
Payments on shares redeemed | (503,523,581 | ) | (32,800,433 | ) | (394,245,937 | ) | ||||||
Cash distributions paid | (36,971,447 | ) | (40,281 | ) | (8,022,926 | ) | ||||||
Due to custodian | 68,691,851 | 13,813 | — | |||||||||
Net cash provided by (used in) financing activities | $ | 786,132,026 | $ | 15,350,043 | $ | 1,210,160,627 | ||||||
| Net change in cash and foreign currency | 22,673,114 | (10,797 | ) | 5,527,082 | ||||||||
Cash, beginning of period | 21,326,798 | 44,021 | 695,980 | |||||||||
Cash, end of period | $ | 43,999,912 | $ | 33,224 | $ | 6,223,062 | ||||||
Supplemental disclosure of cash flow information:
Cash paid during the period for interest in the amount of $1,850,926, $29,902 and $2,369,679.
| ** | Consolidated financial statement, see Note 2 in the Notes to Financial Statements for additional information. |
| The accompanying notes are an integral part of these financial statements. |
| AQR Funds | Annual Report | December 2015 | ||||||||||||||
338
Table of Contents
| Statements of Cash Flows | December 31, 2015 |
AQR STYLE | ||||
| CASH FLOWS FROM OPERATING ACTIVITIES: | ||||
Net increase (decrease) in net assets resulting from operations | $ | 3,068,095 | ||
| Adjustments to reconcile net increase (decrease) in net assets resulting from operations to net cash provided (used) in operating activities: | ||||
Payments to purchase securities | (31,554,658 | ) | ||
Payments to cover short securities | (11,340,188 | ) | ||
Proceeds from sale of securities | 8,511,965 | |||
Proceeds from securities sold short | 27,946,856 | |||
(Purchases) sales of short-term investments, net | (113,393,105 | ) | ||
Realized (gain) loss on investments in securities | 120,173 | |||
Realized (gain) loss on securities sold short | 534,828 | |||
Change in unrealized (appreciation) depreciation on investments in securities | (1,375,946 | ) | ||
Change in unrealized (appreciation) depreciation on securities sold short | (103,941 | ) | ||
Amortization (accretion) of bond premium (discount) | (26,817 | ) | ||
| (Increases) decreases in operating assets: | ||||
Due from brokers | 4,627,131 | |||
Unrealized appreciation on forward foreign currency exchange contracts | (973,358 | ) | ||
OTC swaps, at value | (1,330,649 | ) | ||
Deposits with brokers for exchange-traded and centrally cleared derivatives | (7,197,554 | ) | ||
Variation margin on exchange-traded and centrally cleared derivatives | (249,243 | ) | ||
Receivable for securities sold | (359,138 | ) | ||
Foreign tax reclaim | (6,131 | ) | ||
Dividends and interest | (30,432 | ) | ||
Due from Investment Adviser | 16,780 | |||
Prepaid expenses | 27,687 | |||
| Increases (decreases) in operating liabilities | ||||
Due to brokers | 87,491 | |||
Unrealized depreciation on forward foreign currency exchange contracts | 679,517 | |||
OTC swaps, at value | 366,986 | |||
Deposits from brokers for exchange-traded and centrally cleared derivatives | (266,727 | ) | ||
Variation margin on exchange-traded and centrally cleared derivatives | 141,289 | |||
Payable for securities purchased | (73,423 | ) | ||
Accrued investment advisory fees | 43,277 | |||
Accrued distribution fees—Class N | 848 | |||
Accrued Trustees fees | 31 | |||
Dividends on securities sold short | 22,236 | |||
Other accrued expenses and liabilities | 10,348 | |||
Net cash provided by (used in) operating activities | $ | (122,075,772 | ) | |
| CASH FLOWS FROM FINANCING ACTIVITIES | ||||
Proceeds from shares sold | 186,190,840 | |||
Payments on shares redeemed | (62,411,368 | ) | ||
Cash distributions paid | (13,010 | ) | ||
Due to custodian | (1,462,673 | ) | ||
Net cash provided by (used in) financing activities | $ | 122,303,789 | ||
| Net change in cash and foreign currency | 228,017 | |||
Cash, beginning of period | — | |||
Cash, end of period | $ | 228,017 | ||
Supplemental disclosure of cash flow information:
Cash paid during the period for interest in the amount of $85,188.
| ** | Consolidated financial statement, see Note 2 in the Notes to Financial Statements for additional information. |
| The accompanying notes are an integral part of these financial statements. |
| AQR Funds | Annual Report | December 2015 | ||||||||||||||
339
Table of Contents
| Financial Highlights | December 31, 2015 |
| PER SHARE OPERATING PERFORMANCE | ||||||||||||||||||||||||||||||||
| Change in Net Assets Resulting from Operations1 | Less Dividends and Distributions | |||||||||||||||||||||||||||||||
Net Asset Value, Beginning of Period | Net Investment Income (Loss) | Net Realized and Unrealized Gain | Net Increase (Decrease) in Net Asset Value from Operations | Distributions from Net Investment Income | Distributions from Net Realized Gains | Return of Capital | Total Distributions | |||||||||||||||||||||||||
| AQR DIVERSIFIED ARBITRAGE FUND CLASS I | ||||||||||||||||||||||||||||||||
| FOR THE YEAR ENDED DECEMBER 31, 2015 | $10.14 | 0.07 | (0.55 | ) | (0.48 | ) | (0.45 | ) | — | — | (0.45 | ) | ||||||||||||||||||||
| FOR THE YEAR ENDED DECEMBER 31, 2014 | $10.91 | 0.23 | (0.80 | ) | (0.57 | ) | (0.20 | ) | — | — | (0.20 | ) | ||||||||||||||||||||
| FOR THE YEAR ENDED DECEMBER 31, 2013 | $11.05 | 0.17 | 0.02 | 0.19 | (0.18 | ) | (0.06 | ) | (0.09 | ) | (0.33 | ) | ||||||||||||||||||||
| FOR THE YEAR ENDED DECEMBER 31, 2012 | $10.89 | 0.10 | 6 | 0.24 | 0.34 | (0.13 | ) | (0.05 | ) | — | (0.18 | ) | ||||||||||||||||||||
| FOR THE YEAR ENDED DECEMBER 31, 2011 | $11.15 | 0.13 | (0.02 | ) | 0.11 | (0.09 | ) | (0.28 | ) | — | (0.37 | ) | ||||||||||||||||||||
| AQR DIVERSIFIED ARBITRAGE FUND CLASS N | ||||||||||||||||||||||||||||||||
| FOR THE YEAR ENDED DECEMBER 31, 2015 | $10.10 | 0.03 | (0.51 | ) | (0.48 | ) | (0.41 | ) | — | — | (0.41 | ) | ||||||||||||||||||||
| FOR THE YEAR ENDED DECEMBER 31, 2014 | $10.87 | 0.21 | (0.81 | ) | (0.60 | ) | (0.17 | ) | — | — | (0.17 | ) | ||||||||||||||||||||
| FOR THE YEAR ENDED DECEMBER 31, 2013 | $11.01 | 0.13 | 0.04 | 0.17 | (0.16 | ) | (0.06 | ) | (0.09 | ) | (0.31 | ) | ||||||||||||||||||||
| FOR THE YEAR ENDED DECEMBER 31, 2012 | $10.85 | 0.06 | 6 | 0.24 | 0.30 | (0.09 | ) | (0.05 | ) | — | (0.14 | ) | ||||||||||||||||||||
| FOR THE YEAR ENDED DECEMBER 31, 2011† | $11.12 | 0.10 | (0.02 | ) | 0.08 | (0.07 | ) | (0.28 | ) | — | (0.35 | ) | ||||||||||||||||||||
| AQR DIVERSIFIED ARBITRAGE FUND CLASS R6 | ||||||||||||||||||||||||||||||||
| FOR THE YEAR ENDED DECEMBER 31, 2015 | $10.13 | 0.09 | (0.55 | ) | (0.46 | ) | (0.47 | ) | — | — | (0.47 | ) | ||||||||||||||||||||
| FOR THE PERIOD 9/02/147—12/31/14 | $11.00 | 0.16 | (0.82 | ) | (0.66 | ) | (0.21 | ) | — | — | (0.21 | ) | ||||||||||||||||||||
| AQR EQUITY MARKET NEUTRAL FUND CLASS I | ||||||||||||||||||||||||||||||||
| FOR THE YEAR ENDED DECEMBER 31, 2015 | $10.01 | (0.15 | ) | 1.91 | 1.76 | (0.28 | ) | (0.01 | ) | — | (0.29 | ) | ||||||||||||||||||||
| FOR THE PERIOD 10/07/149—12/31/14 | $10.00 | (0.02 | ) | 0.62 | 0.60 | (0.59 | ) | — | (0.00 | )10 | (0.59 | ) | ||||||||||||||||||||
| AQR EQUITY MARKET NEUTRAL FUND CLASS N | ||||||||||||||||||||||||||||||||
| FOR THE YEAR ENDED DECEMBER 31, 2015 | $10.01 | (0.19 | ) | 1.94 | 1.75 | (0.28 | ) | (0.01 | ) | — | (0.29 | ) | ||||||||||||||||||||
| FOR THE PERIOD 10/07/149—12/31/14 | $10.00 | (0.03 | ) | 0.62 | 0.59 | (0.58 | ) | — | (0.00 | )10 | (0.58 | ) | ||||||||||||||||||||
| AQR EQUITY MARKET NEUTRAL FUND CLASS R6 | ||||||||||||||||||||||||||||||||
| FOR THE YEAR ENDED DECEMBER 31, 2015 | $10.01 | (0.13 | ) | 1.90 | 1.77 | (0.28 | ) | (0.01 | ) | — | (0.29 | ) | ||||||||||||||||||||
| FOR THE PERIOD 10/07/149—12/31/14 | $10.00 | (0.02 | ) | 0.62 | 0.60 | (0.59 | ) | — | (0.00 | )10 | (0.59 | ) | ||||||||||||||||||||
| AQR GLOBAL MACRO FUND CLASS I | ||||||||||||||||||||||||||||||||
| FOR THE YEAR ENDED DECEMBER 31, 2015 | $9.94 | (0.15 | ) | 0.32 | 0.17 | — | (0.51 | ) | — | (0.51 | ) | |||||||||||||||||||||
| FOR THE PERIOD 4/08/149—12/31/14 | $10.00 | (0.10 | ) | 0.06 | (0.04 | ) | — | (0.02 | ) | — | (0.02 | ) | ||||||||||||||||||||
| AQR GLOBAL MACRO FUND CLASS N | ||||||||||||||||||||||||||||||||
| FOR THE YEAR ENDED DECEMBER 31, 2015 | $9.92 | (0.16 | ) | 0.30 | 0.14 | — | (0.51 | ) | — | (0.51 | ) | |||||||||||||||||||||
| FOR THE PERIOD 4/08/149—12/31/14 | $10.00 | (0.12 | ) | 0.06 | (0.06 | ) | — | (0.02 | ) | — | (0.02 | ) | ||||||||||||||||||||
| AQR GLOBAL MACRO FUND CLASS R6 | ||||||||||||||||||||||||||||||||
| FOR THE YEAR ENDED DECEMBER 31, 2015 | $9.94 | (0.14 | ) | 0.31 | 0.17 | — | (0.51 | ) | — | (0.51 | ) | |||||||||||||||||||||
| FOR THE PERIOD 9/02/147—12/31/14 | $9.72 | (0.04 | ) | 0.28 | 0.24 | — | (0.02 | ) | — | (0.02 | ) | |||||||||||||||||||||
| AQR LONG-SHORT EQUITY FUND CLASS I | ||||||||||||||||||||||||||||||||
| FOR THE YEAR ENDED DECEMBER 31, 2015 | $10.87 | (0.15 | ) | 2.00 | 1.85 | (0.58 | ) | (0.02 | ) | — | (0.60 | ) | ||||||||||||||||||||
| FOR THE YEAR ENDED DECEMBER 31, 2014 | $10.21 | (0.14 | ) | 1.67 | 1.53 | (0.74 | ) | (0.10 | ) | (0.03 | ) | (0.87 | ) | |||||||||||||||||||
| FOR THE PERIOD 7/16/139—12/31/13 | $10.00 | (0.06 | ) | 1.17 | 1.11 | (0.67 | ) | (0.23 | ) | — | (0.90 | ) | ||||||||||||||||||||
| AQR LONG-SHORT EQUITY FUND CLASS N | ||||||||||||||||||||||||||||||||
| FOR THE YEAR ENDED DECEMBER 31, 2015 | $10.84 | (0.19 | ) | 2.01 | 1.82 | (0.57 | ) | (0.02 | ) | — | (0.59 | ) | ||||||||||||||||||||
| FOR THE YEAR ENDED DECEMBER 31, 2014 | $10.21 | (0.20 | ) | 1.70 | 1.50 | (0.74 | ) | (0.10 | ) | (0.03 | ) | (0.87 | ) | |||||||||||||||||||
| FOR THE PERIOD 7/16/139—12/31/13 | $10.00 | (0.07 | ) | 1.17 | 1.10 | (0.66 | ) | (0.23 | ) | — | (0.89 | ) | ||||||||||||||||||||
| AQR LONG-SHORT EQUITY FUND CLASS R6 | ||||||||||||||||||||||||||||||||
| FOR THE YEAR ENDED DECEMBER 31, 2015 | $10.87 | (0.15 | ) | 2.02 | 1.87 | (0.59 | ) | (0.02 | ) | — | (0.61 | ) | ||||||||||||||||||||
| FOR THE PERIOD 9/02/147—12/31/14 | $11.05 | (0.08 | ) | 0.78 | 0.70 | (0.75 | ) | (0.10 | ) | (0.03 | ) | (0.88 | ) | |||||||||||||||||||
| The accompanying notes are an integral part of these financial statements. |
| AQR Funds | Annual Report | December 2015 | ||||||||||||||
340
Table of Contents
| Financial Highlights | December 31, 2015 |
| RATIOS/SUPPLEMENTAL DATA | ||||||||||||||||||||||||||||||||
| Ratios to Average Net Assets of:* | ||||||||||||||||||||||||||||||||
Net Asset | Total Return2,3 | Net Assets, End of Period | Expenses, Net of Reimbursements and/or Waivers4 | Expenses, Net of Reimbursements and/or Waivers (Excluding Dividend Short Expense & Interest Expense)4 | Expenses, Before Reimbursements and/or Waivers4 | Net Investment Income (Loss) | Portfolio Turnover Rate5 | |||||||||||||||||||||||||
| $9.21 | (4.67 | )% | $772,394 | 2.42 | % | 1.19 | % | 2.44 | % | 0.71 | % | 249 | % | |||||||||||||||||||
| $10.14 | (5.25 | )% | $1,546,685 | 1.88 | % | 1.20 | % | 1.88 | % | 2.07 | % | 380 | % | |||||||||||||||||||
| $10.91 | 1.75 | % | $1,876,481 | 1.64 | % | 1.20 | % | 1.64 | % | 1.52 | % | 349 | % | |||||||||||||||||||
| $11.05 | 3.13 | % | $1,752,724 | 2.30 | % | 1.21 | % | 2.32 | % | 0.88 | %6 | 312 | % | |||||||||||||||||||
| $10.89 | 0.99 | % | $1,456,748 | 2.75 | % | 1.20 | % | 2.84 | % | 1.18 | % | 298 | % | |||||||||||||||||||
| $9.21 | (4.75 | )% | $183,029 | 2.67 | % | 1.45 | % | 2.69 | % | 0.32 | % | 249 | % | |||||||||||||||||||
| $10.10 | (5.51 | )% | $678,528 | 2.12 | % | 1.44 | % | 2.12 | % | 1.99 | % | 380 | % | |||||||||||||||||||
| $10.87 | 1.51 | % | $836,355 | 1.88 | % | 1.44 | % | 1.88 | % | 1.21 | % | 349 | % | |||||||||||||||||||
| $11.01 | 2.83 | % | $761,371 | 2.62 | % | 1.52 | % | 2.62 | % | 0.57 | %6 | 312 | % | |||||||||||||||||||
| $10.85 | 0.68 | % | $651,791 | 3.05 | % | 1.50 | % | 3.08 | % | 0.89 | % | 298 | % | |||||||||||||||||||
| $9.20 | (4.55 | )% | $866 | 2.33 | % | 1.10 | % | 2.36 | % | 0.92 | % | 249 | % | |||||||||||||||||||
| $10.13 | (5.99 | )% | $94 | 1.94 | % | 1.10 | % | 1.94 | % | 4.69 | % | 380 | % | |||||||||||||||||||
| $11.48 | 17.60 | % | $179,312 | 1.90 | % | 1.25 | % | 2.17 | %8 | (1.36 | )% | 383 | % | |||||||||||||||||||
| $10.01 | 5.93 | % | $1,445 | 1.63 | % | 1.30 | % | 4.57 | %8 | (1.04 | )% | 152 | % | |||||||||||||||||||
| $11.47 | 17.43 | % | $89,755 | 2.16 | % | 1.51 | % | 2.41 | %8 | (1.69 | )% | 383 | % | |||||||||||||||||||
| $10.01 | 5.88 | % | $1,233 | 1.88 | % | 1.55 | % | 4.83 | %8 | (1.29 | )% | 152 | % | |||||||||||||||||||
| $11.49 | 17.72 | % | $148 | 1.85 | % | 1.20 | % | 3.05 | %8 | (1.26 | )% | 383 | % | |||||||||||||||||||
| $10.01 | 5.95 | % | $3,210 | 1.53 | % | 1.20 | % | 4.49 | %8 | (0.95 | )% | 152 | % | |||||||||||||||||||
| $9.60 | 1.71 | % | $31,453 | 1.38 | % | 1.38 | % | 1.78 | %8 | (1.45 | )% | 0 | % | |||||||||||||||||||
| $9.94 | (0.42 | )% | $35,466 | 1.45 | % | 1.45 | % | 2.24 | %8 | (1.44 | )% | 0 | % | |||||||||||||||||||
| $9.55 | 1.41 | % | $20,838 | 1.70 | % | 1.70 | % | 1.88 | %8 | (1.56 | )% | 0 | % | |||||||||||||||||||
| $9.92 | (0.62 | )% | $1,050 | 1.70 | % | 1.70 | % | 2.49 | %8 | (1.69 | )% | 0 | % | |||||||||||||||||||
| $9.60 | 1.71 | % | $104 | 1.35 | % | 1.35 | % | 1.72 | %8 | (1.41 | )% | 0 | % | |||||||||||||||||||
| $9.94 | 2.45 | % | $102 | 1.35 | % | 1.35 | % | 2.02 | %8 | (1.37 | )% | 0 | % | |||||||||||||||||||
| $12.12 | 17.04 | % | $452,667 | 1.81 | % | 1.27 | % | 1.86 | % | (1.28 | )% | 303 | % | |||||||||||||||||||
| $10.87 | 14.91 | % | $43,667 | 1.30 | % | 1.30 | % | 2.34 | % | (1.26 | )% | 0 | % | |||||||||||||||||||
| $10.21 | 11.17 | % | $5,246 | 1.30 | % | 1.30 | % | 3.56 | %8 | (1.29 | )% | 0 | % | |||||||||||||||||||
| $12.07 | 16.79 | % | $90,141 | 2.07 | % | 1.53 | % | 2.12 | % | (1.58 | )% | 303 | % | |||||||||||||||||||
| $10.84 | 14.55 | % | $10,688 | 1.55 | % | 1.55 | % | 2.46 | % | (1.81 | )% | 0 | % | |||||||||||||||||||
| $10.21 | 11.04 | % | $910 | 1.55 | % | 1.55 | % | 5.49 | %8 | (1.54 | )% | 0 | % | |||||||||||||||||||
| $12.13 | 17.16 | % | $16,200 | 1.74 | % | 1.20 | % | 1.77 | % | (1.21 | )% | 303 | % | |||||||||||||||||||
| $10.87 | 6.19 | % | $427 | 1.20 | % | 1.20 | % | 1.99 | % | (2.21 | )% | 0 | % | |||||||||||||||||||
| The accompanying notes are an integral part of these financial statements. |
| AQR Funds | Annual Report | December 2015 | ||||||||||||||
341
Table of Contents
| Financial Highlights | December 31, 2015 |
| PER SHARE OPERATING PERFORMANCE | ||||||||||||||||||||||||||||
| Change in Net Assets Resulting from Operations1 | Less Dividends and Distributions | |||||||||||||||||||||||||||
Net Asset Value, Beginning of Period | Net Investment Income (Loss) | Net Realized and Unrealized Gain (Loss) | Net Increase (Decrease) in Net Asset Value from Operations | Distributions from Net Investment Income | Distributions from Net Realized Gains | Total Distributions | ||||||||||||||||||||||
| AQR MANAGED FUTURES STRATEGY FUND CLASS I | ||||||||||||||||||||||||||||
| FOR THE YEAR ENDED DECEMBER 31, 2015 | $10.63 | (0.12 | ) | 0.34 | 0.22 | (0.46 | ) | (0.21 | ) | (0.67 | ) | |||||||||||||||||
| FOR THE YEAR ENDED DECEMBER 31, 2014 | $10.59 | (0.12 | ) | 1.13 | 1.01 | (0.44 | ) | (0.53 | ) | (0.97 | ) | |||||||||||||||||
| FOR THE YEAR ENDED DECEMBER 31, 2013 | $9.78 | (0.12 | ) | 1.04 | 0.92 | — | (0.11 | ) | (0.11 | ) | ||||||||||||||||||
| FOR THE YEAR ENDED DECEMBER 31, 2012 | $9.57 | (0.12 | ) | 0.40 | 0.28 | (0.07 | ) | — | (0.07 | ) | ||||||||||||||||||
| FOR THE YEAR ENDED DECEMBER 31, 2011† | $10.30 | (0.12 | ) | (0.53 | ) | (0.65 | ) | (0.04 | ) | (0.04 | ) | (0.08 | ) | |||||||||||||||
| AQR MANAGED FUTURES STRATEGY FUND CLASS N | ||||||||||||||||||||||||||||
| FOR THE YEAR ENDED DECEMBER 31, 2015 | $10.54 | (0.15 | ) | 0.34 | 0.19 | (0.43 | ) | (0.21 | ) | (0.64 | ) | |||||||||||||||||
| FOR THE YEAR ENDED DECEMBER 31, 2014 | $10.51 | (0.15 | ) | 1.11 | 0.96 | (0.40 | ) | (0.53 | ) | (0.93 | ) | |||||||||||||||||
| FOR THE YEAR ENDED DECEMBER 31, 2013 | $9.73 | (0.15 | ) | 1.04 | 0.89 | — | (0.11 | ) | (0.11 | ) | ||||||||||||||||||
| FOR THE YEAR ENDED DECEMBER 31, 2012 | $9.55 | (0.14 | ) | 0.39 | 0.25 | (0.07 | ) | — | (0.07 | ) | ||||||||||||||||||
| FOR THE YEAR ENDED DECEMBER 31, 2011† | $10.28 | (0.15 | ) | (0.52 | ) | (0.67 | ) | (0.02 | ) | (0.04 | ) | (0.06 | ) | |||||||||||||||
| AQR MANAGED FUTURES STRATEGY FUND CLASS R6 | ||||||||||||||||||||||||||||
| FOR THE YEAR ENDED DECEMBER 31, 2015 | $10.62 | (0.11 | ) | 0.34 | 0.23 | (0.46 | ) | (0.21 | ) | (0.67 | ) | |||||||||||||||||
| FOR THE PERIOD 9/02/147—12/31/14 | $10.28 | (0.04 | ) | 1.36 | 1.32 | (0.45 | ) | (0.53 | ) | (0.98 | ) | |||||||||||||||||
| AQR MANAGED FUTURES STRATEGY HV FUND CLASS I | ||||||||||||||||||||||||||||
| FOR THE YEAR ENDED DECEMBER 31, 2015 | $11.23 | (0.18 | ) | 0.46 | 0.28 | (0.51 | ) | (0.30 | ) | (0.81 | ) | |||||||||||||||||
| FOR THE YEAR ENDED DECEMBER 31, 2014 | $10.80 | (0.17 | ) | 1.72 | 1.55 | (0.86 | ) | (0.26 | ) | (1.12 | ) | |||||||||||||||||
| FOR THE PERIOD 7/16/139—12/31/13 | $10.00 | (0.08 | ) | 0.89 | 0.81 | — | (0.01 | ) | (0.01 | ) | ||||||||||||||||||
| AQR MANAGED FUTURES STRATEGY HV FUND CLASS N | ||||||||||||||||||||||||||||
| FOR THE YEAR ENDED DECEMBER 31, 2015 | $11.21 | (0.21 | ) | 0.46 | 0.25 | (0.50 | ) | (0.30 | ) | (0.80 | ) | |||||||||||||||||
| FOR THE YEAR ENDED DECEMBER 31, 2014 | $10.79 | (0.19 | ) | 1.71 | 1.52 | (0.84 | ) | (0.26 | ) | (1.10 | ) | |||||||||||||||||
| FOR THE PERIOD 7/16/139—12/31/13 | $10.00 | (0.09 | ) | 0.89 | 0.80 | — | (0.01 | ) | (0.01 | ) | ||||||||||||||||||
| AQR MANAGED FUTURES STRATEGY HV FUND CLASS R6 | ||||||||||||||||||||||||||||
| FOR THE YEAR ENDED DECEMBER 31, 2015 | $11.23 | (0.17 | ) | 0.46 | 0.29 | (0.52 | ) | (0.30 | ) | (0.82 | ) | |||||||||||||||||
| FOR THE PERIOD 9/02/147—12/31/14 | $10.33 | (0.06 | ) | 2.09 | 2.03 | (0.87 | ) | (0.26 | ) | (1.13 | ) | |||||||||||||||||
| AQR MULTI-STRATEGY ALTERNATIVE FUND CLASS I | ||||||||||||||||||||||||||||
| FOR THE YEAR ENDED DECEMBER 31, 2015 | $9.76 | (0.15 | ) | 1.05 | 0.90 | (0.74 | ) | (0.16 | ) | (0.90 | ) | |||||||||||||||||
| FOR THE YEAR ENDED DECEMBER 31, 2014 | $9.78 | (0.14 | ) | 0.85 | 0.71 | (0.73 | ) | — | (0.73 | ) | ||||||||||||||||||
| FOR THE YEAR ENDED DECEMBER 31, 2013 | $9.90 | (0.17 | ) | 0.61 | 0.44 | (0.44 | ) | (0.12 | ) | (0.56 | ) | |||||||||||||||||
| FOR THE YEAR ENDED DECEMBER 31, 2012 | $9.70 | (0.17 | ) | 0.40 | 0.23 | (0.01 | ) | (0.02 | ) | (0.03 | ) | |||||||||||||||||
| FOR THE PERIOD 7/18/119—12/31/11 | $10.00 | (0.05 | ) | (0.21 | ) | (0.26 | ) | (0.04 | ) | — | (0.04 | ) | ||||||||||||||||
| AQR MULTI-STRATEGY ALTERNATIVE FUND CLASS N | ||||||||||||||||||||||||||||
| FOR THE YEAR ENDED DECEMBER 31, 2015 | $ 9.74 | (0.17 | ) | 1.05 | 0.88 | (0.72 | ) | (0.16 | ) | (0.88 | ) | |||||||||||||||||
| FOR THE YEAR ENDED DECEMBER 31, 2014 | $9.76 | (0.17 | ) | 0.85 | 0.68 | (0.70 | ) | — | (0.70 | ) | ||||||||||||||||||
| FOR THE YEAR ENDED DECEMBER 31, 2013 | $9.89 | (0.20 | ) | 0.61 | 0.41 | (0.42 | ) | (0.12 | ) | (0.54 | ) | |||||||||||||||||
| FOR THE YEAR ENDED DECEMBER 31, 2012 | $9.69 | (0.23 | ) | 0.45 | 0.22 | — | (0.02 | ) | (0.02 | ) | ||||||||||||||||||
| FOR THE PERIOD 7/18/119—12/31/11 | $10.00 | (0.06 | ) | (0.21 | ) | (0.27 | ) | (0.04 | ) | — | (0.04 | ) | ||||||||||||||||
| AQR MULTI-STRATEGY ALTERNATIVE FUND CLASS R6 | ||||||||||||||||||||||||||||
| FOR THE YEAR ENDED DECEMBER 31, 2015 | $9.75 | (0.13 | ) | 1.05 | 0.92 | (0.75 | ) | (0.16 | ) | (0.91 | ) | |||||||||||||||||
| FOR THE PERIOD 9/02/147—12/31/14 | $9.88 | (0.11 | ) | 0.71 | 0.60 | (0.73 | ) | — | (0.73 | ) | ||||||||||||||||||
| The accompanying notes are an integral part of these financial statements. |
| AQR Funds | Annual Report | December 2015 | ||||||||||||||
342
Table of Contents
| Financial Highlights | December 31, 2015 |
| RATIOS/SUPPLEMENTAL DATA | ||||||||||||||||||||||||||||||||
| Ratios to Average Net Assets of:* | ||||||||||||||||||||||||||||||||
Net Asset | Total Return2,3 | Net Assets, End of Period | Expenses, Net of Reimbursements and/or Waivers4 | Expenses, Net of Reimbursements and/or Waivers (Excluding Dividend Short Expense & Interest Expense)4 | Expenses, Before Reimbursements and/or Waivers4 | Net Investment Income (Loss) | Portfolio Turnover Rate5 | |||||||||||||||||||||||||
| $10.18 | 2.00 | % | $7,778,072 | 1.21 | % | 1.21 | % | 1.21 | % | (1.11 | )% | 0 | % | |||||||||||||||||||
| $10.63 | 9.69 | % | $5,633,607 | 1.23 | % | 1.23 | % | 1.23 | % | (1.20 | )% | 0 | % | |||||||||||||||||||
| $10.59 | 9.40 | % | $4,506,181 | 1.23 | % | 1.23 | % | 1.23 | % | (1.22 | )% | 0 | % | |||||||||||||||||||
| $9.78 | 2.99 | % | $2,136,959 | 1.25 | % | 1.25 | % | 1.25 | % | (1.24 | )% | 0 | % | |||||||||||||||||||
| $9.57 | (6.37 | )% | $1,078,662 | 1.25 | % | 1.25 | % | 1.30 | % | (1.22 | )% | 0 | % | |||||||||||||||||||
| $10.09 | 1.75 | % | $1,588,011 | 1.47 | % | 1.47 | % | 1.47 | % | (1.38 | )% | 0 | % | |||||||||||||||||||
| $10.54 | 9.34 | % | $1,310,969 | 1.50 | % | 1.50 | % | 1.50 | % | (1.47 | )% | 0 | % | |||||||||||||||||||
| $10.51 | 9.14 | % | $1,408,085 | 1.50 | % | 1.50 | % | 1.50 | % | (1.48 | )% | 0 | % | |||||||||||||||||||
| $9.73 | 2.68 | % | $527,318 | 1.50 | % | 1.50 | % | 1.52 | % | (1.48 | )% | 0 | % | |||||||||||||||||||
| $9.55 | (6.59 | )% | $476,854 | 1.50 | % | 1.50 | % | 1.57 | % | (1.47 | )% | 0 | % | |||||||||||||||||||
| $10.18 | 2.16 | % | $240,185 | 1.13 | % | 1.13 | % | 1.13 | % | (1.01 | )% | 0 | % | |||||||||||||||||||
| $10.62 | 12.99 | % | $113 | 1.15 | % | 1.15 | % | 1.16 | % | (1.11 | )% | 0 | % | |||||||||||||||||||
| $10.70 | 2.48 | % | $258,691 | 1.61 | % | 1.61 | % | 1.65 | % | (1.52 | )% | 0 | % | |||||||||||||||||||
| $11.23 | 14.68 | % | $146,261 | 1.65 | % | 1.65 | % | 1.76 | %8 | (1.62 | )% | 0 | % | |||||||||||||||||||
| $10.80 | 8.14 | % | $37,078 | 1.68 | % | 1.65 | % | 2.51 | %8 | (1.66 | )% | 0 | % | |||||||||||||||||||
| $10.66 | 2.19 | % | $137,115 | 1.89 | % | 1.89 | % | 1.92 | % | (1.78 | )% | 0 | % | |||||||||||||||||||
| $11.21 | 14.37 | % | $9,367 | 1.90 | % | 1.90 | % | 2.12 | %8 | (1.88 | )% | 0 | % | |||||||||||||||||||
| $10.79 | 8.04 | % | $1,644 | 1.93 | % | 1.90 | % | 4.03 | %8 | (1.92 | )% | 0 | % | |||||||||||||||||||
| $10.70 | 2.54 | % | $133,722 | 1.55 | % | 1.55 | % | 1.59 | % | (1.45 | )% | 0 | % | |||||||||||||||||||
| $11.23 | 19.94 | % | $45,436 | 1.55 | % | 1.55 | % | 1.68 | %8 | (1.52 | )% | 0 | % | |||||||||||||||||||
| $9.76 | 9.25 | % | $2,284,285 | 2.41 | % | 1.97 | % | 2.41 | % | (1.44 | )% | 208 | % | |||||||||||||||||||
| $9.76 | 7.31 | % | $1,443,799 | 3.65 | % | 1.98 | % | 3.67 | % | (1.46 | )% | 204 | % | |||||||||||||||||||
| $9.78 | 4.46 | % | $1,453,977 | 3.34 | % | 1.98 | % | 3.37 | % | (1.67 | )% | 137 | % | |||||||||||||||||||
| $9.90 | 2.36 | % | $808,262 | 3.52 | % | 1.98 | % | 3.60 | % | (1.73 | )% | 208 | % | |||||||||||||||||||
| $9.70 | (2.57 | )%11 | $257,168 | 2.23 | % | 1.98 | % | 2.59 | % | (1.09 | )% | 133 | % | |||||||||||||||||||
| $9.74 | 9.02 | % | $103,504 | 2.67 | % | 2.23 | % | 2.68 | % | (1.66 | )% | 208 | % | |||||||||||||||||||
| $9.74 | 7.03 | % | $84,480 | 3.91 | % | 2.23 | % | 3.96 | % | (1.75 | )% | 204 | % | |||||||||||||||||||
| $9.76 | 4.16 | % | $74,641 | 3.59 | % | 2.23 | % | 3.66 | % | (1.95 | )% | 137 | % | |||||||||||||||||||
| $9.89 | 2.22 | % | $43,104 | 3.76 | % | 2.23 | % | 3.93 | % | (2.32 | )% | 208 | % | |||||||||||||||||||
| $9.69 | (2.73 | )%11 | $44,676 | 2.48 | % | 2.23 | % | 2.85 | % | (1.37 | )% | 133 | % | |||||||||||||||||||
| $9.76 | 9.44 | % | $100,959 | 2.32 | % | 1.88 | % | 2.33 | % | (1.29 | )% | 208 | % | |||||||||||||||||||
| $9.75 | 6.19 | % | $35,228 | 3.14 | % | 1.88 | % | 3.21 | % | (3.41 | )% | 204 | % | |||||||||||||||||||
| The accompanying notes are an integral part of these financial statements. |
| AQR Funds | Annual Report | December 2015 | ||||||||||||||
343
Table of Contents
| Financial Highlights | December 31, 2015 |
| PER SHARE OPERATING PERFORMANCE | ||||||||||||||||||||||||||||
| Change in Net Assets Resulting from Operations1 | Less Dividends and Distributions | |||||||||||||||||||||||||||
Net Asset Value, Beginning of Period | Net Investment Income (Loss) | Net Realized and Unrealized Gain (Loss) | Net Increase (Decrease) in Net Asset Value from Operations | Distributions from Net Investment Income | Distributions from Net Realized Gains | Total Distributions | ||||||||||||||||||||||
| AQR RISK-BALANCED COMMODITIES STRATEGY FUND CLASS I | ||||||||||||||||||||||||||||
| FOR THE YEAR ENDED DECEMBER 31, 2015 | $6.98 | (0.05 | ) | (1.31 | ) | (1.36 | ) | — | — | — | ||||||||||||||||||
| FOR THE YEAR ENDED DECEMBER 31, 2014 | $8.29 | (0.08 | ) | (1.23 | ) | (1.31 | ) | — | — | — | ||||||||||||||||||
| FOR THE YEAR ENDED DECEMBER 31, 2013 | $9.87 | (0.09 | ) | (1.49 | ) | (1.58 | ) | — | — | — | ||||||||||||||||||
| FOR THE PERIOD 7/09/129—12/31/12 | $10.00 | (0.05 | ) | (0.08 | ) | (0.13 | ) | — | — | — | ||||||||||||||||||
| AQR RISK-BALANCED COMMODITIES STRATEGY FUND CLASS N | ||||||||||||||||||||||||||||
| FOR THE YEAR ENDED DECEMBER 31, 2015 | $6.94 | (0.08 | ) | (1.29 | ) | (1.37 | ) | — | — | — | ||||||||||||||||||
| FOR THE YEAR ENDED DECEMBER 31, 2014 | $8.27 | (0.11 | ) | (1.22 | ) | (1.33 | ) | — | — | — | ||||||||||||||||||
| FOR THE YEAR ENDED DECEMBER 31, 2013 | $9.86 | (0.11 | ) | (1.48 | ) | (1.59 | ) | — | — | — | ||||||||||||||||||
| FOR THE PERIOD 7/09/129—12/31/12 | $10.00 | (0.06 | ) | (0.08 | ) | (0.14 | ) | — | — | — | ||||||||||||||||||
| AQR RISK-BALANCED COMMODITIES STRATEGY FUND CLASS R6 | ||||||||||||||||||||||||||||
| FOR THE YEAR ENDED DECEMBER 31, 2015 | $6.99 | (0.05 | ) | (1.31 | ) | (1.36 | ) | — | — | — | ||||||||||||||||||
| FOR THE PERIOD 9/02/147—12/31/14 | $8.60 | (0.02 | ) | (1.59 | ) | (1.61 | ) | — | — | — | ||||||||||||||||||
| AQR RISK PARITY FUND CLASS I | ||||||||||||||||||||||||||||
| FOR THE YEAR ENDED DECEMBER 31, 2015 | $10.14 | (0.07 | ) | (0.75 | ) | (0.82 | ) | — | (0.23 | ) | (0.23 | ) | ||||||||||||||||
| FOR THE YEAR ENDED DECEMBER 31, 2014 | $10.77 | (0.04 | ) | 0.81 | 0.77 | (0.30 | ) | (1.10 | ) | (1.40 | ) | |||||||||||||||||
| FOR THE YEAR ENDED DECEMBER 31, 2013 | $11.49 | (0.07 | ) | 0.08 | 12 | 0.01 | (0.27 | ) | (0.46 | ) | (0.73 | ) | ||||||||||||||||
| FOR THE YEAR ENDED DECEMBER 31, 2012 | $10.62 | — | 1.49 | 1.49 | (0.14 | ) | (0.48 | ) | (0.62 | ) | ||||||||||||||||||
| FOR THE YEAR ENDED DECEMBER 31, 2011† | $10.28 | 0.04 | 0.51 | 0.55 | (0.21 | ) | (0.00 | )10 | (0.21 | ) | ||||||||||||||||||
| AQR RISK PARITY FUND CLASS N | ||||||||||||||||||||||||||||
| FOR THE YEAR ENDED DECEMBER 31, 2015 | $10.14 | (0.10 | ) | (0.73 | ) | (0.83 | ) | — | (0.23 | ) | (0.23 | ) | ||||||||||||||||
| FOR THE YEAR ENDED DECEMBER 31, 2014 | $10.76 | (0.07 | ) | 0.80 | 0.73 | (0.25 | ) | (1.10 | ) | (1.35 | ) | |||||||||||||||||
| FOR THE YEAR ENDED DECEMBER 31, 2013 | $11.47 | (0.11 | ) | 0.08 | 12 | (0.03 | ) | (0.22 | ) | (0.46 | ) | (0.68 | ) | |||||||||||||||
| FOR THE YEAR ENDED DECEMBER 31, 2012 | $10.59 | (0.03 | ) | 1.50 | 1.47 | (0.11 | ) | (0.48 | ) | (0.59 | ) | |||||||||||||||||
| FOR THE YEAR ENDED DECEMBER 31, 2011† | $10.27 | 0.03 | 0.49 | 0.52 | (0.20 | ) | (0.00 | )10 | (0.20 | ) | ||||||||||||||||||
| AQR RISK PARITY FUND CLASS R6 | ||||||||||||||||||||||||||||
| FOR THE YEAR ENDED DECEMBER 31, 2015 | $10.14 | (0.04 | ) | (0.77 | ) | (0.81 | ) | — | (0.23 | ) | (0.23 | ) | ||||||||||||||||
| FOR THE PERIOD 9/02/147—12/31/14 | $12.01 | (0.04 | ) | (0.43 | )12 | (0.47 | ) | (0.30 | ) | (1.10 | ) | (1.40 | ) | |||||||||||||||
| AQR RISK PARITY II HV FUND CLASS I | ||||||||||||||||||||||||||||
| FOR THE YEAR ENDED DECEMBER 31, 2015 | $9.55 | (0.08 | ) | (1.19 | ) | (1.27 | ) | (0.03 | ) | (0.46 | ) | (0.49 | ) | |||||||||||||||
| FOR THE YEAR ENDED DECEMBER 31, 2014 | $9.87 | (0.03 | ) | 0.95 | 0.92 | (0.06 | ) | (1.18 | ) | (1.24 | ) | |||||||||||||||||
| FOR THE YEAR ENDED DECEMBER 31, 2013 | $10.21 | (0.06 | ) | (0.23 | ) | (0.29 | ) | (0.03 | ) | (0.02 | ) | (0.05 | ) | |||||||||||||||
| FOR THE PERIOD 11/05/129—12/31/12 | $10.00 | 0.01 | 0.23 | 0.24 | (0.03 | ) | — | (0.03 | ) | |||||||||||||||||||
| AQR RISK PARITY II HV FUND CLASS N | ||||||||||||||||||||||||||||
| FOR THE YEAR ENDED DECEMBER 31, 2015 | $9.56 | (0.10 | ) | (1.20 | ) | (1.30 | ) | — | (0.46 | ) | (0.46 | ) | ||||||||||||||||
| FOR THE YEAR ENDED DECEMBER 31, 2014 | $9.86 | (0.04 | ) | 0.93 | 0.89 | (0.01 | ) | (1.18 | ) | (1.19 | ) | |||||||||||||||||
| FOR THE YEAR ENDED DECEMBER 31, 2013 | $10.23 | (0.09 | ) | (0.23 | ) | (0.32 | ) | (0.03 | ) | (0.02 | ) | (0.05 | ) | |||||||||||||||
| FOR THE PERIOD 11/05/129—12/31/12 | $10.00 | (0.01 | ) | 0.25 | 0.24 | (0.01 | ) | — | (0.01 | ) | ||||||||||||||||||
| AQR RISK PARITY II HV FUND CLASS R6 | ||||||||||||||||||||||||||||
| FOR THE YEAR ENDED DECEMBER 31, 2015 | $9.55 | (0.03 | ) | (1.25 | ) | (1.28 | ) | (0.03 | ) | (0.46 | ) | (0.49 | ) | |||||||||||||||
| FOR THE PERIOD 9/02/147—12/31/14 | $11.37 | (0.05 | ) | (0.53 | )12 | (0.58 | ) | (0.06 | ) | (1.18 | ) | (1.24 | ) | |||||||||||||||
| The accompanying notes are an integral part of these financial statements. |
| AQR Funds | Annual Report | December 2015 | ||||||||||||||
344
Table of Contents
| Financial Highlights | December 31, 2015 |
| RATIOS/SUPPLEMENTAL DATA | ||||||||||||||||||||||||||||||||
| Ratios to Average Net Assets of:* | ||||||||||||||||||||||||||||||||
Net Asset | Total Return2,3 | Net Assets, End of Period | Expenses, Net of Reimbursements and/or Waivers4 | Expenses, Net of Reimbursements and/or Waivers (Excluding Dividend Short Expense & Interest Expense)4 | Expenses, Before Reimbursements and/or Waivers4 | Net Investment Income (Loss) | Portfolio Turnover Rate5 | |||||||||||||||||||||||||
| $5.62 | (19.48 | )% | $71,321 | 0.94 | % | 0.94 | % | 1.14 | % | (0.88 | )% | 0 | % | |||||||||||||||||||
| $6.98 | (15.80 | )% | $46,443 | 1.01 | % | 1.01 | % | 1.34 | % | (1.00 | )% | 0 | % | |||||||||||||||||||
| $8.29 | (16.01 | )% | $28,375 | 1.05 | % | 1.05 | % | 1.32 | % | (1.05 | )% | 0 | % | |||||||||||||||||||
| $9.87 | (1.30 | )% | $63,331 | 1.05 | % | 1.05 | % | 1.72 | % | (1.04 | )% | 0 | % | |||||||||||||||||||
| $5.57 | (19.74 | )% | $2,083 | 1.25 | % | 1.25 | % | 1.48 | % | (1.21 | )% | 0 | % | |||||||||||||||||||
| $6.94 | (16.08 | )% | $4,764 | 1.26 | % | 1.26 | % | 1.59 | % | (1.25 | )% | 0 | % | |||||||||||||||||||
| $8.27 | (16.13 | )% | $3,861 | 1.30 | % | 1.30 | % | 1.70 | % | (1.28 | )% | 0 | % | |||||||||||||||||||
| $9.86 | (1.40 | )% | $2,206 | 1.30 | % | 1.30 | % | 4.00 | % | (1.30 | )% | 0 | % | |||||||||||||||||||
| $5.63 | (19.46 | )% | $29,122 | 0.90 | % | 0.90 | % | 1.11 | % | (0.85 | )% | 0 | % | |||||||||||||||||||
| $6.99 | (18.72 | )% | $15,482 | 0.90 | % | 0.90 | % | 1.31 | % | (0.89 | )% | 0 | % | |||||||||||||||||||
| $9.09 | (8.10 | )% | $492,977 | 0.93 | % | 0.93 | % | 0.94 | % | (0.71 | )% | 157 | % | |||||||||||||||||||
| $10.14 | 7.04 | % | $583,927 | 0.90 | % | 0.90 | % | 0.90 | % | (0.34 | )% | 94 | % | |||||||||||||||||||
| $10.77 | 0.12 | % | $855,024 | 0.89 | % | 0.88 | % | 0.89 | % | (0.64 | )% | 167 | % | |||||||||||||||||||
| $11.49 | 14.05 | % | $868,661 | 0.95 | % | 0.95 | % | 0.95 | % | (0.03 | )% | 72 | % | |||||||||||||||||||
| $10.62 | 5.45 | %13 | $337,526 | 0.95 | % | 0.95 | % | 1.06 | % | 0.41 | % | 66 | % | |||||||||||||||||||
| $9.08 | (8.20 | )% | $22,005 | 1.18 | % | 1.18 | % | 1.19 | % | (0.96 | )% | 157 | % | |||||||||||||||||||
| $10.14 | 6.69 | % | $36,232 | 1.20 | % | 1.20 | % | 1.20 | % | (0.65 | )% | 94 | % | |||||||||||||||||||
| $10.76 | (0.23 | )% | $79,026 | 1.20 | % | 1.20 | % | 1.20 | % | (0.92 | )% | 167 | % | |||||||||||||||||||
| $11.47 | 13.89 | % | $170,953 | 1.20 | % | 1.20 | % | 1.23 | % | (0.26 | )% | 72 | % | |||||||||||||||||||
| $10.59 | 5.12 | %13 | $51,560 | 1.20 | % | 1.20 | % | 1.42 | % | 0.30 | % | 66 | % | |||||||||||||||||||
| $9.10 | (8.00 | )% | $2,796 | 0.85 | % | 0.85 | % | 0.86 | % | (0.37 | )% | 157 | % | |||||||||||||||||||
| $10.14 | (3.96 | )% | $96 | 0.85 | % | 0.85 | % | 0.86 | % | (0.99 | )% | 94 | % | |||||||||||||||||||
| $7.79 | (13.33 | )% | $40,890 | 1.13 | % | 1.08 | % | 1.43 | % | (0.83 | )% | 184 | % | |||||||||||||||||||
| $9.55 | 9.23 | % | $42,279 | 1.20 | % | 1.15 | % | 1.54 | % | (0.28 | )% | 108 | % | |||||||||||||||||||
| $9.87 | (2.83 | )% | $17,577 | 1.23 | % | 1.15 | % | 1.85 | % | (0.62 | )% | 257 | % | |||||||||||||||||||
| $10.21 | 2.44 | % | $16,254 | 1.28 | % | 1.15 | % | 2.26 | % | 0.53 | % | 0 | % | |||||||||||||||||||
| $7.80 | (13.64 | )% | $5,493 | 1.45 | % | 1.40 | % | 1.77 | % | (1.04 | )% | 184 | % | |||||||||||||||||||
| $9.56 | 9.02 | % | $7,834 | 1.45 | % | 1.40 | % | 1.86 | % | (0.37 | )% | 108 | % | |||||||||||||||||||
| $9.86 | (3.12 | )% | $8,652 | 1.48 | % | 1.40 | % | 2.22 | % | (0.84 | )% | 257 | % | |||||||||||||||||||
| $10.23 | 2.38 | % | $5,805 | 1.53 | % | 1.40 | % | 3.44 | % | (0.62 | )% | 0 | % | |||||||||||||||||||
| $7.78 | (13.42 | )% | $2,413 | 1.11 | % | 1.05 | % | 1.43 | % | (0.36 | )% | 184 | % | |||||||||||||||||||
| $9.55 | (5.10 | )% | $95 | 1.10 | % | 1.05 | % | 1.47 | % | (1.49 | )% | 108 | % | |||||||||||||||||||
| The accompanying notes are an integral part of these financial statements. |
| AQR Funds | Annual Report | December 2015 | ||||||||||||||
345
Table of Contents
| Financial Highlights | December 31, 2015 |
| PER SHARE OPERATING PERFORMANCE | ||||||||||||||||||||||||||||
| Change in Net Assets Resulting from Operations1 | Less Dividends and Distributions | |||||||||||||||||||||||||||
Net Asset Value, Beginning of Period | Net Investment Income (Loss) | Net Realized and Unrealized Gain (Loss) | Net Increase (Decrease) in Net Asset Value from Operations | Distributions from Net Investment Income | Distributions from Net Realized Gains | Total Distributions | ||||||||||||||||||||||
| AQR RISK PARITY II MV FUND CLASS I | ||||||||||||||||||||||||||||
| FOR THE YEAR ENDED DECEMBER 31, 2015 | $9.90 | (0.08 | ) | (0.79 | ) | (0.87 | ) | (0.02 | ) | (0.50 | ) | (0.52 | ) | |||||||||||||||
| FOR THE YEAR ENDED DECEMBER 31, 2014 | $10.02 | (0.04 | ) | 0.65 | 0.61 | (0.02 | ) | (0.71 | ) | (0.73 | ) | |||||||||||||||||
| FOR THE YEAR ENDED DECEMBER 31, 2013 | $10.17 | (0.06 | ) | (0.08 | ) | (0.14 | ) | (0.01 | ) | (0.00 | )10 | (0.01 | ) | |||||||||||||||
| FOR THE PERIOD 11/05/129—12/31/12 | $10.00 | — | 0.19 | 0.19 | (0.02 | ) | — | (0.02 | ) | |||||||||||||||||||
| AQR RISK PARITY II MV FUND CLASS N | ||||||||||||||||||||||||||||
| FOR THE YEAR ENDED DECEMBER 31, 2015 | $9.87 | (0.10 | ) | (0.78 | ) | (0.88 | ) | — | (0.50 | ) | (0.50 | ) | ||||||||||||||||
| FOR THE YEAR ENDED DECEMBER 31, 2014 | $9.99 | (0.06 | ) | 0.65 | 0.59 | — | (0.71 | ) | (0.71 | ) | ||||||||||||||||||
| FOR THE YEAR ENDED DECEMBER 31, 2013 | $10.18 | (0.07 | ) | (0.11 | ) | (0.18 | ) | (0.01 | ) | (0.00 | )10 | (0.01 | ) | |||||||||||||||
| FOR THE PERIOD 11/05/129—12/31/12 | $10.00 | — | �� | 0.18 | 0.18 | — | — | — | ||||||||||||||||||||
| AQR RISK PARITY II MV FUND CLASS R6 | ||||||||||||||||||||||||||||
| FOR THE YEAR ENDED DECEMBER 31, 2015 | $9.89 | (0.07 | ) | (0.78 | ) | (0.85 | ) | (0.03 | ) | (0.50 | ) | (0.53 | ) | |||||||||||||||
| FOR THE PERIOD 9/02/147—12/31/14 | $11.00 | (0.04 | ) | (0.33 | )12 | (0.37 | ) | (0.03 | ) | (0.71 | ) | (0.74 | ) | |||||||||||||||
| AQR STYLE PREMIA ALTERNATIVE FUND CLASS I | ||||||||||||||||||||||||||||
| FOR THE YEAR ENDED DECEMBER 31, 2015 | $9.86 | (0.14 | ) | 1.01 | 0.87 | (0.56 | ) | (0.03 | ) | (0.59 | ) | |||||||||||||||||
| FOR THE YEAR ENDED DECEMBER 31, 2014 | $10.18 | (0.10 | ) | 1.24 | 1.14 | (1.16 | ) | (0.30 | ) | (1.46 | ) | |||||||||||||||||
| FOR THE PERIOD 10/30/139—12/31/13 | $10.00 | (0.03 | ) | 0.44 | 0.41 | (0.20 | ) | (0.03 | ) | (0.23 | ) | |||||||||||||||||
| AQR STYLE PREMIA ALTERNATIVE FUND CLASS N | ||||||||||||||||||||||||||||
| FOR THE YEAR ENDED DECEMBER 31, 2015 | $9.87 | (0.17 | ) | 1.02 | 0.85 | (0.55 | ) | (0.03 | ) | (0.58 | ) | |||||||||||||||||
| FOR THE YEAR ENDED DECEMBER 31, 2014 | $10.18 | (0.16 | ) | 1.28 | 1.12 | (1.13 | ) | (0.30 | ) | (1.43 | ) | |||||||||||||||||
| FOR THE PERIOD 10/30/139—12/31/13 | $10.00 | (0.04 | ) | 0.45 | 0.41 | (0.20 | ) | (0.03 | ) | (0.23 | ) | |||||||||||||||||
| AQR STYLE PREMIA ALTERNATIVE FUND CLASS R6 | ||||||||||||||||||||||||||||
| FOR THE YEAR ENDED DECEMBER 31, 2015 | $9.87 | (0.14 | ) | 1.02 | 0.88 | (0.57 | ) | (0.03 | ) | (0.60 | ) | |||||||||||||||||
| FOR THE PERIOD 9/02/147—12/31/14 | $10.35 | (0.07 | ) | 0.86 | 0.79 | (1.16 | ) | (0.11 | ) | (1.27 | ) | |||||||||||||||||
| AQR STYLE PREMIA ALTERNATIVE LV FUND CLASS I | ||||||||||||||||||||||||||||
| FOR THE YEAR ENDED DECEMBER 31, 2015 | $10.18 | (0.08 | ) | 0.49 | 0.41 | (0.17 | ) | (0.03 | ) | (0.20 | ) | |||||||||||||||||
| FOR THE PERIOD 9/17/149—12/31/14 | $10.00 | (0.02 | ) | 0.32 | 0.30 | (0.09 | ) | (0.03 | ) | (0.12 | ) | |||||||||||||||||
| AQR STYLE PREMIA ALTERNATIVE LV FUND CLASS N | ||||||||||||||||||||||||||||
| FOR THE YEAR ENDED DECEMBER 31, 2015 | $10.17 | (0.09 | ) | 0.48 | 0.39 | (0.14 | ) | (0.03 | ) | (0.17 | ) | |||||||||||||||||
| FOR THE PERIOD 9/17/149—12/31/14 | $10.00 | (0.03 | ) | 0.32 | 0.29 | (0.09 | ) | (0.03 | ) | (0.12 | ) | |||||||||||||||||
| AQR STYLE PREMIA ALTERNATIVE LV FUND CLASS R6 | ||||||||||||||||||||||||||||
| FOR THE YEAR ENDED DECEMBER 31, 2015 | $10.17 | (0.05 | ) | 0.48 | 0.43 | (0.17 | ) | (0.03 | ) | (0.20 | ) | |||||||||||||||||
| FOR THE PERIOD 9/17/149—12/31/14 | $10.00 | (0.01 | ) | 0.31 | 0.30 | (0.10 | ) | (0.03 | ) | (0.13 | ) | |||||||||||||||||
| The accompanying notes are an integral part of these financial statements. |
| AQR Funds | Annual Report | December 2015 | ||||||||||||||
346
Table of Contents
| Financial Highlights | December 31, 2015 |
| RATIOS/SUPPLEMENTAL DATA | ||||||||||||||||||||||||||||||||
| Ratios to Average Net Assets of:* | ||||||||||||||||||||||||||||||||
Net Asset | Total Return2,3 | Net Assets, End of Period | Expenses, Net of Reimbursements and/or Waivers4 | Expenses, Net of Reimbursements and/or Waivers (Excluding Dividend Short Expense & Interest Expense)4 | Expenses, Before Reimbursements and/or Waivers4 | Net Investment Income (Loss) | Portfolio Turnover Rate5 | |||||||||||||||||||||||||
| $8.51 | (8.77 | )% | $85,918 | 0.93 | % | 0.93 | % | 1.10 | % | (0.80 | )% | 159 | % | |||||||||||||||||||
| $9.90 | 6.04 | % | $106,473 | 0.95 | % | 0.95 | % | 1.12 | % | (0.34 | )% | 128 | % | |||||||||||||||||||
| $10.02 | (1.32 | )% | $37,848 | 0.95 | % | 0.95 | % | 1.18 | % | (0.61 | )% | 234 | % | |||||||||||||||||||
| $10.17 | 1.87 | % | $29,993 | 0.95 | % | 0.95 | % | 2.07 | % | 0.18 | % | 0 | % | |||||||||||||||||||
| $8.49 | (8.94 | )% | $4,242 | 1.20 | % | 1.20 | % | 1.38 | % | (0.99 | )% | 159 | % | |||||||||||||||||||
| $9.87 | 5.87 | % | $7,795 | 1.20 | % | 1.20 | % | 1.44 | % | (0.54 | )% | 128 | % | |||||||||||||||||||
| $9.99 | (1.71 | )% | $9,397 | 1.20 | % | 1.20 | % | 1.59 | % | (0.71 | )% | 234 | % | |||||||||||||||||||
| $10.18 | 1.80 | % | $2,259 | 1.20 | % | 1.20 | % | 2.81 | % | (0.29 | )% | 0 | % | |||||||||||||||||||
| $8.51 | (8.59 | )% | $99 | 0.85 | % | 0.85 | % | 1.03 | % | (0.68 | )% | 159 | % | |||||||||||||||||||
| $9.89 | (3.44 | )% | $97 | 0.85 | % | 0.85 | % | 1.03 | % | (1.13 | )% | 128 | % | |||||||||||||||||||
| $10.14 | 8.76 | % | $1,341,232 | 2.25 | % | 1.48 | % | 2.29 | % | (1.39 | )% | 138 | % | |||||||||||||||||||
| $9.86 | 11.30 | % | $387,666 | 2.56 | % | 1.50 | % | 2.56 | % | (0.95 | )% | 145 | % | |||||||||||||||||||
| $10.18 | 4.08 | % | $403,243 | 2.07 | % | 1.50 | % | 2.11 | %8 | (1.77 | )% | 133 | % | |||||||||||||||||||
| $10.14 | 8.50 | % | $92,947 | 2.52 | % | 1.75 | % | 2.56 | % | (1.65 | )% | 138 | % | |||||||||||||||||||
| $9.87 | 11.08 | % | $26,594 | 2.81 | % | 1.75 | % | 2.92 | % | (1.50 | )% | 145 | % | |||||||||||||||||||
| $10.18 | 4.05 | % | $15,972 | 2.44 | % | 1.75 | % | 2.70 | %8 | (2.05 | )% | 133 | % | |||||||||||||||||||
| $10.15 | 8.80 | % | $394,568 | 2.17 | % | 1.40 | % | 2.21 | % | (1.37 | )% | 138 | % | |||||||||||||||||||
| $9.87 | 7.67 | % | $74,872 | 2.46 | % | 1.40 | % | 2.57 | % | (1.94 | )% | 145 | % | |||||||||||||||||||
| $10.39 | 4.02 | % | $152,172 | 1.11 | % | 0.79 | % | 1.46 | % | (0.80 | )% | 213 | % | |||||||||||||||||||
| $10.18 | 3.07 | % | $28,094 | 1.01 | % | 0.85 | % | 1.49 | %8 | (0.68 | )% | 191 | % | |||||||||||||||||||
| $10.39 | 3.85 | % | $13,444 | 1.41 | % | 1.09 | % | 1.90 | % | (0.91 | )% | 213 | % | |||||||||||||||||||
| $10.17 | 2.94 | % | $8,577 | 1.32 | % | 1.10 | % | 1.92 | %8 | (0.91 | )% | 191 | % | |||||||||||||||||||
| $10.40 | 4.23 | % | $22,176 | 1.08 | % | 0.75 | % | 1.57 | % | (0.50 | )% | 213 | % | |||||||||||||||||||
| $10.17 | 2.98 | % | $23,695 | 1.00 | % | 0.75 | % | 1.75 | %8 | (0.32 | )% | 191 | % | |||||||||||||||||||
| The accompanying notes are an integral part of these financial statements. |
| AQR Funds | Annual Report | December 2015 | ||||||||||||||
347
Table of Contents
| Financial Highlights | December 31, 2015 |
| * | Annualized for periods less than one year. |
| † | Redemption fees of less than $0.005 per share were incurred by the share class. |
| 1 | Per share net investment income (loss) and net realized and unrealized gain (loss) are based on average shares outstanding. |
| 2 | Total investment return is calculated assuming an initial investment made at the net asset value at the beginning of the period, reinvestment of all dividends and distributions at net asset value during the period and redemption on the last day of the period and is not annualized. |
| 3 | Includes adjustments in accordance with accounting principles generally accepted in the United States of America and as such, the net asset value for financial reporting purposes and the returns based upon those net asset values may differ from the net asset value and returns for shareholder transactions. |
| 4 | Ratios do not include the impact of the expenses of the underlying funds in which the Fund invests. |
| 5 | Portfolio turnover is not annualized. |
| 6 | For the period ended December 31, 2012 certain Funds received special dividends which materially impacted the Net Investment Income Per Share and Net Investment Income Ratio. These dividends are not expected to continue in the future. Had these special dividends not been received the Net Investment Income Per Share and Net Investment Income Ratio would have been as follows: |
| FUND | NET INVESTMENT INCOME PER SHARE | NET INVESTMENT INCOME RATIO | ||||||
AQR Diversified Arbitrage Fund—Class I | $0.08 | 0.73 | % | |||||
AQR Diversified Arbitrage Fund—Class N | 0.04 | 0.42 | ||||||
| 7 | Commencement of offering of shares. |
| 8 | Certain expenses incurred by the Fund were not annualized for the period. |
| 9 | Commencement of operations. |
| 10 | Amount is less than $.005 per share. |
| 11 | For the year ended December 31, 2011, the Adviser contributed $208,438 into the Fund to compensate the Fund for a loss incurred due to a trade processing error. The impact of the Adviser’s contribution increased the Fund’s total return by 0.14%. |
| 12 | The amount shown for a share outstanding throughout the period is not indicative of the aggregate net realized and unrealized gain (loss) for that period because of the timing of sales and repurchases of the Fund shares in relation to fluctuating market value of the investments in the Fund. |
| 13 | For the year ended December 31, 2011, a service provider contributed $354,026 into the Fund to compensate the Fund for a loss incurred due to a valuation error. The impact of this contribution increased the Fund’s total return by 0.21%. |
| The accompanying notes are an integral part of these financial statements. |
| AQR Funds | Annual Report | December 2015 | ||||||||||||||
348
Table of Contents
| Notes to Financial Statements | December 31, 2015 |
1. Organization
AQR Funds (the “Trust”), was organized as a Delaware statutory trust on September 4, 2008. The Trust is an open-end management investment company, registered under the Investment Company Act of 1940, as amended (the “1940 Act”). As of December 31, 2015, the Trust consists of thirty-three active series, thirteen of which are presented in this book (collectively, the “Funds“ and each individually a “Fund”): AQR Diversified Arbitrage Fund, AQR Equity Market Neutral Fund, AQR Global Macro Fund, AQR Long-Short Equity Fund, AQR Managed Futures Strategy Fund, AQR Managed Futures Strategy HV Fund, AQR Multi-Strategy Alternative Fund, AQR Risk-Balanced Commodities Strategy Fund, AQR Risk Parity Fund, AQR Risk Parity II HV Fund, AQR Risk Parity II MV Fund, AQR Style Premia Alternative Fund and AQR Style Premia Alternative LV Fund. The remaining active series, which have a fiscal year-end of September 30th, are reported in a separate book. AQR Capital Management, LLC (the “Adviser”) serves as the investment adviser of each Fund. The Adviser has retained CNH Partners, LLC (the “Sub-Adviser”), an affiliate of the Adviser, to serve as an investment sub-adviser to the AQR Diversified Arbitrage Fund and certain strategies of the AQR Multi-Strategy Alternative Fund.
The investment objective of the AQR Diversified Arbitrage Fund, the AQR Equity Market Neutral Fund, the AQR Global Macro Fund, the AQR Managed Futures Strategy Fund, the AQR Managed Futures Strategy HV Fund, the AQR Multi-Strategy Alternative Fund, the AQR Style Premia Alternative Fund and the AQR Style Premia Alternative LV Fund is to seek positive absolute returns. The investment objective of the AQR Risk-Balanced Commodities Strategy Fund, the AQR Risk Parity Fund, the AQR Risk Parity II HV Fund and the AQR Risk Parity II MV Fund is to seek total return. The investment objective of the AQR Long-Short Equity Fund is to seek capital appreciation. Each of these funds offer Class I, Class N, and Class R6 shares.
On January 22, 2016 the Board of Trustees approved the closure of the AQR Style Premia Alternative Fund and AQR Style Premia Alternative LV Fund to new investors, effective March 31, 2016, subject to certain exceptions.
2. Consolidation of Subsidiaries
The consolidated Schedules of Investments, Statements of Assets and Liabilities, of Operations, of Changes in Net Assets, of Cash Flows, where applicable, and the Financial Highlights of the AQR Global Macro Fund, AQR Managed Futures Strategy Fund, AQR Managed Futures Strategy HV Fund, AQR Multi-Strategy Alternative Fund, AQR Risk-Balanced Commodities Strategy Fund, AQR Risk Parity Fund, AQR Risk Parity II HV Fund, AQR Risk Parity II MV Fund, AQR Style Premia Alternative Fund and AQR Style Premia Alternative LV Fund (“Consolidated Funds”) include the accounts of AQR Global Macro Offshore Fund Ltd., AQR Managed Futures Strategy Offshore Fund Ltd., AQR Managed Futures Strategy HV Offshore Fund Ltd., AQR Multi-Strategy Alternative Offshore Fund Ltd., AQR Risk-Balanced Commodities Strategy Offshore Fund Ltd., AQR Risk Parity Offshore Fund Ltd., AQR Risk Parity II HV Offshore Fund Ltd., AQR Risk Parity II MV Offshore Fund Ltd., AQR Style Premia Alternative Offshore Fund Ltd., and AQR Style Premia Alternative LV Offshore Fund Ltd., respectively, wholly-owned and controlled subsidiaries (the “Subsidiaries”). All intercompany accounts and transactions have been eliminated in consolidation. Subsequent references to the Funds within the Notes to the Consolidated Financial Statements collectively refer to the Consolidated Funds and their Subsidiaries.
Each consolidated Fund may each invest up to 25% of their total assets in its respective Subsidiary, each of which acts as an investment vehicle in order to affect certain investment strategies consistent with the Funds’ investment objectives and policies. The Funds expect that they will achieve a significant portion of their exposure to commodities and commodities-related investments through investment in the Subsidiaries. Unlike the Funds, the Subsidiaries may invest without limitation in commodities and commodities-related investments.
| INCEPTION DATE OF SUBSIDIARY | SUBSIDIARY NET ASSETS AT DECEMBER 31, 2015 | % OF TOTAL NET ASSETS AT DECEMBER 31, 2015 | NET REALIZED GAIN(LOSS) ON INVESTMENTS HELD IN SUBSIDIARY | |||||||||||
AQR Global Macro Offshore Fund Ltd. | April 8, 2014 | $ | 12,210,047 | 23.3 | % | $ | 2,669,504 | |||||||
AQR Managed Futures Strategy Offshore Fund Ltd. | January 5, 2010 | 2,175,788,011 | 22.6 | % | 530,026,473 | |||||||||
AQR Managed Futures Strategy HV Offshore Fund Ltd. | July 16, 2013 | 120,287,443 | 22.7 | % | 31,626,156 | |||||||||
AQR Multi-Strategy Alternative Offshore Fund Ltd. | July 18, 2011 | 384,521,988 | 15.5 | % | 27,493,196 | |||||||||
AQR Risk-Balanced Commodities Strategy Offshore Fund Ltd. | July 9, 2012 | 22,716,221 | 22.2 | % | (20,791,502 | ) | ||||||||
AQR Risk Parity Offshore Fund Ltd. | September 29, 2010 | 105,801,550 | 20.4 | % | (39,564,550 | ) | ||||||||
AQR Risk Parity II HV Offshore Fund Ltd. | November 5, 2012 | 11,295,646 | 23.1 | % | (6,651,656 | ) | ||||||||
AQR Risk Parity II MV Offshore Fund Ltd. | November 5, 2012 | 13,320,475 | 14.8 | % | (7,803,962 | ) | ||||||||
AQR Style Premia Alternative Offshore Fund Ltd. | October 30, 2013 | 412,330,607 | 22.5 | % | 25,001,108 | |||||||||
AQR Style Premia Alternative LV Offshore Fund Ltd. | September 17, 2014 | 42,221,963 | 22.5 | % | 482,826 | |||||||||
| AQR Funds | Annual Report | December 2015 | ||||||||||||||
349
Table of Contents
| Notes to Financial Statements | December 31, 2015 |
3. Significant Accounting Policies
The following is a summary of significant accounting policies followed by the Funds in the preparation of their financial statements. The Funds are investment companies and apply specialized accounting and reporting guidance in conformity with accounting principles generally accepted in the United States of America (“GAAP”).
Use of Estimates: The preparation of the financial statements in conformity with GAAP requires the Adviser to make estimates and assumptions that affect the fair value of investments, the reported amounts of assets and liabilities and disclosure of contingent assets and liabilities, if any, at the date of the financial statements and the reported amounts of increases and decreases in net assets from operations during the reporting period. Actual results could differ from those estimates and such differences could be material.
Valuation of Investments: All securities and other investments are recorded at their estimated fair value, as described in Note 5.
Cash: Cash comprises U.S. Dollar and foreign currency deposits held at a bank(s) or custodian bank(s) which may exceed insured limits. The Funds are subject to risk to the extent that the institutions may be unable to fulfill their obligations.
Due to/from Brokers: Due to/from brokers represents cash balances on deposit with, or cash balances owed to, the Funds’ prime brokers and counterparties. The Funds are subject to credit risk should the prime brokers and counterparties be unable to meet their obligations to the Funds.
Foreign Currency Translation: The books and records of the Funds are maintained in U.S. Dollars. The Funds’ assets and liabilities in foreign currencies are translated into U.S. Dollars at the prevailing exchange rate at the valuation date. Transactions denominated in foreign currencies are translated into U.S. Dollars at the prevailing exchange rate on the date of the transaction. The Funds’ income earned and expense incurred in foreign denominated currencies are translated into U.S. Dollars at the prevailing exchange rate on the date of such activity.
The Funds do not isolate that portion of the results of operations arising from changes in the foreign exchange rates on investments and derivatives from the fluctuations that result from changes in the market prices of investments and derivatives held or sold during the period. Accordingly, such foreign currency gains (losses) are included in the reported net realized gain (loss) on investments in securities and derivatives and net change in unrealized appreciation (depreciation) on investment securities and derivatives on the Statements of Operations.
Realized gains (losses) on foreign currency and foreign currency transactions reported on the Statements of Operations arise from the disposition of foreign currency and a change between the amounts of dividends, interest and foreign withholding taxes recorded on the Funds’ books on the transaction date and the U.S. Dollar equivalent of the amounts actually received or paid. Changes in unrealized appreciation (depreciation) on foreign currency and foreign currency translation reported on the Statements of Operations arise from changes (due to the changes in the exchange rate) in the value of foreign currency and assets and liabilities (other than investments) denominated in foreign currencies, which are held at period end.
Investment Transactions and Related Income: Investment transactions are accounted for on trade date (the date the order to buy or sell is executed). Securities gains and losses are calculated on a specifically identified cost basis. Interest income is determined on the basis of coupon interest accrued using the effective interest method adjusted for amortization of premiums and accretion of discounts using the effective yield method. Dividend income (expense) net of foreign taxes withheld, if any, is recorded on the ex-dividend date or when the Fund first learns of the ex-date dividend notification. Interest purchased and interest sold on bonds is included in interest receivable and interest payable, respectively, in the Statements of Assets and Liabilities. For inflation-linked bonds, interest income (expense) is earned on the principal amount and adjusted for the changes in the relevant consumer price index.
Multi-class Operations: Each class of shares offered by the Trust has equal rights as to earnings, assets and voting privileges, except that each class may bear different sub-transfer agency and distribution fees and shareholders of a class have exclusive voting rights regarding any matter relating solely to that class of shares. Income, non-class specific expenses, realized and unrealized gains and losses are allocated daily to each class of shares based upon the proportion of relative net assets at the beginning of each day. Each Fund is charged for those expenses that are directly attributable to each Fund. Trust level expenses are allocated among the Funds based on the ratio of average net assets or other reasonable methodology.
The Funds record distributions received in excess of income from underlying investments as a reduction of cost of investments and/or realized gain. Such amounts are based on estimates (if actual amounts are not available) and actual amounts of income, realized gain and return of capital may differ from the estimated amounts. The Funds adjust the estimated amounts of components of distributions (and consequently net investment income) as necessary once the issuers provide information about the actual composition of the distributions.
The Funds may be subject to foreign taxes on income, capital gains on investments or currency repatriation, a portion of which may be recoverable. The Funds will accrue such taxes and recoveries as applicable, based upon their current interpretation of tax rules and regulations that exist in the markets in which they invest.
| AQR Funds | Annual Report | December 2015 | ||||||||||||||
350
Table of Contents
| Notes to Financial Statements | December 31, 2015 |
Offering Cost: Offering costs, including professional fees, printing fees and initial registration, are amortized over a period not longer than twelve months from the date the Funds commenced operations.
Federal Income Taxes: Each Fund is treated as a separate taxable entity for federal income tax purposes. Each Fund intends to qualify as a “regulated investment company” under Subchapter M of the Internal Revenue Code of 1986, as amended (the “Code”). If so qualified, each Fund will not be subject to federal income tax to the extent it distributes substantially all of its net investment income and capital gains to shareholders. Accordingly no provision for Federal income tax is necessary.
The Adviser evaluates tax positions taken or expected to be taken in the course of preparing the Funds’ tax returns to determine whether the tax positions are “more-likely-than-not” of being sustained by the applicable tax authority. Tax positions deemed to meet the more-likely-than-not threshold would be recorded as a tax benefit or expense in the current year. The Funds are required to analyze all open tax years. Open tax years are those years that are open for examination by the relevant income taxing authority. The Funds have concluded that there is no tax liability/benefit resulting from uncertain income tax positions taken or expected to be taken. The Funds are not aware of any tax positions for which it is reasonably possible that the total amounts of unrecognized tax expense will materially change in the next twelve months. The returns of the Funds for the prior three fiscal years as well as current year, or since inception if shorter, are open for examination. As of December 31, 2015, the Funds had no examinations in progress.
For Federal tax purposes, taxable income for each Consolidated Fund and its Subsidiary are calculated separately. The Subsidiaries are classified as controlled foreign corporations (“CFCs”) under the Internal Revenue Code of 1986 (“the Code”) and each CFCs taxable income is included in the calculation of the relevant Consolidated Fund’s taxable income. Net losses of the Subsidiaries are not deductible by the Consolidated Funds either in the current period or future periods. Each of the CFCs has a fiscal year end of December 31st for financial statement consolidation purposes and a nonconforming tax year end of November 30th.
Distributions to Shareholders: Distributions to shareholders are recorded on the ex-dividend date. The Funds intend to declare and distribute substantially all of their net investment income and net realized capital gains, if any, at least annually. Income and capital gain distributions will be determined in accordance with federal income tax regulations which may differ from GAAP. Differences may be permanent or temporary. Permanent differences are reclassified among capital accounts in the financial statements to reflect their tax character. Temporary differences arise when certain items of income, expense, gain, or loss are recognized in different periods for financial statement and tax purposes. These differences will reverse at some time in the future. Differences in classification may also result from the treatment of short-term gains as ordinary income for tax purposes. As a result, income dividends and capital gain distributions declared during a fiscal period may differ significantly from the net investment income (loss) and realized gains (losses) reported on the Funds’ financial statements presented under GAAP.
Distributions classified as a tax basis return of capital, if any, are reflected on the accompanying Statements of Changes in Net Assets and have been recorded to paid in capital. In addition, other amounts have been reclassified between undistributed net investment income, accumulated undistributed/overdistributed net realized gains or losses and/or paid in capital to more appropriately conform financial accounting to tax characterizations of dividend distributions.
Indemnification: In the normal course of business, the Funds may enter into various agreements that provide for general indemnifications. The Funds’ maximum exposure under these arrangements is unknown as any potential exposure involves future claims that may be made against the Funds. However, based on experience, the Funds expect the risk of loss to be remote.
4. Securities and Other Investments
Convertible Securities: Certain Funds invest in preferred stocks and fixed-income securities which are convertible into common stock. Convertible securities may be converted either at a stated price or rate within a specified period of time into a specified number of shares of common stock. By investing in a convertible security, the Funds may participate in any capital appreciation or depreciation of a company’s stock, but to a lesser degree than if they had invested in that company’s common stock. Convertible securities rank senior to common stock in a corporation’s capital structure and, therefore, entail less risk than the corporation’s common stock. The Funds may attempt to hedge some of their investments in convertible debt securities by selling short the issuer’s common stock. The premiums attributable to the conversion feature are not amortized.
High Yield Securities: Certain Funds invest in lower-quality debt securities. Investments in lower-rated securities or unrated securities of comparable quality tend to be more sensitive to economic conditions than higher rated securities causing greater price volatility. These instruments involve a greater risk of loss due to default by the issuer because such securities are generally unsecured and are often subordinated to other creditors’ claims.
Inflation-Indexed Bonds: Certain Funds may invest in Inflation-indexed bonds which are adjusted for inflation through periodic increases or decreases in the security’s interest accruals, face amount, or principal redemption value, by amounts corresponding to the rate of inflation as measured by an index.
| AQR Funds | Annual Report | December 2015 | ||||||||||||||
351
Table of Contents
| Notes to Financial Statements | December 31, 2015 |
Loan Participations, Assignments and Unfunded Commitments: Certain Funds invest in loan participations and assignments. When one of the Funds purchases a loan participation, the Fund typically enters into a contractual relationship with the lender or a third party selling such participations (“Selling Participant”), but not the borrower. In this case, the Fund assumes the credit risk of the borrower and the Selling Participant and any other persons inter-positioned between the Fund and the borrower (“Intermediate Participants”). In contrast, when one of the Funds purchases an assignment, the contractual relationship is with the borrower and the credit risk assumed by the Fund is only with the borrower. Although certain loan participations or assignments are secured by collateral, the Fund could experience delays or limitations in realizing on such collateral or have its interest subordinated to other indebtedness of the obligor.
The Funds may also enter into unfunded loan commitments, which are contractual obligations for future funding. These unfunded commitments represent a future obligation in full, even though a percentage of the loan may not be utilized by the borrower. These types of investments may include standby financing commitments, such as revolving credit facilities, which obligate the Fund to supply additional cash to the borrower on demand. The value of the unfunded portion of the investment is determined using a pro-rata allocation, based on its par value relative to the par value of the entire investment. The unfunded loan commitments are marked to market daily and any unrealized appreciation (depreciation) from unfunded commitments is reported in the Statements of Assets and Liabilities as well as the Statements of Operations. When investing in a loan participation, the Fund has the right to receive payments of principal, interest and any fees to which it is entitled only from the lender selling the loan agreement and only upon receipt of payments by the lender from the borrower. The Fund may receive a commitment fee based on the undrawn portion of the underlying line of credit portion of a loan. In certain circumstances, the Fund may receive a penalty fee upon the prepayment of a loan by a borrower. Fees earned or paid are recorded as a component of interest income or interest expense, respectively, on the Statements of Operations. In addition, loan participations and assignments are vulnerable to market conditions such that economic conditions or other events may reduce the demand for loan participations and assignments and certain loan participations and assignments which were liquid, when purchased, may become illiquid. There were no unfunded commitments as of December 31, 2015.
Defaulted Securities and Distressed Investments: Certain Funds held defaulted securities or other securities which were placed in non-accrual status as the collection of a portion or all of the interest has been deemed to be uncollectible. The securities have been identified on the Schedules of Investments. Debt obligations may be placed on non-accrual status and related interest income may be reduced by ceasing current accruals and writing off interest receivable when the collection of a portion of interest has become doubtful based on consistently applied procedures. A debt obligation is removed from non-accrual status when the issuer resumes interest payments or when collectability of interest is probable. The Fund may invest in distressed investments, which are issued by companies that are, or might be, involved in reorganizations or financial restructurings, either out of court or in bankruptcy.
Securities Sold Short: Certain Funds sell securities they do not own as a hedge against some of their long positions and/or in anticipation of a decline in the market value of that security (short sale). When one of the Funds makes a short sale, it must borrow the security sold short and deliver it to the broker through which it made the short sale. The Fund may have to pay a fee to borrow the particular security and may be obligated to remit any interest or dividends received on such borrowed securities. Dividends declared on short positions are recorded on the ex-date as an expense. A gain, limited to the price at which the Fund sold the security short, or a loss, unlimited in magnitude, will be recognized upon the termination of a short sale if the market price at termination is less than or greater than, respectively, the proceeds originally received. The Fund is also subject to the risk that it may be unable to reacquire a security to terminate a short position except at a price substantially in excess of the last quoted price. The Fund is also subject to risk of loss if the broker were to fail to perform its obligations under the contractual terms. Liabilities for securities sold short are reported at market value on the Statements of Assets and Liabilities and the change in market value is recorded as unrealized gain or loss on the Statements of Operations.
The Funds are required to pledge cash or securities to the broker as collateral for securities sold short. Collateral requirements are calculated daily based on the current market value of the short positions. Cash deposited with the broker for collateral for securities sold short is recorded as an asset on the Statements of Assets and Liabilities and securities segregated as collateral are denoted in the Schedules of Investments. The Funds may receive or pay the net of the following amounts: (i) a portion of the income from the investment of cash collateral; (ii) the broker’s fee on the borrowed securities; and (iii) a financing charge for the difference in the market value of the short position and cash collateral deposited with the broker. This income or fee is calculated daily based upon the market value of each borrowed security and a variable rate that is dependent on the availability of the security.
The net amount of fees incurred are included in the dividend and interest on securities sold short in the Statements of Operations and are as follows:
| FUND | ||||
AQR Diversified Arbitrage Fund | $ | 5,892,981 | ||
AQR Equity Market Neutral Fund | 73,617 | |||
AQR Long-Short Equity Fund | 168,757 | |||
AQR Multi-Strategy Alternative Fund | 1,141,001 | |||
AQR Style Premia Alternative Fund | 1,321,768 | |||
AQR Style Premia Alternative LV Fund | 46,956 | |||
| AQR Funds | Annual Report | December 2015 | ||||||||||||||
352
Table of Contents
| Notes to Financial Statements | December 31, 2015 |
Futures Contracts: Certain Funds invest in futures contracts as part of their primary investment strategy and to equitize its cash flows. Investments in futures may increase or decrease exposure to a particular market. In the event of a bankruptcy or insolvency of a futures commission merchant that holds margin on behalf of the Funds, the Funds may not be entitled to the return of the entire margin owed to the Funds, potentially resulting in a loss. A change in market value of an open futures contract is recorded in the Statements of Operations as change in unrealized appreciation (depreciation) on futures contracts. A realized gain (loss) represents the difference between the value of the contract at the time it was opened and the value at the time it was closed or expired, and is reported in the Statements of Operations. The use of long futures contracts subjects the Funds to risk of loss in excess of the variation margin on the Statements of Assets and Liabilities. The use of short futures contracts subjects the Funds to unlimited risk of loss. Futures contracts outstanding at period end, if any, are listed after each Fund’s Schedule of Investments.
Forward Foreign Currency Exchange Contracts: Certain Funds buy and sell forward foreign currency exchange contracts, which are agreements between two parties to buy and sell currencies at a set price on a future date. These contracts are used to protect against a decline in value relative to the U.S. Dollar of the currencies in which portfolio securities are denominated or quoted (or an increase in the value of a currency in which securities that a Fund intends to buy are denominated, when a Fund holds cash reserves and short term investments), or for other investment purposes. The market value of the contract will fluctuate with changes in currency exchange rates. The contract is marked to market daily and the change in market value is recorded as unrealized appreciation or depreciation. When the contract is closed, the Funds record a realized gain or loss equal to the difference between the value of the contract at the time it was opened and the value at the time it was closed. The Funds could be exposed to risk if the value of the currency changes unfavorably, if the counterparties to the contracts are unable to meet the terms of their contracts or if the Funds are unable to enter into a closing position. Risks may exceed amounts recognized on the Statements of Assets and Liabilities. Non-deliverable forward foreign currency exchange contracts are settled with the counterparty in U.S. Dollars without the delivery of foreign currency. Forward foreign currency exchange contracts outstanding at period end, if any, are listed after each Fund’s Schedule of Investments.
Swap Contracts: Certain Funds engage in various swap transactions to manage risks within their portfolios or as alternatives to direct investments. Swap transactions may be privately negotiated in the over-the-counter (“OTC”) market where payments are settled through direct payments between a Fund and the counterparty. By contrast, certain swap transactions are subject to mandatory central clearing (“centrally cleared swaps”). These swaps are executed through a derivatives clearing member (“DCM”), acting in an agency capacity, and submitted to a central counterparty (“CCP”), in which case all payments are settled with the CCP through the DCM. For credit default and interest rate contracts, an up-front payment received by a Fund is recorded as a liability on the Fund’s Statement of Assets and Liabilities. An up-front payment made by a Fund is recorded as an asset on the Fund’s Statement of Assets and Liabilities. Up-front payments are amortized over the term of the contract. Periodic payments received (paid) by a Fund are recorded as realized gains (losses) on swap contracts in the Statements of Operations.
The Funds’ use of swap contracts create additional risks beyond those that would exist if the Funds invested in the underlying positions directly, including: market risk related to unfavorable changes in interest rates or in the price(s) of the underlying security(ies); credit risk related to the counterparty’s failure to perform under contract terms; and liquidity risk related to the lack of a liquid market for the swap contract, which may limit the ability of the Funds to close out their position(s).
Total Return Swap Contracts: Certain Funds invest in total return swaps to obtain exposure to the underlying referenced instruments, obtain leverage or attain the returns from ownership without actually owning the underlying position. Total return swaps are two-party contracts that generally obligate one party to pay the positive return and the other party to pay the negative return on a specified reference security, security index or index component during the period of the swap. Total return swap contracts are marked to market daily and the change, if any, is recorded as net change in appreciation (depreciation) on swap contracts in the Statements of Operations. Total return swaps normally do not involve the delivery of securities or other underlying assets. If the counterparty to a total return swap contract defaults, a Fund’s risk of loss consists of the net amount of payments the Fund is contractually entitled to receive, if any. The use of long total return swap contracts subject the Funds to risk of loss in excess of the amounts shown on the Statements of Assets and Liabilities. The use of short total return swaps subject the Funds to unlimited loss. Periodic payments received (paid) by the Funds are recorded as realized gains (losses) on swap contracts in the Statements of Operations. Total return swap contracts outstanding at period end, if any, are listed after each Fund’s Schedule of Investments.
Total Return Basket Swaps: Certain Funds may enter into an equity basket swap agreement to obtain exposure to a portfolio of long and short securities. Under the terms of the agreement, the swap is designed to function as a portfolio of direct investments in long and short equity or fixed income positions. The Funds have the ability to trade in and out of long and short positions within the swap and will receive all of the economic benefits and risks equivalent to direct investments in these positions such as: capital appreciation (depreciation), corporate actions, and dividends and interest received and paid, all of which are reflected in the swap value. The swap value also includes interest charges and credits related to the notional values of the long and short positions and cash balances within the swap. These interest charges and credits are based on defined market rates plus or minus a specified spread and are referred to herein as “financing costs”. Positions within the swap are reset periodically, and financing costs are reset monthly. During a reset, any realized gains (losses) on positions, income, proceeds from corporate actions and accrued financing costs may become available for cash settlement between the Funds and the swap counterparty. Cash settlement in and out of the swap may occur at a reset date or any other date, at the discretion of the Funds and the counterparty, over the life of the agreement, and is generally determined based on limits and thresholds established as part of the Master Agreement between the Funds and the counterparty. A change in the market value of a total return basket swap contract is recognized as a change in unrealized appreciation
| AQR Funds | Annual Report | December 2015 | ||||||||||||||
353
Table of Contents
| Notes to Financial Statements | December 31, 2015 |
(depreciation) on swap contracts in the Statements of Operations. Cash settlements between a Fund and the counterparty are recognized as realized gains (losses) on swap contracts in the Statements of Operations. Total return basket swap contracts outstanding at period end, if any, are listed after each Fund’s Schedule of Investments.
Credit Default Swap Contracts: Certain Funds enter into credit default swap contracts to provide a measure of protection against risk of loss following a default, or other credit event in respect of issuers within an underlying index or a single issuer, or to gain credit exposure to an underlying index or issuer. In a credit default contract, the protection buyer typically makes an up-front payment and a periodic stream of payments to a counterparty, the protection seller, in exchange for the right to receive a contingent payment upon the occurrence of a credit event on the reference obligation or all other equally ranked obligations of the reference entity. Credit events are contract specific but may include bankruptcy, failure to pay, restructuring and obligation acceleration. The credit default contracts are marked to market daily and the change, if any, is recorded as an unrealized gain or loss. Variation margin is accounted for as unrealized appreciation or depreciation until the contract is closed, at which time the gains or losses are realized. Upon the occurrence of a credit event, the difference between the par value and market value of the reference obligation, net of any proportional amount of the up-front payment, is recorded as a realized gain or loss on swap contracts in the Statements of Operations.
Implied credit spreads are used to determine the value of credit default swap contracts and reflect the cost of buying/selling protection, which may include up-front payments made to enter into the contract. Therefore, higher spreads indicate a greater likelihood that a seller will be obligated to perform (i.e., make payment) under the swap contract. Implied credit spreads for credit default swaps on credit indexes are linked to the weighted average spread across the underlying reference obligations included in a particular index.
Risks of loss may exceed amounts recognized on the Statements of Assets and Liabilities. A Fund’s maximum risk of loss from counterparty risk, either as the protection seller or as the protection buyer, is the fair value of the contract. This risk may be mitigated by having a master netting arrangement between the specific Fund and the counterparty. The central clearing house acts as the counterparty to each centrally cleared swap transaction, therefore credit risk is limited to the failure of the clearing house. Where a Fund is a seller of protection, the maximum potential amount of future payments the Fund may be required to make is equal to the notional amount of the relevant credit default contract. The Fund’s risk of loss associated with these instruments may exceed their value, as recorded in the Statements of Assets and Liabilities. Credit default contracts outstanding, including their respective notional amounts at period end, if any, are listed after each Fund’s Schedule of Investments.
Interest Rate Swaps: Certain Funds enter into interest rate swaps as part of their investment strategy. Interest rate swaps generally involve agreements to exchange fixed and floating payment obligations, without the exchange of the underlying notional amounts. Interest rate swap agreements are privately negotiated in the OTC market or may be executed in a multilateral or other trade facility platform, such as a registered exchange (centrally cleared swaps). Periodic payments received (paid) by the Funds are recorded as realized gains (losses). Interest rate swaps are marked to market daily and the change is recorded as unrealized gain (loss) on swap contracts in the Statements of Operations. The Funds’ risk of loss associated with these instruments may exceed their value, as recorded in the Statements of Assets and Liabilities. Non-deliverable interest rate swap contracts are settled with the counterparty in U.S. Dollars without the delivery of foreign currency. Centrally cleared interest rate swaps may have forward effective dates. The amortization of the upfront premiums (if applicable) and payments related to these swap contracts begin on the effective date of the contract. Interest rate contracts outstanding, including their respective notional amounts at period end, if any, are listed after each Fund’s Schedule of Investments.
Repurchase Agreements: Certain Funds may enter into repurchase agreements. In a repurchase agreement, a Fund takes possession of an underlying debt obligation (collateral) subject to an obligation of the seller to repurchase, and a Fund to resell, the obligation at an agreed-upon price and time. Under the terms of a master repurchase agreement, the underlying securities for all repurchase agreements are held in safekeeping at the Fund’s custodian or designated sub-custodians under tri-party repurchase agreements. Securities purchased under repurchase agreements are reflected as an asset on the Statements of Assets and Liabilities. Interest earned is recorded as a component of interest income on the Statements of Operations. In periods of increased demand for collateral, a Fund may pay a fee for receipt of collateral, which may result in interest expense to the Fund. Generally, in the event of counterparty default, a Fund has the right to use the collateral to offset losses incurred. If the counterparty should default, a Fund may seek to sell the securities which it holds as collateral. This could involve procedural costs or delays in addition to a loss on the securities if their value should fall below their repurchase price. Repurchase agreements outstanding at period end, if any, including the underlying debt obligation (collateral) assigned to each agreement, are included within each Fund’s Schedule of Investments.
Reverse Repurchase Agreements: Certain Funds may enter into reverse repurchase agreements under the terms of a master repurchase agreement. A Fund sells a security that it holds to a counterparty with a contemporaneous agreement to repurchase the same security at an agreed-upon price and date. Reverse repurchase agreements are reflected as a liability on the Statements of Assets and Liabilities. Interest payments made on reverse repurchase agreements are recorded as a component of interest expense on the Statements of Operations. In periods of increased demand for the security, a Fund may receive a fee for use of the security by the counterparty, which may result in interest income to the Fund. A Fund monitors collateral market value for the reverse repurchase agreement, including accrued interest, throughout the lives of the agreements, and when necessary, delivers or receives cash or securities in order to manage credit exposure and liquidity. If the counterparty defaults or enters insolvency proceeding, realization or return of the collateral to the Fund may be delayed or limited. Reverse repurchase agreements outstanding at period end, if any, including the underlying debt obligation (collateral) assigned to each agreement, are listed after each Fund’s Schedule of Investments.
| AQR Funds | Annual Report | December 2015 | ||||||||||||||
354
Table of Contents
| Notes to Financial Statements | December 31, 2015 |
The collateral held in relation to the repurchase agreements and reverse repurchase agreements was in U.S. Treasury Inflation Protected Securities with a maturity of up to 30 days in the amount of $6,778,074 for AQR Risk Parity II HV Fund.
Options: Certain Funds may write and purchase put and call options. When a Fund writes an option, an amount equal to the premium received by the Fund is reflected as an asset and an equivalent liability. The amount of the liability is subsequently marked to market to reflect the current market value of the option written. When a security is purchased or sold through an exercise of an option, the related premium paid (or received) is added to (or deducted from) the basis of the security acquired or deducted from (or added to) the proceeds of the security sold. When an option expires, a Fund realizes a gain or loss on the option to the extent of the premiums received or paid. When a Fund enters into a closing transaction, the Fund realizes a gain or loss to the extent the cost of the closing transaction exceeds the premiums paid or received. Written uncovered call options subject a Fund to unlimited risk of loss. Written covered call options limit the upside potential of a security above the strike price. Put options written subject a Fund to risk of loss if the value of the security declines below the exercise price minus the put premium. A Fund, as writer of an option, bears the market risk of an unfavorable change in the price of the security underlying the written option. Written and purchased options are non-income producing investments.
Transactions in call and put options written during the period for the AQR Diversified Arbitrage Fund and the AQR Multi-Strategy Alternative Fund were as follows:
| CALL OPTIONS | ||||||||
| AQR DIVERSIFIED ARBITRAGE FUND | NUMBER OF CONTRACTS SUBJECT TO CALL | PREMIUM | ||||||
Options outstanding, December 31, 2014 | (5,716 | ) | $ | (2,340,132 | ) | |||
Options written | (22,405 | ) | (875,288 | ) | ||||
Options terminated | 2,288 | 165,402 | ||||||
Options expired | 16,981 | 455,108 | ||||||
Options exercised | 4,056 | 378,530 | ||||||
| Options outstanding, December 31, 2015 | (4,796 | ) | $ | (2,216,380 | ) | |||
| PUT OPTIONS | ||||||||
| AQR DIVERSIFIED ARBITRAGE FUND | NUMBER OF CONTRACTS SUBJECT TO PUT | PREMIUM | ||||||
Options outstanding, December 31, 2014 | — | $ | — | |||||
Options written | (67 | ) | (172,051 | ) | ||||
Options terminated | — | — | ||||||
Options expired | — | — | ||||||
Options exercised | — | — | ||||||
| Options outstanding, December 31, 2015 | (67 | ) | $ | (172,051 | ) | |||
| CALL OPTIONS | ||||||||
| AQR MULTI-STRATEGY ALTERNATIVE FUND | NUMBER OF CONTRACTS SUBJECT TO CALL | PREMIUM | ||||||
Options outstanding, December 31, 2014 | (829 | ) | $ | (104,437 | ) | |||
Options written | — | — | ||||||
Options terminated | — | — | ||||||
Options expired | — | — | ||||||
Options exercised | 829 | 104,437 | ||||||
| Options outstanding, December 31, 2015 | — | $ | — | |||||
Master Agreements: Certain Funds are parties to master netting arrangements with counterparties (“Master Agreements”). Master Agreements govern the terms of certain like transactions, and reduce the counterparty risk associated with relevant transactions by specifying payment netting mechanisms across multiple transactions and providing standardization that improves legal certainty. Since different types of
| AQR Funds | Annual Report | December 2015 | ||||||||||||||
355
Table of Contents
| Notes to Financial Statements | December 31, 2015 |
transactions have different mechanics and are sometimes traded by different legal entities of a particular counterparty organization, each type of transaction may be covered by a different Master Agreement, resulting in the need for multiple Master Agreements with a counterparty and its affiliates. As the Master Agreements are specific to unique operations of different asset types, they allow the Funds to close out and net their total exposure to a counterparty in the event of a default with respect to all the transactions governed under a single Master Agreement with a counterparty.
Master Repurchase Agreements govern repurchase, or reverse repurchase transactions, relating to government bonds between certain Funds and select counterparties. Master Repurchase Agreements maintain provisions for initiation, income payments, events of default, and maintenance of collateral.
Prime Broker Arrangements may be entered into to facilitate execution and/or clearing of equities, bonds, equity options or short sales of securities between certain Funds and selected counterparties. These arrangements provide financing terms for such transactions and include guidelines surrounding the rights, obligations, and other events, including, but not limited to, margin, execution, and settlement. These agreements maintain provisions for payments, maintenance of collateral, events of default, and termination. Margin and other assets delivered as collateral are typically held by the prime broker and offset any obligations due to the prime broker.
Customer Account Agreements govern cleared derivatives transactions and exchange-traded futures and options transactions. Upon entering into an exchange-traded or centrally cleared derivative contract, the Funds are required to deposit with the relevant clearing organization cash or securities, which is referred to as the initial margin. Securities deposited as initial margin are designated on the Schedules of Investments and cash deposited is recorded as Deposits with brokers for futures contracts on the Statements of Assets and Liabilities. For exchange-traded futures or centrally cleared swaps, initial margin is posted, and daily changes in fair value are recorded as a payable or receivable on the Statement of Assets and Liabilities as Variation margin on derivative instruments. Variation margin is determined separately for exchange-traded futures and centrally cleared swaps and cannot be netted.
International Swaps and Derivatives Association, Inc. Master Agreements and Credit Support Annexes (“ISDA Master Agreements”) govern OTC derivative transactions entered into between certain Funds and a counterparty. ISDA Master Agreements maintain provisions for general obligations, representations, netting of settlement payments, agreements to deliver supporting documents, collateral transfer and events of default or termination. Events of termination include a decline in the Fund’s net assets below a specified threshold over a certain period of time or a decline in the counterparty’s long-term and short-term credit ratings below a specified level. In each case, upon occurrence, the other party may elect to terminate early and cause settlement of all OTC contracts outstanding, including the payment of any losses and costs resulting from such early termination, as reasonably determined by the terminating party. Any decision by a party to elect early termination could be material to the financial statements and impact a Fund’s future derivative activity.
Collateral and margin requirements differ according to the terms of each type of Master Agreement. Collateral is routinely transferred if the total net exposure net of existing collateral already in place governed under the relevant Master Agreement with a counterparty in a given account exceeds a specified threshold. Collateral can be in the form of cash, debt securities issued by the U.S. government and other securities or money market funds as agreed to by the Fund and the applicable counterparty, or as permitted by the clearing house or exchange.
Collateral pledged by a Fund for OTC derivatives pursuant to a Master Agreement is segregated by the Fund’s custodian and identified as an asset in the Statements of Assets and Liabilities either as a component of Investments in securities, at value (securities) or in Due from brokers (cash). Segregation of fund’s collateral in the custodian account helps mitigate counterparty risk.
Collateral posted for the benefit of a Fund pursuant to a Master Agreement is held by a custodian of the Fund. Amounts which can be invested or repledged, are presented in the Fund’s Schedule of Investments. Collateral received is reflected as a liability within Due to brokers in the Statements of Assets and Liabilities.
For financial reporting purposes, the Funds do not offset derivative assets and derivative liabilities subject to master netting agreements on the Statements of Assets and Liabilities.
5. Investment Valuation and Fair Value Measurements
Investment Valuation Policies: The Net Asset Value (“NAV”) of the Funds’ shares are valued as of the close of regular trading on the New York Stock Exchange (“NYSE”) (normally 4:00 p.m. Eastern time) on each day that the NYSE is open (each a “Business Day”). The NAV per share of each class within each Fund is computed by dividing the total current value of the assets of such Fund attributable to a class, less class liabilities, by the total number of shares of that class of the Fund outstanding at the time the computation is made. For purposes of calculating the NAV, portfolio securities and other financial derivative instruments are valued on each Business Day using valuation methods as adopted by the Funds’ Board.
The Board has delegated responsibility for applying approved valuation policies to the Adviser. The Adviser monitors the continual appropriateness of valuation methods applied and determines if adjustments should be made in light of market factor changes and events affecting issuers. The Adviser has established a Valuation Committee (the “VC”) whose function is to monitor the valuation of portfolio securities
| AQR Funds | Annual Report | December 2015 | ||||||||||||||
356
Table of Contents
| Notes to Financial Statements | December 31, 2015 |
and other financial derivative instruments and determine in good faith the fair value of portfolio holdings after consideration of all relevant factors. The Adviser performs a series of activities to provide reasonable assurance of the accuracy of prices including: (i) periodic vendor due diligence meetings, review of methodologies, new developments and processes at vendors, (ii) review of daily comparison of security valuation versus prior day for all securities that exceeded established thresholds, (iii) review of third party model prices against internal model prices, and (iv) review the results of back testing and reports for the Board on the results of fair value determinations.
Where market quotes are readily available, fair market value is generally determined on the basis of official closing prices or the last reported sales prices, or if no sales are reported, based on quotes obtained from pricing services or established market makers. Where market quotations are not readily available, or if an available market quotation is determined not to reflect fair value, securities or financial derivatives are valued at fair value, as determined in good faith by the VC in accordance with the valuation procedures approved by the Funds’ Board. Using fair value to price a security may require subjective determinations about the value of a security that could result in a value that is different from a security’s most recent closing price and from the prices used by other mutual funds to calculate their net assets. It is possible the estimated values may differ significantly from the values which would have been used had a ready market for the investments existed. These differences could be material.
Fair Value Hierarchy: Various inputs are utilized in determining the value of each Fund’s investments. GAAP establishes a hierarchy for inputs used in measuring fair value that maximizes the use of observable inputs and minimizes the use of unobservable inputs by requiring the most observable inputs be used when available. These inputs are summarized in the three broad levels as follows:
Level 1 — Inputs using unadjusted quoted prices in active markets or exchanges for identical assets and liabilities.
Level 2 — Other significant observable inputs, which may include, but are not limited to, quoted prices for similar assets or liabilities in markets that are active, quoted prices for identical or similar assets or liabilities in markets that are not active, inputs other than quoted prices that are observable for the assets or liabilities (such as interest rates, yield curves, volatilities, prepayment speeds, credit risks and default rates) or other market corroborated inputs.
Level 3 — Significant unobservable inputs based on the best information available in the circumstances, to the extent observable inputs are not available, which may include assumptions made by the Board or persons acting at their direction that are used in determining the fair value of investments.
An investment asset’s or liability’s level within the fair value hierarchy is based on the lowest level input, individually or in aggregate, that is significant to fair value measurement. The objective of fair value measurement remains the same even when there is a significant decrease in the volume and level of activity for an asset or liability and regardless of the valuation technique used. The valuation techniques used by the Funds to measure fair value maximize the use of observable inputs and minimize the use of unobservable inputs.
The inputs or methodology used for valuing securities are not necessarily an indication of the risk associated with investing in those securities.
Valuation Techniques: The following inputs and techniques may be used by the Funds to evaluate how to classify each major category of assets and liabilities into the appropriate fair value hierarchy in accordance with GAAP.
Equity securities, including securities sold short, rights, exchange options, warrants, Exchange-Traded Funds (“ETFs”) and closed-end investment companies, are valued at the last quoted sales prices or official closing prices taken from the primary market in which each security trades and are therefore considered Level 1.
An equity for which no sales are reported, as in the case of a security that is traded in the over-the-counter market or a less liquid listed equity, is valued at its last bid price (in the case of short sales, at the ask price) and is therefore considered Level 2. In addition, equities traded outside of the Western Hemisphere are also considered Level 2 because they are fair valued daily based on the application of a fair value factor (unless the Adviser determines that use of another valuation methodology is appropriate). The Funds apply daily fair value factors, furnished by an independent pricing service, to account for the market movement between the close of the foreign market and the close of the NYSE. The pricing service uses statistical analysis and quantitative models to adjust local market prices using factors such as subsequent movement and changes in the prices of indices, American Depository Receipts, futures contracts and exchange rates in other markets in determining fair value as of the time the Funds calculate their net asset value.
Fixed income securities and other investments that trade in markets that are not considered to be active, are valued based on quoted market prices, dealer quotations or alternative pricing sources supported by observable inputs and are also classified within Level 2. These include certain U.S. government and sovereign obligations, most government agency securities, investment-grade corporate bonds, money market funds and less liquid listed equities. Corporate and sovereign bonds and other fixed-income instruments are valued at estimated fair value using the latest bid prices or evaluated quotes furnished by independent pricing services, as well as quotations from counterparties and other market participants. Evaluated quotes are based on a matrix system, which may consider such factors as quoted prices for identical or similar assets, yields, maturities and ratings and are not necessarily reliant on quoted prices. Short-term debt investments of sufficient credit quality maturing in less than 60 days are generally valued at amortized cost, which approximates fair value. These investments are categorized as Level 2 of the fair value hierarchy.
| AQR Funds | Annual Report | December 2015 | ||||||||||||||
357
Table of Contents
| Notes to Financial Statements | December 31, 2015 |
Investments classified within Level 3 have significant unobservable inputs, as they trade infrequently or not at all. Level 3 instruments include illiquid securities. When observable prices are not available for these securities, the Funds may use one or more valuation techniques (e.g., the market approach, the income approach, or the cost approach), including proprietary models for which sufficient and reliable data is available. Within Level 3, the use of the market approach generally consists of using comparable market transactions, while the use of the income approach generally consists of estimated future cash flows discounted to calculate fair value. Discounts may also be applied due to the nature or durations of any restrictions on the disposition of the investment or adjusted as appropriate for credit, market and/or other risk factors.
The inputs used by the Funds in estimating the value of Level 3 investments include the original transaction price, recent transactions in the same or similar instruments, completed or pending third-party transactions in the underlying investment or comparable issuers, subsequent rounds of financing, recapitalizations and other transactions across the capital structure, offerings in the equity or debt capital markets, changes in financial ratios or cash flows, benchmark yield curves, credit spreads, estimated default rates, underlying collateral, and other unique security features. Level 3 investments may also be adjusted to reflect illiquidity and/or non-transferability, with the amount of such discount estimated by the Adviser in the absence of market information. Assumptions used by the Funds due to the lack of observable inputs may significantly impact the fair value of the investment.
Exchange-traded derivatives, such as futures contracts and exchange-traded option contracts, are typically classified within Level 1 or Level 2 of the fair value hierarchy depending on whether or not they are deemed to be actively traded. Futures and option contracts that are listed on national exchanges and are freely transferable are valued at fair value based on their last sales price on the date of determination on the exchange that constitutes the principal market or, if no sales occurred on such date, at the bid price on such exchange at the close of business on such date. Centrally cleared swaps listed or traded on a multilateral trade facility platform, such as a registered exchange, are valued on daily basis using quotations provided by an independent pricing service.
OTC derivatives, including forward contracts and swap contracts, are valued by the Funds on a daily basis using observable inputs, such as quotations provided by an independent pricing service, the counterparty, dealers or brokers, whenever available and considered reliable.
The value of each total return swap contract and total return basket swap contract is derived from a combination of (i) the net value of the underlying positions, which are valued daily using the last sale or closing price on the principal exchange on which the securities are traded; (ii) financing costs; (iii) the value of dividends or accrued interest; (iv) cash balances within the swap; and (v) other factors, as applicable.
The U.S. Dollar value of forward foreign currency exchange contracts is determined using current forward currency exchange rates supplied by an independent pricing service.
Credit default swap contracts and interest rate swap contracts are marked to market daily based on quotations as provided by an independent pricing service. The independent pricing services aggregate valuation information from various market participants to create a single reference value for each credit default swap contract and interest rate swap contract.
Generally, a valuation model is used consistently for similar derivative types and model inputs, including, but not limited to, market prices, yield curves, credit spreads, volatilities and implied correlations which are obtained from outside brokers and/or pricing services when available. In instances where models are used, the value of an OTC derivative depends upon the contractual terms of, and specific risks inherent in, the instrument as well as the availability and reliability of observable inputs. Such inputs include market prices for reference securities, yield curves, credit curves, measures of volatility, prepayment rates and correlations of such inputs. Certain OTC derivatives, such as generic forwards, swaps and options, have inputs which can generally be corroborated by market data and are therefore classified within Level 2. Those OTC derivatives that have less liquidity or for which inputs are unobservable are classified within Level 3. While the valuations of less liquid OTC derivatives may utilize some Level 1 and/or Level 2 inputs, they also include other unobservable inputs which are considered significant to the fair value determination. At each measurement date, the Funds update the Level 1 and Level 2 inputs to reflect observable inputs, though the resulting gains and losses are reflected within Level 3 due to the significance of the unobservable inputs.
The Funds value the repurchase agreements and reverse repurchase agreements they have entered based on the respective contract amounts, which approximate fair value. As such, repurchase agreements are carried at the amount of cash paid plus accrued interest receivable (or interest payable in periods of increased demand for collateral), and reverse repurchase agreements are carried at the amount of cash received plus accrued interest payable (or interest receivable in periods of increased demand for collateral).
| AQR Funds | Annual Report | December 2015 | ||||||||||||||
358
Table of Contents
| Notes to Financial Statements | December 31, 2015 |
Quantitative Information
The following tables represent each Fund’s valuation inputs as presented on the Schedule of Investments.
| AQR DIVERSIFIED ARBITRAGE FUND | LEVEL 1 | LEVEL 2 | LEVEL 3 | TOTALS | ||||||||||||
ASSETS |
| |||||||||||||||
Common Stocks | $ | 183,598,838 | $ | 105,147,397 | $ | 11,396,171 | $ | 300,142,406 | ||||||||
Convertible Preferred Stocks | 104,794,294 | 54,996,014 | 27,393,124 | 187,183,432 | ||||||||||||
Corporate Bonds | — | 11,866,958 | 4,726,199 | 16,593,157 | ||||||||||||
Convertible Bonds | — | 253,227,651 | 574,719 | 253,802,370 | ||||||||||||
Securities In Litigation | — | — | 90,995 | 90,995 | ||||||||||||
Closed End Funds | 103,582,307 | — | — | 103,582,307 | ||||||||||||
Loan Participations | — | 809,397 | 2,224,524 | 3,033,921 | ||||||||||||
Open End Fund | 295,133 | — | — | 295,133 | ||||||||||||
Preferred Stocks | — | 1,708,378 | 817,262 | 2,525,640 | ||||||||||||
Rights | 894,855 | 530,105 | 715,900 | 2,140,860 | ||||||||||||
U.S. Treasury Bill | — | 82,704,332 | — | 82,704,332 | ||||||||||||
Warrants | 10,479,812 | 6,296,975 | 1,573,200 | 18,349,987 | ||||||||||||
Money Market Funds | — | 329,945,407 | — | 329,945,407 | ||||||||||||
Purchased Options | 15,276 | — | — | 15,276 | ||||||||||||
Futures Contracts* | 182,399 | — | — | 182,399 | ||||||||||||
Forward Foreign Currency Exchange Contracts* | — | 1,467,728 | — | 1,467,728 | ||||||||||||
Total Return Basket Swaps Contracts* | — | 4,438,467 | — | 4,438,467 | ||||||||||||
Total Assets | $ | 403,842,914 | $ | 853,138,809 | $ | 49,512,094 | $ | 1,306,493,817 | ||||||||
LIABILITIES | ||||||||||||||||
Common Stocks (Sold Short) | $ | (316,088,820 | ) | $ | (978,044 | ) | $ | (453 | ) | $ | (317,067,317 | ) | ||||
Convertible Bonds (Sold Short) | — | (28,297,234 | ) | — | (28,297,234 | ) | ||||||||||
Exchange-Traded Fund (Sold Short) | (679,769 | ) | — | — | (679,769 | ) | ||||||||||
Written Options (Sold Short)* | (201,436 | ) | — | — | (201,436 | ) | ||||||||||
Futures Contracts* | (379,502 | ) | — | — | (379,502 | ) | ||||||||||
Forward Foreign Currency Exchange Contracts* | — | (364,388 | ) | — | (364,388 | ) | ||||||||||
Credit Default Swap Contracts* | — | (1,247,858 | ) | — | (1,247,858 | ) | ||||||||||
Total Return Basket Swaps Contracts* | — | (3,110,613 | ) | — | (3,110,613 | ) | ||||||||||
Total Liabilities | $ | (317,349,527 | ) | $ | (33,998,137 | ) | $ | (453 | ) | $ | (351,348,117 | ) | ||||
| AQR EQUITY MARKET NEUTRAL FUND | LEVEL 1 | LEVEL 2 | LEVEL 3 | TOTALS | ||||||||||||
ASSETS | ||||||||||||||||
Common Stocks† | $ | 15,372,993 | $ | 60,338,736 | $ | — | $ | 75,711,729 | ||||||||
U.S.Treasury Bill | — | 50,522,368 | — | 50,522,368 | ||||||||||||
Money Market Funds | — | 178,161,947 | — | 178,161,947 | ||||||||||||
Forward Foreign Currency Exchange Contracts* | — | 54,341 | — | 54,341 | ||||||||||||
Total Return Basket Swaps Contracts* | — | 6,076,500 | — | 6,076,500 | ||||||||||||
Total Assets | $ | 15,372,993 | $ | 295,153,892 | $ | — | $ | 310,526,885 | ||||||||
LIABILITIES | ||||||||||||||||
Common Stocks (Sold Short)† | $ | (17,290,825 | ) | $ | (45,127,862 | ) | $ | — | $ | (62,418,687 | ) | |||||
Preferred Stocks (Sold Short)† | — | (1,185,918 | ) | — | (1,185,918 | ) | ||||||||||
Forward Foreign Currency Exchange Contracts* | — | (124,079 | ) | — | (124,079 | ) | ||||||||||
Total Return Basket Swaps Contracts* | — | (376,337 | ) | — | (376,337 | ) | ||||||||||
Total Liabilities | $ | (17,290,825 | ) | $ | (46,814,196 | ) | $ | — | $ | (64,105,021 | ) | |||||
| AQR Funds | Annual Report | December 2015 | ||||||||||||||
359
Table of Contents
| Notes to Financial Statements | December 31, 2015 |
| AQR GLOBAL MACRO FUND | LEVEL 1 | LEVEL 2 | LEVEL 3 | TOTALS | ||||||||||||
ASSETS | ||||||||||||||||
U.S.Treasury Bill | $ | — | $ | 29,876,219 | $ | — | $ | 29,876,219 | ||||||||
Money Market Funds | — | 16,924,871 | — | 16,924,871 | ||||||||||||
Futures Contracts* | 366,082 | — | — | 366,082 | ||||||||||||
Forward Foreign Currency Exchange Contracts* | — | 816,404 | — | 816,404 | ||||||||||||
Interest Rate Swap Contracts* | — | 682,904 | — | 682,904 | ||||||||||||
Total Return Swap Contracts* | — | 124,582 | — | 124,582 | ||||||||||||
Total Assets | $ | 366,082 | $ | 48,424,980 | $ | — | $ | 48,791,062 | ||||||||
LIABILITIES | ||||||||||||||||
Futures Contracts* | $ | (370,618 | ) | $ | — | $ | — | $ | (370,618 | ) | ||||||
Forward Foreign Currency Exchange Contracts* | — | (306,582 | ) | — | (306,582 | ) | ||||||||||
Interest Rate Swap Contracts* | — | (94,031 | ) | — | (94,031 | ) | ||||||||||
Total Return Swap Contracts* | — | (18,100 | ) | — | (18,100 | ) | ||||||||||
Total Liabilities | $ | (370,618 | ) | $ | (418,713 | ) | $ | — | $ | (789,331 | ) | |||||
| AQR LONG-SHORT EQUITY FUND | LEVEL 1 | LEVEL 2 | LEVEL 3 | TOTALS | ||||||||||||
ASSETS | ||||||||||||||||
Common Stocks† | $ | 30,498,265 | $ | 124,355,767 | $ | — | $ | 154,854,032 | ||||||||
U.S.Treasury Bill | — | 165,428,283 | — | 165,428,283 | ||||||||||||
Money Market Funds | — | 312,775,294 | — | 312,775,294 | ||||||||||||
Futures Contracts* | 3,296,263 | — | — | 3,296,263 | ||||||||||||
Forward Foreign Currency Exchange Contracts* | — | 964,654 | — | 964,654 | ||||||||||||
Total Return Basket Swaps Contracts* | — | 5,408,354 | — | 5,408,354 | ||||||||||||
Total Return Swap Contracts* | — | 414,386 | — | 414,386 | ||||||||||||
Total Assets | $ | 33,794,528 | $ | 609,346,738 | $ | — | $ | 643,141,266 | ||||||||
LIABILITIES | ||||||||||||||||
Common Stocks (Sold Short)† | $ | (34,354,984 | ) | $ | (87,118,924 | ) | $ | — | $ | (121,473,908 | ) | |||||
Preferred Stocks (Sold Short)† | — | (1,757,728 | ) | — | (1,757,728 | ) | ||||||||||
Forward Foreign Currency Exchange Contracts* | — | (699,605 | ) | — | (699,605 | ) | ||||||||||
Total Return Basket Swaps Contracts* | — | (5,455,052 | ) | — | (5,455,052 | ) | ||||||||||
Total Liabilities | $ | (34,354,984 | ) | $ | (95,031,309 | ) | $ | — | $ | (129,386,293 | ) | |||||
| AQR MANAGED FUTURES STRATEGY FUND | LEVEL 1 | LEVEL 2 | LEVEL 3 | TOTALS | ||||||||||||
ASSETS | ||||||||||||||||
U.S. Treasury Bill | $ | — | $ | 8,021,262,203 | $ | — | $ | 8,021,262,203 | ||||||||
Money Market Funds | — | 1,412,495,198 | — | 1,412,495,198 | ||||||||||||
Futures Contracts* | 47,402,114 | — | — | 47,402,114 | ||||||||||||
Forward Foreign Currency Exchange Contracts* | — | 154,800,955 | — | 154,800,955 | ||||||||||||
Total Return Swap Contracts* | — | 19,080,592 | — | 19,080,592 | ||||||||||||
Total Assets | $ | 47,402,114 | $ | 9,607,638,948 | $ | — | $ | 9,655,041,062 | ||||||||
LIABILITIES | ||||||||||||||||
Futures Contracts* | $ | (50,976,303 | ) | $ | — | $ | — | $ | (50,976,303 | ) | ||||||
Forward Foreign Currency Exchange Contracts* | — | (196,445,264 | ) | — | (196,445,264 | ) | ||||||||||
Total Return Swap Contracts* | — | (9,008,678 | ) | — | (9,008,678 | ) | ||||||||||
Total Liabilities | $ | (50,976,303 | ) | $ | (205,453,942 | ) | $ | — | $ | (256,430,245 | ) | |||||
| AQR Funds | Annual Report | December 2015 | ||||||||||||||
360
Table of Contents
| Notes to Financial Statements | December 31, 2015 |
| AQR MANAGED FUTURES STRATEGY HV FUND | LEVEL 1 | LEVEL 2 | LEVEL 3 | TOTALS | ||||||||||||
ASSETS | ||||||||||||||||
U.S.Treasury Bill | $ | — | $ | 390,109,789 | $ | — | $ | 390,109,789 | ||||||||
Money Market Funds | — | 108,289,490 | — | 108,289,490 | ||||||||||||
Futures Contracts* | 3,812,342 | — | — | 3,812,342 | ||||||||||||
Forward Foreign Currency Exchange Contracts* | — | 12,115,744 | — | 12,115,744 | ||||||||||||
Total Return Swap Contracts* | — | 1,421,210 | — | 1,421,210 | ||||||||||||
Total Assets | $ | 3,812,342 | $ | 511,936,233 | $ | — | $ | 515,748,575 | ||||||||
LIABILITIES | ||||||||||||||||
Futures Contracts* | $ | (3,987,785 | ) | $ | — | $ | — | $ | (3,987,785 | ) | ||||||
Forward Foreign Currency Exchange Contracts* | — | (15,402,116 | ) | — | (15,402,116 | ) | ||||||||||
Total Return Swap Contracts* | — | (732,814 | ) | — | (732,814 | ) | ||||||||||
Total Liabilities | $ | (3,987,785 | ) | $ | (16,134,930 | ) | $ | — | $ | (20,122,715 | ) | |||||
| AQR MULTI-STRATEGY ALTERNATIVE FUND | LEVEL 1 | LEVEL 2 | LEVEL 3 | TOTALS | ||||||||||||
ASSETS | ||||||||||||||||
Common Stocks† | $ | 106,474,358 | $ | — | $ | 408,524 | $ | 106,882,882 | ||||||||
Convertible Preferred Stocks† | 201,579,310 | 72,572,993 | — | 274,152,303 | ||||||||||||
Corporate Bonds† | — | 246,875 | — | 246,875 | ||||||||||||
Convertible Bonds† | — | 550,569,539 | 416,739 | 550,986,278 | ||||||||||||
U.S.Treasury Bill | — | 106,806,095 | — | 106,806,095 | ||||||||||||
Money Market Funds | — | 1,250,165,700 | — | 1,250,165,700 | ||||||||||||
Futures Contracts* | 2,140,906 | — | — | 2,140,906 | ||||||||||||
Forward Foreign Currency Exchange Contracts* | — | 36,246,359 | — | 36,246,359 | ||||||||||||
Credit Default Swap Contracts* | — | 194,065 | — | 194,065 | ||||||||||||
Total Return Basket Swaps Contracts* | — | 148,068,820 | — | 148,068,820 | ||||||||||||
Total Return Swap Contracts* | — | 2,570,600 | — | 2,570,600 | ||||||||||||
Total Assets | $ | 310,194,574 | $ | 2,167,441,046 | $ | 825,263 | $ | 2,478,460,883 | ||||||||
LIABILITIES | ||||||||||||||||
Common Stocks (Sold Short)† | $ | (588,406,560 | ) | $ | — | $ | — | $ | (588,406,560 | ) | ||||||
Futures Contracts* | (4,710,738 | ) | — | — | (4,710,738 | ) | ||||||||||
Forward Foreign Currency Exchange Contracts* | — | (22,536,170 | ) | — | (22,536,170 | ) | ||||||||||
Total Return Basket Swaps Contracts* | — | (5,703,338 | ) | — | (5,703,338 | ) | ||||||||||
Total Return Swap Contracts* | — | (8,205,880 | ) | — | (8,205,880 | ) | ||||||||||
Total Liabilities | $ | (593,117,298 | ) | $ | (36,445,388 | ) | $ | — | $ | (629,562,686 | ) | |||||
| AQR RISK-BALANCED COMMODITIES STRATEGY FUND | LEVEL 1 | LEVEL 2 | LEVEL 3 | TOTALS | ||||||||||||
ASSETS | ||||||||||||||||
U.S.Treasury Bill | $ | — | $ | 52,583,037 | $ | — | $ | 52,583,037 | ||||||||
Money Market Funds | — | 39,904,434 | — | 39,904,434 | ||||||||||||
Total Return Swap Contracts* | — | 323,845 | — | 323,845 | ||||||||||||
Total Assets | $ | — | $ | 92,811,316 | $ | — | $ | 92,811,316 | ||||||||
LIABILITIES | ||||||||||||||||
Futures Contracts* | $ | (3,355,122 | ) | $ | — | $ | — | $ | (3,355,122 | ) | ||||||
Total Return Swap Contracts* | — | (557,767 | ) | — | (557,767 | ) | ||||||||||
Total Liabilities | $ | (3,355,122 | ) | $ | (557,767 | ) | $ | — | $ | (3,912,889 | ) | |||||
| AQR Funds | Annual Report | December 2015 | ||||||||||||||
361
Table of Contents
| Notes to Financial Statements | December 31, 2015 |
| AQR RISK PARITY FUND | LEVEL 1 | LEVEL 2 | LEVEL 3 | TOTALS | ||||||||||||
ASSETS | ||||||||||||||||
Government Related Obligations | $ | — | $ | 62,301,527 | $ | — | $ | 62,301,527 | ||||||||
U.S. Treasury Bill | — | 107,355,380 | — | 107,355,380 | ||||||||||||
U.S. Treasury Obligations | — | 94,207,063 | — | 94,207,063 | ||||||||||||
Money Market Funds | — | 225,690,996 | — | 225,690,996 | ||||||||||||
Futures Contracts* | 1,111,618 | — | — | 1,111,618 | ||||||||||||
Forward Foreign Currency Exchange Contracts* | — | 991,423 | — | 991,423 | ||||||||||||
Interest Rate Swap Contracts* | — | 254,057 | — | 254,057 | ||||||||||||
Credit Default Swap Contracts* | — | 5,114,137 | — | 5,114,137 | ||||||||||||
Total Return Swap Contracts* | — | 184,650 | — | 184,650 | ||||||||||||
Total Assets | $ | 1,111,618 | $ | 496,099,233 | $ | — | $ | 497,210,851 | ||||||||
LIABILITIES | ||||||||||||||||
Futures Contracts* | $ | (6,287,318 | ) | $ | — | $ | — | $ | (6,287,318 | ) | ||||||
Forward Foreign Currency Exchange Contracts* | — | (4,912,113 | ) | — | (4,912,113 | ) | ||||||||||
Interest Rate Swap Contracts* | — | (451,155 | ) | — | (451,155 | ) | ||||||||||
Total Return Swap Contracts* | — | (884,195 | ) | — | (884,195 | ) | ||||||||||
Total Liabilities | $ | (6,287,318 | ) | $ | (6,247,463 | ) | $ | — | $ | (12,534,781 | ) | |||||
| AQR RISK PARITY II HV FUND | LEVEL 1 | LEVEL 2 | LEVEL 3 | TOTALS | ||||||||||||
ASSETS | ||||||||||||||||
Government Related Obligations | $ | — | $ | 6,797,727 | $ | — | $ | 6,797,727 | ||||||||
Repurchase Agreements | — | 2,525,961 | — | 2,525,961 | ||||||||||||
U.S. Treasury Bill | — | 10,186,263 | — | 10,186,263 | ||||||||||||
U.S. Treasury Obligations | — | 10,335,368 | — | 10,335,368 | ||||||||||||
Money Market Funds | — | 25,334,185 | — | 25,334,185 | ||||||||||||
Futures Contracts* | 186,810 | — | — | 186,810 | ||||||||||||
Forward Foreign Currency Exchange Contracts* | — | 41,152 | — | 41,152 | ||||||||||||
Total Return Swap Contracts* | — | 36,390 | — | 36,390 | ||||||||||||
Total Assets | $ | 186,810 | $ | 55,257,046 | $ | — | $ | 55,443,856 | ||||||||
LIABILITIES | ||||||||||||||||
Reverse Repurchase Agreements (Sold Short) | $ | — | $ | (9,233,035 | ) | $ | — | $ | (9,233,035 | ) | ||||||
Futures Contracts* | (897,444 | ) | — | — | (897,444 | ) | ||||||||||
Forward Foreign Currency Exchange Contracts* | — | (158,019 | ) | — | (158,019 | ) | ||||||||||
Total Return Swap Contracts* | — | (140,718 | ) | — | (140,718 | ) | ||||||||||
Total Liabilities | $ | (897,444 | ) | $ | (9,531,772 | ) | $ | — | $ | (10,429,216 | ) | |||||
| AQR RISK PARITY II MV FUND | LEVEL 1 | LEVEL 2 | LEVEL 3 | TOTALS | ||||||||||||
ASSETS | ||||||||||||||||
Government Related Obligations | $ | — | $ | 10,252,599 | $ | — | $ | 10,252,599 | ||||||||
U.S. Treasury Bill | — | 18,869,617 | — | 18,869,617 | ||||||||||||
U.S. Treasury Obligations | — | 15,343,245 | — | 15,343,245 | ||||||||||||
Money Market Funds | — | 43,025,454 | — | 43,025,454 | ||||||||||||
Futures Contracts* | 279,038 | — | — | 279,038 | ||||||||||||
Forward Foreign Currency Exchange Contracts* | — | 55,018 | — | 55,018 | ||||||||||||
Total Return Swap Contracts* | — | 121,247 | — | 121,247 | ||||||||||||
Total Assets | $ | 279,038 | $ | 87,667,180 | $ | — | $ | 87,946,218 | ||||||||
LIABILITIES | ||||||||||||||||
Futures Contracts* | $ | (1,293,475 | ) | $ | — | $ | — | $ | (1,293,475 | ) | ||||||
Forward Foreign Currency Exchange Contracts* | — | (209,065 | ) | — | (209,065 | ) | ||||||||||
Total Return Swap Contracts* | — | (355,699 | ) | — | (355,699 | ) | ||||||||||
Total Liabilities | $ | (1,293,475 | ) | $ | (564,764 | ) | $ | — | $ | (1,858,239 | ) | |||||
| AQR Funds | Annual Report | December 2015 | ||||||||||||||
362
Table of Contents
| Notes to Financial Statements | December 31, 2015 |
| AQR STYLE PREMIA ALTERNATIVE FUND | LEVEL 1 | LEVEL 2 | LEVEL 3 | TOTALS | ||||||||||||
ASSETS | ||||||||||||||||
Common Stocks† | $ | — | $ | 671,441,026 | $ | — | $ | 671,441,026 | ||||||||
Preferred Stocks† | — | 7,283,817 | — | 7,283,817 | ||||||||||||
U.S.Treasury Bill | — | 369,724,615 | — | 369,724,615 | ||||||||||||
Money Market Funds | — | 1,111,259,579 | — | 1,111,259,579 | ||||||||||||
Futures Contracts* | 7,418,990 | — | — | 7,418,990 | ||||||||||||
Forward Foreign Currency Exchange Contracts* | — | 19,468,488 | — | 19,468,488 | ||||||||||||
Total Return Swap Contracts* | — | 2,392,364 | — | 2,392,364 | ||||||||||||
Total Assets | $ | 7,418,990 | $ | 2,181,569,889 | $ | — | $ | 2,188,988,879 | ||||||||
LIABILITIES | ||||||||||||||||
Common Stocks (Sold Short)† | $ | — | $ | (485,078,866 | ) | $ | (2 | ) | $ | (485,078,868 | ) | |||||
Preferred Stocks (Sold Short)† | — | (3,260,520 | ) | — | (3,260,520 | ) | ||||||||||
Futures Contracts* | (27,450,618 | ) | — | — | (27,450,618 | ) | ||||||||||
Forward Foreign Currency Exchange Contracts* | — | (11,836,195 | ) | — | (11,836,195 | ) | ||||||||||
Total Return Basket Swaps Contracts* | — | (18,170,268 | ) | — | (18,170,268 | ) | ||||||||||
Total Return Swap Contracts* | — | (7,145,945 | ) | — | (7,145,945 | ) | ||||||||||
Total Liabilities | $ | (27,450,618 | ) | $ | (525,491,794 | ) | $ | (2 | ) | $ | (552,942,414 | ) | ||||
| AQR STYLE PREMIA ALTERNATIVE LV FUND | LEVEL 1 | LEVEL 2 | LEVEL 3 | TOTALS | ||||||||||||
ASSETS | ||||||||||||||||
Common Stocks† | $ | — | $ | 37,096,219 | $ | — | $ | 37,096,219 | ||||||||
Preferred Stocks† | — | 201,636 | — | 201,636 | ||||||||||||
U.S.Treasury Bill | — | 51,073,338 | — | 51,073,338 | ||||||||||||
Money Market Funds | — | 116,829,809 | — | 116,829,809 | ||||||||||||
Futures Contracts* | 417,848 | — | — | 417,848 | ||||||||||||
Forward Foreign Currency Exchange Contracts* | — | 1,069,551 | — | 1,069,551 | ||||||||||||
Total Return Basket Swaps Contracts* | — | 1,528,900 | — | 1,528,900 | ||||||||||||
Total Return Swap Contracts* | — | 147,827 | — | 147,827 | ||||||||||||
Total Assets | $ | 417,848 | $ | 207,947,280 | $ | — | $ | 208,365,128 | ||||||||
LIABILITIES | ||||||||||||||||
Common Stocks (Sold Short)† | $ | — | $ | (27,481,412 | ) | $ | — | $ | (27,481,412 | ) | ||||||
Preferred Stocks (Sold Short)† | — | (256,418 | ) | — | (256,418 | ) | ||||||||||
Futures Contracts* | (1,438,152 | ) | — | — | (1,438,152 | ) | ||||||||||
Forward Foreign Currency Exchange Contracts* | — | (679,517 | ) | — | (679,517 | ) | ||||||||||
Total Return Swap Contracts* | — | (366,986 | ) | — | (366,986 | ) | ||||||||||
Total Liabilities | $ | (1,438,152 | ) | $ | (28,784,333 | ) | $ | — | $ | (30,222,485 | ) | |||||
| * | Derivative instruments, including futures, total return swap, total return basket swap and forward foreign currency exchange contracts, are reported at the cumulative unrealized appreciation/(depreciation) of the instrument within the Funds’ Schedule of Investments. Credit default swaps, interest rate swaps and option contracts are reported at market value. Only current day’s variation margin is reported within the Statements of Assets and Liabilities for exchange-traded and cleared derivatives. |
| † | Please refer to the Schedule of Investments to view securities segregated by country. |
The Funds recognize all transfers at the beginning of the reporting period, related unrealized appreciation/(depreciation) is also transferred out at the beginning of the reporting period. Transfers between Level 1 and 2 generally relate to whether the principal market for the security becomes active or inactive. Transfers from Level 2 to Level 3 or from Level 3 to Level 2 are due to a decline or an increase in market activity (e.g., frequency of trades), which resulted in a lack of or increase in available market inputs to determine price. During the year ended December 31, 2015, the amount of securities that transferred from Level 1 into Level 2 for the AQR Diversified Arbitrage Fund, AQR Equity Market Neutral Fund and AQR Multi-Strategy Alternative Fund was $21,014,246, $242,650 and $29,061,398, respectively, and the amount transferred from Level 2 into Level 1 for the AQR Diversified Arbitrage Fund and AQR Equity Market Neutral Fund was $13,416,565 and $532,930, respectively. There were no transfers of investments between levels for any of the remaining Funds.
There were no Level 3 securities held at period end, except where noted in AQR Diversified Arbitrage Fund and AQR Multi-Strategy Alternative Fund. Securities classified as Level 3 in the Schedule of Investments are considered quantitatively insignificant in the aggregate for AQR Style Premia Alternative Fund.
| AQR Funds | Annual Report | December 2015 | ||||||||||||||
363
Table of Contents
| Notes to Financial Statements | December 31, 2015 |
The following tables include a rollforward of the balances of investments classified within Level 3 of the fair value hierarchy for the period for each Fund that held Level 3 securities that were considered quantitatively significant:
| AQR DIVERSIFIED ARBITRAGE FUND | COMMON STOCK | CONVERTIBLE PREFERRED STOCK | LOAN PARTI- CORPORATE BONDS | CONVER- BOND | PREFERRED STOCK | RIGHTS | WARRANT | SECURITIES IN LITGATION | SHORT COMMON STOCKS | |||||||||||||||||||||||||||
Balance as of December 31, 2014 | $ | 70,433,999 | $ | 24,872,000 | $ | 79,673,833 | $ | 291,618 | $ | 853,511 | $ | 3,286,022 | $ | 1,270,739 | $ | 93,245 | $ | (453 | ) | |||||||||||||||||
Accrued discounts/(premiums) | — | — | 459,659 | 1,219 | — | — | — | 59 | — | |||||||||||||||||||||||||||
Realized gain/(loss) | (968,426 | ) | — | (15,686,939 | ) | (622,500 | ) | — | 2,513,980 | 365,322 | — | — | ||||||||||||||||||||||||
Change in unrealized appreciation/ | (3,971,390 | ) | 2,521,124 | 2,522,928 | (2,283,927 | ) | (36,249 | ) | (2,519,904 | ) | (609,417 | ) | (2,309 | ) | — | |||||||||||||||||||||
Purchases1 | 7,316,457 | — | 17,686,890 | 2,275,000 | — | — | 1,322,280 | — | — | (a) | ||||||||||||||||||||||||||
Sales2 | (31,971,322 | ) | — | (90,495,157 | ) | (877,500 | ) | — | (2,513,980 | ) | (392,925 | ) | — | — | ||||||||||||||||||||||
Transfers in to Level 3 | — | — | 15,800,377 | 1,790,809 | — | — | 305,832 | — | — | |||||||||||||||||||||||||||
Transfers out of Level 3 | (29,443,147 | ) | — | (3,010,868 | ) | — | — | (50,218 | ) | (688,631 | ) | — | — | |||||||||||||||||||||||
Balance as of December 31, 2015 | $ | 11,396,171 | $ | 27,393,124 | $ | 6,950,723 | $ | 574,719 | $ | 817,262 | $ | 715,900 | $ | 1,573,200 | $ | 90,995 | $ | (453 | ) | |||||||||||||||||
Change in Unrealized appreciation/(depreciation) for securities still held at December 31, 2015 | $ | (4,624,300 | ) | $ | 2,521,124 | $ | (16,533,181 | ) | $ | (2,955,832 | ) | $ | (36,249 | ) | $ | (2,519,904 | ) | $ | (98,772 | ) | $ | (2,250 | ) | $ | — | |||||||||||
| AQR MULTI-STRATEGY ALTERNATIVE FUND | COMMON STOCK | CONVERTIBLE BOND | RIGHTS | |||||||||
Balance as of December 31, 2014 | $ | — | $ | — | $ | — | (a) | |||||
Accrued discounts/(premiums) | — | 8,042 | — | |||||||||
Realized gain/(loss) | 114,365 | — | — | |||||||||
Change in unrealized appreciation/(depreciation) | (343,182 | ) | (21,074 | ) | — | |||||||
Purchases1 | — | — | — | |||||||||
Sales2 | (412,279 | ) | — | — | (a) | |||||||
Transfers in to Level 3 | 1,049,620 | 429,771 | — | |||||||||
Transfers out of Level 3 | — | — | — | |||||||||
Balance as of December 31, 2015 | $ | 408,524 | $ | 416,739 | $ | — | ||||||
Change in Unrealized appreciation/(depreciation) for securities still held at December 31, 2015 | $ | (134,246 | ) | $ | (13,031 | ) | $ | — | ||||
| 1 | Purchases include all purchases of securities and securities received in corporate actions. |
| 2 | Sales include all sales of securities, maturities, pay downs and securities tendered in a corporate action. |
| (a) | Security has zero value. |
The fair market values of Level 3 investments are based on significant unobservable inputs that reflect the Adviser’s determination of assumptions that market participants might reasonably use in valuing the securities. Changes in significant unobservable inputs could cause significant changes in valuation to individual securities and in aggregate. Fair value determinations and valuation of investments that are not actively trading involve judgment and may differ materially from valuations that would have been used had greater market activity occurred.
The significant unobservable inputs used in the fair value measurement of a Fund’s investments in common stocks, corporate bonds, convertible bonds, convertible preferred stocks and warrants potentially include credit spread, liquidity discount, earnings multiples and volatility. Significant increases in the credit spread or liquidity discount inputs in isolation would potentially result in a significantly lower fair value measurement, whereas an increase in volatility generally results in a higher fair value measurement. Generally, a change in the assumption used for the credit spread would be accompanied by a directionally-similar change in the assumptions used for the volatility and liquidity discount. Investments in common stocks potentially include liquidity discounts, theoretical values, book to value analysis and/or broker quotes. Significant changes in any of these inputs would significantly change the fair value measurement of the position.
| AQR Funds | Annual Report | December 2015 | ||||||||||||||
364
Table of Contents
| Notes to Financial Statements | December 31, 2015 |
At December 31, 2015, all of the investments classified within Level 3 of the fair value hierarchy held by the AQR Multi-Strategy Alternative Fund are valued by vendor pricing or brokers. The following table summarizes the quantitative inputs and assumptions used in the valuation of investments classified within Level 3 of the fair value hierarchy for the year ended December 31, 2015 for the AQR Diversified Arbitrage Fund:
Quantitative Information about Level 3 Fair Value Measurements*
| INVESTMENT TYPE | FAIR VALUE AT 12/31/2015 | VALUATION METHODOLOGY | UNOBSERVABLE INPUT(S) | INPUT VALUE/RANGE | WEIGHTED AVERAGE | |||||||
| Common Stock | $1,798,965 | Enterprise Value Waterfall Analysis | EBITDA Multiple | 7.5x | N/A | |||||||
| Discount for Lack of Marketability** | 20.1%—29.9% | 28.4% | ||||||||||
| Volatility | 38.3%—58.6% | 55.3% | ||||||||||
| Revenue Multiple | 1.10x—1.15x | 1.13% | ||||||||||
| $1,766,446 | Options Pricing Model | Discount for Lack of Marketability** | 2.8% | N/A | ||||||||
| Volatility | 54.6% | N/A | ||||||||||
| $1,473,413 | Probability Weighted Expected Return | Discount for Lack of Marketability** | 43.0% | N/A | ||||||||
| Equity Cost of Capital | 33.1% | N/A | ||||||||||
| Volatility | 83.6% | N/A | ||||||||||
| Scenario Probability | 45.0%—55.0% | N/A | ||||||||||
| $2,548,055 | Public Price Adjusted for Lack of Marketability | Discount for Lack of Marketability** | 8.6%—51.2% | 8.8% | ||||||||
| Volatility | 61.7%—147.5% | 62.0% | ||||||||||
| Convertible Bond | $4,552 | Liquidation Analysis | Expected Remaining Distributions | 6.5% | N/A | |||||||
| Discount for Lack of Marketability** | 1.5% | N/A | ||||||||||
| Volatility | 31.3% | N/A | ||||||||||
| Convertible Preferred Stock | $27,392,207 | Discounted Cash Flows Analysis | Discount Rate | 7.6% | N/A | |||||||
| Preferred Stock | $817,262 | Discounted Cash Flows Analysis | Equity Cost of Capital | 14.2% | N/A | |||||||
| Right | | $197,135 | | Options Pricing Model | Discount for Lack of Marketability** | 26.7% | N/A | |||||
| Volatility | 75.0% | N/A | ||||||||||
| $515,927 | Probability Weighted Expected Return | Discount for Lack of Marketability** | 21.4%—38.1% | 31.4% | ||||||||
| Equity Cost of Capital | 15.7%—20.5% | 19.3% | ||||||||||
| Scenario Probability | 22.5%—70.0% | 57.4% | ||||||||||
| Volatility | 51.5%—58.4% | 56.6% | ||||||||||
| Securities in Litigation | $90,996 | Liquidation Analysis | Recovery Probability | 2.5% | N/A | |||||||
| Liquidation Cost (% of capital) | 28.1% | N/A | ||||||||||
| Warrant | $98,840 | Options Pricing Model | Discount for Lack of Marketability** | 10.0%—15.0% | N/A | |||||||
| Volatility | 41.4% | N/A | ||||||||||
| * | The table above does not include Level 3 securities that are valued by pricing vendors or brokers. At December 31, 2015, the value of these securities was $12,807,842. The inputs for these securities are not readily available or cannot be reasonably estimated and are |
| AQR Funds | Annual Report | December 2015 | ||||||||||||||
365
Table of Contents
| Notes to Financial Statements | December 31, 2015 |
| generally those inputs described in Note 5. The appropriateness of fair values for these securities is monitored on an ongoing basis which may include results of back testing, results of pricing vendor and/or broker due diligence, unchanged price review and consideration of macro or security specific events. |
| ** | Represents amounts used when the reporting entity has determined that market participants would take into account discounts, as applicable, when pricing the investments. |
6. Federal Income Tax Matters
At December 31, 2015, the cost of long security positions and aggregate gross unrealized appreciation (depreciation) of investments for federal income tax purposes were as follows:
| FUND | COST OF INVESTMENTS | GROSS UNREALIZED APPRECIATION | GROSS UNREALIZED DEPRECIATION | NET UNREALIZED APPRECIATION (DEPRECIATION) | ||||||||||||
AQR Diversified Arbitrage Fund | $ | 1,534,733,677 | $ | 55,089,980 | $ | (289,418,434 | ) | $ | (234,328,454 | ) | ||||||
AQR Equity Market Neutral Fund | 304,256,119 | 2,601,950 | (2,462,025 | ) | 139,925 | |||||||||||
AQR Global Macro Fund | 46,801,121 | — | (31 | ) | (31 | ) | ||||||||||
AQR Long-Short Equity Fund | 635,516,954 | 4,588,240 | (7,047,585 | ) | (2,459,345 | ) | ||||||||||
AQR Managed Futures Strategy Fund | 9,432,505,947 | 1,496,738 | (245,284 | ) | 1,251,454 | |||||||||||
AQR Managed Futures Strategy HV Fund | 498,365,340 | 39,356 | (5,417 | ) | 33,939 | |||||||||||
AQR Multi-Strategy Alternative Fund | 2,280,706,295 | 75,561,318 | (67,027,480 | ) | 8,533,838 | |||||||||||
AQR Risk Balanced Commodities Strategy Fund | 92,484,468 | 3,486 | (483 | ) | 3,003 | |||||||||||
AQR Risk Parity Fund | 495,016,371 | 8,758 | (5,470,163 | ) | (5,461,405 | ) | ||||||||||
AQR Risk Parity II HV Fund | 55,826,765 | 95 | (647,356 | ) | (647,261 | ) | ||||||||||
AQR Risk Parity II MV Fund | 88,411,894 | 857 | (921,836 | ) | (920,979 | ) | ||||||||||
AQR Style Premia Alternative Fund | 2,145,571,006 | 41,102,674 | (26,964,643 | ) | 14,138,031 | |||||||||||
AQR Style Premia Alternative LV Fund | 204,365,400 | 1,865,554 | (1,029,952 | ) | 835,602 | |||||||||||
The differences between book basis and tax basis appreciation (depreciation) on investments is primarily attributable to wash sale loss deferrals, and differences in the tax treatment of passive foreign investment companies (“PFIC”), investments in partnerships, convertible securities, contingent payment debt instruments (“CPDI”) and investments in inflation protected securities.
As of December 31, 2015, the components of net assets (excluding paid-in capital) on a tax basis were as follows:
| FUND | CURRENT DISTRIBUTABLE ORDINARY INCOME | CURRENT DISTRIBUTABLE LONG TERM CAPITAL GAIN OR (TAX BASIS CAPITAL LOSS CARRYFORWARDS) | NET UNREALIZED APPRECIATION (DEPRECIATION) | POST OCTOBER CAPITAL OR LATE YEAR ORDINARY LOSS DEFERRALS | OTHER TEMPORARY DIFFERENCES | TOTAL ACCUMULATED EARNINGS | ||||||||||||||||||
AQR Diversified Arbitrage Fund | $ | 23,629,111 | $ | (132,212,805 | ) | $ | (182,546,156 | ) | $ | (34,225,955 | ) | $ | 284,068 | $ | (325,071,737 | ) | ||||||||
AQR Equity Market Neutral Fund | 2,415,816 | 85,515 | 2,211,434 | (7,900 | ) | 96,473 | 4,801,338 | |||||||||||||||||
AQR Global Macro Fund | — | 2,770 | 152,452 | (735,598 | ) | 593,573 | 13,197 | |||||||||||||||||
AQR Long-Short Equity Fund | 4,474,128 | — | 8,317,211 | (3,363,537 | ) | 132,687 | 9,560,489 | |||||||||||||||||
AQR Managed Futures Strategy Fund | 2,204,303 | — | (98,131,710 | ) | (281,401,377 | ) | 197,634,901 | (179,693,883 | ) | |||||||||||||||
AQR Managed Futures Strategy HV Fund | 98,316 | — | (6,789,714 | ) | (22,053,898 | ) | 15,491,014 | (13,254,282 | ) | |||||||||||||||
AQR Multi-Strategy Alternative Fund | 30,790,530 | (6,568,303 | ) | (78,105,400 | ) | — | 7,342,092 | (46,541,081 | ) | |||||||||||||||
AQR Risk Balanced Commodities Strategy Fund | — | (12,630 | ) | (8,420,932 | ) | — | (3,795,206 | ) | (12,228,768 | ) | ||||||||||||||
AQR Risk Parity Fund | — | 208,396 | (10,880,806 | ) | (13,695,172 | ) | (7,544,359 | ) | (31,911,941 | ) | ||||||||||||||
AQR Risk Parity II HV Fund | — | — | (1,813,968 | ) | (2,269,683 | ) | (1,406,105 | ) | (5,489,756 | ) | ||||||||||||||
| AQR Funds | Annual Report | December 2015 | ||||||||||||||
366
Table of Contents
| Notes to Financial Statements | December 31, 2015 |
| FUND | CURRENT DISTRIBUTABLE ORDINARY INCOME | CURRENT DISTRIBUTABLE LONG TERM CAPITAL GAIN OR (TAX BASIS CAPITAL LOSS CARRYFORWARDS) | NET UNREALIZED APPRECIATION (DEPRECIATION) | POST OCTOBER CAPITAL OR LATE YEAR ORDINARY LOSS DEFERRALS | OTHER TEMPORARY DIFFERENCES | TOTAL ACCUMULATED EARNINGS | ||||||||||||||||||
AQR Risk Parity II MV Fund | $ | — | $ | — | $ | (2,386,046 | ) | $ | (3,016,862 | ) | $ | (1,598,156 | ) | $ | (7,001,064 | ) | ||||||||
AQR Style Premia Alternative Fund | 64,252,620 | (31,783,961 | ) | (34,031,889 | ) | — | 6,179,408 | 4,616,178 | ||||||||||||||||
AQR Style Premia Alternative LV Fund | 1,163,993 | (1,282,395 | ) | 84,071 | — | 89,561 | 55,230 | |||||||||||||||||
The differences between book basis and tax basis components of net assets are primarily attributable to wash sale loss deferrals and other book and tax differences including, mark to market on PFICs, mark to market on forward foreign currency exchange contracts, mark to market on regulated futures contracts, mark to market and income on certain swaps, late year ordinary loss deferrals, straddle loss deferrals, loss deferrals on unsettled short sales, investments in partnerships, investments in inflation protected securities, post-October capital loss deferrals, deemed dividends from convertible securities, Cayman subsidiary taxable income, CPDI accrued income, capital loss carryforwards and finance charges on basket swaps.
As of December 31, 2015, the effect of permanent book/tax reclassifications resulted in increase (decrease) to the components of net assets as follows:
| FUND | UNDISTRIBUTED NET INVESTMENT INCOME | ACCUMULATED NET REALIZED GAIN(LOSS) ON INVESTMENTS | PAID-IN CAPITAL | |||||||||
AQR Diversified Arbitrage Fund | $ | 56,145,486 | $ | (56,145,586 | ) | $ | 100 | |||||
AQR Equity Market Neutral Fund | 3,185,328 | (3,150,806 | ) | (34,522 | ) | |||||||
AQR Global Macro Fund | 2,508,975 | (133,698 | ) | (2,375,277 | ) | |||||||
AQR Long-Short Equity Fund | 32,926,241 | (32,926,122 | ) | (119 | ) | |||||||
AQR Managed Futures Strategy Fund | 930,782,804 | (512,981,176 | ) | (417,801,628 | ) | |||||||
AQR Managed Futures Strategy HV Fund | 47,033,675 | (32,100,360 | ) | (14,933,315 | ) | |||||||
AQR Multi-Strategy Alternative Fund | 180,037,121 | (146,602,195 | ) | (33,434,926 | ) | |||||||
AQR Risk Balanced Commodities Strategy Fund | (4,845,930 | ) | 22,173,242 | (17,327,312 | ) | |||||||
AQR Risk Parity Fund | (8,515,302 | ) | 46,376,798 | (37,861,496 | ) | |||||||
AQR Risk Parity II HV Fund | (2,576,604 | ) | 7,993,988 | (5,417,384 | ) | |||||||
AQR Risk Parity II MV Fund | (2,820,830 | ) | 9,348,959 | (6,528,129 | ) | |||||||
AQR Style Premia Alternative Fund | 165,744,745 | (165,806,409 | ) | 61,664 | ||||||||
AQR Style Premia Alternative LV Fund | 3,352,796 | (3,064,282 | ) | (288,514 | ) | |||||||
For financial reporting purposes, capital accounts are adjusted to reflect the tax character of permanent book/tax differences. Reclassifications are primarily due to the difference in tax treatment of foreign currency gain/loss, dividend expense for securities sold short, investments in PFICs, investments in certain swap contracts, distribution reclassifications, net operating losses, finance charges and monthly reset on basket swaps, CPDI accrual income, and the tax treatment of income from investments in the Cayman subsidiary. The result of operations and net assets were not affected by the reclassifications.
The tax character of distributions paid during the fiscal year-ends December 31, 2015 and December 31, 2014 were as follows:
| DECEMBER 31, 2015 | DECEMBER 31, 2014 | |||||||||||||||||||||||
| FUND | ORDINARY INCOME | CAPITAL GAINS | RETURN OF CAPITAL | ORDINARY INCOME | CAPITAL GAINS | RETURN OF CAPITAL | ||||||||||||||||||
AQR Diversified Arbitrage Fund | $ | 48,100,540 | $ | — | $ | — | $ | 42,184,546 | $ | — | $ | — | ||||||||||||
AQR Equity Market Neutral Fund | 5,313,037 | 102,719 | — | 327,559 | — | 3,100 | ||||||||||||||||||
AQR Global Macro Fund | 982,330 | 1,765,884 | — | — | 65,718 | — | ||||||||||||||||||
AQR Long-Short Equity Fund | 22,341,353 | 768,361 | — | 3,695,245 | 158,787 | 137,442 | ||||||||||||||||||
AQR Managed Futures Strategy Fund | 457,793,882 | 132,351,997 | — | 397,007,505 | 194,482,633 | — | ||||||||||||||||||
AQR Managed Futures Strategy HV Fund | 25,876,162 | 9,217,388 | — | 15,283,006 | 3,010,679 | — | ||||||||||||||||||
| AQR Funds | Annual Report | December 2015 | ||||||||||||||
367
Table of Contents
| Notes to Financial Statements | December 31, 2015 |
| DECEMBER 31, 2015 | DECEMBER 31, 2014 | |||||||||||||||||||||||
| FUND | ORDINARY INCOME | CAPITAL GAINS | RETURN OF CAPITAL | ORDINARY INCOME | CAPITAL GAINS | RETURN OF CAPITAL | ||||||||||||||||||
AQR Multi-Strategy Alternative Fund | $ | 204,859,857 | $ | — | $ | — | $ | 108,646,645 | $ | 398,487 | $ | — | ||||||||||||
AQR Risk Parity Fund | 7,941,558 | 5,238,673 | — | 65,645,098 | 15,092,700 | — | ||||||||||||||||||
AQR Risk Parity II HV Fund | 1,670,028 | 935,618 | — | 3,324,717 | 2,288,332 | — | ||||||||||||||||||
AQR Risk Parity II MV Fund | 2,477,291 | 2,518,203 | — | 3,714,288 | 3,529,309 | — | ||||||||||||||||||
AQR Style Premia Alternative Fund | 92,480,282 | — | — | 61,067,637 | 5,032,183 | — | ||||||||||||||||||
AQR Style Premia Alternative LV Fund | 3,352,540 | 28,347 | — | 380,534 | 69,820 | — | ||||||||||||||||||
During the year ended December 31, 2015, the Funds utilized capital loss carryforwards in the amounts listed below:
| FUND | SHORT-TERM | LONG-TERM | ||||||
AQR Equity Market Neutral Fund | $ | 1,143 | $ | 2,606 | ||||
As of December 31, 2015, for federal income tax purposes, the following Funds have capital loss carryforwards available to offset future capital gains, if any, to the extent provided by the U.S. Treasury regulations:
| FUND | SHORT-TERM | LONG-TERM | ||||||
AQR Diversified Arbitrage Fund | $ | 84,405,717 | $ | 47,807,088 | ||||
AQR Multi-Strategy Alternative Fund | 6,568,303 | — | ||||||
AQR Risk Balanced Commodities Strategy Fund | 12,630 | — | ||||||
AQR Style Premia Alternative Fund | 22,115,573 | 9,668,388 | ||||||
AQR Style Premia Alternative LV Fund | 674,702 | 607,693 | ||||||
7. Investment Transactions
During the year ended December 31, 2015, the cost of purchases and the proceeds from sales of investments (excluding swap contracts, forward foreign currency exchange contracts, futures contracts and short-term investments) were as follows:
| FUND | PURCHASES | SALES | SECURITIES SOLD SHORT | COVERS ON SECURITIES SOLD SHORT | ||||||||||||
AQR Diversified Arbitrage Fund | $ | 2,636,940,344 | $ | 3,729,132,026 | $ | 1,275,766,742 | $ | 1,726,855,351 | ||||||||
AQR Equity Market Neutral Fund | 78,326,060 | 4,391,238 | 80,473,252 | 16,040,866 | ||||||||||||
AQR Long-Short Equity Fund | 169,391,253 | 11,118,891 | 164,176,695 | 30,341,274 | ||||||||||||
AQR Multi-Strategy Alternative Fund | 1,043,862,256 | 816,386,437 | 716,298,435 | 532,919,116 | ||||||||||||
AQR Risk Parity Fund | 339,238,988 | 381,190,826 | — | — | ||||||||||||
AQR Risk Parity II HV Fund | 52,258,036 | 54,981,653 | — | — | ||||||||||||
AQR Risk Parity II MV Fund | 55,337,593 | 58,376,403 | — | — | ||||||||||||
AQR Style Premia Alternative Fund | 559,904,911 | 90,808,538 | 502,989,840 | 169,676,112 | ||||||||||||
AQR Style Premia Alternative LV Fund | 31,547,668 | 8,502,229 | 27,940,063 | 11,317,456 | ||||||||||||
During the year ended December 31, 2015, the Funds had purchases and sales of long-term U.S. Government obligations as follows:
| FUND | PURCHASES | SALES | ||||||
AQR Diversified Arbitrage Fund | $ | 4,625,903 | $ | 4,622,109 | ||||
AQR Risk Parity Fund | 184,259,370 | 205,827,772 | ||||||
AQR Risk Parity II HV Fund | 29,126,080 | 30,410,912 | ||||||
AQR Risk Parity II MV Fund | 29,920,166 | 31,444,212 | ||||||
8. Derivative Instruments and Activities
Certain funds use derivative instruments as part of their principal investment strategy to achieve their investment objectives. The Funds’ derivative contracts held at December 31, 2015, are not accounted for as hedging instruments under GAAP. For financial reporting purposes, the Funds do not offset financial assets and financial liabilities that are subject to master netting arrangements or similar agreements on the Statements of Assets and Liabilities. All derivative instruments held by the Funds were subject to a master netting agreement or similar arrangement.
| AQR Funds | Annual Report | December 2015 | ||||||||||||||
368
Table of Contents
| Notes to Financial Statements | December 31, 2015 |
The following table lists the fair value of derivatives instruments held by the Funds, by primary underlying risk and contract type, as included in the Statements of Assets and Liabilities* at December 31, 2015.
| ASSETS | LIABILITIES | |||||||||||||||||||||||||||
| FUND | UNREALIZED APPRECIATION ON FUTURES CONTRACTS* | SWAPS AT VALUE* | UNREALIZED APPRECIATION ON FORWARD CURRENCY EXCHANGE CONTRACTS | UNREALIZED DEPRECIATION ON FUTURES CONTRACTS* | SWAPS AT VALUE* | UNREALIZED DEPRECIATION ON FORWARD CURRENCY EXCHANGE CONTRACTS | WRITTEN MARKET | |||||||||||||||||||||
| Equity Risk Exposure: | ||||||||||||||||||||||||||||
AQR Diversified Arbitrage Fund | $ | — | $ | 4,248,128 | $ | — | $ | 534,979 | $ | 3,110,613 | $ | — | $ | 201,436 | ||||||||||||||
AQR Equity Market Neutral Fund | — | 6,076,500 | — | — | 376,337 | — | — | |||||||||||||||||||||
AQR Global Macro Fund | 488,551 | 111,154 | — | 310,329 | 18,100 | — | — | |||||||||||||||||||||
AQR Long-Short Equity Fund | 3,739,853 | 5,822,740 | — | 443,590 | 5,455,052 | — | — | |||||||||||||||||||||
AQR Managed Futures Strategy Fund | 12,491,809 | 9,387,294 | — | 30,109,698 | 4,330,887 | — | — | |||||||||||||||||||||
AQR Managed Futures Strategy HV Fund | 1,019,704 | 676,133 | — | 2,413,103 | 338,187 | — | — | |||||||||||||||||||||
AQR Multi-Strategy Alternative Fund | 2,967,139 | 149,771,815 | — | 6,437,557 | 11,854,202 | — | — | |||||||||||||||||||||
AQR Risk Parity Fund | 1,228,399 | 90,080 | — | 166,789 | 232,054 | — | — | |||||||||||||||||||||
AQR Risk Parity II HV Fund | 207,585 | 23,619 | — | 29,558 | 34,391 | — | — | |||||||||||||||||||||
AQR Risk Parity II MV Fund | 300,427 | 27,681 | — | 33,319 | 54,106 | — | — | |||||||||||||||||||||
AQR Style Premia Alternative Fund | 2,621,029 | 2,368,266 | — | 14,232,962 | 21,907,166 | — | — | |||||||||||||||||||||
AQR Style Premia Alternative LV Fund | 112,673 | 1,668,281 | — | 783,058 | 192,291 | — | — | |||||||||||||||||||||
| Foreign Exchange Rate Risk Exposure: | ||||||||||||||||||||||||||||
AQR Diversified Arbitrage Fund | — | — | 1,467,728 | — | — | 364,388 | — | |||||||||||||||||||||
AQR Equity Market Neutral Fund | — | — | 54,341 | — | — | 124,079 | — | |||||||||||||||||||||
AQR Global Macro Fund | — | — | 816,404 | — | — | 306,582 | — | |||||||||||||||||||||
AQR Long-Short Equity Fund | — | — | 964,654 | — | — | 699,605 | — | |||||||||||||||||||||
AQR Managed Futures Strategy Fund | — | — | 154,800,955 | — | — | 196,445,264 | — | |||||||||||||||||||||
AQR Managed Futures Strategy HV Fund | — | — | 12,115,744 | — | — | 15,402,116 | — | |||||||||||||||||||||
AQR Multi-Strategy Alternative Fund | — | — | 36,246,359 | — | — | 22,536,170 | — | |||||||||||||||||||||
AQR Risk Parity Fund | — | — | 991,423 | — | — | 4,912,113 | — | |||||||||||||||||||||
AQR Risk Parity II HV Fund | — | — | 41,152 | — | — | 158,019 | — | |||||||||||||||||||||
AQR Risk Parity II MV Fund | — | — | 55,018 | — | — | 209,065 | — | |||||||||||||||||||||
AQR Style Premia Alternative Fund | — | — | 19,468,488 | — | — | 11,836,195 | — | |||||||||||||||||||||
AQR Style Premia Alternative LV Fund | — | — | 1,069,551 | — | — | 679,517 | — | |||||||||||||||||||||
| Interest Rate Risk Exposure: | ||||||||||||||||||||||||||||
AQR Diversified Arbitrage Fund | 337,876 | 561,243 | — | — | 370,904 | — | — | |||||||||||||||||||||
AQR Global Macro Fund | 275,966 | 4,460,229 | — | 620,415 | 3,871,356 | — | — | |||||||||||||||||||||
AQR Managed Futures Strategy Fund | 6,674,688 | — | — | 31,054,671 | — | — | — | |||||||||||||||||||||
AQR Managed Futures Strategy HV Fund | 524,300 | — | — | 2,424,402 | — | — | — | |||||||||||||||||||||
AQR Multi-Strategy Alternative Fund | 3,013,301 | 164,019 | — | 3,992,446 | — | — | — | |||||||||||||||||||||
AQR Risk Parity Fund | 304,903 | 1,817,546 | — | 2,092,199 | 2,014,644 | ��� | — | |||||||||||||||||||||
AQR Risk Parity II HV Fund | 45,171 | — | — | 315,194 | — | — | — | |||||||||||||||||||||
AQR Risk Parity II MV Fund | 76,031 | — | — | 476,570 | — | — | — | |||||||||||||||||||||
AQR Style Premia Alternative Fund | 9,185,834 | — | — | 12,311,636 | — | — | — | |||||||||||||||||||||
AQR Style Premia Alternative LV Fund | 573,022 | — | — | 796,272 | — | — | — | |||||||||||||||||||||
| Credit Risk Exposure: | ||||||||||||||||||||||||||||
AQR Diversified Arbitrage Fund | — | — | — | — | 1,247,858 | — | — | |||||||||||||||||||||
AQR Multi-Strategy Alternative Fund | — | 194,065 | — | — | — | — | — | |||||||||||||||||||||
AQR Risk Parity Fund | — | 7,345,564 | — | — | 2,231,427 | — | — | |||||||||||||||||||||
| AQR Funds | Annual Report | December 2015 | ||||||||||||||
369
Table of Contents
| Notes to Financial Statements | December 31, 2015 |
| ASSETS | LIABILITIES | |||||||||||||||||||||||||||
| FUND | UNREALIZED APPRECIATION ON FUTURES CONTRACTS* | SWAPS AT VALUE* | UNREALIZED APPRECIATION ON FORWARD CURRENCY EXCHANGE CONTRACTS | UNREALIZED DEPRECIATION ON FUTURES CONTRACTS* | SWAPS AT VALUE* | UNREALIZED DEPRECIATION ON FORWARD CURRENCY EXCHANGE CONTRACTS | WRITTEN MARKET | |||||||||||||||||||||
| Commodity Risk Exposure: | ||||||||||||||||||||||||||||
AQR Global Macro Fund | $ | 304,867 | $ | 13,428 | $ | — | $ | 143,176 | $ | — | $ | — | $ | — | ||||||||||||||
AQR Managed Futures Strategy Fund | 76,118,720 | 9,693,298 | — | 37,695,037 | 4,677,791 | — | — | |||||||||||||||||||||
AQR Managed Futures Strategy HV Fund | 5,941,533 | 745,077 | — | 2,823,475 | 394,627 | — | — | |||||||||||||||||||||
AQR Multi-Strategy Alternative Fund | 5,372,941 | 703,586 | — | 3,493,210 | 2,055,016 | — | — | |||||||||||||||||||||
AQR Risk-Balanced Commodities Strategy Fund | 2,301,510 | 323,845 | — | 5,656,632 | 557,767 | — | — | |||||||||||||||||||||
AQR Risk Parity Fund | 1,611,720 | 94,570 | — | 6,061,734 | 652,141 | — | — | |||||||||||||||||||||
AQR Risk Parity II HV Fund | 232,816 | 12,771 | — | 851,454 | 106,327 | — | — | |||||||||||||||||||||
AQR Risk Parity II MV Fund | 342,386 | 93,566 | — | 1,223,392 | 301,593 | — | — | |||||||||||||||||||||
AQR Style Premia Alternative Fund | 4,215,663 | 24,098 | — | 9,509,556 | 3,409,047 | — | — | |||||||||||||||||||||
AQR Style Premia Alternative LV Fund | 295,034 | 8,446 | — | 421,703 | 174,695 | — | — | |||||||||||||||||||||
| Netting: | ||||||||||||||||||||||||||||
AQR Diversified Arbitrage Fund | (337,876 | ) | (4,729,375 | ) | (364,388 | ) | (337,876 | ) | (4,729,375 | ) | (364,388 | ) | — | |||||||||||||||
AQR Equity Market Neutral Fund | — | (376,337 | ) | (54,341 | ) | — | (376,337 | ) | (54,341 | ) | — | |||||||||||||||||
AQR Global Macro Fund | (1,069,384 | ) | (3,889,456 | ) | (306,582 | ) | (1,069,384 | ) | (3,889,456 | ) | (306,582 | ) | — | |||||||||||||||
AQR Long-Short Equity Fund | (443,590 | ) | (5,455,052 | ) | (699,605 | ) | (443,590 | ) | (5,455,052 | ) | (699,605 | ) | — | |||||||||||||||
AQR Managed Futures Strategy Fund | (95,285,217 | ) | (9,008,678 | ) | (154,800,955 | ) | (95,285,217 | ) | (9,008,678 | ) | (154,800,955 | ) | — | |||||||||||||||
AQR Managed Futures Strategy HV Fund | (7,485,537 | ) | (732,814 | ) | (12,115,744 | ) | (7,485,537 | ) | (732,814 | ) | (12,115,744 | ) | — | |||||||||||||||
AQR Multi-Strategy Alternative Fund | (11,353,381 | ) | (13,909,218 | ) | (22,536,170 | ) | (11,353,381 | ) | (13,909,218 | ) | (22,536,170 | ) | — | |||||||||||||||
AQR Risk-Balanced Commodities Strategy Fund | (2,301,510 | ) | (323,845 | ) | — | (2,301,510 | ) | (323,845 | ) | — | — | |||||||||||||||||
AQR Risk Parity Fund | (3,145,022 | ) | (5,130,266 | ) | (991,423 | ) | (3,145,022 | ) | (5,130,266 | ) | (991,423 | ) | — | |||||||||||||||
AQR Risk Parity II HV Fund | (485,572 | ) | (36,390 | ) | (41,152 | ) | (485,572 | ) | (36,390 | ) | (41,152 | ) | — | |||||||||||||||
AQR Risk Parity II MV Fund | (718,844 | ) | (121,247 | ) | (55,018 | ) | (718,844 | ) | (121,247 | ) | (55,018 | ) | — | |||||||||||||||
AQR Style Premia Alternative Fund | (16,022,526 | ) | (2,392,364 | ) | (11,836,195 | ) | (16,022,526 | ) | (2,392,364 | ) | (11,836,195 | ) | — | |||||||||||||||
AQR Style Premia Alternative LV Fund | (980,729 | ) | (366,986 | ) | (679,517 | ) | (980,729 | ) | (366,986 | ) | (679,517 | ) | — | |||||||||||||||
| Net Fair Value of Derivative Contracts: | ||||||||||||||||||||||||||||
AQR Diversified Arbitrage Fund | — | 79,996 | 1,103,340 | 197,103 | — | — | 201,436 | |||||||||||||||||||||
AQR Equity Market Neutral Fund | — | 5,700,163 | — | — | — | 69,738 | — | |||||||||||||||||||||
AQR Global Macro Fund | — | 695,355 | 509,822 | 4,536 | — | — | — | |||||||||||||||||||||
AQR Long-Short Equity Fund | 3,296,263 | 367,688 | 265,049 | — | — | — | — | |||||||||||||||||||||
AQR Managed Futures Strategy Fund | — | 10,071,914 | — | 3,574,189 | — | 41,644,309 | — | |||||||||||||||||||||
AQR Managed Futures Strategy HV Fund | — | 688,396 | — | 175,443 | — | 3,286,372 | — | |||||||||||||||||||||
AQR Multi-Strategy Alternative Fund | — | 136,924,267 | 13,710,189 | 2,569,832 | — | — | — | |||||||||||||||||||||
AQR Risk-Balanced Commodities Strategy Fund | — | — | — | 3,355,122 | 233,922 | — | — | |||||||||||||||||||||
AQR Risk Parity Fund | — | 4,217,494 | — | 5,175,700 | — | 3,920,690 | — | |||||||||||||||||||||
AQR Risk Parity II HV Fund | — | — | — | 710,634 | 104,328 | 116,867 | — | |||||||||||||||||||||
AQR Risk Parity II MV Fund | — | — | — | 1,014,437 | 234,452 | 154,047 | — | |||||||||||||||||||||
AQR Style Premia Alternative Fund | — | — | 7,632,293 | 20,031,628 | 22,923,849 | — | — | |||||||||||||||||||||
AQR Style Premia Alternative LV Fund | — | 1,309,741 | 390,034 | 1,020,304 | — | — | — | |||||||||||||||||||||
| * | May include cumulative appreciation (depreciation) of exchange-traded and centrally cleared derivatives as reported in the Schedules of Investments. Only current day’s variation margin is reported within the Statements of Assets and Liabilities for exchange traded derivatives. |
| AQR Funds | Annual Report | December 2015 | ||||||||||||||
370
Table of Contents
| Notes to Financial Statements | December 31, 2015 |
The following table indicates the effect of derivative instruments, by primary underlying risk exposure and contract type, on the Statements of Operations for the year ended December 31, 2015:
| REALIZED GAIN (LOSS) ON DERIVATIVES RECOGNIZED AS A RESULT FROM OPERATIONS | NET CHANGE IN UNREALIZED APPRECIATION (DEPRECIATION) ON DERIVATIVES RECOGNIZED AS A RESULT FROM OPERATIONS | |||||||||||||||||||||||||||||||
| FUND | FUTURES CONTRACTS | SWAP CONTRACTS | FORWARD CURRENCY EXCHANGE CONTRACTS | WRITTEN OPTIONS | FUTURES CONTRACTS | SWAP CONTRACTS | FORWARD CURRENCY EXCHANGE CONTRACTS | WRITTEN OPTIONS | ||||||||||||||||||||||||
| Equity Risk Exposure: | ||||||||||||||||||||||||||||||||
AQR Diversified Arbitrage Fund | $ | (9,126,737 | ) | $ | 27,187,587 | $ | — | $ | 854,357 | $ | 11,642,869 | $ | (22,507,896 | ) | $ | — | $ | 588,688 | ||||||||||||||
AQR Equity Market Neutral Fund | 172,181 | 3,165,894 | — | — | 7,134 | 5,370,356 | — | — | ||||||||||||||||||||||||
AQR Global Macro Fund | (2,643,180 | ) | (331,830 | ) | — | — | 15,533 | 87,024 | — | — | ||||||||||||||||||||||
AQR Long-Short Equity Fund | (1,896,816 | ) | 32,625,929 | — | — | 2,366,022 | (3,123,427 | ) | — | — | ||||||||||||||||||||||
AQR Managed Futures Strategy Fund | (96,989,797 | ) | (87,737,201 | ) | — | — | (39,941,613 | ) | (1,642,887 | ) | — | — | ||||||||||||||||||||
AQR Managed Futures Strategy HV Fund | (10,202,806 | ) | (5,222,277 | ) | — | — | (2,342,473 | ) | 50,714 | — | — | |||||||||||||||||||||
AQR Multi-Strategy Alternative Fund | (30,028,416 | ) | 119,146,728 | — | 103,616 | 4,657,889 | 76,468,157 | — | 135,144 | |||||||||||||||||||||||
AQR Risk Parity Fund | (1,427,918 | ) | (4,175,487 | ) | — | — | (3,588,240 | ) | (730,160 | ) | — | — | ||||||||||||||||||||
AQR Risk Parity II HV Fund | (573,459 | ) | (733,812 | ) | — | — | (569,003 | ) | (104,572 | ) | — | — | ||||||||||||||||||||
AQR Risk Parity II MV Fund | 69 | (903,166 | ) | — | — | (810,880 | ) | (166,631 | ) | — | — | |||||||||||||||||||||
AQR Style Premia Alternative Fund | 11,140,153 | 145,847,255 | — | — | (7,863,725 | ) | (35,917,738 | ) | — | — | ||||||||||||||||||||||
AQR Style Premia Alternative LV Fund | 732,461 | 2,661,574 | — | — | (562,828 | ) | 1,149,948 | — | — | |||||||||||||||||||||||
| Foreign Exchange Rate Risk Exposure: | ||||||||||||||||||||||||||||||||
AQR Diversified Arbitrage Fund | — | — | 14,688,702 | — | — | — | (5,362,743 | ) | — | |||||||||||||||||||||||
AQR Equity Market Neutral Fund | — | — | 183,996 | — | — | — | (76,949 | ) | — | |||||||||||||||||||||||
AQR Global Macro Fund | — | — | 2,362,397 | — | — | — | 271,754 | — | ||||||||||||||||||||||||
AQR Long-Short Equity Fund | — | — | (2,242,959 | ) | — | — | — | 410,684 | — | |||||||||||||||||||||||
AQR Managed Futures Strategy Fund | — | — | 71,394,607 | — | — | — | (108,211,860 | ) | — | |||||||||||||||||||||||
AQR Managed Futures Strategy HV Fund | — | — | 1,411,097 | — | — | — | (6,025,948 | ) | — | |||||||||||||||||||||||
AQR Multi-Strategy Alternative Fund | — | — | (538,403 | ) | — | — | — | 8,637,965 | — | |||||||||||||||||||||||
AQR Risk Parity Fund | — | — | (5,018 | ) | — | — | — | (2,037,144 | ) | — | ||||||||||||||||||||||
AQR Risk Parity II HV Fund | — | — | 964,687 | — | — | — | (254,631 | ) | — | |||||||||||||||||||||||
AQR Risk Parity II MV Fund | — | — | 1,586,462 | — | — | — | (357,840 | ) | — | |||||||||||||||||||||||
AQR Style Premia Alternative Fund | — | — | (1,982,878 | ) | — | — | — | 5,169,539 | — | |||||||||||||||||||||||
AQR Style Premia Alternative LV Fund | — | — | (447,375 | ) | — | — | — | 293,841 | — | |||||||||||||||||||||||
| Interest Rate Risk Exposure: | ||||||||||||||||||||||||||||||||
AQR Diversified Arbitrage Fund | (2,250,561 | ) | (1,089,885 | ) | — | — | 263,797 | 190,339 | — | — | ||||||||||||||||||||||
AQR Global Macro Fund | 73,317 | (722,779 | ) | — | — | (368,209 | ) | 208,113 | — | — | ||||||||||||||||||||||
AQR Managed Futures Strategy Fund | 94,257,089 | 12,616,292 | — | — | (109,466,270 | ) | (2,864,195 | ) | — | — | ||||||||||||||||||||||
AQR Managed Futures Strategy HV Fund | 3,816,422 | 610,603 | — | — | (5,591,023 | ) | (1,513 | ) | — | — | ||||||||||||||||||||||
AQR Multi-Strategy Alternative Fund | (5,892,573 | ) | 5,956,025 | — | — | (132,253 | ) | (4,680,751 | ) | — | — | |||||||||||||||||||||
AQR Risk Parity Fund | 1,765,860 | 17,492,510 | — | — | (1,972,021 | ) | (11,213,661 | ) | — | — | ||||||||||||||||||||||
AQR Risk Parity II HV Fund | 750,910 | 1,200,333 | — | — | (721,775 | ) | (483,301 | ) | — | — | ||||||||||||||||||||||
AQR Risk Parity II MV Fund | 2,214,551 | 1,346,117 | — | — | (1,228,606 | ) | (457,135 | ) | — | — | ||||||||||||||||||||||
AQR Style Premia Alternative Fund | (16,721,709 | ) | (741,583 | ) | — | — | (1,839,497 | ) | 147,948 | — | — | |||||||||||||||||||||
AQR Style Premia Alternative LV Fund | (1,008,317 | ) | 90,088 | — | — | (82,230 | ) | (19,252 | ) | — | — | |||||||||||||||||||||
| AQR Funds | Annual Report | December 2015 | ||||||||||||||
371
Table of Contents
| Notes to Financial Statements | December 31, 2015 |
| REALIZED GAIN (LOSS) ON DERIVATIVES RECOGNIZED AS A RESULT FROM OPERATIONS | NET CHANGE IN UNREALIZED APPRECIATION (DEPRECIATION) ON DERIVATIVES RECOGNIZED AS A RESULT FROM OPERATIONS | |||||||||||||||||||||||||||||||
| FUND | FUTURES CONTRACTS | SWAP CONTRACTS | FORWARD CURRENCY EXCHANGE CONTRACTS | WRITTEN OPTIONS | FUTURES CONTRACTS | SWAP CONTRACTS | FORWARD CURRENCY EXCHANGE CONTRACTS | WRITTEN OPTIONS | ||||||||||||||||||||||||
| Credit Risk Exposure: | ||||||||||||||||||||||||||||||||
AQR Diversified Arbitrage Fund | $ | — | $ | (4,611,589 | ) | $ | — | $ | — | $ | — | $ | 1,809,475 | $ | — | $ | — | |||||||||||||||
AQR Multi-Strategy Alternative Fund | — | 909,829 | — | — | — | (683,712 | ) | — | — | |||||||||||||||||||||||
AQR Risk Parity Fund | — | 2,141,907 | — | — | — | (13,703 | ) | — | — | |||||||||||||||||||||||
| Commodity Risk Exposure: | ||||||||||||||||||||||||||||||||
AQR Diversified Arbitrage Fund | 34,465 | — | — | — | — | — | — | — | ||||||||||||||||||||||||
AQR Global Macro Fund | 2,941,011 | (223,858 | ) | — | — | (44,802 | ) | (74,440 | ) | — | — | |||||||||||||||||||||
AQR Managed Futures Strategy Fund | 606,052,035 | (110,823,828 | ) | — | — | (63,630,122 | ) | 8,672,323 | — | — | ||||||||||||||||||||||
AQR Managed Futures Strategy HV Fund | 34,282,866 | (3,097,719 | ) | — | — | (276,937 | ) | (1,477,750 | ) | — | — | |||||||||||||||||||||
AQR Multi-Strategy Alternative Fund | 27,145,294 | 4,048,648 | — | — | (362,200 | ) | (13,569,053 | ) | — | — | ||||||||||||||||||||||
AQR Risk-Balanced Commodities Strategy Fund | (10,569,395 | ) | (11,644,594 | ) | — | — | (2,632,951 | ) | 5,127,621 | — | — | |||||||||||||||||||||
AQR Risk Parity Fund | (21,680,304 | ) | (27,145,056 | ) | — | — | (4,426,392 | ) | 19,921,210 | — | — | |||||||||||||||||||||
AQR Risk Parity II HV Fund | (5,301,926 | ) | (2,490,274 | ) | — | — | (126,400 | ) | 2,051,033 | — | — | |||||||||||||||||||||
AQR Risk Parity II MV Fund | (5,905,373 | ) | (3,570,492 | ) | — | — | (145,094 | ) | 2,806,411 | — | — | |||||||||||||||||||||
AQR Style Premia Alternative Fund | 27,072,604 | (2,280,639 | ) | — | — | (7,170,703 | ) | (3,534,970 | ) | — | — | |||||||||||||||||||||
AQR Style Premia Alternative LV Fund | 640,460 | (169,181 | ) | — | — | (245,666 | ) | (167,033 | ) | — | — | |||||||||||||||||||||
The following tables present the Funds’ gross OTC derivative assets and liabilities by counterparty and contract type net of amounts available for offset under netting arrangements and any related collateral received or posted by the Funds’ as of December 31, 2015.
AQR DIVERSIFIED ARBITRAGE FUND
GROSS AMOUNTS NOT OFFSET IN THE | ||||||||||||||||||||||||||
| COUNTERPARTY | INVESTMENT TYPE | GROSS AMOUNTS OF | GROSS AMOUNTS OFFSET | NET AMOUNTS OF ASSETS | FINANCIAL INSTRUMENTS | COLLATERAL RECEIVED | NET AMOUNT | |||||||||||||||||||
| Bank of America | Total Return Basket Swaps Contracts | $ | 126,482 | $ | — | $ | 126,482 | $ | — | $ | — | $ | 126,482 | |||||||||||||
| CitiBank | Forward Foreign Currency Exchange Contracts | 745,460 | (138,457 | ) | 607,003 | — | — | 607,003 | ||||||||||||||||||
| Credit Suisse International | Forward Foreign Currency Exchange Contracts | 722,268 | (225,931 | ) | 496,337 | — | (430,000 | ) | 66,337 | |||||||||||||||||
| Deutsche Bank | Total Return Basket Swaps Contracts | 3,750,742 | (3,110,613 | ) | 640,129 | — | — | 640,129 | ||||||||||||||||||
| J.P.Morgan | Total Return Basket Swaps Contracts | 561,243 | — | 561,243 | — | — | 561,243 | |||||||||||||||||||
| Total financial instruments subject to a master netting arrangement or similar arrangement | 5,906,195 | (3,475,001 | ) | 2,431,194 | — | (430,000 | ) | 2,001,194 | ||||||||||||||||||
| AQR Funds | Annual Report | December 2015 | ||||||||||||||
372
Table of Contents
| Notes to Financial Statements | December 31, 2015 |
AQR DIVERSIFIED ARBITRAGE FUND (continued)
GROSS AMOUNTS NOT OFFSET IN THE | ||||||||||||||||||||||||||
| COUNTERPARTY | INVESTMENT TYPE | GROSS AMOUNTS OF | GROSS AMOUNTS OFFSET | NET AMOUNTS OF LIABILITIES | FINANCIAL INSTRUMENTS | COLLATERAL PLEDGED (a) | NET AMOUNT | |||||||||||||||||||
| CitiBank | Forward Foreign Currency Exchange Contracts | $ | 138,457 | $ | (138,457 | ) | $ | — | $ | — | $ | — | $ | — | ||||||||||||
| Credit Suisse International | Forward Foreign Currency Exchange Contracts | 225,931 | (225,931 | ) | — | — | — | — | ||||||||||||||||||
| Deutsche Bank | Total Return Basket Swaps Contracts | 3,110,613 | (3,110,613 | ) | — | — | — | — | ||||||||||||||||||
| Total financial instruments subject to a master netting arrangement or similar arrangement | 3,475,001 | (3,475,001 | ) | — | — | — | — | |||||||||||||||||||
| (a) | Per GAAP disclosure requirements, the table above does not include the additional collateral pledged to the counterparty. Total additional collateral pledged was $49,486,873. |
AQR EQUITY MARKET NEUTRAL FUND
| GROSS AMOUNTS NOT OFFSET IN THE STATEMENT OF ASSETS & LIABILITIES | ||||||||||||||||||||||||||
| COUNTERPARTY | INVESTMENT TYPE | GROSS AMOUNTS OF | GROSS AMOUNTS OFFSET | �� | NET AMOUNTS OF ASSETS | FINANCIAL INSTRUMENTS | COLLATERAL RECEIVED | NET AMOUNT | ||||||||||||||||||
| CitiBank | Forward Foreign Currency Exchange Contracts | $ | 54,341 | $ | (54,341 | ) | $ | — | $ | — | $ | — | $ | — | ||||||||||||
| Morgan Stanley Capital Services, Inc. |
Total Return Basket Swaps Contracts | 6,076,500 | (376,337 | ) | 5,700,163 | — | — | 5,700,163 | ||||||||||||||||||
| Total financial instruments subject to a master netting arrangement or similar arrangement | 6,130,841 | (430,678 | ) | 5,700,163 | — | — | 5,700,163 | |||||||||||||||||||
| AQR Funds | Annual Report | December 2015 | ||||||||||||||
373
Table of Contents
| Notes to Financial Statements | December 31, 2015 |
AQR EQUITY MARKET NEUTRAL FUND (continued)
| GROSS AMOUNTS NOT OFFSET IN THE STATEMENT OF ASSETS & LIABILITIES | ||||||||||||||||||||||||||
| COUNTERPARTY | INVESTMENT TYPE | GROSS AMOUNTS OF | GROSS AMOUNTS OFFSET | NET AMOUNTS OF LIABILITIES | FINANCIAL INSTRUMENTS | COLLATERAL PLEDGED (a) | NET AMOUNT | |||||||||||||||||||
| CitiBank | Forward Foreign Currency Exchange Contracts | $ | 59,026 | $ | (54,341 | ) | $ | 4,685 | $ | — | $ | (4,685 | ) | $ | — | |||||||||||
| Credit Suisse International | Forward Foreign Currency Exchange Contracts | 65,053 | — | 65,053 | — | — | 65,053 | |||||||||||||||||||
| Morgan Stanley Capital Services, Inc. |
Total Return Basket Swaps Contracts | 376,337 | (376,337 | ) | — | — | — | — | ||||||||||||||||||
| Total financial instruments subject to a master netting arrangement or similar arrangement | 500,416 | (430,678 | ) | 69,738 | — | (4,685 | ) | 65,053 | ||||||||||||||||||
| (a) | Per GAAP disclosure requirements, the table above does not include the additional collateral pledged to the counterparty. Total additional collateral pledged was $44,895,315. |
AQR GLOBAL MACRO FUND
| GROSS AMOUNTS NOT OFFSET IN THE STATEMENT OF ASSETS & LIABILITIES | ||||||||||||||||||||||||||
| COUNTERPARTY | INVESTMENT TYPE | GROSS AMOUNTS OF | GROSS AMOUNTS OFFSET | NET AMOUNTS OF ASSETS | FINANCIAL INSTRUMENTS | COLLATERAL RECEIVED (a) | NET AMOUNT | |||||||||||||||||||
| Bank of America | Total Return Swap Contracts | $ | 111,154 | $ | (17,137 | ) | $ | 94,017 | $ | — | $ | (94,017 | ) | $ | — | |||||||||||
| CitiBank | Forward Foreign Currency Exchange Contracts | 409,767 | (155,528 | ) | 254,239 | — | — | 254,239 | ||||||||||||||||||
| Credit Suisse International | Forward Foreign Currency Exchange Contracts | 406,637 | (151,054 | ) | 255,583 | — | (230,000 | ) | 25,583 | |||||||||||||||||
| Total financial instruments subject to a master netting arrangement or similar arrangement | 927,558 | (323,719 | ) | 603,839 | — | (324,017 | ) | 279,822 | ||||||||||||||||||
| AQR Funds | �� | Annual Report | December 2015 | |||||||||||||
374
Table of Contents
| Notes to Financial Statements | December 31, 2015 |
AQR GLOBAL MACRO FUND (continued)
| GROSS AMOUNTS NOT OFFSET IN THE STATEMENT OF ASSETS & LIABILITIES | ||||||||||||||||||||||||||
| COUNTERPARTY | INVESTMENT TYPE | GROSS AMOUNTS OF | GROSS AMOUNTS OFFSET | NET AMOUNTS OF LIABILITIES | FINANCIAL INSTRUMENTS | COLLATERAL PLEDGED (b) | NET AMOUNT | |||||||||||||||||||
| Bank of America | Total Return Swap Contracts | $ | 17,137 | $ | (17,137 | ) | $ | — | $ | — | $ | — | $ | — | ||||||||||||
| CitiBank | Forward Foreign Currency Exchange Contracts | 155,528 | (155,528 | ) | — | — | — | — | ||||||||||||||||||
| Credit Suisse International | Forward Foreign Currency Exchange Contracts | 151,054 | (151,054 | ) | — | — | — | — | ||||||||||||||||||
| Goldman Sachs | Total Return Swap Contracts | 963 | — | 963 | — | — | 963 | |||||||||||||||||||
| Total financial instruments subject to a master netting arrangement or similar arrangement | 324,682 | (323,719 | ) | 963 | — | — | 963 | |||||||||||||||||||
| (a) | Per GAAP disclosure requirements, the table above does not include the additional collateral received from the counterparty. Total additional collateral received was $15,983. |
| (b) | Per GAAP disclosure requirements, the table above does not include the additional collateral pledged to the counterparty. Total additional collateral pledged was $30,001. |
AQR GLOBAL MACRO OFFSHORE FUND LTD.
| GROSS AMOUNTS NOT OFFSET IN THE STATEMENT OF ASSETS & LIABILITIES | ||||||||||||||||||||||||||
| COUNTERPARTY | INVESTMENT TYPE | GROSS AMOUNTS OF | GROSS AMOUNTS OFFSET | NET AMOUNTS OF ASSETS | FINANCIAL INSTRUMENTS | COLLATERAL RECEIVED (a) | NET AMOUNT | |||||||||||||||||||
| CitiBank | Total Return Swap Contracts | $ | 8,108 | $ | — | $ | 8,108 | $ | — | $ | — | $ | 8,108 | |||||||||||||
| Deutsche Bank | Total Return Swap Contracts | 3,844 | — | 3,844 | — | — | 3,844 | |||||||||||||||||||
| Macquarie Capital | Total Return Swap Contracts | 1,476 | — | 1,476 | — | — | 1,476 | |||||||||||||||||||
| Total financial instruments subject to a master netting arrangement or similar arrangement | 13,428 | — | 13,428 | — | — | 13,428 | ||||||||||||||||||||
| (a) | Per GAAP disclosure requirements, the table above does not include the additional collateral pledged to the counterparty. Total additional collateral pledged was $60,001. |
| AQR Funds | Annual Report | December 2015 | ||||||||||||||
375
Table of Contents
| Notes to Financial Statements | December 31, 2015 |
AQR LONG-SHORT EQUITY FUND
| GROSS AMOUNTS NOT OFFSET IN THE STATEMENT OF ASSETS & LIABILITIES | ||||||||||||||||||||||||||
| COUNTERPARTY | INVESTMENT TYPE | GROSS AMOUNTS OF | GROSS AMOUNTS OFFSET | NET AMOUNTS OF ASSETS | FINANCIAL INSTRUMENTS | COLLATERAL RECEIVED (a) | NET AMOUNT | |||||||||||||||||||
| CitiBank | Forward Foreign Currency Exchange Contracts | $ | 437,051 | $ | (349,534 | ) | $ | 87,517 | $ | — | $ | — | $ | 87,517 | ||||||||||||
| Credit Suisse International | Forward Foreign Currency Exchange Contracts | 527,603 | (350,071 | ) | 177,532 | — | (177,532 | ) | — | |||||||||||||||||
| Goldman Sachs | Total Return Swap Contracts | 414,386 | — | 414,386 | — | — | 414,386 | |||||||||||||||||||
| Deutsche Bank | Total Return Basket Swaps Contracts | 5,408,354 | — | 5,408,354 | — | — | 5,408,354 | |||||||||||||||||||
| Total financial instruments subject to a master netting arrangement or similar arrangement | 6,787,394 | (699,605 | ) | 6,087,789 | — | (177,532 | ) | 5,910,257 | ||||||||||||||||||
| GROSS AMOUNTS NOT OFFSET IN THE STATEMENT OF ASSETS & LIABILITIES | ||||||||||||||||||||||||||
| COUNTERPARTY | INVESTMENT TYPE | GROSS AMOUNTS OF RECOGNIZED | GROSS AMOUNTS OFFSET | NET AMOUNTS OF LIABILITIES | FINANCIAL INSTRUMENTS | COLLATERAL PLEDGED (b) | NET AMOUNT | |||||||||||||||||||
| CitiBank | Forward Foreign Currency Exchange Contracts | $ | 349,534 | $ | (349,534 | ) | $ | — | $ | — | $ | — | $ | — | ||||||||||||
| Credit Suisse International | Forward Foreign Currency Exchange Contracts | 350,071 | (350,071 | ) | — | — | — | — | ||||||||||||||||||
| Goldman Sachs | Total Return Basket Swaps Contracts | 5,455,052 | — | 5,455,052 | — | (5,455,052 | ) | — | ||||||||||||||||||
| Total financial instruments subject to a master netting arrangement or similar arrangement | 6,154,657 | (699,605 | ) | 5,455,052 | — | (5,455,052 | ) | — | ||||||||||||||||||
| (a) | Per GAAP disclosure requirements, the table above does not include the additional collateral received from the counterparty. Total additional collateral received was $112,468. |
| (b) | Per GAAP disclosure requirements, the table above does not include the additional collateral pledged to the counterparty. Total additional collateral pledged was $124,955,017. |
| AQR Funds | Annual Report | December 2015 | ||||||||||||||
376
Table of Contents
| Notes to Financial Statements | December 31, 2015 |
AQR MANAGED FUTURES STRATEGY FUND
| GROSS AMOUNTS NOT OFFSET IN THE STATEMENT OF ASSETS & LIABILITIES | ||||||||||||||||||||||||||
| COUNTERPARTY | INVESTMENT TYPE | GROSS RECOGNIZED | GROSS AMOUNTS OFFSET | NET AMOUNTS OF ASSETS | FINANCIAL INSTRUMENTS | COLLATERAL RECEIVED | NET AMOUNT | |||||||||||||||||||
| Bank of America | Total Return Swaps Contracts | $ | 7,860,024 | $ | (3,664,820 | ) | $ | 4,195,204 | $ | — | $ | — | $ | 4,195,204 | ||||||||||||
| CitiBank | Forward Foreign Currency Exchange Contracts | 77,378,599 | (77,378,599 | ) | — | — | — | — | ||||||||||||||||||
| Credit Suisse International | Forward Foreign Currency Exchange Contracts | 77,422,356 | (77,422,356 | ) | — | — | — | — | ||||||||||||||||||
| Morgan Stanley and Co., International PLC |
Total Return Swaps Contracts | 1,527,270 | (666,067 | ) | 861,203 | — | — | 861,203 | ||||||||||||||||||
| Total financial instruments subject to a master netting arrangement or similar arrangement | 164,188,249 | (159,131,842 | ) | 5,056,407 | — | — | 5,056,407 | |||||||||||||||||||
| GROSS AMOUNTS NOT OFFSET IN THE STATEMENT OF ASSETS & LIABILITIES | ||||||||||||||||||||||||||
| COUNTERPARTY | INVESTMENT TYPE | GROSS RECOGNIZED | GROSS AMOUNTS OFFSET | NET AMOUNTS OF LIABILITIES | FINANCIAL INSTRUMENTS | COLLATERAL PLEDGED (a) | NET AMOUNT | |||||||||||||||||||
| Bank of America | Total Return Swaps Contracts | $ | 3,664,820 | $ | (3,664,820 | ) | $ | — | $ | — | $ | — | $ | — | ||||||||||||
| CitiBank | Forward Foreign Currency Exchange Contracts | 98,171,355 | (77,378,599 | ) | 20,792,756 | — | (20,792,756 | ) | — | |||||||||||||||||
| Credit Suisse International | Forward Foreign Currency Exchange Contracts | 98,273,909 | (77,422,356 | ) | 20,851,553 | — | (20,851,553 | ) | — | |||||||||||||||||
| Morgan Stanley and Co., International PLC |
Total Return Swaps Contracts | 666,067 | (666,067 | ) | — | — | — | — | ||||||||||||||||||
| Total financial instruments subject to a master netting arrangement or similar arrangement | 200,776,151 | (159,131,842 | ) | 41,644,309 | — | (41,644,309 | ) | — | ||||||||||||||||||
| (a) | Per GAAP disclosure requirements, the table above does not include the additional collateral pledged to the counterparty. Total additional collateral pledged was $117,296,902. |
| AQR Funds | Annual Report | December 2015 | ||||||||||||||
377
Table of Contents
| Notes to Financial Statements | December 31, 2015 |
AQR MANAGED FUTURES STRATEGY OFFSHORE FUND LTD.
| GROSS AMOUNTS NOT OFFSET IN THE STATEMENT OF ASSETS & LIABILITIES | ||||||||||||||||||||||||||
| COUNTERPARTY | INVESTMENT TYPE | GROSS AMOUNTS OF RECOGNIZED ASSETS PRESENTED IN THE STATEMENT OF ASSETS & LIABILITIES | GROSS AMOUNTS OFFSET | NET AMOUNTS OF ASSETS | FINANCIAL INSTRUMENTS | COLLATERAL RECEIVED | NET AMOUNT | |||||||||||||||||||
| CitiBank | Total Return Swaps Contracts | $ | 5,459,617 | $ | (1,665,026 | ) | $ | 3,794,591 | $ | — | $ | — | $ | 3,794,591 | ||||||||||||
| Deutsche Bank | Total Return Swap Contracts | 2,422,632 | — | 2,422,632 | — | — | 2,422,632 | |||||||||||||||||||
| Macquarie Capital | Total Return Swap Contracts | 431,652 | (431,652 | ) | — | — | — | — | ||||||||||||||||||
| Societe Generale | Total Return Swap Contracts | 1,379,397 | (708,674 | ) | 670,723 | — | — | 670,723 | ||||||||||||||||||
| Total financial instruments subject to a master netting arrangement or similar arrangement | 9,693,298 | (2,805,352 | ) | 6,887,946 | — | — | 6,887,946 | |||||||||||||||||||
| GROSS AMOUNTS NOT OFFSET IN THE STATEMENT OF ASSETS & LIABILITIES | ||||||||||||||||||||||||||
| COUNTERPARTY | INVESTMENT TYPE | GROSS AMOUNTS OF RECOGNIZED LIABILITIES PRESENTED IN THE STATEMENT OF ASSETS & LIABILITIES | GROSS AMOUNTS OFFSET | NET AMOUNTS OF LIABILITIES | FINANCIAL INSTRUMENTS | COLLATERAL PLEDGED (a) | NET AMOUNT | |||||||||||||||||||
| CitiBank | Total Return Swap Contracts | $ | 1,665,026 | $ | (1,665,026 | ) | $ | — | $ | — | $ | — | $ | — | ||||||||||||
| Macquarie Capital | Total Return Swap Contracts | 1,997,101 | (431,652 | ) | 1,565,449 | — | (1,565,449 | ) | — | |||||||||||||||||
| Merrill Lynch | Total Return Swap Contracts | 306,990 | — | 306,990 | — | (306,990 | ) | — | ||||||||||||||||||
| Societe Generale | Total Return Swap Contracts | 708,674 | (708,674 | ) | — | — | — | — | ||||||||||||||||||
| Total financial instruments subject to a master netting arrangement or similar arrangement | 4,677,791 | (2,805,352 | ) | 1,872,439 | — | (1,872,439 | ) | — | ||||||||||||||||||
| (a) | Per GAAP disclosure requirements, the table above does not include the additional collateral pledged to the counterparty. Total additional collateral pledged was $15,439,085. |
| AQR Funds | Annual Report | December 2015 | ||||||||||||||
378
Table of Contents
| Notes to Financial Statements | December 31, 2015 |
AQR MANAGED FUTURES STRATEGY HV FUND
| GROSS AMOUNTS NOT OFFSET IN THE STATEMENT OF ASSETS & LIABILITIES | ||||||||||||||||||||||||||
| COUNTERPARTY | INVESTMENT TYPE | GROSS AMOUNTS OF RECOGNIZED ASSETS PRESENTED IN THE STATEMENT OF ASSETS & LIABILITIES | GROSS AMOUNTS OFFSET | NET AMOUNTS OF ASSETS | FINANCIAL INSTRUMENTS | COLLATERAL RECEIVED | NET AMOUNT | |||||||||||||||||||
| Bank of America | Total Return Swap Contracts | $ | 676,133 | $ | (285,574 | ) | $ | 390,559 | $ | — | $ | — | $ | 390,559 | ||||||||||||
| CitiBank | Forward Foreign Currency Exchange Contracts | 6,056,283 | (6,056,283 | ) | — | — | — | — | ||||||||||||||||||
| Credit Suisse International | Forward Foreign Currency Exchange Contracts | 6,059,461 | (6,059,461 | ) | — | — | — | — | ||||||||||||||||||
| Total financial instruments subject to a master netting arrangement or similar arrangement | 12,791,877 | (12,401,318 | ) | 390,559 | — | — | 390,559 | |||||||||||||||||||
| GROSS AMOUNTS NOT OFFSET IN THE STATEMENT OF ASSETS & LIABILITIES | ||||||||||||||||||||||||||
| COUNTERPARTY | INVESTMENT TYPE | GROSS AMOUNTS OF RECOGNIZED LIABILITIES PRESENTED IN THE STATEMENT OF ASSETS & LIABILITIES | GROSS AMOUNTS OFFSET | NET AMOUNTS OF LIABILITIES | FINANCIAL INSTRUMENTS | COLLATERAL PLEDGED (a) | NET AMOUNT | |||||||||||||||||||
| Bank of America | Total Return Swap Contracts | $ | 285,574 | $ | (285,574 | ) | $ | — | $ | — | $ | — | $ | — | ||||||||||||
| CitiBank | Forward Foreign Currency Exchange Contracts | 7,697,030 | (6,056,283 | ) | 1,640,747 | — | (1,640,747 | ) | — | |||||||||||||||||
| Credit Suisse International | Forward Foreign Currency Exchange Contracts | 7,705,086 | (6,059,461 | ) | 1,645,625 | — | (1,645,625 | ) | — | |||||||||||||||||
| Goldman Sachs | Total Return Swap Contracts | 52,613 | — | 52,613 | — | (52,613 | ) | — | ||||||||||||||||||
| Total financial instruments subject to a master netting arrangement or similar arrangement | 15,740,303 | (12,401,318 | ) | 3,338,985 | — | (3,338,985 | ) | — | ||||||||||||||||||
| (a) | Per GAAP disclosure requirements, the table above does not include the additional collateral pledged to the counterparty. Total additional collateral pledged was $7,541,050. |
| AQR Funds | Annual Report | December 2015 | ||||||||||||||
379
Table of Contents
| Notes to Financial Statements | December 31, 2015 |
AQR MANAGED FUTURES STRATEGY HV OFFSHORE FUND LTD.
| GROSS AMOUNTS NOT OFFSET IN THE STATEMENT OF ASSETS & LIABILITIES | ||||||||||||||||||||||||||
| COUNTERPARTY | INVESTMENT TYPE | GROSS AMOUNTS OF RECOGNIZED ASSETS PRESENTED IN THE STATEMENT OF ASSETS & LIABILITIES | GROSS AMOUNTS OFFSET | NET AMOUNTS OF ASSETS | FINANCIAL INSTRUMENTS | COLLATERAL RECEIVED | NET AMOUNT | |||||||||||||||||||
| CitiBank | Total Return Swap Contracts | $ | 420,351 | $ | (131,635 | ) | $ | 288,716 | $ | — | $ | — | $ | 288,716 | ||||||||||||
| Deutsche Bank | Total Return Swap Contracts | 190,597 | (19,655 | ) | 170,942 | — | — | 170,942 | ||||||||||||||||||
| Macquarie Capital | Total Return Swap Contracts | 40,703 | (40,703 | ) | — | — | — | — | ||||||||||||||||||
| Societe Generale | Total Return Swap Contracts | 93,426 | (65,368 | ) | 28,058 | — | — | 28,058 | ||||||||||||||||||
| Total financial instruments subject to a master netting arrangement or similar arrangement | 745,077 | (257,361 | ) | 487,716 | — | — | 487,716 | |||||||||||||||||||
| GROSS AMOUNTS NOT OFFSET IN THE STATEMENT OF ASSETS & LIABILITIES | ||||||||||||||||||||||||||
| COUNTERPARTY | INVESTMENT TYPE | GROSS AMOUNTS OF RECOGNIZED LIABILITIES PRESENTED IN THE STATEMENT OF ASSETS & LIABILITIES | GROSS AMOUNTS OFFSET | NET AMOUNTS OF LIABILITIES | FINANCIAL INSTRUMENTS | COLLATERAL PLEDGED (a) | NET AMOUNT | |||||||||||||||||||
| CitiBank | Total Return Swap Contracts | $ | 131,635 | $ | (131,635 | ) | $ | — | $ | — | $ | — | $ | — | ||||||||||||
| Deutsche Bank | Total Return Swap Contracts | 19,655 | (19,655 | ) | — | — | — | — | ||||||||||||||||||
| Macquarie Capital | Total Return Swap Contracts | 177,969 | (40,703 | ) | 137,266 | — | (137,266 | ) | — | |||||||||||||||||
| Societe Generale | Total Return Swap Contracts | 65,368 | (65,368 | ) | — | — | — | — | ||||||||||||||||||
| Total financial instruments subject to a master netting arrangement or similar arrangement | 394,627 | (257,361 | ) | 137,266 | — | (137,266 | ) | — | ||||||||||||||||||
| (a) | Per GAAP disclosure requirements, the table above does not include the additional collateral pledged to the counterparty. Total additional collateral pledged was $1,402,765. |
| AQR Funds | Annual Report | December 2015 | ||||||||||||||
380
Table of Contents
| Notes to Financial Statements | December 31, 2015 |
AQR MULTI-STRATEGY ALTERNATIVE FUND
| GROSS AMOUNTS NOT OFFSET IN THE STATEMENT OF ASSETS & LIABILITIES | ||||||||||||||||||||||||||
| COUNTERPARTY | INVESTMENT TYPE | GROSS AMOUNTS OF RECOGNIZED ASSETS PRESENTED IN THE STATEMENT OF ASSETS & LIABILITIES | GROSS AMOUNTS OFFSET | NET AMOUNTS OF ASSETS | FINANCIAL INSTRUMENTS | COLLATERAL RECEIVED | NET AMOUNT | |||||||||||||||||||
| Bank of America | Total Return Swaps Contracts | $ | 236,510 | |||||||||||||||||||||||
| Total Return Basket Swaps Contracts | 25,733 | |||||||||||||||||||||||||
| Total Bank of America | 262,243 | $ | (262,243 | ) | $ | — | $ | — | $ | — | $ | — | ||||||||||||||
| CitiBank | Forward Foreign Currency Exchange Contracts | 18,122,403 | (11,221,808 | ) | 6,900,595 | — | — | 6,900,595 | ||||||||||||||||||
| Credit Suisse International | Forward Foreign Currency Exchange Contracts | 18,123,956 | (11,314,362 | ) | 6,809,594 | — | (4,170,000 | ) | 2,639,594 | |||||||||||||||||
| Deutsche Bank | Total Return Basket Swaps Contracts | 60,433,672 | — | 60,433,672 | — | (600,000 | ) | 59,833,672 | ||||||||||||||||||
| Goldman Sachs | Total Return Basket Swaps Contracts | 2,346,798 | (2,346,798 | ) | — | — | — | — | ||||||||||||||||||
| J.P. Morgan | Total Return Basket Swaps Contracts | 3,754,173 | (2,515,124 | ) | 1,239,049 | — | — | 1,239,049 | ||||||||||||||||||
| Morgan Stanley Capital Services Inc. |
Total Return Basket Swaps Contracts | 81,508,444 | — | 81,508,444 | — | — | 81,508,444 | |||||||||||||||||||
| Morgan Stanley and Co., International PLC |
Total Return Swaps Contracts | 1,630,504 | (1,630,504 | ) | — | — | — | — | ||||||||||||||||||
| Total financial instruments subject to a master netting arrangement or similar arrangement | 186,182,193 | (29,290,839 | ) | 156,891,354 | — | (4,770,000 | ) | 152,121,354 | ||||||||||||||||||
| AQR Funds | Annual Report | December 2015 | ||||||||||||||
381
Table of Contents
| Notes to Financial Statements | December 31, 2015 |
AQR MULTI-STRATEGY ALTERNATIVE FUND (continued)
| GROSS AMOUNTS NOT OFFSET IN THE STATEMENT OF ASSETS & LIABILITIES | ||||||||||||||||||||||||||
| COUNTERPARTY | INVESTMENT TYPE | GROSS AMOUNTS OF RECOGNIZED LIABILITIES PRESENTED IN THE STATEMENT OF ASSETS & LIABILITIES | GROSS AMOUNTS OFFSET | NET AMOUNTS OF LIABILITIES | FINANCIAL INSTRUMENTS | COLLATERAL PLEDGED (a) | NET AMOUNT | |||||||||||||||||||
| Bank of America | Total Return Swap Contracts | $ | 555,470 | $ | (262,243 | ) | $ | 293,227 | $ | — | $ | (293,227 | ) | $ | — | |||||||||||
| CitiBank | Forward Foreign Currency Exchange Contracts | 11,221,808 | (11,221,808 | ) | — | — | — | — | ||||||||||||||||||
| Credit Suisse International | Forward Foreign Currency Exchange Contracts | 11,314,362 | (11,314,362 | ) | — | — | — | — | ||||||||||||||||||
| Goldman Sachs | Total Return Swap Contracts | 185,180 | ||||||||||||||||||||||||
| Total Return Basket Swaps Contracts | 3,188,214 | |||||||||||||||||||||||||
| Total Goldman Sachs | 3,373,394 | (2,346,798 | ) | 1,026,596 | — | (1,026,596 | ) | — | ||||||||||||||||||
| J.P. Morgan | Total Return Basket Swaps Contracts | 2,515,124 | (2,515,124 | ) | — | — | — | — | ||||||||||||||||||
| Morgan Stanley and Co., International PLC | Total Return Swap Contracts | 5,410,214 | (1,630,504 | ) | 3,779,710 | — | (3,779,710 | ) | — | |||||||||||||||||
| Total financial instruments subject to a master netting arrangement or similar arrangement | 34,390,372 | (29,290,839 | ) | 5,099,533 | — | (5,099,533 | ) | — | ||||||||||||||||||
| (a) | Per GAAP disclosure requirements, the table above does not include the additional collateral pledged to the counterparty. Total additional collateral pledged was $468,964,489. |
AQR MULTI-STRATEGY ALTERNATIVE OFFSHORE FUND LTD.
| GROSS AMOUNTS NOT OFFSET IN THE STATEMENT OF ASSETS & LIABILITIES | ||||||||||||||||||||||||||
| COUNTERPARTY | INVESTMENT TYPE | GROSS AMOUNTS OF RECOGNIZED ASSETS PRESENTED IN THE STATEMENT OF ASSETS & LIABILITIES | GROSS AMOUNTS OFFSET | NET AMOUNTS OF ASSETS | FINANCIAL INSTRUMENTS | COLLATERAL RECEIVED | NET AMOUNT | |||||||||||||||||||
| CitiBank | Total Return Swap Contracts | $ | 229,537 | $ | (229,537 | ) | $ | — | $ | — | $ | — | $ | — | ||||||||||||
| Deutsche Bank | Total Return Swap Contracts | 343,170 | (343,170 | ) | — | — | — | — | ||||||||||||||||||
| Societe Generale | Total Return Swap Contracts | 130,879 | (130,879 | ) | — | — | — | — | ||||||||||||||||||
| Total financial instruments subject to a master netting arrangement or similar arrangement | 703,586 | (703,586 | ) | — | — | — | — | |||||||||||||||||||
| AQR Funds | Annual Report | December 2015 | ||||||||||||||
382
Table of Contents
| Notes to Financial Statements | December 31, 2015 |
AQR MULTI-STRATEGY ALTERNATIVE OFFSHORE FUND LTD. (continued)
| GROSS AMOUNTS NOT OFFSET IN THE STATEMENT OF ASSETS & LIABILITIES | ||||||||||||||||||||||||||
| COUNTERPARTY | INVESTMENT TYPE | GROSS AMOUNTS OF RECOGNIZED LIABILITIES PRESENTED IN THE STATEMENT OF ASSETS & LIABILITIES | GROSS AMOUNTS OFFSET | NET AMOUNTS OF LIABILITIES | FINANCIAL INSTRUMENTS | COLLATERAL PLEDGED (a) | NET AMOUNT | |||||||||||||||||||
| CitiBank | Total Return Swap Contracts | $ | 818,451 | $ | (229,537 | ) | $ | 588,914 | $ | — | $ | (588,914 | ) | $ | — | |||||||||||
| Deutsche Bank | Total Return Swap Contracts | 812,337 | (343,170 | ) | 469,167 | — | (469,167 | ) | — | |||||||||||||||||
| Macquarie Capital | Total Return Swap Contracts | 127,909 | — | 127,909 | — | (127,909 | ) | — | ||||||||||||||||||
| Merrill Lynch | Total Return Swap Contracts | 19,190 | — | 19,190 | — | — | 19,190 | |||||||||||||||||||
| Societe Generale | Total Return Swap Contracts | 277,129 | (130,879 | ) | 146,250 | — | (146,250 | ) | — | |||||||||||||||||
| Total financial instruments subject to a master netting arrangement or similar arrangement | 2,055,016 | (703,586 | ) | 1,351,430 | — | (1,332,240 | ) | 19,190 | ||||||||||||||||||
| (a) | Per GAAP disclosure requirements, the table above does not include the additional collateral pledged to the counterparty. Total additional collateral pledged was $3,277,815. |
AQR RISK-BALANCED COMMODITIES STRATEGY OFFSHORE FUND LTD.
| GROSS AMOUNTS NOT OFFSET IN THE STATEMENT OF ASSETS & LIABILITIES | ||||||||||||||||||||||||||
| COUNTERPARTY | INVESTMENT TYPE | GROSS AMOUNTS OF RECOGNIZED ASSETS PRESENTED IN THE STATEMENT OF ASSETS & LIABILITIES | GROSS AMOUNTS OFFSET | NET AMOUNTS OF ASSETS | FINANCIAL INSTRUMENTS | COLLATERAL RECEIVED | NET AMOUNT | |||||||||||||||||||
| CitiBank | Total Return Swaps Contracts | $ | 92,052 | $ | (92,052 | ) | $ | — | $ | — | $ | — | $ | — | ||||||||||||
| Deutsche Bank | Total Return Swaps Contracts | 87,008 | (87,008 | ) | — | — | — | — | ||||||||||||||||||
| Macquarie Capital | Total Return Swaps Contracts | 11,982 | (11,982 | ) | — | — | — | — | ||||||||||||||||||
| Societe Generale | Total Return Swaps Contracts | 132,803 | (90,906 | ) | 41,897 | — | — | 41,897 | ||||||||||||||||||
| Total financial instruments subject to a master netting arrangement or similar arrangement | 323,845 | (281,948 | ) | 41,897 | — | — | 41,897 | |||||||||||||||||||
| AQR Funds | Annual Report | December 2015 | ||||||||||||||
383
Table of Contents
| Notes to Financial Statements | December 31, 2015 |
AQR RISK-BALANCED COMMODITIES STRATEGY OFFSHORE FUND LTD. (continued)
| GROSS AMOUNTS NOT OFFSET IN THE STATEMENT OF ASSETS & LIABILITIES | ||||||||||||||||||||||||||
| COUNTERPARTY | INVESTMENT TYPE | GROSS AMOUNTS OF RECOGNIZED LIABILITIES PRESENTED IN THE STATEMENT OF ASSETS & LIABILITIES | GROSS AMOUNTS OFFSET | NET AMOUNTS OF LIABILITIES | FINANCIAL INSTRUMENTS | COLLATERAL PLEDGED (a) | NET AMOUNT | |||||||||||||||||||
| CitiBank | Total Return Swaps Contracts | $ | 140,257 | $ | (92,052 | ) | $ | 48,205 | $ | — | $ | (48,205 | ) | $ | — | |||||||||||
| Deutsche Bank | Total Return Swaps Contracts | 312,686 | (87,008 | ) | 225,678 | — | (225,678 | ) | — | |||||||||||||||||
| Macquarie Capital | Total Return Swaps Contracts | 13,918 | (11,982 | ) | 1,936 | — | (1,936 | ) | — | |||||||||||||||||
| Societe Generale | Total Return Swaps Contracts | 90,906 | (90,906 | ) | — | — | — | — | ||||||||||||||||||
| Total financial instruments subject to a master netting arrangement or similar arrangement | 557,767 | (281,948 | ) | 275,819 | — | (275,819 | ) | — | ||||||||||||||||||
| (a) | Per GAAP disclosure requirements, the table above does not include the additional collateral pledged to the counterparty. Total additional collateral pledged was $1,684,309. |
AQR RISK PARITY FUND
| GROSS AMOUNTS NOT OFFSET IN THE STATEMENT OF ASSETS & LIABILITIES | ||||||||||||||||||||||||||
| COUNTERPARTY | INVESTMENT TYPE | GROSS AMOUNTS OF RECOGNIZED ASSETS PRESENTED IN THE STATEMENT OF ASSETS & LIABILITIES | GROSS AMOUNTS OFFSET | NET AMOUNTS OF ASSETS | FINANCIAL INSTRUMENTS | COLLATERAL RECEIVED | NET AMOUNT | |||||||||||||||||||
| CitiBank | Forward Foreign Currency Exchange Contracts | $ | 490,044 | $ | (490,044 | ) | $ | — | $ | — | $ | — | $ | — | ||||||||||||
| Interest Rate Swap Contracts | 254,057 | (126,296 | ) | 127,761 | — | — | 127,761 | |||||||||||||||||||
| Total CitiBank | 744,101 | (616,340 | ) | 127,761 | — | — | 127,761 | |||||||||||||||||||
| Credit Suisse International | Forward Foreign Currency Exchange Contracts | 501,379 | (501,379 | ) | — | — | — | — | ||||||||||||||||||
| Morgan Stanley and Co., International PLC | Total Return Swap Contracts | 90,080 | (63,067 | ) | 27,013 | — | — | 27,013 | ||||||||||||||||||
| Total financial instruments subject to a master netting arrangement or similar arrangement | 1,335,560 | (1,180,786 | ) | 154,774 | — | — | 154,774 | |||||||||||||||||||
| AQR Funds | Annual Report | December 2015 | ||||||||||||||
384
Table of Contents
| Notes to Financial Statements | December 31, 2015 |
AQR RISK PARITY FUND (continued)
| GROSS AMOUNTS NOT OFFSET IN THE STATEMENT OF ASSETS & LIABILITIES | ||||||||||||||||||||||||||
| COUNTERPARTY | INVESTMENT TYPE | GROSS AMOUNTS OF RECOGNIZED LIABILITIES PRESENTED IN THE STATEMENT OF ASSETS & LIABILITIES | GROSS AMOUNTS OFFSET | NET AMOUNTS OF LIABILITIES | FINANCIAL INSTRUMENTS | COLLATERAL PLEDGED (a) | NET AMOUNT | |||||||||||||||||||
| Bank of America | Total Return Swap Contracts | $ | 159,950 | $ | — | $ | 159,950 | $ | — | $ | (159,950 | ) | $ | — | ||||||||||||
| CitiBank | Forward Foreign Currency Exchange Contracts | 2,407,238 | (490,044 | ) | 1,917,194 | — | (1,917,194 | ) | — | |||||||||||||||||
| Interest Rate Swap Contracts | 126,296 | (126,296 | ) | — | — | — | — | |||||||||||||||||||
| Total CitiBank | 2,533,534 | (616,340 | ) | 1,917,194 | — | (1,917,194 | ) | — | ||||||||||||||||||
| Credit Suisse International | Forward Foreign Currency Exchange Contracts | 2,504,875 | (501,379 | ) | 2,003,496 | — | (2,003,496 | ) | — | |||||||||||||||||
| Goldman Sachs | Total Return Swap Contracts | 9,037 | — | 9,037 | — | (9,037 | ) | — | ||||||||||||||||||
| Morgan Stanley and Co., International PLC | Total Return Swap Contracts | 63,067 | (63,067 | ) | — | — | — | — | ||||||||||||||||||
| Total financial instruments subject to a master netting arrangement or similar arrangement | 5,270,463 | (1,180,786 | ) | 4,089,677 | — | (4,089,677 | ) | — | ||||||||||||||||||
| (a) | Per GAAP disclosure requirements, the table above does not include the additional collateral pledged to the counterparty. Total additional collateral pledged was $3,964,087. |
AQR RISK PARITY OFFSHORE FUND LTD.
| GROSS AMOUNTS NOT OFFSET IN THE STATEMENT OF ASSETS & LIABILITIES | ||||||||||||||||||||||||||
| COUNTERPARTY | INVESTMENT TYPE | GROSS AMOUNTS OF RECOGNIZED ASSETS PRESENTED IN THE STATEMENT OF ASSETS & LIABILITIES | GROSS AMOUNTS OFFSET | NET AMOUNTS OF ASSETS | FINANCIAL INSTRUMENTS | COLLATERAL RECEIVED | NET AMOUNT | |||||||||||||||||||
| CitiBank | Total Return Swap Contracts | $ | 71,006 | $ | (71,006 | ) | $ | — | $ | — | $ | — | $ | — | ||||||||||||
| Deutsche Bank | Total Return Swap Contracts | 1,823 | (1,823 | ) | — | — | — | — | ||||||||||||||||||
| Macquarie Capital | Total Return Swap Contracts | 4,285 | (4,285 | ) | — | — | — | — | ||||||||||||||||||
| Merrill Lynch | Total Return Swap Contracts | 14,688 | (14,688 | ) | — | — | — | — | ||||||||||||||||||
| Societe Generale | Total Return Swap Contracts | 2,768 | (2,768 | ) | — | — | — | — | ||||||||||||||||||
| Total financial instruments subject to a master netting arrangement or similar arrangement | 94,570 | (94,570 | ) | — | — | — | — | |||||||||||||||||||
| AQR Funds | Annual Report | December 2015 | ||||||||||||||
385
Table of Contents
| Notes to Financial Statements | December 31, 2015 |
AQR RISK PARITY OFFSHORE FUND LTD. (continued)
| GROSS AMOUNTS NOT OFFSET IN THE STATEMENT OF ASSETS & LIABILITIES | ||||||||||||||||||||||||||
| COUNTERPARTY | INVESTMENT TYPE | GROSS AMOUNTS OF RECOGNIZED LIABILITIES PRESENTED IN THE STATEMENT OF ASSETS & LIABILITIES | GROSS AMOUNTS OFFSET | NET AMOUNTS OF LIABILITIES | FINANCIAL INSTRUMENTS | COLLATERAL PLEDGED (a) | NET AMOUNT | |||||||||||||||||||
| CitiBank | Total Return Swap Contracts | $ | 113,928 | $ | (71,006 | ) | $ | 42,922 | $ | — | $ | (42,922 | ) | $ | — | |||||||||||
| Deutsche Bank | Total Return Swap Contracts | 447,624 | (1,823 | ) | 445,801 | — | (445,801 | ) | — | |||||||||||||||||
| Macquarie Capital | Total Return Swap Contracts | 48,600 | (4,285 | ) | 44,315 | — | (44,315 | ) | — | |||||||||||||||||
| Merrill Lynch | Total Return Swap Contracts | 38,398 | (14,688 | ) | 23,710 | — | (23,710 | ) | — | |||||||||||||||||
| Societe Generale | Total Return Swap Contracts | 3,591 | (2,768 | ) | 823 | — | (823 | ) | — | |||||||||||||||||
| Total financial instruments subject to a master netting arrangement or similar arrangement | 652,141 | (94,570 | ) | 557,571 | — | (557,571 | ) | — | ||||||||||||||||||
| (a) | Per GAAP disclosure requirements, the table above does not include the additional collateral pledged to the counterparty. Total additional collateral pledged was $1,162,969. |
AQR RISK PARITY II HV FUND
| GROSS AMOUNTS NOT OFFSET IN THE STATEMENT OF ASSETS & LIABILITIES | ||||||||||||||||||||||||||
| COUNTERPARTY | INVESTMENT TYPE | GROSS AMOUNTS OF RECOGNIZED ASSETS PRESENTED IN THE STATEMENT OF ASSETS & LIABILITIES | GROSS AMOUNTS OFFSET | NET AMOUNTS OF ASSETS | FINANCIAL INSTRUMENTS | COLLATERAL RECEIVED | NET AMOUNT | |||||||||||||||||||
| Bank of America | Total Return Swap Contracts | $ | 1,143 | $ | (1,143 | ) | $ | — | $ | — | $ | — | $ | — | ||||||||||||
| CitiBank | Forward Foreign Currency Exchange Contracts | 19,549 | (19,549 | ) | — | — | — | — | ||||||||||||||||||
| Repurchase Agreements | 1,303,461 | (1,303,461 | ) | — | — | — | — | |||||||||||||||||||
| Total CitiBank | 1,323,010 | (1,323,010 | ) | — | — | — | — | |||||||||||||||||||
| Credit Suisse International | Forward Foreign Currency Exchange Contracts | 21,603 | (21,603 | ) | — | — | — | — | ||||||||||||||||||
| Goldman Sachs | Total Return Swap Contracts | 22,476 | (10,570 | ) | 11,906 | — | — | 11,906 | ||||||||||||||||||
| J.P. Morgan | Repurchase Agreements | 1,222,500 | (1,222,500 | ) | — | — | — | — | ||||||||||||||||||
| Total financial instruments subject to a master netting arrangement or similar arrangement | 2,590,732 | (2,578,826 | ) | 11,906 | — | — | 11,906 | |||||||||||||||||||
| AQR Funds | Annual Report | December 2015 | ||||||||||||||
386
Table of Contents
| Notes to Financial Statements | December 31, 2015 |
AQR RISK PARITY II HV FUND (continued)
| GROSS AMOUNTS NOT OFFSET IN THE STATEMENT OF ASSETS & LIABILITIES | ||||||||||||||||||||||||||
| COUNTERPARTY | INVESTMENT TYPE | GROSS AMOUNTS OF RECOGNIZED LIABILITIES PRESENTED IN THE STATEMENT OF ASSETS & LIABILITIES | GROSS AMOUNTS OFFSET | NET AMOUNTS OF LIABILITIES | FINANCIAL INSTRUMENTS | COLLATERAL PLEDGED (a) | NET AMOUNT | |||||||||||||||||||
| Bank of America | Total Return Swap Contracts | $ | 23,821 | $ | (1,143 | ) | $ | 22,678 | $ | — | $ | (22,678 | ) | $ | — | |||||||||||
| CitiBank | Forward Foreign Currency Exchange Contracts | 72,260 | (19,549 | ) | 52,711 | — | (52,711 | ) | — | |||||||||||||||||
| Reverse Repurchase Agreements | 4,893,410 | (1,303,461 | ) | 3,589,949 | (3,589,949 | ) | — | — | ||||||||||||||||||
| Total CitiBank | 4,965,670 | (1,323,010 | ) | 3,642,660 | (3,589,949 | ) | (52,711 | ) | — | |||||||||||||||||
| Credit Suisse International | Forward Foreign Currency Exchange Contracts | 85,759 | (21,603 | ) | 64,156 | — | (64,156 | ) | — | |||||||||||||||||
| Goldman Sachs | Total Return Swap Contracts | 10,570 | (10,570 | ) | — | — | — | — | ||||||||||||||||||
| J.P.Morgan | Reverse Repurchase Agreements | 4,339,625 | (1,222,500 | ) | 3,117,125 | (3,117,125 | ) | — | — | |||||||||||||||||
| Total financial instruments subject to a master netting arrangement or similar arrangement | 9,425,445 | (2,578,826 | ) | 6,846,619 | (6,707,074 | ) | (139,545 | ) | — | |||||||||||||||||
| (a) | Per GAAP disclosure requirements, the table above does not include the additional collateral pledged to the counterparty. Total additional collateral pledged was $591,458. |
AQR RISK PARITY II HV OFFSHORE FUND LTD.
| GROSS AMOUNTS NOT OFFSET IN THE STATEMENT OF ASSETS & LIABILITIES | ||||||||||||||||||||||||||
| COUNTERPARTY | INVESTMENT TYPE | GROSS AMOUNTS OF RECOGNIZED ASSETS PRESENTED IN THE STATEMENT OF ASSETS & LIABILITIES | GROSS AMOUNTS OFFSET | NET AMOUNTS OF ASSETS | FINANCIAL INSTRUMENTS | COLLATERAL RECEIVED | NET AMOUNT | |||||||||||||||||||
| CitiBank | Total Return Swap Contracts | $ | 11,198 | $ | (11,198 | ) | $ | — | $ | — | $ | — | $ | — | ||||||||||||
| Deutsche Bank | Total Return Swap Contracts | 505 | (505 | ) | — | — | — | — | ||||||||||||||||||
| Macquarie Capital | Total Return Swap Contracts | 973 | (973 | ) | — | — | — | — | ||||||||||||||||||
| Societe Generale | Total Return Swap Contracts | 95 | — | 95 | — | — | 95 | |||||||||||||||||||
| Total financial instruments subject to a master netting arrangement or similar arrangement | 12,771 | (12,676 | ) | 95 | — | — | 95 | |||||||||||||||||||
| AQR Funds | Annual Report | December 2015 | ||||||||||||||
387
Table of Contents
| Notes to Financial Statements | December 31, 2015 |
AQR RISK PARITY II HV OFFSHORE FUND LTD. (continued)
| GROSS AMOUNTS NOT OFFSET IN THE STATEMENT OF ASSETS & LIABILITIES | ||||||||||||||||||||||||||
| COUNTERPARTY | INVESTMENT TYPE | GROSS AMOUNTS OF RECOGNIZED LIABILITIES PRESENTED IN THE STATEMENT OF ASSETS & LIABILITIES | GROSS AMOUNTS OFFSET | NET AMOUNTS OF LIABILITIES | FINANCIAL INSTRUMENTS | COLLATERAL PLEDGED (a) | NET AMOUNT | |||||||||||||||||||
| CitiBank | Total Return Swap Contracts | $ | 16,897 | $ | (11,198 | ) | $ | 5,699 | $ | — | $ | (5,699 | ) | $ | — | |||||||||||
| Deutsche Bank | Total Return Swap Contracts | 81,864 | (505 | ) | 81,359 | — | (81,359 | ) | — | |||||||||||||||||
| Macquarie Capital | Total Return Swap Contracts | 7,566 | (973 | ) | 6,593 | — | — | 6,593 | ||||||||||||||||||
| Total financial instruments subject to a master netting arrangement or similar arrangement | 106,327 | (12,676 | ) | 93,651 | — | (87,058 | ) | 6,593 | ||||||||||||||||||
| (a) | Per GAAP disclosure requirements, the table above does not include the additional collateral pledged to the counterparty. Total additional collateral pledged was $272,970. |
AQR RISK PARITY II MV FUND
| GROSS AMOUNTS NOT OFFSET IN THE STATEMENT OF ASSETS & LIABILITIES | ||||||||||||||||||||||||||
| COUNTERPARTY | INVESTMENT TYPE | GROSS AMOUNTS OF RECOGNIZED ASSETS PRESENTED IN THE STATEMENT OF ASSETS & LIABILITIES | GROSS AMOUNTS OFFSET | NET AMOUNTS OF ASSETS | FINANCIAL INSTRUMENTS | COLLATERAL RECEIVED | NET AMOUNT | |||||||||||||||||||
| Bank of America | Total Return Swap Contracts | $ | 2,612 | $ | (2,612 | ) | $ | — | $ | — | $ | — | $ | — | ||||||||||||
| CitiBank | Forward Foreign Currency Exchange Contracts | 27,267 | (27,267 | ) | — | — | — | — | ||||||||||||||||||
| Credit Suisse International | Forward Foreign Currency Exchange Contracts | 27,751 | (27,751 | ) | — | — | — | — | ||||||||||||||||||
| Goldman Sachs | Total Return Swap Contracts | 25,069 | (25,069 | ) | — | — | — | — | ||||||||||||||||||
| Total financial instruments subject to a master netting arrangement or similar arrangement | 82,699 | (82,699 | ) | — | — | — | — | |||||||||||||||||||
| AQR Funds | Annual Report | December 2015 | ||||||||||||||
388
Table of Contents
| Notes to Financial Statements | December 31, 2015 |
AQR RISK PARITY II MV FUND (continued)
| GROSS AMOUNTS NOT OFFSET IN THE STATEMENT OF ASSETS & LIABILITIES | ||||||||||||||||||||||||||
| COUNTERPARTY | INVESTMENT TYPE | GROSS AMOUNTS OF RECOGNIZED LIABILITIES PRESENTED IN THE STATEMENT OF ASSETS & LIABILITIES | GROSS AMOUNTS OFFSET | NET AMOUNTS OF LIABILITIES | FINANCIAL INSTRUMENTS | COLLATERAL PLEDGED (a) | NET AMOUNT | |||||||||||||||||||
| Bank of America | Total Return Swap Contracts | $ | 27,359 | $ | (2,612 | ) | $ | 24,747 | $ | — | $ | (24,747 | ) | $ | — | |||||||||||
| CitiBank | Forward Foreign Currency Exchange Contracts | 98,553 | (27,267 | ) | 71,286 | — | (71,286 | ) | — | |||||||||||||||||
| Credit Suisse International | Forward Foreign Currency Exchange Contracts | 110,512 | (27,751 | ) | 82,761 | — | (82,761 | ) | — | |||||||||||||||||
| Goldman Sachs | Total Return Swap Contracts | 26,747 | (25,069 | ) | 1,678 | — | (1,678 | ) | — | |||||||||||||||||
| Total financial instruments subject to a master netting arrangement or similar arrangement | 263,171 | (82,699 | ) | 180,472 | — | (180,472 | ) | — | ||||||||||||||||||
| (a) | Per GAAP disclosure requirements, the table above does not include the additional collateral pledged to the counterparty. Total additional collateral pledged was $719,528. |
AQR RISK PARITY II MV OFFSHORE FUND LTD.
| GROSS AMOUNTS NOT OFFSET IN THE STATEMENT OF ASSETS & LIABILITIES | ||||||||||||||||||||||||||
| COUNTERPARTY | INVESTMENT TYPE | GROSS AMOUNTS OF RECOGNIZED ASSETS PRESENTED IN THE STATEMENT OF ASSETS & LIABILITIES | GROSS AMOUNTS OFFSET | NET AMOUNTS OF ASSETS | FINANCIAL INSTRUMENTS | COLLATERAL RECEIVED | NET AMOUNT | |||||||||||||||||||
| CitiBank | Total Return Swap Contracts | $ | 17,788 | $ | (17,788 | ) | $ | — | $ | — | $ | — | $ | — | ||||||||||||
| Deutsche Bank | Total Return Swap Contracts | 2,448 | (2,448 | ) | — | — | — | — | ||||||||||||||||||
| Macquarie Capital | Total Return Swap Contracts | 73,070 | (73,070 | ) | — | — | — | — | ||||||||||||||||||
| Societe Generale | Total Return Swap Contracts | 260 | (260 | ) | — | — | — | — | ||||||||||||||||||
| Total financial instruments subject to a master netting arrangement or similar arrangement | 93,566 | (93,566 | ) | — | — | — | — | |||||||||||||||||||
| AQR Funds | Annual Report | December 2015 | ||||||||||||||
389
Table of Contents
| Notes to Financial Statements | December 31, 2015 |
AQR RISK PARITY II MV OFFSHORE FUND LTD. (continued)
| GROSS AMOUNTS NOT OFFSET IN THE STATEMENT OF ASSETS & LIABILITIES | ||||||||||||||||||||||||||
| COUNTERPARTY | INVESTMENT TYPE | GROSS AMOUNTS OF | GROSS AMOUNTS OFFSET | NET AMOUNTS OF LIABILITIES | FINANCIAL INSTRUMENTS | COLLATERAL PLEDGED (a) | NET AMOUNT | |||||||||||||||||||
| CitiBank | Total Return Swap Contracts | $ | 28,901 | $ | (17,788 | ) | $ | 11,113 | $ | — | $ | (11,113 | ) | $ | — | |||||||||||
| Deutsche Bank | Total Return Swap Contracts | 108,185 | (2,448 | ) | 105,737 | — | (105,737 | ) | — | |||||||||||||||||
| Macquarie Capital | Total Return Swap Contracts | 153,653 | (73,070 | ) | 80,583 | — | (80,583 | ) | — | |||||||||||||||||
| Societe Generale | Total Return Swap Contracts | 10,854 | (260 | ) | 10,594 | — | — | 10,594 | ||||||||||||||||||
| Total financial instruments subject to a master netting arrangement or similar arrangement | 301,593 | (93,566 | ) | 208,027 | — | (197,433 | ) | 10,594 | ||||||||||||||||||
| (a) | Per GAAP disclosure requirements, the table above does not include the additional collateral pledged to the counterparty. Total additional collateral pledged was $272,606. |
AQR STYLE PREMIA ALTERNATIVE FUND
| GROSS AMOUNTS NOT OFFSET IN THE STATEMENT OF ASSETS & LIABILITIES | ||||||||||||||||||||||||||
| COUNTERPARTY | INVESTMENT TYPE | GROSS AMOUNTS OF RECOGNIZED ASSETS PRESENTED IN THE STATEMENT OF ASSETS & LIABILITIES | GROSS AMOUNTS OFFSET | NET AMOUNTS OF ASSETS | FINANCIAL INSTRUMENTS | COLLATERAL RECEIVED | NET AMOUNT | |||||||||||||||||||
Bank of America | Total Return Swaps Contracts | $ | 2,310,886 | $ | (2,310,886 | ) | $ | — | $ | — | $ | — | $ | — | ||||||||||||
CitiBank | Forward Foreign Currency Exchange Contracts | 9,813,454 | (5,956,773 | ) | 3,856,681 | — | — | 3,856,681 | ||||||||||||||||||
Credit Suisse International | Forward Foreign Currency Exchange Contracts | 9,655,034 | (5,879,422 | ) | 3,775,612 | — | (1,120,000 | ) | 2,655,612 | |||||||||||||||||
Goldman Sachs | Total Return Swaps Contracts | 57,380 | (57,380 | ) | — | — | — | — | ||||||||||||||||||
| Total financial instruments subject to a master netting arrangement or similar arrangement | 21,836,754 | (14,204,461 | ) | 7,632,293 | — | (1,120,000 | ) | 6,512,293 | ||||||||||||||||||
| GROSS AMOUNTS NOT OFFSET IN THE STATEMENT OF ASSETS & LIABILITIES | ||||||||||||||||||||||||||
| COUNTERPARTY | INVESTMENT TYPE | GROSS AMOUNTS OF RECOGNIZED LIABILITIES PRESENTED IN THE STATEMENT OF ASSETS & LIABILITIES | GROSS AMOUNTS OFFSET | NET AMOUNTS OF LIABILITIES | FINANCIAL INSTRUMENTS | COLLATERAL PLEDGED (a) | NET AMOUNT | |||||||||||||||||||
| Bank of America | Total Return Swaps Contracts | $ | 3,691,802 | $ | (2,310,886 | ) | $ | 1,380,916 | $ | — | $ | (1,380,916 | ) | $ | — | |||||||||||
| CitiBank | Forward Foreign Currency Exchange Contracts | 5,956,773 | (5,956,773 | ) | — | — | — | — | ||||||||||||||||||
| Credit Suisse International | Forward Foreign Currency Exchange Contracts | 5,879,422 | (5,879,422 | ) | — | — | — | — | ||||||||||||||||||
| Goldman Sachs | Total Return Swaps Contracts | 45,096 | ||||||||||||||||||||||||
| Total Return Basket Swaps Contracts | 18,170,268 | |||||||||||||||||||||||||
| Total Goldman Sachs | 18,215,364 | (57,380 | ) | 18,157,984 | — | (18,157,984 | ) | — | ||||||||||||||||||
| Total financial instruments subject to a master netting arrangement or similar arrangement | 33,743,361 | (14,204,461 | ) | 19,538,900 | — | (19,538,900 | ) | — | ||||||||||||||||||
| (a) | Per GAAP disclosure requirements, the table above does not include the additional collateral pledged to the counterparty. Total additional collateral pledged was $273,971,168. |
| AQR Funds | Annual Report | December 2015 | ||||||||||||||
390
Table of Contents
| Notes to Financial Statements | December 31, 2015 |
AQR STYLE PREMIA ALTERNATIVE OFFSHORE FUND LTD.
| GROSS AMOUNTS NOT OFFSET IN THE STATEMENT OF ASSETS & LIABILITIES | ||||||||||||||||||||||||||
| COUNTERPARTY | INVESTMENT TYPE | GROSS AMOUNTS OF RECOGNIZED ASSETS PRESENTED IN THE STATEMENT OF ASSETS & LIABILITIES | GROSS AMOUNTS OFFSET | NET AMOUNTS OF ASSETS | FINANCIAL INSTRUMENTS | COLLATERAL RECEIVED | NET AMOUNT | |||||||||||||||||||
| Deutsche Bank | Total Return Swap Contracts | $ | 24,098 | $ | (24,098 | ) | $ | — | $ | — | $ | — | $ | — | ||||||||||||
| Total financial instruments subject to a master netting arrangement or similar arrangement | 24,098 | (24,098 | ) | — | — | — | — | |||||||||||||||||||
| GROSS AMOUNTS NOT OFFSET IN THE STATEMENT OF ASSETS & LIABILITIES | ||||||||||||||||||||||||||
| COUNTERPARTY | INVESTMENT TYPE | GROSS AMOUNTS OF RECOGNIZED LIABILITIES PRESENTED IN THE STATEMENT OF ASSETS & LIABILITIES | GROSS AMOUNTS OFFSET | NET AMOUNTS OF LIABILITIES | FINANCIAL INSTRUMENTS | COLLATERAL PLEDGED (a) | NET AMOUNT | |||||||||||||||||||
| CitiBank | Total Return Swap Contracts | $ | 418,205 | $ | — | $ | 418,205 | $ | — | $ | (418,205 | ) | $ | — | ||||||||||||
Deutsche Bank | Total Return Swap Contracts | 1,559,236 | (24,098 | ) | 1,535,138 | — | — | 1,535,138 | ||||||||||||||||||
| Macquarie Capital | Total Return Swap Contracts | 535,842 | — | 535,842 | — | (535,842 | ) | — | ||||||||||||||||||
| Societe Generale | Total Return Swap Contracts | 895,764 | — | 895,764 | — | (895,764 | ) | — | ||||||||||||||||||
| Total financial instruments subject to a master netting arrangement or similar arrangement | 3,409,047 | (24,098 | ) | 3,384,949 | — | (1,849,811 | ) | 1,535,138 | ||||||||||||||||||
| (a) | Per GAAP disclosure requirements, the table above does not include the additional collateral pledged to the counterparty. Total additional collateral pledged was $4,370,193. |
AQR STYLE PREMIA ALTERNATIVE LV FUND
| GROSS AMOUNTS NOT OFFSET IN THE STATEMENT OF ASSETS & LIABILITIES | ||||||||||||||||||||||||||
| COUNTERPARTY | INVESTMENT TYPE | GROSS AMOUNTS OF RECOGNIZED ASSETS PRESENTED IN THE STATEMENT OF ASSETS & LIABILITIES | GROSS AMOUNTS OFFSET | NET AMOUNTS OF ASSETS | FINANCIAL INSTRUMENTS | COLLATERAL RECEIVED | NET AMOUNT | |||||||||||||||||||
| Bank of America | Total Return Swap Contracts | $ | 118,802 | $ | (118,802 | ) | $ | — | $ | — | $ | — | $ | — | ||||||||||||
| CitiBank | Forward Foreign Currency Exchange Contracts | 535,034 | (336,351 | ) | 198,683 | — | — | 198,683 | ||||||||||||||||||
| Credit Suisse International | Forward Foreign Currency Exchange Contracts | 534,517 | (343,166 | ) | 191,351 | — | — | 191,351 | ||||||||||||||||||
| Goldman Sachs | Total Return Swap Contracts | 2,049 | ||||||||||||||||||||||||
| Total Return Basket Swap Contracts | 1,528,900 | |||||||||||||||||||||||||
| Total Goldman Sachs | 1,530,949 | (2,312 | ) | 1,528,637 | — | — | 1,528,637 | |||||||||||||||||||
| Morgan Stanley and Co., International PLC | Total Return Swap Contracts | 18,530 | — | 18,530 | — | — | 18,530 | |||||||||||||||||||
| Total financial instruments subject to a master netting arrangement or similar arrangement | 2,737,832 | (800,631 | ) | 1,937,201 | — | — | 1,937,201 | |||||||||||||||||||
| AQR Funds | Annual Report | December 2015 | ||||||||||||||
391
Table of Contents
| Notes to Financial Statements | December 31, 2015 |
AQR STYLE PREMIA ALTERNATIVE LV FUND (continued)
| GROSS AMOUNTS NOT OFFSET IN THE STATEMENT OF ASSETS & LIABILITIES | ||||||||||||||||||||||||||
| COUNTERPARTY | INVESTMENT TYPE | GROSS AMOUNTS OF RECOGNIZED LIABILITIES PRESENTED IN THE STATEMENT OF ASSETS & LIABILITIES | GROSS AMOUNTS OFFSET | NET AMOUNTS OF LIABILITIES | FINANCIAL INSTRUMENTS | COLLATERAL PLEDGED (a) | NET AMOUNT | |||||||||||||||||||
| Bank of America | Total Return Swap Contracts | $ | 189,979 | $ | (118,802 | ) | $ | 71,177 | $ | — | $ | (71,177 | ) | $ | — | |||||||||||
| CitiBank | Forward Foreign Currency Exchange Contracts | 336,351 | (336,351 | ) | — | — | — | — | ||||||||||||||||||
| Credit Suisse International | Forward Foreign Currency Exchange Contracts | 343,166 | (343,166 | ) | — | — | — | — | ||||||||||||||||||
| Goldman Sachs | Total Return Swap Contracts | 2,312 | (2,312 | ) | — | — | — | — | ||||||||||||||||||
| Total financial instruments subject to a master netting arrangement or similar arrangement | 871,808 | (800,631 | ) | 71,177 | — | (71,177 | ) | — | ||||||||||||||||||
| (a) | Per GAAP disclosure requirements, the table above does not include the additional collateral pledged to the counterparty. Total additional collateral pledged was $14,508,825. |
AQR STYLE PREMIA ALTERNATIVE LV OFFSHORE FUND LTD.
| GROSS AMOUNTS NOT OFFSET IN THE STATEMENT OF ASSETS & LIABILITIES | ||||||||||||||||||||||||||
| COUNTERPARTY | INVESTMENT TYPE | GROSS AMOUNTS OF RECOGNIZED ASSETS PRESENTED IN THE STATEMENT OF ASSETS & LIABILITIES | GROSS AMOUNTS OFFSET | NET AMOUNTS OF ASSETS | FINANCIAL INSTRUMENTS | COLLATERAL RECEIVED | NET AMOUNT | |||||||||||||||||||
| CitiBank | Total Return Swap Contracts | $ | 8,446 | $ | (8,446 | ) | $ | — | $ | — | $ | — | $ | — | ||||||||||||
| Total financial instruments subject to a master netting arrangement or similar arrangement | 8,446 | (8,446 | ) | — | — | — | — | |||||||||||||||||||
| GROSS AMOUNTS NOT OFFSET IN THE STATEMENT OF ASSETS & LIABILITIES | ||||||||||||||||||||||||||
| COUNTERPARTY | INVESTMENT TYPE | GROSS AMOUNTS OF RECOGNIZED LIABILITIES PRESENTED IN THE STATEMENT OF ASSETS & LIABILITIES | GROSS AMOUNTS OFFSET | NET AMOUNTS OF LIABILITIES | FINANCIAL INSTRUMENTS | COLLATERAL PLEDGED (a) | NET AMOUNT | |||||||||||||||||||
| CitiBank | Total Return Swap Contracts | $ | 30,566 | $ | (8,446 | ) | $ | 22,120 | $ | — | $ | (22,120 | ) | $ | — | |||||||||||
| Macquarie Capital | Total Return Swap Contracts | 88,817 | — | 88,817 | — | (88,817 | ) | — | ||||||||||||||||||
| Societe Generale | Total Return Swap Contracts | 55,312 | — | 55,312 | — | (55,312 | ) | — | ||||||||||||||||||
| Total financial instruments subject to a master netting arrangement or similar arrangement | 174,695 | (8,446 | ) | 166,249 | — | (166,249 | ) | — | ||||||||||||||||||
| (a) | Per GAAP disclosure requirements, the table above does not include the additional collateral pledged to the counterparty. Total additional collateral pledged was $313,751. |
| AQR Funds | Annual Report | December 2015 | ||||||||||||||
392
Table of Contents
| Notes to Financial Statements | December 31, 2015 |
For the year ended December 31, 2015, the quarterly average notional values of the derivatives held by the Funds were as follows:
Derivatives Volume Disclosure*
| AQR DIVERSIFIED ARBITRAGE FUND | AQR GLOBAL MACRO FUND | AQR LONG- SHORT EQUITY FUND | AQR MANAGED FUND | AQR MANAGED FUTURES STRATEGY HV FUND | AQR MULTI- STRATEGY ALTERNATIVE FUND | AQR RISK- BALANCED COMMODITIES STRATEGY FUND | ||||||||||||||||||||||
| Futures Contracts: | ||||||||||||||||||||||||||||
Average Notional Balance—Long | $ | — | $ | 384,987,419 | $ | 120,298,540 | $ | 30,941,821,900 | $ | 1,792,283,397 | $ | 2,801,709,526 | $ | 65,839,641 | ||||||||||||||
Average Notional Balance—Short | 384,899,483 | 462,202,938 | 2,386,059 | 7,550,327,881 | 467,401,036 | 2,070,132,153 | 27,303,750 | |||||||||||||||||||||
Ending Notional Balance—Long | — | 416,608,185 | 300,706,088 | 19,393,263,891 | 1,546,190,417 | 2,584,532,900 | 107,661,488 | |||||||||||||||||||||
Ending Notional Balance—Short | 211,581,100 | 375,192,576 | — | 15,561,698,403 | 1,247,537,135 | 2,702,237,263 | 33,987,328 | |||||||||||||||||||||
| Forward Foreign Currency Exchange Contracts: | ||||||||||||||||||||||||||||
Average Settlement Value—Purchased | 29,157,893 | 44,381,946 | 41,820,152 | 9,627,194,579 | 539,707,576 | 1,285,226,997 | — | |||||||||||||||||||||
Average Settlement Value—Sold | 93,310,486 | 45,685,166 | 10,787,436 | 13,015,351,883 | 733,397,289 | 1,546,558,431 | — | |||||||||||||||||||||
Ending Value—Purchased | 12,900,767 | 39,498,090 | 106,242,313 | 9,599,925,714 | 754,583,095 | 1,667,222,554 | — | |||||||||||||||||||||
Ending Value—Sold | 55,988,012 | 37,737,265 | 27,524,588 | 13,213,738,145 | 1,034,763,643 | 1,960,393,346 | — | |||||||||||||||||||||
| Exchange-Traded Options: | ||||||||||||||||||||||||||||
Average Number of Contracts—Written | 7,820 | — | — | — | — | 829 | — | |||||||||||||||||||||
Ending Number of Contracts—Written | 4,863 | — | — | — | — | — | — | |||||||||||||||||||||
| Credit Default Swaps: | ||||||||||||||||||||||||||||
Average Notional Balance—Buy Protection | 143,580,000 | — | — | — | — | 12,800,000 | — | |||||||||||||||||||||
Average Notional Balance—Sell Protection | 25,525,000 | — | — | — | — | 49,443,750 | — | |||||||||||||||||||||
Ending Notional Balance—Buy Protection | 97,575,000 | — | — | — | — | — | — | |||||||||||||||||||||
Ending Notional Balance—Sell Protection | — | — | — | — | — | 15,125,000 | — | |||||||||||||||||||||
| Total Return Swaps: | ||||||||||||||||||||||||||||
Average Notional Balance—Long | — | 5,327,721 | 4,460,451 | 2,904,308,812 | 147,825,281 | 366,223,396 | 115,920,589 | |||||||||||||||||||||
Average Notional Balance—Short | — | 3,619,182 | — | 1,215,703,846 | 76,608,460 | 410,363,839 | 79,587,678 | |||||||||||||||||||||
Ending Notional Balance—Long | — | 3,531,011 | 11,024,572 | 251,318,826 | 20,186,125 | 116,253,433 | 19,838,674 | |||||||||||||||||||||
Ending Notional Balance—Short | — | 1,424,736 | — | 945,632,752 | 74,410,248 | 398,566,539 | 6,006,337 | |||||||||||||||||||||
| Interest Rate-Related Swaps (Interest Rate Swaps): | ||||||||||||||||||||||||||||
Average Notional Balance—Pays Fixed rate | — | 464,848,310 | — | — | — | — | — | |||||||||||||||||||||
Average Notional Balance—Receives Fixed rate | — | 473,068,439 | — | — | — | — | — | |||||||||||||||||||||
Ending Notional Balance—Pays Fixed Rate | — | 604,906,616 | — | — | — | — | — | |||||||||||||||||||||
Ending Notional Balance—Receives Fixed Rate | — | 602,591,761 | — | — | — | — | — | |||||||||||||||||||||
| AQR Funds | Annual Report | December 2015 | ||||||||||||||
393
Table of Contents
| Notes to Financial Statements | December 31, 2015 |
| AQR DIVERSIFIED ARBITRAGE FUND | AQR GLOBAL MACRO FUND | AQR LONG- SHORT EQUITY FUND | AQR MANAGED FUND | AQR MANAGED FUTURES STRATEGY HV FUND | AQR MULTI- STRATEGY ALTERNATIVE FUND | AQR RISK- BALANCED COMMODITIES STRATEGY FUND | ||||||||||||||||||||||
| Total Return Basket Swaps: | ||||||||||||||||||||||||||||
Average Notional of Underlying Positions—Long | $ | 644,074,452 | $ | — | $ | 356,792,236 | $ | — | $ | — | $ | 3,684,441,730 | $ | — | ||||||||||||||
Average Notional of Underlying Positions—Short | 226,105,630 | — | 336,353,578 | — | — | 3,066,423,213 | — | |||||||||||||||||||||
Ending Notional Balance—Long | 271,257,361 | — | 868,465,025 | — | — | 4,487,815,872 | — | |||||||||||||||||||||
Ending Notional Balance—Short | 101,127,954 | — | 809,874,332 | — | — | 3,739,635,941 | — | |||||||||||||||||||||
AQR RISK FUND | AQR RISK PARITY II HV FUND | AQR RISK PARITY II MV FUND | AQR STYLE PREMIA ALTERNATIVE FUND | AQR STYLE PREMIA ALTERNATIVE LV FUND | AQR EQUITY FUND | |||||||||||||||||||
| Futures Contracts: | ||||||||||||||||||||||||
| Average Notional Balance—Long | $ | 424,963,404 | $ | 106,678,862 | $ | 146,198,523 | $ | 3,638,668,889 | $ | 158,417,892 | $ | 1,378,881 | ||||||||||||
| Average Notional Balance—Short | 25,239,320 | 7,102,206 | 8,417,619 | 3,029,282,121 | 125,138,329 | 831,146 | ||||||||||||||||||
| Ending Notional Balance—Long | 545,012,889 | 87,734,683 | 129,073,084 | 6,648,393,478 | 390,207,076 | — | ||||||||||||||||||
| Ending Notional Balance—Short | 19,124,548 | 2,827,084 | 3,894,523 | 4,989,569,223 | 295,772,442 | — | ||||||||||||||||||
| Forward Foreign Currency Exchange Contracts: | ||||||||||||||||||||||||
| Average Settlement Value—Purchased | 177,452,930 | 1,523,217 | 1,269,454 | 512,895,821 | 21,946,656 | 2,706,174 | ||||||||||||||||||
| Average Settlement Value—Sold | 219,869,757 | 13,076,867 | 15,991,641 | 603,265,390 | 25,455,617 | 5,515,831 | ||||||||||||||||||
| Ending Value—Purchased | 161,741,748 | 2,706,029 | 1,835,786 | 865,665,248 | 48,458,194 | 6,465,974 | ||||||||||||||||||
| Ending Value—Sold | 189,560,568 | 9,592,138 | 12,323,834 | 1,030,312,793 | 56,370,602 | 17,655,942 | ||||||||||||||||||
| Credit Default Swaps: | ||||||||||||||||||||||||
Average Notional Balance—Buy Protection | — | — | — | — | — | — | ||||||||||||||||||
Average Notional Balance—Sell Protection | 463,974,533 | — | — | — | — | — | ||||||||||||||||||
| Ending Notional Balance—Buy Protection | — | — | — | — | — | — | ||||||||||||||||||
| Ending Notional Balance—Sell Protection | 376,993,515 | — | — | — | — | — | ||||||||||||||||||
| Total Return Swaps: | ||||||||||||||||||||||||
| Average Notional Balance—Long | 407,615,714 | 40,626,588 | 41,239,070 | 221,221,918 | 8,987,633 | — | ||||||||||||||||||
| Average Notional Balance—Short | 88,429,412 | 7,168,376 | 9,264,828 | 383,217,030 | 14,511,292 | — | ||||||||||||||||||
| Ending Notional Balance—Long | 35,865,132 | 5,325,899 | 8,996,512 | 224,034,819 | 11,310,108 | — | ||||||||||||||||||
| Ending Notional Balance—Short | 929,835 | 294,937 | 813,212 | 165,857,425 | 8,522,870 | — | ||||||||||||||||||
| Interest Rate-Related Swaps (Interest Rate Swaps): | ||||||||||||||||||||||||
Average Notional Balance—Pays Fixed rate | 74,095,826 | — | — | — | — | — | ||||||||||||||||||
Average Notional Balance—Receives Fixed rate | 269,046,971 | — | — | — | — | — | ||||||||||||||||||
Ending Notional Balance—Pays Fixed Rate | 65,569,899 | — | — | — | — | — | ||||||||||||||||||
Ending Notional Balance—Receives Fixed Rate | 224,973,381 | — | — | — | — | — | ||||||||||||||||||
| Total Return Basket Swaps: | ||||||||||||||||||||||||
Average Notional of Underlying Positions—Long | — | — | — | 1,084,866,593 | 45,000,483 | 136,400,528 | ||||||||||||||||||
Average Notional of Underlying Positions—Short | — | — | — | 902,253,215 | 37,801,084 | 128,856,276 | ||||||||||||||||||
| Ending Notional Balance—Long | — | — | — | 1,869,848,660 | 106,445,897 | 411,783,042 | ||||||||||||||||||
| Ending Notional Balance—Short | — | — | — | 1,545,412,048 | 91,958,987 | 390,658,782 | ||||||||||||||||||
| * | Notional values as of each quarter end are used to calculate the average represented. |
| AQR Funds | Annual Report | December 2015 | ||||||||||||||
394
Table of Contents
| Notes to Financial Statements | December 31, 2015 |
9. Investment Advisory and Other Agreements
The Adviser serves as the investment adviser to each of the Funds pursuant to an Investment Advisory Agreement, dated December 4, 2008, as amended, entered into by the Trust, on behalf of the Funds (the “Advisory Agreement”). Under the Advisory Agreement, the Adviser furnishes a continuous investment program for each Fund’s portfolio, makes day-to-day investment decisions for the Funds, and manages the Funds’ investments in accordance with the stated policies of each Fund. The Adviser is also responsible for selecting brokers and dealers to execute purchase and sale orders for the portfolio transactions of each Fund, subject to its obligation to seek best execution, and also provides certain other administrative services to each Fund. The Adviser provides persons satisfactory to the Funds’ Board to serve as officers of the Funds.
Pursuant to the Advisory Agreement, the Funds currently pay the Investment Advisory fee calculated on the average daily net assets for each Fund, in the annual ratios below:
| FUND | RATIO | |||
AQR Diversified Arbitrage Fund | 1.00 | % | ||
AQR Equity Market Neutral Fund | 1.10 | |||
AQR Global Macro Fund | 1.25 | |||
AQR Long-Short Equity Fund | 1.10 | |||
AQR Managed Futures Strategy Fund | 1.05 | |||
AQR Managed Futures Strategy HV Fund | 1.45 | |||
AQR Multi-Strategy Alternative Fund | 1.80 | |||
AQR Risk-Balanced Commodities Strategy Fund | 0.80 | |||
AQR Risk Parity Fund | 0.75 | (a) | ||
AQR Risk Parity II HV Fund | 0.95 | (b) | ||
AQR Risk Parity II MV Fund | 0.75 | (c) | ||
AQR Style Premia Alternative Fund | 1.35 | |||
AQR Style Premia Alternative LV Fund | 0.65 | |||
| (a) | The AQR Risk Parity Fund Advisory Fee is based on the following two tier structure. The first tier charges 0.75% on the first $1 billion of net assets and the second tier charges 0.70% on net assets in excess of $1 billion. |
| (b) | The AQR Risk Parity II HV Fund Advisory Fee is based on the following three tier structure. The first tier charges 0.95% of the first $1 billion of net assets; the second tier charges 0.925% on net assets in excess of the $1 billion, up to $3 billion; and the third tier charges 0.90% on net assets in excess of $3 billion. |
| (c) | The AQR Risk Parity II MV Fund Advisory Fee is based on the following three tier structure. The first tier charges 0.75% of the first $1 billion of net assets; the second tier charges 0.725% on net assets in excess of the $1 billion, up to $3 billion; and the third tier charges 0.70% on net assets in excess of $3 billion. |
The Trust and the Adviser have entered into a Fee Waiver and Expense Reimbursement Agreement (“Fee Waiver Agreement”) whereby the Adviser has agreed to waive its fee and/or reimburse each Fund at least through April 30, 2016 for Class I, N and R6 shares, respectively, unless otherwise noted. Pursuant to the Fee Waiver Agreement, the Adviser has agreed to waive and/or reimburse each Fund to the extent that the total annual fund operating expense ratios (including the consolidated expenses of the Subsidiaries), exclusive of interest, taxes, borrowing costs, acquired fund fees and expenses, dividend and interest expense related to short sales, and extraordinary expenses exceed the following ratios:
| FUND | CLASS I | CLASS N | CLASS R6 | |||||||||
AQR Diversified Arbitrage Fund | 1.20 | % | 1.45 | % | 1.10 | % | ||||||
AQR Equity Market Neutral Fund | 1.30 | 1.55 | 1.20 | |||||||||
AQR Global Macro Fund | 1.45 | 1.70 | 1.35 | |||||||||
AQR Long-Short Equity Fund | 1.30 | 1.55 | 1.20 | |||||||||
AQR Managed Futures Strategy Fund | 1.25 | 1.50 | 1.15 | |||||||||
AQR Managed Futures Strategy HV Fund | 1.65 | 1.90 | 1.55 | |||||||||
AQR Multi-Strategy Alternative Fund | 1.98 | 2.23 | 1.88 | |||||||||
AQR Risk-Balanced Commodities Strategy Fund | 1.00 | 1.25 | 0.90 | |||||||||
AQR Risk Parity Fund | 0.95 | 1.20 | 0.85 | |||||||||
AQR Risk Parity II HV Fund | 1.15 | 1.40 | 1.05 | |||||||||
AQR Risk Parity II MV Fund | 0.95 | 1.20 | 0.85 | |||||||||
AQR Style Premia Alternative Fund | 1.50 | 1.75 | 1.40 | |||||||||
AQR Style Premia Alternative LV Fund | 0.85 | 1.10 | 0.75 | |||||||||
Prior to May 1, 2015, the Fee Waiver and Expense Reimbursement Agreement for the AQR Diversified Arbitrage Fund was as follows:
| FUND | CLASS I | CLASS N | CLASS R6 | |||||||||
AQR Diversified Arbitrage Fund | 1.20 | % | 1.50 | % | 1.10 | % | ||||||
| AQR Funds | Annual Report | December 2015 | ||||||||||||||
395
Table of Contents
| Notes to Financial Statements | December 31, 2015 |
For the year ended December 31, 2015 the Funds’ Adviser waived fees and/or reimbursed expenses for each of the Funds as follows:
| INVESTMENT ADVISORY FEES WAIVED | EXPENSE REIMBURSEMENTS | TOTAL | ||||||||||
AQR Diversified Arbitrage Fund | $ | 337,328 | $ | 26,879 | $ | 364,207 | ||||||
AQR Equity Market Neutral Fund | 163,655 | 28,125 | 191,780 | |||||||||
AQR Global Macro Fund | 128,925 | 69,566 | 198,491 | |||||||||
AQR Long-Short Equity Fund | 63,904 | 34,658 | 98,562 | |||||||||
AQR Managed Futures Strategy HV Fund | 98,152 | 25,196 | 123,348 | |||||||||
AQR Multi Strategy Alternative Fund | 170,817 | 769 | 171,586 | |||||||||
AQR Risk-Balanced Commodity Fund | 186,105 | 2,063 | 188,168 | |||||||||
AQR Risk Parity Fund | 73,453 | 617 | 74,070 | |||||||||
AQR Risk Parity II HV Fund | 173,742 | 1,596 | 175,338 | |||||||||
AQR Risk Parity II MV Fund | 177,570 | 184 | 177,754 | |||||||||
AQR Style Premia Alternative Fund | 383,412 | 389 | 383,801 | |||||||||
AQR Style Premia Alternative LV Fund | 263,746 | 36,727 | 300,473 | |||||||||
The Trust, in turn, agreed that the Funds will repay the fee waiver/expense reimbursement to the Adviser. Such repayment shall be made only out of the class of the Fund for which the applicable fee waiver and expense reimbursement was made. Repayments with respect to a Fund must be limited to amounts that do not cause the aggregate operating expenses of the Fund attributable to a share class during a year in which such repayment is made to exceed the applicable ratios when the waiver was generated. A repayment shall be payable only to the extent it can be made during the thirty-six months following the applicable period during which the Adviser waived fees or reimbursed the applicable Fund for its operating expenses under the Agreement.
For the year ended December 31, 2015, the amounts waived and reimbursed by the Adviser, as well as the amounts available for potential future recoupment by the Adviser and the expiration schedule at December 31, 2015 are as follows:
FEES WAIVED/ | TOTAL | POTENTIAL RECOUPMENT AMOUNTS EXPIRING DECEMBER 31 | ||||||||||||||||||
| 2016 | 2017 | 2018 | ||||||||||||||||||
| AQR DIVERSIFIED ARBITRAGE FUND | ||||||||||||||||||||
Class I | $ | 292,915 | $ | 299,674 | $ | — | $ | 6,759 | $ | 292,915 | ||||||||||
Class N | 71,086 | 71,086 | — | — | 71,086 | |||||||||||||||
Class R6 | 206 | 207 | — | 1 | 206 | |||||||||||||||
| Totals | $ | 364,207 | $ | 370,967 | $ | — | $ | 6,760 | $ | 364,207 | ||||||||||
| AQR EQUITY MARKET NEUTRAL FUND | ||||||||||||||||||||
Class I | $ | 108,152 | $ | 125,369 | $ | — | $ | 17,217 | $ | 108,152 | ||||||||||
Class N | 57,280 | 72,209 | — | 14,929 | 57,280 | |||||||||||||||
Class R6 | 26,348 | 69,800 | — | 43,452 | 26,348 | |||||||||||||||
| Totals | $ | 191,780 | $ | 267,378 | $ | — | $ | 75,598 | $ | 191,780 | ||||||||||
| AQR GLOBAL MACRO FUND | ||||||||||||||||||||
Class I | $ | 126,341 | $ | 337,762 | $ | — | $ | 211,421 | $ | 126,341 | ||||||||||
Class N | 71,767 | 78,778 | — | 7,011 | 71,767 | |||||||||||||||
Class R6 | 383 | 748 | — | 365 | 383 | |||||||||||||||
| Totals | $ | 198,491 | $ | 417,288 | $ | — | $ | 218,797 | $ | 198,491 | ||||||||||
| AQR LONG-SHORT EQUITY FUND | ||||||||||||||||||||
Class I | $ | 80,605 | $ | 335,535 | $ | 81,653 | $ | 173,277 | $ | 80,605 | ||||||||||
Class N | 16,675 | 62,537 | 21,781 | 24,081 | 16,675 | |||||||||||||||
Class R6 | 1,282 | 1,659 | — | 377 | 1,282 | |||||||||||||||
| Totals | $ | 98,562 | $ | 399,731 | $ | 103,434 | $ | 197,735 | $ | 98,562 | ||||||||||
| AQR Funds | Annual Report | December 2015 | ||||||||||||||
396
Table of Contents
| Notes to Financial Statements | December 31, 2015 |
FEES WAIVED/ | TOTAL | POTENTIAL RECOUPMENT AMOUNTS EXPIRING DECEMBER 31 | ||||||||||||||||||
| 2016 | 2017 | 2018 | ||||||||||||||||||
| AQR MANAGED FUTURES STRATEGY HV FUND | ||||||||||||||||||||
Class I | $ | 73,821 | $ | 386,255 | $ | 180,370 | $ | 132,064 | $ | 73,821 | ||||||||||
Class N | 18,956 | 49,480 | 16,709 | 13,815 | 18,956 | |||||||||||||||
Class R6 | 30,571 | 30,758 | — | 187 | 30,571 | |||||||||||||||
| Totals | $ | 123,348 | $ | 466,493 | $ | 197,079 | $ | 146,066 | $ | 123,348 | ||||||||||
| AQR MULTI-STRATEGY ALTERNATIVE FUND | ||||||||||||||||||||
Class I | $ | 158,246 | $ | 616,174 | $ | 263,977 | $ | 193,951 | $ | 158,246 | ||||||||||
Class N | 8,721 | 88,286 | 39,810 | 39,755 | 8,721 | |||||||||||||||
Class R6 | 4,619 | 4,708 | — | 89 | 4,619 | |||||||||||||||
| Totals | $ | 171,586 | $ | 709,168 | $ | 303,787 | $ | 233,795 | $ | 171,586 | ||||||||||
| AQR RISK-BALANCED COMMODITIES STRATEGY FUND | ||||||||||||||||||||
Class I | $ | 138,642 | $ | 435,309 | $ | 150,384 | $ | 146,283 | $ | 138,642 | ||||||||||
Class N | 7,371 | 51,829 | 17,595 | 26,863 | 7,371 | |||||||||||||||
Class R6 | 42,155 | 42,521 | — | 366 | 42,155 | |||||||||||||||
| Totals | $ | 188,168 | $ | 529,659 | $ | 167,979 | $ | 173,512 | $ | 188,168 | ||||||||||
| AQR RISK PARITY FUND | ||||||||||||||||||||
Class I | $ | 69,118 | $ | 69,118 | $ | — | $ | — | $ | 69,118 | ||||||||||
Class N | 4,693 | 4,693 | — | — | 4,693 | |||||||||||||||
Class R6 | 259 | 260 | — | 1 | 259 | |||||||||||||||
| Totals | $ | 74,070 | $ | 74,071 | $ | — | $ | 1 | $ | 74,070 | ||||||||||
| AQR RISK PARITY II HV FUND | ||||||||||||||||||||
Class I | $ | 139,839 | $ | 399,641 | $ | 141,678 | $ | 118,124 | $ | 139,839 | ||||||||||
Class N | 28,164 | 162,579 | 95,743 | 38,672 | 28,164 | |||||||||||||||
Class R6 | 7,335 | 7,457 | — | 122 | 7,335 | |||||||||||||||
| Totals | $ | 175,338 | $ | 569,677 | $ | 237,421 | $ | 156,918 | $ | 175,338 | ||||||||||
| AQR RISK PARITY II MV FUND | ||||||||||||||||||||
Class I | $ | 164,768 | $ | 421,785 | $ | 130,853 | $ | 126,164 | $ | 164,768 | ||||||||||
Class N | 12,819 | 87,424 | 58,403 | 16,202 | 12,819 | |||||||||||||||
Class R6 | 167 | 224 | — | 57 | 167 | |||||||||||||||
| Totals | $ | 177,754 | $ | 509,433 | $ | 189,256 | $ | 142,423 | $ | 177,754 | ||||||||||
| AQR STYLE PREMIA ALTERNATIVE FUND | ||||||||||||||||||||
Class I | $ | 288,940 | $ | 399,965 | $ | 111,025 | $ | — | $ | 288,940 | ||||||||||
Class N | 16,848 | 50,052 | 9,672 | 23,532 | 16,848 | |||||||||||||||
Class R6 | 78,013 | 81,738 | — | 3,725 | 78,013 | |||||||||||||||
| Totals | $ | 383,801 | $ | 531,755 | $ | 120,697 | $ | 27,257 | $ | 383,801 | ||||||||||
| AQR STYLE PREMIA ALTERNATIVE LV FUND | ||||||||||||||||||||
Class I | $ | 177,184 | $ | 189,624 | $ | — | $ | 12,440 | $ | 177,184 | ||||||||||
Class N | 50,106 | 62,874 | — | 12,768 | 50,106 | |||||||||||||||
Class R6 | 73,183 | 186,287 | — | 113,104 | 73,183 | |||||||||||||||
| Totals | $ | 300,473 | $ | 438,785 | $ | — | $ | 138,312 | $ | 300,473 | ||||||||||
| AQR Funds | Annual Report | December 2015 | ||||||||||||||
397
Table of Contents
| Notes to Financial Statements | December 31, 2015 |
During the year ended December 31, 2015, the Funds recouped amounts as follows:
| FUND | CLASS I | CLASS N | CLASS R6 | |||||||||
AQR Managed Futures Strategy Fund | $ | — | $ | 15,567 | $ | 4 | ||||||
Pursuant to the Sub-Advisory Agreements between the Sub-Adviser, the Adviser and the Trust, the Adviser will pay the Sub-Adviser an annual fee, payable monthly, at the annual rate of 0.50% and 0.35% of the average daily net assets for the AQR Diversified Arbitrage Fund and AQR Multi-Strategy Alternative Fund, respectively.
JPMorgan Chase Bank, N.A., serves as the Funds’ Administrator, Accounting Agent and Custodian.
State Street Bank and Trust Company, together with JPMorgan Chase Bank, N.A., serve as Custodian of the AQR Diversified Arbitrage Fund, the AQR Equity Market Neutral Fund, the AQR Long-Short Equity Fund, the AQR Style Premia Alternative Fund and the AQR Style Premia Alternative LV Fund.
ALPS Fund Services, Inc. serves as the Funds’ Transfer Agent, and ALPS Distributors, Inc. serves as the Funds’ Distributor.
During the year ended December 31, 2015, the Adviser contributed $39,831 and $118,388 into the AQR Risk-Balanced Commodities Strategy Fund and AQR Style Premia Alternative Fund, respectively, for losses incurred due to trade processing errors. The impact of the Adviser’s contributions on the Funds’ total return was immaterial. These amounts have been included in Net realized gain (loss) in the Statements of Operations.
10. Distribution Plan
The Trust has adopted a Plan of Distribution (the “Plan”) pursuant to Rule 12b-1 under the 1940 Act with respect to the Class N shares of the Funds. The Plan allows for the payment of services related to the distribution and servicing of these shares at a rate of up to 0.25% per annum of the average daily net asset value of the Class N shares of the Funds.
11. Principal Risks and Concentrations
In the normal course of business the Funds trade financial instruments and enter into financial transactions where risk of potential loss exists due to changes in the market (market risk). A Fund’s investments in financial derivatives and other financial instruments may expose the Fund to various elements of market risks which include interest rate, foreign currency, equity and commodity risks.
Interest rate risk is the risk that fixed income securities will decline in value because of changes in interest rates. Convertible securities and non-convertible income producing securities are subject to certain risks, including (i) if interest rates go up, the value of convertible securities and non-convertible income-producing securities in the Funds’ portfolio generally will decline; (ii) during periods of declining interest rates, the issuer of a security may exercise its option to prepay principal earlier than scheduled, forcing the Funds to reinvest in lower yielding securities (call or prepayment risk); and (iii) during periods of rising interest rates, the average life of certain types of securities may be extended because of slower than expected principal payments (extension risk).
Currency risk arises from the possibility that fluctuations in foreign exchange rates will affect the value of cash balances held in foreign currencies and non-U.S. denominated financial instruments. In addition, the Funds’ use of forward foreign currency exchange contracts may expose them to the risk that the value of the foreign currency changes unfavorably relative to the U.S. Dollar. Currency rates in foreign countries may fluctuate significantly over short periods of time for a number of reasons.
The market values of equities, such as common stocks and preferred securities or equity related investments such as futures and options, may decline due to general market conditions which are not specifically related to a particular company. They may also decline due to factors which affect a particular industry or industries. The Funds may invest in illiquid investments and may experience difficulty in selling those investments in a timely manner at the price that it believes the investments are worth. Prices may fluctuate widely over short or extended periods in response to company, market or economic news. Markets also tend to move in cycles, with periods of rising and falling prices. This volatility may cause the Fund’s net asset value to experience significant increases or decreases over short periods of time. If there is a general decline in the securities and other markets, the net asset value of a Fund may lose value, regardless of the individual results of the securities and other instruments in which the Fund invests.
Exposure to the commodities markets may subject a Fund to greater volatility than investments in traditional securities. The value of commodity-linked derivative investments and exchange-traded notes may be affected by changes in overall market movements, commodity index volatility, changes in interest rates, or factors affecting a particular industry or commodity.
In addition to market risk, the Funds may be exposed to the risk that one or more securities in the Funds’ portfolio will decline in price, or fail to pay interest or principal when due, because the issuer of the security experiences a decline in its financial status (credit risk). Credit risk is
| AQR Funds | Annual Report | December 2015 | ||||||||||||||
398
Table of Contents
| Notes to Financial Statements | December 31, 2015 |
measured by the loss a Fund would record if the major financial institution or other counterparties failed to perform pursuant to terms of their obligations. Certain Funds may primarily maintain cash balances at one or several major financial institutions that may exceed federally insured limits and as such each of the Funds have credit risk associated with such financial institutions. In general, lower rated securities carry a greater degree of risk that the issuer will lose its ability to make interest and principal payments, which could have a negative impact on the Funds’ net asset value or dividends. The Funds minimize credit risk by monitoring credit exposure and collateral values, and by requiring additional collateral to be promptly deposited with or returned to each of the Funds when deemed necessary.
Similar to credit risk, a Fund may be exposed to counterparty risk, or the risk that an institution or other entity with which the Fund has unsettled or open transactions will default. Financial assets, which potentially expose a Fund to counterparty risk, consist principally of cash due from counterparties and investments. By using derivative instruments, the Funds may be exposed to the risk that derivative counterparties may not perform in accordance with the contractual provisions offset by the value of any collateral received. The Funds’ exposure to credit risk associated with counterparty non-performance is limited to the unrealized gains inherent in such transactions that are recognized in the Statements of Assets and Liabilities. The counterparties to the Funds’ derivative investments may include affiliates of the Funds’ clearing brokers and other major financial institutions. While the Funds use multiple clearing brokers and counterparties, a concentration of credit risk may exist because of balances held and transactions with a limited number of clearing brokers and counterparties. The Funds minimize counterparty credit risk through credit limits and approvals, credit monitoring procedures, executing master netting arrangements and managing margin and collateral requirements, as appropriate.
In the normal course of business, the Funds may enter into agreements with certain counterparties for derivative transactions. A number of each Fund’s Master Agreements contain provisions that require each Fund to maintain a predetermined level of net assets, and/or provide limits regarding the decline of a Fund’s net asset value over specified time periods. If a Fund was to violate such provisions, the counterparties to the derivative instruments could request immediate payment or demand immediate collateralization on derivative instruments in net liability positions. If such events are not cured by the Fund or waived by the counterparties, they may decide to curtail or limit extension of credit, and the Fund may be forced to unwind its derivative positions which may result in material losses.
The Funds, at times, utilize substantial leverage in their investment program. Such leverage may take the form of trading on margin, investing in derivative instruments that are inherently leveraged, entering into reverse repurchase transactions and entering into other forms of direct and indirect borrowings. There is no guarantee that the Funds’ borrowing arrangement or other arrangements for obtaining leverage will continue to be available, or if available, will be available on terms and conditions acceptable to the Funds. Unfavorable economic conditions also could increase funding costs, limit access to the capital markets or result in a decision by lenders not to extend credit to the Funds. In addition, a decline in market value of the Funds’ assets may have particular adverse consequences in instances where they have borrowed money based on the market value of those assets. A decrease in market value of those assets may result in the lender (including derivative counterparties) requiring the Funds to post additional collateral or otherwise sell assets at a time when it may not be in the Funds’ best interest to do so.
The Adviser relies heavily on quantitative models and information and data supplied by third parties. When models and data prove to be incorrect or incomplete, any decisions made in reliance thereon may expose the Fund to potential risks. Such models may produce unexpected results, which can result in losses for a Fund.
Periodically, the Funds may be a party to legal actions arising in the ordinary course of business. The Funds are currently not subject to any actions that either individually or in the aggregate are expected to have a material impact on their results of operations, cash flows or financial condition.
12. Holdings of 5% Voting Securities
The 1940 Act defines affiliates as companies in which the Fund owns at least 5% of the outstanding voting securities. The following is a summary of transactions with each affiliated company during the year ended December 31, 2015:
AQR DIVERSIFIED ARBITRAGE FUND | ||||||||||||||||||||||||||||
| NAME OF ISSUER | NUMBER OF SHARES/UNITS AT 12/31/14 | GROSS ADDITIONS | GROSS REDUCTIONS | NUMBER OF END OF YEAR | VALUE AT END OF YEAR 12/31/15 | INVESTMENT INCOME | REALIZED GAIN (LOSS) | |||||||||||||||||||||
1347 Capital Corp. (Common Stock) | 420,504 | — | — | 420,504 | $ | 4,141,964 | $ | — | $ | — | ||||||||||||||||||
Arowana, Inc. (Common Stock) | — | 787,920 | — | 787,920 | 7,737,374 | — | — | |||||||||||||||||||||
Barington/Hilco Acquisition Corp. (Common Stock) | — | 487,260 | — | 487,260 | 4,775,148 | — | — | |||||||||||||||||||||
CB Pharma Acquisition Corp. (Common Stock) | 325,500 | — | — | 325,500 | 3,238,725 | — | — | |||||||||||||||||||||
Dundee Acquisition Ltd., Class A (Common Stock) | — | 1,260,000 | — | 1,260,000 | 8,769,097 | — | — | |||||||||||||||||||||
| AQR Funds | Annual Report | December 2015 | ||||||||||||||
399
Table of Contents
| Notes to Financial Statements | December 31, 2015 |
| AQR DIVERSIFIED ARBITRAGE FUND | ||||||||||||||||||||||||||||
| NAME OF ISSUER | NUMBER OF SHARES/UNITS AT 12/31/14 | GROSS ADDITIONS | GROSS REDUCTIONS | NUMBER OF END OF YEAR | VALUE AT END OF YEAR 12/31/15 | INVESTMENT INCOME | REALIZED GAIN (LOSS) | |||||||||||||||||||||
FinTech Acquisition Corp. (Common Stock) | — | 810,000 | — | 810,000 | $ | 7,703,100 | $ | — | $ | — | ||||||||||||||||||
Garnero Group Acquisition Co. (Common Stock) | 1,900,200 | — | (100,000 | ) | 1,800,200 | 17,659,962 | — | (23,018 | ) | |||||||||||||||||||
Gibraltar Growth Corp., Class A (Common Stock) | — | 1,274,000 | — | 1,274,000 | 8,756,045 | — | — | |||||||||||||||||||||
GP Investments Acquisition Corp. (Common Stock) | — | 2,475,000 | (345,000 | ) | 2,130,000 | 20,448,000 | — | (144,261 | ) | |||||||||||||||||||
HarmonyMerger Corp. (Common Stock) | — | 1,475,100 | (100,000 | ) | 1,375,100 | 13,407,225 | — | (26,018 | ) | |||||||||||||||||||
Hydra Industries Acquisition Corp. (Common Stock) | 1,720,000 | — | (100,000 | ) | 1,620,000 | 15,649,200 | — | (33,018 | ) | |||||||||||||||||||
1347 Capital Corp. (Rights) | 420,504 | — | — | 420,504 | 12,615 | — | — | |||||||||||||||||||||
Arowana, Inc. (Rights) | — | 720,000 | — | 720,000 | 144,000 | — | — | |||||||||||||||||||||
Barington/Hilco Acquisition Corp. (Rights) | — | 487,260 | — | 487,260 | 97,745 | — | — | |||||||||||||||||||||
CB Pharma Acquisition Corp. (Rights) | — | 325,500 | — | 325,500 | 41,501 | — | — | |||||||||||||||||||||
Garnero Group Acquisition Co. (Rights) | 2,430,200 | — | — | 2,430,200 | 583,248 | — | — | |||||||||||||||||||||
Hydra Industries Acquisition Corp. (Rights) | — | 1,720,000 | — | 1,720,000 | 399,040 | — | — | |||||||||||||||||||||
1347 Capital Corp. (Warrants) | 420,504 | — | — | 420,504 | 59,291 | — | — | |||||||||||||||||||||
Arowana, Inc. (Warrants) | — | — | 720,000 | 61,200 | — | — | ||||||||||||||||||||||
Barington/Hilco Acquisition Corp. (Warrants) | — | 487,260 | — | 487,260 | 60,908 | — | — | |||||||||||||||||||||
CB Pharma Acquisition Corp. (Warrants) | — | 325,500 | — | 325,500 | 48,825 | — | — | |||||||||||||||||||||
Dundee Acquisition Ltd. (Warrants) | — | 630,000 | — | 630,000 | 97,890 | — | — | |||||||||||||||||||||
FinTech Acquisition Corp. (Warrants) | — | 810,000 | — | 810,000 | 202,500 | — | — | |||||||||||||||||||||
Garnero Group Acquisition Co. (Warrants) | 2,430,200 | — | — | 2,430,200 | 291,624 | — | — | |||||||||||||||||||||
Gibraltar Growth Corp. (Warrants) | — | 1,274,000 | — | 1,274,000 | 119,694 | — | — | |||||||||||||||||||||
GP Investments Acquisition Corp. (Warrants) | — | 1,237,500 | — | 1,237,500 | 495,000 | — | — | |||||||||||||||||||||
HarmonyMerger Corp. (Warrants) | — | 1,475,100 | — | 1,475,100 | 516,285 | — | — | |||||||||||||||||||||
Hydra Industries Acquisition Corp. (Warrants) | — | 1,720,000 | — | 1,720,000 | 321,640 | — | — | |||||||||||||||||||||
| $ | 115,838,846 | $ | — | $ | (226,315 | ) | ||||||||||||||||||||||
13. Line of Credit
Effective February 27, 2015 and terminating on February 26, 2016, the Trust renewed a committed syndicated line of credit (the “Agreement”) with Bank of America, N.A., as the Administrative Agent. Borrowing, if any, under this arrangement bears interest at the sum of (a) 1.0% per annum plus (b) the higher of (i) the Federal Funds Rate or (ii) the Eurodollar Rate, which is paid as incurred. For the year ended December 31, 2015, the maximum loan amount outstanding per Fund was the lesser of an amount which did not exceed the borrowing limits set forth in the Funds’ Prospectus and/or Registration Statement and did not cause the asset coverage ratio for any borrowings by a Fund to drop below the required amount under the Agreement (between 300-500% per Fund). The Agreement is subject to an annual commitment fee which is payable in arrears on a quarterly basis. In the event of a draw upon the line of credit, liquid assets of the borrowing Fund may be designated as collateral until its loan is repaid in full. Funds with less than $25,000,000 in assets are ineligible to draw upon the line of credit. The line of credit is in the amount of $225,000,000. On February 11, 2016 the Trustees have approved a renewal of the line of credit effective February 29, 2016 through February 28, 2017 up to $275,000,000 subject to substantially similar terms. The Funds did not have any borrowings for the year ended December 31, 2015.
| AQR Funds | Annual Report | December 2015 | ||||||||||||||
400
Table of Contents
| Notes to Financial Statements | December 31, 2015 |
14. Principal Ownership
As of December 31, 2015, the Funds had individual shareholder and/or omnibus accounts owning more than 5% of the total shares outstanding of the Fund as follows:
| FUND | NUMBER OF INDIVIDUAL SHAREHOLDERS AND/OR OMNIBUS ACCOUNTS | TOTAL PERCENTAGE INTEREST HELD | ||||||
AQR Diversified Arbitrage Fund | 5 | 82.06 | % | |||||
AQR Equity Market Neutral Fund | 4 | 88.56 | % | |||||
AQR Global Macro Fund* | 4 | 81.88 | % | |||||
AQR Long-Short Equity Fund | 5 | 89.91 | % | |||||
AQR Managed Futures Strategy Fund | 8 | 77.22 | % | |||||
AQR Managed Futures Strategy HV Fund | 5 | 85.50 | % | |||||
AQR Multi-Strategy Alternative Fund | 4 | 75.71 | % | |||||
AQR Risk-Balanced Commodities Strategy Fund | 6 | 93.24 | % | |||||
AQR Risk Parity Fund | 5 | 81.64 | % | |||||
AQR Risk Parity II HV Fund* | 7 | 86.50 | % | |||||
AQR Risk Parity II MV Fund | 7 | 87.59 | % | |||||
AQR Style Premia Alternative Fund | 5 | 77.08 | % | |||||
AQR Style Premia Alternative LV Fund | 4 | 87.82 | % | |||||
| * | The percentage held by the Adviser and/or affiliates is 14.91% and 18.90% respectively. |
Significant shareholder transactions by these shareholders, if any, may impact the Funds’ performance.
15. Redemption in Kind
On July 25, 2014, one shareholder redeemed their investment in the AQR Style Premia Alternative Fund. The redemption represented 70.1% of the Fund’s net assets and was paid partially in cash and in-kind. The amount of redemption proceeds paid in-kind was $52,771,157. The realized gain (loss) associated with the portion redeemed in-kind was $19,331,459.
16. New Accounting Pronouncements
In May 2015, the FASB issued ASU No. 2015-07, Fair Value Measurement (Topic 820)—Disclosures for Investments in Certain Entities That Calculate Net Asset Value per Share (or Its Equivalent) (“ASU 2015-07”). The amendment removes the requirement to categorize within the fair value hierarchy all investments for which fair value is measured using the Net Asset Value per Share practical expedient. The Funds are required to apply ASU 2015-07 for fiscal years beginning after December 15, 2015 and interim periods within those fiscal years. Management is currently evaluating the impact of ASU 2015-07.
In September 2015, the FASB issued ASU No. 2015-15, Interest-Imputation of Interest (Subtopic 835-30)—Presentation and Subsequent Measurement of Debt Issuance Costs Associated with Line-of-Credit Arrangements. The amendment clarifies that the SEC would not object to an entity deferring and presenting debt issuance costs as an asset and subsequently amortizing the deferred debt issuance costs ratably over the term of the line-of-credit arrangement.
17. Subsequent Events
The Funds have evaluated subsequent events through the date of issuance of this report and have determined that there are no material events other than those noted above.
| AQR Funds | Annual Report | December 2015 | ||||||||||||||
401
Table of Contents
| Report of Independent Registered Public Accounting Firm |
To the Board of Trustees and Shareholders of AQR Funds:
In our opinion, the accompanying statements of assets and liabilities, including the schedules of investments, and the related statements of operations, of changes in net assets and of cash flows and the financial highlights as well as the accompanying consolidated statements of assets and liabilities, including the consolidated schedules of investments, and the related consolidated statements of operations, of changes in net assets and of cash flows and the financial highlights present fairly, in all material respects, the financial position of each of the thirteen portfolios that are included in AQR Funds (as listed in Note 1 to the financial statements and collectively referred to as the “Funds”) at December 31, 2015, and the results of each of their operations, the changes in each of their net assets, the cash flows of AQR Diversified Arbitrage Fund, AQR Equity Market Neutral Fund, AQR Long Short Equity Fund, AQR Multi- Strategy Alternative Fund, AQR Risk Parity II HV Fund, AQR Style Premia Alternative Fund, AQR Style Premia Alternative LV Fund and the financial highlights for each of the periods presented, in conformity with accounting principles generally accepted in the United States of America. These financial statements and financial highlights (hereafter referred to as “financial statements”) are the responsibility of the Funds’ management. Our responsibility is to express an opinion on these financial statements based on our audits. We conducted our audits of these financial statements in accordance with the standards of the Public Company Accounting Oversight Board (United States). Those standards require that we plan and perform the audit to obtain reasonable assurance about whether the financial statements are free of material misstatement. An audit includes examining, on a test basis, evidence supporting the amounts and disclosures in the financial statements, assessing the accounting principles used and significant estimates made by management, and evaluating the overall financial statement presentation. We believe that our audits, which included confirmation of securities at December 31, 2015 by correspondence with the custodian, brokers, and transfer agents and the application of alternative auditing procedures where confirmation of securities purchased had not been received, provide a reasonable basis for our opinion.
PricewaterhouseCoopers LLP
New York, New York
February 25, 2016
| AQR Funds | Annual Report | December 2015 | ||||||||||||||
402
Table of Contents
| Other Federal Tax Information (Unaudited) |
For the fiscal year ended December 31, 2015, the Funds designate the following percentages of ordinary income dividends, or maximum amount allowable, as qualifying for the reduced tax rate under the Jobs and Growth Tax Relief Reconciliation Act of 2003:
| FUND | PERCENTAGE | |||
AQR Diversified Arbitrage Fund | 2.21 | % | ||
AQR Equity Market Neutral Fund | 6.11 | % | ||
AQR Long-Short Equity Fund | 4.07 | % | ||
AQR Multi-Strategy Alternative Fund | 0.44 | % | ||
AQR Style Premia Alternative Fund | 9.44 | % | ||
AQR Style Premia Alternative LV Fund | 8.75 | % | ||
The Funds designate the following amounts, or the maximum allowable under Section 852 of the Internal Revenue Code, as long term capital gain dividends paid during the fiscal year ended December 31, 2015:
| FUND | TOTAL | |||
AQR Equity Market Neutral Fund | $ | 102,719 | ||
AQR Global Macro Fund | $ | 1,765,884 | ||
AQR Long-Short Equity Fund | $ | 768,361 | ||
AQR Managed Futures Strategy Fund | $ | 132,351,997 | ||
AQR Managed Futures Strategy HV Fund | $ | 9,217,388 | ||
AQR Risk Parity Fund | $ | 5,238,673 | ||
AQR Risk Parity II HV Fund | $ | 935,618 | ||
AQR Risk Parity II MV Fund | $ | 2,518,203 | ||
AQR Style Premia Alternative LV Fund | $ | 28,347 | ||
| AQR Funds | Annual Report | December 2015 | ||||||||||||||
403
Table of Contents
| Fund Expense Examples (Unaudited) |
As a shareholder of the Trust, you incur two types of costs: (1) transaction costs and (2) ongoing costs, including management fees; and other Fund expenses. This example is intended to help you understand your ongoing costs (in dollars) of investing in the Fund and to compare these costs with the ongoing costs of investing in other mutual funds The Example is based on an investment of $1,000 invested at the beginning of the period and held for the entire period as indicated below.
Actual Expenses
The table below provides information about actual account values and actual expenses. You may use the information together with the amount you invested, to estimate the expenses that you paid over the period. Simply divide your account value by $1,000 (for example, an $8,600 account value divided by $1,000 = 8.6), then multiply the result by the number under the heading entitled “Expenses Paid for the Period Ending 12/31/15” to estimate the expenses you paid on your account during this period. Each Fund will indirectly bear its pro rata share of the expenses incurred by the underlying investments in which the Fund invests. These expenses are not included in the table.
Hypothetical Example for Comparison Purposes
The table below also provides information about hypothetical account values and hypothetical expenses based on each Fund’s actual expense ratio and an assumed annual rate of return of 5% before expenses, which is not the Fund’s actual return. The hypothetical account values and expenses may not be used to estimate the actual ending account balance or expenses you paid for the period. You may use this information to compare the ongoing costs of investing in a Fund and other funds by comparing this 5% hypothetical example with the 5% hypothetical examples that appear in the shareholder reports of other funds. The Fund will indirectly bear its pro rata share of the expenses incurred by the underlying investments in which the Fund invests. These expenses are not included in the table.
Please note that the expenses shown in the table are meant to highlight your ongoing costs only and do not reflect any transactional costs. Therefore, the hypothetical example is useful in comparing ongoing costs only, and will not help you determine the relative total costs of owning different funds. In addition, if these transactional costs were included, your costs would have been higher.
| BEGINNING ACCOUNT DATE VALUE | ENDING ACCOUNT VALUE 12/31/15 | ANNUALIZED EXPENSE RATIO FOR THE PERIOD | EXPENSES PAID FOR THE PERIOD ENDING 12/31/15 | |||||||||||||
| AQR Diversified Arbitrage Fund | ||||||||||||||||
| Class I | ||||||||||||||||
Actual Return | $1,000.00 | $954.20 | 2.56 | % | $12.61 | |||||||||||
Hypothetical Return | $1,000.00 | $1,012.30 | 2.56 | % | $12.98 | |||||||||||
| Class N | ||||||||||||||||
Actual Return | $1,000.00 | $953.40 | 2.86 | % | $14.08 | |||||||||||
Hypothetical Return | $1,000.00 | $1,010.79 | 2.86 | % | $14.50 | |||||||||||
| Class R6 | ||||||||||||||||
Actual Return | $1,000.00 | $954.50 | 2.43 | % | $11.97 | |||||||||||
Hypothetical Return | $1,000.00 | $1,012.96 | 2.43 | % | $12.33 | |||||||||||
| AQR Equity Market Neutral Fund | ||||||||||||||||
| Class I | ||||||||||||||||
Actual Return | $1,000.00 | $1,126.50 | 1.76 | % | $9.43 | |||||||||||
Hypothetical Return | $1,000.00 | $1,016.33 | 1.76 | % | $8.94 | |||||||||||
| Class N | ||||||||||||||||
Actual Return | $1,000.00 | $1,125.90 | 2.02 | % | $10.82 | |||||||||||
Hypothetical Return | $1,000.00 | $1,015.02 | 2.02 | % | $10.26 | |||||||||||
| Class R6 | ||||||||||||||||
Actual Return | $1,000.00 | $1,126.50 | 1.72 | % | $9.22 | |||||||||||
Hypothetical Return | $1,000.00 | $1,016.53 | 1.72 | % | $8.74 | |||||||||||
| AQR Funds | Annual Report | December 2015 | ||||||||||||||
404
Table of Contents
| Fund Expense Examples (Unaudited) |
| BEGINNING ACCOUNT DATE VALUE | ENDING ACCOUNT VALUE 12/31/15 | ANNUALIZED EXPENSE RATIO FOR THE PERIOD | EXPENSES PAID FOR THE PERIOD ENDING 12/31/15 | |||||||||||||
| AQR Global Macro Fund | ||||||||||||||||
| Class I | ||||||||||||||||
Actual Return | $1,000.00 | $1,019.20 | 1.29 | % | $6.57 | |||||||||||
Hypothetical Return | $1,000.00 | $1,018.70 | 1.29 | % | $6.56 | |||||||||||
| Class N | ||||||||||||||||
Actual Return | $1,000.00 | $1,017.20 | 1.70 | % | $8.64 | |||||||||||
Hypothetical Return | $1,000.00 | $1,016.64 | 1.70 | % | $8.64 | |||||||||||
| Class R6 | ||||||||||||||||
Actual Return | $1,000.00 | $1,019.20 | 1.35 | % | $6.87 | |||||||||||
Hypothetical Return | $1,000.00 | $1,018.40 | 1.35 | % | $6.87 | |||||||||||
| AQR Long-Short Equity Fund | ||||||||||||||||
| Class I | ||||||||||||||||
Actual Return | $1,000.00 | $1,120.90 | 1.73 | % | $9.25 | |||||||||||
Hypothetical Return | $1,000.00 | $1,016.48 | 1.73 | % | $8.79 | |||||||||||
| Class N | ||||||||||||||||
Actual Return | $1,000.00 | $1,119.40 | 1.99 | % | $10.63 | |||||||||||
Hypothetical Return | $1,000.00 | $1,015.17 | 1.99 | % | $10.11 | |||||||||||
| Class R6 | ||||||||||||||||
Actual Return | $1,000.00 | $1,121.10 | 1.72 | % | $9.20 | |||||||||||
Hypothetical Return | $1,000.00 | $1,016.53 | 1.72 | % | $8.74 | |||||||||||
| AQR Managed Futures Strategy Fund | ||||||||||||||||
| Class I | ||||||||||||||||
Actual Return | $1,000.00 | $1,023.80 | 1.19 | % | $6.07 | |||||||||||
Hypothetical Return | $1,000.00 | $1,019.21 | 1.19 | % | $6.06 | |||||||||||
| Class N | ||||||||||||||||
Actual Return | $1,000.00 | $1,022.40 | 1.46 | % | $7.44 | |||||||||||
Hypothetical Return | $1,000.00 | $1,017.85 | 1.46 | % | $7.43 | |||||||||||
| Class R6 | ||||||||||||||||
Actual Return | $1,000.00 | $1,025.50 | 1.13 | % | $5.77 | |||||||||||
Hypothetical Return | $1,000.00 | $1,019.51 | 1.13 | % | $5.75 | |||||||||||
| AQR Managed Futures Strategy HV Fund | ||||||||||||||||
| Class I | ||||||||||||||||
Actual Return | $1,000.00 | $1,032.20 | 1.58 | % | $8.09 | |||||||||||
Hypothetical Return | $1,000.00 | $1,017.24 | 1.58 | % | $8.03 | |||||||||||
| Class N | ||||||||||||||||
Actual Return | $1,000.00 | $1,031.10 | 1.89 | % | $9.68 | |||||||||||
Hypothetical Return | $1,000.00 | $1,015.68 | 1.89 | % | $9.60 | |||||||||||
| Class R6 | ||||||||||||||||
Actual Return | $1,000.00 | $1,032.80 | 1.55 | % | $7.94 | |||||||||||
Hypothetical Return | $1,000.00 | $1,017.39 | 1.55 | % | $7.88 | |||||||||||
| AQR Funds | Annual Report | December 2015 | ||||||||||||||
405
Table of Contents
| Fund Expense Examples (Unaudited) |
| BEGINNING ACCOUNT DATE VALUE | ENDING ACCOUNT VALUE 12/31/15 | ANNUALIZED EXPENSE RATIO FOR THE PERIOD | EXPENSES PAID FOR THE PERIOD ENDING 12/31/15 | |||||||||||||
| AQR Multi-Strategy Alternative Fund | ||||||||||||||||
| Class I | ||||||||||||||||
Actual Return | $1,000.00 | $1,090.30 | 2.40 | % | $12.64 | |||||||||||
Hypothetical Return | $1,000.00 | $1,013.11 | 2.40 | % | $12.18 | |||||||||||
| Class N | ||||||||||||||||
Actual Return | $1,000.00 | $1,089.00 | 2.67 | % | $14.06 | |||||||||||
Hypothetical Return | $1,000.00 | $1,011.75 | 2.67 | % | $13.54 | |||||||||||
| Class R6 | ||||||||||||||||
Actual Return | $1,000.00 | $1,090.00 | 2.33 | % | $12.27 | |||||||||||
Hypothetical Return | $1,000.00 | $1,013.46 | 2.33 | % | $11.82 | |||||||||||
| AQR Risk-Balanced Commodities Strategy Fund | ||||||||||||||||
| Class I | ||||||||||||||||
Actual Return | $1,000.00 | $880.90 | 0.90 | % | $4.27 | |||||||||||
Hypothetical Return | $1,000.00 | $1,020.67 | 0.90 | % | $4.58 | |||||||||||
| Class N | ||||||||||||||||
Actual Return | $1,000.00 | $879.90 | 1.24 | % | $5.88 | |||||||||||
Hypothetical Return | $1,000.00 | $1,018.95 | 1.24 | % | $6.31 | |||||||||||
| Class R6 | ||||||||||||||||
Actual Return | $1,000.00 | $881.10 | 0.90 | % | $4.27 | |||||||||||
Hypothetical Return | $1,000.00 | $1,020.67 | 0.90 | % | $4.58 | |||||||||||
| AQR Risk Parity Fund | ||||||||||||||||
| Class I | ||||||||||||||||
Actual Return | $1,000.00 | $905.60 | 0.92 | % | $4.42 | |||||||||||
Hypothetical Return | $1,000.00 | $1,020.57 | 0.92 | % | $4.69 | |||||||||||
| Class N | ||||||||||||||||
Actual Return | $1,000.00 | $905.50 | 1.15 | % | $5.52 | |||||||||||
Hypothetical Return | $1,000.00 | $1,019.41 | 1.15 | % | $5.85 | |||||||||||
| Class R6 | ||||||||||||||||
Actual Return | $1,000.00 | $906.60 | 0.85 | % | $4.08 | |||||||||||
Hypothetical Return | $1,000.00 | $1,020.92 | 0.85 | % | $4.33 | |||||||||||
| AQR Risk Parity II HV Fund | ||||||||||||||||
| Class I | ||||||||||||||||
Actual Return | $1,000.00 | $850.70 | 1.07 | % | $4.99 | |||||||||||
Hypothetical Return | $1,000.00 | $1,019.81 | 1.07 | % | $5.45 | |||||||||||
| Class N | ||||||||||||||||
Actual Return | $1,000.00 | $848.50 | 1.48 | % | $6.90 | |||||||||||
Hypothetical Return | $1,000.00 | $1,017.74 | 1.48 | % | $7.53 | |||||||||||
| Class R6 | ||||||||||||||||
Actual Return | $1,000.00 | $849.80 | 1.14 | % | $5.32 | |||||||||||
Hypothetical Return | $1,000.00 | $1,019.46 | 1.14 | % | $5.80 | |||||||||||
| AQR Funds | Annual Report | December 2015 | ||||||||||||||
406
Table of Contents
| Fund Expense Examples (Unaudited) |
| BEGINNING ACCOUNT DATE VALUE | ENDING ACCOUNT VALUE 12/31/15 | ANNUALIZED EXPENSE RATIO FOR THE PERIOD | EXPENSES PAID FOR THE PERIOD ENDING 12/31/15 | |||||||||||||
| AQR Risk Parity II MV Fund | ||||||||||||||||
| Class I | ||||||||||||||||
Actual Return | $1,000.00 | $900.50 | 0.91 | % | $4.36 | |||||||||||
Hypothetical Return | $1,000.00 | $1,020.62 | 0.91 | % | $4.63 | |||||||||||
| Class N | ||||||||||||||||
Actual Return | $1,000.00 | $900.60 | 1.20 | % | $5.75 | |||||||||||
Hypothetical Return | $1,000.00 | $1,019.16 | 1.20 | % | $6.11 | |||||||||||
| Class R6 | ||||||||||||||||
Actual Return | $1,000.00 | $901.30 | 0.85 | % | $4.07 | |||||||||||
Hypothetical Return | $1,000.00 | $1,020.92 | 0.85 | % | $4.33 | |||||||||||
| AQR Style Premia Alternative Fund | ||||||||||||||||
| Class I | ||||||||||||||||
Actual Return | $1,000.00 | $1,103.30 | 2.00 | % | $10.60 | |||||||||||
Hypothetical Return | $1,000.00 | $1,015.12 | 2.00 | % | $10.16 | |||||||||||
| Class N | ||||||||||||||||
Actual Return | $1,000.00 | $1,102.90 | 2.26 | % | $11.98 | |||||||||||
Hypothetical Return | $1,000.00 | $1,013.81 | 2.26 | % | $11.47 | |||||||||||
| Class R6 | ||||||||||||||||
Actual Return | $1,000.00 | $1,103.70 | 2.01 | % | $10.66 | |||||||||||
Hypothetical Return | $1,000.00 | $1,015.07 | 2.01 | % | $10.21 | |||||||||||
| AQR Style Premia Alternative LV Fund | ||||||||||||||||
| Class I | ||||||||||||||||
Actual Return | $1,000.00 | $1,046.30 | 1.01 | % | $5.21 | |||||||||||
Hypothetical Return | $1,000.00 | $1,020.11 | 1.01 | % | $5.14 | |||||||||||
| Class N | ||||||||||||||||
Actual Return | $1,000.00 | $1,045.70 | 1.31 | % | $6.75 | |||||||||||
Hypothetical Return | $1,000.00 | $1,018.60 | 1.31 | % | $6.67 | |||||||||||
| Class R6 | ||||||||||||||||
Actual Return | $1,000.00 | $1,047.50 | 0.99 | % | $5.11 | |||||||||||
Hypothetical Return | $1,000.00 | $1,020.21 | 0.99 | % | $5.04 | |||||||||||
Expenses are calculated using each Class’ annualized expense ratio, multiplied by the average account value for the period, multiplied by 184/365 (to reflect the one-half year period unless stated otherwise).
| AQR Funds | Annual Report | December 2015 | ||||||||||||||
407
Table of Contents
| Trustees and Officers (Unaudited) | December 31, 2015 |
Listed in the chart below is basic information regarding the Trustees and Officers of the Trust. The address of each Officer and Trustee is Two Greenwich Plaza, 3rd Floor, Greenwich CT 06830.
| NAME AND YEAR OF BIRTH | CURRENT POSITION WITH THE TRUST, TERM OF OFFICE1 AND LENGTH OF TIME SERVED | PRINCIPAL OCCUPATION(S) DURING PAST 5 YEARS | NUMBER OF FUNDS IN FUND COMPLEX OVERSEEN BY TRUSTEE | OTHER PRESENT OR PAST DIRECTORSHIPS HELD BY TRUSTEE (DURING THE PAST 5 YEARS) | ||||
Disinterested Trustees2 | ||||||||
| Timothy K. Armour, M.B.A., 1948 | Chairman of the Board, since 2010 and Trustee, since 2008 | Interim Chief Executive Officer of Janus Capital Group (retired) (2009 to 2010) (financial services) | 42 | Janus Capital Group (since 2008); ETF Securities (2010- 2013) | ||||
| L. Joe Moravy, M.B.A., CPA, 1950 | Trustee, since 2008 | Independent Consultant (since 2014); Managing Director, Finance Scholars | 42 | Nuveen Exchange Traded Commodities Funds (since 2012) | ||||
| William L. Atwell, M.B.A., 1950 | Trustee, since 2011 | Managing Director, Atwell Partners LLC (since 2012) (consulting); President (CIGNA International), CIGNA (2008 to 2012) (insurance) | 42 | Webster Financial Corporation (since 2014) | ||||
| Gregg D. Behrens, M.M., 1952 | Trustee, since 2011 | Retired from Northern Trust Company (since 2009) banking) | 42 | None | ||||
| Brian Posner, M.B.A., 1961 | Trustee, since 2011 | President, Point Rider Group LLC (since 2008) (consulting) | 42 | Biogen (since 2008); Arch Capital Group (since 2010); BG Medicine (2012- 2015); RiverPark Funds Trust (2010 to 2012) | ||||
Mark. A. Zurack, M.B.A., CFA 1957 | Trustee, since 2014 | Adjunct Professor and Executive-in- Residence, Columbia Business School (since 2002) | 42 | Exchange Traded Concepts Trust (since 2011); Source ETF Trust (since 2014) | ||||
Interested Trustees3 | ||||||||
| David Kabiller, CFA, 1963 | Trustee, since 2010 | Founding Principal, AQR Capital Management, LLC (since 1998) | 42 | None | ||||
| Marco Hanig, Ph.D., 1958 | Trustee, since 2014; Chief Executive | Principal, AQR Capital Management, LLC (since 2008) | 42 | None | ||||
Officers | ||||||||
| H.J. Willcox, J.D., 1966 | Chief Compliance Officer, since 2013 | Managing Director and Chief Compliance Officer, AQR Capital Management, LLC (since 2013); Global Head of Compliance and Counsel KKR & Co., L.P. (2008-2013) | N/A | N/A | ||||
Heather Bonner, CPA, 1977 | Chief Financial Officer, since 2014 | Vice President, AQR Capital Management, LLC (since 2013); Senior Manager, PricewaterhouseCoopers, LLP (2007- 2013) | N/A | N/A | ||||
| AQR Funds | Annual Report | December 2015 | ||||||||||||||
408
Table of Contents
| Trustees and Officers (Unaudited) | December 31, 2015 |
| NAME AND YEAR OF BIRTH | CURRENT POSITION WITH THE TRUST, TERM OF OFFICE1 AND LENGTH OF TIME SERVED | PRINCIPAL OCCUPATION(S) DURING PAST 5 YEARS | NUMBER OF FUNDS IN FUND COMPLEX OVERSEEN BY TRUSTEE | OTHER PRESENT OR PAST DIRECTORSHIPS HELD BY TRUSTEE (DURING THE PAST 5 YEARS) | ||||
| Gregory McNeil, M.S./M.B.A., CPA, 1975 | Vice President and Treasurer, since 2015 | Vice President, AQR Capital Management, LLC (since 2015); Assistant Treasurer at Franklin Templeton Investments (2010-2015) | N/A | N/A | ||||
| Bradley Asness, J.D., M.B.A. 1969 | Vice President, since 2009 | Principal and Chief Legal Officer, AQR Capital Management, LLC (since 1998) | N/A | N/A | ||||
| Brendan R. Kalb, J.D. 1975 | Executive Vice President, since 2009; Secretary, since 2008 | Managing Director and General Counsel, AQR Capital Management, LLC (since 2004) | N/A | N/A | ||||
| Nicole DonVito, J.D. 1979 | Chief Legal Officer, since 2014; Vice President, since 2009 | Senior Counsel & Head of Registered Products, AQR Capital Management, LLC (since 2007) | N/A | N/A | ||||
| (1) | Each Trustee serves until the election and qualification of a successor, or until death, resignation or removal as provided in the Trust’s Declaration of Trust. |
| (2) | A Disinterested Trustee is any Trustee that is not an “interested person” of the Trust within the meaning of Section 2(a)(19) of the 1940 Act. |
| (3) | An Interested Trustee is a Trustee that is an “interested person” of the Trust within the meaning of Section 2(a)(19) of the 1940 Act. Mr. Kabiller and Dr. Hanig are interested persons of the Trust because of their positions with the Adviser. |
| AQR Funds | Annual Report | December 2015 | ||||||||||||||
409
Table of Contents
| Board Approval of Investment Advisory Agreements (Unaudited) | ||
The Board of Trustees (the “Board,” and the members of which are referred to as “Board Members”) of the AQR Funds (the “Trust”) met in person on November 12-13, 2015 to consider the continuation of the: (i) Second Amended and Restated Investment Management Agreement between the Trust, on behalf of the AQR Diversified Arbitrage Fund, AQR Equity Market Neutral Fund, AQR Global Macro Fund, AQR Long-Short Equity Fund, AQR Managed Futures Strategy Fund, AQR Managed Futures Strategy HV Fund, AQR Multi-Strategy Alternative Fund, AQR Risk-Balanced Commodities Strategy Fund, AQR Risk Parity Fund, AQR Risk Parity II HV Fund, AQR Risk Parity II MV Fund, AQR Style Premia Alternative Fund and AQR Style Premia Alternative LV Fund, and AQR Capital Management, LLC (“AQR”) (the “Investment Management Agreement”); (ii) Second Amended and Restated Investment Sub-Advisory Agreement between AQR and CNH Partners, LLC ( “CNH” or the “Sub-Adviser”) with respect to the AQR Diversified Arbitrage Fund; and (iii) the Investment Sub-Advisory Agreement between AQR and CNH with respect to the AQR Multi-Strategy Alternative Fund (collectively, the “Sub-Advisory Agreements”). Each of the aforementioned series of the Trust may be referred to herein as a “Fund” and collectively, the “Funds.” In addition, the Board Members who are not “interested persons” as defined in the Investment Company Act of 1940, as amended (the “1940 Act”) (the “Independent Board Members”), held a separate telephonic meeting in advance of the in-person meeting held on November 12-13, 2015 with independent legal counsel to review the materials provided and the relevant legal considerations (together with the in-person meeting held on November 12-13, 2015, the “Meetings”). In accordance with Section 15(c) of the 1940 Act, the Board requested, reviewed, and considered materials furnished by AQR and CNH relevant to the Board’s consideration of whether to approve the continuation of the Investment Management Agreement and the Sub-Advisory Agreements. These materials included: (i) memoranda and materials provided by AQR, describing the personnel and services provided to the Funds; (ii) memoranda and materials provided by AQR, describing the personnel and services provided by CNH to the AQR Diversified Arbitrage Fund and AQR Multi-Strategy Alternative Fund; (iii) performance information for the Funds relevant to the consideration of the Investment Management Agreement and Sub-Advisory Agreements; (iv) information independently compiled and prepared by Morningstar Associates, LLC (“Morningstar”) relating to the Funds’ fees and expenses and performance relative to peers; (v) a discussion of the financial information and profitability of AQR and CNH; and (vi) a discussion of the compliance programs of AQR and CNH and the regulatory exam histories of each. AQR and CNH are referred to herein as the “Adviser,” as applicable. The Investment Management Agreement and the Sub-Advisory Agreements are referred to collectively herein as the “Advisory Agreement,” as applicable and as the context suggests.
At the in-person meeting held on November 12-13, 2015, the Board, including the Independent Board Members, unanimously approved the continuation of the Advisory Agreement for an additional one-year period. In approving the continuation of the Advisory Agreement, the Board considered all factors it believed to be relevant with respect to the Funds, including, among other factors: (a) the nature, extent and quality of the services provided by the Adviser; (b) the investment performance of the Funds and the Adviser’s portfolio management; (c) the advisory fee and the cost of the services and profits to be realized by the Adviser from the relationship with the Funds; (d) economies of scale; and (e) other factors.
The Board also considered other matters it deemed important to the approval process, such as services related to the valuation and pricing of the Funds’ portfolio holdings, direct and indirect benefits to the Adviser and its affiliates from their relationship with the Funds and advice from independent legal counsel with respect to the review process and materials submitted for the Board’s review. The Board did not identify any particular information as controlling, and each Board Member may have attributed different weightings to the various items considered.
In considering the renewal of the Advisory Agreement, the Board did not view the Advisory Agreement as creating third-party beneficiary rights in shareholders to enforce the terms of the Advisory Agreement.
The following is a summary of the Board’s discussion and views regarding the factors it considered in evaluating the Advisory Agreement:
The Nature, Extent and Quality of the Services Provided by the Adviser. The Board Members reviewed the services that the Adviser provides to the Funds under the Advisory Agreement, including certain administrative services. The Board considered the size and experience of the Adviser’s staff, its use of technology, and the Funds’ stated investment objectives, strategies and processes. The Board reviewed the overall qualifications of the Adviser as an investment adviser. In connection with the investment advisory services provided to the Funds, the Board Members took into account discussions they had with officers of the Adviser regarding the management of each Fund’s investments in accordance with the Funds’ stated investment objectives and policies and the types of transactions that are entered into on behalf of the Funds. During these discussions, the Board Members asked questions of, and received answers from, the officers of the Adviser regarding the formulation and implementation of the Funds’ investment strategies, their efficacy and potential risks.
In addition to the investment advisory services provided to the Funds, the Board Members considered that AQR also provides shareholder and administrative services, has responsibility for overseeing CNH with respect to the AQR Diversified Arbitrage Fund and AQR Multi-Strategy Alternative Fund, provides oversight of Fund accounting, provides marketing services, and provides assistance in meeting legal and regulatory requirements and other services necessary for the operation of the Funds. In particular, the Board Members reviewed the compliance, shareholder and administrative services provided to the Funds by AQR under the Advisory Agreement. The Board also reviewed a wide range of services provided to the Funds pursuant to the Investment Management Agreement, which include providing information and services to Fund shareholders, including professional and informative reporting, access to analysis and explanations of Fund reports, and electronic access to Fund information.
Finally, the Independent Board Members had an opportunity to meet outside the presence of Fund management in executive session separately with independent legal counsel to discuss and consider the Advisory Agreement. Based on the presentations and materials at the Meetings, the Board concluded that the services provided to the Funds by AQR pursuant to the Advisory Agreement were of a high quality and benefit the Funds.
| AQR Funds | Annual Report | December 2015 | ||||||||||||||
410
Table of Contents
| Board Approval of Investment Advisory Agreements (Unaudited) | ||
Investment Performance of the Funds and the Adviser’s Portfolio Management. The Board considered the investment performance of each Fund. In particular, the Independent Board Members considered the investment performance of the Funds relative to their stated objectives and the Adviser’s success in reaching such goals as well as the performance of the Funds relative to their peers. The Board also considered the Adviser’s performance in managing other registered investment companies and private funds, noting that other funds the Adviser manages might have investment objectives, policies or restrictions different from those of the Funds. Based on these factors, the Board Members determined that AQR is an appropriate investment adviser for the Funds.
The Advisory Fee and the Cost of the Services and Profits Realized by the Adviser from the Relationship with the Funds. The Board, including the Independent Board Members, received and reviewed information regarding the management fees paid by the Funds to the Adviser pursuant to the Advisory Agreement. The Board examined this information in order to determine the reasonableness of the fees in light of the nature and quality of services provided to the Funds.
To assist in this analysis, the Board received a report independently prepared by Morningstar (the “Morningstar Report”). The Morningstar Report showed comparative fee information for each Fund’s respective Morningstar category, including expense comparisons of contractual investment advisory fees and actual net expenses. The Board also reviewed information regarding the fees the Adviser charges for other funds and accounts managed by the Adviser, including sub-advised mutual funds, with similar investment strategies to the Funds. The Board noted the greater services provided by the Adviser to the Funds in contrast to the limited role of the Adviser when it sub-advises mutual funds.
The Board also received and reviewed information regarding the profitability of the Adviser with respect to Fund-related activities and the profitability of CNH with respect to its sub-advisory services for two of the Funds. The Board also reviewed the Adviser’s methodology of determining profitability. The Board recognized that profitability may be affected by numerous factors including, among other things, fee waivers and expense reimbursements by the Adviser, the types of funds managed, taxes, expense allocations and business mix, and therefore comparability of profitability is somewhat limited.
The Board reviewed the Adviser’s unaudited financial information. The purpose of the review was to help the Independent Board Members determine whether the firm has the necessary resources to continue to provide high quality services to the Funds and attract and retain high quality employees.
Based on their review of the materials presented at the Meeting, the Board concluded that the management fees under the Advisory Agreement are reasonable.
Economies of Scale. The Adviser provided the Board with information concerning the extent to which economies of scale were realized as the Funds grew and whether fee levels were reflective of such economies of scale. The Board noted that, under the Advisory Agreement, none of the Funds, except for the AQR Risk Parity Fund, AQR Risk Parity II MV Fund and AQR Risk Parity II HV Fund, would have breakpoints in their advisory fees that would allow investors to benefit directly in the form of lower fees as fund assets grew. However, to show that economies are being shared, the Adviser presented information regarding each Fund’s advisory fees relative to comparable funds of larger sizes. The Board considered that the funds in the AQR fund complex share some common resources and, as a result, an increase in the overall size of the complex could permit each Fund to incur lower expenses than it would otherwise as a stand-alone entity. The Board also considered the Adviser’s overall operations and its efforts to expand the scale of, and further enhance the quality of, its operations.
Other Factors. The Board also took into account other ancillary or “fall-out” benefits that the Adviser or its affiliates may derive from its relationship with the Funds, both tangible and intangible. The Board also received information regarding the Adviser’s brokerage and soft dollar practices. The Board considered that the Adviser is responsible for decisions to buy and sell securities for the Funds, selection of broker-dealers and best execution, and aggregation and allocation of trade orders among the firm’s various advisory clients. The Board noted that the Adviser does not presently intend to make use of soft dollars to acquire third-party research.
Conclusion. Counsel advised the Board concerning the statutory and regulatory requirements for approval and disclosure of investment advisory agreements. No single factor was determinative to the decision of the Board. Based on the foregoing and such other matters as were deemed relevant, all of the Board Members, including all of the Independent Board Members, concluded that the management fee rates under the Advisory Agreement and total expense ratios are reasonable in relation to the services provided by the Adviser (including CNH, when applicable) to the Funds, as well as the costs incurred and benefits to be gained by the Adviser (including CNH, when applicable) in providing such services, including the investment advisory and administrative components. The Board also found the investment advisory and management fees to be reasonable in comparison to the fees charged by advisers to other comparable funds of similar size. As a result, all of the Board Members, including the Independent Board Members voting separately, approved the continuation of the Advisory Agreement with respect to the Funds. The Independent Board Members were represented by independent legal counsel who assisted them in their deliberations.
| AQR Funds | Annual Report | December 2015 | ||||||||||||||
411
Table of Contents
Investment Adviser
AQR Capital Management, LLC
Two Greenwich Plaza, 4th Floor
Greenwich, CT 06830
Sub-Adviser
CNH Partners, LLC
Two Greenwich Plaza, 3rd Floor,
Greenwich, CT 06830
Transfer Agent
ALPS Fund Services, Inc.
1290 Broadway, Suite 1100
Denver, CO 80203
Custodian
JPMorgan Chase Bank, N.A.
4 Metro Tech Center
Brooklyn, NY 11245
State Street Bank and Trust Company
One Lincoln Street
Boston, MA 02111
Distributor
ALPS Distributors, Inc.
1290 Broadway, Suite 1100
Denver, CO 80203
Administrator
JPMorgan Chase Bank, N.A.
70 Fargo Street
Boston, MA 02210
Independent Registered Public Accounting Firm
PricewaterhouseCoopers, LLP
300 Madison Avenue
New York, NY 10017
You may obtain a description of the AQR Funds proxy voting, policies, procedures and information regarding how each Fund voted proxies relating to portfolio securities during the 12-month period ending June 30th of each year (available by August 31st of that year) without charge, upon request, by calling 1-866-290-2688 or visiting the funds website https://funds.aqr.com, or by accessing the SEC’s website at www.SEC.gov. Such reports may be reviewed and copied at the SEC’s Public Reference Room in Washington, DC. Information on the operation of the Public Reference Room may be obtained by calling 202-551-8090.
The Fund files complete schedules of the portfolio holdings with the SEC for the first and third quarters on Form N-Q. The Form N-Q is available without charge, upon request, by calling 1-800-SEC-0330, or by accessing the SEC’s website, at www.SEC.gov. It may also be reviewed and copied at the SEC’s Public Reference Room in Washington, DC.
This report has been prepared for shareholders and may be distributed to others only if preceded or accompanied by an effective prospectus, which includes information regarding the Funds’ objectives and policies, experienced of its management, marketability of shares and other information.
Table of Contents

AQR Funds
P.O. Box 2248, Denver, CO 80201-2248
p: +1.866.290.2688 | w: https://funds.aqr.com
Table of Contents
Item 2. Code of Ethics.
| a). | As of the end of the period, December 31, 2015, the Registrant has adopted a code of ethics, as defined in Item 2 of Form N-CSR, that applies to its principal executive officer, principal financial officer, principal accounting officer or controller, or persons performing similar functions. This code of ethics is included as Exhibit 12 (a)(1). |
| b). | Not Applicable. |
| c). | There has been no substantive amendments to the Registrant’s Code of Ethics during the fiscal year ended December 31, 2015 (“Reporting Period”). |
| d). | Registrant granted no waivers from the provisions of its Code of Ethics during the Reporting Period. |
| e). | Not Applicable. |
| f). | Attached. |
Item 3. Audit Committee Financial Expert.
| a). | The Registrant’s Board of Trustees has determined that its Audit Committee has two “audit committee financial experts”, as that term is defined under Items 3(b) and 3(c), serving on its Audit Committee. Messrs. L. Joe Moravy and Brian Posner, the Registrant’s audit committee financial experts, are “independent”, as that term is defined under Item 3(a)(2). |
Item 4. Principal Accountant Fees and Services.
Aggregate fees for professional services rendered for the AQR Funds by PricewaterhouseCoopers LLP for the years ended December 31, 2014 and December 31, 2015 were:
| 2014 | 2015 | |||||||
Audit Fees (a) | $ | 1,295,470 | $ | 1,297,220 | ||||
Audit Related Fees (b) | $ | 42,500 | $ | 8,000 | ||||
Tax Fees (c) | $ | 194,700 | $ | 246,719 | ||||
All Other Fees (d) | $ | 0 | $ | 0 | ||||
Total: | $ | 1,532,670 | $ | 1,551,939 | ||||
| (a) | Audit Fees: These fees relate to professional services rendered by PricewaterhouseCoopers LLP for the audits of the Registrant’s annual financial statements or services normally provided by the independent registered public accounting firm in connection with statutory and regulatory filings or engagements. These services include the audits of the financial statements of the Registrant, issuance of consents and assistance with review of documents filed with the SEC. |
| (b) | Audit Related Fees: These fees relate to assurance and related services by PricewaterhouseCoopers LLP that are reasonably related to the performance of the audit of the Registrant’s December 31, 2014 and December 31, 2015 annual financial statements that are not reported under “Audit Fees” above. The audit related services provided by PricewaterhouseCoopers LLP for the year-ended December 31, 2014 and December 31, 2015 relate to procedures performed by PricewaterhouseCoopers LLP in connection with its review of the issuance of, and amendments to, the Registrant’s Registration Statement as well as review of the in-kind transaction for the AQR Style Premia Alternative Fund during the year-ended December 31, 2014. |
| (c) | Tax Fees: These fees relate to professional services rendered by PricewaterhouseCoopers LLP for tax compliance, tax advice and tax planning. The tax services provided by PricewaterhouseCoopers LLP relate to the review of the Registrant’s federal and state income tax returns, excise tax calculations and the completion of an international taxation review. |
Table of Contents
| (d) | All Other Fees: These fees relate to products and services provided by PricewaterhouseCoopers LLP other than those reported under “Audit Fees,” “Audit-Related Fees,” and “Tax Fees” above. |
| (e) | Audit Committee Pre-approval Policies and Procedures: |
| (i) | Per Rule 2-01(c)(7)(A) and the charter of the Registrant’s Audit Committee, the Audit Committee approves and recommends the principal accountant for the Registrant, pre-approves (i) the principal accountant’s provision of all audit and permissible non-audit services to the Registrant (including the fees and other compensation to be paid to the principal accountant), and (ii) the principal accountant’s provision of any permissible non-audit services to the Registrant’s investment adviser (the “Adviser”), sub-adviser or any entity controlling, controlled by, or under common control with any investment adviser or sub-adviser, if the engagement relates directly to the operations of the financial reporting of the Trust. |
| (ii) | 100% of services described in each of Items 4(b) through (d) were approved by the Audit Committee pursuant to paragraph (c)(7)(A) of Rule 2-01 of Regulation S-X. |
| (f) | Less than 50% of the hours expended on the principal accountant’s engagement to audit Registrant’s financial statements were attributed to work performed by persons other than the accountant’s full-time, permanent employees. |
| (g) | Disclose the aggregate non-audit fees billed by the Registrant’s accountant for services rendered to the Registrant, and rendered to the Registrant’s investment adviser (not including any sub-adviser whose role is primarily portfolio management and is subcontracted with or overseen by another investment adviser), and any entity controlling, controlled by, or under common control with the adviser that provides ongoing services to the Registrant for the fiscal years ended December 31, 2014 and December 31, 2015: $336,340 and $416,799, respectively. |
| (h) | Not Applicable. |
Item 5. Audit Committee of Listed Registrants.
| (a) | The Registrant is an issuer as defined in Section 10A-3 of the Securities Exchange Act of 1934 and has a separately-designated standing Audit Committee in accordance with Section 3(a)(58)(A) of such Act. All of the Board’s independent Trustees, Timothy K. Armour, William L. Atwell, Gregg D. Behrens, L. Joe Moravy, Brian S. Posner and Mark A. Zurack, are members of the Audit Committee. |
| (b) | Not Applicable. |
Item 6. Investments
| (a) | Schedule is included as part of the report to shareholders filed under Item 1 of this Form. |
| (b) | The Registrant made no divestments of securities in accordance with Section 13(c) of the Investment Company Act of 1940. |
Item 7. Disclosure of Proxy Voting Policies and Procedures for Closed-End Management Investment Companies.
Not applicable.
Item 8. Portfolio Managers of Closed-End Management Investment Companies.
Not applicable.
Table of Contents
Item 9. Purchases of Equity Securities by Closed-End Management Investment Company & Affiliated Purchasers.
Not applicable.
Item 10. Submission of Matters to a Vote of Security Holders.
Not applicable.
Item 11. Controls and Procedures.
| (a) | The Registrant’s principal executive officer and principal financial officer have concluded, based on their evaluation of the Registrant’s disclosure controls and procedures as conducted within 90 days of the filing date of this report, that those disclosure controls and procedures provide reasonable assurance that the material information required to be disclosed by the Registrant on this report is recorded, processed, summarized and reported within the time periods specified in the Securities and Exchange Commission’s rules and forms. |
| (b) | There have not been any changes in registrant’s control over financial reporting (as defined in Rule 30a-3(d) under the Investment Company Act of 1940) that occurred during the last fiscal quarter of the period covered by this report that has materially affected, or is reasonably likely to materially affect, the registrant’s internal control over financial reporting. |
Item 12. Exhibits.
| (a)(1) | The code of ethics that is the subject of the disclosure required by Item 2 is attached hereto. |
| (a)(2) | Certifications pursuant to Rule 30a-2(a) under the 1940 Act and Section 302 of the Sarbanes-Oxley Act of 2002 are attached hereto. |
| (a)(3) | Any written solicitation to purchase securities under Rule 23c-1 under the 1940 Act – Not Applicable. |
| (b) | Certification required by Rule 30a-2(b) under the 1940 Act and Section 906 of the Sarbanes-Oxley Act of 2002 is attached hereto. |
Table of Contents
SIGNATURES
Pursuant to the requirements of the Securities Exchange Act of 1934 and the Investment Company Act of 1940, the Registrant has duly caused this report to be signed on its behalf by the undersigned, thereunto duly authorized.
AQR Funds
| /s/ Marco Hanig |
| Marco Hanig, |
| Principal Executive Officer |
| March 2, 2016 |
Pursuant to the requirements of the Securities Exchange Act of 1934 and the Investment Company Act of 1940, this report has been signed below by the following persons on behalf of the Registrant and in the capacities and on the dates indicated.
| /s/ Marco Hanig |
| Marco Hanig, |
| Principal Executive Officer |
| March 2, 2016 |
| /s/ Heather Bonner |
| Heather Bonner, |
| Principal Financial Officer |
| March 2, 2016 |