UNITED STATES
SECURITIES AND EXCHANGE COMMISSION
Washington, D.C. 20549
FORM N-CSR
CERTIFIED SHAREHOLDER REPORT OF REGISTERED
MANAGEMENT INVESTMENT COMPANIES
Investment Company Act file number: 811-22235
AQR Funds
(Exact name of registrant as specified in charter)
Two Greenwich Plaza, 4th Floor
Greenwich, CT 06830
(Address of principal executive offices) (Zip code)
Bradley D. Asness, Esq.
Principal and Chief Legal Officer
AQR Capital Management, LLC
Two Greenwich Plaza, 4th Floor
Greenwich, CT 06830
(Name and Address of Agent for Service)
Registrant’s telephone number, including area code: 203-742-3600
Date of fiscal year end: September 30
Date of reporting period: October 1, 2015 to September 30, 2016
Item 1. Reports to Shareholders.
The following is a copy of the report transmitted to shareholders pursuant to Rule 30e-1 under the Investment Company Act of 1940 (17 CFR 270.30e-1.)
Annual Report
September 30, 2016
AQR Large Cap Multi-Style Fund
AQR Small Cap Multi-Style Fund
AQR International Multi-Style Fund
AQR Emerging Multi-Style Fund
AQR TM Large Cap Multi-Style Fund
AQR TM Small Cap Multi-Style Fund
AQR TM International Multi-Style Fund
AQR TM Emerging Multi-Style Fund
AQR Large Cap Momentum Style Fund
AQR Small Cap Momentum Style Fund
AQR International Momentum Style Fund
AQR Emerging Momentum Style Fund
AQR TM Large Cap Momentum Style Fund
AQR TM Small Cap Momentum Style Fund
AQR TM International Momentum Style Fund
AQR Large Cap Defensive Style Fund
AQR International Defensive Style Fund
AQR Emerging Defensive Style Fund
AQR Global Equity Fund
AQR International Equity Fund
| Shareholder Letters (unaudited) | ||
| 2 | ||
| 4 | ||
| 6 | ||
| 8 | ||
| 10 | ||
| 12 | ||
| 14 | ||
| 16 | ||
| 18 | ||
| 20 | ||
| 22 | ||
| 24 | ||
| 26 | ||
| 28 | ||
| 30 | ||
| 32 | ||
| 34 | ||
| 36 | ||
| 38 | ||
| 41 | ||
| Schedule of Investments | ||
| 46 | ||
51 | ||
59 | ||
63 | ||
68 | ||
73 | ||
80 | ||
84 | ||
89 | ||
95 | ||
105 | ||
111 | ||
116 | ||
121 | ||
130 | ||
135 | ||
140 | ||
145 | ||
149 | ||
158 | ||
| Financial Statements and Notes | 168 | |
| Report of Independent Registered Public Accounting Firm | 238 | |
| Other Federal Tax Information (unaudited) | 239 | |
| Fund Expense Examples (unaudited) | 241 | |
| Trustees and Officers (unaudited) | 246 | |
Shareholder Letter (Unaudited)
| AQR LARGE CAP MULTI-STYLE FUND |

Cliff Asness
Managing & Founding Principal

Andrea Frazzini
Principal

Jacques Friedman
Principal

Ronen Israel
Principal
Dear Shareholder:
The AQR Large Cap Multi-Style Fund (the “Fund”) invests in stocks of attractively valued U.S. large and mid-cap companies that have positive momentum and strong profitability. The Fund is not actively managed to outperform a growth, value or core benchmark. Rather, it seeks to provide systematic exposure to stocks that rank high on a combined score of Value, Momentum and Profitability styles.
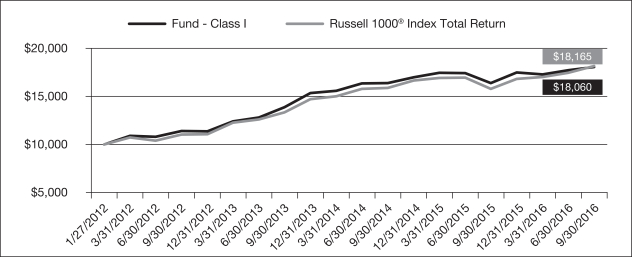
For fiscal year 2016, the AQR Large Cap Multi-Style Fund Class I shares returned 6.61% while its benchmark, the Russell 1000® Index Total Return, returned 14.93% over the period – resulting in a relative underperformance. The Fund’s underperformance was driven primarily by stock selection within sectors and sector selection. In particular, stock selection within information technology and within energy contributed to negative returns. The Fund’s performance was positively impacted by sector selection to information technology.
At the close of fiscal 2016, the AQR Large Cap Multi-Style Fund’s largest active positions include sector overweights to information technology and consumer staples. As of year-end, the Fund is underweight energy.
AVERAGE ANNUAL TOTAL RETURNS AS OF 9/30/2016 AQR LARGE CAP MULTI-STYLE FUND | ||||||||||||||||
| 1 Year | 3 Year | Since Inception | Date of Inception | |||||||||||||
| Fund - Class I: QCELX | 6.61% | 8.99% | 10.84% | 3/26/2013 | ||||||||||||
| Fund - Class N: QCENX | 6.40% | 8.71% | 10.60% | 3/26/2013 | ||||||||||||
| Fund - Class R6: QCERX | 6.71% | na | 3.13% | 7/10/2014 | ||||||||||||
| Russell 1000® Index Total Return | 14.93% | |||||||||||||||
Past performance does not guarantee future results. Investment results and principal value of an investment will fluctuate so that an investor’s shares, when redeemed, may be worth more or less than their original cost. Current performance may be lower or higher than the performance data quoted. As of the latest prospectus, the gross expense ratio for the Fund’s Class I/N/R6 shares are 0.54%, 0.79% and 0.42%, respectively. Call 1-866-290-2688 or visit www.aqrfunds.com for current month-end performance.
| AQR Funds | Annual Report | September 2016 | ||||||||||||||
2
Shareholder Letter (Unaudited)
| AQR LARGE CAP MULTI-STYLE FUND |
AQR LARGE CAP MULTI-STYLE FUND VS. RUSSELL 1000® INDEX TOTAL RETURN VALUE OF $10,000 INVESTED ON 3/26/2013 |
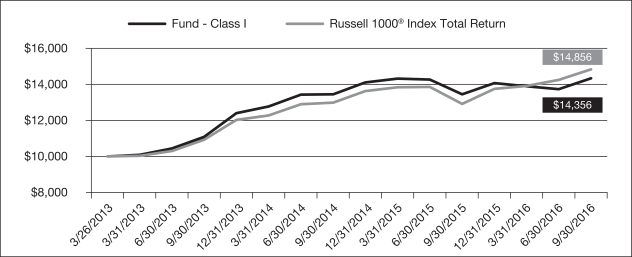
The chart above represents historical performance of a hypothetical investment of $10,000 in the Fund over the past ten years (or since inception if shorter). Performance data quoted represents past performance and does not guarantee future results. Returns shown are total returns, which assume the reinvestment of dividends and capital gains. The table and graph presented above do not reflect the deduction of taxes a shareholder would pay on fund distributions or the redemption of fund shares.
| AQR Funds | Annual Report | September 2016 | ||||||||||||||
3
Shareholder Letter (Unaudited)
| AQR SMALL CAP MULTI-STYLE FUND |
Cliff Asness
Managing & Founding Principal
Andrea Frazzini
Principal
Jacques Friedman
Principal
Ronen Israel
Principal
Dear Shareholder:
The AQR Small Cap Multi-Style Fund (the “Fund”) invests in stocks of attractively valued U.S. small-cap companies that have positive momentum and strong profitability. The Fund is not actively managed to outperform a growth, value or core benchmark. Rather, it seeks to provide systematic exposure to stocks that rank high on a combined score of Value, Momentum and Profitability styles.
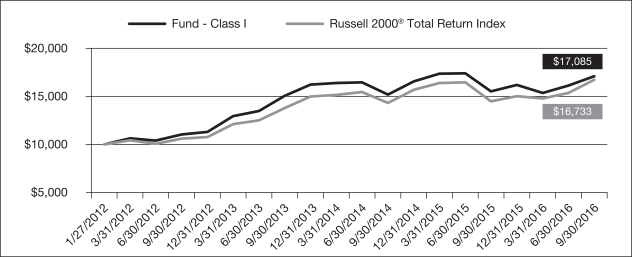
For fiscal year 2016, the AQR Small Cap Multi-Style Fund Class I shares returned 13.74% while its benchmark, the Russell 2000® Total Return Index, returned 15.47% over the period – resulting in a relative underperformance. The Fund’s underperformance was driven primarily by sector selection. In particular, stock selection within energy contributed to negative returns. The Fund’s performance was positively impacted by stock selection within consumer discretionary and within health care.
At the close of fiscal 2016, the AQR Small Cap Multi-Style Fund’s largest active positions include sector overweights to information technology and consumer staples. As of year-end, the Fund is underweight health care and utilities.
AVERAGE ANNUAL TOTAL RETURNS AS OF 9/30/2016 AQR SMALL CAP MULTI-STYLE FUND | ||||||||||||||||
| 1 Year | 3 Year | Since Inception | Date of Inception | |||||||||||||
| Fund - Class I: QSMLX | 13.74% | 6.50% | 10.82% | 3/26/2013 | ||||||||||||
| Fund - Class N: QSMNX | 13.51% | 6.21% | 10.53% | 3/26/2013 | ||||||||||||
| Fund - Class R6: QSERX | 13.90% | na | 4.28% | 7/10/2014 | ||||||||||||
| Russell 2000® Total Return Index | 15.47% | |||||||||||||||
Past performance does not guarantee future results. Investment results and principal value of an investment will fluctuate so that an investor’s shares, when redeemed, may be worth more or less than their original cost. Current performance may be lower or higher than the performance data quoted. As of the latest prospectus, the gross expense ratio for the Fund’s Class I/N/R6 shares are 1.24%, 1.47% and 1.03%, respectively. Call 1-866-290-2688 or visit www.aqrfunds.com for current month-end performance.
| AQR Funds | Annual Report | September 2016 | ||||||||||||||
4
Shareholder Letter (Unaudited)
| AQR SMALL CAP MULTI-STYLE FUND |
AQR SMALL CAP MULTI-STYLE FUND VS. RUSSELL 2000® TOTAL RETURN INDEX VALUE OF $10,000 INVESTED ON 3/26/2013 |
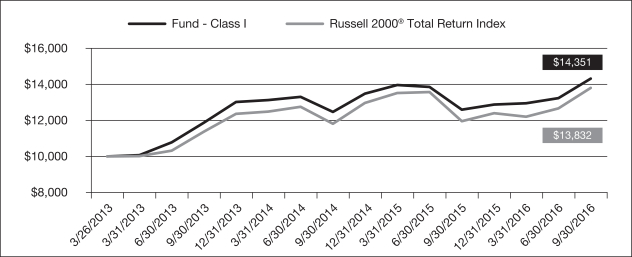
The chart above represents historical performance of a hypothetical investment of $10,000 in the Fund over the past ten years (or since inception if shorter). Performance data quoted represents past performance and does not guarantee future results. Returns shown are total returns, which assume the reinvestment of dividends and capital gains. The table and graph presented above do not reflect the deduction of taxes a shareholder would pay on fund distributions or the redemption of fund shares.
| AQR Funds | Annual Report | September 2016 | ||||||||||||||
5
Shareholder Letter (Unaudited)
| AQR INTERNATIONAL MULTI-STYLE FUND |
Cliff Asness
Managing & Founding Principal
Andrea Frazzini
Principal
Jacques Friedman
Principal
Ronen Israel
Principal
Dear Shareholder:
The AQR International Multi-Style Fund (the “Fund”) invests in stocks of attractively valued large and mid-cap non-U.S. companies that have positive momentum and strong profitability. The Fund is not actively managed to outperform a growth, value or core benchmark. Rather, it seeks to provide systematic exposure to stocks that rank high on a combined score of Value, Momentum and Profitability styles.
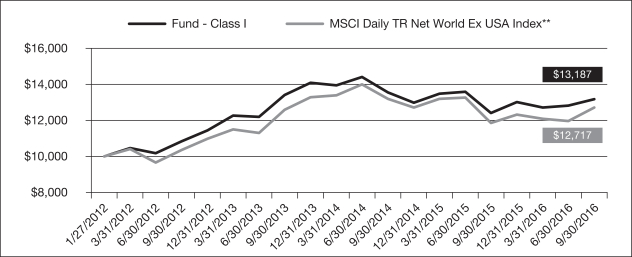
For fiscal year 2016, the AQR International Multi-Style Fund Class I shares returned 1.62% while its benchmark, the MSCI Daily TR Net World Ex USA Index**, returned 7.16% over the period – resulting in a relative underperformance. The Fund’s underperformance was driven primarily by stock selection within countries and within sectors. In particular, stock selection within Japan and within financials contributed to negative returns. The Fund’s performance was positively impacted by country selection.
At the close of fiscal 2016, the AQR International Multi-Style Fund’s largest active positions include sector overweights to information technology and consumer discretionary. As of year-end, the Fund is underweight energy. Notable active positions also include country overweights to Germany with underweights to Israel.
AVERAGE ANNUAL TOTAL RETURNS AS OF 9/30/2016 AQR INTERNATIONAL MULTI-STYLE FUND | ||||||||||||||||
| 1 Year | 3 Year | Since Inception | Date of Inception | |||||||||||||
| Fund - Class I: QICLX | 1.62% | -1.68% | 2.00% | 3/26/2013 | ||||||||||||
| Fund - Class N: QICNX | 1.28% | -1.95% | 1.73% | 3/26/2013 | ||||||||||||
| Fund - Class R6: QICRX | 1.71% | na | -4.99% | 7/10/2014 | ||||||||||||
| MSCI Daily TR Net World Ex USA Index** | 7.16% | |||||||||||||||
Past performance does not guarantee future results. Investment results and principal value of an investment will fluctuate so that an investor’s shares, when redeemed, may be worth more or less than their original cost. Current performance may be lower or higher than the performance data quoted. As of the latest prospectus, the gross expense ratio for the Fund’s Class I/N/R6 shares are 0.84%, 1.08% and 0.68%, respectively. Call 1-866-290-2688 or visit www.aqrfunds.com for current month-end performance.
| AQR Funds | Annual Report | September 2016 | ||||||||||||||
6
Shareholder Letter (Unaudited)
| AQR INTERNATIONAL MULTI-STYLE FUND |
AQR INTERNATIONAL MULTI-STYLE FUND VS. MSCI DAILY TR NET WORLD EX USA INDEX** VALUE OF $10,000 INVESTED ON 3/26/2013 |
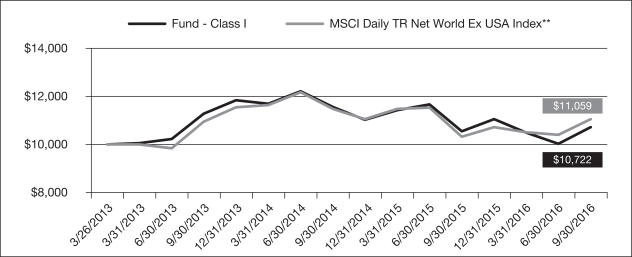
The chart above represents historical performance of a hypothetical investment of $10,000 in the Fund over the past ten years (or since inception if shorter). Performance data quoted represents past performance and does not guarantee future results. Returns shown are total returns, which assume the reinvestment of dividends and capital gains. The table and graph presented above do not reflect the deduction of taxes a shareholder would pay on fund distributions or the redemption of fund shares.
| ** | MSCI makes no express or implied warranties or representations and shall have no liability whatsoever with respect to any MSCI data contained herein. The MSCI data may not be further redistributed or used as a basis for other indices or any securities or financial products. This report is not approved, reviewed, or produced by MSCI. |
| AQR Funds | Annual Report | September 2016 | ||||||||||||||
7
Shareholder Letter (Unaudited)
| AQR EMERGING MULTI-STYLE FUND |
Cliff Asness
Managing & Founding Principal
Andrea Frazzini
Principal
Jacques Friedman
Principal
Ronen Israel
Principal
Dear Shareholder:
The AQR Emerging Multi-Style Fund (the “Fund”) invests in stocks of attractively valued large and mid-cap emerging countries’ companies that have positive momentum and strong profitability. The Fund’s investment universe is currently comprised of approximately the top 85% of stocks by market capitalization in 16 emerging countries. The Fund is not actively managed to outperform a growth, value or core benchmark. Rather, it seeks to provide systematic exposure to stocks that rank high on a combined score of Value, Momentum and Profitability styles.
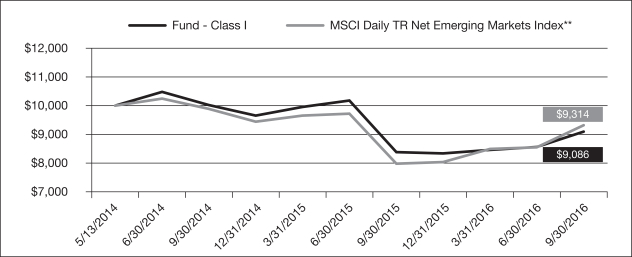
For fiscal year 2016, the AQR Emerging Multi-Style Fund Class I shares returned 11.97% while its benchmark, the MSCI Daily TR Net Emerging Markets Index**, returned 16.78% over the period – resulting in a relative underperformance. The Fund’s underperformance was driven primarily by stock selection within countries and within sectors. In particular, stock selection within financials and within information technology contributed to negative returns. The Fund’s performance was positively impacted by country selection.
At the close of fiscal 2016, the AQR Emerging Multi-Style Fund’s largest active positions include sector overweights to telecommunication services. As of year-end, the Fund is underweight financials and materials. Notable active positions also include country overweights to South Korea with underweights to Qatar.
AVERAGE ANNUAL TOTAL RETURNS AS OF 9/30/2016 AQR EMERGING MULTI-STYLE FUND | ||||||||||||
| 1 Year | Since Inception | Date of Inception | ||||||||||
| Fund - Class I: QEMLX | 11.97% | -3.26% | 5/13/2014 | |||||||||
| Fund - Class N: QEMNX | 11.59% | * | -3.49% | 5/13/2014 | ||||||||
| Fund - Class R6: QECRX | 12.13% | -5.35% | 7/10/2014 | |||||||||
| MSCI Daily TR Net Emerging Markets Index** | 16.78% | |||||||||||
Past performance does not guarantee future results. Investment results and principal value of an investment will fluctuate so that an investor’s shares, when redeemed, may be worth more or less than their original cost. Current performance may be lower or higher than the performance data quoted. As of the latest prospectus, the gross expense ratio for the Fund’s Class I/N/R6 shares are 1.43%, 1.65% and 0.93%, respectively. Call 1-866-290-2688 or visit www.aqrfunds.com for current month-end performance.
| * | Total return information is based on net asset values calculated for shareholder transactions. Certain adjustments were made to the net assets of the Fund at 9/30/2016 for financial reporting purposes, and as a result, the net asset values for shareholder transactions and the total returns based on those net asset values differ from the adjusted net asset values and total returns for financial reporting. |
| AQR Funds | Annual Report | September 2016 | ||||||||||||||
8
Shareholder Letter (Unaudited)
| AQR EMERGING MULTI-STYLE FUND |
AQR EMERGING MULTI-STYLE FUND VS. MSCI DAILY TR NET EMERGING MARKETS INDEX** VALUE OF $10,000 INVESTED ON 5/13/2014 |
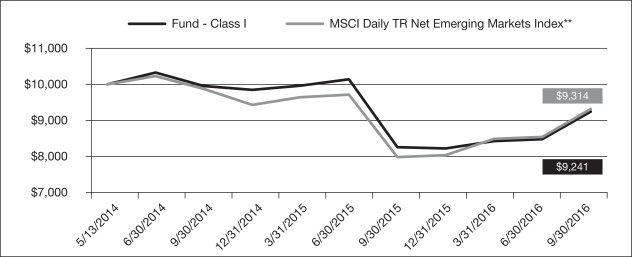
The chart above represents historical performance of a hypothetical investment of $10,000 in the Fund over the past ten years (or since inception if shorter). Performance data quoted represents past performance and does not guarantee future results. Returns shown are total returns, which assume the reinvestment of dividends and capital gains. The table and graph presented above do not reflect the deduction of taxes a shareholder would pay on fund distributions or the redemption of fund shares.
| ** | MSCI makes no express or implied warranties or representations and shall have no liability whatsoever with respect to any MSCI data contained herein. The MSCI data may not be further redistributed or used as a basis for other indices or any securities or financial products. This report is not approved, reviewed, or produced by MSCI. |
| AQR Funds | Annual Report | September 2016 | ||||||||||||||
9
Shareholder Letter (Unaudited)
| AQR TM LARGE CAP MULTI-STYLE FUND |
Cliff Asness
Managing & Founding Principal
Andrea Frazzini
Principal
Jacques Friedman
Principal
Ronen Israel
Principal
Dear Shareholder:
The AQR TM Large Cap Multi-Style Fund (the “Fund”) invests in stocks of attractively valued U.S. large and mid-cap companies that have positive momentum and strong profitability. The Fund is not actively managed to outperform a growth, value or core benchmark. Rather, it seeks to provide systematic exposure to stocks that rank high on a combined score of Value, Momentum and Profitability styles. The Fund employs a tax management strategy which considers the potential impact of taxes on investment return.
For fiscal year 2016, the AQR TM Large Cap Multi-Style Fund Class I shares returned 6.82% while its benchmark, the Russell 1000® Index Total Return, returned 14.93% over the period – resulting in a relative underperformance. The Fund’s underperformance was driven primarily by stock selection within sectors and sector selection. In particular, stock selection within information technology and within energy contributed to negative returns. The Fund’s performance was positively impacted by sector selection to information technology.
At the close of fiscal 2016, the AQR TM Large Cap Multi-Style Fund’s largest active positions include sector overweights to information technology and consumer staples. As of year-end, the Fund is underweight energy.
AVERAGE ANNUAL TOTAL RETURNS AS OF 9/30/2016 AQR TM LARGE CAP MULTI-STYLE FUND | ||||||||||||
| 1 Year | Since Inception | Date of Inception | ||||||||||
| Fund - Class I: QTLLX | 6.82% | 0.38% | 2/11/2015 | |||||||||
| Fund - Class N: QTLNX | 6.48% | 0.05% | 2/11/2015 | |||||||||
| Fund - Class R6: QTLRX | 6.95% | 0.46% | 2/11/2015 | |||||||||
| Russell 1000® Index Total Return | 14.93% | |||||||||||
Past performance does not guarantee future results. Investment results and principal value of an investment will fluctuate so that an investor’s shares, when redeemed, may be worth more or less than their original cost. Current performance may be lower or higher than the performance data quoted. As of the latest prospectus, the gross expense ratio for the Fund’s Class I/N/R6 shares are 1.68%, 2.50% and 1.43%, respectively. Call 1-866-290-2688 or visit www.aqrfunds.com for current month-end performance.
| AQR Funds | Annual Report | September 2016 | ||||||||||||||
10
Shareholder Letter (Unaudited)
| AQR TM LARGE CAP MULTI-STYLE FUND |
AQR TM LARGE CAP MULTI-STYLE FUND VS. RUSSELL 1000® INDEX TOTAL RETURN VALUE OF $10,000 INVESTED ON 2/11/2015 |
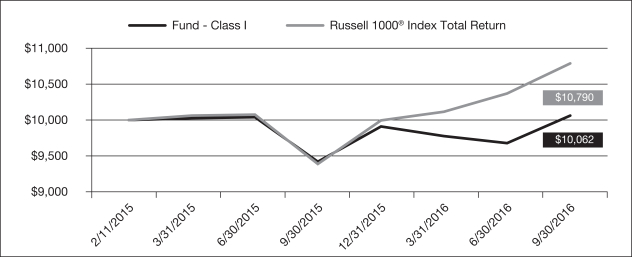
The chart above represents historical performance of a hypothetical investment of $10,000 in the Fund over the past ten years (or since inception if shorter). Performance data quoted represents past performance and does not guarantee future results. Returns shown are total returns, which assume the reinvestment of dividends and capital gains. The table and graph presented above do not reflect the deduction of taxes a shareholder would pay on fund distributions or the redemption of fund shares.
| AQR Funds | Annual Report | September 2016 | ||||||||||||||
11
Shareholder Letter (Unaudited)
| AQR TM SMALL CAP MULTI-STYLE FUND |
Cliff Asness
Managing & Founding Principal
Andrea Frazzini
Principal
Jacques Friedman
Principal
Ronen Israel
Principal
Dear Shareholder:
The AQR TM Small Cap Multi-Style Fund (the “Fund”) invests in stocks of attractively valued U.S. small-cap companies that have positive momentum and strong profitability. The Fund is not actively managed to outperform a growth, value or core benchmark. Rather, it seeks to provide systematic exposure to stocks that rank high on a combined score of Value, Momentum and Profitability styles. The Fund employs a tax management strategy which considers the potential impact of taxes on investment return.
For fiscal year 2016, the AQR TM Small Cap Multi-Style Fund Class I shares returned 12.64% while its benchmark, the Russell 2000® Total Return Index, returned 15.47% over the period – resulting in a relative underperformance. The Fund’s underperformance was driven primarily by stock selection within sectors and sector selection. In particular, stock selection within energy contributed to negative returns. The Fund’s performance was positively impacted by sector selection to health care.
At the close of fiscal 2016, the AQR TM Small Cap Multi-Style Fund’s largest active positions include sector overweights to information technology and consumer staples. As of year-end, the Fund is underweight health care and utilities.
AVERAGE ANNUAL TOTAL RETURNS AS OF 9/30/2016 AQR TM SMALL CAP MULTI-STYLE FUND | ||||||||||||
| 1 Year | Since Inception | Date of Inception | ||||||||||
| Fund - Class I: QSSLX | 12.64% | 2.27% | 2/11/2015 | |||||||||
| Fund - Class N: QSSNX | 12.23% | * | 1.98% | 2/11/2015 | ||||||||
| Fund - Class R6: QSSRX | 12.63% | 2.34% | 2/11/2015 | |||||||||
| Russell 2000® Total Return Index | 15.47% | |||||||||||
Past performance does not guarantee future results. Investment results and principal value of an investment will fluctuate so that an investor’s shares, when redeemed, may be worth more or less than their original cost. Current performance may be lower or higher than the performance data quoted. As of the latest prospectus, the gross expense ratio for the Fund’s Class I/N/R6 shares are 5.72%, 6.59% and 6.34%, respectively. Call 1-866-290-2688 or visit www.aqrfunds.com for current month-end performance.
| * | Total return information is based on net asset values calculated for shareholder transactions. Certain adjustments were made to the net assets of the Fund at 9/30/2016 for financial reporting purposes, and as a result, the net asset values for shareholder transactions and the total returns based on those net asset values differ from the adjusted net asset values and total returns for financial reporting. |
| AQR Funds | Annual Report | September 2016 | ||||||||||||||
12
Shareholder Letter (Unaudited)
| AQR TM SMALL CAP MULTI-STYLE FUND |
AQR TM SMALL CAP MULTI-STYLE FUND VS. RUSSELL 2000® TOTAL RETURN INDEX VALUE OF $10,000 INVESTED ON 2/11/2015 |
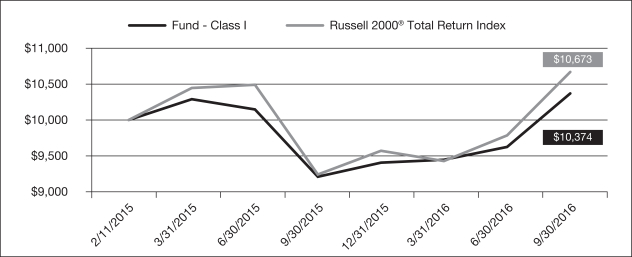
The chart above represents historical performance of a hypothetical investment of $10,000 in the Fund over the past ten years (or since inception if shorter). Performance data quoted represents past performance and does not guarantee future results. Returns shown are total returns, which assume the reinvestment of dividends and capital gains. The table and graph presented above do not reflect the deduction of taxes a shareholder would pay on fund distributions or the redemption of fund shares.
| AQR Funds | Annual Report | September 2016 | ||||||||||||||
13
Shareholder Letter (Unaudited)
| AQR TM INTERNATIONAL MULTI-STYLE FUND |
Cliff Asness
Managing & Founding Principal
Andrea Frazzini
Principal
Jacques Friedman
Principal
Ronen Israel
Principal
Dear Shareholder:
The AQR TM International Multi-Style Fund (the “Fund”) invests in stocks of attractively valued large and mid-cap non-U.S. companies that have positive momentum and strong profitability. The Fund is not actively managed to outperform a growth, value or core benchmark. Rather, it seeks to provide systematic exposure to stocks that rank high on a combined score of Value, Momentum and Profitability styles. The Fund employs a tax management strategy which considers the potential impact of taxes on investment return.
For fiscal year 2016, the AQR TM International Multi-Style Fund Class I shares returned 1.68% while its benchmark, the MSCI Daily TR Net World Ex USA Index**, returned 7.16% over the period – resulting in a relative underperformance. The Fund’s underperformance was driven primarily by stock selection within countries and within sectors. In particular, stock selection within Japan and within financials contributed to negative returns. The Fund’s performance was positively impacted by country selection.
At the close of fiscal 2016, the AQR TM International Multi-Style Fund’s largest active positions include sector overweights to information technology and consumer discretionary. As of year-end, the Fund is underweight energy. Notable active positions also include country overweights to Germany with underweights to Canada.
AVERAGE ANNUAL TOTAL RETURNS AS OF 9/30/2016 AQR TM INTERNATIONAL MULTI-STYLE FUND | ||||||||||||
| 1 Year | Since Inception | Date of Inception | ||||||||||
| Fund - Class I: QIMLX | 1.68% | -2.73% | 2/11/2015 | |||||||||
| Fund - Class N: QIMNX | 1.43% | -2.94% | 2/11/2015 | |||||||||
| Fund - Class R6: QIMRX | 1.71% | -2.65% | 2/11/2015 | |||||||||
| MSCI Daily TR Net World Ex USA Index** | 7.16% | |||||||||||
Past performance does not guarantee future results. Investment results and principal value of an investment will fluctuate so that an investor’s shares, when redeemed, may be worth more or less than their original cost. Current performance may be lower or higher than the performance data quoted. As of the latest prospectus, the gross expense ratio for the Fund’s Class I/N/R6 shares are 1.45%, 2.68% and 1.25%, respectively. Call 1-866-290-2688 or visit www.aqrfunds.com for current month-end performance.
| AQR Funds | Annual Report | September 2016 | ||||||||||||||
14
Shareholder Letter (Unaudited)
| AQR TM INTERNATIONAL MULTI-STYLE FUND |
AQR TM INTERNATIONAL MULTI-STYLE FUND VS. MSCI DAILY TR NET WORLD EX USA INDEX** VALUE OF $10,000 INVESTED ON 2/11/2015 |
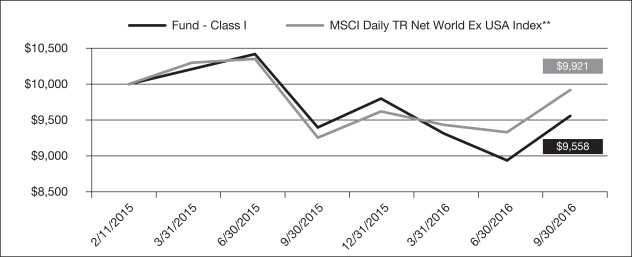
The chart above represents historical performance of a hypothetical investment of $10,000 in the Fund over the past ten years (or since inception if shorter). Performance data quoted represents past performance and does not guarantee future results. Returns shown are total returns, which assume the reinvestment of dividends and capital gains. The table and graph presented above do not reflect the deduction of taxes a shareholder would pay on fund distributions or the redemption of fund shares.
| ** | MSCI makes no express or implied warranties or representations and shall have no liability whatsoever with respect to any MSCI data contained herein. The MSCI data may not be further redistributed or used as a basis for other indices or any securities or financial products. This report is not approved, reviewed, or produced by MSCI. |
| AQR Funds | Annual Report | September 2016 | ||||||||||||||
15
Shareholder Letter (Unaudited)
| AQR TM EMERGING MULTI-STYLE FUND |
Cliff Asness
Managing & Founding Principal
Andrea Frazzini
Principal
Jacques Friedman
Principal
Ronen Israel
Principal
Dear Shareholder:
The AQR TM Emerging Multi-Style Fund (the “Fund”) invests in stocks of attractively valued large and mid-cap emerging countries’ companies that have positive momentum and strong profitability. The Fund’s investment universe is currently comprised of approximately the top 85% of stocks by market capitalization in 16 emerging countries. The Fund is not actively managed to outperform a growth, value or core benchmark. Rather, it seeks to provide systematic exposure to stocks that rank high on a combined score of Value, Momentum and Profitability styles. The Fund employs a tax management strategy which considers the potential impact of taxes on investment return.
For fiscal year 2016, the AQR TM Emerging Multi-Style Fund Class I shares returned 12.14% while its benchmark, the MSCI Daily TR Net Emerging Markets Index**, returned 16.78% over the period – resulting in a relative underperformance. The Fund’s underperformance was driven primarily by stock selection within countries and within sectors. In particular, stock selection within financials and within information technology contributed to negative returns. The Fund’s performance was positively impacted by country selection.
At the close of fiscal 2016, the AQR TM Emerging Multi-Style Fund’s largest active positions include sector overweights to industrials. As of year-end, the Fund is underweight financials and materials. Notable active positions also include country overweights to China with underweights to Qatar.
AVERAGE ANNUAL TOTAL RETURNS AS OF 9/30/2016 AQR TM EMERGING MULTI-STYLE FUND | ||||||||||||
| 1 Year | Since Inception | Date of Inception | ||||||||||
| Fund - Class I: QTELX | 12.14% | * | -4.23% | 2/11/2015 | ||||||||
| Fund - Class N: QTENX | 11.81% | -4.47% | 2/11/2015 | |||||||||
| Fund - Class R6: QTERX | 12.05% | -4.21% | 2/11/2015 | |||||||||
| MSCI Daily TR Net Emerging Markets Index** | 16.78% | |||||||||||
Past performance does not guarantee future results. Investment results and principal value of an investment will fluctuate so that an investor’s shares, when redeemed, may be worth more or less than their original cost. Current performance may be lower or higher than the performance data quoted. As of the latest prospectus, the gross expense ratio for the Fund’s Class I/N/R6 shares are 2.71%, 3.11% and 2.51%, respectively. Call 1-866-290-2688 or visit www.aqrfunds.com for current month-end performance.
| * | Total return information is based on net asset values calculated for shareholder transactions. Certain adjustments were made to the net assets of the Fund at 9/30/2016 for financial reporting purposes, and as a result, the net asset values for shareholder transactions and the total returns based on those net asset values differ from the adjusted net asset values and total returns for financial reporting. |
| AQR Funds | Annual Report | September 2016 | ||||||||||||||
16
Shareholder Letter (Unaudited)
| AQR TM EMERGING MULTI-STYLE FUND |
AQR TM EMERGING MULTI-STYLE FUND VS. MSCI DAILY TR NET EMERGING MARKETS INDEX** VALUE OF $10,000 INVESTED ON 2/11/2015 |
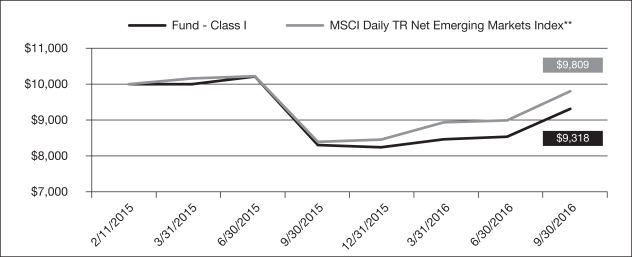
The chart above represents historical performance of a hypothetical investment of $10,000 in the Fund over the past ten years (or since inception if shorter). Performance data quoted represents past performance and does not guarantee future results. Returns shown are total returns, which assume the reinvestment of dividends and capital gains. The table and graph presented above do not reflect the deduction of taxes a shareholder would pay on fund distributions or the redemption of fund shares.
| ** | MSCI makes no express or implied warranties or representations and shall have no liability whatsoever with respect to any MSCI data contained herein. The MSCI data may not be further redistributed or used as a basis for other indices or any securities or financial products. This report is not approved, reviewed, or produced by MSCI. |
| AQR Funds | Annual Report | September 2016 | ||||||||||||||
17
Shareholder Letter (Unaudited)
| AQR LARGE CAP MOMENTUM STYLE FUND |
Cliff Asness
Managing & Founding Principal
Andrea Frazzini
Principal
Jacques Friedman
Principal
Ronen Israel
Principal
Dear Shareholder:
The AQR Large Cap Momentum Style Fund (the “Fund”) invests in stocks of large and mid-cap U.S. companies with positive momentum. The Fund is not actively managed to outperform a growth, value or core benchmark. Rather, it seeks to provide systematic exposure to stocks that share the common characteristic of positive momentum.
For fiscal year 2016, the AQR Large Cap Momentum Style Fund Class I shares returned 11.12% while its benchmark, the Russell 1000® Index Total Return, returned 14.93% over the period – resulting in a relative underperformance. The Fund’s underperformance was driven primarily by stock selection within sectors. In particular, stock selection within information technology and within industrials contributed to negative returns. The Fund’s performance was positively impacted by sector selection.
At the close of fiscal 2016, the AQR Large Cap Momentum Style Fund’s largest active positions include sector overweights to real estate and consumer staples. As of year-end, the Fund is underweight financials and health care.
AVERAGE ANNUAL TOTAL RETURNS AS OF 9/30/2016 AQR LARGE CAP MOMENTUM STYLE FUND | ||||||||||||||||||||
| 1 Year | 3 Year | 5 Year | Since Inception | Date of Inception | ||||||||||||||||
| Fund - Class I: AMOMX | 11.12% | 9.16% | 15.96% | 14.79% | 7/9/2009 | |||||||||||||||
| Fund - Class N: AMONX | 10.89% | 8.90% | na | 12.86% | 12/17/2012 | |||||||||||||||
| Fund - Class R6: QMORX | 11.23% | na | na | 5.01% | 7/10/2014 | |||||||||||||||
| Russell 1000® Index Total Return | 14.93% | |||||||||||||||||||
Past performance does not guarantee future results. Investment results and principal value of an investment will fluctuate so that an investor’s shares, when redeemed, may be worth more or less than their original cost. Current performance may be lower or higher than the performance data quoted. As of the latest prospectus, the gross expense ratio for the Fund’s Class I/N/R6 shares are 0.51%, 0.78% and 0.37%, respectively. Call 1-866-290-2688 or visit www.aqrfunds.com for current month-end performance.
| AQR Funds | Annual Report | September 2016 | ||||||||||||||
18
Shareholder Letter (Unaudited)
| AQR LARGE CAP MOMENTUM STYLE FUND |
AQR LARGE CAP MOMENTUM STYLE FUND VS. RUSSELL 1000® INDEX TOTAL RETURN VALUE OF $10,000 INVESTED ON 7/9/2009 |
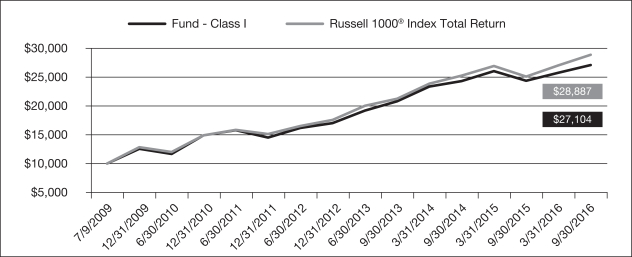
The chart above represents historical performance of a hypothetical investment of $10,000 in the Fund over the past ten years (or since inception if shorter). Performance data quoted represents past performance and does not guarantee future results. Returns shown are total returns, which assume the reinvestment of dividends and capital gains. The table and graph presented above do not reflect the deduction of taxes a shareholder would pay on fund distributions or the redemption of fund shares.
| AQR Funds | Annual Report | September 2016 | ||||||||||||||
19
Shareholder Letter (Unaudited)
| AQR SMALL CAP MOMENTUM STYLE FUND |
Cliff Asness
Managing & Founding Principal
Andrea Frazzini
Principal
Jacques Friedman
Principal
Ronen Israel
Principal
Dear Shareholder:
The AQR Small Cap Momentum Style Fund (the “Fund”) invests in stocks of small-cap U.S. companies with positive momentum. The Fund’s investment universe is comprised of U.S. companies smaller than the 1000th largest and larger than the 3000th largest company by market capitalization. The Fund is not actively managed to outperform a growth, value or core benchmark. Rather, it seeks to provide systematic exposure to stocks that share the common characteristic of positive momentum.
For fiscal year 2016, the AQR Small Cap Momentum Style Fund Class I shares returned 10.24% while its benchmark, the Russell 2000® Total Return Index, returned 15.47% over the period – resulting in a relative underperformance. The Fund’s underperformance was driven primarily by stock selection within sectors and sector selection. In particular, stock selection within health care and within information technology contributed to negative returns. The Fund’s performance was positively impacted by stock selection within energy.
At the close of fiscal 2016, the AQR Small Cap Momentum Style Fund’s largest active positions include sector overweights to information technology and real estate. As of year-end, the Fund is underweight financials and consumer discretionary.
AVERAGE ANNUAL TOTAL RETURNS AS OF 9/30/2016 AQR SMALL CAP MOMENTUM STYLE FUND | ||||||||||||||||||||
| 1 Year | 3 Year | 5 Year | Since Inception | Date of Inception | ||||||||||||||||
| Fund - Class I: ASMOX | 10.24% | 4.75% | 16.49% | 15.00% | 7/9/2009 | |||||||||||||||
| Fund - Class N: ASMNX | 9.96% | 4.49% | na | 12.09% | 12/17/2012 | |||||||||||||||
| Fund - Class R6: QSMRX | 10.30% | na | na | 2.97% | 7/10/2014 | |||||||||||||||
| Russell 2000® Total Return Index | 15.47% | |||||||||||||||||||
Past performance does not guarantee future results. Investment results and principal value of an investment will fluctuate so that an investor’s shares, when redeemed, may be worth more or less than their original cost. Current performance may be lower or higher than the performance data quoted. As of the latest prospectus, the gross expense ratio for the Fund’s Class I/N/R6 shares are 0.70%, 0.96% and 0.61%, respectively. Call 1-866-290-2688 or visit www.aqrfunds.com for current month-end performance.
| AQR Funds | Annual Report | September 2016 | ||||||||||||||
20
Shareholder Letter (Unaudited)
| AQR SMALL CAP MOMENTUM STYLE FUND |
AQR SMALL CAP MOMENTUM STYLE FUND VS. RUSSELL 2000® TOTAL RETURN INDEX VALUE OF $10,000 INVESTED ON 7/9/2009 |
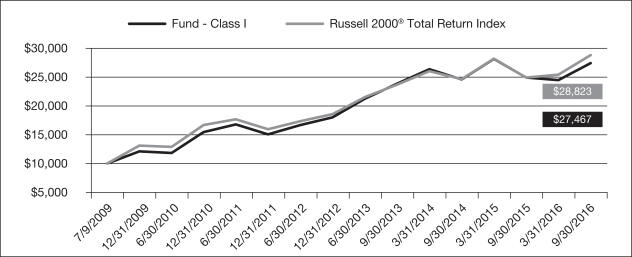
The chart above represents historical performance of a hypothetical investment of $10,000 in the Fund over the past ten years (or since inception if shorter). Performance data quoted represents past performance and does not guarantee future results. Returns shown are total returns, which assume the reinvestment of dividends and capital gains. The table and graph presented above do not reflect the deduction of taxes a shareholder would pay on fund distributions or the redemption of fund shares.
| AQR Funds | Annual Report | September 2016 | ||||||||||||||
21
Shareholder Letter (Unaudited)
| AQR INTERNATIONAL MOMENTUM STYLE FUND |
Cliff Asness
Managing & Founding Principal
Andrea Frazzini
Principal
Jacques Friedman
Principal
Ronen Israel
Principal
Dear Shareholder:
The AQR International Momentum Style Fund (the “Fund”) invests in stocks of non-U.S. companies with positive momentum. The Fund’s investment universe is comprised of approximately the top 85% of stocks by market capitalization of each of the 20 major developed markets outside the U.S. The Fund is not actively managed to outperform a growth, value or core benchmark. Rather, it seeks to provide systematic exposure to stocks that share the common characteristic of positive momentum.
For fiscal year 2016, the AQR International Momentum Style Fund Class I shares returned 6.40% while its benchmark, the MSCI Daily TR Net World Ex USA Index**, returned 7.16% over the period – resulting in a relative underperformance. The Fund’s underperformance was driven primarily by stock selection within sectors and within countries. In particular, stock selection within Canada contributed to negative returns. The Fund’s performance was positively impacted by sector selection and country selection.
At the close of fiscal 2016, the AQR International Momentum Style Fund’s largest active positions include sector overweights to consumer staples and energy. As of year-end, the Fund is underweight financials and consumer discretionary. Notable active positions also include country overweights to Canada and the United Kingdom with underweights to Japan and Switzerland.
AVERAGE ANNUAL TOTAL RETURNS AS OF 9/30/2016 AQR INTERNATIONAL MOMENTUM STYLE FUND | ||||||||||||||||||||
| 1 Year | 3 Year | 5 Year | Since Inception | Date of Inception | ||||||||||||||||
| Fund - Class I: AIMOX | 6.40% | -1.07% | 7.36% | 6.76% | 7/9/2009 | |||||||||||||||
| Fund - Class N: AIONX | 6.16% | -1.31% | na | 3.33% | 12/17/2012 | |||||||||||||||
| Fund - Class R6: QIORX | 6.53% | na | na | -2.75% | 7/10/2014 | |||||||||||||||
| MSCI Daily TR Net World Ex USA Index** | 7.16% | |||||||||||||||||||
Past performance does not guarantee future results. Investment results and principal value of an investment will fluctuate so that an investor’s shares, when redeemed, may be worth more or less than their original cost. Current performance may be lower or higher than the performance data quoted. As of the latest prospectus, the gross expense ratio for the Fund’s Class I/N/R6 shares are 0.68%, 0.94% and 0.55%, respectively. Call 1-866-290-2688 or visit www.aqrfunds.com for current month-end performance.
| AQR Funds | Annual Report | September 2016 | ||||||||||||||
22
Shareholder Letter (Unaudited)
| AQR INTERNATIONAL MOMENTUM STYLE FUND |
AQR INTERNATIONAL MOMENTUM STYLE FUND VS. MSCI DAILY TR NET WORLD EX USA INDEX** VALUE OF $10,000 INVESTED ON 7/9/2009 |
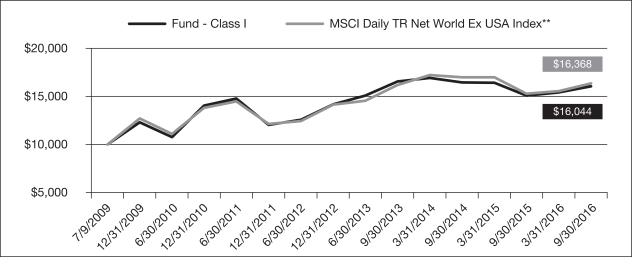
The chart above represents historical performance of a hypothetical investment of $10,000 in the Fund over the past ten years (or since inception if shorter). Performance data quoted represents past performance and does not guarantee future results. Returns shown are total returns, which assume the reinvestment of dividends and capital gains. The table and graph presented above do not reflect the deduction of taxes a shareholder would pay on fund distributions or the redemption of fund shares.
| ** | MSCI makes no express or implied warranties or representations and shall have no liability whatsoever with respect to any MSCI data contained herein. The MSCI data may not be further redistributed or used as a basis for other indices or any securities or financial products. This report is not approved, reviewed, or produced by MSCI. |
| AQR Funds | Annual Report | September 2016 | ||||||||||||||
23
Shareholder Letter (Unaudited)
| AQR EMERGING MOMENTUM STYLE FUND |
Cliff Asness
Managing & Founding Principal
Andrea Frazzini
Principal
Jacques Friedman
Principal
Ronen Israel
Principal
Dear Shareholder:
The AQR Emerging Momentum Style Fund (the “Fund”) invests in stocks of emerging market companies with positive momentum. The Fund is not actively managed to outperform a growth, value or core benchmark. Rather, it seeks to provide systematic exposure to stocks that share the common characteristic of positive momentum.
For fiscal year 2016, the AQR Emerging Momentum Style Fund Class I shares returned 8.53% while its benchmark, the MSCI Daily TR Net Emerging Markets Index**, returned 16.78% over the period – resulting in a relative underperformance. The Fund’s underperformance was driven primarily by stock selection within countries and within sectors. In particular, stock selection within financials and within China contributed to negative returns. The Fund’s performance was positively impacted by country selection.
At the close of fiscal 2016, the AQR Emerging Momentum Style Fund’s largest active positions include sector overweights to information technology. As of year-end, the Fund is underweight financials and telecommunication services. Notable active positions also include country overweights to South Korea with underweights to India and China.
AVERAGE ANNUAL TOTAL RETURNS AS OF 9/30/2016 AQR EMERGING MOMENTUM STYLE FUND | ||||||||||||
| 1 Year | Since Inception | Date of Inception | ||||||||||
| Fund - Class I: QEMLX | 8.53% | -3.94% | 5/13/2014 | |||||||||
| Fund - Class N: QEMNX | 8.38% | -4.17% | 5/13/2014 | |||||||||
| Fund - Class R6: QEMRX | 8.63% | -6.72% | 7/10/2014 | |||||||||
| MSCI Daily TR Net Emerging Markets Index** | 16.78% | |||||||||||
Past performance does not guarantee future results. Investment results and principal value of an investment will fluctuate so that an investor’s shares, when redeemed, may be worth more or less than their original cost. Current performance may be lower or higher than the performance data quoted. As of the latest prospectus, the gross expense ratio for the Fund’s Class I/N/R6 shares are 2.95%, 3.20% and 3.05%, respectively. Call 1-866-290-2688 or visit www.aqrfunds.com for current month-end performance.
| AQR Funds | Annual Report | September 2016 | ||||||||||||||
24
Shareholder Letter (Unaudited)
| AQR EMERGING MOMENTUM STYLE FUND |
AQR EMERGING MOMENTUM STYLE FUND VS. MSCI DAILY TR NET EMERGING MARKETS INDEX** VALUE OF $10,000 INVESTED ON 5/13/2014 |
The chart above represents historical performance of a hypothetical investment of $10,000 in the Fund over the past ten years (or since inception if shorter). Performance data quoted represents past performance and does not guarantee future results. Returns shown are total returns, which assume the reinvestment of dividends and capital gains. The table and graph presented above do not reflect the deduction of taxes a shareholder would pay on fund distributions or the redemption of fund shares.
| ** | MSCI makes no express or implied warranties or representations and shall have no liability whatsoever with respect to any MSCI data contained herein. The MSCI data may not be further redistributed or used as a basis for other indices or any securities or financial products. This report is not approved, reviewed, or produced by MSCI. |
| AQR Funds | Annual Report | September 2016 | ||||||||||||||
25
Shareholder Letter (Unaudited)
| AQR TM LARGE CAP MOMENTUM STYLE FUND |
Cliff Asness
Managing & Founding Principal
Andrea Frazzini
Principal
Jacques Friedman
Principal
Ronen Israel
Principal
Dear Shareholder:
The AQR TM Large Cap Momentum Style Fund (the “Fund”) invests in stocks of large and mid-cap U.S. companies with positive momentum. The Fund’s investment universe is comprised of the 1000 largest U.S. companies by market capitalization. The Fund employs a tax management strategy which considers the potential impact of taxes on investment return.
For fiscal year 2016, the AQR TM Large Cap Momentum Style Fund Class I shares returned 10.22% while its benchmark, the Russell 1000® Index Total Return, returned 14.93% over the period – resulting in a relative underperformance. The Fund’s underperformance was driven primarily by stock selection within sectors. In particular, stock selection within information technology and within health care contributed to negative returns. The Fund’s performance was positively impacted by sector selection.
At the close of fiscal 2016, the AQR TM Large Cap Momentum Style Fund’s largest active positions include sector overweights to consumer staples and real estate. As of year-end, the Fund is underweight financials and health care.
AVERAGE ANNUAL TOTAL RETURNS AS OF 9/30/2016 AQR TM LARGE CAP MOMENTUM STYLE FUND | ||||||||||||||||
| 1 Year | 3 Year | Since Inception | Date of Inception | |||||||||||||
| Fund - Class I: ATMOX | 10.22% | 9.15% | 13.47% | 1/27/2012 | ||||||||||||
| Fund - Class N: ATMNX | 10.11% | 8.92% | 12.78% | 12/17/2012 | ||||||||||||
| Fund - Class R6: QTMRX | 10.32% | na | 4.83% | 7/10/2014 | ||||||||||||
| Russell 1000® Index Total Return | 14.93% | |||||||||||||||
Past performance does not guarantee future results. Investment results and principal value of an investment will fluctuate so that an investor’s shares, when redeemed, may be worth more or less than their original cost. Current performance may be lower or higher than the performance data quoted. As of the latest prospectus, the gross expense ratio for the Fund’s Class I/N/R6 shares are 0.65%, 0.75% and 0.43%, respectively. Call 1-866-290-2688 or visit www.aqrfunds.com for current month-end performance.
| AQR Funds | Annual Report | September 2016 | ||||||||||||||
26
Shareholder Letter (Unaudited)
| AQR TM LARGE CAP MOMENTUM STYLE FUND |
AQR TM LARGE CAP MOMENTUM STYLE FUND VS. RUSSELL 1000® INDEX TOTAL RETURN VALUE OF $10,000 INVESTED ON 1/27/2012 |
The chart above represents historical performance of a hypothetical investment of $10,000 in the Fund over the past ten years (or since inception if shorter). Performance data quoted represents past performance and does not guarantee future results. Returns shown are total returns, which assume the reinvestment of dividends and capital gains. The table and graph presented above do not reflect the deduction of taxes a shareholder would pay on fund distributions or the redemption of fund shares.
| AQR Funds | Annual Report | September 2016 | ||||||||||||||
27
Shareholder Letter (Unaudited)
| AQR TM SMALL CAP MOMENTUM STYLE FUND |
Cliff Asness
Managing & Founding Principal
Andrea Frazzini
Principal
Jacques Friedman
Principal
Ronen Israel
Principal
Dear Shareholder:
The AQR TM Small Cap Momentum Style Fund (the “Fund”) invests in stocks of small-cap U.S. companies with positive momentum. The Fund’s investment universe is comprised of U.S. companies smaller than the 1000th largest and larger than the 3000th largest company by market capitalization. The Fund employs a tax management strategy which considers the potential impact of taxes on investment return.
For fiscal year 2016, the AQR TM Small Cap Momentum Style Fund Class I shares returned 10.07% while its benchmark, the Russell 2000® Total Return Index, returned 15.47% over the period – resulting in a relative underperformance. The Fund’s underperformance was driven primarily by stock selection within sectors and sector selection. In particular, stock selection within health care and within information technology contributed to negative returns. The Fund’s performance was positively impacted by stock selection within energy.
At the close of fiscal 2016, the AQR TM Small Cap Momentum Style Fund’s largest active positions include sector overweights to utilities and information technology. As of year-end, the Fund is underweight financials.
AVERAGE ANNUAL TOTAL RETURNS AS OF 9/30/2016 AQR TM SMALL CAP MOMENTUM STYLE FUND | ||||||||||||||||
| 1 Year | 3 Year | Since Inception | Date of Inception | |||||||||||||
| Fund - Class I: ATSMX | 10.07% | 4.32% | 12.13% | 1/27/2012 | ||||||||||||
| Fund - Class N: ATSNX | 9.95% | 4.10% | 11.91% | 12/17/2012 | ||||||||||||
| Fund - Class R6: QTSRX | 10.24% | na | 3.25% | 7/10/2014 | ||||||||||||
| Russell 2000® Total Return Index | 15.47% | |||||||||||||||
Past performance does not guarantee future results. Investment results and principal value of an investment will fluctuate so that an investor’s shares, when redeemed, may be worth more or less than their original cost. Current performance may be lower or higher than the performance data quoted. As of the latest prospectus, the gross expense ratio for the Fund’s Class I/N/R6 shares are 1.37%, 1.52% and 1.27%, respectively. Call 1-866-290-2688 or visit www.aqrfunds.com for current month-end performance.
| AQR Funds | Annual Report | September 2016 | ||||||||||||||
28
Shareholder Letter (Unaudited)
| AQR TM SMALL CAP MOMENTUM STYLE FUND |
AQR TM SMALL CAP MOMENTUM STYLE FUND VS. RUSSELL 2000® TOTAL RETURN INDEX VALUE OF $10,000 INVESTED ON 1/27/2012 |
The chart above represents historical performance of a hypothetical investment of $10,000 in the Fund over the past ten years (or since inception if shorter). Performance data quoted represents past performance and does not guarantee future results. Returns shown are total returns, which assume the reinvestment of dividends and capital gains. The table and graph presented above do not reflect the deduction of taxes a shareholder would pay on fund distributions or the redemption of fund shares.
| AQR Funds | Annual Report | September 2016 | ||||||||||||||
29
Shareholder Letter (Unaudited)
| AQR TM INTERNATIONAL MOMENTUM STYLE FUND |
Cliff Asness
Managing & Founding Principal
Andrea Frazzini
Principal
Jacques Friedman
Principal
Ronen Israel
Principal
Dear Shareholder:
The AQR TM International Momentum Style Fund (the “Fund”) invests in stocks of large and mid-cap non-U.S. companies with positive momentum. The Fund’s investment universe is comprised of approximately the top 85% of stocks by market capitalization of each of the 20 major developed markets outside the U.S. The Fund is not actively managed to outperform a growth, value or core benchmark. Rather, it seeks to provide systematic exposure to stocks that share the common characteristic of positive momentum. The Fund employs a tax management strategy which considers the potential impact of taxes on investment return.
For fiscal year 2016, the AQR TM International Momentum Style Fund Class I shares returned 6.18% while its benchmark, the MSCI Daily TR Net World Ex USA Index**, returned 7.16% over the period – resulting in a relative underperformance. The Fund’s underperformance was driven primarily by stock selection within countries and within sectors. In particular, stock selection within Canada contributed to negative returns. The Fund’s performance was positively impacted by country selection and sector selection.
At the close of fiscal 2016, the AQR TM International Momentum Style Fund’s largest active positions include sector overweights to consumer staples and energy. As of year-end, the Fund is underweight financials and industrials. Notable active positions also include country overweights to Canada and Netherlands with underweights to Japan and France.
AVERAGE ANNUAL TOTAL RETURNS AS OF 9/30/2016 AQR TM INTERNATIONAL MOMENTUM STYLE FUND | ||||||||||||||||
| 1 Year | 3 Year | Since Inception | Date of Inception | |||||||||||||
| Fund - Class I: ATIMX | 6.18% | -0.59% | 6.09% | 1/27/2012 | ||||||||||||
| Fund - Class N: ATNNX | 6.01% | -0.79% | 3.83% | 12/17/2012 | ||||||||||||
| Fund - Class R6: QTIRX | 6.25% | na | -3.01% | 7/10/2014 | ||||||||||||
| MSCI Daily TR Net World Ex USA Index** | 7.16% | |||||||||||||||
Past performance does not guarantee future results. Investment results and principal value of an investment will fluctuate so that an investor’s shares, when redeemed, may be worth more or less than their original cost. Current performance may be lower or higher than the performance data quoted. As of the latest prospectus, the gross expense ratio for the Fund’s Class I/N/R6 shares are 0.95%, 1.04% and 0.71%, respectively. Call 1-866-290-2688 or visit www.aqrfunds.com for current month-end performance.
| AQR Funds | Annual Report | September 2016 | ||||||||||||||
30
Shareholder Letter (Unaudited)
| AQR TM INTERNATIONAL MOMENTUM STYLE FUND |
AQR TM INTERNATIONAL MOMENTUM STYLE FUND VS. MSCI DAILY TR NET WORLD EX USA INDEX** VALUE OF $10,000 INVESTED ON 1/27/2012 |
The chart above represents historical performance of a hypothetical investment of $10,000 in the Fund over the past ten years (or since inception if shorter). Performance data quoted represents past performance and does not guarantee future results. Returns shown are total returns, which assume the reinvestment of dividends and capital gains. The table and graph presented above do not reflect the deduction of taxes a shareholder would pay on fund distributions or the redemption of fund shares.
| ** | MSCI makes no express or implied warranties or representations and shall have no liability whatsoever with respect to any MSCI data contained herein. The MSCI data may not be further redistributed or used as a basis for other indices or any securities or financial products. This report is not approved, reviewed, or produced by MSCI. |
| AQR Funds | Annual Report | September 2016 | ||||||||||||||
31
Shareholder Letter (Unaudited)
| AQR LARGE CAP DEFENSIVE STYLE FUND |

Michele Aghassi
Principal
Andrea Frazzini
Principal
Jacques Friedman
Principal

Hoon Kim
Principal
Dear Shareholder:
The AQR Large Cap Defensive Style Fund (the “Fund”) pursues a defensive strategy in the U.S. market, meaning it seeks to participate in rising equity markets while mitigating downside risk in declining markets. To achieve this objective, the Fund invests in a broadly diversified set of large/mid-cap companies that we believe to be profitable, stable, low-risk businesses. Profitable and stable companies are identified through measures including profit margins, asset efficiency, leverage, and earnings variability. The Fund also favors lower beta stocks, which tend to be less sensitive to fluctuations in the overall economy and the stock market. We expect lower beta stocks to produce higher risk-adjusted returns than higher beta stocks over the long term.
For fiscal year 2016, the AQR Large Cap Defensive Style Fund Class I shares returned 14.00% while its benchmark, the Russell 1000® Index Total Return, returned 14.93% over the period – resulting in a relative underperformance. The Fund’s underperformance was driven primarily by sector selection. In particular, sector selection to information technology contributed to negative returns. The Fund’s performance was positively impacted by stock selection within sectors.
At the close of fiscal 2016, the AQR Large Cap Defensive Style Fund’s largest active positions include sector overweights to consumer staples and utilities. As of year-end, the Fund is underweight information technology and energy.
AVERAGE ANNUAL TOTAL RETURNS AS OF 9/30/2016 AQR LARGE CAP DEFENSIVE STYLE FUND | ||||||||||||||||
| 1 Year | 3 Year | Since Inception | Date of Inception | |||||||||||||
| Fund - Class I: AUEIX | 14.00% | 13.15% | 14.62% | 7/9/2012 | ||||||||||||
| Fund - Class N: AUENX | 13.78% | * | 12.90% | 14.35% | 7/9/2012 | |||||||||||
| Fund - Class R6: QUERX | 14.13% | na | 10.97% | 9/2/2014 | ||||||||||||
| Russell 1000® Index Total Return | 14.93% | |||||||||||||||
Past performance does not guarantee future results. Investment results and principal value of an investment will fluctuate so that an investor’s shares, when redeemed, may be worth more or less than their original cost. Current performance may be lower or higher than the performance data quoted. As of the latest prospectus, the gross expense ratio for the Fund’s Class I/N/R6 shares are 0.55%, 0.81% and 0.45%, respectively. Call 1-866-290-2688 or visit www.aqrfunds.com for current month-end performance.
| * | Total return information is based on net asset values calculated for shareholder transactions. Certain adjustments were made to the net assets of the Fund at 9/30/2016 for financial reporting purposes, and as a result, the net asset values for shareholder transactions and the total returns based on those net asset values differ from the adjusted net asset values and total returns for financial reporting. |
| AQR Funds | Annual Report | September 2016 | ||||||||||||||
32
Shareholder Letter (Unaudited)
| AQR LARGE CAP DEFENSIVE STYLE FUND |
AQR LARGE CAP DEFENSIVE STYLE FUND VS. RUSSELL 1000® INDEX TOTAL RETURN VALUE OF $10,000 INVESTED ON 7/9/2012 |
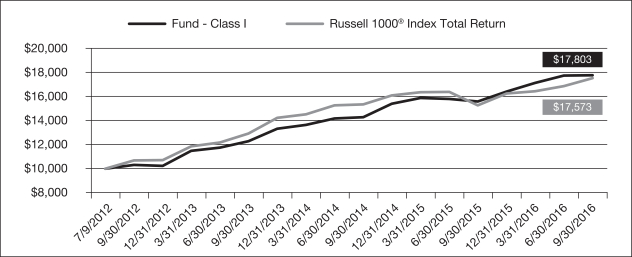
The chart above represents historical performance of a hypothetical investment of $10,000 in the Fund over the past ten years (or since inception if shorter). Performance data quoted represents past performance and does not guarantee future results. Returns shown are total returns, which assume the reinvestment of dividends and capital gains. The table and graph presented above do not reflect the deduction of taxes a shareholder would pay on fund distributions or the redemption of fund shares.
| AQR Funds | Annual Report | September 2016 | ||||||||||||||
33
Shareholder Letter (Unaudited)
| AQR INTERNATIONAL DEFENSIVE STYLE FUND |
Michele Aghassi
Principal
Andrea Frazzini
Principal
Jacques Friedman
Principal
Hoon Kim
Principal
Dear Shareholder:
The AQR International Defensive Style Fund (the “Fund”) pursues a defensive strategy in developed markets outside of the U.S., meaning it seeks to participate in rising equity markets while mitigating downside risk in declining markets. To achieve this objective, the Fund invests in a broadly diversified set of large/mid-cap companies that we believe to be profitable, stable, low-risk businesses. Profitable and stable companies are identified through measures including profit margins, asset efficiency, leverage, and earnings variability. The Fund also favors lower beta stocks, which tend to be less sensitive to fluctuations in the overall economy and the stock market. We expect lower beta stocks to produce higher risk-adjusted returns than higher beta stocks over the long term.
For fiscal year 2016, the AQR International Defensive Style Fund Class I shares returned 12.84% while its benchmark, the MSCI Daily TR Net World Ex USA Index**, returned 7.16% over the period – resulting in a relative outperformance. The Fund’s outperformance was driven primarily by stock selection within sectors and within countries. In particular, stock selection within health care contributed to positive returns. The Fund’s performance was negatively impacted by stock selection within industrials.
At the close of fiscal 2016, the AQR International Defensive Style Fund’s largest active positions include sector overweights to consumer staples. As of year-end, the Fund is underweight financials. Notable active positions also include country overweights to Japan with underweights to the United Kingdom.
AVERAGE ANNUAL TOTAL RETURNS AS OF 9/30/2016 AQR INTERNATIONAL DEFENSIVE STYLE FUND | ||||||||||||||||
| 1 Year | 3 Year | Since Inception | Date of Inception | |||||||||||||
| Fund - Class I: ANDIX | 12.84% | 3.87% | 7.24% | 7/9/2012 | ||||||||||||
| Fund - Class N: ANDNX | 12.59% | 3.58% | 6.97% | 7/9/2012 | ||||||||||||
| Fund - Class R6: ANDRX | 12.95% | na | 0.02% | 9/2/2014 | ||||||||||||
| MSCI Daily TR Net World Ex USA Index** | 7.16% | |||||||||||||||
Past performance does not guarantee future results. Investment results and principal value of an investment will fluctuate so that an investor’s shares, when redeemed, may be worth more or less than their original cost. Current performance may be lower or higher than the performance data quoted. As of the latest prospectus, the gross expense ratio for the Fund’s Class I/N/R6 shares are 1.13%, 1.45% and 1.03%, respectively. Call 1-866-290-2688 or visit www.aqrfunds.com for current month-end performance.
| AQR Funds | Annual Report | September 2016 | ||||||||||||||
34
Shareholder Letter (Unaudited)
| AQR INTERNATIONAL DEFENSIVE STYLE FUND |
AQR INTERNATIONAL DEFENSIVE STYLE FUND VS. MSCI DAILY TR NET WORLD EX USA INDEX** VALUE OF $10,000 INVESTED ON 7/9/2012 |
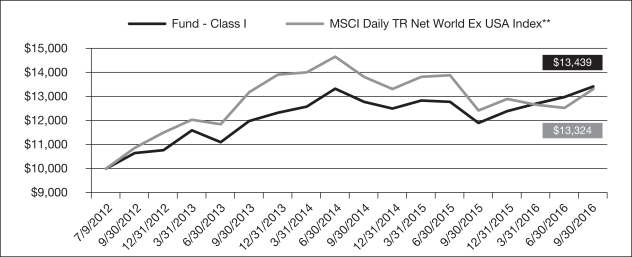
The chart above represents historical performance of a hypothetical investment of $10,000 in the Fund over the past ten years (or since inception if shorter). Performance data quoted represents past performance and does not guarantee future results. Returns shown are total returns, which assume the reinvestment of dividends and capital gains. The table and graph presented above do not reflect the deduction of taxes a shareholder would pay on fund distributions or the redemption of fund shares.
| ** | MSCI makes no express or implied warranties or representations and shall have no liability whatsoever with respect to any MSCI data contained herein. The MSCI data may not be further redistributed or used as a basis for other indices or any securities or financial products. This report is not approved, reviewed, or produced by MSCI. |
| AQR Funds | Annual Report | September 2016 | ||||||||||||||
35
Shareholder Letter (Unaudited)
| AQR EMERGING DEFENSIVE STYLE FUND |
Michele Aghassi
Principal
Andrea Frazzini
Principal
Jacques Friedman
Principal
Hoon Kim
Principal
Dear Shareholder:
The AQR Emerging Defensive Style Fund (the “Fund”) pursues a defensive strategy in emerging markets, meaning it seeks to participate in rising equity markets while mitigating downside risk in declining markets. To achieve this objective, the Fund invests in a broadly diversified set of large/mid-cap companies that we believe to be profitable, stable, low-risk businesses. Profitable and stable companies are identified through measures including profit margins, asset efficiency, leverage, and earnings variability. The Fund also favors lower beta stocks, which tend to be less sensitive to fluctuations in the overall economy and the stock market. We expect lower beta stocks to produce higher risk-adjusted returns than higher beta stocks over the long term.
For fiscal year 2016, the AQR Emerging Defensive Style Fund Class I shares returned 10.73% while its benchmark, the MSCI Daily TR Net Emerging Markets Index**, returned 16.78% over the period – resulting in a relative underperformance. The Fund’s underperformance was driven primarily by sector selection and stock selection within countries. In particular, sector selection to information technology and to telecommunication services contributed to negative returns. The Fund’s performance was positively impacted by stock selection within sectors.
At the close of fiscal 2016, the AQR Emerging Defensive Style Fund’s largest active positions include sector overweights to consumer staples and telecommunication services. As of year-end, the Fund is underweight information technology and financials. Notable active positions also include country overweights to Malaysia and Chile with underweights to China and Russia.
AVERAGE ANNUAL TOTAL RETURNS AS OF 9/30/2016 AQR EMERGING DEFENSIVE STYLE FUND | ||||||||||||||||
| 1 Year | 3 Year | Since Inception (7/9/2012) | Date of Inception | |||||||||||||
| Fund - Class I: AZEIX | 10.73% | -3.10% | -1.34% | 7/9/2012 | ||||||||||||
| Fund - Class N: AZENX | 10.42% | -3.30% | -1.57% | 7/9/2012 | ||||||||||||
| Fund - Class R6: AZERX | 10.67% | na | -8.53% | 9/2/2014 | ||||||||||||
| MSCI Daily TR Net Emerging Markets Index** | 16.78% | |||||||||||||||
Past performance does not guarantee future results. Investment results and principal value of an investment will fluctuate so that an investor’s shares, when redeemed, may be worth more or less than their original cost. Current performance may be lower or higher than the performance data quoted. As of the latest prospectus, the gross expense ratio for the Fund’s Class I/N/R6 shares are 1.15%, 1.43% and 1.11%, respectively. Call 1-866-290-2688 or visit www.aqrfunds.com for current month-end performance.
| AQR Funds | Annual Report | September 2016 | ||||||||||||||
36
Shareholder Letter (Unaudited)
| AQR EMERGING DEFENSIVE STYLE FUND |
AQR EMERGING DEFENSIVE STYLE FUND VS. MSCI DAILY TR NET EMERGING MARKETS INDEX** VALUE OF $10,000 INVESTED ON 7/9/2012 |
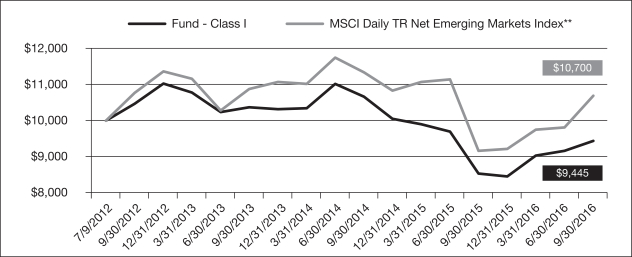
The chart above represents historical performance of a hypothetical investment of $10,000 in the Fund over the past ten years (or since inception if shorter). Performance data quoted represents past performance and does not guarantee future results. Returns shown are total returns, which assume the reinvestment of dividends and capital gains. The table and graph presented above do not reflect the deduction of taxes a shareholder would pay on fund distributions or the redemption of fund shares.
| ** | MSCI makes no express or implied warranties or representations and shall have no liability whatsoever with respect to any MSCI data contained herein. The MSCI data may not be further redistributed or used as a basis for other indices or any securities or financial products. This report is not approved, reviewed, or produced by MSCI. |
| AQR Funds | Annual Report | September 2016 | ||||||||||||||
37
Shareholder Letter (Unaudited)
| AQR GLOBAL EQUITY FUND |
Cliff Asness
Managing & Founding Principal

John Liew
Founding Principal
Jacques Friedman
Principal
Ronen Israel
Principal

Michael Katz
Principal

Oktay Kurbanov
Principal
Dear Shareholder:
The AQR Global Equity Fund (the “Fund”) is actively managed, and it seeks to outperform its benchmark in three ways: by selecting stocks within each country and by using futures, swaps and forwards contracts to over-and-under-weight countries and currencies relative to the benchmark.
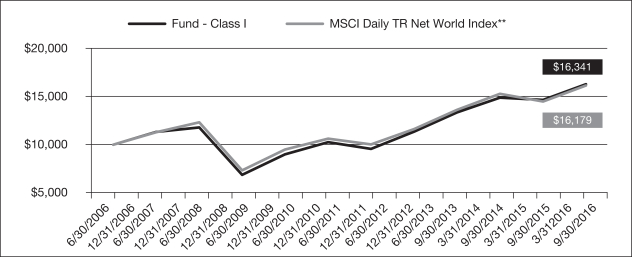
For fiscal year 2016, the AQR Global Equity Fund Class I shares returned 11.33% while its benchmark, the MSCI Daily TR Net World Index**, returned 11.36% over the period – resulting in a relative underperformance. The Fund’s underperformance was driven primarily by stock selection within sectors and sector selection. In particular, stock selection within industrials and within energy contributed to negative returns. The Fund’s performance was positively impacted by stock selection within consumer staples and within health care.
At the close of fiscal 2016, the AQR Global Equity Fund’s largest active positions include sector overweights to information technology. As of year-end, the Fund is underweight financials and energy.
AVERAGE ANNUAL TOTAL RETURNS AS OF 9/30/2016 AQR GLOBAL EQUITY FUND PERFORMANCE SINCE COMMENCEMENT OF OPERATIONS AS A MUTUAL FUND | ||||||||||||||||||||
| 1 Year | 3 Year | 5 Year | Since Inception | Date of Inception | ||||||||||||||||
| Fund - Class I: AQGIX | 11.33% | 6.90% | 13.39% | 9.25% | 12/31/2009 | |||||||||||||||
| Fund - Class N: AQGNX | 10.93% | 6.59% | 13.05% | 8.94% | 12/31/2009 | |||||||||||||||
| Fund - Class R6: AQGRX | 11.33% | na | na | 4.58% | 1/8/2014 | |||||||||||||||
| MSCI Daily TR Net World Index** | 11.36% | |||||||||||||||||||
Past performance does not guarantee future results. Investment results and principal value of an investment will fluctuate so that an investor’s shares, when redeemed, may be worth more or less than their original cost. Current performance may be lower or higher than the performance data quoted. As of the latest prospectus, the gross expense ratio for the Fund’s Class I/N/R6 shares are 0.91%, 1.18% and 0.72%, respectively. Call 1-866-290-2688 or visit www.aqrfunds.com for current month-end performance.
| AQR Funds | Annual Report | September 2016 | ||||||||||||||
38
Shareholder Letter (Unaudited)
| AQR GLOBAL EQUITY FUND |
AQR GLOBAL EQUITY FUND VS. MSCI DAILY TR NET WORLD INDEX** VALUE OF $10,000 INVESTED ON 12/31/2009 |
The chart above represents historical performance of a hypothetical investment of $10,000 in the Fund over the past ten years (or since inception if shorter). Performance data quoted represents past performance and does not guarantee future results. Returns shown are total returns, which assume the reinvestment of dividends and capital gains. The table and graph presented above do not reflect the deduction of taxes a shareholder would pay on fund distributions or the redemption of fund shares.
| ** | MSCI makes no express or implied warranties or representations and shall have no liability whatsoever with respect to any MSCI data contained herein. The MSCI data may not be further redistributed or used as a basis for other indices or any securities or financial products. This report is not approved, reviewed, or produced by MSCI. |
AVERAGE ANNUAL TOTAL RETURNS AS OF 9/30/2016 AQR GLOBAL EQUITY FUND PERFORMANCE SINCE INCEPTION OF PREDECESSOR LIMITED PARTNERSHIP | ||||||||||||||||||||||||
| 1 Year | 3 Year | 5 Year | 10 Year | Since Inception | Date of Inception | |||||||||||||||||||
| Fund - Class I: AQGIX | 11.33% | 6.90% | 13.39% | 4.54% | 4.91% | 6/30/2006 | ||||||||||||||||||
| Fund - Class N: AQGNX | 10.93% | 6.59% | 13.05% | 4.21% | 4.58% | 6/30/2006 | ||||||||||||||||||
| Fund - Class R6: AQGRX | 11.33% | na | na | na | 4.58% | 1/08/2014 | ||||||||||||||||||
| MSCI Daily TR Net World Index** | 11.36% | |||||||||||||||||||||||
Past performance does not guarantee future results. Investment results and principal value of an investment will fluctuate so that an investor’s shares, when redeemed, may be worth more or less than their original cost. Current performance may be lower or higher than the performance data quoted. As of the latest prospectus, the gross expense ratio for the Fund’s Class I/N/R6 shares are 0.91%, 1.18% and 0.72%, respectively. Call 1-866-290-2688 or visit www.aqrfunds.com for current month-end performance.
| AQR Funds | Annual Report | September 2016 | ||||||||||||||
39
Shareholder Letter (Unaudited)
| AQR GLOBAL EQUITY FUND |
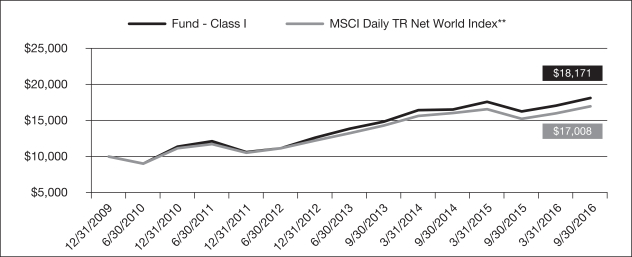
AQR GLOBAL EQUITY FUND VS. MSCI DAILY TR NET WORLD INDEX** VALUE OF $10,000 INVESTED ON 6/30/2006 |
The chart above represents historical performance of a hypothetical investment of $10,000 in the Fund over the past ten years (or since inception if shorter). Performance data quoted represents past performance and does not guarantee future results. Returns shown are total returns, which assume the reinvestment of dividends and capital gains. The table and graph presented above do not reflect the deduction of taxes a shareholder would pay on fund distributions or the redemption of fund shares.
| ** | MSCI makes no express or implied warranties or representations and shall have no liability whatsoever with respect to any MSCI data contained herein. The MSCI data may not be further redistributed or used as a basis for other indices or any securities or financial products. This report is not approved, reviewed, or produced by MSCI. |
| AQR Funds | Annual Report | September 2016 | ||||||||||||||
40
Shareholder Letter (Unaudited)
| AQR INTERNATIONAL EQUITY FUND |
Cliff Asness
Managing & Founding Principal
John Liew
Founding Principal
Jacques Friedman
Principal
Ronen Israel
Principal
Michael Katz
Principal
Oktay Kurbanov
Principal
Dear Shareholder:
The AQR International Equity Fund (the “Fund”) is actively managed, and it seeks to outperform its benchmark in three ways: by selecting stocks within each country and by using futures, swaps and forwards contracts to over-and-under-weight countries and currencies relative to the benchmark.
For fiscal year 2016, the AQR International Equity Fund Class I shares returned 9.34% while its benchmark, the MSCI Daily TR Net EAFE Index**, returned 6.52% over the period – resulting in a relative outperformance. The Fund’s outperformance was driven primarily by global asset allocation strategies and stock selection within health care. Stock selection within industrials contributed negatively to returns.
At the close of fiscal 2016, the AQR International Equity Fund’s largest active positions include sector overweights to materials. As of year-end, the Fund is underweight financials and consumer staples.
AVERAGE ANNUAL TOTAL RETURNS AS OF 9/30/2016 AQR INTERNATIONAL EQUITY FUND PERFORMANCE SINCE COMMENCEMENT OF OPERATIONS AS A MUTUAL FUND | ||||||||||||||||||||
| 1 Year | 3 Year | 5 Year | Since Inception | Date of Inception | ||||||||||||||||
| Fund - Class I: AQIIX | 9.34% | 1.80% | 9.67% | 5.37% | 9/29/2009 | |||||||||||||||
| Fund - Class N: AQINX | 9.04% | 1.51% | 9.31% | 5.06% | 9/29/2009 | |||||||||||||||
| Fund - Class R6: AQIRX | 9.40% | na | na | -0.04% | 1/8/2014 | |||||||||||||||
| MSCI Daily TR Net EAFE Index** | 6.52% | |||||||||||||||||||
Past performance does not guarantee future results. Investment results and principal value of an investment will fluctuate so that an investor’s shares, when redeemed, may be worth more or less than their original cost. Current performance may be lower or higher than the performance data quoted. As of the latest prospectus, the gross expense ratio for the Fund’s Class I/N/R6 shares are 0.93%, 1.22% and 0.86%, respectively. Call 1-866-290-2688 or visit www.aqrfunds.com for current month-end performance.
| AQR Funds | Annual Report | September 2016 | ||||||||||||||
41
Shareholder Letter (Unaudited)
| AQR INTERNATIONAL EQUITY FUND |
AQR INTERNATIONAL EQUITY FUND VS. MSCI DAILY TR NET EAFE INDEX** VALUE OF $10,000 INVESTED ON 9/29/2009 |
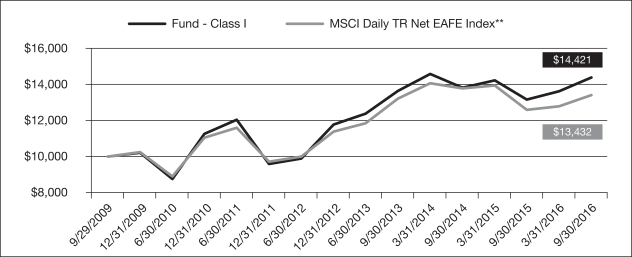
The chart above represents historical performance of a hypothetical investment of $10,000 in the Fund over the past ten years (or since inception if shorter). Performance data quoted represents past performance and does not guarantee future results. Returns shown are total returns, which assume the reinvestment of dividends and capital gains. The table and graph presented above do not reflect the deduction of taxes a shareholder would pay on fund distributions or the redemption of fund shares.
| ** | MSCI makes no express or implied warranties or representations and shall have no liability whatsoever with respect to any MSCI data contained herein. The MSCI data may not be further redistributed or used as a basis for other indices or any securities or financial products. This report is not approved, reviewed, or produced by MSCI. |
AVERAGE ANNUAL TOTAL RETURNS AS OF 9/30/2016 AQR INTERNATIONAL EQUITY FUND PERFORMANCE SINCE INCEPTION OF PREDECESSOR LIMITED PARTNERSHIP | ||||||||||||||||||||||||
| 1 Year | 3 Year | 5 Year | 10 Year | Since Inception | Date of Inception | |||||||||||||||||||
| Fund - Class I: AQIIX | 9.34% | 1.80% | 9.67% | 2.36% | 5.66% | 7/31/2004 | ||||||||||||||||||
| Fund - Class N: AQINX | 9.04% | 1.51% | 9.31% | 2.05% | 5.32% | 7/31/2004 | ||||||||||||||||||
| Fund - Class R6: AQIRX | 9.40% | na | na | na | -0.04% | 1/08/2014 | ||||||||||||||||||
| MSCI Daily TR Net EAFE Index** | 6.52% | |||||||||||||||||||||||
Past performance does not guarantee future results. Investment results and principal value of an investment will fluctuate so that an investor’s shares, when redeemed, may be worth more or less than their original cost. Current performance may be lower or higher than the performance data quoted. As of the latest prospectus, the gross expense ratio for the Fund’s Class I/N/R6 shares are 0.93%, 1.22% and 0.86%, respectively. Call 1-866-290-2688 or visit www.aqrfunds.com for current month-end performance.
| AQR Funds | Annual Report | September 2016 | ||||||||||||||
42
Shareholder Letter (Unaudited)
| AQR INTERNATIONAL EQUITY FUND |
AQR INTERNATIONAL EQUITY FUND VS. MSCI DAILY TR NET EAFE INDEX** VALUE OF $10,000 INVESTED ON 7/31/2004 |
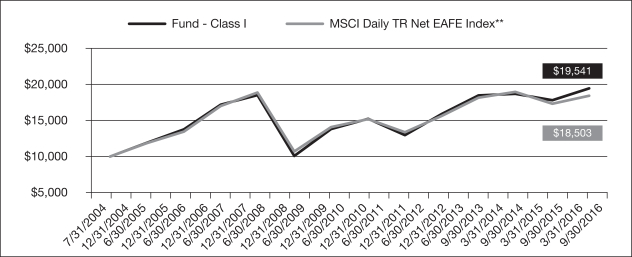
The chart above represents historical performance of a hypothetical investment of $10,000 in the Fund over the past ten years (or since inception if shorter). Performance data quoted represents past performance and does not guarantee future results. Returns shown are total returns, which assume the reinvestment of dividends and capital gains. The table and graph presented above do not reflect the deduction of taxes a shareholder would pay on fund distributions or the redemption of fund shares.
| ** | MSCI makes no express or implied warranties or representations and shall have no liability whatsoever with respect to any MSCI data contained herein. The MSCI data may not be further redistributed or used as a basis for other indices or any securities or financial products. This report is not approved, reviewed, or produced by MSCI. |
| AQR Funds | Annual Report | September 2016 | ||||||||||||||
43
Shareholder Letter (Unaudited)
DEFINITIONS:
Beta: is a measure of volatility of a security or portfolio in comparison to an index or the market as a whole. A beta of 1.0 means the security or portfolio will generally move in tandem with the index or market it is being compared to. A beta greater than 1.0 means the security or portfolio will be more volatile and a beta less than 1.0 means the security or portfolio will be less volatile than the index or market it is being compared to.
Correlation: is computed into what is known as the correlation coefficient, which ranges between -1 and +1. Perfect positive correlation (+1) implies that as one security moves, either up or down, the other security will move in lockstep, in the same direction. Alternatively, perfect negative correlation (-1) means that if one security moves in either direction the security that is perfectly negatively correlated will move in the opposite direction. If the correlation is 0, the movements of the securities are said to have no correlation; they are completely random.
Credit: This strategy purchases attractively priced securities on a hedged basis, typically around event induced capital flows.
Excess Returns: Returns in excess of a Fund’s benchmark.
Industry-Neutral: An industry-neutral bet overweights stocks within an industry versus other stocks within the same industry.
Macroeconomics: is focused on the movement and trends of the whole economy as a whole, including changes such as unemployment, national income, rate of growth, GDP, inflation and price levels.
Momentum: An investment style wherein an asset is deemed to have positive momentum if it has performed well in the past relative to other assets in the same universe.
Profitability: An investment style wherein an asset as certain identifiable characteristics including, profit margin, asset efficiency, leverage and earnings variability.
The MSCI Daily TR Net EAFE Index**: is a free float-adjusted market capitalization index that is designed to measure the performance of equities in developed markets, excluding the United States and Canada. Indexes are unmanaged and one cannot invest directly in an index.
The MSCI Daily TR Net Emerging Markets Index**: is a free float-adjusted market capitalization index that is designed to measure the performance of equities in 23 global emerging markets. Indexes are unmanaged and one cannot invest directly in an index.
The MSCI Daily TR Net World Ex USA Index**: captures large and mid cap securities exhibiting overall growth style characteristics across 22 Developed Markets countries and 23 Emerging Markets countries. The growth investment style characteristics for index construction are defined using five variables: long-term forward EPS growth rate, short-term forward EPS growth rate, current internal growth rate and long-term historical EPS growth trend and long-term historical sales per share growth trend. Indexes are unmanaged and one cannot invest directly in an index.
The MSCI Daily TR Net World Index**: is a free float-adjusted market capitalization index that is designed to measure the performance of equities in developed markets, including the United States and Canada. Indexes are unmanaged and one cannot invest directly in an index.
The Russell 1000® Index Total Return: measures the performance of the large and mid-cap segment of the U.S. equity universe. It is a subset of the Russell 3000® Index and includes approximately 1,000 of the largest securities based on a combination of their market cap and current index membership. The Russell 1000® Index Total Return represents approximately 90% of the U.S. market. Indexes are unmanaged and one cannot invest directly in an index.
The Russell 2000® Total Return Index: measures the performance of the small-cap segment of the U.S. equity universe. The Russell 2000® Total Return Index is a subset of the Russell 3000® Index representing approximately 8% of the total market capitalization of that index. It includes approximately 2,000 of the smallest securities based on a combination of their market cap and current index membership. Indexes are unmanaged and one cannot invest directly in an index.
| AQR Funds | Annual Report | September 2016 | ||||||||||||||
44
Shareholder Letter (Unaudited)
Tracking Error: A measure of how closely a portfolio follows the index to which it is benchmarked. It measures the standard deviation of the difference between the portfolio and index returns.
Volatility: is a statistical measurement of up and down asset price fluctuations over time. If an asset has rapid dramatic price swings, its “volatility” will likely be relatively high. If prices are consistent and rarely change, “volatility” of that asset will likely be relatively low. “Volatility” can be measured as the standard deviation of an asset with a specific time horizon. It is often used to quantify the risk of such asset over a time period, typically expressed in annualized terms.
| ** | MSCI makes no express or implied warranties or representations and shall have no liability whatsoever with respect to any MSCI data contained herein. The MSCI data may not be further redistributed or used as a basis for other indices or any securities or financial products. This report is not approved, reviewed, or produced by MSCI. |
| AQR Funds | Annual Report | September 2016 | ||||||||||||||
45
| Schedule of Investments | September 30, 2016 |
| AQR LARGE CAP MULTI-STYLE FUND |
| INVESTMENTS | SHARES | VALUE | ||||||
| COMMON STOCKS - 95.5% | ||||||||
| Aerospace & Defense - 3.5% | ||||||||
| Boeing Co. (The) | 29,141 | $ | 3,839,035 | |||||
| BWX Technologies, Inc. | 155,181 | 5,954,295 | ||||||
| General Dynamics Corp. | 2,775 | 430,569 | ||||||
| Huntington Ingalls Industries, Inc. | 77,249 | 11,851,542 | ||||||
| L-3 Communications Holdings, Inc. | 6,530 | 984,267 | ||||||
| Northrop Grumman Corp. | 41,577 | 8,895,399 | ||||||
| Raytheon Co. | 105,834 | 14,407,182 | ||||||
| Spirit AeroSystems Holdings, Inc., Class A * | 127,675 | 5,686,645 | ||||||
|
| |||||||
| 52,048,934 | ||||||||
|
| |||||||
| Airlines - 1.9% | ||||||||
| Alaska Air Group, Inc. | 21,559 | 1,419,876 | ||||||
| Delta Air Lines, Inc. | 247,003 | 9,722,038 | ||||||
| JetBlue Airways Corp. * | 278,298 | 4,797,857 | ||||||
| Southwest Airlines Co. | 35,485 | 1,380,012 | ||||||
| United Continental Holdings, Inc. * | 194,162 | 10,187,680 | ||||||
|
| |||||||
| 27,507,463 | ||||||||
|
| |||||||
| Auto Components - 0.7% | ||||||||
| Goodyear Tire & Rubber Co. (The) | 78,092 | 2,522,372 | ||||||
| Lear Corp. | 67,915 | 8,232,656 | ||||||
|
| |||||||
| 10,755,028 | ||||||||
|
| |||||||
| Automobiles - 0.5% | ||||||||
| Ford Motor Co. | 48,415 | 584,369 | ||||||
| General Motors Co. | 156,215 | 4,962,951 | ||||||
| Thor Industries, Inc. | 15,255 | 1,292,098 | ||||||
|
| |||||||
| 6,839,418 | ||||||||
|
| |||||||
| Banks - 6.4% | ||||||||
| Bank of America Corp. | 346,869 | 5,428,500 | ||||||
| Citigroup, Inc. | 206,752 | 9,764,897 | ||||||
| Commerce Bancshares, Inc. | 27,924 | 1,375,536 | ||||||
| Fifth Third Bancorp | 271,745 | 5,559,903 | ||||||
| JPMorgan Chase & Co. | 441,560 | 29,403,480 | ||||||
| PNC Financial Services Group, Inc. (The) | 101,540 | 9,147,739 | ||||||
| Popular, Inc. | 83,504 | 3,191,523 | ||||||
| SunTrust Banks, Inc. | 188,103 | 8,238,911 | ||||||
| US Bancorp | 180,846 | 7,756,485 | ||||||
| Wells Fargo & Co. | 358,073 | 15,855,472 | ||||||
|
| |||||||
| 95,722,446 | ||||||||
|
| |||||||
| Beverages - 1.9% | ||||||||
| Coca-Cola Co. (The) | 120,822 | 5,113,187 | ||||||
| Constellation Brands, Inc., Class A | 63,133 | 10,511,013 | ||||||
| Dr. Pepper Snapple Group, Inc. | 55,834 | 5,098,203 | ||||||
| Molson Coors Brewing Co., Class B | 49,384 | 5,422,363 | ||||||
| PepsiCo, Inc. | 24,650 | 2,681,181 | ||||||
|
| |||||||
| 28,825,947 | ||||||||
|
| |||||||
| Biotechnology - 1.7% | ||||||||
| Amgen, Inc. | 38,028 | 6,343,451 | ||||||
| Biogen, Inc. * | 17,929 | 5,612,315 | ||||||
| Gilead Sciences, Inc. | 65,802 | 5,206,254 | ||||||
| Intrexon Corp. * | 85,975 | 2,409,020 | ||||||
| United Therapeutics Corp. * | 51,131 | 6,037,548 | ||||||
|
| |||||||
| 25,608,588 | ||||||||
|
| |||||||
| INVESTMENTS | SHARES | VALUE | ||||||
| Building Products - 1.3% | ||||||||
| AO Smith Corp. | 52,933 | $ | 5,229,251 | |||||
| Lennox International, Inc. | 3,024 | 474,859 | ||||||
| Masco Corp. | 116,335 | 3,991,454 | ||||||
| Owens Corning | 177,633 | 9,483,826 | ||||||
|
| |||||||
| 19,179,390 | ||||||||
|
| |||||||
| Capital Markets - 1.3% | ||||||||
| Bank of New York Mellon Corp. (The) | 105,001 | 4,187,440 | ||||||
| FactSet Research Systems, Inc. | 9,436 | 1,529,576 | ||||||
| Federated Investors, Inc., Class B | 14,066 | 416,776 | ||||||
| Franklin Resources, Inc. | 33,506 | 1,191,808 | ||||||
| Morgan Stanley | 15,217 | 487,857 | ||||||
| Nasdaq, Inc. | 75,844 | 5,122,504 | ||||||
| S&P Global, Inc. | 17,709 | 2,241,251 | ||||||
| State Street Corp. | 67,521 | 4,701,487 | ||||||
|
| |||||||
| 19,878,699 | ||||||||
|
| |||||||
| Chemicals - 2.2% | ||||||||
| Cabot Corp. | 53,076 | 2,781,713 | ||||||
| Dow Chemical Co. (The) | 165,568 | 8,581,389 | ||||||
| EI du Pont de Nemours & Co. | 59,372 | 3,976,143 | ||||||
| Huntsman Corp. | 413,635 | 6,729,842 | ||||||
| LyondellBasell Industries NV, Class A | 57,313 | 4,622,867 | ||||||
| Monsanto Co. | 28,162 | 2,878,156 | ||||||
| PPG Industries, Inc. | 5,136 | 530,857 | ||||||
| Sherwin-Williams Co. (The) | 5,020 | 1,388,833 | ||||||
| Westlake Chemical Corp. | 29,482 | 1,577,287 | ||||||
|
| |||||||
| 33,067,087 | ||||||||
|
| |||||||
| Commercial Services & Supplies - 0.6% | ||||||||
| Cintas Corp. | 44,955 | 5,061,933 | ||||||
| Pitney Bowes, Inc. | 28,027 | 508,970 | ||||||
| Republic Services, Inc. | 13,617 | 686,978 | ||||||
| Waste Management, Inc. | 33,664 | 2,146,417 | ||||||
|
| |||||||
| 8,404,298 | ||||||||
|
| |||||||
| Communications Equipment - 1.6% | ||||||||
| Brocade Communications Systems, Inc. | 470,728 | 4,344,819 | ||||||
| Cisco Systems, Inc. | 625,577 | 19,843,303 | ||||||
|
| |||||||
| 24,188,122 | ||||||||
|
| |||||||
| Construction & Engineering - 0.0% (a) | ||||||||
Jacobs Engineering Group, Inc. * | 13,465 | 696,410 | ||||||
|
| |||||||
| Consumer Finance - 0.2% | ||||||||
| Capital One Financial Corp. | 19,767 | 1,419,864 | ||||||
| Discover Financial Services | 34,207 | 1,934,406 | ||||||
|
| |||||||
| 3,354,270 | ||||||||
|
| |||||||
| Containers & Packaging - 0.4% | ||||||||
| Avery Dennison Corp. | 35,004 | 2,722,961 | ||||||
| Bemis Co., Inc. | 12,692 | 647,419 | ||||||
| International Paper Co. | 29,238 | 1,402,840 | ||||||
| Packaging Corp. of America | 5,247 | 426,371 | ||||||
|
| |||||||
| 5,199,591 | ||||||||
|
| |||||||
| Distributors - 0.1% | ||||||||
LKQ Corp. * | 30,523 | 1,082,346 | ||||||
|
| |||||||
| Diversified Financial Services - 1.2% | ||||||||
Berkshire Hathaway, Inc., Class B * | 120,877 | 17,463,100 | ||||||
|
| |||||||
| The accompanying notes are an integral part of these financial statements. | (Continued) |
| AQR Funds | Annual Report | September 2016 | ||||||||||||||
46
| Schedule of Investments | September 30, 2016 |
| AQR LARGE CAP MULTI-STYLE FUND |
| INVESTMENTS | SHARES | VALUE | ||||||
| Diversified Telecommunication Services - 2.1% | ||||||||
| AT&T, Inc. | 401,544 | $ | 16,306,702 | |||||
| CenturyLink, Inc. | 57,189 | 1,568,694 | ||||||
| Verizon Communications, Inc. | 253,948 | 13,200,217 | ||||||
|
| |||||||
| 31,075,613 | ||||||||
|
| |||||||
| Electric Utilities - 2.2% | ||||||||
| American Electric Power Co., Inc. | 77,087 | 4,949,756 | ||||||
| Edison International | 15,877 | 1,147,113 | ||||||
| Exelon Corp. | 146,909 | 4,890,601 | ||||||
| Great Plains Energy, Inc. | 58,574 | 1,598,484 | ||||||
| Pinnacle West Capital Corp. | 202,240 | 15,368,218 | ||||||
| Xcel Energy, Inc. | 111,298 | 4,578,800 | ||||||
|
| |||||||
| 32,532,972 | ||||||||
|
| |||||||
| Electrical Equipment - 0.1% | ||||||||
Acuity Brands, Inc. | 5,124 | 1,355,810 | ||||||
|
| |||||||
| Electronic Equipment, Instruments & Components - 1.3% | ||||||||
| Arrow Electronics, Inc. * | 102,067 | 6,529,226 | ||||||
| Avnet, Inc. | 47,533 | 1,951,705 | ||||||
| CDW Corp. | 40,218 | 1,839,169 | ||||||
| Corning, Inc. | 201,658 | 4,769,212 | ||||||
| Dolby Laboratories, Inc., Class A | 37,771 | 2,050,588 | ||||||
| Jabil Circuit, Inc. | 107,154 | 2,338,100 | ||||||
|
| |||||||
| 19,478,000 | ||||||||
|
| |||||||
| Energy Equipment & Services - 0.6% | ||||||||
Rowan Cos. plc, Class A | 616,895 | 9,352,128 | ||||||
|
| |||||||
| Equity Real Estate Investment Trusts (REITs) - 3.3% | ||||||||
| American Tower Corp. | 27,896 | 3,161,454 | ||||||
| AvalonBay Communities, Inc. | 10,236 | 1,820,370 | ||||||
| Boston Properties, Inc. | 6,303 | 859,036 | ||||||
| Crown Castle International Corp. | 20,620 | 1,942,610 | ||||||
| Digital Realty Trust, Inc. | 18,920 | 1,837,510 | ||||||
| Equinix, Inc. | 6,519 | 2,348,470 | ||||||
| Equity Residential | 45,227 | 2,909,453 | ||||||
| Essex Property Trust, Inc. | 2,826 | 629,350 | ||||||
| Extra Space Storage, Inc. | 21,357 | 1,695,959 | ||||||
| General Growth Properties, Inc. | 53,013 | 1,463,159 | ||||||
| HCP, Inc. | 45,628 | 1,731,583 | ||||||
| Host Hotels & Resorts, Inc. | 97,937 | 1,524,879 | ||||||
| Kimco Realty Corp. | 58,406 | 1,690,854 | ||||||
| Macerich Co. (The) | 25,240 | 2,041,159 | ||||||
| Prologis, Inc. | 38,097 | 2,039,713 | ||||||
| Public Storage | 22,605 | 5,044,080 | ||||||
| Realty Income Corp. | 40,996 | 2,743,862 | ||||||
| Simon Property Group, Inc. | 28,970 | 5,997,080 | ||||||
| Ventas, Inc. | 31,502 | 2,224,986 | ||||||
| Vornado Realty Trust | 6,257 | 633,271 | ||||||
| Welltower, Inc. | 27,691 | 2,070,456 | ||||||
| Weyerhaeuser Co. | 75,677 | 2,417,123 | ||||||
|
| |||||||
| 48,826,417 | ||||||||
|
| |||||||
| Food & Staples Retailing - 1.8% | ||||||||
| Kroger Co. (The) | 139,269 | 4,133,504 | ||||||
| Wal-Mart Stores, Inc. | 319,815 | 23,065,058 | ||||||
|
| |||||||
| 27,198,562 | ||||||||
|
| |||||||
| INVESTMENTS | SHARES | VALUE | ||||||
| Food Products - 3.8% | ||||||||
| Campbell Soup Co. | 28,547 | $ | 1,561,521 | |||||
| Hormel Foods Corp. | 182,297 | 6,914,525 | ||||||
| Ingredion, Inc. | 101,757 | 13,539,787 | ||||||
| JM Smucker Co. (The) | 25,390 | 3,441,361 | ||||||
| Kraft Heinz Co. (The) | 38,482 | 3,444,524 | ||||||
| Pilgrim’s Pride Corp. | 201,795 | 4,261,910 | ||||||
| Tyson Foods, Inc., Class A | 303,972 | 22,697,589 | ||||||
|
| |||||||
| 55,861,217 | ||||||||
|
| |||||||
| Health Care Equipment & Supplies - 1.3% | ||||||||
| Baxter International, Inc. | 268,647 | 12,787,597 | ||||||
| Becton Dickinson and Co. | 2,745 | 493,359 | ||||||
| Danaher Corp. | 18,424 | 1,444,257 | ||||||
| Edwards Lifesciences Corp. * | 26,557 | 3,201,712 | ||||||
| ResMed, Inc. | 11,304 | 732,386 | ||||||
| St. Jude Medical, Inc. | 9,695 | 773,273 | ||||||
|
| |||||||
| 19,432,584 | ||||||||
|
| |||||||
| Health Care Providers & Services - 2.9% | ||||||||
| Aetna, Inc. | 88,244 | 10,187,770 | ||||||
| Anthem, Inc. | 55,231 | 6,920,997 | ||||||
| Cigna Corp. | 16,682 | 2,173,998 | ||||||
| Humana, Inc. | 9,797 | 1,732,991 | ||||||
| Quest Diagnostics, Inc. | 9,186 | 777,411 | ||||||
| Quorum Health Corp. * | - | 2 | ||||||
| UnitedHealth Group, Inc. | 53,898 | 7,545,720 | ||||||
| WellCare Health Plans, Inc. * | 114,717 | 13,432,213 | ||||||
|
| |||||||
| 42,771,102 | ||||||||
|
| |||||||
| Hotels, Restaurants & Leisure - 1.2% | ||||||||
| Carnival Corp. | 170,121 | 8,305,307 | ||||||
| Darden Restaurants, Inc. | 77,282 | 4,738,932 | ||||||
| International Game Technology plc | 61,925 | 1,509,732 | ||||||
| McDonald’s Corp. | 24,906 | 2,873,156 | ||||||
| Wyndham Worldwide Corp. | 12,973 | 873,472 | ||||||
|
| |||||||
| 18,300,599 | ||||||||
|
| |||||||
| Household Durables - 0.7% | ||||||||
| DR Horton, Inc. | 240,642 | 7,267,389 | ||||||
| Garmin Ltd. | 11,365 | 546,770 | ||||||
| NVR, Inc. * | 316 | 518,199 | ||||||
| Whirlpool Corp. | 13,295 | 2,155,917 | ||||||
|
| |||||||
| 10,488,275 | ||||||||
|
| |||||||
| Household Products - 2.1% | ||||||||
| Clorox Co. (The) | 19,468 | 2,437,004 | ||||||
| Procter & Gamble Co. (The) | 316,044 | 28,364,949 | ||||||
|
| |||||||
| 30,801,953 | ||||||||
|
| |||||||
| Industrial Conglomerates - 0.7% | ||||||||
| 3M Co. | 7,239 | 1,275,729 | ||||||
| Carlisle Cos., Inc. | 14,270 | 1,463,674 | ||||||
| General Electric Co. | 268,696 | 7,958,776 | ||||||
|
| |||||||
| 10,698,179 | ||||||||
|
| |||||||
| Insurance - 5.1% | ||||||||
| Aflac, Inc. | 93,468 | 6,717,545 | ||||||
| Alleghany Corp. * | 2,130 | 1,118,293 | ||||||
| Allstate Corp. (The) | 108,036 | 7,473,930 | ||||||
| American Financial Group, Inc. | 45,338 | 3,400,350 | ||||||
| The accompanying notes are an integral part of these financial statements. | (Continued) |
| AQR Funds | Annual Report | September 2016 | ||||||||||||||
47
| Schedule of Investments | September 30, 2016 |
| AQR LARGE CAP MULTI-STYLE FUND |
| INVESTMENTS | SHARES | VALUE | ||||||
| Insurance - 5.1% (continued) | ||||||||
| AmTrust Financial Services, Inc. | 43,507 | $ | 1,167,293 | |||||
| Assurant, Inc. | 7,650 | 705,712 | ||||||
| Assured Guaranty Ltd. | 200,558 | 5,565,484 | ||||||
| Chubb Ltd. | 40,304 | 5,064,198 | ||||||
| Cincinnati Financial Corp. | 26,692 | 2,013,111 | ||||||
| CNA Financial Corp. | 18,096 | 622,683 | ||||||
| Everest Re Group Ltd. | 38,880 | 7,386,034 | ||||||
| Hanover Insurance Group, Inc. (The) | 13,398 | 1,010,477 | ||||||
| Old Republic International Corp. | 135,543 | 2,388,268 | ||||||
| Progressive Corp. (The) | 162,538 | 5,119,947 | ||||||
| Prudential Financial, Inc. | 54,810 | 4,475,236 | ||||||
| Reinsurance Group of America, Inc. | 27,690 | 2,988,859 | ||||||
| Travelers Cos., Inc. (The) | 115,307 | 13,208,417 | ||||||
| Unum Group | 55,933 | 1,974,994 | ||||||
| Validus Holdings Ltd. | 20,047 | 998,742 | ||||||
| WR Berkley Corp. | 46,336 | 2,676,367 | ||||||
|
| |||||||
| 76,075,940 | ||||||||
|
| |||||||
| Internet & Direct Marketing Retail - 1.2% | ||||||||
| Amazon.com, Inc. * | 19,221 | 16,093,935 | ||||||
| Priceline Group, Inc. (The) * | 971 | 1,428,817 | ||||||
|
| |||||||
| 17,522,752 | ||||||||
|
| |||||||
| Internet Software & Services - 5.3% | ||||||||
| Akamai Technologies, Inc. * | 81,376 | 4,312,114 | ||||||
| Alphabet, Inc., Class A * | 28,454 | 22,878,723 | ||||||
| Alphabet, Inc., Class C * | 19,182 | 14,909,977 | ||||||
| eBay, Inc. * | 346,492 | 11,399,587 | ||||||
| Facebook, Inc., Class A * | 168,797 | 21,651,591 | ||||||
| LinkedIn Corp., Class A * | 7,790 | 1,488,825 | ||||||
| Rackspace Hosting, Inc. * | 7,285 | 230,862 | ||||||
| VeriSign, Inc. * | 14,879 | 1,164,133 | ||||||
|
| |||||||
| 78,035,812 | ||||||||
|
| |||||||
| IT Services - 2.6% | ||||||||
| Accenture plc, Class A | 73,552 | 8,985,848 | ||||||
| Amdocs Ltd. | 39,812 | 2,303,124 | ||||||
| Booz Allen Hamilton Holding Corp. | 47,017 | 1,486,207 | ||||||
| Broadridge Financial Solutions, Inc. | 15,395 | 1,043,627 | ||||||
| Cognizant Technology Solutions Corp., Class A * | 21,833 | 1,041,653 | ||||||
| Computer Sciences Corp. | 112,689 | 5,883,493 | ||||||
| Fiserv, Inc. * | 36,986 | 3,678,997 | ||||||
| Genpact Ltd. * | 20,641 | 494,352 | ||||||
| International Business Machines Corp. | 52,256 | 8,300,866 | ||||||
| Leidos Holdings, Inc. | 35,987 | 1,557,517 | ||||||
| Western Union Co. (The) | 91,264 | 1,900,117 | ||||||
| Xerox Corp. | 227,911 | 2,308,738 | ||||||
|
| |||||||
| 38,984,539 | ||||||||
|
| |||||||
| Leisure Products - 0.1% | ||||||||
| Brunswick Corp. | 21,575 | 1,052,429 | ||||||
| Mattel, Inc. | 19,200 | 581,376 | ||||||
|
| |||||||
| 1,633,805 | ||||||||
|
| |||||||
| Life Sciences Tools & Services - 0.5% | ||||||||
| Bruker Corp. | 127,308 | 2,883,526 | ||||||
| Charles River Laboratories International, Inc. * | 53,013 | 4,418,104 | ||||||
|
| |||||||
| 7,301,630 | ||||||||
|
| |||||||
| INVESTMENTS | SHARES | VALUE | ||||||
| Machinery - 1.3% | ||||||||
| Cummins, Inc. | 6,583 | $ | 843,611 | |||||
| Illinois Tool Works, Inc. | 15,629 | 1,872,979 | ||||||
| Oshkosh Corp. | 96,240 | 5,389,440 | ||||||
| Stanley Black & Decker, Inc. | 43,274 | 5,321,837 | ||||||
| Toro Co. (The) | 10,300 | 482,452 | ||||||
| Trinity Industries, Inc. | 213,072 | 5,152,081 | ||||||
|
| |||||||
| 19,062,400 | ||||||||
|
| |||||||
| Media - 1.1% | ||||||||
| Cable One, Inc. | 772 | 450,848 | ||||||
| CBS Corp., Class B | 76,488 | 4,186,953 | ||||||
| Charter Communications, Inc., Class A * | 8,998 | 2,429,190 | ||||||
| Comcast Corp., Class A | 65,695 | 4,358,206 | ||||||
| Interpublic Group of Cos., Inc. (The) | 18,527 | 414,078 | ||||||
| John Wiley & Sons, Inc., Class A | 10,655 | 549,905 | ||||||
| News Corp., Class A | 85,723 | 1,198,408 | ||||||
| Scripps Networks Interactive, Inc., Class A | 34,366 | 2,181,897 | ||||||
| TEGNA, Inc. | 46,165 | 1,009,167 | ||||||
|
| |||||||
| 16,778,652 | ||||||||
|
| |||||||
| Metals & Mining - 0.3% | ||||||||
| Newmont Mining Corp. | 34,694 | 1,363,127 | ||||||
| Reliance Steel & Aluminum Co. | 24,519 | 1,766,104 | ||||||
| Steel Dynamics, Inc. | 51,148 | 1,278,188 | ||||||
|
| |||||||
| 4,407,419 | ||||||||
|
| |||||||
| Mortgage Real Estate Investment Trusts (REITs) - 0.1% | ||||||||
Annaly Capital Management, Inc. | 123,202 | 1,293,621 | ||||||
|
| |||||||
| Multiline Retail - 0.1% | ||||||||
Target Corp. | 19,527 | 1,341,114 | ||||||
|
| |||||||
| Multi-Utilities - 1.3% | ||||||||
| Ameren Corp. | 139,487 | 6,859,970 | ||||||
| Consolidated Edison, Inc. | 66,026 | 4,971,758 | ||||||
| Public Service Enterprise Group, Inc. | 162,048 | 6,784,950 | ||||||
| SCANA Corp. | 12,079 | 874,157 | ||||||
|
| |||||||
| 19,490,835 | ||||||||
|
| |||||||
| Oil, Gas & Consumable Fuels - 2.4% | ||||||||
| Antero Resources Corp. * | 434,302 | 11,704,439 | ||||||
| Exxon Mobil Corp. | 94,422 | 8,241,152 | ||||||
| Marathon Petroleum Corp. | 18,451 | 748,926 | ||||||
| Pioneer Natural Resources Co. | 10,426 | 1,935,587 | ||||||
| Range Resources Corp. | 11,905 | 461,319 | ||||||
| Spectra Energy Corp. | 47,300 | 2,022,075 | ||||||
| Tesoro Corp. | 26,717 | 2,125,604 | ||||||
| Valero Energy Corp. | 120,831 | 6,404,043 | ||||||
| World Fuel Services Corp. | 26,476 | 1,224,780 | ||||||
| WPX Energy, Inc. * | 42,980 | 566,906 | ||||||
|
| |||||||
| 35,434,831 | ||||||||
|
| |||||||
| Personal Products - 0.3% | ||||||||
| Estee Lauder Cos., Inc. (The), Class A | 7,265 | 643,388 | ||||||
| Nu Skin Enterprises, Inc., Class A | 49,700 | 3,219,566 | ||||||
|
| |||||||
| 3,862,954 | ||||||||
|
| |||||||
| Pharmaceuticals - 3.5% | ||||||||
| Akorn, Inc. * | 33,704 | 918,771 | ||||||
| Johnson & Johnson | 224,660 | 26,539,086 | ||||||
| The accompanying notes are an integral part of these financial statements. | (Continued) |
| AQR Funds | Annual Report | September 2016 | ||||||||||||||
48
| Schedule of Investments | September 30, 2016 |
| AQR LARGE CAP MULTI-STYLE FUND |
| INVESTMENTS | SHARES | VALUE | ||||||
| Pharmaceuticals - 3.5% (continued) | ||||||||
| Mallinckrodt plc * | 14,407 | $ | 1,005,320 | |||||
| Merck & Co., Inc. | 185,155 | 11,555,524 | ||||||
| Mylan NV * | 10,134 | 386,308 | ||||||
| Pfizer, Inc. | 361,711 | 12,251,152 | ||||||
|
| |||||||
| 52,656,161 | ||||||||
|
| |||||||
| Professional Services - 0.2% | ||||||||
Equifax, Inc. | 25,803 | 3,472,568 | ||||||
|
| |||||||
| Real Estate Management & Development - 0.1% | ||||||||
| CBRE Group, Inc., Class A * | 18,438 | 515,895 | ||||||
| Jones Lang LaSalle, Inc. | 2,862 | 325,667 | ||||||
|
| |||||||
| 841,562 | ||||||||
|
| |||||||
| Road & Rail - 0.3% | ||||||||
| CSX Corp. | 38,074 | 1,161,257 | ||||||
| Norfolk Southern Corp. | 10,968 | 1,064,554 | ||||||
| Union Pacific Corp. | 22,719 | 2,215,784 | ||||||
|
| |||||||
| 4,441,595 | ||||||||
|
| |||||||
| Semiconductors & Semiconductor Equipment - 5.5% | ||||||||
| Applied Materials, Inc. | 417,677 | 12,592,962 | ||||||
| First Solar, Inc. * | 276,780 | 10,930,042 | ||||||
| Intel Corp. | 565,010 | 21,329,127 | ||||||
| Lam Research Corp. | 62,246 | 5,895,319 | ||||||
| NVIDIA Corp. | 224,057 | 15,352,386 | ||||||
| QUALCOMM, Inc. | 15,461 | 1,059,078 | ||||||
| Teradyne, Inc. | 49,161 | 1,060,894 | ||||||
| Texas Instruments, Inc. | 197,777 | 13,879,990 | ||||||
|
| |||||||
| 82,099,798 | ||||||||
|
| |||||||
| Software - 4.4% | ||||||||
| Activision Blizzard, Inc. | 173,762 | 7,697,657 | ||||||
| CA, Inc. | 61,680 | 2,040,374 | ||||||
| Cadence Design Systems, Inc. * | 100,942 | 2,577,049 | ||||||
| Citrix Systems, Inc. * | 128,737 | 10,970,967 | ||||||
| Dell Technologies, Inc. * | 14,037 | 670,969 | ||||||
| Microsoft Corp. | 597,702 | 34,427,635 | ||||||
| Nuance Communications, Inc. * | 30,040 | 435,580 | ||||||
| Oracle Corp. | 47,682 | 1,872,949 | ||||||
| Synopsys, Inc. * | 37,356 | 2,217,079 | ||||||
| VMware, Inc., Class A * | 30,012 | 2,201,380 | ||||||
|
| |||||||
| 65,111,639 | ||||||||
|
| |||||||
| Specialty Retail - 4.0% | ||||||||
| Bed Bath & Beyond, Inc. | 10,182 | 438,946 | ||||||
| Best Buy Co., Inc. | 308,178 | 11,766,236 | ||||||
| Foot Locker, Inc. | 103,835 | 7,031,706 | ||||||
| Home Depot, Inc. (The) | 130,527 | 16,796,214 | ||||||
| Lowe’s Cos., Inc. | 84,457 | 6,098,640 | ||||||
| Murphy USA, Inc. * | 49,902 | 3,561,007 | ||||||
| O’Reilly Automotive, Inc. * | 14,823 | 4,152,070 | ||||||
| Ross Stores, Inc. | 53,933 | 3,467,892 | ||||||
| TJX Cos., Inc. (The) | 34,706 | 2,595,315 | ||||||
| Urban Outfitters, Inc. * | 103,321 | 3,566,641 | ||||||
|
| |||||||
| 59,474,667 | ||||||||
|
| |||||||
| Technology Hardware, Storage & Peripherals - 3.5% | ||||||||
| Apple, Inc. | 353,973 | 40,016,647 | ||||||
| Hewlett Packard Enterprise Co. | 118,693 | 2,700,266 | ||||||
| HP, Inc. | 596,632 | 9,265,695 | ||||||
|
| |||||||
| 51,982,608 | ||||||||
|
| |||||||
| INVESTMENTS | SHARES | VALUE | ||||||
| Textiles, Apparel & Luxury Goods - 1.0% | ||||||||
| Carter’s, Inc. | 21,255 | $ | 1,843,021 | |||||
| Michael Kors Holdings Ltd. * | 227,598 | 10,649,310 | ||||||
| NIKE, Inc., Class B | 39,435 | 2,076,253 | ||||||
|
| |||||||
| 14,568,584 | ||||||||
|
| |||||||
| Thrifts & Mortgage Finance - 0.0% (a) | ||||||||
| New York Community Bancorp, Inc. | 31,509 | 448,373 | ||||||
|
| |||||||
| Tobacco - 1.4% | ||||||||
| Altria Group, Inc. | 127,125 | 8,038,114 | ||||||
| Philip Morris International, Inc. | 100,862 | 9,805,803 | ||||||
| Reynolds American, Inc. | 53,626 | 2,528,466 | ||||||
|
| |||||||
| 20,372,383 | ||||||||
|
| |||||||
| Trading Companies & Distributors - 0.2% | ||||||||
| MSC Industrial Direct Co., Inc., Class A | 8,035 | 589,849 | ||||||
| United Rentals, Inc. * | 26,352 | 2,068,369 | ||||||
|
| |||||||
| 2,658,218 | ||||||||
|
| |||||||
| Transportation Infrastructure - 0.1% | ||||||||
Macquarie Infrastructure Corp. | 14,016 | 1,166,692 | ||||||
|
| |||||||
TOTAL COMMON STOCKS | 1,418,515,700 | |||||||
|
| |||||||
| SHORT-TERM INVESTMENT - 4.1% | ||||||||
| Investment Company - 4.1% | ||||||||
| J.P. Morgan U.S. Treasury Plus Money Market Fund - IM Shares, 0.22% | ||||||||
(cost $60,826,775) (2)(b) | 60,826,775 | 60,826,775 | ||||||
|
| |||||||
TOTAL INVESTMENTS IN SECURITIES AT VALUE - 99.6% | 1,479,342,475 | |||||||
|
| |||||||
| OTHER ASSETS IN EXCESS OF LIABILITIES - 0.4% (c) | 5,309,563 | |||||||
|
| |||||||
NET ASSETS - 100.0% |
| 1,484,652,038 | ||||||
|
| |||||||
| SECTOR | VALUE | % OF NET ASSETS | ||||||
| Consumer Discretionary | $ | 158,785,241 | 10.6 | % | ||||
| Consumer Staples | 166,923,016 | 11.2 | ||||||
| Energy | 44,786,959 | 3.0 | ||||||
| Financials | 214,236,449 | 14.4 | ||||||
| Health Care | 147,770,064 | 10.0 | ||||||
| Industrials | 150,691,956 | 10.1 | ||||||
| Information Technology | 359,880,519 | 24.3 | ||||||
| Materials | 42,674,097 | 2.9 | ||||||
| Real Estate | 49,667,979 | 3.4 | ||||||
| Telecommunication Services | 31,075,613 | 2.1 | ||||||
| Utilities | 52,023,807 | 3.5 | ||||||
| Short-Term Investment | 60,826,775 | 4.1 | ||||||
|
|
|
| |||||
Total Investments In Securities At Value | 1,479,342,475 | 99.6 | ||||||
| Other Assets in Excess of Liabilities (c) | 5,309,563 | 0.4 | ||||||
|
|
|
| |||||
Net Assets | $ | 1,484,652,038 | 100.0 | % | ||||
|
|
|
| |||||
| The accompanying notes are an integral part of these financial statements. | (Continued) |
| AQR Funds | Annual Report | September 2016 | ||||||||||||||
49
| Schedule of Investments | September 30, 2016 |
| AQR LARGE CAP MULTI-STYLE FUND |
| * | Non-income producing security. |
| (a) | Represents less than 0.05% of net assets. |
| (b) | Represents 7-day effective yield as of 9/30/2016. |
| (c) | Includes appreciation/(depreciation) on futures contracts. |
All securities are Level 1 with respect to ASC 820, unless otherwise noted in parentheses.
| (2) | Level 2 security (See Note 4). |
Open futures contracts outstanding at September 30, 2016:
Exchange Traded
| NUMBER OF CONTRACTS | COUNTERPARTY | DESCRIPTION | EXPIRATION DATE | VALUE AT TRADE DATE | VALUE AT SEPTEMBER 30, 2016 | UNREALIZED APPRECIATION (DEPRECIATION) | ||||||||||||||
| Long Contracts: | ||||||||||||||||||||
| 447 | GSCO | S&P 500 E-Mini Futures | 12/2016 | $47,780,991 | $48,284,940 | $503,949 | ||||||||||||||
|
|
|
|
|
| |||||||||||||||
Collateral pledged to, or (received from), each counterparty at September 30, 2016 was as follows:
| COUNTERPARTY | OVER THE COUNTER | EXCHANGE TRADED | TOTAL | |||||||||
| GSCO | ||||||||||||
| Cash | $— | $1,638,777 | $1,638,777 | |||||||||
| ||||||||||||
| The accompanying notes are an integral part of these financial statements. |
| AQR Funds | Annual Report | September 2016 | ||||||||||||||
50
| Schedule of Investments | September 30, 2016 |
| AQR SMALL CAP MULTI-STYLE FUND |
| INVESTMENTS | SHARES | VALUE | ||||||
| COMMON STOCKS - 96.6% | ||||||||
| Aerospace & Defense - 0.5% | ||||||||
| Curtiss-Wright Corp. | 18,743 | $ | 1,707,675 | |||||
| Engility Holdings, Inc. * | 13,066 | 411,579 | ||||||
| Mercury Systems, Inc. * | 23 | 565 | ||||||
| Moog, Inc., Class A * | 7,461 | 444,228 | ||||||
| National Presto Industries, Inc. | 11,381 | 999,138 | ||||||
| Vectrus, Inc. * | 18,962 | 288,791 | ||||||
|
| |||||||
| 3,851,976 | ||||||||
|
| |||||||
| Air Freight & Logistics - 0.2% | ||||||||
| Air Transport Services Group, Inc. * | 55,235 | 792,622 | ||||||
| Hub Group, Inc., Class A * | 16,758 | 683,056 | ||||||
|
| |||||||
| 1,475,678 | ||||||||
|
| |||||||
| Airlines - 0.4% | ||||||||
| Allegiant Travel Co. | 5,157 | 681,085 | ||||||
| Hawaiian Holdings, Inc. * | 18,265 | 887,679 | ||||||
| SkyWest, Inc. | 36,908 | 974,740 | ||||||
| Virgin America, Inc. *(a) | 9,854 | 527,288 | ||||||
|
| |||||||
| 3,070,792 | ||||||||
|
| |||||||
| Auto Components - 4.6% | ||||||||
| American Axle & Manufacturing Holdings, Inc. * | 322,834 | 5,559,201 | ||||||
| Cooper Tire & Rubber Co. | 157,641 | 5,993,511 | ||||||
| Cooper-Standard Holding, Inc. * | 84,459 | 8,344,549 | ||||||
| Dorman Products, Inc. * | 19,172 | 1,225,091 | ||||||
| Drew Industries, Inc. | 44,951 | 4,406,097 | ||||||
| Metaldyne Performance Group, Inc. | 42,615 | 675,448 | ||||||
| Standard Motor Products, Inc. | 12,718 | 607,412 | ||||||
| Stoneridge, Inc. * | 97,194 | 1,788,370 | ||||||
| Superior Industries International, Inc. | 39,728 | 1,158,468 | ||||||
| Tenneco, Inc. * | 70,796 | 4,125,283 | ||||||
| Tower International, Inc. | 26,154 | 630,311 | ||||||
|
| |||||||
| 34,513,741 | ||||||||
|
| |||||||
| Automobiles - 0.1% | ||||||||
| Winnebago Industries, Inc. | 35,364 | 833,530 | ||||||
|
| |||||||
| Banks - 7.7% | ||||||||
| 1st Source Corp. | 12,341 | 440,512 | ||||||
| Ameris Bancorp | 16,617 | 580,764 | ||||||
| Banc of California, Inc. | 91,681 | 1,600,750 | ||||||
| BancorpSouth, Inc. | 14,508 | 336,586 | ||||||
| Bank of the Ozarks, Inc. | 23,566 | 904,934 | ||||||
| Berkshire Hills Bancorp, Inc. | 11,748 | 325,537 | ||||||
| BNC Bancorp | 9,435 | 229,459 | ||||||
| Brookline Bancorp, Inc. | 72,347 | 881,910 | ||||||
| Cardinal Financial Corp. | 34,597 | 902,636 | ||||||
| Cathay General Bancorp | 33,032 | 1,016,725 | ||||||
| CenterState Banks, Inc. | 57,049 | 1,011,479 | ||||||
| Central Pacific Financial Corp. | 10,927 | 275,251 | ||||||
| Chemical Financial Corp. | 71,686 | 3,163,503 | ||||||
| City Holding Co. | 9,824 | 494,049 | ||||||
| Community Bank System, Inc. | 4,534 | 218,131 | ||||||
| Community Trust Bancorp, Inc. | 5,935 | 220,248 | ||||||
| Customers Bancorp, Inc. * | 50,500 | 1,270,580 | ||||||
| Eagle Bancorp, Inc. * | 4,967 | 245,022 | ||||||
| Enterprise Financial Services Corp. | 29,209 | 912,781 | ||||||
| Fidelity Southern Corp. | 44,958 | 826,778 | ||||||
| INVESTMENTS | SHARES | VALUE | ||||||
| Banks - 7.7% (continued) | ||||||||
| Financial Institutions, Inc. | 5,538 | $ | 150,135 | |||||
| First Busey Corp. | 12,896 | 291,450 | ||||||
| First Citizens BancShares, Inc., Class A | 7,898 | 2,321,143 | ||||||
| First Commonwealth Financial Corp. | 39,267 | 396,204 | ||||||
| First Financial Bancorp | 59,053 | 1,289,717 | ||||||
| First Financial Corp. | 5,448 | 221,625 | ||||||
| First Interstate BancSystem, Inc., Class A | 36,361 | 1,145,735 | ||||||
| First Merchants Corp. | 36,114 | 966,049 | ||||||
| First Midwest Bancorp, Inc. | 11,060 | 214,122 | ||||||
| Flushing Financial Corp. | 12,196 | 289,289 | ||||||
| Fulton Financial Corp. | 114,236 | 1,658,707 | ||||||
| Great Southern Bancorp, Inc. | 12,708 | 517,216 | ||||||
| Great Western Bancorp, Inc. | 131,321 | 4,375,616 | ||||||
| Hancock Holding Co. | 6,738 | 218,513 | ||||||
| Hanmi Financial Corp. | 44,419 | 1,169,996 | ||||||
| Heartland Financial USA, Inc. | 16,651 | 600,602 | ||||||
| Heritage Financial Corp. | 20,687 | 371,332 | ||||||
| Hilltop Holdings, Inc. * | 59,624 | 1,339,155 | ||||||
| Home BancShares, Inc. | 19,066 | 396,763 | ||||||
| Hope Bancorp, Inc. | 90,554 | 1,572,923 | ||||||
| Independent Bank Corp. | 12,110 | 203,811 | ||||||
| International Bancshares Corp. | 69,059 | 2,056,577 | ||||||
| LegacyTexas Financial Group, Inc. | 35,970 | 1,137,731 | ||||||
| MB Financial, Inc. | 43,620 | 1,659,305 | ||||||
| Mercantile Bank Corp. | 439 | 11,787 | ||||||
| NBT Bancorp, Inc. | 33,572 | 1,103,512 | ||||||
| Old National Bancorp | 15,548 | 218,605 | ||||||
| Opus Bank | 10,085 | 356,706 | ||||||
| Pacific Premier Bancorp, Inc. * | 37,671 | 996,775 | ||||||
| Peapack Gladstone Financial Corp. | 3,892 | 87,220 | ||||||
| Pinnacle Financial Partners, Inc. | 3,860 | 208,749 | ||||||
| Preferred Bank | 9,883 | 353,317 | ||||||
| PrivateBancorp, Inc. | 34,610 | 1,589,291 | ||||||
| Prosperity Bancshares, Inc. (a) | 46,596 | 2,557,654 | ||||||
| Renasant Corp. | 27,794 | 934,712 | ||||||
| S&T Bancorp, Inc. | 8,693 | 252,010 | ||||||
| Sandy Spring Bancorp, Inc. | 20,407 | 624,046 | ||||||
| ServisFirst Bancshares, Inc. | 22,276 | 1,156,347 | ||||||
| Simmons First National Corp., Class A | 12,992 | 648,301 | ||||||
| Sterling Bancorp | 12,453 | 217,927 | ||||||
| Stock Yards Bancorp, Inc. | 7,609 | 250,793 | ||||||
| Texas Capital Bancshares, Inc. * | 8,442 | 463,635 | ||||||
| Tompkins Financial Corp. | 4,871 | 372,193 | ||||||
| Towne Bank | 35,940 | 863,638 | ||||||
| TriCo Bancshares | 15,404 | 412,365 | ||||||
| TriState Capital Holdings, Inc. * | 566 | 9,141 | ||||||
| Trustmark Corp. | 49,458 | 1,363,062 | ||||||
| Umpqua Holdings Corp. | 22,974 | 345,759 | ||||||
| Union Bankshares Corp. | 24,070 | 644,354 | ||||||
| Webster Financial Corp. | 5,607 | 213,122 | ||||||
| Wintrust Financial Corp. | 11,715 | 651,003 | ||||||
|
| |||||||
| 57,327,375 | ||||||||
|
| |||||||
| Beverages - 0.8% | ||||||||
| Boston Beer Co., Inc. (The), Class A *(a) | 1,486 | 230,716 | ||||||
| Coca-Cola Bottling Co. Consolidated | 3,792 | 561,823 | ||||||
| MGP Ingredients, Inc. (a) | 47,277 | 1,915,664 | ||||||
| National Beverage Corp. *(a) | 70,366 | 3,099,622 | ||||||
|
| |||||||
| 5,807,825 | ||||||||
|
| |||||||
| The accompanying notes are an integral part of these financial statements. | (Continued) |
| AQR Funds | Annual Report | September 2016 | ||||||||||||||
51
| Schedule of Investments | September 30, 2016 |
| AQR SMALL CAP MULTI-STYLE FUND |
| INVESTMENTS | SHARES | VALUE | ||||||
| Biotechnology - 4.6% | ||||||||
| Acceleron Pharma, Inc. * | 9,856 | $ | 356,689 | |||||
| Acorda Therapeutics, Inc. * | 52,946 | 1,105,513 | ||||||
| Aduro Biotech, Inc. *(a) | 18,363 | 228,252 | ||||||
| Alder Biopharmaceuticals, Inc. *(a) | 22,209 | 727,789 | ||||||
| AMAG Pharmaceuticals, Inc. *(a) | 13,693 | 335,615 | ||||||
| Aptevo Therapeutics, Inc. * | 23,005 | 58,893 | ||||||
| ARIAD Pharmaceuticals, Inc. * | 59,374 | 812,830 | ||||||
| BioSpecifics Technologies Corp. * | 7,384 | 337,227 | ||||||
| Cara Therapeutics, Inc. *(a) | 29,742 | 248,346 | ||||||
| Cepheid * | 30,102 | 1,586,074 | ||||||
| Eagle Pharmaceuticals, Inc. *(a) | 18,745 | 1,312,150 | ||||||
| Emergent BioSolutions, Inc. * | 96,941 | 3,056,550 | ||||||
| Enanta Pharmaceuticals, Inc. * | 15,858 | 421,981 | ||||||
| Exact Sciences Corp. *(a) | 75,138 | 1,395,313 | ||||||
| Exelixis, Inc. * | 201,107 | 2,572,159 | ||||||
| Five Prime Therapeutics, Inc. * | 71,941 | 3,776,183 | ||||||
| Inovio Pharmaceuticals, Inc. *(a) | 23,113 | 215,413 | ||||||
| Kite Pharma, Inc. *(a) | 6,011 | 335,774 | ||||||
| Lexicon Pharmaceuticals, Inc. *(a) | 60,660 | 1,096,126 | ||||||
| Ligand Pharmaceuticals, Inc. *(a) | 17,900 | 1,826,874 | ||||||
| Myriad Genetics, Inc. * | 108,554 | 2,234,041 | ||||||
| Novavax, Inc. *(a) | 103,081 | 214,408 | ||||||
| PDL BioPharma, Inc. | 460,829 | 1,543,777 | ||||||
| Prothena Corp. plc (Ireland) *(a) | 14,289 | 856,911 | ||||||
| Radius Health, Inc. * | 24,008 | 1,298,593 | ||||||
| Repligen Corp. * | 31,447 | 949,385 | ||||||
| Retrophin, Inc. *(a) | 55,807 | 1,248,961 | ||||||
| Spark Therapeutics, Inc. *(a) | 26,125 | 1,569,068 | ||||||
| TESARO, Inc. *(a) | 10,636 | 1,066,153 | ||||||
| Xencor, Inc. * | 42,916 | 1,051,013 | ||||||
|
| |||||||
| 33,838,061 | ||||||||
|
| |||||||
| Building Products - 2.6% | ||||||||
| American Woodmark Corp. * | 27,299 | 2,199,480 | ||||||
| Apogee Enterprises, Inc. | 30,885 | 1,380,251 | ||||||
| Builders FirstSource, Inc. * | 43,614 | 501,997 | ||||||
| Gibraltar Industries, Inc. * | 83,165 | 3,089,580 | ||||||
| Griffon Corp. | 28,623 | 486,877 | ||||||
| Insteel Industries, Inc. | 95,418 | 3,457,948 | ||||||
| NCI Building Systems, Inc. * | 15,196 | 221,710 | ||||||
| Patrick Industries, Inc. * | 32,428 | 2,007,942 | ||||||
| Ply Gem Holdings, Inc. * | 30,267 | 404,367 | ||||||
| Trex Co., Inc. * | 5,083 | 298,474 | ||||||
| Universal Forest Products, Inc. | 56,379 | 5,552,768 | ||||||
|
| |||||||
| 19,601,394 | ||||||||
|
| |||||||
| Capital Markets - 0.4% | ||||||||
| Cowen Group, Inc., Class A *(a) | 69,598 | 252,641 | ||||||
| INTL. FCStone, Inc. * | 44,057 | 1,711,614 | ||||||
| Janus Capital Group, Inc. | 21,959 | 307,646 | ||||||
| Piper Jaffray Cos. * | 11,434 | 552,262 | ||||||
|
| |||||||
| 2,824,163 | ||||||||
|
| |||||||
| Chemicals - 2.3% | ||||||||
| American Vanguard Corp. | 48,099 | 772,470 | ||||||
| Chemours Co. (The) | 121,745 | 1,947,920 | ||||||
| FutureFuel Corp. | 28,561 | 322,168 | ||||||
| GCP Applied Technologies, Inc. * | 27,783 | 786,814 | ||||||
| Ingevity Corp. * | 17,387 | 801,541 | ||||||
| Innospec, Inc. | 27,250 | 1,657,072 | ||||||
| Kraton Performance Polymers, Inc. * | 22,478 | 787,629 | ||||||
| INVESTMENTS | SHARES | VALUE | ||||||
| Chemicals - 2.3% (continued) | ||||||||
| Rayonier Advanced Materials, Inc. (a) | 220,049 | $ | 2,942,055 | |||||
| Stepan Co. | 29,730 | 2,160,182 | ||||||
| Trinseo SA | 84,094 | 4,756,357 | ||||||
|
| |||||||
| 16,934,208 | ||||||||
|
| |||||||
| Commercial Services & Supplies - 2.5% | ||||||||
| ABM Industries, Inc. | 8,516 | 338,085 | ||||||
| ACCO Brands Corp. * | 333,757 | 3,217,418 | ||||||
| Brink’s Co. (The) | 5,818 | 215,731 | ||||||
| Deluxe Corp. | 43,529 | 2,908,608 | ||||||
| Ennis, Inc. | 79,682 | 1,342,642 | ||||||
| G&K Services, Inc., Class A | 8,112 | 774,615 | ||||||
| Herman Miller, Inc. | 75,374 | 2,155,696 | ||||||
| HNI Corp. | 23,584 | 938,643 | ||||||
| Interface, Inc. | 14,899 | 248,664 | ||||||
| Knoll, Inc. | 46,601 | 1,064,833 | ||||||
| Quad/Graphics, Inc. | 18,891 | 504,768 | ||||||
| Steelcase, Inc., Class A | 89,215 | 1,239,196 | ||||||
| Tetra Tech, Inc. | 35,658 | 1,264,789 | ||||||
| UniFirst Corp. | 8,447 | 1,113,821 | ||||||
| Viad Corp. | 6,388 | 235,526 | ||||||
| West Corp. | 30,986 | 684,171 | ||||||
|
| |||||||
| 18,247,206 | ||||||||
|
| |||||||
| Communications Equipment - 2.9% | ||||||||
| Digi International, Inc. * | 13,777 | 157,058 | ||||||
| Extreme Networks, Inc. * | 208,756 | 937,315 | ||||||
| Finisar Corp. * | 123,069 | 3,667,456 | ||||||
| Infinera Corp. * | 80,411 | 726,111 | ||||||
| InterDigital, Inc. | 21,805 | 1,726,956 | ||||||
| Ixia * | 77,834 | 972,925 | ||||||
| Lumentum Holdings, Inc. * | 40,426 | 1,688,594 | ||||||
| NETGEAR, Inc. * | 109,184 | 6,604,540 | ||||||
| Plantronics, Inc. | 16,104 | 836,764 | ||||||
| Sonus Networks, Inc. * | 39,158 | 304,649 | ||||||
| Ubiquiti Networks, Inc. *(a) | 68,383 | 3,658,491 | ||||||
|
| |||||||
| 21,280,859 | ||||||||
|
| |||||||
| Construction & Engineering - 1.5% | ||||||||
| Aegion Corp. * | 35,791 | 682,534 | ||||||
| Argan, Inc. | 12,008 | 710,754 | ||||||
| Comfort Systems USA, Inc. | 39,683 | 1,163,109 | ||||||
| Dycom Industries, Inc. * | 22,090 | 1,806,520 | ||||||
| EMCOR Group, Inc. | 62,865 | 3,748,011 | ||||||
| MasTec, Inc. * | 51,234 | 1,523,699 | ||||||
| MYR Group, Inc. * | 7,960 | 239,596 | ||||||
| Tutor Perini Corp. * | 44,198 | 948,931 | ||||||
|
| |||||||
| 10,823,154 | ||||||||
|
| |||||||
| Construction Materials - 0.1% | ||||||||
| Headwaters, Inc. * | 38,812 | 656,699 | ||||||
| US Concrete, Inc. *(a) | 5,720 | 263,492 | ||||||
|
| |||||||
| 920,191 | ||||||||
|
| |||||||
| Consumer Finance - 0.3% | ||||||||
| First Cash Financial Services, Inc. | 12,405 | 584,028 | ||||||
| LendingClub Corp. *(a) | 136,429 | 843,131 | ||||||
| Regional Management Corp. * | 13,945 | 301,909 | ||||||
| World Acceptance Corp. * | 9,594 | 470,490 | ||||||
|
| |||||||
| 2,199,558 | ||||||||
|
| |||||||
| The accompanying notes are an integral part of these financial statements. | (Continued) |
| AQR Funds | Annual Report | September 2016 | ||||||||||||||
52
| Schedule of Investments | September 30, 2016 |
| AQR SMALL CAP MULTI-STYLE FUND |
| INVESTMENTS | SHARES | VALUE | ||||||
| Containers & Packaging - 0.0% (b) | ||||||||
| AEP Industries, Inc. | 2,425 | $ | 265,222 | |||||
|
| |||||||
| Distributors - 0.1% | ||||||||
| Core-Mark Holding Co., Inc. | 17,918 | 641,464 | ||||||
|
| |||||||
| Diversified Consumer Services - 0.4% | ||||||||
| American Public Education, Inc. * | 31,562 | 625,243 | ||||||
| Career Education Corp. * | 91,629 | 622,161 | ||||||
| Grand Canyon Education, Inc. * | 14,167 | 572,205 | ||||||
| K12, Inc. * | 37,374 | 536,317 | ||||||
| Strayer Education, Inc. * | 7,247 | 338,290 | ||||||
|
| |||||||
| 2,694,216 | ||||||||
|
| |||||||
| Diversified Telecommunication Services - 0.4% | ||||||||
| Cincinnati Bell, Inc. * | 117,209 | 478,213 | ||||||
| FairPoint Communications, Inc. * | 27,386 | 411,612 | ||||||
| General Communication, Inc., Class A * | 16,283 | 223,891 | ||||||
| IDT Corp., Class B | 19,218 | 331,318 | ||||||
| Inteliquent, Inc. | 68,225 | 1,101,152 | ||||||
| Iridium Communications, Inc. *(a) | 40,948 | 332,088 | ||||||
| Vonage Holdings Corp. * | 38,704 | 255,833 | ||||||
|
| |||||||
| 3,134,107 | ||||||||
|
| |||||||
| Electric Utilities - 0.3% | ||||||||
| ALLETE, Inc. | 4,780 | 284,984 | ||||||
| Spark Energy, Inc., Class A (a) | 55,243 | 1,609,228 | ||||||
|
| |||||||
| 1,894,212 | ||||||||
|
| |||||||
| Electrical Equipment - 0.3% | ||||||||
| Allied Motion Technologies, Inc. | 11,765 | 222,476 | ||||||
| Encore Wire Corp. | 21,683 | 797,284 | ||||||
| EnerSys | 8,999 | 622,641 | ||||||
| LSI Industries, Inc. | 39,486 | 443,428 | ||||||
|
| |||||||
| 2,085,829 | ||||||||
|
| |||||||
| Electronic Equipment, Instruments & Components - 4.7% | ||||||||
| AVX Corp. | 52,117 | 718,693 | ||||||
| Belden, Inc. | 36,367 | 2,508,959 | ||||||
| Coherent, Inc. * | 37,230 | 4,115,404 | ||||||
| CTS Corp. | 11,980 | 222,828 | ||||||
| ePlus, Inc. * | 13,272 | 1,253,010 | ||||||
| Fabrinet (Thailand) * | 39,022 | 1,739,991 | ||||||
| II-VI, Inc. * | 81,221 | 1,976,107 | ||||||
| Insight Enterprises, Inc. * | 48,835 | 1,589,579 | ||||||
| Littelfuse, Inc. | 5,917 | 762,169 | ||||||
| Methode Electronics, Inc. | 46,515 | 1,626,630 | ||||||
| PC Connection, Inc. | 3,133 | 82,774 | ||||||
| Plexus Corp. * | 7,644 | 357,586 | ||||||
| Rofin-Sinar Technologies, Inc. * | 23,036 | 741,299 | ||||||
| Sanmina Corp. * | 191,556 | 5,453,599 | ||||||
| SYNNEX Corp. | 39,065 | 4,457,707 | ||||||
| Tech Data Corp. * | 56,455 | 4,782,303 | ||||||
| TTM Technologies, Inc. * | 126,641 | 1,450,040 | ||||||
| Vishay Intertechnology, Inc. | 53,248 | 750,264 | ||||||
|
| |||||||
| 34,588,942 | ||||||||
|
| |||||||
| Energy Equipment & Services - 0.8% | ||||||||
| Atwood Oceanics, Inc.(a) | 431,824 | 3,752,551 | ||||||
| Matrix Service Co. * | 19,649 | 368,615 | ||||||
| McDermott International, Inc. * | 76,514 | 383,335 | ||||||
| Parker Drilling Co. * | 115,535 | 250,711 | ||||||
| INVESTMENTS | SHARES | VALUE | ||||||
| Energy Equipment & Services - 0.8% (continued) | ||||||||
| US Silica Holdings, Inc. | 21,023 | $ | 978,831 | |||||
|
| |||||||
| 5,734,043 | ||||||||
|
| |||||||
| Equity Real Estate Investment Trusts (REITs) - 6.9% | ||||||||
| Acadia Realty Trust | 22,872 | 828,881 | ||||||
| Agree Realty Corp. | 28,285 | 1,398,410 | ||||||
| American Assets Trust, Inc. | 13,359 | 579,513 | ||||||
| CBL & Associates Properties, Inc. | 76,168 | 924,680 | ||||||
| Chatham Lodging Trust | 18,956 | 364,903 | ||||||
| Chesapeake Lodging Trust | 23,409 | 536,066 | ||||||
| Colony Starwood Homes (a) | 25,810 | 740,747 | ||||||
| CoreSite Realty Corp. | 17,530 | 1,297,921 | ||||||
| Cousins Properties, Inc. | 89,694 | 936,405 | ||||||
| DiamondRock Hospitality Co. | 98,561 | 896,905 | ||||||
| DuPont Fabros Technology, Inc. | 36,083 | 1,488,424 | ||||||
| EastGroup Properties, Inc. | 8,424 | 619,669 | ||||||
| Education Realty Trust, Inc. | 29,191 | 1,259,300 | ||||||
| FelCor Lodging Trust, Inc. | 109,811 | 706,085 | ||||||
| First Industrial Realty Trust, Inc. | 50,404 | 1,422,401 | ||||||
| Four Corners Property Trust, Inc. | 41,609 | 887,520 | ||||||
| Franklin Street Properties Corp. | 62,690 | 789,894 | ||||||
| GEO Group, Inc. (The) (a) | 34,901 | 829,946 | ||||||
| Global Net Lease, Inc. | 64,810 | 528,850 | ||||||
| Government Properties Income Trust | 27,835 | 629,628 | ||||||
| Gramercy Property Trust | 161,799 | 1,559,742 | ||||||
| Healthcare Realty Trust, Inc. | 49,334 | 1,680,316 | ||||||
| Hudson Pacific Properties, Inc. | 28,576 | 939,293 | ||||||
| Kite Realty Group Trust | 29,359 | 813,831 | ||||||
| LaSalle Hotel Properties | 47,297 | 1,128,979 | ||||||
| Lexington Realty Trust | 86,129 | 887,129 | ||||||
| LTC Properties, Inc. | 15,264 | 793,575 | ||||||
| Mack-Cali Realty Corp. | 57,265 | 1,558,753 | ||||||
| Medical Properties Trust, Inc. | 101,004 | 1,491,829 | ||||||
| Monmouth Real Estate Investment Corp. | 74,001 | 1,055,994 | ||||||
| Monogram Residential Trust, Inc. | 92,620 | 985,477 | ||||||
| National Health Investors, Inc. | 12,852 | 1,008,625 | ||||||
| New Senior Investment Group, Inc. | 29,116 | 335,999 | ||||||
| New York REIT, Inc. | 61,790 | 565,379 | ||||||
| Parkway Properties, Inc. | 38,594 | 656,484 | ||||||
| Pebblebrook Hotel Trust (a) | 32,404 | 861,946 | ||||||
| Pennsylvania REIT | 35,593 | 819,707 | ||||||
| Physicians Realty Trust | 48,583 | 1,046,478 | ||||||
| Potlatch Corp. | 15,775 | 613,490 | ||||||
| PS Business Parks, Inc. | 4,743 | 538,663 | ||||||
| QTS Realty Trust, Inc., Class A | 20,958 | 1,107,630 | ||||||
| Ramco-Gershenson Properties Trust | 36,446 | 682,998 | ||||||
| Retail Opportunity Investments Corp. | 31,613 | 694,221 | ||||||
| Rexford Industrial Realty, Inc. | 45,584 | 1,043,418 | ||||||
| RLJ Lodging Trust | 56,430 | 1,186,723 | ||||||
| Ryman Hospitality Properties, Inc. | 19,404 | 934,497 | ||||||
| Sabra Health Care REIT, Inc. | 35,103 | 883,894 | ||||||
| Select Income REIT | 28,994 | 779,939 | ||||||
| Seritage Growth Properties, Class A (a) | 15,237 | 772,211 | ||||||
| STAG Industrial, Inc. | 23,309 | 571,304 | ||||||
| Summit Hotel Properties, Inc. | 66,119 | 870,126 | ||||||
| Sunstone Hotel Investors, Inc. | 92,362 | 1,181,310 | ||||||
| Terreno Realty Corp. | 31,022 | 853,415 | ||||||
| Urban Edge Properties | 37,635 | 1,059,049 | ||||||
| Washington Prime Group, Inc. | 62,209 | 770,147 | ||||||
| The accompanying notes are an integral part of these financial statements. | (Continued) |
| AQR Funds | Annual Report | September 2016 | ||||||||||||||
53
| Schedule of Investments | September 30, 2016 |
| AQR SMALL CAP MULTI-STYLE FUND |
| INVESTMENTS | SHARES | VALUE | ||||||
| Equity Real Estate Investment Trusts (REITs) - 6.9% (continued) | ||||||||
| Washington REIT | 15,381 | $ | 478,657 | |||||
| Xenia Hotels & Resorts, Inc. | 39,930 | 606,137 | ||||||
|
| |||||||
| 51,483,513 | ||||||||
|
| |||||||
| Food & Staples Retailing - 0.5% | ||||||||
| Ingles Markets, Inc., Class A | 23,480 | 928,399 | ||||||
| SpartanNash Co. | 33,723 | 975,269 | ||||||
| SUPERVALU, Inc. * | 116,652 | 582,094 | ||||||
| United Natural Foods, Inc. * | 10,473 | 419,339 | ||||||
| Weis Markets, Inc. | 13,848 | 733,944 | ||||||
|
| |||||||
| 3,639,045 | ||||||||
|
| |||||||
| Food Products - 2.6% | ||||||||
| B&G Foods, Inc. | 8,376 | 411,932 | ||||||
| Cal-Maine Foods, Inc. (a) | 69,120 | 2,663,885 | ||||||
| Darling Ingredients, Inc. * | 85,797 | 1,159,117 | ||||||
| Dean Foods Co. | 78,989 | 1,295,420 | ||||||
| Fresh Del Monte Produce, Inc. | 51,651 | 3,093,895 | ||||||
| John B. Sanfilippo & Son, Inc. | 51,222 | 2,629,225 | ||||||
| Lancaster Colony Corp. | 7,335 | 968,880 | ||||||
| Omega Protein Corp. * | 145,165 | 3,392,506 | ||||||
| Sanderson Farms, Inc. (a) | 39,570 | 3,811,778 | ||||||
|
| |||||||
| 19,426,638 | ||||||||
|
| |||||||
| Gas Utilities - 0.8% | ||||||||
| ONE Gas, Inc. | 54,655 | 3,379,865 | ||||||
| Southwest Gas Corp. | 31,957 | 2,232,516 | ||||||
|
| |||||||
| 5,612,381 | ||||||||
|
| |||||||
| Health Care Equipment & Supplies - 1.7% | ||||||||
| Anika Therapeutics, Inc. * | 50,457 | 2,414,368 | ||||||
| Cantel Medical Corp. | 4,640 | 361,827 | ||||||
| Cynosure, Inc., Class A * | 25,374 | 1,292,552 | ||||||
| Exactech, Inc. * | 11,440 | 309,223 | ||||||
| Globus Medical, Inc., Class A * | 9,737 | 219,764 | ||||||
| iRadimed Corp. *(a) | 36,142 | 614,053 | ||||||
| LeMaitre Vascular, Inc. | 35,542 | 705,153 | ||||||
| Masimo Corp. * | 46,180 | 2,747,248 | ||||||
| Meridian Bioscience, Inc. | 14,473 | 279,184 | ||||||
| Merit Medical Systems, Inc. * | 8,830 | 214,481 | ||||||
| Natus Medical, Inc. * | 11,567 | 454,467 | ||||||
| OraSure Technologies, Inc. * | 111,123 | 885,650 | ||||||
| Orthofix International NV* | 4,927 | 210,728 | ||||||
| Penumbra, Inc. * | 10,594 | 805,038 | ||||||
| TransEnterix, Inc. *(a) | 472,190 | 798,001 | ||||||
|
| |||||||
| 12,311,737 | ||||||||
|
| |||||||
| Health Care Providers & Services - 1.6% | ||||||||
| Aceto Corp. | 33,006 | 626,784 | ||||||
| Almost Family, Inc. * | 9,845 | 362,001 | ||||||
| Amedisys, Inc. * | 16,583 | 786,697 | ||||||
| AMN Healthcare Services, Inc. * | 65,483 | 2,086,943 | ||||||
| BioTelemetry, Inc. * | 55,622 | 1,032,901 | ||||||
| Chemed Corp. | 11,341 | 1,599,875 | ||||||
| Cross Country Healthcare, Inc. * | 24,081 | 283,674 | ||||||
| Diplomat Pharmacy, Inc. *(a) | 7,627 | 213,632 | ||||||
| Healthways, Inc. * | 31,663 | 837,803 | ||||||
| LHC Group, Inc. * | 10,174 | 375,217 | ||||||
| Molina Healthcare, Inc. * | 22,770 | 1,327,946 | ||||||
| Nobilis Health Corp. *(a) | 137,976 | 462,220 | ||||||
| INVESTMENTS | SHARES | VALUE | ||||||
| Health Care Providers & Services - 1.6% (continued) | ||||||||
| Select Medical Holdings Corp. * | 24,607 | $ | 332,194 | |||||
| Surgical Care Affiliates, Inc. * | 5,651 | 275,543 | ||||||
| Triple-S Management Corp., Class B * | 58,516 | 1,283,256 | ||||||
|
| |||||||
| 11,886,686 | ||||||||
|
| |||||||
| Health Care Technology - 0.2% | ||||||||
| HMS Holdings Corp. * | 58,804 | 1,303,685 | ||||||
| Press Ganey Holdings, Inc. * | 10,391 | 419,796 | ||||||
|
| |||||||
| 1,723,481 | ||||||||
|
| |||||||
| Hotels, Restaurants & Leisure - 1.1% | ||||||||
| Caesars Entertainment Corp. *(a) | 78,516 | 584,944 | ||||||
| Carrols Restaurant Group, Inc. * | 24,873 | 328,572 | ||||||
| Dave & Buster’s Entertainment, Inc. * | 45,084 | 1,766,391 | ||||||
| Denny’s Corp. * | 29,809 | 318,658 | ||||||
| Eldorado Resorts, Inc. * | 148,302 | 2,085,126 | ||||||
| Isle of Capri Casinos, Inc. * | 62,475 | 1,391,943 | ||||||
| Marcus Corp. (The) | 18,663 | 467,322 | ||||||
| Marriott Vacations Worldwide Corp. | 6,642 | 486,992 | ||||||
| Ruth’s Hospitality Group, Inc. | 53,934 | 761,548 | ||||||
| Texas Roadhouse, Inc. | 4,970 | 193,979 | ||||||
|
| |||||||
| 8,385,475 | ||||||||
|
| |||||||
| Household Durables - 1.7% | ||||||||
| Bassett Furniture Industries, Inc. | 37,992 | 883,314 | ||||||
| Beazer Homes USA, Inc. * | 196,073 | 2,286,211 | ||||||
| Ethan Allen Interiors, Inc. (a) | 28,018 | 876,123 | ||||||
| Flexsteel Industries, Inc. | 5,627 | 291,028 | ||||||
| Hooker Furniture Corp. | 19,654 | 481,327 | ||||||
| KB Home (a) | 167,832 | 2,705,452 | ||||||
| La-Z-Boy, Inc. | 60,548 | 1,487,059 | ||||||
| LGI Homes, Inc. *(a) | 39,736 | 1,463,874 | ||||||
| Libbey, Inc. | 15,014 | 268,000 | ||||||
| TopBuild Corp. * | 30,891 | 1,025,581 | ||||||
| ZAGG, Inc. * | 113,519 | 919,504 | ||||||
|
| |||||||
| 12,687,473 | ||||||||
|
| |||||||
| Household Products - 0.5% | ||||||||
| Central Garden & Pet Co., Class A * | 98,384 | 2,439,923 | ||||||
| HRG Group, Inc. * | 39,227 | 615,864 | ||||||
| WD-40 Co. | 3,020 | 339,539 | ||||||
|
| |||||||
| 3,395,326 | ||||||||
|
| |||||||
| Insurance - 4.5% | ||||||||
| Ambac Financial Group, Inc. * | 57,898 | 1,064,744 | ||||||
| American Equity Investment Life Holding Co. | 32,177 | 570,498 | ||||||
| AMERISAFE, Inc. | 27,740 | 1,630,557 | ||||||
| Argo Group International Holdings Ltd. | 43,447 | 2,451,280 | ||||||
| Atlas Financial Holdings, Inc. * | 4,995 | 78,771 | ||||||
| CNO Financial Group, Inc. | 163,600 | 2,498,172 | ||||||
| Employers Holdings, Inc. | 106,547 | 3,178,297 | ||||||
| Enstar Group Ltd. * | 4,552 | 748,667 | ||||||
| FBL Financial Group, Inc., Class A | 14,654 | 937,416 | ||||||
| Federated National Holding Co. | 41,704 | 779,448 | ||||||
| Genworth Financial, Inc., Class A * | 280,193 | 1,389,757 | ||||||
| Heritage Insurance Holdings, Inc. | 82,096 | 1,183,003 | ||||||
| Horace Mann Educators Corp. | 33,418 | 1,224,770 | ||||||
| Infinity Property & Casualty Corp. | 11,107 | 917,771 | ||||||
| James River Group Holdings Ltd. | 25,365 | 918,213 | ||||||
| The accompanying notes are an integral part of these financial statements. | (Continued) |
| AQR Funds | Annual Report | September 2016 | ||||||||||||||
54
| Schedule of Investments | September 30, 2016 |
| AQR SMALL CAP MULTI-STYLE FUND |
| INVESTMENTS | SHARES | VALUE | ||||||
| Insurance - 4.5% (continued) | ||||||||
| Kemper Corp. | 6,314 | $ | 248,267 | |||||
| Maiden Holdings Ltd. | 68,760 | 872,564 | ||||||
| National General Holdings Corp. | 43,798 | 974,068 | ||||||
| National Western Life Group, Inc., Class A | 2,414 | 495,763 | ||||||
| Navigators Group, Inc. (The) | 16,216 | 1,571,655 | ||||||
| Primerica, Inc. (a) | 50,109 | 2,657,280 | ||||||
| Selective Insurance Group, Inc. | 77,968 | 3,107,805 | ||||||
| State Auto Financial Corp. | 2,979 | 70,930 | ||||||
| United Fire Group, Inc. | 35,265 | 1,492,415 | ||||||
| United Insurance Holdings Corp. | 30,872 | 524,207 | ||||||
| Universal Insurance Holdings, Inc. (a) | 78,954 | 1,989,641 | ||||||
|
| |||||||
| 33,575,959 | ||||||||
|
| |||||||
| Internet & Direct Marketing Retail - 0.2% | ||||||||
| 1-800-Flowers.com, Inc., Class A * | 62,513 | 573,244 | ||||||
| Nutrisystem, Inc. | 19,297 | 572,928 | ||||||
| PetMed Express, Inc. (a) | 35,149 | 712,822 | ||||||
|
| |||||||
| 1,858,994 | ||||||||
|
| |||||||
| Internet Software & Services - 1.8% | ||||||||
| Bankrate, Inc. * | 27,890 | 236,507 | ||||||
| Brightcove, Inc. * | 17,027 | 222,202 | ||||||
| EarthLink Holdings Corp. | 38,179 | 236,710 | ||||||
| Five9, Inc. * | 20,595 | 322,930 | ||||||
| GrubHub, Inc. * | 9,795 | 421,087 | ||||||
| j2 Global, Inc. | 33,639 | 2,240,694 | ||||||
| Liquidity Services, Inc. * | 27,244 | 306,223 | ||||||
| LogMeIn, Inc. | 17,920 | 1,619,789 | ||||||
| MeetMe, Inc. * | 389,200 | 2,413,040 | ||||||
| Monster Worldwide, Inc. * | 206,910 | 746,945 | ||||||
| NIC, Inc. | 13,603 | 319,670 | ||||||
| RetailMeNot, Inc. * | 50,761 | 502,026 | ||||||
| Shutterstock, Inc. *(a) | 19,316 | 1,230,429 | ||||||
| Stamps.com, Inc. *(a) | 24,657 | 2,330,333 | ||||||
| Web.com Group, Inc. * | 21,565 | 372,428 | ||||||
|
| |||||||
| 13,521,013 | ||||||||
|
| |||||||
| IT Services - 3.1% | ||||||||
| CACI International, Inc., Class A * | 21,874 | 2,207,087 | ||||||
| Cardtronics plc * | 17,259 | 769,751 | ||||||
| Convergys Corp. | 119,689 | 3,640,939 | ||||||
| CSG Systems International, Inc. | 82,883 | 3,425,554 | ||||||
| ExlService Holdings, Inc. * | 41,965 | 2,091,536 | ||||||
| Hackett Group, Inc. (The) | 107,944 | 1,783,235 | ||||||
| MoneyGram International, Inc. * | 614 | 4,359 | ||||||
| NeuStar, Inc., Class A *(a) | 128,918 | 3,427,930 | ||||||
| Perficient, Inc. * | 12,331 | 248,470 | ||||||
| Science Applications International Corp. | 13,786 | 956,335 | ||||||
| Sykes Enterprises, Inc. * | 100,349 | 2,822,817 | ||||||
| Syntel, Inc. | 13,848 | 580,370 | ||||||
| TeleTech Holdings, Inc. | 26,987 | 782,353 | ||||||
|
| |||||||
| 22,740,736 | ||||||||
|
| |||||||
| Leisure Products - 1.6% | ||||||||
| JAKKS Pacific, Inc. *(a) | 34,564 | 298,633 | ||||||
| Nautilus, Inc. * | 81,168 | 1,844,137 | ||||||
| Smith & Wesson Holding Corp. *(a) | 308,348 | 8,198,973 | ||||||
| Sturm Ruger & Co., Inc. (a) | 30,708 | 1,773,694 | ||||||
|
| |||||||
| 12,115,437 | ||||||||
|
| |||||||
| INVESTMENTS | SHARES | VALUE | ||||||
| Life Sciences Tools & Services - 0.6% | ||||||||
| Cambrex Corp. * | 67,943 | $ | 3,020,746 | |||||
| INC Research Holdings, Inc., Class A * | 18,560 | 827,405 | ||||||
| Luminex Corp. * | 22,437 | 509,768 | ||||||
|
| |||||||
| 4,357,919 | ||||||||
|
| |||||||
| Machinery - 3.5% | ||||||||
| Alamo Group, Inc. | 24,184 | 1,593,484 | ||||||
| Altra Industrial Motion Corp. | 11,795 | 341,701 | ||||||
| American Railcar Industries, Inc. (a) | 18,439 | 764,665 | ||||||
| Astec Industries, Inc. | 9,944 | 595,347 | ||||||
| Barnes Group, Inc. | 16,468 | 667,777 | ||||||
| Briggs & Stratton Corp. | 22,355 | 416,921 | ||||||
| Douglas Dynamics, Inc. | 32,808 | 1,047,888 | ||||||
| Energy Recovery, Inc. *(a) | 168,145 | 2,686,957 | ||||||
| Federal Signal Corp. | 38,951 | 516,490 | ||||||
| Global Brass & Copper Holdings, Inc. | 66,010 | 1,907,029 | ||||||
| Greenbrier Cos., Inc. (The) (a) | 83,571 | 2,950,056 | ||||||
| John Bean Technologies Corp. | 21,328 | 1,504,690 | ||||||
| Joy Global, Inc. | 40,638 | 1,127,298 | ||||||
| Kadant, Inc. | 13,271 | 691,552 | ||||||
| Lydall, Inc. * | 29,832 | 1,525,310 | ||||||
| Meritor, Inc. * | 53,181 | 591,905 | ||||||
| Mueller Industries, Inc. | 9,904 | 321,088 | ||||||
| Standex International Corp. | 14,835 | 1,377,727 | ||||||
| Supreme Industries, Inc., Class A | 82,947 | 1,600,877 | ||||||
| Wabash National Corp. * | 253,568 | 3,610,808 | ||||||
|
| |||||||
| 25,839,570 | ||||||||
|
| |||||||
| Marine - 0.1% | ||||||||
| Matson, Inc. | 16,596 | 661,849 | ||||||
|
| |||||||
| Media - 1.6% | ||||||||
| Entravision Communications Corp., Class A | 41,197 | 314,333 | ||||||
| Gannett Co., Inc. | 249,746 | 2,907,043 | ||||||
| Gray Television, Inc. * | 116,435 | 1,206,267 | ||||||
| Media General, Inc. * | 36,985 | 681,634 | ||||||
| Meredith Corp. | 9,309 | 483,975 | ||||||
| MSG Networks, Inc., Class A * | 26,205 | 487,675 | ||||||
| New Media Investment Group, Inc. | 68,212 | 1,057,286 | ||||||
| New York Times Co. (The), Class A | 69,021 | 824,801 | ||||||
| Nexstar Broadcasting Group, Inc., Class A (a) | 22,146 | 1,278,046 | ||||||
| Sinclair Broadcast Group, Inc., Class A | 76,681 | 2,214,547 | ||||||
| World Wrestling Entertainment, Inc., Class A (a) | 21,050 | 448,365 | ||||||
|
| |||||||
| 11,903,972 | ||||||||
|
| |||||||
| Metals & Mining - 1.9% | ||||||||
| AK Steel Holding Corp. *(a) | 262,422 | 1,267,498 | ||||||
| Cliffs Natural Resources, Inc. *(a) | 586,339 | 3,430,083 | ||||||
| Coeur Mining, Inc. * | 63,088 | 746,331 | ||||||
| Commercial Metals Co. | 104,291 | 1,688,472 | ||||||
| Hecla Mining Co. | 155,710 | 887,547 | ||||||
| Olympic Steel, Inc. | 40,492 | 894,873 | ||||||
| Ryerson Holding Corp. * | 127,407 | 1,438,425 | ||||||
| Worthington Industries, Inc. | 78,791 | 3,784,332 | ||||||
|
| |||||||
| 14,137,561 | ||||||||
|
| |||||||
| The accompanying notes are an integral part of these financial statements. | (Continued) |
| AQR Funds | Annual Report | September 2016 | ||||||||||||||
55
| Schedule of Investments | September 30, 2016 |
| AQR SMALL CAP MULTI-STYLE FUND |
| INVESTMENTS | SHARES | VALUE | ||||||
| Mortgage Real Estate Investment Trusts (REITs) - 1.2% | ||||||||
| Apollo Commercial Real Estate Finance, Inc. | 65,268 | $ | 1,068,437 | |||||
| Capstead Mortgage Corp. | 100,628 | 948,922 | ||||||
| Colony Capital, Inc., Class A | 54,017 | 984,730 | ||||||
| CYS Investments, Inc. | 166,414 | 1,451,130 | ||||||
| Invesco Mortgage Capital, Inc. | 94,224 | 1,435,031 | ||||||
| New Residential Investment Corp. | 122,704 | 1,694,542 | ||||||
| PennyMac Mortgage Investment Trust | 39,646 | 617,685 | ||||||
| Redwood Trust, Inc. | 69,054 | 977,805 | ||||||
|
| |||||||
| 9,178,282 | ||||||||
|
| |||||||
| Multiline Retail - 0.1% | ||||||||
| Big Lots, Inc. | 4,485 | 214,159 | ||||||
| Fred’s, Inc., Class A (a) | 34,141 | 309,317 | ||||||
|
| |||||||
| 523,476 | ||||||||
|
| |||||||
| Multi-Utilities - 0.1% | ||||||||
| Avista Corp. | 16,739 | 699,523 | ||||||
|
| |||||||
| Oil, Gas & Consumable Fuels - 0.6% | ||||||||
| Callon Petroleum Co. * | 39,899 | 626,414 | ||||||
| Gener8 Maritime, Inc. * | 44,329 | 226,965 | ||||||
| Jones Energy, Inc., Class A *(a) | 66,730 | 237,559 | ||||||
| Oasis Petroleum, Inc. * | 93,778 | 1,075,634 | ||||||
| PDC Energy, Inc. * | 7,581 | 508,382 | ||||||
| Renewable Energy Group, Inc. *(a) | 43,617 | 369,436 | ||||||
| REX American Resources Corp. * | 10,732 | 909,644 | ||||||
| RSP Permian, Inc. * | 22,499 | 872,511 | ||||||
|
| |||||||
| 4,826,545 | ||||||||
|
| |||||||
| Paper & Forest Products - 0.3% | ||||||||
| Clearwater Paper Corp. * | 7,985 | 516,390 | ||||||
| Neenah Paper, Inc. | 13,767 | 1,087,731 | ||||||
| PH Glatfelter Co. | 33,412 | 724,372 | ||||||
|
| |||||||
| 2,328,493 | ||||||||
|
| |||||||
| Personal Products - 1.0% | ||||||||
| Avon Products, Inc. | 40,977 | 231,930 | ||||||
| Medifast, Inc. | 10,605 | 400,763 | ||||||
| Natural Health Trends Corp. (a) | 97,375 | 2,751,817 | ||||||
| Revlon, Inc., Class A * | 8,131 | 299,058 | ||||||
| USANA Health Sciences, Inc. * | 28,360 | 3,923,606 | ||||||
|
| |||||||
| 7,607,174 | ||||||||
|
| |||||||
| Pharmaceuticals - 1.0% | ||||||||
| Amphastar Pharmaceuticals, Inc. * | 55,472 | 1,052,304 | ||||||
| Corcept Therapeutics, Inc. *(a) | 64,785 | 421,102 | ||||||
| Heska Corp. * | 11,125 | 605,534 | ||||||
| Horizon Pharma plc* | 40,222 | 729,225 | ||||||
| Innoviva, Inc. *(a) | 37,915 | 416,686 | ||||||
| Prestige Brands Holdings, Inc. * | 19,860 | 958,642 | ||||||
| SciClone Pharmaceuticals, Inc. * | 225,736 | 2,313,794 | ||||||
| Supernus Pharmaceuticals, Inc. * | 49,934 | 1,234,868 | ||||||
|
| |||||||
| 7,732,155 | ||||||||
|
| |||||||
| Professional Services - 2.2% | ||||||||
| Barrett Business Services, Inc. | 40,043 | 1,986,533 | ||||||
| CBIZ, Inc. * | 28,987 | 324,364 | ||||||
| ICF International, Inc. * | 24,190 | 1,072,101 | ||||||
| Insperity, Inc. | 71,098 | 5,164,559 | ||||||
| Kelly Services, Inc., Class A | 38,058 | 731,475 | ||||||
| INVESTMENTS | SHARES | VALUE | ||||||
| Professional Services - 2.2% (continued) | ||||||||
| Kforce, Inc. | 48,932 | $ | 1,002,617 | |||||
| Mistras Group, Inc. * | 48,819 | 1,145,782 | ||||||
| Navigant Consulting, Inc. * | 41,718 | 843,538 | ||||||
| On Assignment, Inc. * | 30,367 | 1,102,018 | ||||||
| Resources Connection, Inc. | 24,386 | 364,327 | ||||||
| RPX Corp. * | 63,547 | 679,317 | ||||||
| TrueBlue, Inc. * | 80,350 | 1,820,731 | ||||||
|
| |||||||
| 16,237,362 | ||||||||
|
| |||||||
| Real Estate Management & Development - 0.1% | ||||||||
| Alexander & Baldwin, Inc. | 17,385 | 667,932 | ||||||
|
| |||||||
| Road & Rail - 0.1% | ||||||||
| Roadrunner Transportation Systems, Inc. * | 29,078 | 232,042 | ||||||
| Swift Transportation Co. *(a) | 18,500 | 397,195 | ||||||
|
| |||||||
| 629,237 | ||||||||
|
| |||||||
| Semiconductors & Semiconductor Equipment - 6.0% | ||||||||
| Advanced Energy Industries, Inc. * | 105,390 | 4,987,055 | ||||||
| Advanced Micro Devices, Inc. * | 288,043 | 1,990,377 | ||||||
| Alpha & Omega Semiconductor Ltd. * | 28,351 | 615,784 | ||||||
| Ambarella, Inc. * | 27,369 | 2,014,632 | ||||||
| Amkor Technology, Inc. * | 253,048 | 2,459,627 | ||||||
| Cabot Microelectronics Corp. | 7,578 | 400,952 | ||||||
| Cirrus Logic, Inc. * | 99,775 | 5,303,041 | ||||||
| Cohu, Inc. | 3,553 | 41,712 | ||||||
| Entegris, Inc. * | 49,707 | 865,896 | ||||||
| GigPeak, Inc. *(a) | 178,625 | 419,769 | ||||||
| Inphi Corp. * | 46,054 | 2,003,810 | ||||||
| Integrated Device Technology, Inc. * | 146,632 | 3,387,199 | ||||||
| Intersil Corp., Class A | 55,376 | 1,214,396 | ||||||
| IXYS Corp. | 31,754 | 382,636 | ||||||
| MaxLinear, Inc., Class A * | 211,450 | 4,286,091 | ||||||
| MKS Instruments, Inc. | 43,453 | 2,160,918 | ||||||
| Monolithic Power Systems, Inc. | 10,690 | 860,545 | ||||||
| NeoPhotonics Corp. * | 129,560 | 2,117,010 | ||||||
| PDF Solutions, Inc. * | 12,569 | 228,379 | ||||||
| Photronics, Inc. * | 197,111 | 2,032,214 | ||||||
| Power Integrations, Inc. | 9,852 | 620,972 | ||||||
| Rambus, Inc. * | 20,369 | 254,612 | ||||||
| Rudolph Technologies, Inc. * | 81,146 | 1,439,530 | ||||||
| Silicon Laboratories, Inc. * | 8,277 | 486,688 | ||||||
| Synaptics, Inc. * | 40,887 | 2,395,160 | ||||||
| Tessera Technologies, Inc. | 45,301 | 1,741,370 | ||||||
|
| |||||||
| 44,710,375 | ||||||||
|
| |||||||
| Software - 2.5% | ||||||||
| A10 Networks, Inc. * | 22,981 | 245,667 | ||||||
| AVG Technologies NV* | 27,686 | 692,427 | ||||||
| BroadSoft, Inc. * | 10,346 | 481,606 | ||||||
| Ebix, Inc. (a) | 52,555 | 2,987,752 | ||||||
| Ellie Mae, Inc. * | 24,267 | 2,555,315 | ||||||
| Fair Isaac Corp. | 14,583 | 1,816,896 | ||||||
| Fleetmatics Group plc* | 20,001 | 1,199,660 | ||||||
| Gigamon, Inc. * | 36,825 | 2,018,010 | ||||||
| Mentor Graphics Corp. | 47,367 | 1,252,383 | ||||||
| Mitek Systems, Inc. *(a) | 190,075 | 1,575,722 | ||||||
| Paycom Software, Inc. * | 14,843 | 744,080 | ||||||
| Rubicon Project, Inc. (The) * | 61,734 | 511,158 | ||||||
| The accompanying notes are an integral part of these financial statements. | (Continued) |
| AQR Funds | Annual Report | September 2016 | ||||||||||||||
56
| Schedule of Investments | September 30, 2016 |
| AQR SMALL CAP MULTI-STYLE FUND |
| INVESTMENTS | SHARES | VALUE | ||||||
| Software - 2.5% (continued) | ||||||||
| Silver Spring Networks, Inc. * | 21,790 | $ | 308,982 | |||||
| Take-Two Interactive Software, Inc. * | 10,173 | 458,599 | ||||||
| TiVo Corp. * | 67,474 | 1,314,393 | ||||||
| VASCO Data Security International, Inc. * | 36,915 | 650,073 | ||||||
| Zix Corp. * | 37,854 | 155,201 | ||||||
|
| |||||||
| 18,967,924 | ||||||||
|
| |||||||
| Specialty Retail - 1.7% | ||||||||
| American Eagle Outfitters, Inc. (a) | 118,700 | 2,119,982 | ||||||
| Build-A-Bear Workshop, Inc. * | 24,811 | 257,042 | ||||||
| Caleres, Inc. | 39,012 | 986,613 | ||||||
| Cato Corp. (The), Class A | 7,747 | 254,799 | ||||||
| Children’s Place, Inc. (The) | 10,511 | 839,514 | ||||||
| Citi Trends, Inc. | 26,670 | 531,533 | ||||||
| Express, Inc. * | 180,457 | 2,127,588 | ||||||
| Francesca’s Holdings Corp. * | 76,498 | 1,180,364 | ||||||
| Genesco, Inc. * | 7,995 | 435,408 | ||||||
| Haverty Furniture Cos., Inc. | 12,386 | 248,215 | ||||||
| Kirkland’s, Inc. * | 24,742 | 301,358 | ||||||
| Lithia Motors, Inc., Class A | 7,333 | 700,448 | ||||||
| Office Depot, Inc. | 491,620 | 1,755,083 | ||||||
| Shoe Carnival, Inc. | 17,009 | 453,460 | ||||||
| Stein Mart, Inc. | 28,977 | 184,004 | ||||||
| Tile Shop Holdings, Inc. * | 22,887 | 378,780 | ||||||
|
| |||||||
| 12,754,191 | ||||||||
|
| |||||||
| Technology Hardware, Storage & Peripherals - 0.6% | ||||||||
| Cray, Inc. * | 109,297 | 2,572,852 | ||||||
| Super Micro Computer, Inc. * | 65,930 | 1,540,784 | ||||||
|
| |||||||
| 4,113,636 | ||||||||
|
| |||||||
| Textiles, Apparel & Luxury Goods - 0.5% | ||||||||
| Culp, Inc. | 9,073 | 270,103 | ||||||
| Movado Group, Inc. | 109,165 | 2,344,864 | ||||||
| Perry Ellis International, Inc. * | 12,743 | 245,685 | ||||||
| Vera Bradley, Inc. * | 76,232 | 1,154,915 | ||||||
|
| |||||||
| 4,015,567 | ||||||||
|
| |||||||
| Thrifts & Mortgage Finance - 2.9% | ||||||||
| BofI Holding, Inc. *(a) | 9,684 | 216,922 | ||||||
| Dime Community Bancshares, Inc. | 38,461 | 644,606 | ||||||
| Essent Group Ltd. * | 22,222 | 591,327 | ||||||
| EverBank Financial Corp. | 42,600 | 824,736 | ||||||
| Federal Agricultural Mortgage Corp., Class C | 18,201 | 718,940 | ||||||
| First Defiance Financial Corp. | 15,684 | 700,134 | ||||||
| Flagstar Bancorp, Inc. * | 61,166 | 1,697,357 | ||||||
| HomeStreet, Inc. * | 43,395 | 1,087,479 | ||||||
| Impac Mortgage Holdings, Inc. * | 3,679 | 48,526 | ||||||
| Meta Financial Group, Inc. | 9,396 | 569,492 | ||||||
| MGIC Investment Corp. * | 506,587 | 4,052,696 | ||||||
| Oritani Financial Corp. | 50,157 | 788,468 | ||||||
| Provident Financial Services, Inc. | 55,358 | 1,175,250 | ||||||
| Radian Group, Inc. | 119,604 | 1,620,634 | ||||||
| Territorial Bancorp, Inc. | 3,725 | 106,758 | ||||||
| United Financial Bancorp, Inc. | 47,638 | 659,310 | ||||||
| Walker & Dunlop, Inc. * | 92,889 | 2,346,376 | ||||||
| Washington Federal, Inc. | 97,647 | 2,605,222 | ||||||
| WSFS Financial Corp. | 25,615 | 934,691 | ||||||
|
| |||||||
| 21,388,924 | ||||||||
|
| |||||||
| INVESTMENTS | SHARES | VALUE | ||||||
| Tobacco - 0.2% | ||||||||
| Universal Corp. | 14,685 | $ | 854,961 | |||||
| Vector Group Ltd. (a) | 35,339 | 760,844 | ||||||
|
| |||||||
| 1,615,805 | ||||||||
|
| |||||||
| Trading Companies & Distributors - 0.2% | ||||||||
| Applied Industrial Technologies, Inc. | 5,780 | 270,157 | ||||||
| H&E Equipment Services, Inc. | 37,132 | 622,332 | ||||||
| Kaman Corp. | 9,121 | 400,595 | ||||||
|
| |||||||
| 1,293,084 | ||||||||
|
| |||||||
| Wireless Telecommunication Services - 0.3% | ||||||||
| NII Holdings, Inc. * | 137,772 | 458,781 | ||||||
| Shenandoah Telecommunications Co. | 53,256 | 1,449,096 | ||||||
| Spok Holdings, Inc. | 31,163 | 555,324 | ||||||
|
| |||||||
| 2,463,201 | ||||||||
|
| |||||||
TOTAL COMMON STOCKS |
| 717,605,397 | ||||||
|
| |||||||
| SHORT-TERM INVESTMENT - 3.2% | ||||||||
| Investment Company - 3.2% | ||||||||
| J.P. Morgan U.S. Treasury Plus Money Market Fund - IM Shares, 0.22% | ||||||||
(cost $24,020,775) (2)(c) | 24,020,775 | 24,020,775 | ||||||
|
| |||||||
| SECURITIES LENDING COLLATERAL - 9.0% | ||||||||
| Money Market Funds - 9.0% | ||||||||
| Investments in a Pooled Account through Securities Lending Program with JPMorgan Chase Bank | ||||||||
| Dreyfus Treasury & Agency Cash | ||||||||
Management, 0.21% | 66,623,428 | 66,623,428 | ||||||
|
| |||||||
TOTAL INVESTMENTS IN SECURITIES AT VALUE - 108.8% |
| 808,249,600 | ||||||
|
| |||||||
| LIABILITIES IN EXCESS OF OTHER ASSETS - (8.8%) (e) | (65,047,715) | |||||||
|
| |||||||
| NET ASSETS - 100.0% | 743,201,885 | |||||||
|
| |||||||
| The accompanying notes are an integral part of these financial statements. | (Continued) |
| AQR Funds | Annual Report | September 2016 | ||||||||||||||
57
| Schedule of Investments | September 30, 2016 |
| AQR SMALL CAP MULTI-STYLE FUND |
| SECTOR | VALUE | % OF NET ASSETS | ||||||
| Consumer Discretionary | $ | 102,927,536 | 13.8 | % | ||||
| Consumer Staples | 41,491,813 | 5.6 | ||||||
| Energy | 10,560,587 | 1.4 | ||||||
| Financials | 126,494,262 | 17.0 | ||||||
| Health Care | 71,850,039 | 9.7 | ||||||
| Industrials | 103,817,131 | 14.0 | ||||||
| Information Technology | 159,923,485 | 21.5 | ||||||
| Materials | 34,585,675 | 4.7 | ||||||
| Real Estate | 52,151,445 | 7.0 | ||||||
| Telecommunication Services | 5,597,308 | 0.8 | ||||||
| Utilities | 8,206,116 | 1.1 | ||||||
| Short-Term Investment | 24,020,775 | 3.2 | ||||||
| Securities Lending Collateral | 66,623,428 | 9.0 | ||||||
|
|
|
| |||||
Total Investments In Securities At Value | 808,249,600 | 108.8 | ||||||
| Liabilities in Excess of Other Assets (e) | (65,047,715 | ) | (8.8 | ) | ||||
|
|
|
| |||||
Net Assets | $ | 743,201,885 | 100.0 | % | ||||
|
|
|
| |||||
All securities are United States companies, unless noted otherwise in parentheses.
| * | Non-income producing security. |
| (a) | The security or a portion of this security is on loan at 9/30/2016. The total value of securities on loan at 9/30/2016 was $64,912,322. |
| (b) | Represents less than 0.05% of net assets. |
| (c) | Represents 7-day effective yield as of 9/30/2016. |
| (d) | Represents security, or portion thereof, purchased with the cash collateral received for securities on loan. |
| (e) | Includes appreciation/(depreciation) on futures contracts. |
All securities are Level 1 with respect to ASC 820, unless otherwise noted in parentheses.
(2) Level 2 security (See Note 4).
Open futures contracts outstanding at September 30, 2016:
Exchange Traded
| NUMBER OF CONTRACTS | COUNTERPARTY | DESCRIPTION | EXPIRATION DATE | VALUE AT TRADE DATE | VALUE AT SEPTEMBER 30, 2016 | UNREALIZED APPRECIATION (DEPRECIATION) | ||||||||||||||
| Long Contracts: | ||||||||||||||||||||
| 130 | JPMS | E-Mini Russell 2000 Futures | 12/2016 | $15,864,499 | $16,227,900 | $363,401 | ||||||||||||||
|
|
|
|
|
| |||||||||||||||
Collateral pledged to, or (received from), each counterparty at September 30, 2016 was as follows:
| COUNTERPARTY | OVER THE COUNTER | EXCHANGE TRADED | TOTAL | |||||||||
| JPMS | ||||||||||||
| Cash | $— | $561,556 | $561,556 | |||||||||
| ||||||||||||
| The accompanying notes are an integral part of these financial statements. |
| AQR Funds | Annual Report | September 2016 | ||||||||||||||
58
| Schedule of Investments | September 30, 2016 |
| AQR INTERNATIONAL MULTI-STYLE FUND |
| INVESTMENTS | SHARES | VALUE | ||||||
| COMMON STOCKS - 95.5% | ||||||||
| Australia - 5.8% | ||||||||
| Amcor Ltd. | 29,675 | $ | 345,634 | |||||
| Aristocrat Leisure Ltd. | 111,673 | 1,358,717 | ||||||
| Bank of Queensland Ltd. | 20,793 | 182,114 | ||||||
| BHP Billiton Ltd. | 77,989 | 1,350,964 | ||||||
| Caltex Australia Ltd. | 123,073 | 3,253,899 | ||||||
| CIMIC Group Ltd. | 87,280 | 1,933,033 | ||||||
| Cochlear Ltd. | 8,740 | 947,355 | ||||||
| Commonwealth Bank of Australia | 5,866 | 327,107 | ||||||
| CSL Ltd. | 11,411 | 938,333 | ||||||
| Dexus Property Group, REIT | 104,929 | 737,500 | ||||||
| Flight Centre Travel Group Ltd. | 36,084 | 1,010,156 | ||||||
| Fortescue Metals Group Ltd. | 565,946 | 2,166,202 | ||||||
| Goodman Group, REIT | 41,832 | 234,455 | ||||||
| GPT Group (The), REIT | 196,673 | 765,855 | ||||||
| Harvey Norman Holdings Ltd. | 47,125 | 188,638 | ||||||
| Macquarie Group Ltd. | 19,730 | 1,247,813 | ||||||
| Newcrest Mining Ltd. | 20,277 | 342,279 | ||||||
| Qantas Airways Ltd. | 95,359 | 229,035 | ||||||
| REA Group Ltd. | 22,827 | 992,859 | ||||||
| Scentre Group, REIT | 235,569 | 850,448 | ||||||
| Tabcorp Holdings Ltd. | 379,186 | 1,452,034 | ||||||
| Treasury Wine Estates Ltd. | 96,024 | 814,926 | ||||||
| Woodside Petroleum Ltd. | 15,015 | 332,924 | ||||||
|
| |||||||
| 22,002,280 | ||||||||
|
| |||||||
| Belgium - 1.6% | ||||||||
| Ageas | 34,686 | 1,268,238 | ||||||
| Anheuser-Busch InBev SA/NV | 10,656 | 1,401,348 | ||||||
| Colruyt SA | 12,529 | 695,806 | ||||||
| KBC Group NV | 21,303 | 1,243,581 | ||||||
| Proximus SADP | 24,506 | 733,121 | ||||||
| Umicore SA | 12,906 | 810,355 | ||||||
|
| |||||||
| 6,152,449 | ||||||||
|
| |||||||
| Canada - 7.4% | ||||||||
| Alimentation Couche-Tard, Inc., Class B (1) | 32,687 | 1,584,084 | ||||||
| Bank of Montreal (1) | 30,564 | 2,002,810 | ||||||
| Bank of Nova Scotia (The) (1) | 20,105 | 1,065,360 | ||||||
| Barrick Gold Corp. (1) | 33,652 | 595,858 | ||||||
| Brookfield Asset Management, Inc., Class A (1) | 6,089 | 214,098 | ||||||
| Canadian Imperial Bank of Commerce (1) | 17,851 | 1,384,185 | ||||||
| Canadian Tire Corp. Ltd., Class A (1) | 8,065 | 807,637 | ||||||
| CCL Industries, Inc., Class B (1) | 1,483 | 285,545 | ||||||
| CGI Group, Inc., Class A (1)* | 43,030 | 2,049,579 | ||||||
| Constellation Software, Inc. (1) | 2,940 | 1,325,336 | ||||||
| Dollarama, Inc. (1) | 5,101 | 398,259 | ||||||
| Empire Co. Ltd., Class A (1) | 6,750 | 100,688 | ||||||
| First Quantum Minerals Ltd. (1) | 218,088 | 1,805,279 | ||||||
| George Weston Ltd. (1) | 11,619 | 969,232 | ||||||
| Great-West Lifeco, Inc. (1) | 3,723 | 91,631 | ||||||
| Kinross Gold Corp. (1)* | 81,347 | 342,886 | ||||||
| Loblaw Cos. Ltd. (1) | 10,490 | 539,712 | ||||||
| Metro, Inc. (1) | 37,583 | 1,233,812 | ||||||
| National Bank of Canada (1) | 10,700 | 379,408 | ||||||
| Open Text Corp. (1) | 45,223 | 2,929,266 | ||||||
| Power Corp. of Canada (1) | 5,259 | 111,397 | ||||||
| Royal Bank of Canada (1) | 46,220 | 2,862,790 | ||||||
| INVESTMENTS | SHARES | VALUE | ||||||
| Canada - 7.4% (continued) | ||||||||
| Saputo, Inc. (1) | 30,459 | $ | 1,058,444 | |||||
| Seven Generations Energy Ltd., Class A (1)* | 28,937 | 696,544 | ||||||
| Sun Life Financial, Inc. (1) | 7,111 | 231,387 | ||||||
| Toronto-Dominion Bank (The) (1) | 60,966 | 2,706,399 | ||||||
|
| |||||||
| 27,771,626 | ||||||||
|
| |||||||
| China - 0.2% | ||||||||
| Yangzijiang Shipbuilding Holdings Ltd. | 1,046,500 | 578,910 | ||||||
|
| |||||||
| Denmark - 2.0% | ||||||||
| DSV A/S | 10,569 | 527,342 | ||||||
| Genmab A/S * | 7,097 | 1,214,672 | ||||||
| ISS A/S | 26,066 | 1,083,166 | ||||||
| Novo Nordisk A/S, Class B | 13,751 | 573,124 | ||||||
| Pandora A/S | 10,549 | 1,277,691 | ||||||
| Vestas Wind Systems A/S | 29,001 | 2,395,586 | ||||||
| William Demant Holding A/S * | 26,893 | 548,817 | ||||||
|
| |||||||
| 7,620,398 | ||||||||
|
| |||||||
| Finland - 1.3% | ||||||||
| Neste OYJ | 95,543 | 4,075,481 | ||||||
| Nokia OYJ | 143,842 | 833,759 | ||||||
|
| |||||||
| 4,909,240 | ||||||||
|
| |||||||
| France - 8.4% | ||||||||
| Airbus Group SE | 2,014 | 122,151 | ||||||
| Arkema SA | 4,649 | 430,415 | ||||||
| Atos SE | 21,348 | 2,298,297 | ||||||
| AXA SA | 43,757 | 930,369 | ||||||
| BNP Paribas SA | 63,329 | 3,257,238 | ||||||
| Capgemini SA | 13,576 | 1,331,038 | ||||||
| Cie Generale des Etablissements Michelin | 17,677 | 1,957,464 | ||||||
| CNP Assurances | 106,540 | 1,789,970 | ||||||
| L’Oreal SA | 11,261 | 2,128,436 | ||||||
| Orange SA | 69,702 | 1,092,060 | ||||||
| Peugeot SA * | 151,347 | 2,311,187 | ||||||
| Publicis Groupe SA | 3,929 | 297,299 | ||||||
| Renault SA | 25,849 | 2,126,577 | ||||||
| Sanofi | 10,370 | 789,685 | ||||||
| SCOR SE | 16,158 | 502,481 | ||||||
| Societe BIC SA | 800 | 118,280 | ||||||
| Societe Generale SA | 31,377 | 1,085,464 | ||||||
| Sodexo SA | 14,034 | 1,671,728 | ||||||
| Thales SA | 23,392 | 2,153,957 | ||||||
| TOTAL SA | 45,311 | 2,155,018 | ||||||
| Valeo SA | 24,231 | 1,414,334 | ||||||
| Veolia Environnement SA | 11,432 | 263,412 | ||||||
| Vinci SA | 17,817 | 1,364,397 | ||||||
|
| |||||||
| 31,591,257 | ||||||||
|
| |||||||
| Germany - 8.3% | ||||||||
| adidas AG | 14,559 | 2,532,167 | ||||||
| Allianz SE | 15,590 | 2,316,833 | ||||||
| Bayer AG | 6,683 | 671,176 | ||||||
| Continental AG | 5,365 | 1,130,412 | ||||||
| Covestro AG (a) | 9,313 | 551,126 | ||||||
| Deutsche Lufthansa AG | 248,047 | 2,765,316 | ||||||
| Deutsche Post AG | 24,027 | 752,249 | ||||||
| Deutsche Telekom AG | 135,625 | 2,278,570 | ||||||
| The accompanying notes are an integral part of these financial statements. | (Continued) |
| AQR Funds | Annual Report | September 2016 | ||||||||||||||
59
| Schedule of Investments | September 30, 2016 |
| AQR INTERNATIONAL MULTI-STYLE FUND |
| INVESTMENTS | SHARES | VALUE | ||||||
| Germany - 8.3% (continued) | ||||||||
| Fresenius SE & Co. KGaA | 9,490 | $ | 758,076 | |||||
| Hannover Rueck SE | 21,743 | 2,330,749 | ||||||
| HeidelbergCement AG | 12,100 | 1,144,319 | ||||||
| Infineon Technologies AG | 291,488 | 5,197,677 | ||||||
| METRO AG | 20,089 | 597,965 | ||||||
| Muenchener Rueckversicherungs-Gesellschaft AG in Muenchen | 17,358 | 3,241,884 | ||||||
| OSRAM Licht AG | 22,616 | 1,328,609 | ||||||
| SAP SE | 9,801 | 896,325 | ||||||
| Siemens AG | 19,873 | 2,330,314 | ||||||
| Vonovia SE | 11,443 | 433,795 | ||||||
|
| |||||||
| 31,257,562 | ||||||||
|
| |||||||
| Hong Kong - 3.2% | ||||||||
| BOC Hong Kong Holdings Ltd. | 250,500 | 852,302 | ||||||
| CK Hutchison Holdings Ltd. | 39,500 | 504,899 | ||||||
| CLP Holdings Ltd. | 144,000 | 1,491,417 | ||||||
| Hang Seng Bank Ltd. | 6,700 | 120,274 | ||||||
| Henderson Land Development Co. Ltd. | 61,904 | 369,367 | ||||||
| Hong Kong Exchanges and Clearing Ltd. | 28,400 | 751,616 | ||||||
| Link REIT | 26,000 | 191,934 | ||||||
| New World Development Co. Ltd. | 157,000 | 205,873 | ||||||
| NWS Holdings Ltd. | 129,000 | 216,179 | ||||||
| PCCW Ltd. | 269,000 | 165,681 | ||||||
| Sino Land Co. Ltd. | 228,000 | 406,371 | ||||||
| WH Group Ltd.(a) | 5,601,500 | 4,527,373 | ||||||
| Wharf Holdings Ltd. (The) | 23,000 | 168,741 | ||||||
| Wheelock & Co. Ltd. | 94,000 | 558,338 | ||||||
| Yue Yuen Industrial Holdings Ltd. | 414,500 | 1,713,064 | ||||||
|
| |||||||
| 12,243,429 | ||||||||
|
| |||||||
| Italy - 1.6% | ||||||||
| Enel SpA | 442,207 | 1,970,794 | ||||||
| Leonardo-Finmeccanica SpA * | 57,320 | 649,704 | ||||||
| Mediobanca SpA | 57,365 | 373,353 | ||||||
| Prysmian SpA | 57,843 | 1,514,647 | ||||||
| Snam SpA | 131,085 | 726,849 | ||||||
| Terna Rete Elettrica Nazionale SpA | 149,357 | 769,868 | ||||||
|
| |||||||
| 6,005,215 | ||||||||
|
| |||||||
| Japan - 20.9% | ||||||||
| Acom Co. Ltd. * | 10,000 | 47,145 | ||||||
| AEON Financial Service Co. Ltd. | 2,700 | 47,261 | ||||||
| Alfresa Holdings Corp. | 8,700 | 184,217 | ||||||
| Amada Holdings Co. Ltd. | 215,400 | 2,240,656 | ||||||
| Astellas Pharma, Inc. | 70,800 | 1,105,829 | ||||||
| Bandai Namco Holdings, Inc. | 18,300 | 560,128 | ||||||
| Bridgestone Corp. | 40,300 | 1,484,804 | ||||||
| Central Japan Railway Co. | 9,500 | 1,626,448 | ||||||
| Chubu Electric Power Co., Inc. | 90,800 | 1,321,183 | ||||||
| Concordia Financial Group Ltd. | 40,900 | 178,457 | ||||||
| Credit Saison Co. Ltd. | 16,800 | 278,918 | ||||||
| Daicel Corp. | 13,000 | 164,282 | ||||||
| Daiichi Sankyo Co. Ltd. | 74,200 | 1,782,909 | ||||||
| Daikin Industries Ltd. | 6,500 | 606,553 | ||||||
| Daiwa House Industry Co. Ltd. | 15,100 | 414,415 | ||||||
| Fuji Heavy Industries Ltd. | 153,600 | 5,762,994 | ||||||
| FUJIFILM Holdings Corp. | 14,500 | 537,122 | ||||||
| Hisamitsu Pharmaceutical Co., Inc. | 2,200 | 118,910 | ||||||
| INVESTMENTS | SHARES | VALUE | ||||||
| Japan - 20.9% (continued) | ||||||||
| Hitachi Chemical Co. Ltd. | 69,600 | $ | 1,599,193 | |||||
| Hitachi High-Technologies Corp. | 32,300 | 1,293,002 | ||||||
| Hoya Corp. | 14,900 | 599,395 | ||||||
| Idemitsu Kosan Co. Ltd. | 17,000 | 351,971 | ||||||
| Iida Group Holdings Co. Ltd. | 3,800 | 76,466 | ||||||
| ITOCHU Corp. | 145,200 | 1,828,005 | ||||||
| Japan Tobacco, Inc. | 27,100 | 1,109,345 | ||||||
| JTEKT Corp. | 53,100 | 797,562 | ||||||
| Kaneka Corp. | 59,000 | 467,129 | ||||||
| KDDI Corp. | 22,800 | 706,390 | ||||||
| Komatsu Ltd. | 19,000 | 435,845 | ||||||
| Konami Holdings Corp. | 80,700 | 3,118,274 | ||||||
| Kuraray Co. Ltd. | 15,600 | 231,426 | ||||||
| Kurita Water Industries Ltd. | 12,700 | 301,769 | ||||||
| Mazda Motor Corp. | 35,900 | 550,769 | ||||||
| Medipal Holdings Corp. | 17,700 | 306,814 | ||||||
| Mitsubishi Chemical Holdings Corp. | 83,800 | 525,376 | ||||||
| Mitsubishi Electric Corp. | 223,000 | 2,858,126 | ||||||
| Mitsubishi Estate Co. Ltd. | 31,000 | 581,764 | ||||||
| Mitsubishi Motors Corp. | 25,900 | 120,986 | ||||||
| Mitsubishi Tanabe Pharma Corp. | 49,300 | 1,055,929 | ||||||
| Mitsubishi UFJ Financial Group, Inc. | 340,300 | 1,723,989 | ||||||
| Mitsui Chemicals, Inc. | 334,000 | 1,588,755 | ||||||
| Mitsui Fudosan Co. Ltd. | 24,000 | 510,586 | ||||||
| Mixi, Inc. | 25,300 | 916,641 | ||||||
| Mizuho Financial Group, Inc. | 1,600,600 | 2,697,713 | ||||||
| Nexon Co. Ltd. | 76,000 | 1,193,853 | ||||||
| NHK Spring Co. Ltd. | 15,500 | 150,260 | ||||||
| Nikon Corp. | 161,900 | 2,417,856 | ||||||
| Nippon Telegraph & Telephone Corp. | 130,900 | 5,986,841 | ||||||
| Nitto Denko Corp. | 16,100 | 1,045,627 | ||||||
| Nomura Real Estate Holdings, Inc. | 8,000 | 135,227 | ||||||
| NSK Ltd. | 29,700 | 304,507 | ||||||
| NTT DOCOMO, Inc. | 35,400 | 899,267 | ||||||
| Obayashi Corp. | 48,300 | 479,077 | ||||||
| ORIX Corp. | 33,100 | 488,313 | ||||||
| Otsuka Holdings Co. Ltd. | 22,700 | 1,034,727 | ||||||
| Sekisui House Ltd. | 26,900 | 458,287 | ||||||
| Shin-Etsu Chemical Co. Ltd. | 13,500 | 941,933 | ||||||
| Shionogi & Co. Ltd. | 28,000 | 1,434,539 | ||||||
| Sompo Japan Nipponkoa Holdings, Inc. | 26,100 | 773,537 | ||||||
| Sumitomo Chemical Co. Ltd. | 25,000 | 111,085 | ||||||
| Sumitomo Dainippon Pharma Co. Ltd. | 64,300 | 1,245,408 | ||||||
| Sumitomo Mitsui Financial Group, Inc. | 75,400 | 2,546,983 | ||||||
| Sumitomo Mitsui Trust Holdings, Inc. | 5,600 | 182,961 | ||||||
| Suzuken Co. Ltd. | 17,100 | 564,651 | ||||||
| Suzuki Motor Corp. | 9,400 | 314,853 | ||||||
| TDK Corp. | 42,600 | 2,854,163 | ||||||
| Terumo Corp. | 4,200 | 161,556 | ||||||
| Tokyo Electric Power Co. Holdings, Inc. * | 197,500 | 855,552 | ||||||
| Tokyo Electron Ltd. | 15,400 | 1,361,113 | ||||||
| Toppan Printing Co. Ltd. | 31,000 | 279,835 | ||||||
| Toyo Seikan Group Holdings Ltd. | 4,200 | 74,253 | ||||||
| Toyota Motor Corp. | 41,400 | 2,401,467 | ||||||
| Yahoo Japan Corp. | 268,100 | 1,069,400 | ||||||
| Yamaha Corp. | 45,700 | 1,479,371 | ||||||
| Yamazaki Baking Co. Ltd. | 8,000 | 196,712 | ||||||
| Yokogawa Electric Corp. | 57,700 | 768,670 | ||||||
|
| |||||||
| 79,027,335 | ||||||||
|
| |||||||
| The accompanying notes are an integral part of these financial statements. | (Continued) |
| AQR Funds | Annual Report | September 2016 | ||||||||||||||
60
| Schedule of Investments | September 30, 2016 |
| AQR INTERNATIONAL MULTI-STYLE FUND |
| INVESTMENTS | SHARES | VALUE | ||||||
| Netherlands - 4.3% | ||||||||
| ASML Holding NV | 8,349 | $ | 914,975 | |||||
| ING Groep NV | 96,440 | 1,190,611 | ||||||
| Koninklijke Ahold NV * | 167,575 | 3,816,682 | ||||||
| Koninklijke Vopak NV | 3,001 | 157,393 | ||||||
| NN Group NV | 51,007 | 1,565,937 | ||||||
| Randstad Holding NV | 11,410 | 518,841 | ||||||
| Royal Dutch Shell plc, Class A | 51,719 | 1,286,661 | ||||||
| Royal Dutch Shell plc, Class B | 97,616 | 2,530,763 | ||||||
| Wolters Kluwer NV | 103,117 | 4,408,377 | ||||||
|
| |||||||
| 16,390,240 | ||||||||
|
| |||||||
| Singapore - 0.5% | ||||||||
| CapitaLand Commercial Trust Ltd., REIT | 273,500 | 319,871 | ||||||
| DBS Group Holdings Ltd. | 60,300 | 684,215 | ||||||
| Oversea-Chinese Banking Corp. Ltd. | 85,100 | 542,356 | ||||||
| United Overseas Bank Ltd. | 21,900 | 303,836 | ||||||
|
| |||||||
| 1,850,278 | ||||||||
|
| |||||||
| South Africa - 0.6% | ||||||||
| Investec plc | 230,142 | 1,402,891 | ||||||
| Mondi plc | 48,611 | 1,021,317 | ||||||
|
| |||||||
| 2,424,208 | ||||||||
|
| |||||||
| Spain - 2.9% | ||||||||
| Aena SA(a) | 32,293 | 4,766,766 | ||||||
| Banco de Sabadell SA | 364,449 | 466,907 | ||||||
| Banco Santander SA | 191,733 | 850,594 | ||||||
| Endesa SA | 27,385 | 587,127 | ||||||
| Gas Natural SDG SA | 11,618 | 238,844 | ||||||
| Grifols SA | 7,841 | 169,015 | ||||||
| Iberdrola SA | 260,889 | 1,773,890 | ||||||
| Industria de Diseno Textil SA | 47,775 | 1,771,396 | ||||||
| Repsol SA | 34,568 | 469,580 | ||||||
|
| |||||||
| 11,094,119 | ||||||||
|
| |||||||
| Sweden - 2.6% | ||||||||
| Assa Abloy AB, Class B | 40,564 | 823,760 | ||||||
| Hexagon AB, Class B | 49,816 | 2,175,545 | ||||||
| Husqvarna AB, Class B | 12,631 | 110,238 | ||||||
| Investor AB, Class B | 8,330 | 304,584 | ||||||
| Nordea Bank AB | 79,939 | 793,832 | ||||||
| Sandvik AB | 16,107 | 177,237 | ||||||
| Securitas AB, Class B | 163,119 | 2,731,755 | ||||||
| Skanska AB, Class B | 32,396 | 756,859 | ||||||
| Svenska Cellulosa AB SCA, Class B | 14,930 | 443,136 | ||||||
| Telefonaktiebolaget LM Ericsson, Class B | 74,353 | 536,850 | ||||||
| Volvo AB, Class B | 90,464 | 1,032,906 | ||||||
|
| |||||||
| 9,886,702 | ||||||||
|
| |||||||
| Switzerland - 8.5% | ||||||||
| ABB Ltd. * | 41,002 | 924,102 | ||||||
| Actelion Ltd. * | 13,431 | 2,330,736 | ||||||
| Baloise Holding AG | 3,204 | 387,947 | ||||||
| Coca-Cola HBC AG * | 33,552 | 779,465 | ||||||
| Galenica AG | 2,642 | 2,809,563 | ||||||
| Givaudan SA | 631 | 1,286,432 | ||||||
| Nestle SA | 55,405 | 4,375,005 | ||||||
| Novartis AG | 29,896 | 2,359,402 | ||||||
| Roche Holding AG | 24,574 | 6,106,605 | ||||||
| SGS SA | 640 | 1,434,096 | ||||||
| INVESTMENTS | SHARES | VALUE | ||||||
| Switzerland - 8.5% (continued) | ||||||||
| Sika AG | 188 | $ | 915,955 | |||||
| Swiss Life Holding AG * | 7,791 | 2,020,383 | ||||||
| Swiss Re AG | 45,001 | 4,064,420 | ||||||
| Syngenta AG | 2,276 | 996,757 | ||||||
| UBS Group AG | 93,438 | 1,276,406 | ||||||
|
| |||||||
| 32,067,274 | ||||||||
|
| |||||||
| United Kingdom - 14.8% | ||||||||
| 3i Group plc | 23,824 | 200,870 | ||||||
| Admiral Group plc | 12,335 | 327,384 | ||||||
| Ashtead Group plc | 6,649 | 109,272 | ||||||
| AstraZeneca plc | 4,834 | 313,011 | ||||||
| Auto Trader Group plc(a) | 127,653 | 671,068 | ||||||
| BAE Systems plc | 67,524 | 458,709 | ||||||
| Barclays plc | 182,556 | 395,785 | ||||||
| Barratt Developments plc | 425,246 | 2,722,439 | ||||||
| Berkeley Group Holdings plc | 20,460 | 683,645 | ||||||
| BP plc | 41,307 | 240,768 | ||||||
| British American Tobacco plc | 45,546 | 2,904,745 | ||||||
| British Land Co. plc (The), REIT | 80,014 | 655,389 | ||||||
| BT Group plc | 680,762 | 3,425,132 | ||||||
| Compass Group plc | 95,482 | 1,849,167 | ||||||
| Diageo plc | 6,622 | 189,678 | ||||||
| Direct Line Insurance Group plc | 508,473 | 2,401,892 | ||||||
| Dixons Carphone plc | 150,583 | 719,254 | ||||||
| Fiat Chrysler Automobiles NV | 256,749 | 1,631,949 | ||||||
| GlaxoSmithKline plc | 21,119 | 449,804 | ||||||
| Hammerson plc, REIT | 43,773 | 333,146 | ||||||
| HSBC Holdings plc | 694,601 | 5,221,155 | ||||||
| Imperial Brands plc | 25,501 | 1,312,553 | ||||||
| International Consolidated Airlines Group SA | 19,483 | 101,089 | ||||||
| Intertek Group plc | 31,611 | 1,427,043 | ||||||
| J Sainsbury plc | 41,134 | 131,014 | ||||||
| Kingfisher plc | 262,138 | 1,278,988 | ||||||
| Land Securities Group plc, REIT | 27,580 | 377,949 | ||||||
| Legal & General Group plc | 187,218 | 530,580 | ||||||
| Lloyds Banking Group plc | 4,300,690 | 3,038,505 | ||||||
| Marks & Spencer Group plc | 80,456 | 345,166 | ||||||
| National Grid plc | 177,198 | 2,502,538 | ||||||
| Old Mutual plc | 44,546 | 116,765 | ||||||
| Persimmon plc | 81,149 | 1,908,023 | ||||||
| Prudential plc | 87,891 | 1,558,014 | ||||||
| Reckitt Benckiser Group plc | 15,601 | 1,468,755 | ||||||
| RELX plc | 27,020 | 512,394 | ||||||
| Rio Tinto Ltd. | 10,260 | 408,148 | ||||||
| Royal Mail plc | 22,363 | 141,907 | ||||||
| SABMiller plc | 23,774 | 1,384,823 | ||||||
| Sage Group plc (The) | 137,032 | 1,309,293 | ||||||
| Segro plc, REIT | 105,872 | 622,006 | ||||||
| Sky plc | 119,129 | 1,380,719 | ||||||
| Standard Chartered plc * | 26,167 | 212,941 | ||||||
| Taylor Wimpey plc | 795,728 | 1,587,142 | ||||||
| Unilever plc | 31,184 | 1,475,630 | ||||||
| Vodafone Group plc | 212,804 | 610,306 | ||||||
| William Hill plc | 115,514 | 455,703 | ||||||
| Wm Morrison Supermarkets plc | 342,319 | 966,589 | ||||||
| WPP plc | 115,721 | 2,720,095 | ||||||
|
| |||||||
| 55,788,940 | ||||||||
|
| |||||||
| The accompanying notes are an integral part of these financial statements. | (Continued) |
| AQR Funds | Annual Report | September 2016 | ||||||||||||||
61
| Schedule of Investments | September 30, 2016 |
| AQR INTERNATIONAL MULTI-STYLE FUND |
| INVESTMENTS | SHARES | VALUE | ||||||
| United States - 0.6% | ||||||||
| Shire plc | 9,771 | $ | 631,824 | |||||
| Valeant Pharmaceuticals International, Inc. (1)* | 66,052 | 1,620,652 | ||||||
|
| |||||||
| 2,252,476 | ||||||||
|
| |||||||
TOTAL COMMON STOCKS | 360,913,938 | |||||||
|
| |||||||
| PREFERRED STOCK - 0.1% | ||||||||
| Germany - 0.1% | ||||||||
Henkel AG & Co. KGaA | 4,398 | 598,573 | ||||||
|
| |||||||
| SHORT-TERM INVESTMENT - 3.5% | ||||||||
| Investment Company - 3.5% | ||||||||
| J.P. Morgan U.S. Treasury Plus Money Market Fund - IM Shares, 0.22% | ||||||||
(cost $13,089,190) (b) | 13,089,190 | 13,089,190 | ||||||
|
| |||||||
TOTAL INVESTMENTS IN SECURITIES AT VALUE - 99.1% |
| 374,601,701 | ||||||
|
| |||||||
| OTHER ASSETS IN EXCESS OF LIABILITIES - 0.9% (c) | 3,471,754 | |||||||
|
| |||||||
NET ASSETS - 100.0% | 378,073,455 | |||||||
|
| |||||||
| SECTOR | VALUE | % OF NET ASSETS | ||||||
| Consumer Discretionary | $ | 57,582,390 | 15.2 | % | ||||
| Consumer Staples | 36,804,530 | 9.7 | ||||||
| Energy | 15,551,002 | 4.1 | ||||||
| Financials | 71,694,941 | 19.0 | ||||||
| Health Care | 32,826,730 | 8.7 | ||||||
| Industrials | 52,651,271 | 14.0 | ||||||
| Information Technology | 35,581,247 | 9.4 | ||||||
| Materials | 21,548,530 | 5.7 | ||||||
| Real Estate | 8,873,030 | 2.3 | ||||||
| Telecommunication Services | 15,897,368 | 4.2 | ||||||
| Utilities | 12,501,472 | 3.3 | ||||||
| Short-Term Investment | 13,089,190 | 3.5 | ||||||
|
|
|
| |||||
Total Investments In Securities At Value | 374,601,701 | 99.1 | ||||||
| Other Assets in Excess of Liabilities(c) | 3,471,754 | 0.9 | ||||||
|
|
|
| |||||
Net Assets | $ | 378,073,455 | 100.0 | % | ||||
|
|
|
| |||||
| * | Non-income producing security. |
| (a) | Securities exempt from registration under Rule 144A or section 4(2), of the Securities Act of 1933. Under procedures approved by the Board of Trustees, such securities have been determined to be liquid by the investment adviser and may be resold, normally to qualified institutional buyers in transactions exempt from registration. Total value of all such securities at 9/30/2016 amounted to $10,516,333, which represents approximately 2.78% of net assets of the fund. |
| (b) | Represents 7-day effective yield as of 9/30/2016. |
| (c) | Includes appreciation/(depreciation) on futures contracts. |
All securities are Level 2 with respect to ASC 820, unless otherwise noted in parentheses.
| (1) | Level 1 security (See Note 4). |
Abbreviations
OYJ - Public Traded Company
REIT - Real Estate Investment Trust
SCA - Limited partnership with share capital
Open futures contracts outstanding at September 30, 2016:
Exchange Traded
| NUMBER OF CONTRACTS | COUNTERPARTY | DESCRIPTION | EXPIRATION DATE | VALUE AT TRADE DATE | VALUE AT SEPTEMBER 30, 2016 | UNREALIZED APPRECIATION (DEPRECIATION) | ||||||||||||||
| Long Contracts: | ||||||||||||||||||||
| 144 | JPMS | E-Mini MSCI EAFE Index Futures | 12/2016 | $12,210,650 | $12,288,240 | $77,590 | ||||||||||||||
|
|
|
|
|
| |||||||||||||||
Collateral pledged to, or (received from), each counterparty at September 30, 2016 was as follows:
| COUNTERPARTY | OVER THE COUNTER | EXCHANGE TRADED | TOTAL | |||||||||
| JPMS | ||||||||||||
| Cash | $— | $636,916 | $636,916 | |||||||||
| ||||||||||||
| The accompanying notes are an integral part of these financial statements. |
| AQR Funds | Annual Report | September 2016 | ||||||||||||||
62
| Schedule of Investments | September 30, 2016 |
| AQR EMERGING MULTI-STYLE FUND |
| INVESTMENTS | SHARES | VALUE | ||||||
| COMMON STOCKS - 94.5% | ||||||||
| Brazil - 5.8% | ||||||||
| Ambev SA, ADR (1) | 18,000 | $ | 109,620 | |||||
| Banco Bradesco SA, ADR (1) | 352,551 | 3,197,638 | ||||||
| Banco Santander Brasil SA, ADR (1) | 18,868 | 126,416 | ||||||
| BM&FBovespa SA - Bolsa de Valores Mercadorias e Futuros (1) | 183,800 | 955,128 | ||||||
| Cia de Saneamento Basico do Estado de Sao Paulo, ADR (1) | 118,424 | 1,096,606 | ||||||
| Cia Paranaense de Energia, ADR (1) | 21,579 | 223,774 | ||||||
| EDP - Energias do Brasil SA (1) | 113,400 | 500,722 | ||||||
| Equatorial Energia SA (1) | 69,200 | 1,084,551 | ||||||
| Hypermarcas SA (1) | 4,200 | 36,329 | ||||||
| Itau Unibanco Holding SA, ADR (1) | 177,223 | 1,938,820 | ||||||
| JBS SA (1) | 873,100 | 3,173,298 | ||||||
| Kroton Educacional SA (1) | 233,600 | 1,070,258 | ||||||
| Lojas Renner SA (1) | 3,400 | 25,687 | ||||||
| M Dias Branco SA (1) | 3,700 | 152,066 | ||||||
| Natura Cosmeticos SA (1) | 11,000 | 106,410 | ||||||
| Porto Seguro SA (1) | 44,800 | 413,127 | ||||||
| Qualicorp SA (1) | 72,300 | 425,510 | ||||||
| Raia Drogasil SA (1) | 9,800 | 201,475 | ||||||
| Sul America SA (1) | 12,600 | 62,842 | ||||||
| Telefonica Brasil SA, ADR (1) | 8,329 | 120,521 | ||||||
| TIM Participacoes SA, ADR (1) | 25,007 | 306,086 | ||||||
| Transmissora Alianca de Energia Eletrica SA (1) | 18,700 | 120,233 | ||||||
|
| |||||||
| 15,447,117 | ||||||||
|
| |||||||
| Chile - 1.2% | ||||||||
| Banco Santander Chile, ADR (1) | 20,889 | 432,193 | ||||||
| Cencosud SA (1) | 545,113 | 1,637,432 | ||||||
| Cia Cervecerias Unidas SA, ADR (1) | 9,318 | 188,131 | ||||||
| Empresa Nacional de Electricidad SA, ADR (1) | 1,100 | 21,824 | ||||||
| Enersis Americas SA, ADR (1) | 27,333 | 223,857 | ||||||
| Enersis Chile SA, ADR (1) | 47,158 | 224,001 | ||||||
| Itau CorpBanca (1) | 22,467,384 | 197,983 | ||||||
| Latam Airlines Group SA, ADR (1)* | 26,649 | 216,390 | ||||||
| Sociedad Quimica y Minera de Chile SA, ADR (1) | 3,206 | 86,241 | ||||||
|
| |||||||
| 3,228,052 | ||||||||
|
| |||||||
| China - 26.2% | ||||||||
| 58.com, Inc., ADR (1)*(a) | 4,817 | 229,578 | ||||||
| Agricultural Bank of China Ltd., Class H | 2,213,000 | 954,548 | ||||||
| Air China Ltd., Class H | 816,000 | 551,605 | ||||||
| Alibaba Group Holding Ltd., ADR (1)* | 67,225 | 7,111,733 | ||||||
| Baidu, Inc., ADR (1)* | 16,444 | 2,993,959 | ||||||
| Bank of China Ltd., Class H | 2,166,000 | 1,000,267 | ||||||
| Bank of Communications Co. Ltd., Class H | 651,000 | 500,716 | ||||||
| Beijing Capital International Airport Co. Ltd., Class H | 100,000 | 113,993 | ||||||
| Belle International Holdings Ltd. | 997,000 | 690,302 | ||||||
| China Cinda Asset Management Co. Ltd., Class H | 400,000 | 142,458 | ||||||
| China CITIC Bank Corp. Ltd., Class H | 1,489,000 | 995,960 | ||||||
| China Communications Services Corp. Ltd., Class H | 1,146,000 | 719,314 | ||||||
| China Construction Bank Corp., Class H | 5,674,000 | 4,261,392 | ||||||
| INVESTMENTS | SHARES | VALUE | ||||||
| China - 26.2% (continued) | ||||||||
| China Everbright Bank Co. Ltd., Class H | 1,602,000 | $ | 750,288 | |||||
| China Galaxy Securities Co. Ltd., Class H | 1,695,500 | 1,559,461 | ||||||
| China Jinmao Holdings Group Ltd. | 310,000 | 96,215 | ||||||
| China Merchants Bank Co. Ltd., Class H | 638,000 | 1,622,456 | ||||||
| China Minsheng Banking Corp. Ltd., Class H | 657,500 | 763,832 | ||||||
| China Mobile Ltd. | 522,175 | 6,414,590 | ||||||
| China Overseas Land & Investment Ltd. | 380,000 | 1,306,438 | ||||||
| China Petroleum & Chemical Corp., Class H | 638,000 | 471,010 | ||||||
| China Railway Construction Corp. Ltd., Class H (a) | 261,000 | 299,071 | ||||||
| China Resources Land Ltd. | 290,000 | 817,627 | ||||||
| China Southern Airlines Co. Ltd., Class H | 2,200,000 | 1,241,035 | ||||||
| China Telecom Corp. Ltd., Class H | 2,548,000 | 1,299,899 | ||||||
| China Vanke Co. Ltd., Class H | 214,000 | 559,471 | ||||||
| Chongqing Rural Commercial Bank Co. Ltd., Class H | 1,586,000 | 983,584 | ||||||
| CNOOC Ltd., ADR (1) | 6,972 | 881,888 | ||||||
| Country Garden Holdings Co. Ltd. | 1,591,000 | 845,361 | ||||||
| Ctrip.com International Ltd., ADR (1)* | 20,700 | 963,999 | ||||||
| Dongfeng Motor Group Co. Ltd., Class H | 124,000 | 125,048 | ||||||
| Evergrande Real Estate Group Ltd. | 585,000 | 399,748 | ||||||
| Far East Horizon Ltd. | 234,000 | 222,603 | ||||||
| Geely Automobile Holdings Ltd. | 4,450,000 | 4,007,004 | ||||||
| Great Wall Motor Co. Ltd., Class H | 1,324,500 | 1,302,452 | ||||||
| Industrial & Commercial Bank of China Ltd., Class H | 5,118,000 | 3,248,245 | ||||||
| JD.com, Inc., ADR (1)*(a) | 41,989 | 1,095,493 | ||||||
| Kingsoft Corp. Ltd. (a) | 104,000 | 248,477 | ||||||
| Kunlun Energy Co. Ltd. | 184,000 | 142,236 | ||||||
| Longfor Properties Co. Ltd. | 498,000 | 769,322 | ||||||
| NetEase, Inc., ADR (1) | 4,926 | 1,186,082 | ||||||
| New Oriental Education & Technology Group, Inc., ADR (1)* | 7,867 | 364,714 | ||||||
| People’s Insurance Co. Group of China Ltd. (The), Class H | 1,986,000 | 817,939 | ||||||
| PICC Property & Casualty Co. Ltd., Class H | 1,436,000 | 2,407,556 | ||||||
| Ping An Insurance Group Co. of China Ltd., Class H | 113,000 | 592,367 | ||||||
| Shui On Land Ltd. | 865,500 | 236,528 | ||||||
| Sino-Ocean Land Holdings Ltd. | 36,500 | 16,945 | ||||||
| Sinopec Engineering Group Co. Ltd., Class H | 500,500 | 433,638 | ||||||
| Sinopec Shanghai Petrochemical Co. Ltd., Class H | 2,810,000 | 1,426,990 | ||||||
| Sinopharm Group Co. Ltd., Class H | 274,000 | 1,327,072 | ||||||
| Sinotrans Ltd., Class H | 904,000 | 441,721 | ||||||
| Tencent Holdings Ltd. | 209,100 | 5,813,406 | ||||||
| TravelSky Technology Ltd., Class H | 496,000 | 1,183,856 | ||||||
| Vipshop Holdings Ltd., ADR (1)* | 24,408 | 358,065 | ||||||
| Weichai Power Co. Ltd., Class H | 193,000 | 260,410 | ||||||
|
| |||||||
| 69,569,967 | ||||||||
|
| |||||||
| Hong Kong - 0.4% | ||||||||
| Nine Dragons Paper Holdings Ltd. | 937,000 | 883,533 | ||||||
| Sino Biopharmaceutical Ltd. | 35,000 | 23,675 | ||||||
| The accompanying notes are an integral part of these financial statements. | (Continued) |
| AQR Funds | Annual Report | September 2016 | ||||||||||||||
63
| Schedule of Investments | September 30, 2016 |
| AQR EMERGING MULTI-STYLE FUND |
| INVESTMENTS | SHARES | VALUE | ||||||
| Hong Kong - 0.4% (continued) | ||||||||
| Sun Art Retail Group Ltd. (a) | 203,000 | $ | 140,409 | |||||
|
| |||||||
| 1,047,617 | ||||||||
|
| |||||||
| Hungary - 0.3% | ||||||||
| MOL Hungarian Oil & Gas plc | 5,533 | 342,783 | ||||||
| OTP Bank plc | 3,687 | 96,864 | ||||||
| Richter Gedeon Nyrt | 13,143 | 267,100 | ||||||
|
| |||||||
| 706,747 | ||||||||
|
| |||||||
| India - 7.5% | ||||||||
| Axis Bank Ltd., GDR | 2,717 | 109,263 | ||||||
| Dr. Reddy’s Laboratories Ltd., ADR (1)(a) | 64,481 | 2,993,208 | ||||||
| ICICI Bank Ltd., ADR (1) | 223,929 | 1,672,749 | ||||||
| Infosys Ltd., ADR (1) | 414,717 | 6,544,234 | ||||||
| Reliance Industries Ltd., GDR (b) | 27,868 | 914,287 | ||||||
| State Bank of India, GDR | 21,014 | 782,340 | ||||||
| Tata Motors Ltd., ADR (1) | 148,913 | 5,953,542 | ||||||
| Wipro Ltd., ADR (1)(a) | 102,652 | 996,751 | ||||||
|
| |||||||
| 19,966,374 | ||||||||
|
| |||||||
| Indonesia - 3.1% | ||||||||
| Adaro Energy Tbk. PT | 1,100,500 | 102,123 | ||||||
| Bank Central Asia Tbk. PT | 386,000 | 465,581 | ||||||
| Bank Mandiri Persero Tbk. PT | 397,900 | 343,317 | ||||||
| Bank Rakyat Indonesia Persero Tbk. PT | 906,500 | 850,603 | ||||||
| Gudang Garam Tbk. PT | 202,600 | 964,056 | ||||||
| Indofood CBP Sukses Makmur Tbk. PT | 127,900 | 93,094 | ||||||
| Indofood Sukses Makmur Tbk. PT | 598,400 | 400,201 | ||||||
| Telekomunikasi Indonesia Persero Tbk. PT | 11,539,500 | 3,842,511 | ||||||
| United Tractors Tbk. PT | 724,900 | 987,622 | ||||||
| Waskita Karya Persero Tbk. PT | 824,900 | 165,981 | ||||||
|
| |||||||
| 8,215,089 | ||||||||
|
| |||||||
| Korea, Republic of - 14.9% | ||||||||
| AMOREPACIFIC Group | 1,259 | 190,218 | ||||||
| CJ Corp. | 999 | 169,625 | ||||||
| Daelim Industrial Co. Ltd. | 7,804 | 590,973 | ||||||
| Dongbu Insurance Co. Ltd. | 6,868 | 426,984 | ||||||
| Hana Financial Group, Inc. | 9,954 | 253,418 | ||||||
| Hankook Tire Co. Ltd. | 8,612 | 465,620 | ||||||
| Hanmi Pharm Co. Ltd. | 2,036 | 946,028 | ||||||
| Hanwha Chemical Corp. | 74,851 | 1,658,019 | ||||||
| Hanwha Corp. | 19,542 | 625,594 | ||||||
| Hyundai Engineering & Construction Co. Ltd. | 8,651 | 311,327 | ||||||
| Hyundai Heavy Industries Co. Ltd. * | 6,884 | 870,357 | ||||||
| Hyundai Marine & Fire Insurance Co. Ltd. | 43,670 | 1,441,737 | ||||||
| Hyundai Mobis Co. Ltd. | 5,043 | 1,265,572 | ||||||
| Kangwon Land, Inc. | 2,147 | 76,719 | ||||||
| KB Financial Group, Inc. | 28,012 | 963,472 | ||||||
| Kia Motors Corp. | 4,427 | 170,094 | ||||||
| Korea Electric Power Corp. | 57,385 | 2,811,074 | ||||||
| KT Corp. | 9,941 | 288,447 | ||||||
| KT&G Corp. | 7,195 | 819,362 | ||||||
| LG Corp. | 4,009 | 236,914 | ||||||
| LG Uplus Corp. | 97,273 | 1,040,293 | ||||||
| Lotte Chemical Corp. | 7,747 | 2,111,773 | ||||||
| POSCO | 615 | 127,470 | ||||||
| Posco Daewoo Corp. | 25,697 | 577,623 | ||||||
| INVESTMENTS | SHARES | VALUE | ||||||
| Korea, Republic of - 14.9% (continued) | ||||||||
| S-1 Corp. | 1,090 | $ | 100,702 | |||||
| Samsung Card Co. Ltd. | 2,008 | 91,729 | ||||||
| Samsung Electronics Co. Ltd. | 8,374 | 12,198,928 | ||||||
| Shinhan Financial Group Co. Ltd. | 40,656 | 1,489,012 | ||||||
| SK Innovation Co. Ltd. | 31,521 | 4,670,376 | ||||||
| SK Telecom Co. Ltd. | 1,541 | 315,968 | ||||||
| S-Oil Corp. | 13,643 | 1,013,751 | ||||||
| Woori Bank | 115,423 | 1,199,719 | ||||||
|
| |||||||
| 39,518,898 | ||||||||
|
| |||||||
| Malaysia - 2.5% | ||||||||
| AirAsia Bhd. | 4,606,492 | 3,112,874 | ||||||
| Genting Bhd. | 85,200 | 163,546 | ||||||
| IHH Healthcare Bhd. | 222,700 | 341,092 | ||||||
| Malayan Banking Bhd. | 237,800 | 431,637 | ||||||
| MISC Bhd. | 171,700 | 313,565 | ||||||
| Public Bank Bhd. | 184,200 | 883,232 | ||||||
| Tenaga Nasional Bhd. | 291,300 | 1,007,593 | ||||||
| YTL Corp. Bhd. | 994,100 | 430,341 | ||||||
|
| |||||||
| 6,683,880 | ||||||||
|
| |||||||
| Mexico - 4.0% | ||||||||
| Alfa SAB de CV, Class A (1) | 55,700 | 86,926 | ||||||
| America Movil SAB de CV, Class L, ADR (1) | 8,700 | 99,528 | ||||||
| Cemex SAB de CV, ADR (1)* | 95,613 | 759,167 | ||||||
| Coca-Cola Femsa SAB de CV, ADR (1) | 1,177 | 88,275 | ||||||
| Fomento Economico Mexicano SAB de CV, ADR (1) | 7,841 | 721,686 | ||||||
| Gentera SAB de CV (1) | 228,500 | 411,282 | ||||||
| Gruma SAB de CV, Class B (1) | 108,555 | 1,427,301 | ||||||
| Grupo Aeroportuario del Pacifico SAB de CV, Class B (1) | 95,800 | 909,642 | ||||||
| Grupo Aeroportuario del Sureste SAB de CV, ADR (1) | 1,728 | 253,014 | ||||||
| Grupo Bimbo SAB de CV, Series A (1) | 114,500 | 301,814 | ||||||
| Grupo Financiero Banorte SAB de CV, Class O (1) | 236,300 | 1,239,159 | ||||||
| Grupo Financiero Santander Mexico SAB de CV, Class B, ADR (1) | 94,209 | 829,039 | ||||||
| Grupo Lala SAB de CV (1) | 474,300 | 903,359 | ||||||
| Grupo Mexico SAB de CV, Series B (1) | 60,100 | 146,858 | ||||||
| Grupo Televisa SAB, ADR (1) | 27,366 | 703,032 | ||||||
| Kimberly-Clark de Mexico SAB de CV, Class A (1) | 441,400 | 998,456 | ||||||
| OHL Mexico SAB de CV (1)* | 367,300 | 487,214 | ||||||
| Promotora y Operadora de Infraestructura SAB de CV (1) | 14,125 | 151,560 | ||||||
|
| |||||||
| 10,517,312 | ||||||||
|
| |||||||
| Peru - 0.2% | ||||||||
| Credicorp Ltd. (1) | 3,587 | 546,013 | ||||||
|
| |||||||
| Philippines - 0.8% | ||||||||
| Ayala Corp. | 12,620 | 223,598 | ||||||
| Bank of the Philippine Islands | 56,900 | 123,262 | ||||||
| BDO Unibank, Inc. | 55,070 | 124,910 | ||||||
| Globe Telecom, Inc. | 16,480 | 695,775 | ||||||
| JG Summit Holdings, Inc. | 305,970 | 471,085 | ||||||
| The accompanying notes are an integral part of these financial statements. | (Continued) |
| AQR Funds | Annual Report | September 2016 | ||||||||||||||
64
| Schedule of Investments | September 30, 2016 |
| AQR EMERGING MULTI-STYLE FUND |
| INVESTMENTS | SHARES | VALUE | ||||||
| Philippines - 0.8% (continued) | ||||||||
| Jollibee Foods Corp. | 15,650 | $ | 79,791 | |||||
| Metropolitan Bank & Trust Co. | 62,860 | 110,773 | ||||||
| PLDT, Inc. | 775 | 27,412 | ||||||
| Security Bank Corp. | 29,520 | 147,337 | ||||||
| SM Investments Corp. | 9,450 | 131,605 | ||||||
| Universal Robina Corp. | 32,770 | 120,600 | ||||||
|
| |||||||
| 2,256,148 | ||||||||
|
| |||||||
| Poland - 1.5% | ||||||||
| Bank Pekao SA | 4,603 | 149,033 | ||||||
| Bank Zachodni WBK SA | 2,624 | 213,609 | ||||||
| Cyfrowy Polsat SA * | 15,529 | 99,522 | ||||||
| Enea SA * | 5,114 | 11,391 | ||||||
| Energa SA | 14,030 | 27,542 | ||||||
| Eurocash SA | 102,315 | 1,137,952 | ||||||
| Grupa Azoty SA | 14,632 | 235,874 | ||||||
| Grupa Lotos SA * | 13,624 | 101,466 | ||||||
| PGE Polska Grupa Energetyczna SA | 59,714 | 158,643 | ||||||
| Polski Koncern Naftowy ORLEN SA | 60,274 | 1,025,091 | ||||||
| Polskie Gornictwo Naftowe i Gazownictwo SA | 506,328 | 669,129 | ||||||
| Tauron Polska Energia SA * | 154,667 | 105,243 | ||||||
|
| |||||||
| 3,934,495 | ||||||||
|
| |||||||
| Russia - 3.4% | ||||||||
| Gazprom PJSC, ADR (1) | 350,088 | 1,480,872 | ||||||
| Lukoil PJSC, ADR | 29,278 | 1,427,680 | ||||||
| Mobile TeleSystems PJSC, ADR (1) | 273,002 | 2,083,005 | ||||||
| Novatek OJSC, GDR | 5,239 | 577,521 | ||||||
| Rosneft OJSC, GDR | 68,272 | 373,439 | ||||||
| Severstal PJSC, GDR | 34,296 | 413,863 | ||||||
| Surgutneftegas OJSC, ADR (1) | 88,464 | 428,166 | ||||||
| Tatneft PJSC, ADR (1) | 72,259 | 2,229,913 | ||||||
|
| |||||||
| 9,014,459 | ||||||||
|
| |||||||
| South Africa - 6.5% | ||||||||
| AngloGold Ashanti Ltd., ADR (1)* | 24,357 | 387,763 | ||||||
| Barloworld Ltd. | 12,490 | 75,634 | ||||||
| Bid Corp. Ltd. | 19,957 | 377,214 | ||||||
| Bidvest Group Ltd. (The) | 163,770 | 1,931,021 | ||||||
| Brait SE * | 165,928 | 1,334,565 | ||||||
| Capitec Bank Holdings Ltd. | 10,795 | 505,844 | ||||||
| Exxaro Resources Ltd. | 32,768 | 201,447 | ||||||
| Gold Fields Ltd., ADR (1) | 24,457 | 118,616 | ||||||
| Hyprop Investments Ltd., REIT | 89,153 | 786,468 | ||||||
| Imperial Holdings Ltd. | 50,583 | 617,644 | ||||||
| Investec Ltd. | 215,765 | 1,324,437 | ||||||
| Liberty Holdings Ltd. | 9,745 | 82,793 | ||||||
| Massmart Holdings Ltd. | 7,981 | 68,981 | ||||||
| Mondi Ltd. | 42,353 | 889,921 | ||||||
| Naspers Ltd., Class N | 24,126 | 4,175,557 | ||||||
| Pick n Pay Stores Ltd. | 144,629 | 725,254 | ||||||
| Redefine Properties Ltd., REIT | 130,202 | 108,637 | ||||||
| Remgro Ltd. | 28,077 | 469,836 | ||||||
| Resilient REIT Ltd. | 80,551 | 673,928 | ||||||
| Sanlam Ltd. | 40,715 | 189,725 | ||||||
| Sappi Ltd. * | 67,977 | 352,099 | ||||||
| Sasol Ltd. | 9,492 | 259,327 | ||||||
| Sibanye Gold Ltd., ADR (1) | 30,193 | 426,627 | ||||||
| INVESTMENTS | SHARES | VALUE | ||||||
| South Africa - 6.5% (continued) | ||||||||
| Standard Bank Group Ltd. | 43,145 | $ | 443,330 | |||||
| Telkom SA SOC Ltd. | 92,114 | 406,140 | ||||||
| Truworths International Ltd. | 73,133 | 379,031 | ||||||
|
| |||||||
| 17,311,839 | ||||||||
|
| |||||||
| Taiwan - 12.0% | ||||||||
| Advanced Semiconductor Engineering, Inc. | 125,000 | 150,120 | ||||||
| Asustek Computer, Inc. | 4,000 | 35,756 | ||||||
| AU Optronics Corp. | 219,000 | 80,396 | ||||||
| Casetek Holdings Ltd. | 227,000 | 831,083 | ||||||
| Catcher Technology Co. Ltd. | 224,000 | 1,832,885 | ||||||
| Cathay Financial Holding Co. Ltd. | 133,000 | 171,007 | ||||||
| Chailease Holding Co. Ltd. | 94,240 | 167,836 | ||||||
| Chicony Electronics Co. Ltd. | 44,872 | 113,808 | ||||||
| China Airlines Ltd. | 1,152,000 | 344,150 | ||||||
| China Life Insurance Co. Ltd. | 1,327,560 | 1,219,556 | ||||||
| Compal Electronics, Inc. | 824,000 | 510,176 | ||||||
| CTBC Financial Holding Co. Ltd. | 778,259 | 453,648 | ||||||
| E.Sun Financial Holding Co. Ltd. | 1,098,900 | 627,948 | ||||||
| Eva Airways Corp. | 307,650 | 140,587 | ||||||
| Far EasTone Telecommunications Co. Ltd. | 145,000 | 342,843 | ||||||
| Feng TAY Enterprise Co. Ltd. | 104,014 | 462,824 | ||||||
| First Financial Holding Co. Ltd. | 97,000 | 51,658 | ||||||
| Foxconn Technology Co. Ltd. | 536,929 | 1,583,205 | ||||||
| Fubon Financial Holding Co. Ltd. | 649,000 | 964,352 | ||||||
| Hon Hai Precision Industry Co. Ltd. | 1,241,493 | 3,141,800 | ||||||
| Inventec Corp. | 563,000 | 462,180 | ||||||
| Largan Precision Co. Ltd. | 5,000 | 609,382 | ||||||
| Lite-On Technology Corp. | 559,410 | 808,755 | ||||||
| MediaTek, Inc. | 15,000 | 115,169 | ||||||
| Mega Financial Holding Co. Ltd. | 450,000 | 317,433 | ||||||
| Nien Made Enterprise Co. Ltd. | 19,000 | 245,699 | ||||||
| Novatek Microelectronics Corp. | 28,000 | 99,211 | ||||||
| Pegatron Corp. | 197,000 | 509,837 | ||||||
| Pou Chen Corp. | 1,000,000 | 1,412,964 | ||||||
| Powertech Technology, Inc. | 538,000 | 1,398,214 | ||||||
| Radiant Opto-Electronics Corp. | 8,000 | 13,078 | ||||||
| Realtek Semiconductor Corp. | 171,000 | 564,367 | ||||||
| Shin Kong Financial Holding Co. Ltd. * | 161,000 | 35,520 | ||||||
| SinoPac Financial Holdings Co. Ltd. | 479,683 | 142,009 | ||||||
| Taishin Financial Holding Co. Ltd. | 285,025 | 106,348 | ||||||
| Taiwan Fertilizer Co. Ltd. | 46,000 | 61,764 | ||||||
| Taiwan Semiconductor Manufacturing Co. Ltd., ADR (1) | 275,930 | 8,440,699 | ||||||
| Uni-President Enterprises Corp. | 776,000 | 1,460,052 | ||||||
| United Microelectronics Corp. | 1,897,000 | 700,500 | ||||||
| Wistron Corp. | 832,402 | 620,855 | ||||||
| WPG Holdings Ltd. | 129,000 | 153,049 | ||||||
| Zhen Ding Technology Holding Ltd. | 126,000 | 278,248 | ||||||
|
| |||||||
| 31,780,971 | ||||||||
|
| |||||||
| Thailand - 2.6% | ||||||||
| Airports of Thailand PCL, NVDR | 35,800 | 412,879 | ||||||
| Bangkok Bank PCL, NVDR | 119,400 | 562,087 | ||||||
| Bumrungrad Hospital PCL, NVDR | 5,200 | 26,245 | ||||||
| Charoen Pokphand Foods PCL, NVDR | 1,689,200 | 1,552,777 | ||||||
| Delta Electronics Thailand PCL, NVDR | 11,800 | 27,060 | ||||||
| Home Product Center PCL, NVDR | 968,800 | 280,400 | ||||||
| The accompanying notes are an integral part of these financial statements. | (Continued) |
| AQR Funds | Annual Report | September 2016 | ||||||||||||||
65
| Schedule of Investments | September 30, 2016 |
| AQR EMERGING MULTI-STYLE FUND |
| INVESTMENTS | SHARES | VALUE | ||||||
| Thailand - 2.6% (continued) | ||||||||
| IRPC PCL, NVDR | 1,489,700 | $ | 210,428 | |||||
| Kasikornbank PCL, NVDR | 24,100 | 130,857 | ||||||
| Krung Thai Bank PCL, NVDR | 257,900 | 131,460 | ||||||
| PTT Exploration & Production PCL, NVDR | 167,300 | 393,557 | ||||||
| PTT Global Chemical PCL, NVDR | 341,900 | 582,731 | ||||||
| PTT PCL, NVDR | 17,100 | 168,279 | ||||||
| Robinson Department Store PCL, NVDR | 41,400 | 72,757 | ||||||
| Thai Oil PCL, NVDR | 693,100 | 1,374,229 | ||||||
| Thai Union Group PCL, NVDR | 1,728,304 | 1,069,982 | ||||||
|
| |||||||
| 6,995,728 | ||||||||
|
| |||||||
| Turkey - 1.6% | ||||||||
| Akbank TAS | 65,967 | 176,721 | ||||||
| Arcelik A/S | 280,879 | 1,976,778 | ||||||
| Petkim Petrokimya Holding A/S | 280,344 | 424,985 | ||||||
| Turkiye Sise ve Cam Fabrikalari A/S | 858,471 | 909,778 | ||||||
| Turkiye Vakiflar Bankasi TAO, Class D | 344,095 | 526,382 | ||||||
| Yapi ve Kredi Bankasi A/S * | 206,250 | 252,152 | ||||||
|
| |||||||
| 4,266,796 | ||||||||
|
| |||||||
TOTAL COMMON STOCKS | 251,007,502 | |||||||
|
| |||||||
| PREFERRED STOCKS - 1.9% | ||||||||
| Brazil - 1.8% | ||||||||
| Braskem SA, Class A (1) | 312,800 | 2,412,258 | ||||||
| Centrais Eletricas Brasileiras SA, Class B (1)* | 164,000 | 1,211,285 | ||||||
| Gerdau SA (1) | 54,400 | 149,543 | ||||||
| Itausa - Investimentos Itau SA (1) | 215,941 | 556,427 | ||||||
| Petroleo Brasileiro SA (1)* | 92,800 | 390,929 | ||||||
|
| |||||||
| 4,720,442 | ||||||||
|
| |||||||
| Chile - 0.1% | ||||||||
| Embotelladora Andina SA, Series B (1) | 47,433 | 181,675 | ||||||
|
| |||||||
TOTAL PREFERRED STOCKS |
| 4,902,117 | ||||||
|
| |||||||
| SHORT-TERM INVESTMENT - 3.9% | ||||||||
| Investment Company - 3.9% | ||||||||
| J.P. Morgan U.S. Treasury Plus Money Market Fund - IM Shares, 0.22% | ||||||||
(cost $10,327,810) (c) | 10,327,810 | 10,327,810 | ||||||
|
| |||||||
| SECURITIES LENDING COLLATERAL - 1.6% | ||||||||
| Money Market Funds - 1.6% | ||||||||
| Investments in a Pooled Account through Securities Lending Program with JPMorgan Chase Bank | ||||||||
| Dreyfus Treasury & Agency Cash | ||||||||
Management, 0.21% | 4,314,790 | 4,314,790 | ||||||
|
| |||||||
TOTAL INVESTMENTS IN SECURITIES AT VALUE - 101.9% |
| 270,552,219 | ||||||
|
| |||||||
| LIABILITIES IN EXCESS OF OTHER ASSETS - (1.9)% (e) | (5,047,639) | |||||||
|
| |||||||
NET ASSETS - 100.0% |
| 265,504,580 | ||||||
|
| |||||||
| SECTOR | VALUE | % OF NET ASSETS | ||||||
| Consumer Discretionary | $ | 28,604,118 | 10.8 | % | ||||
| Consumer Staples | 19,347,478 | 7.3 | ||||||
| Energy | 20,837,548 | 7.8 | ||||||
| Financials | 54,711,423 | 20.6 | ||||||
| Health Care | 6,349,929 | 2.4 | ||||||
| Industrials | 16,938,490 | 6.4 | ||||||
| Information Technology | 61,586,836 | 23.2 | ||||||
| Materials | 13,656,097 | 5.1 | ||||||
| Real Estate | 6,616,688 | 2.5 | ||||||
| Telecommunication Services | 18,002,331 | 6.8 | ||||||
| Utilities | 9,258,681 | 3.5 | ||||||
| Short-Term Investment | 10,327,810 | 3.9 | ||||||
| Securities Lending Collateral | 4,314,790 | 1.6 | ||||||
|
|
|
| |||||
Total Investments In Securities At Value | 270,552,219 | 101.9 | ||||||
| Liabilities in Excess of Other Assets (e) | (5,047,639 | ) | (1.9 | ) | ||||
|
|
|
| |||||
Net Assets | $ | 265,504,580 | 100.0 | % | ||||
|
|
|
| |||||
| * | Non-income producing security. |
| (a) | The security or a portion of this security is on loan at 9/30/2016. The total value of securities on loan at 9/30/2016 was $4,192,193. |
| (b) | Securities exempt from registration under Rule 144A or section 4(2), of the Securities Act of 1933. Under procedures approved by the Board of Trustees, such securities have been determined to be liquid by the investment adviser and may be resold, normally to qualified institutional buyers in transactions exempt from registration. Total value of all such securities at 9/30/2016 amounted to $914,287, which represents approximately 0.34% of net assets of the fund. |
| (c) | Represents 7-day effective yield as of 9/30/2016. |
| (d) | Represents security, or portion thereof, purchased with the cash collateral received for securities on loan. |
| (e) | Includes appreciation/(depreciation) on futures contracts. |
All securities are Level 2 with respect to ASC 820, unless otherwise noted in parentheses.
| (1) | Level 1 security (See Note 4). |
Abbreviations
ADR - American Depositary Receipt
GDR - Global Depositary Receipt
NVDR - Non-Voting Depositary Receipt
OJSC - Open Joint Stock Company
PJSC - Public Joint Stock Company
REIT - Real Estate Investment Trust
| The accompanying notes are an integral part of these financial statements. | (Continued) |
| AQR Funds | Annual Report | September 2016 | ||||||||||||||
66
| Schedule of Investments | September 30, 2016 |
| AQR EMERGING MULTI-STYLE FUND |
Open futures contracts outstanding at September 30, 2016:
Exchange Traded
| NUMBER OF CONTRACTS | COUNTERPARTY | DESCRIPTION | EXPIRATION DATE | VALUE AT TRADE DATE | VALUE AT SEPTEMBER 30, 2016 | UNREALIZED APPRECIATION (DEPRECIATION) | ||||||||||||
| Long Contracts: | ||||||||||||||||||
| 131 | BARC | E-Mini MSCI Emerging Markets Index Futures | 12/2016 | $ | 6,071,474 | $ | 5,976,875 | $ | (94,599 | ) | ||||||||
|
|
|
|
|
| |||||||||||||
Collateral pledged to, or (received from), each counterparty at September 30, 2016 was as follows:
| COUNTERPARTY | OVER THE COUNTER | EXCHANGE TRADED | TOTAL | |||||||||
| BARC | ||||||||||||
| Cash | $— | $471,029 | $471,029 | |||||||||
| ||||||||||||
| The accompanying notes are an integral part of these financial statements. |
| AQR Funds | Annual Report | September 2016 | ||||||||||||||
67
| Schedule of Investments | September 30, 2016 |
| AQR TM LARGE CAP MULTI-STYLE FUND |
| INVESTMENTS | SHARES | VALUE | ||||||
| COMMON STOCKS - 95.9% | ||||||||
| Aerospace & Defense - 3.7% | ||||||||
| Boeing Co. (The) | 3,641 | $ | 479,665 | |||||
| BWX Technologies, Inc. | 13,593 | 521,563 | ||||||
| General Dynamics Corp. | 2,116 | 328,319 | ||||||
| Huntington Ingalls Industries, Inc. | 6,480 | 994,162 | ||||||
| Lockheed Martin Corp. | 397 | 95,169 | ||||||
| Northrop Grumman Corp. | 3,569 | 763,587 | ||||||
| Raytheon Co. | 10,364 | 1,410,851 | ||||||
| Spirit AeroSystems Holdings, Inc., Class A * | 13,227 | 589,131 | ||||||
| Textron, Inc. | 1,471 | 58,472 | ||||||
|
| |||||||
| 5,240,919 | ||||||||
|
| |||||||
| Air Freight & Logistics - 0.1% | ||||||||
| FedEx Corp. | 883 | 154,242 | ||||||
|
| |||||||
| Airlines - 1.8% | ||||||||
| Alaska Air Group, Inc. | 2,764 | 182,037 | ||||||
| Delta Air Lines, Inc. | 20,791 | 818,334 | ||||||
| JetBlue Airways Corp. * | 24,982 | 430,690 | ||||||
| Southwest Airlines Co. | 2,423 | 94,230 | ||||||
| United Continental Holdings, Inc. * | 17,753 | 931,500 | ||||||
|
| |||||||
| 2,456,791 | ||||||||
|
| |||||||
| Auto Components - 0.8% | ||||||||
| Goodyear Tire & Rubber Co. (The) | 11,619 | 375,294 | ||||||
| Lear Corp. | 6,179 | 749,018 | ||||||
|
| |||||||
| 1,124,312 | ||||||||
|
| |||||||
| Automobiles - 0.6% | ||||||||
| Ford Motor Co. | 21,575 | 260,410 | ||||||
| General Motors Co. | 18,491 | 587,459 | ||||||
|
| |||||||
| 847,869 | ||||||||
|
| |||||||
| Banks - 6.0% | ||||||||
| Bank of America Corp. | 31,071 | 486,261 | ||||||
| Citigroup, Inc. | 18,832 | 889,435 | ||||||
| Commerce Bancshares, Inc. | 1,056 | 52,018 | ||||||
| Fifth Third Bancorp | 23,880 | 488,585 | ||||||
| JPMorgan Chase & Co. | 39,593 | 2,636,498 | ||||||
| PNC Financial Services Group, Inc. (The) | 8,462 | 762,341 | ||||||
| Popular, Inc. | 6,935 | 265,056 | ||||||
| SunTrust Banks, Inc. | 18,521 | 811,220 | ||||||
| US Bancorp | 15,558 | 667,283 | ||||||
| Wells Fargo & Co. | 31,342 | 1,387,824 | ||||||
|
| |||||||
| 8,446,521 | ||||||||
|
| |||||||
| Beverages - 1.9% | ||||||||
| Coca-Cola Co. (The) | 9,494 | 401,786 | ||||||
| Constellation Brands, Inc., Class A | 5,635 | 938,171 | ||||||
| Dr Pepper Snapple Group, Inc. | 3,224 | 294,384 | ||||||
| Molson Coors Brewing Co., Class B | 5,228 | 574,034 | ||||||
| PepsiCo, Inc. | 3,971 | 431,926 | ||||||
|
| |||||||
| 2,640,301 | ||||||||
|
| |||||||
| Biotechnology - 1.7% | ||||||||
| Amgen, Inc. | 3,595 | 599,682 | ||||||
| Biogen, Inc. * | 1,607 | 503,039 | ||||||
| Gilead Sciences, Inc. | 5,793 | 458,342 | ||||||
| Intrexon Corp. * | 9,181 | 257,252 | ||||||
| United Therapeutics Corp. * | 4,963 | 586,031 | ||||||
|
| |||||||
| 2,404,346 | ||||||||
|
| |||||||
| INVESTMENTS | SHARES | VALUE | ||||||
| Building Products - 1.3% | ||||||||
| AO Smith Corp. | 5,431 | $ | 536,528 | |||||
| Lennox International, Inc. | 284 | 44,597 | ||||||
| Masco Corp. | 9,173 | 314,726 | ||||||
| Owens Corning | 17,377 | 927,758 | ||||||
|
| |||||||
| 1,823,609 | ||||||||
|
| |||||||
| Capital Markets - 1.3% | ||||||||
| Bank of New York Mellon Corp. (The) | 7,816 | 311,702 | ||||||
| Franklin Resources, Inc. | 3,474 | 123,570 | ||||||
| Morgan Stanley | 7,455 | 239,008 | ||||||
| Nasdaq, Inc. | 8,167 | 551,599 | ||||||
| S&P Global, Inc. | 1,350 | 170,856 | ||||||
| State Street Corp. | 6,314 | 439,644 | ||||||
|
| |||||||
| 1,836,379 | ||||||||
|
| |||||||
| Chemicals - 2.0% | ||||||||
| Cabot Corp. | 3,468 | 181,758 | ||||||
| Dow Chemical Co. (The) | 12,625 | 654,354 | ||||||
| EI du Pont de Nemours & Co. | 4,525 | 303,039 | ||||||
| Huntsman Corp. | 39,783 | 647,269 | ||||||
| LyondellBasell Industries NV, Class A | 6,070 | 489,606 | ||||||
| Monsanto Co. | 2,354 | 240,579 | ||||||
| Sherwin-Williams Co. (The) | 159 | 43,989 | ||||||
| Westlake Chemical Corp. | 3,412 | 182,542 | ||||||
|
| |||||||
| 2,743,136 | ||||||||
|
| |||||||
| Commercial Services & Supplies - 0.3% | ||||||||
| Cintas Corp. | 1,937 | 218,106 | ||||||
| Republic Services, Inc. | 1,912 | 96,461 | ||||||
| RR Donnelley & Sons Co. | 4,071 | 63,996 | ||||||
|
| |||||||
| 378,563 | ||||||||
|
| |||||||
| Communications Equipment - 1.6% | ||||||||
| Brocade Communications Systems, Inc. | 42,421 | 391,546 | ||||||
| Cisco Systems, Inc. | 56,610 | 1,795,669 | ||||||
|
| |||||||
| 2,187,215 | ||||||||
|
| |||||||
| Construction & Engineering - 0.0% (a) | ||||||||
| Jacobs Engineering Group, Inc. * | 1,257 | 65,012 | ||||||
|
| |||||||
| Consumer Finance - 0.6% | ||||||||
| Capital One Financial Corp. | 8,008 | 575,215 | ||||||
| Discover Financial Services | 3,668 | 207,425 | ||||||
|
| |||||||
| 782,640 | ||||||||
|
| |||||||
| Containers & Packaging - 0.2% | ||||||||
| Avery Dennison Corp. | 1,201 | 93,426 | ||||||
| International Paper Co. | 2,490 | 119,470 | ||||||
|
| |||||||
| 212,896 | ||||||||
|
| |||||||
| Distributors - 0.1% | ||||||||
| LKQ Corp. * | 2,069 | 73,367 | ||||||
|
| |||||||
| Diversified Financial Services - 1.2% | ||||||||
| Berkshire Hathaway, Inc., Class B * | 11,633 | 1,680,620 | ||||||
|
| |||||||
| Diversified Telecommunication Services - 1.7% | ||||||||
| AT&T, Inc. | 30,667 | 1,245,387 | ||||||
| CenturyLink, Inc. | 4,548 | 124,752 | ||||||
| Verizon Communications, Inc. | 20,281 | 1,054,206 | ||||||
|
| |||||||
| 2,424,345 | ||||||||
|
| |||||||
| The accompanying notes are an integral part of these financial statements. | (Continued) |
| AQR Funds | Annual Report | September 2016 | ||||||||||||||
68
| Schedule of Investments | September 30, 2016 |
| AQR TM LARGE CAP MULTI-STYLE FUND |
| INVESTMENTS | SHARES | VALUE | ||||||
| Electric Utilities - 2.6% | ||||||||
| American Electric Power Co., Inc. | 9,901 | $ | 635,743 | |||||
| Edison International | 2,442 | 176,434 | ||||||
| Exelon Corp. | 16,180 | 538,632 | ||||||
| Great Plains Energy, Inc. | 12,700 | 346,583 | ||||||
| Pinnacle West Capital Corp. | 17,849 | 1,356,346 | ||||||
| Xcel Energy, Inc. | 13,720 | 564,441 | ||||||
|
| |||||||
| 3,618,179 | ||||||||
|
| |||||||
| Electrical Equipment - 0.1% | ||||||||
| Acuity Brands, Inc. | 349 | 92,345 | ||||||
|
| |||||||
| Electronic Equipment, Instruments & Components - 1.2% | ||||||||
| Arrow Electronics, Inc. * | 9,682 | 619,358 | ||||||
| Avnet, Inc. | 3,796 | 155,864 | ||||||
| CDW Corp. | 3,076 | 140,665 | ||||||
| Corning, Inc. | 21,073 | 498,376 | ||||||
| Dolby Laboratories, Inc., Class A | 4,427 | 240,342 | ||||||
| Jabil Circuit, Inc. | 3,481 | 75,955 | ||||||
|
| |||||||
| 1,730,560 | ||||||||
|
| |||||||
| Energy Equipment & Services - 0.6% | ||||||||
| Diamond Offshore Drilling, Inc. | 2,585 | 45,522 | ||||||
| Rowan Cos. plc, Class A | 53,312 | 808,210 | ||||||
|
| |||||||
| 853,732 | ||||||||
|
| |||||||
| Equity Real Estate Investment Trusts (REITs) - 3.3% | ||||||||
| American Tower Corp. | 1,834 | 207,847 | ||||||
| AvalonBay Communities, Inc. | 848 | 150,808 | ||||||
| Boston Properties, Inc. | 666 | 90,769 | ||||||
| Crown Castle International Corp. | 1,636 | 154,128 | ||||||
| Digital Realty Trust, Inc. | 2,957 | 287,184 | ||||||
| Equinix, Inc. | 709 | 255,417 | ||||||
| Equity Residential | 4,132 | 265,812 | ||||||
| Essex Property Trust, Inc. | 218 | 48,549 | ||||||
| Extra Space Storage, Inc. | 2,146 | 170,414 | ||||||
| Federal Realty Investment Trust | 366 | 56,338 | ||||||
| General Growth Properties, Inc. | 3,378 | 93,233 | ||||||
| HCP, Inc. | 3,475 | 131,876 | ||||||
| Host Hotels & Resorts, Inc. | 6,659 | 103,681 | ||||||
| Kimco Realty Corp. | 5,802 | 167,968 | ||||||
| Macerich Co. (The) | 2,285 | 184,788 | ||||||
| Prologis, Inc. | 3,209 | 171,810 | ||||||
| Public Storage | 2,089 | 466,139 | ||||||
| Realty Income Corp. | 5,417 | 362,560 | ||||||
| Simon Property Group, Inc. | 3,193 | 660,983 | ||||||
| Ventas, Inc. | 2,509 | 177,211 | ||||||
| Vornado Realty Trust | 648 | 65,584 | ||||||
| Welltower, Inc. | 2,033 | 152,007 | ||||||
| Weyerhaeuser Co. | 4,966 | 158,614 | ||||||
|
| |||||||
| 4,583,720 | ||||||||
|
| |||||||
| Food & Staples Retailing - 1.9% | ||||||||
| Costco Wholesale Corp. | 819 | 124,906 | ||||||
| CVS Health Corp. | 1,374 | 122,272 | ||||||
| Kroger Co. (The) | 13,438 | 398,840 | ||||||
| Walgreens Boots Alliance, Inc. | 1,043 | 84,087 | ||||||
| Wal-Mart Stores, Inc. | 27,527 | 1,985,247 | ||||||
|
| |||||||
| 2,715,352 | ||||||||
|
| |||||||
| INVESTMENTS | SHARES | VALUE | ||||||
| Food Products - 4.1% | ||||||||
| Archer-Daniels-Midland Co. | 1,444 | $ | 60,894 | |||||
| Campbell Soup Co. | 4,032 | 220,550 | ||||||
| Hormel Foods Corp. | 19,503 | 739,749 | ||||||
| Ingredion, Inc. | 10,323 | 1,373,578 | ||||||
| JM Smucker Co. (The) | 3,275 | 443,894 | ||||||
| Kraft Heinz Co. (The) | 2,933 | 262,533 | ||||||
| Pilgrim’s Pride Corp. | 23,625 | 498,960 | ||||||
| Tyson Foods, Inc., Class A | 28,933 | 2,160,427 | ||||||
|
| |||||||
| 5,760,585 | ||||||||
|
| |||||||
| Health Care Equipment & Supplies - 1.3% | ||||||||
| Baxter International, Inc. | 26,453 | 1,259,163 | ||||||
| Danaher Corp. | 3,850 | 301,801 | ||||||
| Edwards Lifesciences Corp. * | 2,296 | 276,806 | ||||||
| St. Jude Medical, Inc. | 674 | 53,758 | ||||||
|
| |||||||
| 1,891,528 | ||||||||
|
| |||||||
| Health Care Providers & Services - 3.0% | ||||||||
| Aetna, Inc. | 6,931 | 800,184 | ||||||
| Anthem, Inc. | 4,394 | 550,612 | ||||||
| Cigna Corp. | 1,272 | 165,767 | ||||||
| Express Scripts Holding Co. * | 1,886 | 133,019 | ||||||
| Humana, Inc. | 746 | 131,960 | ||||||
| Laboratory Corp. of America Holdings * | 491 | 67,503 | ||||||
| Quest Diagnostics, Inc. | 1,408 | 119,159 | ||||||
| UnitedHealth Group, Inc. | 7,879 | 1,103,060 | ||||||
| WellCare Health Plans, Inc. * | 10,141 | 1,187,410 | ||||||
|
| |||||||
| 4,258,674 | ||||||||
|
| |||||||
| Hotels, Restaurants & Leisure - 1.5% | ||||||||
| Carnival Corp. | 17,122 | 835,896 | ||||||
| Darden Restaurants, Inc. | 10,834 | 664,341 | ||||||
| International Game Technology plc | 5,876 | 143,257 | ||||||
| McDonald’s Corp. | 2,976 | 343,311 | ||||||
| Royal Caribbean Cruises Ltd. | 587 | 43,996 | ||||||
| Wyndham Worldwide Corp. | 1,323 | 89,077 | ||||||
|
| |||||||
| 2,119,878 | ||||||||
|
| |||||||
| Household Durables - 0.9% | ||||||||
| DR Horton, Inc. | 28,233 | 852,637 | ||||||
| Garmin Ltd. | 1,333 | 64,131 | ||||||
| NVR, Inc. * | 120 | 196,784 | ||||||
| Whirlpool Corp. | 1,096 | 177,727 | ||||||
|
| |||||||
| 1,291,279 | ||||||||
|
| |||||||
| Household Products - 2.1% | ||||||||
| Clorox Co. (The) | 1,823 | 228,203 | ||||||
| Procter & Gamble Co. (The) | 30,428 | 2,730,913 | ||||||
|
| |||||||
| 2,959,116 | ||||||||
|
| |||||||
| Industrial Conglomerates - 0.5% | ||||||||
| 3M Co. | 1,376 | 242,492 | ||||||
| Carlisle Cos., Inc. | 1,140 | 116,930 | ||||||
| General Electric Co. | 10,492 | 310,773 | ||||||
|
| |||||||
| 670,195 | ||||||||
|
| |||||||
| Insurance - 5.0% | ||||||||
| Aflac, Inc. | 10,547 | 758,013 | ||||||
| Alleghany Corp. * | 181 | 95,029 | ||||||
| Allstate Corp. (The) | 14,000 | 968,520 | ||||||
| The accompanying notes are an integral part of these financial statements. | (Continued) |
| AQR Funds | Annual Report | September 2016 | ||||||||||||||
69
| Schedule of Investments | September 30, 2016 |
| AQR TM LARGE CAP MULTI-STYLE FUND |
| INVESTMENTS | SHARES | VALUE | ||||||
| Insurance - 5.0% (continued) | ||||||||
| American Financial Group, Inc. | 2,020 | $ | 151,500 | |||||
| AmTrust Financial Services, Inc. | 3,180 | 85,319 | ||||||
| Assurant, Inc. | 1,195 | 110,239 | ||||||
| Assured Guaranty Ltd. | 17,687 | 490,814 | ||||||
| Chubb Ltd. | 7,280 | 914,732 | ||||||
| Cincinnati Financial Corp. | 2,546 | 192,019 | ||||||
| Everest Re Group Ltd. | 2,552 | 484,803 | ||||||
| Hanover Insurance Group, Inc. (The) | 2,645 | 199,486 | ||||||
| Hartford Financial Services Group, Inc. (The) | 1,013 | 43,377 | ||||||
| Old Republic International Corp. | 6,568 | 115,728 | ||||||
| Progressive Corp. (The) | 14,022 | 441,693 | ||||||
| Prudential Financial, Inc. | 4,330 | 353,545 | ||||||
| Reinsurance Group of America, Inc. | 1,230 | 132,766 | ||||||
| Travelers Cos., Inc. (The) | 12,093 | 1,385,253 | ||||||
| Unum Group | 2,416 | 85,309 | ||||||
| WR Berkley Corp. | 1,227 | 70,872 | ||||||
|
| |||||||
| 7,079,017 | ||||||||
|
| |||||||
| Internet & Direct Marketing Retail - 1.2% | ||||||||
| Amazon.com, Inc. * | 1,644 | 1,376,538 | ||||||
| Priceline Group, Inc. (The) * | 216 | 317,842 | ||||||
|
| |||||||
| 1,694,380 | ||||||||
|
| |||||||
| Internet Software & Services - 5.1% | ||||||||
| Akamai Technologies, Inc. * | 9,542 | 505,631 | ||||||
| Alphabet, Inc., Class A * | 2,330 | 1,873,460 | ||||||
| Alphabet, Inc., Class C * | 1,898 | 1,475,296 | ||||||
| eBay, Inc. * | 33,289 | 1,095,208 | ||||||
| Facebook, Inc., Class A * | 15,643 | 2,006,528 | ||||||
| LinkedIn Corp., Class A * | 662 | 126,521 | ||||||
| Rackspace Hosting, Inc. * | 691 | 21,898 | ||||||
| VeriSign, Inc. * | 1,510 | 118,142 | ||||||
|
| |||||||
| 7,222,684 | ||||||||
|
| |||||||
| IT Services - 2.6% | ||||||||
| Accenture plc, Class A | 7,680 | 938,265 | ||||||
| Amdocs Ltd. | 4,880 | 282,308 | ||||||
| Cognizant Technology Solutions Corp., Class A * | 5,777 | 275,621 | ||||||
| Computer Sciences Corp. | 12,524 | 653,878 | ||||||
| Fiserv, Inc. * | 889 | 88,429 | ||||||
| International Business Machines Corp. | 4,314 | 685,279 | ||||||
| Jack Henry & Associates, Inc. | 685 | 58,602 | ||||||
| Leidos Holdings, Inc. | 5,156 | 223,152 | ||||||
| Western Union Co. (The) | 6,033 | 125,607 | ||||||
| Xerox Corp. | 24,903 | 252,267 | ||||||
|
| |||||||
| 3,583,408 | ||||||||
|
| |||||||
| Leisure Products - 0.0% (a) | ||||||||
| Mattel, Inc. | 1,399 | 42,362 | ||||||
|
| |||||||
| Life Sciences Tools & Services - 0.5% | ||||||||
| Bruker Corp. | 10,533 | 238,572 | ||||||
| Charles River Laboratories International, Inc. * | 5,581 | 465,121 | ||||||
|
| |||||||
| 703,693 | ||||||||
|
| |||||||
| Machinery - 1.3% | ||||||||
| Illinois Tool Works, Inc. | 1,471 | 176,285 | ||||||
| Manitowoc Co., Inc. (The) | 3,737 | 17,900 | ||||||
| INVESTMENTS | SHARES | VALUE | ||||||
| Machinery - 1.3% (continued) | ||||||||
| Oshkosh Corp. | 9,073 | $ | 508,088 | |||||
| Stanley Black & Decker, Inc. | 4,216 | 518,484 | ||||||
| Toro Co. (The) | 1,452 | 68,012 | ||||||
| Trinity Industries, Inc. | 21,041 | 508,771 | ||||||
|
| |||||||
| 1,797,540 | ||||||||
|
| |||||||
| Media - 1.3% | ||||||||
| CBS Corp., Class B | 6,731 | 368,455 | ||||||
| Charter Communications, Inc., Class A * | 1,228 | 331,523 | ||||||
| Comcast Corp., Class A | 10,061 | 667,447 | ||||||
| News Corp., Class A | 11,543 | 161,371 | ||||||
| Scripps Networks Interactive, Inc., Class A | 4,181 | 265,452 | ||||||
| TEGNA, Inc. | 2,421 | 52,923 | ||||||
|
| |||||||
| 1,847,171 | ||||||||
|
| |||||||
| Metals & Mining - 0.3% | ||||||||
| Newmont Mining Corp. | 2,949 | 115,866 | ||||||
| Reliance Steel & Aluminum Co. | 2,812 | 202,548 | ||||||
| Steel Dynamics, Inc. | 5,018 | 125,400 | ||||||
|
| |||||||
| 443,814 | ||||||||
|
| |||||||
| Mortgage Real Estate Investment Trusts (REITs) - 0.1% | ||||||||
| Annaly Capital Management, Inc. | 15,826 | 166,173 | ||||||
|
| |||||||
| Multiline Retail - 0.2% | ||||||||
| Target Corp. | 4,429 | 304,184 | ||||||
|
| |||||||
| Multi-Utilities - 1.4% | ||||||||
| Ameren Corp. | 16,375 | 805,322 | ||||||
| Consolidated Edison, Inc. | 7,836 | 590,051 | ||||||
| Public Service Enterprise Group, Inc. | 13,273 | 555,740 | ||||||
| Vectren Corp. | 1,193 | 59,889 | ||||||
|
| |||||||
| 2,011,002 | ||||||||
|
| |||||||
| Oil, Gas & Consumable Fuels - 2.7% | ||||||||
| Antero Resources Corp. * | 40,135 | 1,081,638 | ||||||
| Exxon Mobil Corp. | 11,170 | 974,918 | ||||||
| Marathon Petroleum Corp. | 2,550 | 103,504 | ||||||
| Pioneer Natural Resources Co. | 794 | 147,406 | ||||||
| Range Resources Corp. | 2,418 | 93,697 | ||||||
| Spectra Energy Corp. | 4,485 | 191,734 | ||||||
| Tesoro Corp. | 3,372 | 268,276 | ||||||
| Valero Energy Corp. | 13,984 | 741,152 | ||||||
| World Fuel Services Corp. | 2,460 | 113,800 | ||||||
| WPX Energy, Inc. * | 3,815 | 50,320 | ||||||
|
| |||||||
| 3,766,445 | ||||||||
|
| |||||||
| Personal Products - 0.2% | ||||||||
| Estee Lauder Cos., Inc. (The), Class A | 961 | 85,106 | ||||||
| Nu Skin Enterprises, Inc., Class A | 3,038 | 196,802 | ||||||
|
| |||||||
| 281,908 | ||||||||
|
| |||||||
| Pharmaceuticals - 3.6% | ||||||||
| Akorn, Inc. * | 4,356 | 118,745 | ||||||
| Johnson & Johnson | 20,901 | 2,469,035 | ||||||
| Mallinckrodt plc * | 1,357 | 94,691 | ||||||
| Merck & Co., Inc. | 18,885 | 1,178,613 | ||||||
| Pfizer, Inc. | 33,338 | 1,129,158 | ||||||
|
| |||||||
| 4,990,242 | ||||||||
|
| |||||||
| The accompanying notes are an integral part of these financial statements. | (Continued) |
| AQR Funds | Annual Report | September 2016 | ||||||||||||||
70
| Schedule of Investments | September 30, 2016 |
| AQR TM LARGE CAP MULTI-STYLE FUND |
| INVESTMENTS | SHARES | VALUE | ||||||
| Professional Services - 0.1% | ||||||||
| Equifax, Inc. | 1,251 | $ | 168,360 | |||||
|
| |||||||
| Real Estate Management & Development - 0.2% | ||||||||
| CBRE Group, Inc., Class A * | 4,543 | 127,113 | ||||||
| Jones Lang LaSalle, Inc. | 772 | 87,846 | ||||||
|
| |||||||
| 214,959 | ||||||||
|
| |||||||
| Road & Rail - 0.2% | ||||||||
| CSX Corp. | 1,902 | 58,011 | ||||||
| Norfolk Southern Corp. | 714 | 69,301 | ||||||
| Union Pacific Corp. | 1,827 | 178,187 | ||||||
|
| |||||||
| 305,499 | ||||||||
|
| |||||||
| Semiconductors & Semiconductor Equipment - 5.6% | ||||||||
| Applied Materials, Inc. | 40,711 | 1,227,437 | ||||||
| First Solar, Inc. * | 24,910 | 983,696 | ||||||
| Intel Corp. | 53,805 | 2,031,139 | ||||||
| Lam Research Corp. | 5,492 | 520,147 | ||||||
| NVIDIA Corp. | 21,085 | 1,444,744 | ||||||
| QUALCOMM, Inc. | 1,055 | 72,267 | ||||||
| Teradyne, Inc. | 10,091 | 217,764 | ||||||
| Texas Instruments, Inc. | 18,513 | 1,299,242 | ||||||
|
| |||||||
| 7,796,436 | ||||||||
|
| |||||||
| Software - 4.0% | ||||||||
| Activision Blizzard, Inc. | 14,902 | 660,159 | ||||||
| CA, Inc. | 1,723 | 56,997 | ||||||
| Cadence Design Systems, Inc. * | 5,691 | 145,291 | ||||||
| Citrix Systems, Inc. * | 11,843 | 1,009,260 | ||||||
| Dell Technologies, Inc. * | 1,069 | 51,098 | ||||||
| Microsoft Corp. | 53,079 | 3,057,350 | ||||||
| Nuance Communications, Inc. * | 2,766 | 40,107 | ||||||
| Oracle Corp. | 5,078 | 199,464 | ||||||
| Synopsys, Inc. * | 1,540 | 91,399 | ||||||
| VMware, Inc., Class A * | 3,131 | 229,659 | ||||||
|
| |||||||
| 5,540,784 | ||||||||
|
| |||||||
| Specialty Retail - 4.1% | ||||||||
| AutoZone, Inc. * | 96 | 73,761 | ||||||
| Bed Bath & Beyond, Inc. | 992 | 42,765 | ||||||
| Best Buy Co., Inc. | 26,690 | 1,019,024 | ||||||
| Foot Locker, Inc. | 10,719 | 725,891 | ||||||
| Home Depot, Inc. (The) | 10,742 | 1,382,281 | ||||||
| Lowe’s Cos., Inc. | 8,664 | 625,627 | ||||||
| Murphy USA, Inc. * | 4,339 | 309,631 | ||||||
| O’Reilly Automotive, Inc. * | 1,521 | 426,047 | ||||||
| Ross Stores, Inc. | 4,649 | 298,931 | ||||||
| TJX Cos., Inc. (The) | 6,263 | 468,347 | ||||||
| Urban Outfitters, Inc. * | 10,031 | 346,270 | ||||||
|
| |||||||
| 5,718,575 | ||||||||
|
| |||||||
| Technology Hardware, Storage & Peripherals - 3.4% | ||||||||
| Apple, Inc. | 31,994 | 3,616,922 | ||||||
| Hewlett Packard Enterprise Co. | 10,466 | 238,101 | ||||||
| HP, Inc. | 57,536 | 893,534 | ||||||
|
| |||||||
| 4,748,557 | ||||||||
|
| |||||||
| Textiles, Apparel & Luxury Goods - 1.2% | ||||||||
| Carter’s, Inc. | 2,137 | 185,299 | ||||||
| Michael Kors Holdings Ltd. * | 22,239 | 1,040,563 | ||||||
| INVESTMENTS | SHARES | VALUE | ||||||
| Textiles, Apparel & Luxury Goods - 1.2% (continued) | ||||||||
| NIKE, Inc., Class B | 8,660 | $ | 455,949 | |||||
|
| |||||||
| 1,681,811 | ||||||||
|
| |||||||
| Thrifts & Mortgage Finance - 0.1% | ||||||||
| New York Community Bancorp, Inc. | 5,186 | 73,797 | ||||||
|
| |||||||
| Tobacco - 1.3% | ||||||||
| Altria Group, Inc. | 11,955 | 755,915 | ||||||
| Philip Morris International, Inc. | 9,499 | 923,493 | ||||||
| Reynolds American, Inc. | 4,087 | 192,702 | ||||||
|
| |||||||
| 1,872,110 | ||||||||
|
| |||||||
| Trading Companies & Distributors - 0.2% | ||||||||
| MSC Industrial Direct Co., Inc., Class A | 1,828 | 134,193 | ||||||
| United Rentals, Inc. * | 2,683 | 210,589 | ||||||
|
| |||||||
| 344,782 | ||||||||
|
| |||||||
TOTAL COMMON STOCKS |
| 134,467,919 | ||||||
|
| |||||||
| EXCHANGE TRADED FUND - 2.8% | ||||||||
SPDR S&P 500 Fund Trust | 18,271 | 3,952,017 | ||||||
|
| |||||||
| SHORT-TERM INVESTMENT - 1.1% | ||||||||
| Investment Company - 1.1% | ||||||||
| J.P. Morgan U.S. Treasury Plus Money Market Fund - IM Shares, 0.22% | ||||||||
(cost $1,539,169) (2)(b) | 1,539,169 | 1,539,169 | ||||||
|
| |||||||
TOTAL INVESTMENTS IN SECURITIES AT VALUE - 99.8% |
| 139,959,105 | ||||||
|
| |||||||
| OTHER ASSETS IN EXCESS OF LIABILITIES - 0.2% | 261,860 | |||||||
|
| |||||||
NET ASSETS - 100.0% |
| 140,220,965 | ||||||
|
| |||||||
| SECTOR | VALUE | % OF NET ASSETS | ||||||
| Consumer Discretionary | $ | 16,745,187 | 11.9 | % | ||||
| Consumer Staples | 16,229,370 | 11.6 | ||||||
| Energy | 4,620,177 | 3.3 | ||||||
| Exchange Traded Fund | 3,952,017 | 2.8 | ||||||
| Financials | 20,065,146 | 14.3 | ||||||
| Health Care | 14,248,484 | 10.2 | ||||||
| Industrials | 13,497,857 | 9.6 | ||||||
| Information Technology | 32,809,645 | 23.5 | ||||||
| Materials | 3,399,847 | 2.4 | ||||||
| Real Estate | 4,798,679 | 3.4 | ||||||
| Telecommunication Services | 2,424,345 | 1.7 | ||||||
| Utilities | 5,629,182 | 4.0 | ||||||
| Short-Term Investment | 1,539,169 | 1.1 | ||||||
|
|
|
| |||||
Total Investments In Securities At Value | 139,959,105 | 99.8 | ||||||
| Other Assets in Excess of Liabilities | 261,860 | 0.2 | ||||||
|
|
|
| |||||
Net Assets | $ | 140,220,965 | 100.0 | % | ||||
|
|
|
| |||||
| The accompanying notes are an integral part of these financial statements. | (Continued) |
| AQR Funds | Annual Report | September 2016 | ||||||||||||||
71
| Schedule of Investments | September 30, 2016 |
| AQR TM LARGE CAP MULTI-STYLE FUND |
All securities are United States companies, unless noted otherwise in parentheses.
| * | Non-income producing security. |
| (a) | Represents less than 0.05% of net assets. |
| (b) | Represents 7-day effective yield as of 9/30/2016. |
All securities are Level 1 with respect to ASC 820, unless otherwise noted in parentheses.
| (2) | Level 2 security (See Note 4). |
Abbreviations
SPDR - Standard & Poor’s Depositary Receipt
| The accompanying notes are an integral part of these financial statements. |
| AQR Funds | Annual Report | September 2016 | ||||||||||||||
72
| Schedule of Investments | September 30, 2016 |
| AQR TM SMALL CAP MULTI-STYLE FUND |
| INVESTMENTS | SHARES | VALUE | ||||||
| COMMON STOCKS - 95.0% | ||||||||
| Aerospace & Defense - 0.4% | ||||||||
| Curtiss-Wright Corp. | 401 | $ | 36,535 | |||||
| Engility Holdings, Inc. * | 270 | 8,505 | ||||||
| Kratos Defense & Security Solutions, Inc. * | 1,006 | 6,931 | ||||||
| Moog, Inc., Class A * | 137 | 8,157 | ||||||
| National Presto Industries, Inc. | 153 | 13,432 | ||||||
| Vectrus, Inc. * | 674 | 10,265 | ||||||
|
| |||||||
| 83,825 | ||||||||
|
| |||||||
| Air Freight & Logistics - 0.2% | ||||||||
| Air Transport Services Group, Inc. * | 739 | 10,605 | ||||||
| Hub Group, Inc., Class A * | 503 | 20,502 | ||||||
|
| |||||||
| 31,107 | ||||||||
|
| |||||||
| Airlines - 0.3% | ||||||||
| Allegiant Travel Co. | 100 | 13,207 | ||||||
| Hawaiian Holdings, Inc. * | 353 | 17,156 | ||||||
| SkyWest, Inc. | 613 | 16,189 | ||||||
| Virgin America, Inc. * | 190 | 10,167 | ||||||
|
| |||||||
| 56,719 | ||||||||
|
| |||||||
| Auto Components - 4.6% | ||||||||
| American Axle & Manufacturing Holdings, Inc. * | 7,884 | 135,762 | ||||||
| Cooper Tire & Rubber Co. | 3,053 | 116,075 | ||||||
| Cooper-Standard Holding, Inc. * | 2,111 | 208,567 | ||||||
| Dorman Products, Inc. * | 377 | 24,090 | ||||||
| Drew Industries, Inc. | 1,238 | 121,349 | ||||||
| Metaldyne Performance Group, Inc. | 952 | 15,089 | ||||||
| Standard Motor Products, Inc. | 409 | 19,534 | ||||||
| Stoneridge, Inc. * | 2,895 | 53,268 | ||||||
| Superior Industries International, Inc. | 1,578 | 46,015 | ||||||
| Tenneco, Inc. * | 1,746 | 101,739 | ||||||
| Tower International, Inc. | 710 | 17,111 | ||||||
|
| |||||||
| 858,599 | ||||||||
|
| |||||||
| Automobiles - 0.0% (a) | ||||||||
| Winnebago Industries, Inc. | 192 | 4,525 | ||||||
|
| |||||||
| Banks - 7.4% | ||||||||
| 1st Source Corp. | 596 | 21,274 | ||||||
| Banc of California, Inc. | 2,462 | 42,987 | ||||||
| BancorpSouth, Inc. | 1,587 | 36,818 | ||||||
| Bank of the Ozarks, Inc. | 376 | 14,438 | ||||||
| Berkshire Hills Bancorp, Inc. | 320 | 8,867 | ||||||
| BNC Bancorp | 350 | 8,512 | ||||||
| Brookline Bancorp, Inc. | 576 | 7,021 | ||||||
| Cardinal Financial Corp. | 302 | 7,879 | ||||||
| Cathay General Bancorp | 1,997 | 61,468 | ||||||
| CenterState Banks, Inc. | 1,055 | 18,705 | ||||||
| Chemical Financial Corp. | 955 | 42,144 | ||||||
| City Holding Co. | 128 | 6,437 | ||||||
| Columbia Banking System, Inc. | 372 | 12,172 | ||||||
| Community Trust Bancorp, Inc. | 222 | 8,238 | ||||||
| Customers Bancorp, Inc. * | 1,062 | 26,720 | ||||||
| Eagle Bancorp, Inc. * | 212 | 10,458 | ||||||
| Enterprise Financial Services Corp. | 721 | 22,531 | ||||||
| Fidelity Southern Corp. | 893 | 16,422 | ||||||
| Financial Institutions, Inc. | 266 | 7,211 | ||||||
| First Busey Corp. | 276 | 6,238 | ||||||
| INVESTMENTS | SHARES | VALUE | ||||||
| Banks - 7.4% (continued) | ||||||||
| First Citizens BancShares, Inc., Class A | 167 | $ | 49,080 | |||||
| First Commonwealth Financial Corp. | 537 | 5,418 | ||||||
| First Financial Bancorp | 386 | 8,430 | ||||||
| First Financial Corp. | 157 | 6,387 | ||||||
| First Interstate BancSystem, Inc., Class A | 1,069 | 33,684 | ||||||
| First Merchants Corp. | 770 | 20,598 | ||||||
| First Midwest Bancorp, Inc. | 830 | 16,069 | ||||||
| Flushing Financial Corp. | 411 | 9,749 | ||||||
| FNB Corp. | 733 | 9,016 | ||||||
| Fulton Financial Corp. | 3,838 | 55,728 | ||||||
| Great Southern Bancorp, Inc. | 426 | 17,338 | ||||||
| Great Western Bancorp, Inc. | 2,233 | 74,404 | ||||||
| Hanmi Financial Corp. | 456 | 12,011 | ||||||
| Heartland Financial USA, Inc. | 596 | 21,498 | ||||||
| Heritage Financial Corp. | 437 | 7,844 | ||||||
| Hilltop Holdings, Inc. * | 1,191 | 26,750 | ||||||
| Home BancShares, Inc. | 505 | 10,509 | ||||||
| Hope Bancorp, Inc. | 603 | 10,474 | ||||||
| Independent Bank Corp. | 103 | 1,734 | ||||||
| Independent Bank Group, Inc. | 131 | 5,786 | ||||||
| International Bancshares Corp. | 1,168 | 34,783 | ||||||
| LegacyTexas Financial Group, Inc. | 599 | 18,946 | ||||||
| MB Financial, Inc. | 1,204 | 45,800 | ||||||
| NBT Bancorp, Inc. | 821 | 26,986 | ||||||
| Old National Bancorp | 1,544 | 21,709 | ||||||
| Opus Bank | 155 | 5,482 | ||||||
| Pacific Premier Bancorp, Inc. * | 645 | 17,067 | ||||||
| Peapack Gladstone Financial Corp. | 219 | 4,908 | ||||||
| Preferred Bank | 502 | 17,947 | ||||||
| PrivateBancorp, Inc. | 529 | 24,292 | ||||||
| Prosperity Bancshares, Inc. | 1,545 | 84,805 | ||||||
| Renasant Corp. | 315 | 10,593 | ||||||
| Sandy Spring Bancorp, Inc. | 415 | 12,691 | ||||||
| ServisFirst Bancshares, Inc. | 133 | 6,904 | ||||||
| Simmons First National Corp., Class A | 152 | 7,585 | ||||||
| Stock Yards Bancorp, Inc. | 234 | 7,713 | ||||||
| Texas Capital Bancshares, Inc. * | 672 | 36,906 | ||||||
| Towne Bank | 1,008 | 24,222 | ||||||
| TriCo Bancshares | 365 | 9,771 | ||||||
| Trustmark Corp. | 1,520 | 41,891 | ||||||
| Umpqua Holdings Corp. | 2,470 | 37,174 | ||||||
| Webster Financial Corp. | 964 | 36,642 | ||||||
| Wintrust Financial Corp. | 1,079 | 59,960 | ||||||
|
| |||||||
| 1,383,824 | ||||||||
|
| |||||||
| Beverages - 0.9% | ||||||||
| Coca-Cola Bottling Co. Consolidated | 132 | 19,557 | ||||||
| MGP Ingredients, Inc. | 1,406 | 56,971 | ||||||
| National Beverage Corp. *(b) | 2,293 | 101,007 | ||||||
|
| |||||||
| 177,535 | ||||||||
|
| |||||||
| Biotechnology - 4.5% | ||||||||
| Acorda Therapeutics, Inc. * | 1,312 | 27,395 | ||||||
| Aduro Biotech, Inc. *(b) | 455 | 5,656 | ||||||
| Alder Biopharmaceuticals, Inc. * | 369 | 12,092 | ||||||
| AMAG Pharmaceuticals, Inc. *(b) | 606 | 14,853 | ||||||
| Aptevo Therapeutics, Inc. * | 44 | 113 | ||||||
| ARIAD Pharmaceuticals, Inc. * | 1,420 | 19,440 | ||||||
| BioSpecifics Technologies Corp. * | 389 | 17,766 | ||||||
| The accompanying notes are an integral part of these financial statements. | (Continued) |
| AQR Funds | Annual Report | September 2016 | ||||||||||||||
73
| Schedule of Investments | September 30, 2016 |
| AQR TM SMALL CAP MULTI-STYLE FUND |
| INVESTMENTS | SHARES | VALUE | ||||||
| Biotechnology - 4.5% (continued) | ||||||||
| Cepheid * | 747 | $ | 39,359 | |||||
| Eagle Pharmaceuticals, Inc. *(b) | 509 | 35,630 | ||||||
| Emergent BioSolutions, Inc. * | 2,393 | 75,451 | ||||||
| Enanta Pharmaceuticals, Inc. * | 618 | 16,445 | ||||||
| Exact Sciences Corp. * | 1,928 | 35,803 | ||||||
| Exelixis, Inc. * | 4,948 | 63,285 | ||||||
| Five Prime Therapeutics, Inc. * | 1,800 | 94,482 | ||||||
| Inovio Pharmaceuticals, Inc. *(b) | 574 | 5,350 | ||||||
| Kite Pharma, Inc. *(b) | 139 | 7,765 | ||||||
| Lexicon Pharmaceuticals, Inc. *(b) | 1,133 | 20,473 | ||||||
| Ligand Pharmaceuticals, Inc. *(b) | 509 | 51,949 | ||||||
| Myriad Genetics, Inc. * | 2,785 | 57,315 | ||||||
| Novavax, Inc. *(b) | 2,318 | 4,821 | ||||||
| PDL BioPharma, Inc. | 13,390 | 44,856 | ||||||
| Prothena Corp. plc (Ireland) *(b) | 347 | 20,810 | ||||||
| Radius Health, Inc. * | 527 | 28,505 | ||||||
| Repligen Corp. * | 659 | 19,895 | ||||||
| Retrophin, Inc. * | 1,531 | 34,264 | ||||||
| Spark Therapeutics, Inc. *(b) | 674 | 40,480 | ||||||
| TESARO, Inc. * | 258 | 25,862 | ||||||
| Xencor, Inc. * | 1,154 | 28,261 | ||||||
|
| |||||||
| 848,376 | ||||||||
|
| |||||||
| Building Products - 3.0% | ||||||||
| American Woodmark Corp. * | 679 | 54,707 | ||||||
| Apogee Enterprises, Inc. | 513 | 22,926 | ||||||
| Gibraltar Industries, Inc. * | 2,207 | 81,990 | ||||||
| Insteel Industries, Inc. | 4,956 | 179,605 | ||||||
| Patrick Industries, Inc. * | 744 | 46,068 | ||||||
| Ply Gem Holdings, Inc. * | 2,755 | 36,807 | ||||||
| Trex Co., Inc. * | 93 | 5,461 | ||||||
| Universal Forest Products, Inc. | 1,401 | 137,985 | ||||||
|
| |||||||
| 565,549 | ||||||||
|
| |||||||
| Capital Markets - 0.3% | ||||||||
| INTL. FCStone, Inc. * | 871 | 33,838 | ||||||
| Janus Capital Group, Inc. | 594 | 8,322 | ||||||
| Piper Jaffray Cos. * | 149 | 7,197 | ||||||
|
| |||||||
| 49,357 | ||||||||
|
| |||||||
| Chemicals - 2.3% | ||||||||
| American Vanguard Corp. | 513 | 8,239 | ||||||
| Chase Corp. | 118 | 8,156 | ||||||
| Chemours Co. (The) | 3,487 | 55,792 | ||||||
| Chemtura Corp. * | 261 | 8,563 | ||||||
| FutureFuel Corp. | 496 | 5,595 | ||||||
| GCP Applied Technologies, Inc. * | 652 | 18,465 | ||||||
| Ingevity Corp. * | 423 | 19,500 | ||||||
| Innospec, Inc. | 805 | 48,952 | ||||||
| Kraton Performance Polymers, Inc. * | 636 | 22,285 | ||||||
| Minerals Technologies, Inc. | 163 | 11,523 | ||||||
| Rayonier Advanced Materials, Inc. | 5,723 | 76,517 | ||||||
| Stepan Co. | 476 | 34,586 | ||||||
| Trinseo SA | 1,953 | 110,462 | ||||||
|
| |||||||
| 428,635 | ||||||||
|
| |||||||
| Commercial Services & Supplies - 2.4% | ||||||||
| ABM Industries, Inc. | 206 | 8,178 | ||||||
| ACCO Brands Corp. * | 8,789 | 84,726 | ||||||
| INVESTMENTS | SHARES | VALUE | ||||||
| Commercial Services & Supplies - 2.4% (continued) | ||||||||
| Brink’s Co. (The) | 197 | $ | 7,305 | |||||
| Deluxe Corp. | 973 | 65,016 | ||||||
| Ennis, Inc. | 4,170 | 70,264 | ||||||
| G&K Services, Inc., Class A | 129 | 12,318 | ||||||
| Herman Miller, Inc. | 1,351 | 38,639 | ||||||
| HNI Corp. | 1,074 | 42,745 | ||||||
| Interface, Inc. | 330 | 5,508 | ||||||
| Knoll, Inc. | 642 | 14,670 | ||||||
| Quad/Graphics, Inc. | 553 | 14,776 | ||||||
| Steelcase, Inc., Class A | 2,073 | 28,794 | ||||||
| Tetra Tech, Inc. | 377 | 13,372 | ||||||
| UniFirst Corp. | 160 | 21,098 | ||||||
| Viad Corp. | 153 | 5,641 | ||||||
| VSE Corp. | 22 | 748 | ||||||
| West Corp. | 779 | 17,200 | ||||||
|
| |||||||
| 450,998 | ||||||||
|
| |||||||
| Communications Equipment - 2.7% | ||||||||
| Ciena Corp. * | 1,205 | 26,269 | ||||||
| Extreme Networks, Inc. * | 4,013 | 18,018 | ||||||
| Finisar Corp. * | 2,982 | 88,864 | ||||||
| Infinera Corp. * | 2,001 | 18,069 | ||||||
| InterDigital, Inc. | 571 | 45,223 | ||||||
| Ixia * | 1,083 | 13,537 | ||||||
| Lumentum Holdings, Inc. * | 1,085 | 45,320 | ||||||
| NETGEAR, Inc. * | 2,597 | 157,093 | ||||||
| Plantronics, Inc. | 624 | 32,423 | ||||||
| Sonus Networks, Inc. * | 932 | 7,251 | ||||||
| Ubiquiti Networks, Inc. * | 823 | 44,031 | ||||||
|
| |||||||
| 496,098 | ||||||||
|
| |||||||
| Construction & Engineering - 1.1% | ||||||||
| Argan, Inc. | 513 | 30,364 | ||||||
| Comfort Systems USA, Inc. | 390 | 11,431 | ||||||
| Dycom Industries, Inc. * | 433 | 35,411 | ||||||
| EMCOR Group, Inc. | 1,222 | 72,856 | ||||||
| MasTec, Inc. * | 867 | 25,784 | ||||||
| MYR Group, Inc. * | 223 | 6,712 | ||||||
| Tutor Perini Corp. * | 1,023 | 21,964 | ||||||
|
| |||||||
| 204,522 | ||||||||
|
| |||||||
| Construction Materials - 0.1% | ||||||||
| Headwaters, Inc. * | 874 | 14,788 | ||||||
| US Concrete, Inc. * | 110 | 5,067 | ||||||
|
| |||||||
| 19,855 | ||||||||
|
| |||||||
| Consumer Finance - 0.4% | ||||||||
| First Cash Financial Services, Inc. | 490 | 23,069 | ||||||
| LendingClub Corp. *(b) | 3,386 | 20,926 | ||||||
| Nelnet, Inc., Class A | 233 | 9,406 | ||||||
| Regional Management Corp. * | 348 | 7,534 | ||||||
| World Acceptance Corp. * | 410 | 20,107 | ||||||
|
| |||||||
| 81,042 | ||||||||
|
| |||||||
| Containers & Packaging - 0.0% (a) | ||||||||
| AEP Industries, Inc. | 68 | 7,437 | ||||||
|
| |||||||
| Distributors - 0.0% (a) | ||||||||
| Core-Mark Holding Co., Inc. | 182 | 6,516 | ||||||
|
| |||||||
| The accompanying notes are an integral part of these financial statements. | (Continued) |
| AQR Funds | Annual Report | September 2016 | ||||||||||||||
74
| Schedule of Investments | September 30, 2016 |
| AQR TM SMALL CAP MULTI-STYLE FUND |
| INVESTMENTS | SHARES | VALUE | ||||||
| Diversified Consumer Services - 0.7% | ||||||||
| American Public Education, Inc. * | 2,768 | $ | 54,834 | |||||
| Capella Education Co. | 149 | 8,648 | ||||||
| Career Education Corp. * | 5,761 | 39,117 | ||||||
| Grand Canyon Education, Inc. * | 344 | 13,894 | ||||||
| K12, Inc. * | 636 | 9,127 | ||||||
| Strayer Education, Inc. * | 113 | 5,275 | ||||||
|
| |||||||
| 130,895 | ||||||||
|
| |||||||
| Diversified Telecommunication Services - 0.5% | ||||||||
| Cincinnati Bell, Inc. * | 3,280 | 13,382 | ||||||
| FairPoint Communications, Inc. * | 1,658 | 24,920 | ||||||
| General Communication, Inc., Class A * | 525 | 7,219 | ||||||
| IDT Corp., Class B | 697 | 12,016 | ||||||
| Inteliquent, Inc. | 692 | 11,169 | ||||||
| Iridium Communications, Inc. *(b) | 891 | 7,226 | ||||||
| Vonage Holdings Corp. * | 1,583 | 10,463 | ||||||
|
| |||||||
| 86,395 | ||||||||
|
| |||||||
| Electric Utilities - 0.4% | ||||||||
| Portland General Electric Co. | 347 | 14,779 | ||||||
| Spark Energy, Inc., Class A (b) | 1,893 | 55,143 | ||||||
|
| |||||||
| 69,922 | ||||||||
|
| |||||||
| Electrical Equipment - 0.3% | ||||||||
| Encore Wire Corp. | 442 | 16,252 | ||||||
| EnerSys | 337 | 23,317 | ||||||
| LSI Industries, Inc. | 642 | 7,210 | ||||||
|
| |||||||
| 46,779 | ||||||||
|
| |||||||
| Electronic Equipment, Instruments & Components - 4.1% | ||||||||
| AVX Corp. | 825 | 11,377 | ||||||
| Belden, Inc. | 892 | 61,539 | ||||||
| Benchmark Electronics, Inc. * | 228 | 5,689 | ||||||
| Coherent, Inc. * | 836 | 92,411 | ||||||
| CTS Corp. | 344 | 6,398 | ||||||
| ePlus, Inc. * | 306 | 28,890 | ||||||
| Fabrinet (Thailand) * | 810 | 36,118 | ||||||
| II-VI, Inc. * | 1,298 | 31,580 | ||||||
| Insight Enterprises, Inc. * | 755 | 24,575 | ||||||
| Methode Electronics, Inc. | 1,209 | 42,279 | ||||||
| Plexus Corp. * | 115 | 5,380 | ||||||
| Rofin-Sinar Technologies, Inc. * | 213 | 6,854 | ||||||
| Sanmina Corp. * | 4,382 | 124,756 | ||||||
| SYNNEX Corp. | 855 | 97,564 | ||||||
| Tech Data Corp. * | 1,534 | 129,945 | ||||||
| TTM Technologies, Inc. * | 3,666 | 41,976 | ||||||
| Vishay Intertechnology, Inc. | 1,424 | 20,064 | ||||||
|
| |||||||
| 767,395 | ||||||||
|
| |||||||
| Energy Equipment & Services - 0.7% | ||||||||
| Atwood Oceanics, Inc. (b) | 10,130 | 88,030 | ||||||
| Matrix Service Co. * | 333 | 6,247 | ||||||
| McDermott International, Inc. * | 1,162 | 5,821 | ||||||
| US Silica Holdings, Inc. | 480 | 22,349 | ||||||
|
| |||||||
| 122,447 | ||||||||
|
| |||||||
| Equity Real Estate Investment Trusts (REITs) - 6.9% | ||||||||
| Acadia Realty Trust | 671 | 24,317 | ||||||
| Agree Realty Corp. | 647 | 31,988 | ||||||
| American Assets Trust, Inc. | 285 | 12,363 | ||||||
| INVESTMENTS | SHARES | VALUE | ||||||
| Equity Real Estate Investment Trusts (REITs) - 6.9% (continued) | ||||||||
| CBL & Associates Properties, Inc. | 2,030 | $ | 24,644 | |||||
| Chatham Lodging Trust | 678 | 13,051 | ||||||
| Chesapeake Lodging Trust | 556 | 12,732 | ||||||
| Colony Starwood Homes (b) | 606 | 17,392 | ||||||
| CoreSite Realty Corp. | 426 | 31,541 | ||||||
| Cousins Properties, Inc. | 1,930 | 20,149 | ||||||
| DiamondRock Hospitality Co. | 2,138 | 19,456 | ||||||
| DuPont Fabros Technology, Inc. | 991 | 40,879 | ||||||
| EastGroup Properties, Inc. | 226 | 16,625 | ||||||
| Education Realty Trust, Inc. | 774 | 33,390 | ||||||
| FelCor Lodging Trust, Inc. | 2,524 | 16,229 | ||||||
| First Industrial Realty Trust, Inc. | 1,399 | 39,480 | ||||||
| Four Corners Property Trust, Inc. | 1,072 | 22,866 | ||||||
| Franklin Street Properties Corp. | 1,782 | 22,453 | ||||||
| GEO Group, Inc. (The) (b) | 983 | 23,376 | ||||||
| Global Net Lease, Inc. | 1,504 | 12,273 | ||||||
| Government Properties Income Trust | 827 | 18,707 | ||||||
| Gramercy Property Trust | 3,124 | 30,115 | ||||||
| Healthcare Realty Trust, Inc. | 1,261 | 42,950 | ||||||
| Hudson Pacific Properties, Inc. | 764 | 25,113 | ||||||
| Kite Realty Group Trust | 646 | 17,907 | ||||||
| LaSalle Hotel Properties | 1,025 | 24,467 | ||||||
| Lexington Realty Trust | 2,658 | 27,377 | ||||||
| LTC Properties, Inc. | 343 | 17,833 | ||||||
| Mack-Cali Realty Corp. | 1,735 | 47,227 | ||||||
| Medical Properties Trust, Inc. | 2,557 | 37,767 | ||||||
| Monmouth Real Estate Investment Corp. | 2,008 | 28,654 | ||||||
| Monogram Residential Trust, Inc. | 1,718 | 18,280 | ||||||
| National Health Investors, Inc. | 344 | 26,997 | ||||||
| New Senior Investment Group, Inc. | 889 | 10,259 | ||||||
| New York REIT, Inc. | 1,150 | 10,522 | ||||||
| Parkway Properties, Inc. | 687 | 11,686 | ||||||
| Pebblebrook Hotel Trust (b) | 724 | 19,258 | ||||||
| Pennsylvania REIT | 778 | 17,917 | ||||||
| Physicians Realty Trust | 1,228 | 26,451 | ||||||
| Potlatch Corp. | 371 | 14,428 | ||||||
| PS Business Parks, Inc. | 119 | 13,515 | ||||||
| QTS Realty Trust, Inc., Class A | 505 | 26,689 | ||||||
| Ramco-Gershenson Properties Trust | 870 | 16,304 | ||||||
| Retail Opportunity Investments Corp. | 955 | 20,972 | ||||||
| Rexford Industrial Realty, Inc. | 980 | 22,432 | ||||||
| RLJ Lodging Trust | 1,239 | 26,056 | ||||||
| Ryman Hospitality Properties, Inc. | 423 | 20,372 | ||||||
| Sabra Health Care REIT, Inc. | 796 | 20,043 | ||||||
| Select Income REIT | 922 | 24,802 | ||||||
| Seritage Growth Properties, Class A (b) | 414 | 20,982 | ||||||
| STAG Industrial, Inc. | 722 | 17,696 | ||||||
| Summit Hotel Properties, Inc. | 1,776 | 23,372 | ||||||
| Sunstone Hotel Investors, Inc. | 2,588 | 33,101 | ||||||
| Terreno Realty Corp. | 727 | 20,000 | ||||||
| Urban Edge Properties | 942 | 26,508 | ||||||
| Washington Prime Group, Inc. | 1,731 | 21,430 | ||||||
| Washington REIT | 485 | 15,093 | ||||||
| Xenia Hotels & Resorts, Inc. | 991 | 15,043 | ||||||
|
| |||||||
| 1,293,529 | ||||||||
|
| |||||||
| Food & Staples Retailing - 0.3% | ||||||||
| Ingles Markets, Inc., Class A | 316 | 12,495 | ||||||
| SpartanNash Co. | 620 | 17,930 | ||||||
| The accompanying notes are an integral part of these financial statements. | (Continued) |
| AQR Funds | Annual Report | September 2016 | ||||||||||||||
75
| Schedule of Investments | September 30, 2016 |
| AQR TM SMALL CAP MULTI-STYLE FUND |
| INVESTMENTS | SHARES | VALUE | ||||||
| Food & Staples Retailing - 0.3% (continued) | ||||||||
| SUPERVALU, Inc. * | 2,754 | $ | 13,743 | |||||
| United Natural Foods, Inc. * | 154 | 6,166 | ||||||
| Weis Markets, Inc. | 279 | 14,787 | ||||||
|
| |||||||
| 65,121 | ||||||||
|
| |||||||
| Food Products - 2.8% | ||||||||
| B&G Foods, Inc. | 174 | 8,557 | ||||||
| Cal-Maine Foods, Inc. (b) | 1,740 | 67,060 | ||||||
| Darling Ingredients, Inc. * | 1,904 | 25,723 | ||||||
| Dean Foods Co. | 2,091 | 34,292 | ||||||
| Fresh Del Monte Produce, Inc. | 950 | 56,905 | ||||||
| John B. Sanfilippo & Son, Inc. | 1,378 | 70,733 | ||||||
| Lancaster Colony Corp. | 98 | 12,945 | ||||||
| Omega Protein Corp. * | 6,304 | 147,325 | ||||||
| Sanderson Farms, Inc. | 971 | 93,536 | ||||||
|
| |||||||
| 517,076 | ||||||||
|
| |||||||
| Gas Utilities - 0.9% | ||||||||
| ONE Gas, Inc. | 1,344 | 83,113 | ||||||
| Southwest Gas Corp. | 1,194 | 83,413 | ||||||
|
| |||||||
| 166,526 | ||||||||
|
| |||||||
| Health Care Equipment & Supplies - 1.7% | ||||||||
| Anika Therapeutics, Inc. * | 1,272 | 60,865 | ||||||
| Cynosure, Inc., Class A * | 576 | 29,342 | ||||||
| ICU Medical, Inc. * | 129 | 16,303 | ||||||
| Integra LifeSciences Holdings Corp. * | 223 | 18,409 | ||||||
| iRadimed Corp. *(b) | 984 | 16,718 | ||||||
| LeMaitre Vascular, Inc. | 739 | 14,662 | ||||||
| Masimo Corp. * | 934 | 55,564 | ||||||
| Natus Medical, Inc. * | 525 | 20,627 | ||||||
| NuVasive, Inc. * | 213 | 14,199 | ||||||
| OraSure Technologies, Inc. * | 3,554 | 28,325 | ||||||
| Penumbra, Inc. * | 257 | 19,529 | ||||||
| TransEnterix, Inc. *(b) | 11,125 | 18,801 | ||||||
|
| |||||||
| 313,344 | ||||||||
|
| |||||||
| Health Care Providers & Services - 1.6% | ||||||||
| Aceto Corp. | 553 | 10,502 | ||||||
| Amedisys, Inc. * | 292 | 13,853 | ||||||
| AMN Healthcare Services, Inc. * | 1,407 | 44,841 | ||||||
| BioTelemetry, Inc. * | 2,495 | 46,332 | ||||||
| Chemed Corp. | 304 | 42,885 | ||||||
| Healthways, Inc. * | 1,135 | 30,032 | ||||||
| LHC Group, Inc. * | 163 | 6,011 | ||||||
| Molina Healthcare, Inc. * | 702 | 40,941 | ||||||
| Nobilis Health Corp. *(b) | 1,861 | 6,234 | ||||||
| Select Medical Holdings Corp. * | 452 | 6,102 | ||||||
| Triple-S Management Corp., Class B * | 2,220 | 48,685 | ||||||
|
| |||||||
| 296,418 | ||||||||
|
| |||||||
| Health Care Technology - 0.4% | ||||||||
| HMS Holdings Corp. * | 2,445 | 54,206 | ||||||
| Press Ganey Holdings, Inc. * | 369 | 14,907 | ||||||
|
| |||||||
| 69,113 | ||||||||
|
| |||||||
| Hotels, Restaurants & Leisure - 1.6% | ||||||||
| Bloomin’ Brands, Inc. | 378 | 6,517 | ||||||
| Boyd Gaming Corp. * | 523 | 10,345 | ||||||
| Caesars Entertainment Corp. *(b) | 2,794 | 20,815 | ||||||
| INVESTMENTS | SHARES | VALUE | ||||||
| Hotels, Restaurants & Leisure - 1.6% (continued) | ||||||||
| Carrols Restaurant Group, Inc. * | 724 | $ | 9,564 | |||||
| Cracker Barrel Old Country Store, Inc. | 321 | 42,443 | ||||||
| Dave & Buster’s Entertainment, Inc. * | 824 | 32,284 | ||||||
| Eldorado Resorts, Inc. * | 5,370 | 75,502 | ||||||
| Isle of Capri Casinos, Inc. * | 867 | 19,317 | ||||||
| Jack in the Box, Inc. | 113 | 10,841 | ||||||
| Marcus Corp. (The) | 373 | 9,340 | ||||||
| Marriott Vacations Worldwide Corp. | 222 | 16,277 | ||||||
| Papa John’s International, Inc. (b) | 116 | 9,146 | ||||||
| Ruth’s Hospitality Group, Inc. | 1,008 | 14,233 | ||||||
| Sonic Corp. | 209 | 5,472 | ||||||
| Texas Roadhouse, Inc. | 339 | 13,231 | ||||||
|
| |||||||
| 295,327 | ||||||||
|
| |||||||
| Household Durables - 1.6% | ||||||||
| Bassett Furniture Industries, Inc. | 1,542 | 35,851 | ||||||
| Beazer Homes USA, Inc. * | 4,875 | 56,842 | ||||||
| Ethan Allen Interiors, Inc. | 830 | 25,954 | ||||||
| Flexsteel Industries, Inc. | 79 | 4,086 | ||||||
| Helen of Troy Ltd. * | 182 | 15,683 | ||||||
| Hooker Furniture Corp. | 716 | 17,535 | ||||||
| KB Home (b) | 2,196 | 35,400 | ||||||
| La-Z-Boy, Inc. | 1,426 | 35,023 | ||||||
| LGI Homes, Inc. *(b) | 980 | 36,103 | ||||||
| TopBuild Corp. * | 651 | 21,613 | ||||||
| ZAGG, Inc. * | 1,092 | 8,845 | ||||||
|
| |||||||
| 292,935 | ||||||||
|
| |||||||
| Household Products - 0.2% | ||||||||
| Central Garden & Pet Co., Class A * | 1,088 | 26,983 | ||||||
| HRG Group, Inc. * | 1,172 | 18,400 | ||||||
|
| |||||||
| 45,383 | ||||||||
|
| |||||||
| Independent Power and Renewable Electricity Producers - 0.1% | ||||||||
| Ormat Technologies, Inc. | 296 | 14,329 | ||||||
|
| |||||||
| Insurance - 4.6% | ||||||||
| Ambac Financial Group, Inc. * | 1,669 | 30,693 | ||||||
| American Equity Investment Life Holding Co. | 456 | 8,085 | ||||||
| AMERISAFE, Inc. | 595 | 34,974 | ||||||
| Argo Group International Holdings Ltd. | 1,063 | 59,975 | ||||||
| CNO Financial Group, Inc. | 5,135 | 78,412 | ||||||
| Employers Holdings, Inc. | 3,538 | 105,539 | ||||||
| Enstar Group Ltd. * | 107 | 17,598 | ||||||
| FBL Financial Group, Inc., Class A | 333 | 21,302 | ||||||
| Federated National Holding Co. | 1,081 | 20,204 | ||||||
| Genworth Financial, Inc., Class A * | 7,815 | 38,762 | ||||||
| HCI Group, Inc. | 253 | 7,681 | ||||||
| Heritage Insurance Holdings, Inc. | 2,226 | 32,077 | ||||||
| Horace Mann Educators Corp. | 851 | 31,189 | ||||||
| Infinity Property & Casualty Corp. | 97 | 8,015 | ||||||
| James River Group Holdings Ltd. | 518 | 18,752 | ||||||
| Maiden Holdings Ltd. | 1,955 | 24,809 | ||||||
| National General Holdings Corp. | 765 | 17,014 | ||||||
| National Western Life Group, Inc., Class A | 55 | 11,295 | ||||||
| Navigators Group, Inc. (The) | 423 | 40,997 | ||||||
| Primerica, Inc. (b) | 1,275 | 67,613 | ||||||
| Selective Insurance Group, Inc. | 1,516 | 60,428 | ||||||
| United Fire Group, Inc. | 1,204 | 50,953 | ||||||
| The accompanying notes are an integral part of these financial statements. | (Continued) |
| AQR Funds | Annual Report | September 2016 | ||||||||||||||
76
| Schedule of Investments | September 30, 2016 |
| AQR TM SMALL CAP MULTI-STYLE FUND |
| INVESTMENTS | SHARES | VALUE | ||||||
| Insurance - 4.6% (continued) | ||||||||
| United Insurance Holdings Corp. | 1,339 | $ | 22,736 | |||||
| Universal Insurance Holdings, Inc. | 1,887 | 47,552 | ||||||
|
| |||||||
| 856,655 | ||||||||
|
| |||||||
| Internet & Direct Marketing Retail - 0.2% | ||||||||
| 1-800-Flowers.com, Inc., Class A * | 1,397 | 12,811 | ||||||
| Nutrisystem, Inc. | 525 | 15,587 | ||||||
| PetMed Express, Inc. (b) | 397 | 8,051 | ||||||
|
| |||||||
| 36,449 | ||||||||
|
| |||||||
| Internet Software & Services - 1.8% | ||||||||
| Brightcove, Inc. * | 1,141 | 14,890 | ||||||
| Cimpress NV (Netherlands) *(b) | 195 | 19,730 | ||||||
| Five9, Inc. * | 876 | 13,736 | ||||||
| GrubHub, Inc. * | 136 | 5,847 | ||||||
| j2 Global, Inc. | 993 | 66,144 | ||||||
| LogMeIn, Inc. | 424 | 38,325 | ||||||
| MeetMe, Inc. * | 11,653 | 72,248 | ||||||
| NIC, Inc. | 580 | 13,630 | ||||||
| RetailMeNot, Inc. * | 1,389 | 13,737 | ||||||
| Shutterstock, Inc. * | 436 | 27,773 | ||||||
| Stamps.com, Inc. * | 523 | 49,429 | ||||||
| Web.com Group, Inc. * | 296 | 5,112 | ||||||
|
| |||||||
| 340,601 | ||||||||
|
| |||||||
| IT Services - 3.0% | ||||||||
| CACI International, Inc., Class A * | 437 | 44,093 | ||||||
| Cardtronics plc * | 240 | 10,704 | ||||||
| Convergys Corp. | 2,846 | 86,575 | ||||||
| CSG Systems International, Inc. | 1,857 | 76,750 | ||||||
| Everi Holdings, Inc. * | 3,983 | 9,838 | ||||||
| ExlService Holdings, Inc. * | 628 | 31,300 | ||||||
| Hackett Group, Inc. (The) | 3,816 | 63,040 | ||||||
| NeuStar, Inc., Class A *(b) | 3,049 | 81,073 | ||||||
| Science Applications International Corp. | 428 | 29,690 | ||||||
| Sykes Enterprises, Inc. * | 3,004 | 84,503 | ||||||
| Syntel, Inc. | 631 | 26,445 | ||||||
| TeleTech Holdings, Inc. | 430 | 12,466 | ||||||
|
| |||||||
| 556,477 | ||||||||
|
| |||||||
| Leisure Products - 1.4% | ||||||||
| JAKKS Pacific, Inc. *(b) | 883 | 7,629 | ||||||
| Nautilus, Inc. * | 2,029 | 46,099 | ||||||
| Smith & Wesson Holding Corp. *(b) | 6,293 | 167,331 | ||||||
| Sturm Ruger & Co., Inc. | 811 | 46,843 | ||||||
|
| |||||||
| 267,902 | ||||||||
|
| |||||||
| Life Sciences Tools & Services - 0.6% | ||||||||
| Cambrex Corp. * | 1,591 | 70,736 | ||||||
| INC Research Holdings, Inc., Class A * | 705 | 31,429 | ||||||
| PRA Health Sciences, Inc. * | 319 | 18,027 | ||||||
|
| |||||||
| 120,192 | ||||||||
|
| |||||||
| Machinery - 3.4% | ||||||||
| Alamo Group, Inc. | 544 | 35,844 | ||||||
| Altra Industrial Motion Corp. | 431 | 12,486 | ||||||
| American Railcar Industries, Inc. | 139 | 5,764 | ||||||
| Astec Industries, Inc. | 166 | 9,939 | ||||||
| Barnes Group, Inc. | 736 | 29,845 | ||||||
| Douglas Dynamics, Inc. | 481 | 15,363 | ||||||
| INVESTMENTS | SHARES | VALUE | ||||||
| Machinery - 3.4% (continued) | ||||||||
| Energy Recovery, Inc. *(b) | 5,445 | $ | 87,011 | |||||
| Federal Signal Corp. | 846 | 11,218 | ||||||
| FreightCar America, Inc. | 526 | 7,564 | ||||||
| Global Brass & Copper Holdings, Inc. | 1,620 | 46,802 | ||||||
| Greenbrier Cos., Inc. (The) | 2,259 | 79,743 | ||||||
| Hillenbrand, Inc. | 227 | 7,182 | ||||||
| John Bean Technologies Corp. | 342 | 24,128 | ||||||
| Joy Global, Inc. | 988 | 27,407 | ||||||
| Kadant, Inc. | 399 | 20,792 | ||||||
| Lydall, Inc. * | 679 | 34,717 | ||||||
| Meritor, Inc. * | 783 | 8,715 | ||||||
| Mueller Industries, Inc. | 234 | 7,586 | ||||||
| Standex International Corp. | 405 | 37,612 | ||||||
| Supreme Industries, Inc., Class A | 3,033 | 58,537 | ||||||
| Wabash National Corp. * | 5,342 | 76,070 | ||||||
|
| |||||||
| 644,325 | ||||||||
|
| |||||||
| Marine - 0.1% | ||||||||
| Matson, Inc. | 320 | 12,762 | ||||||
|
| |||||||
| Media - 1.4% | ||||||||
| Gannett Co., Inc. | 6,569 | 76,463 | ||||||
| Gray Television, Inc. * | 3,135 | 32,479 | ||||||
| Media General, Inc. * | 744 | 13,712 | ||||||
| Meredith Corp. | 227 | 11,802 | ||||||
| MSG Networks, Inc., Class A * | 724 | 13,474 | ||||||
| New Media Investment Group, Inc. | 1,963 | 30,426 | ||||||
| New York Times Co. (The), Class A | 1,221 | 14,591 | ||||||
| Nexstar Broadcasting Group, Inc., Class A (b) | 545 | 31,452 | ||||||
| Sinclair Broadcast Group, Inc., Class A | 1,366 | 39,450 | ||||||
|
| |||||||
| 263,849 | ||||||||
|
| |||||||
| Metals & Mining - 2.0% | ||||||||
| AK Steel Holding Corp. *(b) | 6,284 | 30,352 | ||||||
| Cliffs Natural Resources, Inc. *(b) | 14,752 | 86,299 | ||||||
| Coeur Mining, Inc. * | 1,480 | 17,508 | ||||||
| Commercial Metals Co. | 2,391 | 38,710 | ||||||
| Hecla Mining Co. | 3,653 | 20,822 | ||||||
| Olympic Steel, Inc. | 1,401 | 30,962 | ||||||
| Ryerson Holding Corp. * | 3,751 | 42,349 | ||||||
| Worthington Industries, Inc. | 2,326 | 111,718 | ||||||
|
| |||||||
| 378,720 | ||||||||
|
| |||||||
| Mortgage Real Estate Investment Trusts (REITs) - 1.1% | ||||||||
| Apollo Commercial Real Estate Finance, Inc. | 1,429 | 23,393 | ||||||
| Capstead Mortgage Corp. | 2,798 | 26,385 | ||||||
| Colony Capital, Inc., Class A | 962 | 17,537 | ||||||
| CYS Investments, Inc. | 4,773 | 41,621 | ||||||
| Invesco Mortgage Capital, Inc. | 2,024 | 30,825 | ||||||
| New Residential Investment Corp. | 2,914 | 40,242 | ||||||
| PennyMac Mortgage Investment Trust | 713 | 11,109 | ||||||
| Redwood Trust, Inc. | 1,499 | 21,226 | ||||||
|
| |||||||
| 212,338 | ||||||||
|
| |||||||
| Multiline Retail - 0.1% | ||||||||
| Big Lots, Inc. | 313 | 14,946 | ||||||
|
| |||||||
| Multi-Utilities - 0.0% (a) | ||||||||
| Avista Corp. | 153 | 6,394 | ||||||
|
| |||||||
| The accompanying notes are an integral part of these financial statements. | (Continued) |
| AQR Funds | Annual Report | September 2016 | ||||||||||||||
77
| Schedule of Investments | September 30, 2016 |
| AQR TM SMALL CAP MULTI-STYLE FUND |
| INVESTMENTS | SHARES | VALUE | ||||||
| Oil, Gas & Consumable Fuels - 0.6% | ||||||||
| Callon Petroleum Co. * | 430 | $ | 6,751 | |||||
| Gener8 Maritime, Inc. * | 2,468 | 12,636 | ||||||
| Jones Energy, Inc., Class A *(b) | 4,328 | 15,408 | ||||||
| Oasis Petroleum, Inc. * | 1,721 | 19,740 | ||||||
| Renewable Energy Group, Inc. * | 1,946 | 16,483 | ||||||
| REX American Resources Corp. * | 119 | 10,086 | ||||||
| RSP Permian, Inc. * | 363 | 14,077 | ||||||
| Scorpio Tankers, Inc. (Monaco) | 3,881 | 17,969 | ||||||
|
| |||||||
| 113,150 | ||||||||
|
| |||||||
| Paper & Forest Products - 0.3% | ||||||||
| Clearwater Paper Corp. * | 200 | 12,934 | ||||||
| Neenah Paper, Inc. | 279 | 22,044 | ||||||
| PH Glatfelter Co. | 1,161 | 25,170 | ||||||
|
| |||||||
| 60,148 | ||||||||
|
| |||||||
| Personal Products - 1.1% | ||||||||
| Medifast, Inc. | 218 | 8,238 | ||||||
| Natural Health Trends Corp. (b) | 3,147 | 88,934 | ||||||
| Revlon, Inc., Class A * | 311 | 11,439 | ||||||
| USANA Health Sciences, Inc. * | 663 | 91,726 | ||||||
|
| |||||||
| 200,337 | ||||||||
|
| |||||||
| Pharmaceuticals - 1.4% | ||||||||
| Amphastar Pharmaceuticals, Inc. * | 1,845 | 35,000 | ||||||
| Corcept Therapeutics, Inc. * | 2,054 | 13,351 | ||||||
| Heska Corp. * | 314 | 17,091 | ||||||
| Horizon Pharma plc *(b) | 1,358 | 24,620 | ||||||
| Innoviva, Inc. *(b) | 1,303 | 14,320 | ||||||
| Lannett Co., Inc. * | 282 | 7,493 | ||||||
| Phibro Animal Health Corp., Class A | 288 | 7,828 | ||||||
| Prestige Brands Holdings, Inc. * | 750 | 36,202 | ||||||
| SciClone Pharmaceuticals, Inc. * | 6,357 | 65,159 | ||||||
| Supernus Pharmaceuticals, Inc. * | 1,368 | 33,831 | ||||||
|
| |||||||
| 254,895 | ||||||||
|
| |||||||
| Professional Services - 2.0% | ||||||||
| Barrett Business Services, Inc. | 1,108 | 54,968 | ||||||
| CBIZ, Inc. * | 559 | 6,255 | ||||||
| FTI Consulting, Inc. * | 150 | 6,684 | ||||||
| Huron Consulting Group, Inc. * | 92 | 5,498 | ||||||
| ICF International, Inc. * | 362 | 16,044 | ||||||
| Insperity, Inc. | 1,970 | 143,101 | ||||||
| Kelly Services, Inc., Class A | 993 | 19,085 | ||||||
| Kforce, Inc. | 277 | 5,676 | ||||||
| Mistras Group, Inc. * | 970 | 22,766 | ||||||
| Navigant Consulting, Inc. * | 693 | 14,012 | ||||||
| On Assignment, Inc. * | 656 | 23,806 | ||||||
| Resources Connection, Inc. | 532 | 7,948 | ||||||
| RPX Corp. * | 745 | 7,964 | ||||||
| TrueBlue, Inc. * | 1,930 | 43,734 | ||||||
|
| |||||||
| 377,541 | ||||||||
|
| |||||||
| Real Estate Management & Development - 0.1% | ||||||||
| Alexander & Baldwin, Inc. | 361 | 13,870 | ||||||
|
| |||||||
| Semiconductors & Semiconductor Equipment - 5.9% | ||||||||
| Advanced Energy Industries, Inc. * | 2,873 | 135,950 | ||||||
| Advanced Micro Devices, Inc. * | 6,422 | 44,376 | ||||||
| INVESTMENTS | SHARES | VALUE | ||||||
| Semiconductors & Semiconductor Equipment - 5.9% (continued) | ||||||||
| Alpha & Omega Semiconductor Ltd. * | 849 | $ | 18,440 | |||||
| Ambarella, Inc. * | 653 | 48,067 | ||||||
| Amkor Technology, Inc. * | 7,054 | 68,565 | ||||||
| Cirrus Logic, Inc. * | 2,340 | 124,371 | ||||||
| Entegris, Inc. * | 893 | 15,556 | ||||||
| GigPeak, Inc. * | 4,744 | 11,148 | ||||||
| Inphi Corp. * | 1,088 | 47,339 | ||||||
| Integrated Device Technology, Inc. * | 3,468 | 80,111 | ||||||
| Intersil Corp., Class A | 1,374 | 30,132 | ||||||
| IXYS Corp. | 644 | 7,760 | ||||||
| MaxLinear, Inc., Class A * | 5,779 | 117,140 | ||||||
| Microsemi Corp. * | 1,020 | 42,820 | ||||||
| MKS Instruments, Inc. | 1,001 | 49,780 | ||||||
| Monolithic Power Systems, Inc. | 99 | 7,970 | ||||||
| NeoPhotonics Corp. * | 3,353 | 54,788 | ||||||
| Photronics, Inc. * | 4,449 | 45,869 | ||||||
| Power Integrations, Inc. | 321 | 20,233 | ||||||
| Rambus, Inc. * | 447 | 5,588 | ||||||
| Rudolph Technologies, Inc. * | 1,202 | 21,323 | ||||||
| Silicon Laboratories, Inc. * | 138 | 8,114 | ||||||
| Synaptics, Inc. * | 998 | 58,463 | ||||||
| Tessera Technologies, Inc. | 873 | 33,558 | ||||||
|
| |||||||
| 1,097,461 | ||||||||
|
| |||||||
| Software - 2.6% | ||||||||
| 8x8, Inc. * | 576 | 8,888 | ||||||
| AVG Technologies NV * | 886 | 22,159 | ||||||
| BroadSoft, Inc. * | 448 | 20,854 | ||||||
| Ebix, Inc. | 1,281 | 72,825 | ||||||
| Ellie Mae, Inc. * | 548 | 57,704 | ||||||
| Fair Isaac Corp. | 251 | 31,272 | ||||||
| Fleetmatics Group plc * | 438 | 26,271 | ||||||
| Gigamon, Inc. * | 841 | 46,087 | ||||||
| Mentor Graphics Corp. | 1,717 | 45,398 | ||||||
| Mitek Systems, Inc. * | 5,994 | 49,690 | ||||||
| Paycom Software, Inc. * | 234 | 11,730 | ||||||
| Progress Software Corp. * | 223 | 6,066 | ||||||
| Qualys, Inc. * | 204 | 7,791 | ||||||
| Rubicon Project, Inc. (The) * | 1,781 | 14,747 | ||||||
| Take-Two Interactive Software, Inc. * | 1,073 | 48,371 | ||||||
| TiVo Corp. * | 1,058 | 20,610 | ||||||
| VASCO Data Security International, Inc. * | 371 | 6,533 | ||||||
|
| |||||||
| 496,996 | ||||||||
|
| |||||||
| Specialty Retail - 1.9% | ||||||||
| Abercrombie & Fitch Co., Class A | 319 | 5,069 | ||||||
| American Eagle Outfitters, Inc. (b) | 4,259 | 76,066 | ||||||
| Asbury Automotive Group, Inc. * | 105 | 5,845 | ||||||
| Build-A-Bear Workshop, Inc. * | 584 | 6,050 | ||||||
| Caleres, Inc. | 708 | 17,905 | ||||||
| Cato Corp. (The), Class A | 167 | 5,493 | ||||||
| Children’s Place, Inc. (The) | 466 | 37,219 | ||||||
| Citi Trends, Inc. | 401 | 7,992 | ||||||
| Express, Inc. * | 3,983 | 46,960 | ||||||
| Francesca’s Holdings Corp. * | 1,228 | 18,948 | ||||||
| Genesco, Inc. * | 158 | 8,605 | ||||||
| Haverty Furniture Cos., Inc. | 305 | 6,112 | ||||||
| Kirkland’s, Inc. * | 677 | 8,246 | ||||||
| Lithia Motors, Inc., Class A | 291 | 27,796 | ||||||
| The accompanying notes are an integral part of these financial statements. | (Continued) |
| AQR Funds | Annual Report | September 2016 | ||||||||||||||
78
| Schedule of Investments | September 30, 2016 |
| AQR TM SMALL CAP MULTI-STYLE FUND |
| INVESTMENTS | SHARES | VALUE | ||||||
| Specialty Retail - 1.9% (continued) | ||||||||
| Office Depot, Inc. | 13,694 | $ | 48,888 | |||||
| Select Comfort Corp. * | 489 | 10,562 | ||||||
| Shoe Carnival, Inc. | 500 | 13,330 | ||||||
|
| |||||||
| 351,086 | ||||||||
|
| |||||||
| Technology Hardware, Storage & Peripherals - 0.6% | ||||||||
| Cray, Inc. * | 2,649 | 62,358 | ||||||
| Super Micro Computer, Inc. * | 1,966 | 45,945 | ||||||
|
| |||||||
| 108,303 | ||||||||
|
| |||||||
| Textiles, Apparel & Luxury Goods - 0.5% | ||||||||
| Deckers Outdoor Corp. * | 99 | 5,895 | ||||||
| Movado Group, Inc. | 3,049 | 65,493 | ||||||
| Vera Bradley, Inc. * | 1,936 | 29,330 | ||||||
|
| |||||||
| 100,718 | ||||||||
|
| |||||||
| Thrifts & Mortgage Finance - 2.4% | ||||||||
| BofI Holding, Inc. *(b) | 505 | 11,312 | ||||||
| Dime Community Bancshares, Inc. | 673 | 11,279 | ||||||
| Essent Group Ltd. * | 744 | 19,798 | ||||||
| EverBank Financial Corp. | 1,057 | 20,464 | ||||||
| Federal Agricultural Mortgage Corp., Class C | 468 | 18,486 | ||||||
| First Defiance Financial Corp. | 680 | 30,355 | ||||||
| Flagstar Bancorp, Inc. * | 573 | 15,901 | ||||||
| HomeStreet, Inc. * | 697 | 17,467 | ||||||
| Meta Financial Group, Inc. | 152 | 9,213 | ||||||
| MGIC Investment Corp. * | 11,813 | 94,504 | ||||||
| Oritani Financial Corp. | 488 | 7,671 | ||||||
| Provident Financial Services, Inc. | 940 | 19,956 | ||||||
| Radian Group, Inc. | 2,527 | 34,241 | ||||||
| United Financial Bancorp, Inc. | 473 | 6,546 | ||||||
| Walker & Dunlop, Inc. * | 1,972 | 49,813 | ||||||
| Washington Federal, Inc. | 2,612 | 69,688 | ||||||
| WSFS Financial Corp. | 309 | 11,275 | ||||||
|
| |||||||
| 447,969 | ||||||||
|
| |||||||
| Tobacco - 0.1% | ||||||||
| Universal Corp. | 169 | 9,839 | ||||||
| Vector Group Ltd. (b) | 774 | 16,661 | ||||||
|
| |||||||
| 26,500 | ||||||||
|
| |||||||
| Trading Companies & Distributors - 0.1% | ||||||||
| Applied Industrial Technologies, Inc. | 115 | 5,375 | ||||||
| H&E Equipment Services, Inc. | 1,259 | 21,101 | ||||||
|
| |||||||
| 26,476 | ||||||||
|
| |||||||
| Wireless Telecommunication Services - 0.3% | ||||||||
| NII Holdings, Inc. * | 3,872 | 12,894 | ||||||
| Shenandoah Telecommunications Co. | 1,272 | 34,611 | ||||||
| Spok Holdings, Inc. | 610 | 10,870 | ||||||
|
| |||||||
| 58,375 | ||||||||
|
| |||||||
TOTAL COMMON STOCKS | 17,792,888 | |||||||
|
| |||||||
| EXCHANGE TRADED FUND - 3.7% | ||||||||
iShares Russell 2000 Fund | 5,687 | 706,383 | ||||||
|
| |||||||
| INVESTMENTS | SHARES | VALUE | ||||||
| SHORT-TERM INVESTMENT - 1.5% | ||||||||
| Investment Company - 1.5% | ||||||||
| J.P. Morgan U.S. Treasury Plus Money Market Fund - IM Shares, 0.22% | ||||||||
(cost $276,531) (2)(c) | 276,531 | $ | 276,531 | |||||
|
| |||||||
| SECURITIES LENDING COLLATERAL - 7.5% | ||||||||
| Money Market Funds - 7.5% | ||||||||
| Investments in a Pooled Account through Securities Lending Program with JPMorgan Chase Bank Dreyfus Treasury & Agency Cash Management, 0.21% | ||||||||
(cost $1,409,090) (2)(c)(d) | 1,409,090 | 1,409,090 | ||||||
|
| |||||||
TOTAL INVESTMENTS IN SECURITIES |
| 20,184,892 | ||||||
|
| |||||||
| LIABILITIES IN EXCESS OF OTHER ASSETS - (7.7%) | (1,449,894 | ) | ||||||
|
| |||||||
NET ASSETS - 100.0% | 18,734,998 | |||||||
|
| |||||||
| SECTOR | VALUE | % OF NET ASSETS | ||||||
| Consumer Discretionary | $ | 2,623,747 | 14.0 | % | ||||
| Consumer Staples | 1,031,951 | 5.5 | ||||||
| Energy | 235,597 | 1.3 | ||||||
| Exchange Traded Fund | 706,383 | 3.7 | ||||||
| Financials | 3,031,184 | 16.2 | ||||||
| Health Care | 1,902,337 | 10.2 | ||||||
| Industrials | 2,500,604 | 13.3 | ||||||
| Information Technology | 3,863,332 | 20.5 | ||||||
| Materials | 894,796 | 4.8 | ||||||
| Real Estate | 1,307,399 | 7.0 | ||||||
| Telecommunication Services | 144,770 | 0.8 | ||||||
| Utilities | 257,171 | 1.4 | ||||||
| Short-Term Investment | 276,531 | 1.5 | ||||||
| Securities Lending Collateral | 1,409,090 | 7.5 | ||||||
|
|
|
| |||||
Total Investments In Securities At Value | 20,184,892 | 107.7 | ||||||
| Liabilities in Excess of Other Assets | (1,449,894 | ) | (7.7 | ) | ||||
|
|
|
| |||||
Net Assets | $ | 18,734,998 | 100.0 | % | ||||
|
|
|
| |||||
All securities are United States companies, unless noted otherwise in parentheses.
| * | Non-income producing security. |
| (a) | Represents less than 0.05% of net assets. |
| (b) | The security or a portion of this security is on loan at 9/30/2016. The total value of securities on loan at 9/30/2016 was $1,372,811. |
| (c) | Represents 7-day effective yield as of 9/30/2016. |
| (d) | Represents security, or portion thereof, purchased with the cash collateral received for securities on loan. |
All securities are Level 1 with respect to ASC 820, unless otherwise noted in parentheses.
| (2) | Level 2 security (See Note 4). |
| The accompanying notes are an integral part of these financial statements. |
| AQR Funds | Annual Report | September 2016 | ||||||||||||||
79
| Schedule of Investments | September 30, 2016 |
| AQR TM INTERNATIONAL MULTI-STYLE FUND |
| INVESTMENTS | SHARES | VALUE | ||||||
| COMMON STOCKS - 96.2% | ||||||||
| Australia - 5.9% | ||||||||
| Amcor Ltd. | 10,220 | $ | 119,035 | |||||
| Aristocrat Leisure Ltd. | 55,936 | 680,569 | ||||||
| Australia & New Zealand Banking Group Ltd. | 4,457 | 94,941 | ||||||
| BHP Billiton Ltd. | 31,889 | 552,397 | ||||||
| Caltex Australia Ltd. | 31,189 | 824,599 | ||||||
| CIMIC Group Ltd. | 47,449 | 1,050,876 | ||||||
| Cochlear Ltd. | 1,786 | 193,590 | ||||||
| Commonwealth Bank of Australia | 5,831 | 325,155 | ||||||
| CSL Ltd. | 2,228 | 183,210 | ||||||
| Dexus Property Group, REIT | 33,527 | 235,647 | ||||||
| Flight Centre Travel Group Ltd. | 5,956 | 166,736 | ||||||
| Fortescue Metals Group Ltd. | 266,270 | 1,019,169 | ||||||
| Goodman Group, REIT | 30,886 | 173,106 | ||||||
| GPT Group (The), REIT | 19,876 | 77,398 | ||||||
| Harvey Norman Holdings Ltd. | 18,350 | 73,454 | ||||||
| Macquarie Group Ltd. | 5,407 | 341,963 | ||||||
| Newcrest Mining Ltd. | 7,367 | 124,356 | ||||||
| Qantas Airways Ltd. | 23,435 | 56,287 | ||||||
| REA Group Ltd. | 8,300 | 361,008 | ||||||
| Scentre Group, REIT | 71,981 | 259,865 | ||||||
| Tabcorp Holdings Ltd. | 100,805 | 386,017 | ||||||
| Treasury Wine Estates Ltd. | 62,484 | 530,282 | ||||||
| Westpac Banking Corp. | 8,476 | 192,847 | ||||||
| Woodside Petroleum Ltd. | 5,055 | 112,083 | ||||||
|
| |||||||
| 8,134,590 | ||||||||
|
| |||||||
| Belgium - 1.6% | ||||||||
| Ageas | 23,767 | 869,002 | ||||||
| Anheuser-Busch InBev SA/NV | 2,486 | 326,929 | ||||||
| Colruyt SA | 4,779 | 265,405 | ||||||
| Groupe Bruxelles Lambert SA | 1,467 | 130,215 | ||||||
| KBC Group NV | 4,025 | 234,963 | ||||||
| Proximus SADP | 2,159 | 64,589 | ||||||
| Umicore SA | 5,280 | 331,526 | ||||||
|
| |||||||
| 2,222,629 | ||||||||
|
| |||||||
| Canada - 7.3% | ||||||||
| Alimentation Couche-Tard, Inc., Class B (1) | 9,374 | 454,285 | ||||||
| Bank of Montreal (1) | 8,976 | 588,183 | ||||||
| Bank of Nova Scotia (The) (1) | 15,059 | 797,974 | ||||||
| Barrick Gold Corp. (1) | 15,584 | 275,937 | ||||||
| Canadian Imperial Bank of Commerce (1) | 5,176 | 401,352 | ||||||
| Canadian Tire Corp. Ltd., Class A (1) | 2,858 | 286,203 | ||||||
| CCL Industries, Inc., Class B (1) | 491 | 94,540 | ||||||
| CGI Group, Inc., Class A (1)* | 18,964 | 903,282 | ||||||
| Constellation Software, Inc. (1) | 288 | 129,829 | ||||||
| Dollarama, Inc. (1) | 1,471 | 114,848 | ||||||
| First Quantum Minerals Ltd. (1) | 82,158 | 680,084 | ||||||
| George Weston Ltd. (1) | 1,936 | 161,497 | ||||||
| Great-West Lifeco, Inc. (1) | 2,283 | 56,190 | ||||||
| Kinross Gold Corp. (1)* | 38,304 | 161,455 | ||||||
| Loblaw Cos. Ltd. (1) | 1,505 | 77,432 | ||||||
| Metro, Inc. (1) | 7,934 | 260,465 | ||||||
| Open Text Corp. (1) | 22,960 | 1,487,207 | ||||||
| Royal Bank of Canada (1) | 20,862 | 1,292,157 | ||||||
| Saputo, Inc. (1) | 10,524 | 365,707 | ||||||
| Seven Generations Energy Ltd., Class A (1)* | 9,156 | 220,394 | ||||||
| Sun Life Financial, Inc. (1) | 3,446 | 112,131 | ||||||
| Toronto-Dominion Bank (The) (1) | 27,150 | 1,205,241 | ||||||
|
| |||||||
| 10,126,393 | ||||||||
|
| |||||||
| INVESTMENTS | SHARES | VALUE | ||||||
| China - 0.2% | ||||||||
| Yangzijiang Shipbuilding Holdings Ltd. | 537,600 | $ | 297,393 | |||||
|
| |||||||
| Denmark - 2.0% | ||||||||
| DSV A/S | 8,024 | 400,359 | ||||||
| Genmab A/S * | 3,873 | 662,875 | ||||||
| ISS A/S | 8,807 | 365,972 | ||||||
| Novo Nordisk A/S, Class B | 12,560 | 523,485 | ||||||
| Pandora A/S | 2,308 | 279,544 | ||||||
| Vestas Wind Systems A/S | 6,065 | 500,991 | ||||||
| William Demant Holding A/S * | 3,393 | 69,242 | ||||||
|
| |||||||
| 2,802,468 | ||||||||
|
| |||||||
| Finland - 1.3% | ||||||||
| Kone OYJ, Class B | 2,138 | 108,540 | ||||||
| Neste OYJ | 31,096 | 1,326,430 | ||||||
| Nokia OYJ | 42,143 | 244,276 | ||||||
| Orion OYJ, Class B | 3,101 | 122,253 | ||||||
| UPM-Kymmene OYJ | 2,816 | 59,459 | ||||||
|
| |||||||
| 1,860,958 | ||||||||
|
| |||||||
| France - 8.5% | ||||||||
| Airbus Group SE | 1,221 | 74,055 | ||||||
| Atos SE | 8,793 | 946,643 | ||||||
| AXA SA | 19,281 | 409,956 | ||||||
| BNP Paribas SA | 19,306 | 992,977 | ||||||
| Capgemini SA | 2,295 | 225,010 | ||||||
| Cie Generale des Etablissements Michelin | 6,126 | 678,363 | ||||||
| CNP Assurances | 67,240 | 1,129,694 | ||||||
| Gecina SA, REIT | 483 | 76,116 | ||||||
| L’Oreal SA | 4,096 | 774,183 | ||||||
| Orange SA | 38,802 | 607,932 | ||||||
| Peugeot SA * | 47,834 | 730,462 | ||||||
| Publicis Groupe SA | 2,866 | 216,864 | ||||||
| Renault SA | 10,492 | 863,168 | ||||||
| Sanofi | 4,054 | 308,716 | ||||||
| SCOR SE | 6,374 | 198,219 | ||||||
| Societe BIC SA | 872 | 128,925 | ||||||
| Societe Generale SA | 12,656 | 437,825 | ||||||
| Sodexo SA | 5,427 | 646,463 | ||||||
| Thales SA | 8,824 | 812,522 | ||||||
| TOTAL SA | 16,452 | 782,467 | ||||||
| Unibail-Rodamco SE, REIT | 333 | 89,788 | ||||||
| Valeo SA | 6,156 | 359,318 | ||||||
| Vinci SA | 2,881 | 220,622 | ||||||
|
| |||||||
| 11,710,288 | ||||||||
|
| |||||||
| Germany - 8.4% | ||||||||
| adidas AG | 6,955 | 1,209,645 | ||||||
| Allianz SE | 6,822 | 1,013,819 | ||||||
| Bayer AG | 1,003 | 100,732 | ||||||
| Continental AG | 1,698 | 357,771 | ||||||
| Covestro AG (a) | 6,569 | 388,741 | ||||||
| Deutsche Lufthansa AG | 92,328 | 1,029,305 | ||||||
| Deutsche Post AG | 7,039 | 220,380 | ||||||
| Deutsche Telekom AG | 23,191 | 389,621 | ||||||
| Fresenius SE & Co. KGaA | 2,780 | 222,071 | ||||||
| Hannover Rueck SE | 3,736 | 400,482 | ||||||
| HeidelbergCement AG | 4,124 | 390,014 | ||||||
| Infineon Technologies AG | 118,459 | 2,112,305 | ||||||
| METRO AG | 10,806 | 321,649 | ||||||
| The accompanying notes are an integral part of these financial statements. | (Continued) |
| AQR Funds | Annual Report | September 2016 | ||||||||||||||
80
| Schedule of Investments | September 30, 2016 |
| AQR TM INTERNATIONAL MULTI-STYLE FUND |
| INVESTMENTS | SHARES | VALUE | ||||||
| Germany - 8.4% (continued) | ||||||||
| Muenchener Rueckversicherungs-Gesellschaft AG in Muenchen | 4,107 | $ | 767,048 | |||||
| OSRAM Licht AG | 8,951 | 525,839 | ||||||
| SAP SE | 6,543 | 598,373 | ||||||
| Siemens AG | 12,219 | 1,432,804 | ||||||
| Vonovia SE | 3,353 | 127,109 | ||||||
|
| |||||||
| 11,607,708 | ||||||||
|
| |||||||
| Hong Kong - 3.2% | ||||||||
| BOC Hong Kong Holdings Ltd. | 118,000 | 401,483 | ||||||
| CK Hutchison Holdings Ltd. | 9,500 | 121,431 | ||||||
| CLP Holdings Ltd. | 44,000 | 455,711 | ||||||
| Hang Seng Bank Ltd. | 2,200 | 39,493 | ||||||
| Henderson Land Development Co. Ltd. | 7,040 | 42,006 | ||||||
| Hong Kong Exchanges and Clearing Ltd. | 8,300 | 219,662 | ||||||
| Link REIT | 13,000 | 95,967 | ||||||
| NWS Holdings Ltd. | 50,000 | 83,791 | ||||||
| PCCW Ltd. | 30,000 | 18,477 | ||||||
| Sino Land Co. Ltd. | 66,000 | 117,634 | ||||||
| WH Group Ltd. (a) | 2,317,500 | 1,873,103 | ||||||
| Wheelock & Co. Ltd. | 28,000 | 166,314 | ||||||
| Yue Yuen Industrial Holdings Ltd. | 182,000 | 752,178 | ||||||
|
| |||||||
| 4,387,250 | ||||||||
|
| |||||||
| Italy - 1.5% | ||||||||
| Assicurazioni Generali SpA | 4,055 | 49,487 | ||||||
| Enel SpA | 160,694 | 716,169 | ||||||
| Eni SpA | 5,508 | 79,372 | ||||||
| Leonardo-Finmeccanica SpA * | 34,580 | 391,953 | ||||||
| Mediobanca SpA | 15,122 | 98,420 | ||||||
| Prysmian SpA | 14,433 | 377,935 | ||||||
| Snam SpA | 33,809 | 187,466 | ||||||
| Terna Rete Elettrica Nazionale SpA | 27,302 | 140,730 | ||||||
| UnipolSai SpA | 33,760 | 54,968 | ||||||
|
| |||||||
| 2,096,500 | ||||||||
|
| |||||||
| Japan - 21.3% | ||||||||
| Acom Co. Ltd. * | 16,500 | 77,790 | ||||||
| AEON Financial Service Co. Ltd. | 800 | 14,003 | ||||||
| Amada Holdings Co. Ltd. | 90,900 | 945,569 | ||||||
| Astellas Pharma, Inc. | 25,700 | 401,410 | ||||||
| Bandai Namco Holdings, Inc. | 6,900 | 211,196 | ||||||
| Bridgestone Corp. | 11,600 | 427,388 | ||||||
| Central Japan Railway Co. | 3,400 | 582,097 | ||||||
| Chubu Electric Power Co., Inc. | 30,800 | 448,155 | ||||||
| Credit Saison Co. Ltd. | 2,900 | 48,147 | ||||||
| Dai-ichi Life Insurance Co. Ltd. (The) | 15,200 | 208,537 | ||||||
| Daiichi Sankyo Co. Ltd. | 23,800 | 571,876 | ||||||
| Daikin Industries Ltd. | 1,400 | 130,642 | ||||||
| Daiwa House Industry Co. Ltd. | 4,400 | 120,757 | ||||||
| Fuji Heavy Industries Ltd. | 56,300 | 2,112,348 | ||||||
| FUJIFILM Holdings Corp. | 4,000 | 148,172 | ||||||
| GungHo Online Entertainment, Inc. | 16,400 | 40,298 | ||||||
| Hakuhodo DY Holdings, Inc. | 5,100 | 59,773 | ||||||
| Hisamitsu Pharmaceutical Co., Inc. | 1,800 | 97,290 | ||||||
| Hitachi Chemical Co. Ltd. | 31,500 | 723,773 | ||||||
| Hitachi High-Technologies Corp. | 9,900 | 396,307 | ||||||
| Honda Motor Co. Ltd. | 5,400 | 155,846 | ||||||
| Hoya Corp. | 2,100 | 84,478 | ||||||
| INVESTMENTS | SHARES | VALUE | ||||||
| Japan - 21.3% (continued) | ||||||||
| Idemitsu Kosan Co. Ltd. | 15,400 | $ | 318,844 | |||||
| Iida Group Holdings Co. Ltd. | 1,100 | 22,135 | ||||||
| ITOCHU Corp. | 77,200 | 971,915 | ||||||
| Japan Real Estate Investment Corp., REIT | 9 | 53,819 | ||||||
| Japan Tobacco, Inc. | 7,900 | 323,388 | ||||||
| JGC Corp. | 3,000 | 52,226 | ||||||
| JTEKT Corp. | 13,900 | 208,778 | ||||||
| Kaneka Corp. | 14,000 | 110,844 | ||||||
| Kao Corp. | 1,500 | 84,807 | ||||||
| KDDI Corp. | 17,300 | 535,989 | ||||||
| Komatsu Ltd. | 5,200 | 119,284 | ||||||
| Konami Holdings Corp. | 28,800 | 1,112,841 | ||||||
| Kuraray Co. Ltd. | 12,200 | 180,987 | ||||||
| Kurita Water Industries Ltd. | 7,000 | 166,329 | ||||||
| Kyocera Corp. | 1,300 | 62,469 | ||||||
| Mazda Motor Corp. | 3,800 | 58,299 | ||||||
| Medipal Holdings Corp. | 4,000 | 69,337 | ||||||
| MEIJI Holdings Co. Ltd. | 700 | 69,503 | ||||||
| Mitsubishi Chemical Holdings Corp. | 16,200 | 101,564 | ||||||
| Mitsubishi Electric Corp. | 86,000 | 1,102,237 | ||||||
| Mitsubishi Estate Co. Ltd. | 9,000 | 168,899 | ||||||
| Mitsubishi Tanabe Pharma Corp. | 17,900 | 383,390 | ||||||
| Mitsubishi UFJ Financial Group, Inc. | 123,200 | 624,142 | ||||||
| Mitsui Chemicals, Inc. | 132,000 | 627,891 | ||||||
| Mitsui Fudosan Co. Ltd. | 7,000 | 148,921 | ||||||
| Mixi, Inc. | 6,400 | 231,878 | ||||||
| Mizuho Financial Group, Inc. | 490,900 | 827,382 | ||||||
| Nexon Co. Ltd. | 26,600 | 417,849 | ||||||
| Nikon Corp. | 60,100 | 897,549 | ||||||
| Nippon Telegraph & Telephone Corp. | 48,000 | 2,195,327 | ||||||
| Nitto Denko Corp. | 4,700 | 305,245 | ||||||
| Nomura Real Estate Holdings, Inc. | 2,700 | 45,639 | ||||||
| Nomura Real Estate Master Fund, Inc., REIT | 65 | 108,411 | ||||||
| NTT Data Corp. | 1,000 | 49,944 | ||||||
| NTT DOCOMO, Inc. | 10,400 | 264,191 | ||||||
| Obayashi Corp. | 15,600 | 154,733 | ||||||
| ORIX Corp. | 9,700 | 143,101 | ||||||
| Otsuka Holdings Co. Ltd. | 7,900 | 360,103 | ||||||
| Sekisui House Ltd. | 4,400 | 74,961 | ||||||
| Shin-Etsu Chemical Co. Ltd. | 4,700 | 327,932 | ||||||
| Shionogi & Co. Ltd. | 10,400 | 532,829 | ||||||
| Sompo Japan Nipponkoa Holdings, Inc. | 8,700 | 257,845 | ||||||
| Sumitomo Corp. | 25,200 | 282,105 | ||||||
| Sumitomo Dainippon Pharma Co. Ltd. | 25,200 | 488,091 | ||||||
| Sumitomo Heavy Industries Ltd. | 8,000 | 39,528 | ||||||
| Sumitomo Mitsui Financial Group, Inc. | 23,000 | 776,931 | ||||||
| Sumitomo Mitsui Trust Holdings, Inc. | 1,700 | 55,542 | ||||||
| Suzuken Co. Ltd. | 6,500 | 214,633 | ||||||
| TDK Corp. | 16,500 | 1,105,486 | ||||||
| Terumo Corp. | 2,600 | 100,011 | ||||||
| Tokyo Electric Power Co. Holdings, Inc. * | 274,200 | 1,187,809 | ||||||
| Tokyo Electron Ltd. | 4,400 | 388,889 | ||||||
| Toppan Printing Co. Ltd. | 10,000 | 90,269 | ||||||
| Toyo Seikan Group Holdings Ltd. | 5,000 | 88,396 | ||||||
| Toyota Motor Corp. | 14,800 | 858,495 | ||||||
| Yamaha Corp. | 16,700 | 540,602 | ||||||
| Yamazaki Baking Co. Ltd. | 2,000 | 49,178 | ||||||
| Yokogawa Electric Corp. | 26,100 | 347,700 | ||||||
|
| |||||||
| 29,493,274 | ||||||||
|
| |||||||
| The accompanying notes are an integral part of these financial statements. | (Continued) |
| AQR Funds | Annual Report | September 2016 | ||||||||||||||
81
| Schedule of Investments | September 30, 2016 |
| AQR TM INTERNATIONAL MULTI-STYLE FUND |
| INVESTMENTS | SHARES | VALUE | ||||||
| Netherlands - 4.4% | ||||||||
| ASML Holding NV | 411 | $ | 45,042 | |||||
| ING Groep NV | 28,255 | 348,825 | ||||||
| Koninklijke Ahold NV * | 65,090 | 1,482,488 | ||||||
| NN Group NV | 33,697 | 1,034,512 | ||||||
| Randstad Holding NV | 2,263 | 102,904 | ||||||
| Royal Dutch Shell plc, Class A | 24,398 | 606,971 | ||||||
| Royal Dutch Shell plc, Class B | 35,605 | 923,085 | ||||||
| Wolters Kluwer NV | 37,262 | 1,592,996 | ||||||
|
| |||||||
| 6,136,823 | ||||||||
|
| |||||||
| Singapore - 0.4% | ||||||||
| CapitaLand Commercial Trust Ltd., REIT | 42,100 | 49,238 | ||||||
| DBS Group Holdings Ltd. | 14,300 | 162,260 | ||||||
| Oversea-Chinese Banking Corp. Ltd. | 24,900 | 158,692 | ||||||
| United Overseas Bank Ltd. | 2,900 | 40,234 | ||||||
| Wilmar International Ltd. | 73,900 | 175,452 | ||||||
|
| |||||||
| 585,876 | ||||||||
|
| |||||||
| South Africa - 0.6% | ||||||||
| Investec plc | 95,068 | 579,512 | ||||||
| Mondi plc | 13,262 | 278,635 | ||||||
|
| |||||||
| 858,147 | ||||||||
|
| |||||||
| Spain - 3.0% | ||||||||
| Aena SA (a) | 12,640 | 1,865,789 | ||||||
| Banco de Sabadell SA | 129,798 | 166,288 | ||||||
| Banco Santander SA | 108,089 | 479,520 | ||||||
| Endesa SA | 12,688 | 272,027 | ||||||
| Gas Natural SDG SA | 2,169 | 44,591 | ||||||
| Iberdrola SA | 116,796 | 794,143 | ||||||
| Industria de Diseno Textil SA | 9,890 | 366,701 | ||||||
| Repsol SA | 8,580 | 116,553 | ||||||
|
| |||||||
| 4,105,612 | ||||||||
|
| |||||||
| Sweden - 2.8% | ||||||||
| Assa Abloy AB, Class B | 8,111 | 164,715 | ||||||
| Hexagon AB, Class B | 25,991 | 1,135,069 | ||||||
| Husqvarna AB, Class B | 4,651 | 40,592 | ||||||
| Investor AB, Class B | 2,740 | 100,187 | ||||||
| Nordea Bank AB | 30,977 | 307,616 | ||||||
| Sandvik AB | 3,692 | 40,626 | ||||||
| Securitas AB, Class B | 58,843 | 985,444 | ||||||
| Skanska AB, Class B | 16,306 | 380,953 | ||||||
| Svenska Cellulosa AB SCA, Class B | 4,374 | 129,824 | ||||||
| Swedish Match AB | 1,210 | 44,397 | ||||||
| Telefonaktiebolaget LM Ericsson, Class B | 21,784 | 157,287 | ||||||
| Volvo AB, Class B | 32,418 | 370,145 | ||||||
|
| |||||||
| 3,856,855 | ||||||||
|
| |||||||
| Switzerland - 8.6% | ||||||||
| ABB Ltd. * | 12,689 | 285,984 | ||||||
| Actelion Ltd. * | 3,836 | 665,676 | ||||||
| Baloise Holding AG | 3,966 | 480,211 | ||||||
| Coca-Cola HBC AG * | 14,323 | 332,746 | ||||||
| Galenica AG | 1,193 | 1,268,664 | ||||||
| Givaudan SA | 123 | 250,762 | ||||||
| Nestle SA | 20,202 | 1,595,232 | ||||||
| Novartis AG | 9,023 | 712,098 | ||||||
| Roche Holding AG | 9,686 | 2,406,957 | ||||||
| INVESTMENTS | SHARES | VALUE | ||||||
| Switzerland - 8.6% (continued) | ||||||||
| SGS SA | 366 | $ | 820,124 | |||||
| Sika AG | 35 | 170,524 | ||||||
| Swiss Life Holding AG * | 2,494 | 646,751 | ||||||
| Swiss Re AG | 15,507 | 1,400,568 | ||||||
| Syngenta AG | 667 | 292,108 | ||||||
| UBS Group AG | 37,004 | 505,492 | ||||||
|
| |||||||
| 11,833,897 | ||||||||
|
| |||||||
| United Kingdom - 14.7% | ||||||||
| 3i Group plc | 6,980 | 58,851 | ||||||
| Admiral Group plc | 8,136 | 215,938 | ||||||
| Aggreko plc | 3,484 | 42,953 | ||||||
| Anglo American plc * | 4,704 | 58,663 | ||||||
| Ashtead Group plc | 7,752 | 127,399 | ||||||
| Auto Trader Group plc (a) | 77,829 | 409,145 | ||||||
| BAE Systems plc | 19,261 | 130,845 | ||||||
| Barclays plc | 102,789 | 222,849 | ||||||
| Barratt Developments plc | 152,801 | 978,237 | ||||||
| Berkeley Group Holdings plc | 18,184 | 607,595 | ||||||
| BP plc | 40,806 | 237,847 | ||||||
| British American Tobacco plc | 16,289 | 1,038,848 | ||||||
| British Land Co. plc (The), REIT | 9,564 | 78,338 | ||||||
| BT Group plc | 181,125 | 911,298 | ||||||
| Compass Group plc | 42,854 | 829,939 | ||||||
| Diageo plc | 5,686 | 162,867 | ||||||
| Direct Line Insurance Group plc | 144,477 | 682,471 | ||||||
| Dixons Carphone plc | 38,595 | 184,347 | ||||||
| Fiat Chrysler Automobiles NV | 101,468 | 644,951 | ||||||
| GlaxoSmithKline plc | 8,398 | 178,865 | ||||||
| Hammerson plc, REIT | 5,925 | 45,094 | ||||||
| HSBC Holdings plc | 275,889 | 2,073,794 | ||||||
| Imperial Brands plc | 6,967 | 358,596 | ||||||
| Intertek Group plc | 9,487 | 428,280 | ||||||
| J Sainsbury plc | 14,761 | 47,015 | ||||||
| Kingfisher plc | 79,044 | 385,661 | ||||||
| Land Securities Group plc, REIT | 4,025 | 55,158 | ||||||
| Legal & General Group plc | 34,823 | 98,689 | ||||||
| Lloyds Banking Group plc | 1,369,355 | 967,471 | ||||||
| Marks & Spencer Group plc | 41,733 | 179,040 | ||||||
| National Grid plc | 53,255 | 752,111 | ||||||
| Old Mutual plc | 20,110 | 52,713 | ||||||
| Persimmon plc | 29,480 | 693,151 | ||||||
| Prudential plc | 37,850 | 670,954 | ||||||
| Reckitt Benckiser Group plc | 6,067 | 571,177 | ||||||
| RELX plc | 7,916 | 150,115 | ||||||
| Rio Tinto Ltd. | 3,006 | 119,580 | ||||||
| Royal Mail plc | 6,552 | 41,577 | ||||||
| SABMiller plc | 9,366 | 545,565 | ||||||
| Sage Group plc (The) | 39,230 | 374,829 | ||||||
| Segro plc, REIT | 63,452 | 372,785 | ||||||
| Sky plc | 36,287 | 420,570 | ||||||
| Standard Chartered plc * | 13,757 | 111,951 | ||||||
| Taylor Wimpey plc | 171,546 | 342,162 | ||||||
| Unilever plc | 12,180 | 576,359 | ||||||
| Vodafone Group plc | 135,401 | 388,320 | ||||||
| William Hill plc | 26,510 | 104,582 | ||||||
| Wm Morrison Supermarkets plc | 150,867 | 425,996 | ||||||
| WPP plc | 51,151 | 1,202,337 | ||||||
|
| |||||||
| 20,357,878 | ||||||||
|
| |||||||
| The accompanying notes are an integral part of these financial statements. | (Continued) |
| AQR Funds | Annual Report | September 2016 | ||||||||||||||
82
| Schedule of Investments | September 30, 2016 |
| AQR TM INTERNATIONAL MULTI-STYLE FUND |
| INVESTMENTS | SHARES | VALUE | ||||||
| United States - 0.5% | ||||||||
| Shire plc | 1,532 | $ | 99,064 | |||||
| Valeant Pharmaceuticals International, Inc. (1)* | 21,720 | 532,922 | ||||||
|
| |||||||
| 631,986 | ||||||||
|
| |||||||
TOTAL COMMON STOCKS |
| 133,106,525 | ||||||
|
| |||||||
| PREFERRED STOCK - 0.1% | ||||||||
| Germany - 0.1% | ||||||||
| Henkel AG & Co. KGaA | ||||||||
(cost $141,996) | 1,289 | 175,434 | ||||||
|
| |||||||
| SHORT-TERM INVESTMENT - 2.8% | ||||||||
| Investment Company - 2.8% | ||||||||
| J.P. Morgan U.S. Treasury Plus Money Market Fund - IM Shares, 0.22% | ||||||||
(cost $3,849,890) (b) | 3,849,890 | 3,849,890 | ||||||
|
| |||||||
TOTAL INVESTMENTS IN SECURITIES AT VALUE - 99.1% | 137,131,849 | |||||||
|
| |||||||
| OTHER ASSETS IN EXCESS OF LIABILITIES - 0.9% (c) | 1,195,183 | |||||||
|
| |||||||
NET ASSETS - 100.0% | 138,327,032 | |||||||
|
| |||||||
| SECTOR | VALUE | % OF NET ASSETS | ||||||
| Consumer Discretionary | $ | 20,561,066 | 14.9 | % | ||||
| Consumer Staples | 13,599,810 | 9.8 | ||||||
| Energy | 5,548,647 | 4.0 | ||||||
| Financials | 27,455,617 | 19.7 | ||||||
| Health Care | 11,553,867 | 8.4 | ||||||
| Industrials | 20,576,542 | 14.9 | ||||||
| Information Technology | 13,070,128 | 9.4 | ||||||
| Materials | 7,833,618 | 5.7 | ||||||
| Real Estate | 2,708,008 | 2.0 | ||||||
| Telecommunication Services | 5,375,745 | 3.9 | ||||||
| Utilities | 4,998,911 | 3.6 | ||||||
| Short-Term Investment | 3,849,890 | 2.8 | ||||||
|
|
|
| |||||
Total Investments In Securities At Value | 137,131,849 | 99.1 | ||||||
| Other Assets in Excess of Liabilities (c) | 1,195,183 | 0.9 | ||||||
|
|
|
| |||||
Net Assets | $ | 138,327,032 | 100.0 | % | ||||
|
|
|
| |||||
| * | Non-income producing security. |
| (a) | Securities exempt from registration under Rule 144A or section 4(2), of the Securities Act of 1933. Under procedures approved by the Board of Trustees, such securities have been determined to be liquid by the investment adviser and may be resold, normally to qualified institutional buyers in transactions exempt from registration. Total value of all such securities at 9/30/2016 amounted to $4,536,778, which represents approximately 3.28% of net assets of the fund. |
| (b) | Represents 7-day effective yield as of 9/30/2016. |
| (c) | Includes appreciation/(depreciation) on futures contracts. |
All securities are Level 2 with respect to ASC 820, unless otherwise noted in parentheses.
| (1) | Level 1 security (See Note 4). |
Abbreviations
OYJ - Public Traded Company
REIT - Real Estate Investment Trust
SCA - Limited partnership with share capital
Open futures contracts outstanding at September 30, 2016:
Exchange Traded
| NUMBER OF CONTRACTS | COUNTERPARTY | DESCRIPTION | EXPIRATION DATE | VALUE AT TRADE DATE | VALUE AT SEPTEMBER 30, 2016 | UNREALIZED APPRECIATION (DEPRECIATION) | ||||||||||||
| Long Contracts: | ||||||||||||||||||
| 42 | JPMS | E-Mini MSCI EAFE Index Futures | 12/2016 | $ | 3,555,114 | $ | 3,584,070 | $ | 28,956 | |||||||||
|
|
|
|
|
| |||||||||||||
Collateral pledged to, or (received from), each counterparty at September 30, 2016 was as follows:
| COUNTERPARTY | OVER THE COUNTER | EXCHANGE TRADED | TOTAL | |||||||||
| JPMS | ||||||||||||
| Cash | $— | $179,250 | $179,250 | |||||||||
| ||||||||||||
| The accompanying notes are an integral part of these financial statements. |
| AQR Funds | Annual Report | September 2016 | ||||||||||||||
83
| Schedule of Investments | September 30, 2016 |
| AQR TM EMERGING MULTI-STYLE FUND |
| INVESTMENTS | SHARES | VALUE | ||||||
| COMMON STOCKS - 94.8% | ||||||||
| Brazil - 5.6% | ||||||||
| Ambev SA, ADR (1) | 35,100 | $ | 213,759 | |||||
| Banco Bradesco SA, ADR (1) | 428,493 | 3,886,432 | ||||||
| Banco Santander Brasil SA, ADR (1) | 25,147 | 168,485 | ||||||
| BM&FBovespa SA - Bolsa de Valores Mercadorias e Futuros(1) | 191,300 | 994,102 | ||||||
| Cia de Saneamento Basico do Estado de Sao Paulo, ADR (1) | 142,279 | 1,317,504 | ||||||
| EDP - Energias do Brasil SA (1) | 43,900 | 193,842 | ||||||
| Equatorial Energia SA (1) | 57,600 | 902,748 | ||||||
| Itau Unibanco Holding SA, ADR (1) | 204,809 | 2,240,611 | ||||||
| JBS SA (1) | 797,100 | 2,897,075 | ||||||
| Kroton Educacional SA (1) | 217,300 | 995,578 | ||||||
| M Dias Branco SA (1) | 4,500 | 184,945 | ||||||
| Natura Cosmeticos SA (1) | 11,200 | 108,344 | ||||||
| Porto Seguro SA (1) | 31,600 | 291,402 | ||||||
| Qualicorp SA (1) | 91,900 | 540,863 | ||||||
| Raia Drogasil SA (1) | 13,700 | 281,654 | ||||||
| Sul America SA (1) | 13,700 | 68,328 | ||||||
| Telefonica Brasil SA, ADR (1) | 15,025 | 217,412 | ||||||
| TIM Participacoes SA, ADR (1) | 40,364 | 494,055 | ||||||
| Transmissora Alianca de Energia Eletrica SA (1) | 20,300 | 130,521 | ||||||
|
| |||||||
| 16,127,660 | ||||||||
|
| |||||||
| Chile - 1.1% | ||||||||
| Banco Santander Chile, ADR (1) | 13,356 | 276,336 | ||||||
| Cencosud SA (1) | 627,928 | 1,886,195 | ||||||
| Cia Cervecerias Unidas SA, ADR (1) | 21,758 | 439,294 | ||||||
| Enersis Americas SA, ADR (1) | 9,249 | 75,749 | ||||||
| Enersis Chile SA, ADR (1) | 58,532 | 278,027 | ||||||
| Itau CorpBanca (1) | 7,771,910 | 68,486 | ||||||
| Latam Airlines Group SA, ADR (1)* | 29,704 | 241,197 | ||||||
|
| |||||||
| 3,265,284 | ||||||||
|
| |||||||
| China - 26.3% | ||||||||
| 58.com, Inc., ADR (1)* | 5,066 | 241,446 | ||||||
| Agricultural Bank of China Ltd., Class H | 1,269,000 | 547,366 | ||||||
| Air China Ltd., Class H | 1,114,000 | 753,049 | ||||||
| Alibaba Group Holding Ltd., ADR (1)* | 73,489 | 7,774,401 | ||||||
| ANTA Sports Products Ltd. | 44,000 | 120,308 | ||||||
| Baidu, Inc., ADR (1)* | 18,474 | 3,363,561 | ||||||
| Bank of China Ltd., Class H | 3,491,000 | 1,612,157 | ||||||
| Bank of Communications Co. Ltd., Class H | 97,000 | 74,607 | ||||||
| Beijing Capital International Airport Co. Ltd., Class H | 96,000 | 109,433 | ||||||
| Beijing Enterprises Holdings Ltd. | 5,000 | 25,516 | ||||||
| Belle International Holdings Ltd. | 469,000 | 324,726 | ||||||
| China Cinda Asset Management Co. Ltd., Class H | 89,000 | 31,697 | ||||||
| China CITIC Bank Corp. Ltd., Class H | 900,000 | 601,990 | ||||||
| China Communications Construction Co. Ltd., Class H | 39,000 | 41,389 | ||||||
| China Communications Services Corp. Ltd., Class H | 1,606,000 | 1,008,044 | ||||||
| China Construction Bank Corp., Class H | 6,335,000 | 4,757,828 | ||||||
| China Everbright Bank Co. Ltd., Class H | 1,911,000 | 895,006 | ||||||
| China Galaxy Securities Co. Ltd., Class H | 2,516,500 | 2,314,588 | ||||||
| China Merchants Bank Co. Ltd., Class H | 693,500 | 1,763,595 | ||||||
| INVESTMENTS | SHARES | VALUE | ||||||
| China - 26.3% (continued) | ||||||||
| China Minsheng Banking Corp. Ltd., Class H | 690,500 | $ | 802,169 | |||||
| China Mobile Ltd. | 468,975 | 5,761,062 | ||||||
| China Overseas Land & Investment Ltd. | 400,000 | 1,375,198 | ||||||
| China Petroleum & Chemical Corp., Class H | 756,000 | 558,125 | ||||||
| China Railway Construction Corp. Ltd., Class H | 207,500 | 237,767 | ||||||
| China Resources Land Ltd. | 302,000 | 851,460 | ||||||
| China Southern Airlines Co. Ltd., Class H | 1,944,000 | 1,096,623 | ||||||
| China Telecom Corp. Ltd., Class H | 2,920,000 | 1,489,680 | ||||||
| China Vanke Co. Ltd., Class H | 373,700 | 976,983 | ||||||
| Chongqing Rural Commercial Bank Co. Ltd., Class H | 1,207,000 | 748,541 | ||||||
| CNOOC Ltd., ADR (1) | 5,304 | 670,903 | ||||||
| Country Garden Holdings Co. Ltd. | 1,935,000 | 1,028,142 | ||||||
| Ctrip.com International Ltd., ADR (1)* | 22,693 | 1,056,813 | ||||||
| Dongfeng Motor Group Co. Ltd., Class H | 22,000 | 22,186 | ||||||
| Evergrande Real Estate Group Ltd. | 786,000 | 537,097 | ||||||
| Far East Horizon Ltd. | 192,000 | 182,648 | ||||||
| Geely Automobile Holdings Ltd. | 5,170,000 | 4,655,329 | ||||||
| Great Wall Motor Co. Ltd., Class H | 1,582,000 | 1,555,666 | ||||||
| Industrial & Commercial Bank of China Ltd., Class H | 5,209,000 | 3,306,000 | ||||||
| JD.com, Inc., ADR (1)* | 46,823 | 1,221,612 | ||||||
| Kingsoft Corp. Ltd. (a) | 81,000 | 193,525 | ||||||
| Kunlun Energy Co. Ltd. | 210,000 | 162,335 | ||||||
| Longfor Properties Co. Ltd. | 474,000 | 732,246 | ||||||
| NetEase, Inc., ADR (1) | 5,427 | 1,306,713 | ||||||
| New Oriental Education & Technology Group, Inc., ADR (1)* | 8,807 | 408,293 | ||||||
| People’s Insurance Co. Group of China Ltd. (The), Class H | 1,510,000 | 621,897 | ||||||
| PICC Property & Casualty Co. Ltd., Class H | 1,580,000 | 2,648,982 | ||||||
| Ping An Insurance Group Co. of China Ltd., Class H | 101,500 | 532,082 | ||||||
| Shui On Land Ltd. | 586,000 | 160,145 | ||||||
| Sinopec Engineering Group Co. Ltd., Class H | 691,500 | 599,122 | ||||||
| Sinopec Shanghai Petrochemical Co. Ltd., Class H | 3,514,000 | 1,784,499 | ||||||
| Sinopharm Group Co. Ltd., Class H | 392,000 | 1,898,584 | ||||||
| Sinotrans Ltd., Class H | 1,599,000 | 781,319 | ||||||
| Tencent Holdings Ltd. | 249,400 | 6,933,828 | ||||||
| TravelSky Technology Ltd., Class H | 666,000 | 1,589,614 | ||||||
| Vipshop Holdings Ltd., ADR (1)* | 27,558 | 404,276 | ||||||
| Weichai Power Co. Ltd., Class H | 280,000 | 377,797 | ||||||
|
| |||||||
| 75,629,968 | ||||||||
|
| |||||||
| Hong Kong - 0.5% | ||||||||
| Nine Dragons Paper Holdings Ltd. | 1,335,000 | 1,258,823 | ||||||
| Sun Art Retail Group Ltd. (a) | 340,500 | 235,513 | ||||||
|
| |||||||
| 1,494,336 | ||||||||
|
| |||||||
| Hungary - 0.4% | ||||||||
| MOL Hungarian Oil & Gas plc | 7,860 | 486,947 | ||||||
| Richter Gedeon Nyrt | 33,207 | 674,852 | ||||||
|
| |||||||
| 1,161,799 | ||||||||
|
| |||||||
| The accompanying notes are an integral part of these financial statements. | (Continued) |
| AQR Funds | Annual Report | September 2016 | ||||||||||||||
84
| Schedule of Investments | September 30, 2016 |
| AQR TM EMERGING MULTI-STYLE FUND |
| INVESTMENTS | SHARES | VALUE | ||||||
| India - 7.6% | ||||||||
| Axis Bank Ltd., GDR | 2,943 | $ | 118,351 | |||||
| Dr. Reddy’s Laboratories Ltd., ADR (1)(a) | 76,176 | 3,536,090 | ||||||
| ICICI Bank Ltd., ADR (1) | 241,889 | 1,806,911 | ||||||
| Infosys Ltd., ADR (1) | 464,435 | 7,328,784 | ||||||
| Reliance Industries Ltd., GDR (b) | 23,768 | 779,775 | ||||||
| State Bank of India, GDR | 20,020 | 745,334 | ||||||
| Tata Motors Ltd., ADR (1) | 158,918 | 6,353,542 | ||||||
| Wipro Ltd., ADR (1) | 111,478 | 1,082,451 | ||||||
|
| |||||||
| 21,751,238 | ||||||||
|
| |||||||
| Indonesia - 3.2% | ||||||||
| Adaro Energy Tbk. PT | 1,192,300 | 110,641 | ||||||
| Bank Mandiri Persero Tbk. PT | 185,100 | 159,709 | ||||||
| Bank Rakyat Indonesia Persero Tbk. PT | 1,382,000 | 1,296,783 | ||||||
| Gudang Garam Tbk. PT | 212,100 | 1,009,261 | ||||||
| Indofood CBP Sukses Makmur Tbk. PT | 138,600 | 100,883 | ||||||
| Indofood Sukses Makmur Tbk. PT | 639,600 | 427,755 | ||||||
| Telekomunikasi Indonesia Persero Tbk. PT | 14,356,100 | 4,780,404 | ||||||
| United Tractors Tbk. PT | 743,900 | 1,013,508 | ||||||
| Waskita Karya Persero Tbk. PT | 893,700 | 179,824 | ||||||
|
| |||||||
| 9,078,768 | ||||||||
|
| |||||||
| Korea, Republic of - 14.9% | ||||||||
| AMOREPACIFIC Group | 2,555 | 386,026 | ||||||
| CJ Corp. | 1,364 | 231,600 | ||||||
| Daelim Industrial Co. Ltd. | 9,893 | 749,167 | ||||||
| DGB Financial Group, Inc. | 26,665 | 219,560 | ||||||
| Dongbu Insurance Co. Ltd. | 9,859 | 612,935 | ||||||
| Hana Financial Group, Inc. | 5,895 | 150,080 | ||||||
| Hankook Tire Co. Ltd. | 8,718 | 471,351 | ||||||
| Hanmi Pharm Co. Ltd. | 2,636 | 1,224,818 | ||||||
| Hanwha Chemical Corp. | 64,373 | 1,425,922 | ||||||
| Hanwha Corp. | 25,951 | 830,764 | ||||||
| Hanwha Life Insurance Co. Ltd. | 17,163 | 90,000 | ||||||
| Hyundai Department Store Co. Ltd. | 862 | 93,144 | ||||||
| Hyundai Engineering & Construction Co. Ltd. | 2,649 | 95,330 | ||||||
| Hyundai Heavy Industries Co. Ltd. * | 6,607 | 835,335 | ||||||
| Hyundai Marine & Fire Insurance Co. Ltd. | 63,483 | 2,095,851 | ||||||
| Hyundai Mobis Co. Ltd. | 3,216 | 807,075 | ||||||
| Industrial Bank of Korea | 10,376 | 113,127 | ||||||
| Kangwon Land, Inc. | 2,756 | 98,480 | ||||||
| KB Financial Group, Inc. | 20,061 | 689,997 | ||||||
| Kia Motors Corp. | 4,819 | 185,155 | ||||||
| Korea Electric Power Corp. | 63,723 | 3,121,549 | ||||||
| KT Corp. | 8,103 | 235,115 | ||||||
| KT&G Corp. | 6,196 | 705,597 | ||||||
| LG Corp. | 2,298 | 135,802 | ||||||
| LG Uplus Corp. | 115,249 | 1,232,539 | ||||||
| Lotte Chemical Corp. | 12,096 | 3,297,278 | ||||||
| Posco Daewoo Corp. | 33,125 | 744,591 | ||||||
| S-1 Corp. | 2,690 | 248,521 | ||||||
| Samsung Electronics Co. Ltd. | 8,679 | 12,643,241 | ||||||
| Shinhan Financial Group Co. Ltd. | 38,233 | 1,400,270 | ||||||
| SK Innovation Co. Ltd. | 36,765 | 5,447,365 | ||||||
| SK Telecom Co. Ltd. | 1,786 | 366,203 | ||||||
| S-Oil Corp. | 8,825 | 655,747 | ||||||
| Woori Bank | 126,902 | 1,319,033 | ||||||
|
| |||||||
| 42,958,568 | ||||||||
|
| |||||||
| INVESTMENTS | SHARES | VALUE | ||||||
| Malaysia - 2.2% | �� | |||||||
| AirAsia Bhd. | 4,589,008 | $ | 3,101,059 | |||||
| Genting Bhd. | 164,900 | 316,535 | ||||||
| IHH Healthcare Bhd. | 245,500 | 376,013 | ||||||
| Malayan Banking Bhd. | 152,200 | 276,262 | ||||||
| MISC Bhd. | 157,600 | 287,815 | ||||||
| Public Bank Bhd. | 285,000 | 1,366,564 | ||||||
| Tenaga Nasional Bhd. | 150,700 | 521,264 | ||||||
|
| |||||||
| 6,245,512 | ||||||||
|
| |||||||
| Mexico - 4.0% | ||||||||
| Alfa SAB de CV, Class A (1) | 27,500 | 42,917 | ||||||
| America Movil SAB de CV, Class L, ADR (1) | 19,234 | 220,037 | ||||||
| Cemex SAB de CV, ADR (1)* | 89,932 | 714,060 | ||||||
| Coca-Cola Femsa SAB de CV, ADR (1) | 1,715 | 128,625 | ||||||
| Fomento Economico Mexicano SAB de CV, ADR (1) | 9,771 | 899,323 | ||||||
| Gentera SAB de CV (1) | 260,500 | 468,879 | ||||||
| Gruma SAB de CV, Class B (1) | 141,480 | 1,860,205 | ||||||
| Grupo Aeroportuario del Pacifico SAB de CV, Class B (1) | 103,500 | 982,756 | ||||||
| Grupo Aeroportuario del Sureste SAB de CV, ADR (1) | 839 | 122,846 | ||||||
| Grupo Bimbo SAB de CV, Series A (1) | 86,800 | 228,799 | ||||||
| Grupo Financiero Banorte SAB de CV, Class O (1) | 295,700 | 1,550,653 | ||||||
| Grupo Financiero Santander Mexico SAB de CV, Class B, ADR (1) | 107,260 | 943,888 | ||||||
| Grupo Lala SAB de CV (1) | 507,500 | 966,592 | ||||||
| Grupo Televisa SAB, ADR (1) | 31,296 | 803,994 | ||||||
| Kimberly-Clark de Mexico SAB de CV, Class A (1) | 457,400 | 1,034,648 | ||||||
| OHL Mexico SAB de CV (1)* | 338,600 | 449,144 | ||||||
| Promotora y Operadora de Infraestructura SAB de CV (1) | 3,650 | 39,164 | ||||||
|
| |||||||
| 11,456,530 | ||||||||
|
| |||||||
| Peru - 0.2% | ||||||||
| Credicorp Ltd. (1) | 4,593 | 699,146 | ||||||
|
| |||||||
| Philippines - 0.9% | ||||||||
| Ayala Corp. | 14,440 | 255,844 | ||||||
| Bank of the Philippine Islands | 63,230 | 136,974 | ||||||
| BDO Unibank, Inc. | 123,520 | 280,169 | ||||||
| Globe Telecom, Inc. | 17,870 | 754,460 | ||||||
| JG Summit Holdings, Inc. | 344,940 | 531,085 | ||||||
| Jollibee Foods Corp. | 42,200 | 215,156 | ||||||
| Metropolitan Bank & Trust Co. | 53,350 | 94,014 | ||||||
| Security Bank Corp. | 31,990 | 159,665 | ||||||
| SM Investments Corp. | 10,575 | 147,272 | ||||||
| Universal Robina Corp. | 32,930 | 121,189 | ||||||
|
| |||||||
| 2,695,828 | ||||||||
|
| |||||||
| Poland - 1.5% | ||||||||
| Alior Bank SA * | 3,081 | 37,414 | ||||||
| Bank Pekao SA | 3,258 | 105,485 | ||||||
| Bank Zachodni WBK SA | 3,338 | 271,733 | ||||||
| Cyfrowy Polsat SA * | 13,989 | 89,653 | ||||||
| Energa SA | 40,737 | 79,971 | ||||||
| Eurocash SA | 101,037 | 1,123,738 | ||||||
| The accompanying notes are an integral part of these financial statements. | (Continued) |
| AQR Funds | Annual Report | September 2016 | ||||||||||||||
85
| Schedule of Investments | September 30, 2016 |
| AQR TM EMERGING MULTI-STYLE FUND |
| INVESTMENTS | SHARES | VALUE | ||||||
| Poland - 1.5% (continued) | ||||||||
| Grupa Azoty SA | 4,348 | $ | 70,091 | |||||
| Grupa Lotos SA * | 37,898 | 282,250 | ||||||
| mBank SA * | 1,156 | 103,407 | ||||||
| PGE Polska Grupa Energetyczna SA | 57,113 | 151,733 | ||||||
| Polski Koncern Naftowy ORLEN SA | 71,422 | 1,214,687 | ||||||
| Polskie Gornictwo Naftowe i Gazownictwo SA | 552,682 | 730,388 | ||||||
| Tauron Polska Energia SA * | 83,681 | 56,940 | ||||||
|
| |||||||
| 4,317,490 | ||||||||
|
| |||||||
| Russia - 3.7% | ||||||||
| Gazprom PJSC, ADR (1) | 400,359 | 1,693,519 | ||||||
| Lukoil PJSC, ADR | 33,482 | 1,632,679 | ||||||
| MegaFon PJSC, GDR | 3,197 | 30,472 | ||||||
| Mobile TeleSystems PJSC, ADR (1) | 293,192 | 2,237,055 | ||||||
| Novatek OJSC, GDR | 5,992 | 660,528 | ||||||
| Rosneft OJSC, GDR | 78,075 | 427,059 | ||||||
| Severstal PJSC, GDR | 69,542 | 839,191 | ||||||
| Sistema PJSC FC, GDR | 9,772 | 72,679 | ||||||
| Surgutneftegas OJSC, ADR (1) | 101,167 | 489,648 | ||||||
| Tatneft PJSC, ADR (1) | 78,847 | 2,433,218 | ||||||
| Tatneft PJSC, ADR (LSE) | 3,417 | 105,353 | ||||||
|
| |||||||
| 10,621,401 | ||||||||
|
| |||||||
| South Africa - 6.5% | ||||||||
| AngloGold Ashanti Ltd., ADR (1)* | 28,526 | 454,134 | ||||||
| Barloworld Ltd. | 106,228 | 643,269 | ||||||
| Bid Corp. Ltd. | 21,970 | 415,263 | ||||||
| Bidvest Group Ltd. (The) | 177,139 | 2,088,656 | ||||||
| Brait SE * | 228,863 | 1,840,754 | ||||||
| Capitec Bank Holdings Ltd. | 14,552 | 681,893 | ||||||
| Exxaro Resources Ltd. | 19,341 | 118,902 | ||||||
| Gold Fields Ltd., ADR (1) | 29,771 | 144,389 | ||||||
| Hyprop Investments Ltd., REIT | 84,685 | 747,053 | ||||||
| Imperial Holdings Ltd. | 56,380 | 688,428 | ||||||
| Investec Ltd. | 163,348 | 1,002,684 | ||||||
| Massmart Holdings Ltd. | 18,949 | 163,778 | ||||||
| MMI Holdings Ltd. | 26,587 | 43,297 | ||||||
| Mondi Ltd. | 36,248 | 761,643 | ||||||
| Naspers Ltd., Class N | 22,095 | 3,824,046 | ||||||
| Pick n Pay Stores Ltd. | 152,648 | 765,466 | ||||||
| Redefine Properties Ltd., REIT | 425,319 | 354,875 | ||||||
| Remgro Ltd. | 32,109 | 537,307 | ||||||
| Resilient REIT Ltd. | 74,141 | 620,298 | ||||||
| Sappi Ltd. * | 12,169 | 63,031 | ||||||
| Sasol Ltd. | 23,180 | 633,291 | ||||||
| Sibanye Gold Ltd., ADR (1) | 32,768 | 463,012 | ||||||
| Standard Bank Group Ltd. | 82,816 | 850,964 | ||||||
| Telkom SA SOC Ltd. | 67,461 | 297,442 | ||||||
| Truworths International Ltd. | 73,455 | 380,700 | ||||||
|
| |||||||
| 18,584,575 | ||||||||
|
| |||||||
| Taiwan - 11.9% | ||||||||
| Asustek Computer, Inc. | 24,000 | 214,534 | ||||||
| AU Optronics Corp. | 152,000 | 55,800 | ||||||
| Casetek Holdings Ltd. | 270,000 | 988,513 | ||||||
| Catcher Technology Co. Ltd. | 228,000 | 1,865,615 | ||||||
| China Airlines Ltd. | 1,174,000 | 350,722 | ||||||
| INVESTMENTS | SHARES | VALUE | ||||||
| Taiwan - 11.9% (continued) | ||||||||
| China Development Financial Holding Corp. | 815,000 | $ | 208,782 | |||||
| China Life Insurance Co. Ltd. | 1,089,192 | 1,000,580 | ||||||
| China Steel Corp. | 81,000 | 57,258 | ||||||
| Compal Electronics, Inc. | 1,373,000 | 850,086 | ||||||
| CTBC Financial Holding Co. Ltd. | 487,000 | 283,873 | ||||||
| E.Sun Financial Holding Co. Ltd. | 521,400 | 297,945 | ||||||
| Eva Airways Corp. | 557,550 | 254,784 | ||||||
| Far EasTone Telecommunications Co. Ltd. | 81,000 | 191,519 | ||||||
| Feng TAY Enterprise Co. Ltd. | 66,180 | 294,477 | ||||||
| First Financial Holding Co. Ltd. | 111,000 | 59,114 | ||||||
| Foxconn Technology Co. Ltd. | 539,582 | 1,591,028 | ||||||
| Fubon Financial Holding Co. Ltd. | 433,000 | 643,397 | ||||||
| Hon Hai Precision Industry Co. Ltd. | 1,392,545 | 3,524,062 | ||||||
| Inventec Corp. | 917,000 | 752,787 | ||||||
| Largan Precision Co. Ltd. | 3,000 | 365,629 | ||||||
| Lite-On Technology Corp. | 752,533 | 1,087,959 | ||||||
| MediaTek, Inc. | 20,000 | 153,558 | ||||||
| Mega Financial Holding Co. Ltd. | 623,000 | 439,468 | ||||||
| Nien Made Enterprise Co. Ltd. | 21,000 | 271,562 | ||||||
| Novatek Microelectronics Corp. | 38,000 | 134,643 | ||||||
| Pegatron Corp. | 340,000 | 879,922 | ||||||
| Pou Chen Corp. | 1,044,000 | 1,475,135 | ||||||
| Powertech Technology, Inc. | 560,000 | 1,455,390 | ||||||
| Radiant Opto-Electronics Corp. | 298,000 | 487,137 | ||||||
| Realtek Semiconductor Corp. | 170,000 | 561,067 | ||||||
| Shin Kong Financial Holding Co. Ltd. * | 859,411 | 189,603 | ||||||
| SinoPac Financial Holdings Co. Ltd. | 1,145,214 | 339,038 | ||||||
| Taishin Financial Holding Co. Ltd. | 735,640 | 274,481 | ||||||
| Taiwan Semiconductor Manufacturing Co. Ltd., ADR (1) | 295,893 | 9,051,367 | ||||||
| Uni-President Enterprises Corp. | 706,000 | 1,328,347 | ||||||
| United Microelectronics Corp. | 2,794,000 | 1,031,732 | ||||||
| Wistron Corp. | 982,575 | 732,863 | ||||||
| WPG Holdings Ltd. | 109,000 | 129,320 | ||||||
| Zhen Ding Technology Holding Ltd. | 111,000 | 245,124 | ||||||
|
| |||||||
| 34,118,221 | ||||||||
|
| |||||||
| Thailand - 2.7% | ||||||||
| Airports of Thailand PCL, NVDR | 43,400 | 500,529 | ||||||
| Bangkok Bank PCL, NVDR | 27,900 | 131,342 | ||||||
| Charoen Pokphand Foods PCL, NVDR | 2,782,300 | 2,557,596 | ||||||
| Delta Electronics Thailand PCL, NVDR | 14,000 | 32,105 | ||||||
| Home Product Center PCL, NVDR | 1,193,700 | 345,493 | ||||||
| IRPC PCL, NVDR | 278,000 | 39,269 | ||||||
| PTT Exploration & Production PCL, NVDR | 196,100 | 461,306 | ||||||
| PTT Global Chemical PCL, NVDR | 278,500 | 474,673 | ||||||
| PTT PCL, NVDR | 5,900 | 58,061 | ||||||
| Robinson Department Store PCL, NVDR | 39,500 | 69,418 | ||||||
| Thai Oil PCL, NVDR | 827,300 | 1,640,311 | ||||||
| Thai Union Group PCL, NVDR | 2,240,696 | 1,387,201 | ||||||
|
| |||||||
| 7,697,304 | ||||||||
|
| |||||||
| Turkey - 1.6% | ||||||||
| Arcelik A/S | 264,674 | 1,862,730 | ||||||
| Petkim Petrokimya Holding A/S | 463,398 | 702,485 | ||||||
| Turkiye Garanti Bankasi A/S | 49,260 | 130,530 | ||||||
| Turkiye Sise ve Cam Fabrikalari A/S | 1,030,647 | 1,092,244 | ||||||
| The accompanying notes are an integral part of these financial statements. | (Continued) |
| AQR Funds | Annual Report | September 2016 | ||||||||||||||
86
| Schedule of Investments | September 30, 2016 |
| AQR TM EMERGING MULTI-STYLE FUND |
| INVESTMENTS | SHARES | VALUE | ||||||
| Turkey - 1.6% (continued) | ||||||||
| Turkiye Vakiflar Bankasi TAO, Class D | 355,370 | $ | 543,630 | |||||
| Yapi ve Kredi Bankasi A/S* | 262,074 | 320,400 | ||||||
|
| |||||||
| 4,652,019 | ||||||||
|
| |||||||
TOTAL COMMON STOCKS | 272,555,647 | |||||||
|
| |||||||
| PREFERRED STOCKS - 2.1% | ||||||||
| Brazil - 2.0% | ||||||||
| Braskem SA, Class A (1) | 325,100 | 2,507,113 | ||||||
| Centrais Eletricas Brasileiras SA, Class B (1)* | 256,500 | 1,894,479 | ||||||
| Cia Energetica de Sao Paulo, Series B (1) | 8,200 | 37,418 | ||||||
| Itausa - Investimentos Itau SA (1) | 421,800 | 1,086,876 | ||||||
| Petroleo Brasileiro SA (1)* | 67,700 | 285,193 | ||||||
|
| |||||||
| 5,811,079 | ||||||||
|
| |||||||
| Chile - 0.1% | ||||||||
| Embotelladora Andina SA, Series B (1) | 70,967 | 271,814 | ||||||
|
| |||||||
TOTAL PREFERRED STOCKS |
| 6,082,893 | ||||||
|
| |||||||
| SHORT-TERM INVESTMENT - 2.3% | ||||||||
| Investment Company - 2.3% | ||||||||
| J.P. Morgan U.S. Treasury Plus Money Market Fund - IM Shares, 0.22% | ||||||||
(cost $6,579,902) (c) | 6,579,902 | 6,579,902 | ||||||
|
| |||||||
| SECURITIES LENDING COLLATERAL - 1.4% | ||||||||
| Money Market Funds - 1.4% | ||||||||
| Investments in a Pooled Account through Securities Lending Program with JPMorgan Chase Bank | ||||||||
| Dreyfus Treasury & Agency Cash Management, 0.21% | ||||||||
(cost $4,165,729) (c)(d) | 4,165,729 | 4,165,729 | ||||||
|
| |||||||
TOTAL INVESTMENTS IN SECURITIES AT VALUE - 100.6% |
| 289,384,171 | ||||||
|
| |||||||
| LIABILITIES IN EXCESS OF OTHER ASSETS - (0.6)% (e) | (1,711,214) | |||||||
|
| |||||||
NET ASSETS - 100.0% |
| 287,672,957 | ||||||
|
| |||||||
| SECTOR | VALUE | % OF NET ASSETS | ||||||
| Consumer Discretionary | $ | 29,410,861 | 10.2 | % | ||||
| Consumer Staples | 22,128,883 | 7.7 | ||||||
| Energy | 22,791,007 | 7.9 | ||||||
| Financials | 57,909,333 | 20.1 | ||||||
| Health Care | 8,251,219 | 2.9 | ||||||
| Industrials | 18,948,408 | 6.6 | ||||||
| Information Technology | 68,647,805 | 24.0 | ||||||
| Materials | 15,017,602 | 5.2 | ||||||
| Real Estate | 7,383,498 | 2.6 | ||||||
| Telecommunication Services | 19,388,179 | 6.7 | ||||||
| Utilities | 8,761,745 | 3.0 | ||||||
| Short-Term Investment | 6,579,902 | 2.3 | ||||||
| Securities Lending Collateral | 4,165,729 | 1.4 | ||||||
|
|
|
| |||||
Total Investments In Securities At Value | 289,384,171 | 100.6 | ||||||
| Liabilities in Excess of Other Assets (e) | (1,711,214 | ) | (0.6 | ) | ||||
|
|
|
| |||||
Net Assets | $ | 287,672,957 | 100.0 | % | ||||
|
|
|
| |||||
| * | Non-income producing security. |
| (a) | The security or a portion of this security is on loan at 9/30/2016. The total value of securities on loan at 9/30/2016 was $4,053,488. |
| (b) | Securities exempt from registration under Rule 144A or section 4(2), of the Securities Act of 1933. Under procedures approved by the Board of Trustees, such securities have been determined to be liquid by the investment adviser and may be resold, normally to qualified institutional buyers in transactions exempt from registration. Total value of all such securities at 9/30/2016 amounted to $779,775, which represents approximately 0.27% of net assets of the fund. |
| (c) | Represents 7-day effective yield as of 9/30/2016. |
| (d) | Represents security, or portion thereof, purchased with the cash collateral received for securities on loan. |
| (e) | Includes appreciation/(depreciation) on futures contracts. |
All securities are Level 2 with respect to ASC 820, unless otherwise noted in parentheses.
| (1) | Level 1 security (See Note 4). |
Abbreviations
ADR - American Depositary Receipt
GDR - Global Depositary Receipt
LSE - London Stock Exchange
NVDR - Non-Voting Depositary Receipt
OJSC - Open Joint Stock Company
PJSC - Public Joint Stock Company
REIT - Real Estate Investment Trust
| The accompanying notes are an integral part of these financial statements. | (Continued) |
| AQR Funds | Annual Report | September 2016 | ||||||||||||||
87
| Schedule of Investments | September 30, 2016 |
| AQR TM EMERGING MULTI-STYLE FUND |
Open futures contracts outstanding at September 30, 2016:
Exchange Traded
| NUMBER OF CONTRACTS | COUNTERPARTY | DESCRIPTION | EXPIRATION DATE | VALUE AT TRADE DATE | VALUE AT SEPTEMBER 30, 2016 | UNREALIZED APPRECIATION (DEPRECIATION) | ||||||||||||
| Long Contracts: | ||||||||||||||||||
| 103 | JPMS | E-Mini MSCI Emerging Markets Index Futures | 12/2016 | $ | 4,751,081 | $ | 4,699,375 | $ | (51,706 | ) | ||||||||
|
|
|
|
|
| |||||||||||||
Collateral pledged to, or (received from), each counterparty at September 30, 2016 was as follows:
| COUNTERPARTY | OVER THE COUNTER | EXCHANGE TRADED | TOTAL | |||||||||
| JPMS | ||||||||||||
| Cash | $— | $295,829 | $295,829 | |||||||||
| ||||||||||||
| The accompanying notes are an integral part of these financial statements. |
| AQR Funds | Annual Report | September 2016 | ||||||||||||||
88
| Schedule of Investments | September 30, 2016 |
| AQR LARGE CAP MOMENTUM STYLE FUND |
| INVESTMENTS | SHARES | VALUE | ||||||
| COMMON STOCKS - 97.0% | ||||||||
| Aerospace & Defense - 2.3% | ||||||||
| BWX Technologies, Inc. | 15,551 | $ | 596,692 | |||||
| General Dynamics Corp. | 12,231 | 1,897,762 | ||||||
| Huntington Ingalls Industries, Inc. | 6,059 | 929,572 | ||||||
| Lockheed Martin Corp. | 30,412 | 7,290,364 | ||||||
| Northrop Grumman Corp. | 25,205 | 5,392,610 | ||||||
| Orbital ATK, Inc. | 8,225 | 626,992 | ||||||
| Raytheon Co. | 27,267 | 3,711,857 | ||||||
| TransDigm Group, Inc. * | 3,144 | 908,993 | ||||||
| United Technologies Corp. | 6,091 | 618,845 | ||||||
|
| |||||||
| 21,973,687 | ||||||||
|
| |||||||
| Air Freight & Logistics - 0.5% | ||||||||
| CH Robinson Worldwide, Inc. | 6,166 | 434,456 | ||||||
| United Parcel Service, Inc., Class B | 36,869 | 4,031,994 | ||||||
|
| |||||||
| 4,466,450 | ||||||||
|
| |||||||
| Airlines - 0.3% | ||||||||
| Alaska Air Group, Inc. | 17,355 | 1,143,000 | ||||||
| JetBlue Airways Corp. * | 29,007 | 500,081 | ||||||
| Southwest Airlines Co. | 24,079 | 936,432 | ||||||
|
| |||||||
| 2,579,513 | ||||||||
|
| |||||||
| Auto Components - 0.2% | ||||||||
| Delphi Automotive plc (United Kingdom) | 5,599 | 399,320 | ||||||
| Gentex Corp. | 26,000 | 456,560 | ||||||
| Goodyear Tire & Rubber Co. (The) | 23,409 | 756,111 | ||||||
| Lear Corp. | 5,514 | 668,407 | ||||||
|
| |||||||
| 2,280,398 | ||||||||
|
| |||||||
| Automobiles - 0.1% | ||||||||
| Tesla Motors, Inc. * | 2,729 | 556,798 | ||||||
|
| |||||||
| Banks - 0.4% | ||||||||
| Bank of Hawaii Corp. | 12,152 | 882,478 | ||||||
| BankUnited, Inc. | 13,348 | 403,110 | ||||||
| Commerce Bancshares, Inc. | 19,499 | 960,521 | ||||||
| First Republic Bank | 16,043 | 1,237,076 | ||||||
| People’s United Financial, Inc. | 17,621 | 278,764 | ||||||
| Signature Bank * | 2,800 | 331,660 | ||||||
|
| |||||||
| 4,093,609 | ||||||||
|
| |||||||
| Beverages - 3.1% | ||||||||
| Brown-Forman Corp., Class B | 31,435 | 1,491,276 | ||||||
| Coca-Cola Co. (The) | 163,528 | 6,920,505 | ||||||
| Constellation Brands, Inc., Class A | 24,981 | 4,159,087 | ||||||
| Dr Pepper Snapple Group, Inc. | 39,550 | 3,611,310 | ||||||
| Molson Coors Brewing Co., Class B | 20,295 | 2,228,391 | ||||||
| Monster Beverage Corp. * | 12,205 | 1,791,816 | ||||||
| PepsiCo, Inc. | 81,027 | 8,813,307 | ||||||
|
| |||||||
| 29,015,692 | ||||||||
|
| |||||||
| Biotechnology - 0.1% | ||||||||
| AbbVie, Inc. | 4,622 | 291,509 | ||||||
| Amgen, Inc. | 1,581 | 263,727 | ||||||
|
| |||||||
| 555,236 | ||||||||
|
| |||||||
| INVESTMENTS | SHARES | VALUE | ||||||
| Building Products - 0.8% | ||||||||
| Allegion plc | 8,013 | $ | 552,176 | |||||
| AO Smith Corp. | 18,950 | 1,872,070 | ||||||
| Fortune Brands Home & Security, Inc. | 44,029 | 2,558,085 | ||||||
| Lennox International, Inc. | 4,124 | 647,592 | ||||||
| Masco Corp. | 49,427 | 1,695,840 | ||||||
| Owens Corning | 12,800 | 683,392 | ||||||
|
| |||||||
| 8,009,155 | ||||||||
|
| |||||||
| Capital Markets – 1.2% | ||||||||
| CME Group, Inc. | 25,459 | 2,660,975 | ||||||
| FactSet Research Systems, Inc. | 4,485 | 727,018 | ||||||
| Interactive Brokers Group, Inc., Class A | 41,795 | 1,474,109 | ||||||
| Intercontinental Exchange, Inc. | 9,355 | 2,519,863 | ||||||
| MarketAxess Holdings, Inc. | 1,610 | 266,600 | ||||||
| Morningstar, Inc. | 7,785 | 617,117 | ||||||
| MSCI, Inc. | 14,254 | 1,196,481 | ||||||
| Nasdaq, Inc. | 18,693 | 1,262,525 | ||||||
| S&P Global, Inc. | 4,816 | 609,513 | ||||||
| Thomson Reuters Corp. | 8,785 | 363,523 | ||||||
|
| |||||||
| 11,697,724 | ||||||||
|
| |||||||
| Chemicals - 0.8% | ||||||||
| Air Products & Chemicals, Inc. | 2,729 | 410,278 | ||||||
| Albemarle Corp. | 8,583 | 733,761 | ||||||
| Dow Chemical Co. (The) | 77,910 | 4,038,075 | ||||||
| International Flavors & Fragrances, Inc. | 5,004 | 715,422 | ||||||
| NewMarket Corp. | 1,600 | 686,912 | ||||||
| Sherwin-Williams Co. (The) | 2,808 | 776,861 | ||||||
|
| |||||||
| 7,361,309 | ||||||||
|
| |||||||
| Commercial Services & Supplies - 0.8% | ||||||||
| Cintas Corp. | 23,846 | 2,685,060 | ||||||
| Copart, Inc. * | 10,601 | 567,790 | ||||||
| Republic Services, Inc. | 22,714 | 1,145,921 | ||||||
| Rollins, Inc. | 21,305 | 623,810 | ||||||
| Waste Management, Inc. | 36,120 | 2,303,011 | ||||||
|
| |||||||
| 7,325,592 | ||||||||
|
| |||||||
| Communications Equipment - 1.2% | ||||||||
| Cisco Systems, Inc. | 293,906 | 9,322,699 | ||||||
| Harris Corp. | 8,866 | 812,214 | ||||||
| Motorola Solutions, Inc. | 11,008 | 839,690 | ||||||
| Palo Alto Networks, Inc. * | 4,102 | 653,572 | ||||||
|
| |||||||
| 11,628,175 | ||||||||
|
| |||||||
| Construction Materials - 0.4% | ||||||||
| Martin Marietta Materials, Inc. | 7,530 | 1,348,698 | ||||||
| Vulcan Materials Co. | 18,426 | 2,095,589 | ||||||
|
| |||||||
| 3,444,287 | ||||||||
|
| |||||||
| Consumer Finance - 0.0% (a) | ||||||||
| Credit Acceptance Corp. * | 2,491 | 500,865 | ||||||
|
| |||||||
| Containers & Packaging - 0.2% | ||||||||
| Avery Dennison Corp. | 6,491 | 504,935 | ||||||
| Bemis Co., Inc. | 6,149 | 313,660 | ||||||
| Berry Plastics Group, Inc. * | 5,974 | 261,960 | ||||||
| Sealed Air Corp. | 10,067 | 461,270 | ||||||
|
| |||||||
| 1,541,825 | ||||||||
|
| |||||||
| The accompanying notes are an integral part of these financial statements. | (Continued) |
| AQR Funds | Annual Report | September 2016 | ||||||||||||||
89
| Schedule of Investments | September 30, 2016 |
| AQR LARGE CAP MOMENTUM STYLE FUND |
| INVESTMENTS | SHARES | VALUE | ||||||
| Distributors - 0.3% | ||||||||
| Genuine Parts Co. | 16,500 | $ | 1,657,425 | |||||
| LKQ Corp. * | 31,969 | 1,133,621 | ||||||
|
| |||||||
| 2,791,046 | ||||||||
|
| |||||||
| Diversified Consumer Services - 0.2% | ||||||||
| Graham Holdings Co., Class B | 737 | 354,770 | ||||||
| Service Corp. International | 15,037 | 399,082 | ||||||
| ServiceMaster Global Holdings, Inc. * | 20,653 | 695,593 | ||||||
|
| |||||||
| 1,449,445 | ||||||||
|
| |||||||
| Diversified Telecommunication Services - 3.6% | ||||||||
| AT&T, Inc. | 463,710 | 18,831,263 | ||||||
| Verizon Communications, Inc. | 294,639 | 15,315,335 | ||||||
|
| |||||||
| 34,146,598 | ||||||||
|
| |||||||
| Electric Utilities - 3.4% | ||||||||
| Alliant Energy Corp. | 43,306 | 1,659,053 | ||||||
| American Electric Power Co., Inc. | 45,726 | 2,936,066 | ||||||
| Duke Energy Corp. | 22,147 | 1,772,646 | ||||||
| Edison International | 38,839 | 2,806,118 | ||||||
| Eversource Energy | 31,398 | 1,701,144 | ||||||
| Exelon Corp. | 35,984 | 1,197,907 | ||||||
| Great Plains Energy, Inc. | 14,856 | 405,420 | ||||||
| NextEra Energy, Inc. | 43,577 | 5,330,339 | ||||||
| PG&E Corp. | 50,785 | 3,106,518 | ||||||
| Pinnacle West Capital Corp. | 30,000 | 2,279,700 | ||||||
| PPL Corp. | 55,594 | 1,921,885 | ||||||
| Southern Co. (The) | 81,357 | 4,173,614 | ||||||
| Xcel Energy, Inc. | 64,379 | 2,648,552 | ||||||
|
| |||||||
| 31,938,962 | ||||||||
|
| |||||||
| Electrical Equipment - 0.3% | ||||||||
| Acuity Brands, Inc. | 9,990 | 2,643,354 | ||||||
|
| |||||||
| Electronic Equipment, Instruments & Components - 0.5% | ||||||||
| Amphenol Corp., Class A | 21,046 | 1,366,306 | ||||||
| Arrow Electronics, Inc. * | 8,600 | 550,142 | ||||||
| CDW Corp. | 25,023 | 1,144,302 | ||||||
| Corning, Inc. | 33,230 | 785,889 | ||||||
| IPG Photonics Corp. * | 5,942 | 489,324 | ||||||
|
| |||||||
| 4,335,963 | ||||||||
|
| |||||||
| Energy Equipment & Services - 0.3% | ||||||||
| Patterson-UTI Energy, Inc. | 42,140 | 942,672 | ||||||
| RPC, Inc. * | 117,095 | 1,967,196 | ||||||
|
| |||||||
| 2,909,868 | ||||||||
|
| |||||||
| Equity Real Estate Investment Trusts (REITs) - 7.3% | ||||||||
| Alexandria Real Estate Equities, Inc. | 5,032 | 547,331 | ||||||
| American Campus Communities, Inc. | 20,902 | 1,063,285 | ||||||
| American Homes 4 Rent, Class A | 12,537 | 271,301 | ||||||
| American Tower Corp. | 27,758 | 3,145,814 | ||||||
| Apartment Investment & Management Co., Class A | 32,100 | 1,473,711 | ||||||
| AvalonBay Communities, Inc. | 12,954 | 2,303,739 | ||||||
| Boston Properties, Inc. | 11,893 | 1,620,897 | ||||||
| Brixmor Property Group, Inc. | 40,616 | 1,128,719 | ||||||
| Camden Property Trust | 15,154 | 1,268,996 | ||||||
| Communications Sales & Leasing, Inc. * | 17,215 | 540,723 | ||||||
| Corrections Corp. of America | 18,552 | 257,316 | ||||||
| INVESTMENTS | SHARES | VALUE | ||||||
| Equity Real Estate Investment Trusts (REITs) - 7.3% (continued) | ||||||||
| Crown Castle International Corp. | 35,334 | $ | 3,328,816 | |||||
| CyrusOne, Inc. | 10,004 | 475,890 | ||||||
| Digital Realty Trust, Inc. | 30,490 | 2,961,189 | ||||||
| Duke Realty Corp. | 25,685 | 701,971 | ||||||
| Equinix, Inc. | 9,995 | 3,600,699 | ||||||
| Equity LifeStyle Properties, Inc. | 33,755 | 2,605,211 | ||||||
| Equity Residential | 16,728 | 1,076,112 | ||||||
| Essex Property Trust, Inc. | 8,634 | 1,922,792 | ||||||
| Extra Space Storage, Inc. | 32,200 | 2,557,002 | ||||||
| Federal Realty Investment Trust | 20,052 | 3,086,604 | ||||||
| General Growth Properties, Inc. | 17,906 | 494,206 | ||||||
| Healthcare Trust of America, Inc., Class A | 29,525 | 963,105 | ||||||
| Iron Mountain, Inc. | 25,667 | 963,282 | ||||||
| Kimco Realty Corp. | 32,068 | 928,369 | ||||||
| Lamar Advertising Co., Class A | 12,300 | 803,313 | ||||||
| Macerich Co. (The) | 10,901 | 881,564 | ||||||
| Mid-America Apartment Communities, Inc. | 14,372 | 1,350,824 | ||||||
| National Retail Properties, Inc. | 41,609 | 2,115,818 | ||||||
| Omega Healthcare Investors, Inc. | 11,537 | 408,987 | ||||||
| Prologis, Inc. | 27,665 | 1,481,184 | ||||||
| Public Storage | 22,504 | 5,021,542 | ||||||
| Realty Income Corp. | 44,947 | 3,008,303 | ||||||
| Regency Centers Corp. | 25,053 | 1,941,357 | ||||||
| Senior Housing Properties Trust | 11,558 | 262,482 | ||||||
| Simon Property Group, Inc. | 28,613 | 5,923,177 | ||||||
| Spirit Realty Capital, Inc. | 34,588 | 461,058 | ||||||
| UDR, Inc. | 46,520 | 1,674,255 | ||||||
| Ventas, Inc. | 22,683 | 1,602,100 | ||||||
| VEREIT, Inc. | 59,673 | 618,809 | ||||||
| Vornado Realty Trust | 7,098 | 718,389 | ||||||
| Welltower, Inc. | 11,878 | 888,118 | ||||||
|
| |||||||
| 68,448,360 | ||||||||
|
| |||||||
| Food & Staples Retailing - 0.7% | ||||||||
| Costco Wholesale Corp. | 13,953 | 2,127,972 | ||||||
| Kroger Co. (The) | 13,873 | 411,751 | ||||||
| Sysco Corp. | 51,008 | 2,499,902 | ||||||
| Wal-Mart Stores, Inc. | 17,720 | 1,277,966 | ||||||
|
| |||||||
| 6,317,591 | ||||||||
|
| |||||||
| Food Products - 2.7% | ||||||||
| Campbell Soup Co. | 41,152 | 2,251,014 | ||||||
| ConAgra Foods, Inc. | 32,885 | 1,549,212 | ||||||
| General Mills, Inc. | 56,783 | 3,627,298 | ||||||
| Hormel Foods Corp. | 70,962 | 2,691,589 | ||||||
| Ingredion, Inc. | 11,951 | 1,590,200 | ||||||
| JM Smucker Co. (The) | 15,205 | 2,060,886 | ||||||
| Kellogg Co. | 29,857 | 2,313,022 | ||||||
| McCormick & Co., Inc. | 24,062 | 2,404,275 | ||||||
| Mondelez International, Inc., Class A | 34,554 | 1,516,921 | ||||||
| Pilgrim’s Pride Corp. | 18,200 | 384,384 | ||||||
| Pinnacle Foods, Inc. | 20,716 | 1,039,322 | ||||||
| Tyson Foods, Inc., Class A | 47,381 | 3,537,939 | ||||||
|
| |||||||
| 24,966,062 | ||||||||
|
| |||||||
| Health Care Equipment & Supplies – 4.1% | ||||||||
| Align Technology, Inc. * | 11,244 | 1,054,125 | ||||||
| Baxter International, Inc. | 41,890 | 1,993,964 | ||||||
| Becton Dickinson and Co. | 18,256 | 3,281,151 | ||||||
| The accompanying notes are an integral part of these financial statements. | (Continued) |
| AQR Funds | Annual Report | September 2016 | ||||||||||||||
90
| Schedule of Investments | September 30, 2016 |
| AQR LARGE CAP MOMENTUM STYLE FUND |
| INVESTMENTS | SHARES | VALUE | ||||||
| Health Care Equipment & Supplies – 4.1% (continued) | ||||||||
| Boston Scientific Corp. * | 129,047 | $ | 3,071,319 | |||||
| Cooper Cos., Inc. (The) | 5,006 | 897,375 | ||||||
| CR Bard, Inc. | 7,455 | 1,672,007 | ||||||
| Danaher Corp. | 55,487 | 4,349,626 | ||||||
| DENTSPLY SIRONA, Inc. | 15,018 | 892,520 | ||||||
| DexCom, Inc. * | 17,918 | 1,570,692 | ||||||
| Edwards Lifesciences Corp. * | 31,232 | 3,765,330 | ||||||
| Hologic, Inc. * | 23,630 | 917,553 | ||||||
| IDEXX Laboratories, Inc. * | 9,630 | 1,085,590 | ||||||
| Intuitive Surgical, Inc. * | 4,208 | 3,050,085 | ||||||
| Medtronic plc | 55,253 | 4,773,859 | ||||||
| ResMed, Inc. | 10,915 | 707,183 | ||||||
| Stryker Corp. | 27,867 | 3,243,997 | ||||||
| Teleflex, Inc. | 7,020 | 1,179,711 | ||||||
| Zimmer Biomet Holdings, Inc. | 5,963 | 775,309 | ||||||
|
| |||||||
| 38,281,396 | ||||||||
|
| |||||||
| Health Care Providers & Services - 1.6% | ||||||||
| Aetna, Inc. | 4,112 | 474,730 | ||||||
| Cardinal Health, Inc. | 3,587 | 278,710 | ||||||
| Henry Schein, Inc. * | 10,724 | 1,747,798 | ||||||
| Laboratory Corp. of America Holdings * | 2,281 | 313,592 | ||||||
| Quest Diagnostics, Inc. | 6,341 | 536,639 | ||||||
| UnitedHealth Group, Inc. | 70,150 | 9,821,000 | ||||||
| Universal Health Services, Inc., Class B | 5,053 | 622,631 | ||||||
| VCA, Inc. * | 11,583 | 810,578 | ||||||
|
| |||||||
| 14,605,678 | ||||||||
|
| |||||||
| Health Care Technology - 0.1% | ||||||||
| Allscripts Healthcare Solutions, Inc. * | 37,159 | 489,384 | ||||||
| athenahealth, Inc. * | 5,100 | 643,212 | ||||||
| Veeva Systems, Inc. * | 6,587 | 271,911 | ||||||
|
| |||||||
| 1,404,507 | ||||||||
|
| |||||||
| Hotels, Restaurants & Leisure - 1.8% | ||||||||
| Aramark | 23,714 | 901,843 | ||||||
| Brinker International, Inc. | 8,880 | 447,818 | ||||||
| Carnival Corp. | 29,955 | 1,462,403 | ||||||
| Darden Restaurants, Inc. | 16,014 | 981,979 | ||||||
| Domino’s Pizza, Inc. | 12,719 | 1,931,380 | ||||||
| McDonald’s Corp. | 64,087 | 7,393,076 | ||||||
| MGM Resorts International * | 11,741 | 305,618 | ||||||
| Panera Bread Co., Class A * | 6,436 | 1,253,218 | ||||||
| Royal Caribbean Cruises Ltd. | 4,821 | 361,334 | ||||||
| Six Flags Entertainment Corp. | 25,645 | 1,374,829 | ||||||
| Starbucks Corp. | 8,900 | 481,846 | ||||||
| Wynn Resorts Ltd. | 3,111 | 303,074 | ||||||
|
| |||||||
| 17,198,418 | ||||||||
|
| |||||||
| Household Durables - 0.7% | ||||||||
| DR Horton, Inc. | 47,077 | 1,421,725 | ||||||
| Garmin Ltd. | 5,628 | 270,763 | ||||||
| Leggett & Platt, Inc. | 14,426 | 657,537 | ||||||
| Mohawk Industries, Inc. * | 7,584 | 1,519,379 | ||||||
| Newell Brands, Inc. | 36,998 | 1,948,315 | ||||||
| NVR, Inc. * | 599 | 982,282 | ||||||
|
| |||||||
| 6,800,001 | ||||||||
|
| |||||||
| INVESTMENTS | SHARES | VALUE | ||||||
| Household Products - 1.9% | ||||||||
| Church & Dwight Co., Inc. | 52,954 | $ | 2,537,556 | |||||
| Clorox Co. (The) | 18,474 | 2,312,575 | ||||||
| Colgate-Palmolive Co. | 16,895 | 1,252,595 | ||||||
| Energizer Holdings, Inc. | 9,516 | 475,420 | ||||||
| Kimberly-Clark Corp. | 32,956 | 4,157,070 | ||||||
| Procter & Gamble Co. (The) | 82,432 | 7,398,272 | ||||||
|
| |||||||
| 18,133,488 | ||||||||
|
| |||||||
| Industrial Conglomerates - 3.4% | ||||||||
| 3M Co. | 32,094 | 5,655,926 | ||||||
| General Electric Co. | 646,920 | 19,161,770 | ||||||
| Honeywell International, Inc. | 44,789 | 5,221,949 | ||||||
| Roper Technologies, Inc. | 8,485 | 1,548,258 | ||||||
|
| |||||||
| 31,587,903 | ||||||||
|
| |||||||
| Insurance - 2.9% | ||||||||
| Allstate Corp. (The) | 7,302 | 505,152 | ||||||
| American Financial Group, Inc. | 11,412 | 855,900 | ||||||
| AmTrust Financial Services, Inc. | 13,037 | 349,783 | ||||||
| Aon plc | 15,470 | 1,740,220 | ||||||
| Arch Capital Group Ltd. * | 20,469 | 1,622,373 | ||||||
| Aspen Insurance Holdings Ltd. | 8,457 | 394,012 | ||||||
| Assurant, Inc. | 6,148 | 567,153 | ||||||
| Assured Guaranty Ltd. | 19,688 | 546,342 | ||||||
| Axis Capital Holdings Ltd. | 7,392 | 401,607 | ||||||
| Chubb Ltd. | 24,391 | 3,064,729 | ||||||
| Cincinnati Financial Corp. | 26,000 | 1,960,920 | ||||||
| Endurance Specialty Holdings Ltd. | 7,982 | 522,422 | ||||||
| Erie Indemnity Co., Class A | 6,993 | 713,776 | ||||||
| Everest Re Group Ltd. | 3,886 | 738,223 | ||||||
| FNF Group | 22,711 | 838,263 | ||||||
| Hanover Insurance Group, Inc. (The) | 11,713 | 883,394 | ||||||
| Markel Corp. * | 1,587 | 1,473,958 | ||||||
| Marsh & McLennan Cos., Inc. | 33,809 | 2,273,655 | ||||||
| ProAssurance Corp. | 20,042 | 1,051,804 | ||||||
| Progressive Corp. (The) | 34,852 | 1,097,838 | ||||||
| RenaissanceRe Holdings Ltd. | 8,666 | 1,041,307 | ||||||
| Torchmark Corp. | 11,199 | 715,504 | ||||||
| Travelers Cos., Inc. (The) | 9,489 | 1,086,965 | ||||||
| Validus Holdings Ltd. | 11,878 | 591,762 | ||||||
| White Mountains Insurance Group Ltd. | 2,013 | 1,670,790 | ||||||
| WR Berkley Corp. | 10,543 | 608,964 | ||||||
|
| |||||||
| 27,316,816 | ||||||||
|
| |||||||
| Internet & Direct Marketing Retail - 3.6% | ||||||||
| Amazon.com, Inc. * | 34,971 | 29,281,568 | ||||||
| Expedia, Inc. | 13,068 | 1,525,297 | ||||||
| Netflix, Inc. * | 4,374 | 431,058 | ||||||
| Priceline Group, Inc. (The) * | 2,033 | 2,991,539 | ||||||
|
| |||||||
| 34,229,462 | ||||||||
|
| |||||||
| Internet Software & Services - 7.7% | ||||||||
| Alphabet, Inc., Class A * | 48,157 | 38,721,117 | ||||||
| CoStar Group, Inc. * | 3,684 | 797,696 | ||||||
| eBay, Inc. * | 49,437 | 1,626,477 | ||||||
| Facebook, Inc., Class A * | 214,358 | 27,495,701 | ||||||
| GoDaddy, Inc., Class A * | 15,274 | 527,411 | ||||||
| VeriSign, Inc. * | 21,755 | 1,702,111 | ||||||
| Yahoo!, Inc. * | 9,568 | 412,381 | ||||||
| The accompanying notes are an integral part of these financial statements. | (Continued) |
| AQR Funds | Annual Report | September 2016 | ||||||||||||||
91
| Schedule of Investments | September 30, 2016 |
| AQR LARGE CAP MOMENTUM STYLE FUND |
| INVESTMENTS | SHARES | VALUE | ||||||
| Internet Software & Services - 7.7% (continued) | ||||||||
| Yelp, Inc. * | 6,928 | $ | 288,898 | |||||
| Zillow Group, Inc., Class C * | 7,781 | 269,612 | ||||||
|
| |||||||
| 71,841,404 | ||||||||
|
| |||||||
| IT Services - 3.1% | ||||||||
| Accenture plc, Class A | 35,171 | 4,296,841 | ||||||
| Amdocs Ltd. | 21,861 | 1,264,659 | ||||||
| Automatic Data Processing, Inc. | 27,344 | 2,411,741 | ||||||
| Booz Allen Hamilton Holding Corp. | 14,749 | 466,216 | ||||||
| Broadridge Financial Solutions, Inc. | 11,087 | 751,588 | ||||||
| Computer Sciences Corp. | 22,381 | 1,168,512 | ||||||
| CoreLogic, Inc. * | 18,100 | 709,882 | ||||||
| Fidelity National Information Services, Inc. | 5,248 | 404,253 | ||||||
| Fiserv, Inc. * | 35,423 | 3,523,526 | ||||||
| Gartner, Inc. * | 6,200 | 548,390 | ||||||
| Genpact Ltd. * | 44,401 | 1,063,404 | ||||||
| Global Payments, Inc. | 25,397 | 1,949,474 | ||||||
| Jack Henry & Associates, Inc. | 17,949 | 1,535,537 | ||||||
| MasterCard, Inc., Class A | 3,383 | 344,288 | ||||||
| Paychex, Inc. | 34,906 | 2,020,010 | ||||||
| Sabre Corp. | 45,937 | 1,294,505 | ||||||
| Total System Services, Inc. | 31,608 | 1,490,317 | ||||||
| Vantiv, Inc., Class A * | 28,434 | 1,599,981 | ||||||
| Visa, Inc., Class A | 18,755 | 1,551,038 | ||||||
| Western Union Co. (The) | 15,876 | 330,538 | ||||||
|
| |||||||
| 28,724,700 | ||||||||
|
| |||||||
| Leisure Products - 0.4% | ||||||||
| Hasbro, Inc. | 20,453 | 1,622,536 | ||||||
| Mattel, Inc. | 44,934 | 1,360,602 | ||||||
| Vista Outdoor, Inc. * | 10,871 | 433,318 | ||||||
|
| |||||||
| 3,416,456 | ||||||||
|
| |||||||
| Life Sciences Tools & Services - 1.0% | ||||||||
| Bio-Rad Laboratories, Inc., Class A * | 5,986 | 980,567 | ||||||
| Bruker Corp. | 35,568 | 805,615 | ||||||
| Charles River Laboratories International, Inc. * | 6,903 | 575,296 | ||||||
| Mettler-Toledo International, Inc. * | 2,907 | 1,220,446 | ||||||
| PerkinElmer, Inc. | 9,553 | 536,019 | ||||||
| QIAGEN NV * | 21,131 | 579,835 | ||||||
| Quintiles Transnational Holdings, Inc. * | 8,771 | 710,977 | ||||||
| Thermo Fisher Scientific, Inc. | 18,666 | 2,969,014 | ||||||
| Waters Corp. * | 7,531 | 1,193,588 | ||||||
|
| |||||||
| 9,571,357 | ||||||||
|
| |||||||
| Machinery - 0.9% | ||||||||
| Caterpillar, Inc. | 3,300 | 292,941 | ||||||
| Dover Corp. | 3,921 | 288,743 | ||||||
| Fortive Corp. | 28,938 | 1,472,944 | ||||||
| Illinois Tool Works, Inc. | 19,876 | 2,381,940 | ||||||
| Middleby Corp. (The) * | 3,107 | 384,087 | ||||||
| Snap-on, Inc. | 7,597 | 1,154,440 | ||||||
| Stanley Black & Decker, Inc. | 6,696 | 823,474 | ||||||
| Toro Co. (The) | 36,514 | 1,710,316 | ||||||
| Xylem, Inc. | 5,904 | 309,665 | ||||||
|
| |||||||
| 8,818,550 | ||||||||
|
| |||||||
| INVESTMENTS | SHARES | VALUE | ||||||
| Media - 0.9% | ||||||||
| Comcast Corp., Class A | 90,475 | $ | 6,002,112 | |||||
| Interpublic Group of Cos., Inc. (The) | 21,162 | 472,971 | ||||||
| Madison Square Garden Co. (The), Class A * | 2,525 | 427,760 | ||||||
| Omnicom Group, Inc. | 14,639 | 1,244,315 | ||||||
|
| |||||||
| 8,147,158 | ||||||||
|
| |||||||
| Metals & Mining - 0.9% | ||||||||
| Freeport-McMoRan, Inc. | 81,019 | 879,866 | ||||||
| Newmont Mining Corp. | 113,529 | 4,460,555 | ||||||
| Nucor Corp. | 12,145 | 600,570 | ||||||
| Royal Gold, Inc. | 10,218 | 791,180 | ||||||
| Steel Dynamics, Inc. | 20,899 | 522,266 | ||||||
| Tahoe Resources, Inc. | 39,076 | 501,345 | ||||||
| United States Steel Corp. | 45,030 | 849,266 | ||||||
|
| |||||||
| 8,605,048 | ||||||||
|
| |||||||
| Multiline Retail - 0.3% | ||||||||
| Dollar General Corp. | 26,018 | 1,821,000 | ||||||
| Dollar Tree, Inc. * | 8,383 | 661,670 | ||||||
| JC Penney Co., Inc. * | 36,823 | 339,508 | ||||||
|
| |||||||
| 2,822,178 | ||||||||
|
| |||||||
| Multi-Utilities - 1.6% | ||||||||
| Ameren Corp. | 32,468 | 1,596,776 | ||||||
| CenterPoint Energy, Inc. | 12,401 | 288,075 | ||||||
| CMS Energy Corp. | 41,358 | 1,737,450 | ||||||
| Consolidated Edison, Inc. | 44,730 | 3,368,169 | ||||||
| Dominion Resources, Inc. | 12,711 | 944,046 | ||||||
| DTE Energy Co. | 12,286 | 1,150,830 | ||||||
| NiSource, Inc. | 27,269 | 657,456 | ||||||
| Public Service Enterprise Group, Inc. | 42,083 | 1,762,015 | ||||||
| SCANA Corp. | 19,576 | 1,416,715 | ||||||
| WEC Energy Group, Inc. | 40,625 | 2,432,625 | ||||||
|
| |||||||
| 15,354,157 | ||||||||
|
| |||||||
| Oil, Gas & Consumable Fuels - 7.0% | ||||||||
| Apache Corp. | 32,599 | 2,082,098 | ||||||
| Chevron Corp. | 111,747 | 11,501,001 | ||||||
| Cimarex Energy Co. | 5,296 | 711,623 | ||||||
| CONSOL Energy, Inc. | 29,257 | 561,734 | ||||||
| Continental Resources, Inc. * | 47,385 | 2,462,125 | ||||||
| Diamondback Energy, Inc. * | 30,668 | 2,960,689 | ||||||
| Exxon Mobil Corp. | 285,739 | 24,939,300 | ||||||
| HollyFrontier Corp. | 20,332 | 498,134 | ||||||
| Marathon Petroleum Corp. | 9,484 | 384,956 | ||||||
| Newfield Exploration Co. * | 40,416 | 1,756,479 | ||||||
| Occidental Petroleum Corp. | 17,744 | 1,293,892 | ||||||
| ONEOK, Inc. | 35,221 | 1,810,007 | ||||||
| Parsley Energy, Inc., Class A * | 48,935 | 1,639,812 | ||||||
| PBF Energy, Inc., Class A | 50,359 | 1,140,128 | ||||||
| Phillips 66 | 29,956 | 2,412,956 | ||||||
| Pioneer Natural Resources Co. | 23,909 | 4,438,706 | ||||||
| QEP Resources, Inc. | 48,949 | 955,974 | ||||||
| Range Resources Corp. | 8,970 | 347,587 | ||||||
| Rice Energy, Inc. * | 30,058 | 784,814 | ||||||
| Tesoro Corp. | 12,876 | 1,024,415 | ||||||
| Valero Energy Corp. | 14,739 | 781,167 | ||||||
| WPX Energy, Inc. * | 86,740 | 1,144,101 | ||||||
|
| |||||||
| 65,631,698 | ||||||||
|
| |||||||
| The accompanying notes are an integral part of these financial statements. | (Continued) |
| AQR Funds | Annual Report | September 2016 | ||||||||||||||
92
| Schedule of Investments | September 30, 2016 |
| AQR LARGE CAP MOMENTUM STYLE FUND |
| INVESTMENTS | SHARES | VALUE | ||||||
| Personal Products - 0.4% | ||||||||
| Coty, Inc., Class A * | 51,159 | $ | 1,202,236 | |||||
| Edgewell Personal Care Co. * | 4,753 | 377,959 | ||||||
| Estee Lauder Cos., Inc. (The), Class A | 24,485 | 2,168,392 | ||||||
|
| |||||||
| 3,748,587 | ||||||||
|
| |||||||
| Pharmaceuticals - 3.5% | ||||||||
| Bristol-Myers Squibb Co. | 94,267 | 5,082,877 | ||||||
| Eli Lilly & Co. | 7,439 | 597,054 | ||||||
| Johnson & Johnson | 198,747 | 23,477,983 | ||||||
| Merck & Co., Inc. | 28,941 | 1,806,208 | ||||||
| Pfizer, Inc. | 45,652 | 1,546,233 | ||||||
| Zoetis, Inc. | 8,185 | 425,702 | ||||||
|
| |||||||
| 32,936,057 | ||||||||
|
| |||||||
| Professional Services - 0.5% | ||||||||
| Equifax, Inc. | 16,124 | 2,169,968 | ||||||
| Nielsen Holdings plc | 15,792 | 845,977 | ||||||
| Verisk Analytics, Inc. * | 15,384 | 1,250,412 | ||||||
|
| |||||||
| 4,266,357 | ||||||||
|
| |||||||
| Road & Rail - 0.2% | ||||||||
| AMERCO | 3,404 | 1,103,679 | ||||||
| JB Hunt Transport Services, Inc. | 6,466 | 524,651 | ||||||
| Norfolk Southern Corp. | 3,006 | 291,762 | ||||||
| Old Dominion Freight Line, Inc. * | 5,160 | 354,028 | ||||||
|
| |||||||
| 2,274,120 | ||||||||
|
| |||||||
| Semiconductors & Semiconductor Equipment - 4.2% | ||||||||
| Analog Devices, Inc. | 18,146 | 1,169,510 | ||||||
| Applied Materials, Inc. | 121,988 | 3,677,938 | ||||||
| Broadcom Ltd. (Singapore) | 36,683 | 6,328,551 | ||||||
| First Solar, Inc. * | �� | 11,793 | 465,706 | |||||
| Intel Corp. | 257,817 | 9,732,592 | ||||||
| Lam Research Corp. | 11,210 | 1,061,699 | ||||||
| Maxim Integrated Products, Inc. | 31,919 | 1,274,526 | ||||||
| Microchip Technology, Inc. | 10,829 | 672,914 | ||||||
| NVIDIA Corp. | 84,821 | 5,811,935 | ||||||
| Teradyne, Inc. | 24,948 | 538,378 | ||||||
| Texas Instruments, Inc. | 89,392 | 6,273,530 | ||||||
| Xilinx, Inc. | 36,025 | 1,957,598 | ||||||
|
| |||||||
| 38,964,877 | ||||||||
|
| |||||||
| Software - 5.9% | ||||||||
| Activision Blizzard, Inc. | 87,059 | 3,856,714 | ||||||
| Adobe Systems, Inc. * | 45,877 | 4,979,490 | ||||||
| ANSYS, Inc. * | 5,600 | 518,616 | ||||||
| Cadence Design Systems, Inc. * | 31,925 | 815,045 | ||||||
| CDK Global, Inc. | 20,178 | 1,157,410 | ||||||
| Citrix Systems, Inc. * | 14,512 | 1,236,713 | ||||||
| Electronic Arts, Inc. * | 13,376 | 1,142,310 | ||||||
| Intuit, Inc. | 14,330 | 1,576,443 | ||||||
| Microsoft Corp. | 563,225 | 32,441,760 | ||||||
| Nuance Communications, Inc. * | 49,154 | 712,733 | ||||||
| Red Hat, Inc. * | 6,528 | 527,658 | ||||||
| salesforce.com, Inc. * | 44,474 | 3,172,330 | ||||||
| SS&C Technologies Holdings, Inc. | 16,904 | 543,464 | ||||||
| Symantec Corp. | 13,365 | 335,462 | ||||||
| Synopsys, Inc. * | 12,734 | 755,763 | ||||||
| Ultimate Software Group, Inc. (The) * | 5,637 | 1,152,146 | ||||||
|
| |||||||
| 54,924,057 | ||||||||
|
| |||||||
| INVESTMENTS | SHARES | VALUE | ||||||
| Specialty Retail - 2.8% | ||||||||
| AutoZone, Inc. * | 1,454 | $ | 1,117,166 | |||||
| Burlington Stores, Inc. * | 3,662 | 296,695 | ||||||
| Foot Locker, Inc. | 6,992 | 473,498 | ||||||
| Home Depot, Inc. (The) | 73,021 | 9,396,342 | ||||||
| Lowe’s Cos., Inc. | 32,745 | 2,364,517 | ||||||
| Michael’s Cos., Inc. (The) * | 21,313 | 515,135 | ||||||
| Murphy USA, Inc. * | 6,252 | 446,143 | ||||||
| O’Reilly Automotive, Inc. * | 11,598 | 3,248,716 | ||||||
| Ross Stores, Inc. | 31,231 | 2,008,153 | ||||||
| TJX Cos., Inc. (The) | 35,655 | 2,666,281 | ||||||
| Tractor Supply Co. | 15,573 | 1,048,842 | ||||||
| Ulta Salon Cosmetics & Fragrance, Inc. * | 12,747 | 3,033,531 | ||||||
|
| |||||||
| 26,615,019 | ||||||||
|
| |||||||
| Textiles, Apparel & Luxury Goods - 0.5% | ||||||||
| Carter’s, Inc. | 5,756 | 499,103 | ||||||
| Michael Kors Holdings Ltd. * | 5,626 | 263,241 | ||||||
| NIKE, Inc., Class B | 38,417 | 2,022,655 | ||||||
| Skechers U.S.A., Inc., Class A * | 21,170 | 484,793 | ||||||
| Under Armour, Inc., Class A * | 25,644 | 991,910 | ||||||
| Under Armour, Inc., Class C * | 10,583 | 358,340 | ||||||
|
| |||||||
| 4,620,042 | ||||||||
|
| |||||||
| Thrifts & Mortgage Finance - 0.1% | ||||||||
| TFS Financial Corp. | 41,075 | 731,546 | ||||||
|
| |||||||
| Tobacco - 2.5% | ||||||||
| Altria Group, Inc. | 145,535 | 9,202,178 | ||||||
| Philip Morris International, Inc. | 95,203 | 9,255,636 | ||||||
| Reynolds American, Inc. | 114,701 | 5,408,152 | ||||||
|
| |||||||
| 23,865,966 | ||||||||
|
| |||||||
| Trading Companies & Distributors - 0.1% | ||||||||
| Watsco, Inc. | 3,619 | 509,917 | ||||||
| WW Grainger, Inc. | 3,083 | 693,182 | ||||||
|
| |||||||
| 1,203,099 | ||||||||
|
| |||||||
| Water Utilities - 0.3% | ||||||||
| American Water Works Co., Inc. | 32,657 | 2,444,050 | ||||||
| Aqua America, Inc. | 9,149 | 278,861 | ||||||
|
| |||||||
| 2,722,911 | ||||||||
|
| |||||||
| Wireless Telecommunication Services - 0.4% | ||||||||
| Sprint Corp. * | 172,378 | 1,142,866 | ||||||
| T-Mobile US, Inc. * | 50,736 | 2,370,386 | ||||||
|
| |||||||
| 3,513,252 | ||||||||
|
| |||||||
TOTAL COMMON STOCKS |
| 909,853,829 | ||||||
|
| |||||||
| SHORT-TERM INVESTMENT - 2.8% | ||||||||
| Investment Company - 2.8% | ||||||||
| J.P. Morgan U.S. Treasury Plus Money Market Fund - IM Shares, 0.22% | ||||||||
(cost $25,866,654) (2)(b) | 25,866,654 | 25,866,654 | ||||||
|
| |||||||
TOTAL INVESTMENTS IN SECURITIES AT VALUE - 99.8% |
| 935,720,483 | ||||||
|
| |||||||
| OTHER ASSETS IN EXCESS OF LIABILITIES - 0.2% (c) | 1,945,995 | |||||||
|
| |||||||
NET ASSETS - 100.0% | 937,666,478 | |||||||
|
| |||||||
| The accompanying notes are an integral part of these financial statements. | (Continued) |
| AQR Funds | Annual Report | September 2016 | ||||||||||||||
93
| Schedule of Investments | September 30, 2016 |
| AQR LARGE CAP MOMENTUM STYLE FUND |
| SECTOR | VALUE | % OF NET ASSETS | ||||||
| Consumer Discretionary | $ | 110,926,420 | 11.9 | % | ||||
| Consumer Staples | 106,047,385 | 11.3 | ||||||
| Energy | 68,541,566 | 7.3 | ||||||
| Financials | 44,340,561 | 4.7 | ||||||
| Health Care | 97,354,231 | 10.4 | ||||||
| Industrials | 95,147,781 | 10.1 | ||||||
| Information Technology | 210,419,176 | 22.5 | ||||||
| Materials | 20,952,469 | 2.2 | ||||||
| Real Estate | 68,448,360 | 7.3 | ||||||
| Telecommunication Services | 37,659,850 | 4.0 | ||||||
| Utilities | 50,016,030 | 5.3 | ||||||
| Short-Term Investment | 25,866,654 | 2.8 | ||||||
|
|
|
| |||||
Total Investments In Securities At Value | 935,720,483 | 99.8 | ||||||
| Other Assets in Excess of Liabilities (c) | 1,945,995 | 0.2 | ||||||
|
|
|
| |||||
Net Assets | $ | 937,666,478 | 100.0 | % | ||||
|
|
|
| |||||
All securities are United States companies, unless noted otherwise in parentheses.
| * | Non-income producing security. |
| (a) | Represents less than 0.05% of net assets. |
| (b) | Represents 7-day effective yield as of 9/30/2016. |
| (c) | Includes appreciation/(depreciation) on futures contracts. |
All securities are Level 1 with respect to ASC 820, unless otherwise noted in parentheses.
| (2) | Level 2 security (See Note 4). |
Open futures contracts outstanding at September 30, 2016:
Exchange Traded
| NUMBER OF CONTRACTS | COUNTERPARTY | DESCRIPTION | EXPIRATION DATE | VALUE AT TRADE DATE | VALUE AT SEPTEMBER 30, 2016 | UNREALIZED APPRECIATION (DEPRECIATION) | ||||||||||||||
| Long Contracts: | ||||||||||||||||||||
| 185 | BARC | S&P 500 E-Mini Futures | 12/2016 | $ | 19,864,166 | $ | 19,983,700 | $ | 119,534 | |||||||||||
|
|
|
|
|
| |||||||||||||||
Collateral pledged to, or (received from), each counterparty at September 30, 2016 was as follows:
| COUNTERPARTY | OVER THE COUNTER | EXCHANGE TRADED | TOTAL | |||||||||
| BARC | ||||||||||||
| Cash | $— | $767,528 | $767,528 | |||||||||
|
|
| ||||||||||
| The accompanying notes are an integral part of these financial statements. |
| AQR Funds | Annual Report | September 2016 | ||||||||||||||
94
| Schedule of Investments | September 30, 2016 |
| AQR SMALL CAP MOMENTUM STYLE FUND |
| INVESTMENTS | SHARES | VALUE | ||||||
| COMMON STOCKS - 96.9% | ||||||||
| Aerospace & Defense - 0.9% | ||||||||
| Aerojet Rocketdyne Holdings, Inc. * | 7,667 | $ | 134,786 | |||||
| Aerovironment, Inc. * | 7,641 | 186,517 | ||||||
| Curtiss-Wright Corp. | 13,348 | 1,216,136 | ||||||
| DigitalGlobe, Inc. * | 3,438 | 94,545 | ||||||
| Engility Holdings, Inc. * | 4,188 | 131,922 | ||||||
| KEYW Holding Corp. (The) *(a) | 9,659 | 106,635 | ||||||
| Mercury Systems, Inc. * | 21,745 | 534,275 | ||||||
| National Presto Industries, Inc. | 1,715 | 150,560 | ||||||
| Sparton Corp. * | 6,924 | 181,824 | ||||||
| Vectrus, Inc. * | 5,334 | 81,237 | ||||||
|
| |||||||
| 2,818,437 | ||||||||
|
| |||||||
| Air Freight & Logistics - 0.2% | ||||||||
| Air Transport Services Group, Inc. * | 33,900 | 486,465 | ||||||
| XPO Logistics, Inc. * | 6,427 | 235,678 | ||||||
|
| |||||||
| 722,143 | ||||||||
|
| |||||||
| Airlines - 0.5% | ||||||||
| Hawaiian Holdings, Inc. * | 22,896 | 1,112,746 | ||||||
| SkyWest, Inc. | 24,142 | 637,590 | ||||||
|
| |||||||
| 1,750,336 | ||||||||
|
| |||||||
| Auto Components - 1.7% | ||||||||
| Cooper Tire & Rubber Co. | 8,314 | 316,098 | ||||||
| Cooper-Standard Holding, Inc. * | 7,770 | 767,676 | ||||||
| Dorman Products, Inc. * | 9,995 | 638,680 | ||||||
| Drew Industries, Inc. | 11,249 | 1,102,627 | ||||||
| Fox Factory Holding Corp. * | 8,907 | 204,594 | ||||||
| Gentherm, Inc. * | 3,795 | 119,239 | ||||||
| Horizon Global Corp. * | 4,751 | 94,687 | ||||||
| Motorcar Parts of America, Inc. * | 9,004 | 259,135 | ||||||
| Spartan Motors, Inc. | 30,958 | 296,578 | ||||||
| Standard Motor Products, Inc. | 5,402 | 258,000 | ||||||
| Stoneridge, Inc. * | 15,449 | 284,262 | ||||||
| Superior Industries International, Inc. | 16,718 | 487,497 | ||||||
| Tenneco, Inc. * | 9,453 | 550,826 | ||||||
| Tower International, Inc. | 5,389 | 129,875 | ||||||
|
| |||||||
| 5,509,774 | ||||||||
|
| |||||||
| Automobiles - 0.0% (b) | ||||||||
| Winnebago Industries, Inc. | 4,117 | 97,038 | ||||||
|
| |||||||
| Banks - 4.7% | ||||||||
| Ameris Bancorp | 11,337 | 396,228 | ||||||
| Banc of California, Inc. | 15,122 | 264,030 | ||||||
| Berkshire Hills Bancorp, Inc. | 4,880 | 135,225 | ||||||
| BNC Bancorp | 11,995 | 291,718 | ||||||
| Brookline Bancorp, Inc. | 13,553 | 165,211 | ||||||
| Capital Bank Financial Corp., Class A | 17,266 | 554,411 | ||||||
| CenterState Banks, Inc. | 21,995 | 389,971 | ||||||
| Central Pacific Financial Corp. | 6,264 | 157,790 | ||||||
| Chemical Financial Corp. | 10,758 | 474,751 | ||||||
| Community Bank System, Inc. | 9,046 | 435,203 | ||||||
| ConnectOne Bancorp, Inc. | 9,170 | 165,610 | ||||||
| CVB Financial Corp. | 14,211 | 250,256 | ||||||
| Eagle Bancorp, Inc. * | 15,418 | 760,570 | ||||||
| Enterprise Financial Services Corp. | 9,119 | 284,969 | ||||||
| FCB Financial Holdings, Inc., Class A * | 13,517 | 519,458 | ||||||
| INVESTMENTS | SHARES | VALUE | ||||||
| Banks - 4.7% (continued) | ||||||||
| Fidelity Southern Corp. | 14,791 | $ | 272,007 | |||||
| First Financial Bankshares, Inc. | 5,971 | 217,583 | ||||||
| First Interstate BancSystem, Inc., Class A | 5,980 | 188,430 | ||||||
| First Merchants Corp. | 8,267 | 221,142 | ||||||
| Flushing Financial Corp. | 7,004 | 166,135 | ||||||
| Fulton Financial Corp. | 41,998 | 609,811 | ||||||
| Great Southern Bancorp, Inc. | 4,133 | 168,213 | ||||||
| Great Western Bancorp, Inc. | 30,158 | 1,004,865 | ||||||
| Hanmi Financial Corp. | 5,827 | 153,483 | ||||||
| Heartland Financial USA, Inc. | 4,432 | 159,862 | ||||||
| Home BancShares, Inc. | 33,108 | 688,978 | ||||||
| Independent Bank Corp./MA (a) | 6,932 | 374,952 | ||||||
| Independent Bank Corp./MI | 27,663 | 465,568 | ||||||
| International Bancshares Corp. | 4,292 | 127,816 | ||||||
| Lakeland Financial Corp. | 11,374 | 402,867 | ||||||
| LegacyTexas Financial Group, Inc. | 7,515 | 237,700 | ||||||
| MB Financial, Inc. | 4,175 | 158,817 | ||||||
| NBT Bancorp, Inc. | 3,605 | 118,496 | ||||||
| Opus Bank | 6,292 | 222,548 | ||||||
| Pacific Premier Bancorp, Inc. * | 7,111 | 188,157 | ||||||
| Preferred Bank | 10,383 | 371,192 | ||||||
| Renasant Corp. | 4,694 | 157,859 | ||||||
| S&T Bancorp, Inc. | 3,731 | 108,162 | ||||||
| Sandy Spring Bancorp, Inc. | 3,390 | 103,666 | ||||||
| Seacoast Banking Corp. of Florida * | 17,359 | 279,306 | ||||||
| ServisFirst Bancshares, Inc. | 18,343 | 952,185 | ||||||
| Simmons First National Corp., Class A | 3,151 | 157,235 | ||||||
| Southside Bancshares, Inc. | 5,935 | 190,988 | ||||||
| State Bank Financial Corp. | 5,880 | 134,182 | ||||||
| Sterling Bancorp | 37,903 | 663,303 | ||||||
| Stonegate Bank | 4,323 | 145,901 | ||||||
| Tompkins Financial Corp. | 1,585 | 121,110 | ||||||
| Towne Bank | 14,776 | 355,067 | ||||||
| Union Bankshares Corp. | 3,912 | 104,724 | ||||||
| United Community Banks, Inc. | 13,283 | 279,209 | ||||||
|
| |||||||
| 15,516,920 | ||||||||
|
| |||||||
| Beverages - 0.6% | ||||||||
| Coca-Cola Bottling Co. Consolidated | 1,994 | 295,431 | ||||||
| Craft Brew Alliance, Inc. * | 5,958 | 112,189 | ||||||
| MGP Ingredients, Inc. (a) | 14,063 | 569,833 | ||||||
| National Beverage Corp. *(a) | 21,441 | 944,476 | ||||||
|
| |||||||
| 1,921,929 | ||||||||
|
| |||||||
| Biotechnology - 3.2% | ||||||||
| Acceleron Pharma, Inc. * | 10,256 | 371,165 | ||||||
| Achillion Pharmaceuticals, Inc. * | 34,987 | 283,395 | ||||||
| ARIAD Pharmaceuticals, Inc. * | 42,741 | 585,124 | ||||||
| Axovant Sciences Ltd. * | 6,697 | 93,758 | ||||||
| BioSpecifics Technologies Corp. * | 2,268 | 103,580 | ||||||
| CTI BioPharma Corp. * | 77,000 | 28,821 | ||||||
| Cytokinetics, Inc. *(a) | 24,791 | 227,581 | ||||||
| Emergent BioSolutions, Inc. * | 6,408 | 202,044 | ||||||
| Exact Sciences Corp. * | 8,431 | 156,564 | ||||||
| Exelixis, Inc. * | 107,777 | 1,378,468 | ||||||
| Five Prime Therapeutics, Inc. * | 13,433 | 705,098 | ||||||
| Genomic Health, Inc. * | 5,685 | 164,410 | ||||||
| Ignyta, Inc. * | 17,759 | 111,704 | ||||||
| The accompanying notes are an integral part of these financial statements. | (Continued) |
| AQR Funds | Annual Report | September 2016 | ||||||||||||||
95
| Schedule of Investments | September 30, 2016 |
| AQR SMALL CAP MOMENTUM STYLE FUND |
| INVESTMENTS | SHARES | VALUE | ||||||
| Biotechnology - 3.2% (continued) | ||||||||
| Inovio Pharmaceuticals, Inc. *(a) | 36,389 | $ | 339,146 | |||||
| Insmed, Inc. * | 11,460 | 166,399 | ||||||
| Ironwood Pharmaceuticals, Inc. * | 39,114 | 621,130 | ||||||
| Lexicon Pharmaceuticals, Inc. *(a) | 49,075 | 886,785 | ||||||
| Ligand Pharmaceuticals, Inc. * | 6,082 | 620,729 | ||||||
| Lion Biotechnologies, Inc. *(a) | 12,937 | 106,472 | ||||||
| Loxo Oncology, Inc. *(a) | 15,828 | 414,377 | ||||||
| Minerva Neurosciences, Inc. *(a) | 25,714 | 362,953 | ||||||
| Myriad Genetics, Inc. * | 4,727 | 97,282 | ||||||
| Ohr Pharmaceutical, Inc. * | 7,600 | 21,508 | ||||||
| Organovo Holdings, Inc. *(a) | 37,800 | 143,262 | ||||||
| Peregrine Pharmaceuticals, Inc. * | 181,400 | 78,002 | ||||||
| Prothena Corp. plc (Ireland) * | 2,757 | 165,337 | ||||||
| Repligen Corp. * | 4,058 | 122,511 | ||||||
| Sarepta Therapeutics, Inc. *(a) | 1,685 | 103,476 | ||||||
| Spectrum Pharmaceuticals, Inc. * | 25,248 | 117,908 | ||||||
| Synergy Pharmaceuticals, Inc. * | 25,940 | 142,930 | ||||||
| TESARO, Inc. *(a) | 12,743 | 1,277,358 | ||||||
| Trevena, Inc. * | 28,383 | 191,585 | ||||||
| Xencor, Inc. * | 5,970 | 146,205 | ||||||
|
| |||||||
| 10,537,067 | ||||||||
|
| |||||||
| Building Products - 2.1% | ||||||||
| AAON, Inc. | 15,165 | 437,055 | ||||||
| Advanced Drainage Systems, Inc. | 4,397 | 105,792 | ||||||
| American Woodmark Corp. * | 10,294 | 829,388 | ||||||
| Apogee Enterprises, Inc. | 4,666 | 208,524 | ||||||
| Builders FirstSource, Inc. * | 22,692 | 261,185 | ||||||
| Gibraltar Industries, Inc. * | 18,133 | 673,641 | ||||||
| Griffon Corp. | 21,547 | 366,514 | ||||||
| Insteel Industries, Inc. | 16,658 | 603,686 | ||||||
| Masonite International Corp. * | 3,491 | 217,036 | ||||||
| NCI Building Systems, Inc. * | 23,636 | 344,849 | ||||||
| Patrick Industries, Inc. * | 12,325 | 763,164 | ||||||
| PGT, Inc. * | 22,467 | 239,723 | ||||||
| Ply Gem Holdings, Inc. * | 11,673 | 155,951 | ||||||
| Simpson Manufacturing Co., Inc. | 9,912 | 435,632 | ||||||
| Trex Co., Inc. * | 4,263 | 250,323 | ||||||
| Universal Forest Products, Inc. | 9,901 | 975,150 | ||||||
|
| |||||||
| 6,867,613 | ||||||||
|
| |||||||
| Capital Markets - 0.6% | ||||||||
| Actua Corp. * | 12,100 | 156,695 | ||||||
| BGC Partners, Inc., Class A | 70,384 | 615,860 | ||||||
| Cohen & Steers, Inc. | 7,823 | 334,433 | ||||||
| Diamond Hill Investment Group, Inc. | 1,639 | 302,871 | ||||||
| Evercore Partners, Inc., Class A | 3,778 | 194,605 | ||||||
| GAIN Capital Holdings, Inc. | 24,292 | 150,125 | ||||||
| INTL. FCStone, Inc. * | 6,700 | 260,295 | ||||||
| KCG Holdings, Inc., Class A * | 6,225 | 96,674 | ||||||
|
| |||||||
| 2,111,558 | ||||||||
|
| |||||||
| Chemicals - 1.6% | ||||||||
| American Vanguard Corp. | 9,893 | 158,882 | ||||||
| Balchem Corp. | 5,596 | 433,858 | ||||||
| Chemours Co. (The) | 24,936 | 398,976 | ||||||
| H.B. Fuller Co. | 9,656 | 448,714 | ||||||
| Innospec, Inc. | 7,845 | 477,055 | ||||||
| KMG Chemicals, Inc. | 10,063 | 285,085 | ||||||
| INVESTMENTS | SHARES | VALUE | ||||||
| Chemicals - 1.6% (continued) | ||||||||
| Koppers Holdings, Inc. * | 6,463 | $ | 207,979 | |||||
| Kraton Performance Polymers, Inc. * | 10,451 | 366,203 | ||||||
| Minerals Technologies, Inc. | 2,031 | 143,571 | ||||||
| Quaker Chemical Corp. | 1,296 | 137,285 | ||||||
| Rayonier Advanced Materials, Inc. | 7,806 | 104,366 | ||||||
| Sensient Technologies Corp. | 2,597 | 196,853 | ||||||
| Stepan Co. | 6,808 | 494,669 | ||||||
| Trinseo SA | 23,676 | 1,339,115 | ||||||
| Tronox Ltd. | 10,025 | 93,934 | ||||||
|
| |||||||
| 5,286,545 | ||||||||
|
| |||||||
| Commercial Services & Supplies - 2.0% | ||||||||
| ABM Industries, Inc. | 8,360 | 331,892 | ||||||
| ACCO Brands Corp. * | 42,602 | 410,683 | ||||||
| Brady Corp., Class A | 17,045 | 589,927 | ||||||
| Brink’s Co. (The) | 12,230 | 453,488 | ||||||
| Casella Waste Systems, Inc., Class A * | 13,943 | 143,613 | ||||||
| Deluxe Corp. | 4,980 | 332,764 | ||||||
| Ennis, Inc. | 10,681 | 179,975 | ||||||
| Healthcare Services Group, Inc. | 22,924 | 907,332 | ||||||
| Herman Miller, Inc. | 14,493 | 414,500 | ||||||
| Interface, Inc. | 8,931 | 149,058 | ||||||
| Knoll, Inc. | 9,074 | 207,341 | ||||||
| Matthews International Corp., Class A | 8,717 | 529,645 | ||||||
| Multi-Color Corp. | 2,227 | 146,982 | ||||||
| Quad/Graphics, Inc. | 21,524 | 575,121 | ||||||
| Team, Inc. * | 4,400 | 143,924 | ||||||
| Tetra Tech, Inc. | 13,146 | 466,289 | ||||||
| UniFirst Corp. | 969 | 127,772 | ||||||
| US Ecology, Inc. | 4,522 | 202,767 | ||||||
| Viad Corp. | 5,800 | 213,846 | ||||||
| VSE Corp. | 4,267 | 145,035 | ||||||
|
| |||||||
| 6,671,954 | ||||||||
|
| |||||||
| Communications Equipment - 2.7% | ||||||||
| ADTRAN, Inc. | 11,311 | 216,493 | ||||||
| Applied Optoelectronics, Inc. *(a) | 8,401 | 186,586 | ||||||
| CalAmp Corp. * | 8,803 | 122,802 | ||||||
| Clearfield, Inc. *(a) | 11,378 | 213,906 | ||||||
| Extreme Networks, Inc. * | 44,347 | 199,118 | ||||||
| Finisar Corp. * | 34,264 | 1,021,067 | ||||||
| InterDigital, Inc. | 6,940 | 549,648 | ||||||
| Ixia * | 14,568 | 182,100 | ||||||
| Lumentum Holdings, Inc. * | 28,205 | 1,178,123 | ||||||
| NETGEAR, Inc. * | 12,858 | 777,780 | ||||||
| Oclaro, Inc. * | 95,527 | 816,756 | ||||||
| Plantronics, Inc. | 2,183 | 113,429 | ||||||
| ShoreTel, Inc. * | 18,745 | 149,960 | ||||||
| Sonus Networks, Inc. * | 23,563 | 183,320 | ||||||
| Ubiquiti Networks, Inc. *(a) | 32,650 | 1,746,775 | ||||||
| ViaSat, Inc. * | 12,790 | 954,774 | ||||||
| Viavi Solutions, Inc. * | 42,629 | 315,028 | ||||||
|
| |||||||
| 8,927,665 | ||||||||
|
| |||||||
| Construction & Engineering - 1.8% | ||||||||
| Aegion Corp. * | 9,430 | 179,830 | ||||||
| Argan, Inc. | 5,482 | 324,480 | ||||||
| Comfort Systems USA, Inc. | 16,682 | 488,949 | ||||||
| Dycom Industries, Inc. * | 13,873 | 1,134,534 | ||||||
| The accompanying notes are an integral part of these financial statements. | (Continued) |
| AQR Funds | Annual Report | September 2016 | ||||||||||||||
96
| Schedule of Investments | September 30, 2016 |
| AQR SMALL CAP MOMENTUM STYLE FUND |
| INVESTMENTS | SHARES | VALUE | ||||||
| Construction & Engineering - 1.8% (continued) | ||||||||
| EMCOR Group, Inc. | 11,751 | $ | 700,595 | |||||
| Granite Construction, Inc. | 13,147 | 653,932 | ||||||
| HC2 Holdings, Inc. *(a) | 27,896 | 152,033 | ||||||
| MasTec, Inc. * | 30,841 | 917,211 | ||||||
| MYR Group, Inc. * | 5,924 | 178,312 | ||||||
| NV5 Global, Inc. * | 13,579 | 438,737 | ||||||
| Primoris Services Corp. | 19,351 | 398,631 | ||||||
| Tutor Perini Corp. * | 8,183 | 175,689 | ||||||
|
| |||||||
| 5,742,933 | ||||||||
|
| |||||||
| Construction Materials - 0.2% | ||||||||
| Headwaters, Inc. * | 11,071 | 187,321 | ||||||
| US Concrete, Inc. * | 9,368 | 431,537 | ||||||
|
| |||||||
| 618,858 | ||||||||
|
| |||||||
| Consumer Finance - 0.1% | ||||||||
| EZCORP, Inc., Class A * | 9,246 | 102,261 | ||||||
| Green Dot Corp., Class A * | 9,413 | 217,064 | ||||||
|
| |||||||
| 319,325 | ||||||||
|
| |||||||
| Containers & Packaging - 0.2% | ||||||||
| Greif, Inc., Class A | 14,000 | 694,260 | ||||||
|
| |||||||
| Distributors - 0.2% | ||||||||
| Core-Mark Holding Co., Inc. | 16,544 | 592,275 | ||||||
|
| |||||||
| Diversified Consumer Services - 0.9% | ||||||||
| American Public Education, Inc. * | 7,939 | 157,272 | ||||||
| Bright Horizons Family Solutions, Inc. * | 17,315 | 1,158,200 | ||||||
| Career Education Corp. * | 42,174 | 286,362 | ||||||
| Carriage Services, Inc. | 10,033 | 237,280 | ||||||
| LifeLock, Inc. * | 40,964 | 693,111 | ||||||
| Weight Watchers International, Inc. *(a) | 40,948 | 422,583 | ||||||
|
| |||||||
| 2,954,808 | ||||||||
|
| |||||||
| Diversified Telecommunication Services - 1.1% | ||||||||
| Atlantic Tele-Network, Inc. | 2,969 | 193,104 | ||||||
| Cincinnati Bell, Inc. * | 36,600 | 149,328 | ||||||
| Cogent Communications Holdings, Inc. | 10,768 | 396,370 | ||||||
| Consolidated Communications Holdings, Inc. | 12,893 | 325,419 | ||||||
| FairPoint Communications, Inc. * | 9,396 | 141,222 | ||||||
| General Communication, Inc., Class A * | 14,543 | 199,966 | ||||||
| IDT Corp., Class B | 12,066 | 208,018 | ||||||
| Inteliquent, Inc. | 8,841 | 142,694 | ||||||
| Lumos Networks Corp. * | 9,282 | 129,948 | ||||||
| ORBCOMM, Inc. * | 42,884 | 439,561 | ||||||
| Straight Path Communications, Inc., Class B *(a) | 6,023 | 154,249 | ||||||
| Vonage Holdings Corp. * | 37,211 | 245,965 | ||||||
| Windstream Holdings, Inc. (a) | 79,645 | 800,432 | ||||||
|
| |||||||
| 3,526,276 | ||||||||
|
| |||||||
| Electric Utilities - 2.0% | ||||||||
| ALLETE, Inc. | 10,849 | 646,818 | ||||||
| El Paso Electric Co. | 13,342 | 624,005 | ||||||
| IDACORP, Inc. | 17,911 | 1,402,073 | ||||||
| MGE Energy, Inc. | 12,714 | 718,468 | ||||||
| Otter Tail Corp. | 5,498 | 190,176 | ||||||
| INVESTMENTS | SHARES | VALUE | ||||||
| Electric Utilities - 2.0% (continued) | ||||||||
| PNM Resources, Inc. | 30,346 | $ | 992,921 | |||||
| Portland General Electric Co. | 26,884 | 1,144,990 | ||||||
| Spark Energy, Inc., Class A (a) | 23,772 | 692,478 | ||||||
|
| |||||||
| 6,411,929 | ||||||||
|
| |||||||
| Electrical Equipment - 0.4% | ||||||||
| AZZ, Inc. | 6,976 | 455,323 | ||||||
| Energous Corp. *(a) | 15,823 | 310,289 | ||||||
| EnerSys | 3,925 | 271,571 | ||||||
| Generac Holdings, Inc. * | 9,643 | 350,041 | ||||||
|
| |||||||
| 1,387,224 | ||||||||
|
| |||||||
| Electronic Equipment, Instruments & Components - 3.6% | ||||||||
| AVX Corp. | 12,390 | 170,858 | ||||||
| Badger Meter, Inc. | 11,542 | 386,772 | ||||||
| Belden, Inc. | 6,021 | 415,389 | ||||||
| Coherent, Inc. * | 10,822 | 1,196,264 | ||||||
| CTS Corp. | 12,200 | 226,920 | ||||||
| ePlus, Inc. * | 3,930 | 371,031 | ||||||
| Fabrinet (Thailand) * | 19,918 | 888,144 | ||||||
| II-VI, Inc. * | 19,798 | 481,685 | ||||||
| Insight Enterprises, Inc. * | 4,032 | 131,242 | ||||||
| Itron, Inc. * | 12,694 | 707,817 | ||||||
| Littelfuse, Inc. | 6,846 | 881,833 | ||||||
| Mesa Laboratories, Inc. (a) | 3,230 | 369,383 | ||||||
| Methode Electronics, Inc. | 6,896 | 241,153 | ||||||
| MTS Systems Corp. | 2,200 | 101,266 | ||||||
| OSI Systems, Inc. * | 1,769 | 115,657 | ||||||
| PC Connection, Inc. | 9,526 | 251,677 | ||||||
| Sanmina Corp. * | 26,247 | 747,252 | ||||||
| SYNNEX Corp. | 11,941 | 1,362,588 | ||||||
| Tech Data Corp. * | 11,816 | 1,000,933 | ||||||
| TTM Technologies, Inc. * | 10,753 | 123,122 | ||||||
| Universal Display Corp. * | 19,076 | 1,058,909 | ||||||
| Vishay Intertechnology, Inc. | 32,811 | 462,307 | ||||||
|
| |||||||
| 11,692,202 | ||||||||
|
| |||||||
| Energy Equipment & Services - 0.9% | ||||||||
| Fairmount Santrol Holdings, Inc. *(a) | 58,980 | 500,150 | ||||||
| Forum Energy Technologies, Inc. * | 12,569 | 249,620 | ||||||
| Helix Energy Solutions Group, Inc. * | 22,666 | 184,275 | ||||||
| McDermott International, Inc. * | 32,162 | 161,132 | ||||||
| Oil States International, Inc. * | 5,507 | 173,856 | ||||||
| TETRA Technologies, Inc. * | 26,462 | 161,683 | ||||||
| Unit Corp. * | 5,649 | 105,071 | ||||||
| US Silica Holdings, Inc. | 27,696 | 1,289,526 | ||||||
|
| |||||||
| 2,825,313 | ||||||||
|
| |||||||
| Equity Real Estate Investment Trusts (REITs) - 10.2% | ||||||||
| Acadia Realty Trust | 21,103 | 764,773 | ||||||
| Agree Realty Corp. | 12,630 | 624,427 | ||||||
| Alexander’s, Inc. | 1,154 | 484,218 | ||||||
| American Assets Trust, Inc. | 9,951 | 431,674 | ||||||
| Armada Hoffler Properties, Inc. | 15,545 | 208,303 | ||||||
| Bluerock Residential Growth REIT, Inc. | 11,974 | 155,662 | ||||||
| Cedar Realty Trust, Inc. | 19,172 | 138,038 | ||||||
| Community Healthcare Trust, Inc. | 4,426 | 97,018 | ||||||
| CoreSite Realty Corp. | 20,141 | 1,491,240 | ||||||
| Cousins Properties, Inc. | 43,398 | 453,075 | ||||||
| The accompanying notes are an integral part of these financial statements. | (Continued) |
| AQR Funds | Annual Report | September 2016 | ||||||||||||||
97
| Schedule of Investments | September 30, 2016 |
| AQR SMALL CAP MOMENTUM STYLE FUND |
| INVESTMENTS | SHARES | VALUE | ||||||
| Equity Real Estate Investment Trusts (REITs) - 10.2% (continued) | ||||||||
| DuPont Fabros Technology, Inc. | 39,719 | $ | 1,638,409 | |||||
| Easterly Government Properties, Inc. | 10,973 | 209,365 | ||||||
| EastGroup Properties, Inc. | 7,677 | 564,720 | ||||||
| Education Realty Trust, Inc. | 32,100 | 1,384,794 | ||||||
| First Industrial Realty Trust, Inc. | 53,306 | 1,504,295 | ||||||
| Getty Realty Corp. | 4,321 | 103,402 | ||||||
| Gladstone Commercial Corp. | 17,758 | 330,832 | ||||||
| Government Properties Income Trust | 30,023 | 679,120 | ||||||
| Healthcare Realty Trust, Inc. | 57,490 | 1,958,109 | ||||||
| Hudson Pacific Properties, Inc. | 8,459 | 278,047 | ||||||
| Independence Realty Trust, Inc. | 11,681 | 105,129 | ||||||
| Kite Realty Group Trust | 21,671 | 600,720 | ||||||
| Lexington Realty Trust | 77,309 | 796,283 | ||||||
| LTC Properties, Inc. | 10,734 | 558,061 | ||||||
| Mack-Cali Realty Corp. | 39,027 | 1,062,315 | ||||||
| Medical Properties Trust, Inc. | 71,973 | 1,063,041 | ||||||
| Monmouth Real Estate Investment Corp. | 33,580 | 479,187 | ||||||
| Monogram Residential Trust, Inc. | 32,040 | 340,906 | ||||||
| National Health Investors, Inc. | 8,803 | 690,859 | ||||||
| National Storage Affiliates Trust | 38,604 | 808,368 | ||||||
| NexPoint Residential Trust, Inc. | 16,633 | 327,005 | ||||||
| Pennsylvania REIT | 13,055 | 300,657 | ||||||
| Physicians Realty Trust | 59,560 | 1,282,922 | ||||||
| Potlatch Corp. | 2,434 | 94,658 | ||||||
| Preferred Apartment Communities, Inc. | 12,783 | 172,698 | ||||||
| PS Business Parks, Inc. | 13,027 | 1,479,476 | ||||||
| QTS Realty Trust, Inc., Class A | 33,641 | 1,777,927 | ||||||
| Ramco-Gershenson Properties Trust | 15,494 | 290,358 | ||||||
| Retail Opportunity Investments Corp. | 51,090 | 1,121,936 | ||||||
| Rexford Industrial Realty, Inc. | 40,152 | 919,079 | ||||||
| Saul Centers, Inc. | 5,116 | 340,726 | ||||||
| Select Income REIT | 37,865 | 1,018,569 | ||||||
| Seritage Growth Properties, Class A (a) | 10,698 | 542,175 | ||||||
| STAG Industrial, Inc. | 36,200 | 887,262 | ||||||
| Terreno Realty Corp. | 9,381 | 258,071 | ||||||
| Universal Health Realty Income Trust | 2,973 | 187,358 | ||||||
| Urban Edge Properties | 50,790 | 1,429,231 | ||||||
| Urstadt Biddle Properties, Inc., Class A | 5,947 | 132,142 | ||||||
| Washington Prime Group, Inc. | 7,712 | 95,475 | ||||||
| Washington REIT | 21,202 | 659,806 | ||||||
| Whitestone REIT | 8,519 | 118,244 | ||||||
|
| |||||||
| 33,440,165 | ||||||||
|
| |||||||
| Food & Staples Retailing - 0.1% | ||||||||
| Ingles Markets, Inc., Class A | 4,685 | 185,245 | ||||||
| PriceSmart, Inc. | 1,476 | 123,630 | ||||||
| SpartanNash Co. | 5,073 | 146,711 | ||||||
|
| |||||||
| 455,586 | ||||||||
|
| |||||||
| Food Products - 2.3% | ||||||||
| Amplify Snack Brands, Inc. * | 5,986 | 96,973 | ||||||
| B&G Foods, Inc. | 24,015 | 1,181,058 | ||||||
| Calavo Growers, Inc. | 5,972 | 390,748 | ||||||
| Cal-Maine Foods, Inc. (a) | 4,929 | 189,964 | ||||||
| Darling Ingredients, Inc. * | 38,099 | 514,717 | ||||||
| Dean Foods Co. | 8,337 | 136,727 | ||||||
| Fresh Del Monte Produce, Inc. | 24,128 | 1,445,267 | ||||||
| J&J Snack Foods Corp. | 3,317 | 395,121 | ||||||
| John B. Sanfilippo & Son, Inc. | 6,663 | 342,012 | ||||||
| INVESTMENTS | SHARES | VALUE | ||||||
| Food Products - 2.3% (continued) | ||||||||
| Lancaster Colony Corp. | 10,414 | $ | 1,375,585 | |||||
| Omega Protein Corp. * | 14,399 | 336,505 | ||||||
| Sanderson Farms, Inc. | 6,287 | 605,627 | ||||||
| Snyder’s-Lance, Inc. | 7,716 | 259,103 | ||||||
| Tootsie Roll Industries, Inc. (a) | 6,695 | 246,577 | ||||||
|
| |||||||
| 7,515,984 | ||||||||
|
| |||||||
| Gas Utilities - 2.2% | ||||||||
| Chesapeake Utilities Corp. | 9,836 | 600,586 | ||||||
| New Jersey Resources Corp. | 24,582 | 807,764 | ||||||
| Northwest Natural Gas Co. | 8,889 | 534,318 | ||||||
| ONE Gas, Inc. | 31,316 | 1,936,581 | ||||||
| South Jersey Industries, Inc. | 11,082 | 327,473 | ||||||
| Southwest Gas Corp. | 10,682 | 746,245 | ||||||
| Spire, Inc. | 16,759 | 1,068,219 | ||||||
| WGL Holdings, Inc. | 19,573 | 1,227,227 | ||||||
|
| |||||||
| 7,248,413 | ||||||||
|
| |||||||
| Health Care Equipment & Supplies - 3.9% | ||||||||
| Analogic Corp. | 1,217 | 107,826 | ||||||
| Anika Therapeutics, Inc. * | 6,861 | 328,299 | ||||||
| AtriCure, Inc. * | 9,247 | 146,288 | ||||||
| Atrion Corp. | 700 | 298,620 | ||||||
| Cantel Medical Corp. | 20,542 | 1,601,865 | ||||||
| Cerus Corp. * | 25,882 | 160,727 | ||||||
| CONMED Corp. | 2,522 | 101,031 | ||||||
| CryoLife, Inc. | 10,147 | 178,283 | ||||||
| Cynosure, Inc., Class A * | 12,609 | 642,302 | ||||||
| Glaukos Corp. * | 2,445 | 92,274 | ||||||
| ICU Medical, Inc. * | 5,491 | 693,953 | ||||||
| Inogen, Inc. * | 11,892 | 712,331 | ||||||
| Insulet Corp. * | 8,518 | 348,727 | ||||||
| Integra LifeSciences Holdings Corp. * | 14,291 | 1,179,722 | ||||||
| iRadimed Corp. *(a) | 7,495 | 127,340 | ||||||
| LeMaitre Vascular, Inc. | 10,217 | 202,705 | ||||||
| Masimo Corp. * | 20,859 | 1,240,902 | ||||||
| Meridian Bioscience, Inc. | 7,667 | 147,896 | ||||||
| Merit Medical Systems, Inc. * | 6,344 | 154,096 | ||||||
| Natus Medical, Inc. * | 3,884 | 152,602 | ||||||
| Neogen Corp. * | 3,554 | 198,811 | ||||||
| Nevro Corp. *(a) | 13,746 | 1,434,945 | ||||||
| NuVasive, Inc. * | 14,321 | 954,638 | ||||||
| NxStage Medical, Inc. * | 15,595 | 389,719 | ||||||
| OraSure Technologies, Inc. * | 29,155 | 232,365 | ||||||
| Orthofix International NV * | 5,619 | 240,325 | ||||||
| Penumbra, Inc. * | 1,553 | 118,013 | ||||||
| RTI Surgical, Inc. * | 6,354 | 19,888 | ||||||
| Spectranetics Corp. (The) * | 7,601 | 190,709 | ||||||
| Vascular Solutions, Inc. * | 9,342 | 450,565 | ||||||
|
| |||||||
| 12,847,767 | ||||||||
|
| |||||||
| Health Care Providers & Services - 1.8% | ||||||||
| Aceto Corp. | 12,688 | 240,945 | ||||||
| Addus HomeCare Corp. * | 9,220 | 241,195 | ||||||
| Almost Family, Inc. * | 3,746 | 137,741 | ||||||
| Amedisys, Inc. * | 16,877 | 800,645 | ||||||
| AMN Healthcare Services, Inc. * | 18,057 | 575,477 | ||||||
| BioTelemetry, Inc. * | 25,845 | 479,942 | ||||||
| Capital Senior Living Corp. * | 6,600 | 110,880 | ||||||
| The accompanying notes are an integral part of these financial statements. | (Continued) |
| AQR Funds | Annual Report | September 2016 | ||||||||||||||
98
| Schedule of Investments | September 30, 2016 |
| AQR SMALL CAP MOMENTUM STYLE FUND |
| INVESTMENTS | SHARES | VALUE | ||||||
| Health Care Providers & Services - 1.8% (continued) | ||||||||
| Chemed Corp. | 1,947 | $ | 274,663 | |||||
| Civitas Solutions, Inc. * | 6,879 | 125,611 | ||||||
| CorVel Corp. * | 6,100 | 234,240 | ||||||
| Cross Country Healthcare, Inc. * | 14,589 | 171,858 | ||||||
| Ensign Group, Inc. (The) | 7,633 | 153,652 | ||||||
| HealthEquity, Inc. * | 3,387 | 128,198 | ||||||
| Healthways, Inc. * | 5,828 | 154,209 | ||||||
| LHC Group, Inc. * | 7,457 | 275,014 | ||||||
| Medcath Corp. (3)*(c) | 10,300 | - | ||||||
| National HealthCare Corp. | 1,886 | 124,457 | ||||||
| Owens & Minor, Inc. | 9,380 | 325,767 | ||||||
| Providence Service Corp. (The) * | 3,601 | 175,117 | ||||||
| RadNet, Inc. * | 19,258 | 142,509 | ||||||
| Surgical Care Affiliates, Inc. * | 12,716 | 620,032 | ||||||
| Universal American Corp. | 19,738 | 150,996 | ||||||
| US Physical Therapy, Inc. | 6,163 | 386,420 | ||||||
|
| |||||||
| 6,029,568 | ||||||||
|
| |||||||
| Health Care Technology - 0.5% | ||||||||
| Evolent Health, Inc. *(a) | 10,498 | 258,461 | ||||||
| HealthStream, Inc. * | 7,258 | 200,321 | ||||||
| HMS Holdings Corp. * | 33,525 | 743,249 | ||||||
| Medidata Solutions, Inc. * | 2,479 | 138,229 | ||||||
| Omnicell, Inc. * | 6,219 | 238,188 | ||||||
| Vocera Communications, Inc. * | 10,735 | 181,421 | ||||||
|
| |||||||
| 1,759,869 | ||||||||
|
| |||||||
| Hotels, Restaurants & Leisure - 2.1% | ||||||||
| Boyd Gaming Corp. * | 39,480 | 780,914 | ||||||
| Caesars Entertainment Corp. *(a) | 22,440 | 167,178 | ||||||
| Carrols Restaurant Group, Inc. * | 32,223 | 425,666 | ||||||
| Churchill Downs, Inc. | 3,785 | 553,935 | ||||||
| Chuy’s Holdings, Inc. * | 9,817 | 274,287 | ||||||
| ClubCorp Holdings, Inc. | 9,715 | 140,576 | ||||||
| Cracker Barrel Old Country Store, Inc. (a) | 4,590 | 606,890 | ||||||
| Dave & Buster’s Entertainment, Inc. * | 16,897 | 662,025 | ||||||
| Denny’s Corp. * | 22,460 | 240,097 | ||||||
| Eldorado Resorts, Inc. * | 36,433 | 512,248 | ||||||
| International Speedway Corp., Class A | 8,963 | 299,544 | ||||||
| Intrawest Resorts Holdings, Inc. * | 10,121 | 164,163 | ||||||
| Jack in the Box, Inc. | 1,191 | 114,265 | ||||||
| Marcus Corp. (The) | 6,900 | 172,776 | ||||||
| Monarch Casino & Resort, Inc. * | 7,349 | 184,974 | ||||||
| Papa John’s International, Inc. | 1,526 | 120,325 | ||||||
| Penn National Gaming, Inc. * | 8,269 | 112,210 | ||||||
| Planet Fitness, Inc. * | 7,443 | 149,381 | ||||||
| Popeyes Louisiana Kitchen, Inc. * | 2,780 | 147,729 | ||||||
| Ruth’s Hospitality Group, Inc. | 13,870 | 195,844 | ||||||
| Sonic Corp. | 4,685 | 122,653 | ||||||
| Texas Roadhouse, Inc. | 20,477 | 799,217 | ||||||
|
| |||||||
| 6,946,897 | ||||||||
|
| |||||||
| Household Durables - 1.4% | ||||||||
| Bassett Furniture Industries, Inc. | 16,512 | 383,904 | ||||||
| Cavco Industries, Inc. * | 3,895 | 385,800 | ||||||
| Ethan Allen Interiors, Inc. | 4,828 | 150,971 | ||||||
| Flexsteel Industries, Inc. | 2,686 | 138,920 | ||||||
| Helen of Troy Ltd. * | 9,841 | 847,999 | ||||||
| Hooker Furniture Corp. | 12,387 | 303,358 | ||||||
| INVESTMENTS | SHARES | VALUE | ||||||
| Household Durables - 1.4% (continued) | ||||||||
| Installed Building Products, Inc. * | 14,200 | $ | 509,354 | |||||
| iRobot Corp. * | 2,187 | 96,184 | ||||||
| La-Z-Boy, Inc. | 4,371 | 107,352 | ||||||
| LGI Homes, Inc. *(a) | 16,644 | 613,165 | ||||||
| NACCO Industries, Inc., Class A | 3,287 | 223,384 | ||||||
| TopBuild Corp. * | 4,553 | 151,160 | ||||||
| Universal Electronics, Inc. * | 5,698 | 424,273 | ||||||
| ZAGG, Inc. * | 17,070 | 138,267 | ||||||
|
| |||||||
| 4,474,091 | ||||||||
|
| |||||||
| Household Products - 0.4% | ||||||||
| Central Garden & Pet Co., Class A * | 25,171 | 624,241 | ||||||
| Orchids Paper Products Co. (a) | 5,844 | 159,132 | ||||||
| WD-40 Co. | 5,417 | 609,033 | ||||||
|
| |||||||
| 1,392,406 | ||||||||
|
| |||||||
| Independent Power and Renewable Electricity Producers - 0.2% | ||||||||
| Ormat Technologies, Inc. | 13,252 | 641,529 | ||||||
|
| |||||||
| Insurance - 2.7% | ||||||||
| AMERISAFE, Inc. | 8,584 | 504,567 | ||||||
| Argo Group International Holdings Ltd. | 11,002 | 620,733 | ||||||
| CNO Financial Group, Inc. | 16,656 | 254,337 | ||||||
| Employers Holdings, Inc. | 6,048 | 180,412 | ||||||
| Enstar Group Ltd. * | 3,224 | 530,251 | ||||||
| FBL Financial Group, Inc., Class A | 10,027 | 641,427 | ||||||
| Federated National Holding Co. | 7,509 | 140,343 | ||||||
| Horace Mann Educators Corp. | 7,112 | 260,655 | ||||||
| Infinity Property & Casualty Corp. | 2,082 | 172,036 | ||||||
| James River Group Holdings Ltd. | 11,794 | 426,943 | ||||||
| Kemper Corp. | 3,161 | 124,291 | ||||||
| Maiden Holdings Ltd. | 7,487 | 95,010 | ||||||
| National General Holdings Corp. | 21,132 | 469,976 | ||||||
| Navigators Group, Inc. (The) | 5,020 | 486,538 | ||||||
| OneBeacon Insurance Group Ltd., Class A | 10,443 | 149,126 | ||||||
| Primerica, Inc. (a) | 8,867 | 470,217 | ||||||
| RLI Corp. | 19,610 | 1,340,540 | ||||||
| Safety Insurance Group, Inc. | 2,738 | 184,048 | ||||||
| Selective Insurance Group, Inc. | 16,206 | 645,971 | ||||||
| Stewart Information Services Corp. | 7,639 | 339,554 | ||||||
| Trupanion, Inc. *(a) | 20,746 | 350,607 | ||||||
| United Fire Group, Inc. | 8,387 | 354,938 | ||||||
| United Insurance Holdings Corp. | 8,652 | 146,911 | ||||||
|
| |||||||
| 8,889,431 | ||||||||
|
| |||||||
| Internet & Direct Marketing Retail - 0.5% | ||||||||
| Nutrisystem, Inc. | 13,444 | 399,152 | ||||||
| Overstock.com, Inc. * | 9,124 | 139,780 | ||||||
| PetMed Express, Inc. (a) | 10,939 | 221,843 | ||||||
| Shutterfly, Inc. * | 2,243 | 100,128 | ||||||
| Wayfair, Inc., Class A *(a) | 16,719 | 658,227 | ||||||
|
| |||||||
| 1,519,130 | ||||||||
|
| |||||||
| Internet Software & Services - 3.3% | ||||||||
| 2U, Inc. *(a) | 5,844 | 223,767 | ||||||
| Alarm.com Holdings, Inc. *(a) | 20,626 | 595,266 | ||||||
| Amber Road, Inc. * | 9,941 | 95,931 | ||||||
| Benefitfocus, Inc. * | 4,090 | 163,273 | ||||||
| Brightcove, Inc. * | 16,597 | 216,591 | ||||||
| The accompanying notes are an integral part of these financial statements. | (Continued) |
| AQR Funds | Annual Report | September 2016 | ||||||||||||||
99
| Schedule of Investments | September 30, 2016 |
| AQR SMALL CAP MOMENTUM STYLE FUND |
| INVESTMENTS | SHARES | VALUE | ||||||
| Internet Software & Services - 3.3% (continued) | ||||||||
| ChannelAdvisor Corp. * | 12,592 | $ | 162,815 | |||||
| Cimpress NV (Netherlands) * | 9,460 | 957,163 | ||||||
| Cornerstone OnDemand, Inc. * | 19,335 | 888,443 | ||||||
| DHI Group, Inc. * | 15,761 | 124,354 | ||||||
| EarthLink Holdings Corp. | 45,321 | 280,990 | ||||||
| Envestnet, Inc. * | 2,574 | 93,822 | ||||||
| Five9, Inc. * | 48,315 | 757,579 | ||||||
| GrubHub, Inc. * | 9,400 | 404,106 | ||||||
| GTT Communications, Inc. * | 6,403 | 150,663 | ||||||
| Intralinks Holdings, Inc. * | 16,496 | 165,950 | ||||||
| j2 Global, Inc. | 2,491 | 165,926 | ||||||
| LogMeIn, Inc. | 4,534 | 409,828 | ||||||
| MeetMe, Inc. * | 53,417 | 331,185 | ||||||
| MINDBODY, Inc. *(a) | 21,019 | 413,234 | ||||||
| NIC, Inc. | 17,480 | 410,780 | ||||||
| Q2 Holdings, Inc. * | 14,946 | 428,352 | ||||||
| Quotient Technology, Inc. * | 21,709 | 288,947 | ||||||
| Shutterstock, Inc. * | 8,452 | 538,392 | ||||||
| SPS Commerce, Inc. * | 1,758 | 129,055 | ||||||
| Stamps.com, Inc. *(a) | 6,017 | 568,667 | ||||||
| TrueCar, Inc. *(a) | 29,967 | 282,888 | ||||||
| Web.com Group, Inc. * | 5,859 | 101,185 | ||||||
| WebMD Health Corp. * | 13,210 | 656,537 | ||||||
| Xactly Corp. * | 26,867 | 395,482 | ||||||
| XO Group, Inc. * | 16,852 | 325,749 | ||||||
|
| |||||||
| 10,726,920 | ||||||||
|
| |||||||
| IT Services - 2.1% | ||||||||
| Acxiom Corp. * | 22,963 | 611,964 | ||||||
| Blackhawk Network Holdings, Inc. * | 4,256 | 128,404 | ||||||
| CACI International, Inc., Class A * | 6,137 | 619,223 | ||||||
| Cardtronics plc * | 7,925 | 353,455 | ||||||
| Convergys Corp. | 34,452 | 1,048,030 | ||||||
| CSG Systems International, Inc. | 11,909 | 492,199 | ||||||
| EPAM Systems, Inc. * | 5,115 | 354,521 | ||||||
| ExlService Holdings, Inc. * | 15,184 | 756,771 | ||||||
| Hackett Group, Inc. (The) | 26,961 | 445,396 | ||||||
| Lionbridge Technologies, Inc. * | 23,819 | 119,095 | ||||||
| ManTech International Corp., Class A | 6,644 | 250,412 | ||||||
| Perficient, Inc. * | 11,282 | 227,332 | ||||||
| PFSweb, Inc. * | 16,898 | 150,899 | ||||||
| Science Applications International Corp. | 10,383 | 720,269 | ||||||
| ServiceSource International, Inc. * | 27,897 | 136,137 | ||||||
| Sykes Enterprises, Inc. * | 10,388 | 292,214 | ||||||
| TeleTech Holdings, Inc. | 5,303 | 153,734 | ||||||
|
| |||||||
| 6,860,055 | ||||||||
|
| |||||||
| Leisure Products - 0.5% | ||||||||
| Callaway Golf Co. | 19,727 | 229,030 | ||||||
| Nautilus, Inc. * | 9,368 | 212,841 | ||||||
| Smith & Wesson Holding Corp. *(a) | 30,134 | 801,263 | ||||||
| Sturm Ruger & Co., Inc. (a) | 7,609 | 439,496 | ||||||
|
| |||||||
| 1,682,630 | ||||||||
|
| |||||||
| Life Sciences Tools & Services - 0.9% | ||||||||
| Accelerate Diagnostics, Inc. * | 3,521 | 95,982 | ||||||
| Cambrex Corp. * | 10,665 | 474,166 | ||||||
| INC Research Holdings, Inc., Class A * | 5,777 | 257,539 | ||||||
| Luminex Corp. * | 8,372 | 190,212 | ||||||
| INVESTMENTS | SHARES | VALUE | ||||||
| Life Sciences Tools & Services - 0.9% (continued) | ||||||||
| NeoGenomics, Inc. * | 39,315 | $ | 323,169 | |||||
| Pacific Biosciences of California, Inc. *(a) | 55,131 | 493,974 | ||||||
| PRA Health Sciences, Inc. * | 22,011 | 1,243,842 | ||||||
|
| |||||||
| 3,078,884 | ||||||||
|
| |||||||
| Machinery - 3.2% | ||||||||
| Actuant Corp., Class A | 6,940 | 161,286 | ||||||
| Alamo Group, Inc. | 4,338 | 285,831 | ||||||
| Albany International Corp., Class A | 2,564 | 108,662 | ||||||
| Altra Industrial Motion Corp. | 5,521 | 159,943 | ||||||
| Astec Industries, Inc. | 7,906 | 473,332 | ||||||
| Barnes Group, Inc. | 3,154 | 127,895 | ||||||
| Briggs & Stratton Corp. | 13,814 | 257,631 | ||||||
| CIRCOR International, Inc. | 4,102 | 244,315 | ||||||
| Douglas Dynamics, Inc. | 12,738 | 406,852 | ||||||
| Energy Recovery, Inc. *(a) | 44,516 | 711,366 | ||||||
| Federal Signal Corp. | 14,847 | 196,871 | ||||||
| Franklin Electric Co., Inc. | 11,415 | 464,705 | ||||||
| Global Brass & Copper Holdings, Inc. | 16,684 | 482,001 | ||||||
| John Bean Technologies Corp. | 15,679 | 1,106,153 | ||||||
| Kadant, Inc. | 3,300 | 171,963 | ||||||
| Lydall, Inc. * | 10,527 | 538,245 | ||||||
| Manitowoc Co., Inc. (The) | 40,525 | 194,115 | ||||||
| Mueller Industries, Inc. | 7,029 | 227,880 | ||||||
| Mueller Water Products, Inc., Class A | 76,021 | 954,064 | ||||||
| Proto Labs, Inc. *(a) | 2,037 | 122,037 | ||||||
| RBC Bearings, Inc. * | 4,711 | 360,297 | ||||||
| SPX Corp. * | 4,812 | 96,914 | ||||||
| Standex International Corp. | 4,173 | 387,546 | ||||||
| Supreme Industries, Inc., Class A | 22,373 | 431,799 | ||||||
| Tennant Co. | 3,269 | 211,831 | ||||||
| Wabash National Corp. * | 11,007 | 156,740 | ||||||
| Watts Water Technologies, Inc., Class A | 7,056 | 457,511 | ||||||
| Woodward, Inc. | 16,146 | 1,008,802 | ||||||
|
| |||||||
| 10,506,587 | ||||||||
|
| |||||||
| Marine - 0.1% | ||||||||
| Matson, Inc. | 4,403 | 175,592 | ||||||
|
| |||||||
| Media - 0.9% | ||||||||
| Entravision Communications Corp., Class A | 28,539 | 217,753 | ||||||
| Gray Television, Inc. * | 15,238 | 157,866 | ||||||
| Meredith Corp. | 4,851 | 252,203 | ||||||
| National CineMedia, Inc. | 10,496 | 154,501 | ||||||
| New Media Investment Group, Inc. | 8,166 | 126,573 | ||||||
| New York Times Co. (The), Class A | 20,517 | 245,178 | ||||||
| Scholastic Corp. | 9,598 | 377,777 | ||||||
| Sinclair Broadcast Group, Inc., Class A | 28,823 | 832,408 | ||||||
| World Wrestling Entertainment, Inc., Class A (a) | 28,272 | 602,194 | ||||||
|
| |||||||
| 2,966,453 | ||||||||
|
| |||||||
| Metals & Mining - 2.0% | ||||||||
| AK Steel Holding Corp. *(a) | 138,303 | 668,003 | ||||||
| Century Aluminum Co. * | 14,183 | 98,572 | ||||||
| Cliffs Natural Resources, Inc. *(a) | 100,030 | 585,175 | ||||||
| Coeur Mining, Inc. * | 85,378 | 1,010,022 | ||||||
| Commercial Metals Co. | 10,881 | 176,163 | ||||||
| The accompanying notes are an integral part of these financial statements. | (Continued) |
| AQR Funds | Annual Report | September 2016 | ||||||||||||||
100
| Schedule of Investments | September 30, 2016 |
| AQR SMALL CAP MOMENTUM STYLE FUND |
| INVESTMENTS | SHARES | VALUE | ||||||
| Metals & Mining - 2.0% (continued) | ||||||||
| Gold Resource Corp. (a) | 35,223 | $ | 261,355 | |||||
| Hecla Mining Co. | 181,197 | 1,032,823 | ||||||
| Kaiser Aluminum Corp. | 5,091 | 440,321 | ||||||
| Materion Corp. | 4,614 | 141,696 | ||||||
| Olympic Steel, Inc. | 13,887 | 306,903 | ||||||
| Ryerson Holding Corp. * | 32,102 | 362,431 | ||||||
| Stillwater Mining Co. * | 23,381 | 312,370 | ||||||
| Worthington Industries, Inc. | 23,099 | 1,109,445 | ||||||
|
| |||||||
| 6,505,279 | ||||||||
|
| |||||||
| Multiline Retail - 0.2% | ||||||||
| Big Lots, Inc. | 7,444 | 355,451 | ||||||
| Ollie’s Bargain Outlet Holdings, Inc. * | 13,539 | 354,857 | ||||||
|
| |||||||
| 710,308 | ||||||||
|
| |||||||
| Multi-Utilities - 1.1% | ||||||||
| Avista Corp. | 22,685 | 948,006 | ||||||
| Black Hills Corp. | 18,586 | 1,137,835 | ||||||
| NorthWestern Corp. | 16,468 | 947,404 | ||||||
| Unitil Corp. | 12,864 | 502,468 | ||||||
|
| |||||||
| 3,535,713 | ||||||||
|
| |||||||
| Oil, Gas & Consumable Fuels - 1.6% | ||||||||
| Ardmore Shipping Corp. (Ireland) | 14,473 | 101,890 | ||||||
| Bill Barrett Corp. * | 31,889 | 177,303 | ||||||
| Callon Petroleum Co. * | 76,411 | 1,199,653 | ||||||
| Contango Oil & Gas Co. * | 10,754 | 109,906 | ||||||
| EXCO Resources, Inc. *(a) | 171,503 | 183,508 | ||||||
| Matador Resources Co. * | 6,330 | 154,072 | ||||||
| Nordic American Tankers Ltd. (a) | 9,448 | 95,519 | ||||||
| Par Pacific Holdings, Inc. * | 10,609 | 138,766 | ||||||
| PDC Energy, Inc. * | 15,056 | 1,009,655 | ||||||
| REX American Resources Corp. * | 1,134 | 96,118 | ||||||
| RSP Permian, Inc. * | 40,790 | 1,581,836 | ||||||
| Sanchez Energy Corp. * | 11,537 | 101,987 | ||||||
| Ship Finance International Ltd. (Norway) (a) | 22,055 | 324,870 | ||||||
|
| |||||||
| 5,275,083 | ||||||||
|
| |||||||
| Paper & Forest Products - 0.5% | ||||||||
| Clearwater Paper Corp. * | 2,894 | 187,155 | ||||||
| Louisiana-Pacific Corp. * | 50,479 | 950,519 | ||||||
| Neenah Paper, Inc. | 4,575 | 361,471 | ||||||
|
| |||||||
| 1,499,145 | ||||||||
|
| |||||||
| Personal Products - 0.3% | ||||||||
| Avon Products, Inc. | 21,344 | 120,807 | ||||||
| Inter Parfums, Inc. | 6,100 | 196,847 | ||||||
| Natural Health Trends Corp. (a) | 9,234 | 260,953 | ||||||
| Revlon, Inc., Class A * | 6,461 | 237,635 | ||||||
|
| |||||||
| 816,242 | ||||||||
|
| |||||||
| Pharmaceuticals - 1.6% | ||||||||
| Amphastar Pharmaceuticals, Inc. * | 13,180 | 250,025 | ||||||
| ANI Pharmaceuticals, Inc. * | 1,416 | 93,952 | ||||||
| Corcept Therapeutics, Inc. * | 28,297 | 183,930 | ||||||
| Dermira, Inc. * | 17,210 | 582,042 | ||||||
| Heska Corp. * | 10,823 | 589,096 | ||||||
| Intra-Cellular Therapies, Inc. * | 16,875 | 257,175 | ||||||
| Medicines Co. (The) * | 13,662 | 515,604 | ||||||
| Nektar Therapeutics * | 46,797 | 803,972 | ||||||
| INVESTMENTS | SHARES | VALUE | ||||||
| Pharmaceuticals - 1.6% (continued) | ||||||||
| Prestige Brands Holdings, Inc. * | 15,964 | $ | 770,582 | |||||
| SciClone Pharmaceuticals, Inc. * | 24,050 | 246,513 | ||||||
| Supernus Pharmaceuticals, Inc. * | 25,872 | 639,815 | ||||||
| TherapeuticsMD, Inc. *(a) | 61,551 | 419,162 | ||||||
|
| |||||||
| 5,351,868 | ||||||||
|
| |||||||
| Professional Services - 1.0% | ||||||||
| Barrett Business Services, Inc. | 3,741 | 185,591 | ||||||
| CRA International, Inc. * | 6,151 | 163,555 | ||||||
| Exponent, Inc. | 14,044 | 717,087 | ||||||
| FTI Consulting, Inc. * | 3,688 | 164,337 | ||||||
| Heidrick & Struggles International, Inc. | 6,742 | 125,064 | ||||||
| Insperity, Inc. | 7,571 | 549,957 | ||||||
| Kelly Services, Inc., Class A | 6,667 | 128,140 | ||||||
| Kforce, Inc. | 6,514 | 133,472 | ||||||
| Mistras Group, Inc. * | 11,599 | 272,229 | ||||||
| On Assignment, Inc. * | 2,835 | 102,882 | ||||||
| Resources Connection, Inc. | 10,068 | 150,416 | ||||||
| TrueBlue, Inc. * | 4,421 | 100,180 | ||||||
| WageWorks, Inc. * | 9,711 | 591,497 | ||||||
|
| |||||||
| 3,384,407 | ||||||||
|
| |||||||
| Real Estate Management & Development - 0.2% | ||||||||
| Altisource Portfolio Solutions SA *(a) | 4,222 | 136,793 | ||||||
| HFF, Inc., Class A | 3,604 | 99,795 | ||||||
| Marcus & Millichap, Inc. * | 5,385 | 140,818 | ||||||
| RE/MAX Holdings, Inc., Class A | 5,481 | 239,958 | ||||||
|
| |||||||
| 617,364 | ||||||||
|
| |||||||
| Road & Rail - 0.0% (b) | ||||||||
| Marten Transport Ltd. | 7,355 | 154,455 | ||||||
|
| |||||||
| Semiconductors & Semiconductor Equipment - 5.2% | ||||||||
| Advanced Energy Industries, Inc. * | 19,613 | 928,087 | ||||||
| Advanced Micro Devices, Inc. * | 360,922 | 2,493,971 | ||||||
| Alpha & Omega Semiconductor Ltd. * | 13,854 | 300,909 | ||||||
| Amkor Technology, Inc. * | 81,224 | 789,497 | ||||||
| Applied Micro Circuits Corp. * | 23,174 | 161,059 | ||||||
| Axcelis Technologies, Inc. * | 13,172 | 174,924 | ||||||
| Brooks Automation, Inc. | 10,126 | 137,815 | ||||||
| Cabot Microelectronics Corp. | 2,479 | 131,164 | ||||||
| CEVA, Inc. * | 12,403 | 434,973 | ||||||
| Cirrus Logic, Inc. * | 28,336 | 1,506,058 | ||||||
| Entegris, Inc. * | 15,466 | 269,418 | ||||||
| FormFactor, Inc. * | 28,368 | 307,793 | ||||||
| Inphi Corp. * | 21,064 | 916,495 | ||||||
| Integrated Device Technology, Inc. * | 7,562 | 174,682 | ||||||
| Lattice Semiconductor Corp. * | 35,743 | 231,972 | ||||||
| MACOM Technology Solutions Holdings, Inc. * | 15,183 | 642,848 | ||||||
| MaxLinear, Inc., Class A * | 40,285 | 816,577 | ||||||
| Microsemi Corp. * | 24,032 | 1,008,863 | ||||||
| MKS Instruments, Inc. | 14,155 | 703,928 | ||||||
| Monolithic Power Systems, Inc. | 20,957 | 1,687,039 | ||||||
| Nanometrics, Inc. * | 9,875 | 220,608 | ||||||
| NeoPhotonics Corp. * | 24,579 | 401,621 | ||||||
| Photronics, Inc. * | 17,287 | 178,229 | ||||||
| Power Integrations, Inc. | 9,694 | 611,013 | ||||||
| Rudolph Technologies, Inc. * | 14,942 | 265,071 | ||||||
| The accompanying notes are an integral part of these financial statements. | (Continued) |
| AQR Funds | Annual Report | September 2016 | ||||||||||||||
101
| Schedule of Investments | September 30, 2016 |
| AQR SMALL CAP MOMENTUM STYLE FUND |
| INVESTMENTS | SHARES | VALUE | ||||||
| Semiconductors & Semiconductor Equipment - 5.2% (continued) | ||||||||
| Semtech Corp. * | 21,848 | $ | 605,845 | |||||
| Sigma Designs, Inc. * | 22,053 | 171,793 | ||||||
| Silicon Laboratories, Inc. * | 3,381 | 198,803 | ||||||
| Tessera Technologies, Inc. | 4,092 | 157,296 | ||||||
| Ultratech, Inc. * | 4,898 | 113,046 | ||||||
| Xcerra Corp. * | 21,804 | 132,132 | ||||||
|
| |||||||
| 16,873,529 | ||||||||
|
| |||||||
| Software - 5.6% | ||||||||
| 8x8, Inc. * | 43,402 | 669,693 | ||||||
| A10 Networks, Inc. * | 24,258 | 259,318 | ||||||
| ACI Worldwide, Inc. * | 5,609 | 108,702 | ||||||
| Aspen Technology, Inc. * | 2,580 | 120,718 | ||||||
| Blackbaud, Inc. | 15,394 | 1,021,238 | ||||||
| Bottomline Technologies de, Inc. * | 6,446 | 150,256 | ||||||
| BroadSoft, Inc. * | 14,581 | 678,746 | ||||||
| Callidus Software, Inc. * | 30,531 | 560,244 | ||||||
| CommVault Systems, Inc. * | 12,018 | 638,516 | ||||||
| Digimarc Corp. *(a) | 4,179 | 160,265 | ||||||
| Ebix, Inc. (a) | 15,421 | 876,684 | ||||||
| Ellie Mae, Inc. * | 12,916 | 1,360,055 | ||||||
| Fair Isaac Corp. | 12,303 | 1,532,831 | ||||||
| Gigamon, Inc. * | 14,373 | 787,640 | ||||||
| HubSpot, Inc. * | 5,156 | 297,089 | ||||||
| MicroStrategy, Inc., Class A * | 737 | 123,403 | ||||||
| Mitek Systems, Inc. * | 27,452 | 227,577 | ||||||
| Monotype Imaging Holdings, Inc. | 5,625 | 124,369 | ||||||
| Paycom Software, Inc. *(a) | 24,779 | 1,242,171 | ||||||
| Paylocity Holding Corp. * | 19,311 | 858,567 | ||||||
| Pegasystems, Inc. | 17,696 | 521,855 | ||||||
| Progress Software Corp. * | 3,731 | 101,483 | ||||||
| Proofpoint, Inc. * | 8,325 | 623,126 | ||||||
| RealPage, Inc. * | 23,311 | 599,093 | ||||||
| RingCentral, Inc., Class A * | 27,044 | 639,861 | ||||||
| Silver Spring Networks, Inc. * | 17,845 | 253,042 | ||||||
| Take-Two Interactive Software, Inc. * | 32,781 | 1,477,768 | ||||||
| Telenav, Inc. * | 14,428 | 82,673 | ||||||
| TiVo Corp. * | 29,338 | 571,504 | ||||||
| Varonis Systems, Inc. * | 5,758 | 173,316 | ||||||
| Zendesk, Inc. * | 39,902 | 1,225,390 | ||||||
| Zix Corp. * | 50,931 | 208,817 | ||||||
|
| |||||||
| 18,276,010 | ||||||||
|
| |||||||
| Specialty Retail - 1.0% | ||||||||
| Abercrombie & Fitch Co., Class A | 6,140 | 97,565 | ||||||
| American Eagle Outfitters, Inc. | 5,369 | 95,890 | ||||||
| Caleres, Inc. | 5,009 | 126,678 | ||||||
| Cato Corp. (The), Class A | 3,507 | 115,345 | ||||||
| Children’s Place, Inc. (The) | 6,913 | 552,141 | ||||||
| Citi Trends, Inc. | 7,878 | 157,008 | ||||||
| Five Below, Inc. * | 17,721 | 713,979 | ||||||
| Haverty Furniture Cos., Inc. | 7,500 | 150,300 | ||||||
| Lithia Motors, Inc., Class A | 2,259 | 215,780 | ||||||
| Monro Muffler Brake, Inc. | 4,806 | 293,983 | ||||||
| Shoe Carnival, Inc. | 7,229 | 192,725 | ||||||
| Sportsman’s Warehouse Holdings, Inc. * | 11,753 | 123,642 | ||||||
| Tile Shop Holdings, Inc. * | 21,438 | 354,799 | ||||||
|
| |||||||
| 3,189,835 | ||||||||
|
| |||||||
| INVESTMENTS | SHARES | VALUE | ||||||
| Technology Hardware, Storage & Peripherals - 0.3% | ||||||||
| 3D Systems Corp. * | 12,407 | $ | 222,705 | |||||
| Cray, Inc. * | 16,187 | 381,042 | ||||||
| Electronics For Imaging, Inc. * | 6,439 | 314,996 | ||||||
|
| |||||||
| 918,743 | ||||||||
|
| |||||||
| Textiles, Apparel & Luxury Goods - 0.5% | ||||||||
| Columbia Sportswear Co. | 7,884 | 447,338 | ||||||
| Culp, Inc. | 11,894 | 354,084 | ||||||
| Movado Group, Inc. | 5,631 | 120,954 | ||||||
| Perry Ellis International, Inc. * | 7,211 | 139,028 | ||||||
| Sequential Brands Group, Inc. *(a) | 17,635 | 141,080 | ||||||
| Unifi, Inc. * | 5,876 | 172,931 | ||||||
| Vera Bradley, Inc. * | 7,194 | 108,989 | ||||||
|
| |||||||
| 1,484,404 | ||||||||
|
| |||||||
| Thrifts & Mortgage Finance - 2.2% | ||||||||
| Beneficial Bancorp, Inc. | 31,592 | 464,718 | ||||||
| Capitol Federal Financial, Inc. | 27,273 | 383,731 | ||||||
| Dime Community Bancshares, Inc. | 8,591 | 143,985 | ||||||
| Federal Agricultural Mortgage Corp., Class C | 2,455 | 96,973 | ||||||
| First Defiance Financial Corp. | 7,175 | 320,292 | ||||||
| Flagstar Bancorp, Inc. * | 20,448 | 567,432 | ||||||
| HomeStreet, Inc. * | 8,667 | 217,195 | ||||||
| Kearny Financial Corp. | 28,847 | 392,608 | ||||||
| LendingTree, Inc. *(a) | 3,090 | 299,452 | ||||||
| Meridian Bancorp, Inc. | 29,164 | 454,083 | ||||||
| Meta Financial Group, Inc. | 6,520 | 395,177 | ||||||
| Northfield Bancorp, Inc. | 9,328 | 150,181 | ||||||
| Northwest Bancshares, Inc. | 37,079 | 582,511 | ||||||
| Oritani Financial Corp. | 22,154 | 348,261 | ||||||
| Provident Financial Services, Inc. | 11,436 | 242,786 | ||||||
| Walker & Dunlop, Inc. * | 12,314 | 311,052 | ||||||
| Washington Federal, Inc. | 26,965 | 719,426 | ||||||
| Waterstone Financial, Inc. | 33,935 | 576,556 | ||||||
| WSFS Financial Corp. | 10,598 | 386,721 | ||||||
|
| |||||||
| 7,053,140 | ||||||||
|
| |||||||
| Tobacco - 0.4% | ||||||||
| Universal Corp. (a) | 5,375 | 312,932 | ||||||
| Vector Group Ltd. (a) | 43,615 | 939,029 | ||||||
|
| |||||||
| 1,251,961 | ||||||||
|
| |||||||
| Trading Companies & Distributors - 0.7% | ||||||||
| Aircastle Ltd. | 5,512 | 109,468 | ||||||
| Applied Industrial Technologies, Inc. | 3,381 | 158,028 | ||||||
| Beacon Roofing Supply, Inc. * | 22,211 | 934,417 | ||||||
| H&E Equipment Services, Inc. | 11,725 | 196,511 | ||||||
| Kaman Corp. | 4,422 | 194,214 | ||||||
| MRC Global, Inc. * | 29,404 | 483,108 | ||||||
| NOW, Inc. * | 12,331 | 264,253 | ||||||
|
| |||||||
| 2,339,999 | ||||||||
|
| |||||||
| Water Utilities - 0.6% | ||||||||
| American States Water Co. | 10,869 | 435,303 | ||||||
| California Water Service Group | 13,155 | 422,144 | ||||||
| Connecticut Water Service, Inc. | 6,009 | 298,828 | ||||||
| Middlesex Water Co. | 8,786 | 309,619 | ||||||
| SJW Corp. | 7,772 | 339,481 | ||||||
|
| |||||||
| 1,805,375 | ||||||||
|
| |||||||
| The accompanying notes are an integral part of these financial statements. | (Continued) |
| AQR Funds | Annual Report | September 2016 | ||||||||||||||
102
| Schedule of Investments | September 30, 2016 |
| AQR SMALL CAP MOMENTUM STYLE FUND |
| INVESTMENTS | SHARES | VALUE | ||||||
| Wireless Telecommunication Services - 0.4% | ||||||||
| Boingo Wireless, Inc. * | 19,566 | $ | 201,139 | |||||
| Shenandoah Telecommunications Co. | 30,202 | 821,796 | ||||||
| Spok Holdings, Inc. | 10,576 | 188,464 | ||||||
|
| |||||||
| 1,211,399 | ||||||||
|
| |||||||
TOTAL COMMON STOCKS | 316,916,598 | |||||||
|
| |||||||
| RIGHTS - 0.0% (b) | NO. OF RIGHTS | |||||||
| Biotechnology - 0.0% (b) | ||||||||
| Durata Therapeutics, Inc. (3)*(a)(c) | 9,900 | 8,647 | ||||||
|
| |||||||
| Electronic Equipment, Instruments & Components - 0.0% | ||||||||
| Gerber Scientific, Inc. (3)*(a)(c) | 4,000 | — | ||||||
|
| |||||||
TOTAL RIGHTS | 8,647 | |||||||
|
| |||||||
| WARRANT - 0.0% | NO. OF WARRANTS | |||||||
| Diversified Consumer Services - 0.0% | ||||||||
Education Management Corp., expiring 5/1/2022 | 6,600 | — | ||||||
|
| |||||||
| SHORT-TERM INVESTMENT - 2.7% | SHARES | |||||||
| Investment Company - 2.7% | ||||||||
| J.P. Morgan U.S. Treasury Plus Money Market Fund - IM Shares, 0.22% | ||||||||
(cost $8,789,282) (2)(d) | 8,789,282 | 8,789,282 | ||||||
|
| |||||||
| SECURITIES LENDING COLLATERAL - 7.4% | ||||||||
| Money Market Funds - 7.4% | ||||||||
| Investments in a Pooled Account through Securities Lending Program with JPMorgan Chase Bank Dreyfus Treasury & Agency Cash Management, 0.21% | ||||||||
(cost $24,311,255) (2)(d)(e) | 24,311,255 | 24,311,255 | ||||||
|
| |||||||
TOTAL INVESTMENTS IN SECURITIES |
| 350,025,782 | ||||||
|
| |||||||
| LIABILITIES IN EXCESS OF OTHER ASSETS - (7.0%) (f) | (22,807,725) | |||||||
|
| |||||||
NET ASSETS - 100.0% | 327,218,057 | |||||||
|
| |||||||
| SECTOR | VALUE | % OF NET ASSETS | ||||||
| Consumer Discretionary | $ | 32,127,643 | 9.8 | % | ||||
| Consumer Staples | 13,354,108 | 4.1 | ||||||
| Energy | 8,100,396 | 2.5 | ||||||
| Financials | 33,890,373 | 10.4 | ||||||
| Health Care | 39,613,668 | 12.1 | ||||||
| Industrials | 42,521,680 | 13.0 | ||||||
| Information Technology | 74,275,126 | 22.7 | ||||||
| Materials | 14,604,088 | 4.5 | ||||||
| Real Estate | 34,057,529 | 10.4 | ||||||
| Telecommunication Services | 4,737,675 | 1.4 | ||||||
| Utilities | 19,642,959 | 6.0 | ||||||
| Short-Term Investment | 8,789,282 | 2.7 | ||||||
| Securities Lending Collateral | 24,311,255 | 7.4 | ||||||
|
|
|
| |||||
Total Investments In Securities At Value | 350,025,782 | 107.0 | ||||||
| Liabilities in Excess of Other Assets (f) | (22,807,725 | ) | (7.0 | ) | ||||
|
|
|
| |||||
Net Assets | $ | 327,218,057 | 100.0 | % | ||||
|
|
|
| |||||
All securities are United States companies, unless noted otherwise in parentheses.
| * | Non-income producing security. |
| (a) | The security or a portion of this security is on loan at 9/30/2016. The total value of securities on loan at 9/30/2016 was $23,686,170. |
| (b) | Represents less than 0.05% of net assets. |
| (c) | Security fair valued as of 9/30/2016 in accordance with procedures approved by the Board of Trustees. Total value of all such securities at 9/30/2016 amounted to $8,647, which represents approximately 0.00% of net assets of the fund. |
| (d) | Represents 7-day effective yield as of 9/30/2016. |
| (e) | Represents security, or portion thereof, purchased with the cash collateral received for securities on loan. |
| (f) | Includes appreciation/(depreciation) on futures contracts. |
All securities are Level 1 with respect to ASC 820, unless otherwise noted in parentheses.
| (2) | Level 2 security (See Note 4). |
| (3) | Level 3 security (See Note 4). |
| The accompanying notes are an integral part of these financial statements. | (Continued) |
| AQR Funds | Annual Report | September 2016 | ||||||||||||||
103
| Schedule of Investments | September 30, 2016 |
| AQR SMALL CAP MOMENTUM STYLE FUND |
Open futures contracts outstanding at September 30, 2016:
Exchange Traded
| NUMBER OF CONTRACTS | COUNTERPARTY | DESCRIPTION | EXPIRATION DATE | VALUE AT TRADE DATE | VALUE AT SEPTEMBER 30, 2016 | UNREALIZED APPRECIATION (DEPRECIATION) | ||||||||||||
| Long Contracts: | ||||||||||||||||||
| 59 | BARC | E-Mini Russell 2000 Futures | 12/2016 | $7,240,582 | $7,364,970 | $124,388 | ||||||||||||
|
|
|
|
|
| |||||||||||||
Collateral pledged to, or (received from), each counterparty at September 30, 2016 was as follows:
| COUNTERPARTY | OVER THE COUNTER | EXCHANGE TRADED | TOTAL | |||||||||
| BARC | ||||||||||||
| Cash | $— | $295,846 | $295,846 | |||||||||
| ||||||||||||
| The accompanying notes are an integral part of these financial statements. |
| AQR Funds | Annual Report | September 2016 | ||||||||||||||
104
| Schedule of Investments | September 30, 2016 |
| AQR INTERNATIONAL MOMENTUM STYLE FUND |
| INVESTMENTS | SHARES | VALUE | ||||||
| COMMON STOCKS - 97.3% | ||||||||
| Australia - 6.4% | ||||||||
| AGL Energy Ltd. | 70,264 | $ | 1,028,687 | |||||
| Alumina Ltd. | 92,527 | 104,172 | ||||||
| Amcor Ltd. | 57,254 | 666,854 | ||||||
| AMP Ltd. | 26,931 | 109,485 | ||||||
| Aristocrat Leisure Ltd. | 67,187 | 817,459 | ||||||
| ASX Ltd. | 6,715 | 248,780 | ||||||
| Aurizon Holdings Ltd. | 51,027 | 184,495 | ||||||
| AusNet Services | 141,964 | 178,935 | ||||||
| Brambles Ltd. | 78,037 | 719,309 | ||||||
| Caltex Australia Ltd. | 18,724 | 495,040 | ||||||
| Challenger Ltd. | 26,415 | 206,848 | ||||||
| CIMIC Group Ltd. | 12,885 | 285,370 | ||||||
| Cochlear Ltd. | 4,247 | 460,345 | ||||||
| CSL Ltd. | 33,157 | 2,726,519 | ||||||
| Dexus Property Group, REIT | 54,248 | 381,285 | ||||||
| Domino’s Pizza Enterprises Ltd. | 3,574 | 193,647 | ||||||
| Flight Centre Travel Group Ltd. | 5,286 | 147,979 | ||||||
| Fortescue Metals Group Ltd. | 194,779 | 745,531 | ||||||
| Goodman Group, REIT | 80,962 | 453,766 | ||||||
| GPT Group (The), REIT | 214,608 | 835,695 | ||||||
| Harvey Norman Holdings Ltd. | 63,440 | 253,946 | ||||||
| Incitec Pivot Ltd. | 54,550 | 118,560 | ||||||
| Insurance Australia Group Ltd. | 33,454 | 140,891 | ||||||
| Macquarie Group Ltd. | 9,339 | 590,640 | ||||||
| Medibank Pvt Ltd. | 253,480 | 482,876 | ||||||
| Mirvac Group, REIT | 134,805 | 232,403 | ||||||
| Newcrest Mining Ltd. | 52,909 | 893,112 | ||||||
| Qantas Airways Ltd. | 122,069 | 293,187 | ||||||
| QBE Insurance Group Ltd. | 19,200 | 137,386 | ||||||
| Ramsay Health Care Ltd. | 15,757 | 958,794 | ||||||
| REA Group Ltd. | 5,751 | 250,139 | ||||||
| Scentre Group, REIT | 469,735 | 1,695,831 | ||||||
| SEEK Ltd. | 14,726 | 176,536 | ||||||
| South32 Ltd. | 171,646 | 319,814 | ||||||
| Stockland, REIT | 109,739 | 401,911 | ||||||
| Suncorp Group Ltd. | 11,430 | 106,635 | ||||||
| Tabcorp Holdings Ltd. | 103,175 | 395,093 | ||||||
| Tatts Group Ltd. | 66,241 | 186,175 | ||||||
| Telstra Corp. Ltd. | 52,734 | 210,257 | ||||||
| TPG Telecom Ltd. | 52,484 | 348,274 | ||||||
| Treasury Wine Estates Ltd. | 161,460 | 1,370,261 | ||||||
| Vocus Communications Ltd. | 73,199 | 351,050 | ||||||
| Westfield Corp., REIT | 78,719 | 589,022 | ||||||
|
| |||||||
| 21,492,994 | ||||||||
|
| |||||||
| Austria - 0.4% | ||||||||
| ANDRITZ AG | 8,061 | 438,656 | ||||||
| Erste Group Bank AG * | 3,417 | 101,183 | ||||||
| OMV AG | 33,152 | 954,514 | ||||||
|
| |||||||
| 1,494,353 | ||||||||
|
| |||||||
| Belgium - 1.9% | ||||||||
| Ageas | 13,674 | 499,968 | ||||||
| Anheuser-Busch InBev SA/NV | 35,552 | 4,675,367 | ||||||
| Colruyt SA | 5,800 | 322,106 | ||||||
| Proximus SADP | 4,059 | 121,429 | ||||||
| UCB SA | 6,994 | 541,376 | ||||||
| Umicore SA | 6,822 | 428,347 | ||||||
|
| |||||||
| 6,588,593 | ||||||||
|
| |||||||
| INVESTMENTS | SHARES | VALUE | ||||||
| Canada - 13.2% | ||||||||
| Agnico Eagle Mines Ltd. (1) | 21,352 | $ | 1,154,712 | |||||
| Alimentation Couche-Tard, Inc., Class B (1) | 16,559 | 802,486 | ||||||
| ARC Resources Ltd. (1) | 9,471 | 171,307 | ||||||
| Bank of Montreal (1) | 36,260 | 2,376,060 | ||||||
| Bank of Nova Scotia (The) (1) | 48,946 | 2,593,640 | ||||||
| Barrick Gold Corp. (1) | 81,696 | 1,446,548 | ||||||
| BCE, Inc. (1) | 53,442 | 2,468,121 | ||||||
| Bombardier, Inc., Class B (1)* | 121,969 | 167,342 | ||||||
| Canadian Imperial Bank of Commerce (1) | 20,437 | 1,584,707 | ||||||
| Canadian National Railway Co. (1) | 8,546 | 558,638 | ||||||
| Canadian Natural Resources Ltd. (1) | 64,212 | 2,052,709 | ||||||
| Canadian Tire Corp. Ltd., Class A (1) | 3,668 | 367,317 | ||||||
| CCL Industries, Inc., Class B (1) | 4,952 | 953,485 | ||||||
| CGI Group, Inc., Class A (1)* | 23,312 | 1,110,383 | ||||||
| Constellation Software, Inc. (1) | 829 | 373,709 | ||||||
| Crescent Point Energy Corp. (1) | 9,477 | 124,968 | ||||||
| Dollarama, Inc. (1) | 12,419 | 969,609 | ||||||
| Eldorado Gold Corp. (1)* | 42,210 | 166,015 | ||||||
| Encana Corp., Class R (1) | 39,381 | 411,535 | ||||||
| Fairfax Financial Holdings Ltd. (1) | 530 | 310,547 | ||||||
| First Capital Realty, Inc. (1) | 6,303 | 105,598 | ||||||
| First Quantum Minerals Ltd. (1) | 49,130 | 406,686 | ||||||
| Fortis, Inc. (1) | 16,654 | 535,563 | ||||||
| Franco-Nevada Corp. (1) | 14,615 | 1,021,084 | ||||||
| George Weston Ltd. (1) | 4,631 | 386,308 | ||||||
| Goldcorp, Inc. (1) | 9,095 | 150,087 | ||||||
| Imperial Oil Ltd. (1) | 5,611 | 175,522 | ||||||
| Intact Financial Corp. (1) | 2,479 | 179,205 | ||||||
| Keyera Corp. (1) | 16,585 | 536,252 | ||||||
| Kinross Gold Corp. (1)* | 141,587 | 596,803 | ||||||
| Loblaw Cos. Ltd. (1) | 6,423 | 330,464 | ||||||
| Metro, Inc. (1) | 26,211 | 860,481 | ||||||
| Onex Corp. (1) | 8,499 | 547,338 | ||||||
| Open Text Corp. (1) | 9,046 | 585,944 | ||||||
| Peyto Exploration & Development Corp. (1) | 5,685 | 159,550 | ||||||
| Restaurant Brands International, Inc. (1) | 25,328 | 1,129,378 | ||||||
| Rogers Communications, Inc., Class B (1) | 35,397 | 1,501,732 | ||||||
| Royal Bank of Canada (1) | 32,917 | 2,038,824 | ||||||
| Saputo, Inc. (1) | 20,013 | 695,448 | ||||||
| Seven Generations Energy Ltd., Class A (1)* | 40,897 | 984,433 | ||||||
| Silver Wheaton Corp. (1) | 38,338 | 1,035,633 | ||||||
| SNC-Lavalin Group, Inc. (1) | 6,618 | 259,938 | ||||||
| Sun Life Financial, Inc. (1) | 33,384 | 1,086,294 | ||||||
| Suncor Energy, Inc. (1) | 50,978 | 1,415,160 | ||||||
| Teck Resources Ltd., Class B (1) | 57,866 | 1,043,127 | ||||||
| Toronto-Dominion Bank (The) (1) | 95,404 | 4,235,168 | ||||||
| TransCanada Corp. (1) | 44,188 | 2,098,673 | ||||||
| Yamana Gold, Inc. (1) | 70,374 | 303,070 | ||||||
|
| |||||||
| 44,567,601 | ||||||||
|
| |||||||
| Denmark - 2.1% | ||||||||
| Carlsberg A/S, Class B | 2,772 | 264,931 | ||||||
| Chr Hansen Holding A/S | 9,929 | 591,418 | ||||||
| Coloplast A/S, Class B | 5,148 | 400,367 | ||||||
| DSV A/S | 15,616 | 779,163 | ||||||
| Genmab A/S * | 5,450 | 932,783 | ||||||
| ISS A/S | 12,970 | 538,965 | ||||||
| Novo Nordisk A/S, Class B | 4,389 | 182,928 | ||||||
| Pandora A/S | 9,719 | 1,177,162 | ||||||
| The accompanying notes are an integral part of these financial statements. | (Continued) |
| AQR Funds | Annual Report | September 2016 | ||||||||||||||
105
| Schedule of Investments | September 30, 2016 |
| AQR INTERNATIONAL MOMENTUM STYLE FUND |
| INVESTMENTS | SHARES | VALUE | ||||||
| Denmark - 2.1% (continued) | ||||||||
| Tryg A/S | 18,790 | $ | 377,543 | |||||
| Vestas Wind Systems A/S | 17,954 | 1,483,064 | ||||||
| William Demant Holding A/S * | 19,555 | 399,067 | ||||||
|
| |||||||
| 7,127,391 | ||||||||
|
| |||||||
| Finland - 1.3% | ||||||||
| Elisa OYJ | 15,555 | 573,253 | ||||||
| Kone OYJ, Class B | 21,937 | 1,113,676 | ||||||
| Metso OYJ | 3,457 | 100,884 | ||||||
| Neste OYJ | 26,159 | 1,115,838 | ||||||
| Nokian Renkaat OYJ | 15,255 | 556,198 | ||||||
| Orion OYJ, Class B | 6,824 | 269,027 | ||||||
| Sampo OYJ, Class A | 4,436 | 197,080 | ||||||
| UPM-Kymmene OYJ | 27,509 | 580,841 | ||||||
|
| |||||||
| 4,506,797 | ||||||||
|
| |||||||
| France - 7.8% | ||||||||
| Accor SA | 3,636 | 144,274 | ||||||
| Air Liquide SA | 2,890 | 309,914 | ||||||
| Airbus Group SE | 28,940 | 1,755,245 | ||||||
| AXA SA | 23,258 | 494,516 | ||||||
| Bouygues SA | 5,122 | 169,862 | ||||||
| Capgemini SA | 13,074 | 1,281,820 | ||||||
| Christian Dior SE | 2,681 | 480,829 | ||||||
| Cie Generale des Etablissements Michelin | 1,645 | 182,159 | ||||||
| Danone SA | 2,756 | 204,641 | ||||||
| Dassault Systemes | 13,270 | 1,151,975 | ||||||
| Essilor International SA | 11,330 | 1,461,519 | ||||||
| Hermes International | 1,920 | 781,654 | ||||||
| Iliad SA | 1,060 | 222,533 | ||||||
| Ingenico Group SA | 2,324 | 203,197 | ||||||
| JCDecaux SA | 3,627 | 117,278 | ||||||
| Kering | 1,110 | 223,979 | ||||||
| Legrand SA | 2,988 | 176,140 | ||||||
| L’Oreal SA | 10,484 | 1,981,576 | ||||||
| LVMH Moet Hennessy Louis Vuitton SE | 6,875 | 1,172,263 | ||||||
| Orange SA | 69,008 | 1,081,186 | ||||||
| Pernod Ricard SA | 4,394 | 520,400 | ||||||
| Safran SA | 6,111 | 439,516 | ||||||
| Sanofi | 1,944 | 148,037 | ||||||
| SCOR SE | 9,686 | 301,215 | ||||||
| Societe BIC SA | 1,113 | 164,556 | ||||||
| Sodexo SA | 3,300 | 393,096 | ||||||
| Thales SA | 10,677 | 983,148 | ||||||
| TOTAL SA | 79,015 | 3,758,000 | ||||||
| Unibail-Rodamco SE, REIT | 7,384 | 1,990,970 | ||||||
| Valeo SA | 8,543 | 498,644 | ||||||
| Veolia Environnement SA | 28,559 | 658,045 | ||||||
| Vinci SA | 27,859 | 2,133,397 | ||||||
| Vivendi SA | 30,525 | 616,070 | ||||||
|
| |||||||
| 26,201,654 | ||||||||
|
| |||||||
| Germany -7.4% | ||||||||
| adidas AG | 15,135 | 2,632,347 | ||||||
| Allianz SE | 5,285 | 785,405 | ||||||
| Beiersdorf AG | 8,715 | 822,636 | ||||||
| Brenntag AG | 6,563 | 358,661 | ||||||
| Continental AG | 2,351 | 495,359 | ||||||
| Deutsche Lufthansa AG | 10,289 | 114,705 | ||||||
| INVESTMENTS | SHARES | VALUE | ||||||
| Germany -7.4% (continued) | ||||||||
| Deutsche Post AG | 14,257 | $ | 446,365 | |||||
| Fresenius Medical Care AG & Co. KGaA | 13,566 | 1,186,834 | ||||||
| GEA Group AG | 7,621 | 423,705 | ||||||
| Hannover Rueck SE | 10,622 | 1,138,629 | ||||||
| HeidelbergCement AG | 5,117 | 483,924 | ||||||
| HOCHTIEF AG | 1,536 | 216,768 | ||||||
| Infineon Technologies AG | 104,576 | 1,864,750 | ||||||
| MAN SE | 6,431 | 678,296 | ||||||
| Merck KGaA | 3,316 | 357,680 | ||||||
| ProSiebenSat.1 Media SE | 9,187 | 393,894 | ||||||
| RWE AG * | 5,983 | 103,324 | ||||||
| SAP SE | 53,035 | 4,850,177 | ||||||
| Siemens AG | 41,099 | 4,819,282 | ||||||
| Symrise AG | 12,205 | 895,049 | ||||||
| thyssenkrupp AG | 10,759 | 257,064 | ||||||
| United Internet AG | 9,362 | 414,615 | ||||||
| Vonovia SE | 27,581 | 1,045,573 | ||||||
| Zalando SE *(a) | 7,013 | 293,013 | ||||||
|
| |||||||
| 25,078,055 | ||||||||
|
| |||||||
| Hong Kong - 3.2% | ||||||||
| AIA Group Ltd. | 361,200 | 2,428,978 | ||||||
| BOC Hong Kong Holdings Ltd. | 72,000 | 244,973 | ||||||
| CLP Holdings Ltd. | 137,000 | 1,418,917 | ||||||
| Hang Seng Bank Ltd. | 22,600 | 405,699 | ||||||
| Hong Kong & China Gas Co. Ltd. | 70,681 | 134,209 | ||||||
| Hysan Development Co. Ltd. | 39,000 | 183,497 | ||||||
| Link REIT | 149,000 | 1,099,932 | ||||||
| MTR Corp. Ltd. | 121,500 | 671,412 | ||||||
| New World Development Co. Ltd. | 135,000 | 177,025 | ||||||
| NWS Holdings Ltd. | 109,000 | 182,663 | ||||||
| PCCW Ltd. | 302,000 | 186,006 | ||||||
| Power Assets Holdings Ltd. | 68,500 | 670,319 | ||||||
| Sands China Ltd. | 34,000 | 149,026 | ||||||
| Sino Land Co. Ltd. | 134,000 | 238,832 | ||||||
| Sun Hung Kai Properties Ltd. | 37,000 | 562,502 | ||||||
| Techtronic Industries Co. Ltd. | 145,000 | 568,008 | ||||||
| WH Group Ltd. (a) | 1,018,000 | 822,791 | ||||||
| Wharf Holdings Ltd. (The) | 43,000 | 315,473 | ||||||
| Wheelock & Co. Ltd. | 27,000 | 160,374 | ||||||
| Yue Yuen Industrial Holdings Ltd. | 44,000 | 181,845 | ||||||
|
| |||||||
| 10,802,481 | ||||||||
|
| |||||||
| Ireland - 0.3% | ||||||||
| Experian plc | 48,579 | 970,510 | ||||||
|
| |||||||
| Italy - 1.1% | ||||||||
| Atlantia SpA | 33,905 | 861,106 | ||||||
| Eni SpA | 27,361 | 394,280 | ||||||
| Leonardo-Finmeccanica SpA * | 15,760 | 178,634 | ||||||
| Prysmian SpA | 23,402 | 612,793 | ||||||
| Snam SpA | 170,900 | 947,618 | ||||||
| Terna Rete Elettrica Nazionale SpA | 150,086 | 773,626 | ||||||
|
| |||||||
| 3,768,057 | ||||||||
|
| |||||||
| Japan - 14.0% | ||||||||
| Acom Co. Ltd. * | 47,300 | 222,997 | ||||||
| Aisin Seiki Co. Ltd. | 2,700 | 123,697 | ||||||
| Ajinomoto Co., Inc. | 4,300 | 95,875 | ||||||
| The accompanying notes are an integral part of these financial statements. | (Continued) |
| AQR Funds | Annual Report | September 2016 | ||||||||||||||
106
| Schedule of Investments | September 30, 2016 |
| AQR INTERNATIONAL MOMENTUM STYLE FUND |
| INVESTMENTS | SHARES | VALUE | ||||||
| Japan - 14.0% (continued) | ||||||||
| Alfresa Holdings Corp. | 20,800 | $ | 440,427 | |||||
| Bandai Namco Holdings, Inc. | 5,400 | 165,284 | ||||||
| CYBERDYNE, Inc. * | 16,300 | 255,286 | ||||||
| Daicel Corp. | 9,900 | 125,107 | ||||||
| Daiichi Sankyo Co. Ltd. | 11,200 | 269,118 | ||||||
| Daikin Industries Ltd. | 14,900 | 1,390,406 | ||||||
| Daito Trust Construction Co. Ltd. | 4,500 | 719,728 | ||||||
| Daiwa House Industry Co. Ltd. | 23,300 | 639,461 | ||||||
| FamilyMart Co. Ltd. | 5,700 | 380,511 | ||||||
| FUJIFILM Holdings Corp. | 2,600 | 96,312 | ||||||
| Hamamatsu Photonics KK | 3,500 | 107,679 | ||||||
| Hankyu Hanshin Holdings, Inc. | 4,800 | 165,499 | ||||||
| Hikari Tsushin, Inc. | 3,600 | 334,298 | ||||||
| Hisamitsu Pharmaceutical Co., Inc. | 5,300 | 286,464 | ||||||
| Hitachi High-Technologies Corp. | 2,500 | 100,078 | ||||||
| Hoshizaki Electric Co. Ltd. | 6,100 | 556,661 | ||||||
| Idemitsu Kosan Co. Ltd. | 7,500 | 155,281 | ||||||
| Iida Group Holdings Co. Ltd. | 28,200 | 567,461 | ||||||
| ITOCHU Corp. | 12,000 | 151,075 | ||||||
| Japan Prime Realty Investment Corp., REIT | 98 | 442,456 | ||||||
| Japan Real Estate Investment Corp., REIT | 122 | 729,550 | ||||||
| Japan Retail Fund Investment Corp., REIT | 255 | 628,924 | ||||||
| Japan Tobacco, Inc. | 20,900 | 855,546 | ||||||
| Kajima Corp. | 92,000 | 643,805 | ||||||
| Kakaku.com, Inc. | 12,600 | 228,159 | ||||||
| Kaneka Corp. | 28,000 | 221,688 | ||||||
| Kansai Paint Co. Ltd. | 8,500 | 186,325 | ||||||
| Kao Corp. | 12,700 | 718,033 | ||||||
| KDDI Corp. | 91,800 | 2,844,149 | ||||||
| Keihan Holdings Co. Ltd. | 26,000 | 181,846 | ||||||
| Keisei Electric Railway Co. Ltd. | 7,000 | 175,017 | ||||||
| Keyence Corp. | 2,240 | 1,641,225 | ||||||
| Kikkoman Corp. | 4,000 | 128,107 | ||||||
| Kintetsu Group Holdings Co. Ltd. | 59,000 | 247,621 | ||||||
| Koito Manufacturing Co. Ltd. | 16,500 | 803,049 | ||||||
| Komatsu Ltd. | 5,200 | 119,284 | ||||||
| Konami Holdings Corp. | 14,800 | 571,877 | ||||||
| Kose Corp. | 1,600 | 163,835 | ||||||
| Kyowa Hakko Kirin Co. Ltd. | 7,700 | 121,624 | ||||||
| M3, Inc. | 23,000 | 787,301 | ||||||
| Makita Corp. | 6,400 | 455,999 | ||||||
| Marui Group Co. Ltd. | 7,100 | 93,790 | ||||||
| McDonald’s Holdings Co. Japan Ltd. | 6,900 | 203,244 | ||||||
| Medipal Holdings Corp. | 8,800 | 152,540 | ||||||
| MEIJI Holdings Co. Ltd. | 9,300 | 923,403 | ||||||
| Mitsubishi Electric Corp. | 11,000 | 140,984 | ||||||
| Mitsubishi Tanabe Pharma Corp. | 4,500 | 96,383 | ||||||
| Mitsui Chemicals, Inc. | 26,000 | 123,676 | ||||||
| Nagoya Railroad Co. Ltd. | 25,000 | 136,041 | ||||||
| Nexon Co. Ltd. | 10,100 | 158,657 | ||||||
| Nikon Corp. | 15,800 | 235,961 | ||||||
| Nippon Building Fund, Inc., REIT | 115 | 728,623 | ||||||
| Nippon Paint Holdings Co. Ltd. | 6,100 | 204,123 | ||||||
| Nippon Prologis REIT, Inc. | 74 | 187,164 | ||||||
| Nippon Telegraph & Telephone Corp. | 65,000 | 2,972,839 | ||||||
| Nisshin Seifun Group, Inc. | 23,100 | 352,104 | ||||||
| Nitori Holdings Co. Ltd. | 6,900 | 827,122 | ||||||
| Nomura Real Estate Master Fund, Inc., REIT | 375 | 625,448 | ||||||
| INVESTMENTS | SHARES | VALUE | ||||||
| Japan - 14.0% (continued) | ||||||||
| NTT Data Corp. | 3,900 | $ | 194,783 | |||||
| NTT DOCOMO, Inc. | 70,600 | 1,793,453 | ||||||
| Obayashi Corp. | 56,400 | 559,419 | ||||||
| Obic Co. Ltd. | 6,500 | 346,118 | ||||||
| Olympus Corp. | 2,800 | 97,780 | ||||||
| Ono Pharmaceutical Co. Ltd. | 27,400 | 765,020 | ||||||
| Oriental Land Co. Ltd. | 2,600 | 158,334 | ||||||
| Otsuka Corp. | 2,000 | 94,993 | ||||||
| Otsuka Holdings Co. Ltd. | 23,000 | 1,048,401 | ||||||
| Park24 Co. Ltd. | 18,800 | 611,432 | ||||||
| Pola Orbis Holdings, Inc. | 1,200 | 107,420 | ||||||
| Rinnai Corp. | 4,200 | 390,994 | ||||||
| Ryohin Keikaku Co. Ltd. | 700 | 141,371 | ||||||
| Santen Pharmaceutical Co. Ltd. | 8,100 | 119,608 | ||||||
| Secom Co. Ltd. | 3,800 | 283,762 | ||||||
| Sekisui House Ltd. | 29,700 | 505,989 | ||||||
| Shimadzu Corp. | 20,000 | 305,231 | ||||||
| Shimamura Co. Ltd. | 3,200 | 389,572 | ||||||
| Shimano, Inc. | 700 | 103,967 | ||||||
| Shimizu Corp. | 12,000 | 107,250 | ||||||
| Shin-Etsu Chemical Co. Ltd. | 4,200 | 293,046 | ||||||
| Shionogi & Co. Ltd. | 22,900 | 1,173,248 | ||||||
| Shiseido Co. Ltd. | 8,200 | 217,183 | ||||||
| Sohgo Security Services Co. Ltd. | 7,800 | 419,194 | ||||||
| Sony Corp. | 31,400 | 1,040,301 | ||||||
| Start Today Co. Ltd. | 10,500 | 180,670 | ||||||
| Sumitomo Dainippon Pharma Co. Ltd. | 9,400 | 182,066 | ||||||
| Sundrug Co. Ltd. | 1,300 | 109,121 | ||||||
| Suzuken Co. Ltd. | 3,000 | 99,062 | ||||||
| Sysmex Corp. | 5,300 | 393,225 | ||||||
| Taisei Corp. | 68,000 | 510,154 | ||||||
| Taisho Pharmaceutical Holdings Co. Ltd. | 1,000 | 102,492 | ||||||
| Terumo Corp. | 27,600 | 1,061,651 | ||||||
| Toho Co. Ltd. | 7,900 | 262,417 | ||||||
| Toho Gas Co. Ltd. | 61,000 | 571,216 | ||||||
| Tokyo Electron Ltd. | 10,900 | 963,385 | ||||||
| Tokyu Corp. | 44,000 | 335,646 | ||||||
| Toppan Printing Co. Ltd. | 14,000 | 126,377 | ||||||
| Toray Industries, Inc. | 23,000 | 224,008 | ||||||
| TOTO Ltd. | 13,400 | 506,615 | ||||||
| Toyo Suisan Kaisha Ltd. | 3,100 | 131,512 | ||||||
| USS Co. Ltd. | 6,400 | 108,317 | ||||||
| Yahoo Japan Corp. | 36,600 | 145,991 | ||||||
| Yamada Denki Co. Ltd. | 80,900 | 401,270 | ||||||
| Yamaha Corp. | 24,500 | 793,098 | ||||||
| Yamato Holdings Co. Ltd. | 5,100 | 118,879 | ||||||
| Yamazaki Baking Co. Ltd. | 19,000 | 467,191 | ||||||
|
| |||||||
| 47,468,459 | ||||||||
|
| |||||||
| Mexico - 0.2% | ||||||||
| Fresnillo plc | 35,502 | 833,024 | ||||||
|
| |||||||
| Netherlands - 5.0% | ||||||||
| ASML Holding NV | 18,380 | 2,014,281 | ||||||
| Heineken Holding NV | 3,988 | 319,502 | ||||||
| Heineken NV | 16,338 | 1,436,130 | ||||||
| Koninklijke Ahold NV * | 57,286 | 1,304,744 | ||||||
| Koninklijke DSM NV | 5,302 | 358,073 | ||||||
| Koninklijke KPN NV | 35,796 | 118,762 | ||||||
| The accompanying notes are an integral part of these financial statements. | (Continued) |
| AQR Funds | Annual Report | September 2016 | ||||||||||||||
107
| Schedule of Investments | September 30, 2016 |
| AQR INTERNATIONAL MOMENTUM STYLE FUND |
| INVESTMENTS | SHARES | VALUE | ||||||
| Netherlands - 5.0% (continued) | ||||||||
| Koninklijke Philips NV | 28,002 | $ | 828,567 | |||||
| NN Group NV | 8,861 | 272,037 | ||||||
| Randstad Holding NV | 3,918 | 178,161 | ||||||
| Royal Dutch Shell plc, Class B | 340,363 | 8,824,149 | ||||||
| Wolters Kluwer NV | 26,875 | 1,148,939 | ||||||
|
| |||||||
| 16,803,345 | ||||||||
|
| |||||||
| Norway - 0.6% | ||||||||
| Golar LNG Ltd. (3)(b) | 2,009 | 42,720 | ||||||
| Marine Harvest ASA * | 27,912 | 500,688 | ||||||
| Norsk Hydro ASA | 71,477 | 309,050 | ||||||
| Orkla ASA | 24,048 | 249,023 | ||||||
| Statoil ASA | 54,997 | 923,306 | ||||||
|
| |||||||
| 2,024,787 | ||||||||
|
| |||||||
| Portugal - 0.4% | ||||||||
| Galp Energia SGPS SA | 47,820 | 653,312 | ||||||
| Jeronimo Martins SGPS SA | 43,875 | 760,424 | ||||||
|
| |||||||
| 1,413,736 | ||||||||
|
| |||||||
| Singapore - 0.6% | ||||||||
| Ascendas REIT, REIT | 142,500 | 263,837 | ||||||
| CapitaLand Commercial Trust Ltd., REIT | 82,800 | 96,838 | ||||||
| CapitaLand Mall Trust, REIT | 113,500 | 180,826 | ||||||
| ComfortDelGro Corp. Ltd. | 125,500 | 259,595 | ||||||
| Jardine Cycle & Carriage Ltd. | 4,100 | 129,505 | ||||||
| Singapore Telecommunications Ltd. | 393,100 | 1,149,775 | ||||||
|
| |||||||
| 2,080,376 | ||||||||
|
| |||||||
| South Africa - 0.1% | ||||||||
| Mondi plc | 10,030 | 210,730 | ||||||
|
| |||||||
| Spain - 2.1% | ||||||||
| Aena SA (a) | 5,952 | 878,574 | ||||||
| Amadeus IT Group SA, Class A | 16,194 | 808,290 | ||||||
| Endesa SA | 24,438 | 523,944 | ||||||
| Ferrovial SA | 14,364 | 305,849 | ||||||
| Grifols SA | 23,008 | 495,943 | ||||||
| Iberdrola SA | 220,989 | 1,502,594 | ||||||
| Industria de Diseno Textil SA | 53,143 | 1,970,431 | ||||||
| Red Electrica Corp. SA | 28,976 | 625,202 | ||||||
|
| |||||||
| 7,110,827 | ||||||||
|
| |||||||
| Sweden - 2.3% | ||||||||
| Assa Abloy AB, Class B | 60,656 | 1,231,781 | ||||||
| Boliden AB | 35,508 | 834,603 | ||||||
| Hexagon AB, Class B | 13,079 | 571,181 | ||||||
| Husqvarna AB, Class B | 22,273 | 194,389 | ||||||
| ICA Gruppen AB | 3,287 | 108,581 | ||||||
| Lundin Petroleum AB * | 52,133 | 954,240 | ||||||
| Sandvik AB | 58,191 | 640,316 | ||||||
| Securitas AB, Class B | 29,331 | 491,206 | ||||||
| Skanska AB, Class B | 13,263 | 309,860 | ||||||
| Svenska Cellulosa AB SCA, Class B | 49,964 | 1,482,976 | ||||||
| Swedish Match AB | 14,951 | 548,579 | ||||||
| Volvo AB, Class B | 26,069 | 297,653 | ||||||
|
| |||||||
| 7,665,365 | ||||||||
|
| |||||||
| INVESTMENTS | SHARES | VALUE | ||||||
| Switzerland - 6.7% | ||||||||
| ABB Ltd. * | 92,019 | $ | 2,073,922 | |||||
| Actelion Ltd. * | 9,253 | 1,605,710 | ||||||
| Barry Callebaut AG * | 173 | 230,239 | ||||||
| Chocoladefabriken Lindt & Spruengli AG | 182 | 1,052,537 | ||||||
| Coca-Cola HBC AG * | 15,239 | 354,026 | ||||||
| EMS-Chemie Holding AG | 1,161 | 624,045 | ||||||
| Galenica AG | 497 | 528,521 | ||||||
| Geberit AG | 1,809 | 792,958 | ||||||
| Givaudan SA | 761 | 1,551,466 | ||||||
| Glencore plc * | 339,839 | 930,539 | ||||||
| Kuehne + Nagel International AG | 4,939 | 717,767 | ||||||
| Lonza Group AG * | 4,768 | 912,590 | ||||||
| Nestle SA | 63,288 | 4,997,479 | ||||||
| Partners Group Holding AG | 2,657 | 1,342,411 | ||||||
| Schindler Holding AG | 4,941 | 927,833 | ||||||
| SGS SA | 351 | 786,512 | ||||||
| Sika AG | 147 | 716,199 | ||||||
| Sonova Holding AG | 1,208 | 171,290 | ||||||
| Swiss Prime Site AG * | 7,747 | 680,337 | ||||||
| Swiss Re AG | 13,465 | 1,216,138 | ||||||
| Wolseley plc | 7,753 | 436,048 | ||||||
|
| |||||||
| 22,648,567 | ||||||||
|
| |||||||
| United Kingdom - 19.6% | ||||||||
| 3i Group plc | 56,789 | 478,812 | ||||||
| Admiral Group plc | 13,052 | 346,414 | ||||||
| Anglo American plc * | 38,240 | 476,884 | ||||||
| Ashtead Group plc | 9,006 | 148,008 | ||||||
| Associated British Foods plc | 31,384 | 1,057,477 | ||||||
| AstraZeneca plc | 37,059 | 2,399,640 | ||||||
| Auto Trader Group plc (a) | 113,311 | 595,673 | ||||||
| Aviva plc | 36,331 | 207,307 | ||||||
| BAE Systems plc | 189,769 | 1,289,152 | ||||||
| BP plc | 625,465 | 3,645,672 | ||||||
| British American Tobacco plc | 120,564 | 7,689,098 | ||||||
| BT Group plc | 229,321 | 1,153,788 | ||||||
| Bunzl plc | 15,969 | 470,901 | ||||||
| Compass Group plc | 111,402 | 2,157,484 | ||||||
| Croda International plc | 4,629 | 208,880 | ||||||
| Diageo plc | 41,713 | 1,194,810 | ||||||
| Direct Line Insurance Group plc | 241,246 | 1,139,582 | ||||||
| Dixons Carphone plc | 25,543 | 122,005 | ||||||
| easyJet plc | 16,101 | 209,941 | ||||||
| GlaxoSmithKline plc | 223,138 | 4,752,515 | ||||||
| Hargreaves Lansdown plc | 29,884 | 492,078 | ||||||
| HSBC Holdings plc | 84,770 | 637,196 | ||||||
| ICAP plc | 22,128 | 133,262 | ||||||
| Imperial Brands plc | 72,967 | 3,755,658 | ||||||
| Inmarsat plc | 40,068 | 365,271 | ||||||
| InterContinental Hotels Group plc | 4,523 | 186,416 | ||||||
| Intertek Group plc | 14,454 | 652,509 | ||||||
| ITV plc | 258,330 | 626,637 | ||||||
| Kingfisher plc | 42,770 | 208,678 | ||||||
| Legal & General Group plc | 133,260 | 377,662 | ||||||
| Merlin Entertainments plc (a) | 36,725 | 209,065 | ||||||
| National Grid plc | 258,515 | 3,650,964 | ||||||
| Old Mutual plc | 78,992 | 207,056 | ||||||
| Petrofac Ltd. | 69,604 | 805,637 | ||||||
| Provident Financial plc | 3,835 | 150,582 | ||||||
| The accompanying notes are an integral part of these financial statements. | (Continued) |
| AQR Funds | Annual Report | September 2016 | ||||||||||||||
108
| Schedule of Investments | September 30, 2016 |
| AQR INTERNATIONAL MOMENTUM STYLE FUND |
| INVESTMENTS | SHARES | VALUE | ||||||
| United Kingdom - 19.6% (continued) | ||||||||
| Prudential plc | 17,238 | $ | 305,572 | |||||
| Randgold Resources Ltd. | 7,638 | 765,511 | ||||||
| Reckitt Benckiser Group plc | 46,274 | 4,356,462 | ||||||
| RELX NV | 138,912 | 2,484,690 | ||||||
| Royal Mail plc | 41,943 | 266,155 | ||||||
| Sage Group plc (The) | 102,660 | 980,880 | ||||||
| Schroders plc | 3,675 | 128,336 | ||||||
| Severn Trent plc | 24,217 | 785,791 | ||||||
| Sky plc | 22,727 | 263,408 | ||||||
| Smith & Nephew plc | 18,671 | 301,133 | ||||||
| St. James’s Place plc | 20,354 | 249,847 | ||||||
| Travis Perkins plc | 5,606 | 111,816 | ||||||
| Unilever NV, CVA | 153,913 | 7,091,271 | ||||||
| United Utilities Group plc | 24,730 | 321,212 | ||||||
| Vodafone Group plc | 1,418,964 | 4,069,484 | ||||||
| Whitbread plc | 7,536 | 382,470 | ||||||
| WPP plc | 43,221 | 1,015,937 | ||||||
|
| |||||||
| 66,082,689 | ||||||||
|
| |||||||
| United States - 0.6% | ||||||||
| QIAGEN NV * | 9,510 | 262,221 | ||||||
| Shire plc | 3,830 | 247,660 | ||||||
| Thomson Reuters Corp. (1) | 34,035 | 1,407,370 | ||||||
|
| |||||||
| 1,917,251 | ||||||||
|
| |||||||
TOTAL COMMON STOCKS |
| 328,857,642 | ||||||
|
| |||||||
TOTAL INVESTMENTS IN SECURITIES AT VALUE - 97.3% |
| 328,857,642 | ||||||
|
| |||||||
| OTHER ASSETS IN EXCESS OF LIABILITIES - 2.7% (c) | 9,028,169 | |||||||
|
| |||||||
NET ASSETS - 100.0% |
| 337,885,811 | ||||||
|
| |||||||
| SECTOR | VALUE | % OF NET ASSETS | ||||||
| Consumer Discretionary | $ | 30,448,401 | 9.0 | % | ||||
| Consumer Staples | 57,199,442 | 16.9 | ||||||
| Energy | 30,852,097 | 9.1 | ||||||
| Financials | 33,265,172 | 9.8 | ||||||
| Health Care | 29,154,196 | 8.6 | ||||||
| Industrials | 49,337,668 | 14.6 | ||||||
| Information Technology | 21,761,363 | 6.4 | ||||||
| Materials | 23,868,827 | 7.1 | ||||||
| Real Estate | 16,392,881 | 4.9 | ||||||
| Telecommunication Services | 22,147,431 | 6.6 | ||||||
| Utilities | 14,430,164 | 4.3 | ||||||
|
|
|
| |||||
Total Investments In Securities At Value | 328,857,642 | 97.3 | ||||||
| Other Assets in Excess of Liabilities (c) | 9,028,169 | 2.7 | ||||||
|
|
|
| |||||
Net Assets | $ | 337,885,811 | 100.0 | % | ||||
|
|
|
| |||||
| * | Non-income producing security. |
| (a) | Securities exempt from registration under Rule 144A or section 4(2), of the Securities Act of 1933. Under procedures approved by the Board of Trustees, such securities have been determined to be liquid by the investment adviser and may be resold, normally to qualified institutional buyers in transactions exempt from registration. Total value of all such securities at 9/30/2016 amounted to $2,799,116, which represents approximately 0.83% of net assets of the fund. |
| (b) | Security fair valued as of 9/30/2016 in accordance with procedures approved by the Board of Trustees. Total value of all such securities at 9/30/2016 amounted to $42,720, which represents approximately 0.01% of net assets of the fund. |
| (c) | Includes appreciation/(depreciation) on futures contracts. |
All securities are Level 2 with respect to ASC 820, unless otherwise noted in parentheses.
| (1) | Level 1 security (See Note 4). |
| (3) | Level 3 security (See Note 4). |
Abbreviations
CVA - Dutch Certification
OYJ - Public Traded Company
REIT - Real Estate Investment Trust
SCA - Limited partnership with share capital
SGPS - Sociedade Gestora de Participacões Sociais
| The accompanying notes are an integral part of these financial statements. | (Continued) |
| AQR Funds | Annual Report | September 2016 | ||||||||||||||
109
| Schedule of Investments | September 30, 2016 |
| AQR INTERNATIONAL MOMENTUM STYLE FUND |
Open futures contracts outstanding at September 30, 2016:
Exchange Traded
| NUMBER OF CONTRACTS | COUNTERPARTY | DESCRIPTION | EXPIRATION DATE | VALUE AT TRADE DATE | VALUE AT SEPTEMBER 30, 2016 | UNREALIZED APPRECIATION (DEPRECIATION) | ||||||||||||||
| Long Contracts: | ||||||||||||||||||||
| 54 | BARC | E-Mini MSCI EAFE Index Futures | 12/2016 | $4,577,924 | $4,608,090 | $30,166 | ||||||||||||||
|
|
|
|
|
| |||||||||||||||
Collateral pledged to, or (received from), each counterparty at September 30, 2016 was as follows:
| COUNTERPARTY | OVER THE COUNTER | EXCHANGE TRADED | TOTAL | |||||||||
| BARC | ||||||||||||
| Cash | $— | $237,639 | $237,639 | |||||||||
| ||||||||||||
| The accompanying notes are an integral part of these financial statements. |
| AQR Funds | Annual Report | September 2016 | ||||||||||||||
110
| Schedule of Investments | September 30, 2016 |
| AQR EMERGING MOMENTUM STYLE FUND |
| INVESTMENTS | SHARES | VALUE | ||||||
| COMMON STOCKS - 95.1% | ||||||||
| Brazil - 8.9% | ||||||||
| AES Tiete SA (1) | 1,200 | $ | 6,003 | |||||
| Banco Bradesco SA, ADR (1) | 14,753 | 133,810 | ||||||
| Banco do Brasil SA (1) | 1,600 | 11,296 | ||||||
| Banco Santander Brasil SA, ADR (1)(a) | 3,581 | 23,993 | ||||||
| BM&FBovespa SA - Bolsa de Valores Mercadorias e Futuros (1) | 13,100 | 68,075 | ||||||
| BR Malls Participacoes SA (1)* | 3,400 | 12,943 | ||||||
| CCR SA (1) | 6,100 | 32,074 | ||||||
| Cia de Saneamento Basico do Estado de Sao Paulo, ADR (1) | 4,548 | 42,114 | ||||||
| Cia Siderurgica Nacional SA (1)* | 7,200 | 20,125 | ||||||
| Cosan SA Industria e Comercio (1) | 2,300 | 26,606 | ||||||
| CPFL Energia SA (1) | 1,700 | 12,650 | ||||||
| Duratex SA (1) | 5,500 | 14,646 | ||||||
| EDP - Energias do Brasil SA (1) | 3,800 | 16,779 | ||||||
| Engie Brasil Energia SA (1) | 300 | 3,574 | ||||||
| Equatorial Energia SA (1) | 2,500 | 39,182 | ||||||
| Hypermarcas SA (1) | 4,400 | 38,059 | ||||||
| Itau Unibanco Holding SA, ADR (1) | 12,345 | 135,054 | ||||||
| JBS SA (1) | 1,400 | 5,088 | ||||||
| Kroton Educacional SA (1) | 11,400 | 52,230 | ||||||
| Localiza Rent a Car SA (1) | 1,900 | 23,252 | ||||||
| Lojas Renner SA (1) | 1,900 | 14,355 | ||||||
| M Dias Branco SA (1) | 600 | 24,659 | ||||||
| Multiplan Empreendimentos Imobiliarios SA (1) | 1,100 | 21,465 | ||||||
| Natura Cosmeticos SA (1) | 800 | 7,739 | ||||||
| Odontoprev SA (1) | 2,200 | 8,787 | ||||||
| Qualicorp SA (1) | 2,200 | 12,948 | ||||||
| Raia Drogasil SA (1) | 2,800 | 57,564 | ||||||
| Telefonica Brasil SA, ADR (1) | 1,354 | 19,592 | ||||||
| Transmissora Alianca de Energia Eletrica SA (1) | 1,900 | 12,216 | ||||||
| Ultrapar Participacoes SA (1) | 2,800 | 61,981 | ||||||
|
| |||||||
| 958,859 | ||||||||
|
| |||||||
| Chile - 1.5% | ||||||||
| Banco de Chile, ADR (1) | 216 | 14,537 | ||||||
| Cencosud SA (1) | 2,827 | 8,492 | ||||||
| Cia Cervecerias Unidas SA, ADR (1) | 646 | 13,043 | ||||||
| Colbun SA (1) | 105,746 | 21,079 | ||||||
| Empresa Nacional de Electricidad SA, ADR (1) | 439 | 8,710 | ||||||
| Itau CorpBanca (1) | 1,089,380 | 9,599 | ||||||
| Latam Airlines Group SA, ADR (1)* | 1,508 | 12,245 | ||||||
| SACI Falabella (1) | 5,679 | 41,639 | ||||||
| Sociedad Quimica y Minera de Chile SA, ADR (1) | 1,361 | 36,611 | ||||||
|
| |||||||
| 165,955 | ||||||||
|
| |||||||
| China - 21.6% | ||||||||
| AAC Technologies Holdings, Inc. | 9,500 | 95,988 | ||||||
| ANTA Sports Products Ltd. | 2,000 | 5,469 | ||||||
| AviChina Industry & Technology Co. Ltd., Class H | 5,000 | 3,392 | ||||||
| Beijing Capital International Airport Co. Ltd., Class H | 10,000 | 11,399 | ||||||
| Beijing Enterprises Water Group Ltd. (a) | 6,000 | 4,090 | ||||||
| INVESTMENTS | SHARES | VALUE | ||||||
| China - 21.6% (continued) | ||||||||
| BYD Co. Ltd., Class H (a) | 11,000 | $ | 73,170 | |||||
| China Coal Energy Co. Ltd. * | 24,000 | 13,064 | ||||||
| China Communications Services Corp. Ltd., Class H | 28,000 | 17,575 | ||||||
| China Galaxy Securities Co. Ltd., Class H | 28,000 | 25,753 | ||||||
| China Huishan Dairy Holdings Co. Ltd. | 70,000 | 26,208 | ||||||
| China Jinmao Holdings Group Ltd. | 12,000 | 3,724 | ||||||
| China Medical System Holdings Ltd. | 14,000 | 23,668 | ||||||
| China Minsheng Banking Corp. Ltd., Class H | 45,500 | 52,858 | ||||||
| China Overseas Land & Investment Ltd. | 10,000 | 34,380 | ||||||
| China Resources Beer Holdings Co. Ltd. * | 26,000 | 55,413 | ||||||
| China Resources Gas Group Ltd. | 4,000 | 13,738 | ||||||
| China Resources Land Ltd. | 8,000 | 22,555 | ||||||
| China Shenhua Energy Co. Ltd. | 29,500 | 58,306 | ||||||
| China Vanke Co. Ltd., Class H | 15,100 | 39,477 | ||||||
| CNOOC Ltd. | 180,000 | 227,073 | ||||||
| Country Garden Holdings Co. Ltd. | 48,000 | 25,504 | ||||||
| CSPC Pharmaceutical Group Ltd. | 34,000 | 34,136 | ||||||
| Dongfeng Motor Group Co. Ltd., Class H | 4,000 | 4,034 | ||||||
| Evergrande Real Estate Group Ltd. | 47,000 | 32,117 | ||||||
| Geely Automobile Holdings Ltd. | 80,000 | 72,036 | ||||||
| GF Securities Co. Ltd. | 14,400 | 30,696 | ||||||
| Great Wall Motor Co. Ltd., Class H | 11,000 | 10,817 | ||||||
| Guangdong Investment Ltd. | 38,000 | 60,703 | ||||||
| Guangzhou Automobile Group Co. Ltd., Class H | 34,000 | 43,972 | ||||||
| Guangzhou R&F Properties Co. Ltd., Class H | 18,400 | 29,158 | ||||||
| Haitong Securities Co. Ltd. | 36,400 | 62,235 | ||||||
| Hanergy Thin Film Power Group Ltd. (3)*(b) | 86,000 | — | ||||||
| Huatai Securities Co. Ltd. (c) | 14,400 | 29,407 | ||||||
| Jiangsu Expressway Co. Ltd., Class H | 18,000 | 24,979 | ||||||
| Longfor Properties Co. Ltd. | 5,500 | 8,497 | ||||||
| Shanghai Pharmaceuticals Holding Co. Ltd. | 5,300 | 14,394 | ||||||
| Shenzhou International Group Holdings Ltd. | 6,000 | 41,987 | ||||||
| Shui On Land Ltd. | 35,500 | 9,702 | ||||||
| Sinopec Engineering Group Co. Ltd., Class H | 12,500 | 10,830 | ||||||
| Sinopec Shanghai Petrochemical Co. Ltd., Class H | 72,000 | 36,563 | ||||||
| Sinopharm Group Co. Ltd., Class H | 9,200 | 44,559 | ||||||
| SOHO China Ltd. | 22,000 | 11,937 | ||||||
| Sunac China Holdings Ltd. | 4,000 | 2,910 | ||||||
| Tencent Holdings Ltd. | 28,500 | 792,358 | ||||||
| TravelSky Technology Ltd., Class H | 16,000 | 38,189 | ||||||
| Weichai Power Co. Ltd., Class H | 3,000 | 4,048 | ||||||
| Yanzhou Coal Mining Co. Ltd. (a) | 10,000 | 6,780 | ||||||
| Zhuzhou CRRC Times Electric Co. Ltd., Class H | 1,000 | 5,224 | ||||||
| Zijin Mining Group Co. Ltd., Class H | 146,000 | 46,784 | ||||||
|
| |||||||
| 2,341,856 | ||||||||
|
| |||||||
| Hong Kong - 0.3% | ||||||||
| China Gas Holdings Ltd. | 4,000 | 6,364 | ||||||
| Nine Dragons Paper Holdings Ltd. | 17,000 | 16,030 | ||||||
| Sino Biopharmaceutical Ltd. | 9,000 | 6,088 | ||||||
|
| |||||||
| 28,482 | ||||||||
|
| |||||||
| The accompanying notes are an integral part of these financial statements. | (Continued) |
| AQR Funds | Annual Report | September 2016 | ||||||||||||||
111
| Schedule of Investments | September 30, 2016 |
| AQR EMERGING MOMENTUM STYLE FUND |
| INVESTMENTS | SHARES | VALUE | ||||||
| Hungary - 0.9% | ||||||||
| MOL Hungarian Oil & Gas plc | 350 | $ | 21,684 | |||||
| OTP Bank plc | 1,704 | 44,767 | ||||||
| Richter Gedeon Nyrt | 1,774 | 36,052 | ||||||
|
| |||||||
| 102,503 | ||||||||
|
| |||||||
| India - 1.8% | ||||||||
| Infosys Ltd., ADR (1) | 3,430 | 54,125 | ||||||
| Reliance Industries Ltd., GDR (c) | 1,074 | 35,236 | ||||||
| Tata Motors Ltd., ADR (1) | 2,750 | 109,945 | ||||||
|
| |||||||
| 199,306 | ||||||||
|
| |||||||
| Indonesia - 5.5% | ||||||||
| Adaro Energy Tbk. PT | 218,400 | 20,267 | ||||||
| AKR Corporindo Tbk. PT | 34,100 | 16,926 | ||||||
| Astra International Tbk. PT | 116,200 | 73,732 | ||||||
| Bank Central Asia Tbk. PT | 34,300 | 41,372 | ||||||
| Bank Mandiri Persero Tbk. PT | 8,200 | 7,075 | ||||||
| Bank Rakyat Indonesia Persero Tbk. PT | 60,700 | 56,957 | ||||||
| Bumi Serpong Damai Tbk. PT | 90,700 | 15,372 | ||||||
| Charoen Pokphand Indonesia Tbk. PT | 74,600 | 20,096 | ||||||
| Gudang Garam Tbk. PT | 5,600 | 26,647 | ||||||
| Hanjaya Mandala Sampoerna Tbk. PT | 110,000 | 33,313 | ||||||
| Indofood CBP Sukses Makmur Tbk. PT | 27,400 | 19,944 | ||||||
| Indofood Sukses Makmur Tbk. PT | 35,200 | 23,541 | ||||||
| Kalbe Farma Tbk. PT | 81,000 | 10,672 | ||||||
| Lippo Karawaci Tbk. PT | 61,000 | 4,644 | ||||||
| Matahari Department Store Tbk. PT | 18,200 | 25,843 | ||||||
| Media Nusantara Citra Tbk. PT | 31,300 | 4,863 | ||||||
| Summarecon Agung Tbk. PT | 35,100 | 4,746 | ||||||
| Surya Citra Media Tbk. PT | 53,400 | 11,493 | ||||||
| Telekomunikasi Indonesia Persero Tbk. PT | 352,300 | 117,311 | ||||||
| Unilever Indonesia Tbk. PT | 8,200 | 28,034 | ||||||
| Waskita Karya Persero Tbk. PT | 123,100 | 24,769 | ||||||
| XL Axiata Tbk. PT * | 35,700 | 7,401 | ||||||
|
| |||||||
| 595,018 | ||||||||
|
| |||||||
| Korea, Republic of - 18.4% | ||||||||
| Amorepacific Corp. | 143 | 50,711 | ||||||
| AMOREPACIFIC Group | 86 | 12,993 | ||||||
| BGF retail Co. Ltd. | 35 | 6,151 | ||||||
| Celltrion, Inc. * | 600 | 58,244 | ||||||
| Cheil Worldwide, Inc. | 234 | 3,415 | ||||||
| CJ CheilJedang Corp. | 33 | 10,921 | ||||||
| CJ Corp. | 52 | 8,829 | ||||||
| CJ E&M Corp. | 91 | 6,316 | ||||||
| CJ Korea Express Corp. * | 68 | 13,329 | ||||||
| Coway Co. Ltd. | 268 | 23,280 | ||||||
| Daelim Industrial Co. Ltd. | 178 | 13,479 | ||||||
| Dongbu Insurance Co. Ltd. | 359 | 22,319 | ||||||
| Dongsuh Cos., Inc. | 189 | 5,034 | ||||||
| Doosan Heavy Industries & Construction Co. Ltd. | 138 | 3,266 | ||||||
| GS Engineering & Construction Corp. * | 223 | 5,995 | ||||||
| GS Holdings Corp. | 379 | 18,531 | ||||||
| GS Retail Co. Ltd. | 163 | 7,313 | ||||||
| Hankook Tire Co. Ltd. | 438 | 23,681 | ||||||
| Hanmi Pharm Co. Ltd. | 39 | 18,121 | ||||||
| Hanmi Science Co. Ltd. | 73 | 7,608 | ||||||
| Hanon Systems | 1,078 | 12,197 | ||||||
| INVESTMENTS | SHARES | VALUE | ||||||
| Korea, Republic of - 18.4% (continued) | ||||||||
| Hanssem Co. Ltd. | 30 | $ | 4,815 | |||||
| Hanwha Chemical Corp. | 1,292 | 28,619 | ||||||
| Hanwha Corp. | 354 | 11,333 | ||||||
| Hanwha Life Insurance Co. Ltd. | 717 | 3,760 | ||||||
| Hyosung Corp. | 150 | 17,822 | ||||||
| Hyundai Department Store Co. Ltd. | 60 | 6,483 | ||||||
| Hyundai Development Co.-Engineering & Construction | 177 | 8,297 | ||||||
| Hyundai Glovis Co. Ltd. | 20 | 3,303 | ||||||
| Hyundai Heavy Industries Co. Ltd. * | 80 | 10,115 | ||||||
| Hyundai Marine & Fire Insurance Co. Ltd. | 383 | 12,644 | ||||||
| Hyundai Mobis Co. Ltd. | 381 | 95,614 | ||||||
| Hyundai Motor Co. | 92 | 11,370 | ||||||
| Hyundai Steel Co. | 96 | 4,463 | ||||||
| Kangwon Land, Inc. | 589 | 21,047 | ||||||
| KCC Corp. | 13 | 4,685 | ||||||
| Korea Aerospace Industries Ltd. | 240 | 16,726 | ||||||
| Korea Electric Power Corp. | 1,515 | 74,214 | ||||||
| Korea Investment Holdings Co. Ltd. | 247 | 9,204 | ||||||
| KT&G Corp. | 625 | 71,175 | ||||||
| LG Chem Ltd. | 16 | 3,539 | ||||||
| LG Corp. | 424 | 25,057 | ||||||
| LG Display Co. Ltd. | 261 | 6,672 | ||||||
| LG Electronics, Inc. | 331 | 14,456 | ||||||
| LG Household & Health Care Ltd. | 23 | 20,016 | ||||||
| LG Innotek Co. Ltd. | 60 | 4,290 | ||||||
| LG Uplus Corp. | 1,014 | 10,844 | ||||||
| Lotte Chemical Corp. | 68 | 18,536 | ||||||
| Mirae Asset Daewoo Co. Ltd. | 922 | 6,601 | ||||||
| NAVER Corp. | 120 | 96,608 | ||||||
| NCSoft Corp. | 131 | 35,337 | ||||||
| NH Investment & Securities Co. Ltd. | 534 | 4,880 | ||||||
| OCI Co. Ltd. * | 62 | 5,308 | ||||||
| Orion Corp. | 7 | 5,275 | ||||||
| Ottogi Corp. | 7 | 4,783 | ||||||
| POSCO | 268 | 55,548 | ||||||
| S-1 Corp. | 190 | 17,554 | ||||||
| Samsung C&T Corp. | 36 | 4,893 | ||||||
| Samsung Electro-Mechanics Co. Ltd. | 146 | 6,518 | ||||||
| Samsung Electronics Co. Ltd. | 507 | 738,579 | ||||||
| Samsung Life Insurance Co. Ltd. | 38 | 3,649 | ||||||
| Samsung SDI Co. Ltd. | 100 | 8,784 | ||||||
| Samsung Securities Co. Ltd. | 121 | 3,833 | ||||||
| Shinhan Financial Group Co. Ltd. | 492 | 18,019 | ||||||
| SK Holdings Co. Ltd. | 39 | 7,547 | ||||||
| SK Innovation Co. Ltd. | 421 | 62,378 | ||||||
| S-Oil Corp. | 373 | 27,716 | ||||||
| Woori Bank | 376 | 3,908 | ||||||
| Yuhan Corp. | 77 | 19,471 | ||||||
|
| |||||||
| 1,988,021 | ||||||||
|
| |||||||
| Malaysia - 2.3% | ||||||||
| AirAsia Bhd. | 25,100 | 16,962 | ||||||
| Dialog Group Bhd. | 13,600 | 4,806 | ||||||
| DiGi.Com Bhd. | 5,300 | 6,383 | ||||||
| Felda Global Ventures Holdings Bhd. | 5,400 | 3,061 | ||||||
| Genting Bhd. | 4,200 | 8,062 | ||||||
| Genting Malaysia Bhd. | 9,100 | 10,018 | ||||||
| Genting Plantations Bhd. | 1,700 | 4,526 | ||||||
| The accompanying notes are an integral part of these financial statements. | (Continued) |
| AQR Funds | Annual Report | September 2016 | ||||||||||||||
112
| Schedule of Investments | September 30, 2016 |
| AQR EMERGING MOMENTUM STYLE FUND |
| INVESTMENTS | SHARES | VALUE | ||||||
| Malaysia - 2.3% (continued) | ||||||||
| HAP Seng Consolidated Bhd. | 16,800 | $ | 31,279 | |||||
| Hartalega Holdings Bhd. | 10,100 | 11,338 | ||||||
| IHH Healthcare Bhd. | 14,400 | 22,055 | ||||||
| IJM Corp. Bhd. | 6,100 | 4,735 | ||||||
| MISC Bhd. | 3,200 | 5,844 | ||||||
| Petronas Chemicals Group Bhd. | 3,400 | 5,470 | ||||||
| Petronas Dagangan Bhd. | 600 | 3,410 | ||||||
| PPB Group Bhd. | 3,300 | 12,928 | ||||||
| Public Bank Bhd. | 6,900 | 33,085 | ||||||
| Telekom Malaysia Bhd. | 5,500 | 9,027 | ||||||
| Tenaga Nasional Bhd. | 8,500 | 29,401 | ||||||
| Westports Holdings Bhd. | 15,300 | 16,255 | ||||||
| YTL Corp. Bhd. | 18,900 | 8,182 | ||||||
|
| |||||||
| 246,827 | ||||||||
|
| |||||||
| Mexico - 4.5% | ||||||||
| Alfa SAB de CV, Class A (1) | 4,000 | 6,242 | ||||||
| Arca Continental SAB de CV (1) | 4,600 | 27,370 | ||||||
| Cemex SAB de CV, ADR (1)* | 2,871 | 22,796 | ||||||
| Coca-Cola Femsa SAB de CV, ADR (1) | 219 | 16,425 | ||||||
| Fibra Uno Administracion SA de CV, REIT (1) | 9,100 | 16,623 | ||||||
| Fomento Economico Mexicano SAB de CV, ADR (1) | 367 | 33,779 | ||||||
| Gentera SAB de CV (1) | 10,500 | 18,899 | ||||||
| Gruma SAB de CV, Class B (1) | 2,200 | 28,926 | ||||||
| Grupo Aeroportuario del Pacifico SAB de CV, Class B (1) | 4,400 | 41,779 | ||||||
| Grupo Aeroportuario del Sureste SAB de CV, ADR (1) | 121 | 17,717 | ||||||
| Grupo Bimbo SAB de CV, Series A (1) | 17,800 | 46,920 | ||||||
| Grupo Carso SAB de CV, Series A1 (1) | 1,300 | 5,195 | ||||||
| Grupo Comercial Chedraui SA de CV (1) | 5,300 | 11,584 | ||||||
| Grupo Financiero Banorte SAB de CV, Class O (1) | 16,900 | 88,624 | ||||||
| Grupo Financiero Santander Mexico SAB de CV, Class B, ADR (1) | 2,240 | 19,712 | ||||||
| Grupo Lala SAB de CV (1) | 5,300 | 10,094 | ||||||
| Industrias Penoles SAB de CV (1) | 1,025 | 24,638 | ||||||
| Kimberly-Clark de Mexico SAB de CV, Class A (1) | 9,200 | 20,811 | ||||||
| OHL Mexico SAB de CV (1)* | 2,500 | 3,316 | ||||||
| Promotora y Operadora de Infraestructura SAB de CV (1) | 2,010 | 21,567 | ||||||
| Wal-Mart de Mexico SAB de CV (1) | 3,400 | 7,466 | ||||||
|
| |||||||
| 490,483 | ||||||||
|
| |||||||
| Netherlands - 1.0% | ||||||||
| Steinhoff International Holdings NV | 19,861 | 113,742 | ||||||
|
| |||||||
| Peru - 0.7% | ||||||||
| Cia de Minas Buenaventura SAA, ADR (1)* | 2,168 | 30,005 | ||||||
| Credicorp Ltd. (1) | 322 | 49,015 | ||||||
|
| |||||||
| 79,020 | ||||||||
|
| |||||||
| Poland - 0.3% | ||||||||
| CCC SA | 177 | 8,198 | ||||||
| Eurocash SA | 295 | 3,281 | ||||||
| Grupa Lotos SA* | 889 | 6,621 | ||||||
| INVESTMENTS | SHARES | VALUE | ||||||
| Poland - 0.3% (continued) | ||||||||
| Polski Koncern Naftowy ORLEN SA | 215 | $ | 3,656 | |||||
| Polskie Gornictwo Naftowe i Gazownictwo SA | 5,392 | 7,126 | ||||||
|
| |||||||
| 28,882 | ||||||||
|
| |||||||
| Romania - 0.1% | ||||||||
| New Europe Property Investments plc | 713 | 8,085 | ||||||
|
| |||||||
| Russia - 0.5% | ||||||||
| MMC Norilsk Nickel PJSC, ADR | 265 | 4,236 | ||||||
| Mobile TeleSystems PJSC, ADR (1) | 3,023 | 23,065 | ||||||
| PhosAgro OJSC, GDR | 626 | 8,072 | ||||||
| Sistema PJSC FC, GDR | 533 | 3,964 | ||||||
| Tatneft PJSC, ADR (1) | 532 | 16,418 | ||||||
|
| |||||||
| 55,755 | ||||||||
|
| |||||||
| South Africa - 6.1% | ||||||||
| Anglo American Platinum Ltd. * | 720 | 20,256 | ||||||
| AngloGold Ashanti Ltd., ADR (1)* | 2,650 | 42,188 | ||||||
| Aspen Pharmacare Holdings Ltd. | 163 | 3,681 | ||||||
| Bidvest Group Ltd. (The) | 2,275 | 26,825 | ||||||
| Brait SE* | 1,110 | 8,928 | ||||||
| Capitec Bank Holdings Ltd. | 687 | 32,192 | ||||||
| Discovery Ltd. | 370 | 3,050 | ||||||
| Fortress Income Fund Ltd., REIT | 5,775 | 13,795 | ||||||
| Foschini Group Ltd. (The) | 392 | 3,978 | ||||||
| Gold Fields Ltd., ADR (1) | 5,611 | 27,213 | ||||||
| Hyprop Investments Ltd., REIT | 481 | 4,243 | ||||||
| Mr Price Group Ltd. | 473 | 5,233 | ||||||
| Naspers Ltd., Class N | 1,855 | 321,050 | ||||||
| Pick n Pay Stores Ltd. | 3,867 | 19,391 | ||||||
| PSG Group Ltd. | 433 | 6,340 | ||||||
| Redefine Properties Ltd., REIT | 7,023 | 5,860 | ||||||
| Remgro Ltd. | 262 | 4,384 | ||||||
| Resilient REIT Ltd., REIT | 887 | 7,421 | ||||||
| RMB Holdings Ltd. | 1,049 | 4,476 | ||||||
| Sappi Ltd. * | 4,065 | 21,055 | ||||||
| Shoprite Holdings Ltd. | 381 | 5,324 | ||||||
| Sibanye Gold Ltd. | 8,174 | 29,062 | ||||||
| Standard Bank Group Ltd. | 418 | 4,295 | ||||||
| Telkom SA SOC Ltd. | 1,747 | 7,703 | ||||||
| Tiger Brands Ltd. | 607 | 16,830 | ||||||
| Truworths International Ltd. | 867 | 4,493 | ||||||
| Vodacom Group Ltd. | 830 | 9,326 | ||||||
|
| |||||||
| 658,592 | ||||||||
|
| |||||||
| Taiwan - 14.4% | ||||||||
| Acer, Inc. * | 7,000 | 3,265 | ||||||
| Advantech Co. Ltd. | 1,198 | 10,311 | ||||||
| Asia Cement Corp. | 7,160 | 6,272 | ||||||
| Asustek Computer, Inc. | 1,000 | 8,939 | ||||||
| AU Optronics Corp. | 16,000 | 5,874 | ||||||
| Casetek Holdings Ltd. | 1,000 | 3,661 | ||||||
| Cathay Financial Holding Co. Ltd. | 7,600 | 9,772 | ||||||
| Chailease Holding Co. Ltd. | 3,960 | 7,053 | ||||||
| Chang Hwa Commercial Bank Ltd. | 31,235 | 16,036 | ||||||
| China Airlines Ltd. | 15,000 | 4,481 | ||||||
| China Development Financial Holding Corp. | 40,000 | 10,247 | ||||||
| China Life Insurance Co. Ltd. | 31,512 | 28,948 | ||||||
| The accompanying notes are an integral part of these financial statements. | (Continued) |
| AQR Funds | Annual Report | September 2016 | ||||||||||||||
113
| Schedule of Investments | September 30, 2016 |
| AQR EMERGING MOMENTUM STYLE FUND |
| INVESTMENTS | SHARES | VALUE | ||||||
| Taiwan - 14.4% (continued) | ||||||||
| Chunghwa Telecom Co. Ltd. | 28,000 | $ | 98,749 | |||||
| Compal Electronics, Inc. | 7,000 | 4,334 | ||||||
| CTBC Financial Holding Co. Ltd. | 14,660 | 8,545 | ||||||
| E.Sun Financial Holding Co. Ltd. | 15,448 | 8,827 | ||||||
| Eclat Textile Co. Ltd. | 1,040 | 12,461 | ||||||
| Eva Airways Corp. | 14,700 | 6,717 | ||||||
| Far EasTone Telecommunications Co. Ltd. | 6,000 | 14,187 | ||||||
| Feng TAY Enterprise Co. Ltd. | 3,614 | 16,081 | ||||||
| First Financial Holding Co. Ltd. | 26,198 | 13,952 | ||||||
| Formosa Chemicals & Fibre Corp. | 14,000 | 37,777 | ||||||
| Formosa Petrochemical Corp. | 10,000 | 30,147 | ||||||
| Formosa Plastics Corp. | 17,000 | 42,335 | ||||||
| Fubon Financial Holding Co. Ltd. | 3,000 | 4,458 | ||||||
| Highwealth Construction Corp. | 5,800 | 8,988 | ||||||
| Hiwin Technologies Corp. | 1,081 | 5,674 | ||||||
| Hon Hai Precision Industry Co. Ltd. | 15,441 | 39,076 | ||||||
| HTC Corp. * | 7,000 | 19,579 | ||||||
| Innolux Corp. | 13,000 | 4,418 | ||||||
| Inventec Corp. | 14,000 | 11,493 | ||||||
| Lite-On Technology Corp. | 11,034 | 15,952 | ||||||
| Nien Made Enterprise Co. Ltd. | 1,000 | 12,932 | ||||||
| OBI Pharma, Inc. * | 2,000 | 25,007 | ||||||
| Pegatron Corp. | 6,000 | 15,528 | ||||||
| Pou Chen Corp. | 7,000 | 9,891 | ||||||
| Powertech Technology, Inc. | 7,000 | 18,192 | ||||||
| President Chain Store Corp. | 1,000 | 7,965 | ||||||
| Realtek Semiconductor Corp. | 6,000 | 19,802 | ||||||
| Standard Foods Corp. | 4,440 | 11,410 | ||||||
| TaiMed Biologics, Inc. * | 3,000 | 21,001 | ||||||
| Taishin Financial Holding Co. Ltd. | 29,897 | 11,155 | ||||||
| Taiwan Cement Corp. | 9,000 | 10,265 | ||||||
| Taiwan Mobile Co. Ltd. | 10,000 | 35,955 | ||||||
| Taiwan Semiconductor Manufacturing Co. Ltd., ADR (1) | 24,907 | 761,905 | ||||||
| Teco Electric and Machinery Co. Ltd. | 10,000 | 8,651 | ||||||
| Uni-President Enterprises Corp. | 28,000 | 52,682 | ||||||
| Wistron Corp. | 13,000 | 9,696 | ||||||
| WPG Holdings Ltd. | 6,000 | 7,119 | ||||||
|
| |||||||
| 1,557,765 | ||||||||
|
| |||||||
| Thailand - 5.4% | ||||||||
| Airports of Thailand PCL, NVDR | 4,200 | 48,438 | ||||||
| Bangkok Dusit Medical Services PCL, NVDR | 74,900 | 47,212 | ||||||
| Bangkok Expressway & Metro PCL, NVDR | 131,400 | 26,238 | ||||||
| BTS Group Holdings PCL, NVDR | 39,100 | 9,785 | ||||||
| Bumrungrad Hospital PCL, NVDR | 4,500 | 22,712 | ||||||
| Central Pattana PCL, NVDR | 20,700 | 34,949 | ||||||
| Charoen Pokphand Foods PCL, NVDR | 33,000 | 30,335 | ||||||
| CP ALL PCL, NVDR | 31,200 | 55,493 | ||||||
| Delta Electronics Thailand PCL, NVDR | 7,800 | 17,887 | ||||||
| Electricity Generating PCL, NVDR | 600 | 3,447 | ||||||
| Energy Absolute PCL, NVDR | 7,000 | 5,219 | ||||||
| Glow Energy PCL, NVDR | 2,800 | 6,466 | ||||||
| Home Product Center PCL, NVDR | 58,000 | 16,787 | ||||||
| Indorama Ventures PCL, NVDR | 24,000 | 19,655 | ||||||
| IRPC PCL, NVDR | 177,800 | 25,115 | ||||||
| Kasikornbank PCL, NVDR | 3,700 | 20,090 | ||||||
| Minor International PCL, NVDR | 24,160 | 27,289 | ||||||
| PTT Exploration & Production PCL, NVDR | 3,500 | 8,234 | ||||||
| PTT Global Chemical PCL, NVDR | 7,500 | 12,783 | ||||||
| INVESTMENTS | SHARES | VALUE | ||||||
| Thailand - 5.4% (continued) | ||||||||
| PTT PCL, NVDR | 6,600 | $ | 64,950 | |||||
| Robinson Department Store PCL, NVDR | 6,500 | 11,423 | ||||||
| Siam Cement PCL (The), NVDR | 750 | 11,199 | ||||||
| Siam Commercial Bank PCL (The), NVDR | 5,100 | 21,887 | ||||||
| Thai Oil PCL, NVDR | 11,500 | 22,801 | ||||||
| Thai Union Group PCL, NVDR | 24,200 | 14,982 | ||||||
|
| |||||||
| 585,376 | ||||||||
|
| |||||||
| Turkey - 0.9% | ||||||||
| Arcelik A/S | 3,302 | 23,239 | ||||||
| BIM Birlesik Magazalar A/S | 469 | 7,823 | ||||||
| KOC Holding A/S | 1,205 | 5,177 | ||||||
| Petkim Petrokimya Holding A/S | 14,291 | 21,664 | ||||||
| Tofas Turk Otomobil Fabrikasi A/S | 2,629 | 19,170 | ||||||
| Turkiye Sise ve Cam Fabrikalari A/S | 8,386 | 8,887 | ||||||
| Ulker Biskuvi Sanayi A/S | 1,279 | 9,116 | ||||||
|
| |||||||
| 95,076 | ||||||||
|
| |||||||
TOTAL COMMON STOCKS | 10,299,603 | |||||||
|
| |||||||
| PREFERRED STOCKS - 1.8% | ||||||||
| Brazil - 1.8% | ||||||||
| Braskem SA, Class A (1) | 3,700 | 28,534 | ||||||
| Centrais Eletricas Brasileiras SA, Class B (1)* | 5,400 | 39,884 | ||||||
| Gerdau SA (1) | 6,100 | 16,769 | ||||||
| Itausa - Investimentos Itau SA (1) | 14,000 | 36,075 | ||||||
| Lojas Americanas SA (1) | 2,940 | 18,297 | ||||||
| Petroleo Brasileiro SA (1)* | 12,400 | 52,236 | ||||||
| Suzano Papel e Celulose SA, Series A (1) | 1,100 | 3,551 | ||||||
|
| |||||||
TOTAL PREFERRED STOCKS | 195,346 | |||||||
|
| |||||||
| EXCHANGE TRADED FUND - 1.9% | ||||||||
| United States | ||||||||
| iShares MSCI Emerging Markets Fund | ||||||||
(cost $201,043) (1) | 5,702 | 213,540 | ||||||
|
| |||||||
| SHORT-TERM INVESTMENT - 1.1% | ||||||||
| Investment Company - 1.1% | ||||||||
| J.P. Morgan U.S. Treasury Plus Money Market Fund - IM Shares, 0.22% | ||||||||
(cost $114,043) (d) | 114,043 | 114,043 | ||||||
|
| |||||||
| SECURITIES LENDING COLLATERAL - 0.5% | ||||||||
| Money Market Funds - 0.5% | ||||||||
| Investments in a Pooled Account through Securities Lending Program with JPMorgan Chase Bank | ||||||||
Dreyfus Treasury & Agency Cash Management, 0.21% | 53,284 | 53,284 | ||||||
|
| |||||||
TOTAL INVESTMENTS IN SECURITIES AT VALUE - 100.4% |
| 10,875,816 | ||||||
|
| |||||||
| LIABILITIES IN EXCESS OF OTHER ASSETS - (0.4)% | (48,387) | |||||||
|
| |||||||
NET ASSETS - 100.0% | 10,827,429 | |||||||
|
| |||||||
| The accompanying notes are an integral part of these financial statements. | (Continued) |
| AQR Funds | Annual Report | September 2016 | ||||||||||||||
114
| Schedule of Investments | September 30, 2016 |
| AQR EMERGING MOMENTUM STYLE FUND |
| SECTOR | VALUE | % OF NET ASSETS | ||||||
| Consumer Discretionary | $ | 1,450,601 | 13.4 | % | ||||
| Consumer Staples | 1,040,733 | 9.6 | ||||||
| Energy | 825,552 | 7.6 | ||||||
| Exchange Traded Fund | 213,540 | 2.0 | ||||||
| Financials | 1,306,348 | 12.1 | ||||||
| Health Care | 447,756 | 4.1 | ||||||
| Industrials | 650,116 | 6.0 | ||||||
| Information Technology | 2,854,481 | 26.3 | ||||||
| Materials | 750,389 | 6.9 | ||||||
| Real Estate | 379,093 | 3.5 | ||||||
| Telecommunication Services | 381,083 | 3.5 | ||||||
| Utilities | 408,797 | 3.8 | ||||||
| Short-Term Investment | 114,043 | 1.1 | ||||||
| Securities Lending Collateral | 53,284 | 0.5 | ||||||
|
|
|
| |||||
Total Investments In Securities At Value | 10,875,816 | 100.4 | ||||||
| Liabilities in Excess of Other Assets | (48,387 | ) | (0.4 | ) | ||||
|
|
|
| |||||
Net Assets | $ | 10,827,429 | 100.0 | % | ||||
|
|
|
| |||||
| * | Non-income producing security. |
| (a) | The security or a portion of this security is on loan at 9/30/2016. The total value of securities on loan at 9/30/2016 was $49,425. |
| (b) | Security fair valued as of 9/30/2016 in accordance with procedures approved by the Board of Trustees. Total value of all such securities at 9/30/2016 amounted to $0, which represents approximately 0.00% of net assets of the fund. |
| (c) | Securities exempt from registration under Rule 144A or section 4(2), of the Securities Act of 1933. Under procedures approved by the Board of Trustees, such securities have been determined to be liquid by the investment adviser and may be resold, normally to qualified institutional buyers in transactions exempt from registration. Total value of all such securities at 9/30/2016 amounted to $64,643, which represents approximately 0.60% of net assets of the fund. |
| (d) | Represents 7-day effective yield as of 9/30/2016. |
| (e) | Represents security, or portion thereof, purchased with the cash collateral received for securities on loan. |
All securities are Level 2 with respect to ASC 820, unless otherwise noted in parentheses.
| (1) | Level 1 security (See Note 4). |
| (3) | Level 3 security (See Note 4). |
Abbreviations
ADR - American Depositary Receipt
GDR - Global Depositary Receipt
NVDR - Non-Voting Depositary Receipt
OJSC - Open Joint Stock Company
PJSC - Public Joint Stock Company
REIT - Real Estate Investment Trust
| The accompanying notes are an integral part of these financial statements. |
| AQR Funds | Annual Report | September 2016 | ||||||||||||||
115
| Schedule of Investments | September 30, 2016 |
| AQR TM LARGE CAP MOMENTUM STYLE FUND |
| INVESTMENTS | SHARES | VALUE | ||||||
| COMMON STOCKS - 96.9% | ||||||||
| Aerospace & Defense - 3.3% | ||||||||
| B/E Aerospace, Inc. | 2,772 | $ | 143,202 | |||||
| General Dynamics Corp. | 5,500 | 853,380 | ||||||
| Huntington Ingalls Industries, Inc. | 1,500 | 230,130 | ||||||
| Lockheed Martin Corp. | 6,291 | 1,508,078 | ||||||
| Northrop Grumman Corp. | 5,646 | 1,207,962 | ||||||
| Raytheon Co. | 6,276 | 854,352 | ||||||
| Textron, Inc. | 2,100 | 83,475 | ||||||
|
| |||||||
| 4,880,579 | ||||||||
|
| |||||||
| Air Freight & Logistics - 0.7% | ||||||||
| FedEx Corp. | 2,746 | 479,671 | ||||||
| United Parcel Service, Inc., Class B | 4,507 | 492,886 | ||||||
|
| |||||||
| 972,557 | ||||||||
|
| |||||||
| Airlines - 0.8% | ||||||||
| Alaska Air Group, Inc. | 2,312 | 152,268 | ||||||
| Delta Air Lines, Inc. | 7,213 | 283,904 | ||||||
| JetBlue Airways Corp. * | 8,441 | 145,523 | ||||||
| Southwest Airlines Co. | 9,757 | 379,450 | ||||||
| Spirit Airlines, Inc. * | 1,713 | 72,854 | ||||||
| United Continental Holdings, Inc. * | 2,546 | 133,588 | ||||||
|
| |||||||
| 1,167,587 | ||||||||
|
| |||||||
| Auto Components - 0.1% | ||||||||
| Delphi Automotive plc (United Kingdom) | 1,542 | 109,976 | ||||||
| Goodyear Tire & Rubber Co. (The) | 3,168 | 102,326 | ||||||
| Johnson Controls International plc | 1,533 | 71,331 | ||||||
|
| |||||||
| 283,633 | ||||||||
|
| |||||||
| Banks - 0.6% | ||||||||
| Comerica, Inc. | 1,500 | 70,980 | ||||||
| Fifth Third Bancorp | 5,100 | 104,346 | ||||||
| First Republic Bank | 4,040 | 311,524 | ||||||
| Huntington Bancshares, Inc. | 10,400 | 102,544 | ||||||
| Signature Bank * | 1,700 | 201,365 | ||||||
| SVB Financial Group * | 700 | 77,378 | ||||||
|
| |||||||
| 868,137 | ||||||||
|
| |||||||
| Beverages - 3.9% | ||||||||
| Brown-Forman Corp., Class B | 3,068 | 145,546 | ||||||
| Coca-Cola Co. (The) | 34,865 | 1,475,487 | ||||||
| Constellation Brands, Inc., Class A | 4,163 | 693,098 | ||||||
| Dr. Pepper Snapple Group, Inc. | 5,698 | 520,284 | ||||||
| Molson Coors Brewing Co., Class B | 1,513 | 166,127 | ||||||
| Monster Beverage Corp. * | 3,934 | 577,551 | ||||||
| PepsiCo, Inc. | 19,989 | 2,174,203 | ||||||
|
| |||||||
| 5,752,296 | ||||||||
|
| |||||||
| Biotechnology - 0.7% | ||||||||
| Alexion Pharmaceuticals, Inc. * | 458 | 56,123 | ||||||
| Alnylam Pharmaceuticals, Inc. * | 1,211 | 82,082 | ||||||
| Amgen, Inc. | 901 | 150,296 | ||||||
| BioMarin Pharmaceutical, Inc. * | 864 | 79,937 | ||||||
| Incyte Corp. * | 2,919 | 275,232 | ||||||
| OPKO Health, Inc. * | 4,868 | 51,552 | ||||||
| Regeneron Pharmaceuticals, Inc. * | 635 | 255,283 | ||||||
| United Therapeutics Corp. * | 512 | 60,457 | ||||||
|
| |||||||
| 1,010,962 | ||||||||
|
| |||||||
| INVESTMENTS | SHARES | VALUE | ||||||
| Building Products - 0.3% | ||||||||
| AO Smith Corp. | 2,198 | $ | 217,140 | |||||
| Fortune Brands Home & Security, Inc. | 3,256 | 189,174 | ||||||
| Masco Corp. | 2,809 | 96,377 | ||||||
|
| |||||||
| 502,691 | ||||||||
|
| |||||||
| Capital Markets - 1.3% | ||||||||
| BlackRock, Inc. | 365 | 132,298 | ||||||
| CBOE Holdings, Inc. | 1,623 | 105,252 | ||||||
| CME Group, Inc. | 4,272 | 446,509 | ||||||
| E*TRADE Financial Corp. * | 5,200 | 151,424 | ||||||
| Interactive Brokers Group, Inc., Class A | 2,788 | 98,333 | ||||||
| Moody’s Corp. | 2,313 | 250,452 | ||||||
| Intercontinental Exchange, Inc. | 867 | 233,535 | ||||||
| Northern Trust Corp. | 2,636 | 179,221 | ||||||
| S&P Global, Inc. | 2,820 | 356,899 | ||||||
|
| |||||||
| 1,953,923 | ||||||||
|
| |||||||
| Chemicals - 0.9% | ||||||||
| Air Products & Chemicals, Inc. | 1,700 | 255,578 | ||||||
| Dow Chemical Co. (The) | 2,240 | 116,099 | ||||||
| Ecolab, Inc. | 2,147 | 261,333 | ||||||
| PPG Industries, Inc. | 3,826 | 395,456 | ||||||
| Sherwin-Williams Co. (The) | 961 | 265,870 | ||||||
|
| |||||||
| 1,294,336 | ||||||||
|
| |||||||
| Communications Equipment - 1.1% | ||||||||
| ARRIS International plc * | 2,800 | 79,324 | ||||||
| Brocade Communications Systems, Inc. | 7,800 | 71,994 | ||||||
| Cisco Systems, Inc. | 23,651 | 750,210 | ||||||
| F5 Networks, Inc. * | 1,500 | 186,960 | ||||||
| Juniper Networks, Inc. | 7,300 | 175,638 | ||||||
| Palo Alto Networks, Inc. * | 2,234 | 355,943 | ||||||
|
| |||||||
| 1,620,069 | ||||||||
|
| |||||||
| Construction Materials - 0.1% | ||||||||
| Vulcan Materials Co. | 1,445 | 164,340 | ||||||
|
| |||||||
| Consumer Finance - 0.2% | ||||||||
| Discover Financial Services | 3,539 | 200,130 | ||||||
| Synchrony Financial | 2,237 | 62,636 | ||||||
|
| |||||||
| 262,766 | ||||||||
|
| |||||||
| Containers & Packaging - 0.1% | ||||||||
| Ball Corp. | 1,400 | 114,730 | ||||||
|
| |||||||
| Distributors - 0.1% | ||||||||
| LKQ Corp. * | 2,515 | 89,182 | ||||||
|
| |||||||
| Diversified Consumer Services - 0.1% | ||||||||
| ServiceMaster Global Holdings, Inc. * | 2,514 | 84,672 | ||||||
|
| |||||||
| Diversified Financial Services - 0.0% (a) | ||||||||
| Berkshire Hathaway, Inc., Class B* | 365 | 52,731 | ||||||
|
| |||||||
| Diversified Telecommunication Services - 3.7% | ||||||||
| AT&T, Inc. | 73,920 | 3,001,891 | ||||||
| Level 3 Communications, Inc. * | 3,005 | 139,372 | ||||||
| Verizon Communications, Inc. | 43,292 | 2,250,318 | ||||||
|
| |||||||
| 5,391,581 | ||||||||
|
| |||||||
| The accompanying notes are an integral part of these financial statements. | (Continued) |
| AQR Funds | Annual Report | September 2016 | ||||||||||||||
116
| Schedule of Investments | September 30, 2016 |
| AQR TM LARGE CAP MOMENTUM STYLE FUND |
| INVESTMENTS | SHARES | VALUE | ||||||
| Electric Utilities - 3.7% | ||||||||
| American Electric Power Co., Inc. | 9,103 | $ | 584,504 | |||||
| Duke Energy Corp. | 6,342 | 507,614 | ||||||
| Edison International | 6,971 | 503,655 | ||||||
| Entergy Corp. | 1,400 | 107,422 | ||||||
| Eversource Energy | 1,288 | 69,784 | ||||||
| NextEra Energy, Inc. | 12,254 | 1,498,909 | ||||||
| PG&E Corp. | 6,286 | 384,515 | ||||||
| PPL Corp. | 5,332 | 184,327 | ||||||
| Southern Co. (The) | 23,798 | 1,220,837 | ||||||
| Xcel Energy, Inc. | 11,233 | 462,125 | ||||||
|
| |||||||
| 5,523,692 | ||||||||
|
| |||||||
| Electrical Equipment - 0.4% | ||||||||
| Acuity Brands, Inc. | 821 | 217,237 | ||||||
| Rockwell Automation, Inc. | 2,600 | 318,084 | ||||||
|
| |||||||
| 535,321 | ||||||||
|
| |||||||
| Electronic Equipment, Instruments & Components - 0.2% | ||||||||
| Corning, Inc. | 11,812 | 279,354 | ||||||
|
| |||||||
| Energy Equipment & Services - 0.0% (a) | ||||||||
| Patterson-UTI Energy, Inc. | 2,347 | 52,502 | ||||||
|
| |||||||
| Equity Real Estate Investment Trusts (REITs) - 6.6% | ||||||||
| American Tower Corp. | 6,176 | 699,926 | ||||||
| AvalonBay Communities, Inc. | 4,737 | 842,428 | ||||||
| Boston Properties, Inc. | 5,439 | 741,281 | ||||||
| Crown Castle International Corp. | 2,926 | 275,658 | ||||||
| CyrusOne, Inc. | 1,443 | 68,644 | ||||||
| Digital Realty Trust, Inc. | 3,871 | 375,952 | ||||||
| Equinix, Inc. | 1,400 | 504,350 | ||||||
| Equity Residential | 11,412 | 734,134 | ||||||
| Essex Property Trust, Inc. | 2,600 | 579,020 | ||||||
| Extra Space Storage, Inc. | 1,500 | 119,115 | ||||||
| Federal Realty Investment Trust | 700 | 107,751 | ||||||
| General Growth Properties, Inc. | 11,239 | 310,196 | ||||||
| HCP, Inc. | 5,000 | 189,750 | ||||||
| Public Storage | 6,373 | 1,422,071 | ||||||
| Realty Income Corp. | 1,500 | 100,395 | ||||||
| Retail Properties of America, Inc., Class A | 5,600 | 94,080 | ||||||
| Simon Property Group, Inc. | 5,645 | 1,168,571 | ||||||
| UDR, Inc. | 2,100 | 75,579 | ||||||
| Ventas, Inc. | 5,620 | 396,941 | ||||||
| Vornado Realty Trust | 4,200 | 425,082 | ||||||
| Welltower, Inc. | 7,492 | 560,177 | ||||||
|
| |||||||
| 9,791,101 | ||||||||
|
| |||||||
| Food & Staples Retailing - 1.0% | ||||||||
| Costco Wholesale Corp. | 5,252 | 800,982 | ||||||
| Kroger Co. (The) | 15,781 | 468,380 | ||||||
| Sysco Corp. | 1,418 | 69,496 | ||||||
| Walgreens Boots Alliance, Inc. | 1,551 | 125,042 | ||||||
|
| |||||||
| 1,463,900 | ||||||||
|
| |||||||
| Food Products - 2.2% | ||||||||
| Archer-Daniels-Midland Co. | 2,109 | 88,937 | ||||||
| Campbell Soup Co. | 3,359 | 183,737 | ||||||
| ConAgra Foods, Inc. | 1,869 | 88,049 | ||||||
| General Mills, Inc. | 9,165 | 585,460 | ||||||
| INVESTMENTS | SHARES | VALUE | ||||||
| Food Products - 2.2% (continued) | ||||||||
| Hormel Foods Corp. | 12,214 | $ | 463,277 | |||||
| JM Smucker Co. (The) | 1,402 | 190,027 | ||||||
| Kellogg Co. | 1,167 | 90,407 | ||||||
| McCormick & Co., Inc. | 1,621 | 161,970 | ||||||
| Mondelez International, Inc., Class A | 18,095 | 794,371 | ||||||
| Pilgrim’s Pride Corp. | 3,191 | 67,394 | ||||||
| Pinnacle Foods, Inc. | 1,572 | 78,867 | ||||||
| Tyson Foods, Inc., Class A | 6,540 | 488,342 | ||||||
|
| |||||||
| 3,280,838 | ||||||||
|
| |||||||
| Health Care Equipment & Supplies - 2.1% | ||||||||
| Abbott Laboratories | 3,550 | 150,129 | ||||||
| Align Technology, Inc. * | 1,400 | 131,250 | ||||||
| Becton Dickinson and Co. | 1,193 | 214,418 | ||||||
| Boston Scientific Corp. * | 15,571 | 370,590 | ||||||
| Danaher Corp. | 5,772 | 452,467 | ||||||
| DexCom, Inc. * | 2,200 | 192,852 | ||||||
| Edwards Lifesciences Corp. * | 3,270 | 394,231 | ||||||
| Hologic, Inc. * | 1,943 | 75,447 | ||||||
| Intuitive Surgical, Inc. * | 200 | 144,966 | ||||||
| Medtronic plc | 9,817 | 848,189 | ||||||
| Stryker Corp. | 1,316 | 153,195 | ||||||
|
| |||||||
| 3,127,734 | ||||||||
|
| |||||||
| Health Care Providers & Services - 2.8% | ||||||||
| Acadia Healthcare Co., Inc. * | 889 | 44,050 | ||||||
| Aetna, Inc. | 5,446 | 628,741 | ||||||
| AmerisourceBergen Corp. | 1,061 | 85,708 | ||||||
| Anthem, Inc. | 3,564 | 446,605 | ||||||
| Cardinal Health, Inc. | 3,661 | 284,460 | ||||||
| Centene Corp. * | 3,293 | 220,499 | ||||||
| HCA Holdings, Inc. * | 2,023 | 152,999 | ||||||
| Henry Schein, Inc. * | 648 | 105,611 | ||||||
| McKesson Corp. | 579 | 96,548 | ||||||
| UnitedHealth Group, Inc. | 14,744 | 2,064,160 | ||||||
|
| |||||||
| 4,129,381 | ||||||||
|
| |||||||
| Health Care Technology - 0.2% | ||||||||
| athenahealth, Inc. * | 1,017 | 128,264 | ||||||
| Cerner Corp. * | 2,661 | 164,317 | ||||||
|
| |||||||
| 292,581 | ||||||||
|
| |||||||
| Hotels, Restaurants & Leisure - 1.8% | ||||||||
| Carnival Corp. | 5,761 | 281,252 | ||||||
| McDonald’s Corp. | 11,163 | 1,287,764 | ||||||
| Norwegian Cruise Line Holdings Ltd. * | 2,611 | 98,435 | ||||||
| Royal Caribbean Cruises Ltd. | 796 | 59,660 | ||||||
| Starbucks Corp. | 16,502 | 893,418 | ||||||
| Yum! Brands, Inc. | 1,045 | 94,896 | ||||||
|
| |||||||
| 2,715,425 | ||||||||
|
| |||||||
| Household Durables - 0.3% | ||||||||
| Mohawk Industries, Inc. * | 1,586 | 317,739 | ||||||
| Whirlpool Corp. | 1,142 | 185,187 | ||||||
|
| |||||||
| 502,926 | ||||||||
|
| |||||||
| Household Products - 1.7% | ||||||||
| Clorox Co. (The) | 1,049 | 131,314 | ||||||
| Colgate-Palmolive Co. | 1,496 | 110,913 | ||||||
| Kimberly-Clark Corp. | 5,626 | 709,664 | ||||||
| The accompanying notes are an integral part of these financial statements. | (Continued) |
| AQR Funds | Annual Report | September 2016 | ||||||||||||||
117
| Schedule of Investments | September 30, 2016 |
| AQR TM LARGE CAP MOMENTUM STYLE FUND |
| INVESTMENTS | SHARES | VALUE | ||||||
| Household Products - 1.7% (continued) | ||||||||
| Procter & Gamble Co. (The) | 16,552 | $ | 1,485,542 | |||||
|
| |||||||
| 2,437,433 | ||||||||
|
| |||||||
| Industrial Conglomerates - 2.9% | ||||||||
| 3M Co. | 5,664 | 998,167 | ||||||
| General Electric Co. | 88,614 | 2,624,747 | ||||||
| Honeywell International, Inc. | 5,345 | 623,173 | ||||||
|
| |||||||
| 4,246,087 | ||||||||
|
| |||||||
| Insurance - 1.8% | ||||||||
| American Financial Group, Inc. | 1,717 | 128,775 | ||||||
| Arch Capital Group Ltd. * | 2,968 | 235,244 | ||||||
| Axis Capital Holdings Ltd. | 856 | 46,506 | ||||||
| Chubb Ltd. | 5,486 | 689,316 | ||||||
| Everest Re Group Ltd. | 999 | 189,780 | ||||||
| Hartford Financial Services Group, Inc. (The) | 3,282 | 140,535 | ||||||
| Markel Corp. * | 231 | 214,546 | ||||||
| Principal Financial Group, Inc. | 1,500 | 77,265 | ||||||
| Progressive Corp. (The) | 5,576 | 175,644 | ||||||
| RenaissanceRe Holdings Ltd. | 1,701 | 204,392 | ||||||
| Travelers Cos., Inc. (The) | 3,710 | 424,981 | ||||||
| White Mountains Insurance Group Ltd. | 100 | 83,000 | ||||||
|
| |||||||
| 2,609,984 | ||||||||
|
| |||||||
| Internet & Direct Marketing Retail - 4.0% | ||||||||
| Amazon.com, Inc. * | 5,531 | 4,631,162 | ||||||
| Expedia, Inc. | 2,588 | 302,071 | ||||||
| Netflix, Inc. * | 3,073 | 302,844 | ||||||
| Priceline Group, Inc. (The) * | 467 | 687,186 | ||||||
| TripAdvisor, Inc. * | 877 | 55,409 | ||||||
|
| |||||||
| 5,978,672 | ||||||||
|
| |||||||
| Internet Software & Services - 7.7% | ||||||||
| Akamai Technologies, Inc. * | 1,700 | 90,083 | ||||||
| Alphabet, Inc., Class A * | 7,718 | 6,205,735 | ||||||
| CoStar Group, Inc. * | 500 | 108,265 | ||||||
| eBay, Inc. * | 13,570 | 446,453 | ||||||
| Facebook, Inc., Class A * | 33,586 | 4,308,076 | ||||||
| VeriSign, Inc. * | 576 | 45,066 | ||||||
| Zillow Group, Inc., Class C * | 2,870 | 99,446 | ||||||
|
| |||||||
| 11,303,124 | ||||||||
|
| |||||||
| IT Services - 3.5% | ||||||||
| Accenture plc, Class A | 8,221 | 1,004,360 | ||||||
| Alliance Data Systems Corp. * | 634 | 136,012 | ||||||
| Amdocs Ltd. | 1,750 | 101,237 | ||||||
| Automatic Data Processing, Inc. | 3,680 | 324,576 | ||||||
| Cognizant Technology Solutions Corp., Class A * | 5,948 | 283,779 | ||||||
| Fiserv, Inc. * | 3,342 | 332,429 | ||||||
| FleetCor Technologies, Inc. * | 1,727 | 300,032 | ||||||
| Jack Henry & Associates, Inc. | 1,350 | 115,493 | ||||||
| MasterCard, Inc., Class A | 7,616 | 775,080 | ||||||
| Sabre Corp. | 4,115 | 115,961 | ||||||
| Total System Services, Inc. | 2,043 | 96,327 | ||||||
| Vantiv, Inc., Class A * | 2,419 | 136,117 | ||||||
| Visa, Inc., Class A | 16,029 | 1,325,598 | ||||||
| Xerox Corp. | 11,832 | 119,858 | ||||||
|
| |||||||
| 5,166,859 | ||||||||
|
| |||||||
| INVESTMENTS | SHARES | VALUE | ||||||
| Leisure Products - 0.1% | ||||||||
| Brunswick Corp. | 1,969 | $ | 96,048 | |||||
|
| |||||||
| Life Sciences Tools & Services - 0.8% | ||||||||
| Illumina, Inc. * | 1,398 | 253,961 | ||||||
| Quintiles Transnational Holdings, Inc. * | 1,288 | 104,405 | ||||||
| Thermo Fisher Scientific, Inc. | 5,346 | 850,335 | ||||||
|
| |||||||
| 1,208,701 | ||||||||
|
| |||||||
| Machinery - 0.8% | ||||||||
| Dover Corp. | 2,493 | 183,585 | ||||||
| Fortive Corp. | 2,886 | 146,897 | ||||||
| Illinois Tool Works, Inc. | 871 | 104,381 | ||||||
| Middleby Corp. (The) * | 1,800 | 222,516 | ||||||
| Parker-Hannifin Corp. | 1,500 | 188,295 | ||||||
| WABCO Holdings, Inc. * | 800 | 90,824 | ||||||
| Wabtec Corp. | 785 | 64,095 | ||||||
| Xylem, Inc. | 2,752 | 144,342 | ||||||
|
| |||||||
| 1,144,935 | ||||||||
|
| |||||||
| Media - 1.0% | ||||||||
| CBS Corp., Class B | 2,587 | 141,612 | ||||||
| Comcast Corp., Class A | 14,932 | 990,589 | ||||||
| DISH Network Corp., Class A * | 2,530 | 138,593 | ||||||
| Madison Square Garden Co. (The), Class A * | 316 | 53,534 | ||||||
| TEGNA, Inc. | 2,894 | 63,263 | ||||||
| Walt Disney Co. (The) | 595 | 55,252 | ||||||
|
| |||||||
| 1,442,843 | ||||||||
|
| |||||||
| Metals & Mining - 0.8% | ||||||||
| Newmont Mining Corp. | 22,385 | 879,507 | ||||||
| Royal Gold, Inc. | 1,671 | 129,385 | ||||||
| Tahoe Resources, Inc. | 5,258 | 67,460 | ||||||
| United States Steel Corp. | 2,180 | 41,115 | ||||||
|
| |||||||
| 1,117,467 | ||||||||
|
| |||||||
| Multiline Retail - 0.6% | ||||||||
| Dollar General Corp. | 5,246 | 367,168 | ||||||
| Dollar Tree, Inc. * | 6,199 | 489,287 | ||||||
|
| |||||||
| 856,455 | ||||||||
|
| |||||||
| Multi-Utilities - 1.6% | ||||||||
| CMS Energy Corp. | 2,100 | 88,221 | ||||||
| Consolidated Edison, Inc. | 8,991 | 677,022 | ||||||
| Dominion Resources, Inc. | 6,051 | 449,408 | ||||||
| DTE Energy Co. | 3,287 | 307,893 | ||||||
| NiSource, Inc. | 6,128 | 147,746 | ||||||
| Public Service Enterprise Group, Inc. | 3,833 | 160,488 | ||||||
| Sempra Energy | 3,095 | 331,753 | ||||||
| WEC Energy Group, Inc. | 2,920 | 174,850 | ||||||
|
| |||||||
| 2,337,381 | ||||||||
|
| |||||||
| Oil, Gas & Consumable Fuels - 7.3% | ||||||||
| Apache Corp. | 3,898 | 248,965 | ||||||
| Chevron Corp. | 15,077 | 1,551,725 | ||||||
| Cimarex Energy Co. | 1,073 | 144,179 | ||||||
| Continental Resources, Inc. * | 5,386 | 279,857 | ||||||
| Diamondback Energy, Inc. * | 10,931 | 1,055,279 | ||||||
| EQT Corp. | 1,200 | 87,144 | ||||||
| Exxon Mobil Corp. | 40,069 | 3,497,222 | ||||||
| HollyFrontier Corp. | 6,227 | 152,561 | ||||||
| The accompanying notes are an integral part of these financial statements. | (Continued) |
| AQR Funds | Annual Report | September 2016 | ||||||||||||||
118
| Schedule of Investments | September 30, 2016 |
| AQR TM LARGE CAP MOMENTUM STYLE FUND |
| INVESTMENTS | SHARES | VALUE | ||||||
| Oil, Gas & Consumable Fuels - 7.3% (continued) | ||||||||
| Newfield Exploration Co. * | 14,449 | $ | 627,953 | |||||
| Occidental Petroleum Corp. | 1,687 | 123,016 | ||||||
| ONEOK, Inc. | 3,504 | 180,071 | ||||||
| Parsley Energy, Inc., Class A * | 9,055 | 303,433 | ||||||
| PBF Energy, Inc., Class A | 7,511 | 170,049 | ||||||
| Phillips 66 | 10,092 | 812,911 | ||||||
| Pioneer Natural Resources Co. | 3,576 | 663,884 | ||||||
| QEP Resources, Inc. | 4,397 | 85,873 | ||||||
| Rice Energy, Inc. * | 3,288 | 85,850 | ||||||
| Tesoro Corp. | 4,757 | 378,467 | ||||||
| Valero Energy Corp. | 3,683 | 195,199 | ||||||
| WPX Energy, Inc. * | 9,841 | 129,803 | ||||||
|
| |||||||
| 10,773,441 | ||||||||
|
| |||||||
| Personal Products - 0.3% | ||||||||
| Coty, Inc., Class A * | 4,893 | 114,985 | ||||||
| Estee Lauder Cos., Inc. (The), Class A | 3,003 | 265,946 | ||||||
|
| |||||||
| 380,931 | ||||||||
|
| |||||||
| Pharmaceuticals - 3.9% | ||||||||
| Bristol-Myers Squibb Co. | 15,990 | 862,181 | ||||||
| Eli Lilly & Co. | 11,772 | 944,821 | ||||||
| Johnson & Johnson | 31,505 | 3,721,686 | ||||||
| Zoetis, Inc. | 5,446 | 283,246 | ||||||
|
| |||||||
| 5,811,934 | ||||||||
|
| |||||||
| Professional Services - 0.1% | ||||||||
| Equifax, Inc. | 651 | 87,611 | ||||||
| Verisk Analytics, Inc. * | 906 | 73,640 | ||||||
|
| |||||||
| 161,251 | ||||||||
|
| |||||||
| Road & Rail - 0.1% | ||||||||
| Old Dominion Freight Line, Inc. * | 1,956 | 134,201 | ||||||
|
| |||||||
| Semiconductors & Semiconductor Equipment - 3.7% | ||||||||
| Applied Materials, Inc. | 17,020 | 513,153 | ||||||
| Broadcom Ltd. (Singapore) | 5,474 | 944,374 | ||||||
| Intel Corp. | 29,185 | 1,101,734 | ||||||
| Marvell Technology Group Ltd. | 6,200 | 82,274 | ||||||
| Microchip Technology, Inc. | 1,024 | 63,631 | ||||||
| NVIDIA Corp. | 17,195 | 1,178,201 | ||||||
| Qorvo, Inc. * | 1,344 | 74,915 | ||||||
| Skyworks Solutions, Inc. | 3,805 | 289,713 | ||||||
| Texas Instruments, Inc. | 15,348 | 1,077,123 | ||||||
| Xilinx, Inc. | 2,840 | 154,326 | ||||||
|
| |||||||
| 5,479,444 | ||||||||
|
| |||||||
| Software - 6.1% | ||||||||
| Activision Blizzard, Inc. | 14,761 | 653,912 | ||||||
| Adobe Systems, Inc. * | 8,721 | 946,577 | ||||||
| Autodesk, Inc. * | 1,500 | 108,495 | ||||||
| CA, Inc. | 2,700 | 89,316 | ||||||
| CDK Global, Inc. | 905 | 51,911 | ||||||
| Electronic Arts, Inc. * | 8,389 | 716,421 | ||||||
| Fortinet, Inc. * | 1,807 | 66,733 | ||||||
| Intuit, Inc. | 2,897 | 318,699 | ||||||
| Microsoft Corp. | 88,152 | 5,077,555 | ||||||
| Red Hat, Inc. * | 1,240 | 100,229 | ||||||
| salesforce.com, Inc. * | 7,043 | 502,377 | ||||||
| ServiceNow, Inc. * | 3,184 | 252,014 | ||||||
| INVESTMENTS | SHARES | VALUE | ||||||
| Software - 6.1% (continued) | ||||||||
| Splunk, Inc. * | 1,137 | $ | 66,719 | |||||
| SS&C Technologies Holdings, Inc. | 2,522 | 81,082 | ||||||
|
| |||||||
| 9,032,040 | ||||||||
|
| |||||||
| Specialty Retail - 4.0% | ||||||||
| Advance Auto Parts, Inc. | 600 | 89,472 | ||||||
| AutoZone, Inc. * | 579 | 444,869 | ||||||
| Best Buy Co., Inc. | 2,009 | 76,704 | ||||||
| Home Depot, Inc. (The) | 14,967 | 1,925,953 | ||||||
| L Brands, Inc. | 1,384 | 97,946 | ||||||
| Lowe’s Cos., Inc. | 8,719 | 629,599 | ||||||
| O’Reilly Automotive, Inc. * | 3,103 | 869,181 | ||||||
| Ross Stores, Inc. | 11,170 | 718,231 | ||||||
| TJX Cos., Inc. (The) | 8,247 | 616,711 | ||||||
| Tractor Supply Co. | 663 | 44,653 | ||||||
| Ulta Salon Cosmetics & Fragrance, Inc. * | 1,847 | 439,549 | ||||||
|
| |||||||
| 5,952,868 | ||||||||
|
| |||||||
| Technology Hardware, Storage & Peripherals - 0.0% (a) | ||||||||
| Hewlett Packard Enterprise Co. | 2,761 | 62,813 | ||||||
|
| |||||||
| Textiles, Apparel & Luxury Goods - 1.0% | ||||||||
| Hanesbrands, Inc. | 5,676 | 143,319 | ||||||
| NIKE, Inc., Class B | 10,229 | 538,557 | ||||||
| Skechers U.S.A., Inc., Class A * | 2,882 | 65,998 | ||||||
| Under Armour, Inc., Class A * | 6,273 | 242,640 | ||||||
| Under Armour, Inc., Class C * | 6,317 | 213,893 | ||||||
| VF Corp. | 4,888 | 273,972 | ||||||
|
| |||||||
| 1,478,379 | ||||||||
|
| |||||||
| Tobacco - 3.4% | ||||||||
| Altria Group, Inc. | 36,875 | 2,331,606 | ||||||
| Philip Morris International, Inc. | 13,686 | 1,330,553 | ||||||
| Reynolds American, Inc. | 28,659 | 1,351,272 | ||||||
|
| |||||||
| 5,013,431 | ||||||||
|
| |||||||
| Trading Companies & Distributors - 0.0% (a) | ||||||||
| HD Supply Holdings, Inc. * | 2,092 | 66,902 | ||||||
|
| |||||||
| Transportation Infrastructure - 0.0% (a) | ||||||||
| Macquarie Infrastructure Corp. | 800 | 66,592 | ||||||
|
| |||||||
| Water Utilities - 0.1% | ||||||||
| American Water Works Co., Inc. | 2,903 | 217,261 | ||||||
|
| |||||||
| Wireless Telecommunication Services - 0.3% | ||||||||
| Sprint Corp. * | 8,011 | 53,113 | ||||||
| T-Mobile US, Inc. * | 8,671 | 405,109 | ||||||
|
| |||||||
| 458,222 | ||||||||
|
| |||||||
TOTAL COMMON STOCKS | 143,197,226 | |||||||
|
| |||||||
| The accompanying notes are an integral part of these financial statements. | (Continued) |
| AQR Funds | Annual Report | September 2016 | ||||||||||||||
119
| Schedule of Investments | September 30, 2016 |
| AQR TM LARGE CAP MOMENTUM STYLE FUND |
| INVESTMENTS | SHARES | VALUE | ||||||
| SHORT-TERM INVESTMENT - 2.9% | ||||||||
| Investment Company - 2.9% | ||||||||
| J.P. Morgan U.S. Treasury Plus Money Market Fund - IM Shares, 0.22% | ||||||||
(cost $4,229,064) (2)(b) | 4,229,064 | $ | 4,229,064 | |||||
|
| |||||||
TOTAL INVESTMENTS IN SECURITIES AT VALUE - 99.8% |
| 147,426,290 | ||||||
|
| |||||||
| OTHER ASSETS IN EXCESS OF LIABILITIES - 0.2% (c) | 321,627 | |||||||
|
| |||||||
NET ASSETS - 100.0% | 147,747,917 | |||||||
|
| |||||||
| SECTOR | VALUE | % OF NET ASSETS | ||||||
| Consumer Discretionary | $ | 19,481,101 | 13.2 | % | ||||
| Consumer Staples | 18,328,830 | 12.4 | ||||||
| Energy | 10,825,944 | 7.3 | ||||||
| Financials | 5,747,543 | 3.9 | ||||||
| Health Care | 15,581,293 | 10.5 | ||||||
| Industrials | 13,878,703 | 9.4 | ||||||
| Information Technology | 32,943,702 | 22.3 | ||||||
| Materials | 2,690,873 | 1.8 | ||||||
| Real Estate | 9,791,101 | 6.6 | ||||||
| Telecommunication Services | 5,849,803 | 4.0 | ||||||
| Utilities | 8,078,333 | 5.5 | ||||||
| Short-Term Investment | 4,229,064 | 2.9 | ||||||
|
|
|
| |||||
Total Investments In Securities At Value | 147,426,290 | 99.8 | ||||||
| Other Assets in Excess of Liabilities (c) | 321,627 | 0.2 | ||||||
|
|
|
| |||||
Net Assets | $ | 147,747,917 | 100.0 | % | ||||
|
|
|
| |||||
All securities are United States companies, unless noted otherwise in parentheses.
| * | Non-income producing security. |
| (a) | Represents less than 0.05% of net assets. |
| (b) | Represents 7-day effective yield as of 9/30/2016. |
| (c) | Includes appreciation/(depreciation) on futures contracts. |
All securities are Level 1 with respect to ASC 820, unless otherwise noted in parentheses.
| (2) | Level 2 security (See Note 4). |
Open futures contracts outstanding at September 30, 2016:
Exchange Traded
| NUMBER OF CONTRACTS | COUNTERPARTY | DESCRIPTION | EXPIRATION DATE | VALUE AT TRADE DATE | VALUE AT SEPTEMBER 30, 2016 | UNREALIZED APPRECIATION (DEPRECIATION) | ||||||||||||||
| Long Contracts: | ||||||||||||||||||||
| 27 | GSCO | S&P 500 E-Mini Futures | 12/2016 | $ | 2,895,360 | $ | 2,916,540 | $ | 21,180 | |||||||||||
|
|
|
|
|
| |||||||||||||||
Collateral pledged to, or (received from), each counterparty at September 30, 2016 was as follows:
| COUNTERPARTY | OVER THE COUNTER | EXCHANGE TRADED | TOTAL | |||||||||
| GSCO | ||||||||||||
| Cash | $— | $108,508 | $108,508 | |||||||||
| ||||||||||||
| The accompanying notes are an integral part of these financial statements. |
| AQR Funds | Annual Report | September 2016 | ||||||||||||||
120
| Schedule of Investments | September 30, 2016 |
| AQR TM SMALL CAP MOMENTUM STYLE FUND |
| INVESTMENTS | SHARES | �� | VALUE | |||||
| COMMON STOCKS - 96.9% | ||||||||
| Aerospace & Defense - 0.9% | ||||||||
| AAR Corp. | 688 | $ | 21,548 | |||||
| Aerojet Rocketdyne Holdings, Inc. * | 588 | 10,337 | ||||||
| Astronics Corp. * | 515 | 23,201 | ||||||
| Curtiss-Wright Corp. | 1,230 | 112,065 | ||||||
| Engility Holdings, Inc. * | 315 | 9,923 | ||||||
| KEYW Holding Corp. (The) *(a) | 1,519 | 16,770 | ||||||
| Mercury Systems, Inc. * | 1,561 | 38,354 | ||||||
| National Presto Industries, Inc. | 136 | 11,939 | ||||||
| TASER International, Inc. *(a) | 1,681 | 48,093 | ||||||
| Vectrus, Inc. * | 532 | 8,102 | ||||||
|
| |||||||
| 300,332 | ||||||||
|
| |||||||
| Air Freight & Logistics - 0.3% | ||||||||
| Air Transport Services Group, Inc. * | 1,277 | 18,325 | ||||||
| Atlas Air Worldwide Holdings, Inc. * | 400 | 17,128 | ||||||
| Echo Global Logistics, Inc. * | 1,533 | 35,351 | ||||||
| Hub Group, Inc., Class A * | 700 | 28,532 | ||||||
| Park-Ohio Holdings Corp. | 324 | 11,810 | ||||||
|
| |||||||
| 111,146 | ||||||||
|
| |||||||
| Airlines - 0.5% | ||||||||
| Allegiant Travel Co. | 593 | 78,318 | ||||||
| Hawaiian Holdings, Inc. * | 1,800 | 87,480 | ||||||
| SkyWest, Inc. | 525 | 13,865 | ||||||
|
| |||||||
| 179,663 | ||||||||
|
| |||||||
| Auto Components - 1.4% | ||||||||
| Cooper Tire & Rubber Co. | 576 | 21,899 | ||||||
| Cooper-Standard Holding, Inc. * | 845 | 83,486 | ||||||
| Dorman Products, Inc. * | 381 | 24,346 | ||||||
| Drew Industries, Inc. | 1,251 | 122,623 | ||||||
| Fox Factory Holding Corp. * | 779 | 17,894 | ||||||
| Gentherm, Inc. * | 1,057 | 33,211 | ||||||
| Horizon Global Corp. * | 493 | 9,825 | ||||||
| Motorcar Parts of America, Inc. * | 1,306 | 37,587 | ||||||
| Spartan Motors, Inc. | 1,194 | 11,439 | ||||||
| Standard Motor Products, Inc. | 641 | 30,614 | ||||||
| Superior Industries International, Inc. | 1,403 | 40,911 | ||||||
| Tenneco, Inc. * | 373 | 21,735 | ||||||
| Tower International, Inc. | 753 | 18,147 | ||||||
|
| |||||||
| 473,717 | ||||||||
|
| |||||||
| Banks - 7.5% | ||||||||
| Ameris Bancorp | 2,004 | 70,040 | ||||||
| Banc of California, Inc. | 1,710 | 29,857 | ||||||
| Banner Corp. | 455 | 19,902 | ||||||
| Blue Hills Bancorp, Inc. | 1,200 | 18,024 | ||||||
| BNC Bancorp | 2,186 | 53,164 | ||||||
| Boston Private Financial Holdings, Inc. | 1,225 | 15,717 | ||||||
| Capital Bank Financial Corp., Class A | 4,049 | 130,013 | ||||||
| Cathay General Bancorp | 1,774 | 54,604 | ||||||
| Central Pacific Financial Corp. | 835 | 21,034 | ||||||
| Chemical Financial Corp. | 462 | 20,388 | ||||||
| ConnectOne Bancorp, Inc. | 900 | 16,254 | ||||||
| Customers Bancorp, Inc. * | 2,023 | 50,899 | ||||||
| CVB Financial Corp. | 1,182 | 20,815 | ||||||
| Eagle Bancorp, Inc. * | 2,446 | 120,661 | ||||||
| Enterprise Financial Services Corp. | 957 | 29,906 | ||||||
| INVESTMENTS | SHARES | VALUE | ||||||
| Banks - 7.5% (continued) | ||||||||
| FCB Financial Holdings, Inc., Class A * | 2,790 | $ | 107,220 | |||||
| Fidelity Southern Corp. | 1,125 | 20,689 | ||||||
| First Interstate BancSystem, Inc., Class A | 3,438 | 108,331 | ||||||
| First Merchants Corp. | 654 | 17,494 | ||||||
| Fulton Financial Corp. | 3,338 | 48,468 | ||||||
| Great Western Bancorp, Inc. | 4,016 | 133,813 | ||||||
| Hanmi Financial Corp. | 1,300 | 34,242 | ||||||
| Hilltop Holdings, Inc. * | 800 | 17,968 | ||||||
| Home BancShares, Inc. | 7,534 | 156,783 | ||||||
| Independent Bank Corp./MA | 741 | 40,081 | ||||||
| Independent Bank Corp./MI | 1,815 | 30,546 | ||||||
| Independent Bank Group, Inc. | 300 | 13,251 | ||||||
| Investors Bancorp, Inc. | 12,491 | 150,017 | ||||||
| Lakeland Financial Corp. | 1,783 | 63,154 | ||||||
| LegacyTexas Financial Group, Inc. | 492 | 15,562 | ||||||
| MB Financial, Inc. | 627 | 23,851 | ||||||
| National Bank Holdings Corp., Class A | 1,472 | 34,401 | ||||||
| Opus Bank | 1,958 | 69,254 | ||||||
| Pacific Premier Bancorp, Inc. * | 840 | 22,226 | ||||||
| Pinnacle Financial Partners, Inc. | 2,089 | 112,973 | ||||||
| Preferred Bank | 366 | 13,084 | ||||||
| Renasant Corp. | 1,210 | 40,692 | ||||||
| Seacoast Banking Corp. of Florida * | 1,142 | 18,375 | ||||||
| ServisFirst Bancshares, Inc. | 2,855 | 148,203 | ||||||
| Simmons First National Corp., Class A | 600 | 29,940 | ||||||
| South State Corp. | 674 | 50,577 | ||||||
| Southside Bancshares, Inc. | 882 | 28,383 | ||||||
| State Bank Financial Corp. | 950 | 21,679 | ||||||
| Stonegate Bank | 1,807 | 60,986 | ||||||
| Towne Bank | 1,494 | 35,901 | ||||||
| United Community Banks, Inc. | 3,125 | 65,687 | ||||||
| Webster Financial Corp. | 725 | 27,557 | ||||||
| WesBanco, Inc. | 352 | 11,574 | ||||||
| Wintrust Financial Corp. | 1,032 | 57,348 | ||||||
|
| |||||||
| 2,501,588 | ||||||||
|
| |||||||
| Beverages - 0.8% | ||||||||
| Boston Beer Co., Inc. (The), Class A * | 72 | 11,179 | ||||||
| Coca-Cola Bottling Co. Consolidated | 491 | 72,746 | ||||||
| Craft Brew Alliance, Inc. * | 514 | 9,679 | ||||||
| MGP Ingredients, Inc. | 1,119 | 45,342 | ||||||
| National Beverage Corp. *(a) | 2,583 | 113,781 | ||||||
| Primo Water Corp. * | 1,330 | 16,133 | ||||||
|
| |||||||
| 268,860 | ||||||||
|
| |||||||
| Biotechnology - 3.3% | ||||||||
| Acceleron Pharma, Inc. * | 315 | 11,400 | ||||||
| Adamas Pharmaceuticals, Inc. *(a) | 757 | 12,422 | ||||||
| Agenus, Inc. * | 3,037 | 21,806 | ||||||
| Alder Biopharmaceuticals, Inc. * | 741 | 24,283 | ||||||
| ARIAD Pharmaceuticals, Inc. * | 2,295 | 31,418 | ||||||
| BioSpecifics Technologies Corp. * | 296 | 13,518 | ||||||
| Cara Therapeutics, Inc. *(a) | 1,902 | 15,882 | ||||||
| Coherus Biosciences, Inc. *(a) | 650 | 17,407 | ||||||
| Concert Pharmaceuticals, Inc. * | 1,751 | 17,703 | ||||||
| CTI BioPharma Corp. * | 3,700 | 1,385 | ||||||
| Eagle Pharmaceuticals, Inc. *(a) | 509 | 35,630 | ||||||
| Emergent BioSolutions, Inc. * | 500 | 15,765 | ||||||
| Exelixis, Inc. * | 8,858 | 113,294 | ||||||
| The accompanying notes are an integral part of these financial statements. | (Continued) |
| AQR Funds | Annual Report | September 2016 | ||||||||||||||
121
| Schedule of Investments | September 30, 2016 |
| AQR TM SMALL CAP MOMENTUM STYLE FUND |
| INVESTMENTS | SHARES | VALUE | ||||||
| Biotechnology - 3.3% (continued) | ||||||||
| Five Prime Therapeutics, Inc. * | 1,409 | $ | 73,958 | |||||
| Genomic Health, Inc. * | 455 | 13,159 | ||||||
| Ignyta, Inc. * | 2,127 | 13,379 | ||||||
| Inovio Pharmaceuticals, Inc. *(a) | 2,423 | 22,582 | ||||||
| Insmed, Inc. * | 890 | 12,923 | ||||||
| Ironwood Pharmaceuticals, Inc. * | 1,229 | 19,516 | ||||||
| Lexicon Pharmaceuticals, Inc. *(a) | 3,291 | 59,468 | ||||||
| Ligand Pharmaceuticals, Inc. *(a) | 661 | 67,462 | ||||||
| Lion Biotechnologies, Inc. *(a) | 1,693 | 13,933 | ||||||
| Loxo Oncology, Inc. * | 959 | 25,107 | ||||||
| MiMedx Group, Inc. *(a) | 2,791 | 23,947 | ||||||
| Minerva Neurosciences, Inc. *(a) | 2,132 | 30,093 | ||||||
| Myriad Genetics, Inc. * | 1,348 | 27,742 | ||||||
| Ophthotech Corp. * | 298 | 13,747 | ||||||
| Peregrine Pharmaceuticals, Inc. * | 9,591 | 4,124 | ||||||
| Progenics Pharmaceuticals, Inc. * | 3,435 | 21,743 | ||||||
| Prothena Corp. plc (Ireland) * | 805 | 48,276 | ||||||
| Repligen Corp. * | 1,200 | 36,228 | ||||||
| Retrophin, Inc. * | 1,201 | 26,878 | ||||||
| Sarepta Therapeutics, Inc. * | 521 | 31,995 | ||||||
| TESARO, Inc. * | 1,168 | 117,080 | ||||||
| Trevena, Inc. * | 1,935 | 13,061 | ||||||
| Ultragenyx Pharmaceutical, Inc. * | 173 | 12,273 | ||||||
| Xencor, Inc. * | 1,298 | 31,788 | ||||||
|
| |||||||
| 1,092,375 | ||||||||
|
| |||||||
| Building Products - 2.0% | ||||||||
| AAON, Inc. | 1,050 | 30,261 | ||||||
| Advanced Drainage Systems, Inc. | 848 | 20,403 | ||||||
| American Woodmark Corp. * | 564 | 45,442 | ||||||
| Apogee Enterprises, Inc. | 791 | 35,350 | ||||||
| Builders FirstSource, Inc. * | 1,831 | 21,075 | ||||||
| Continental Building Products, Inc. * | 1,526 | 32,031 | ||||||
| Gibraltar Industries, Inc. * | 1,956 | 72,665 | ||||||
| Insteel Industries, Inc. | 1,596 | 57,839 | ||||||
| Masonite International Corp. * | 1,077 | 66,957 | ||||||
| NCI Building Systems, Inc. * | 1,241 | 18,106 | ||||||
| Patrick Industries, Inc. * | 2,206 | 136,596 | ||||||
| PGT, Inc. * | 881 | 9,400 | ||||||
| Ply Gem Holdings, Inc. * | 822 | 10,982 | ||||||
| Trex Co., Inc. * | 402 | 23,605 | ||||||
| Universal Forest Products, Inc. | 890 | 87,656 | ||||||
|
| |||||||
| 668,368 | ||||||||
|
| |||||||
| Capital Markets - 0.4% | ||||||||
| BGC Partners, Inc., Class A | 6,967 | 60,961 | ||||||
| Cowen Group, Inc., Class A *(a) | 3,463 | 12,571 | ||||||
| GAIN Capital Holdings, Inc. | 1,922 | 11,878 | ||||||
| GAMCO Investors, Inc., Class A | 344 | 9,794 | ||||||
| Investment Technology Group, Inc. | 682 | 11,689 | ||||||
| Janus Capital Group, Inc. | 800 | 11,208 | ||||||
| KCG Holdings, Inc., Class A * | 843 | 13,092 | ||||||
|
| |||||||
| 131,193 | ||||||||
|
| |||||||
| Chemicals - 1.4% | ||||||||
| A Schulman, Inc. | 500 | 14,560 | ||||||
| Chemours Co. (The) | 2,336 | 37,376 | ||||||
| Ferro Corp. * | 2,400 | 33,144 | ||||||
| FutureFuel Corp. | 1,187 | 13,389 | ||||||
| INVESTMENTS | SHARES | VALUE | ||||||
| Chemicals - 1.4% (continued) | ||||||||
| Innophos Holdings, Inc. | 300 | $ | 11,709 | |||||
| Innospec, Inc. | 332 | 20,189 | ||||||
| Koppers Holdings, Inc. * | 325 | 10,459 | ||||||
| Kraton Performance Polymers, Inc. * | 754 | 26,420 | ||||||
| Minerals Technologies, Inc. | 500 | 35,345 | ||||||
| Sensient Technologies Corp. | 1,100 | 83,380 | ||||||
| Stepan Co. | 220 | 15,985 | ||||||
| Trinseo SA | 2,822 | 159,612 | ||||||
|
| |||||||
| 461,568 | ||||||||
|
| |||||||
| Commercial Services & Supplies - 0.9% | ||||||||
| ACCO Brands Corp. * | 1,709 | 16,475 | ||||||
| Brady Corp., Class A | 570 | 19,727 | ||||||
| Deluxe Corp. | 267 | 17,841 | ||||||
| Healthcare Services Group, Inc. | 976 | 38,630 | ||||||
| HNI Corp. | 700 | 27,860 | ||||||
| Interface, Inc. | 687 | 11,466 | ||||||
| Kimball International, Inc., Class B | 1,371 | 17,741 | ||||||
| Mobile Mini, Inc. | 427 | 12,895 | ||||||
| Multi-Color Corp. | 444 | 29,304 | ||||||
| Quad/Graphics, Inc. | 1,501 | 40,107 | ||||||
| Steelcase, Inc., Class A | 1,047 | 14,543 | ||||||
| UniFirst Corp. | 100 | 13,186 | ||||||
| US Ecology, Inc. | 349 | 15,649 | ||||||
| West Corp. | 1,102 | 24,332 | ||||||
|
| |||||||
| 299,756 | ||||||||
|
| |||||||
| Communications Equipment - 2.3% | ||||||||
| ADTRAN, Inc. | 734 | 14,049 | ||||||
| Applied Optoelectronics, Inc. *(a) | 846 | 18,790 | ||||||
| Ciena Corp. * | 1,152 | 25,114 | ||||||
| Extreme Networks, Inc. * | 3,048 | 13,685 | ||||||
| Finisar Corp. * | 1,932 | 57,574 | ||||||
| Infinera Corp. * | 1,115 | 10,068 | ||||||
| InterDigital, Inc. | 800 | 63,360 | ||||||
| Lumentum Holdings, Inc. * | 3,227 | 134,792 | ||||||
| NETGEAR, Inc. * | 842 | 50,933 | ||||||
| Oclaro, Inc. * | 11,213 | 95,871 | ||||||
| Plantronics, Inc. | 393 | 20,420 | ||||||
| Ubiquiti Networks, Inc. * | 3,286 | 175,801 | ||||||
| ViaSat, Inc. * | 1,042 | 77,785 | ||||||
|
| |||||||
| 758,242 | ||||||||
|
| |||||||
| Construction & Engineering - 1.0% | ||||||||
| Argan, Inc. | 730 | 43,209 | ||||||
| Comfort Systems USA, Inc. | 1,346 | 39,451 | ||||||
| Dycom Industries, Inc. * | 1,337 | 109,340 | ||||||
| Granite Construction, Inc. | 465 | 23,129 | ||||||
| HC2 Holdings, Inc. *(a) | 962 | 5,243 | ||||||
| MasTec, Inc. * | 2,344 | 69,710 | ||||||
| NV5 Global, Inc. * | 1,032 | 33,344 | ||||||
| Primoris Services Corp. | 715 | 14,729 | ||||||
|
| |||||||
| 338,155 | ||||||||
|
| |||||||
| Construction Materials - 0.3% | ||||||||
| Headwaters, Inc. * | 2,139 | 36,192 | ||||||
| US Concrete, Inc. * | 1,646 | 75,823 | ||||||
|
| |||||||
| 112,015 | ||||||||
|
| |||||||
| The accompanying notes are an integral part of these financial statements. | (Continued) |
| AQR Funds | Annual Report | September 2016 | ||||||||||||||
122
| Schedule of Investments | September 30, 2016 |
| AQR TM SMALL CAP MOMENTUM STYLE FUND |
| INVESTMENTS | SHARES | VALUE | ||||||
| Consumer Finance - 0.0% (b) | ||||||||
| Nelnet, Inc., Class A | 400 | $ | 16,148 | |||||
|
| |||||||
| Containers & Packaging - 0.0% (b) | ||||||||
| Greif, Inc., Class A | 334 | 16,563 | ||||||
|
| |||||||
| Distributors - 0.2% | ||||||||
| Core-Mark Holding Co., Inc. | 2,000 | 71,600 | ||||||
|
| |||||||
| Diversified Consumer Services - 1.1% | ||||||||
| Bright Horizons Family Solutions, Inc. * | 2,896 | 193,713 | ||||||
| Capella Education Co. | 200 | 11,608 | ||||||
| Career Education Corp. * | 1,909 | 12,962 | ||||||
| Carriage Services, Inc. | 552 | 13,055 | ||||||
| Chegg, Inc. *(a) | 2,968 | 21,043 | ||||||
| Grand Canyon Education, Inc. * | 538 | 21,730 | ||||||
| Houghton Mifflin Harcourt Co. * | 1,697 | 22,757 | ||||||
| LifeLock, Inc. * | 3,144 | 53,197 | ||||||
| Weight Watchers International, Inc. *(a) | 1,329 | 13,715 | ||||||
|
| |||||||
| 363,780 | ||||||||
|
| |||||||
| Diversified Telecommunication Services - 1.1% | ||||||||
| Atlantic Tele-Network, Inc. | 181 | 11,772 | ||||||
| Cogent Communications Holdings, Inc. | 1,010 | 37,178 | ||||||
| Consolidated Communications Holdings, Inc. | 1,600 | 40,384 | ||||||
| IDT Corp., Class B | 755 | 13,016 | ||||||
| Inteliquent, Inc. | 1,436 | 23,177 | ||||||
| Iridium Communications, Inc. *(a) | 2,656 | 21,540 | ||||||
| Lumos Networks Corp. * | 1,202 | 16,828 | ||||||
| ORBCOMM, Inc. * | 3,221 | 33,016 | ||||||
| Straight Path Communications, Inc., Class B * | 1,332 | 34,113 | ||||||
| Vonage Holdings Corp. * | 2,700 | 17,847 | ||||||
| Windstream Holdings, Inc. (a) | 12,265 | 123,263 | ||||||
|
| |||||||
| 372,134 | ||||||||
|
| |||||||
| Electric Utilities - 2.5% | ||||||||
| ALLETE, Inc. | 1,004 | 59,858 | ||||||
| El Paso Electric Co. | 1,222 | 57,153 | ||||||
| IDACORP, Inc. | 3,091 | 241,964 | ||||||
| MGE Energy, Inc. | 1,275 | 72,050 | ||||||
| Otter Tail Corp. | 739 | 25,562 | ||||||
| PNM Resources, Inc. | 4,394 | 143,772 | ||||||
| Portland General Electric Co. | 2,916 | 124,192 | ||||||
| Spark Energy, Inc., Class A | 3,790 | 110,403 | ||||||
|
| |||||||
| 834,954 | ||||||||
|
| |||||||
| Electrical Equipment - 0.3% | ||||||||
| Allied Motion Technologies, Inc. | 729 | 13,785 | ||||||
| AZZ, Inc. | 300 | 19,581 | ||||||
| Energous Corp. *(a) | 1,752 | 34,357 | ||||||
| EnerSys | 213 | 14,737 | ||||||
| Generac Holdings, Inc. * | 495 | 17,969 | ||||||
|
| |||||||
| 100,429 | ||||||||
|
| |||||||
| Electronic Equipment, Instruments & Components - 3.2% | ||||||||
| Badger Meter, Inc. | 936 | 31,365 | ||||||
| Coherent, Inc. * | 1,260 | 139,280 | ||||||
| CTS Corp. | 722 | 13,429 | ||||||
| ePlus, Inc. * | 336 | 31,722 | ||||||
| Fabrinet (Thailand) * | 3,118 | 139,032 | ||||||
| INVESTMENTS | SHARES | VALUE | ||||||
| Electronic Equipment, Instruments & Components - 3.2% (continued) | ||||||||
| Insight Enterprises, Inc. * | 700 | $ | 22,785 | |||||
| Itron, Inc. * | 370 | 20,631 | ||||||
| Littelfuse, Inc. | 761 | 98,024 | ||||||
| Mesa Laboratories, Inc. | 432 | 49,404 | ||||||
| Methode Electronics, Inc. | 887 | 31,018 | ||||||
| OSI Systems, Inc. * | 393 | 25,694 | ||||||
| Plexus Corp. * | 600 | 28,068 | ||||||
| Rogers Corp. * | 300 | 18,324 | ||||||
| Sanmina Corp. * | 1,891 | 53,837 | ||||||
| SYNNEX Corp. | 1,105 | 126,092 | ||||||
| Tech Data Corp. * | 1,035 | 87,675 | ||||||
| TTM Technologies, Inc. * | 1,385 | 15,858 | ||||||
| Universal Display Corp. * | 2,244 | 124,565 | ||||||
|
| |||||||
| 1,056,803 | ||||||||
|
| |||||||
| Energy Equipment & Services - 0.9% | ||||||||
| Fairmount Santrol Holdings, Inc. * | 6,146 | 52,118 | ||||||
| Forum Energy Technologies, Inc. * | 1,722 | 34,199 | ||||||
| Matrix Service Co. * | 700 | 13,132 | ||||||
| Natural Gas Services Group, Inc. * | 490 | 12,049 | ||||||
| Oil States International, Inc. * | 621 | 19,605 | ||||||
| TETRA Technologies, Inc. * | 2,864 | 17,499 | ||||||
| US Silica Holdings, Inc. | 3,194 | 148,713 | ||||||
|
| |||||||
| 297,315 | ||||||||
|
| |||||||
| Equity Real Estate Investment Trusts (REITs) - 9.2% | ||||||||
| Acadia Realty Trust | 1,244 | 45,083 | ||||||
| Agree Realty Corp. | 1,901 | 93,985 | ||||||
| American Assets Trust, Inc. | 1,609 | 69,798 | ||||||
| Armada Hoffler Properties, Inc. | 3,235 | 43,349 | ||||||
| Bluerock Residential Growth REIT, Inc. | 1,167 | 15,171 | ||||||
| Cedar Realty Trust, Inc. | 1,989 | 14,321 | ||||||
| Chatham Lodging Trust | 1,226 | 23,601 | ||||||
| Community Healthcare Trust, Inc. | 554 | 12,144 | ||||||
| CoreSite Realty Corp. | 2,561 | 189,616 | ||||||
| DuPont Fabros Technology, Inc. | 4,087 | 168,589 | ||||||
| Easterly Government Properties, Inc. | 1,705 | 32,531 | ||||||
| EastGroup Properties, Inc. | 329 | 24,201 | ||||||
| Education Realty Trust, Inc. | 2,892 | 124,761 | ||||||
| First Industrial Realty Trust, Inc. | 3,246 | 91,602 | ||||||
| GEO Group, Inc. (The) | 1,257 | 29,891 | ||||||
| Gladstone Commercial Corp. | 2,247 | 41,862 | ||||||
| Government Properties Income Trust | 1,140 | 25,787 | ||||||
| Healthcare Realty Trust, Inc. | 4,365 | 148,672 | ||||||
| Hersha Hospitality Trust | 1,090 | 19,642 | ||||||
| Hudson Pacific Properties, Inc. | 2,666 | 87,631 | ||||||
| Independence Realty Trust, Inc. | 1,033 | 9,297 | ||||||
| LTC Properties, Inc. | 450 | 23,396 | ||||||
| Mack-Cali Realty Corp. | 2,589 | 70,473 | ||||||
| Monmouth Real Estate Investment Corp. | 2,217 | 31,637 | ||||||
| Monogram Residential Trust, Inc. | 1,490 | 15,854 | ||||||
| National Health Investors, Inc. | 336 | 26,369 | ||||||
| National Storage Affiliates Trust | 4,712 | 98,669 | ||||||
| NexPoint Residential Trust, Inc. | 2,537 | 49,877 | ||||||
| Physicians Realty Trust | 4,602 | 99,127 | ||||||
| Preferred Apartment Communities, Inc. | 1,161 | 15,685 | ||||||
| PS Business Parks, Inc. | 1,917 | 217,714 | ||||||
| QTS Realty Trust, Inc., Class A | 4,410 | 233,069 | ||||||
| Ramco-Gershenson Properties Trust | 1,967 | 36,862 | ||||||
| The accompanying notes are an integral part of these financial statements. | (Continued) |
| AQR Funds | Annual Report | September 2016 | ||||||||||||||
123
| Schedule of Investments | September 30, 2016 |
| AQR TM SMALL CAP MOMENTUM STYLE FUND |
| INVESTMENTS | SHARES | VALUE | ||||||
| Equity Real Estate Investment Trusts (REITs) - 9.2% (continued) | ||||||||
| Retail Opportunity Investments Corp. | 6,692 | $ | 146,956 | |||||
| Rexford Industrial Realty, Inc. | 3,724 | 85,242 | ||||||
| Ryman Hospitality Properties, Inc. | 1,068 | 51,435 | ||||||
| Sabra Health Care REIT, Inc. | 554 | 13,950 | ||||||
| Saul Centers, Inc. | 346 | 23,044 | ||||||
| Select Income REIT | 2,029 | 54,580 | ||||||
| Seritage Growth Properties, Class A (a) | 596 | 30,205 | ||||||
| Silver Bay Realty Trust Corp. | 889 | 15,584 | ||||||
| STAG Industrial, Inc. | 2,175 | 53,309 | ||||||
| Summit Hotel Properties, Inc. | 2,178 | 28,663 | ||||||
| Terreno Realty Corp. | 1,883 | 51,801 | ||||||
| Tier REIT, Inc. | 928 | 14,328 | ||||||
| UMH Properties, Inc. | 984 | 11,729 | ||||||
| Universal Health Realty Income Trust | 283 | 17,835 | ||||||
| Urban Edge Properties | 6,389 | 179,786 | ||||||
| Urstadt Biddle Properties, Inc., Class A | 1,210 | 26,886 | ||||||
| Washington REIT | 1,600 | 49,792 | ||||||
| Whitestone REIT | 1,052 | 14,602 | ||||||
|
| |||||||
| 3,099,993 | ||||||||
|
| |||||||
| Food & Staples Retailing - 0.1% | ||||||||
| Ingles Markets, Inc., Class A | 500 | 19,770 | ||||||
| SpartanNash Co. | 755 | 21,835 | ||||||
|
| |||||||
| 41,605 | ||||||||
|
| |||||||
| Food Products - 2.5% | ||||||||
| B&G Foods, Inc. | 2,303 | 113,262 | ||||||
| Calavo Growers, Inc. | 300 | 19,629 | ||||||
| Cal-Maine Foods, Inc. (a) | 2,449 | 94,384 | ||||||
| Fresh Del Monte Produce, Inc. | 2,090 | 125,191 | ||||||
| J&J Snack Foods Corp. | 693 | 82,550 | ||||||
| John B. Sanfilippo & Son, Inc. | 726 | 37,266 | ||||||
| Lancaster Colony Corp. | 1,371 | 181,095 | ||||||
| Omega Protein Corp. * | 853 | 19,935 | ||||||
| Sanderson Farms, Inc. | 886 | 85,348 | ||||||
| Snyder’s-Lance, Inc. | 1,947 | 65,380 | ||||||
|
| |||||||
| 824,040 | ||||||||
|
| |||||||
| Gas Utilities - 3.0% | ||||||||
| Chesapeake Utilities Corp. | 933 | 56,969 | ||||||
| New Jersey Resources Corp. | 2,436 | 80,047 | ||||||
| Northwest Natural Gas Co. | 500 | 30,055 | ||||||
| ONE Gas, Inc. | 6,012 | 371,782 | ||||||
| Southwest Gas Corp. | 1,312 | 91,656 | ||||||
| Spire, Inc. | 2,759 | 175,859 | ||||||
| WGL Holdings, Inc. | 3,253 | 203,963 | ||||||
|
| |||||||
| 1,010,331 | ||||||||
|
| |||||||
| Health Care Equipment & Supplies - 3.7% | ||||||||
| Abaxis, Inc. | 657 | 33,914 | ||||||
| Analogic Corp. | 156 | 13,822 | ||||||
| Anika Therapeutics, Inc. * | 794 | 37,993 | ||||||
| AtriCure, Inc. * | 800 | 12,656 | ||||||
| AxoGen, Inc. * | 2,114 | 19,089 | ||||||
| Cantel Medical Corp. | 1,202 | 93,732 | ||||||
| Cerus Corp. * | 3,201 | 19,878 | ||||||
| CONMED Corp. | 500 | 20,030 | ||||||
| Cynosure, Inc., Class A * | 663 | 33,773 | ||||||
| GenMark Diagnostics, Inc. * | 1,549 | 18,278 | ||||||
| INVESTMENTS | SHARES | VALUE | ||||||
| Health Care Equipment & Supplies - 3.7% (continued) | ||||||||
| Glaukos Corp. * | 316 | $ | 11,926 | |||||
| Globus Medical, Inc., Class A * | 1,783 | 40,242 | ||||||
| ICU Medical, Inc. * | 559 | 70,646 | ||||||
| Inogen, Inc. * | 1,479 | 88,592 | ||||||
| Integra LifeSciences Holdings Corp. * | 853 | 70,415 | ||||||
| iRadimed Corp. *(a) | 1,697 | 28,832 | ||||||
| K2M Group Holdings, Inc. * | 1,170 | 20,803 | ||||||
| Masimo Corp. * | 819 | 48,722 | ||||||
| Merit Medical Systems, Inc. * | 612 | 14,866 | ||||||
| Natus Medical, Inc. * | 1,478 | 58,071 | ||||||
| Neogen Corp. * | 480 | 26,851 | ||||||
| Nevro Corp. *(a) | 1,853 | 193,435 | ||||||
| NuVasive, Inc. * | 896 | 59,727 | ||||||
| NxStage Medical, Inc. * | 1,351 | 33,762 | ||||||
| Penumbra, Inc. * | 126 | 9,575 | ||||||
| Rockwell Medical, Inc. *(a) | 1,724 | 11,551 | ||||||
| Spectranetics Corp. (The) * | 1,257 | 31,538 | ||||||
| Vascular Solutions, Inc. * | 769 | 37,089 | ||||||
| Zeltiq Aesthetics, Inc. * | 2,063 | 80,911 | ||||||
|
| |||||||
| 1,240,719 | ||||||||
|
| |||||||
| Health Care Providers & Services - 2.1% | ||||||||
| Aceto Corp. | 1,044 | 19,825 | ||||||
| Addus HomeCare Corp. * | 1,246 | 32,595 | ||||||
| Adeptus Health, Inc., Class A *(a) | 300 | 12,915 | ||||||
| Amedisys, Inc. * | 745 | 35,343 | ||||||
| AMN Healthcare Services, Inc. * | 1,210 | 38,563 | ||||||
| BioTelemetry, Inc. * | 1,700 | 31,569 | ||||||
| Chemed Corp. | 500 | 70,535 | ||||||
| Civitas Solutions, Inc. * | 958 | 17,493 | ||||||
| CorVel Corp. * | 404 | 15,514 | ||||||
| Cross Country Healthcare, Inc. * | 1,400 | 16,492 | ||||||
| Diplomat Pharmacy, Inc. * | 946 | 26,497 | ||||||
| Ensign Group, Inc. (The) | 2,000 | 40,260 | ||||||
| HealthEquity, Inc. * | 1,812 | 68,584 | ||||||
| Healthways, Inc. * | 1,200 | 31,752 | ||||||
| LHC Group, Inc. * | 287 | 10,585 | ||||||
| Molina Healthcare, Inc. * | 681 | 39,716 | ||||||
| Owens & Minor, Inc. | 530 | 18,407 | ||||||
| PharMerica Corp. * | 900 | 25,263 | ||||||
| Providence Service Corp. (The) * | 400 | 19,452 | ||||||
| RadNet, Inc. * | 2,500 | 18,500 | ||||||
| Select Medical Holdings Corp. * | 2,344 | 31,644 | ||||||
| Surgical Care Affiliates, Inc. * | 1,146 | 55,879 | ||||||
| US Physical Therapy, Inc. | 280 | 17,556 | ||||||
|
| |||||||
| 694,939 | ||||||||
|
| |||||||
| Health Care Technology - 0.4% | ||||||||
| Evolent Health, Inc. * | 436 | 10,734 | ||||||
| HealthStream, Inc. * | 397 | 10,957 | ||||||
| HMS Holdings Corp. * | 1,510 | 33,477 | ||||||
| Medidata Solutions, Inc. * | 471 | 26,263 | ||||||
| Omnicell, Inc. * | 1,035 | 39,641 | ||||||
| Vocera Communications, Inc. * | 901 | 15,227 | ||||||
|
| |||||||
| 136,299 | ||||||||
|
| |||||||
| Hotels, Restaurants & Leisure - 2.9% | ||||||||
| BJ’s Restaurants, Inc. * | 600 | 21,330 | ||||||
| Boyd Gaming Corp. * | 617 | 12,204 | ||||||
| The accompanying notes are an integral part of these financial statements. | (Continued) |
| AQR Funds | Annual Report | September 2016 | ||||||||||||||
124
| Schedule of Investments | September 30, 2016 |
| AQR TM SMALL CAP MOMENTUM STYLE FUND |
| INVESTMENTS | SHARES | VALUE | ||||||
| Hotels, Restaurants & Leisure - 2.9% (continued) | ||||||||
| Buffalo Wild Wings, Inc. * | 243 | $ | 34,200 | |||||
| Carrols Restaurant Group, Inc. * | 1,505 | 19,881 | ||||||
| Cheesecake Factory, Inc. (The) | 662 | 33,140 | ||||||
| Churchill Downs, Inc. | 372 | 54,442 | ||||||
| Chuy’s Holdings, Inc. * | 1,281 | 35,791 | ||||||
| ClubCorp Holdings, Inc. | 1,646 | 23,818 | ||||||
| Cracker Barrel Old Country Store, Inc. (a) | 949 | 125,477 | ||||||
| Dave & Buster’s Entertainment, Inc. * | 1,370 | 53,677 | ||||||
| Denny’s Corp. * | 2,000 | 21,380 | ||||||
| DineEquity, Inc. | 299 | 23,678 | ||||||
| Eldorado Resorts, Inc. * | 4,258 | 59,867 | ||||||
| Golden Entertainment, Inc. | 1,209 | 15,076 | ||||||
| Jack in the Box, Inc. | 1,015 | 97,379 | ||||||
| Kona Grill, Inc. * | 1,191 | 14,971 | ||||||
| Marriott Vacations Worldwide Corp. | 710 | 52,057 | ||||||
| Papa John’s International, Inc. | 932 | 73,488 | ||||||
| Penn National Gaming, Inc. * | 999 | 13,556 | ||||||
| Planet Fitness, Inc. * | 484 | 9,714 | ||||||
| Popeyes Louisiana Kitchen, Inc. * | 873 | 46,391 | ||||||
| Red Robin Gourmet Burgers, Inc. * | 219 | 9,842 | ||||||
| Ruth’s Hospitality Group, Inc. | 972 | 13,725 | ||||||
| Sonic Corp. | 1,127 | 29,505 | ||||||
| Texas Roadhouse, Inc. | 2,000 | 78,060 | ||||||
| Zoe’s Kitchen, Inc. *(a) | 509 | 11,295 | ||||||
|
| |||||||
| 983,944 | ||||||||
|
| |||||||
| Household Durables - 1.2% | ||||||||
| Bassett Furniture Industries, Inc. | 576 | 13,392 | ||||||
| Cavco Industries, Inc. * | 228 | 22,583 | ||||||
| Helen of Troy Ltd. * | 1,094 | 94,270 | ||||||
| Hooker Furniture Corp. | 465 | 11,388 | ||||||
| Installed Building Products, Inc. * | 1,874 | 67,220 | ||||||
| La-Z-Boy, Inc. | 430 | 10,561 | ||||||
| LGI Homes, Inc. *(a) | 2,476 | 91,216 | ||||||
| NACCO Industries, Inc., Class A | 210 | 14,272 | ||||||
| TopBuild Corp. * | 807 | 26,792 | ||||||
| Universal Electronics, Inc. * | 400 | 29,784 | ||||||
| ZAGG, Inc. * | 1,866 | 15,115 | ||||||
|
| |||||||
| 396,593 | ||||||||
|
| |||||||
| Household Products - 0.5% | ||||||||
| Central Garden & Pet Co., Class A * | 2,551 | 63,265 | ||||||
| Orchids Paper Products Co. | 391 | 10,647 | ||||||
| WD-40 Co. | 734 | 82,523 | ||||||
|
| |||||||
| 156,435 | ||||||||
|
| |||||||
| Insurance - 2.7% | ||||||||
| American Equity Investment Life Holding Co. | 641 | 11,365 | ||||||
| AMERISAFE, Inc. | 907 | 53,313 | ||||||
| Argo Group International Holdings Ltd. | 1,756 | 99,074 | ||||||
| CNO Financial Group, Inc. | 725 | 11,071 | ||||||
| Enstar Group Ltd. * | 626 | 102,958 | ||||||
| FBL Financial Group, Inc., Class A | 241 | 15,417 | ||||||
| Federated National Holding Co. | 2,074 | 38,763 | ||||||
| James River Group Holdings Ltd. | 2,244 | 81,233 | ||||||
| Maiden Holdings Ltd. | 1,054 | 13,375 | ||||||
| National General Holdings Corp. | 1,414 | 31,447 | ||||||
| Navigators Group, Inc. (The) | 383 | 37,120 | ||||||
| Primerica, Inc. (a) | 641 | 33,992 | ||||||
| INVESTMENTS | SHARES | VALUE | ||||||
| Insurance - 2.7% (continued) | ||||||||
| RLI Corp. | 3,035 | $ | 207,473 | |||||
| Selective Insurance Group, Inc. | 415 | 16,542 | ||||||
| Trupanion, Inc. *(a) | 1,445 | 24,421 | ||||||
| United Fire Group, Inc. | 1,284 | 54,339 | ||||||
| United Insurance Holdings Corp. | 2,600 | 44,148 | ||||||
| Universal Insurance Holdings, Inc. | 1,100 | 27,720 | ||||||
|
| |||||||
| 903,771 | ||||||||
|
| |||||||
| Internet & Direct Marketing Retail - 0.7% | ||||||||
| 1-800-Flowers.com, Inc., Class A * | 3,613 | 33,131 | ||||||
| FTD Cos., Inc. * | 500 | 10,285 | ||||||
| Liberty TripAdvisor Holdings, Inc., Class A * | 526 | 11,493 | ||||||
| Nutrisystem, Inc. | 1,800 | 53,442 | ||||||
| Overstock.com, Inc. * | 822 | 12,593 | ||||||
| Wayfair, Inc., Class A *(a) | 2,778 | 109,370 | ||||||
|
| |||||||
| 230,314 | ||||||||
|
| |||||||
| Internet Software & Services - 3.3% | ||||||||
| 2U, Inc. * | 2,833 | 108,476 | ||||||
| Alarm.com Holdings, Inc. *(a) | 1,654 | 47,734 | ||||||
| Benefitfocus, Inc. * | 344 | 13,733 | ||||||
| Brightcove, Inc. * | 762 | 9,944 | ||||||
| Cimpress NV (Netherlands) * | 852 | 86,205 | ||||||
| comScore, Inc. * | 429 | 13,153 | ||||||
| Cornerstone OnDemand, Inc. * | 1,364 | 62,676 | ||||||
| EarthLink Holdings Corp. | 3,871 | 24,000 | ||||||
| Five9, Inc. * | 5,274 | 82,696 | ||||||
| GrubHub, Inc. * | 518 | 22,269 | ||||||
| GTT Communications, Inc. * | 1,035 | 24,354 | ||||||
| Intralinks Holdings, Inc. * | 1,674 | 16,840 | ||||||
| j2 Global, Inc. | 1,431 | 95,319 | ||||||
| LogMeIn, Inc. | 1,151 | 104,039 | ||||||
| MeetMe, Inc. * | 5,647 | 35,011 | ||||||
| MINDBODY, Inc. *(a) | 1,883 | 37,020 | ||||||
| NIC, Inc. | 611 | 14,359 | ||||||
| Q2 Holdings, Inc. * | 1,367 | 39,178 | ||||||
| Quotient Technology, Inc. * | 1,196 | 15,919 | ||||||
| Shutterstock, Inc. * | 402 | 25,607 | ||||||
| SPS Commerce, Inc. * | 593 | 43,532 | ||||||
| Stamps.com, Inc. * | 678 | 64,078 | ||||||
| TrueCar, Inc. * | 1,696 | 16,010 | ||||||
| WebMD Health Corp. * | 1,168 | 58,050 | ||||||
| Xactly Corp. * | 2,301 | 33,871 | ||||||
|
| |||||||
| 1,094,073 | ||||||||
|
| |||||||
| IT Services - 1.7% | ||||||||
| Acxiom Corp. * | 580 | 15,457 | ||||||
| Blackhawk Network Holdings, Inc. * | 2,603 | 78,532 | ||||||
| CACI International, Inc., Class A * | 241 | 24,317 | ||||||
| Cardtronics plc * | 701 | 31,265 | ||||||
| Convergys Corp. | 644 | 19,590 | ||||||
| CSG Systems International, Inc. | 958 | 39,594 | ||||||
| EPAM Systems, Inc. * | 1,851 | 128,293 | ||||||
| ExlService Holdings, Inc. * | 709 | 35,336 | ||||||
| Hackett Group, Inc. (The) | 955 | 15,777 | ||||||
| MAXIMUS, Inc. | 1,347 | 76,186 | ||||||
| Perficient, Inc. * | 546 | 11,002 | ||||||
| PFSweb, Inc. * | 1,190 | 10,627 | ||||||
| Planet Payment, Inc. * | 4,077 | 15,126 | ||||||
| The accompanying notes are an integral part of these financial statements. | (Continued) |
| AQR Funds | Annual Report | September 2016 | ||||||||||||||
125
| Schedule of Investments | September 30, 2016 |
| AQR TM SMALL CAP MOMENTUM STYLE FUND |
| INVESTMENTS | SHARES | VALUE | ||||||
| IT Services - 1.7% (continued) | ||||||||
| Science Applications International Corp. | 573 | $ | 39,749 | |||||
| ServiceSource International, Inc. * | 3,635 | 17,739 | ||||||
| Sykes Enterprises, Inc. * | 541 | 15,218 | ||||||
| Virtusa Corp. * | 479 | 11,822 | ||||||
|
| |||||||
| 585,630 | ||||||||
|
| |||||||
| Leisure Products - 0.4% | ||||||||
| Nautilus, Inc. * | 1,157 | 26,287 | ||||||
| Smith & Wesson Holding Corp. *(a) | 3,307 | 87,933 | ||||||
| Sturm Ruger & Co., Inc. | 583 | 33,674 | ||||||
|
| |||||||
| 147,894 | ||||||||
|
| |||||||
| Life Sciences Tools & Services - 1.1% | ||||||||
| Accelerate Diagnostics, Inc. * | 1,539 | 41,953 | ||||||
| Cambrex Corp. * | 1,200 | 53,352 | ||||||
| INC Research Holdings, Inc., Class A * | 1,874 | 83,543 | ||||||
| NeoGenomics, Inc. * | 2,416 | 19,860 | ||||||
| Pacific Biosciences of California, Inc. * | 3,390 | 30,374 | ||||||
| PAREXEL International Corp. * | 228 | 15,835 | ||||||
| PRA Health Sciences, Inc. * | 2,187 | 123,587 | ||||||
|
| |||||||
| 368,504 | ||||||||
|
| |||||||
| Machinery - 2.5% | ||||||||
| Alamo Group, Inc. | 196 | 12,914 | ||||||
| Albany International Corp., Class A | 329 | 13,943 | ||||||
| Astec Industries, Inc. | 509 | 30,474 | ||||||
| Briggs & Stratton Corp. | 731 | 13,633 | ||||||
| CIRCOR International, Inc. | 296 | 17,630 | ||||||
| Douglas Dynamics, Inc. | 969 | 30,950 | ||||||
| Energy Recovery, Inc. *(a) | 4,304 | 68,778 | ||||||
| EnPro Industries, Inc. | 400 | 22,728 | ||||||
| Federal Signal Corp. | 2,000 | 26,520 | ||||||
| Global Brass & Copper Holdings, Inc. | 3,107 | 89,761 | ||||||
| Hyster-Yale Materials Handling, Inc. | 348 | 20,925 | ||||||
| John Bean Technologies Corp. | 1,269 | 89,528 | ||||||
| Kadant, Inc. | 253 | 13,184 | ||||||
| Lydall, Inc. * | 1,067 | 54,556 | ||||||
| Manitowoc Co., Inc. (The) | 3,099 | 14,844 | ||||||
| Mueller Industries, Inc. | 332 | 10,763 | ||||||
| Mueller Water Products, Inc., Class A | 5,126 | 64,331 | ||||||
| NN, Inc. | 927 | 16,918 | ||||||
| Proto Labs, Inc. *(a) | 223 | 13,360 | ||||||
| RBC Bearings, Inc. * | 181 | 13,843 | ||||||
| SPX Corp. * | 500 | 10,070 | ||||||
| Standex International Corp. | 358 | 33,248 | ||||||
| Supreme Industries, Inc., Class A | 2,661 | 51,357 | ||||||
| Tennant Co. | 497 | 32,206 | ||||||
| Watts Water Technologies, Inc., Class A | 425 | 27,557 | ||||||
| Woodward, Inc. | 689 | 43,049 | ||||||
|
| |||||||
| 837,070 | ||||||||
|
| |||||||
| Media - 0.8% | ||||||||
| AMC Entertainment Holdings, Inc., Class A | 1,870 | 58,138 | ||||||
| Entravision Communications Corp., Class A | 2,467 | 18,823 | ||||||
| EW Scripps Co. (The), Class A * | 1,235 | 19,637 | ||||||
| Gray Television, Inc. * | 2,135 | 22,119 | ||||||
| IMAX Corp. * | 891 | 25,812 | ||||||
| MDC Partners, Inc., Class A | 944 | 10,120 | ||||||
| New Media Investment Group, Inc. | 1,547 | 23,978 | ||||||
| INVESTMENTS | SHARES | VALUE | ||||||
| Media - 0.8% (continued) | ||||||||
| Nexstar Broadcasting Group, Inc., Class A (a) | 356 | $ | 20,545 | |||||
| Sinclair Broadcast Group, Inc., Class A | 1,581 | 45,659 | ||||||
| World Wrestling Entertainment, Inc., Class A | 1,183 | 25,198 | ||||||
|
| |||||||
| 270,029 | ||||||||
|
| |||||||
| Metals & Mining - 2.1% | ||||||||
| AK Steel Holding Corp. *(a) | 13,801 | 66,659 | ||||||
| Cliffs Natural Resources, Inc. * | 10,885 | 63,677 | ||||||
| Coeur Mining, Inc. * | 11,540 | 136,518 | ||||||
| Gold Resource Corp. | 2,912 | 21,607 | ||||||
| Hecla Mining Co. | 21,631 | 123,297 | ||||||
| Kaiser Aluminum Corp. | 1,173 | 101,453 | ||||||
| Olympic Steel, Inc. | 1,375 | 30,387 | ||||||
| Ryerson Holding Corp. * | 3,147 | 35,530 | ||||||
| Stillwater Mining Co. * | 880 | 11,757 | ||||||
| Worthington Industries, Inc. | 2,039 | 97,933 | ||||||
|
| |||||||
| 688,818 | ||||||||
|
| |||||||
| Multiline Retail - 0.2% | ||||||||
| Big Lots, Inc. | 872 | 41,638 | ||||||
| Ollie’s Bargain Outlet Holdings, Inc. * | 682 | 17,875 | ||||||
|
| |||||||
| 59,513 | ||||||||
|
| |||||||
| Multi-Utilities - 1.4% | ||||||||
| Avista Corp. | 3,301 | 137,949 | ||||||
| Black Hills Corp. | 2,167 | 132,664 | ||||||
| NorthWestern Corp. | 2,792 | 160,624 | ||||||
| Unitil Corp. | 962 | 37,575 | ||||||
|
| |||||||
| 468,812 | ||||||||
|
| |||||||
| Oil, Gas & Consumable Fuels - 1.9% | ||||||||
| Bill Barrett Corp. * | 3,054 | 16,980 | ||||||
| Callon Petroleum Co. * | 10,288 | 161,522 | ||||||
| Green Plains, Inc. | 616 | 16,139 | ||||||
| Matador Resources Co. * | 1,561 | 37,995 | ||||||
| Nordic American Tankers Ltd. (a) | 1,290 | 13,042 | ||||||
| Pacific Ethanol, Inc. * | 900 | 6,219 | ||||||
| Par Pacific Holdings, Inc. * | 908 | 11,877 | ||||||
| PDC Energy, Inc. * | 1,807 | 121,177 | ||||||
| REX American Resources Corp. * | 300 | 25,428 | ||||||
| RSP Permian, Inc. * | 5,241 | 203,246 | ||||||
| Sanchez Energy Corp. * | 1,547 | 13,675 | ||||||
| Ship Finance International Ltd. (Norway) (a) | 1,000 | 14,730 | ||||||
|
| |||||||
| 642,030 | ||||||||
|
| |||||||
| Paper & Forest Products - 0.2% | ||||||||
| Clearwater Paper Corp. * | 200 | 12,934 | ||||||
| Louisiana-Pacific Corp. * | 2,967 | 55,869 | ||||||
| PH Glatfelter Co. | 528 | 11,447 | ||||||
|
| |||||||
| 80,250 | ||||||||
|
| |||||||
| Personal Products - 0.3% | ||||||||
| Lifevantage Corp. *(a) | 1,319 | 12,478 | ||||||
| Natural Health Trends Corp. (a) | 1,142 | 32,273 | ||||||
| Revlon, Inc., Class A * | 830 | 30,527 | ||||||
| USANA Health Sciences, Inc. * | 300 | 41,505 | ||||||
|
| |||||||
| 116,783 | ||||||||
|
| |||||||
| The accompanying notes are an integral part of these financial statements. | (Continued) |
| AQR Funds | Annual Report | September 2016 | ||||||||||||||
126
| Schedule of Investments | September 30, 2016 |
| AQR TM SMALL CAP MOMENTUM STYLE FUND |
| INVESTMENTS | SHARES | VALUE | ||||||
| Pharmaceuticals - 2.0% | ||||||||
| Aerie Pharmaceuticals, Inc. *(a) | 811 | $ | 30,607 | |||||
| Amphastar Pharmaceuticals, Inc. * | 1,336 | 25,344 | ||||||
| ANI Pharmaceuticals, Inc. * | 400 | 26,540 | ||||||
| Catalent, Inc. * | 844 | 21,809 | ||||||
| Corcept Therapeutics, Inc. * | 2,685 | 17,453 | ||||||
| Dermira, Inc. * | 1,724 | 58,306 | ||||||
| Heska Corp. * | 1,128 | 61,397 | ||||||
| Impax Laboratories, Inc. * | 1,600 | 37,920 | ||||||
| Intra-Cellular Therapies, Inc. * | 1,989 | 30,312 | ||||||
| Medicines Co. (The) * | 1,884 | 71,102 | ||||||
| Nektar Therapeutics * | 3,040 | 52,227 | ||||||
| Omeros Corp. * | 1,286 | 14,352 | ||||||
| Phibro Animal Health Corp., Class A | 796 | 21,635 | ||||||
| Prestige Brands Holdings, Inc. * | 1,126 | 54,352 | ||||||
| Sucampo Pharmaceuticals, Inc., Class A * | 868 | 10,685 | ||||||
| Supernus Pharmaceuticals, Inc. * | 2,382 | 58,907 | ||||||
| Teligent, Inc. *(a) | 3,732 | 28,363 | ||||||
| TherapeuticsMD, Inc. *(a) | 6,294 | 42,862 | ||||||
|
| |||||||
| 664,173 | ||||||||
|
| |||||||
| Professional Services - 0.7% | ||||||||
| CEB, Inc. | 456 | 24,838 | ||||||
| Exponent, Inc. | 576 | 29,411 | ||||||
| Huron Consulting Group, Inc. * | 402 | 24,023 | ||||||
| Insperity, Inc. | 534 | 38,790 | ||||||
| Kforce, Inc. | 539 | 11,044 | ||||||
| Korn/Ferry International | 1,020 | 21,420 | ||||||
| Mistras Group, Inc. * | 764 | 17,931 | ||||||
| On Assignment, Inc. * | 635 | 23,044 | ||||||
| WageWorks, Inc. * | 615 | 37,460 | ||||||
|
| |||||||
| 227,961 | ||||||||
|
| |||||||
| Real Estate Management & Development - 0.4% | ||||||||
| HFF, Inc., Class A | 1,079 | 29,877 | ||||||
| Kennedy-Wilson Holdings, Inc. | 1,600 | 36,080 | ||||||
| Marcus & Millichap, Inc. * | 1,193 | 31,197 | ||||||
| RE/MAX Holdings, Inc., Class A | 998 | 43,692 | ||||||
|
| |||||||
| 140,846 | ||||||||
|
| |||||||
| Road & Rail - 0.6% | ||||||||
| ArcBest Corp. | 599 | 11,393 | ||||||
| Covenant Transportation Group, Inc., Class A * | 1,000 | 19,330 | ||||||
| Heartland Express, Inc. | 2,500 | 47,200 | ||||||
| Knight Transportation, Inc. | 1,521 | 43,638 | ||||||
| Marten Transport Ltd. | 800 | 16,800 | ||||||
| Saia, Inc. * | 643 | 19,264 | ||||||
| Werner Enterprises, Inc. | 1,200 | 27,924 | ||||||
|
| |||||||
| 185,549 | ||||||||
|
| |||||||
| Semiconductors & Semiconductor Equipment - 5.1% | ||||||||
| Advanced Energy Industries, Inc. * | 1,704 | 80,633 | ||||||
| Advanced Micro Devices, Inc. * | 43,013 | 297,220 | ||||||
| Alpha & Omega Semiconductor Ltd. * | 2,021 | 43,896 | ||||||
| Ambarella, Inc. * | 251 | 18,476 | ||||||
| Amkor Technology, Inc. * | 4,396 | 42,729 | ||||||
| Axcelis Technologies, Inc. * | 1,752 | 23,267 | ||||||
| Cabot Microelectronics Corp. | 300 | 15,873 | ||||||
| Cavium, Inc. * | 609 | 35,444 | ||||||
| INVESTMENTS | SHARES | VALUE | ||||||
| Semiconductors & Semiconductor Equipment - 5.1% (continued) | ||||||||
| CEVA, Inc. * | 450 | $ | 15,781 | |||||
| Cirrus Logic, Inc. * | 2,965 | 157,590 | ||||||
| Diodes, Inc. * | 696 | 14,853 | ||||||
| Entegris, Inc. * | 1,000 | 17,420 | ||||||
| Inphi Corp. * | 2,178 | 94,765 | ||||||
| Integrated Device Technology, Inc. * | 3,043 | 70,293 | ||||||
| MACOM Technology Solutions Holdings, Inc. * | 1,968 | 83,325 | ||||||
| MaxLinear, Inc., Class A * | 5,061 | 102,586 | ||||||
| Microsemi Corp. * | 1,605 | 67,378 | ||||||
| MKS Instruments, Inc. | 908 | 45,155 | ||||||
| Monolithic Power Systems, Inc. | 2,229 | 179,434 | ||||||
| Nanometrics, Inc. * | 818 | 18,274 | ||||||
| NeoPhotonics Corp. * | 2,298 | 37,549 | ||||||
| Photronics, Inc. * | 1,352 | 13,939 | ||||||
| Power Integrations, Inc. | 424 | 26,725 | ||||||
| Rambus, Inc. * | 3,205 | 40,063 | ||||||
| Rudolph Technologies, Inc. * | 786 | 13,944 | ||||||
| Semtech Corp. * | 662 | 18,357 | ||||||
| Sigma Designs, Inc. * | 1,966 | 15,315 | ||||||
| Synaptics, Inc. * | 513 | 30,052 | ||||||
| Tessera Technologies, Inc. | 1,800 | 69,192 | ||||||
| Xcerra Corp. * | 1,800 | 10,908 | ||||||
|
| |||||||
| 1,700,436 | ||||||||
|
| |||||||
| Software - 4.9% | ||||||||
| 8x8, Inc. * | 4,163 | 64,235 | ||||||
| ACI Worldwide, Inc. * | 1,294 | 25,078 | ||||||
| Aspen Technology, Inc. * | 1,283 | 60,032 | ||||||
| Blackbaud, Inc. | 923 | 61,232 | ||||||
| BroadSoft, Inc. * | 1,139 | 53,020 | ||||||
| Callidus Software, Inc. * | 2,014 | 36,957 | ||||||
| CommVault Systems, Inc. * | 357 | 18,967 | ||||||
| Ebix, Inc. (a) | 1,032 | 58,669 | ||||||
| Ellie Mae, Inc. * | 1,709 | 179,958 | ||||||
| Fair Isaac Corp. | 880 | 109,639 | ||||||
| Gigamon, Inc. * | 1,442 | 79,022 | ||||||
| Glu Mobile, Inc. *(a) | 5,554 | 12,441 | ||||||
| HubSpot, Inc. * | 891 | 51,339 | ||||||
| Imperva, Inc. * | 450 | 24,170 | ||||||
| Mentor Graphics Corp. | 559 | 14,780 | ||||||
| MicroStrategy, Inc., Class A * | 200 | 33,488 | ||||||
| Monotype Imaging Holdings, Inc. | 488 | 10,790 | ||||||
| Paycom Software, Inc. * | 2,824 | 141,567 | ||||||
| Paylocity Holding Corp. * | 1,556 | 69,180 | ||||||
| Proofpoint, Inc. *(a) | 1,172 | 87,724 | ||||||
| Qualys, Inc. * | 787 | 30,056 | ||||||
| RealPage, Inc. * | 640 | 16,448 | ||||||
| RingCentral, Inc., Class A * | 2,161 | 51,129 | ||||||
| Rubicon Project, Inc. (The) * | 1,493 | 12,362 | ||||||
| Silver Spring Networks, Inc. * | 1,029 | 14,591 | ||||||
| Synchronoss Technologies, Inc. * | 968 | 39,862 | ||||||
| Take-Two Interactive Software, Inc. * | 2,568 | 115,765 | ||||||
| TiVo Corp. * | 1,667 | 32,473 | ||||||
| VASCO Data Security International, Inc. * | 1,100 | 19,371 | ||||||
| Verint Systems, Inc. * | 900 | 33,867 | ||||||
| VirnetX Holding Corp. *(a) | 80 | 245 | ||||||
| Zendesk, Inc. * | 3,225 | 99,040 | ||||||
|
| |||||||
| 1,657,497 | ||||||||
|
| |||||||
| The accompanying notes are an integral part of these financial statements. | (Continued) |
| AQR Funds | Annual Report | September 2016 | ||||||||||||||
127
| Schedule of Investments | September 30, 2016 |
| AQR TM SMALL CAP MOMENTUM STYLE FUND |
| INVESTMENTS | SHARES | VALUE | ||||||
| Specialty Retail - 1.3% | ||||||||
| American Eagle Outfitters, Inc. | 3,224 | $ | 57,581 | |||||
| Barnes & Noble, Inc. | 1,300 | 14,690 | ||||||
| Build-A-Bear Workshop, Inc. * | 1,000 | 10,360 | ||||||
| Caleres, Inc. | 931 | 23,545 | ||||||
| Cato Corp. (The), Class A | 400 | 13,156 | ||||||
| Children’s Place, Inc. (The) | 498 | 39,775 | ||||||
| Citi Trends, Inc. | 600 | 11,958 | ||||||
| Express, Inc. * | 1,640 | 19,336 | ||||||
| Five Below, Inc. * | 1,160 | 46,736 | ||||||
| Group 1 Automotive, Inc. | 200 | 12,776 | ||||||
| Kirkland’s, Inc. * | 900 | 10,962 | ||||||
| Lithia Motors, Inc., Class A | 602 | 57,503 | ||||||
| MarineMax, Inc. * | 669 | 14,016 | ||||||
| Monro Muffler Brake, Inc. | 625 | 38,231 | ||||||
| Select Comfort Corp. * | 1,283 | 27,713 | ||||||
| Sportsman’s Warehouse Holdings, Inc. * | 2,531 | 26,626 | ||||||
| Stein Mart, Inc. | 1,340 | 8,509 | ||||||
| Tile Shop Holdings, Inc. * | 1,151 | 19,049 | ||||||
|
| |||||||
| 452,522 | ||||||||
|
| |||||||
| Technology Hardware, Storage & Peripherals - 0.4% | ||||||||
| 3D Systems Corp. * | 780 | 14,001 | ||||||
| Cray, Inc. * | 1,006 | 23,681 | ||||||
| Electronics For Imaging, Inc. * | 983 | 48,088 | ||||||
| Immersion Corp. * | 1,473 | 12,020 | ||||||
| Super Micro Computer, Inc. * | 1,027 | 24,001 | ||||||
|
| |||||||
| 121,791 | ||||||||
|
| |||||||
| Textiles, Apparel & Luxury Goods - 0.3% | ||||||||
| Columbia Sportswear Co. | 1,156 | 65,591 | ||||||
| G-III Apparel Group Ltd. * | 878 | 25,594 | ||||||
| Steven Madden Ltd. * | 651 | 22,499 | ||||||
|
| |||||||
| 113,684 | ||||||||
|
| |||||||
| Thrifts & Mortgage Finance - 2.4% | ||||||||
| Beneficial Bancorp, Inc. | 1,856 | 27,302 | ||||||
| BofI Holding, Inc. *(a) | 4,680 | 104,832 | ||||||
| Capitol Federal Financial, Inc. | 4,102 | 57,715 | ||||||
| Essent Group Ltd. * | 1,630 | 43,374 | ||||||
| First Defiance Financial Corp. | 725 | 32,364 | ||||||
| HomeStreet, Inc. * | 1,444 | 36,187 | ||||||
| Kearny Financial Corp. | 3,143 | 42,776 | ||||||
| LendingTree, Inc. * | 622 | 60,278 | ||||||
| Meridian Bancorp, Inc. | 1,087 | 16,924 | ||||||
| Meta Financial Group, Inc. | 1,311 | 79,460 | ||||||
| Northwest Bancshares, Inc. (a) | 7,532 | 118,328 | ||||||
| Oritani Financial Corp. | 2,501 | 39,316 | ||||||
| PennyMac Financial Services, Inc., Class A * | 835 | 14,203 | ||||||
| Walker & Dunlop, Inc. * | 980 | 24,755 | ||||||
| Washington Federal, Inc. | 2,194 | 58,536 | ||||||
| Waterstone Financial, Inc. | 2,000 | 33,980 | ||||||
|
| |||||||
| 790,330 | ||||||||
|
| |||||||
| Tobacco - 0.4% | ||||||||
| Universal Corp. | 323 | 18,805 | ||||||
| Vector Group Ltd. (a) | 4,768 | 102,656 | ||||||
|
| |||||||
| 121,461 | ||||||||
|
| |||||||
| INVESTMENTS | SHARES | VALUE | ||||||
| Trading Companies & Distributors - 0.5% | ||||||||
| Aircastle Ltd. | 1,474 | $ | 29,273 | |||||
| Beacon Roofing Supply, Inc. * | 1,573 | 66,176 | ||||||
| H&E Equipment Services, Inc. | 878 | 14,715 | ||||||
| MRC Global, Inc. * | 3,462 | 56,881 | ||||||
| NOW, Inc. * | 553 | 11,851 | ||||||
|
| |||||||
| 178,896 | ||||||||
|
| |||||||
| Water Utilities - 0.4% | ||||||||
| American States Water Co. | 700 | 28,035 | ||||||
| Artesian Resources Corp., Class A | 590 | 16,839 | ||||||
| Connecticut Water Service, Inc. | 635 | 31,579 | ||||||
| Middlesex Water Co. | 1,085 | 38,235 | ||||||
| York Water Co. (The) | 352 | 10,440 | ||||||
|
| |||||||
| 125,128 | ||||||||
|
| |||||||
| Wireless Telecommunication Services - 0.3% | ||||||||
| Boingo Wireless, Inc. * | 1,931 | 19,851 | ||||||
| Shenandoah Telecommunications Co. | 3,344 | 90,990 | ||||||
|
| |||||||
| 110,841 | ||||||||
|
| |||||||
TOTAL COMMON STOCKS |
| 32,496,208 | ||||||
|
| |||||||
| EXCHANGE TRADED FUND - 2.3% | ||||||||
| iShares Russell 2000 Fund | ||||||||
(cost $650,050) | 6,085 | 755,818 | ||||||
|
| |||||||
| SHORT-TERM INVESTMENT - 1.5% | ||||||||
| INVESTMENT COMPANY - 1.5% | ||||||||
| J.P. Morgan U.S. Treasury Plus Money Market Fund - IM Shares, 0.22% | ||||||||
(cost $504,720) (2)(c) | 504,720 | 504,720 | ||||||
|
| |||||||
| SECURITIES LENDING COLLATERAL - 5.7% | ||||||||
| Money Market Funds - 5.7% | ||||||||
| Investments in a Pooled Account through Securities Lending Program with JPMorgan Chase Bank Dreyfus Treasury & Agency Cash Management, 0.21% | ||||||||
(cost $1,927,915) (2)(c)(d) | 1,927,915 | 1,927,915 | ||||||
|
| |||||||
TOTAL INVESTMENTS IN SECURITIES AT VALUE - 106.4% |
| 35,684,661 | ||||||
|
| |||||||
LIABILITIES IN EXCESS OF OTHER ASSETS - (6.4%) | (2,135,957) | |||||||
|
| |||||||
NET ASSETS - 100.0% |
| 33,548,704 | ||||||
|
| |||||||
| The accompanying notes are an integral part of these financial statements. | (Continued) |
| AQR Funds | Annual Report | September 2016 | ||||||||||||||
128
| Schedule of Investments | September 30, 2016 |
| AQR TM SMALL CAP MOMENTUM STYLE FUND |
| SECTOR | VALUE | % OF NET ASSETS | ||||||
| Consumer Discretionary | $ | 3,563,590 | 10.7 | % | ||||
| Consumer Staples | 1,529,184 | 4.6 | ||||||
| Energy | 939,345 | 2.8 | ||||||
| Exchange Traded Fund | 755,818 | 2.3 | ||||||
| Financials | 4,343,030 | 12.9 | ||||||
| Health Care | 4,197,009 | 12.5 | ||||||
| Industrials | 3,427,325 | 10.2 | ||||||
| Information Technology | 6,974,472 | 20.8 | ||||||
| Materials | 1,359,214 | 4.1 | ||||||
| Real Estate | 3,240,839 | 9.6 | ||||||
| Telecommunication Services | 482,975 | 1.4 | ||||||
| Utilities | 2,439,225 | 7.3 | ||||||
| Short-Term Investment | 504,720 | 1.5 | ||||||
| Securities Lending Collateral | 1,927,915 | 5.7 | ||||||
|
|
|
| |||||
Total Investments In Securities At Value | 35,684,661 | 106.4 | ||||||
| Liabilities in Excess of Other Assets | (2,135,957 | ) | (6.4 | ) | ||||
|
|
|
| |||||
Net Assets | $ | 33,548,704 | 100.0 | % | ||||
|
|
|
| |||||
All securities are United States companies, unless noted otherwise in parentheses.
| * | Non-income producing security. |
| (a) | The security or a portion of this security is on loan at 9/30/2016. The total value of securities on loan at 9/30/2016 was $1,879,581. |
| (b) | Represents less than 0.05% of net assets. |
| (c) | Represents 7-day effective yield as of 9/30/2016. |
| (d) | Represents security, or portion thereof, purchased with the cash collateral received for securities on loan. |
All securities are Level 1 with respect to ASC 820, unless otherwise noted in parentheses.
| (2) | Level 2 security (See Note 4). |
| The accompanying notes are an integral part of these financial statements. |
| AQR Funds | Annual Report | September 2016 | ||||||||||||||
129
| Schedule of Investments | September 30, 2016 |
| AQR TM INTERNATIONAL MOMENTUM STYLE FUND |
| INVESTMENTS | SHARES | VALUE | ||||||
| COMMON STOCKS - 97.1% | ||||||||
| Australia - 6.0% | ||||||||
| AGL Energy Ltd. | 13,172 | $ | 192,842 | |||||
| Amcor Ltd. | 28,362 | 330,341 | ||||||
| Aristocrat Leisure Ltd. | 10,915 | 132,802 | ||||||
| Australia & New Zealand Banking Group Ltd. | 2,199 | 46,842 | ||||||
| Brambles Ltd. | 11,872 | 109,431 | ||||||
| Caltex Australia Ltd. | 5,724 | 151,335 | ||||||
| Commonwealth Bank of Australia | 525 | 29,276 | ||||||
| Crown Resorts Ltd. | 11,649 | 117,508 | ||||||
| CSL Ltd. | 7,546 | 620,512 | ||||||
| Dexus Property Group, REIT | 14,878 | 104,571 | ||||||
| Domino’s Pizza Enterprises Ltd. | 1,617 | 87,612 | ||||||
| Fortescue Metals Group Ltd. | 68,035 | 260,409 | ||||||
| GPT Group (The), REIT | 27,005 | 105,159 | ||||||
| Insurance Australia Group Ltd. | 28,183 | 118,692 | ||||||
| Medibank Pvt Ltd. | 45,386 | 86,460 | ||||||
| Newcrest Mining Ltd. | 14,604 | 246,518 | ||||||
| Qantas Airways Ltd. | 35,049 | 84,181 | ||||||
| Ramsay Health Care Ltd. | 11,496 | 699,517 | ||||||
| Scentre Group, REIT | 186,313 | 672,625 | ||||||
| South32 Ltd. | 55,031 | 102,535 | ||||||
| Suncorp Group Ltd. | 11,005 | 102,670 | ||||||
| Telstra Corp. Ltd. | 92,756 | 369,829 | ||||||
| Treasury Wine Estates Ltd. | 60,427 | 512,825 | ||||||
| Vocus Communications Ltd. | 8,441 | 40,482 | ||||||
| Westfield Corp., REIT | 11,400 | 85,301 | ||||||
|
| |||||||
| 5,410,275 | ||||||||
|
| |||||||
| Austria - 0.3% | ||||||||
| ANDRITZ AG | 2,003 | 108,997 | ||||||
| OMV AG | 6,031 | 173,645 | ||||||
|
| |||||||
| 282,642 | ||||||||
|
| |||||||
| Belgium - 2.8% | ||||||||
| Ageas | 9,048 | 330,826 | ||||||
| Anheuser-Busch InBev SA/NV | 11,786 | 1,549,952 | ||||||
| Colruyt SA | 2,357 | 130,897 | ||||||
| Proximus SADP | 5,258 | 157,298 | ||||||
| UCB SA | 4,323 | 334,625 | ||||||
| Umicore SA | 877 | 55,066 | ||||||
|
| |||||||
| 2,558,664 | ||||||||
|
| |||||||
| Canada - 14.8% | ||||||||
| Agnico Eagle Mines Ltd. (1) | 7,349 | 397,433 | ||||||
| Alimentation Couche-Tard, Inc., Class B (1) | 12,079 | 585,375 | ||||||
| Bank of Montreal (1) | 8,247 | 540,413 | ||||||
| Bank of Nova Scotia (The) (1) | 12,262 | 649,761 | ||||||
| Barrick Gold Corp. (1) | 22,804 | 403,778 | ||||||
| BCE, Inc. (1) | 19,726 | 911,009 | ||||||
| Canadian Imperial Bank of Commerce (1) | 4,833 | 374,756 | ||||||
| Canadian National Railway Co. (1) | 2,757 | 180,221 | ||||||
| Canadian Natural Resources Ltd. (1) | 16,600 | 530,664 | ||||||
| Canadian Tire Corp. Ltd., Class A (1) | 1,212 | 121,371 | ||||||
| CCL Industries, Inc., Class B (1) | 1,450 | 279,191 | ||||||
| CGI Group, Inc., Class A (1)* | 6,619 | 315,272 | ||||||
| CI Financial Corp. (1) | 8,112 | 155,630 | ||||||
| Constellation Software, Inc. (1) | 536 | 241,626 | ||||||
| Crescent Point Energy Corp. (1) | 3,762 | 49,608 | ||||||
| Dollarama, Inc. (1) | 5,199 | 405,910 | ||||||
| INVESTMENTS | SHARES | VALUE | ||||||
| Canada - 14.8% (continued) | ||||||||
| Encana Corp., Class R (1) | 9,822 | $ | 102,641 | |||||
| Fairfax Financial Holdings Ltd. (1) | 101 | 59,180 | ||||||
| First Quantum Minerals Ltd. (1) | 13,243 | 109,622 | ||||||
| Fortis, Inc. (1) | 7,316 | 235,270 | ||||||
| Franco-Nevada Corp. (1) | 5,659 | 395,369 | ||||||
| George Weston Ltd. (1) | 453 | 37,788 | ||||||
| Gildan Activewear, Inc. (1) | 7,380 | 206,108 | ||||||
| Goldcorp, Inc. (1) | 1,669 | 27,542 | ||||||
| Imperial Oil Ltd. (1) | 4,286 | 134,073 | ||||||
| Jean Coutu Group PJC, Inc. (The), Class A (1) | 3,300 | 50,634 | ||||||
| Keyera Corp. (1) | 5,174 | 167,294 | ||||||
| Kinross Gold Corp. (1)* | 37,264 | 157,071 | ||||||
| Loblaw Cos. Ltd. (1) | 2,479 | 127,545 | ||||||
| Metro, Inc. (1) | 11,839 | 388,662 | ||||||
| Onex Corp. (1) | 1,692 | 108,965 | ||||||
| Open Text Corp. (1) | 1,226 | 79,413 | ||||||
| Restaurant Brands International, Inc. (1) | 5,059 | 225,581 | ||||||
| Rogers Communications, Inc., Class B (1) | 11,564 | 490,607 | ||||||
| Royal Bank of Canada (1) | 8,139 | 504,116 | ||||||
| Saputo, Inc. (1) | 3,451 | 119,922 | ||||||
| Seven Generations Energy Ltd., Class A (1)* | 11,366 | 273,591 | ||||||
| Silver Wheaton Corp. (1) | 10,615 | 286,745 | ||||||
| Sun Life Financial, Inc. (1) | 7,180 | 233,633 | ||||||
| Suncor Energy, Inc. (1) | 17,565 | 487,608 | ||||||
| Teck Resources Ltd., Class B (1) | 16,959 | 305,713 | ||||||
| Toronto-Dominion Bank (The) (1) | 23,928 | 1,062,210 | ||||||
| TransCanada Corp. (1) | 14,764 | 701,204 | ||||||
| Yamana Gold, Inc. (1) | 7,836 | 33,746 | ||||||
|
| |||||||
| 13,253,871 | ||||||||
|
| |||||||
| Denmark - 2.7% | ||||||||
| Chr Hansen Holding A/S | 2,097 | 124,907 | ||||||
| Coloplast A/S, Class B | 5,113 | 397,645 | ||||||
| Danske Bank A/S | 2,517 | 73,637 | ||||||
| Genmab A/S * | 1,353 | 231,570 | ||||||
| ISS A/S | 1,764 | 73,302 | ||||||
| Novo Nordisk A/S, Class B | 7,300 | 304,255 | ||||||
| Pandora A/S | 3,615 | 437,848 | ||||||
| Tryg A/S | 11,965 | 240,410 | ||||||
| Vestas Wind Systems A/S | 5,029 | 415,413 | ||||||
| William Demant Holding A/S * | 3,965 | 80,915 | ||||||
|
| |||||||
| 2,379,902 | ||||||||
|
| |||||||
| Finland - 1.2% | ||||||||
| Kone OYJ, Class B | 4,708 | 239,011 | ||||||
| Neste OYJ | 9,546 | 407,194 | ||||||
| Nokia OYJ | 20,191 | 117,034 | ||||||
| Nokian Renkaat OYJ | 1,449 | 52,831 | ||||||
| Sampo OYJ, Class A | 6,585 | 292,555 | ||||||
|
| |||||||
| 1,108,625 | ||||||||
|
| |||||||
| France - 5.0% | ||||||||
| Accor SA | 917 | 36,386 | ||||||
| Airbus Group SE | 10,257 | 622,099 | ||||||
| AXA SA | 6,712 | 142,712 | ||||||
| Capgemini SA | 1,863 | 182,655 | ||||||
| Dassault Systemes | 2,145 | 186,209 | ||||||
| Essilor International SA | 726 | 93,651 | ||||||
| Hermes International | 304 | 123,762 | ||||||
| The accompanying notes are an integral part of these financial statements. | (Continued) |
| AQR Funds | Annual Report | September 2016 | ||||||||||||||
130
| Schedule of Investments | September 30, 2016 |
| AQR TM INTERNATIONAL MOMENTUM STYLE FUND |
| INVESTMENTS | SHARES | VALUE | ||||||
| France - 5.0% (continued) | ||||||||
| Iliad SA | 718 | $ | 150,735 | |||||
| JCDecaux SA | 894 | 28,907 | ||||||
| L’Oreal SA | 1,023 | 193,357 | ||||||
| LVMH Moet Hennessy Louis Vuitton SE | 1,666 | 284,071 | ||||||
| Orange SA | 18,570 | 290,946 | ||||||
| Peugeot SA * | 2,366 | 36,131 | ||||||
| Renault SA | 555 | 45,659 | ||||||
| Safran SA | 2,841 | 204,331 | ||||||
| Sanofi | 811 | 61,758 | ||||||
| SFR Group SA | 3,252 | 95,789 | ||||||
| TOTAL SA | 10,152 | 482,835 | ||||||
| Unibail-Rodamco SE, REIT | 3,272 | 882,239 | ||||||
| Valeo SA | 5,598 | 326,748 | ||||||
|
| |||||||
| 4,470,980 | ||||||||
|
| |||||||
| Germany - 7.7% | ||||||||
| adidas AG | 4,640 | 807,010 | ||||||
| Beiersdorf AG | 2,178 | 205,588 | ||||||
| Brenntag AG | 1,417 | 77,437 | ||||||
| Continental AG | 1,279 | 269,487 | ||||||
| Fresenius Medical Care AG & Co. KGaA | 4,229 | 369,978 | ||||||
| GEA Group AG | 2,774 | 154,226 | ||||||
| Hannover Rueck SE | 3,192 | 342,168 | ||||||
| Infineon Technologies AG | 26,622 | 474,711 | ||||||
| MAN SE | 932 | 98,301 | ||||||
| Merck KGaA | 2,173 | 234,390 | ||||||
| Muenchener Rueckversicherungs-Gesellschaft AG in Muenchen | 264 | 49,306 | ||||||
| OSRAM Licht AG | 1,230 | 72,258 | ||||||
| ProSiebenSat.1 Media SE | 4,809 | 206,187 | ||||||
| SAP SE | 18,381 | 1,680,986 | ||||||
| Siemens AG | 10,247 | 1,201,567 | ||||||
| Symrise AG | 928 | 68,055 | ||||||
| United Internet AG | 3,833 | 169,752 | ||||||
| Vonovia SE | 7,871 | 298,383 | ||||||
| Zalando SE *(a) | 3,246 | 135,622 | ||||||
|
| |||||||
| 6,915,412 | ||||||||
|
| |||||||
| Hong Kong - 2.4% | ||||||||
| AIA Group Ltd. | 63,800 | 429,039 | ||||||
| BOC Hong Kong Holdings Ltd. | 89,500 | 304,515 | ||||||
| Cathay Pacific Airways Ltd. | 44,000 | 61,509 | ||||||
| Cheung Kong Property Holdings Ltd. | 7,000 | 51,491 | ||||||
| CK Hutchison Holdings Ltd. | 7,000 | 89,476 | ||||||
| CLP Holdings Ltd. | 26,000 | 269,283 | ||||||
| Henderson Land Development Co. Ltd. | 18,150 | 108,297 | ||||||
| Hong Kong Exchanges and Clearing Ltd. | 3,200 | 84,689 | ||||||
| Link REIT | 19,500 | 143,951 | ||||||
| MTR Corp. Ltd. | 19,500 | 107,757 | ||||||
| PCCW Ltd. | 75,000 | 46,194 | ||||||
| Power Assets Holdings Ltd. | 4,000 | 39,143 | ||||||
| Sun Hung Kai Properties Ltd. | 4,000 | 60,811 | ||||||
| Techtronic Industries Co. Ltd. | 14,000 | 54,842 | ||||||
| WH Group Ltd. (a) | 152,500 | 123,257 | ||||||
| Wharf Holdings Ltd. (The) | 16,000 | 117,385 | ||||||
| Wheelock & Co. Ltd. | 9,000 | 53,458 | ||||||
|
| |||||||
| 2,145,097 | ||||||||
|
| |||||||
| INVESTMENTS | SHARES | VALUE | ||||||
| Ireland - 0.1% | ||||||||
| Experian plc | 5,258 | $ | 105,044 | |||||
|
| |||||||
| Italy - 1.4% | ||||||||
| Atlantia SpA | 3,173 | 80,586 | ||||||
| Enel SpA | 9,323 | 41,550 | ||||||
| Eni SpA | 36,371 | 524,117 | ||||||
| Leonardo-Finmeccanica SpA * | 9,430 | 106,886 | ||||||
| Luxottica Group SpA | 5,789 | 276,501 | ||||||
| Prysmian SpA | 2,292 | 60,017 | ||||||
| Snam SpA | 36,381 | 201,728 | ||||||
|
| |||||||
| 1,291,385 | ||||||||
|
| |||||||
| Japan - 14.8% | ||||||||
| Acom Co. Ltd. * | 24,800 | 116,920 | ||||||
| Aisin Seiki Co. Ltd. | 1,800 | 82,465 | ||||||
| Ajinomoto Co., Inc. | 5,800 | 129,319 | ||||||
| Alfresa Holdings Corp. | 3,400 | 71,993 | ||||||
| Calbee, Inc. | 1,800 | 68,199 | ||||||
| CYBERDYNE, Inc. * | 1,800 | 28,191 | ||||||
| Daicel Corp. | 3,400 | 42,966 | ||||||
| Daiichi Sankyo Co. Ltd. | 8,500 | 204,242 | ||||||
| Daikin Industries Ltd. | 2,300 | 214,626 | ||||||
| Daito Trust Construction Co. Ltd. | 1,100 | 175,934 | ||||||
| Daiwa House Industry Co. Ltd. | 10,400 | 285,425 | ||||||
| Dentsu, Inc. | 1,000 | 50,898 | ||||||
| FamilyMart Co. Ltd. | 800 | 53,405 | ||||||
| FUJIFILM Holdings Corp. | 2,000 | 74,086 | ||||||
| Hoshizaki Electric Co. Ltd. | 1,200 | 109,507 | ||||||
| Hoya Corp. | 2,200 | 88,501 | ||||||
| Idemitsu Kosan Co. Ltd. | 10,100 | 209,112 | ||||||
| Iida Group Holdings Co. Ltd. | 6,600 | 132,810 | ||||||
| Japan Airport Terminal Co. Ltd. | 2,000 | 76,477 | ||||||
| Japan Prime Realty Investment Corp., REIT | 9 | 40,634 | ||||||
| Japan Real Estate Investment Corp., REIT | 19 | 113,618 | ||||||
| Japan Retail Fund Investment Corp., REIT | 35 | 86,323 | ||||||
| Japan Tobacco, Inc. | 6,700 | 274,266 | ||||||
| JX Holdings, Inc. | 23,300 | 94,308 | ||||||
| Kajima Corp. | 13,000 | 90,972 | ||||||
| Kakaku.com, Inc. | 2,500 | 45,270 | ||||||
| Kaneka Corp. | 4,000 | 31,670 | ||||||
| Kao Corp. | 5,100 | 288,344 | ||||||
| KDDI Corp. | 26,100 | 808,631 | ||||||
| Keihan Holdings Co. Ltd. | 13,000 | 90,923 | ||||||
| Keisei Electric Railway Co. Ltd. | 4,000 | 100,009 | ||||||
| Keyence Corp. | 400 | 293,076 | ||||||
| Kikkoman Corp. | 4,000 | 128,107 | ||||||
| Kintetsu Group Holdings Co. Ltd. | 9,000 | 37,773 | ||||||
| Koito Manufacturing Co. Ltd. | 5,000 | 243,348 | ||||||
| Konami Holdings Corp. | 2,600 | 100,465 | ||||||
| Kose Corp. | 1,000 | 102,397 | ||||||
| Kyowa Hakko Kirin Co. Ltd. | 1,600 | 25,272 | ||||||
| M3, Inc. | 5,800 | 198,537 | ||||||
| Mabuchi Motor Co. Ltd. | 900 | 49,942 | ||||||
| Marui Group Co. Ltd. | 3,700 | 48,876 | ||||||
| MEIJI Holdings Co. Ltd. | 3,700 | 367,375 | ||||||
| Mitsubishi Tanabe Pharma Corp. | 1,900 | 40,695 | ||||||
| Mitsui Chemicals, Inc. | 10,000 | 47,568 | ||||||
| Mixi, Inc. | 1,700 | 61,592 | ||||||
| Nexon Co. Ltd. | 6,800 | 106,818 | ||||||
| The accompanying notes are an integral part of these financial statements. | (Continued) |
| AQR Funds | Annual Report | September 2016 | ||||||||||||||
131
| Schedule of Investments | September 30, 2016 |
| AQR TM INTERNATIONAL MOMENTUM STYLE FUND |
| INVESTMENTS | SHARES | VALUE | ||||||
| Japan - 14.8% (continued) | ||||||||
| Nidec Corp. | 300 | $ | 27,730 | |||||
| Nippon Building Fund, Inc., REIT | 14 | 88,702 | ||||||
| Nippon Telegraph & Telephone Corp. | 18,700 | 855,263 | ||||||
| Nisshin Seifun Group, Inc. | 7,000 | 106,698 | ||||||
| Nitori Holdings Co. Ltd. | 2,700 | 323,656 | ||||||
| Nomura Real Estate Master Fund, Inc., REIT | 66 | 110,079 | ||||||
| Nomura Research Institute Ltd. | 1,500 | 51,771 | ||||||
| NTT Data Corp. | 3,200 | 159,822 | ||||||
| NTT DOCOMO, Inc. | 22,100 | 561,407 | ||||||
| Obayashi Corp. | 18,300 | 181,514 | ||||||
| Obic Co. Ltd. | 1,600 | 85,198 | ||||||
| Olympus Corp. | 900 | 31,429 | ||||||
| Ono Pharmaceutical Co. Ltd. | 8,400 | 234,532 | ||||||
| Oriental Land Co. Ltd. | 3,200 | 194,873 | ||||||
| Otsuka Corp. | 1,200 | 56,996 | ||||||
| Otsuka Holdings Co. Ltd. | 5,500 | 250,705 | ||||||
| Park24 Co. Ltd. | 4,600 | 149,606 | ||||||
| Rinnai Corp. | 800 | 74,475 | ||||||
| Ryohin Keikaku Co. Ltd. | 500 | 100,979 | ||||||
| Santen Pharmaceutical Co. Ltd. | 4,000 | 59,066 | ||||||
| Secom Co. Ltd. | 2,900 | 216,556 | ||||||
| Seiko Epson Corp. | 1,500 | 28,883 | ||||||
| Sekisui House Ltd. | 9,200 | 156,737 | ||||||
| Shimadzu Corp. | 5,000 | 76,308 | ||||||
| Shimamura Co. Ltd. | 300 | 36,522 | ||||||
| Shimano, Inc. | 1,300 | 193,081 | ||||||
| Shimizu Corp. | 12,000 | 107,250 | ||||||
| Shin-Etsu Chemical Co. Ltd. | 700 | 48,841 | ||||||
| Shionogi & Co. Ltd. | 7,500 | 384,251 | ||||||
| Shiseido Co. Ltd. | 3,600 | 95,349 | ||||||
| Sohgo Security Services Co. Ltd. | 3,800 | 204,223 | ||||||
| Sony Corp. | 2,900 | 96,079 | ||||||
| Suntory Beverage & Food Ltd. | 1,000 | 43,238 | ||||||
| Suruga Bank Ltd. | 3,000 | 71,909 | ||||||
| Suzuken Co. Ltd. | 1,200 | 39,625 | ||||||
| Sysmex Corp. | 3,300 | 244,838 | ||||||
| Taisei Corp. | 11,000 | 82,525 | ||||||
| Taiyo Nippon Sanso Corp. | 5,900 | 61,560 | ||||||
| Teijin Ltd. | 1,800 | 34,920 | ||||||
| Terumo Corp. | 5,600 | 215,407 | ||||||
| Toho Gas Co. Ltd. | 12,000 | 112,370 | ||||||
| Tohoku Electric Power Co., Inc. | 1,900 | 24,778 | ||||||
| Tokyo Electron Ltd. | 1,900 | 167,930 | ||||||
| Tokyu Corp. | 4,000 | 30,513 | ||||||
| Toray Industries, Inc. | 5,000 | 48,697 | ||||||
| TOTO Ltd. | 3,500 | 132,325 | ||||||
| Trend Micro, Inc. | 2,500 | 87,213 | ||||||
| USS Co. Ltd. | 4,900 | 82,930 | ||||||
| Yamaha Corp. | 6,000 | 194,228 | ||||||
| Yamato Holdings Co. Ltd. | 2,100 | 48,950 | ||||||
| Yamazaki Baking Co. Ltd. | 2,000 | 49,178 | ||||||
|
| |||||||
| 13,253,600 | ||||||||
|
| |||||||
| Mexico - 0.2% | ||||||||
| Fresnillo plc | 7,951 | 186,563 | ||||||
|
| |||||||
| Netherlands - 4.4% | ||||||||
| ASML Holding NV | 4,486 | 491,625 | ||||||
| Heineken NV | 7,348 | 645,898 | ||||||
| INVESTMENTS | SHARES | VALUE | ||||||
| Netherlands - 4.4% (continued) | ||||||||
| Koninklijke Ahold NV * | 16,036 | $ | 365,235 | |||||
| Koninklijke KPN NV | 50,357 | 167,072 | ||||||
| NN Group NV | 2,604 | 79,944 | ||||||
| Randstad Holding NV | 1,696 | 77,121 | ||||||
| Royal Dutch Shell plc, Class B | 73,715 | 1,911,113 | ||||||
| Wolters Kluwer NV | 5,675 | 242,613 | ||||||
|
| |||||||
| 3,980,621 | ||||||||
|
| |||||||
| Norway - 0.5% | ||||||||
| Golar LNG Ltd. (3)(b) | 70 | 1,489 | ||||||
| Marine Harvest ASA * | 7,632 | 136,903 | ||||||
| Statoil ASA | 19,255 | 323,259 | ||||||
|
| |||||||
| 461,651 | ||||||||
|
| |||||||
| Portugal - 0.3% | ||||||||
| EDP - Energias de Portugal SA | 18,666 | 62,643 | ||||||
| Galp Energia SGPS SA | 14,388 | 196,568 | ||||||
|
| |||||||
| 259,211 | ||||||||
|
| |||||||
| Singapore - 0.3% | ||||||||
| ComfortDelGro Corp. Ltd. | 16,200 | 33,509 | ||||||
| DBS Group Holdings Ltd. | 2,900 | 32,906 | ||||||
| Singapore Telecommunications Ltd. | 65,000 | 190,118 | ||||||
|
| |||||||
| 256,533 | ||||||||
|
| |||||||
| Spain - 2.9% | ||||||||
| Abertis Infraestructuras SA | 2,615 | 40,740 | ||||||
| Aena SA (a) | 716 | 105,689 | ||||||
| Amadeus IT Group SA, Class A | 9,319 | 465,139 | ||||||
| Ferrovial SA | 17,060 | 363,255 | ||||||
| Gas Natural SDG SA | 4,011 | 82,458 | ||||||
| Grifols SA | 3,053 | 65,808 | ||||||
| Iberdrola SA | 69,882 | 475,156 | ||||||
| Industria de Diseno Textil SA | 23,937 | 887,534 | ||||||
| Red Electrica Corp. SA | 3,624 | 78,193 | ||||||
|
| |||||||
| 2,563,972 | ||||||||
|
| |||||||
| Sweden - 2.4% | ||||||||
| Assa Abloy AB, Class B | 17,134 | 347,951 | ||||||
| Boliden AB | 10,436 | 245,295 | ||||||
| Electrolux AB, Series B | 2,915 | 73,012 | ||||||
| Hennes & Mauritz AB, Class B | 3,205 | 90,463 | ||||||
| ICA Gruppen AB | 3,756 | 124,073 | ||||||
| Kinnevik AB, Class B * | 2,239 | 57,103 | ||||||
| Lundin Petroleum AB * | 10,480 | 191,826 | ||||||
| Sandvik AB | 13,074 | 143,862 | ||||||
| Skanska AB, Class B | 15,522 | 362,636 | ||||||
| Svenska Cellulosa AB SCA, Class B | 9,728 | 288,736 | ||||||
| Svenska Handelsbanken AB, Class A | 9,726 | 133,694 | ||||||
| Volvo AB, Class B | 7,103 | 81,101 | ||||||
|
| |||||||
| 2,139,752 | ||||||||
|
| |||||||
| Switzerland - 7.1% | ||||||||
| ABB Ltd. * | 21,468 | 483,845 | ||||||
| Actelion Ltd. * | 2,690 | 466,807 | ||||||
| Chocoladefabriken Lindt & Spruengli AG | 55 | 318,074 | ||||||
| Coca-Cola HBC AG * | 2,201 | 51,133 | ||||||
| EMS-Chemie Holding AG | 460 | 247,253 | ||||||
| Galenica AG | 183 | 194,606 | ||||||
| The accompanying notes are an integral part of these financial statements. | (Continued) |
| AQR Funds | Annual Report | September 2016 | ||||||||||||||
132
| Schedule of Investments | September 30, 2016 |
| AQR TM INTERNATIONAL MOMENTUM STYLE FUND |
| INVESTMENTS | SHARES | VALUE | ||||||
| Switzerland - 7.1% (continued) | ||||||||
| Geberit AG | 365 | $ | 159,994 | |||||
| Givaudan SA | 360 | 733,939 | ||||||
| Glencore plc * | 59,487 | 162,886 | ||||||
| Kuehne + Nagel International AG | 815 | 118,441 | ||||||
| Lonza Group AG * | 808 | 154,650 | ||||||
| Nestle SA | 25,690 | 2,028,587 | ||||||
| Partners Group Holding AG | 1,371 | 692,678 | ||||||
| Schindler Holding AG | 370 | 69,480 | ||||||
| Sika AG | 15 | 73,082 | ||||||
| Swiss Re AG | 4,107 | 370,938 | ||||||
| Swisscom AG | 70 | 33,297 | ||||||
|
| |||||||
| 6,359,690 | ||||||||
|
| |||||||
| United Kingdom - 19.0% | ||||||||
| 3i Group plc | 5,219 | 44,004 | ||||||
| Admiral Group plc | 1,037 | 27,523 | ||||||
| Anglo American plc * | 5,017 | 62,566 | ||||||
| Ashtead Group plc | 4,765 | 78,310 | ||||||
| Associated British Foods plc | 11,141 | 375,394 | ||||||
| AstraZeneca plc | 9,974 | 645,835 | ||||||
| Auto Trader Group plc (a) | 29,518 | 155,175 | ||||||
| BAE Systems plc | 37,113 | 252,119 | ||||||
| Barclays plc | 24,559 | 53,244 | ||||||
| Barratt Developments plc | 7,602 | 48,668 | ||||||
| BP plc | 157,027 | 915,269 | ||||||
| British American Tobacco plc | 28,247 | 1,801,483 | ||||||
| BT Group plc | 107,206 | 539,388 | ||||||
| Bunzl plc | 6,811 | 200,846 | ||||||
| Capita plc | 4,384 | 37,977 | ||||||
| Compass Group plc | 28,409 | 550,187 | ||||||
| Diageo plc | 1,887 | 54,050 | ||||||
| Direct Line Insurance Group plc | 42,210 | 199,389 | ||||||
| Dixons Carphone plc | 18,897 | 90,261 | ||||||
| GlaxoSmithKline plc | 38,774 | 825,830 | ||||||
| HSBC Holdings plc | 10,509 | 78,994 | ||||||
| Imperial Brands plc | 19,296 | 993,177 | ||||||
| Inmarsat plc | 6,370 | 58,071 | ||||||
| International Consolidated Airlines Group SA | 15,406 | 79,935 | ||||||
| Intertek Group plc | 3,758 | 169,651 | ||||||
| ITV plc | 79,090 | 191,850 | ||||||
| Kingfisher plc | 13,199 | 64,399 | ||||||
| Legal & General Group plc | 45,149 | 127,953 | ||||||
| Marks & Spencer Group plc | 12,540 | 53,798 | ||||||
| Merlin Entertainments plc (a) | 9,248 | 52,646 | ||||||
| National Grid plc | 75,296 | 1,063,393 | ||||||
| Next plc | 1,489 | 92,168 | ||||||
| Pearson plc | 4,138 | 40,452 | ||||||
| Persimmon plc | 12,600 | 296,259 | ||||||
| Petrofac Ltd. | 4,403 | 50,963 | ||||||
| Prudential plc | 20,491 | 363,237 | ||||||
| Randgold Resources Ltd. | 2,064 | 206,862 | ||||||
| Reckitt Benckiser Group plc | 12,458 | 1,172,857 | ||||||
| RELX NV | 51,973 | 929,630 | ||||||
| Sage Group plc (The) | 32,325 | 308,854 | ||||||
| Severn Trent plc | 5,892 | 191,183 | ||||||
| Smith & Nephew plc | 3,009 | 48,530 | ||||||
| SSE plc | 1,950 | 39,596 | ||||||
| Taylor Wimpey plc | 76,759 | 153,102 | ||||||
| Unilever NV, CVA | 51,532 | 2,374,246 | ||||||
| INVESTMENTS | SHARES | VALUE | ||||||
| United Kingdom - 19.0% (continued) | ||||||||
| United Utilities Group plc | 6,524 | $ | 84,739 | |||||
| Vodafone Group plc | 255,688 | 733,294 | ||||||
| Whitbread plc | 1,309 | 66,435 | ||||||
|
| |||||||
| 17,043,792 | ||||||||
|
| |||||||
| United States - 0.8% | ||||||||
| Shire plc | 6,046 | 390,954 | ||||||
| Thomson Reuters Corp. (1) | 8,753 | 361,942 | ||||||
|
| |||||||
| 752,896 | ||||||||
|
| |||||||
TOTAL COMMON STOCKS |
| 87,180,178 | ||||||
|
| |||||||
| SHORT-TERM INVESTMENT - 0.5% | ||||||||
| Investment Company - 0.5% | ||||||||
J.P. Morgan U.S. Treasury Plus Money Market Fund - IM Shares, 0.22% | 419,243 | 419,243 | ||||||
|
| |||||||
TOTAL INVESTMENTS IN SECURITIES AT VALUE - 97.6% |
| 87,599,421 | ||||||
|
| |||||||
OTHER ASSETS IN EXCESS OF LIABILITIES - 2.4% (d) | 2,186,869 | |||||||
|
| |||||||
NET ASSETS - 100.0% |
| 89,786,290 | ||||||
|
| |||||||
| SECTOR | VALUE | % OF NET ASSETS | ||||||
| Consumer Discretionary | $ | 9,182,075 | 10.2 | % | ||||
| Consumer Staples | 16,461,526 | 18.3 | ||||||
| Energy | 8,079,714 | 9.0 | ||||||
| Financials | 9,174,838 | 10.2 | ||||||
| Health Care | 8,339,121 | 9.3 | ||||||
| Industrials | 10,582,178 | 11.8 | ||||||
| Information Technology | 6,263,879 | 7.0 | ||||||
| Materials | 5,818,708 | 6.5 | ||||||
| Real Estate | 3,584,385 | 4.0 | ||||||
| Telecommunication Services | 6,499,428 | 7.2 | ||||||
| Utilities | 3,194,326 | 3.6 | ||||||
| Short-Term Investment | 419,243 | 0.5 | ||||||
|
|
|
| |||||
Total Investments In Securities At Value | 87,599,421 | 97.6 | ||||||
| Other Assets in Excess of Liabilities (d) | 2,186,869 | 2.4 | ||||||
|
|
|
| |||||
Net Assets | $ | 89,786,290 | 100.0 | % | ||||
|
|
|
| |||||
| * | Non-income producing security. |
| (a) | Securities exempt from registration under Rule 144A or section 4(2), of the Securities Act of 1933. Under procedures approved by the Board of Trustees, such securities have been determined to be liquid by the investment adviser and may be resold, normally to qualified institutional buyers in transactions exempt from registration. Total value of all such securities at 9/30/2016 amounted to $572,389, which represents approximately 0.64% of net assets of the fund. |
| (b) | Security fair valued as of 9/30/2016 in accordance with procedures approved by the Board of Trustees. Total value of all such securities at 9/30/2016 amounted to $1,489, which represents approximately 0.00% of net assets of the fund. |
| The accompanying notes are an integral part of these financial statements. | (Continued) |
| AQR Funds | Annual Report | September 2016 | ||||||||||||||
133
| Schedule of Investments | September 30, 2016 |
| AQR TM INTERNATIONAL MOMENTUM STYLE FUND |
| (c) | Represents 7-day effective yield as of 9/30/2016. |
| (d) | Includes appreciation/(depreciation) on futures contracts. |
All securities are Level 2 with respect to ASC 820, unless otherwise noted in parentheses.
| (1) | Level 1 security (See Note 4). |
| (3) | Level 3 security (See Note 4). |
Abbreviations
| CVA | - Dutch Certification |
| OYJ | - Public Traded Company |
| REIT | - Real Estate Investment Trust |
| SCA | - Limited partnership with share capital |
| SGPS | - Sociedade Gestora de Participacões Sociais |
Open futures contracts outstanding at September 30, 2016:
Exchange Traded
NUMBER OF CONTRACTS | COUNTERPARTY | DESCRIPTION | EXPIRATION DATE | VALUE AT TRADE DATE | VALUE AT 2016 | UNREALIZED APPRECIATION (DEPRECIATION) | ||||||||||||||
| Long Contracts: | ||||||||||||||||||||
| 22 | JPMS | E-Mini MSCI EAFE Index Futures | 12/2016 | $1,854,424 | $1,877,370 | $22,946 | ||||||||||||||
|
|
|
|
|
| |||||||||||||||
Collateral pledged to, or (received from), each counterparty at September 30, 2016 was as follows:
| COUNTERPARTY | OVER THE COUNTER | EXCHANGE TRADED | TOTAL | |||||||||
| JPMS | ||||||||||||
| Cash | $— | $87,008 | $87,008 | |||||||||
| ||||||||||||
| The accompanying notes are an integral part of these financial statements. |
| AQR Funds | Annual Report | September 2016 | ||||||||||||||
134
| Schedule of Investments | September 30, 2016 |
| AQR LARGE CAP DEFENSIVE STYLE FUND |
| INVESTMENTS | SHARES | VALUE | ||||||
| COMMON STOCKS - 89.8% | ||||||||
| Aerospace & Defense - 2.7% | ||||||||
| Boeing Co. (The) | 59,077 | $ | 7,782,804 | |||||
| General Dynamics Corp. | 18,991 | 2,946,644 | ||||||
| Huntington Ingalls Industries, Inc. | 1,805 | 276,923 | ||||||
| Lockheed Martin Corp. | 15,030 | 3,602,992 | ||||||
| Northrop Grumman Corp. | 17,894 | 3,828,421 | ||||||
| Raytheon Co. | 16,217 | 2,207,620 | ||||||
| Rockwell Collins, Inc. | 3,469 | 292,575 | ||||||
| United Technologies Corp. | 24,858 | 2,525,573 | ||||||
|
| |||||||
| 23,463,552 | ||||||||
|
| |||||||
| Air Freight & Logistics - 1.3% | ||||||||
| CH Robinson Worldwide, Inc. | 21,854 | 1,539,833 | ||||||
| Expeditors International of Washington, Inc. | 64,274 | 3,311,396 | ||||||
| FedEx Corp. | 4,513 | 788,331 | ||||||
| United Parcel Service, Inc., Class B | 50,971 | 5,574,189 | ||||||
|
| |||||||
| 11,213,749 | ||||||||
|
| |||||||
| Airlines - 0.3% | ||||||||
| Alaska Air Group, Inc. | 21,234 | 1,398,471 | ||||||
| Southwest Airlines Co. | 34,385 | 1,337,233 | ||||||
|
| |||||||
| 2,735,704 | ||||||||
|
| |||||||
| Banks - 5.7% | ||||||||
| Bank of Hawaii Corp. | 22,724 | 1,650,217 | ||||||
| BB&T Corp. | 37,331 | 1,408,125 | ||||||
| BOK Financial Corp. | 29,063 | 2,004,475 | ||||||
| Commerce Bancshares, Inc. | 31,611 | 1,557,158 | ||||||
| Cullen/Frost Bankers, Inc. | 11,255 | 809,685 | ||||||
| East West Bancorp, Inc. | 48,904 | 1,795,266 | ||||||
| Fifth Third Bancorp | 37,592 | 769,132 | ||||||
| First Republic Bank | 2,157 | 166,326 | ||||||
| JPMorgan Chase & Co. | 28,647 | 1,907,604 | ||||||
| M&T Bank Corp. | 50,886 | 5,907,865 | ||||||
| PacWest Bancorp | 26,130 | 1,121,238 | ||||||
| People’s United Financial, Inc. | 93,869 | 1,485,007 | ||||||
| PNC Financial Services Group, Inc. (The) | 43,562 | 3,924,501 | ||||||
| Signature Bank * | 4,728 | 560,032 | ||||||
| SunTrust Banks, Inc. | 15,300 | 670,140 | ||||||
| SVB Financial Group * | 19,443 | 2,149,229 | ||||||
| TCF Financial Corp. | 153,165 | 2,222,424 | ||||||
| US Bancorp | 249,687 | 10,709,075 | ||||||
| Wells Fargo & Co. | 203,678 | 9,018,862 | ||||||
|
| |||||||
| 49,836,361 | ||||||||
|
| |||||||
| Beverages - 3.2% | ||||||||
| Brown-Forman Corp., Class B | 34,884 | 1,654,897 | ||||||
| Coca-Cola Co. (The) | 219,884 | 9,305,491 | ||||||
| Dr. Pepper Snapple Group, Inc. | 35,913 | 3,279,216 | ||||||
| Monster Beverage Corp. * | 8,803 | 1,292,369 | ||||||
| PepsiCo, Inc. | 111,655 | 12,144,714 | ||||||
|
| |||||||
| 27,676,687 | ||||||||
|
| |||||||
| Biotechnology - 0.3% | ||||||||
| United Therapeutics Corp. * | 20,509 | 2,421,703 | ||||||
|
| |||||||
| INVESTMENTS | SHARES | VALUE | ||||||
| Capital Markets - 0.7% | ||||||||
| Bank of New York Mellon Corp. (The) | 19,575 | $ | 780,651 | |||||
| CBOE Holdings, Inc. | 4,422 | 286,767 | ||||||
| FactSet Research Systems, Inc. | 7,520 | 1,218,992 | ||||||
| Franklin Resources, Inc. | 46,629 | 1,658,594 | ||||||
| T Rowe Price Group, Inc. | 9,808 | 652,232 | ||||||
| Thomson Reuters Corp. | 8,739 | 361,620 | ||||||
| Waddell & Reed Financial, Inc., Class A | 77,134 | 1,400,753 | ||||||
|
| |||||||
| 6,359,609 | ||||||||
|
| |||||||
| Chemicals - 1.8% | ||||||||
| Air Products & Chemicals, Inc. | 6,134 | 922,186 | ||||||
| Ecolab, Inc. | 26,065 | 3,172,632 | ||||||
| GCP Applied Technologies, Inc. * | 12,955 | 366,886 | ||||||
| International Flavors & Fragrances, Inc. | 1,127 | 161,127 | ||||||
| NewMarket Corp. | 2,460 | 1,056,127 | ||||||
| PPG Industries, Inc. | 46,291 | 4,784,638 | ||||||
| Praxair, Inc. | 7,705 | 930,995 | ||||||
| Sherwin-Williams Co. (The) | 16,075 | 4,447,309 | ||||||
|
| |||||||
| 15,841,900 | ||||||||
|
| |||||||
| Commercial Services & Supplies - 1.8% | ||||||||
| Cintas Corp. | 4,682 | 527,193 | ||||||
| Clean Harbors, Inc. * | 12,491 | 599,318 | ||||||
| Republic Services, Inc. | 93,501 | 4,717,125 | ||||||
| Rollins, Inc. | 35,221 | 1,031,271 | ||||||
| Stericycle, Inc. * | 18,684 | 1,497,336 | ||||||
| Waste Connections, Inc. (Canada) | 4,300 | 321,210 | ||||||
| Waste Management, Inc. | 111,731 | 7,123,969 | ||||||
|
| |||||||
| 15,817,422 | ||||||||
|
| |||||||
| Communications Equipment - 0.9% | ||||||||
| Arista Networks, Inc. * | 17,410 | 1,481,243 | ||||||
| Cisco Systems, Inc. | 141,972 | 4,503,352 | ||||||
| F5 Networks, Inc. * | 12,290 | 1,531,825 | ||||||
| Palo Alto Networks, Inc. * | 975 | 155,347 | ||||||
|
| |||||||
| 7,671,767 | ||||||||
|
| |||||||
| Construction & Engineering - 0.3% | ||||||||
| Jacobs Engineering Group, Inc. * | 18,908 | 977,922 | ||||||
| Quanta Services, Inc. * | 51,002 | 1,427,546 | ||||||
|
| |||||||
| 2,405,468 | ||||||||
|
| |||||||
| Consumer Finance - 0.8% | ||||||||
| American Express Co. | 33,931 | 2,172,941 | ||||||
| Capital One Financial Corp. | 25,827 | 1,855,153 | ||||||
| Discover Financial Services | 35,735 | 2,020,814 | ||||||
| SLM Corp. * | 98,499 | 735,788 | ||||||
|
| |||||||
| 6,784,696 | ||||||||
|
| |||||||
| Containers & Packaging - 0.0% (a) | ||||||||
| Avery Dennison Corp. | 2,810 | 218,590 | ||||||
|
| |||||||
| Distributors - 0.2% | ||||||||
| Genuine Parts Co. | 15,086 | 1,515,389 | ||||||
|
| |||||||
| Diversified Consumer Services - 0.4% | ||||||||
| H&R Block, Inc. | 152,281 | 3,525,305 | ||||||
|
| |||||||
| The accompanying notes are an integral part of these financial statements. | (Continued) |
| AQR Funds | Annual Report | September 2016 | ||||||||||||||
135
| Schedule of Investments | September 30, 2016 |
| AQR LARGE CAP DEFENSIVE STYLE FUND |
| INVESTMENTS | SHARES | VALUE | ||||||
| Diversified Telecommunication Services - 2.1% | ||||||||
| AT&T, Inc. | 214,076 | $ | 8,693,626 | |||||
| Verizon Communications, Inc. | 185,020 | 9,617,340 | ||||||
|
| |||||||
| 18,310,966 | ||||||||
|
| |||||||
| Electric Utilities - 4.6% | ||||||||
| Alliant Energy Corp. | 4,744 | 181,743 | ||||||
| American Electric Power Co., Inc. | 105,096 | 6,748,214 | ||||||
| Duke Energy Corp. | 53,406 | 4,274,616 | ||||||
| Edison International | 17,002 | 1,228,394 | ||||||
| Entergy Corp. | 14,372 | 1,102,764 | ||||||
| Eversource Energy | 5,106 | 276,643 | ||||||
| Exelon Corp. | 40,444 | 1,346,381 | ||||||
| NextEra Energy, Inc. | 39,418 | 4,821,610 | ||||||
| OGE Energy Corp. | 95,514 | 3,020,153 | ||||||
| PG&E Corp. | 45,025 | 2,754,179 | ||||||
| Pinnacle West Capital Corp. | 72,555 | 5,513,454 | ||||||
| PPL Corp. | 34,422 | 1,189,968 | ||||||
| Southern Co. (The) | 94,423 | 4,843,900 | ||||||
| Xcel Energy, Inc. | 73,033 | 3,004,578 | ||||||
|
| |||||||
| 40,306,597 | ||||||||
|
| |||||||
| Electrical Equipment - 0.3% | ||||||||
| Acuity Brands, Inc. | 1,756 | 464,637 | ||||||
| Emerson Electric Co. | 8,792 | 479,252 | ||||||
| Rockwell Automation, Inc. | 10,199 | 1,247,746 | ||||||
|
| |||||||
| 2,191,635 | ||||||||
|
| |||||||
| Electronic Equipment, Instruments & Components - 0.3% | ||||||||
| FLIR Systems, Inc. | 42,716 | 1,342,137 | ||||||
| National Instruments Corp. | 34,094 | 968,269 | ||||||
|
| |||||||
| 2,310,406 | ||||||||
|
| |||||||
| Food & Staples Retailing - 3.2% | ||||||||
| Costco Wholesale Corp. | 40,612 | 6,193,736 | ||||||
| CVS Health Corp. | 32,834 | 2,921,898 | ||||||
| Kroger Co. (The) | 29,402 | 872,651 | ||||||
| Sysco Corp. | 114,615 | 5,617,281 | ||||||
| Walgreens Boots Alliance, Inc. | 21,882 | 1,764,127 | ||||||
| Wal-Mart Stores, Inc. | 142,704 | 10,291,813 | ||||||
|
| |||||||
| 27,661,506 | ||||||||
|
| |||||||
| Food Products - 2.7% | ||||||||
| Campbell Soup Co. | 36,656 | 2,005,083 | ||||||
| Flowers Foods, Inc. | 16,899 | 255,513 | ||||||
| General Mills, Inc. | 70,732 | 4,518,360 | ||||||
| Hershey Co. (The) | 57,299 | 5,477,784 | ||||||
| Hormel Foods Corp. | 34,256 | 1,299,330 | ||||||
| Kellogg Co. | 11,287 | 874,404 | ||||||
| McCormick & Co., Inc. | 36,172 | 3,614,306 | ||||||
| Mead Johnson Nutrition Co. | 56,797 | 4,487,531 | ||||||
| Mondelez International, Inc., Class A | 10,896 | 478,335 | ||||||
| Tyson Foods, Inc., Class A | 2,366 | 176,669 | ||||||
|
| |||||||
| 23,187,315 | ||||||||
|
| |||||||
| Gas Utilities - 0.9% | ||||||||
| Atmos Energy Corp. | 41,011 | 3,054,089 | ||||||
| UGI Corp. | 99,017 | 4,479,529 | ||||||
|
| |||||||
| 7,533,618 | ||||||||
|
| |||||||
| INVESTMENTS | SHARES | VALUE | ||||||
| Health Care Equipment & Supplies - 3.4% | ||||||||
| Abbott Laboratories | 24,500 | $ | 1,036,105 | |||||
| Align Technology, Inc. * | 19,351 | 1,814,156 | ||||||
| Baxter International, Inc. | 4,311 | 205,204 | ||||||
| Becton Dickinson and Co. | 8,589 | 1,543,701 | ||||||
| CR Bard, Inc. | 18,080 | 4,054,982 | ||||||
| Danaher Corp. | 37,871 | 2,968,708 | ||||||
| DENTSPLY SIRONA, Inc. | 1,908 | 113,392 | ||||||
| DexCom, Inc. * | 12,105 | 1,061,124 | ||||||
| Edwards Lifesciences Corp. * | 13,258 | 1,598,385 | ||||||
| IDEXX Laboratories, Inc. * | 3,584 | 404,024 | ||||||
| Intuitive Surgical, Inc. * | 4,403 | 3,191,427 | ||||||
| Medtronic plc | 45,754 | 3,953,146 | ||||||
| ResMed, Inc. | 41,432 | 2,684,379 | ||||||
| Stryker Corp. | 32,696 | 3,806,141 | ||||||
| Varian Medical Systems, Inc. * | 14,097 | 1,403,074 | ||||||
| Zimmer Biomet Holdings, Inc. | 1,077 | 140,032 | ||||||
|
| |||||||
| 29,977,980 | ||||||||
|
| |||||||
| Health Care Providers & Services - 2.9% | ||||||||
| Aetna, Inc. | 28,980 | 3,345,741 | ||||||
| AmerisourceBergen Corp. | 14,583 | 1,178,015 | ||||||
| Anthem, Inc. | 41,051 | 5,144,101 | ||||||
| Cardinal Health, Inc. | 39,408 | 3,062,002 | ||||||
| Express Scripts Holding Co. * | 1,500 | 105,795 | ||||||
| Henry Schein, Inc. * | 18,105 | 2,950,753 | ||||||
| McKesson Corp. | 5,902 | 984,158 | ||||||
| UnitedHealth Group, Inc. | 61,697 | 8,637,580 | ||||||
|
| |||||||
| 25,408,145 | ||||||||
|
| |||||||
| Health Care Technology - 0.0% (a) | ||||||||
| athenahealth, Inc. * | 1,051 | 132,552 | ||||||
| Cerner Corp. * | 1,797 | 110,965 | ||||||
|
| |||||||
| 243,517 | ||||||||
|
| |||||||
| Hotels, Restaurants & Leisure - 3.1% | ||||||||
| Chipotle Mexican Grill, Inc. * | 3,543 | 1,500,460 | ||||||
| Darden Restaurants, Inc. | 49,546 | 3,038,161 | ||||||
| Domino’s Pizza, Inc. | 7,900 | 1,199,615 | ||||||
| McDonald’s Corp. | 65,370 | 7,541,083 | ||||||
| Panera Bread Co., Class A * | 8,133 | 1,583,658 | ||||||
| Starbucks Corp. | 106,789 | 5,781,556 | ||||||
| Yum! Brands, Inc. | 74,360 | 6,752,632 | ||||||
|
| |||||||
| 27,397,165 | ||||||||
|
| |||||||
| Household Durables - 0.1% | ||||||||
| Garmin Ltd. | 17,021 | 818,880 | ||||||
| Tupperware Brands Corp. | 7,624 | 498,381 | ||||||
|
| |||||||
| 1,317,261 | ||||||||
|
| |||||||
| Household Products - 3.5% | ||||||||
| Church & Dwight Co., Inc. | 87,510 | 4,193,479 | ||||||
| Clorox Co. (The) | 17,292 | 2,164,613 | ||||||
| Colgate-Palmolive Co. | 114,208 | 8,467,381 | ||||||
| Kimberly-Clark Corp. | 27,568 | 3,477,427 | ||||||
| Procter & Gamble Co. (The) | 139,404 | 12,511,509 | ||||||
|
| |||||||
| 30,814,409 | ||||||||
|
| |||||||
| Industrial Conglomerates - 2.2% | ||||||||
| 3M Co. | 67,632 | 11,918,787 | ||||||
| General Electric Co. | 68,722 | 2,035,546 | ||||||
| The accompanying notes are an integral part of these financial statements. | (Continued) |
| AQR Funds | Annual Report | September 2016 | ||||||||||||||
136
| Schedule of Investments | September 30, 2016 |
| AQR LARGE CAP DEFENSIVE STYLE FUND |
| INVESTMENTS | SHARES | VALUE | ||||||
| Industrial Conglomerates - 2.2% (continued) | ||||||||
| Honeywell International, Inc. | 47,643 | $ | 5,554,697 | |||||
|
| |||||||
| 19,509,030 | ||||||||
|
| |||||||
| Insurance - 9.1% | ||||||||
| Aflac, Inc. | 18,698 | 1,343,825 | ||||||
| Alleghany Corp. * | 5,461 | 2,867,134 | ||||||
| Allied World Assurance Co. Holdings AG | 3,826 | 154,647 | ||||||
| Allstate Corp. (The) | 154,075 | 10,658,908 | ||||||
| American Financial Group, Inc. | 26,731 | 2,004,825 | ||||||
| American National Insurance Co. | 930 | 113,423 | ||||||
| AmTrust Financial Services, Inc. | 6,465 | 173,456 | ||||||
| Aon plc | 33,361 | 3,752,779 | ||||||
| Arch Capital Group Ltd. * | 35,822 | 2,839,252 | ||||||
| Arthur J Gallagher & Co. | 2,692 | 136,942 | ||||||
| Aspen Insurance Holdings Ltd. | 7,554 | 351,941 | ||||||
| Assurant, Inc. | 10,450 | 964,012 | ||||||
| Assured Guaranty Ltd. | 45,590 | 1,265,123 | ||||||
| Axis Capital Holdings Ltd. | 34,907 | 1,896,497 | ||||||
| Chubb Ltd. | 49,972 | 6,278,982 | ||||||
| Cincinnati Financial Corp. | 8,018 | 604,718 | ||||||
| CNA Financial Corp. | 12,957 | 445,850 | ||||||
| Endurance Specialty Holdings Ltd. | 4,132 | 270,439 | ||||||
| Erie Indemnity Co., Class A | 4,434 | 452,578 | ||||||
| Everest Re Group Ltd. | 39,699 | 7,541,619 | ||||||
| FNF Group | 41,210 | 1,521,061 | ||||||
| Markel Corp. * | 2,809 | 2,608,915 | ||||||
| Marsh & McLennan Cos., Inc. | 45,067 | 3,030,756 | ||||||
| Mercury General Corp. | 9,147 | 501,713 | ||||||
| ProAssurance Corp. | 13,873 | 728,055 | ||||||
| Progressive Corp. (The) | 328,769 | 10,356,223 | ||||||
| RenaissanceRe Holdings Ltd. | 24,254 | 2,914,361 | ||||||
| Travelers Cos., Inc. (The) | 75,072 | 8,599,498 | ||||||
| Validus Holdings Ltd. | 25,539 | 1,272,353 | ||||||
| White Mountains Insurance Group Ltd. | 1,688 | 1,401,040 | ||||||
| WR Berkley Corp. | 44,921 | 2,594,637 | ||||||
|
| |||||||
| 79,645,562 | ||||||||
|
| |||||||
| Internet & Direct Marketing Retail - 0.7% | ||||||||
| Amazon.com, Inc. * | 4,737 | 3,966,338 | ||||||
| Priceline Group, Inc. (The) * | 454 | 668,056 | ||||||
| TripAdvisor, Inc. * | 24,523 | 1,549,363 | ||||||
|
| |||||||
| 6,183,757 | ||||||||
|
| |||||||
| Internet Software & Services - 1.2% | ||||||||
| Alphabet, Inc., Class A * | 9,188 | 7,387,703 | ||||||
| Facebook, Inc., Class A * | 23,135 | 2,967,527 | ||||||
|
| |||||||
| 10,355,230 | ||||||||
|
| |||||||
| IT Services - 4.9% | ||||||||
| Accenture plc, Class A | 47,995 | 5,863,549 | ||||||
| Amdocs Ltd. | 43,899 | 2,539,557 | ||||||
| Automatic Data Processing, Inc. | 58,112 | 5,125,478 | ||||||
| Cognizant Technology Solutions Corp., Class A * | 18,229 | 869,706 | ||||||
| Gartner, Inc. * | 10,705 | 946,857 | ||||||
| International Business Machines Corp. | 30,490 | 4,843,337 | ||||||
| Jack Henry & Associates, Inc. | 19,887 | 1,701,333 | ||||||
| MasterCard, Inc., Class A | 78,182 | 7,956,582 | ||||||
| Paychex, Inc. | 48,392 | 2,800,445 | ||||||
| INVESTMENTS | SHARES | VALUE | ||||||
| IT Services - 4.9% (continued) | ||||||||
| Teradata Corp. * | 45,994 | $ | 1,425,814 | |||||
| Visa, Inc., Class A | 107,589 | 8,897,610 | ||||||
|
| |||||||
| 42,970,268 | ||||||||
|
| |||||||
| Leisure Products - 0.3% | ||||||||
| Hasbro, Inc. | 13,332 | 1,057,628 | ||||||
| Polaris Industries, Inc. | 17,133 | 1,326,779 | ||||||
|
| |||||||
| 2,384,407 | ||||||||
|
| |||||||
| Life Sciences Tools & Services - 0.9% | ||||||||
| Bruker Corp. | 43,024 | 974,494 | ||||||
| Mettler-Toledo International, Inc. * | 9,148 | 3,840,605 | ||||||
| Thermo Fisher Scientific, Inc. | 7,310 | 1,162,728 | ||||||
| Waters Corp. * | 9,483 | 1,502,961 | ||||||
|
| |||||||
| 7,480,788 | ||||||||
|
| |||||||
| Machinery - 0.2% | ||||||||
| Cummins, Inc. | 9,380 | 1,202,047 | ||||||
| Fortive Corp. | 18,935 | 963,792 | ||||||
|
| |||||||
| 2,165,839 | ||||||||
|
| |||||||
| Media - 0.7% | ||||||||
| Comcast Corp., Class A | 31,153 | 2,066,690 | ||||||
| Time Warner, Inc. | 9,866 | 785,432 | ||||||
| Walt Disney Co. (The) | 37,166 | 3,451,235 | ||||||
|
| |||||||
| 6,303,357 | ||||||||
|
| |||||||
| Multiline Retail - 0.7% | ||||||||
| Dollar General Corp. | 2,882 | 201,711 | ||||||
| Dollar Tree, Inc. * | 5,936 | 468,529 | ||||||
| Target Corp. | 75,308 | 5,172,153 | ||||||
|
| |||||||
| 5,842,393 | ||||||||
|
| |||||||
| Multi-Utilities - 3.4% | ||||||||
| Ameren Corp. | 104,675 | 5,147,916 | ||||||
| CenterPoint Energy, Inc. | 24,123 | 560,377 | ||||||
| Consolidated Edison, Inc. | 56,520 | 4,255,956 | ||||||
| Dominion Resources, Inc. | 41,636 | 3,092,306 | ||||||
| DTE Energy Co. | 17,646 | 1,652,901 | ||||||
| Public Service Enterprise Group, Inc. | 215,330 | 9,015,867 | ||||||
| Sempra Energy | 38,003 | 4,073,542 | ||||||
| Vectren Corp. | 26,686 | 1,339,637 | ||||||
| WEC Energy Group, Inc. | 2,429 | 145,449 | ||||||
|
| |||||||
| 29,283,951 | ||||||||
|
| |||||||
| Oil, Gas & Consumable Fuels - 0.5% | ||||||||
| Chevron Corp. | 7,315 | 752,860 | ||||||
| ConocoPhillips | 6,264 | 272,296 | ||||||
| Exxon Mobil Corp. | 41,849 | 3,652,581 | ||||||
|
| |||||||
| 4,677,737 | ||||||||
|
| |||||||
| Personal Products - 0.9% | ||||||||
| Estee Lauder Cos., Inc. (The), Class A | 71,110 | 6,297,502 | ||||||
| Nu Skin Enterprises, Inc., Class A | 21,472 | 1,390,956 | ||||||
|
| |||||||
| 7,688,458 | ||||||||
|
| |||||||
| Pharmaceuticals - 3.0% | ||||||||
| Bristol-Myers Squibb Co. | 39,560 | 2,133,075 | ||||||
| Eli Lilly & Co. | 56,771 | 4,556,441 | ||||||
| Jazz Pharmaceuticals plc * | 784 | 95,240 | ||||||
| Johnson & Johnson | 97,703 | 11,541,655 | ||||||
| Merck & Co., Inc. | 78,605 | 4,905,738 | ||||||
| The accompanying notes are an integral part of these financial statements. | (Continued) |
| AQR Funds | Annual Report | September 2016 | ||||||||||||||
137
| Schedule of Investments | September 30, 2016 |
| AQR LARGE CAP DEFENSIVE STYLE FUND |
| INVESTMENTS | SHARES | VALUE | ||||||
| Pharmaceuticals - 3.0% (continued) | ||||||||
| Pfizer, Inc. | 95,618 | $ | 3,238,582 | |||||
| Zoetis, Inc. | 2,245 | 116,763 | ||||||
|
| |||||||
| 26,587,494 | ||||||||
|
| |||||||
| Professional Services - 0.2% | ||||||||
| Equifax, Inc. | 3,815 | 513,423 | ||||||
| Robert Half International, Inc. | 35,346 | 1,338,199 | ||||||
|
| |||||||
| 1,851,622 | ||||||||
|
| |||||||
| Road & Rail - 0.4% | ||||||||
| Landstar System, Inc. | 29,452 | 2,005,092 | ||||||
| Union Pacific Corp. | 17,526 | 1,709,311 | ||||||
|
| |||||||
| 3,714,403 | ||||||||
|
| |||||||
| Semiconductors & Semiconductor Equipment - 2.0% | ||||||||
| Analog Devices, Inc. | 11,256 | 725,449 | ||||||
| Intel Corp. | 81,419 | 3,073,567 | ||||||
| Linear Technology Corp. | 91,099 | 5,401,260 | ||||||
| Maxim Integrated Products, Inc. | 22,045 | 880,257 | ||||||
| NVIDIA Corp. | 44,112 | 3,022,554 | ||||||
| QUALCOMM, Inc. | 16,138 | 1,105,453 | ||||||
| Texas Instruments, Inc. | 46,659 | 3,274,529 | ||||||
|
| |||||||
| 17,483,069 | ||||||||
|
| |||||||
| Software - 1.8% | ||||||||
| Adobe Systems, Inc. * | 20,694 | 2,246,127 | ||||||
| ANSYS, Inc. * | 3,405 | 315,337 | ||||||
| Intuit, Inc. | 44,394 | 4,883,784 | ||||||
| Microsoft Corp. | 109,466 | 6,305,241 | ||||||
| Oracle Corp. | 45,207 | 1,775,731 | ||||||
|
| |||||||
| 15,526,220 | ||||||||
|
| |||||||
| Specialty Retail - 3.3% | ||||||||
| AutoZone, Inc. * | 1,858 | 1,427,576 | ||||||
| Bed Bath & Beyond, Inc. | 26,933 | 1,161,082 | ||||||
| Dick’s Sporting Goods, Inc. | 11,887 | 674,231 | ||||||
| Home Depot, Inc. (The) | 60,416 | 7,774,331 | ||||||
| Lowe’s Cos., Inc. | 56,776 | 4,099,795 | ||||||
| O’Reilly Automotive, Inc. * | 14,951 | 4,187,924 | ||||||
| Ross Stores, Inc. | 2,194 | 141,074 | ||||||
| TJX Cos., Inc. (The) | 73,255 | 5,478,009 | ||||||
| Tractor Supply Co. | 28,093 | 1,892,063 | ||||||
| Ulta Salon Cosmetics & Fragrance, Inc. * | 2,099 | 499,520 | ||||||
| Williams-Sonoma, Inc. | 37,149 | 1,897,571 | ||||||
|
| |||||||
| 29,233,176 | ||||||||
|
| |||||||
| Technology Hardware, Storage & Peripherals - 0.4% | ||||||||
| Apple, Inc. | 27,726 | 3,134,424 | ||||||
|
| |||||||
| Textiles, Apparel & Luxury Goods - 0.3% | ||||||||
| NIKE, Inc., Class B | 45,508 | 2,395,996 | ||||||
| Ralph Lauren Corp. | 1,522 | 153,935 | ||||||
| VF Corp. | 2,718 | 152,344 | ||||||
|
| |||||||
| 2,702,275 | ||||||||
|
| |||||||
| Thrifts & Mortgage Finance - 0.4% | ||||||||
| New York Community Bancorp, Inc. | 191,734 | 2,728,375 | ||||||
| TFS Financial Corp. | 20,441 | 364,054 | ||||||
|
| |||||||
| 3,092,429 | ||||||||
|
| |||||||
| INVESTMENTS | SHARES | VALUE | ||||||
| Tobacco - 3.6% | ||||||||
| Altria Group, Inc. | 171,448 | $ | 10,840,657 | |||||
| Philip Morris International, Inc. | 113,503 | 11,034,762 | ||||||
| Reynolds American, Inc. | 197,139 | 9,295,104 | ||||||
|
| |||||||
| 31,170,523 | ||||||||
|
| |||||||
| Trading Companies & Distributors - 0.4% | ||||||||
| Fastenal Co. | 38,809 | 1,621,440 | ||||||
| WW Grainger, Inc. | 10,238 | 2,301,912 | ||||||
|
| |||||||
| 3,923,352 | ||||||||
|
| |||||||
| Water Utilities - 0.8% | ||||||||
| American Water Works Co., Inc. | 67,884 | 5,080,438 | ||||||
| Aqua America, Inc. | 74,335 | 2,265,731 | ||||||
|
| |||||||
| 7,346,169 | ||||||||
|
| |||||||
TOTAL COMMON STOCKS |
| 784,404,355 | ||||||
|
| |||||||
| SHORT-TERM INVESTMENT - 9.7% | ||||||||
| Investment Company - 9.7% | ||||||||
J.P. Morgan U.S. Treasury Plus Money Market Fund - IM Shares, 0.22% | 84,487,198 | 84,487,198 | ||||||
|
| |||||||
TOTAL INVESTMENTS IN SECURITIES AT VALUE - 99.5% |
| 868,891,553 | ||||||
|
| |||||||
OTHER ASSETS IN EXCESS OF LIABILITIES - 0.5% (c) | 4,423,208 | |||||||
|
| |||||||
NET ASSETS - 100.0% | 873,314,761 | |||||||
|
| |||||||
| SECTOR | VALUE | % OF NET ASSETS | ||||||
| Consumer Discretionary | $ | 86,404,486 | 9.9 | % | ||||
| Consumer Staples | 148,198,897 | 17.0 | ||||||
| Energy | 4,677,737 | 0.5 | ||||||
| Financials | 145,718,658 | 16.7 | ||||||
| Health Care | 92,119,626 | 10.5 | ||||||
| Industrials | 88,991,775 | 10.2 | ||||||
| Information Technology | 99,451,385 | 11.4 | ||||||
| Materials | 16,060,490 | 1.8 | ||||||
| Telecommunication Services | 18,310,966 | 2.1 | ||||||
| Utilities | 84,470,335 | 9.7 | ||||||
| Short-Term Investment | 84,487,198 | 9.7 | ||||||
|
|
|
| |||||
Total Investments In Securities At Value | 868,891,553 | 99.5 | ||||||
| Other Assets in Excess of Liabilities (c) | 4,423,208 | 0.5 | ||||||
|
|
|
| |||||
Net Assets | $ | 873,314,761 | 100.0 | % | ||||
|
|
|
| |||||
All securities are United States companies, unless noted otherwise in parentheses.
| * | Non-income producing security. |
| (a) | Represents less than 0.05% of net assets. |
| (b) | Represents 7-day effective yield as of 9/30/2016. |
| (c) | Includes appreciation/(depreciation) on futures contracts. |
| The accompanying notes are an integral part of these financial statements. | (Continued) |
| AQR Funds | Annual Report | September 2016 | ||||||||||||||
138
| Schedule of Investments | September 30, 2016 |
| AQR LARGE CAP DEFENSIVE STYLE FUND |
All securities are Level 1 with respect to ASC 820, unless otherwise noted in parentheses.
| (2) | Level 2 security (See Note 4). |
Open futures contracts outstanding at September 30, 2016:
Exchange Traded
| NUMBER OF CONTRACTS | COUNTERPARTY | DESCRIPTION | EXPIRATION DATE | VALUE AT TRADE DATE | VALUE AT 2016 | UNREALIZED APPRECIATION (DEPRECIATION) | ||||||||||||||
| Long Contracts: | ||||||||||||||||||||
| 741 | GSCO | S&P 500 E-Mini Futures | 12/2016 | $79,488,446 | $80,042,820 | $554,374 | ||||||||||||||
|
|
|
|
|
| |||||||||||||||
Collateral pledged to, or (received from), each counterparty at September 30, 2016 was as follows:
| COUNTERPARTY | OVER THE COUNTER | EXCHANGE TRADED | TOTAL | |||||||||
| GSCO | ||||||||||||
| Cash | $— | $2,996,624 | $2,996,624 | |||||||||
| ||||||||||||
| The accompanying notes are an integral part of these financial statements. |
| AQR Funds | Annual Report | September 2016 | ||||||||||||||
139
| Schedule of Investments | September 30, 2016 |
| AQR INTERNATIONAL DEFENSIVE STYLE FUND |
| INVESTMENTS | SHARES | VALUE | ||||||
| COMMON STOCKS - 95.4% | ||||||||
| Australia - 9.3% | ||||||||
| AGL Energy Ltd. | 99,826 | $ | 1,461,484 | |||||
| Aurizon Holdings Ltd. | 65,334 | 236,224 | ||||||
| AusNet Services | 94,515 | 119,129 | ||||||
| Australia & New Zealand Banking Group Ltd. | 15,115 | 321,973 | ||||||
| Caltex Australia Ltd. | 47,742 | 1,262,240 | ||||||
| Coca-Cola Amatil Ltd. | 44,821 | 353,420 | ||||||
| Cochlear Ltd. | 8,470 | 918,089 | ||||||
| Commonwealth Bank of Australia | 2,420 | 134,947 | ||||||
| CSL Ltd. | 2,683 | 220,625 | ||||||
| Flight Centre Travel Group Ltd. | 22,994 | 643,707 | ||||||
| Harvey Norman Holdings Ltd. | 6,317 | 25,287 | ||||||
| Medibank Pvt Ltd. | 39,354 | 74,969 | ||||||
| Newcrest Mining Ltd. | 22,851 | 385,728 | ||||||
| REA Group Ltd. | 2,498 | 108,651 | ||||||
| South32 Ltd. | 105,146 | 195,910 | ||||||
| Tabcorp Holdings Ltd. | 36,300 | 139,005 | ||||||
| Tatts Group Ltd. | 92,466 | 259,882 | ||||||
| Telstra Corp. Ltd. | 483,721 | 1,928,651 | ||||||
| TPG Telecom Ltd. | 5,439 | 36,092 | ||||||
| Wesfarmers Ltd. | 39,834 | 1,350,418 | ||||||
| Westpac Banking Corp. | 12,201 | 277,599 | ||||||
| Woolworths Ltd. | 102,695 | 1,838,626 | ||||||
|
| |||||||
| 12,292,656 | ||||||||
|
| |||||||
| Austria - 0.1% | ||||||||
| OMV AG | 3,730 | 107,394 | ||||||
|
| |||||||
| Belgium - 1.3% | ||||||||
| Anheuser-Busch InBev SA/NV | 2,115 | 278,139 | ||||||
| Colruyt SA | 14,514 | 806,044 | ||||||
| Groupe Bruxelles Lambert SA | 618 | 54,855 | ||||||
| Proximus SADP | 20,390 | 609,987 | ||||||
| UCB SA | 608 | 47,063 | ||||||
|
| |||||||
| 1,796,088 | ||||||||
|
| |||||||
| Canada - 11.2% | ||||||||
| Agnico Eagle Mines Ltd. (1) | 13,992 | 756,685 | ||||||
| Alimentation Couche-Tard, Inc., Class B (1) | 5,454 | 264,313 | ||||||
| Bank of Montreal (1) | 8,480 | 555,681 | ||||||
| Bank of Nova Scotia (The) (1) | 8,954 | 474,471 | ||||||
| Barrick Gold Corp. (1) | 39,663 | 702,292 | ||||||
| BCE, Inc. (1) | 41,213 | 1,903,347 | ||||||
| Cameco Corp. (1) | 15,350 | 131,159 | ||||||
| Canadian Imperial Bank of Commerce (1) | 6,593 | 511,228 | ||||||
| Canadian National Railway Co. (1) | 10,709 | 700,030 | ||||||
| Canadian Utilities Ltd., Class A (1) | 2,168 | 61,176 | ||||||
| CI Financial Corp. (1) | 36,953 | 708,950 | ||||||
| Eldorado Gold Corp. (1)* | 17,190 | 67,610 | ||||||
| Empire Co. Ltd., Class A (1) | 21,226 | 316,622 | ||||||
| Fairfax Financial Holdings Ltd. (1) | 132 | 77,344 | ||||||
| Fortis, Inc. (1) | 8,102 | 260,546 | ||||||
| Franco-Nevada Corp. (1) | 7,835 | 547,396 | ||||||
| George Weston Ltd. (1) | 4,173 | 348,102 | ||||||
| Goldcorp, Inc. (1) | 21,923 | 361,777 | ||||||
| Intact Financial Corp. (1) | 13,650 | 986,749 | ||||||
| Kinross Gold Corp. (1)* | 96,966 | 408,721 | ||||||
| Loblaw Cos. Ltd. (1) | 12,680 | 652,388 | ||||||
| INVESTMENTS | SHARES | VALUE | ||||||
| Canada - 11.2% (continued) | ||||||||
| Metro, Inc. (1) | 9,075 | $ | 297,923 | |||||
| Power Financial Corp. (1) | 15,418 | 357,260 | ||||||
| Rogers Communications, Inc., Class B (1) | 8,139 | 345,300 | ||||||
| Royal Bank of Canada (1) | 11,639 | 720,900 | ||||||
| Saputo, Inc. (1) | 21,629 | 751,603 | ||||||
| Shaw Communications, Inc., Class B (1) | 12,674 | 259,382 | ||||||
| Silver Wheaton Corp. (1) | 19,260 | 520,275 | ||||||
| Toronto-Dominion Bank (The) (1) | 15,460 | 686,299 | ||||||
| Yamana Gold, Inc. (1) | 27,393 | 117,970 | ||||||
|
| |||||||
| 14,853,499 | ||||||||
|
| |||||||
| China - 0.1% | ||||||||
| Yangzijiang Shipbuilding Holdings Ltd. | 283,000 | 156,552 | ||||||
|
| |||||||
| Denmark - 2.4% | ||||||||
| Coloplast A/S, Class B | 18,008 | 1,400,506 | ||||||
| Danske Bank A/S | 3,404 | 99,587 | ||||||
| DSV A/S | 5,466 | 272,727 | ||||||
| ISS A/S | 3,044 | 126,493 | ||||||
| Novo Nordisk A/S, Class B | 28,962 | 1,207,099 | ||||||
| Novozymes A/S, Class B | 1,119 | 49,354 | ||||||
|
| |||||||
| 3,155,766 | ||||||||
|
| |||||||
| Finland - 0.9% | ||||||||
| Kone OYJ, Class B | 8,149 | 413,701 | ||||||
| Orion OYJ, Class B | 11,226 | 442,570 | ||||||
| Sampo OYJ, Class A | 8,074 | 358,707 | ||||||
|
| |||||||
| 1,214,978 | ||||||||
|
| |||||||
| France - 6.2% | ||||||||
| Aeroports de Paris | 2,096 | 207,978 | ||||||
| BNP Paribas SA | 4,427 | 227,696 | ||||||
| Bouygues SA | 1,651 | 54,753 | ||||||
| Cie Generale des Etablissements Michelin | 2,529 | 280,049 | ||||||
| Danone SA | 7,879 | 585,038 | ||||||
| Dassault Systemes | 4,699 | 407,922 | ||||||
| Electricite de France SA | 8,768 | 106,726 | ||||||
| Engie SA | 15,483 | 240,059 | ||||||
| Essilor International SA | 289 | 37,280 | ||||||
| Hermes International | 1,902 | 774,326 | ||||||
| Iliad SA | 1,040 | 218,334 | ||||||
| Imerys SA | 2,048 | 147,921 | ||||||
| Lagardere SCA | 3,911 | 99,599 | ||||||
| L’Oreal SA | 8,340 | 1,576,340 | ||||||
| Pernod Ricard SA | 898 | 106,354 | ||||||
| Sanofi | 3,386 | 257,847 | ||||||
| SCOR SE | 2,005 | 62,351 | ||||||
| Societe BIC SA | 4,569 | 675,524 | ||||||
| Societe Generale SA | 3,534 | 122,256 | ||||||
| Sodexo SA | 4,294 | 511,501 | ||||||
| Suez | 2,973 | 49,130 | ||||||
| Thales SA | 5,982 | 550,828 | ||||||
| TOTAL SA | 14,474 | 688,392 | ||||||
| Vinci SA | 3,224 | 246,889 | ||||||
|
| |||||||
| 8,235,093 | ||||||||
|
| |||||||
| Germany - 3.4% | ||||||||
| Allianz SE | 1,007 | 149,651 | ||||||
| Bayer AG | 2,729 | 274,074 | ||||||
| Beiersdorf AG | 7,238 | 683,217 | ||||||
| The accompanying notes are an integral part of these financial statements. | (Continued) |
| AQR Funds | Annual Report | September 2016 | ||||||||||||||
140
| Schedule of Investments | September 30, 2016 |
| AQR INTERNATIONAL DEFENSIVE STYLE FUND |
| INVESTMENTS | SHARES | VALUE | ||||||
| Germany - 3.4% (continued) | ||||||||
| Covestro AG (a) | 1,095 | $ | 64,800 | |||||
| Deutsche Post AG | 1,190 | 37,257 | ||||||
| Fresenius Medical Care AG & Co. KGaA | 589 | 51,529 | ||||||
| Hannover Rueck SE | 529 | 56,706 | ||||||
| HUGO BOSS AG | 3,855 | 213,395 | ||||||
| MAN SE | 18,018 | 1,900,410 | ||||||
| Merck KGaA | 458 | 49,402 | ||||||
| METRO AG | 15,705 | 467,472 | ||||||
| Muenchener Rueckversicherungs-Gesellschaft AG in Muenchen | 1,366 | 255,122 | ||||||
| SAP SE | 3,136 | 286,795 | ||||||
| Siemens AG | 338 | 39,634 | ||||||
| TUI AG | 3,797 | 53,955 | ||||||
|
| |||||||
| 4,583,419 | ||||||||
|
| |||||||
| Hong Kong - 4.6% | ||||||||
| BOC Hong Kong Holdings Ltd. | 43,500 | 148,004 | ||||||
| CK Hutchison Holdings Ltd. | 9,000 | 115,040 | ||||||
| CLP Holdings Ltd. | 107,000 | 1,108,206 | ||||||
| Galaxy Entertainment Group Ltd. | 79,000 | 300,416 | ||||||
| Hang Seng Bank Ltd. | 13,800 | 247,728 | ||||||
| HK Electric Investments & HK Electric Investments Ltd. (a) | 501,000 | 491,187 | ||||||
| HKT Trust & HKT Ltd. | 116,000 | 163,121 | ||||||
| Hong Kong & China Gas Co. Ltd. | 544,104 | 1,033,144 | ||||||
| MTR Corp. Ltd. | 212,500 | 1,174,280 | ||||||
| Noble Group Ltd. * | 144,900 | 16,328 | ||||||
| Power Assets Holdings Ltd. | 74,000 | 724,140 | ||||||
| SJM Holdings Ltd. | 484,000 | 358,677 | ||||||
| WH Group Ltd. (a) | 83,000 | 67,084 | ||||||
| Yue Yuen Industrial Holdings Ltd. | 51,500 | 212,842 | ||||||
|
| |||||||
| 6,160,197 | ||||||||
|
| |||||||
| Italy - 0.5% | ||||||||
| Enel SpA | 80,776 | 359,996 | ||||||
| Luxottica Group SpA | 1,301 | 62,140 | ||||||
| Snam SpA | 33,015 | 183,064 | ||||||
|
| |||||||
| 605,200 | ||||||||
|
| |||||||
| Japan - 25.3% | ||||||||
| ABC-Mart, Inc. | 5,300 | 360,924 | ||||||
| Ajinomoto Co., Inc. | 7,100 | 158,305 | ||||||
| Amada Holdings Co. Ltd. | 2,000 | 20,805 | ||||||
| ANA Holdings, Inc. | 37,000 | 100,519 | ||||||
| Asahi Glass Co. Ltd. | 4,000 | 25,864 | ||||||
| Asahi Group Holdings Ltd. | 7,500 | 273,204 | ||||||
| Astellas Pharma, Inc. | 61,000 | 952,763 | ||||||
| Bandai Namco Holdings, Inc. | 20,600 | 630,527 | ||||||
| Benesse Holdings, Inc. | 8,800 | 224,763 | ||||||
| Bridgestone Corp. | 18,200 | 670,557 | ||||||
| Calbee, Inc. | 13,000 | 492,547 | ||||||
| Canon, Inc. | 26,200 | 760,648 | ||||||
| Central Japan Railway Co. | 900 | 154,084 | ||||||
| Chubu Electric Power Co., Inc. | 8,300 | 120,769 | ||||||
| Chugai Pharmaceutical Co. Ltd. | 8,400 | 303,611 | ||||||
| Daiichi Sankyo Co. Ltd. | 3,400 | 81,697 | ||||||
| East Japan Railway Co. | 2,000 | 180,528 | ||||||
| Eisai Co. Ltd. | 3,800 | 237,665 | ||||||
| FamilyMart Co. Ltd. | 1,400 | 93,459 | ||||||
| INVESTMENTS | SHARES | VALUE | ||||||
| Japan - 25.3% (continued) | ||||||||
| FANUC Corp. | 1,200 | $ | 202,699 | |||||
| Fast Retailing Co. Ltd. | 600 | 193,215 | ||||||
| Fuji Heavy Industries Ltd. | 6,700 | 251,381 | ||||||
| GungHo Online Entertainment, Inc. | 275,600 | 677,204 | ||||||
| Hakuhodo DY Holdings, Inc. | 46,500 | 544,985 | ||||||
| Hirose Electric Co. Ltd. | 700 | 92,038 | ||||||
| Hisamitsu Pharmaceutical Co., Inc. | 13,500 | 729,673 | ||||||
| Hitachi Chemical Co. Ltd. | 11,400 | 261,937 | ||||||
| Hitachi Metals Ltd. | 27,500 | 338,311 | ||||||
| Hoshizaki Electric Co. Ltd. | 5,100 | 465,405 | ||||||
| Hoya Corp. | 12,600 | 506,871 | ||||||
| ITOCHU Corp. | 5,900 | 74,278 | ||||||
| Japan Airlines Co. Ltd. | 32,800 | 964,172 | ||||||
| Japan Airport Terminal Co. Ltd. | 500 | 19,119 | ||||||
| Japan Tobacco, Inc. | 9,000 | 368,417 | ||||||
| Kajima Corp. | 66,000 | 461,860 | ||||||
| Kamigumi Co. Ltd. | 58,000 | 505,990 | ||||||
| Kao Corp. | 8,400 | 474,919 | ||||||
| KDDI Corp. | 21,400 | 663,015 | ||||||
| Kikkoman Corp. | 3,000 | 96,080 | ||||||
| Kirin Holdings Co. Ltd. | 4,700 | 78,113 | ||||||
| Komatsu Ltd. | 7,000 | 160,574 | ||||||
| Konica Minolta, Inc. | 18,100 | 153,276 | ||||||
| Kose Corp. | 1,500 | 153,595 | ||||||
| Kuraray Co. Ltd. | 1,300 | 19,285 | ||||||
| Kurita Water Industries Ltd. | 7,300 | 173,458 | ||||||
| Makita Corp. | 3,300 | 235,124 | ||||||
| McDonald’s Holdings Co. Japan Ltd. | 4,600 | 135,496 | ||||||
| MEIJI Holdings Co. Ltd. | 3,400 | 337,588 | ||||||
| Mitsubishi Electric Corp. | 14,000 | 179,434 | ||||||
| Mitsubishi Motors Corp. | 11,000 | 51,384 | ||||||
| Mitsubishi Tanabe Pharma Corp. | 39,700 | 850,312 | ||||||
| Mitsui & Co. Ltd. | 5,500 | 76,224 | ||||||
| Mixi, Inc. | 3,300 | 119,562 | ||||||
| Mizuho Financial Group, Inc. | 7,100 | 11,967 | ||||||
| Murata Manufacturing Co. Ltd. | 400 | 52,213 | ||||||
| Nabtesco Corp. | 3,200 | 90,658 | ||||||
| Nexon Co. Ltd. | 6,700 | 105,248 | ||||||
| NH Foods Ltd. | 5,000 | 120,787 | ||||||
| Nidec Corp. | 600 | 55,460 | ||||||
| Nikon Corp. | 7,500 | 112,007 | ||||||
| Nippon Express Co. Ltd. | 61,000 | 285,174 | ||||||
| Nippon Telegraph & Telephone Corp. | 15,200 | 695,187 | ||||||
| Nisshin Seifun Group, Inc. | 8,400 | 128,038 | ||||||
| Nissin Foods Holdings Co. Ltd. | 8,800 | 534,858 | ||||||
| Nitori Holdings Co. Ltd. | 1,900 | 227,758 | ||||||
| Nitto Denko Corp. | 6,900 | 448,126 | ||||||
| Nomura Research Institute Ltd. | 1,170 | 40,381 | ||||||
| Obayashi Corp. | 38,000 | 376,914 | ||||||
| Omron Corp. | 21,100 | 759,493 | ||||||
| Oracle Corp. Japan | 5,600 | 316,387 | ||||||
| Oriental Land Co. Ltd. | 4,900 | 298,399 | ||||||
| Osaka Gas Co. Ltd. | 293,000 | 1,228,906 | ||||||
| Otsuka Corp. | 11,100 | 527,213 | ||||||
| Otsuka Holdings Co. Ltd. | 8,700 | 396,569 | ||||||
| Pola Orbis Holdings, Inc. | 1,100 | 98,469 | ||||||
| Recruit Holdings Co. Ltd. | 37,200 | 1,517,507 | ||||||
| Rinnai Corp. | 200 | 18,619 | ||||||
| Sankyo Co. Ltd. | 4,300 | 146,907 | ||||||
| The accompanying notes are an integral part of these financial statements. | (Continued) |
| AQR Funds | Annual Report | September 2016 | ||||||||||||||
141
| Schedule of Investments | September 30, 2016 |
| AQR INTERNATIONAL DEFENSIVE STYLE FUND |
| INVESTMENTS | SHARES | VALUE | ||||||
| Japan - 25.3% (continued) | ||||||||
| Secom Co. Ltd. | 600 | $ | 44,805 | |||||
| Seiko Epson Corp. | 700 | 13,479 | ||||||
| Seven & i Holdings Co. Ltd. | 5,100 | 241,104 | ||||||
| Seven Bank Ltd. | 27,700 | 88,720 | ||||||
| Shimamura Co. Ltd. | 2,700 | 328,702 | ||||||
| Shimizu Corp. | 23,000 | 205,563 | ||||||
| Shionogi & Co. Ltd. | 5,100 | 261,291 | ||||||
| SMC Corp. | 100 | 28,873 | ||||||
| Sumitomo Corp. | 3,800 | 42,540 | ||||||
| Sumitomo Dainippon Pharma Co. Ltd. | 21,200 | 410,616 | ||||||
| Sumitomo Mitsui Financial Group, Inc. | 3,000 | 101,339 | ||||||
| Sumitomo Rubber Industries Ltd. | 1,800 | 27,227 | ||||||
| Sundrug Co. Ltd. | 4,000 | 335,757 | ||||||
| Suntory Beverage & Food Ltd. | 5,200 | 224,840 | ||||||
| Suzuki Motor Corp. | 1,800 | 60,291 | ||||||
| Sysmex Corp. | 6,400 | 474,838 | ||||||
| Taisei Corp. | 49,000 | 367,611 | ||||||
| Takeda Pharmaceutical Co. Ltd. | 1,800 | 86,273 | ||||||
| Toho Gas Co. Ltd. | 107,000 | 1,001,969 | ||||||
| Tokyo Electron Ltd. | 1,000 | 88,384 | ||||||
| Tokyo Gas Co. Ltd. | 212,000 | 943,192 | ||||||
| TOTO Ltd. | 1,500 | 56,711 | ||||||
| Toyo Suisan Kaisha Ltd. | 21,600 | 916,341 | ||||||
| Trend Micro, Inc. | 16,900 | 589,559 | ||||||
| Tsuruha Holdings, Inc. | 3,800 | 439,282 | ||||||
| Unicharm Corp. | 1,200 | 31,137 | ||||||
| USS Co. Ltd. | 1,600 | 27,079 | ||||||
| West Japan Railway Co. | 4,400 | 272,951 | ||||||
| Yakult Honsha Co. Ltd. | 2,000 | 90,393 | ||||||
| Yamada Denki Co. Ltd. | 7,900 | 39,185 | ||||||
| Yamato Holdings Co. Ltd. | 7,200 | 167,829 | ||||||
| Yamazaki Baking Co. Ltd. | 17,600 | 432,767 | ||||||
| Yokogawa Electric Corp. | 4,600 | 61,280 | ||||||
|
| |||||||
| 33,553,406 | ||||||||
|
| |||||||
| Luxembourg - 0.1% | ||||||||
| Millicom International Cellular SA, SDR | 2,295 | 118,907 | ||||||
|
| |||||||
| Netherlands - 1.6% | ||||||||
| Heineken NV | 2,163 | 190,130 | ||||||
| Koninklijke Ahold NV * | 49,943 | 1,137,500 | ||||||
| Koninklijke Vopak NV | 1,513 | 79,352 | ||||||
| Randstad Holding NV | 9,739 | 442,857 | ||||||
| Royal Dutch Shell plc, Class B | 8,717 | 225,994 | ||||||
|
| |||||||
| 2,075,833 | ||||||||
|
| |||||||
| Norway - 1.9% | ||||||||
| Gjensidige Forsikring ASA | 15,019 | 280,904 | ||||||
| Marine Harvest ASA * | 26,509 | 475,521 | ||||||
| Norsk Hydro ASA | 15,187 | 65,665 | ||||||
| Orkla ASA | 67,908 | 703,205 | ||||||
| Schibsted ASA, Class A | 5,112 | 150,541 | ||||||
| Telenor ASA | 45,453 | 781,605 | ||||||
| Yara International ASA | 3,176 | 105,834 | ||||||
|
| |||||||
| 2,563,275 | ||||||||
|
| |||||||
| Portugal - 0.1% | ||||||||
| EDP - Energias de Portugal SA | 27,775 | 93,213 | ||||||
| Jeronimo Martins SGPS SA | 2,999 | 51,978 | ||||||
|
| |||||||
| 145,191 | ||||||||
|
| |||||||
| INVESTMENTS | SHARES | VALUE | ||||||
| Singapore - 3.9% | ||||||||
| ComfortDelGro Corp. Ltd. | 160,000 | $ | 330,958 | |||||
| DBS Group Holdings Ltd. | 68,100 | 772,721 | ||||||
| Oversea-Chinese Banking Corp. Ltd. | 100,300 | 639,228 | ||||||
| Singapore Airlines Ltd. | 95,200 | 735,485 | ||||||
| Singapore Telecommunications Ltd. | 354,500 | 1,036,874 | ||||||
| StarHub Ltd. | 346,900 | 875,939 | ||||||
| United Overseas Bank Ltd. | 51,200 | 710,338 | ||||||
| Wilmar International Ltd. | 54,500 | 129,393 | ||||||
|
| |||||||
| 5,230,936 | ||||||||
|
| |||||||
| South Africa - 0.4% | ||||||||
| Mondi plc | 24,720 | 519,367 | ||||||
|
| |||||||
| Spain - 1.8% | ||||||||
| Enagas SA | 2,355 | 70,844 | ||||||
| Endesa SA | 38,485 | 825,108 | ||||||
| Gas Natural SDG SA | 3,417 | 70,247 | ||||||
| Iberdrola SA | 94,530 | 642,748 | ||||||
| Industria de Diseno Textil SA | 11,415 | 423,244 | ||||||
| Mapfre SA | 65,467 | 183,165 | ||||||
| Red Electrica Corp. SA | 6,913 | 149,158 | ||||||
|
| |||||||
| 2,364,514 | ||||||||
|
| |||||||
| Sweden - 4.1% | ||||||||
| Assa Abloy AB, Class B | 1,062 | 21,567 | ||||||
| Atlas Copco AB, Class A | 7,038 | 211,876 | ||||||
| Hennes & Mauritz AB, Class B | 33,414 | 943,131 | ||||||
| ICA Gruppen AB | 16,374 | 540,889 | ||||||
| Nordea Bank AB | 27,239 | 270,496 | ||||||
| Sandvik AB | 2,220 | 24,428 | ||||||
| Skanska AB, Class B | 16,276 | 380,252 | ||||||
| SKF AB, Class B | 2,488 | 42,966 | ||||||
| Svenska Cellulosa AB SCA, Class B | 16,328 | 484,630 | ||||||
| Svenska Handelsbanken AB, Class A | 2,802 | 38,516 | ||||||
| Swedbank AB, Class A | 854 | 20,066 | ||||||
| Swedish Match AB | 34,102 | 1,251,262 | ||||||
| Tele2 AB, Class B | 20,238 | 174,696 | ||||||
| Telefonaktiebolaget LM Ericsson, Class B | 28,405 | 205,092 | ||||||
| Telia Co. AB | 146,428 | 655,863 | ||||||
| Volvo AB, Class B | 12,623 | 144,128 | ||||||
|
| |||||||
| 5,409,858 | ||||||||
|
| |||||||
| Switzerland - 5.2% | ||||||||
| ABB Ltd. * | 9,534 | 214,877 | ||||||
| Adecco Group AG | 603 | 33,989 | ||||||
| Chocoladefabriken Lindt & Spruengli AG | 3 | 17,349 | ||||||
| Coca-Cola HBC AG * | 21,357 | 496,156 | ||||||
| Kuehne + Nagel International AG | 6,770 | 983,859 | ||||||
| Nestle SA | 18,049 | 1,425,223 | ||||||
| Novartis AG | 8,094 | 638,781 | ||||||
| Roche Holding AG | 3,988 | 991,012 | ||||||
| Schindler Holding AG | 1,572 | 295,194 | ||||||
| SGS SA | 82 | 183,744 | ||||||
| Sika AG | 24 | 116,930 | ||||||
| Sonova Holding AG | 2,981 | 422,695 | ||||||
| Swatch Group AG (The) | 45 | 12,757 | ||||||
| Swiss Re AG | 5,245 | 473,720 | ||||||
| Swisscom AG | 694 | 330,115 | ||||||
| Wolseley plc | 3,514 | 197,636 | ||||||
| The accompanying notes are an integral part of these financial statements. | (Continued) |
| AQR Funds | Annual Report | September 2016 | ||||||||||||||
142
| Schedule of Investments | September 30, 2016 |
| AQR INTERNATIONAL DEFENSIVE STYLE FUND |
| INVESTMENTS | SHARES | VALUE | ||||||
| Switzerland - 5.2% (continued) | ||||||||
| Zurich Insurance Group AG * | 86 | $ | 22,179 | |||||
|
| |||||||
| 6,856,216 | ||||||||
|
| |||||||
| United Kingdom - 10.5% | ||||||||
| Admiral Group plc | 13,479 | 357,747 | ||||||
| Associated British Foods plc | 21,484 | 723,899 | ||||||
| AstraZeneca plc | 7,845 | 507,978 | ||||||
| BAE Systems plc | 42,854 | 291,119 | ||||||
| BP plc | 15,556 | 90,672 | ||||||
| British American Tobacco plc | 7,028 | 448,218 | ||||||
| BT Group plc | 131,273 | 660,477 | ||||||
| Bunzl plc | 3,697 | 109,019 | ||||||
| Burberry Group plc | 19,358 | 345,430 | ||||||
| Centrica plc | 123,470 | 365,072 | ||||||
| Compass Group plc | 11,100 | 214,970 | ||||||
| Diageo plc | 24,393 | 698,703 | ||||||
| Direct Line Insurance Group plc | 99,006 | 467,678 | ||||||
| easyJet plc | 5,931 | 77,334 | ||||||
| GKN plc | 10,759 | 44,645 | ||||||
| GlaxoSmithKline plc | 14,775 | 314,686 | ||||||
| HSBC Holdings plc | 89,959 | 676,201 | ||||||
| Imperial Brands plc | 8,385 | 431,581 | ||||||
| ITV plc | 43,737 | 106,094 | ||||||
| J Sainsbury plc | 12,622 | 40,202 | ||||||
| Kingfisher plc | 95,854 | 467,678 | ||||||
| Marks & Spencer Group plc | 20,345 | 87,282 | ||||||
| National Grid plc | 106,694 | 1,506,821 | ||||||
| Next plc | 481 | 29,773 | ||||||
| Reckitt Benckiser Group plc | 11,569 | 1,089,163 | ||||||
| Royal Mail plc | 169,506 | 1,075,622 | ||||||
| Sage Group plc (The) | 3,363 | 32,132 | ||||||
| Sky plc | 18,966 | 219,818 | ||||||
| Smith & Nephew plc | 39,282 | 633,555 | ||||||
| SSE plc | 35,055 | 711,817 | ||||||
| Tate & Lyle plc | 5,428 | 52,688 | ||||||
| Travis Perkins plc | 2,417 | 48,209 | ||||||
| Unilever NV, CVA | 5,592 | 257,642 | ||||||
| United Utilities Group plc | 2,762 | 35,875 | ||||||
| Vodafone Group plc | 129,785 | 372,214 | ||||||
| Whitbread plc | 1,298 | 65,876 | ||||||
| WPP plc | 14,084 | 331,053 | ||||||
|
| |||||||
| 13,988,943 | ||||||||
|
| |||||||
| United States - 0.5% | ||||||||
| Shire plc | 1,638 | 105,918 | ||||||
| Thomson Reuters Corp. (1) | 5,952 | 246,119 | ||||||
| Valeant Pharmaceuticals International, Inc. (1)* | 11,509 | 282,385 | ||||||
|
| |||||||
| 634,422 | ||||||||
|
| |||||||
TOTAL COMMON STOCKS |
| 126,621,710 | ||||||
|
| |||||||
| PREFERRED STOCKS - 0.5% | ||||||||
| Germany - 0.5% | ||||||||
| FUCHS PETROLUB SE | 692 | 31,594 | ||||||
| Henkel AG & Co. KGaA | 4,605 | 626,745 | ||||||
|
| |||||||
TOTAL PREFERRED STOCKS |
| 658,339 | ||||||
|
| |||||||
| INVESTMENTS | SHARES | VALUE | ||||||
| SHORT-TERM INVESTMENT - 3.1% | ||||||||
| Investment Company - 3.1% | ||||||||
J.P. Morgan U.S. Treasury Plus Money Market Fund - IM Shares, 0.22% | 4,074,605 | $ | 4,074,605 | |||||
|
| |||||||
TOTAL INVESTMENTS IN SECURITIES AT VALUE - 99.0% |
| 131,354,654 | ||||||
|
| |||||||
OTHER ASSETS IN EXCESS OF LIABILITIES - 1.0% (c) | 1,292,718 | |||||||
|
| |||||||
NET ASSETS - 100.0% | 132,647,372 | |||||||
|
| |||||||
| SECTOR | VALUE | % OF NET ASSETS | ||||||
| Consumer Discretionary | $ | 12,094,512 | 9.1 | % | ||||
| Consumer Staples | 28,135,181 | 21.3 | ||||||
| Energy | 2,585,203 | 1.9 | ||||||
| Financials | 13,032,141 | 9.8 | ||||||
| Health Care | 14,095,274 | 10.6 | ||||||
| Industrials | 20,282,493 | 15.3 | ||||||
| Information Technology | 5,288,307 | 4.0 | ||||||
| Materials | 6,233,488 | 4.7 | ||||||
| Telecommunication Services | 11,569,725 | 8.7 | ||||||
| Utilities | 13,963,725 | 10.5 | ||||||
| Short-Term Investment | 4,074,605 | 3.1 | ||||||
|
|
|
| |||||
Total Investments In Securities At Value | 131,354,654 | 99.0 | ||||||
| Other Assets in Excess of Liabilities (c) | 1,292,718 | 1.0 | ||||||
|
|
|
| |||||
Net Assets | $ | 132,647,372 | 100.0 | % | ||||
|
|
|
| |||||
| * | Non-income producing security. |
| (a) | Securities exempt from registration under Rule 144A or section 4(2), of the Securities Act of 1933. Under procedures approved by the Board of Trustees, such securities have been determined to be liquid by the investment adviser and may be resold, normally to qualified institutional buyers in transactions exempt from registration. Total value of all such securities at 9/30/2016 amounted to $623,071, which represents approximately 0.47% of net assets of the fund. |
| (b) | Represents 7-day effective yield as of 9/30/2016. |
| (c) | Includes appreciation/(depreciation) on futures contracts. |
All securities are Level 2 with respect to ASC 820, unless otherwise noted in parentheses.
| (1) | Level 1 security (See Note 4). |
Abbreviations
CVA - Dutch Certification
OYJ - Public Traded Company
SCA - Limited partnership with share capital
SDR - Swedish Depositary Receipt
| The accompanying notes are an integral part of these financial statements. | (Continued) |
| AQR Funds | Annual Report | September 2016 | ||||||||||||||
143
| Schedule of Investments | September 30, 2016 |
| AQR INTERNATIONAL DEFENSIVE STYLE FUND |
Open futures contracts outstanding at September 30, 2016:
Exchange Traded
NUMBER OF CONTRACTS | COUNTERPARTY | DESCRIPTION | EXPIRATION DATE | VALUE AT TRADE DATE | VALUE AT SEPTEMBER 30, 2016 | UNREALIZED APPRECIATION (DEPRECIATION) | ||||||||||||||
| Long Contracts: | ||||||||||||||||||||
| 42 | JPMS | E-Mini MSCI EAFE Index Futures | 12/2016 | $3,570,672 | $3,584,070 | $13,398 | ||||||||||||||
|
|
|
|
|
| |||||||||||||||
Collateral pledged to, or (received from), each counterparty at September 30, 2016 was as follows:
| COUNTERPARTY | OVER THE COUNTER | EXCHANGE TRADED | TOTAL | |||||||||
| JPMS | ||||||||||||
| Cash | $— | $195,342 | $195,342 | |||||||||
| ||||||||||||
| The accompanying notes are an integral part of these financial statements. |
| AQR Funds | Annual Report | September 2016 | ||||||||||||||
144
| Schedule of Investments | September 30, 2016 |
| AQR EMERGING DEFENSIVE STYLE FUND |
| INVESTMENTS | SHARES | VALUE | ||||||
| COMMON STOCKS - 94.9% | ||||||||
| Brazil - 5.9% | ||||||||
| Ambev SA, ADR (1) | 91,200 | $ | 555,408 | |||||
| BM&FBovespa SA - Bolsa de Valores Mercadorias e Futuros (1) | 9,900 | 51,446 | ||||||
| BRF SA (1) | 1,500 | 25,635 | ||||||
| Cia Paranaense de Energia, ADR (1)(a) | 2,663 | 27,615 | ||||||
| Engie Brasil Energia SA (1) | 31,200 | 371,658 | ||||||
| Equatorial Energia SA (1) | 3,700 | 57,989 | ||||||
| Localiza Rent a Car SA (1) | 27,910 | 341,564 | ||||||
| Lojas Renner SA (1) | 3,000 | 22,665 | ||||||
| Natura Cosmeticos SA (1) | 17,100 | 165,419 | ||||||
| Odontoprev SA (1) | 170,900 | 682,623 | ||||||
| Qualicorp SA (1) | 13,400 | 78,863 | ||||||
| Telefonica Brasil SA, ADR (1) | 3,051 | 44,148 | ||||||
| TIM Participacoes SA, ADR (1) | 16,505 | 202,021 | ||||||
| TOTVS SA (1) | 2,700 | 25,654 | ||||||
| Ultrapar Participacoes SA (1) | 6,000 | 132,817 | ||||||
| WEG SA (1) | 34,580 | 189,586 | ||||||
|
| |||||||
| 2,975,111 | ||||||||
|
| |||||||
| Chile - 4.4% | ||||||||
| Aguas Andinas SA, Class A (1) | 359,420 | 230,881 | ||||||
| Banco de Chile (1) | 5,303,815 | 592,624 | ||||||
| Banco Santander Chile, ADR (1) | 3,091 | 63,953 | ||||||
| Cia Cervecerias Unidas SA, ADR (1) | 5,599 | 113,044 | ||||||
| Empresa Nacional de Electricidad SA, ADR (1)(a) | 12,281 | 243,655 | ||||||
| Empresas COPEC SA (1) | 19,020 | 177,878 | ||||||
| Endesa Americas SA, ADR (1) | 7,716 | 105,709 | ||||||
| Enersis Americas SA, ADR (1) | 25,630 | 209,910 | ||||||
| Enersis Chile SA, ADR (1) | 11,279 | 53,575 | ||||||
| SACI Falabella (1) | 54,235 | 397,659 | ||||||
|
| |||||||
| 2,188,888 | ||||||||
|
| |||||||
| China - 13.1% | ||||||||
| Agricultural Bank of China Ltd., Class H | 567,000 | 244,568 | ||||||
| Anhui Conch Cement Co. Ltd., Class H | 10,000 | 27,639 | ||||||
| ANTA Sports Products Ltd. | 151,000 | 412,874 | ||||||
| Bank of China Ltd., Class H | 106,000 | 48,951 | ||||||
| Bank of Communications Co. Ltd., Class H | 158,000 | 121,526 | ||||||
Beijing Capital International Airport Co. Ltd., Class H | 70,000 | 79,795 | ||||||
| Belle International Holdings Ltd. | 393,000 | 272,105 | ||||||
China Communications Services Corp. Ltd., Class H | 1,048,000 | 657,802 | ||||||
| China Construction Bank Corp., Class H | 464,000 | 348,482 | ||||||
| China Galaxy Securities Co. Ltd., Class H | 77,000 | 70,822 | ||||||
| China Huishan Dairy Holdings Co. Ltd. | 229,000 | 85,738 | ||||||
| China Life Insurance Co. Ltd., Class H | 6,000 | 15,721 | ||||||
| China Mobile Ltd. | 58,500 | 718,636 | ||||||
| China Petroleum & Chemical Corp., Class H | 44,000 | 32,483 | ||||||
| China Resources Gas Group Ltd. | 92,000 | 315,979 | ||||||
| China Resources Power Holdings Co. Ltd. | 30,000 | 52,153 | ||||||
| China Telecom Corp. Ltd., Class H | 364,000 | 185,700 | ||||||
| Chongqing Rural Commercial Bank Co. Ltd., Class H | 40,000 | 24,807 | ||||||
| CITIC Ltd. | 29,000 | 41,705 | ||||||
| CSPC Pharmaceutical Group Ltd. | 274,000 | 275,092 | ||||||
| INVESTMENTS | SHARES | VALUE | ||||||
| China - 13.1% (continued) | ||||||||
| Dongfeng Motor Group Co. Ltd., Class H | 58,000 | $ | 58,490 | |||||
| ENN Energy Holdings Ltd. | 36,000 | 176,238 | ||||||
| Great Wall Motor Co. Ltd., Class H | 46,500 | 45,726 | ||||||
| Guangdong Investment Ltd. | 464,000 | 741,216 | ||||||
| Hengan International Group Co. Ltd. | 14,500 | 121,006 | ||||||
| Industrial & Commercial Bank of China Ltd., Class H | 301,000 | 191,036 | ||||||
| Jiangsu Expressway Co. Ltd., Class H | 148,000 | 205,384 | ||||||
| Luye Pharma Group Ltd. * | 127,500 | 83,912 | ||||||
| People’s Insurance Co. Group of China Ltd. (The), Class H | 296,000 | 121,908 | ||||||
| PICC Property & Casualty Co. Ltd., Class H | 48,000 | 80,475 | ||||||
| Qinqin Foodstuffs Group Cayman Co. Ltd. * | 2,900 | 1,066 | ||||||
| Shenzhou International Group Holdings Ltd. | 11,000 | 76,976 | ||||||
| Sinopec Engineering Group Co. Ltd., Class H | 247,500 | 214,436 | ||||||
| Tencent Holdings Ltd. | 1,600 | 44,483 | ||||||
| Tsingtao Brewery Co. Ltd., Class H | 34,000 | 133,094 | ||||||
| Want Want China Holdings Ltd. (a) | 110,000 | 68,457 | ||||||
| Weichai Power Co. Ltd., Class H | 70,000 | 94,449 | ||||||
| Zhejiang Expressway Co. Ltd., Class H | 36,000 | 38,138 | ||||||
| Zhuzhou CRRC Times Electric Co. Ltd., Class H | 4,500 | 23,509 | ||||||
|
| |||||||
| 6,552,577 | ||||||||
|
| |||||||
| Hong Kong - 1.1% | ||||||||
| China Gas Holdings Ltd. | 30,000 | 47,732 | ||||||
| Haier Electronics Group Co. Ltd. | 60,000 | 99,804 | ||||||
| Sino Biopharmaceutical Ltd. | 360,000 | 243,516 | ||||||
| Sun Art Retail Group Ltd. | 255,500 | 176,721 | ||||||
|
| |||||||
| 567,773 | ||||||||
|
| |||||||
| India - 8.3% | ||||||||
| Dr. Reddy’s Laboratories Ltd., ADR (1)(a) | 13,167 | 611,212 | ||||||
| ICICI Bank Ltd., ADR (1) | 42,445 | 317,064 | ||||||
| Infosys Ltd., ADR (1) | 42,662 | 673,206 | ||||||
| Larsen & Toubro Ltd., GDR | 11,574 | 248,234 | ||||||
| Reliance Industries Ltd., GDR (b) | 18,452 | 605,369 | ||||||
| State Bank of India, GDR | 14,671 | 546,193 | ||||||
| Tata Motors Ltd., ADR (1) | 13,174 | 526,697 | ||||||
| Wipro Ltd., ADR (1)(a) | 62,522 | 607,089 | ||||||
|
| |||||||
| 4,135,064 | ||||||||
|
| |||||||
| Indonesia - 3.4% | ||||||||
| Bank Central Asia Tbk. PT | 119,600 | 144,258 | ||||||
| Hanjaya Mandala Sampoerna Tbk. PT | 879,500 | 266,354 | ||||||
| Indofood CBP Sukses Makmur Tbk. PT | 25,200 | 18,342 | ||||||
| Kalbe Farma Tbk. PT | 2,844,500 | 374,785 | ||||||
| Semen Indonesia Persero Tbk. PT | 43,000 | 33,402 | ||||||
| Telekomunikasi Indonesia Persero Tbk. PT | 1,345,200 | 447,935 | ||||||
| Unilever Indonesia Tbk. PT | 123,900 | 423,591 | ||||||
|
| |||||||
| 1,708,667 | ||||||||
|
| |||||||
| Korea, Republic of - 17.1% | ||||||||
| Amorepacific Corp. | 476 | 168,800 | ||||||
| BGF retail Co. Ltd. | 1,358 | 238,650 | ||||||
| Cheil Worldwide, Inc. | 9,723 | 141,896 | ||||||
| Coway Co. Ltd. | 2,741 | 238,098 | ||||||
| Dongbu Insurance Co. Ltd. | 7,524 | 467,768 | ||||||
| Hanmi Pharm Co. Ltd. | 223 | 103,617 | ||||||
| The accompanying notes are an integral part of these financial statements. | (Continued) |
| AQR Funds | Annual Report | September 2016 | ||||||||||||||
145
| Schedule of Investments | September 30, 2016 |
| AQR EMERGING DEFENSIVE STYLE FUND |
| INVESTMENTS | SHARES | VALUE | ||||||
| Korea, Republic of - 17.1% (continued) | ||||||||
| Hanmi Science Co. Ltd. | 973 | $ | 101,409 | |||||
| Hanon Systems | 34,155 | 386,442 | ||||||
| Hanssem Co. Ltd. | 1,518 | 243,658 | ||||||
| Hanwha Life Insurance Co. Ltd. | 51,780 | 271,526 | ||||||
| Hyundai Glovis Co. Ltd. | 653 | 107,842 | ||||||
| Hyundai Marine & Fire Insurance Co. Ltd. | 20,328 | 671,116 | ||||||
| Hyundai Mobis Co. Ltd. | 216 | 54,207 | ||||||
| Kangwon Land, Inc. | 11,440 | 408,786 | ||||||
| KB Financial Group, Inc. | 1,404 | 48,290 | ||||||
| KEPCO Plant Service & Engineering Co. Ltd. | 1,770 | 93,215 | ||||||
| Kia Motors Corp. | 10,074 | 387,062 | ||||||
| Korea Electric Power Corp. | 4,955 | 242,727 | ||||||
| Korea Zinc Co. Ltd. | 41 | 17,990 | ||||||
| KT Corp. | 1,517 | 44,017 | ||||||
| KT&G Corp. | 4,734 | 539,105 | ||||||
| LG Chem Ltd. | 1,078 | 238,424 | ||||||
| LG Display Co. Ltd. | 1,880 | 48,062 | ||||||
| LG Household & Health Care Ltd. | 124 | 107,911 | ||||||
| LG Uplus Corp. | 26,249 | 280,722 | ||||||
| NAVER Corp. | 632 | 508,800 | ||||||
| NCSoft Corp. | 838 | 226,051 | ||||||
| S-1 Corp. | 6,225 | 575,110 | ||||||
| Samsung Electronics Co. Ltd. | 444 | 646,802 | ||||||
| Samsung Fire & Marine Insurance Co. Ltd. | 1,141 | 290,615 | ||||||
| Samsung Life Insurance Co. Ltd. | 2,063 | 198,121 | ||||||
| Samsung SDS Co. Ltd. | 886 | 124,650 | ||||||
| SK Hynix, Inc. | 601 | 22,063 | ||||||
| SK Telecom Co. Ltd. | 1,105 | 226,570 | ||||||
| Yuhan Corp. | 336 | 84,965 | ||||||
|
| |||||||
| 8,555,087 | ||||||||
|
| |||||||
| Malaysia - 7.9% | ||||||||
| Axiata Group Bhd. | 48,700 | 61,474 | ||||||
| British American Tobacco Malaysia Bhd. | 16,200 | 192,470 | ||||||
| DiGi.Com Bhd. | 275,700 | 332,032 | ||||||
| Genting Malaysia Bhd. | 32,900 | 36,219 | ||||||
| Hartalega Holdings Bhd. | 48,800 | 54,783 | ||||||
| Hong Leong Bank Bhd. | 65,600 | 208,488 | ||||||
| IHH Healthcare Bhd. | 180,400 | 276,304 | ||||||
| IOI Corp. Bhd. | 22,200 | 23,921 | ||||||
| Malayan Banking Bhd. | 103,800 | 188,410 | ||||||
| Maxis Bhd. | 140,000 | 208,810 | ||||||
| MISC Bhd. | 61,600 | 112,496 | ||||||
| Petronas Dagangan Bhd. | 38,900 | 221,092 | ||||||
| Petronas Gas Bhd. | 98,500 | 521,237 | ||||||
| Public Bank Bhd. | 84,900 | 407,092 | ||||||
| Telekom Malaysia Bhd. | 298,300 | 489,589 | ||||||
| Tenaga Nasional Bhd. | 68,400 | 236,593 | ||||||
| Westports Holdings Bhd. | 369,500 | 392,566 | ||||||
|
| |||||||
| 3,963,576 | ||||||||
|
| |||||||
| Mexico - 5.6% | ||||||||
| America Movil SAB de CV, Class L, ADR (1) | 1,212 | 13,865 | ||||||
| Arca Continental SAB de CV (1) | 72,700 | 432,569 | ||||||
| Coca-Cola Femsa SAB de CV, ADR (1) | 2,235 | 167,625 | ||||||
| El Puerto de Liverpool SAB de CV (1) | 13,755 | 144,178 | ||||||
| Gentera SAB de CV (1) | 16,700 | 30,059 | ||||||
| Gruma SAB de CV, Class B (1) | 19,100 | 251,130 | ||||||
| INVESTMENTS | SHARES | VALUE | ||||||
| Mexico - 5.6% (continued) | ||||||||
| Grupo Aeroportuario del Pacifico SAB de CV, ADR (1)(a) | 3,102 | $ | 294,597 | |||||
| Grupo Aeroportuario del Sureste SAB de CV, ADR (1) | 922 | 134,999 | ||||||
| Grupo Bimbo SAB de CV, Series A (1) | 63,100 | 166,327 | ||||||
| Grupo Financiero Inbursa SAB de CV, Class O (1) | 16,900 | 26,671 | ||||||
| Grupo Lala SAB de CV (1) | 192,200 | 366,067 | ||||||
| Kimberly-Clark de Mexico SAB de CV, Class A (1) | 38,300 | 86,635 | ||||||
| Promotora y Operadora de Infraestructura SAB de CV (1) | 5,000 | 53,649 | ||||||
| Wal-Mart de Mexico SAB de CV (1) | 291,900 | 641,014 | ||||||
|
| |||||||
| 2,809,385 | ||||||||
|
| |||||||
| Philippines - 0.7% | ||||||||
| Bank of the Philippine Islands | 106,100 | 229,843 | ||||||
| BDO Unibank, Inc. | 10,890 | 24,701 | ||||||
| Universal Robina Corp. | 19,220 | 70,733 | ||||||
|
| |||||||
| 325,277 | ||||||||
|
| |||||||
| Poland - 2.7% | ||||||||
| Bank Pekao SA | 9,562 | 309,592 | ||||||
| Bank Zachodni WBK SA | 492 | 40,052 | ||||||
| Energa SA | 50,013 | 98,180 | ||||||
| Eurocash SA | 15,998 | 177,931 | ||||||
| LPP SA | 18 | 18,540 | ||||||
| Orange Polska SA | 60,177 | 94,379 | ||||||
| PGE Polska Grupa Energetyczna SA | 110,782 | 294,316 | ||||||
| Polski Koncern Naftowy ORLEN SA | 6,848 | 116,465 | ||||||
| Polskie Gornictwo Naftowe i Gazownictwo SA | 30,228 | 39,947 | ||||||
| Powszechna Kasa Oszczednosci Bank Polski SA | 5,747 | 39,258 | ||||||
| Powszechny Zaklad Ubezpieczen SA | 21,850 | 139,432 | ||||||
|
| |||||||
| 1,368,092 | ||||||||
|
| |||||||
| South Africa - 7.5% | ||||||||
| Barclays Africa Group Ltd. | 1,394 | 15,391 | ||||||
| Bidvest Group Ltd. (The) (a) | 16,896 | 199,222 | ||||||
| Brait SE * | 23,711 | 190,708 | ||||||
| Mr Price Group Ltd. (a) | 15,404 | 170,405 | ||||||
| Nedbank Group Ltd. | 5,788 | 94,142 | ||||||
| Netcare Ltd. | 80,072 | 196,551 | ||||||
| Pick n Pay Stores Ltd. | 129,535 | 649,564 | ||||||
| RMB Holdings Ltd. | 69,000 | 294,395 | ||||||
| Sasol Ltd. | 849 | 23,195 | ||||||
| Shoprite Holdings Ltd. | 26,846 | 375,109 | ||||||
| Sibanye Gold Ltd. | 48,436 | 172,209 | ||||||
| SPAR Group Ltd. (The) | 20,243 | 283,925 | ||||||
| Tiger Brands Ltd. | 8,525 | 236,369 | ||||||
| Truworths International Ltd. | 60,093 | 311,448 | ||||||
| Vodacom Group Ltd. | 47,935 | 538,579 | ||||||
|
| |||||||
| 3,751,212 | ||||||||
|
| |||||||
| Taiwan - 12.1% | ||||||||
| Advantech Co. Ltd. | 27,000 | 232,394 | ||||||
| Asustek Computer, Inc. | 32,000 | 286,045 | ||||||
| Chang Hwa Commercial Bank Ltd. | 161,120 | 82,716 | ||||||
| The accompanying notes are an integral part of these financial statements. | (Continued) |
| AQR Funds | Annual Report | September 2016 | ||||||||||||||
146
| Schedule of Investments | September 30, 2016 |
| AQR EMERGING DEFENSIVE STYLE FUND |
| INVESTMENTS | SHARES | VALUE | ||||||
| Taiwan - 12.1% (continued) | ||||||||
| Cheng Shin Rubber Industry Co. Ltd. | 16,000 | $ | 33,753 | |||||
| Chicony Electronics Co. Ltd. | 7,035 | 17,843 | ||||||
| Chunghwa Telecom Co. Ltd. | 186,600 | 658,090 | ||||||
| E.Sun Financial Holding Co. Ltd. | 148,500 | 84,858 | ||||||
| Far EasTone Telecommunications Co. Ltd. | 296,000 | 699,872 | ||||||
| Feng TAY Enterprise Co. Ltd. | 19,040 | 84,721 | ||||||
| First Financial Holding Co. Ltd. | 514,113 | 273,794 | ||||||
| Formosa Petrochemical Corp. | 21,000 | 63,309 | ||||||
| Fubon Financial Holding Co. Ltd. | 52,000 | 77,267 | ||||||
| Hon Hai Precision Industry Co. Ltd. | 44,583 | 112,825 | ||||||
| Hua Nan Financial Holdings Co. Ltd. | 423,738 | 217,454 | ||||||
| Lite-On Technology Corp. | 31,023 | 44,851 | ||||||
| MediaTek, Inc. | 5,000 | 38,390 | ||||||
| Mega Financial Holding Co. Ltd. | 518,000 | 365,401 | ||||||
| Novatek Microelectronics Corp. | 11,000 | 38,976 | ||||||
| President Chain Store Corp. | 92,000 | 732,767 | ||||||
| Realtek Semiconductor Corp. | 62,442 | 206,083 | ||||||
| Standard Foods Corp. | 8,880 | 22,819 | ||||||
| Taiwan Cooperative Financial Holding Co. Ltd. | 308,160 | 136,443 | ||||||
| Taiwan Mobile Co. Ltd. | 203,000 | 729,889 | ||||||
| Taiwan Semiconductor Manufacturing Co. Ltd., ADR (1) | 14,697 | 449,581 | ||||||
| Teco Electric and Machinery Co. Ltd. | 21,000 | 18,166 | ||||||
| Uni-President Enterprises Corp. | 176,172 | 331,469 | ||||||
|
| |||||||
| 6,039,776 | ||||||||
|
| |||||||
| Thailand - 3.6% | ||||||||
| Advanced Info Service PCL, NVDR | 55,700 | 258,119 | ||||||
| Airports of Thailand PCL, NVDR | 15,000 | 172,994 | ||||||
| Bangkok Bank PCL, NVDR | 17,300 | 81,441 | ||||||
| Bangkok Dusit Medical Services PCL, NVDR | 315,800 | 199,061 | ||||||
| BTS Group Holdings PCL, NVDR | 975,800 | 244,185 | ||||||
| Bumrungrad Hospital PCL, NVDR | 68,000 | 343,207 | ||||||
| Delta Electronics Thailand PCL, NVDR | 60,400 | 138,508 | ||||||
| Home Product Center PCL, NVDR | 813,800 | 235,538 | ||||||
| Siam Cement PCL (The), NVDR | 7,700 | 114,977 | ||||||
| Siam Commercial Bank PCL (The), NVDR | 4,300 | 18,454 | ||||||
|
| |||||||
| 1,806,484 | ||||||||
|
| |||||||
| Turkey - 1.5% | ||||||||
| BIM Birlesik Magazalar A/S | 22,226 | 370,750 | ||||||
| Enka Insaat ve Sanayi A/S | 8,830 | 12,915 | ||||||
| Eregli Demir ve Celik Fabrikalari TAS | 15,749 | 21,674 | ||||||
| Turk Telekomunikasyon A/S | 118,691 | 224,291 | ||||||
| Turkcell Iletisim Hizmetleri A/S * | 34,871 | 112,751 | ||||||
|
| |||||||
| 742,381 | ||||||||
|
| |||||||
TOTAL COMMON STOCKS | 47,489,350 | |||||||
|
| |||||||
| PREFERRED STOCK - 0.1% | ||||||||
| Brazil - 0.1% | ||||||||
| Cia Energetica de Sao Paulo, Series B | ||||||||
(cost $56,282) (1) | 7,200 | 32,854 | ||||||
|
| |||||||
| INVESTMENTS | SHARES | VALUE | ||||||
| SHORT-TERM INVESTMENT - 4.4% | ||||||||
| Investment Company - 4.4% | ||||||||
| J.P. Morgan U.S. Treasury Plus Money Market Fund - IM Shares, 0.22% | ||||||||
(cost $2,179,087) (c) | 2,179,087 | $ | 2,179,087 | |||||
|
| |||||||
| SECURITIES LENDING COLLATERAL - 2.2% | ||||||||
| Money Market Funds - 2.2% | ||||||||
| Investments in a Pooled Account through Securities Lending Program with JPMorgan Chase Bank | ||||||||
| Dreyfus Treasury & Agency Cash Management, 0.21% | ||||||||
(cost $1,090,427) (c)(d) | 1,090,427 | 1,090,427 | ||||||
|
| |||||||
TOTAL INVESTMENTS IN SECURITIES |
| 50,791,718 | ||||||
|
| |||||||
LIABILITIES IN EXCESS OF OTHER ASSETS - (1.6)% (e) |
| (782,596 | ) | |||||
|
| |||||||
NET ASSETS - 100.0% | 50,009,122 | |||||||
|
| |||||||
| SECTOR | VALUE | % OF NET ASSETS | ||||||
| Consumer Discretionary | $ | 4,807,946 | 9.6 | % | ||||
| Consumer Staples | 8,787,536 | 17.5 | ||||||
| Energy | 1,412,556 | 2.8 | ||||||
| Financials | 8,507,332 | 17.0 | ||||||
| Health Care | 3,709,899 | 7.4 | ||||||
| Industrials | 3,888,758 | 7.8 | ||||||
| Information Technology | 4,492,356 | 9.0 | ||||||
| Materials | 626,314 | 1.3 | ||||||
| Telecommunication Services | 7,229,289 | 14.5 | ||||||
| Utilities | 4,060,218 | 8.1 | ||||||
| Short-Term Investment | 2,179,087 | 4.4 | ||||||
| Securities Lending Collateral | 1,090,427 | 2.2 | ||||||
|
|
|
| |||||
Total Investments In Securities At Value | 50,791,718 | 101.6 | ||||||
| Liabilities in Excess of Other Assets (e) | (782,596 | ) | (1.6 | ) | ||||
|
|
|
| |||||
Net Assets | $ | 50,009,122 | 100.0 | % | ||||
|
|
|
| |||||
| * | Non-income producing security. |
| (a) | The security or a portion of this security is on loan at 9/30/2016. The total value of securities on loan at 9/30/2016 was $1,057,766. |
| (b) | Securities exempt from registration under Rule 144A or section 4(2), of the Securities Act of 1933. Under procedures approved by the Board of Trustees, such securities have been determined to be liquid by the investment adviser and may be resold, normally to qualified institutional buyers in transactions exempt from registration. Total value of all such securities at 9/30/2016 amounted to $605,369, which represents approximately 1.21% of net assets of the fund. |
| (c) | Represents 7-day effective yield as of 9/30/2016. |
| (d) | Represents security, or portion thereof, purchased with the cash collateral received for securities on loan. |
| (e) | Includes appreciation/(depreciation) on futures contracts. |
| The accompanying notes are an integral part of these financial statements. | (Continued) |
| AQR Funds | Annual Report | September 2016 | ||||||||||||||
147
| Schedule of Investments | September 30, 2016 |
| AQR EMERGING DEFENSIVE STYLE FUND |
All securities are Level 2 with respect to ASC 820, unless otherwise noted in parentheses.
| (1) | Level 1 security (See Note 4). |
Abbreviations
ADR - American Depositary Receipt
GDR - Global Depositary Receipt
NVDR - Non-Voting Depositary Receipt
Open futures contracts outstanding at September 30, 2016:
Exchange Traded
| NUMBER OF CONTRACTS | COUNTERPARTY | DESCRIPTION | EXPIRATION DATE | VALUE AT TRADE DATE | VALUE AT SEPTEMBER 30, 2016 | UNREALIZED APPRECIATION (DEPRECIATION) | ||||||||||||||
| Long Contracts: | ||||||||||||||||||||
| 39 | JPMS | E-Mini MSCI Emerging Markets Index Futures | 12/2016 | $1,792,795 | $1,779,375 | $(13,420 | ) | |||||||||||||
|
|
|
|
|
| |||||||||||||||
Collateral pledged to, or (received from), each counterparty at September 30, 2016 was as follows:
| COUNTERPARTY | OVER THE COUNTER | EXCHANGE TRADED | TOTAL | |||||
| JPMS | ||||||||
| Cash | $— | $103,207 | $103,207 | |||||
| ||||||||
| The accompanying notes are an integral part of these financial statements. |
| AQR Funds | Annual Report | September 2016 | ||||||||||||||
148
| Schedule of Investments | September 30, 2016 |
| AQR GLOBAL EQUITY FUND |
| INVESTMENTS | SHARES | VALUE | ||||||
| COMMON STOCKS - 91.0% | ||||||||
| Australia - 2.1% | ||||||||
| Aristocrat Leisure Ltd. | 9,320 | $ | 113,396 | |||||
| ASX Ltd. | 891 | 33,010 | ||||||
| BGP Holdings plc (3)*(a) | 96,388 | 7,798 | ||||||
| BHP Billiton Ltd. | 14,837 | 257,014 | ||||||
| BHP Billiton plc | 2,754 | 41,416 | ||||||
| Caltex Australia Ltd. | 8,887 | 234,961 | ||||||
| CIMIC Group Ltd. | 20,820 | 461,111 | ||||||
| Coca-Cola Amatil Ltd. | 6,362 | 50,165 | ||||||
| Computershare Ltd. | 2,187 | 17,346 | ||||||
| Fortescue Metals Group Ltd. | 72,791 | 278,613 | ||||||
| Goodman Group, REIT | 8,333 | 46,704 | ||||||
| GPT Group (The), REIT | 14,922 | 58,107 | ||||||
| Harvey Norman Holdings Ltd. | 10,441 | 41,795 | ||||||
| LendLease Group | 2,927 | 31,718 | ||||||
| Mirvac Group, REIT | 33,659 | 58,028 | ||||||
| National Australia Bank Ltd. | 3,516 | 75,580 | ||||||
| Newcrest Mining Ltd. | 7,468 | 126,061 | ||||||
| Origin Energy Ltd. | 33,836 | 142,697 | ||||||
| QBE Insurance Group Ltd. | 42,643 | 305,132 | ||||||
| Scentre Group, REIT | 25,938 | 93,641 | ||||||
| South32 Ltd. | 109,879 | 204,729 | ||||||
| Stockland, REIT | 17,557 | 64,301 | ||||||
| Suncorp Group Ltd. | 6,711 | 62,610 | ||||||
| Telstra Corp. Ltd. | 9,896 | 39,457 | ||||||
| Vicinity Centres, REIT | 14,880 | 36,289 | ||||||
| Westfield Corp., REIT | 9,064 | 67,822 | ||||||
|
| |||||||
| 2,949,501 | ||||||||
|
| |||||||
| Belgium - 0.3% | ||||||||
| Ageas | 7,406 | 270,788 | ||||||
| Proximus SADP | 7,085 | 211,955 | ||||||
|
| |||||||
| 482,743 | ||||||||
|
| |||||||
| Canada - 2.8% | ||||||||
| Bank of Montreal (1) | 3,220 | 211,001 | ||||||
| Barrick Gold Corp. (1) | 17,335 | 306,942 | ||||||
| Brookfield Asset Management, Inc., Class A (1) | 1,097 | 38,572 | ||||||
| Cameco Corp. (1) | 4,462 | 38,126 | ||||||
| Canadian Imperial Bank of Commerce (1) | 5,908 | 458,113 | ||||||
| Canadian Tire Corp. Ltd., Class A (1) | 1,649 | 165,132 | ||||||
| Cenovus Energy, Inc. (1) | 31,629 | 453,961 | ||||||
| CGI Group, Inc., Class A (1)* | 3,208 | 152,801 | ||||||
| Crescent Point Energy Corp. (1) | 1,800 | 23,736 | ||||||
| Dollarama, Inc. (1) | 2,366 | 184,725 | ||||||
| First Quantum Minerals Ltd. (1) | 26,054 | 215,669 | ||||||
| Great-West Lifeco, Inc. (1) | 1,345 | 33,103 | ||||||
| Husky Energy, Inc. (1)* | 7,812 | 95,689 | ||||||
| Imperial Oil Ltd. (1) | 1,926 | 60,248 | ||||||
| Industrial Alliance Insurance & Financial Services, Inc. (1) | 6,979 | 251,243 | ||||||
| Kinross Gold Corp. (1)* | 63,952 | 269,564 | ||||||
| Magna International, Inc. (1) | 1,734 | 74,438 | ||||||
| Open Text Corp. (1) | 955 | 61,859 | ||||||
| Power Corp. of Canada (1) | 1,646 | 34,866 | ||||||
| RioCan REIT (1) | 2,373 | 49,234 | ||||||
| Saputo, Inc. (1) | 1,107 | 38,468 | ||||||
| INVESTMENTS | SHARES | VALUE | ||||||
| Canada - 2.8% (continued) | ||||||||
| SNC-Lavalin Group, Inc. (1) | 1,265 | $ | 49,686 | |||||
| Sun Life Financial, Inc. (1) | 2,619 | 85,221 | ||||||
| Suncor Energy, Inc. (1) | 13,153 | 365,130 | ||||||
| TransCanada Corp. (1) | 1,252 | 59,463 | ||||||
| Yamana Gold, Inc. (1) | 42,823 | 184,420 | ||||||
|
| |||||||
| 3,961,410 | ||||||||
|
| |||||||
| China - 0.2% | ||||||||
| Yangzijiang Shipbuilding Holdings Ltd. | 426,200 | 235,768 | ||||||
|
| |||||||
| Denmark - 0.9% | ||||||||
| ISS A/S | 7,695 | 319,764 | ||||||
| Novo Nordisk A/S, Class B | 1,987 | 82,816 | ||||||
| TDC A/S * | 84,607 | 498,282 | ||||||
| Vestas Wind Systems A/S | 3,712 | 306,624 | ||||||
|
| |||||||
| 1,207,486 | ||||||||
|
| |||||||
| Finland - 0.7% | ||||||||
| Fortum OYJ | 5,317 | 85,922 | ||||||
| Neste OYJ | 6,923 | 295,307 | ||||||
| Nokia OYJ | 18,004 | 104,358 | ||||||
| Nokian Renkaat OYJ | 2,760 | 100,630 | ||||||
| Orion OYJ, Class B | 8,375 | 330,173 | ||||||
| UPM-Kymmene OYJ | 6,977 | 147,317 | ||||||
|
| |||||||
| 1,063,707 | ||||||||
|
| |||||||
| France - 3.5% | ||||||||
| Atos SE | 8,106 | 872,681 | ||||||
| BNP Paribas SA | 14,816 | 762,040 | ||||||
| Capgemini SA | 4,734 | 464,138 | ||||||
| Cie de Saint-Gobain | 3,884 | 168,061 | ||||||
| Cie Generale des Etablissements Michelin | 2,457 | 272,076 | ||||||
| CNP Assurances | 9,500 | 159,609 | ||||||
| Eiffage SA | 1,077 | 83,698 | ||||||
| Klepierre, REIT | 997 | 45,765 | ||||||
| Lagardere SCA | 7,379 | 187,916 | ||||||
| Orange SA | 33,495 | 524,785 | ||||||
| Peugeot SA * | 15,166 | 231,597 | ||||||
| Renault SA | 788 | 64,828 | ||||||
| Sanofi | 1,128 | 85,898 | ||||||
| SCOR SE | 1,991 | 61,916 | ||||||
| Societe Generale SA | 8,578 | 296,750 | ||||||
| Thales SA | 3,038 | 279,742 | ||||||
| Unibail-Rodamco SE, REIT | 614 | 165,554 | ||||||
| Vinci SA | 3,719 | 284,795 | ||||||
|
| |||||||
| 5,011,849 | ||||||||
|
| |||||||
| Germany - 3.1% | ||||||||
| Allianz SE | 1,837 | 272,997 | ||||||
| Bayer AG | 6,346 | 637,331 | ||||||
| Commerzbank AG | 12,313 | 79,554 | ||||||
| Covestro AG (b) | 1,933 | 114,391 | ||||||
| Deutsche Post AG | 2,805 | 87,820 | ||||||
| Deutsche Telekom AG | 8,375 | 140,704 | ||||||
| E.ON SE | 50,087 | 355,993 | ||||||
| Evonik Industries AG | 13,586 | 459,945 | ||||||
| Fresenius SE & Co. KGaA | 1,365 | 109,038 | ||||||
| Hannover Rueck SE | 2,682 | 287,498 | ||||||
| HeidelbergCement AG | 411 | 38,869 | ||||||
| HOCHTIEF AG | 309 | 43,608 | ||||||
| The accompanying notes are an integral part of these financial statements. | (Continued) |
| AQR Funds | Annual Report | September 2016 | ||||||||||||||
149
| Schedule of Investments | September 30, 2016 |
| AQR GLOBAL EQUITY FUND |
| INVESTMENTS | SHARES | VALUE | ||||||
| Germany - 3.1% (continued) | ||||||||
| Infineon Technologies AG | 5,507 | $ | 98,198 | |||||
| METRO AG | 7,556 | 224,910 | ||||||
| Muenchener Rueckversicherungs-Gesellschaft AG in Muenchen | 2,154 | 402,294 | ||||||
| OSRAM Licht AG | 11,837 | 695,381 | ||||||
| Siemens AG | 2,910 | 341,228 | ||||||
| Uniper SE * | 5,008 | 61,349 | ||||||
|
| |||||||
| 4,451,108 | ||||||||
|
| |||||||
| Hong Kong - 1.4% | ||||||||
| ASM Pacific Technology Ltd. | 1,082 | 8,956 | ||||||
| Cheung Kong Infrastructure Holdings Ltd. | 2,749 | 23,710 | ||||||
| Cheung Kong Property Holdings Ltd. | 8,701 | 64,003 | ||||||
| Hong Kong Exchanges and Clearing Ltd. | 5,269 | 139,446 | ||||||
| Kerry Properties Ltd. | 65,500 | 215,185 | ||||||
| Li & Fung Ltd. | 102,000 | 52,557 | ||||||
| Link REIT | 10,829 | 79,941 | ||||||
| New World Development Co. Ltd. | 263,000 | 344,870 | ||||||
| NWS Holdings Ltd. | 7,500 | 12,569 | ||||||
| PCCW Ltd. | 19,406 | 11,952 | ||||||
| Sino Land Co. Ltd. | 122,000 | 217,444 | ||||||
| Sun Hung Kai Properties Ltd. | 13,000 | 197,636 | ||||||
| Techtronic Industries Co. Ltd. | 11,500 | 45,049 | ||||||
| WH Group Ltd. (b) | 142,500 | 115,175 | ||||||
| Wharf Holdings Ltd. (The) | 9,000 | 66,029 | ||||||
| Wheelock & Co. Ltd. | 29,000 | 172,253 | ||||||
| Yue Yuen Industrial Holdings Ltd. | 59,623 | 246,413 | ||||||
|
| |||||||
| 2,013,188 | ||||||||
|
| |||||||
| Italy - 0.8% | ||||||||
| Enel SpA | 182,245 | 812,215 | ||||||
| Ferrari NV | 621 | 32,271 | ||||||
| Mediobanca SpA | 9,251 | 60,209 | ||||||
| Prysmian SpA | 7,161 | 187,514 | ||||||
|
| |||||||
| 1,092,209 | ||||||||
|
| |||||||
| Japan - 7.6% | ||||||||
| Aeon Mall Co. Ltd. | 700 | 11,056 | ||||||
| Ajinomoto Co., Inc. | 7,700 | 171,683 | ||||||
| Amada Holdings Co. Ltd. | 22,500 | 234,052 | ||||||
| Astellas Pharma, Inc. | 31,700 | 495,124 | ||||||
| Bandai Namco Holdings, Inc. | 10,200 | 312,202 | ||||||
| Chubu Electric Power Co., Inc. | 8,600 | 125,134 | ||||||
| Daiichi Sankyo Co. Ltd. | 4,500 | 108,128 | ||||||
| Daito Trust Construction Co. Ltd. | 486 | 77,731 | ||||||
| Daiwa House Industry Co. Ltd. | 2,451 | 67,267 | ||||||
| Fuji Heavy Industries Ltd. | 8,433 | 316,402 | ||||||
| FUJIFILM Holdings Corp. | 4,444 | 164,619 | ||||||
| Fujitsu Ltd. | 17,115 | 92,106 | ||||||
| Hakuhodo DY Holdings, Inc. | 5,600 | 65,633 | ||||||
| Hitachi Chemical Co. Ltd. | 14,000 | 321,677 | ||||||
| Hitachi Construction Machinery Co. Ltd. | 2,000 | 39,882 | ||||||
| Hitachi High-Technologies Corp. | 3,958 | 158,443 | ||||||
| Hoya Corp. | 2,706 | 108,856 | ||||||
| Hulic Co. Ltd. | 1,500 | 15,326 | ||||||
| Isetan Mitsukoshi Holdings Ltd. | 3,800 | 37,416 | ||||||
| Japan Airlines Co. Ltd. | 6,200 | 182,252 | ||||||
| Japan Real Estate Investment Corp., REIT | 10 | 59,799 | ||||||
| Japan Retail Fund Investment Corp., REIT | 22 | 54,260 | ||||||
| INVESTMENTS | SHARES | VALUE | ||||||
| Japan - 7.6% (continued) | ||||||||
| Japan Tobacco, Inc. | 5,400 | $ | 221,050 | |||||
| JTEKT Corp. | 13,788 | 207,096 | ||||||
| Kamigumi Co. Ltd. | 5,000 | 43,620 | ||||||
| Kaneka Corp. | 13,000 | 102,927 | ||||||
| Kao Corp. | 1,000 | 56,538 | ||||||
| Konami Holdings Corp. | 8,900 | 343,899 | ||||||
| Kyocera Corp. | 1,100 | 52,859 | ||||||
| Mazda Motor Corp. | 13,900 | 213,251 | ||||||
| MEIJI Holdings Co. Ltd. | 4,100 | 407,091 | ||||||
| Mitsubishi Chemical Holdings Corp. | 5,900 | 36,989 | ||||||
| Mitsubishi Electric Corp. | 18,000 | 230,701 | ||||||
| Mitsubishi Estate Co. Ltd. | 5,764 | 108,170 | ||||||
| Mitsubishi Motors Corp. | 64,600 | 301,764 | ||||||
| Mitsubishi Tanabe Pharma Corp. | 5,700 | 122,085 | ||||||
| Mitsubishi UFJ Financial Group, Inc. | 8,549 | 43,310 | ||||||
| Mitsui Chemicals, Inc. | 88,000 | 418,594 | ||||||
| Mitsui Fudosan Co. Ltd. | 4,598 | 97,820 | ||||||
| Mixi, Inc. | 7,200 | 260,862 | ||||||
| Mizuho Financial Group, Inc. | 21,700 | 36,574 | ||||||
| MS&AD Insurance Group Holdings, Inc. | 9,000 | 250,841 | ||||||
| Nexon Co. Ltd. | 13,100 | 205,783 | ||||||
| NHK Spring Co. Ltd. | 4,000 | 38,777 | ||||||
| Nippon Building Fund, Inc., REIT | 7 | 44,351 | ||||||
| Nippon Express Co. Ltd. | 47,000 | 219,724 | ||||||
| Nippon Telegraph & Telephone Corp. | 6,396 | 292,527 | ||||||
| Nitto Denko Corp. | 900 | 58,451 | ||||||
| Nomura Real Estate Holdings, Inc. | 1,000 | 16,903 | ||||||
| NSK Ltd. | 5,200 | 53,314 | ||||||
| NTT DOCOMO, Inc. | 5,300 | 134,636 | ||||||
| Obayashi Corp. | 6,100 | 60,505 | ||||||
| ORIX Corp. | 5,190 | 76,566 | ||||||
| Otsuka Corp. | 1,300 | 61,746 | ||||||
| Panasonic Corp. | 24,200 | 242,038 | ||||||
| Resona Holdings, Inc. | 32,600 | 137,103 | ||||||
| Seiko Epson Corp. | 12,400 | 238,767 | ||||||
| Sekisui House Ltd. | 2,900 | 49,406 | ||||||
| Shimamura Co. Ltd. | 1,300 | 158,264 | ||||||
| Shionogi & Co. Ltd. | 7,300 | 374,005 | ||||||
| Sompo Japan Nipponkoa Holdings, Inc. | 2,200 | 65,202 | ||||||
| Sony Corp. | 2,000 | 66,261 | ||||||
| Sumitomo Chemical Co. Ltd. | 44,000 | 195,510 | ||||||
| Sumitomo Heavy Industries Ltd. | 9,000 | 44,469 | ||||||
| Sumitomo Mitsui Financial Group, Inc. | 5,700 | 192,544 | ||||||
| Sumitomo Realty & Development Co. Ltd. | 2,624 | 68,016 | ||||||
| Taisei Corp. | 10,000 | 75,023 | ||||||
| TDK Corp. | 1,700 | 113,898 | ||||||
| Teijin Ltd. | 3,400 | 65,960 | ||||||
| Tokyo Electric Power Co. Holdings, Inc. * | 21,370 | 92,573 | ||||||
| Tokyo Tatemono Co. Ltd. | 1,200 | 14,435 | ||||||
| Tokyu Fudosan Holdings Corp. | 2,900 | 15,771 | ||||||
| Toyoda Gosei Co. Ltd. | 2,700 | 62,775 | ||||||
| Toyota Motor Corp. | 4,100 | 237,826 | ||||||
| Yamazaki Baking Co. Ltd. | 2,200 | 54,096 | ||||||
| Yokogawa Electric Corp. | 2,900 | 38,633 | ||||||
| Yokohama Rubber Co. Ltd. (The) | 3,800 | 60,828 | ||||||
|
| |||||||
| 10,701,775 | ||||||||
|
| |||||||
| The accompanying notes are an integral part of these financial statements. | (Continued) |
| AQR Funds | Annual Report | September 2016 | ||||||||||||||
150
| Schedule of Investments | September 30, 2016 |
| AQR GLOBAL EQUITY FUND |
| INVESTMENTS | SHARES | VALUE | ||||||
| Netherlands - 1.6% | ||||||||
| ASML Holding NV | 1,683 | $ | 184,441 | |||||
| Gemalto NV | 1,111 | 71,181 | ||||||
| ING Groep NV | 19,668 | 242,814 | ||||||
| Koninklijke Ahold NV * | 12,872 | 293,172 | ||||||
| NN Group NV | 16,182 | 496,794 | ||||||
| Randstad Holding NV | 6,622 | 301,119 | ||||||
| Royal Dutch Shell plc, Class B | 14,108 | 365,760 | ||||||
| Wolters Kluwer NV | 6,067 | 259,372 | ||||||
|
| |||||||
| 2,214,653 | ||||||||
|
| |||||||
| Singapore - 0.1% | ||||||||
| Genting Singapore plc | 79,200 | 43,767 | ||||||
| Sembcorp Industries Ltd. | 4,477 | 8,568 | ||||||
| Singapore Exchange Ltd. | 4,067 | 22,183 | ||||||
| Singapore Technologies Engineering Ltd. | 7,003 | 16,658 | ||||||
|
| |||||||
| 91,176 | ||||||||
|
| |||||||
| South Africa - 0.2% | ||||||||
| Investec plc | 6,409 | 39,068 | ||||||
| Mondi plc | 10,041 | 210,961 | ||||||
|
| |||||||
| 250,029 | ||||||||
|
| |||||||
| Spain - 1.4% | ||||||||
| ACS Actividades de Construccion y Servicios SA | 5,022 | 151,810 | ||||||
| Banco Santander SA | 56,845 | 252,184 | ||||||
| Endesa SA | 34,767 | 745,395 | ||||||
| Iberdrola SA | 39,179 | 266,394 | ||||||
| Repsol SA | 41,727 | 566,829 | ||||||
|
| |||||||
| 1,982,612 | ||||||||
|
| |||||||
| Sweden - 1.3% | ||||||||
| Boliden AB | 16,311 | 383,385 | ||||||
| Electrolux AB, Series B | 13,213 | 330,943 | ||||||
| Investor AB, Class B | 2,204 | 80,589 | ||||||
| Kinnevik AB, Class B * | 1,380 | 35,195 | ||||||
| Skanska AB, Class B | 3,292 | 76,910 | ||||||
| Svenska Cellulosa AB SCA, Class B | 4,430 | 131,486 | ||||||
| Swedish Match AB | 19,356 | 710,206 | ||||||
| Telefonaktiebolaget LM Ericsson, Class B | 19,539 | 141,077 | ||||||
|
| |||||||
| 1,889,791 | ||||||||
|
| |||||||
| Switzerland - 3.8% | ||||||||
| ABB Ltd. * | 18,254 | 411,408 | ||||||
| Actelion Ltd. * | 479 | 83,123 | ||||||
| Adecco Group AG | 8,874 | 500,189 | ||||||
| Aryzta AG* | 1,571 | 69,881 | ||||||
| Coca-Cola HBC AG * | 10,198 | 236,915 | ||||||
| Galenica AG | 170 | 180,782 | ||||||
| Glencore plc * | 124,037 | 339,635 | ||||||
| Lonza Group AG * | 2,374 | 454,381 | ||||||
| Nestle SA | 18,132 | 1,431,777 | ||||||
| Novartis AG | 2,329 | 183,805 | ||||||
| Roche Holding AG | 3,080 | 765,376 | ||||||
| Swiss Life Holding AG * | 1,264 | 327,784 | ||||||
| Swiss Re AG | 2,252 | 203,397 | ||||||
| Syngenta AG | 337 | 147,587 | ||||||
|
| |||||||
| 5,336,040 | ||||||||
|
| |||||||
| INVESTMENTS | SHARES | VALUE | ||||||
| United Kingdom - 5.3% | ||||||||
| 3i Group plc | 9,545 | $ | 80,478 | |||||
| Anglo American plc * | 28,333 | 353,335 | ||||||
| Barclays plc | 134,586 | 291,786 | ||||||
| Barratt Developments plc | 23,996 | 153,623 | ||||||
| BP plc | 66,517 | 387,710 | ||||||
| British Land Co. plc (The), REIT | 7,594 | 62,202 | ||||||
| BT Group plc | 13,092 | 65,870 | ||||||
| Centrica plc | 46,885 | 138,628 | ||||||
| Fiat Chrysler Automobiles NV | 54,430 | 345,968 | ||||||
| GlaxoSmithKline plc | 11,737 | 249,981 | ||||||
| Hammerson plc, REIT | 5,915 | 45,018 | ||||||
| HSBC Holdings plc | 23,196 | 174,359 | ||||||
| Imperial Brands plc | 8,267 | 425,508 | ||||||
| International Consolidated Airlines Group SA | 25,293 | 131,234 | ||||||
| Johnson Matthey plc | 964 | 41,119 | ||||||
| Kingfisher plc | 80,717 | 393,823 | ||||||
| Land Securities Group plc, REIT | 4,952 | 67,861 | ||||||
| Lloyds Banking Group plc | 54,318 | 38,377 | ||||||
| Persimmon plc | 31,220 | 734,063 | ||||||
| Randgold Resources Ltd. | 867 | 86,894 | ||||||
| Reckitt Benckiser Group plc | 1,074 | 101,112 | ||||||
| Rio Tinto plc | 7,349 | 244,253 | ||||||
| Royal Mail plc | 76,294 | 484,133 | ||||||
| SABMiller plc | 3,535 | 205,912 | ||||||
| Sage Group plc (The) | 33,280 | 317,979 | ||||||
| Sky plc | 9,046 | 104,844 | ||||||
| Tate & Lyle plc | 48,102 | 466,914 | ||||||
| Taylor Wimpey plc | 57,703 | 115,093 | ||||||
| Unilever plc | 5,942 | 281,176 | ||||||
| William Hill plc | 116,272 | 458,693 | ||||||
| WPP plc | 17,131 | 402,675 | ||||||
|
| |||||||
| 7,450,621 | ||||||||
|
| |||||||
| United States - 53.9% | ||||||||
| Accenture plc, Class A (1) | 927 | 113,252 | ||||||
| Activision Blizzard, Inc. (1) | 955 | 42,306 | ||||||
| Agilent Technologies, Inc. (1) | 6,588 | 310,229 | ||||||
| Akamai Technologies, Inc. (1)* | 1,128 | 59,773 | ||||||
| Allstate Corp. (The) (1) | 9,957 | 688,825 | ||||||
| Alphabet, Inc., Class A (1)* | 1,019 | 819,337 | ||||||
| Alphabet, Inc., Class C (1)* | 1,170 | 909,429 | ||||||
| Altria Group, Inc. (1) | 8,888 | 561,988 | ||||||
| Amazon.com, Inc. (1)* | 1,670 | 1,398,308 | ||||||
| Ameren Corp. (1) | 6,961 | 342,342 | ||||||
| American Electric Power Co., Inc. (1) | 9,730 | 624,763 | ||||||
| American International Group, Inc. (1) | 4,185 | 248,338 | ||||||
| American Tower Corp., REIT (1) | 2,400 | 271,992 | ||||||
| AmerisourceBergen Corp. (1) | 463 | 37,401 | ||||||
| Amgen, Inc. (1) | 1,334 | 222,525 | ||||||
| Analog Devices, Inc. (1) | 610 | 39,314 | ||||||
| Anthem, Inc. (1) | 3,264 | 409,012 | ||||||
| Apple, Inc. (1) | 21,664 | 2,449,115 | ||||||
| Applied Materials, Inc. (1) | 43,222 | 1,303,143 | ||||||
| Archer-Daniels-Midland Co. (1) | 14,749 | 621,965 | ||||||
| Arrow Electronics, Inc. (1)* | 7,770 | 497,047 | ||||||
| Assurant, Inc. (1) | 1,172 | 108,117 | ||||||
| AT&T, Inc. (1) | 8,174 | 331,946 | ||||||
| AvalonBay Communities, Inc., REIT (1) | 811 | 144,228 | ||||||
| The accompanying notes are an integral part of these financial statements. | (Continued) |
| AQR Funds | Annual Report | September 2016 | ||||||||||||||
151
| Schedule of Investments | September 30, 2016 |
| AQR GLOBAL EQUITY FUND |
| INVESTMENTS | SHARES | VALUE | ||||||
| United States - 53.9% (continued) | ||||||||
| Avery Dennison Corp. (1) | 1,629 | $ | 126,720 | |||||
| Avnet, Inc. (1) | 3,943 | 161,900 | ||||||
| Axis Capital Holdings Ltd. (1) | 4,872 | 264,696 | ||||||
| Baxter International, Inc. (1) | 7,066 | 336,342 | ||||||
| Berkshire Hathaway, Inc., Class B (1)* | 4,337 | 626,566 | ||||||
| Best Buy Co., Inc. (1) | 10,737 | 409,939 | ||||||
| Biogen, Inc. (1)* | 1,860 | 582,236 | ||||||
| Boeing Co. (The) (1) | 4,167 | 548,961 | ||||||
| Boston Properties, Inc., REIT (1) | 709 | 96,630 | ||||||
| Bunge Ltd. (1) | 4,384 | 259,664 | ||||||
| CA, Inc. (1) | 1,943 | 64,274 | ||||||
| Campbell Soup Co. (1) | 754 | 41,244 | ||||||
| Cardinal Health, Inc. (1) | 3,291 | 255,711 | ||||||
| Celanese Corp., Series A (1) | 5,079 | 338,058 | ||||||
| Celgene Corp. (1)* | 1,201 | 125,541 | ||||||
| CenterPoint Energy, Inc. (1) | 8,569 | 199,058 | ||||||
| CenturyLink, Inc. (1) | 3,644 | 99,955 | ||||||
| Charter Communications, Inc., Class A (1)* | 667 | 179,967 | ||||||
| Chevron Corp. (1) | 3,114 | 320,493 | ||||||
| Cigna Corp. (1) | 1,386 | 180,624 | ||||||
| Cisco Systems, Inc. (1) | 23,632 | 749,607 | ||||||
| Citigroup, Inc. (1) | 6,601 | 311,765 | ||||||
| Citrix Systems, Inc. (1)* | 4,465 | 380,507 | ||||||
| Coca-Cola Co. (The) (1) | 2,329 | 98,563 | ||||||
| Cognizant Technology Solutions Corp., Class A (1)* | 5,142 | 245,325 | ||||||
| Comcast Corp., Class A (1) | 4,600 | 305,164 | ||||||
| Comerica, Inc. (1) | 3,857 | 182,513 | ||||||
| ConAgra Foods, Inc. (1) | 15,297 | 720,642 | ||||||
| ConocoPhillips (1) | 1,745 | 75,855 | ||||||
| Crown Castle International Corp., REIT (1) | 1,397 | 131,611 | ||||||
| Crown Holdings, Inc. (1)* | 1,873 | 106,930 | ||||||
| Cummins, Inc. (1) | 2,841 | 364,074 | ||||||
| Darden Restaurants, Inc. (1) | 2,970 | 182,120 | ||||||
| Dell Technologies, Inc. (1)* | 1,196 | 57,169 | ||||||
| Delta Air Lines, Inc. (1) | 11,561 | 455,041 | ||||||
| Dick’s Sporting Goods, Inc. (1) | 3,854 | 218,599 | ||||||
| Discover Financial Services (1) | 3,066 | 173,382 | ||||||
| Dow Chemical Co. (The) (1) | 3,729 | 193,274 | ||||||
| DR Horton, Inc. (1) | 9,458 | 285,632 | ||||||
| Dr. Pepper Snapple Group, Inc. (1) | 670 | 61,178 | ||||||
| Eastman Chemical Co. (1) | 990 | 67,003 | ||||||
| eBay, Inc. (1)* | 23,325 | 767,392 | ||||||
| Edwards Lifesciences Corp. (1)* | 858 | 103,440 | ||||||
| EI du Pont de Nemours & Co. (1) | 3,282 | 219,796 | ||||||
| Electronic Arts, Inc. (1)* | 762 | 65,075 | ||||||
| Entergy Corp. (1) | 5,434 | 416,951 | ||||||
| Equinix, Inc., REIT (1) | 445 | 160,311 | ||||||
| Equity Residential, REIT (1) | 2,048 | 131,748 | ||||||
| Essex Property Trust, Inc., REIT (1) | 422 | 93,979 | ||||||
| Exelon Corp. (1) | 12,864 | 428,243 | ||||||
| Exxon Mobil Corp. (1) | 11,527 | 1,006,077 | ||||||
| F5 Networks, Inc. (1)* | 417 | 51,975 | ||||||
| Facebook, Inc., Class A (1)* | 8,887 | 1,139,935 | ||||||
| FirstEnergy Corp. (1) | 39,962 | 1,321,943 | ||||||
| Flextronics International Ltd. (1)* | 18,917 | 257,650 | ||||||
| Fluor Corp. (1) | 1,658 | 85,089 | ||||||
| Foot Locker, Inc. (1) | 2,711 | 183,589 | ||||||
| INVESTMENTS | SHARES | VALUE | ||||||
| United States - 53.9% (continued) | ||||||||
| Freeport-McMoRan, Inc. (1) | 5,250 | $ | 57,015 | |||||
| General Dynamics Corp. (1) | 2,680 | 415,829 | ||||||
| General Electric Co. (1) | 4,696 | 139,095 | ||||||
| General Growth Properties, Inc., REIT (1) | 3,709 | 102,368 | ||||||
| General Mills, Inc. (1) | 2,925 | 186,849 | ||||||
| General Motors Co. (1) | 13,468 | 427,878 | ||||||
| Gilead Sciences, Inc. (1) | 13,348 | 1,056,094 | ||||||
| H&R Block, Inc. (1) | 10,274 | 237,843 | ||||||
| Hasbro, Inc. (1) | 2,310 | 183,252 | ||||||
| HCP, Inc., REIT (1) | 2,772 | 105,197 | ||||||
| Hewlett Packard Enterprise Co. (1) | 10,501 | 238,898 | ||||||
| Home Depot, Inc. (The) (1) | 2,781 | 357,859 | ||||||
| Host Hotels & Resorts, Inc., REIT (1) | 5,400 | 84,078 | ||||||
| HP, Inc. (1) | 92,156 | 1,431,183 | ||||||
| Humana, Inc. (1) | 327 | 57,843 | ||||||
| Ingredion, Inc. (1) | 3,701 | 492,455 | ||||||
| Intel Corp. (1) | 28,699 | 1,083,387 | ||||||
| International Business Machines Corp. (1) | 2,037 | 323,577 | ||||||
| International Paper Co. (1) | 3,564 | 171,001 | ||||||
| Interpublic Group of Cos., Inc. (The) (1) | 3,703 | 82,762 | ||||||
| Intuit, Inc. (1) | 349 | 38,393 | ||||||
| Jacobs Engineering Group, Inc. (1)* | 4,228 | 218,672 | ||||||
| Jazz Pharmaceuticals plc (1)* | 2,098 | 254,865 | ||||||
| Johnson & Johnson (1) | 12,074 | 1,426,302 | ||||||
| JPMorgan Chase & Co. (1) | 8,191 | 545,439 | ||||||
| Kimberly-Clark Corp. (1) | 2,557 | 322,540 | ||||||
| Kimco Realty Corp., REIT (1) | 3,800 | 110,010 | ||||||
| Kinder Morgan, Inc. (1) | 13,895 | 321,391 | ||||||
| Kraft Heinz Co. (The) (1) | 2,951 | 264,144 | ||||||
| L-3 Communications Holdings, Inc. (1) | 3,992 | 601,714 | ||||||
| Las Vegas Sands Corp. (1) | 7,587 | 436,556 | ||||||
| Lear Corp. (1) | 5,777 | 700,288 | ||||||
| Level 3 Communications, Inc. (1)* | 2,057 | 95,404 | ||||||
| Lincoln National Corp. (1) | 4,096 | 192,430 | ||||||
| Lowe’s Cos., Inc. (1) | 2,760 | 199,300 | ||||||
| LyondellBasell Industries NV, Class A (1) | 6,860 | 553,328 | ||||||
| Macy’s, Inc. (1) | 6,866 | 254,385 | ||||||
| Mallinckrodt plc (1)* | 7,640 | 533,119 | ||||||
| ManpowerGroup, Inc. (1) | 4,265 | 308,189 | ||||||
| Marathon Petroleum Corp. (1) | 6,889 | 279,624 | ||||||
| Marriott International, Inc., Class A (1) | 1 | 54 | ||||||
| Marvell Technology Group Ltd. (1) | 23,198 | 307,837 | ||||||
| Masco Corp. (1) | 5,663 | 194,298 | ||||||
| Maxim Integrated Products, Inc. (1) | 12,215 | 487,745 | ||||||
| McKesson Corp. (1) | 3,546 | 591,295 | ||||||
| Merck & Co., Inc. (1) | 10,220 | 637,830 | ||||||
| MetLife, Inc. (1) | 1,323 | 58,781 | ||||||
| MGM Resorts International (1)* | 1,613 | 41,986 | ||||||
| Michael Kors Holdings Ltd. (1)* | 7,156 | 334,829 | ||||||
| Microsoft Corp. (1) | 34,238 | 1,972,109 | ||||||
| Mondelez International, Inc., Class A (1) | 4,560 | 200,184 | ||||||
| Monsanto Co. (1) | 1,679 | 171,594 | ||||||
| Newmont Mining Corp. (1) | 2,131 | 83,727 | ||||||
| News Corp., Class A (1) | 3,155 | 44,107 | ||||||
| Northrop Grumman Corp. (1) | 3,952 | 845,530 | ||||||
| Nuance Communications, Inc. (1)* | 20,764 | 301,078 | ||||||
| Nucor Corp. (1) | 1,622 | 80,208 | ||||||
| Oracle Corp. (1) | 12,201 | 479,255 | ||||||
| The accompanying notes are an integral part of these financial statements. | (Continued) |
| AQR Funds | Annual Report | September 2016 | ||||||||||||||
152
| Schedule of Investments | September 30, 2016 |
| AQR GLOBAL EQUITY FUND |
| INVESTMENTS | SHARES | VALUE | ||||||
| United States - 53.9% (continued) | ||||||||
| PepsiCo, Inc. (1) | 9,570 | $ | 1,040,929 | |||||
| Pfizer, Inc. (1) | 21,959 | 743,751 | ||||||
| PG&E Corp. (1) | 1,764 | 107,904 | ||||||
| Phillips 66 (1) | 2,710 | 218,290 | ||||||
| Pinnacle West Capital Corp. (1) | 4,992 | 379,342 | ||||||
| PNC Financial Services Group, Inc. (The) (1) | 19,140 | 1,724,323 | ||||||
| PPL Corp. (1) | 6,695 | 231,446 | ||||||
| Priceline Group, Inc. (The) (1)* | 55 | 80,932 | ||||||
| Procter & Gamble Co. (The) (1) | 12,737 | 1,143,146 | ||||||
| Progressive Corp. (The) (1) | 9,191 | 289,516 | ||||||
| Prologis, Inc., REIT (1) | 2,980 | 159,549 | ||||||
| Public Service Enterprise Group, Inc. (1) | 10,571 | 442,608 | ||||||
| Public Storage, REIT (1) | 654 | 145,934 | ||||||
| QUALCOMM, Inc. (1) | 15,367 | 1,052,639 | ||||||
| Quest Diagnostics, Inc. (1) | 2,013 | 170,360 | ||||||
| Quintiles Transnational Holdings, Inc. (1)* | 484 | 39,233 | ||||||
| Raytheon Co. (1) | 4,215 | 573,788 | ||||||
| Republic Services, Inc. (1) | 3,136 | 158,211 | ||||||
| Rite Aid Corp. (1)* | 3,658 | 28,130 | ||||||
| Robert Half International, Inc. (1) | 10,780 | 408,131 | ||||||
| S&P Global, Inc. (1) | 1,010 | 127,826 | ||||||
| Sealed Air Corp. (1) | 828 | 37,939 | ||||||
| Shire plc | 3,495 | 225,998 | ||||||
| Simon Property Group, Inc., REIT (1) | 1,352 | 279,878 | ||||||
| Southwest Airlines Co. (1) | 23,790 | 925,193 | ||||||
| Sprint Corp. (1)* | 5,714 | 37,884 | ||||||
| St. Jude Medical, Inc. (1) | 2,459 | 196,130 | ||||||
| Staples, Inc. (1) | 18,093 | 154,695 | ||||||
| SunTrust Banks, Inc. (1) | 15,028 | 658,226 | ||||||
| Synchrony Financial (1) | 6,580 | 184,240 | ||||||
| Synopsys, Inc. (1)* | 3,460 | 205,351 | ||||||
| TEGNA, Inc. (1) | 7,074 | 154,638 | ||||||
| Tesoro Corp. (1) | 6,966 | 554,215 | ||||||
| Texas Instruments, Inc. (1) | 6,221 | 436,590 | ||||||
| Textron, Inc. (1) | 1,544 | 61,374 | ||||||
| Time Warner, Inc. (1) | 2,367 | 188,437 | ||||||
| TJX Cos., Inc. (The) (1) | 1,779 | 133,034 | ||||||
| Travelers Cos., Inc. (The) (1) | 5,400 | 618,570 | ||||||
| Tyson Foods, Inc., Class A (1) | 17,926 | 1,338,534 | ||||||
| UGI Corp. (1) | 15,756 | 712,801 | ||||||
| United Continental Holdings, Inc. (1)* | 19,089 | 1,001,600 | ||||||
| United Technologies Corp. (1) | 3,426 | 348,082 | ||||||
| United Therapeutics Corp. (1)* | 4,366 | 515,537 | ||||||
| UnitedHealth Group, Inc. (1) | 8,898 | 1,245,720 | ||||||
| Universal Health Services, Inc., Class B (1) | 1,287 | 158,584 | ||||||
| Valeant Pharmaceuticals International, Inc. (1)* | 1,474 | 36,166 | ||||||
| Valero Energy Corp. (1) | 9,935 | 526,555 | ||||||
| Ventas, Inc., REIT (1) | 2,800 | 197,764 | ||||||
| Verizon Communications, Inc. (1) | 13,653 | 709,683 | ||||||
| Vornado Realty Trust, REIT (1) | 729 | 73,782 | ||||||
| Walgreens Boots Alliance, Inc. (1) | 1,553 | 125,203 | ||||||
| Wal-Mart Stores, Inc. (1) | 13,132 | 947,080 | ||||||
| Waste Management, Inc. (1) | 8,251 | 526,084 | ||||||
| Wells Fargo & Co. (1) | 19,427 | 860,228 | ||||||
| Welltower, Inc., REIT (1) | 1,800 | 134,586 | ||||||
| Weyerhaeuser Co., REIT (1) | 3,285 | 104,923 | ||||||
| Whirlpool Corp. (1) | 356 | 57,729 | ||||||
| INVESTMENTS | SHARES | VALUE | ||||||
| United States - 53.9% (continued) | ||||||||
| Williams Cos., Inc. (The) (1) | 1,375 | $ | 42,254 | |||||
| WR Grace & Co. (1) | 2,607 | 192,397 | ||||||
| Xerox Corp. (1) | 30,857 | 312,581 | ||||||
| Xilinx, Inc. (1) | 4,689 | 254,800 | ||||||
| Yum! Brands, Inc. (1) | 1,376 | 124,955 | ||||||
|
| |||||||
| 76,161,432 | ||||||||
|
| |||||||
TOTAL COMMON STOCKS | 128,547,098 | |||||||
|
| |||||||
| PREFERRED STOCK - 0.0% (c) | ||||||||
| Germany - 0.0% (c) | ||||||||
| Porsche Automobil Holding SE | ||||||||
(cost $69,853) | 865 | 44,247 | ||||||
|
| |||||||
| SHORT-TERM INVESTMENT - 5.7% | ||||||||
| Investment Company - 5.7% | ||||||||
| J.P. Morgan U.S. Treasury Plus Money Market Fund- IM Shares, 0.22% | ||||||||
(cost $8,058,564) (d)(e) | 8,058,564 | 8,058,564 | ||||||
|
| |||||||
TOTAL INVESTMENTS IN SECURITIES | 136,649,909 | |||||||
|
| |||||||
| OTHER ASSETS IN EXCESS OF LIABILITIES - 3.3% (f) | 4,648,281 | |||||||
|
| |||||||
NET ASSETS - 100.0% | 141,298,190 | |||||||
|
| |||||||
| SECTOR | VALUE | % OF NET ASSETS | ||||||
| Consumer Discretionary | $ | 14,462,241 | 10.2 | % | ||||
| Consumer Staples | 14,147,673 | 10.0 | ||||||
| Energy | 6,434,372 | 4.6 | ||||||
| Financials | 15,340,277 | 10.9 | ||||||
| Health Care | 14,822,790 | 10.5 | ||||||
| Industrials | 15,468,360 | 10.9 | ||||||
| Information Technology | 23,325,583 | 16.5 | ||||||
| Materials | 8,051,214 | 5.7 | ||||||
| Real Estate | 5,429,081 | 3.8 | ||||||
| Telecommunication Services | 3,195,040 | 2.3 | ||||||
| Utilities | 7,914,714 | 5.6 | ||||||
| Short-Term Investment | 8,058,564 | 5.7 | ||||||
|
|
|
| |||||
Total Investments In Securities At Value | 136,649,909 | 96.7 | ||||||
| Other Assets in Excess of Liabilities (f) | 4,648,281 | 3.3 | ||||||
|
|
|
| |||||
Net Assets | $ | 141,298,190 | 100.0 | % | ||||
|
|
|
| |||||
| * | Non-income producing security. |
| (a) | Security fair valued as of 9/30/2016 in accordance with procedures approved by the Board of Trustees. Total value of all such securities at 9/30/2016 amounted to $7,798, which represents approximately 0.01% of net assets of the fund. |
| The accompanying notes are an integral part of these financial statements. | (Continued) |
| AQR Funds | Annual Report | September 2016 | ||||||||||||||
153
| Schedule of Investments | September 30, 2016 |
| AQR GLOBAL EQUITY FUND |
| (b) | Securities exempt from registration under Rule 144A or section 4(2), of the Securities Act of 1933. Under procedures approved by the Board of Trustees, such securities have been determined to be liquid by the investment adviser and may be resold, normally to qualified institutional buyers in transactions exempt from registration. Total value of all such securities at 9/30/2016 amounted to $229,566, which represents approximately 0.16% of net assets of the fund. |
| (c) | Represents less than 0.05% of net assets. |
| (d) | Represents 7-day effective yield as of 9/30/2016. |
| (e) | All or a portion of the security pledged as collateral for forward foreign currency exchange contracts. |
| (f) | Includes appreciation/(depreciation) on forward foreign currency exchange, futures and swap contracts. |
All securities are Level 2 with respect to ASC 820, unless otherwise noted in parentheses.
| (1) | Level 1 security (See Note 4). |
| (3) | Level 3 security (See Note 4). |
Abbreviations
OYJ - Public Traded Company
REIT - Real Estate Investment Trust
SCA - Limited partnership with share capital
Total return swap contracts outstanding as of September 30, 2016:
Over the Counter
| ||||||||||||||||
| COUNTERPARTY | UNDERLYING REFERENCE INSTRUMENT | TERMINATION DATE | CURRENCY | NOTIONAL VALUE | UNREALIZED APPRECIATION (DEPRECIATION) | |||||||||||
| GSIN | Hang Seng Index October Futures | 10/2016 | HKD | 11,728,787 | $(9,317 | ) | ||||||||||
| GSIN | Swiss Market Index December Futures | 12/2016 | CHF | (983,035 | ) | 9,626 | ||||||||||
|
| |||||||||||||||
| $309 | ||||||||||||||||
|
| |||||||||||||||
Open futures contracts outstanding at September 30, 2016:
Exchange Traded
| NUMBER OF CONTRACTS | COUNTERPARTY | DESCRIPTION | EXPIRATION DATE | VALUE AT TRADE DATE | VALUE AT SEPTEMBER 30, 2016 | UNREALIZED APPRECIATION (DEPRECIATION) | ||||||||||||||
| Long Contracts: | ||||||||||||||||||||
| 46 | BARC | CAC40 Index Futures | 10/2016 | $2,268,130 | $2,296,139 | $28,009 | ||||||||||||||
| 32 | BARC | DAX Index Futures | 12/2016 | 9,352,320 | 9,447,373 | 95,053 | ||||||||||||||
| 4 | BARC | FTSE 100 Index Futures | 12/2016 | 351,715 | 355,534 | 3,819 | ||||||||||||||
| 1 | BARC | Hang Seng Index Futures | 10/2016 | 151,618 | 150,282 | (1,336 | ) | |||||||||||||
| 19 | BARC | IBEX 35 Index Futures | 10/2016 | 1,860,770 | 1,870,259 | 9,489 | ||||||||||||||
| 15 | BARC | MSCI Singapore Index Futures | 10/2016 | 343,685 | 346,649 | 2,964 | ||||||||||||||
| 29 | BARC | S&P 500 E-Mini Futures | 12/2016 | 3,123,782 | 3,132,580 | 8,798 | ||||||||||||||
| 65 | BARC | TOPIX Index Futures | 12/2016 | 8,544,466 | 8,480,351 | (64,115 | ) | |||||||||||||
|
|
|
|
|
| |||||||||||||||
| 25,996,486 | 26,079,167 | 82,681 | ||||||||||||||||||
|
|
|
|
|
| |||||||||||||||
| Short Contracts: | ||||||||||||||||||||
| 42 | BARC | Amsterdam Index Futures | 10/2016 | $(4,189,949 | ) | $(4,266,079 | ) | $(76,130 | ) | |||||||||||
| 8 | BARC | FTSE/MIB Index Futures | 12/2016 | (722,127 | ) | (734,986 | ) | (12,859 | ) | |||||||||||
| 111 | BARC | OMXS30 Index Futures | 10/2016 | (1,830,348 | ) | (1,861,256 | ) | (30,908 | ) | |||||||||||
| 16 | BARC | S&P/Toronto Stock Exchange 60 Index Futures | 12/2016 | (2,047,715 | ) | (2,085,933 | ) | (38,218 | ) | |||||||||||
| 78 | BARC | SPI 200 Index Futures | 12/2016 | (7,778,156 | ) | (8,083,014 | ) | (304,858 | ) | |||||||||||
|
|
|
|
|
| |||||||||||||||
| (16,568,295 | ) | (17,031,268 | ) | (462,973 | ) | |||||||||||||||
|
|
|
|
|
| |||||||||||||||
| $9,428,191 | $9,047,899 | $(380,292 | ) | |||||||||||||||||
|
|
|
|
|
| |||||||||||||||
| The accompanying notes are an integral part of these financial statements. | (Continued) |
| AQR Funds | Annual Report | September 2016 | ||||||||||||||
154
| Schedule of Investments | September 30, 2016 |
| AQR GLOBAL EQUITY FUND |
Forward foreign currency exchange contracts outstanding as of September 30, 2016:
Over the Counter
| PURCHASE CONTRACTS | COUNTERPARTY | CURRENCY | CURRENCY AMOUNT PURCHASED | VALUE AT SETTLEMENT DATE | VALUE AT SEPTEMBER 30, 2016 | UNREALIZED APPRECIATION (DEPRECIATION) | ||||||||||||||
| Australian Dollar, Expiring 12/21/16 | CITG | AUD | 3,465,200 | $2,604,395 | $2,647,316 | $42,921 | ||||||||||||||
| Australian Dollar, Expiring 12/21/16 | JPMC | AUD | 4,270,800 | 3,211,960 | 3,262,772 | 50,812 | ||||||||||||||
| Canadian Dollar, Expiring 12/21/16 | CITG | CAD | 852,200 | 656,592 | 649,946 | (6,646 | ) | |||||||||||||
| Canadian Dollar, Expiring 12/21/16 | JPMC | CAD | 1,276,798 | 983,739 | 973,772 | (9,967 | ) | |||||||||||||
| Swiss Franc, Expiring 12/21/16 | CITG | CHF | 347,600 | 357,398 | 359,557 | 2,159 | ||||||||||||||
| Swiss Franc, Expiring 12/21/16 | JPMC | CHF | 299,400 | 307,251 | 309,699 | 2,448 | ||||||||||||||
| Euro, Expiring 12/21/16 | CITG | EUR | 735,000 | 823,152 | 828,730 | 5,578 | ||||||||||||||
| Euro, Expiring 12/21/16 | JPMC | EUR | 24,000 | 26,898 | 27,061 | 163 | ||||||||||||||
| British Pound, Expiring 12/21/16 | CITG | GBP | 1,410,000 | 1,850,270 | 1,830,634 | (19,636 | ) | |||||||||||||
| Hong Kong Dollar, Expiring 12/21/16 | CITG | HKD | 1,871,000 | 241,478 | 241,415 | (63 | ) | |||||||||||||
| Hong Kong Dollar, Expiring 12/21/16 | JPMC | HKD | 279,000 | 35,992 | 35,999 | 7 | ||||||||||||||
| Israeli Shekel, Expiring 12/21/16 | CITG | ILS | 612,400 | 163,469 | 163,765 | 296 | ||||||||||||||
| Israeli Shekel, Expiring 12/21/16 | JPMC | ILS | 906,599 | 242,025 | 242,438 | 413 | ||||||||||||||
| Japanese Yen, Expiring 12/21/16 | CITG | JPY | 954,614,000 | 9,408,226 | 9,447,645 | 39,419 | ||||||||||||||
| Japanese Yen, Expiring 12/21/16 | JPMC | JPY | 1,418,523,000 | 13,978,655 | 14,038,870 | 60,215 | ||||||||||||||
| Norwegian Krone, Expiring 12/21/16 | CITG | NOK | 10,207,601 | 1,238,845 | 1,277,093 | 38,248 | ||||||||||||||
| Norwegian Krone, Expiring 12/21/16 | JPMC | NOK | 13,901,400 | 1,689,249 | 1,739,233 | 49,984 | ||||||||||||||
| New Zealand Dollar, Expiring 12/21/16 | CITG | NZD | 7,182,401 | 5,241,843 | 5,213,803 | (28,040 | ) | |||||||||||||
| New Zealand Dollar, Expiring 12/21/16 | JPMC | NZD | 9,846,600 | 7,196,483 | 7,147,785 | (48,698 | ) | |||||||||||||
| Swedish Krona, Expiring 12/21/16 | CITG | SEK | 1,000 | 117 | 117 | — | ||||||||||||||
| Singapore Dollar, Expiring 12/21/16 | CITG | SGD | 228,600 | 168,278 | 167,686 | (592 | ) | |||||||||||||
| Singapore Dollar, Expiring 12/21/16 | JPMC | SGD | 317,400 | 233,463 | 232,823 | (640 | ) | |||||||||||||
|
|
|
|
|
| |||||||||||||||
| $50,659,778 | $50,838,159 | $178,381 | ||||||||||||||||||
|
|
|
|
|
| |||||||||||||||
| The accompanying notes are an integral part of these financial statements. | (Continued) |
| AQR Funds | Annual Report | September 2016 | ||||||||||||||
155
| Schedule of Investments | September 30, 2016 |
| AQR GLOBAL EQUITY FUND |
SALES CONTRACTS | COUNTERPARTY | CURRENCY | CURRENCY AMOUNT SOLD | VALUE AT SETTLEMENT DATE | VALUE AT SEPTEMBER 30, 2016 | UNREALIZED APPRECIATION (DEPRECIATION) | ||||||||||||||
| Australian Dollar, Expiring 12/21/16 | CITG | AUD | (907,600 | ) | $(684,798 | ) | $(693,381 | ) | $(8,583 | ) | ||||||||||
| Australian Dollar, Expiring 12/21/16 | JPMC | AUD | (1,241,400 | ) | (935,513 | ) | (948,395 | ) | (12,882 | ) | ||||||||||
| Canadian Dollar, Expiring 12/21/16 | CITG | CAD | (2,922,400 | ) | (2,210,528 | ) | (2,228,818 | ) | (18,290 | ) | ||||||||||
| Canadian Dollar, Expiring 12/21/16 | JPMC | CAD | (3,888,600 | ) | (2,940,581 | ) | (2,965,708 | ) | (25,127 | ) | ||||||||||
| Swiss Franc, Expiring 12/21/16 | CITG | CHF | (2,863,600 | ) | (2,959,515 | ) | (2,962,106 | ) | (2,591 | ) | ||||||||||
| Swiss Franc, Expiring 12/21/16 | JPMC | CHF | (4,289,400 | ) | (4,433,091 | ) | (4,436,951 | ) | (3,860 | ) | ||||||||||
| Danish Krone, Expiring 12/21/16 | CITG | DKK | (1,428,200 | ) | (215,636 | ) | (216,316 | ) | (680 | ) | ||||||||||
| Danish Krone, Expiring 12/21/16 | JPMC | DKK | (376,800 | ) | (57,398 | ) | (57,070 | ) | 328 | |||||||||||
| Euro, Expiring 12/21/16 | CITG | EUR | (1,858,800 | ) | (2,094,086 | ) | (2,095,843 | ) | (1,757 | ) | ||||||||||
| Euro, Expiring 12/21/16 | JPMC | EUR | (2,275,200 | ) | (2,564,514 | ) | (2,565,345 | ) | (831 | ) | ||||||||||
| British Pound, Expiring 12/21/16 | CITG | GBP | (1,336,802 | ) | (1,779,424 | ) | (1,735,600 | ) | 43,824 | |||||||||||
| British Pound, Expiring 12/21/16 | JPMC | GBP | (2,005,201 | ) | (2,669,129 | ) | (2,603,397 | ) | 65,732 | |||||||||||
| Hong Kong Dollar, Expiring 12/21/16 | CITG | HKD | (2,526,000 | ) | (326,008 | ) | (325,930 | ) | 78 | |||||||||||
| Hong Kong Dollar, Expiring 12/21/16 | JPMC | HKD | (957,000 | ) | (123,508 | ) | (123,482 | ) | 26 | |||||||||||
| Israeli Shekel, Expiring 12/21/16 | CITG | ILS | (44,000 | ) | (11,642 | ) | (11,766 | ) | (124 | ) | ||||||||||
| Israeli Shekel, Expiring 12/21/16 | JPMC | ILS | (18,000 | ) | (4,770 | ) | (4,813 | ) | (43 | ) | ||||||||||
| Japanese Yen, Expiring 12/21/16 | CITG | JPY | (364,071,400 | ) | (3,558,362 | ) | (3,603,151 | ) | (44,789 | ) | ||||||||||
| Japanese Yen, Expiring 12/21/16 | JPMC | JPY | (65,811,600 | ) | (647,050 | ) | (651,326 | ) | (4,276 | ) | ||||||||||
| New Zealand Dollar, Expiring 12/21/16 | CITG | NZD | (140,400 | ) | (102,367 | ) | (101,918 | ) | 449 | |||||||||||
| New Zealand Dollar, Expiring 12/21/16 | JPMC | NZD | (210,600 | ) | (153,464 | ) | (152,877 | ) | 587 | |||||||||||
| Swedish Krona, Expiring 12/21/16 | CITG | SEK | (42,471,801 | ) | (5,025,805 | ) | (4,971,039 | ) | 54,766 | |||||||||||
| Swedish Krona, Expiring 12/21/16 | JPMC | SEK | (38,626,200 | ) | (4,587,946 | ) | (4,520,938 | ) | 67,008 | |||||||||||
| Singapore Dollar, Expiring 12/21/16 | CITG | SGD | (78,000 | ) | (57,240 | ) | (57,216 | ) | 24 | |||||||||||
|
|
|
|
|
| |||||||||||||||
| (38,142,375 | ) | (38,033,386 | ) | 108,989 | ||||||||||||||||
|
|
|
|
|
| |||||||||||||||
| $12,517,403 | $12,804,773 | $287,370 | ||||||||||||||||||
|
|
|
|
|
| |||||||||||||||
| The accompanying notes are an integral part of these financial statements. | (Continued) |
| AQR Funds | Annual Report | September 2016 | ||||||||||||||
156
| Schedule of Investments | September 30, 2016 |
| AQR GLOBAL EQUITY FUND |
AUD - Australian Dollar
CAD - Canadian Dollar
CHF - Swiss Franc
DKK - Danish Krone
EUR - Euro
GBP - British Pound
HKD - Hong Kong Dollar
ILS - Israeli Shekel
JPY - Japanese Yen
NOK - Norwegian Krone
NZD - New Zealand Dollar
SEK - Swedish Krona
SGD - Singapore Dollar
Collateral pledged to, or (received from), each counterparty at September 30, 2016 was as follows:
| COUNTERPARTY | OVER THE COUNTER | EXCHANGE TRADED | TOTAL | |||||||||
| BARC | ||||||||||||
| Cash | $— | $2,923,811 | $2,923,811 | |||||||||
| ||||||||||||
| CITG | ||||||||||||
| Cash | (141,371 | ) | — | (141,371 | ) | |||||||
| ||||||||||||
| JPMC | ||||||||||||
| Cash | 1,160,000 | — | 1,160,000 | |||||||||
| ||||||||||||
| The accompanying notes are an integral part of these financial statements. |
| AQR Funds | Annual Report | September 2016 | ||||||||||||||
157
| Schedule of Investments | September 30, 2016 |
| AQR INTERNATIONAL EQUITY FUND |
| INVESTMENTS | SHARES | VALUE | ||||||
| COMMON STOCKS - 88.9% | ||||||||
| Australia - 6.1% | ||||||||
| AGL Energy Ltd. | 18,353 | $ | 268,694 | |||||
| Aristocrat Leisure Ltd. | 43,184 | 525,417 | ||||||
| ASX Ltd. | 5,022 | 186,057 | ||||||
| Australia & New Zealand Banking Group Ltd. | 158,765 | 3,381,941 | ||||||
| Bank of Queensland Ltd. | 27,629 | 241,987 | ||||||
| Bendigo & Adelaide Bank Ltd. | 76,686 | 636,019 | ||||||
| BGP Holdings plc (3)*(a) | 143,427 | 11,604 | ||||||
| BHP Billiton Ltd. | 92,900 | 1,609,260 | ||||||
| BHP Billiton plc | 30,099 | 452,646 | ||||||
| Boral Ltd. | �� | 34,793 | 180,992 | |||||
| Caltex Australia Ltd. | 64,522 | 1,705,882 | ||||||
| CIMIC Group Ltd. | 115,761 | 2,563,816 | ||||||
| Cochlear Ltd. | 2,400 | 260,143 | ||||||
| Computershare Ltd. | 7,538 | 59,788 | ||||||
| CSL Ltd. | 5,597 | 460,245 | ||||||
| Dexus Property Group, REIT | 23,093 | 162,311 | ||||||
| Flight Centre Travel Group Ltd. | 6,815 | 190,783 | ||||||
| Fortescue Metals Group Ltd. | 416,919 | 1,595,789 | ||||||
| Goodman Group, REIT | 54,028 | 302,810 | ||||||
| GPT Group (The), REIT | 55,477 | 216,030 | ||||||
| Harvey Norman Holdings Ltd. | 123,166 | 493,025 | ||||||
| Incitec Pivot Ltd. | 96,922 | 210,652 | ||||||
| LendLease Group | 24,576 | 266,317 | ||||||
| Macquarie Group Ltd. | 14,286 | 903,510 | ||||||
| Medibank Pvt Ltd. | 58,666 | 111,758 | ||||||
| Mirvac Group, REIT | 104,753 | 180,594 | ||||||
| National Australia Bank Ltd. | 87,310 | 1,876,814 | ||||||
| Newcrest Mining Ltd. | 123,993 | 2,093,020 | ||||||
| Origin Energy Ltd. | 67,909 | 286,393 | ||||||
| QBE Insurance Group Ltd. | 112,674 | 806,240 | ||||||
| Scentre Group, REIT | 147,628 | 532,965 | ||||||
| South32 Ltd. | 174,261 | 324,686 | ||||||
| Stockland, REIT | 62,453 | 228,729 | ||||||
| Suncorp Group Ltd. | 23,033 | 214,884 | ||||||
| Telstra Corp. Ltd. | 133,126 | 530,789 | ||||||
| Treasury Wine Estates Ltd. | 22,567 | 191,519 | ||||||
| Vicinity Centres, REIT | 94,695 | 230,939 | ||||||
| Westfield Corp., REIT | 57,863 | 432,965 | ||||||
| Westpac Banking Corp. | 37,549 | 854,321 | ||||||
|
| |||||||
| 25,782,334 | ||||||||
|
| |||||||
| Belgium - 1.4% | ||||||||
| Ageas | 74,609 | 2,727,959 | ||||||
| Anheuser-Busch InBev SA/NV | 880 | 115,727 | ||||||
| Groupe Bruxelles Lambert SA | 1,290 | 114,504 | ||||||
| KBC Group NV | 3,081 | 179,856 | ||||||
| Proximus SADP | 83,380 | 2,494,395 | ||||||
| UCB SA | 2,262 | 175,092 | ||||||
| Umicore SA | 3,015 | 189,309 | ||||||
|
| |||||||
| 5,996,842 | ||||||||
|
| |||||||
| China - 0.2% | ||||||||
| Yangzijiang Shipbuilding Holdings Ltd. | 1,451,800 | 803,117 | ||||||
|
| |||||||
| Denmark - 2.0% | ||||||||
| Carlsberg A/S, Class B | 6,417 | 613,298 | ||||||
| ISS A/S | 31,359 | 1,303,115 | ||||||
| Novo Nordisk A/S, Class B | 43,197 | 1,800,396 | ||||||
| INVESTMENTS | SHARES | VALUE | ||||||
| Denmark - 2.0% (continued) | ||||||||
| TDC A/S * | 264,413 | $ | 1,557,228 | |||||
| Vestas Wind Systems A/S | 34,309 | 2,834,046 | ||||||
| William Demant Holding A/S * | 12,297 | 250,950 | ||||||
|
| |||||||
| 8,359,033 | ||||||||
|
| |||||||
| Finland - 1.3% | ||||||||
| Elisa OYJ | 3,157 | 116,346 | ||||||
| Fortum OYJ | 12,970 | 209,594 | ||||||
| Neste OYJ | 33,713 | 1,438,061 | ||||||
| Nokia OYJ | 154,752 | 896,998 | ||||||
| Nokian Renkaat OYJ | 10,543 | 384,398 | ||||||
| Orion OYJ, Class B | 39,138 | 1,542,964 | ||||||
| Stora Enso OYJ, Class R | 23,251 | 206,544 | ||||||
| UPM-Kymmene OYJ | 39,145 | 826,530 | ||||||
|
| |||||||
| 5,621,435 | ||||||||
|
| |||||||
| France - 8.7% | ||||||||
| Arkema SA | 4,133 | 382,643 | ||||||
| Atos SE | 35,426 | 3,813,916 | ||||||
| BNP Paribas SA | 84,326 | 4,337,189 | ||||||
| Capgemini SA | 29,465 | 2,888,851 | ||||||
| Cie de Saint-Gobain | 28,497 | 1,233,066 | ||||||
| Cie Generale des Etablissements Michelin | 12,053 | 1,334,690 | ||||||
| CNP Assurances | 32,432 | 544,887 | ||||||
| Eiffage SA | 2,512 | 195,219 | ||||||
| Engie SA | 31,077 | 481,840 | ||||||
| Klepierre, REIT | 3,302 | 151,571 | ||||||
| Lagardere SCA | 45,014 | 1,146,340 | ||||||
| Orange SA | 222,892 | 3,492,172 | ||||||
| Peugeot SA * | 82,125 | 1,254,113 | ||||||
| Renault SA | 8,474 | 697,149 | ||||||
| Rexel SA | 7,411 | 113,524 | ||||||
| Sanofi | 45,240 | 3,445,069 | ||||||
| Schneider Electric SE | 1,683 | 117,076 | ||||||
| SCOR SE | 21,021 | 653,711 | ||||||
| Societe BIC SA | 2,784 | 411,613 | ||||||
| Societe Generale SA | 75,354 | 2,606,816 | ||||||
| Sodexo SA | 4,996 | 595,123 | ||||||
| Thales SA | 29,895 | 2,752,759 | ||||||
| TOTAL SA | 20,255 | 963,340 | ||||||
| Unibail-Rodamco SE, REIT | 3,742 | 1,008,966 | ||||||
| Valeo SA | 2,029 | 118,430 | ||||||
| Veolia Environnement SA | 43,142 | 994,061 | ||||||
| Vinci SA | 14,855 | 1,137,572 | ||||||
|
| |||||||
| 36,871,706 | ||||||||
|
| |||||||
| Germany - 8.2% | ||||||||
| Allianz SE | 15,415 | 2,290,827 | ||||||
| BASF SE | 13,245 | 1,134,107 | ||||||
| Bayer AG | 46,286 | 4,648,516 | ||||||
| Brenntag AG | 2,097 | 114,599 | ||||||
| Covestro AG (b) | 5,068 | 299,915 | ||||||
| Deutsche Lufthansa AG | 31,543 | 351,653 | ||||||
| Deutsche Post AG | 10,871 | 340,355 | ||||||
| Deutsche Telekom AG | 71,509 | 1,201,388 | ||||||
| Deutsche Wohnen AG | 9,934 | 361,479 | ||||||
| E.ON SE | 261,388 | 1,857,814 | ||||||
| Evonik Industries AG | 66,548 | 2,252,939 | ||||||
| Fresenius Medical Care AG & Co. KGaA | 2,200 | 192,469 | ||||||
| The accompanying notes are an integral part of these financial statements. | (Continued) |
| AQR Funds | Annual Report | September 2016 | ||||||||||||||
158
| Schedule of Investments | September 30, 2016 |
| AQR INTERNATIONAL EQUITY FUND |
| INVESTMENTS | SHARES | VALUE | ||||||
| Germany - 8.2% (continued) | ||||||||
| Fresenius SE & Co. KGaA | 10,315 | $ | 823,978 | |||||
| Hannover Rueck SE | 20,327 | 2,178,960 | ||||||
| HeidelbergCement AG | 6,656 | 629,470 | ||||||
| Infineon Technologies AG | 30,967 | 552,189 | ||||||
| METRO AG | 35,497 | 1,056,596 | ||||||
| Muenchener Rueckversicherungs-Gesellschaft AG in Muenchen | 13,406 | 2,503,785 | ||||||
| OSRAM Licht AG | 89,702 | 5,269,671 | ||||||
| SAP SE | 8,678 | 793,624 | ||||||
| Siemens AG | 42,381 | 4,969,610 | ||||||
| Uniper SE * | 41,063 | 503,027 | ||||||
| Vonovia SE | 7,064 | 267,790 | ||||||
|
| |||||||
| 34,594,761 | ||||||||
|
| |||||||
| Hong Kong - 3.3% | ||||||||
| ASM Pacific Technology Ltd. | 6,904 | 57,147 | ||||||
| Cheung Kong Infrastructure Holdings Ltd. | 17,827 | 153,757 | ||||||
| Cheung Kong Property Holdings Ltd. | 96,962 | 713,239 | ||||||
| CLP Holdings Ltd. | 53,000 | 548,924 | ||||||
| Hong Kong Exchanges and Clearing Ltd. | 32,254 | 853,613 | ||||||
| Kerry Properties Ltd. | 298,500 | 980,653 | ||||||
| Li & Fung Ltd. | 1,174,000 | 604,926 | ||||||
| Link REIT | 67,882 | 501,111 | ||||||
| New World Development Co. Ltd. | 1,598,896 | 2,096,621 | ||||||
| NWS Holdings Ltd. | 42,000 | 70,384 | ||||||
| PCCW Ltd. | 64,000 | 39,419 | ||||||
| Sino Land Co. Ltd. | 610,000 | 1,087,220 | ||||||
| Sun Hung Kai Properties Ltd. | 71,000 | 1,079,396 | ||||||
| Techtronic Industries Co. Ltd. | 125,500 | 491,621 | ||||||
| WH Group Ltd. (b) | 1,485,000 | 1,200,241 | ||||||
| Wharf Holdings Ltd. (The) | 119,000 | 873,052 | ||||||
| Wheelock & Co. Ltd. | 133,000 | 789,989 | ||||||
| Yue Yuen Industrial Holdings Ltd. | 383,609 | 1,585,397 | ||||||
|
| |||||||
| 13,726,710 | ||||||||
|
| |||||||
| Italy - 1.9% | ||||||||
| Enel SpA | 810,315 | 3,611,349 | ||||||
| Ferrari NV | 7,428 | 386,000 | ||||||
| Mediobanca SpA | 88,142 | 573,661 | ||||||
| Prysmian SpA | 80,234 | 2,100,967 | ||||||
| Snam SpA | 209,413 | 1,161,167 | ||||||
|
| |||||||
| 7,833,144 | ||||||||
|
| |||||||
| Japan - 20.8% | ||||||||
| Ajinomoto Co., Inc. | 53,000 | 1,181,711 | ||||||
| Alfresa Holdings Corp. | 36,900 | 781,334 | ||||||
| Amada Holdings Co. Ltd. | 139,400 | 1,450,081 | ||||||
| Astellas Pharma, Inc. | 253,900 | 3,965,679 | ||||||
| Bandai Namco Holdings, Inc. | 68,600 | 2,099,715 | ||||||
| Chubu Electric Power Co., Inc. | 13,500 | 196,431 | ||||||
| Daiichi Sankyo Co. Ltd. | 81,300 | 1,953,510 | ||||||
| Daikin Industries Ltd. | 6,100 | 569,227 | ||||||
| Daito Trust Construction Co. Ltd. | 2,487 | 397,770 | ||||||
| Daiwa House Industry Co. Ltd. | 8,395 | 230,398 | ||||||
| Dentsu, Inc. | 3,300 | 167,962 | ||||||
| Fuji Heavy Industries Ltd. | 87,621 | 3,287,496 | ||||||
| FUJIFILM Holdings Corp. | 22,043 | 816,537 | ||||||
| Fujitsu Ltd. | 109,000 | 586,597 | ||||||
| Fukuoka Financial Group, Inc. | 32,000 | 133,003 | ||||||
| INVESTMENTS | SHARES | VALUE | ||||||
| Japan - 20.8% (continued) | ||||||||
| GungHo Online Entertainment, Inc. | 53,400 | $ | 131,214 | |||||
| Hitachi Chemical Co. Ltd. | 73,200 | 1,681,910 | ||||||
| Hitachi Construction Machinery Co. Ltd. | 14,700 | 293,134 | ||||||
| Hitachi High-Technologies Corp. | 38,200 | 1,529,185 | ||||||
| Hoya Corp. | 26,200 | 1,053,969 | ||||||
| Hulic Co. Ltd. | 8,000 | 81,738 | ||||||
| Idemitsu Kosan Co. Ltd. | 6,700 | 138,718 | ||||||
| Japan Real Estate Investment Corp., REIT | 41 | 245,177 | ||||||
| Japan Retail Fund Investment Corp., REIT | 73 | 180,045 | ||||||
| Japan Tobacco, Inc. | 39,500 | 1,616,942 | ||||||
| JTEKT Corp. | 79,070 | 1,187,631 | ||||||
| Kajima Corp. | 114,000 | 797,758 | ||||||
| Kaneka Corp. | 100,000 | 791,743 | ||||||
| Kao Corp. | 10,900 | 616,265 | ||||||
| Konami Holdings Corp. | 66,900 | 2,585,038 | ||||||
| Konica Minolta, Inc. | 21,300 | 180,375 | ||||||
| Kyocera Corp. | 16,100 | 773,658 | ||||||
| Kyowa Hakko Kirin Co. Ltd. | 28,700 | 453,324 | ||||||
| Mazda Motor Corp. | 109,800 | 1,684,526 | ||||||
| Medipal Holdings Corp. | 29,400 | 509,624 | ||||||
| MEIJI Holdings Co. Ltd. | 23,500 | 2,333,329 | ||||||
| Mitsubishi Chemical Holdings Corp. | 133,700 | 838,219 | ||||||
| Mitsubishi Electric Corp. | 117,000 | 1,499,555 | ||||||
| Mitsubishi Estate Co. Ltd. | 38,020 | 713,505 | ||||||
| Mitsubishi Gas Chemical Co., Inc. | 49,000 | 701,536 | ||||||
| Mitsubishi Motors Corp. | 234,400 | 1,094,947 | ||||||
| Mitsubishi Tanabe Pharma Corp. | 41,200 | 882,439 | ||||||
| Mitsubishi UFJ Financial Group, Inc. | 330,891 | 1,676,322 | ||||||
| Mitsui Chemicals, Inc. | 725,000 | 3,448,645 | ||||||
| Mitsui Fudosan Co. Ltd. | 29,205 | 621,319 | ||||||
| Mixi, Inc. | 52,800 | 1,912,990 | ||||||
| Mizuho Financial Group, Inc. | 689,900 | 1,162,784 | ||||||
| MS&AD Insurance Group Holdings, Inc. | 76,500 | 2,132,148 | ||||||
| Nexon Co. Ltd. | 117,700 | 1,848,901 | ||||||
| NHK Spring Co. Ltd. | 40,100 | 388,738 | ||||||
| Nikon Corp. | 19,300 | 288,231 | ||||||
| Nippon Building Fund, Inc., REIT | 41 | 259,770 | ||||||
| Nippon Express Co. Ltd. | 210,000 | 981,746 | ||||||
| Nippon Telegraph & Telephone Corp. | 58,838 | 2,691,014 | ||||||
| Nissan Motor Co. Ltd. | 19,400 | 190,292 | ||||||
| Nisshin Seifun Group, Inc. | 19,400 | 295,706 | ||||||
| Nitto Denko Corp. | 10,200 | 662,447 | ||||||
| Nomura Real Estate Holdings, Inc. | 3,900 | 65,923 | ||||||
| NSK Ltd. | 19,300 | 197,878 | ||||||
| NTT Data Corp. | 9,200 | 459,488 | ||||||
| NTT DOCOMO, Inc. | 39,500 | 1,003,419 | ||||||
| Obayashi Corp. | 102,300 | 1,014,691 | ||||||
| Panasonic Corp. | 104,000 | 1,040,162 | ||||||
| Resona Holdings, Inc. | 330,400 | 1,389,531 | ||||||
| Seiko Epson Corp. | 76,100 | 1,465,336 | ||||||
| Sekisui House Ltd. | 15,600 | 265,772 | ||||||
| Shimamura Co. Ltd. | 8,600 | 1,046,976 | ||||||
| Shin-Etsu Chemical Co. Ltd. | 5,500 | 383,751 | ||||||
| Shionogi & Co. Ltd. | 45,000 | 2,305,509 | ||||||
| SoftBank Group Corp. | 23,500 | 1,523,002 | ||||||
| Sompo Japan Nipponkoa Holdings, Inc. | 6,500 | 192,643 | ||||||
| Sony Corp. | 17,300 | 573,159 | ||||||
| Sumitomo Chemical Co. Ltd. | 350,000 | 1,555,194 | ||||||
| The accompanying notes are an integral part of these financial statements. | (Continued) |
| AQR Funds | Annual Report | September 2016 | ||||||||||||||
159
| Schedule of Investments | September 30, 2016 |
| AQR INTERNATIONAL EQUITY FUND |
| INVESTMENTS | SHARES | VALUE | ||||||
| Japan - 20.8% (continued) | ||||||||
| Sumitomo Dainippon Pharma Co. Ltd. | 7,300 | $ | 141,392 | |||||
| Sumitomo Electric Industries Ltd. | 18,200 | 257,288 | ||||||
| Sumitomo Heavy Industries Ltd. | 88,000 | 434,806 | ||||||
| Sumitomo Mitsui Financial Group, Inc. | 68,236 | 2,304,986 | ||||||
| Sumitomo Mitsui Trust Holdings, Inc. | 16,500 | 539,082 | ||||||
| Sumitomo Realty & Development Co. Ltd. | 12,261 | 317,815 | ||||||
| Suzuken Co. Ltd. | 18,140 | 598,992 | ||||||
| Taisei Corp. | 99,000 | 742,724 | ||||||
| TDK Corp. | 12,600 | 844,189 | ||||||
| Teijin Ltd. | 52,600 | 1,020,443 | ||||||
| Terumo Corp. | 11,200 | 430,815 | ||||||
| Tokyo Electric Power Co. Holdings, Inc. * | 43,300 | 187,572 | ||||||
| Tokyo Electron Ltd. | 4,500 | 397,728 | ||||||
| Tokyu Fudosan Holdings Corp. | 12,883 | 70,059 | ||||||
| Toppan Printing Co. Ltd. | 20,000 | 180,539 | ||||||
| Toyo Suisan Kaisha Ltd. | 4,400 | 186,662 | ||||||
| Toyota Motor Corp. | 39,078 | 2,266,776 | ||||||
| Yamaha Corp. | 17,500 | 566,499 | ||||||
| Yamazaki Baking Co. Ltd. | 25,400 | 624,561 | ||||||
| Yokogawa Electric Corp. | 14,900 | 198,495 | ||||||
| Yokohama Rubber Co. Ltd. (The) | 7,500 | 120,055 | ||||||
|
| |||||||
| 87,887,920 | ||||||||
|
| |||||||
| Netherlands - 4.3% | ||||||||
| ASML Holding NV | 9,553 | 1,046,922 | ||||||
| Heineken NV | 5,115 | 449,615 | ||||||
| ING Groep NV | 120,945 | 1,493,141 | ||||||
| Koninklijke Ahold NV * | 114,943 | 2,617,938 | ||||||
| Koninklijke DSM NV | 5,876 | 396,838 | ||||||
| Koninklijke Philips NV | 9,634 | 285,066 | ||||||
| Koninklijke Vopak NV | 2,819 | 147,848 | ||||||
| NN Group NV | 107,587 | 3,302,967 | ||||||
| Randstad Holding NV | 24,644 | 1,120,624 | ||||||
| Royal Dutch Shell plc, Class A | 60,241 | 1,498,670 | ||||||
| Royal Dutch Shell plc, Class B | 113,163 | 2,933,830 | ||||||
| Wolters Kluwer NV | 65,585 | 2,803,838 | ||||||
|
| |||||||
| 18,097,297 | ||||||||
|
| |||||||
| Singapore - 0.5% | ||||||||
| Ascendas REIT | 102,137 | 189,105 | ||||||
| CapitaLand Commercial Trust Ltd., REIT | 121,300 | 141,866 | ||||||
| CapitaLand Mall Trust, REIT | 71,294 | 113,584 | ||||||
| ComfortDelGro Corp. Ltd. | 54,100 | 111,905 | ||||||
| Genting Singapore plc | 531,800 | 293,882 | ||||||
| Global Logistic Properties Ltd. | 132,300 | 182,488 | ||||||
| Sembcorp Industries Ltd. | 29,317 | 56,105 | ||||||
| Singapore Airlines Ltd. | 49,100 | 379,331 | ||||||
| Singapore Exchange Ltd. | 25,572 | 139,482 | ||||||
| Singapore Technologies Engineering Ltd. | 45,565 | 108,382 | ||||||
| Singapore Telecommunications Ltd. | 48,400 | 141,565 | ||||||
| StarHub Ltd. | 62,900 | 158,826 | ||||||
| Wilmar International Ltd. | 89,400 | 212,252 | ||||||
|
| |||||||
| 2,228,773 | ||||||||
|
| |||||||
| South Africa - 0.7% | ||||||||
| Investec plc | 170,507 | 1,039,370 | ||||||
| Mondi plc | 86,030 | 1,807,490 | ||||||
|
| |||||||
| 2,846,860 | ||||||||
|
| |||||||
| INVESTMENTS | SHARES | VALUE | ||||||
| Spain - 2.9% | ||||||||
| ACS Actividades de Construccion y Servicios SA | 47,887 | $ | 1,447,572 | |||||
| Aena SA (b) | 3,291 | 485,784 | ||||||
| Banco Santander SA | 523,643 | 2,323,061 | ||||||
| Endesa SA | 144,610 | 3,100,399 | ||||||
| Iberdrola SA | 359,880 | 2,446,970 | ||||||
| Red Electrica Corp. SA | 38,727 | 835,595 | ||||||
| Repsol SA | 100,746 | 1,368,558 | ||||||
|
| |||||||
| 12,007,939 | ||||||||
|
| |||||||
| Sweden - 3.0% | ||||||||
| Boliden AB | 136,155 | 3,200,276 | ||||||
| Electrolux AB, Series B | 65,733 | 1,646,401 | ||||||
| Investor AB, Class B | 9,454 | 345,683 | ||||||
| Skanska AB, Class B | 26,824 | 626,682 | ||||||
| Svenska Cellulosa AB SCA, Class B | 95,608 | 2,837,730 | ||||||
| Swedish Match AB | 91,825 | 3,369,221 | ||||||
| Telefonaktiebolaget LM Ericsson, Class B | 83,473 | 602,699 | ||||||
|
| |||||||
| 12,628,692 | ||||||||
|
| |||||||
| Switzerland - 9.2% | ||||||||
| ABB Ltd. * | 160,796 | 3,624,016 | ||||||
| Actelion Ltd. * | 2,873 | 498,563 | ||||||
| Adecco Group AG | 24,002 | 1,352,890 | ||||||
| Aryzta AG * | 2,860 | 127,218 | ||||||
| Coca-Cola HBC AG * | 56,560 | 1,313,977 | ||||||
| Galenica AG | 1,339 | 1,423,923 | ||||||
| Glencore plc * | 773,956 | 2,119,227 | ||||||
| Lonza Group AG * | 21,691 | 4,151,635 | ||||||
| Nestle SA | 107,452 | 8,484,848 | ||||||
| Novartis AG | 33,160 | 2,616,998 | ||||||
| Partners Group Holding AG | 576 | 291,016 | ||||||
| Roche Holding AG | 27,577 | 6,852,846 | ||||||
| SGS SA | 148 | 331,635 | ||||||
| Sika AG | 151 | 735,687 | ||||||
| Swiss Life Holding AG * | 7,278 | 1,887,350 | ||||||
| Swiss Re AG | 20,371 | 1,839,877 | ||||||
| Syngenta AG | 2,535 | 1,110,184 | ||||||
| Wolseley plc | 3,330 | 187,288 | ||||||
|
| |||||||
| 38,949,178 | ||||||||
|
| |||||||
| United Kingdom - 14.0% | ||||||||
| 3i Group plc | 29,271 | 246,796 | ||||||
| Anglo American plc * | 110,788 | 1,381,615 | ||||||
| Auto Trader Group plc (b) | 23,991 | 126,120 | ||||||
| Barclays plc | 649,304 | 1,407,705 | ||||||
| Barratt Developments plc | 123,898 | 793,199 | ||||||
| BP plc | 740,873 | 4,318,355 | ||||||
| British American Tobacco plc | 36,800 | 2,346,960 | ||||||
| British Land Co. plc (The), REIT | 28,168 | 230,722 | ||||||
| BT Group plc | 312,885 | 1,574,225 | ||||||
| Compass Group plc | 6,198 | 120,035 | ||||||
| Diageo plc | 19,536 | 559,581 | ||||||
| Direct Line Insurance Group plc | 121,264 | 572,819 | ||||||
| Dixons Carphone plc | 93,475 | 446,480 | ||||||
| Fiat Chrysler Automobiles NV | 200,768 | 1,276,122 | ||||||
| GlaxoSmithKline plc | 207,071 | 4,410,311 | ||||||
| Hammerson plc, REIT | 24,134 | 183,678 | ||||||
| HSBC Holdings plc | 469,975 | 3,532,693 | ||||||
| ICAP plc | 99,363 | 598,395 | ||||||
| The accompanying notes are an integral part of these financial statements. | (Continued) |
| AQR Funds | Annual Report | September 2016 | ||||||||||||||
160
| Schedule of Investments | September 30, 2016 |
| AQR INTERNATIONAL EQUITY FUND |
| INVESTMENTS | SHARES | VALUE | ||||||
| United Kingdom - 14.0% (continued) | ||||||||
| Imperial Brands plc | 90,751 | $ | 4,671,012 | |||||
| InterContinental Hotels Group plc | 4,415 | 181,965 | ||||||
| International Consolidated Airlines Group SA | 271,947 | 1,411,013 | ||||||
| Johnson Matthey plc | 26,947 | 1,149,405 | ||||||
| Kingfisher plc | 301,557 | 1,471,316 | ||||||
| Land Securities Group plc, REIT | 22,984 | 314,967 | ||||||
| Lloyds Banking Group plc | 1,066,326 | 753,376 | ||||||
| London Stock Exchange Group plc | 8,751 | 317,114 | ||||||
| Marks & Spencer Group plc | 44,806 | 192,223 | ||||||
| Pearson plc | 13,508 | 132,050 | ||||||
| Persimmon plc | 180,880 | 4,252,956 | ||||||
| Randgold Resources Ltd. | 1,836 | 184,011 | ||||||
| Reckitt Benckiser Group plc | 20,964 | 1,973,654 | ||||||
| RELX plc | 31,122 | 590,182 | ||||||
| Rio Tinto Ltd. | 12,593 | 500,956 | ||||||
| Rio Tinto plc | 37,820 | 1,256,994 | ||||||
| Royal Mail plc | 347,258 | 2,203,569 | ||||||
| SABMiller plc | 26,610 | 1,550,019 | ||||||
| Sage Group plc (The) | 257,100 | 2,456,500 | ||||||
| Sky plc | 160,840 | 1,864,154 | ||||||
| Tate & Lyle plc | 77,839 | 755,564 | ||||||
| Taylor Wimpey plc | 681,013 | 1,358,334 | ||||||
| Unilever plc | 37,592 | 1,778,857 | ||||||
| William Hill plc | 410,249 | 1,618,433 | ||||||
| Wm Morrison Supermarkets plc | 103,970 | 293,575 | ||||||
| WPP plc | 82,356 | 1,935,830 | ||||||
|
| |||||||
| 59,293,840 | ||||||||
|
| |||||||
| United States - 0.4% | ||||||||
| Shire plc | 25,194 | 1,629,124 | ||||||
|
| |||||||
TOTAL COMMON STOCKS | 375,158,705 | |||||||
|
| |||||||
| PREFERRED STOCKS - 0.4% | ||||||||
| Germany - 0.4% | ||||||||
| Henkel AG & Co. KGaA | 9,447 | 1,285,747 | ||||||
| Porsche Automobil Holding SE | 4,664 | 238,577 | ||||||
|
| |||||||
TOTAL PREFERRED STOCKS |
| 1,524,324 | ||||||
|
| |||||||
| SHORT-TERM INVESTMENTS - 6.1% | ||||||||
| INVESTMENT COMPANIES - 6.1% | ||||||||
| J.P. Morgan U.S. Treasury Plus Money Market Fund - IM Shares, 0.22% (c)(d) | 21,596,751 | 21,596,751 | ||||||
| J.P. Morgan U.S. Treasury Plus Money Market Fund - Institutional Shares, 0.20% (c)(d) | 4,341,101 | 4,341,101 | ||||||
|
| |||||||
TOTAL SHORT-TERM INVESTMENTS | 25,937,852 | |||||||
|
| |||||||
TOTAL INVESTMENTS IN SECURITIES | 402,620,881 | |||||||
|
| |||||||
| OTHER ASSETS IN EXCESS OF LIABILITIES - 4.6% (e) | 19,593,187 | |||||||
|
| |||||||
NET ASSETS - 100.0% |
| 422,214,068 | ||||||
|
| |||||||
| SECTOR | VALUE | % OF NET ASSETS | ||||||
| Consumer Discretionary | $ | 42,967,960 | 10.2 | % | ||||
| Consumer Staples | 44,660,324 | 10.6 | ||||||
| Energy | 14,799,656 | 3.5 | ||||||
| Financials | 58,412,248 | 13.9 | ||||||
| Health Care | 48,259,810 | 11.4 | ||||||
| Industrials | 53,157,811 | 12.7 | ||||||
| Information Technology | 27,024,485 | 6.4 | ||||||
| Materials | 37,315,076 | 8.8 | ||||||
| Real Estate | 17,004,679 | 4.0 | ||||||
| Telecommunication Services | 16,523,787 | 3.9 | ||||||
| Utilities | 16,557,193 | 3.9 | ||||||
| Short-Term Investment | 25,937,852 | 6.1 | ||||||
|
|
|
| |||||
Total Investments In Securities At Value | 402,620,881 | 95.4 | ||||||
| Other Assets in Excess of Liabilities (e) | 19,593,187 | 4.6 | ||||||
|
|
|
| |||||
Net Assets | $ | 422,214,068 | 100.0 | % | ||||
|
|
|
| |||||
| * | Non-income producing security. |
| (a) | Security fair valued as of 9/30/2016 in accordance with procedures approved by the Board of Trustees. Total value of all such securities at 9/30/2016 amounted to $11,604, which represents approximately 0.00% of net assets of the fund. |
| (b) | Securities exempt from registration under Rule 144A or section 4(2), of the Securities Act of 1933. Under procedures approved by the Board of Trustees, such securities have been determined to be liquid by the investment adviser and may be resold, normally to qualified institutional buyers in transactions exempt from registration. Total value of all such securities at 9/30/2016 amounted to $2,112,060, which represents approximately 0.50% of net assets of the fund. |
| (c) | Represents 7-day effective yield as of 9/30/2016. |
| (d) | All or a portion of the security pledged as collateral for forward foreign currency exchange and swap contracts. |
| (e) | Includes appreciation/(depreciation) on forward foreign currency exchange, futures and swap contracts. |
All securities are Level 2 with respect to ASC 820, unless otherwise noted in parentheses.
| (3) | Level 3 security (See Note 4). |
Abbreviations
OYJ - Public Traded Company
REIT - Real Estate Investment Trust
SCA - Limited partnership with share capital
| The accompanying notes are an integral part of these financial statements. | (Continued) |
| AQR Funds | Annual Report | September 2016 | ||||||||||||||
161
| Schedule of Investments | September 30, 2016 |
| AQR INTERNATIONAL EQUITY FUND |
Total return swap contracts outstanding as of September 30, 2016:
Over the Counter
| COUNTERPARTY | UNDERLYING REFERENCE INSTRUMENT | TERMINATION DATE | CURRENCY | NOTIONAL VALUE | UNREALIZED APPRECIATION (DEPRECIATION) | |||||||||||
| GSIN | Hang Seng Index October Futures | 10/2016 | HKD | 19,934,580 | $(15,276 | ) | ||||||||||
| GSIN | Swiss Market Index December Futures | 12/2016 | CHF | (20,224,022 | ) | 187,702 | ||||||||||
|
| |||||||||||||||
| $172,426 | ||||||||||||||||
|
| |||||||||||||||
Open futures contracts outstanding at September 30, 2016:
Exchange Traded
| NUMBER OF CONTRACTS | COUNTERPARTY | DESCRIPTION | EXPIRATION DATE | VALUE AT TRADE DATE | VALUE AT SEPTEMBER 30, 2016 | UNREALIZED APPRECIATION (DEPRECIATION) | ||||||||||||||
| Long Contracts: | ||||||||||||||||||||
| 210 | BARC | CAC40 Index Futures | 10/2016 | $10,353,255 | $10,482,372 | $129,117 | ||||||||||||||
| 129 | BARC | DAX Index Futures | 12/2016 | 37,710,620 | 38,084,724 | 374,104 | ||||||||||||||
| 19 | BARC | Hang Seng Index Futures | 10/2016 | 2,875,487 | 2,855,365 | (20,122 | ) | |||||||||||||
| 107 | BARC | IBEX 35 Index Futures | 10/2016 | 10,464,592 | 10,532,509 | 67,917 | ||||||||||||||
| 100 | BARC | MSCI Singapore Index Futures | 10/2016 | 2,290,757 | 2,310,992 | 20,235 | ||||||||||||||
| 322 | BARC | TOPIX Index Futures | 12/2016 | 42,312,416 | 42,010,355 | (302,061 | ) | |||||||||||||
|
|
|
|
|
| |||||||||||||||
| 106,007,127 | 106,276,317 | 269,190 | ||||||||||||||||||
|
|
|
|
|
| |||||||||||||||
| Short Contracts: | ||||||||||||||||||||
| 119 | BARC | Amsterdam Index Futures | 10/2016 | $(11,870,969 | ) | $(12,087,223 | ) | $(216,254 | ) | |||||||||||
| 33 | BARC | FTSE 100 Index Futures | 12/2016 | (2,912,815 | ) | (2,933,155 | ) | (20,340 | ) | |||||||||||
| 36 | BARC | FTSE/MIB Index Futures | 12/2016 | (3,249,068 | ) | (3,307,435 | ) | (58,367 | ) | |||||||||||
| 683 | BARC | OMXS30 Index Futures | 10/2016 | (11,269,419 | ) | (11,452,598 | ) | (183,179 | ) | |||||||||||
| 222 | BARC | SPI 200 Index Futures | 12/2016 | (22,182,618 | ) | (23,005,502 | ) | (822,884 | ) | |||||||||||
|
|
|
|
|
| |||||||||||||||
| (51,484,889 | ) | (52,785,913 | ) | (1,301,024 | ) | |||||||||||||||
|
|
|
|
|
| |||||||||||||||
| $54,522,238 | $53,490,404 | $(1,031,834 | ) | |||||||||||||||||
|
|
|
|
|
| |||||||||||||||
Forward foreign currency exchange contracts outstanding as of September 30, 2016:
Over the Counter
| PURCHASE CONTRACTS | COUNTERPARTY | CURRENCY | CURRENCY AMOUNT PURCHASED | VALUE AT SETTLEMENT DATE | VALUE AT SEPTEMBER 30, 2016 | UNREALIZED APPRECIATION (DEPRECIATION) | ||||||||||||||
| Australian Dollar, Expiring 12/21/16 | CITG | AUD | 12,145,200 | $9,173,880 | $9,278,592 | $104,712 | ||||||||||||||
| Australian Dollar, Expiring 12/21/16 | JPMC | AUD | 18,217,800 | 13,760,835 | 13,917,888 | 157,053 | ||||||||||||||
| Swiss Franc, Expiring 12/21/16 | CITG | CHF | 240,600 | 248,558 | 248,876 | 318 | ||||||||||||||
| Swiss Franc, Expiring 12/21/16 | JPMC | CHF | 269,400 | 278,329 | 278,667 | 338 | ||||||||||||||
| Danish Krone, Expiring 12/21/16 | CITG | DKK | 946,000 | 143,448 | 143,282 | (166 | ) | |||||||||||||
| Euro, Expiring 12/21/16 | CITG | EUR | 1,144,000 | 1,280,461 | 1,289,889 | 9,428 | ||||||||||||||
| The accompanying notes are an integral part of these financial statements. | (Continued) |
| AQR Funds | Annual Report | September 2016 | ||||||||||||||
162
| Schedule of Investments | September 30, 2016 |
| AQR INTERNATIONAL EQUITY FUND |
| PURCHASE CONTRACTS | COUNTERPARTY | CURRENCY | CURRENCY AMOUNT PURCHASED | VALUE AT SETTLEMENT DATE | VALUE AT SEPTEMBER 30, 2016 | UNREALIZED APPRECIATION (DEPRECIATION) | ||||||||||||||
| Euro, Expiring 12/21/16 | JPMC | EUR | 1,716,000 | $ 1,920,694 | $ 1,934,833 | $ 14,139 | ||||||||||||||
| British Pound, Expiring 12/21/16 | CITG | GBP | 1,953,600 | 2,563,471 | 2,536,402 | (27,069 | ) | |||||||||||||
| British Pound, Expiring 12/21/16 | JPMC | GBP | 2,930,400 | 3,844,818 | 3,804,603 | (40,215 | ) | |||||||||||||
| Hong Kong Dollar, Expiring 12/21/16 | CITG | HKD | 6,256,400 | 807,383 | 807,262 | (121 | ) | |||||||||||||
| Hong Kong Dollar, Expiring 12/21/16 | JPMC | HKD | 9,384,600 | 1,211,072 | 1,210,893 | (179 | ) | |||||||||||||
Israeli Shekel, Expiring 12/21/16 | CITG | ILS | 4,890,000 | 1,305,099 | 1,307,659 | 2,560 | ||||||||||||||
Israeli Shekel, Expiring 12/21/16 | JPMC | ILS | 7,059,000 | 1,884,467 | 1,887,683 | 3,216 | ||||||||||||||
| Japanese Yen, Expiring 12/21/16 | CITG | JPY | 3,390,216,120 | 33,414,601 | 33,552,368 | 137,767 | ||||||||||||||
| Japanese Yen, Expiring 12/21/16 | JPMC | JPY | 4,931,182,680 | 48,585,151 | 48,803,042 | 217,891 | ||||||||||||||
| Norwegian Krone, Expiring 12/21/16 | CITG | NOK | 5,710,800 | 698,956 | 714,490 | 15,534 | ||||||||||||||
| Norwegian Krone, Expiring 12/21/16 | JPMC | NOK | 8,566,200 | 1,048,436 | 1,071,735 | 23,299 | ||||||||||||||
| New Zealand Dollar, Expiring 12/21/16 | CITG | NZD | 26,067,200 | 19,051,440 | 18,922,542 | (128,898 | ) | |||||||||||||
| New Zealand Dollar, Expiring 12/21/16 | JPMC | NZD | 39,100,800 | 28,577,195 | 28,383,813 | (193,382 | ) | |||||||||||||
| Swedish Krona, Expiring 12/21/16 | CITG | SEK | 1,522,400 | 179,316 | 178,187 | (1,129 | ) | |||||||||||||
| Swedish Krona, Expiring 12/21/16 | JPMC | SEK | 2,283,600 | 268,993 | 267,280 | (1,713 | ) | |||||||||||||
| Singapore Dollar, Expiring 12/21/16 | CITG | SGD | 1,495,120 | 1,100,257 | 1,096,716 | (3,541 | ) | |||||||||||||
| Singapore Dollar, Expiring 12/21/16 | JPMC | SGD | 2,043,180 | 1,502,939 | 1,498,735 | (4,204 | ) | |||||||||||||
|
|
|
|
|
| |||||||||||||||
| $172,849,799 | $173,135,437 | $285,638 | ||||||||||||||||||
|
|
|
|
|
| |||||||||||||||
SALES CONTRACTS | COUNTERPARTY | CURRENCY | CURRENCY AMOUNT SOLD | VALUE AT SETTLEMENT DATE | VALUE AT SEPTEMBER 30, 2016 | UNREALIZED APPRECIATION (DEPRECIATION) | ||||||||||||||
| Australian Dollar, Expiring 12/21/16 | CITG | AUD | (9,125,360 | ) | $(6,898,265 | ) | $(6,971,518 | ) | $(73,253 | ) | ||||||||||
| Australian Dollar, Expiring 12/21/16 | JPMC | AUD | (12,312,540 | ) | (9,307,672 | ) | (9,406,435 | ) | (98,763 | ) | ||||||||||
| Swiss Franc, Expiring 12/21/16 | CITG | CHF | (13,630,720 | ) | (14,084,488 | ) | (14,099,605 | ) | (15,117 | ) | ||||||||||
| Swiss Franc, Expiring 12/21/16 | JPMC | CHF | (19,327,080 | ) | (19,975,749 | ) | (19,991,915 | ) | (16,166 | ) | ||||||||||
| Danish Krone, Expiring 12/21/16 | CITG | DKK | (3,802,000 | ) | (576,514 | ) | (575,855 | ) | 659 | |||||||||||
| Danish Krone, Expiring 12/21/16 | JPMC | DKK | (3,582,000 | ) | (545,643 | ) | (542,533 | ) | 3,110 | |||||||||||
Euro, Expiring 12/21/16 | CITG | EUR | (12,459,240 | ) | (14,017,483 | ) | (14,048,104 | ) | (30,621 | ) | ||||||||||
Euro, Expiring 12/21/16 | JPMC | EUR | (14,550,360 | ) | (16,398,855 | ) | (16,405,895 | ) | (7,040 | ) | ||||||||||
| The accompanying notes are an integral part of these financial statements. | (Continued) |
| AQR Funds | Annual Report | September 2016 | ||||||||||||||
163
| Schedule of Investments | September 30, 2016 |
| AQR INTERNATIONAL EQUITY FUND |
SALES CONTRACTS | COUNTERPARTY | CURRENCY | CURRENCY AMOUNT SOLD | VALUE AT SETTLEMENT DATE | VALUE AT SEPTEMBER 30, 2016 | UNREALIZED APPRECIATION (DEPRECIATION) | ||||||||||||||
British Pound, Expiring 12/21/16 | CITG | GBP | (8,088,080 | ) | $ (10,671,676 | ) | $ (10,500,931 | ) | $ 170,745 | |||||||||||
British Pound, Expiring 12/21/16 | JPMC | GBP | (10,021,620 | ) | (13,265,780 | ) | (13,011,289 | ) | 254,491 | |||||||||||
| Hong Kong Dollar, Expiring 12/21/16 | CITG | HKD | (7,714,800 | ) | (995,616 | ) | (995,440 | ) | 176 | |||||||||||
| Hong Kong Dollar, Expiring 12/21/16 | JPMC | HKD | (706,200 | ) | (91,125 | ) | (91,121 | ) | 4 | |||||||||||
Israeli Shekel, Expiring 12/21/16 | CITG | ILS | (237,600 | ) | (62,944 | ) | (63,538 | ) | (594 | ) | ||||||||||
Israeli Shekel, Expiring 12/21/16 | JPMC | ILS | (125,400 | ) | (33,324 | ) | (33,533 | ) | (209 | ) | ||||||||||
Japanese Yen, Expiring 12/21/16 | CITG | JPY | (449,131,600 | ) | (4,388,652 | ) | (4,444,976 | ) | (56,324 | ) | ||||||||||
Japanese Yen, Expiring 12/21/16 | JPMC | JPY | (673,697,400 | ) | (6,582,970 | ) | (6,667,464 | ) | (84,494 | ) | ||||||||||
| New Zealand Dollar, Expiring 12/21/16 | CITG | NZD | (2,539,600 | ) | (1,851,643 | ) | (1,843,531 | ) | 8,112 | |||||||||||
| New Zealand Dollar, Expiring 12/21/16 | JPMC | NZD | (3,809,400 | ) | (2,775,900 | ) | (2,765,296 | ) | 10,604 | |||||||||||
Swedish Krona, Expiring 12/21/16 | CITG | SEK | (44,620,600 | ) | (5,287,633 | ) | (5,222,543 | ) | 65,090 | |||||||||||
Swedish Krona, Expiring 12/21/16 | JPMC | SEK | (58,253,400 | ) | (6,918,815 | ) | (6,818,172 | ) | 100,643 | |||||||||||
| Singapore Dollar, Expiring 12/21/16 | CITG | SGD | (407,400 | ) | (299,624 | ) | (298,841 | ) | 783 | |||||||||||
| Singapore Dollar, Expiring 12/21/16 | JPMC | SGD | (15,600 | ) | (11,488 | ) | (11,443 | ) | 45 | |||||||||||
|
|
|
|
|
| |||||||||||||||
| (135,041,859 | ) | (134,809,978 | ) | 231,881 | ||||||||||||||||
|
|
|
|
|
| |||||||||||||||
| $37,807,940 | $38,325,459 | $517,519 | ||||||||||||||||||
|
|
|
|
|
| |||||||||||||||
AUD - Australian Dollar
CHF - Swiss Franc
DKK - Danish Krone
EUR - Euro
GBP - British Pound
HKD - Hong Kong Dollar
ILS - Israeli Shekel
JPY - Japanese Yen
NOK - Norwegian Krone
NZD - New Zealand Dollar
SEK - Swedish Krona
SGD - Singapore Dollar
| The accompanying notes are an integral part of these financial statements. | (Continued) |
| AQR Funds | Annual Report | September 2016 | ||||||||||||||
164
| Schedule of Investments | September 30, 2016 |
| AQR INTERNATIONAL EQUITY FUND |
Collateral pledged to, or (received from), each counterparty at September 30, 2016 was as follows:
| COUNTERPARTY | OVER THE COUNTER | EXCHANGE TRADED | TOTAL | |||||||||
| BARC | ||||||||||||
| Cash | $— | $10,569,987 | $10,569,987 | |||||||||
| ||||||||||||
| CITG | ||||||||||||
| Cash | (33,752 | ) | — | (33,752 | ) | |||||||
| ||||||||||||
| GSIN | ||||||||||||
| Investment Companies | 4,341,101 | — | 4,341,101 | |||||||||
| ||||||||||||
| JPMC | ||||||||||||
| Cash | 4,360,000 | — | 4,360,000 | |||||||||
| ||||||||||||
| The accompanying notes are an integral part of these financial statements. |
| AQR Funds | Annual Report | September 2016 | ||||||||||||||
165
| Schedule of Investments | September 30, 2016 |
The following abbreviations are used for counterparty descriptions:
BARC - Barclays Capital, Inc.
CITG - Citigroup Global Markets, Inc.
GSCO - Goldman Sachs & Co.
GSIN - Goldman Sachs International
JPMC - J.P. Morgan Chase Bank NA
JPMS - J.P. Morgan Securities LLC
| The accompanying notes are an integral part of these financial statements. |
| AQR Funds | Annual Report | September 2016 | ||||||||||||||
166
[Intentionally Left Blank]
| Statements of Assets and Liabilities | September 30, 2016 |
| AQR LARGE CAP MULTI-STYLE FUND | AQR SMALL CAP MULTI-STYLE FUND | AQR INTERNATIONAL MULTI-STYLE FUND | AQR EMERGING MULTI-STYLE FUND | |||||||||||||
| ASSETS: | ||||||||||||||||
| Investments in securities, at cost | $ | 1,379,240,579 | $ | 723,028,451 | $ | 362,036,487 | $ | 247,151,898 | ||||||||
| Investments in securities, at value* | $ | 1,479,342,475 | $ | 808,249,600 | $ | 374,601,701 | $ | 270,552,219 | ||||||||
| Cash | — | — | — | 414 | ||||||||||||
| Cash denominated in foreign currencies‡ | — | — | 758,961 | 1,736,103 | ||||||||||||
| Deposits with brokers for exchange-traded and centrally cleared derivatives | 2,010,739 | 766,851 | 604,800 | 261,891 | ||||||||||||
| Variation margin on exchange-traded and centrally cleared derivatives | 131,987 | 158,105 | 109,706 | 114,539 | ||||||||||||
| Receivables: | ||||||||||||||||
Securities sold | — | 383,501 | — | 18,646,570 | ||||||||||||
Foreign tax reclaims | — | — | 372,075 | — | ||||||||||||
Dividends | 1,375,331 | 894,188 | 1,113,711 | 409,616 | ||||||||||||
Capital shares sold | 2,894,957 | 317,081 | 855,854 | 266,387 | ||||||||||||
| Prepaid expenses | 125,616 | 116,855 | 49,667 | 43,970 | ||||||||||||
| Total Assets | 1,485,881,105 | 810,886,181 | 378,466,475 | 292,031,709 | ||||||||||||
| LIABILITIES: | ||||||||||||||||
| Due to custodian | — | 383,501 | — | — | ||||||||||||
| Payables: | ||||||||||||||||
Securities purchased | — | — | — | 21,883,056 | ||||||||||||
Collateral received on securities loaned | — | 66,623,428 | — | 4,314,790 | ||||||||||||
Accrued investment advisory fees | 298,230 | 176,151 | 47,138 | 6,772 | ||||||||||||
Accrued distribution fees—Class N | 13,100 | 1,967 | 1,679 | 1,535 | ||||||||||||
Capital shares redeemed | 624,610 | 335,012 | 206,514 | 173,795 | ||||||||||||
Other accrued expenses and liabilities | 293,127 | 164,237 | 137,689 | 147,181 | ||||||||||||
| Total Liabilities | 1,229,067 | 67,684,296 | 393,020 | 26,527,129 | ||||||||||||
| Net Assets | $ | 1,484,652,038 | $ | 743,201,885 | $ | 378,073,455 | $ | 265,504,580 | ||||||||
| NET ASSETS CONSIST OF: | ||||||||||||||||
| Paid-in capital ($0.001 par value common stock, unlimited authorized shares) | $ | 1,456,161,724 | $ | 641,992,103 | $ | 407,031,051 | $ | 283,215,987 | ||||||||
| Undistributed accumulated net investment income (loss) | 14,853,381 | 5,118,103 | 8,595,128 | 3,427,142 | ||||||||||||
| Undistributed accumulated net realized gain (loss) | (86,968,912 | ) | 10,507,129 | (50,194,338 | ) | (44,446,495 | ) | |||||||||
| Net unrealized appreciation (depreciation) | 100,605,845 | 85,584,550 | 12,641,614 | 23,307,946 | ||||||||||||
| Net Assets | $ | 1,484,652,038 | $ | 743,201,885 | $ | 378,073,455 | $ | 265,504,580 | ||||||||
| NET ASSETS: | ||||||||||||||||
| Class I | $ | 627,269,183 | $ | 45,482,478 | $ | 68,287,987 | $ | 73,792,627 | ||||||||
| Class N | 64,718,150 | 9,733,263 | 8,491,192 | 7,600,174 | ||||||||||||
| Class R6 | 792,664,705 | 687,986,144 | 301,294,276 | 184,111,779 | ||||||||||||
| SHARES OUTSTANDING: | ||||||||||||||||
| Class I | 44,811,070 | 3,258,870 | 6,677,387 | 8,243,713 | ||||||||||||
| Class N | 4,643,563 | 700,486 | 832,639 | 850,737 | ||||||||||||
| Class R6 | 56,611,041 | 49,226,271 | 29,492,098 | 20,536,218 | ||||||||||||
| NET ASSET VALUE: | ||||||||||||||||
| Class I | $ | 14.00 | $ | 13.96 | $ | 10.23 | $ | 8.95 | ||||||||
| Class N | $ | 13.94 | $ | 13.90 | $ | 10.20 | $ | 8.93 | ||||||||
| Class R6 | $ | 14.00 | $ | 13.98 | $ | 10.22 | $ | 8.97 | ||||||||
| * Includes market value of securities out on loan | $ | — | $ | 64,912,322 | $ | — | $ | 4,192,193 | ||||||||
| ‡ Cash denominated in foreign currencies at cost | $ | — | $ | — | $ | 754,705 | $ | 1,734,990 | ||||||||
| The accompanying notes are an integral part of these financial statements. |
| AQR Funds | Annual Report | September 2016 | ||||||||||||||
168
| Statements of Assets and Liabilities | September 30, 2016 |
| AQR TM LARGE CAP MULTI-STYLE FUND | AQR TM SMALL CAP MULTI-STYLE FUND | AQR TM INTERNATIONAL MULTI-STYLE FUND | AQR TM EMERGING MULTI-STYLE FUND | |||||||||||||
| ASSETS: | ||||||||||||||||
| Investments in securities, at cost | $ | 133,085,004 | $ | 18,230,765 | $ | 132,257,083 | $ | 257,381,858 | ||||||||
| Investments in securities, at value* | $ | 139,959,105 | $ | 20,184,892 | $ | 137,131,849 | $ | 289,384,171 | ||||||||
| Cash | — | — | — | 409 | ||||||||||||
| Cash denominated in foreign currencies‡ | — | — | 444,270 | 1,800,985 | ||||||||||||
| Deposits with brokers for exchange-traded and centrally cleared derivatives | — | — | 176,400 | 206,040 | ||||||||||||
| Variation margin on exchange-traded and centrally cleared derivatives | — | — | 31,806 | 38,083 | ||||||||||||
| Receivables: | ||||||||||||||||
Securities sold | — | — | — | 20,194,110 | ||||||||||||
Foreign tax reclaims | — | — | 128,182 | — | ||||||||||||
Dividends | 165,161 | 22,198 | 426,921 | 473,653 | ||||||||||||
Capital shares sold | 177,357 | 52,673 | 137,237 | 132,980 | ||||||||||||
Due from Investment Adviser | — | 21,177 | 9,356 | — | ||||||||||||
| Prepaid expenses | 32,726 | 23,392 | 27,794 | 46,205 | ||||||||||||
| Total Assets | 140,334,349 | 20,304,332 | 138,513,815 | 312,276,636 | ||||||||||||
| LIABILITIES: | ||||||||||||||||
| Payables: | ||||||||||||||||
Securities purchased | — | 101,888 | — | 20,180,845 | ||||||||||||
Collateral received on securities loaned | — | 1,409,090 | — | 4,165,729 | ||||||||||||
Accrued investment advisory fees | 4,541 | — | — | 26,950 | ||||||||||||
Accrued distribution fees—Class N | 440 | 599 | 320 | 439 | ||||||||||||
Capital shares redeemed | 35,121 | — | 87,857 | 62,526 | ||||||||||||
Other accrued expenses and liabilities | 73,282 | 57,757 | 98,606 | 167,190 | ||||||||||||
| Total Liabilities | 113,384 | 1,569,334 | 186,783 | 24,603,679 | ||||||||||||
| Net Assets | $ | 140,220,965 | $ | 18,734,998 | $ | 138,327,032 | $ | 287,672,957 | ||||||||
| NET ASSETS CONSIST OF: | ||||||||||||||||
| Paid-in capital ($0.001 par value common stock, unlimited authorized shares) | $ | 135,418,066 | $ | 16,686,364 | $ | 138,494,973 | $ | 265,079,350 | ||||||||
| Undistributed accumulated net investment income (loss) | 1,317,000 | 129,068 | 2,530,691 | 4,444,706 | ||||||||||||
| Undistributed accumulated net realized gain (loss) | (3,388,202 | ) | (34,561 | ) | (7,603,641 | ) | (13,798,964 | ) | ||||||||
| Net unrealized appreciation (depreciation) | 6,874,101 | 1,954,127 | 4,905,009 | 31,947,865 | ||||||||||||
| Net Assets | $ | 140,220,965 | $ | 18,734,998 | $ | 138,327,032 | $ | 287,672,957 | ||||||||
| NET ASSETS: | ||||||||||||||||
| Class I | $ | 39,963,671 | $ | 13,792,084 | $ | 20,094,128 | $ | 12,710,706 | ||||||||
| Class N | 2,165,397 | 2,969,709 | 1,591,555 | 2,163,369 | ||||||||||||
| Class R6 | 98,091,897 | 1,973,205 | 116,641,349 | 272,798,882 | ||||||||||||
| SHARES OUTSTANDING: | ||||||||||||||||
| Class I | 3,995,600 | 1,338,219 | 2,128,774 | 1,370,519 | ||||||||||||
| Class N | 217,083 | 289,019 | 168,987 | 233,206 | ||||||||||||
| Class R6 | 9,800,397 | 191,117 | 12,337,482 | 29,394,195 | ||||||||||||
| NET ASSET VALUE: | ||||||||||||||||
| Class I | $ | 10.00 | $ | 10.31 | $ | 9.44 | $ | 9.27 | ||||||||
| Class N | $ | 9.97 | $ | 10.28 | $ | 9.42 | $ | 9.28 | ||||||||
| Class R6 | $ | 10.01 | $ | 10.32 | $ | 9.45 | $ | 9.28 | ||||||||
| * Includes market value of securities out on loan | $ | — | $ | 1,372,811 | $ | — | $ | 4,053,488 | ||||||||
| ‡ Cash denominated in foreign currencies at cost | $ | — | $ | — | $ | 441,803 | $ | 1,802,549 | ||||||||
| The accompanying notes are an integral part of these financial statements. |
| AQR Funds | Annual Report | September 2016 | ||||||||||||||
169
| Statements of Assets and Liabilities | September 30, 2016 |
| AQR LARGE CAP MOMENTUM STYLE FUND | AQR SMALL CAP MOMENTUM STYLE FUND | AQR INTERNATIONAL MOMENTUM STYLE FUND | AQR EMERGING MOMENTUM STYLE FUND | |||||||||||||
| ASSETS: | ||||||||||||||||
| Investments in securities, at cost | $ | 787,980,847 | $ | 292,301,882 | $ | 294,861,119 | $ | 9,464,555 | ||||||||
| Investments in securities, at value* | $ | 935,720,483 | $ | 350,025,782 | $ | 328,857,642 | $ | 10,875,816 | ||||||||
| Cash | 820,184 | — | — | — | ||||||||||||
| Cash denominated in foreign currencies‡ | 397 | — | 1,021,372 | 32,295 | ||||||||||||
| Deposits with brokers for exchange-traded and centrally cleared derivatives | 831,616 | 348,370 | 227,002 | — | ||||||||||||
| Variation margin on exchange-traded and centrally cleared derivatives | 55,446 | 71,864 | 40,803 | — | ||||||||||||
| Receivables: | ||||||||||||||||
Securities sold | — | 21,871,825 | 14,663,309 | 2,114,347 | ||||||||||||
Foreign tax reclaims | — | — | 855,282 | — | ||||||||||||
Dividends | 1,193,676 | 281,278 | 715,573 | 9,061 | ||||||||||||
Capital shares sold | 963,304 | 729,379 | 147,005 | 1,672 | ||||||||||||
Due from Investment Adviser | — | — | — | 24,826 | ||||||||||||
| Prepaid expenses | 48,042 | 35,965 | 36,208 | 28,789 | ||||||||||||
| Total Assets | 939,633,148 | 373,364,463 | 346,564,196 | 13,086,806 | ||||||||||||
| LIABILITIES: | ||||||||||||||||
| Due to custodian | — | — | 1,245,676 | — | ||||||||||||
| Payables: | ||||||||||||||||
Securities purchased | 820,540 | 21,216,268 | 6,991,587 | 2,126,341 | ||||||||||||
Collateral received on securities loaned | — | 24,311,255 | — | 53,284 | ||||||||||||
Accrued investment advisory fees | 176,558 | 112,008 | 58,652 | — | ||||||||||||
Accrued distribution fees—Class N | 12,005 | 326 | 6,279 | 225 | ||||||||||||
Capital shares redeemed | 657,874 | 359,223 | 221,630 | — | ||||||||||||
Other accrued expenses and liabilities | 299,693 | 147,326 | 154,561 | 79,527 | ||||||||||||
| Total Liabilities | 1,966,670 | 46,146,406 | 8,678,385 | 2,259,377 | ||||||||||||
| Net Assets | $ | 937,666,478 | $ | 327,218,057 | $ | 337,885,811 | $ | 10,827,429 | ||||||||
| NET ASSETS CONSIST OF: | ||||||||||||||||
| Paid-in capital ($0.001 par value common stock, unlimited authorized shares) | $ | 729,300,251 | $ | 272,376,171 | $ | 336,242,408 | $ | 12,012,473 | ||||||||
| Undistributed accumulated net investment income (loss) | 10,157,798 | 1,749,939 | 6,620,395 | 81,620 | ||||||||||||
| Undistributed accumulated net realized gain (loss) | 50,349,291 | (4,756,341 | ) | (39,007,788 | ) | (2,678,501 | ) | |||||||||
| Net unrealized appreciation (depreciation) | 147,859,138 | 57,848,288 | 34,030,796 | 1,411,837 | ||||||||||||
| Net Assets | $ | 937,666,478 | $ | 327,218,057 | $ | 337,885,811 | $ | 10,827,429 | ||||||||
| NET ASSETS: | ||||||||||||||||
| Class I | $ | 820,914,459 | $ | 317,153,905 | $ | 272,001,465 | $ | 8,783,892 | ||||||||
| Class N | 57,643,678 | 1,574,173 | 30,502,392 | 1,105,269 | ||||||||||||
| Class R6 | 59,108,341 | 8,489,979 | 35,381,954 | 938,268 | ||||||||||||
| SHARES OUTSTANDING: | ||||||||||||||||
| Class I | 40,158,763 | 15,247,228 | 19,627,772 | 1,003,384 | ||||||||||||
| Class N | 2,823,181 | 76,105 | 2,207,600 | 126,465 | ||||||||||||
| Class R6 | 2,895,803 | 408,690 | 2,555,356 | 107,058 | ||||||||||||
| NET ASSET VALUE: | ||||||||||||||||
| Class I | $ | 20.44 | $ | 20.80 | $ | 13.86 | $ | 8.75 | ||||||||
| Class N | $ | 20.42 | $ | 20.68 | $ | 13.82 | $ | 8.74 | ||||||||
| Class R6 | $ | 20.41 | $ | 20.77 | $ | 13.85 | $ | 8.76 | ||||||||
| * Includes market value of securities out on loan | $ | — | $ | 23,686,170 | $ | — | $ | 49,425 | ||||||||
| ‡ Cash denominated in foreign currencies at cost | $ | 429 | $ | — | $ | 1,022,743 | $ | 32,099 | ||||||||
| The accompanying notes are an integral part of these financial statements. |
| AQR Funds | Annual Report | September 2016 | ||||||||||||||
170
| Statements of Assets and Liabilities | September 30, 2016 |
| AQR TM LARGE CAP MOMENTUM STYLE FUND | AQR TM SMALL CAP MOMENTUM STYLE FUND | AQR TM INTERNATIONAL MOMENTUM STYLE FUND | AQR LARGE CAP DEFENSIVE STYLE FUND | |||||||||||||
| ASSETS: | ||||||||||||||||
| Investments in securities, at cost | $ | 126,011,423 | $ | 31,637,268 | $ | 81,224,819 | $ | 791,848,667 | ||||||||
| Investments in securities, at value* | $ | 147,426,290 | $ | 35,684,661 | $ | 87,599,421 | $ | 868,891,553 | ||||||||
| Cash | 230,666 | — | 323,048 | — | ||||||||||||
| Cash denominated in foreign currencies‡ | — | — | 232,708 | — | ||||||||||||
| Deposits with brokers for exchange-traded and centrally cleared derivatives | 121,300 | — | 92,697 | 3,332,126 | ||||||||||||
| Variation margin on exchange-traded and centrally cleared derivatives | 8,388 | — | 17,257 | 218,872 | ||||||||||||
| Receivables: | ||||||||||||||||
Securities sold | — | 1,139,260 | 2,650,424 | — | ||||||||||||
Foreign tax reclaims | — | — | 144,171 | — | ||||||||||||
Dividends | 206,411 | 27,651 | 192,077 | 1,088,144 | ||||||||||||
Capital shares sold | 43,047 | 16,523 | 19,356 | 675,112 | ||||||||||||
Due from Investment Adviser | — | 8,282 | 1,207 | — | ||||||||||||
| Prepaid expenses | 30,004 | 26,098 | 27,471 | 88,786 | ||||||||||||
| Total Assets | 148,066,106 | 36,902,475 | 91,299,837 | 874,294,593 | ||||||||||||
| LIABILITIES: | ||||||||||||||||
| Payables: | ||||||||||||||||
Securities purchased | 230,660 | 1,318,578 | 1,321,544 | — | ||||||||||||
Collateral received on securities loaned | — | 1,927,915 | — | — | ||||||||||||
Accrued investment advisory fees | 10,849 | — | — | 116,749 | ||||||||||||
Accrued distribution fees—Class N | 33 | 31 | 33 | 45,939 | ||||||||||||
Capital shares redeemed | 729 | 48,915 | 104,321 | 551,449 | ||||||||||||
Other accrued expenses and liabilities | 75,918 | 58,332 | 87,649 | 265,695 | ||||||||||||
| Total Liabilities | 318,189 | 3,353,771 | 1,513,547 | 979,832 | ||||||||||||
| Net Assets | $ | 147,747,917 | $ | 33,548,704 | $ | 89,786,290 | $ | 873,314,761 | ||||||||
| NET ASSETS CONSIST OF: | ||||||||||||||||
| Paid-in capital ($0.001 par value common stock, unlimited authorized shares) | $ | 128,251,807 | $ | 30,142,767 | $ | 94,425,096 | $ | 782,986,089 | ||||||||
| Undistributed accumulated net investment income (loss) | 1,603,587 | 165,887 | 1,645,428 | 8,653,953 | ||||||||||||
| Undistributed accumulated net realized gain (loss) | (3,543,524 | ) | (807,343 | ) | (12,688,373 | ) | 4,077,459 | |||||||||
| Net unrealized appreciation (depreciation) | 21,436,047 | 4,047,393 | 6,404,139 | 77,597,260 | ||||||||||||
| Net Assets | $ | 147,747,917 | $ | 33,548,704 | $ | 89,786,290 | $ | 873,314,761 | ||||||||
| NET ASSETS: | ||||||||||||||||
| Class I | $ | 67,396,969 | $ | 33,228,798 | $ | 33,887,486 | $ | 519,983,723 | ||||||||
| Class N | 161,347 | 154,169 | 160,105 | 226,019,660 | ||||||||||||
| Class R6 | 80,189,601 | 165,737 | 55,738,699 | 127,311,378 | ||||||||||||
| SHARES OUTSTANDING: | ||||||||||||||||
| Class I | 3,971,690 | 2,094,916 | 2,762,443 | 33,090,713 | ||||||||||||
| Class N | 9,538 | 9,764 | 13,105 | 14,418,150 | ||||||||||||
| Class R6 | 4,730,865 | 10,452 | 4,552,606 | 8,114,231 | ||||||||||||
| NET ASSET VALUE: | ||||||||||||||||
| Class I | $ | 16.97 | $ | 15.86 | $ | 12.27 | $ | 15.71 | ||||||||
| Class N | $ | 16.92 | $ | 15.79 | $ | 12.22 | $ | 15.68 | ||||||||
| Class R6 | $ | 16.95 | $ | 15.86 | $ | 12.24 | $ | 15.69 | ||||||||
| * Includes market value of securities out on loan | $ | — | $ | 1,879,581 | $ | — | $ | — | ||||||||
| ‡ Cash denominated in foreign currencies at cost | $ | — | $ | — | $ | 230,480 | $ | — | ||||||||
| The accompanying notes are an integral part of these financial statements. |
| AQR Funds | Annual Report | September 2016 | ||||||||||||||
171
| Statements of Assets and Liabilities | September 30, 2016 |
| AQR INTERNATIONAL DEFENSIVE STYLE FUND | AQR EMERGING DEFENSIVE STYLE FUND | AQR GLOBAL EQUITY FUND | AQR INTERNATIONAL EQUITY FUND | |||||||||||||
| ASSETS: | ||||||||||||||||
| Investments in securities, at cost | $ | 126,033,880 | $ | 49,956,572 | $ | 122,128,993 | $ | 389,189,014 | ||||||||
| Investments in securities, at value* | $ | 131,354,654 | $ | 50,791,718 | $ | 136,649,909 | $ | 402,620,881 | ||||||||
| Cash | — | — | 52,017 | 3,386 | ||||||||||||
| Cash denominated in foreign currencies‡ | 506,310 | 177,462 | 302,333 | 1,536,345 | ||||||||||||
| Due from brokers | — | — | 1,174,149 | 4,383,575 | ||||||||||||
| Unrealized appreciation on forward foreign currency exchange contracts | — | — | 525,485 | 1,300,717 | ||||||||||||
| Unrealized appreciation on OTC swaps | — | — | 9,626 | 187,702 | ||||||||||||
| Deposits with brokers for exchange-traded and centrally cleared derivatives | 176,400 | 78,007 | 2,519,867 | 9,845,375 | ||||||||||||
| Variation margin on exchange-traded and centrally cleared derivatives | 32,340 | 11,780 | 23,652 | — | ||||||||||||
| Receivables: | ||||||||||||||||
Securities sold | 371 | — | 5,580,985 | 338,599 | ||||||||||||
Foreign tax reclaims | 91,674 | 4,810 | 425,445 | 1,883,837 | ||||||||||||
Dividends | 380,349 | 66,183 | 214,463 | 1,044,835 | ||||||||||||
Capital shares sold | 174,200 | 45,377 | 540 | 1,629,969 | ||||||||||||
Due from Investment Adviser | 13,743 | 2,443 | — | — | ||||||||||||
| Prepaid expenses | 42,407 | 31,988 | 29,208 | 52,716 | ||||||||||||
| Total Assets | 132,772,448 | 51,209,768 | 147,507,679 | 424,827,937 | ||||||||||||
| LIABILITIES: | ||||||||||||||||
| Due to custodian | 147 | — | — | — | ||||||||||||
| Due to brokers | — | — | 141,949 | 33,752 | ||||||||||||
| Unrealized depreciation on forward foreign currency exchange contracts | — | — | 238,115 | 783,198 | ||||||||||||
| Unrealized depreciation on OTC swaps | — | — | 9,317 | 15,276 | ||||||||||||
| Variation margin on exchange-traded and centrally cleared derivatives | — | — | — | 307,223 | ||||||||||||
| Payables: | ||||||||||||||||
Securities purchased | — | — | 5,657,126 | 338,471 | ||||||||||||
Collateral received on securities loaned | — | 1,090,427 | — | — | ||||||||||||
Accrued investment advisory fees | — | — | 22,073 | 145,621 | ||||||||||||
Accrued shareholder servicing fees | — | — | 25,897 | 101,748 | ||||||||||||
Accrued distribution fees—Class N | 3,971 | 42 | 348 | 7,722 | ||||||||||||
Capital shares redeemed | 13,676 | 21,040 | — | 639,778 | ||||||||||||
Other accrued expenses and liabilities | 107,282 | 89,137 | 114,664 | 241,080 | ||||||||||||
| Total Liabilities | 125,076 | 1,200,646 | 6,209,489 | 2,613,869 | ||||||||||||
| Net Assets | $ | 132,647,372 | $ | 50,009,122 | $ | 141,298,190 | $ | 422,214,068 | ||||||||
| NET ASSETS CONSIST OF: | ||||||||||||||||
| Paid-in capital ($0.001 par value common stock, unlimited authorized shares) | $ | 126,485,075 | $ | 58,930,868 | $ | 116,075,582 | $ | 402,321,288 | ||||||||
| Undistributed accumulated net investment income (loss) | 1,526,390 | 717,058 | 2,528,112 | 10,358,726 | ||||||||||||
| Undistributed accumulated net realized gain (loss) | (696,739 | ) | (10,459,568 | ) | 8,145,637 | (3,540,282 | ) | |||||||||
| Net unrealized appreciation (depreciation) | 5,332,646 | 820,764 | 14,548,859 | 13,074,336 | ||||||||||||
| Net Assets | $ | 132,647,372 | $ | 50,009,122 | $ | 141,298,190 | $ | 422,214,068 | ||||||||
| NET ASSETS: | ||||||||||||||||
| Class I | $ | 96,843,736 | $ | 49,612,071 | $ | 33,013,383 | $ | 370,529,632 | ||||||||
| Class N | 21,135,221 | 206,668 | 1,711,684 | 37,297,237 | ||||||||||||
| Class R6 | 14,668,415 | 190,383 | 106,573,123 | 14,387,199 | ||||||||||||
| SHARES OUTSTANDING: | ||||||||||||||||
| Class I | 8,004,942 | 5,639,656 | 4,067,125 | 36,446,082 | ||||||||||||
| Class N | 1,704,809 | 22,961 | 212,001 | 3,604,797 | ||||||||||||
| Class R6 | 1,213,597 | 21,705 | 13,023,243 | 1,335,884 | ||||||||||||
| NET ASSET VALUE: | ||||||||||||||||
| Class I | $ | 12.10 | $ | 8.80 | $ | 8.12 | $ | 10.17 | ||||||||
| Class N | $ | 12.40 | $ | 9.00 | $ | 8.07 | $ | 10.35 | ||||||||
| Class R6 | $ | 12.09 | $ | 8.77 | $ | 8.18 | $ | 10.77 | ||||||||
| * Includes market value of securities out on loan | $ | — | $ | 1,057,766 | $ | — | $ | — | ||||||||
| ‡ Cash denominated in foreign currencies at cost | $ | 505,429 | $ | 177,431 | $ | 301,001 | $ | 1,538,166 | ||||||||
| The accompanying notes are an integral part of these financial statements. |
| AQR Funds | Annual Report | September 2016 | ||||||||||||||
172
| Statements of Operations | September 30, 2016 |
| AQR LARGE CAP MULTI-STYLE FUND | AQR SMALL CAP MULTI-STYLE FUND | AQR INTERNATIONAL MULTI-STYLE FUND | AQR EMERGING | |||||||||||||
| FOR THE YEAR ENDED SEPTEMBER 30, 2016 | FOR THE YEAR ENDED SEPTEMBER 30, 2016 | FOR THE YEAR ENDED SEPTEMBER 30, 2016 | FOR THE YEAR ENDED SEPTEMBER 30, 2016 | |||||||||||||
| INVESTMENT INCOME: | ||||||||||||||||
Dividend income† | $25,134,513 | $6,799,281 | $10,104,190 | $5,602,581 | ||||||||||||
Securities lending income, net | — | 1,494,719 | — | 39,398 | ||||||||||||
| Total Income | 25,134,513 | 8,294,000 | 10,104,190 | 5,641,979 | ||||||||||||
| EXPENSES: | ||||||||||||||||
Investment advisory fees | 4,023,845 | 2,339,722 | 1,489,758 | 1,297,775 | ||||||||||||
Custody fees | 49,089 | 92,233 | 61,553 | 227,256 | ||||||||||||
Administration & accounting fees | 289,308 | 97,728 | 71,261 | 46,696 | ||||||||||||
Legal fees | 59,460 | 9,523 | 22,820 | 6,572 | ||||||||||||
Audit & tax fees | 52,681 | 50,307 | 66,483 | 65,073 | ||||||||||||
Shareholder reporting fees | 188,529 | 128,472 | 101,538 | 91,946 | ||||||||||||
Transfer agent fees | 604,967 | 56,035 | 76,182 | 77,811 | ||||||||||||
Trustee fees | 39,190 | 10,277 | 10,443 | 6,892 | ||||||||||||
Distribution fees—Class N | 173,048 | 21,594 | 17,226 | 14,802 | ||||||||||||
Registration fees | 113,813 | 104,540 | 55,979 | 51,370 | ||||||||||||
Pricing fee | 75 | 945 | 20,548 | 20,980 | ||||||||||||
Other expenses | 64,311 | 61,423 | 17,340 | 15,068 | ||||||||||||
| Total Expenses | 5,658,316 | 2,972,799 | 2,011,131 | 1,922,241 | ||||||||||||
Less fee waivers and/or reimbursements | (184,765 | ) | (329,815 | ) | (276,268 | ) | (438,452 | ) | ||||||||
| Net Expenses | 5,473,551 | 2,642,984 | 1,734,863 | 1,483,789 | ||||||||||||
| Net Investment Income (Loss) | 19,660,962 | 5,651,016 | 8,369,327 | 4,158,190 | ||||||||||||
| REALIZED GAIN (LOSS) AND CHANGE IN UNREALIZED APPRECIATION (DEPRECIATION): | ||||||||||||||||
| Net realized gain (loss) from: | ||||||||||||||||
Investments in securities | (78,116,882 | ) | 7,524,245 | (38,617,504 | ) | (34,439,890 | ) | |||||||||
Foreign currency and foreign currency transactions | — | — | 55,117 | (79,154 | ) | |||||||||||
Forward foreign currency exchange contracts | — | — | — | 21,056 | ||||||||||||
Futures contracts | 8,818,063 | 3,647,556 | 103,916 | 818,028 | ||||||||||||
| Net realized gain (loss) | (69,298,819 | ) | 11,171,801 | (38,458,471 | ) | (33,679,960 | ) | |||||||||
| Net change in unrealized appreciation (depreciation) on: | ||||||||||||||||
Investments in securities | 134,973,034 | 87,120,596 | 37,094,392 | 58,033,250 | ||||||||||||
Foreign currency and foreign currency translations | — | — | 32,122 | 8,382 | ||||||||||||
Futures contracts | 784,521 | 363,401 | 77,590 | (94,599 | ) | |||||||||||
| Net change in unrealized appreciation (depreciation) | 135,757,555 | 87,483,997 | 37,204,104 | 57,947,033 | ||||||||||||
| Net realized gain (loss) and net change in unrealized appreciation (depreciation) | 66,458,736 | 98,655,798 | (1,254,367 | ) | 24,267,073 | |||||||||||
| Net increase (decrease) in net assets resulting from operations | $86,119,698 | $104,306,814 | $ | 7,114,960 | $ | 28,425,263 | ||||||||||
† Net of foreign taxes withheld of | $6,231 | $746 | $910,372 | $597,660 | ||||||||||||
| The accompanying notes are an integral part of these financial statements. |
| AQR Funds | Annual Report | September 2016 | ||||||||||||||
173
| Statements of Operations | September 30, 2016 |
| AQR TM LARGE CAP MULTI-STYLE FUND | AQR TM SMALL CAP MULTI-STYLE FUND | AQR TM INTERNATIONAL MULTI-STYLE FUND | AQR TM EMERGING MULTI-STYLE FUND | |||||||||||||
| FOR THE YEAR ENDED SEPTEMBER 30, 2016 | FOR THE YEAR ENDED SEPTEMBER 30, 2016 | FOR THE YEAR ENDED SEPTEMBER 30, 2016 | FOR THE YEAR ENDED SEPTEMBER 30, 2016 | |||||||||||||
| INVESTMENT INCOME: | ||||||||||||||||
Dividend income† | $1,803,985 | $175,984 | $3,085,244 | $6,021,273 | ||||||||||||
Securities lending income, net | — | 40,594 | — | 28,960 | ||||||||||||
| Total Income | 1,803,985 | 216,578 | 3,085,244 | 6,050,233 | ||||||||||||
| EXPENSES: | ||||||||||||||||
Investment advisory fees | 272,187 | 57,097 | 430,869 | 1,322,790 | ||||||||||||
Custody fees | 23,121 | 29,155 | 45,031 | 275,512 | ||||||||||||
Administration & accounting fees | 19,148 | 2,387 | 20,243 | 47,052 | ||||||||||||
Legal fees | 1,954 | 314 | 1,491 | 7,785 | ||||||||||||
Audit & tax fees | 48,620 | 48,298 | 60,357 | 65,929 | ||||||||||||
Shareholder reporting fees | 26,008 | 5,906 | 34,118 | 42,453 | ||||||||||||
Transfer agent fees | 33,955 | 24,878 | 29,188 | 24,093 | ||||||||||||
Trustee fees | 2,804 | 1,004 | 3,019 | 5,605 | ||||||||||||
Offering costs | 5,702 | 5,664 | 5,690 | 8,583 | ||||||||||||
Distribution fees—Class N | 3,294 | 4,105 | 1,623 | 3,104 | ||||||||||||
Registration fees | 49,101 | 43,194 | 45,360 | 77,330 | ||||||||||||
Pricing fee | 159 | 1,747 | 14,042 | 14,154 | ||||||||||||
Other expenses | 12,720 | 2,525 | 11,796 | 27,892 | ||||||||||||
| Total Expenses | 498,773 | 226,274 | 702,827 | 1,922,282 | ||||||||||||
Less fee waivers and/or reimbursements | (159,013 | ) | (150,650 | ) | (208,409 | ) | (475,322 | ) | ||||||||
| Net Expenses | 339,760 | 75,624 | 494,418 | 1,446,960 | ||||||||||||
| Net Investment Income (Loss) | 1,464,225 | 140,954 | 2,590,826 | 4,603,273 | ||||||||||||
| REALIZED GAIN (LOSS) AND CHANGE IN UNREALIZED APPRECIATION (DEPRECIATION): | ||||||||||||||||
| Net realized gain (loss) from: | ||||||||||||||||
Investments in securities | (3,244,697 | ) | (32,325 | ) | (6,893,985 | ) | (13,619,072 | ) | ||||||||
Foreign currency and foreign currency transactions | — | — | 106,023 | (14,285 | ) | |||||||||||
Forward foreign currency exchange contracts | — | — | (71,550 | ) | (170,293 | ) | ||||||||||
Futures contracts | — | — | 192,250 | 944,829 | ||||||||||||
| Net realized gain (loss) | (3,244,697 | ) | (32,325 | ) | (6,667,262 | ) | (12,858,821 | ) | ||||||||
| Net change in unrealized appreciation (depreciation) on: | ||||||||||||||||
Investments in securities | 8,712,424 | 2,174,304 | 8,513,807 | 34,423,158 | ||||||||||||
Foreign currency and foreign currency translations | — | — | 3,622 | (2,082 | ) | |||||||||||
Futures contracts | — | — | 28,956 | (51,706 | ) | |||||||||||
| Net change in unrealized appreciation (depreciation) | 8,712,424 | 2,174,304 | 8,546,385 | 34,369,370 | ||||||||||||
| Net realized gain (loss) and net change in unrealized appreciation (depreciation) | 5,467,727 | 2,141,979 | 1,879,123 | 21,510,549 | ||||||||||||
| Net increase (decrease) in net assets resulting from operations | $6,931,952 | $2,282,933 | $4,469,949 | $ | 26,113,822 | |||||||||||
† Net of foreign taxes withheld of | $264 | $12 | $288,617 | $651,154 | ||||||||||||
| The accompanying notes are an integral part of these financial statements. |
| AQR Funds | Annual Report | September 2016 | ||||||||||||||
174
| Statements of Operations | September 30, 2016 |
| AQR LARGE CAP MOMENTUM STYLE FUND | AQR SMALL CAP MOMENTUM STYLE FUND | AQR INTERNATIONAL MOMENTUM STYLE FUND | AQR EMERGING | |||||||||||||
| FOR THE YEAR ENDED SEPTEMBER 30, 2016 | FOR THE YEAR ENDED SEPTEMBER 30, 2016 | FOR THE YEAR ENDED SEPTEMBER 30, 2016 | FOR THE YEAR ENDED SEPTEMBER 30, 2016 | |||||||||||||
| INVESTMENT INCOME: | ||||||||||||||||
Dividend income† | $17,276,301 | $3,570,416 | $8,146,000 | $178,830 | ||||||||||||
Securities lending income, net | — | 928,283 | — | 3,987 | ||||||||||||
| Total Income | 17,276,301 | 4,498,699 | 8,146,000 | 182,817 | ||||||||||||
| EXPENSES: | ||||||||||||||||
Investment advisory fees | 2,480,522 | 1,491,402 | 1,341,750 | 51,696 | ||||||||||||
Custody fees | 49,798 | 57,797 | 81,262 | 48,524 | ||||||||||||
Administration & accounting fees | 213,622 | 71,261 | 72,084 | 1,989 | ||||||||||||
Legal fees | 64,951 | 21,186 | 22,382 | 3,637 | ||||||||||||
Audit & tax fees | 51,413 | 49,159 | 74,811 | 60,140 | ||||||||||||
Shareholder reporting fees | 115,348 | 42,450 | 55,441 | 4,793 | ||||||||||||
Transfer agent fees | 925,083 | 316,129 | 310,003 | 20,937 | ||||||||||||
Trustee fees | 31,443 | 11,509 | 10,949 | 1,029 | ||||||||||||
Distribution fees—Class N | 158,302 | 15,831 | 83,015 | 3,302 | ||||||||||||
Registration fees | 68,071 | 66,465 | 57,482 | 41,477 | ||||||||||||
Pricing fee | 130 | 1,420 | 20,461 | 21,041 | ||||||||||||
Other expenses | 45,002 | 16,148 | 16,428 | 2,038 | ||||||||||||
| Total Expenses | 4,203,685 | 2,160,757 | 2,146,068 | 260,603 | ||||||||||||
Less fee waivers and/or reimbursements | (147,639 | ) | (184,736 | ) | (255,821 | ) | (196,346 | ) | ||||||||
| Net Expenses | 4,056,046 | 1,976,021 | 1,890,247 | 64,257 | ||||||||||||
| Net Investment Income (Loss) | 13,220,255 | 2,522,678 | 6,255,753 | 118,560 | ||||||||||||
| REALIZED GAIN (LOSS) AND CHANGE IN UNREALIZED APPRECIATION (DEPRECIATION): | ||||||||||||||||
| Net realized gain (loss) from: | ||||||||||||||||
Investments in securities | 59,677,897 | (6,296,128 | ) | (18,013,875 | ) | (1,408,614 | ) | |||||||||
Foreign currency and foreign currency transactions | — | — | (102,143 | ) | (6,165 | ) | ||||||||||
Forward foreign currency exchange contracts | — | — | (4,890 | ) | (2,743 | ) | ||||||||||
Futures contracts | 1,227,713 | 1,108,053 | 380,314 | — | ||||||||||||
| Net realized gain (loss) | 60,905,610 | (5,188,075 | ) | (17,740,594 | ) | (1,417,522 | ) | |||||||||
| Net change in unrealized appreciation (depreciation) on: | ||||||||||||||||
Investments in securities | 28,574,404 | 39,349,708 | 31,964,240 | 2,321,734 | ||||||||||||
Foreign currency and foreign currency translations | 2 | — | 73,721 | 720 | ||||||||||||
Futures contracts | 522,112 | 502,772 | 210,363 | — | ||||||||||||
| Net change in unrealized appreciation (depreciation) | 29,096,518 | 39,852,480 | 32,248,324 | 2,322,454 | ||||||||||||
| Net realized gain (loss) and net change in unrealized appreciation (depreciation) | 90,002,128 | 34,664,405 | 14,507,730 | 904,932 | ||||||||||||
| Net increase (decrease) in net assets resulting from operations | $103,222,383 | $37,187,083 | $ | 20,763,483 | $ | 1,023,492 | ||||||||||
† Net of foreign taxes withheld of | $3,376 | $410 | $826,463 | $16,398 | ||||||||||||
| The accompanying notes are an integral part of these financial statements. |
| AQR Funds | Annual Report | September 2016 | ||||||||||||||
175
| Statements of Operations | September 30, 2016 |
| AQR TM LARGE CAP MOMENTUM STYLE FUND | AQR TM SMALL CAP MOMENTUM STYLE FUND | AQR TM INTERNATIONAL MOMENTUM STYLE FUND | AQR LARGE CAP DEFENSIVE STYLE FUND | |||||||||||||
| FOR THE YEAR ENDED SEPTEMBER 30, 2016 | FOR THE YEAR ENDED SEPTEMBER 30, 2016 | FOR THE YEAR ENDED SEPTEMBER 30, 2016 | FOR THE YEAR ENDED SEPTEMBER 30, 2016 | |||||||||||||
| INVESTMENT INCOME: | ||||||||||||||||
Dividend income† | $2,505,540 | $308,480 | $2,052,311 | $12,293,280 | ||||||||||||
Securities lending income, net | — | 77,629 | — | — | ||||||||||||
| Total Income | 2,505,540 | 386,109 | 2,052,311 | 12,293,280 | ||||||||||||
| EXPENSES: | ||||||||||||||||
Investment advisory fees | 351,085 | 122,008 | 338,066 | 1,414,034 | ||||||||||||
Custody fees | 15,370 | 17,987 | 37,006 | 28,948 | ||||||||||||
Administration & accounting fees | 30,153 | 5,768 | 18,149 | 119,447 | ||||||||||||
Legal fees | 6,991 | 1,002 | 7,311 | 13,314 | ||||||||||||
Audit & tax fees | 48,506 | 48,068 | 56,116 | 50,335 | ||||||||||||
Shareholder reporting fees | 16,417 | 8,135 | 11,282 | 71,839 | ||||||||||||
Transfer agent fees | 77,132 | 42,275 | 43,381 | 434,497 | ||||||||||||
Trustee fees | 4,940 | 1,509 | 3,206 | 14,058 | ||||||||||||
Distribution fees—Class N | 403 | 352 | 333 | 330,918 | ||||||||||||
Registration fees | 51,510 | 46,226 | 46,726 | 74,186 | ||||||||||||
Pricing fee | 114 | 1,829 | 20,528 | 129 | ||||||||||||
Other expenses | 7,575 | 3,290 | 5,509 | 55,193 | ||||||||||||
| Total Expenses | 610,196 | 298,449 | 587,613 | 2,606,898 | ||||||||||||
Less fee waivers and/or reimbursements | (125,515 | ) | (136,358 | ) | (178,612 | ) | (152,969 | ) | ||||||||
| Net Expenses | 484,681 | 162,091 | 409,001 | 2,453,929 | ||||||||||||
| Net Investment Income (Loss) | 2,020,859 | 224,018 | 1,643,310 | 9,839,351 | ||||||||||||
| REALIZED GAIN (LOSS) AND CHANGE IN UNREALIZED APPRECIATION (DEPRECIATION): | ||||||||||||||||
| Net realized gain (loss) from: | ||||||||||||||||
Investments in securities | (2,081,306 | ) | (508,214 | ) | (4,786,745 | ) | 33,276 | |||||||||
Foreign currency and foreign currency transactions | — | — | (72,203 | ) | — | |||||||||||
Forward foreign currency exchange contracts | — | — | 63,735 | — | ||||||||||||
Futures contracts | 173,981 | — | (123,992 | ) | 5,105,340 | |||||||||||
| Net realized gain (loss) | (1,907,325 | ) | (508,214 | ) | (4,919,205 | ) | 5,138,616 | |||||||||
| Net change in unrealized appreciation (depreciation) on: | ||||||||||||||||
Investments in securities | 13,449,104 | 3,235,528 | 8,304,266 | 50,606,281 | ||||||||||||
Foreign currency and foreign currency translations | — | — | 17,086 | — | ||||||||||||
Futures contracts | 70,429 | — | 22,946 | 753,157 | ||||||||||||
| Net change in unrealized appreciation (depreciation) | 13,519,533 | 3,235,528 | 8,344,298 | 51,359,438 | ||||||||||||
| Net realized gain (loss) and net change in unrealized appreciation (depreciation) | 11,612,208 | 2,727,314 | 3,425,093 | 56,498,054 | ||||||||||||
| Net increase (decrease) in net assets resulting from operations | $13,633,067 | $2,951,332 | $ | 5,068,403 | $ | 66,337,405 | ||||||||||
† Net of foreign taxes withheld of | $10 | $119 | $226,554 | $2,608 | ||||||||||||
| The accompanying notes are an integral part of these financial statements. |
| AQR Funds | Annual Report | September 2016 | ||||||||||||||
176
| Statements of Operations | September 30, 2016 |
| AQR INTERNATIONAL DEFENSIVE STYLE FUND | AQR EMERGING | AQR GLOBAL FUND | AQR FUND | |||||||||||||
| FOR THE YEAR ENDED SEPTEMBER 30, 2016 | FOR THE YEAR ENDED SEPTEMBER 30, 2016 | FOR THE YEAR ENDED SEPTEMBER 30, 2016 | FOR THE YEAR ENDED SEPTEMBER 30, 2016 | |||||||||||||
| INVESTMENT INCOME: | ||||||||||||||||
Dividend income† | $2,201,496 | $1,044,540 | $4,359,094 | $15,713,137 | ||||||||||||
Securities lending income, net | — | 5,262 | — | — | ||||||||||||
| Total Income | 2,201,496 | 1,049,802 | 4,359,094 | 15,713,137 | ||||||||||||
| EXPENSES: | ||||||||||||||||
Investment advisory fees | 282,008 | 223,702 | 831,242 | 2,591,973 | ||||||||||||
Shareholder servicing fees | — | — | 294,923 | 1,168,708 | ||||||||||||
Custody fees | 42,976 | 45,684 | 57,892 | 110,628 | ||||||||||||
Administration & accounting fees | 14,701 | 9,067 | 45,543 | 125,865 | ||||||||||||
Legal fees | 6,030 | 3,432 | 24,969 | 59,653 | ||||||||||||
Audit & tax fees | 58,142 | 61,195 | 69,949 | 103,105 | ||||||||||||
Shareholder reporting fees | 15,490 | 15,130 | 10,518 | 49,587 | ||||||||||||
Transfer agent fees | 73,466 | 47,188 | 47,762 | 406,431 | ||||||||||||
Trustee fees | 2,448 | 2,094 | 8,195 | 19,806 | ||||||||||||
Distribution fees—Class N | 12,327 | 321 | 3,320 | 92,076 | ||||||||||||
Registration fees | 43,664 | 41,244 | 48,328 | 66,969 | ||||||||||||
Pricing fee | 20,541 | 16,525 | 20,737 | 20,557 | ||||||||||||
Other expenses | 9,838 | 3,768 | 14,001 | 30,494 | ||||||||||||
| Total Expenses | 581,631 | 469,350 | 1,477,379 | 4,845,852 | ||||||||||||
Less fee waivers and/or reimbursements | (193,971 | ) | (193,575 | ) | (89,444 | ) | (72,812 | ) | ||||||||
| Net Expenses | 387,660 | 275,775 | 1,387,935 | 4,773,040 | ||||||||||||
| Net Investment Income (Loss) | 1,813,836 | 774,027 | 2,971,159 | 10,940,097 | ||||||||||||
| REALIZED GAIN (LOSS) AND CHANGE IN UNREALIZED APPRECIATION (DEPRECIATION): | ||||||||||||||||
| Net realized gain (loss) from: | ||||||||||||||||
Investments in securities | (658,231 | ) | (1,932,493 | ) | 20,893,288 | 11,561,003 | ||||||||||
Foreign currency and foreign currency transactions | (242,085 | ) | 52,231 | (159,739 | ) | (430,728 | ) | |||||||||
Forward foreign currency exchange contracts | 208,234 | (151 | ) | 6,752,840 | 28,741,705 | |||||||||||
Futures contracts | 420,342 | 602,116 | 2,107,906 | 1,943,063 | ||||||||||||
Swap contracts | — | — | (378,410 | ) | 457,018 | |||||||||||
| Net realized gain (loss) | (271,740 | ) | (1,278,297 | ) | 29,215,885 | 42,272,061 | ||||||||||
| Net change in unrealized appreciation (depreciation) on: | ||||||||||||||||
Investments in securities | 6,834,764 | 5,134,362 | (6,978,028 | ) | (8,449,068 | ) | ||||||||||
Foreign currency and foreign currency translations | 2,758 | 4,218 | 16,968 | 271,828 | ||||||||||||
Forward foreign currency exchange contracts | — | — | (1,081,657 | ) | (1,401,567 | ) | ||||||||||
Futures contracts | 13,398 | (15,448 | ) | 314,270 | 1,439,712 | |||||||||||
Swap contracts | — | — | 168,322 | (216,773 | ) | |||||||||||
| Net change in unrealized appreciation (depreciation) | 6,850,920 | 5,123,132 | (7,560,125 | ) | (8,355,868 | ) | ||||||||||
| Net realized gain (loss) and net change in unrealized appreciation (depreciation) | 6,579,180 | 3,844,835 | 21,655,760 | 33,916,193 | ||||||||||||
| Net increase (decrease) in net assets resulting from operations | $ | 8,393,016 | $ | 4,618,862 | $24,626,919 | $ | 44,856,290 | |||||||||
† Net of foreign taxes withheld of | $187,473 | $122,335 | $354,091 | $1,320,121 | ||||||||||||
| The accompanying notes are an integral part of these financial statements. |
| AQR Funds | Annual Report | September 2016 | ||||||||||||||
177
| Statements of Changes in Net Assets | September 30, 2016 |
| AQR LARGE CAP MULTI-STYLE FUND | AQR SMALL CAP MULTI-STYLE FUND | |||||||||||||||
| FOR THE YEAR ENDED SEPTEMBER 30, 2016 | FOR THE YEAR ENDED SEPTEMBER 30, 2015 | FOR THE YEAR ENDED SEPTEMBER 30, 2016 | FOR THE YEAR ENDED SEPTEMBER 30, 2015 | |||||||||||||
| OPERATIONS: | ||||||||||||||||
Net investment income (loss) | $ | 19,660,962 | $ | 8,821,418 | $ | 5,651,016 | $ | 244,272 | ||||||||
Net realized gain (loss) | (69,298,819 | ) | (17,539,841 | ) | 11,171,801 | (858,740 | ) | |||||||||
Net change in unrealized appreciation (depreciation) | 135,757,555 | (42,928,966 | ) | 87,483,997 | (2,230,520 | ) | ||||||||||
Net increase (decrease) in net assets resulting from operations | 86,119,698 | (51,647,389 | ) | 104,306,814 | (2,844,988 | ) | ||||||||||
| DISTRIBUTIONS TO SHAREHOLDERS: | ||||||||||||||||
| Net investment income: | ||||||||||||||||
Class I | (5,061,842 | ) | (1,256,118 | ) | (70,814 | ) | (32,992 | ) | ||||||||
Class N | (461,951 | ) | (147,772 | ) | (3,819 | ) | (293 | ) | ||||||||
Class R6 | (6,699,234 | ) | (289,685 | ) | (401,079 | ) | (274 | ) | ||||||||
Total | (12,223,027 | ) | (1,693,575 | ) | (475,712 | ) | (33,559 | ) | ||||||||
| Net realized gain: | ||||||||||||||||
Class I | (495 | ) | (1,427,011 | ) | (49 | ) | (159,558 | ) | ||||||||
Class N | (61 | ) | (190,661 | ) | (15 | ) | (25,739 | ) | ||||||||
Class R6 | (595 | ) | (294,996 | ) | (209 | ) | (1,122 | ) | ||||||||
Total | (1,151 | ) | (1,912,668 | ) | (273 | ) | (186,419 | ) | ||||||||
Total distributions | (12,224,178 | ) | (3,606,243 | ) | (475,985 | ) | (219,978 | ) | ||||||||
| CAPITAL TRANSACTIONS: | ||||||||||||||||
| CLASS I (a) | ||||||||||||||||
Proceeds from shares sold | 371,477,654 | 453,462,208 | 32,766,802 | 26,053,038 | ||||||||||||
Reinvestment of distributions | 4,979,196 | 2,314,801 | 70,815 | 192,314 | ||||||||||||
Cost of shares redeemed | (267,990,360 | ) | (113,786,483 | ) | (17,559,231 | ) | (6,229,549 | ) | ||||||||
Net increase (decrease) from capital transactions | 108,466,490 | 341,990,526 | 15,278,386 | 20,015,803 | ||||||||||||
| CLASS N | ||||||||||||||||
Proceeds from shares sold | 35,135,654 | 62,739,741 | 10,910,277 | 12,604,768 | ||||||||||||
Reinvestment of distributions | 461,243 | 337,887 | 3,805 | 25,695 | ||||||||||||
Cost of shares redeemed | (34,612,635 | ) | (11,001,877 | ) | (7,735,264 | ) | (7,706,384 | ) | ||||||||
Net increase (decrease) from capital transactions | 984,262 | 52,075,751 | 3,178,818 | 4,924,079 | ||||||||||||
| CLASS R6 | ||||||||||||||||
Proceeds from shares sold | 311,854,105 | 604,806,891 | 643,974,405 | 10,426,076 | ||||||||||||
Reinvestment of distributions | 6,698,589 | 584,681 | 353,862 | 1,396 | ||||||||||||
Cost of shares redeemed | (131,474,251 | ) | (48,619,870 | ) | (65,223,279 | ) | (105,385 | ) | ||||||||
Net increase (decrease) from capital transactions | 187,078,443 | 556,771,702 | 579,104,988 | 10,322,087 | ||||||||||||
| Net increase (decrease) in net assets resulting from capital transactions | 296,529,195 | 950,837,979 | 597,562,192 | 35,261,969 | ||||||||||||
Total increase (decrease) in net assets | 370,424,715 | 895,584,347 | 701,393,021 | 32,197,003 | ||||||||||||
| NET ASSETS: | ||||||||||||||||
Beginning of period | 1,114,227,323 | 218,642,976 | 41,808,864 | 9,611,861 | ||||||||||||
End of period | $ | 1,484,652,038 | $ | 1,114,227,323 | $ | 743,201,885 | $ | 41,808,864 | ||||||||
Undistributed accumulated net investment income (loss) | $ | 14,853,381 | $ | 7,912,780 | $ | 5,118,103 | $ | 212,998 | ||||||||
| The accompanying notes are an integral part of these financial statements. | (continued on p. 179) |
| AQR Funds | Annual Report | September 2016 | ||||||||||||||
178
| Statements of Changes in Net Assets | September 30, 2016 |
| AQR LARGE CAP MULTI-STYLE FUND | AQR SMALL CAP MULTI-STYLE FUND | |||||||||||||||
| FOR THE YEAR ENDED SEPTEMBER 30, 2016 | FOR THE YEAR ENDED SEPTEMBER 30, 2015 | FOR THE YEAR ENDED SEPTEMBER 30, 2016 | FOR THE YEAR ENDED SEPTEMBER 30, 2015 | |||||||||||||
| CHANGES IN SHARES OUTSTANDING: | ||||||||||||||||
| CLASS I (a) | ||||||||||||||||
Shares outstanding, beginning of period | 37,047,708 | 12,425,605 | 2,165,764 | 667,089 | ||||||||||||
Shares sold | 27,475,415 | 32,729,614 | 2,534,955 | 1,971,201 | ||||||||||||
Shares issued on reinvestment of distributions | 364,509 | 165,579 | 5,656 | 14,805 | ||||||||||||
Shares redeemed | (20,076,562 | ) | (8,273,090 | ) | (1,447,505 | ) | (487,331 | ) | ||||||||
Shares outstanding, end of period | 44,811,070 | 37,047,708 | 3,258,870 | 2,165,764 | ||||||||||||
| CLASS N | ||||||||||||||||
Shares outstanding, beginning of period | 4,528,366 | 774,591 | 463,666 | 104,362 | ||||||||||||
Shares sold | 2,626,755 | 4,524,196 | 863,642 | 958,712 | ||||||||||||
Shares issued on reinvestment of distributions | 33,865 | 24,221 | 305 | 1,981 | ||||||||||||
Shares redeemed | (2,545,423 | ) | (794,642 | ) | (627,127 | ) | (601,389 | ) | ||||||||
Shares outstanding, end of period | 4,643,563 | 4,528,366 | 700,486 | 463,666 | ||||||||||||
| CLASS R6 | ||||||||||||||||
Shares outstanding, beginning of period | 42,554,777 | 3,162,925 | 771,282 | 7,722 | ||||||||||||
Shares sold | 23,345,042 | 42,819,832 | 53,443,534 | 771,282 | ||||||||||||
Shares issued on reinvestment of distributions | 490,739 | 41,823 | 28,241 | 107 | ||||||||||||
Shares redeemed | (9,779,517 | ) | (3,469,803 | ) | (5,016,786 | ) | (7,829 | ) | ||||||||
Shares outstanding, end of period | 56,611,041 | 42,554,777 | 49,226,271 | 771,282 | ||||||||||||
| (a) | Effective April 1, 2015, Class L Shares were renamed Class I Shares. |
| The accompanying notes are an integral part of these financial statements. |
| AQR Funds | Annual Report | September 2016 | ||||||||||||||
179
| Statements of Changes in Net Assets | September 30, 2016 |
| AQR INTERNATIONAL MULTI-STYLE FUND | AQR EMERGING MULTI-STYLE FUND | |||||||||||||||
| FOR THE YEAR ENDED SEPTEMBER 30, 2016 | FOR THE YEAR ENDED SEPTEMBER 30, 2015 | FOR THE YEAR ENDED SEPTEMBER 30, 2016 | FOR THE YEAR ENDED SEPTEMBER 30, 2015 | |||||||||||||
| OPERATIONS: | ||||||||||||||||
Net investment income (loss) | $ | 8,369,327 | $ | 4,484,141 | $ | 4,158,190 | $ | 3,809,337 | ||||||||
Net realized gain (loss) | (38,458,471 | ) | (10,741,439 | ) | (33,679,960 | ) | (10,325,813 | ) | ||||||||
Net change in unrealized appreciation (depreciation) | 37,204,104 | (24,826,176 | ) | 57,947,033 | (34,013,618 | ) | ||||||||||
Net increase (decrease) in net assets resulting from operations | 7,114,960 | (31,083,474 | ) | 28,425,263 | (40,530,094 | ) | ||||||||||
| DISTRIBUTIONS TO SHAREHOLDERS: | ||||||||||||||||
| Net investment income: | ||||||||||||||||
Class I | (606,011 | ) | (403,490 | ) | (1,291,346 | ) | (141,008 | ) | ||||||||
Class N | (76,115 | ) | (26,584 | ) | (112,201 | ) | (22,750 | ) | ||||||||
Class R6 | (3,911,376 | ) | (577,980 | ) | (3,422,346 | ) | (690 | ) | ||||||||
Total | (4,593,502 | ) | (1,008,054 | ) | (4,825,893 | ) | (164,448 | ) | ||||||||
| Net realized gain: | ||||||||||||||||
Class I | — | (166,855 | ) | — | — | |||||||||||
Class N | — | (13,559 | ) | — | — | |||||||||||
Class R6 | — | (214,047 | ) | — | — | |||||||||||
Total | — | (394,461 | ) | — | — | |||||||||||
Total distributions | (4,593,502 | ) | (1,402,515 | ) | (4,825,893 | ) | (164,448 | ) | ||||||||
| CAPITAL TRANSACTIONS: | ||||||||||||||||
| CLASS I (a) | ||||||||||||||||
Proceeds from shares sold | 60,133,163 | 28,507,436 | 33,023,607 | 51,143,674 | ||||||||||||
Reinvestment of distributions | 603,182 | 569,269 | 1,285,557 | 141,008 | ||||||||||||
Cost of shares redeemed | (33,973,951 | ) | (11,623,854 | ) | (15,499,794 | ) | (10,102,839 | ) | ||||||||
Net increase (decrease) from capital transactions | 26,762,394 | 17,452,851 | 18,809,370 | 41,181,843 | ||||||||||||
| CLASS N | ||||||||||||||||
Proceeds from shares sold | 8,931,867 | 5,611,389 | 6,735,342 | 6,496,864 | ||||||||||||
Reinvestment of distributions | 75,447 | 39,182 | 112,201 | 22,750 | ||||||||||||
Cost of shares redeemed | (4,548,689 | ) | (3,746,127 | ) | (4,356,156 | ) | (3,479,794 | ) | ||||||||
Net increase (decrease) from capital transactions | 4,458,625 | 1,904,444 | 2,491,387 | 3,039,820 | ||||||||||||
| CLASS R6 | ||||||||||||||||
Proceeds from shares sold | 101,522,329 | 268,169,384 | 54,236,859 | 182,921,207 | ||||||||||||
Reinvestment of distributions | 3,910,599 | 792,027 | 3,421,616 | 690 | ||||||||||||
Cost of shares redeemed | (47,070,019 | ) | (25,761,136 | ) | (26,043,362 | ) | (11,514,345 | ) | ||||||||
Net increase (decrease) from capital transactions | 58,362,909 | 243,200,275 | 31,615,113 | 171,407,552 | ||||||||||||
| Net increase (decrease) in net assets resulting from capital transactions | 89,583,928 | 262,557,570 | 52,915,870 | 215,629,215 | ||||||||||||
Total increase (decrease) in net assets | 92,105,386 | 230,071,581 | 76,515,240 | 174,934,673 | ||||||||||||
| NET ASSETS: | ||||||||||||||||
Beginning of period | 285,968,069 | 55,896,488 | 188,989,340 | 14,054,667 | ||||||||||||
End of period | $ | 378,073,455 | $ | 285,968,069 | $ | 265,504,580 | $ | 188,989,340 | ||||||||
Undistributed accumulated net investment income (loss) | $ | 8,595,128 | $ | 3,852,002 | $ | 3,427,142 | $ | 3,917,919 | ||||||||
| The accompanying notes are an integral part of these financial statements. | (continued on p. 181) |
| AQR Funds | Annual Report | September 2016 | ||||||||||||||
180
| Statements of Changes in Net Assets | September 30, 2016 |
| AQR INTERNATIONAL MULTI-STYLE FUND | AQR EMERGING MULTI-STYLE FUND | |||||||||||||||
| FOR THE YEAR ENDED SEPTEMBER 30, 2016 | FOR THE YEAR ENDED SEPTEMBER 30, 2015 | FOR THE YEAR ENDED SEPTEMBER 30, 2016 | FOR THE YEAR ENDED SEPTEMBER 30, 2015 | |||||||||||||
| CHANGES IN SHARES OUTSTANDING: | ||||||||||||||||
| CLASS I (a) | ||||||||||||||||
Shares outstanding, beginning of period | 3,920,915 | 2,331,110 | 5,981,726 | 1,161,585 | ||||||||||||
Shares sold | 6,091,979 | 2,593,860 | 3,979,169 | 5,827,607 | ||||||||||||
Shares issued on reinvestment of distributions | 57,666 | 52,661 | 159,696 | 14,582 | ||||||||||||
Shares redeemed | (3,393,173 | ) | (1,056,716 | ) | (1,876,878 | ) | (1,022,048 | ) | ||||||||
Shares outstanding, end of period | 6,677,387 | 3,920,915 | 8,243,713 | 5,981,726 | ||||||||||||
| CLASS N | ||||||||||||||||
Shares outstanding, beginning of period | 406,162 | 240,807 | 549,846 | 239,916 | ||||||||||||
Shares sold | 868,544 | 501,312 | 830,399 | 667,815 | ||||||||||||
Shares issued on reinvestment of distributions | 7,220 | 3,621 | 13,938 | 2,355 | ||||||||||||
Shares redeemed | (449,287 | ) | (339,578 | ) | (543,446 | ) | (360,240 | ) | ||||||||
Shares outstanding, end of period | 832,639 | 406,162 | 850,737 | 549,846 | ||||||||||||
| CLASS R6 | ||||||||||||||||
Shares outstanding, beginning of period | 23,695,163 | 2,303,191 | 16,527,847 | 9,551 | ||||||||||||
Shares sold | 10,128,333 | 23,663,755 | 6,779,947 | 17,730,277 | ||||||||||||
Shares issued on reinvestment of distributions | 374,578 | 73,404 | 425,046 | 71 | ||||||||||||
Shares redeemed | (4,705,976 | ) | (2,345,187 | ) | (3,196,622 | ) | (1,212,052 | ) | ||||||||
Shares outstanding, end of period | 29,492,098 | 23,695,163 | 20,536,218 | 16,527,847 | ||||||||||||
| (a) | Effective April 1, 2015, Class L Shares were renamed Class I Shares. |
| The accompanying notes are an integral part of these financial statements. |
| AQR Funds | Annual Report | September 2016 | ||||||||||||||
181
| Statements of Changes in Net Assets | September 30, 2016 |
| AQR TM LARGE CAP MULTI-STYLE FUND | AQR TM SMALL CAP MULTI-STYLE FUND | |||||||||||||||
| FOR THE YEAR ENDED SEPTEMBER 30, 2016 | FOR THE PERIOD 2/11/15*- 9/30/15 | FOR THE YEAR ENDED SEPTEMBER 30, 2016 | FOR THE PERIOD 2/11/15*- 9/30/15 | |||||||||||||
| OPERATIONS: | ||||||||||||||||
Net investment income (loss) | $ | 1,464,225 | $ | 125,314 | $ | 140,954 | $ | 14,039 | ||||||||
Net realized gain (loss) | (3,244,697 | ) | (105,465 | ) | (32,325 | ) | (8,431 | ) | ||||||||
Net change in unrealized appreciation (depreciation) | 8,712,424 | (1,838,323 | ) | 2,174,304 | (220,177 | ) | ||||||||||
Net increase (decrease) in net assets resulting from operations | 6,931,952 | (1,818,474 | ) | 2,282,933 | (214,569 | ) | ||||||||||
| DISTRIBUTIONS TO SHAREHOLDERS: | ||||||||||||||||
| Net investment income: | ||||||||||||||||
Class I | (29,888 | ) | — | (19,379 | ) | — | ||||||||||
Class N | (419 | ) | — | (1,994 | ) | — | ||||||||||
Class R6 | (227,299 | ) | — | (10,514 | ) | — | ||||||||||
Total | (257,606 | ) | — | (31,887 | ) | — | ||||||||||
| Net realized gain: | ||||||||||||||||
Class I | (7,959 | ) | — | — | — | |||||||||||
Class N | (210 | ) | — | — | — | |||||||||||
Class R6 | (56,997 | ) | — | — | — | |||||||||||
Total | (65,166 | ) | — | — | — | |||||||||||
Total distributions | (322,772 | ) | — | (31,887 | ) | — | ||||||||||
| CAPITAL TRANSACTIONS: | ||||||||||||||||
| CLASS I (a) | ||||||||||||||||
Proceeds from shares sold | 44,782,939 | 2,399,875 | 12,204,726 | 1,942,079 | ||||||||||||
Reinvestment of distributions | 36,936 | — | 19,379 | — | ||||||||||||
Cost of shares redeemed | (8,474,396 | ) | (187,312 | ) | (1,791,158 | ) | (177,223 | ) | ||||||||
Net increase (decrease) from capital transactions | 36,345,479 | 2,212,563 | 10,432,947 | 1,764,856 | ||||||||||||
| CLASS N | ||||||||||||||||
Proceeds from shares sold | 2,304,554 | 246,921 | 2,575,146 | 240,900 | ||||||||||||
Reinvestment of distributions | 629 | — | 1,994 | — | ||||||||||||
Cost of shares redeemed | (413,640 | ) | (102,252 | ) | (127,136 | ) | (100,700 | ) | ||||||||
Net increase (decrease) from capital transactions | 1,891,543 | 144,669 | 2,450,004 | 140,200 | ||||||||||||
| CLASS R6 | ||||||||||||||||
Proceeds from shares sold | 79,815,885 | 31,455,583 | 100,000 | 3,612,600 | ||||||||||||
Reinvestment of distributions | 284,187 | — | 10,514 | — | ||||||||||||
Cost of shares redeemed | (13,650,502 | ) | (3,069,148 | ) | — | (1,812,600 | ) | |||||||||
Net increase (decrease) from capital transactions | 66,449,570 | 28,386,435 | 110,514 | 1,800,000 | ||||||||||||
| Net increase (decrease) in net assets resulting from capital transactions | 104,686,592 | 30,743,667 | 12,993,465 | 3,705,056 | ||||||||||||
Total increase (decrease) in net assets | 111,295,772 | 28,925,193 | 15,244,511 | 3,490,487 | ||||||||||||
| NET ASSETS: | ||||||||||||||||
Beginning of period | 28,925,193 | — | 3,490,487 | — | ||||||||||||
End of period | $ | 140,220,965 | $ | 28,925,193 | $ | 18,734,998 | $ | 3,490,487 | ||||||||
Undistributed accumulated net investment income (loss) | $ | 1,317,000 | $ | 131,665 | $ | 129,068 | $ | 20,214 | ||||||||
| The accompanying notes are an integral part of these financial statements. | (continued on p. 183) |
| AQR Funds | Annual Report | September 2016 | ||||||||||||||
182
| Statements of Changes in Net Assets | September 30, 2016 |
| AQR TM LARGE CAP MULTI-STYLE FUND | AQR TM SMALL CAP MULTI-STYLE FUND | |||||||||||||||
| FOR THE YEAR ENDED SEPTEMBER 30, 2016 | FOR THE PERIOD 2/11/15*- 9/30/15 | FOR THE YEAR ENDED SEPTEMBER 30, 2016 | FOR THE PERIOD 2/11/15*- 9/30/15 | |||||||||||||
| CHANGES IN SHARES OUTSTANDING: | ||||||||||||||||
| CLASS I (a) | ||||||||||||||||
Shares outstanding, beginning of period | 221,606 | — | 184,697 | — | ||||||||||||
Shares sold | 4,680,798 | 240,148 | 1,352,610 | 202,916 | ||||||||||||
Shares issued on reinvestment of distributions | 3,777 | — | 2,079 | — | ||||||||||||
Shares redeemed | (910,581 | ) | (18,542 | ) | (201,167 | ) | (18,219 | ) | ||||||||
Shares outstanding, end of period | 3,995,600 | 221,606 | 1,338,219 | 184,697 | ||||||||||||
| CLASS N | ||||||||||||||||
Shares outstanding, beginning of period | 14,363 | — | 13,941 | — | ||||||||||||
Shares sold | 245,689 | 24,461 | 288,222 | 23,941 | ||||||||||||
Shares issued on reinvestment of distributions | 64 | — | 214 | — | ||||||||||||
Shares redeemed | (43,033 | ) | (10,098 | ) | (13,358 | ) | (10,000 | ) | ||||||||
Shares outstanding, end of period | 217,083 | 14,363 | 289,019 | 13,941 | ||||||||||||
| CLASS R6 | ||||||||||||||||
Shares outstanding, beginning of period | 2,833,532 | — | 180,000 | — | ||||||||||||
Shares sold | 8,363,499 | 3,139,230 | 9,990 | 360,000 | ||||||||||||
Shares issued on reinvestment of distributions | 29,028 | — | 1,127 | — | ||||||||||||
Shares redeemed | (1,425,662 | ) | (305,698 | ) | — | (180,000 | ) | |||||||||
Shares outstanding, end of period | 9,800,397 | 2,833,532 | 191,117 | 180,000 | ||||||||||||
| * | Commencement of operations. |
| (a) | Effective April 1, 2015, Class L Shares were renamed Class I Shares. |
| The accompanying notes are an integral part of these financial statements. |
| AQR Funds | Annual Report | September 2016 | ||||||||||||||
183
| Statements of Changes in Net Assets | September 30, 2016 |
| AQR TM INTERNATIONAL MULTI-STYLE FUND | AQR TM EMERGING MULTI-STYLE FUND | |||||||||||||||
| FOR THE YEAR ENDED SEPTEMBER 30, 2016 | FOR THE PERIOD 2/11/15*- 9/30/15 | FOR THE YEAR ENDED SEPTEMBER 30, 2016 | FOR THE PERIOD 2/11/15*- 9/30/15 | |||||||||||||
| OPERATIONS: | ||||||||||||||||
Net investment income (loss) | $ | 2,590,826 | $ | 575,004 | $ | 4,603,273 | $ | 259,957 | ||||||||
Net realized gain (loss) | (6,667,262 | ) | (846,771 | ) | (12,858,821 | ) | (594,460 | ) | ||||||||
Net change in unrealized appreciation (depreciation) | 8,546,385 | (3,641,376 | ) | 34,369,370 | (2,421,505 | ) | ||||||||||
Net increase (decrease) in net assets resulting from operations | 4,469,949 | (3,913,143 | ) | 26,113,822 | (2,756,008 | ) | ||||||||||
| DISTRIBUTIONS TO SHAREHOLDERS: | ||||||||||||||||
| Net investment income: | ||||||||||||||||
Class I | (140,652 | ) | — | (32,378 | ) | — | ||||||||||
Class N | (3,650 | ) | — | — | — | |||||||||||
Class R6 | (593,342 | ) | — | (749,383 | ) | — | ||||||||||
Total | (737,644 | ) | — | (781,761 | ) | — | ||||||||||
Total distributions | (737,644 | ) | — | (781,761 | ) | — | ||||||||||
| CAPITAL TRANSACTIONS: | ||||||||||||||||
| CLASS I (a) | ||||||||||||||||
Proceeds from shares sold | 23,518,732 | 3,758,322 | 13,573,964 | 3,658,322 | ||||||||||||
Reinvestment of distributions | 138,694 | — | 32,123 | — | ||||||||||||
Cost of shares redeemed | (7,008,552 | ) | (322,336 | ) | (4,847,472 | ) | (262,727 | ) | ||||||||
Net increase (decrease) from capital transactions | 16,648,874 | 3,435,986 | 8,758,615 | 3,395,595 | ||||||||||||
| CLASS N | ||||||||||||||||
Proceeds from shares sold | 1,605,564 | 262,560 | 2,346,427 | 1,206,418 | ||||||||||||
Reinvestment of distributions | 3,650 | — | — | — | ||||||||||||
Cost of shares redeemed | (196,510 | ) | (107,281 | ) | (1,380,915 | ) | (122,033 | ) | ||||||||
Net increase (decrease) from capital transactions | 1,412,704 | 155,279 | 965,512 | 1,084,385 | ||||||||||||
| CLASS R6 | ||||||||||||||||
Proceeds from shares sold | 85,284,291 | 49,173,048 | 261,029,638 | 18,938,392 | ||||||||||||
Reinvestment of distributions | 593,184 | — | 749,355 | — | ||||||||||||
Cost of shares redeemed | (14,072,933 | ) | (4,122,563 | ) | (28,410,599 | ) | (1,413,989 | ) | ||||||||
Net increase (decrease) from capital transactions | 71,804,542 | 45,050,485 | 233,368,394 | 17,524,403 | ||||||||||||
| Net increase (decrease) in net assets resulting from capital transactions | 89,866,120 | 48,641,750 | 243,092,521 | 22,004,383 | ||||||||||||
Total increase (decrease) in net assets | 93,598,425 | 44,728,607 | 268,424,582 | 19,248,375 | ||||||||||||
| NET ASSETS: | ||||||||||||||||
Beginning of period | 44,728,607 | — | 19,248,375 | — | ||||||||||||
End of period | $ | 138,327,032 | $ | 44,728,607 | $ | 287,672,957 | $ | 19,248,375 | ||||||||
Undistributed accumulated net investment income (loss) | $ | 2,530,691 | $ | 580,570 | $ | 4,444,706 | $ | 260,708 | ||||||||
| The accompanying notes are an integral part of these financial statements. | (continued on p. 185) |
| AQR Funds | Annual Report | September 2016 | ||||||||||||||
184
| Statements of Changes in Net Assets | September 30, 2016 |
| AQR TM INTERNATIONAL MULTI-STYLE FUND | AQR TM EMERGING MULTI-STYLE FUND | |||||||||||||||
| FOR THE YEAR ENDED SEPTEMBER 30, 2016 | FOR THE PERIOD 2/11/15*- 9/30/15 | FOR THE YEAR ENDED SEPTEMBER 30, 2016 | FOR THE PERIOD 2/11/15*- 9/30/15 | |||||||||||||
| CHANGES IN SHARES OUTSTANDING: | ||||||||||||||||
| CLASS I (a) | ||||||||||||||||
Shares outstanding, beginning of period | 341,610 | — | 359,225 | — | ||||||||||||
Shares sold | 2,539,093 | 372,890 | 1,596,157 | 389,114 | ||||||||||||
Shares issued on reinvestment of distributions | 14,447 | — | 3,870 | — | ||||||||||||
Shares redeemed | (766,376 | ) | (31,280 | ) | (588,733 | ) | (29,889 | ) | ||||||||
Shares outstanding, end of period | 2,128,774 | 341,610 | 1,370,519 | 359,225 | ||||||||||||
| CLASS N | ||||||||||||||||
Shares outstanding, beginning of period | 15,231 | — | 106,116 | — | ||||||||||||
Shares sold | 174,012 | 25,323 | 286,357 | 120,009 | ||||||||||||
Shares issued on reinvestment of distributions | 381 | — | — | — | ||||||||||||
Shares redeemed | (20,637 | ) | (10,092 | ) | (159,267 | ) | (13,893 | ) | ||||||||
Shares outstanding, end of period | 168,987 | 15,231 | 233,206 | 106,116 | ||||||||||||
| CLASS R6 | ||||||||||||||||
Shares outstanding, beginning of period | 4,395,156 | — | 1,849,302 | — | ||||||||||||
Shares sold | 9,392,713 | 4,790,830 | 30,840,327 | 1,985,791 | ||||||||||||
Shares issued on reinvestment of distributions | 61,726 | — | 90,284 | — | ||||||||||||
Shares redeemed | (1,512,113 | ) | (395,674 | ) | (3,385,718 | ) | (136,489 | ) | ||||||||
Shares outstanding, end of period | 12,337,482 | 4,395,156 | 29,394,195 | 1,849,302 | ||||||||||||
| * | Commencement of operations. |
| (a) | Effective April 1, 2015, Class L Shares were renamed Class I Shares. |
| The accompanying notes are an integral part of these financial statements. |
| AQR Funds | Annual Report | September 2016 | ||||||||||||||
185
| Statements of Changes in Net Assets | September 30, 2016 |
AQR LARGE CAP MOMENTUM STYLE FUND | AQR SMALL CAP MOMENTUM STYLE FUND | |||||||||||||||
| FOR THE YEAR ENDED SEPTEMBER 30, 2016 | FOR THE YEAR ENDED SEPTEMBER 30, 2015 | FOR THE YEAR ENDED SEPTEMBER 30, 2016 | FOR THE YEAR ENDED SEPTEMBER 30, 2015 | |||||||||||||
| OPERATIONS: | ||||||||||||||||
Net investment income (loss) | $ | 13,220,255 | $ | 11,260,175 | $ | 2,522,678 | $ | 2,676,710 | ||||||||
Net realized gain (loss) | 60,905,610 | 60,159,968 | (5,188,075 | ) | 2,010,388 | |||||||||||
Net change in unrealized appreciation (depreciation) | 29,096,518 | (66,301,497 | ) | 39,852,480 | (10,193,167 | ) | ||||||||||
Net increase (decrease) in net assets resulting from operations | 103,222,383 | 5,118,646 | 37,187,083 | (5,506,069 | ) | |||||||||||
| DISTRIBUTIONS TO SHAREHOLDERS: | ||||||||||||||||
| Net investment income: | ||||||||||||||||
Class I | (8,820,091 | ) | (5,966,543 | ) | (2,497,115 | ) | (520,487 | ) | ||||||||
Class N | (462,621 | ) | (274,098 | ) | (45,047 | ) | — | |||||||||
Class R6 | (760,600 | ) | (3,434 | ) | (108,602 | ) | (776 | ) | ||||||||
Total | (10,043,312 | ) | (6,244,075 | ) | (2,650,764 | ) | (521,263 | ) | ||||||||
| Net realized gain: | ||||||||||||||||
Class I | (62,191,159 | ) | (84,910,757 | ) | (1,362,253 | ) | (34,089,287 | ) | ||||||||
Class N | (4,768,963 | ) | (7,008,345 | ) | (36,403 | ) | (840,081 | ) | ||||||||
Class R6 | (4,758,117 | ) | (37,242 | ) | (49,898 | ) | (24,737 | ) | ||||||||
Total | (71,718,239 | ) | (91,956,344 | ) | (1,448,554 | ) | (34,954,105 | ) | ||||||||
Total distributions | (81,761,551 | ) | (98,200,419 | ) | (4,099,318 | ) | (35,475,368 | ) | ||||||||
| CAPITAL TRANSACTIONS: | ||||||||||||||||
| CLASS I (a) | ||||||||||||||||
Proceeds from shares sold | 164,695,456 | 211,226,314 | 66,699,622 | 161,169,039 | ||||||||||||
Reinvestment of distributions | 70,902,935 | 90,741,389 | 3,846,424 | 34,230,950 | ||||||||||||
Cost of shares redeemed | (308,309,640 | ) | (298,024,764 | ) | (96,490,678 | ) | (149,534,654 | ) | ||||||||
Net increase (decrease) from capital transactions | (72,711,249 | ) | 3,942,939 | (25,944,632 | ) | 45,865,335 | ||||||||||
| CLASS N | ||||||||||||||||
Proceeds from shares sold | 15,961,335 | 16,481,731 | 2,771,176 | 2,574,174 | ||||||||||||
Reinvestment of distributions | 5,231,584 | 7,275,650 | 81,450 | 840,081 | ||||||||||||
Cost of shares redeemed | (32,777,173 | ) | (28,023,112 | ) | (9,695,395 | ) | (1,567,273 | ) | ||||||||
Net increase (decrease) from capital transactions | (11,584,254 | ) | (4,265,731 | ) | (6,842,769 | ) | 1,846,982 | |||||||||
| CLASS R6 | ||||||||||||||||
Proceeds from shares sold | 25,052,120 | 73,727,793 | 9,126,865 | 90,053,626 | ||||||||||||
Reinvestment of distributions | 5,501,528 | 40,676 | 157,097 | 25,513 | ||||||||||||
Cost of shares redeemed | (35,675,247 | ) | (7,379,515 | ) | (84,209,643 | ) | (3,424,682 | ) | ||||||||
Net increase (decrease) from capital transactions | (5,121,599 | ) | 66,388,954 | (74,925,681 | ) | 86,654,457 | ||||||||||
| Net increase (decrease) in net assets resulting from capital transactions | (89,417,102 | ) | 66,066,162 | (107,713,082 | ) | 134,366,774 | ||||||||||
Total increase (decrease) in net assets | (67,956,270 | ) | (27,015,611 | ) | (74,625,317 | ) | 93,385,337 | |||||||||
| NET ASSETS: | ||||||||||||||||
Beginning of period | 1,005,622,748 | 1,032,638,359 | 401,843,374 | 308,458,037 | ||||||||||||
End of period | $ | 937,666,478 | $ | 1,005,622,748 | $ | 327,218,057 | $ | 401,843,374 | ||||||||
Undistributed accumulated net investment income (loss) | $ | 10,157,798 | $ | 7,544,244 | $ | 1,749,939 | $ | 1,891,375 | ||||||||
| The accompanying notes are an integral part of these financial statements. | (continued on p. 187) |
| AQR Funds | Annual Report | September 2016 | ||||||||||||||
186
| Statements of Changes in Net Assets | September 30, 2016 |
AQR LARGE CAP MOMENTUM STYLE FUND | AQR SMALL CAP MOMENTUM STYLE FUND | |||||||||||||||
| FOR THE YEAR ENDED SEPTEMBER 30, 2016 | FOR THE YEAR ENDED SEPTEMBER 30, 2015 | FOR THE YEAR ENDED SEPTEMBER 30, 2016 | FOR THE YEAR ENDED SEPTEMBER 30, 2015 | |||||||||||||
| CHANGES IN SHARES OUTSTANDING: | ||||||||||||||||
| CLASS I (a) | ||||||||||||||||
Shares outstanding, beginning of period | 43,794,416 | 43,544,682 | 16,557,893 | 14,280,666 | ||||||||||||
Shares sold | 8,413,669 | 9,913,694 | 3,530,297 | 7,627,885 | ||||||||||||
Shares issued on reinvestment of distributions | 3,643,522 | 4,352,105 | 197,151 | 1,676,344 | ||||||||||||
Shares redeemed | (15,692,844 | ) | (14,016,065 | ) | (5,038,113 | ) | (7,027,002 | ) | ||||||||
Shares outstanding, end of period | 40,158,763 | 43,794,416 | 15,247,228 | 16,557,893 | ||||||||||||
| CLASS N | ||||||||||||||||
Shares outstanding, beginning of period | 3,440,002 | 3,628,327 | 431,529 | 342,381 | ||||||||||||
Shares sold | 820,756 | 775,166 | 149,541 | 122,447 | ||||||||||||
Shares issued on reinvestment of distributions | 268,699 | 348,952 | 4,190 | 41,282 | ||||||||||||
Shares redeemed | (1,706,276 | ) | (1,312,443 | ) | (509,155 | ) | (74,581 | ) | ||||||||
Shares outstanding, end of period | 2,823,181 | 3,440,002 | 76,105 | 431,529 | ||||||||||||
| CLASS R6 | ||||||||||||||||
Shares outstanding, beginning of period | 3,158,235 | 5,987 | 4,056,213 | 4,529 | ||||||||||||
Shares sold | 1,254,740 | 3,496,747 | 473,650 | 4,213,475 | ||||||||||||
Shares issued on reinvestment of distributions | 283,438 | 1,954 | 8,069 | 1,251 | ||||||||||||
Shares redeemed | (1,800,610 | ) | (346,453 | ) | (4,129,242 | ) | (163,042 | ) | ||||||||
Shares outstanding, end of period | 2,895,803 | 3,158,235 | 408,690 | 4,056,213 | ||||||||||||
| (a) | Effective April 1, 2015, Class L Shares were renamed Class I Shares. |
| The accompanying notes are an integral part of these financial statements. |
| AQR Funds | Annual Report | September 2016 | ||||||||||||||
187
| Statements of Changes in Net Assets | September 30, 2016 |
AQR INTERNATIONAL MOMENTUM STYLE FUND | AQR EMERGING MOMENTUM STYLE FUND | |||||||||||||||
| FOR THE YEAR ENDED SEPTEMBER 30, 2016 | FOR THE YEAR ENDED SEPTEMBER 30, 2015 | FOR THE YEAR ENDED SEPTEMBER 30, 2016 | FOR THE YEAR ENDED SEPTEMBER 30, 2015 | |||||||||||||
| OPERATIONS: | ||||||||||||||||
Net investment income (loss) | $ | 6,255,753 | $ | 6,496,457 | $ | 118,560 | $ | 181,332 | ||||||||
Net realized gain (loss) | (17,740,594 | ) | (20,031,827 | ) | (1,417,522 | ) | (1,222,390 | ) | ||||||||
Net change in unrealized appreciation (depreciation) | 32,248,324 | (15,530,299 | ) | 2,322,454 | (762,821 | ) | ||||||||||
Net increase (decrease) in net assets resulting from operations | 20,763,483 | (29,065,669 | ) | 1,023,492 | (1,803,879 | ) | ||||||||||
| DISTRIBUTIONS TO SHAREHOLDERS: | ||||||||||||||||
| Net investment income: | ||||||||||||||||
Class I | (4,299,494 | ) | (5,801,763 | ) | (182,437 | ) | (65,400 | ) | ||||||||
Class N | (446,579 | ) | (766,472 | ) | (25,974 | ) | (8,023 | ) | ||||||||
Class R6 | (549,818 | ) | (2,173 | ) | (7,466 | ) | (894 | ) | ||||||||
Total | (5,295,891 | ) | (6,570,408 | ) | (215,877 | ) | (74,317 | ) | ||||||||
| Net realized gain: | ||||||||||||||||
Class I | — | (3,099,138 | ) | — | — | |||||||||||
Class N | — | (466,349 | ) | — | — | |||||||||||
Class R6 | — | (1,071 | ) | — | — | |||||||||||
Total | — | (3,566,558 | ) | — | — | |||||||||||
Total distributions | (5,295,891 | ) | (10,136,966 | ) | (215,877 | ) | (74,317 | ) | ||||||||
| CAPITAL TRANSACTIONS: | ||||||||||||||||
| CLASS I (a) | ||||||||||||||||
Proceeds from shares sold | 62,967,813 | 97,248,698 | 3,221,843 | 4,293,630 | ||||||||||||
Reinvestment of distributions | 4,297,414 | 8,899,111 | 182,437 | 65,400 | ||||||||||||
Cost of shares redeemed | (65,008,082 | ) | (96,079,086 | ) | (1,868,461 | ) | (2,372,015 | ) | ||||||||
Net increase (decrease) from capital transactions | 2,257,145 | 10,068,723 | 1,535,819 | 1,987,015 | ||||||||||||
| CLASS N | ||||||||||||||||
Proceeds from shares sold | 5,428,425 | 7,066,299 | 589,906 | 378,938 | ||||||||||||
Reinvestment of distributions | 446,579 | 1,232,821 | 25,974 | 8,023 | ||||||||||||
Cost of shares redeemed | (12,243,981 | ) | (8,527,367 | ) | (733,943 | ) | (63,400 | ) | ||||||||
Net increase (decrease) from capital transactions | (6,368,977 | ) | (228,247 | ) | (118,063 | ) | 323,561 | |||||||||
| CLASS R6 | ||||||||||||||||
Proceeds from shares sold | 14,099,786 | 35,571,124 | 978,729 | 1,370 | ||||||||||||
Reinvestment of distributions | 549,818 | 3,244 | 7,466 | 894 | ||||||||||||
Cost of shares redeemed | (11,819,504 | ) | (2,500,800 | ) | (207,501 | ) | — | |||||||||
Net increase (decrease) from capital transactions | 2,830,100 | 33,073,568 | 778,694 | 2,264 | ||||||||||||
| Net increase (decrease) in net assets resulting from capital transactions | (1,281,732 | ) | 42,914,044 | 2,196,450 | 2,312,840 | |||||||||||
Total increase (decrease) in net assets | 14,185,860 | 3,711,409 | 3,004,065 | 434,644 | ||||||||||||
| NET ASSETS: | ||||||||||||||||
Beginning of period | 323,699,951 | 319,988,542 | 7,823,364 | 7,388,720 | ||||||||||||
End of period | $ | 337,885,811 | $ | 323,699,951 | $ | 10,827,429 | $ | 7,823,364 | ||||||||
Undistributed accumulated net investment income (loss) | $ | 6,620,395 | $ | 4,894,430 | $ | 81,620 | $ | 165,138 | ||||||||
| The accompanying notes are an integral part of these financial statements. | (continued on p. 189) |
| AQR Funds | Annual Report | September 2016 | ||||||||||||||
188
| Statements of Changes in Net Assets | September 30, 2016 |
AQR INTERNATIONAL MOMENTUM STYLE FUND | AQR EMERGING MOMENTUM STYLE FUND | |||||||||||||||
| FOR THE YEAR ENDED SEPTEMBER 30, 2016 | FOR THE YEAR ENDED SEPTEMBER 30, 2015 | FOR THE YEAR ENDED SEPTEMBER 30, 2016 | FOR THE YEAR ENDED SEPTEMBER 30, 2015 | |||||||||||||
| CHANGES IN SHARES OUTSTANDING: | ||||||||||||||||
| CLASS I (a) | ||||||||||||||||
Shares outstanding, beginning of period | 19,429,009 | 18,723,227 | 797,764 | 625,023 | ||||||||||||
Shares sold | 4,707,160 | 6,823,888 | 414,462 | 424,961 | ||||||||||||
Shares issued on reinvestment of distributions | 318,799 | 637,472 | 22,607 | 6,877 | ||||||||||||
Shares redeemed | (4,827,196 | ) | (6,755,578 | ) | (231,449 | ) | (259,097 | ) | ||||||||
Shares outstanding, end of period | 19,627,772 | 19,429,009 | 1,003,384 | 797,764 | ||||||||||||
| CLASS N | ||||||||||||||||
Shares outstanding, beginning of period | 2,678,581 | 2,690,049 | 136,798 | 103,336 | ||||||||||||
Shares sold | 410,919 | 497,298 | 75,999 | 39,542 | ||||||||||||
Shares issued on reinvestment of distributions | 33,178 | 88,501 | 3,215 | 844 | ||||||||||||
Shares redeemed | (915,078 | ) | (597,267 | ) | (89,547 | ) | (6,924 | ) | ||||||||
Shares outstanding, end of period | 2,207,600 | 2,678,581 | 126,465 | 136,798 | ||||||||||||
| CLASS R6 | ||||||||||||||||
Shares outstanding, beginning of period | 2,346,761 | 6,435 | 9,662 | 9,407 | ||||||||||||
Shares sold | 1,051,223 | 2,511,328 | 124,721 | 161 | ||||||||||||
Shares issued on reinvestment of distributions | 40,849 | 233 | 925 | 94 | ||||||||||||
Shares redeemed | (883,477 | ) | (171,235 | ) | (28,250 | ) | — | |||||||||
Shares outstanding, end of period | 2,555,356 | 2,346,761 | 107,058 | 9,662 | ||||||||||||
| (a) | Effective April 1, 2015, Class L Shares were renamed Class I Shares. |
| The accompanying notes are an integral part of these financial statements. |
| AQR Funds | Annual Report | September 2016 | ||||||||||||||
189
| Statements of Changes in Net Assets | September 30, 2016 |
AQR TM LARGE CAP MOMENTUM STYLE FUND | AQR TM SMALL CAP MOMENTUM STYLE FUND | |||||||||||||||
| FOR THE YEAR ENDED SEPTEMBER 30, 2016 | FOR THE YEAR ENDED SEPTEMBER 30, 2015 | FOR THE YEAR ENDED SEPTEMBER 30, 2016 | FOR THE YEAR ENDED SEPTEMBER 30, 2015 | |||||||||||||
| OPERATIONS: | ||||||||||||||||
Net investment income (loss) | $ | 2,020,859 | $ | 1,390,660 | $ | 224,018 | $ | 131,332 | ||||||||
Net realized gain (loss) | (1,907,325 | ) | (1,325,195 | ) | (508,214 | ) | (175,799 | ) | ||||||||
Net change in unrealized appreciation (depreciation) | 13,519,533 | (783,566 | ) | 3,235,528 | 26,802 | |||||||||||
Net increase (decrease) in net assets resulting from operations | 13,633,067 | (718,101 | ) | 2,951,332 | (17,665 | ) | ||||||||||
| DISTRIBUTIONS TO SHAREHOLDERS: | ||||||||||||||||
| Net investment income: | ||||||||||||||||
Class I | (560,699 | ) | (570,768 | ) | (152,199 | ) | (14,503 | ) | ||||||||
Class N | (1,335 | ) | (366 | ) | (815 | ) | — | |||||||||
Class R6 | (853,432 | ) | (587 | ) | (1,020 | ) | (257 | ) | ||||||||
Total | (1,415,466 | ) | (571,721 | ) | (154,034 | ) | (14,760 | ) | ||||||||
| Net realized gain: | ||||||||||||||||
Class I | — | (1,895,534 | ) | — | (537,085 | ) | ||||||||||
Class N | — | (2,336 | ) | — | (4,583 | ) | ||||||||||
Class R6 | — | (1,710 | ) | — | (3,495 | ) | ||||||||||
Total | — | (1,899,580 | ) | — | (545,163 | ) | ||||||||||
Total distributions | (1,415,466 | ) | (2,471,301 | ) | (154,034 | ) | (559,923 | ) | ||||||||
| CAPITAL TRANSACTIONS: | ||||||||||||||||
| CLASS I (a) | ||||||||||||||||
Proceeds from shares sold | 22,821,824 | 46,249,904 | 19,666,884 | 13,596,226 | ||||||||||||
Reinvestment of distributions | 559,771 | 2,465,957 | 152,199 | 551,580 | ||||||||||||
Cost of shares redeemed | (17,607,554 | ) | (94,078,583 | ) | (9,353,481 | ) | (8,271,400 | ) | ||||||||
Net increase (decrease) from capital transactions | 5,774,041 | (45,362,722 | ) | 10,465,602 | 5,876,406 | |||||||||||
| CLASS N | ||||||||||||||||
Proceeds from shares sold | 11,765 | 59,000 | 35,649 | — | ||||||||||||
Reinvestment of distributions | 1,335 | 2,702 | 815 | 4,583 | ||||||||||||
Cost of shares redeemed | (12,929 | ) | (48,058 | ) | (20,665 | ) | — | |||||||||
Net increase (decrease) from capital transactions | 171 | 13,644 | 15,799 | 4,583 | ||||||||||||
| CLASS R6 | ||||||||||||||||
Proceeds from shares sold | 22,497,954 | 86,282,195 | 61,871 | — | ||||||||||||
Reinvestment of distributions | 853,432 | 2,297 | 1,020 | 3,752 | ||||||||||||
Cost of shares redeemed | (20,079,953 | ) | (12,835,621 | ) | (9,574 | ) | — | |||||||||
Net increase (decrease) from capital transactions | 3,271,433 | 73,448,871 | 53,317 | 3,752 | ||||||||||||
| Net increase (decrease) in net assets resulting from capital transactions | 9,045,645 | 28,099,793 | 10,534,718 | 5,884,741 | ||||||||||||
Total increase (decrease) in net assets | 21,263,246 | 24,910,391 | 13,332,016 | 5,307,153 | ||||||||||||
| NET ASSETS: | ||||||||||||||||
Beginning of period | 126,484,671 | 101,574,280 | 20,216,688 | 14,909,535 | ||||||||||||
End of period | $ | 147,747,917 | $ | 126,484,671 | $ | 33,548,704 | $ | 20,216,688 | ||||||||
Undistributed accumulated net investment income (loss) | $ | 1,603,587 | $ | 1,077,518 | $ | 165,887 | $ | 108,541 | ||||||||
| The accompanying notes are an integral part of these financial statements. | (continued on p. 191) |
| AQR Funds | Annual Report | September 2016 | ||||||||||||||
190
| Statements of Changes in Net Assets | September 30, 2016 |
AQR TM LARGE CAP MOMENTUM STYLE FUND | AQR TM SMALL CAP MOMENTUM STYLE FUND | |||||||||||||||
| FOR THE YEAR ENDED SEPTEMBER 30, 2016 | FOR THE YEAR ENDED SEPTEMBER 30, 2015 | FOR THE YEAR ENDED SEPTEMBER 30, 2016 | FOR THE YEAR ENDED SEPTEMBER 30, 2015 | |||||||||||||
| CHANGES IN SHARES OUTSTANDING: | ||||||||||||||||
| CLASS I (a) | ||||||||||||||||
Shares outstanding, beginning of period | 3,613,144 | 6,375,044 | 1,377,919 | 998,131 | ||||||||||||
Shares sold | 1,410,988 | 2,855,438 | 1,356,767 | 875,065 | ||||||||||||
Shares issued on reinvestment of distributions | 34,321 | 151,565 | 10,174 | 35,910 | ||||||||||||
Shares redeemed | (1,086,763 | ) | (5,768,903 | ) | (649,944 | ) | (531,187 | ) | ||||||||
Shares outstanding, end of period | 3,971,690 | 3,613,144 | 2,094,916 | 1,377,919 | ||||||||||||
| CLASS N | ||||||||||||||||
Shares outstanding, beginning of period | 9,457 | 8,660 | 8,788 | 8,489 | ||||||||||||
Shares sold | 760 | 3,546 | 2,361 | — | ||||||||||||
Shares issued on reinvestment of distributions | 82 | 166 | 55 | 299 | ||||||||||||
Shares redeemed | (761 | ) | (2,915 | ) | (1,440 | ) | — | |||||||||
Shares outstanding, end of period | 9,538 | 9,457 | 9,764 | 8,788 | ||||||||||||
| CLASS R6 | ||||||||||||||||
Shares outstanding, beginning of period | 4,517,716 | 6,337 | 6,717 | 6,472 | ||||||||||||
Shares sold | 1,409,409 | 5,283,178 | 4,295 | — | ||||||||||||
Shares issued on reinvestment of distributions | 52,422 | 141 | 68 | 245 | ||||||||||||
Shares redeemed | (1,248,682 | ) | (771,940 | ) | (628 | ) | — | |||||||||
Shares outstanding, end of period | 4,730,865 | 4,517,716 | 10,452 | 6,717 | ||||||||||||
| (a) | Effective April 1, 2015, Class L Shares were renamed Class I Shares. |
| The accompanying notes are an integral part of these financial statements. |
| AQR Funds | Annual Report | September 2016 | ||||||||||||||
191
| Statements of Changes in Net Assets | September 30, 2016 |
AQR TM INTERNATIONAL MOMENTUM STYLE FUND | AQR LARGE CAP DEFENSIVE STYLE FUND | |||||||||||||||
| FOR THE YEAR ENDED SEPTEMBER 30, 2016 | FOR THE YEAR ENDED SEPTEMBER 30, 2015 | FOR THE YEAR ENDED SEPTEMBER 30, 2016 | FOR THE YEAR ENDED SEPTEMBER 30, 2015 | |||||||||||||
| OPERATIONS: | ||||||||||||||||
Net investment income (loss) | $ | 1,643,310 | $ | 1,282,003 | $ | 9,839,351 | $ | 3,034,473 | ||||||||
Net realized gain (loss) | (4,919,205 | ) | (6,843,718 | ) | 5,138,616 | 17,594,621 | ||||||||||
Net change in unrealized appreciation (depreciation) | 8,344,298 | (1,536,690 | ) | 51,359,438 | 267,210 | |||||||||||
Net increase (decrease) in net assets resulting from operations | 5,068,403 | (7,098,405 | ) | 66,337,405 | 20,896,304 | |||||||||||
| DISTRIBUTIONS TO SHAREHOLDERS: | ||||||||||||||||
| Net investment income: | ||||||||||||||||
Class I | (284,457 | ) | (1,175,400 | ) | (2,142,472 | ) | (3,243,005 | ) | ||||||||
Class N | (1,787 | ) | (1,938 | ) | (528,218 | ) | (320,128 | ) | ||||||||
Class R6 | (826,613 | ) | (1,973 | ) | (591,390 | ) | (2,267 | ) | ||||||||
Total | (1,112,857 | ) | (1,179,311 | ) | (3,262,080 | ) | (3,565,400 | ) | ||||||||
| Net realized gain: | ||||||||||||||||
Class I | — | (271,071 | ) | (11,772,261 | ) | (4,763,948 | ) | |||||||||
Class N | — | (502 | ) | (3,153,506 | ) | (581,240 | ) | |||||||||
Class R6 | — | (428 | ) | (2,966,065 | ) | (2,984 | ) | |||||||||
Total | — | (272,001 | ) | (17,891,832 | ) | (5,348,172 | ) | |||||||||
Total distributions | (1,112,857 | ) | (1,451,312 | ) | (21,153,912 | ) | (8,913,572 | ) | ||||||||
| CAPITAL TRANSACTIONS: | ||||||||||||||||
| CLASS I (a) | ||||||||||||||||
Proceeds from shares sold | 18,384,546 | 34,627,692 | 465,741,590 | 86,200,229 | ||||||||||||
Reinvestment of distributions | 284,457 | 1,446,199 | 13,906,906 | 8,002,469 | ||||||||||||
Cost of shares redeemed | (9,939,845 | ) | (88,358,791 | ) | (141,910,504 | ) | (171,466,612 | ) | ||||||||
Net increase (decrease) from capital transactions | 8,729,158 | (52,284,900 | ) | 337,737,992 | (77,263,914 | ) | ||||||||||
| CLASS N | ||||||||||||||||
Proceeds from shares sold | 64,921 | — | 252,592,188 | 26,517,517 | ||||||||||||
Reinvestment of distributions | 1,787 | 2,440 | 3,681,724 | 901,368 | ||||||||||||
Cost of shares redeemed | (14,300 | ) | — | (72,065,267 | ) | (26,705,671 | ) | |||||||||
Net increase (decrease) from capital transactions | 52,408 | 2,440 | 184,208,645 | 713,214 | ||||||||||||
| CLASS R6 | ||||||||||||||||
Proceeds from shares sold | 28,713,881 | 58,393,918 | 133,569,139 | — | ||||||||||||
Reinvestment of distributions | 826,613 | 2,401 | 3,557,455 | 5,251 | ||||||||||||
Cost of shares redeemed | (24,296,080 | ) | (7,591,717 | ) | (20,148,273 | ) | — | |||||||||
Net increase (decrease) from capital transactions | 5,244,414 | 50,804,602 | 116,978,321 | 5,251 | ||||||||||||
| Net increase (decrease) in net assets resulting from capital transactions | 14,025,980 | (1,477,858 | ) | 638,924,958 | (76,545,449 | ) | ||||||||||
Total increase (decrease) in net assets | 17,981,526 | (10,027,575 | ) | 684,108,451 | (64,562,717 | ) | ||||||||||
| NET ASSETS: | ||||||||||||||||
Beginning of period | 71,804,764 | 81,832,339 | 189,206,310 | 253,769,027 | ||||||||||||
End of period | $ | 89,786,290 | $ | 71,804,764 | $ | 873,314,761 | $ | 189,206,310 | ||||||||
Undistributed accumulated net investment income (loss) | $ | 1,645,428 | $ | 1,024,613 | $ | 8,653,953 | $ | 2,088,036 | ||||||||
| The accompanying notes are an integral part of these financial statements. | (continued on p. 193) |
| AQR Funds | Annual Report | September 2016 | ||||||||||||||
192
| Statements of Changes in Net Assets | September 30, 2016 |
AQR TM INTERNATIONAL MOMENTUM STYLE FUND | AQR LARGE CAP DEFENSIVE STYLE FUND | |||||||||||||||
| FOR THE YEAR ENDED SEPTEMBER 30, 2016 | FOR THE YEAR ENDED SEPTEMBER 30, 2015 | FOR THE YEAR ENDED SEPTEMBER 30, 2016 | FOR THE YEAR ENDED SEPTEMBER 30, 2015 | |||||||||||||
| CHANGES IN SHARES OUTSTANDING: | ||||||||||||||||
| CLASS I (a) | ||||||||||||||||
Shares outstanding, beginning of period | 2,026,170 | 6,235,784 | 10,821,982 | 15,984,434 | ||||||||||||
Shares sold | 1,558,631 | 2,765,327 | 30,720,567 | 5,842,476 | ||||||||||||
Shares issued on reinvestment of distributions | 23,724 | 117,101 | 967,774 | 551,514 | ||||||||||||
Shares redeemed | (846,082 | ) | (7,092,042 | ) | (9,419,610 | ) | (11,556,442 | ) | ||||||||
Shares outstanding, end of period | 2,762,443 | 2,026,170 | 33,090,713 | 10,821,982 | ||||||||||||
| CLASS N | ||||||||||||||||
Shares outstanding, beginning of period | 8,782 | 8,584 | 2,092,861 | 2,054,040 | ||||||||||||
Shares sold | 5,391 | — | 16,757,391 | 1,775,969 | ||||||||||||
Shares issued on reinvestment of distributions | 150 | 198 | 256,209 | 62,035 | ||||||||||||
Shares redeemed | (1,218 | ) | — | (4,688,311 | ) | (1,799,183 | ) | |||||||||
Shares outstanding, end of period | 13,105 | 8,782 | 14,418,150 | 2,092,861 | ||||||||||||
| CLASS R6 | ||||||||||||||||
Shares outstanding, beginning of period | 4,102,795 | 7,321 | 7,440 | 7,077 | ||||||||||||
Shares sold | 2,438,316 | 4,688,648 | 9,221,194 | — | ||||||||||||
Shares issued on reinvestment of distributions | 69,173 | 194 | 248,079 | 363 | ||||||||||||
Shares redeemed | (2,057,678 | ) | (593,368 | ) | (1,362,482 | ) | — | |||||||||
Shares outstanding, end of period | 4,552,606 | 4,102,795 | 8,114,231 | 7,440 | ||||||||||||
| (a) | Effective April 1, 2015, Class L Shares were renamed Class I Shares for AQR TM International Momentum Style Fund. |
| The accompanying notes are an integral part of these financial statements. |
| AQR Funds | Annual Report | September 2016 | ||||||||||||||
193
| Statements of Changes in Net Assets | September 30, 2016 |
| AQR INTERNATIONAL DEFENSIVE STYLE FUND | AQR EMERGING DEFENSIVE STYLE FUND | |||||||||||||||
| FOR THE YEAR ENDED SEPTEMBER 30, 2016 | FOR THE YEAR ENDED SEPTEMBER 30, 2015 | FOR THE YEAR ENDED SEPTEMBER 30, 2016 | FOR THE YEAR ENDED SEPTEMBER 30, 2015 | |||||||||||||
| OPERATIONS: | ||||||||||||||||
Net investment income (loss) | $ | 1,813,836 | $ | 761,962 | $ | 774,027 | $ | 1,342,996 | ||||||||
Net realized gain (loss) | (271,740 | ) | (542,246 | ) | (1,278,297 | ) | (8,718,405 | ) | ||||||||
Net change in unrealized appreciation (depreciation) | 6,850,920 | (2,713,287 | ) | 5,123,132 | (4,655,925 | ) | ||||||||||
Net increase (decrease) in net assets resulting from operations | 8,393,016 | (2,493,571 | ) | 4,618,862 | (12,031,334 | ) | ||||||||||
| DISTRIBUTIONS TO SHAREHOLDERS: | ||||||||||||||||
| Net investment income: | ||||||||||||||||
Class I | (763,796 | ) | (709,481 | ) | (1,068,331 | ) | (1,397,556 | ) | ||||||||
Class N | (2,117 | ) | — | (1,572 | ) | — | ||||||||||
Class R6 | (1,972 | ) | (2,619 | ) | (2,585 | ) | (1,702 | ) | ||||||||
Total | (767,885 | ) | (712,100 | ) | (1,072,488 | ) | (1,399,258 | ) | ||||||||
| Net realized gain: | ||||||||||||||||
Class I | — | (631,276 | ) | — | — | |||||||||||
Class N | — | (3,943 | ) | — | — | |||||||||||
Class R6 | — | (2,162 | ) | — | — | |||||||||||
Total | — | (637,381 | ) | — | — | |||||||||||
Total distributions | (767,885 | ) | (1,349,481 | ) | (1,072,488 | ) | (1,399,258 | ) | ||||||||
| CAPITAL TRANSACTIONS: | ||||||||||||||||
| CLASS I | ||||||||||||||||
Proceeds from shares sold | 64,153,655 | 17,136,089 | 27,630,236 | 52,553,380 | ||||||||||||
Reinvestment of distributions | 763,231 | 1,337,505 | 1,060,287 | 1,392,152 | ||||||||||||
Cost of shares redeemed | (8,454,631 | ) | (7,791,797 | ) | (9,817,446 | ) | (83,482,698 | ) | ||||||||
Net increase (decrease) from capital transactions | 56,462,255 | 10,681,797 | 18,873,077 | (29,537,166 | ) | |||||||||||
| CLASS N | ||||||||||||||||
Proceeds from shares sold | 20,760,013 | 40,193 | 633,630 | 17,599 | ||||||||||||
Reinvestment of distributions | 2,117 | 3,943 | 1,572 | — | ||||||||||||
Cost of shares redeemed | (465,768 | ) | (339,848 | ) | (487,514 | ) | (882,569 | ) | ||||||||
Net increase (decrease) from capital transactions | 20,296,362 | (295,712 | ) | 147,688 | (864,970 | ) | ||||||||||
| CLASS R6 | ||||||||||||||||
Proceeds from shares sold | 17,495,519 | — | 146,181 | — | ||||||||||||
Reinvestment of distributions | 1,972 | 4,781 | 2,585 | 1,702 | ||||||||||||
Cost of shares redeemed | (3,654,467 | ) | — | (56,356 | ) | — | ||||||||||
Net increase (decrease) from capital transactions | 13,843,024 | 4,781 | 92,410 | 1,702 | ||||||||||||
| Net increase (decrease) in net assets resulting from capital transactions | 90,601,641 | 10,390,866 | 19,113,175 | (30,400,434 | ) | |||||||||||
Total increase (decrease) in net assets | 98,226,772 | 6,547,814 | 22,659,549 | (43,831,026 | ) | |||||||||||
| NET ASSETS: | ||||||||||||||||
Beginning of period | 34,420,600 | 27,872,786 | 27,349,573 | 71,180,599 | ||||||||||||
End of period | $ | 132,647,372 | $ | 34,420,600 | $ | 50,009,122 | $ | 27,349,573 | ||||||||
Undistributed accumulated net investment income (loss) | $ | 1,526,390 | $ | 617,686 | $ | 717,058 | $ | 921,629 | ||||||||
| The accompanying notes are an integral part of these financial statements. | (continued on p. 195) |
| AQR Funds | Annual Report | September 2016 | ||||||||||||||
194
| Statements of Changes in Net Assets | September 30, 2016 |
| AQR INTERNATIONAL DEFENSIVE STYLE FUND | AQR EMERGING DEFENSIVE STYLE FUND | |||||||||||||||
| FOR THE YEAR ENDED SEPTEMBER 30, 2016 | FOR THE YEAR ENDED SEPTEMBER 30, 2015 | FOR THE YEAR ENDED SEPTEMBER 30, 2016 | FOR THE YEAR ENDED SEPTEMBER 30, 2015 | |||||||||||||
| CHANGES IN SHARES OUTSTANDING: | ||||||||||||||||
| CLASS I | ||||||||||||||||
Shares outstanding, beginning of period | 3,121,519 | 2,208,372 | 3,314,071 | 6,698,530 | ||||||||||||
Shares sold | 5,553,130 | 1,458,582 | 3,371,402 | 5,361,095 | ||||||||||||
Shares issued on reinvestment of distributions | 69,133 | 115,902 | 134,896 | 144,865 | ||||||||||||
Shares redeemed | (738,840 | ) | (661,337 | ) | (1,180,713 | ) | (8,890,419 | ) | ||||||||
Shares outstanding, end of period | 8,004,942 | 3,121,519 | 5,639,656 | 3,314,071 | ||||||||||||
| CLASS N | ||||||||||||||||
Shares outstanding, beginning of period | 12,556 | 37,419 | 6,419 | 97,323 | ||||||||||||
Shares sold | 1,730,261 | 3,258 | 73,524 | 1,781 | ||||||||||||
Shares issued on reinvestment of distributions | 187 | 333 | 195 | — | ||||||||||||
Shares redeemed | (38,195 | ) | (28,454 | ) | (57,177 | ) | (92,685 | ) | ||||||||
Shares outstanding, end of period | 1,704,809 | 12,556 | 22,961 | 6,419 | ||||||||||||
| CLASS R6 | ||||||||||||||||
Shares outstanding, beginning of period | 8,096 | 7,680 | 9,146 | 8,969 | ||||||||||||
Shares sold | 1,521,529 | — | 18,922 | — | ||||||||||||
Shares issued on reinvestment of distributions | 179 | 416 | 330 | 177 | ||||||||||||
Shares redeemed | (316,207 | ) | — | (6,693 | ) | — | ||||||||||
Shares outstanding, end of period | 1,213,597 | 8,096 | 21,705 | 9,146 | ||||||||||||
| The accompanying notes are an integral part of these financial statements. |
| AQR Funds | Annual Report | September 2016 | ||||||||||||||
195
| Statements of Changes in Net Assets | September 30, 2016 |
| AQR GLOBAL EQUITY FUND | AQR INTERNATIONAL EQUITY FUND | |||||||||||||||
| FOR THE YEAR ENDED SEPTEMBER 30, 2016 | FOR THE YEAR ENDED SEPTEMBER 30, 2015 | FOR THE YEAR ENDED SEPTEMBER 30, 2016 | FOR THE YEAR ENDED SEPTEMBER 30, 2015 | |||||||||||||
| OPERATIONS: | ||||||||||||||||
Net investment income (loss) | $ | 2,971,159 | $ | 5,680,257 | $ | 10,940,097 | $ | 16,785,802 | ||||||||
Net realized gain (loss) | 29,215,885 | 14,179,971 | 42,272,061 | (2,276,413 | ) | |||||||||||
Net change in unrealized appreciation (depreciation) | (7,560,125 | ) | (26,177,167 | ) | (8,355,868 | ) | (46,846,590 | ) | ||||||||
Net increase (decrease) in net assets resulting from operations | 24,626,919 | (6,316,939 | ) | 44,856,290 | (32,337,201 | ) | ||||||||||
| DISTRIBUTIONS TO SHAREHOLDERS: | ||||||||||||||||
| Net investment income: | ||||||||||||||||
Class I | (506,575 | ) | (44,059 | ) | (6,541,592 | ) | (7,468,588 | ) | ||||||||
Class N | (6,423 | ) | (33,397 | ) | (614,398 | ) | (1,067,058 | ) | ||||||||
Class R6 | (1,217,400 | ) | (1,362,728 | ) | (656,409 | ) | (3,120,675 | ) | ||||||||
Class Y | (3,414,898 | ) | (4,184,608 | ) | (8,051,362 | ) | (12,814,382 | ) | ||||||||
Total | (5,145,296 | ) | (5,624,792 | ) | (15,863,761 | ) | (24,470,703 | ) | ||||||||
| Net realized gain: | ||||||||||||||||
Class I | (1,816,068 | ) | (252,903 | ) | (3,956,397 | ) | (12,413,847 | ) | ||||||||
Class N | (43,077 | ) | (201,754 | ) | (441,881 | ) | (1,953,495 | ) | ||||||||
Class R6 | (4,517,439 | ) | (7,229,201 | ) | (382,785 | ) | (4,966,615 | ) | ||||||||
Class Y | (11,253,865 | ) | (20,189,254 | ) | (4,100,460 | ) | (19,017,323 | ) | ||||||||
Total | (17,630,449 | ) | (27,873,112 | ) | (8,881,523 | ) | (38,351,280 | ) | ||||||||
Total distributions | (22,775,745 | ) | (33,497,904 | ) | (24,745,284 | ) | (62,821,983 | ) | ||||||||
| CAPITAL TRANSACTIONS: | ||||||||||||||||
| CLASS I | ||||||||||||||||
Proceeds from shares sold | 2,993,256 | 36,134,787 | 128,184,249 | 152,854,438 | ||||||||||||
Reinvestment of distributions | 2,322,643 | 290,801 | 9,424,064 | 17,337,012 | ||||||||||||
Cost of shares redeemed | (7,758,323 | ) | (2,514,719 | ) | (108,490,777 | ) | (60,857,843 | ) | ||||||||
Net increase (decrease) from capital transactions | (2,442,424 | ) | 33,910,869 | 29,117,536 | 109,333,607 | |||||||||||
| CLASS N | ||||||||||||||||
Proceeds from shares sold | 978,266 | 1,427,222 | 6,615,072 | 8,515,077 | ||||||||||||
Reinvestment of distributions | 49,060 | 235,151 | 981,695 | 2,881,032 | ||||||||||||
Cost of shares redeemed | (192,346 | ) | (1,826,441 | ) | (8,603,919 | ) | (9,639,791 | ) | ||||||||
Net increase (decrease) from capital transactions | 834,980 | (164,068 | ) | (1,007,152 | ) | 1,756,318 | ||||||||||
| CLASS R6 | ||||||||||||||||
Proceeds from shares sold | 11,086,258 | 10,400,000 | 13,218,194 | 1,925,813 | ||||||||||||
Reinvestment of distributions | 5,734,839 | 8,591,929 | 1,039,194 | 8,087,290 | ||||||||||||
Cost of shares redeemed | (111,189 | ) | — | (724,458 | ) | (74,041,677 | ) | |||||||||
Cost of shares redeemed in kind (See Note 15) | — | — | (32,220,986 | ) | — | |||||||||||
Net increase (decrease) from capital transactions | 16,709,908 | 18,991,929 | (18,688,056 | ) | (64,028,574 | ) | ||||||||||
| CLASS Y (a) | ||||||||||||||||
Proceeds from shares sold | — | 2,812,030 | — | — | ||||||||||||
Reinvestment of distributions | 14,668,763 | 24,373,862 | 12,151,822 | 31,831,705 | ||||||||||||
Cost of shares redeemed | (122,861,157 | ) | (272,727 | ) | (1,143 | ) | (34,988,570 | ) | ||||||||
Cost of shares redeemed in kind (See Note 15) | (99,731,073 | ) | — | (358,280,995 | ) | — | ||||||||||
Redemption fees | 122,861 | 5,514 | — | 35,000 | ||||||||||||
Net increase (decrease) from capital transactions | (207,800,606 | ) | 26,918,679 | (346,130,316 | ) | (3,121,865 | ) | |||||||||
| Net increase (decrease) in net assets resulting from capital transactions | (192,698,142 | ) | 79,657,409 | (336,707,988 | ) | 43,939,486 | ||||||||||
| Total increase (decrease) in net assets | (190,846,968 | ) | 39,842,566 | (316,596,982 | ) | (51,219,698 | ) | |||||||||
| NET ASSETS: | ||||||||||||||||
Beginning of period | 332,145,158 | 292,302,592 | 738,811,050 | 790,030,748 | ||||||||||||
End of period | $ | 141,298,190 | $ | 332,145,158 | $ | 422,214,068 | $ | 738,811,050 | ||||||||
Undistributed accumulated net investment income (loss) | $ | 2,528,112 | $ | 4,287,622 | $ | 10,358,726 | $ | 12,683,216 | ||||||||
| The accompanying notes are an integral part of these financial statements. | (continued on p. 197) |
| AQR Funds | Annual Report | September 2016 | ||||||||||||||
196
| Statements of Changes in Net Assets | September 30, 2016 |
| AQR GLOBAL EQUITY FUND | AQR INTERNATIONAL EQUITY FUND | |||||||||||||||
| FOR THE YEAR ENDED SEPTEMBER 30, 2016 | FOR THE YEAR ENDED SEPTEMBER 30, 2015 | FOR THE YEAR ENDED SEPTEMBER 30, 2016 | FOR THE YEAR ENDED SEPTEMBER 30, 2015 | |||||||||||||
| CHANGES IN SHARES OUTSTANDING: | ||||||||||||||||
| CLASS I | ||||||||||||||||
Shares outstanding, beginning of period | 4,380,799 | 279,524 | 33,377,117 | 22,556,156 | ||||||||||||
Shares sold | 391,296 | 4,367,231 | 13,308,235 | 14,903,085 | ||||||||||||
Shares issued on reinvestment of distributions | 302,087 | 35,946 | 985,781 | 1,742,414 | ||||||||||||
Shares redeemed | (1,007,057 | ) | (301,902 | ) | (11,225,051 | ) | (5,824,538 | ) | ||||||||
Shares outstanding, end of period | 4,067,125 | 4,380,799 | 36,446,082 | 33,377,117 | ||||||||||||
| CLASS N | ||||||||||||||||
Shares outstanding, beginning of period | 98,923 | 127,426 | 3,703,495 | 3,527,546 | ||||||||||||
Shares sold | 131,671 | 162,394 | 673,280 | 801,790 | ||||||||||||
Shares issued on reinvestment of distributions | 6,405 | 29,284 | 100,790 | 284,406 | ||||||||||||
Shares redeemed | (24,998 | ) | (220,181 | ) | (872,768 | ) | (910,247 | ) | ||||||||
Shares outstanding, end of period | 212,001 | 98,923 | 3,604,797 | 3,703,495 | ||||||||||||
| CLASS R6 | ||||||||||||||||
Shares outstanding, beginning of period | 10,836,304 | 8,489,461 | 3,212,966 | 8,984,668 | ||||||||||||
Shares sold | 1,460,127 | 1,288,724 | 1,283,890 | 183,148 | ||||||||||||
Shares issued on reinvestment of distributions | 741,067 | 1,058,119 | 102,687 | 770,218 | ||||||||||||
Shares redeemed | (14,255 | ) | — | (70,839 | ) | (6,725,068 | ) | |||||||||
Shares redeemed in kind (See Note 15) | — | — | (3,192,820 | ) | — | |||||||||||
Shares outstanding, end of period | 13,023,243 | 10,836,304 | 1,335,884 | 3,212,966 | ||||||||||||
| CLASS Y (a) | ||||||||||||||||
Shares outstanding, beginning of period | 26,995,455 | 23,708,830 | 34,301,988 | 34,443,561 | ||||||||||||
Shares sold | — | 322,420 | — | — | ||||||||||||
Shares issued on reinvestment of distributions | 1,895,655 | 2,998,015 | 1,201,960 | 3,031,591 | ||||||||||||
Shares redeemed | (15,768,729 | ) | (33,810 | ) | — | (3,173,164 | ) | |||||||||
Shares redeemed in kind (See Note 15) | (13,122,381 | ) | — | (35,503,948 | ) | — | ||||||||||
Shares outstanding, end of period | — | 26,995,455 | — | 34,301,988 | ||||||||||||
| (a) | Class Y closed on April 1, 2016 and May 9, 2016 for AQR International Equity Fund and AQR Global Equity Fund, respectively. |
| The accompanying notes are an integral part of these financial statements. |
| AQR Funds | Annual Report | September 2016 | ||||||||||||||
197
| Financial Highlights | September 30, 2016 |
| PER SHARE OPERATING PERFORMANCE | ||||||||||||||||||||||||||||
| Change in Net Assets Resulting from Operations1 | Less Dividends and Distributions | |||||||||||||||||||||||||||
| Net Asset Value, Beginning of Period | Net Investment Income (Loss) | Net Realized and Unrealized Gain (Loss) | Net Increase (Decrease) in Net Asset Value from Operations | Distributions from Net Investment Income | Distributions from Net Realized Gains | Total Distributions | ||||||||||||||||||||||
| AQR LARGE CAP MULTI-STYLE FUND CLASS I6 | ||||||||||||||||||||||||||||
| FOR THE YEAR ENDED SEPTEMBER 30, 2016 | $13.25 | 0.19 | 0.68 | 0.87 | (0.12) | (0.00) | 7 | (0.12) | ||||||||||||||||||||
| FOR THE YEAR ENDED SEPTEMBER 30, 2015 | $13.36 | 0.16 | (0.15) | 0.01 | (0.06) | (0.06) | (0.12) | |||||||||||||||||||||
| FOR THE YEAR ENDED SEPTEMBER 30, 2014 | $11.09 | 0.15 | 2.21 | 2.36 | (0.04) | (0.05) | (0.09) | |||||||||||||||||||||
| FOR THE PERIOD 3/26/138-9/30/13 | $10.00 | 0.06 | 9 | 1.03 | 1.09 | — | — | — | ||||||||||||||||||||
| AQR LARGE CAP MULTI-STYLE FUND CLASS N | ||||||||||||||||||||||||||||
| FOR THE YEAR ENDED SEPTEMBER 30, 2016 | $13.19 | 0.16 | 0.68 | 0.84 | (0.09) | (0.00) | 7 | (0.09) | ||||||||||||||||||||
| FOR THE YEAR ENDED SEPTEMBER 30, 2015 | $13.33 | 0.13 | (0.16) | (0.03) | (0.05) | (0.06) | (0.11) | |||||||||||||||||||||
| FOR THE YEAR ENDED SEPTEMBER 30, 2014 | $11.09 | 0.11 | 2.21 | 2.32 | (0.03) | (0.05) | (0.08) | |||||||||||||||||||||
| FOR THE PERIOD 3/26/138—9/30/13 | $10.00 | 0.04 | 9 | 1.05 | 1.09 | — | — | — | ||||||||||||||||||||
| AQR LARGE CAP MULTI-STYLE FUND CLASS R6 | ||||||||||||||||||||||||||||
| FOR THE YEAR ENDED SEPTEMBER 30, 2016 | $13.25 | 0.21 | 0.68 | 0.89 | (0.14) | (0.00) | 7 | (0.14) | ||||||||||||||||||||
| FOR THE YEAR ENDED SEPTEMBER 30, 2015 | $13.36 | 0.18 | (0.17) | 0.01 | (0.06) | (0.06) | (0.12) | |||||||||||||||||||||
| FOR THE PERIOD 7/10/1412—9/30/14 | $13.32 | 0.04 | 0.00 | 7 | 0.04 | — | — | — | ||||||||||||||||||||
| AQR SMALL CAP MULTI-STYLE FUND CLASS I6 | ||||||||||||||||||||||||||||
| FOR THE YEAR ENDED SEPTEMBER 30, 2016 | $12.30 | 0.13 | 1.56 | 1.69 | (0.03) | (0.00) | 7 | (0.03) | ||||||||||||||||||||
| FOR THE YEAR ENDED SEPTEMBER 30, 2015 | $12.34 | 0.12 | 13 | 0.02 | 14 | 0.14 | (0.03) | (0.15) | (0.18) | |||||||||||||||||||
| FOR THE YEAR ENDED SEPTEMBER 30, 2014 | $11.88 | 0.05 | 15 | 0.57 | 0.62 | (0.04) | (0.12) | (0.16) | ||||||||||||||||||||
| FOR THE PERIOD 3/26/138—9/30/13 | $10.00 | 0.03 | 9 | 1.85 | 1.88 | — | — | — | ||||||||||||||||||||
| AQR SMALL CAP MULTI-STYLE FUND CLASS N | ||||||||||||||||||||||||||||
| FOR THE YEAR ENDED SEPTEMBER 30, 2016 | $12.25 | 0.10 | 1.55 | 1.65 | (0.00) | 7 | (0.00) | 7 | (0.00) | 7 | ||||||||||||||||||
| FOR THE YEAR ENDED SEPTEMBER 30, 2015 | $12.30 | 0.09 | 13 | 0.01 | 14 | 0.10 | (0.00) | 7 | (0.15) | (0.15) | ||||||||||||||||||
| FOR THE YEAR ENDED SEPTEMBER 30, 2014 | $11.87 | 0.01 | 15 | 0.56 | 0.57 | (0.02) | (0.12) | (0.14) | ||||||||||||||||||||
| FOR THE PERIOD 3/26/138—9/30/13 | $10.00 | 0.01 | 9 | 1.86 | 1.87 | — | — | — | ||||||||||||||||||||
| AQR SMALL CAP MULTI-STYLE FUND CLASS R6 | ||||||||||||||||||||||||||||
| FOR THE YEAR ENDED SEPTEMBER 30, 2016 | $12.31 | 0.16 | 1.55 | 1.71 | (0.04) | (0.00) | 7 | (0.04) | ||||||||||||||||||||
| FOR THE YEAR ENDED SEPTEMBER 30, 2015 | $12.35 | 0.15 | 13 | 0.00 | 7,14 | 0.15 | (0.04) | (0.15) | (0.19) | |||||||||||||||||||
| FOR THE PERIOD 7/10/1412—9/30/14 | $12.95 | 0.01 | 15 | (0.61) | 14 | (0.60) | — | — | — | |||||||||||||||||||
| AQR INTERNATIONAL MULTI-STYLE FUND CLASS I6 | ||||||||||||||||||||||||||||
| FOR THE YEAR ENDED SEPTEMBER 30, 2016 | $10.21 | 0.26 | (0.09) | 0.17 | (0.15) | — | (0.15) | |||||||||||||||||||||
| FOR THE YEAR ENDED SEPTEMBER 30, 2015 | $11.47 | 0.27 | 13 | (1.26) | (0.99) | (0.19) | (0.08) | (0.27) | ||||||||||||||||||||
| FOR THE YEAR ENDED SEPTEMBER 30, 2014 | $11.28 | 0.28 | 0.01 | 14 | 0.29 | (0.10) | — | (0.10) | ||||||||||||||||||||
| FOR THE PERIOD 3/26/138—9/30/13 | $10.00 | 0.13 | 9 | 1.15 | 1.28 | — | — | — | ||||||||||||||||||||
| AQR INTERNATIONAL MULTI-STYLE FUND CLASS N | ||||||||||||||||||||||||||||
| FOR THE YEAR ENDED SEPTEMBER 30, 2016 | $10.20 | 0.23 | (0.10) | 0.13 | (0.13) | — | (0.13) | |||||||||||||||||||||
| FOR THE YEAR ENDED SEPTEMBER 30, 2015 | $11.44 | 0.24 | 13 | (1.25) | (1.01) | (0.15) | (0.08) | (0.23) | ||||||||||||||||||||
| FOR THE YEAR ENDED SEPTEMBER 30, 2014 | $11.27 | 0.24 | 0.01 | 14 | 0.25 | (0.08) | — | (0.08) | ||||||||||||||||||||
| FOR THE PERIOD 3/26/138—9/30/13 | $10.00 | 0.15 | 9 | 1.12 | 1.27 | — | — | — | ||||||||||||||||||||
| AQR INTERNATIONAL MULTI-STYLE FUND CLASS R6 | ||||||||||||||||||||||||||||
| FOR THE YEAR ENDED SEPTEMBER 30, 2016 | $10.20 | 0.25 | (0.07) | 0.18 | (0.16) | — | (0.16) | |||||||||||||||||||||
| FOR THE YEAR ENDED SEPTEMBER 30, 2015 | $11.47 | 0.30 | 13 | (1.28) | (0.98) | (0.21) | (0.08) | (0.29) | ||||||||||||||||||||
| FOR THE PERIOD 7/10/1412—9/30/14 | $11.94 | 0.13 | (0.60) | (0.47) | — | — | — | |||||||||||||||||||||
| The accompanying notes are an integral part of these financial statements. |
| AQR Funds | Annual Report | September 2016 | ||||||||||||||
198
| Financial Highlights | September 30, 2016 |
| RATIOS/SUPPLEMENTAL DATA | ||||||||||||||||||||||||||||||||||
| Ratios to Average Net Assets of:* | ||||||||||||||||||||||||||||||||||
| Net Asset Value, End of Period | Total Return2,3 | Net Assets, End of Period (000’s) | Expenses, Before Reimbursements and/or Waivers4 | Expenses, Net of Reimbursements and/or Waivers4 | Expenses, Net of Reimbursements and/or Waivers (Excluding Dividend Short Expense & Interest Expense)4 | Net Investment Income (Loss) | Portfolio Turnover Rate5 | |||||||||||||||||||||||||||
| $14.00 | 6.61 | % | $627,269 | 0.46 | % | 0.45 | % | 0.45 | % | 1.43 | % | 80 | % | |||||||||||||||||||||
| $13.25 | 0.03 | % | $490,709 | 0.54 | % | 0.49 | % | 0.49 | % | 1.17 | % | 59 | % | |||||||||||||||||||||
| $13.36 | 21.39 | % | $166,058 | 0.71 | % | 0.54 | % | 0.54 | % | 1.17 | % | 277 | % | |||||||||||||||||||||
| $11.09 | 10.90 | % | $18,811 | 1.80 | %10,11 | 0.54 | % | 0.54 | % | 1.09 | %9 | 223 | % | |||||||||||||||||||||
| $13.94 | 6.40 | % | $64,718 | 0.71 | % | 0.70 | % | 0.70 | % | 1.18 | % | 80 | % | |||||||||||||||||||||
| $13.19 | (0.25 | )% | $59,733 | 0.79 | % | 0.74 | % | 0.74 | % | 0.93 | % | 59 | % | |||||||||||||||||||||
| $13.33 | 21.05 | % | $10,328 | 1.14 | % | 0.79 | % | 0.79 | % | 0.90 | % | 277 | % | |||||||||||||||||||||
| $11.09 | 10.90 | % | $1,403 | 4.30 | %10,11 | 0.79 | % | 0.79 | % | 0.72 | %9 | 223 | % | |||||||||||||||||||||
| $14.00 | 6.71 | % | $792,665 | 0.37 | % | 0.35 | % | 0.35 | % | 1.52 | % | 80 | % | |||||||||||||||||||||
| $13.25 | 0.07 | % | $563,785 | 0.42 | % | 0.36 | % | 0.36 | % | 1.28 | % | 59 | % | |||||||||||||||||||||
| $13.36 | 0.30 | % | $42,256 | 0.61 | % | 0.44 | % | 0.44 | % | 1.23 | % | 277 | % | |||||||||||||||||||||
| $13.96 | 13.74 | % | $45,483 | 0.75 | % | 0.65 | % | 0.65 | % | 1.00 | % | 96 | % | |||||||||||||||||||||
| $12.30 | 1.02 | % | $26,634 | 1.17 | % | 0.68 | % | 0.68 | % | 0.88 | %13 | 228 | % | |||||||||||||||||||||
| $12.34 | 5.13 | % | $8,233 | 2.58 | % | 0.75 | % | 0.75 | % | 0.37 | %15 | 189 | % | |||||||||||||||||||||
| $11.88 | 18.80 | % | $2,184 | 5.84 | %10 | 0.75 | % | 0.75 | % | 0.45 | %9 | 70 | % | |||||||||||||||||||||
| $13.90 | 13.51 | % | $9,733 | 0.99 | % | 0.90 | % | 0.90 | % | 0.76 | % | 96 | % | |||||||||||||||||||||
| $12.25 | 0.72 | % | $5,681 | 1.40 | % | 0.93 | % | 0.93 | % | 0.65 | %13 | 228 | % | |||||||||||||||||||||
| $12.30 | 4.78 | % | $1,284 | 3.27 | % | 1.00 | % | 1.00 | % | 0.11 | %15 | 189 | % | |||||||||||||||||||||
| $11.87 | 18.70 | % | $1,381 | 6.40 | %10 | 1.00 | % | 1.00 | % | 0.17 | %9 | 70 | % | |||||||||||||||||||||
| $13.98 | 13.90 | % | $687,986 | 0.62 | % | 0.55 | % | 0.55 | % | 1.23 | % | 96 | % | |||||||||||||||||||||
| $12.31 | 1.06 | % | $9,494 | 0.96 | % | 0.55 | % | 0.55 | % | 1.17 | %13 | 228 | % | |||||||||||||||||||||
| $12.35 | (4.63 | )% | $95 | 2.34 | % | 0.65 | % | 0.65 | % | 0.45 | %15 | 189 | % | |||||||||||||||||||||
| $10.23 | 1.62 | % | $68,288 | 0.68 | % | 0.59 | % | 0.59 | % | 2.62 | % | 106 | % | |||||||||||||||||||||
| $10.21 | (8.78 | )% | $40,047 | 0.82 | % | 0.64 | % | 0.64 | % | 2.45 | %13 | 236 | % | |||||||||||||||||||||
| $11.47 | 2.53 | % | $26,729 | 1.38 | % | 0.70 | % | 0.70 | % | 2.36 | % | 204 | % | |||||||||||||||||||||
| $11.28 | 12.80 | % | $15,810 | 2.16 | %10 | 0.70 | % | 0.70 | % | 2.25 | %9 | 218 | % | |||||||||||||||||||||
| $10.20 | 1.28 | % | $8,491 | 0.93 | % | 0.85 | % | 0.85 | % | 2.32 | % | 106 | % | |||||||||||||||||||||
| $10.20 | (8.92 | )% | $4,142 | 1.06 | % | 0.88 | % | 0.88 | % | 2.19 | %13 | 236 | % | |||||||||||||||||||||
| $11.44 | 2.19 | % | $2,756 | 1.85 | % | 0.95 | % | 0.95 | % | 2.02 | % | 204 | % | |||||||||||||||||||||
| $11.27 | 12.70 | % | $2,154 | 4.10 | %10 | 0.95 | % | 0.95 | % | 2.65 | %9 | 218 | % | |||||||||||||||||||||
| $10.22 | 1.71 | % | $301,294 | 0.59 | % | 0.50 | % | 0.50 | % | 2.52 | % | 106 | % | |||||||||||||||||||||
| $10.20 | (8.68 | )% | $241,780 | 0.66 | % | 0.51 | % | 0.51 | % | 2.70 | %13 | 236 | % | |||||||||||||||||||||
| $11.47 | (3.94 | )% | $26,412 | 1.34 | % | 0.60 | % | 0.60 | % | 5.13 | % | 204 | % | |||||||||||||||||||||
| The accompanying notes are an integral part of these financial statements. |
| AQR Funds | Annual Report | September 2016 | ||||||||||||||
199
| Financial Highlights | September 30, 2016 |
| PER SHARE OPERATING PERFORMANCE | ||||||||||||||||||||||||||||
| Change in Net Assets Resulting from Operations1 | Less Dividends and Distributions | |||||||||||||||||||||||||||
| Net Asset Value, Beginning of Period | Net Investment Income (Loss) | Net Realized and Unrealized Gain (Loss) | Net Increase (Decrease) in Net Asset Value from Operations | Distributions from Net Investment Income | Distributions from Net Realized Gains | Total Distributions | ||||||||||||||||||||||
| AQR EMERGING MULTI-STYLE FUND CLASS I6 | ||||||||||||||||||||||||||||
| FOR THE YEAR ENDED SEPTEMBER 30, 2016 | $8.19 | 0.15 | 0.81 | 0.96 | (0.20) | — | (0.20) | |||||||||||||||||||||
| FOR THE YEAR ENDED SEPTEMBER 30, 2015 | $9.96 | 0.27 | (1.97) | (1.70) | (0.07) | — | (0.07) | |||||||||||||||||||||
| FOR THE PERIOD 5/13/148—9/30/14 | $10.00 | 0.14 | (0.18) | (0.04) | — | — | — | |||||||||||||||||||||
| AQR EMERGING MULTI-STYLE FUND CLASS N | ||||||||||||||||||||||||||||
| FOR THE YEAR ENDED SEPTEMBER 30, 2016 | $8.17 | 0.13 | 0.81 | 0.94 | (0.18) | — | (0.18) | |||||||||||||||||||||
| FOR THE YEAR ENDED SEPTEMBER 30, 2015 | $9.95 | 0.29 | (2.01) | (1.72) | (0.06) | — | (0.06) | |||||||||||||||||||||
| FOR THE PERIOD 5/13/148—9/30/14 | $10.00 | 0.14 | (0.19) | (0.05) | — | — | — | |||||||||||||||||||||
| AQR EMERGING MULTI-STYLE FUND CLASS R6 | ||||||||||||||||||||||||||||
| FOR THE YEAR ENDED SEPTEMBER 30, 2016 | $8.20 | 0.16 | 0.81 | 0.97 | (0.20) | — | (0.20) | |||||||||||||||||||||
| FOR THE YEAR ENDED SEPTEMBER 30, 2015 | $9.96 | 0.45 | (2.14) | (1.69) | (0.07) | — | (0.07) | |||||||||||||||||||||
| FOR THE PERIOD 7/10/1412—9/30/14 | $10.47 | 0.05 | (0.56) | (0.51) | — | — | — | |||||||||||||||||||||
| AQR TM LARGE CAP MULTI-STYLE FUND CLASS I6 | ||||||||||||||||||||||||||||
| FOR THE YEAR ENDED SEPTEMBER 30, 2016 | $9.42 | 0.15 | 0.49 | 0.64 | (0.05) | (0.01) | (0.06) | |||||||||||||||||||||
| FOR THE PERIOD 2/11/158—9/30/15 | $10.00 | 0.08 | (0.66) | (0.58) | — | — | — | |||||||||||||||||||||
| AQR TM LARGE CAP MULTI-STYLE FUND CLASS N | ||||||||||||||||||||||||||||
| FOR THE YEAR ENDED SEPTEMBER 30, 2016 | $9.40 | 0.13 | 0.48 | 0.61 | (0.03) | (0.01) | (0.04) | |||||||||||||||||||||
| FOR THE PERIOD 2/11/158—9/30/15 | $10.00 | 0.06 | (0.66) | (0.60) | — | — | — | |||||||||||||||||||||
| AQR TM LARGE CAP MULTI-STYLE FUND CLASS R6 | ||||||||||||||||||||||||||||
| FOR THE YEAR ENDED SEPTEMBER 30, 2016 | $9.42 | 0.16 | 0.49 | 0.65 | (0.05) | (0.01) | (0.06) | |||||||||||||||||||||
| FOR THE PERIOD 2/11/158—9/30/15 | $10.00 | 0.08 | (0.66) | (0.58) | — | — | — | |||||||||||||||||||||
| AQR TM SMALL CAP MULTI-STYLE FUND CLASS I6 | ||||||||||||||||||||||||||||
| FOR THE YEAR ENDED SEPTEMBER 30, 2016 | $9.21 | 0.12 | 16 | 1.04 | 1.16 | (0.06) | — | (0.06) | ||||||||||||||||||||
| FOR THE PERIOD 2/11/158—9/30/15 | $10.00 | 0.05 | (0.84) | (0.79) | — | — | — | |||||||||||||||||||||
| AQR TM SMALL CAP MULTI-STYLE FUND CLASS N | ||||||||||||||||||||||||||||
| FOR THE YEAR ENDED SEPTEMBER 30, 2016 | $9.20 | 0.10 | 16 | 1.03 | 1.13 | (0.05) | — | (0.05) | ||||||||||||||||||||
| FOR THE PERIOD 2/11/158—9/30/15 | $10.00 | 0.04 | (0.84) | (0.80) | — | — | — | |||||||||||||||||||||
| AQR TM SMALL CAP MULTI-STYLE FUND CLASS R6 | ||||||||||||||||||||||||||||
| FOR THE YEAR ENDED SEPTEMBER 30, 2016 | $9.22 | 0.12 | 16 | 1.04 | 1.16 | (0.06) | — | (0.06) | ||||||||||||||||||||
| FOR THE PERIOD 2/11/158—9/30/15 | $10.00 | 0.06 | (0.84) | (0.78) | — | — | — | |||||||||||||||||||||
| AQR TM INTERNATIONAL MULTI-STYLE FUND CLASS I6 | ||||||||||||||||||||||||||||
| FOR THE YEAR ENDED SEPTEMBER 30, 2016 | $9.40 | 0.24 | (0.08) | 14 | 0.16 | (0.12) | — | (0.12) | ||||||||||||||||||||
| FOR THE PERIOD 2/11/158—9/30/15 | $10.00 | 0.18 | (0.78) | (0.60) | — | — | — | |||||||||||||||||||||
| AQR TM INTERNATIONAL MULTI-STYLE FUND CLASS N | ||||||||||||||||||||||||||||
| FOR THE YEAR ENDED SEPTEMBER 30, 2016 | $9.39 | 0.22 | (0.08) | 14 | 0.14 | (0.11) | — | (0.11) | ||||||||||||||||||||
| FOR THE PERIOD 2/11/158—9/30/15 | $10.00 | 0.15 | (0.76) | (0.61) | — | — | — | |||||||||||||||||||||
| AQR TM INTERNATIONAL MULTI-STYLE FUND CLASS R6 | ||||||||||||||||||||||||||||
| FOR THE YEAR ENDED SEPTEMBER 30, 2016 | $9.41 | 0.25 | (0.09) | 14 | 0.16 | (0.12) | — | (0.12) | ||||||||||||||||||||
| FOR THE PERIOD 2/11/158—9/30/15 | $10.00 | 0.18 | (0.77) | (0.59) | — | — | — | |||||||||||||||||||||
| AQR TM EMERGING MULTI-STYLE FUND CLASS I6 | ||||||||||||||||||||||||||||
| FOR THE YEAR ENDED SEPTEMBER 30, 2016 | $8.31 | 0.17 | 0.82 | 0.99 | (0.03) | — | (0.03) | |||||||||||||||||||||
| FOR THE PERIOD 2/11/158—9/30/15 | $10.00 | 0.21 | (1.90) | (1.69) | — | — | — | |||||||||||||||||||||
| AQR TM EMERGING MULTI-STYLE FUND CLASS N | ||||||||||||||||||||||||||||
| FOR THE YEAR ENDED SEPTEMBER 30, 2016 | $8.30 | 0.17 | 0.81 | 0.98 | — | — | — | |||||||||||||||||||||
| FOR THE PERIOD 2/11/158—9/30/15 | $10.00 | 0.19 | (1.89) | (1.70) | — | — | — | |||||||||||||||||||||
| AQR TM EMERGING MULTI-STYLE FUND CLASS R6 | ||||||||||||||||||||||||||||
| FOR THE YEAR ENDED SEPTEMBER 30, 2016 | $8.32 | 0.18 | 0.82 | 1.00 | (0.04) | — | (0.04) | |||||||||||||||||||||
| FOR THE PERIOD 2/11/158—9/30/15 | $10.00 | 0.22 | (1.90) | (1.68) | — | — | — | |||||||||||||||||||||
| The accompanying notes are an integral part of these financial statements. |
| AQR Funds | Annual Report | September 2016 | ||||||||||||||
200
| Financial Highlights | September 30, 2016 |
| RATIOS/SUPPLEMENTAL DATA | ||||||||||||||||||||||||||||||||||
| Ratios to Average Net Assets of:* | ||||||||||||||||||||||||||||||||||
| Net Asset Value, End of Period | Total Return2,3 | Net Assets, End of Period (000’s) | Expenses, Before Reimbursements and/or Waivers4 | Expenses, Net of Reimbursements and/or Waivers4 | Expenses, Net of Reimbursements and/or Waivers (Excluding Dividend Short Expense & Interest Expense)4 | Net Investment Income (Loss) | Portfolio Turnover Rate5 | |||||||||||||||||||||||||||
| $8.95 | 11.97 | % | $73,793 | 0.95 | % | 0.75 | % | 0.75 | % | 1.85 | % | 94 | % | |||||||||||||||||||||
| $8.19 | (17.14 | )% | $48,992 | 1.39 | % | 0.79 | % | 0.79 | % | 2.79 | % | 317 | % | |||||||||||||||||||||
| $9.96 | (0.40 | )% | $11,572 | 3.30 | %10,11 | 0.85 | % | 0.85 | % | 3.49 | % | 154 | % | |||||||||||||||||||||
| $8.93 | 11.72 | % | $7,600 | 1.20 | % | 1.00 | % | 1.00 | % | 1.64 | % | 94 | % | |||||||||||||||||||||
| $8.17 | (17.34 | )% | $4,494 | 1.61 | % | 1.04 | % | 1.04 | % | 2.98 | % | 317 | % | |||||||||||||||||||||
| $9.95 | (0.50 | )% | $2,388 | 3.55 | %10,11 | 1.10 | % | 1.10 | % | 3.49 | % | 154 | % | |||||||||||||||||||||
| $8.97 | 12.13 | % | $184,112 | 0.85 | % | 0.65 | % | 0.65 | % | 1.96 | % | 94 | % | |||||||||||||||||||||
| $8.20 | (17.06 | )% | $135,503 | 0.89 | % | 0.65 | % | 0.65 | % | 4.66 | % | 317 | % | |||||||||||||||||||||
| $9.96 | (4.87 | )% | $95 | 2.73 | %10,11 | 0.75 | % | 0.75 | % | 2.09 | % | 154 | % | |||||||||||||||||||||
| $10.00 | 6.82 | % | $39,964 | 0.59 | %10 | 0.43 | % | 0.43 | % | 1.57 | % | 173 | % | |||||||||||||||||||||
| $9.42 | (5.80 | )% | $2,087 | 1.66 | %10 | 0.46 | % | 0.46 | % | 1.20 | % | 207 | % | |||||||||||||||||||||
| $9.97 | 6.48 | % | $2,165 | 0.84 | %10 | 0.69 | % | 0.69 | % | 1.34 | % | 173 | % | |||||||||||||||||||||
| $9.40 | (6.00 | )% | $135 | 2.48 | %10 | 0.70 | % | 0.70 | % | 0.99 | % | 207 | % | |||||||||||||||||||||
| $10.01 | 6.95 | % | $98,092 | 0.53 | %10 | 0.35 | % | 0.35 | % | 1.63 | % | 173 | % | |||||||||||||||||||||
| $9.42 | (5.80 | )% | $26,703 | 1.41 | %10 | 0.36 | % | 0.36 | % | 1.33 | % | 207 | % | |||||||||||||||||||||
| $10.31 | 12.64 | % | $13,792 | 1.90 | %10 | 0.64 | % | 0.64 | % | 1.27 | %16 | 179 | % | |||||||||||||||||||||
| $9.21 | (7.90 | )% | $1,702 | 5.66 | %10 | 0.65 | % | 0.65 | % | 0.77 | % | 98 | % | |||||||||||||||||||||
| $10.28 | 12.34 | % | $2,970 | 2.03 | %10 | 0.88 | % | 0.88 | % | 1.05 | %16 | 179 | % | |||||||||||||||||||||
| $9.20 | (8.00 | )% | $128 | 6.53 | %10 | 0.92 | % | 0.92 | % | 0.59 | % | 98 | % | |||||||||||||||||||||
| $10.32 | 12.63 | % | $1,973 | 2.29 | %10 | 0.55 | % | 0.55 | % | 1.26 | %16 | 179 | % | |||||||||||||||||||||
| $9.22 | (7.80 | )% | $1,660 | 6.28 | %10 | 0.57 | % | 0.57 | % | 0.96 | % | 98 | % | |||||||||||||||||||||
| $9.44 | 1.68 | % | $20,094 | 0.81 | %10 | 0.59 | % | 0.58 | % | 2.58 | % | 135 | % | |||||||||||||||||||||
| $9.40 | (6.00 | )% | $3,213 | 1.42 | %10 | 0.61 | % | 0.61 | % | 2.85 | % | 172 | % | |||||||||||||||||||||
| $9.42 | 1.43 | % | $1,592 | 1.07 | %10 | 0.82 | % | 0.82 | % | 2.41 | % | 135 | % | |||||||||||||||||||||
| $9.39 | (6.10 | )% | $143 | 2.65 | %10 | 0.81 | % | 0.81 | % | 2.28 | % | 172 | % | |||||||||||||||||||||
| $9.45 | 1.71 | % | $116,641 | 0.72 | %10 | 0.50 | % | 0.50 | % | 2.73 | % | 135 | % | |||||||||||||||||||||
| $9.41 | (5.90 | )% | $41,373 | 1.22 | %10 | 0.51 | % | 0.51 | % | 2.81 | % | 172 | % | |||||||||||||||||||||
| $9.27 | 12.02 | % | $12,711 | 0.94 | %10 | 0.72 | % | 0.72 | % | 2.00 | % | 181 | % | |||||||||||||||||||||
| $8.31 | (16.90 | )% | $2,986 | 2.66 | %10 | 0.77 | % | 0.77 | % | 3.46 | % | 173 | % | |||||||||||||||||||||
| $9.28 | 11.81 | % | $2,163 | 1.20 | %10 | 0.95 | % | 0.95 | % | 2.01 | % | 181 | % | |||||||||||||||||||||
| $8.30 | (17.00 | )% | $881 | 3.06 | %10 | 1.03 | % | 1.03 | % | 3.08 | % | 173 | % | |||||||||||||||||||||
| $9.28 | 12.05 | % | $272,799 | 0.87 | %10 | 0.65 | % | 0.65 | % | 2.09 | % | 181 | % | |||||||||||||||||||||
| $8.32 | (16.80 | )% | $15,381 | 2.46 | %10 | 0.67 | % | 0.67 | % | 3.66 | % | 173 | % | |||||||||||||||||||||
| The accompanying notes are an integral part of these financial statements. |
| AQR Funds | Annual Report | September 2016 | ||||||||||||||
201
| Financial Highlights | September 30, 2016 |
| PER SHARE OPERATING PERFORMANCE | ||||||||||||||||||||||||||||
| Change in Net Assets Resulting from Operations1 | Less Dividends and Distributions | |||||||||||||||||||||||||||
| Net Asset Value, Beginning of Period | Net Investment Income (Loss) | Net Realized and Unrealized Gain (Loss) | Net Increase (Decrease) in Net Asset Value from Operations | Distributions from Net Investment Income | Distributions from Net Realized Gains | Total Distributions | ||||||||||||||||||||||
| AQR LARGE CAP MOMENTUM STYLE FUND CLASS I6 | ||||||||||||||||||||||||||||
| FOR THE YEAR ENDED SEPTEMBER 30, 2016 | $19.96 | 0.27 | 1.87 | 2.14 | (0.21) | (1.45) | (1.66) | |||||||||||||||||||||
| FOR THE YEAR ENDED SEPTEMBER 30, 2015 | $21.89 | 0.23 | (0.10) | 0.13 | (0.14) | (1.92) | (2.06) | |||||||||||||||||||||
| FOR THE YEAR ENDED SEPTEMBER 30, 2014 | $19.65 | 0.12 | 3.12 | 3.24 | (0.13) | (0.87) | (1.00) | |||||||||||||||||||||
| NINE MONTHS ENDED SEPTEMBER 30, 2013 | $16.06 | 0.12 | 9 | 3.47 | 3.59 | — | — | — | ||||||||||||||||||||
| FOR THE YEAR ENDED DECEMBER 31, 2012 | $13.89 | 0.26 | 17 | 2.16 | 2.42 | (0.25) | — | (0.25) | ||||||||||||||||||||
| FOR THE YEAR ENDED DECEMBER 31, 2011† | $14.40 | 0.15 | (0.54) | (0.39) | (0.09) | (0.03) | (0.12) | |||||||||||||||||||||
| AQR LARGE CAP MOMENTUM STYLE FUND CLASS N | ||||||||||||||||||||||||||||
| FOR THE YEAR ENDED SEPTEMBER 30, 2016 | $19.92 | 0.21 | 1.88 | 2.09 | (0.14) | (1.45) | (1.59) | |||||||||||||||||||||
| FOR THE YEAR ENDED SEPTEMBER 30, 2015 | $21.85 | 0.17 | (0.10) | 0.07 | (0.08) | (1.92) | (2.00) | |||||||||||||||||||||
| FOR THE YEAR ENDED SEPTEMBER 30, 2014 | $19.61 | 0.06 | 3.13 | 3.19 | (0.08) | (0.87) | (0.95) | |||||||||||||||||||||
| NINE MONTHS ENDED SEPTEMBER 30, 2013 | $16.05 | 0.09 | 9 | 3.47 | 3.56 | — | — | — | ||||||||||||||||||||
| FOR THE PERIOD 12/17/1212—12/31/12 | $16.02 | 0.01 | 17 | 0.02 | 0.03 | — | — | — | ||||||||||||||||||||
| AQR LARGE CAP MOMENTUM STYLE FUND CLASS R6 | ||||||||||||||||||||||||||||
| FOR THE YEAR ENDED SEPTEMBER 30, 2016 | $19.94 | 0.29 | 1.86 | 2.15 | (0.23) | (1.45) | (1.68) | |||||||||||||||||||||
| FOR THE YEAR ENDED SEPTEMBER 30, 2015 | $21.89 | 0.23 | (0.08) | 0.15 | (0.18) | (1.92) | (2.10) | |||||||||||||||||||||
| FOR THE PERIOD 7/10/1412—9/30/14 | $21.90 | 0.04 | (0.05) | 14 | (0.01) | — | — | — | ||||||||||||||||||||
| AQR SMALL CAP MOMENTUM STYLE FUND CLASS I6 | ||||||||||||||||||||||||||||
| FOR THE YEAR ENDED SEPTEMBER 30, 2016 | $19.10 | 0.15 | 1.79 | 1.94 | (0.16) | (0.08) | (0.24) | |||||||||||||||||||||
| FOR THE YEAR ENDED SEPTEMBER 30, 2015 | $21.09 | 0.15 | 13 | 0.26 | 14 | 0.41 | (0.04) | (2.36) | (2.40) | |||||||||||||||||||
| FOR THE YEAR ENDED SEPTEMBER 30, 2014 | $21.77 | 0.00 | 7,15 | 0.73 | 0.73 | (0.06) | (1.35) | (1.41) | ||||||||||||||||||||
| NINE MONTHS ENDED SEPTEMBER 30, 2013 | $16.43 | 0.09 | 9 | 5.25 | 5.34 | — | — | — | ||||||||||||||||||||
| FOR THE YEAR ENDED DECEMBER 31, 2012 | $13.89 | 0.22 | 17 | 2.50 | 2.72 | (0.18) | — | (0.18) | ||||||||||||||||||||
| FOR THE YEAR ENDED DECEMBER 31, 2011† | $14.39 | 0.04 | (0.42) | (0.38) | (0.02) | (0.10) | (0.12) | |||||||||||||||||||||
| AQR SMALL CAP MOMENTUM STYLE FUND CLASS N | ||||||||||||||||||||||||||||
| FOR THE YEAR ENDED SEPTEMBER 30, 2016 | $18.99 | 0.09 | 1.78 | 1.87 | (0.10) | (0.08) | (0.18) | |||||||||||||||||||||
| FOR THE YEAR ENDED SEPTEMBER 30, 2015 | $21.00 | 0.09 | 13 | 0.26 | 14 | 0.35 | — | (2.36) | (2.36) | |||||||||||||||||||
| FOR THE YEAR ENDED SEPTEMBER 30, 2014 | $21.73 | (0.06) | 15 | 0.73 | 0.67 | (0.05) | (1.35) | (1.40) | ||||||||||||||||||||
| NINE MONTHS ENDED SEPTEMBER 30, 2013 | $16.43 | 0.03 | 9 | 5.27 | 5.30 | — | — | — | ||||||||||||||||||||
| FOR THE PERIOD 12/17/1212—12/31/12 | $16.09 | 0.02 | 17 | 0.32 | 0.34 | — | — | — | ||||||||||||||||||||
| AQR SMALL CAP MOMENTUM STYLE FUND CLASS R6 | ||||||||||||||||||||||||||||
| FOR THE YEAR ENDED SEPTEMBER 30, 2016 | $19.09 | 0.13 | 1.81 | 1.94 | (0.18) | (0.08) | (0.26) | |||||||||||||||||||||
| FOR THE YEAR ENDED SEPTEMBER 30, 2015 | $21.10 | 0.13 | 13 | 0.29 | 14 | 0.42 | (0.07) | (2.36) | (2.43) | |||||||||||||||||||
| FOR THE PERIOD 7/10/1412—9/30/14 | $22.08 | 0.01 | 15 | (0.99) | 14 | (0.98) | — | — | — | |||||||||||||||||||
| AQR INTERNATIONAL MOMENTUM STYLE FUND CLASS I6 | ||||||||||||||||||||||||||||
| FOR THE YEAR ENDED SEPTEMBER 30, 2016 | $13.24 | 0.25 | 0.59 | 0.84 | (0.22) | — | (0.22) | |||||||||||||||||||||
| FOR THE YEAR ENDED SEPTEMBER 30, 2015 | $14.95 | 0.28 | (1.51) | (1.23) | (0.31) | (0.17) | (0.48) | |||||||||||||||||||||
| FOR THE YEAR ENDED SEPTEMBER 30, 2014 | $15.29 | 0.27 | 15 | (0.36) | (0.09) | (0.25) | — | (0.25) | ||||||||||||||||||||
| NINE MONTHS ENDED SEPTEMBER 30, 2013 | $13.09 | 0.22 | 9 | 1.98 | 2.20 | — | — | — | ||||||||||||||||||||
| FOR THE YEAR ENDED DECEMBER 31, 2012 | $11.37 | 0.29 | 1.74 | 2.03 | (0.31) | — | (0.31) | |||||||||||||||||||||
| FOR THE YEAR ENDED DECEMBER 31, 2011† | $13.62 | 0.29 | (2.26) | (1.97) | (0.28) | — | (0.28) | |||||||||||||||||||||
| AQR INTERNATIONAL MOMENTUM STYLE FUND CLASS N | ||||||||||||||||||||||||||||
| FOR THE YEAR ENDED SEPTEMBER 30, 2016 | $13.19 | 0.21 | 0.60 | 0.81 | (0.18) | — | (0.18) | |||||||||||||||||||||
| FOR THE YEAR ENDED SEPTEMBER 30, 2015 | $14.89 | 0.25 | (1.51) | (1.26) | (0.27) | (0.17) | (0.44) | |||||||||||||||||||||
| FOR THE YEAR ENDED SEPTEMBER 30, 2014 | $15.25 | 0.22 | 15 | (0.35) | (0.13) | (0.23) | — | (0.23) | ||||||||||||||||||||
| NINE MONTHS ENDED SEPTEMBER 30, 2013 | $13.08 | 0.25 | 9 | 1.92 | 2.17 | — | — | — | ||||||||||||||||||||
| FOR THE PERIOD 12/17/1212—12/31/12 | $12.95 | — | 0.13 | 0.13 | — | — | — | |||||||||||||||||||||
| AQR INTERNATIONAL MOMENTUM STYLE FUND CLASS R6 | ||||||||||||||||||||||||||||
| FOR THE YEAR ENDED SEPTEMBER 30, 2016 | $13.23 | 0.27 | 0.59 | 0.86 | (0.24) | — | (0.24) | |||||||||||||||||||||
| FOR THE YEAR ENDED SEPTEMBER 30, 2015 | $14.94 | 0.33 | (1.53) | (1.20) | (0.34) | (0.17) | (0.51) | |||||||||||||||||||||
| FOR THE PERIOD 7/10/1412—9/30/14 | $15.54 | 0.05 | 15 | (0.65) | (0.60) | — | — | — | ||||||||||||||||||||
| The accompanying notes are an integral part of these financial statements. |
| AQR Funds | Annual Report | September 2016 | ||||||||||||||
202
| Financial Highlights | September 30, 2016 |
| RATIOS/SUPPLEMENTAL DATA | ||||||||||||||||||||||||||||||||||
| Ratios to Average Net Assets of:* | ||||||||||||||||||||||||||||||||||
| Net Asset Value, End of Period | Total Return2,3 | Net Assets, End of Period (000’s) | Expenses, Before Reimbursements and/or Waivers4 | Expenses, Net of Reimbursements and/or Waivers4 | Expenses, Net of Reimbursements and/or Waivers (Excluding Dividend Short Expense & Interest Expense)4 | Net Investment Income (Loss) | Portfolio Turnover Rate5 | |||||||||||||||||||||||||||
| $20.44 | 11.12 | % | $820,914 | 0.42 | % | 0.40 | % | 0.40 | % | 1.34 | % | 77 | % | |||||||||||||||||||||
| $19.96 | 0.18 | % | $874,115 | 0.50 | % | 0.45 | % | 0.45 | % | 1.06 | % | 90 | % | |||||||||||||||||||||
| $21.89 | 16.86 | % | $953,235 | 0.55 | % | 0.49 | % | 0.49 | % | 0.55 | % | 83 | % | |||||||||||||||||||||
| $19.65 | 22.35 | % | $719,389 | 0.55 | %10 | 0.49 | % | 0.49 | % | 0.88 | %9 | 62 | % | |||||||||||||||||||||
| $16.06 | 17.49 | % | $490,442 | 0.58 | % | 0.50 | % | 0.49 | % | 1.69 | %17 | 68 | % | |||||||||||||||||||||
| $13.89 | (2.68 | )% | $302,755 | 0.67 | % | 0.50 | % | 0.49 | % | 1.07 | % | 162 | % | |||||||||||||||||||||
| $20.42 | 10.89 | % | $57,644 | 0.66 | % | 0.65 | % | 0.65 | % | 1.08 | % | 77 | % | |||||||||||||||||||||
| $19.92 | (0.10 | )% | $68,535 | 0.77 | % | 0.70 | % | 0.70 | % | 0.81 | % | 90 | % | |||||||||||||||||||||
| $21.85 | 16.59 | % | $79,272 | 0.83 | % | 0.74 | % | 0.74 | % | 0.30 | % | 83 | % | |||||||||||||||||||||
| $19.61 | 22.18 | % | $70,265 | 0.83 | %10 | 0.74 | % | 0.74 | % | 0.64 | %9 | 62 | % | |||||||||||||||||||||
| $16.05 | 0.19 | % | $58,422 | 0.82 | % | 0.75 | % | 0.74 | % | 1.19 | %17 | 68 | % | |||||||||||||||||||||
| $20.41 | 11.23 | % | $59,108 | 0.32 | % | 0.30 | % | 0.30 | % | 1.45 | % | 77 | % | |||||||||||||||||||||
| $19.94 | 0.28 | % | $62,973 | 0.36 | % | 0.31 | % | 0.31 | % | 1.09 | % | 90 | % | |||||||||||||||||||||
| $21.89 | (0.05 | )% | $131 | 0.48 | % | 0.39 | % | 0.39 | % | 0.75 | % | 83 | % | |||||||||||||||||||||
| $20.80 | 10.24 | % | $317,154 | 0.65 | % | 0.60 | % | 0.60 | % | 0.77 | % | 85 | % | |||||||||||||||||||||
| $19.10 | 1.17 | % | $316,232 | 0.68 | % | 0.63 | % | 0.62 | % | 0.69 | %13 | 86 | % | |||||||||||||||||||||
| $21.09 | 3.07 | % | $301,173 | 0.68 | % | 0.65 | % | 0.65 | % | 0.01 | %15 | 83 | % | |||||||||||||||||||||
| $21.77 | 32.50 | % | $242,675 | 0.68 | %10,11 | 0.65 | % | 0.65 | % | 0.60 | %9 | 49 | % | |||||||||||||||||||||
| $16.43 | 19.62 | % | $145,770 | 0.72 | % | 0.66 | % | 0.65 | % | 1.44 | %17 | 73 | % | |||||||||||||||||||||
| $13.89 | (2.62 | )% | $100,534 | 0.85 | % | 0.66 | % | 0.65 | % | 0.26 | % | 121 | % | |||||||||||||||||||||
| $20.68 | 9.96 | % | $1,574 | 0.91 | % | 0.84 | % | 0.84 | % | 0.47 | % | 85 | % | |||||||||||||||||||||
| $18.99 | 0.89 | % | $8,195 | 0.94 | % | 0.88 | % | 0.87 | % | 0.43 | %13 | 86 | % | |||||||||||||||||||||
| $21.00 | 2.83 | % | $7,189 | 1.04 | % | 0.90 | % | 0.90 | % | (0.26 | )%15 | 83 | % | |||||||||||||||||||||
| $21.73 | 32.26 | % | $1,668 | 4.82 | %10,11 | 0.90 | % | 0.90 | % | 0.18 | %9 | 49 | % | |||||||||||||||||||||
| $16.43 | 2.11 | % | $10 | 135.33 | %18 | 0.90 | % | 0.90 | % | 3.36 | %17 | 73 | % | |||||||||||||||||||||
| $20.77 | 10.30 | % | $8,490 | 0.56 | % | 0.50 | % | 0.50 | % | 0.69 | % | 85 | % | |||||||||||||||||||||
| $19.09 | 1.25 | % | $77,416 | 0.59 | % | 0.50 | % | 0.50 | % | 0.62 | %13 | 86 | % | |||||||||||||||||||||
| $21.10 | (4.44 | )% | $96 | 0.63 | % | 0.55 | % | 0.55 | % | 0.13 | %15 | 83 | % | |||||||||||||||||||||
| $13.86 | 6.40 | % | $272,002 | 0.63 | % | 0.55 | % | 0.55 | % | 1.89 | % | 85 | % | |||||||||||||||||||||
| $13.24 | (8.40 | )% | $257,299 | 0.68 | % | 0.60 | % | 0.60 | % | 1.95 | % | 112 | % | |||||||||||||||||||||
| $14.95 | (0.64 | )% | $279,838 | 0.71 | % | 0.65 | % | 0.65 | % | 1.73 | %15 | 98 | % | |||||||||||||||||||||
| $15.29 | 16.81 | % | $219,002 | 0.73 | %10 | 0.65 | % | 0.65 | % | 2.09 | %9 | 76 | % | |||||||||||||||||||||
| $13.09 | 17.92 | % | $127,673 | 0.80 | % | 0.66 | % | 0.65 | % | 2.41 | % | 116 | % | |||||||||||||||||||||
| $11.37 | (14.42 | )% | $77,225 | 0.97 | % | 0.66 | % | 0.65 | % | 2.23 | % | 203 | % | |||||||||||||||||||||
| $13.82 | 6.16 | % | $30,502 | 0.87 | % | 0.80 | % | 0.79 | % | 1.59 | % | 85 | % | |||||||||||||||||||||
| $13.19 | (8.62 | )% | $35,343 | 0.94 | % | 0.85 | % | 0.85 | % | 1.71 | % | 112 | % | |||||||||||||||||||||
| $14.89 | (0.91 | )% | $40,054 | 1.00 | % | 0.90 | % | 0.90 | % | 1.42 | %15 | 98 | % | |||||||||||||||||||||
| $15.25 | 16.59 | % | $41,503 | 1.03 | %10 | 0.90 | % | 0.90 | % | 2.28 | %9 | 76 | % | |||||||||||||||||||||
| $13.08 | 1.00 | % | $11 | 132.42 | %18 | 0.90 | % | 0.90 | % | 0.25 | % | 116 | % | |||||||||||||||||||||
| $13.85 | 6.53 | % | $35,382 | 0.53 | % | 0.45 | % | 0.45 | % | 1.98 | % | 85 | % | |||||||||||||||||||||
| $13.23 | (8.24 | )% | $31,058 | 0.55 | % | 0.46 | % | 0.46 | % | 2.31 | % | 112 | % | |||||||||||||||||||||
| $14.94 | (3.86 | )% | $96 | 0.64 | % | 0.55 | % | 0.55 | % | 1.38 | %15 | 98 | % | |||||||||||||||||||||
| The accompanying notes are an integral part of these financial statements. |
| AQR Funds | Annual Report | September 2016 | ||||||||||||||
203
| Financial Highlights | September 30, 2016 |
| PER SHARE OPERATING PERFORMANCE | ||||||||||||||||||||||||||||
| Change in Net Assets Resulting from Operations1 | Less Dividends and Distributions | |||||||||||||||||||||||||||
| Net Asset Value, Beginning of Period | Net Investment Income (Loss) | Net Realized and Unrealized Gain (Loss) | Net Increase (Decrease) in Net Asset Value from Operations | Distributions from Net Investment Income | Distributions from Net Realized Gains | Total Distributions | ||||||||||||||||||||||
| AQR EMERGING MOMENTUM STYLE FUND CLASS I6 | ||||||||||||||||||||||||||||
| FOR THE YEAR ENDED SEPTEMBER 30, 2016 | $8.29 | 0.10 | 0.59 | 0.69 | (0.23) | — | (0.23) | |||||||||||||||||||||
| FOR THE YEAR ENDED SEPTEMBER 30, 2015 | $10.02 | 0.20 | (1.84) | (1.64) | (0.09) | — | (0.09) | |||||||||||||||||||||
| FOR THE PERIOD 5/13/148—9/30/14 | $10.00 | 0.09 | (0.07) | 0.02 | — | — | — | |||||||||||||||||||||
| AQR EMERGING MOMENTUM STYLE FUND CLASS N | ||||||||||||||||||||||||||||
| FOR THE YEAR ENDED SEPTEMBER 30, 2016 | $8.27 | 0.09 | 0.59 | 0.68 | (0.21) | — | (0.21) | |||||||||||||||||||||
| FOR THE YEAR ENDED SEPTEMBER 30, 2015 | $10.01 | 0.16 | (1.82) | (1.66) | (0.08) | — | (0.08) | |||||||||||||||||||||
| FOR THE PERIOD 5/13/148—9/30/14 | $10.00 | 0.09 | (0.08) | 0.01 | — | — | — | |||||||||||||||||||||
| AQR EMERGING MOMENTUM STYLE FUND CLASS R6 | ||||||||||||||||||||||||||||
| FOR THE YEAR ENDED SEPTEMBER 30, 2016 | $8.30 | 0.14 | 0.56 | 0.70 | (0.24) | — | (0.24) | |||||||||||||||||||||
| FOR THE YEAR ENDED SEPTEMBER 30, 2015 | $10.02 | 0.19 | (1.81) | (1.62) | (0.10) | — | (0.10) | |||||||||||||||||||||
| FOR THE PERIOD 7/10/1412—9/30/14 | $10.63 | 0.05 | (0.66) | 14 | (0.61) | — | — | — | ||||||||||||||||||||
| AQR TM LARGE CAP MOMENTUM STYLE FUND CLASS I6 | ||||||||||||||||||||||||||||
| FOR THE YEAR ENDED SEPTEMBER 30, 2016 | $15.54 | 0.23 | 16 | 1.35 | 1.58 | (0.15) | — | (0.15) | ||||||||||||||||||||
| FOR THE YEAR ENDED SEPTEMBER 30, 2015 | $15.90 | 0.18 | (0.19) | (0.01) | (0.08) | (0.27) | (0.35) | |||||||||||||||||||||
| FOR THE YEAR ENDED SEPTEMBER 30, 2014 | $13.60 | 0.09 | 2.36 | 2.45 | (0.04) | (0.11) | (0.15) | |||||||||||||||||||||
| NINE MONTHS ENDED SEPTEMBER 30, 2013 | $11.13 | 0.09 | 9 | 2.38 | 2.47 | — | — | — | ||||||||||||||||||||
| FOR THE PERIOD 1/27/128—12/31/12 | $10.00 | 0.19 | 17 | 1.17 | 1.36 | (0.14) | (0.09) | (0.23) | ||||||||||||||||||||
| AQR TM LARGE CAP MOMENTUM STYLE FUND CLASS N | ||||||||||||||||||||||||||||
| FOR THE YEAR ENDED SEPTEMBER 30, 2016 | $15.50 | 0.20 | 16 | 1.36 | 1.56 | (0.14) | — | (0.14) | ||||||||||||||||||||
| FOR THE YEAR ENDED SEPTEMBER 30, 2015 | $15.86 | 0.15 | (0.20) | (0.05) | (0.04) | (0.27) | (0.31) | |||||||||||||||||||||
| FOR THE YEAR ENDED SEPTEMBER 30, 2014 | $13.57 | 0.04 | 2.37 | 2.41 | (0.01) | (0.11) | (0.12) | |||||||||||||||||||||
| NINE MONTHS ENDED SEPTEMBER 30, 2013 | $11.13 | 0.07 | 9 | 2.37 | 2.44 | — | — | — | ||||||||||||||||||||
| FOR THE PERIOD 12/17/1212—12/31/12 | $11.12 | 0.01 | 17 | 0.00 | 7 | 0.01 | — | — | — | |||||||||||||||||||
| AQR TM LARGE CAP MOMENTUM STYLE FUND CLASS R6 | ||||||||||||||||||||||||||||
| FOR THE YEAR ENDED SEPTEMBER 30, 2016 | $15.54 | 0.24 | 16 | 1.36 | 1.60 | (0.19) | — | (0.19) | ||||||||||||||||||||
| FOR THE YEAR ENDED SEPTEMBER 30, 2015 | $15.90 | 0.19 | (0.19) | 0.00 | 7 | (0.09) | (0.27) | (0.36) | ||||||||||||||||||||
| FOR THE PERIOD 7/10/1412—9/30/14 | $15.78 | 0.03 | 0.09 | 0.12 | — | — | — | |||||||||||||||||||||
| AQR TM SMALL CAP MOMENTUM STYLE FUND CLASS I6 | ||||||||||||||||||||||||||||
| FOR THE YEAR ENDED SEPTEMBER 30, 2016 | $14.51 | 0.12 | 1.33 | 1.45 | (0.10) | — | (0.10) | |||||||||||||||||||||
| FOR THE YEAR ENDED SEPTEMBER 30, 2015 | $14.72 | 0.11 | 13 | 0.23 | 14 | 0.34 | (0.01) | (0.54) | (0.55) | |||||||||||||||||||
| FOR THE YEAR ENDED SEPTEMBER 30, 2014 | $14.85 | 0.01 | 0.15 | 0.16 | (0.04) | (0.25) | (0.29) | |||||||||||||||||||||
| NINE MONTHS ENDED SEPTEMBER 30, 2013 | $11.15 | 0.05 | 9 | 3.65 | 3.70 | — | — | — | ||||||||||||||||||||
| FOR THE PERIOD 1/27/128—12/31/12 | $10.00 | 0.19 | 17 | 1.11 | 1.30 | (0.15) | — | (0.15) | ||||||||||||||||||||
| AQR TM SMALL CAP MOMENTUM STYLE FUND CLASS N | ||||||||||||||||||||||||||||
| FOR THE YEAR ENDED SEPTEMBER 30, 2016 | $14.44 | 0.10 | 1.33 | 1.43 | (0.08) | — | (0.08) | |||||||||||||||||||||
| FOR THE YEAR ENDED SEPTEMBER 30, 2015 | $14.67 | 0.07 | 13 | 0.24 | 14 | 0.31 | — | (0.54) | (0.54) | |||||||||||||||||||
| FOR THE YEAR ENDED SEPTEMBER 30, 2014 | $14.81 | (0.03) | 0.14 | 0.11 | (0.00) | 7 | (0.25) | (0.25) | ||||||||||||||||||||
| NINE MONTHS ENDED SEPTEMBER 30, 2013 | $11.15 | 0.03 | 9 | 3.63 | 3.66 | — | — | — | ||||||||||||||||||||
| FOR THE PERIOD 12/17/1212—12/31/12 | $10.91 | 0.02 | 17 | 0.22 | 0.24 | — | — | — | ||||||||||||||||||||
| AQR TM SMALL CAP MOMENTUM STYLE FUND CLASS R6 | ||||||||||||||||||||||||||||
| FOR THE YEAR ENDED SEPTEMBER 30, 2016 | $14.50 | 0.14 | 1.34 | 1.48 | (0.12) | — | (0.12) | |||||||||||||||||||||
| FOR THE YEAR ENDED SEPTEMBER 30, 2015 | $14.72 | 0.12 | 13 | 0.24 | 14 | 0.36 | (0.04) | (0.54) | (0.58) | |||||||||||||||||||
| FOR THE PERIOD 7/10/1412—9/30/14 | $15.45 | 0.01 | (0.74) | 14 | (0.73) | — | — | — | ||||||||||||||||||||
| The accompanying notes are an integral part of these financial statements. |
| AQR Funds | Annual Report | September 2016 | ||||||||||||||
204
| Financial Highlights | September 30, 2016 |
| RATIOS/SUPPLEMENTAL DATA | ||||||||||||||||||||||||||||||||||
| Ratios to Average Net Assets of:* | ||||||||||||||||||||||||||||||||||
| Net Asset Value, End of Period | Total Return2,3 | Net Assets, End of Period (000’s) | Expenses, Before Reimbursements and/or Waivers4 | Expenses, Net of Reimbursements and/or Waivers4 | Expenses, Net of Reimbursements and/or Waivers (Excluding Dividend Short Expense & Interest Expense)4 | Net Investment Income (Loss) | Portfolio Turnover Rate5 | |||||||||||||||||||||||||||
| $8.75 | 8.53 | % | $8,784 | 2.75 | % | 0.65 | % | 0.65 | % | 1.26 | % | 155 | % | |||||||||||||||||||||
| $8.29 | (16.45 | )% | $6,612 | 2.92 | % | 0.75 | % | 0.75 | % | 2.06 | % | 159 | % | |||||||||||||||||||||
| $10.02 | 0.20 | % | $6,260 | 4.03 | %10,11 | 0.80 | % | 0.80 | % | 2.27 | % | 72 | % | |||||||||||||||||||||
| $8.74 | 8.38 | % | $1,105 | 2.95 | % | 0.89 | % | 0.89 | % | 1.10 | % | 155 | % | |||||||||||||||||||||
| $8.27 | (16.72 | )% | $1,132 | 3.17 | % | 1.00 | % | 1.00 | % | 1.68 | % | 159 | % | |||||||||||||||||||||
| $10.01 | 0.10 | % | $1,034 | 4.18 | %10,11 | 1.05 | % | 1.05 | % | 2.13 | % | 72 | % | |||||||||||||||||||||
| $8.76 | 8.63 | % | $938 | 2.69 | % | 0.60 | % | 0.60 | % | 1.69 | % | 155 | % | |||||||||||||||||||||
| $8.30 | (16.34 | )% | $80 | 3.02 | % | 0.66 | % | 0.66 | % | 1.93 | % | 159 | % | |||||||||||||||||||||
| $10.02 | (5.74 | )% | $94 | 3.73 | %10,11 | 0.70 | % | 0.70 | % | 2.01 | % | 72 | % | |||||||||||||||||||||
| $16.97 | 10.22 | % | $67,397 | 0.49 | % | 0.40 | % | 0.40 | % | 1.39 | %16 | 49 | % | |||||||||||||||||||||
| $15.54 | (0.16 | )% | $56,141 | 0.65 | % | 0.48 | % | 0.48 | % | 1.08 | % | 62 | % | |||||||||||||||||||||
| $15.90 | 18.15 | % | $101,336 | 0.69 | % | 0.54 | % | 0.54 | % | 0.57 | % | 153 | % | |||||||||||||||||||||
| $13.60 | 22.19 | % | $21,709 | 1.41 | %10,11 | 0.54 | % | 0.54 | % | 1.00 | %9 | 178 | % | |||||||||||||||||||||
| $11.13 | 13.67 | % | $6,041 | 4.57 | % | 0.55 | % | 0.54 | % | 1.89 | %17 | 93 | % | |||||||||||||||||||||
| $16.92 | 10.11 | % | $161 | 0.65 | % | 0.56 | % | 0.56 | % | 1.22 | %16 | 49 | % | |||||||||||||||||||||
| $15.50 | (0.39 | )% | $147 | 0.75 | % | 0.64 | % | 0.64 | % | 0.89 | % | 62 | % | |||||||||||||||||||||
| $15.86 | 17.81 | % | $137 | 1.60 | % | 0.79 | % | 0.79 | % | 0.30 | % | �� | 153 | % | ||||||||||||||||||||
| $13.57 | 21.92 | % | $115 | 4.11 | %10,11 | 0.79 | % | 0.79 | % | 0.71 | %9 | 178 | % | |||||||||||||||||||||
| $11.13 | 0.09 | % | $10 | 15.32 | %18 | 0.79 | % | 0.79 | % | 2.41 | %17 | 93 | % | |||||||||||||||||||||
| $16.95 | 10.32 | % | $80,190 | 0.39 | % | 0.30 | % | 0.30 | % | 1.48 | %16 | 49 | % | |||||||||||||||||||||
| $15.54 | (0.09 | )% | $70,197 | 0.43 | % | 0.31 | % | 0.31 | % | 1.15 | % | 62 | % | |||||||||||||||||||||
| $15.90 | 0.76 | % | $101 | 0.67 | % | 0.44 | % | 0.44 | % | 0.77 | % | 153 | % | |||||||||||||||||||||
| $15.86 | 10.07 | % | $33,229 | 1.10 | % | 0.60 | % | 0.60 | % | 0.83 | % | 92 | % | |||||||||||||||||||||
| $14.51 | 2.13 | % | $19,992 | 1.34 | % | 0.64 | % | 0.64 | % | 0.68 | %13 | 111 | % | |||||||||||||||||||||
| $14.72 | 0.98 | % | $14,690 | 1.61 | % | 0.70 | % | 0.70 | % | 0.04 | % | 154 | % | |||||||||||||||||||||
| $14.85 | 33.18 | % | $6,764 | 2.67 | %10,11 | 0.70 | % | 0.70 | % | 0.49 | %9 | 81 | % | |||||||||||||||||||||
| $11.15 | 13.01 | % | $3,435 | 5.77 | % | 0.71 | % | 0.70 | % | 1.91 | %17 | 93 | % | |||||||||||||||||||||
| $15.79 | 9.95 | % | $154 | 1.26 | % | 0.76 | % | 0.76 | % | 0.65 | % | 92 | % | |||||||||||||||||||||
| $14.44 | 1.90 | % | $127 | 1.49 | % | 0.86 | % | 0.86 | % | 0.45 | %13 | 111 | % | |||||||||||||||||||||
| $14.67 | 0.69 | % | $125 | 2.44 | % | 0.95 | % | 0.95 | % | (0.21 | )% | 154 | % | |||||||||||||||||||||
| $14.81 | 32.83 | % | $122 | 5.05 | %10,11 | 0.95 | % | 0.95 | % | 0.26 | %9 | 81 | % | |||||||||||||||||||||
| $11.15 | 2.20 | % | $10 | 12.32 | % | 0.95 | % | 0.95 | % | 4.19 | %17 | 93 | % | |||||||||||||||||||||
| $15.86 | 10.24 | % | $166 | 1.00 | % | 0.50 | % | 0.50 | % | 0.92 | % | 92 | % | |||||||||||||||||||||
| $14.50 | 2.23 | % | $97 | 1.24 | % | 0.54 | % | 0.54 | % | 0.77 | %13 | 111 | % | |||||||||||||||||||||
| $14.72 | (4.72 | )% | $95 | 1.65 | % | 0.60 | % | 0.60 | % | 0.22 | % | 154 | % | |||||||||||||||||||||
| The accompanying notes are an integral part of these financial statements. |
| AQR Funds | Annual Report | September 2016 | ||||||||||||||
205
| Financial Highlights | September 30, 2016 |
| PER SHARE OPERATING PERFORMANCE | ||||||||||||||||||||||||||||
| Change in Net Assets Resulting from Operations1 | Less Dividends and Distributions | |||||||||||||||||||||||||||
| Net Asset Value, Beginning of Period | Net Investment Income (Loss) | Net Realized and Unrealized Gain (Loss) | Net Increase (Decrease) in Net Asset Value from Operations | Distributions from Net Investment Income | Distributions from Net Realized Gains | Total Distributions | ||||||||||||||||||||||
| AQR TM INTERNATIONAL MOMENTUM STYLE FUND CLASS I6 | ||||||||||||||||||||||||||||
| FOR THE YEAR ENDED SEPTEMBER 30, 2016 | $11.70 | 0.23 | 0.49 | 0.72 | (0.15) | — | (0.15) | |||||||||||||||||||||
| FOR THE YEAR ENDED SEPTEMBER 30, 2015 | $13.09 | 0.20 | (1.28) | (1.08) | (0.25) | (0.06) | (0.31) | |||||||||||||||||||||
| FOR THE YEAR ENDED SEPTEMBER 30, 2014 | $13.18 | 0.23 | 15 | (0.10) | 0.13 | (0.06) | (0.16) | (0.22) | ||||||||||||||||||||
| NINE MONTHS ENDED SEPTEMBER 30, 2013 | $11.24 | 0.20 | 1.74 | 1.94 | — | — | — | |||||||||||||||||||||
| FOR THE PERIOD 1/27/128—12/31/12 | $10.00 | 0.23 | 1.22 | 1.45 | (0.19) | (0.02) | (0.21) | |||||||||||||||||||||
| AQR TM INTERNATIONAL MOMENTUM STYLE FUND CLASS N | ||||||||||||||||||||||||||||
| FOR THE YEAR ENDED SEPTEMBER 30, 2016 | $11.68 | 0.19 | 0.51 | 0.70 | (0.16) | — | (0.16) | |||||||||||||||||||||
| FOR THE YEAR ENDED SEPTEMBER 30, 2015 | $13.06 | 0.21 | (1.30) | (1.09) | (0.23) | (0.06) | (0.29) | |||||||||||||||||||||
| FOR THE YEAR ENDED SEPTEMBER 30, 2014 | $13.15 | 0.17 | 15 | (0.08) | 0.09 | (0.02) | (0.16) | (0.18) | ||||||||||||||||||||
| NINE MONTHS ENDED SEPTEMBER 30, 2013 | $11.24 | 0.20 | 1.71 | 1.91 | — | — | — | |||||||||||||||||||||
| FOR THE PERIOD 12/17/1212—12/31/12 | $11.14 | — | 0.10 | 0.10 | — | — | — | |||||||||||||||||||||
| AQR TM INTERNATIONAL MOMENTUM STYLE FUND CLASS R6 | ||||||||||||||||||||||||||||
| FOR THE YEAR ENDED SEPTEMBER 30, 2016 | $11.70 | 0.23 | 0.50 | 0.73 | (0.19) | — | (0.19) | |||||||||||||||||||||
| FOR THE YEAR ENDED SEPTEMBER 30, 2015 | $13.09 | 0.31 | (1.37) | (1.06) | (0.27) | (0.06) | (0.33) | |||||||||||||||||||||
| FOR THE PERIOD 7/10/1412—9/30/14 | $13.66 | 0.03 | 15 | (0.60) | (0.57) | — | — | — | ||||||||||||||||||||
| AQR LARGE CAP DEFENSIVE STYLE FUND CLASS I | ||||||||||||||||||||||||||||
| FOR THE YEAR ENDED SEPTEMBER 30, 2016 | $14.64 | 0.27 | 1.70 | 1.97 | (0.14) | (0.76) | (0.90) | |||||||||||||||||||||
| FOR THE YEAR ENDED SEPTEMBER 30, 2015 | $14.07 | 0.24 | 1.04 | 1.28 | (0.29) | (0.42) | (0.71) | |||||||||||||||||||||
| FOR THE YEAR ENDED SEPTEMBER 30, 2014 | $12.20 | 0.20 | 1.79 | 1.99 | (0.08) | (0.04) | (0.12) | |||||||||||||||||||||
| NINE MONTHS ENDED SEPTEMBER 30, 2013 | $10.16 | 0.15 | 1.89 | 2.04 | — | — | — | |||||||||||||||||||||
| FOR THE PERIOD 7/09/128—12/31/12 | $10.00 | 0.14 | 17 | 0.10 | 0.24 | (0.07) | (0.01) | (0.08) | ||||||||||||||||||||
| AQR LARGE CAP DEFENSIVE STYLE FUND CLASS N | ||||||||||||||||||||||||||||
| FOR THE YEAR ENDED SEPTEMBER 30, 2016 | $14.64 | 0.23 | 1.70 | 1.93 | (0.13) | (0.76) | (0.89) | |||||||||||||||||||||
| FOR THE YEAR ENDED SEPTEMBER 30, 2015 | $14.04 | 0.20 | 1.05 | 1.25 | (0.23) | (0.42) | (0.65) | |||||||||||||||||||||
| FOR THE YEAR ENDED SEPTEMBER 30, 2014 | $12.19 | 0.17 | 1.79 | 1.96 | (0.07) | (0.04) | (0.11) | |||||||||||||||||||||
| NINE MONTHS ENDED SEPTEMBER 30, 2013 | $10.18 | 0.13 | 1.88 | 2.01 | — | — | — | |||||||||||||||||||||
| FOR THE PERIOD 7/09/128—12/31/12 | $10.00 | 0.08 | 17 | 0.15 | 0.23 | (0.04) | (0.01) | (0.05) | ||||||||||||||||||||
| AQR LARGE CAP DEFENSIVE STYLE FUND CLASS R6 | ||||||||||||||||||||||||||||
| FOR THE YEAR ENDED SEPTEMBER 30, 2016 | $14.62 | 0.29 | 1.69 | 1.98 | (0.15) | (0.76) | (0.91) | |||||||||||||||||||||
| FOR THE YEAR ENDED SEPTEMBER 30, 2015 | $14.07 | 0.26 | 1.03 | 1.29 | (0.32) | (0.42) | (0.74) | |||||||||||||||||||||
| FOR THE PERIOD 9/02/1412—9/30/14 | $14.13 | 0.02 | (0.08) | 14 | (0.06) | — | — | — | ||||||||||||||||||||
| AQR INTERNATIONAL DEFENSIVE STYLE FUND CLASS I | ||||||||||||||||||||||||||||
| FOR THE YEAR ENDED SEPTEMBER 30, 2016 | $10.95 | 0.29 | 1.09 | 1.38 | (0.23) | — | (0.23) | |||||||||||||||||||||
| FOR THE YEAR ENDED SEPTEMBER 30, 2015 | $12.37 | 0.28 | (1.10) | (0.82) | (0.32) | (0.28) | (0.60) | |||||||||||||||||||||
| FOR THE YEAR ENDED SEPTEMBER 30, 2014 | $11.88 | 0.31 | 0.47 | 0.78 | (0.17) | (0.12) | (0.29) | |||||||||||||||||||||
| NINE MONTHS ENDED SEPTEMBER 30, 2013 | $10.67 | 0.23 | 0.98 | 1.21 | — | — | — | |||||||||||||||||||||
| FOR THE PERIOD 7/09/128—12/31/12 | $10.00 | 0.10 | 0.67 | 0.77 | (0.06) | (0.04) | (0.10) | |||||||||||||||||||||
| AQR INTERNATIONAL DEFENSIVE STYLE FUND CLASS N | ||||||||||||||||||||||||||||
| FOR THE YEAR ENDED SEPTEMBER 30, 2016 | $11.20 | 0.30 | 1.09 | 1.39 | (0.19) | — | (0.19) | |||||||||||||||||||||
| FOR THE YEAR ENDED SEPTEMBER 30, 2015 | $12.35 | 0.23 | (1.10) | (0.87) | — | (0.28) | (0.28) | |||||||||||||||||||||
| FOR THE YEAR ENDED SEPTEMBER 30, 2014 | $11.88 | 0.27 | 0.47 | 0.74 | (0.15) | (0.12) | (0.27) | |||||||||||||||||||||
| NINE MONTHS ENDED SEPTEMBER 30, 2013 | $10.69 | 0.20 | 0.99 | 1.19 | — | — | — | |||||||||||||||||||||
| FOR THE PERIOD 7/09/128—12/31/12 | $10.00 | 0.08 | 0.68 | 0.76 | (0.03) | (0.04) | (0.07) | |||||||||||||||||||||
| AQR INTERNATIONAL DEFENSIVE STYLE FUND CLASS R6 | ||||||||||||||||||||||||||||
| FOR THE YEAR ENDED SEPTEMBER 30, 2016 | $10.94 | 0.36 | 1.03 | 1.39 | (0.24) | — | (0.24) | |||||||||||||||||||||
| FOR THE YEAR ENDED SEPTEMBER 30, 2015 | $12.37 | 0.29 | (1.10) | (0.81) | (0.34) | (0.28) | (0.62) | |||||||||||||||||||||
| FOR THE PERIOD 9/02/1412—9/30/14 | $13.02 | 0.03 | (0.68) | 14 | (0.65) | — | — | — | ||||||||||||||||||||
| The accompanying notes are an integral part of these financial statements. |
| AQR Funds | Annual Report | September 2016 | ||||||||||||||
206
| Financial Highlights | September 30, 2016 |
| RATIOS/SUPPLEMENTAL DATA | ||||||||||||||||||||||||||||||||||
| Ratios to Average Net Assets of:* | ||||||||||||||||||||||||||||||||||
| Net Asset Value, End of Period | Total Return2,3 | Net Assets, End of Period (000’s) | Expenses, Before Reimbursements and/or Waivers4 | Expenses, Net of Reimbursements and/or Waivers4 | Expenses, Net of Reimbursements and/or Waivers (Excluding Dividend Short Expense & Interest Expense)4 | Net Investment Income (Loss) | Portfolio Turnover Rate5 | |||||||||||||||||||||||||||
| $12.27 | 6.18 | % | $33,887 | 0.76 | % | 0.55 | % | 0.55 | % | 1.90 | % | 87 | % | |||||||||||||||||||||
| $11.70 | (8.36 | )% | $23,699 | 0.94 | % | 0.65 | % | 0.65 | % | 1.57 | % | 147 | % | |||||||||||||||||||||
| $13.09 | 0.97 | % | $81,624 | 0.91 | % | 0.70 | % | 0.70 | % | 1.73 | %15 | 185 | % | |||||||||||||||||||||
| $13.18 | 17.26 | % | $17,418 | 2.31 | %10,11 | 0.70 | % | 0.70 | % | 2.14 | % | 154 | % | |||||||||||||||||||||
| $11.24 | 14.46 | % | $5,739 | 5.28 | % | 0.71 | % | 0.70 | % | 2.38 | % | 131 | % | |||||||||||||||||||||
| $12.22 | 6.01 | % | $160 | 0.93 | % | 0.72 | % | 0.72 | % | 1.61 | % | 87 | % | |||||||||||||||||||||
| $11.68 | (8.51 | )% | $103 | 1.03 | % | 0.79 | % | 0.78 | % | 1.69 | % | 147 | % | |||||||||||||||||||||
| $13.06 | 0.69 | % | $112 | 1.92 | % | 0.95 | % | 0.95 | % | 1.26 | %15 | 185 | % | |||||||||||||||||||||
| $13.15 | 16.99 | % | $111 | 5.00 | %10,11 | 0.95 | % | 0.95 | % | 2.19 | % | 154 | % | |||||||||||||||||||||
| $11.24 | 0.90 | % | $10 | 15.82 | %18 | 0.95 | % | 0.95 | % | 0.15 | % | 131 | % | |||||||||||||||||||||
| $12.24 | 6.25 | % | $55,739 | 0.66 | % | 0.45 | % | 0.45 | % | 1.97 | % | 87 | % | |||||||||||||||||||||
| $11.70 | (8.25 | )% | $48,003 | 0.70 | % | 0.46 | % | 0.46 | % | 2.40 | % | 147 | % | |||||||||||||||||||||
| $13.09 | (4.17 | )% | $96 | 0.94 | % | 0.60 | % | 0.60 | % | 1.13 | %15 | 185 | % | |||||||||||||||||||||
| $15.71 | 14.00 | % | $519,984 | 0.42 | % | 0.39 | % | 0.39 | % | 1.79 | % | 8 | % | |||||||||||||||||||||
| $14.64 | 9.13 | % | $158,468 | 0.55 | % | 0.45 | % | 0.45 | % | 1.65 | % | 24 | % | |||||||||||||||||||||
| $14.07 | 16.44 | % | $224,826 | 0.62 | % | 0.49 | % | 0.49 | % | 1.51 | % | 16 | % | |||||||||||||||||||||
| $12.20 | 20.08 | % | $155,660 | 0.93 | %10 | 0.52 | % | 0.52 | % | 1.69 | % | 106 | % | |||||||||||||||||||||
| $10.16 | 2.34 | % | $7,842 | 3.90 | % | 0.75 | % | 0.75 | % | 2.90 | %17 | 141 | % | |||||||||||||||||||||
| $15.68 | 13.70 | % | $226,020 | 0.68 | % | 0.65 | % | 0.65 | % | 1.53 | % | 8 | % | |||||||||||||||||||||
| $14.64 | 8.97 | % | $30,629 | 0.81 | % | 0.70 | % | 0.70 | % | 1.38 | % | 24 | % | |||||||||||||||||||||
| $14.04 | 16.16 | % | $28,843 | 0.92 | % | 0.74 | % | 0.74 | % | 1.26 | % | 16 | % | |||||||||||||||||||||
| $12.19 | 19.74 | % | $20,736 | 1.48 | %10 | 0.77 | % | 0.77 | % | 1.44 | % | 106 | % | |||||||||||||||||||||
| $10.18 | 2.29 | % | $421 | 9.36 | % | 1.00 | % | 1.00 | % | 1.70 | %17 | 141 | % | |||||||||||||||||||||
| $15.69 | 14.13 | % | $127,311 | 0.33 | % | 0.30 | % | 0.30 | % | 1.87 | % | 8 | % | |||||||||||||||||||||
| $14.62 | 9.23 | % | $109 | 0.45 | % | 0.35 | % | 0.34 | % | 1.76 | % | 24 | % | |||||||||||||||||||||
| $14.07 | (0.42 | )% | $100 | 0.54 | % | 0.39 | % | 0.39 | % | 1.69 | % | 16 | % | |||||||||||||||||||||
| $12.10 | 12.84 | % | $96,844 | 0.83 | % | 0.54 | % | 0.54 | % | 2.51 | % | 83 | % | |||||||||||||||||||||
| $10.95 | (6.89 | )% | $34,191 | 1.11 | % | 0.60 | % | 0.60 | % | 2.40 | % | 47 | % | |||||||||||||||||||||
| $12.37 | 6.68 | % | $27,316 | 1.24 | % | 0.65 | % | 0.65 | % | 2.53 | % | 57 | % | |||||||||||||||||||||
| $11.88 | 11.34 | % | $17,631 | 2.01 | %10,11 | 0.73 | % | 0.73 | % | 2.68 | % | 115 | % | |||||||||||||||||||||
| $10.67 | 7.69 | % | $5,366 | 5.00 | % | 0.90 | % | 0.90 | % | 1.91 | % | 81 | % | |||||||||||||||||||||
| $12.40 | 12.59 | % | $21,135 | 1.08 | % | 0.79 | % | 0.78 | % | 2.51 | % | 83 | % | |||||||||||||||||||||
| $11.20 | (7.15 | )% | $141 | 1.43 | % | 0.86 | % | 0.86 | % | 1.94 | % | 47 | % | |||||||||||||||||||||
| $12.35 | 6.32 | % | $462 | 1.85 | % | 0.90 | % | 0.90 | % | 2.18 | % | 57 | % | |||||||||||||||||||||
| $11.88 | 11.13 | % | $1,153 | 4.15 | %10,11 | 1.00 | % | 1.00 | % | 2.34 | % | 115 | % | |||||||||||||||||||||
| $10.69 | 7.62 | % | $850 | 6.96 | % | 1.15 | % | 1.15 | % | 1.61 | % | 81 | % | |||||||||||||||||||||
| $12.09 | 12.95 | % | $14,668 | 0.67 | % | 0.45 | % | 0.45 | % | 3.06 | % | 83 | % | |||||||||||||||||||||
| $10.94 | (6.78 | )% | $89 | 1.01 | % | 0.50 | % | 0.50 | % | 2.45 | % | 47 | % | |||||||||||||||||||||
| $12.37 | (4.99 | )% | $95 | 1.23 | % | 0.55 | % | 0.55 | % | 3.49 | % | 57 | % | |||||||||||||||||||||
| The accompanying notes are an integral part of these financial statements. |
| AQR Funds | Annual Report | September 2016 | ||||||||||||||
207
| Financial Highlights | September 30, 2016 |
| PER SHARE OPERATING PERFORMANCE | ||||||||||||||||||||||||||||
| Change in Net Assets Resulting from Operations1 | Less Dividends and Distributions | |||||||||||||||||||||||||||
| Net Asset Value, Beginning of Period | Net Investment Income (Loss) | Net Realized and Unrealized Gain (Loss) | Net Increase (Decrease) in Net Asset Value from Operations | Distributions from Net Investment Income | Distributions from Net Realized Gains | Total Distributions | ||||||||||||||||||||||
| AQR EMERGING DEFENSIVE STYLE FUND CLASS I | ||||||||||||||||||||||||||||
| FOR THE YEAR ENDED SEPTEMBER 30, 2016 | $8.21 | 0.16 | 0.69 | 0.85 | (0.26) | — | (0.26) | |||||||||||||||||||||
| FOR THE YEAR ENDED SEPTEMBER 30, 2015 | $10.46 | 0.19 | (2.26) | (2.07) | (0.18) | — | (0.18) | |||||||||||||||||||||
| FOR THE YEAR ENDED SEPTEMBER 30, 2014 | $10.27 | 0.25 | 15 | 0.03 | 14 | 0.28 | (0.09) | (0.00) | 7 | (0.09) | ||||||||||||||||||
| NINE MONTHS ENDED SEPTEMBER 30, 2013 | $10.92 | 0.20 | (0.85) | (0.65) | — | — | — | |||||||||||||||||||||
| FOR THE PERIOD 7/09/128—12/31/12 | $10.00 | 0.10 | 0.94 | 1.04 | (0.09) | (0.03) | (0.12) | |||||||||||||||||||||
| AQR EMERGING DEFENSIVE STYLE FUND CLASS N | ||||||||||||||||||||||||||||
| FOR THE YEAR ENDED SEPTEMBER 30, 2016 | $8.34 | 0.15 | 0.70 | 0.85 | (0.19) | — | (0.19) | |||||||||||||||||||||
| FOR THE YEAR ENDED SEPTEMBER 30, 2015 | $10.45 | 0.12 | (2.23) | (2.11) | — | — | — | |||||||||||||||||||||
| FOR THE YEAR ENDED SEPTEMBER 30, 2014 | $10.26 | 0.18 | 15 | 0.08 | 14 | 0.26 | (0.07) | (0.00) | 7 | (0.07) | ||||||||||||||||||
| NINE MONTHS ENDED SEPTEMBER 30, 2013 | $10.93 | 0.16 | (0.83) | (0.67) | — | — | — | |||||||||||||||||||||
| FOR THE PERIOD 7/09/128—12/31/12 | $10.00 | 0.08 | 0.94 | 1.02 | (0.06) | (0.03) | (0.09) | |||||||||||||||||||||
| AQR EMERGING DEFENSIVE STYLE FUND CLASS R6 | ||||||||||||||||||||||||||||
| FOR THE YEAR ENDED SEPTEMBER 30, 2016 | $8.21 | 0.17 | 0.67 | 0.84 | (0.28) | — | (0.28) | |||||||||||||||||||||
| FOR THE YEAR ENDED SEPTEMBER 30, 2015 | $10.46 | 0.21 | (2.27) | (2.06) | (0.19) | — | (0.19) | |||||||||||||||||||||
| FOR THE PERIOD 9/02/1412—9/30/14 | $11.15 | 0.03 | 15 | (0.72) | (0.69) | — | — | — | ||||||||||||||||||||
| AQR GLOBAL EQUITY FUND CLASS I | ||||||||||||||||||||||||||||
| FOR THE YEAR ENDED SEPTEMBER 30, 2016 | $7.80 | 0.10 | 0.76 | 0.86 | (0.12) | (0.42) | (0.54) | |||||||||||||||||||||
| FOR THE YEAR ENDED SEPTEMBER 30, 2015 | $8.91 | 0.12 | 13 | (0.23) | (0.11) | (0.15) | (0.85) | (1.00) | ||||||||||||||||||||
| FOR THE YEAR ENDED SEPTEMBER 30, 2014 | $13.33 | 0.15 | 15 | 1.13 | 1.28 | (0.39) | (5.31) | (5.70) | ||||||||||||||||||||
| NINE MONTHS ENDED SEPTEMBER 30, 2013 | $11.35 | 0.14 | 1.84 | 1.98 | — | — | — | |||||||||||||||||||||
| FOR THE YEAR ENDED DECEMBER 31, 2012 | $9.99 | 0.20 | 1.69 | 1.89 | (0.29) | (0.24) | (0.53) | |||||||||||||||||||||
| FOR THE YEAR ENDED DECEMBER 31, 2011 | $10.97 | 0.21 | (0.95) | (0.74) | (0.11) | (0.13) | (0.24) | |||||||||||||||||||||
| AQR GLOBAL EQUITY FUND CLASS N | ||||||||||||||||||||||||||||
| FOR THE YEAR ENDED SEPTEMBER 30, 2016 | $7.73 | 0.10 | 0.72 | 0.82 | (0.06) | (0.42) | (0.48) | |||||||||||||||||||||
| FOR THE YEAR ENDED SEPTEMBER 30, 2015 | $8.85 | 0.10 | 13 | (0.23) | (0.13) | (0.14) | (0.85) | (0.99) | ||||||||||||||||||||
| FOR THE YEAR ENDED SEPTEMBER 30, 2014 | $13.27 | 0.12 | 15 | 1.12 | 1.24 | (0.35) | (5.31) | (5.66) | ||||||||||||||||||||
| NINE MONTHS ENDED SEPTEMBER 30, 2013 | $11.32 | 0.11 | 1.84 | 1.95 | — | — | — | |||||||||||||||||||||
| FOR THE YEAR ENDED DECEMBER 31, 2012 | $9.97 | 0.16 | 1.70 | 1.86 | (0.27) | (0.24) | (0.51) | |||||||||||||||||||||
| FOR THE YEAR ENDED DECEMBER 31, 2011 | $10.97 | 0.16 | (0.94) | (0.78) | (0.09) | (0.13) | (0.22) | |||||||||||||||||||||
| AQR GLOBAL EQUITY FUND CLASS R6 | ||||||||||||||||||||||||||||
| FOR THE YEAR ENDED SEPTEMBER 30, 2016 | $7.85 | 0.12 | 0.75 | 0.87 | (0.12) | (0.42) | (0.54) | |||||||||||||||||||||
| FOR THE YEAR ENDED SEPTEMBER 30, 2015 | $8.96 | 0.14 | 13 | (0.24) | (0.10) | (0.16) | (0.85) | (1.01) | ||||||||||||||||||||
| FOR THE PERIOD 1/08/1412—9/30/14 | $8.70 | 0.15 | 15 | 0.11 | 0.26 | — | — | — | ||||||||||||||||||||
| AQR INTERNATIONAL EQUITY FUND CLASS I | ||||||||||||||||||||||||||||
| FOR THE YEAR ENDED SEPTEMBER 30, 2016 | $9.61 | 0.21 | 0.67 | 0.88 | (0.20) | (0.12) | (0.32) | |||||||||||||||||||||
| FOR THE YEAR ENDED SEPTEMBER 30, 2015 | $10.99 | 0.21 | (0.71) | (0.50) | (0.33) | (0.55) | (0.88) | |||||||||||||||||||||
| FOR THE YEAR ENDED SEPTEMBER 30, 2014 | $11.88 | 0.28 | 15 | (0.09) | 0.19 | (0.22) | (0.86) | (1.08) | ||||||||||||||||||||
| NINE MONTHS ENDED SEPTEMBER 30, 2013 | $10.24 | 0.17 | 1.47 | 1.64 | — | — | — | |||||||||||||||||||||
| FOR THE YEAR ENDED DECEMBER 31, 2012 | $8.60 | 0.20 | 1.76 | 1.96 | (0.32) | — | (0.32) | |||||||||||||||||||||
| FOR THE YEAR ENDED DECEMBER 31, 2011† | $10.45 | 0.21 | (1.78) | (1.57) | (0.21) | (0.07) | (0.28) | |||||||||||||||||||||
| AQR INTERNATIONAL EQUITY FUND CLASS N | ||||||||||||||||||||||||||||
| FOR THE YEAR ENDED SEPTEMBER 30, 2016 | $9.77 | 0.19 | 0.68 | 0.87 | (0.17) | (0.12) | (0.29) | |||||||||||||||||||||
| FOR THE YEAR ENDED SEPTEMBER 30, 2015 | $11.15 | 0.17 | (0.70) | (0.53) | (0.30) | (0.55) | (0.85) | |||||||||||||||||||||
| FOR THE YEAR ENDED SEPTEMBER 30, 2014 | $12.06 | 0.25 | 15 | (0.10) | 0.15 | (0.20) | (0.86) | (1.06) | ||||||||||||||||||||
| NINE MONTHS ENDED SEPTEMBER 30, 2013 | $10.43 | 0.13 | 1.50 | 1.63 | — | — | — | |||||||||||||||||||||
| FOR THE YEAR ENDED DECEMBER 31, 2012 | $8.76 | 0.19 | 1.76 | 1.95 | (0.28) | — | (0.28) | |||||||||||||||||||||
| FOR THE YEAR ENDED DECEMBER 31, 2011 | $10.61 | 0.20 | (1.83) | (1.63) | (0.15) | (0.07) | (0.22) | |||||||||||||||||||||
| AQR INTERNATIONAL EQUITY FUND CLASS R6 | ||||||||||||||||||||||||||||
| FOR THE YEAR ENDED SEPTEMBER 30, 2016 | $10.16 | 0.16 | 0.77 | 0.93 | (0.20) | (0.12) | (0.32) | |||||||||||||||||||||
| FOR THE YEAR ENDED SEPTEMBER 30, 2015 | $11.56 | 0.18 | (0.68) | (0.50) | (0.35) | (0.55) | (0.90) | |||||||||||||||||||||
| FOR THE PERIOD 1/08/1412—9/30/14 | $12.08 | 0.34 | 15 | (0.86) | (0.52) | — | — | — | ||||||||||||||||||||
| The accompanying notes are an integral part of these financial statements. |
| AQR Funds | Annual Report | September 2016 | ||||||||||||||
208
| Financial Highlights | September 30, 2016 |
| RATIOS/SUPPLEMENTAL DATA | ||||||||||||||||||||||||||||||||||
| Ratios to Average Net Assets of:* | ||||||||||||||||||||||||||||||||||
| Net Asset Value, End of Period | Total Return2,3 | Net Assets, End of Period (000’s) | Expenses, Before Reimbursements and/or Waivers4 | Expenses, Net of Reimbursements and/or Waivers4 | Expenses, Net of Reimbursements and/or Waivers (Excluding Dividend Short Expense & Interest Expense)4 | Net Investment Income (Loss) | Portfolio Turnover Rate5 | |||||||||||||||||||||||||||
| $8.80 | 10.73 | % | $49,612 | 1.15 | % | 0.68 | % | 0.68 | % | 1.90 | % | 23 | % | |||||||||||||||||||||
| $8.21 | (20.07 | )% | $27,221 | 1.12 | % | 0.76 | % | 0.76 | % | 1.92 | % | 117 | % | |||||||||||||||||||||
| $10.46 | 2.78 | % | $70,070 | 1.23 | % | 0.85 | % | 0.85 | % | 2.35 | %15 | 124 | % | |||||||||||||||||||||
| $10.27 | (5.95 | )% | $29,471 | 2.08 | %10 | 0.96 | % | 0.96 | % | 2.55 | % | 181 | % | |||||||||||||||||||||
| $10.92 | 10.39 | % | $5,402 | 4.14 | % | 1.15 | % | 1.15 | % | 1.92 | % | 38 | % | |||||||||||||||||||||
| $9.00 | 10.42 | % | $207 | 1.38 | % | 0.91 | % | 0.91 | % | 1.79 | % | 23 | % | |||||||||||||||||||||
| $8.34 | (20.19 | )% | $54 | 1.40 | % | 1.03 | % | 1.03 | % | 1.22 | % | 117 | % | |||||||||||||||||||||
| $10.45 | 2.60 | % | $1,017 | 1.68 | % | 1.10 | % | 1.10 | % | 1.73 | %15 | 124 | % | |||||||||||||||||||||
| $10.26 | (6.13 | )% | $2,594 | 3.50 | %10 | 1.25 | % | 1.25 | % | 2.06 | % | 181 | % | |||||||||||||||||||||
| $10.93 | 10.22 | % | $1,804 | 5.41 | % | 1.40 | % | 1.40 | % | 1.67 | % | 38 | % | |||||||||||||||||||||
| $8.77 | 10.67 | % | $190 | 1.05 | % | 0.60 | % | 0.60 | % | 2.06 | % | 23 | % | |||||||||||||||||||||
| $8.21 | (19.96 | )% | $75 | 1.08 | % | 0.66 | % | 0.65 | % | 2.16 | % | 117 | % | |||||||||||||||||||||
| $10.46 | (6.19 | )% | $94 | 1.36 | % | 0.70 | % | 0.70 | % | 4.04 | %15 | 124 | % | |||||||||||||||||||||
| $8.12 | 11.33 | % | $33,013 | 0.96 | % | 0.89 | % | 0.89 | % | 1.36 | % | 78 | % | |||||||||||||||||||||
| $7.80 | (1.64 | )% | $34,186 | 0.90 | % | 0.90 | % | 0.90 | % | 1.49 | %13 | 73 | % | |||||||||||||||||||||
| $8.91 | 11.55 | % | $2,492 | 1.14 | % | 0.91 | % | 0.91 | % | 1.62 | %15 | 90 | % | |||||||||||||||||||||
| $13.33 | 17.44 | % | $1,263 | 2.27 | %10,11 | 0.95 | % | 0.95 | % | 1.46 | % | 71 | % | |||||||||||||||||||||
| $11.35 | 18.95 | % | $626 | 1.41 | % | 0.95 | % | 0.94 | % | 1.83 | % | 87 | % | |||||||||||||||||||||
| $9.99 | (6.68 | )% | $2,103 | 2.03 | % | 0.96 | % | 0.95 | % | 1.90 | % | 59 | % | |||||||||||||||||||||
| $8.07 | 10.93 | % | $1,712 | 1.20 | % | 1.13 | % | 1.12 | % | 1.28 | % | 78 | % | |||||||||||||||||||||
| $7.73 | (1.86 | )% | $765 | 1.17 | % | 1.17 | % | 1.17 | % | 1.18 | %13 | 73 | % | |||||||||||||||||||||
| $8.85 | 11.17 | % | $1,128 | 1.60 | % | 1.21 | % | 1.21 | % | 1.28 | %15 | 90 | % | |||||||||||||||||||||
| $13.27 | 17.23 | % | $712 | 3.06 | %10,11 | 1.25 | % | 1.25 | % | 1.14 | % | 71 | % | |||||||||||||||||||||
| $11.32 | 18.67 | % | $518 | 1.87 | % | 1.25 | % | 1.24 | % | 1.51 | % | 87 | % | |||||||||||||||||||||
| $9.97 | (7.03 | )% | $2,019 | 3.22 | % | 1.27 | % | 1.26 | % | 1.46 | % | 59 | % | |||||||||||||||||||||
| $8.18 | 11.33 | % | $106,573 | 0.77 | % | 0.70 | % | 0.70 | % | 1.59 | % | 78 | % | |||||||||||||||||||||
| $7.85 | (1.47 | )% | $85,017 | 0.71 | % | 0.70 | % | 0.70 | % | 1.69 | %13 | 73 | % | |||||||||||||||||||||
| $8.96 | 2.99 | % | $76,031 | 0.73 | % | 0.70 | % | 0.70 | % | 2.23 | %15 | 90 | % | |||||||||||||||||||||
| $10.17 | 9.34 | % | $370,530 | 0.97 | % | 0.95 | % | 0.95 | % | 2.14 | % | 62 | % | |||||||||||||||||||||
| $9.61 | (4.79 | )% | $320,807 | 0.92 | % | 0.92 | % | 0.92 | % | 1.98 | % | 84 | % | |||||||||||||||||||||
| $10.99 | 1.33 | % | $247,847 | 0.90 | % | 0.90 | % | 0.90 | % | 2.41 | %15 | 71 | % | |||||||||||||||||||||
| $11.88 | 16.02 | % | $241,467 | 0.90 | %10 | 0.90 | % | 0.90 | % | 2.11 | % | 59 | % | |||||||||||||||||||||
| $10.24 | 22.87 | % | $196,971 | 0.91 | % | 0.91 | % | 0.90 | % | 2.17 | % | 74 | % | |||||||||||||||||||||
| $8.60 | (15.00 | )% | $138,229 | 0.94 | % | 0.94 | % | 0.93 | % | 2.13 | % | 60 | % | |||||||||||||||||||||
| $10.35 | 9.04 | % | $37,297 | 1.20 | % | 1.18 | % | 1.18 | % | 1.89 | % | 62 | % | |||||||||||||||||||||
| $9.77 | (4.99 | )% | $36,174 | 1.21 | % | 1.21 | % | 1.21 | % | 1.61 | % | 84 | % | |||||||||||||||||||||
| $11.15 | 0.96 | % | $39,336 | 1.25 | % | 1.25 | % | 1.25 | % | 2.11 | %15 | 71 | % | |||||||||||||||||||||
| $12.06 | 15.63 | % | $32,011 | 1.29 | %10 | 1.29 | % | 1.29 | % | 1.52 | % | 59 | % | |||||||||||||||||||||
| $10.43 | 22.41 | % | $15,562 | 1.28 | % | 1.28 | % | 1.27 | % | 2.00 | % | 74 | % | |||||||||||||||||||||
| $8.76 | (15.27 | )% | $1,167 | 2.18 | % | 1.35 | % | 1.34 | % | 1.96 | % | 60 | % | |||||||||||||||||||||
| $10.77 | 9.40 | % | $14,387 | 0.77 | % | 0.77 | % | 0.77 | % | 1.57 | % | 62 | % | |||||||||||||||||||||
| $10.16 | (4.59 | )% | $32,648 | 0.75 | % | 0.75 | % | 0.75 | % | 1.61 | % | 84 | % | |||||||||||||||||||||
| $11.56 | (4.30 | )% | $103,882 | 0.74 | % | 0.74 | % | 0.74 | % | 3.90 | %15 | 71 | % | |||||||||||||||||||||
| The accompanying notes are an integral part of these financial statements. |
| AQR Funds | Annual Report | September 2016 | ||||||||||||||
209
| Financial Highlights | September 30, 2016 |
| * | Annualized for periods less than one year. |
| † | Redemption fees of less than $0.005 per share were incurred by the share class. |
| 1 | Per share net investment income (loss) and net realized and unrealized gain (loss) are based on average shares outstanding. |
| 2 | Total investment return is calculated assuming an initial investment made at the net asset value at the beginning of the period, reinvestment of all dividends and distributions at net asset value during the period and redemption on the last day of the period and is not annualized. |
| 3 | Includes adjustments in accordance with accounting principles generally accepted in the United States of America and as such, the net asset value for financial reporting purposes and the returns based upon those net asset values may differ from the net asset value and returns for shareholder transactions. |
| 4 | Ratios do not include the impact of the expenses of the underlying funds in which the Fund invests. |
| 5 | Portfolio turnover is not annualized. |
| 6 | Effective April 1, 2015, Class L Shares were renamed Class I Shares |
| 7 | Amount is less than $.005 per share. |
| 8 | Commencement of operations. |
| 9 | For the period ended September 30, 2013 certain Funds received special dividends which materially impacted the Net Investment Income Per Share and Net Investment Income Ratio. These dividends are not expected to continue in the future. Had these special dividends not been received the Net Investment Income Per Share and Net Investment Income Ratio would have been as follows: |
| FUND | NET INVESTMENT INCOME PER SHARE | NET INVESTMENT INCOME RATIO | ||||||
AQR Large Cap Multi-Style Fund—Class I . . . . . . . . . . . . . . . . . . . . . . . . . . . . . . . . . . . . . . . . .. | $0.06 | 0.98 | % | |||||
AQR Large Cap Multi-Style Fund—Class N . . . . . . . . . . . . . . . . . . . . . . . . . . . . . . . . . . . . . . . . | 0.04 | 0.61 | ||||||
AQR Small Cap Multi-Style Fund—Class I . . . . . . . . . . . . . . . . . . . . . . . . . . . . . . . . . . . . . . . . | 0.03 | 0.38 | ||||||
AQR Small Cap Multi-Style Fund—Class N . . . . . . . . . . . . . . . . . . . . . . . . . . . . . . . . . . . . . . . . | 0.01 | 0.10 | ||||||
AQR International Multi-Style Fund—Class I . . . . . . . . . . . . . . . . . . . . . . . . . . . . . . . . . . . . . . .. | 0.13 | 2.08 | ||||||
AQR International Multi-Style Fund—Class N . . . . . . . . . . . . . . . . . . . . . . . . . . . . . . . . . . . . . . | 0.15 | 2.48 | ||||||
AQR Large Cap Momentum Style Fund—Class I . . . . . . . . . . . . . . . . . . . . . . . . . . . . . . . . . . . . | 0.11 | 0.80 | ||||||
AQR Large Cap Momentum Style Fund—Class N . . . . . . . . . . . . . . . . . . . . . . . . . . . . . . . . . . . | 0.08 | 0.56 | ||||||
AQR Small Cap Momentum Style Fund—Class I . . . . . . . . . . . . . . . . . . . . . . . . . . . . . . . . . . . | 0.07 | 0.52 | ||||||
AQR Small Cap Momentum Style Fund—Class N . . . . . . . . . . . . . . . . . . . . . . . . . . . . . . . . . . . | 0.01 | 0.10 | ||||||
AQR International Momentum Style Fund—Class I . . . . . . . . . . . . . . . . . . . . . . . . . . . . . . . . . . | 0.21 | 1.97 | ||||||
AQR International Momentum Style Fund—Class N . . . . . . . . . . . . . . . . . . . . . . . . . . . . . . . . . . | 0.23 | 2.16 | ||||||
AQR TM Large Cap Momentum Style Fund—Class I . . . . . . . . . . . . . . . . . . . . . . . . . . . . . . . . . | 0.09 | 0.92 | ||||||
AQR TM Large Cap Momentum Style Fund—Class N . . . . . . . . . . . . . . . . . . . . . . . . . . . . . . . . . | 0.07 | 0.63 | ||||||
AQR TM Small Cap Momentum Style Fund—Class I . . . . . . . . . . . . . . . . . . . . . . . . . . . . . . . . . | 0.04 | 0.37 | ||||||
AQR TM Small Cap Momentum Style Fund—Class N . . . . . . . . . . . . . . . . . . . . . . . . . . . . . . . . . | 0.01 | 0.14 | ||||||
| 10 | Certain expenses incurred by the Fund were not annualized for the period. |
| 11 | Ratios are disproportionate between classes due to size of net assets and fixed expenses. |
| 12 | Commencement of offering of shares. |
| 13 | For the period ended September 30, 2015 certain Funds received special dividends which materially impacted the Net Investment Income Per Share and Net Investment Income Ratio. These dividends are not expected to continue in the future. Had these special dividends not been received the Net Investment Income Per Share and Net Investment Income Ratio would have been as follows: |
| FUND | NET INVESTMENT INCOME PER SHARE | NET INVESTMENT INCOME RATIO | ||||||
AQR Small Cap Multi-Style Fund—Class I . . . . . . . . . . . . . . . . . . . . . . . . . . . . . . . . . . . . . . . . | $0.10 | 0.76 | % | |||||
AQR Small Cap Multi-Style Fund—Class N . . . . . . . . . . . . . . . . . . . . . . . . . . . . . . . . . . . . . . . . | 0.07 | 0.53 | ||||||
AQR Small Cap Multi-Style Fund—Class R6 . . . . . . . . . . . . . . . . . . . . . . . . . . . . . . . . . . . . . . . | 0.13 | 1.05 | ||||||
AQR International Multi-Style Fund—Class I . . . . . . . . . . . . . . . . . . . . . . . . . . . . . . . . . . . . . . .. | 0.25 | 2.28 | ||||||
AQR International Multi-Style Fund—Class N . . . . . . . . . . . . . . . . . . . . . . . . . . . . . . . . . . . . . . | 0.22 | 2.02 | ||||||
AQR International Multi-Style Fund—Class R6 . . . . . . . . . . . . . . . . . . . . . . . . . . . . . . . . . . . . . | 0.28 | 2.53 | ||||||
AQR Small Cap Momentum Style Fund—Class I . . . . . . . . . . . . . . . . . . . . . . . . . . . . . . . . . . . | 0.13 | 0.58 | ||||||
AQR Small Cap Momentum Style Fund—Class N . . . . . . . . . . . . . . . . . . . . . . . . . . . . . . . . . . . | 0.07 | 0.32 | ||||||
AQR Small Cap Momentum Style Fund—Class R6 . . . . . . . . . . . . . . . . . . . . . . . . . . . . . . . . . . | 0.11 | 0.51 | ||||||
AQR TM Small Cap Momentum Style Fund—Class I . . . . . . . . . . . . . . . . . . . . . . . . . . . . . . . . . | 0.09 | 0.57 | ||||||
AQR TM Small Cap Momentum Style Fund—Class N . . . . . . . . . . . . . . . . . . . . . . . . . . . . . . . . . | 0.05 | 0.34 | ||||||
AQR TM Small Cap Momentum Style Fund—Class R6 . . . . . . . . . . . . . . . . . . . . . . . . . . . . . . . . . | 0.10 | 0.66 | ||||||
AQR Global Equity Fund—Class I . . . . . . . . . . . . . . . . . . . . . . . . . . . . . . . . . . . . . . . . . . . . . . . . .. | 0.10 | 1.26 | ||||||
AQR Global Equity Fund—Class N . . . . . . . . . . . . . . . . . . . . . . . . . . . . . . . . . . . . . . . . . . . . . . . . .. | 0.08 | 0.95 | ||||||
AQR Global Equity Fund—Class R6 . . . . . . . . . . . . . . . . . . . . . . . . . . . . . . . . . . . . . . . . . . . . . . .. | 0.12 | 1.46 | ||||||
| 14 | The amount shown for a share outstanding throughout the period is not indicative of the aggregate net realized and unrealized gain (loss) for that period because of the timing of sales and repurchases of the Fund shares in relation to fluctuating market value of the investments in the Fund. |
| The accompanying notes are an integral part of these financial statements. |
| AQR Funds | Annual Report | September 2016 | ||||||||||||||
210
| Financial Highlights | September 30, 2016 |
| 15 | For the period ended September 30, 2014 certain Funds received special dividends which materially impacted the Net Investment Income Per Share and Net Investment Income Ratio. These dividends are not expected to continue in the future. Had these special dividends not been received the Net Investment Income Per Share and Net Investment Income Ratio would have been as follows: |
| FUND | NET INVESTMENT INCOME PER SHARE | NET INVESTMENT INCOME RATIO | ||||||
AQR Small Cap Multi-Style Fund—Class I | $0.04 | 0.28 | % | |||||
AQR Small Cap Multi-Style Fund—Class N | (0.00 | ) | 0.02 | |||||
AQR Small Cap Multi-Style Fund—Class R6 | (0.00 | ) | 0.36 | |||||
AQR Small Cap Momentum Style Fund—Class I | (0.02 | ) | (0.07 | ) | ||||
AQR Small Cap Momentum Style Fund—Class N | (0.08 | ) | (0.34 | ) | ||||
AQR Small Cap Momentum Style Fund—Class R6 | (0.01 | ) | 0.05 | |||||
AQR International Momentum Style Fund—Class I | 0.25 | 1.57 | ||||||
AQR International Momentum Style Fund—Class N | 0.20 | 1.26 | ||||||
AQR International Momentum Style Fund—Class R6 | 0.03 | 1.22 | ||||||
AQR TM International Momentum Style Fund—Class I | 0.22 | 1.63 | ||||||
AQR TM International Momentum Style Fund—Class N | 0.16 | 1.16 | ||||||
AQR TM International Momentum Style Fund—Class R6 | 0.02 | 1.03 | ||||||
AQR Emerging Defensive Style Fund—Class I | 0.23 | 2.13 | ||||||
AQR Emerging Defensive Style Fund—Class N | 0.16 | 1.51 | ||||||
AQR Emerging Defensive Style Fund—Class R6 | 0.01 | 3.82 | ||||||
AQR Global Equity Fund—Class I | 0.14 | 1.50 | ||||||
AQR Global Equity Fund—Class N | 0.11 | 1.16 | ||||||
AQR Global Equity Fund—Class R6 | 0.14 | 2.11 | ||||||
AQR International Equity Fund—Class I | 0.26 | 2.22 | ||||||
AQR International Equity Fund—Class N | 0.23 | 1.92 | ||||||
AQR International Equity Fund—Class R6 | 0.32 | 3.71 | ||||||
| 16 | For the period ended September 30, 2016 certain Funds received special dividends which materially impacted the Net Investment Income Per Share and Net Investment Income Ratio. These dividends are not expected to continue in the future. Had these special dividends not been received the Net Investment Income Per Share and Net Investment Income Ratio would have been as follows: |
| FUND | NET INVESTMENT INCOME PER SHARE | NET INVESTMENT INCOME RATIO | ||||||
AQR TM Small Cap Multi-Style Fund—Class I | $0.11 | 1.14 | % | |||||
AQR TM Small Cap Multi-Style Fund—Class N | 0.09 | 0.92 | ||||||
AQR TM Small Cap Multi-Style Fund—Class R6 | 0.11 | 1.13 | ||||||
AQR TM Large Cap Momentum Style Fund—Class I | 0.21 | 1.27 | ||||||
AQR TM Large Cap Momentum Style Fund—Class N | 0.18 | 1.10 | ||||||
AQR TM Large Cap Momentum Style Fund—Class R6 | 0.22 | 1.36 | ||||||
| 17 | For the period ended December 31, 2012 certain Funds received special dividends which materially impacted the Net Investment Income Per Share and Net Investment Income Ratio. These dividends are not expected to continue in the future. Had these special dividends not been received the Net Investment Income Per Share and Net Investment Income Ratio would have been as follows: |
| FUND | NET INVESTMENT INCOME PER SHARE | NET INVESTMENT INCOME RATIO | ||||||
AQR Large Cap Momentum Style Fund—Class I | $0.24 | 1.57 | % | |||||
AQR Large Cap Momentum Style Fund—Class N | 0.01 | 1.07 | ||||||
AQR Small Cap Momentum Style Fund—Class I | 0.15 | 1.01 | ||||||
AQR Small Cap Momentum Style Fund—Class N | 0.02 | 2.93 | ||||||
AQR TM Large Cap Momentum Style Fund—Class I | 0.17 | 1.76 | ||||||
AQR TM Large Cap Momentum Style Fund—Class N | 0.01 | 2.28 | ||||||
AQR TM Small Cap Momentum Style Fund—Class I | 0.12 | 1.26 | ||||||
AQR TM Small Cap Momentum Style Fund—Class N | 0.02 | 3.54 | ||||||
AQR Large Cap Defensive Style Fund—Class I | 0.11 | 2.58 | ||||||
AQR Large Cap Defensive Style Fund—Class N | 0.05 | 1.38 | ||||||
| 18 | The ratio is not representative of what the ratio would be if the Fund class had operated for a longer period of time. Certain expenses incurred by the Fund were not annualized for the period. |
| The accompanying notes are an integral part of these financial statements. |
| AQR Funds | Annual Report | September 2016 | ||||||||||||||
211
| Notes to Financial Statements | September 30, 2016 |
1. Organization
AQR Funds (the “Trust”), was organized as a Delaware statutory trust on September 4, 2008. The Trust is an open-end management investment company, registered under the Investment Company Act of 1940, as amended (the “1940 Act”). As of September 30, 2016, the Trust consists of thirty-three active series, twenty of which are presented in this book (collectively, the “Funds” and each individually a “Fund”): AQR Large Cap Multi-Style Fund, AQR Small Cap Multi-Style Fund, AQR International Multi-Style Fund, AQR Emerging Multi-Style Fund, AQR TM Large Cap Multi-Style Fund, AQR TM Small Cap Multi-Style Fund, AQR TM International Multi-Style Fund, AQR TM Emerging Multi-Style Fund, AQR Large Cap Momentum Style Fund, AQR Small Cap Momentum Style Fund, AQR International Momentum Style Fund, AQR Emerging Momentum Style Fund, AQR TM Large Cap Momentum Style Fund, AQR TM Small Cap Momentum Style Fund, AQR TM International Momentum Style Fund, AQR Large Cap Defensive Style Fund, AQR International Defensive Style Fund, AQR Emerging Defensive Style Fund, AQR Global Equity Fund and AQR International Equity Fund. The remaining active series, which have a fiscal year-end of December 31st, are reported in a separate book. AQR Capital Management, LLC (the “Adviser”) serves as the investment adviser of each Fund.
The investment objective for AQR Large Cap Multi-Style Fund, AQR Small Cap Multi-Style Fund, AQR International Multi-Style Fund, AQR Emerging Multi-Style Fund, AQR Large Cap Momentum Style Fund, AQR Small Cap Momentum Style Fund, AQR International Momentum Style Fund, AQR Emerging Momentum Style Fund, AQR Global Equity Fund and AQR International Equity Fund is to seek long-term capital appreciation. The investment objective for AQR Large Cap Defensive Style Fund, AQR International Defensive Style Fund and AQR Emerging Defensive Style Fund is to seek total return. The investment objective for AQR TM Large Cap Multi-Style Fund, AQR TM Small Cap Multi-Style Fund, AQR TM International Multi-Style Fund, AQR TM Emerging Multi-Style Fund, AQR TM Large Cap Momentum Style Fund, AQR TM Small Cap Momentum Style Fund and AQR TM International Momentum Style Fund is to seek long-term after-tax capital appreciation.
Each Fund offers Class I, N and R6 shares. On April 1, 2016 and May 9, 2016, AQR International Equity Fund and AQR Global Equity Fund closed Class Y shares, respectively.
2. Significant Accounting Policies
The Funds are investment companies and apply specialized accounting and reporting guidance in conformity with accounting principles generally accepted in the United States of America (“GAAP”).
Use of Estimates: The preparation of the financial statements in conformity with GAAP requires the Adviser to make estimates and assumptions that affect the fair value of investments, the reported amounts of assets and liabilities and disclosure of contingent assets and liabilities, if any, at the date of the financial statements and the reported amounts of increases and decreases in net assets from operations during the reporting period. Actual results could differ from those estimates and such differences could be material.
Valuation of Investments: All securities and other investments are recorded at their estimated fair value, as described in Note 4.
Cash: Cash comprises U.S. Dollar and foreign currency deposits held at a bank(s) or custodian bank(s) which may exceed insured limits. The Funds are subject to risk to the extent that the institutions may be unable to fulfill their obligations.
Due to/from Brokers: Due to/from brokers represents cash balances on deposit with, or cash balances or owned to, the Funds’ prime brokers and counterparties. The Funds are subject to credit risk should the prime brokers and counterparties be unable to meet their obligations to the Funds.
Foreign Currency Translation: The books and records of the Funds are maintained in U.S. Dollars. The Funds’ assets and liabilities in foreign currencies are translated into U.S. Dollars at the prevailing exchange rate at the valuation date. Transactions denominated in foreign currencies are translated into U.S. Dollars at the prevailing exchange rate on the date of the transaction. The Funds’ income earned and expense incurred in foreign denominated currencies are translated into U.S. Dollars at the prevailing exchange rate on the date of such activity.
The Funds do not isolate that portion of the results of operations arising from changes in the foreign exchange rates on investments and derivatives from the fluctuations that result from changes in the market prices of investments and derivatives held or sold during the period. Accordingly, such foreign currency gains (losses) are included in the reported net realized gain (loss) on investments in securities and derivatives and net change in unrealized appreciation (depreciation) on investment securities and derivatives on the Statements of Operations.
Realized gains (losses) on foreign currency and foreign currency transactions reported on the Statements of Operations arise from the disposition of foreign currency and a change between the amounts of dividends, interest and foreign withholding taxes recorded on the Funds’ books on the transaction date and the U.S. Dollar equivalent of the amounts actually received or paid. Changes in unrealized appreciation (depreciation) on foreign currency and foreign currency translation reported on the Statements of Operations arise from changes (due to the changes in the exchange rate) in the value of foreign currency and assets and liabilities (other than investments) denominated in foreign currencies, which are held at period end.
Investment Transactions and Related Income: Investment transactions are accounted for on trade date (the date the order to buy or sell is executed). Securities gains and losses are calculated on a specifically identified cost basis. Interest income is determined on the basis of coupon
| AQR Funds | Annual Report | September 2016 | ||||||||||||||
212
| Notes to Financial Statements | September 30, 2016 |
interest accrued using the effective interest method adjusted for amortization of premiums and accretion of discounts using the effective yield method. Dividend income (expense) net of foreign taxes withheld, if any, is recorded on the ex-dividend date or when the Fund first learns of the ex-date dividend notification. Interest purchased and interest sold on bonds is included in interest receivable and interest payable, respectively, in the Statements of Assets and Liabilities. For inflation-linked bonds, interest income (expense) is earned on the principal amount and adjusted for the changes in the relevant consumer price index.
Multi-class Operations: Each class of shares offered by the Trust has equal rights as to earnings, assets and voting privileges, except that each class may bear different sub-transfer agency and distribution fees and shareholders of a class have exclusive voting rights regarding any matter relating solely to that class of shares. Income, non-class specific expenses, realized and unrealized gains and losses are allocated daily to each class of shares based upon the proportion of relative net assets at the beginning of each day. Each Fund is charged for those expenses that are directly attributable to each Fund. Trust level expenses are allocated among the Funds based on the ratio of average net assets or other reasonable methodology.
The Funds record distributions received in excess of income from underlying investments as a reduction of cost of investments and/or realized gain. Such amounts are based on estimates (if actual amounts are not available) and actual amounts of income, realized gain and return of capital may differ from the estimated amounts. The Funds adjust the estimated amounts of components of distributions (and consequently net investment income) as necessary once the issuers provide information about the actual composition of the distributions.
The Funds may be subject to foreign taxes on income, capital gains on investments or currency repatriation, a portion of which may be recoverable. The Funds will accrue such taxes and recoveries as applicable, based upon their current interpretation of tax rules and regulations that exist in the markets in which they invest.
Offering Cost: Offering costs, including professional fees, printing fees and initial registration, are amortized over a period not longer than twelve months from the date the Funds commenced operations.
Federal Income Taxes: Each Fund is treated as a separate taxable entity for federal income tax purposes. Each Fund intends to qualify as a “regulated investment company” under Subchapter M of the Internal Revenue Code of 1986, as amended (the “Code”). If so qualified, each Fund will not be subject to federal income tax to the extent it distributes substantially all of its net investment income and capital gains to shareholders. Accordingly no provision for Federal income tax is necessary.
The Adviser evaluates tax positions taken or expected to be taken in the course of preparing the Funds’ tax returns to determine whether the tax positions are “more-likely-than-not” of being sustained by the applicable tax authority. Tax positions deemed to meet the more-likely-than-not threshold would be recorded as a tax benefit or expense in the current year. The Funds are required to analyze all open tax years. Open tax years are those years that are open for examination by the relevant income taxing authority. The Funds have concluded that there is no tax liability/benefit resulting from uncertain income tax positions taken or expected to be taken. The Funds are not aware of any tax positions for which it is reasonably possible that the total amounts of unrecognized tax expense will materially change in the next twelve months. The returns of the Funds for the prior three fiscal years as well as current year, or since inception if shorter, are open for examination. As of September 30, 2016, the Funds had no examinations in progress.
Distributions to Shareholders: Distributions to shareholders are recorded on the ex-dividend date. The Funds intend to declare and distribute substantially all of their net investment income and net realized capital gains, if any, at least annually. Income and capital gain distributions will be determined in accordance with federal income tax regulations which may differ from GAAP. Differences may be permanent or temporary. Permanent differences are reclassified among capital accounts in the financial statements to reflect their tax character. Temporary differences arise when certain items of income, expense, gain, or loss are recognized in different periods for financial statement and tax purposes. These differences will reverse at some time in the future. Differences in classification may also result from the treatment of short-term gains as ordinary income for tax purposes. As a result, income dividends and capital gain distributions declared during a fiscal period may differ significantly from the net investment income (loss) and realized gains (losses) reported on the Funds’ financial statements presented under GAAP.
Distributions classified as a tax basis return of capital, if any, are reflected on the accompanying Statements of Changes in Net Assets and have been recorded to paid in capital. In addition, other amounts have been reclassified between undistributed net investment income, accumulated undistributed/overdistributed net realized gains or losses and/or paid in capital to more appropriately conform financial accounting to tax characterizations of dividend distributions.
Indemnification: In the normal course of business, the Funds may enter into various agreements that provide for general indemnifications. The Funds’ maximum exposure under these arrangements is unknown as any potential exposure involves future claims that may be made against the Funds. However, based on experience, the Funds expect the risk of loss to be remote.
3. Securities and Other Investments
Futures Contracts: Certain Funds invest in futures contracts as part of their primary investment strategy and to equitize its cash flows. Investments in futures may increase or decrease exposure to a particular market. In the event of a bankruptcy or insolvency of a futures
| AQR Funds | Annual Report | September 2016 | ||||||||||||||
213
| Notes to Financial Statements | September 30, 2016 |
commission merchant that holds margin on behalf of the Funds, the Funds may not receive the return of the entire margin owed to the Funds, potentially resulting in a loss. A change in market value of an open futures contract is recorded in the Statements of Operations as change in unrealized appreciation (depreciation) on futures contracts. A realized gain (loss) represents the difference between the value of the contract at the time it was opened and the value at the time it was closed or expired, and is reported in the Statements of Operations. The use of long futures contracts subjects the Funds to risk of loss in excess of the variation margin on the Statements of Assets and Liabilities. The use of short futures contracts subjects the Funds to unlimited risk of loss. Futures contracts outstanding at period end, if any, are listed after each Fund’s Schedule of Investments.
Forward Foreign Currency Exchange Contracts: Certain Funds buy and sell forward foreign currency exchange contracts, which are agreements between two parties to buy and sell currencies at a set price on a future date. These contracts are used to protect against a decline in value relative to the U.S. Dollar of the currencies in which portfolio securities are denominated or quoted (or an increase in the value of a currency in which securities that a Fund intends to buy are denominated, when a Fund holds cash reserves and short term investments), or for other investment purposes. The market value of the contract will fluctuate with changes in currency exchange rates. The contract is marked to market daily and the change in market value is recorded as unrealized appreciation or depreciation. When the contract is closed, the Funds record a realized gain or loss equal to the difference between the value of the contract at the time it was opened and the value at the time it was closed. The Funds could be exposed to risk if the value of the currency changes unfavorably, if the counterparties to the contracts are unable to meet the terms of their contracts or if the Funds are unable to enter into a closing position. Risks may exceed amounts recognized on the Statements of Assets and Liabilities. Non-deliverable forward foreign currency exchange contracts are settled with the counterparty in U.S. Dollars without the delivery of foreign currency. Forward foreign currency exchange contracts outstanding at period end, if any, are listed after each Fund’s Schedule of Investments.
Swap Contracts: Certain Funds engage in various swap transactions to manage risks within their portfolios or as alternatives to direct investments. Swap transactions may be privately negotiated in the over-the-counter (“OTC”) market where payments are settled through direct payments between a Fund and the counterparty. By contrast, certain swap transactions are subject to mandatory central clearing (“centrally cleared swaps”). These swaps are executed through a derivatives clearing member (“DCM”), acting in an agency capacity, and submitted to a central counterparty (“CCP”), in which case all payments are settled with the CCP through the DCM. For credit default and interest rate contracts, an up-front payment received by a Fund is recorded as a liability on the Funds’ Statements of Assets and Liabilities. An up-front payment made by a Fund is recorded as an asset on the Funds’ Statements of Assets and Liabilities. Up-front payments are amortized over the term of the contract. Periodic payments received (paid) by a Fund are recorded as realized gains (losses) on swap contracts in the Statements of Operations.
The Funds’ use of swap contracts create additional risks beyond those that would exist if the Funds invested in the underlying positions directly, including: market risk related to unfavorable changes in interest rates or in the price(s) of the underlying security(ies); credit risk related to the counterparty’s failure to perform under contract terms; and liquidity risk related to the lack of a liquid market for the swap contract, which may limit the ability of the Funds to close out their position(s).
Total Return Swap Contracts: Certain Funds invest in total return swaps to obtain exposure to the underlying referenced instruments, obtain leverage or attain the returns from ownership without actually owning the underlying position. Total return swaps are two-party contracts that generally obligate one party to pay the positive return and the other party to pay the negative return on a specified reference security, security index or index component during the period of the swap. Total return swap contracts are marked to market daily and the change, if any, is recorded as net change in appreciation (depreciation) on swap contracts in the Statements of Operations. Total return swaps normally do not involve the delivery of securities or other underlying assets. If the counterparty to a total return swap contract defaults, a Fund’s risk of loss consists of the net amount of payments the Fund is contractually entitled to receive, if any. The use of long total return swap contracts subject the Funds to risk of loss in excess of the amounts shown on the Statements of Assets and Liabilities. The use of short total return swaps subject the Funds to unlimited loss. Periodic payments received (paid) by the Funds are recorded as realized gains (losses) on swap contracts in the Statements of Operations. Total return swap contracts outstanding at period end, if any, are listed after each Fund’s Schedule of Investments.
Securities Lending: Certain Funds may lend securities to qualified borrowers approved by the Adviser in order to generate additional income. Securities loaned are collateralized by cash valued at 102% to 105% of the market value of the securities on loan. The Funds invest cash collateral in money market funds as indicated on the Schedule of Investments, and record a liability in the Statements of Assets and Liabilities for the return of the collateral, during the period the securities are on loan. Daily market fluctuations could cause the value of loaned securities to be more or less than the value of the collateral received. When this occurs, the collateral is adjusted and settled on the next business day. The Funds bear the risk of loss associated with the collateral investments and are not entitled to additional collateral from the borrower to cover any such losses. Loans are subject to termination by the Funds or the borrower at any time. Securities lending also involves counterparty risks, including the risk that the loaned securities may not be returned in a timely manner or at all. In the event of a default by a borrower with respect to any loan, the lending agent will exercise any and all remedies provided under the applicable borrower agreement to make the Funds whole. If, despite such efforts by the lending agent to exercise these remedies, the Funds sustain losses as a result of a borrower’s default, the lending agent indemnifies the Funds by purchasing replacement securities at its expense, or paying the Funds an amount equal to the market value of the replacement securities, subject to certain limitations which are set forth in the Securities Lending Agency Agreement between the Funds and the lending agent. Securities lending income represents fees charged to borrowers plus income earned on invested cash collateral, less expenses associated with the loan. This amount is recorded as Securities lending income, net on the Statements of Operations. Certain of the
| AQR Funds | Annual Report | September 2016 | ||||||||||||||
214
| Notes to Financial Statements | September 30, 2016 |
securities on loan may have been sold prior to the close of the reporting period and are included in Receivables for Securities Sold on the Statements of Assets and Liabilities.
The following table presents the liabilities under the outstanding securities lending transactions as of September 30, 2016, on the basis of the nature, characteristics and risks associated with the investment of the cash collateral received in a money market fund, in accordance with guidance presented in FASB ASU 2014-11, Balance Sheet (Topic) 860: Repurchase-to-Maturity Transactions, Repurchase Financings, and Disclosures (“ASU 2014-11”). As the securities loans are subject to termination by the Funds or the borrower at any time, the remaining contractual maturities of the outstanding securities lending transactions are considered to be overnight and continuous.
| FUND | COMMON STOCKS (OVERNIGHT& | TOTAL BORROWINGS | ||||||
AQR Small Cap Multi-Style Fund | $ | 66,623,428 | $ | 66,623,428 | ||||
AQR Emerging Multi-Style Fund | 4,314,790 | 4,314,790 | ||||||
AQR TM Small Cap Multi-Style Fund | 1,409,090 | 1,409,090 | ||||||
AQR TM Emerging Multi-Style Fund | 4,165,729 | 4,165,729 | ||||||
AQR Small Cap Momentum Style Fund | 24,311,255 | 24,311,255 | ||||||
AQR Emerging Momentum Style Fund | 53,284 | 53,284 | ||||||
AQR TM Small Cap Momentum Style Fund | 1,927,915 | 1,927,915 | ||||||
AQR Emerging Defensive Style Fund | 1,090,427 | 1,090,427 | ||||||
The securities lending transactions are governed by a Securities Lending Agency Agreement with JPMorgan Chase Bank, N.A., which is not considered to be master netting arrangements. As a result the liabilities associated with the securities lending transactions are not disclosed in Note 7 of the Notes to Financial Statements.
Master Agreements: Certain Funds are parties to master netting arrangements with counterparties (“Master Agreements”). Master Agreements govern the terms of certain like transactions, and reduce the counterparty risk associated with relevant transactions by specifying payment netting mechanisms across multiple transactions and providing standardization that improves legal certainty. Since different types of transactions have different mechanics and are sometimes traded by different legal entities of a particular counterparty organization, each type of transaction may be covered by a different Master Agreement, resulting in the need for multiple Master Agreements with a counterparty and its affiliates. As the Master Agreements are specific to unique operations of different asset types, they allow the Funds to close out and net their total exposure to a counterparty in the event of a default with respect to all the transactions governed under a single Master Agreement with a counterparty.
Master Repurchase Agreements govern repurchase, or reverse repurchase transactions, relating to government bonds between certain Funds and select counterparties. Master Repurchase Agreements maintain provisions for initiation, income payments, events of default, and maintenance of collateral.
Prime Broker Arrangements may be entered into to facilitate execution and/or clearing of equities, bonds, equity options or short sales of securities between certain Funds and selected counterparties. These arrangements provide financing terms for such transactions and include guidelines surrounding the rights, obligations, and other events, including, but not limited to, margin, execution, and settlement. These agreements maintain provisions for payments, maintenance of collateral, events of default, and termination. Margin and other assets delivered as collateral are typically held by the prime broker and offset any obligations due to the prime broker.
Customer Account Agreements govern cleared derivatives transactions and exchange-traded futures and options transactions. Upon entering into an exchange-traded or centrally cleared derivative contract, the Funds are required to deposit with the relevant clearing organization cash or securities, which is referred to as the initial margin. Securities deposited as initial margin are designated on the Schedules of Investments and cash deposited is recorded as Deposits with brokers for exchange-traded and centrally cleared derivatives on the Statements of Assets and Liabilities. For exchange-traded futures or centrally cleared swaps, initial margin is posted, and daily changes in fair value are recorded as a payable or receivable on the Statement of Assets and Liabilities as Variation margin on exchange-traded and centrally cleared derivatives. Variation margin is determined separately for exchange-traded futures and centrally cleared swaps and cannot be netted.
International Swaps and Derivatives Association, Inc. Master Agreements and Credit Support Annexes (“ISDA Master Agreements”) govern OTC derivative transactions entered into between certain Funds and a counterparty. ISDA Master Agreements maintain provisions for general obligations, representations, netting of settlement payments, agreements to deliver supporting documents, collateral transfer and events of default or termination. Events of termination include a decline in the Fund’s net assets below a specified threshold over a certain period of time or a decline in the counterparty’s long-term and short-term credit ratings below a specified level. In each case, upon occurrence, the other party may elect to terminate early and cause settlement of all OTC contracts outstanding, including the payment of any losses and costs resulting from such early termination, as reasonably determined by the terminating party. Any decision by a party to elect early termination could be material to the financial statements and impact a Fund’s future derivative activity.
| AQR Funds | Annual Report | September 2016 | ||||||||||||||
215
| Notes to Financial Statements | September 30, 2016 |
Collateral and margin requirements differ according to the terms of each type of Master Agreement. Collateral is routinely transferred if the total net exposure net of existing collateral already in place governed under the relevant Master Agreement with a counterparty in a given account exceeds a specified threshold. Collateral can be in the form of cash, debt securities issued by the U.S. government, money market funds and other securities as agreed to by the Fund and the applicable counterparty, or as permitted by the clearing house or exchange.
Collateral pledged by a Fund for OTC derivatives pursuant to a Master Agreement is segregated by the Fund’s custodian and identified as an asset in the Statements of Assets and Liabilities either as a component of Investments in securities, at value (securities) or in Due from brokers (cash). Segregation of fund’s collateral in the custodian account helps mitigate counterparty risk.
Collateral posted for the benefit of a Fund pursuant to a Master Agreement is held by a custodian of the Fund. Amounts which can be invested or repledged, are presented in the Fund’s Schedule of Investments. Collateral received is reflected as a liability within Due to brokers in the Statements of Assets and Liabilities.
For financial reporting purposes, the Funds do not offset derivative assets and derivative liabilities subject to master netting agreements on the Statements of Assets and Liabilities.
4. Investment Valuation and Fair Value Measurements
Investment Valuation Policies: The Net Asset Value (“NAV”) of the Funds’ shares are valued as of the close of regular trading on the New York Stock Exchange (“NYSE”) (normally 4:00 p.m. Eastern time) on each day that the NYSE is open (each a “Business Day”). The NAV per share of each class within each Fund is computed by dividing the total current value of the assets of such Fund attributable to a class, less class liabilities, by the total number of shares of that class of the Fund outstanding at the time the computation is made. For purposes of calculating the NAV, portfolio securities and other financial derivative instruments are valued on each Business Day using valuation methods as adopted by the Funds’ Board of Trustees (the “Board”).
The Board has delegated responsibility for applying approved valuation policies to the Adviser, subject to Board oversight. The Adviser has established a Valuation Committee (the “VC”) whose function is to administer, implement and oversee the continual appropriateness of valuation methods applied and the determination of adjustments to the fair valuation of portfolio securities and other financial derivative instruments in good faith after consideration of market factor changes and events affecting issuers. The Adviser performs a series of activities to provide reasonable assurance of the accuracy of prices including: (i) periodic vendor due diligence meetings, review of methodologies, new developments and processes at vendors, (ii) review of daily comparison of security valuation versus prior day for all securities that exceeded established thresholds, (iii) review of third party model prices against internal model prices, and (iv) review the results of back testing and reports for the Board on the results of fair value determinations.
Where market quotes are readily available, fair market value is generally determined on the basis of official closing prices or the last reported sales prices, or if no sales are reported, based on quotes obtained from pricing services or established market makers. Where market quotations are not readily available, or if an available market quotation is determined not to reflect fair value, securities or financial derivatives are valued at fair value, as determined in good faith by the VC in accordance with the valuation procedures approved by the Funds’ Board. Using fair value to price a security may require subjective determinations about the value of a security that could result in a value that is different from a security’s most recent closing price and from the prices used by other mutual funds to calculate their net assets. It is possible the estimated values may differ significantly from the values which would have been used had a ready market for the investments existed. These differences could be material.
Fair Value Hierarchy: Various inputs are utilized in determining the value of each Fund’s investments. GAAP establishes a hierarchy for inputs used in measuring fair value that maximizes the use of observable inputs and minimizes the use of unobservable inputs by requiring the most observable inputs be used when available. These inputs are summarized in the three broad levels as follows:
Level 1 — Inputs using unadjusted quoted prices in active markets or exchanges for identical assets and liabilities.
Level 2 — Other significant observable inputs, which may include, but are not limited to, quoted prices for similar assets or liabilities in markets that are active, quoted prices for identical or similar assets or liabilities in markets that are not active, inputs other than quoted prices that are observable for the assets or liabilities (such as interest rates, yield curves, volatilities, prepayment speeds, credit risks and default rates) or other market corroborated inputs.
Level 3 — Significant unobservable inputs based on the best information available in the circumstances, to the extent observable inputs are not available, which may include assumptions made by the Board or persons acting at their direction that are used in determining the fair value of investments.
An investment asset’s or liability’s level within the fair value hierarchy is based on the lowest level input, individually or in aggregate, that is significant to fair value measurement. The objective of fair value measurement remains the same even when there is a significant decrease in the volume and level of activity for an asset or liability and regardless of the valuation technique used. The valuation techniques used by the Funds to measure fair value maximize the use of observable inputs and minimize the use of unobservable inputs.
| AQR Funds | Annual Report | September 2016 | ||||||||||||||
216
| Notes to Financial Statements | September 30, 2016 |
The inputs or methodology used for valuing securities are not necessarily an indication of the risk associated with investing in those securities.
Valuation Techniques: The following inputs and techniques may be used by the Funds to evaluate how to classify each major category of assets and liabilities into the appropriate fair value hierarchy in accordance with GAAP.
Equity securities, including securities sold short, rights, exchange options, warrants, Exchange-Traded Funds (“ETFs”) and closed-end investment companies, are valued at the last quoted sales prices or official closing prices taken from the primary market in which each security trades and are therefore considered Level 1.
An equity for which no sales are reported, as in the case of a security that is traded in the over the counter market or a less liquid listed equity, is valued at its last bid price (in the case of short sales, at the ask price) and is therefore considered Level 2. In addition, equities traded outside of the Western Hemisphere are also considered Level 2 because they are fair valued daily based on the application of a fair value factor (unless the Adviser determines that use of another valuation methodology is appropriate). The Funds apply daily fair value factors, furnished by an independent pricing service, to account for the market movement between the close of the foreign market and the close of the NYSE. The pricing service uses statistical analysis and quantitative models to adjust local market prices using factors such as subsequent movement and changes in the prices of indices, American Depository Receipts, futures contracts and exchange rates in other markets in determining fair value as of the time the Funds calculate their net asset value.
Fixed income securities and other investments that trade in markets that are not considered to be active, are valued based on quoted market prices, dealer quotations or alternative pricing sources supported by observable inputs and are also classified within Level 2. These include certain U.S. government and sovereign obligations, most government agency securities, investment-grade corporate bonds, money market funds and less liquid listed equities. Corporate and sovereign bonds and other fixed-income instruments are valued at estimated fair value using the latest bid prices or evaluated quotes furnished by independent pricing services, as well as quotations from counterparties and other market participants. Evaluated quotes are based on a matrix system, which may consider such factors as quoted prices for identical or similar assets, yields, maturities and ratings and are not necessarily reliant on quoted prices. Short-term debt investments of sufficient credit quality maturing in less than 60 days are generally valued at amortized cost, which approximates fair value. These investments are categorized as Level 2 within the fair value hierarchy.
Investments classified within Level 3 have significant unobservable inputs, as they trade infrequently or not at all. Level 3 instruments include illiquid securities. When observable prices are not available for these securities, the Funds may use one or more valuation techniques (e.g., the market approach, the income approach, or the cost approach), including proprietary models for which sufficient and reliable data is available. Within Level 3, the use of the market approach generally consists of using comparable market transactions, while the use of the income approach generally consists of estimated future cash flows discounted to calculate fair value. Discounts may also be applied due to the nature or durations of any restrictions on the disposition of the investment or adjusted as appropriate for credit, market and/or other risk factors.
The inputs used by the Funds in estimating the value of Level 3 investments include the original transaction price, recent transactions in the same or similar instruments, completed or pending third-party transactions in the underlying investment or comparable issuers, subsequent rounds of financing, recapitalizations and other transactions across the capital structure, offerings in the equity or debt capital markets, changes in financial ratios or cash flows, benchmark yield curves, credit spreads, estimated default rates, underlying collateral, and other unique security features. Level 3 investments may also be adjusted to reflect illiquidity and/or non-transferability, with the amount of such discount estimated by the Adviser in the absence of market information. Assumptions used by the Funds due to the lack of observable inputs may significantly impact the fair value of the investment.
Exchange-traded derivatives, such as futures contracts and exchange-traded option contracts, are typically classified within Level 1 or Level 2 of the fair value hierarchy depending on whether or not they are deemed to be actively traded. Futures and option contracts that are listed on national exchanges and are freely transferable are valued at fair value based on their last sales price on the date of determination on the exchange that constitutes the principal market or, if no sales occurred on such date, at the bid price on such exchange at the close of business on such date. Centrally cleared swaps listed or traded on a multilateral trade facility platform, such as a registered exchange, are valued on daily basis using quotations provided by an independent pricing service.
OTC derivatives, including forward contracts and swap contracts, are valued by the Funds on a daily basis using observable inputs, such as quotations provided by an independent pricing service, the counterparty, dealers or brokers, whenever available and considered reliable.
The value of each total return swap contract is derived from a combination of (i) the net value of the underlying positions, which are valued daily using the last sale or closing price on the principal exchange on which the securities are traded; (ii) financing costs; (iii) the value of dividends or accrued interest; (iv) cash balances within the swap; and (v) other factors, as applicable.
The U.S. Dollar value of forward foreign currency exchange contracts is determined using current forward currency exchange rates supplied by an independent pricing service.
| AQR Funds | Annual Report | September 2016 | ||||||||||||||
217
| Notes to Financial Statements | September 30, 2016 |
Generally, a valuation model is used consistently for similar derivative types and model inputs, including, but not limited to, market prices, yield curves, credit spreads, volatilities and implied correlations which are obtained from outside brokers and/or pricing services when available. In instances where models are used, the value of an OTC derivative depends upon the contractual terms of, and specific risks inherent in, the instrument as well as the availability and reliability of observable inputs. Such inputs include market prices for reference securities, yield curves, credit curves, measures of volatility, prepayment rates and correlations of such inputs. Certain OTC derivatives, such as generic forwards, swaps and options, have inputs which can generally be corroborated by market data and are therefore classified within Level 2. Those OTC derivatives that have less liquidity or for which inputs are unobservable are classified within Level 3. While the valuations of less liquid OTC derivatives may utilize some Level 1 and/or Level 2 inputs, they also include other unobservable inputs which are considered significant to the fair value determination. At each measurement date, the Funds update the Level 1 and Level 2 inputs to reflect observable inputs, though the resulting gains and losses are reflected within Level 3 due to the significance of the unobservable inputs.
Quantitative Information
The following tables represent each Fund’s valuation inputs as presented on the Schedule of Investments:
| AQR LARGE CAP MULTI-STYLE FUND | LEVEL 1 | LEVEL 2 | LEVEL 3 | TOTALS | ||||||||||||
ASSETS |
| |||||||||||||||
Common Stocks | $ | 1,418,515,700 | $ | — | $ | — | $ | 1,418,515,700 | ||||||||
Short-Term Investment | — | 60,826,775 | — | 60,826,775 | ||||||||||||
Futures Contracts* | 503,949 | — | — | 503,949 | ||||||||||||
Total Assets | $ | 1,419,019,649 | $ | 60,826,775 | $ | — | $ | 1,479,846,424 | ||||||||
| AQR SMALL CAP MULTI-STYLE FUND | LEVEL 1 | LEVEL 2 | LEVEL 3 | TOTALS | ||||||||||||
ASSETS |
| |||||||||||||||
Common Stocks | $ | 717,605,397 | $ | — | $ | — | $ | 717,605,397 | ||||||||
Securities Lending Collateral | — | 66,623,428 | — | 66,623,428 | ||||||||||||
Short-Term Investment | — | 24,020,775 | — | 24,020,775 | ||||||||||||
Futures Contracts* | 363,401 | — | — | 363,401 | ||||||||||||
Total Assets | $ | 717,968,798 | $ | 90,644,203 | $ | — | $ | 808,613,001 | ||||||||
| AQR INTERNATIONAL MULTI-STYLE FUND | LEVEL 1 | LEVEL 2 | LEVEL 3 | TOTALS | ||||||||||||
ASSETS |
| |||||||||||||||
Common Stocks† | $ | 29,392,278 | $ | 331,521,660 | $ | — | $ | 360,913,938 | ||||||||
Preferred Stocks | — | 598,573 | — | 598,573 | ||||||||||||
Short-Term Investment | — | 13,089,190 | — | 13,089,190 | ||||||||||||
Futures Contracts* | 77,590 | — | — | 77,590 | ||||||||||||
Total Assets | $ | 29,469,868 | $ | 345,209,423 | $ | — | $ | 374,679,291 | ||||||||
| AQR EMERGING MULTI-STYLE FUND | LEVEL 1 | LEVEL 2 | LEVEL 3 | TOTALS | ||||||||||||
ASSETS |
| |||||||||||||||
Common Stocks† | $ | 78,680,150 | $ | 172,327,352 | $ | — | $ | 251,007,502 | ||||||||
Preferred Stocks† | 4,902,117 | — | — | 4,902,117 | ||||||||||||
Securities Lending Collateral | — | 4,314,790 | — | 4,314,790 | ||||||||||||
Short-Term Investment | — | 10,327,810 | — | 10,327,810 | ||||||||||||
Total Assets | $ | 83,582,267 | $ | 186,969,952 | $ | — | $ | 270,552,219 | ||||||||
LIABILITIES | ||||||||||||||||
Futures Contracts* | $ | (94,599 | ) | $ | — | $ | — | $ | (94,599 | ) | ||||||
Total Liabilities | $ | (94,599 | ) | $ | — | $ | — | $ | (94,599 | ) | ||||||
| AQR TM LARGE CAP MULTI-STYLE FUND | LEVEL 1 | LEVEL 2 | LEVEL 3 | TOTALS | ||||||||||||
ASSETS |
| |||||||||||||||
Common Stocks | $ | 134,467,919 | $ | — | $ | — | $ | 134,467,919 | ||||||||
Exchange-Traded Funds | 3,952,017 | — | — | 3,952,017 | ||||||||||||
Short-Term Investment | — | 1,539,169 | — | 1,539,169 | ||||||||||||
Total Assets | $ | 138,419,936 | $ | 1,539,169 | $ | — | $ | 139,959,105 | ||||||||
| AQR Funds | Annual Report | September 2016 | ||||||||||||||
218
| Notes to Financial Statements | September 30, 2016 |
| AQR TM SMALL CAP MULTI-STYLE FUND | LEVEL 1 | LEVEL 2 | LEVEL 3 | TOTALS | ||||||||||||
ASSETS |
| |||||||||||||||
Common Stocks | $ | 17,792,888 | $ | — | $ | — | $ | 17,792,888 | ||||||||
Exchange-Traded Funds | 706,383 | — | — | 706,383 | ||||||||||||
Securities Lending Collateral | — | 1,409,090 | — | 1,409,090 | ||||||||||||
Short-Term Investment | — | 276,531 | — | 276,531 | ||||||||||||
Total Assets | $ | 18,499,271 | $ | 1,685,621 | $ | — | $ | 20,184,892 | ||||||||
| AQR TM INTERNATIONAL MULTI-STYLE FUND | LEVEL 1 | LEVEL 2 | LEVEL 3 | TOTALS | ||||||||||||
ASSETS |
| |||||||||||||||
Common Stocks† | $ | 10,659,315 | $ | 122,447,210 | $ | — | $ | 133,106,525 | ||||||||
Preferred Stocks† | — | 175,434 | — | 175,434 | ||||||||||||
Short-Term Investment | — | 3,849,890 | — | 3,849,890 | ||||||||||||
Futures Contracts* | 28,956 | — | — | 28,956 | ||||||||||||
Total Assets | $ | 10,688,271 | $ | 126,472,534 | $ | — | $ | 137,160,805 | ||||||||
| AQR TM EMERGING MULTI-STYLE FUND | LEVEL 1 | LEVEL 2 | LEVEL 3 | TOTALS | ||||||||||||
ASSETS |
| |||||||||||||||
Common Stocks† | $ | 85,070,758 | $ | 187,484,889 | $ | — | $ | 272,555,647 | ||||||||
Preferred Stocks† | 6,082,893 | — | — | 6,082,893 | ||||||||||||
Securities Lending Collateral | — | 4,165,729 | — | 4,165,729 | ||||||||||||
Short-Term Investment | — | 6,579,902 | — | 6,579,902 | ||||||||||||
Total Assets | $ | 91,153,651 | $ | 198,230,520 | $ | — | $ | 289,384,171 | ||||||||
LIABILITIES | ||||||||||||||||
Futures Contracts* | $ | (51,706 | ) | $ | — | $ | — | $ | (51,706 | ) | ||||||
Total Liabilities | $ | (51,706 | ) | $ | — | $ | — | $ | (51,706 | ) | ||||||
| AQR LARGE CAP MOMENTUM STYLE FUND | LEVEL 1 | LEVEL 2 | LEVEL 3 | TOTALS | ||||||||||||
ASSETS |
| |||||||||||||||
Common Stocks | $ | 909,853,829 | $ | — | $ | — | $ | 909,853,829 | ||||||||
Short-Term Investment | — | 25,866,654 | — | 25,866,654 | ||||||||||||
Futures Contracts* | 119,534 | — | — | 119,534 | ||||||||||||
Total Assets | $ | 909,973,363 | $ | 25,866,654 | $ | — | $ | 935,840,017 | ||||||||
| AQR SMALL CAP MOMENTUM STYLE FUND | LEVEL 1 | LEVEL 2 | LEVEL 3 | TOTALS | ||||||||||||
ASSETS |
| |||||||||||||||
Common Stocks | $ | 316,916,598 | $ | — | $ | — | (a) | $ | 316,916,598 | |||||||
Rights | — | — | 8,647 | 8,647 | ||||||||||||
Securities Lending Collateral | — | 24,311,255 | — | 24,311,255 | ||||||||||||
Short-Term Investment | — | 8,789,282 | — | 8,789,282 | ||||||||||||
Warrants | — | — | — | (a) | –(a | ) | ||||||||||
Futures Contracts* | 124,388 | — | — | 124,388 | ||||||||||||
Total Assets | $ | 317,040,986 | $ | 33,100,537 | $ | 8,647 | $ | 350,150,170 | ||||||||
| AQR INTERNATIONAL MOMENTUM STYLE FUND | LEVEL 1 | LEVEL 2 | LEVEL 3 | TOTALS | ||||||||||||
ASSETS |
| |||||||||||||||
Common Stocks† | $ | 45,974,971 | $ | 282,839,951 | $ | 42,720 | $ | 328,857,642 | ||||||||
Futures Contracts* | 30,166 | — | — | 30,166 | ||||||||||||
Total Assets | $ | 46,005,137 | $ | 282,839,951 | $ | 42,720 | $ | 328,887,808 | ||||||||
| AQR Funds | Annual Report | September 2016 | ||||||||||||||
219
| Notes to Financial Statements | September 30, 2016 |
| AQR EMERGING MOMENTUM STYLE FUND | LEVEL 1 | LEVEL 2 | LEVEL 3 | TOTALS | ||||||||||||
ASSETS |
| |||||||||||||||
Common Stocks† | $ | 2,729,176 | $ | 7,570,427 | $ | — | (a) | $ | 10,299,603 | |||||||
Exchange-Traded Funds | 213,540 | — | — | 213,540 | ||||||||||||
Preferred Stocks† | 195,346 | — | — | 195,346 | ||||||||||||
Securities Lending Collateral | — | 53,284 | — | 53,284 | ||||||||||||
Short-Term Investment | — | 114,043 | — | 114,043 | ||||||||||||
Total Assets | $ | 3,138,062 | $ | 7,737,754 | $ | — | (a) | $ | 10,875,816 | |||||||
| AQR TM LARGE CAP MOMENTUM STYLE FUND | LEVEL 1 | LEVEL 2 | LEVEL 3 | TOTALS | ||||||||||||
ASSETS |
| |||||||||||||||
Common Stocks | $ | 143,197,226 | $ | — | $ | — | $ | 143,197,226 | ||||||||
Short-Term Investment | — | 4,229,064 | — | 4,229,064 | ||||||||||||
Futures Contracts* | 21,180 | — | — | 21,180 | ||||||||||||
Total Assets | $ | 143,218,406 | $ | 4,229,064 | $ | — | $ | 147,447,470 | ||||||||
| AQR TM SMALL CAP MOMENTUM STYLE FUND | LEVEL 1 | LEVEL 2 | LEVEL 3 | TOTALS | ||||||||||||
ASSETS |
| |||||||||||||||
Common Stocks | $ | 32,496,208 | $ | — | $ | — | $ | 32,496,208 | ||||||||
Exchange-Traded Funds | 755,818 | — | — | 755,818 | ||||||||||||
Securities Lending Collateral | — | 1,927,915 | — | 1,927,915 | ||||||||||||
Short-Term Investment | — | 504,720 | — | 504,720 | ||||||||||||
Total Assets | $ | 33,252,026 | $ | 2,432,635 | $ | — | $ | 35,684,661 | ||||||||
| AQR TM INTERNATIONAL MOMENTUM STYLE FUND | LEVEL 1 | LEVEL 2 | LEVEL 3 | TOTALS | ||||||||||||
ASSETS |
| |||||||||||||||
Common Stocks† | $ | 13,615,813 | $ | 73,562,876 | $ | 1,489 | $ | 87,180,178 | ||||||||
Short-Term Investment | — | 419,243 | — | 419,243 | ||||||||||||
Futures Contracts* | 22,946 | — | — | 22,946 | ||||||||||||
Total Assets | $ | 13,638,759 | $ | 73,982,119 | $ | 1,489 | $ | 87,622,367 | ||||||||
| AQR LARGE CAP DEFENSIVE STYLE FUND | LEVEL 1 | LEVEL 2 | LEVEL 3 | TOTALS | ||||||||||||
ASSETS |
| |||||||||||||||
Common Stocks | $ | 784,404,355 | $ | — | $ | — | $ | 784,404,355 | ||||||||
Short-Term Investment | — | 84,487,198 | — | 84,487,198 | ||||||||||||
Futures Contracts* | 554,374 | — | — | 554,374 | ||||||||||||
Total Assets | $ | 784,958,729 | $ | 84,487,198 | $ | — | $ | 869,445,927 | ||||||||
| AQR INTERNATIONAL DEFENSIVE STYLE FUND | LEVEL 1 | LEVEL 2 | LEVEL 3 | TOTALS | ||||||||||||
ASSETS |
| |||||||||||||||
Common Stocks† | $ | 15,382,003 | $ | 111,239,707 | $ | — | $ | 126,621,710 | ||||||||
Preferred Stocks† | — | 658,339 | — | 658,339 | ||||||||||||
Short-Term Investment | — | 4,074,605 | — | 4,074,605 | ||||||||||||
Futures Contracts* | 13,398 | — | — | 13,398 | ||||||||||||
Total Assets | $ | 15,395,401 | $ | 115,972,651 | $ | — | $ | 131,368,052 | ||||||||
| AQR Funds | Annual Report | September 2016 | ||||||||||||||
220
| Notes to Financial Statements | September 30, 2016 |
| AQR EMERGING DEFENSIVE STYLE FUND | LEVEL 1 | LEVEL 2 | LEVEL 3 | TOTALS | ||||||||||||
ASSETS |
| |||||||||||||||
Common Stocks† | $ | 11,158,233 | $ | 36,331,117 | $ | — | $ | 47,489,350 | ||||||||
Preferred Stocks† | 32,854 | — | — | 32,854 | ||||||||||||
Securities Lending Collateral | — | 1,090,427 | — | 1,090,427 | ||||||||||||
Short-Term Investment | — | 2,179,087 | — | 2,179,087 | ||||||||||||
Total Assets | $ | 11,191,087 | $ | 39,600,631 | $ | — | $ | 50,791,718 | ||||||||
LIABILITIES | ||||||||||||||||
Futures Contracts* | $ | (13,420 | ) | $ | — | $ | — | $ | (13,420 | ) | ||||||
Total Liabilities | $ | (13,420 | ) | $ | — | $ | — | $ | (13,420 | ) | ||||||
| AQR GLOBAL EQUITY FUND | LEVEL 1 | LEVEL 2 | LEVEL 3 | TOTALS | ||||||||||||
ASSETS |
| |||||||||||||||
Common Stocks† | $ | 79,896,844 | $ | 48,642,456 | $ | 7,798 | $ | 128,547,098 | ||||||||
Preferred Stocks† | — | 44,247 | — | 44,247 | ||||||||||||
Short-Term Investment | — | 8,058,564 | — | 8,058,564 | ||||||||||||
Forward Foreign Currency Exchange Contracts* | — | 525,485 | — | 525,485 | ||||||||||||
Total Return Swap Contracts* | — | 9,626 | — | 9,626 | ||||||||||||
Total Assets | $ | 79,896,844 | $ | 57,280,378 | $ | 7,798 | $ | 137,185,020 | ||||||||
LIABILITIES | ||||||||||||||||
Futures Contracts* | $ | (380,292 | ) | $ | — | $ | — | $ | (380,292 | ) | ||||||
Forward Foreign Currency Exchange Contracts* | — | (238,115 | ) | — | (238,115 | ) | ||||||||||
Total Return Swap Contracts* | — | (9,317 | ) | — | (9,317 | ) | ||||||||||
Total Liabilities | $ | (380,292 | ) | $ | (247,432 | ) | $ | — | $ | (627,724 | ) | |||||
| AQR INTERNATIONAL EQUITY FUND | LEVEL 1 | LEVEL 2 | LEVEL 3 | TOTALS | ||||||||||||
ASSETS |
| |||||||||||||||
Common Stocks† | $ | — | $ | 375,147,101 | $ | 11,604 | $ | 375,158,705 | ||||||||
Preferred Stocks† | — | 1,524,324 | — | 1,524,324 | ||||||||||||
Short-Term Investments | — | 25,937,852 | — | 25,937,852 | ||||||||||||
Forward Foreign Currency Exchange Contracts* | — | 1,300,717 | — | 1,300,717 | ||||||||||||
Total Return Swap Contracts* | — | 187,702 | — | 187,702 | ||||||||||||
Total Assets | $ | — | $ | 404,097,696 | $ | 11,604 | $ | 404,109,300 | ||||||||
LIABILITIES | ||||||||||||||||
Futures Contracts* | $ | (1,031,834 | ) | $ | — | $ | — | $ | (1,031,834 | ) | ||||||
Forward Foreign Currency Exchange Contracts* | — | (783,198 | ) | — | (783,198 | ) | ||||||||||
Total Return Swap Contracts* | — | (15,276 | ) | — | (15,276 | ) | ||||||||||
Total Liabilities | $ | (1,031,834 | ) | $ | (798,474 | ) | $ | — | $ | (1,830,308 | ) | |||||
| * | Derivative instruments, including futures, forward foreign currency exchange and total return swap contracts, are reported at the cumulative unrealized appreciation/(depreciation) of the instrument within the Funds’ Schedule of Investments. Only the current day’s variation margin is reported within the Statements of Assets and Liabilities for exchange-traded and cleared derivatives. |
| † | Please refer to the Schedule of Investments to view securities segregated by country. |
| (a) | Security has zero value. |
The Funds recognize all transfers at the beginning of the reporting period, related unrealized appreciation/(depreciation) is also transferred out at the beginning of the reporting period. Transfers between Level 1 and 2 generally relate to whether the principal market for the security becomes active or inactive. Transfers from Level 2 to Level 3 or from Level 3 to Level 2 are due to a decline or an increase in market activity (e.g., frequency of trades), which resulted in a lack of, or increase in, available market inputs to determine price. During the period ended September 30, 2016, the amount of securities transferred from Level 2 into Level 1 for the AQR Global Equity Fund and AQR TM Large Cap Momentum Style Fund was $307,837 and $82,274, respectively. There were no transfers of investments between levels for any of the remaining Funds.
| AQR Funds | Annual Report | September 2016 | ||||||||||||||
221
| Notes to Financial Statements | September 30, 2016 |
At September 30, 2016, all of the investments classified within Level 3 of the fair value hierarchy held by the AQR Emerging Momentum Style Fund are valued by pricing vendors or brokers. The inputs for these securities are not readily available or cannot be reasonably estimated and are generally those inputs described in Note 4. The appropriateness of fair values for these securities is monitored on an ongoing basis which may include results of back testing, results of pricing vendor and/or broker due diligence, unchanged price review and consideration of macro or security specific events. There were no other Level 3 securities held at period end, except those securities classified as Level 3 in the Schedules of Investments that are considered quantitatively insignificant in the aggregate for the AQR Small Cap Momentum Style Fund, AQR International Momentum Style Fund, AQR TM International Momentum Style Fund, AQR Global Equity Fund and AQR International Equity Fund.
The following table includes a rollforward of the balances of investments classified within Level 3 of the fair value hierarchy for the period for each Fund that held Level 3 securities that were considered quantitatively significant:
| AQR EMERGING MOMENTUM STYLE FUND | COMMON STOCKS | |||
Balance as of September 30, 2015 | $ | 56,058 | ||
Accrued discounts/(premiums) | — | |||
Realized gain/(loss) | (21,499 | ) | ||
Change in unrealized appreciation/(depreciation) | (11,484 | ) | ||
Purchases1 | — | |||
Sales2 | (23,075 | ) | ||
Transfers in to Level 3 | — | |||
Transfers out of Level 3 | — | |||
Balance as of September 30, 2016 | $ | — | (a) | |
Change in Unrealized appreciation/(depreciation) for securities still held at September 30, 2016 | $ | (14,414 | ) | |
| 1 | Purchases include all purchases of securities and securities received in corporate actions. |
| 2 | Sales include all sales of securities, maturities, pay downs and securities tendered in a corporate action. |
| (a) | Security has zero value. |
The fair market values of Level 3 investments are based on significant unobservable inputs that reflect the Adviser’s determination of assumptions that market participants might reasonably use in valuing the securities. Changes in significant unobservable inputs could cause significant changes in valuation to individual securities and in aggregate. Fair value determinations and valuation of investments that are not actively trading involve judgment and may differ materially from valuations that would have been used had greater market activity occurred.
The significant unobservable inputs used in the fair value measurement of a Fund’s investments in common stocks, corporate bonds, convertible bonds, convertible preferred stocks and warrants potentially include credit spread, liquidity discount, earnings multiples and volatility. Significant increases in the credit spread or liquidity discount inputs in isolation would potentially result in a significantly lower fair value measurement, whereas an increase in volatility generally results in a higher fair value measurement. Generally, a change in the assumption used for the credit spread would be accompanied by a directionally-similar change in the assumptions used for the volatility and liquidity discount. Investments in common stocks potentially include liquidity discounts, theoretical values, book to value analysis and/or broker quotes. Significant changes in any of these inputs would significantly change the fair value measurement of the position.
5. Federal Income Tax Matters
At September 30, 2016, the cost of long security positions and aggregate gross unrealized appreciation (depreciation) of investments for federal income tax purposes were as follows:
| FUND | COST OF INVESTMENTS | GROSS UNREALIZED APPRECIATION | GROSS UNREALIZED DEPRECIATION | NET UNREALIZED APPRECIATION (DEPRECIATION) | ||||||||||||
AQR Large Cap Multi-Style Fund | $ | 1,379,871,660 | $ | 124,031,756 | $ | (24,560,941 | ) | $ | 99,470,815 | |||||||
AQR Small Cap Multi-Style Fund | 724,888,776 | 100,314,302 | (16,953,478 | ) | 83,360,824 | |||||||||||
AQR International Multi-Style Fund | 363,102,897 | 26,921,077 | (15,422,273 | ) | 11,498,804 | |||||||||||
AQR Emerging Multi-Style Fund | 249,637,798 | 28,793,408 | (7,878,987 | ) | 20,914,421 | |||||||||||
AQR TM Large Cap Multi-Style Fund | 133,334,356 | 9,267,655 | (2,642,906 | ) | 6,624,749 | |||||||||||
AQR TM Small Cap Multi-Style Fund | 18,239,754 | 2,406,089 | (460,951 | ) | 1,945,138 | |||||||||||
AQR TM International Multi-Style Fund | 132,540,904 | 9,560,378 | (4,969,433 | ) | 4,590,945 | |||||||||||
AQR TM Emerging Multi-Style Fund | 259,418,925 | 36,118,475 | (6,153,229 | ) | 29,965,246 | |||||||||||
AQR Large Cap Momentum Style Fund | 787,887,104 | 153,483,634 | (5,650,255 | ) | 147,833,379 | |||||||||||
AQR Small Cap Momentum Style Fund | 292,516,966 | 62,248,545 | (4,739,729 | ) | 57,508,816 | |||||||||||
AQR International Momentum Style Fund | 295,624,665 | 37,449,265 | (4,216,288 | ) | 33,232,977 | |||||||||||
| AQR Funds | Annual Report | September 2016 | ||||||||||||||
222
| Notes to Financial Statements | September 30, 2016 |
| FUND | COST OF INVESTMENTS | GROSS UNREALIZED APPRECIATION | GROSS UNREALIZED DEPRECIATION | NET UNREALIZED APPRECIATION (DEPRECIATION) | ||||||||||||
AQR Emerging Momentum Style Fund | $ | 9,572,734 | $ | 1,511,780 | $ | (208,698 | ) | $ | 1,303,082 | |||||||
AQR TM Large Cap Momentum Style Fund | 125,995,617 | 22,536,216 | (1,105,543 | ) | 21,430,673 | |||||||||||
AQR TM Small Cap Momentum Style Fund | 31,679,981 | 5,018,353 | (1,013,673 | ) | 4,004,680 | |||||||||||
AQR TM International Momentum Style Fund | 81,385,716 | 9,150,754 | (2,937,049 | ) | 6,213,705 | |||||||||||
AQR Large Cap Defensive Style Fund | 792,059,988 | 84,378,734 | (7,547,169 | ) | 76,831,565 | |||||||||||
AQR International Defensive Style Fund | 126,450,661 | 8,181,290 | (3,277,297 | ) | 4,903,993 | |||||||||||
AQR Emerging Defensive Style Fund | 50,041,831 | 4,353,449 | (3,603,562 | ) | 749,887 | |||||||||||
AQR Global Equity Fund | 123,542,047 | 16,735,327 | (3,627,465 | ) | 13,107,862 | |||||||||||
AQR International Equity Fund | 392,521,404 | 31,621,582 | (21,522,105 | ) | 10,099,477 | |||||||||||
The differences between book basis and tax basis appreciation (depreciation) on investments is primarily attributable to wash sale loss deferrals, mark to market on passive foreign investment companies (“PFIC”), non-taxable dividends from fund investments including Real Estate Investment Trusts (“REITs”).
As of September 30, 2016, the components of net assets (excluding paid in capital) on a tax basis were as follows:
| FUND | CURRENT DISTRIBUTABLE ORDINARY INCOME | CURRENT DISTRIBUTABLE LONG TERM CAPITAL GAIN OR (TAX BASIS CAPITAL LOSS CARRYFORWARDS) | NET UNREALIZED APPRECIATION (DEPRECIATION) | POST OCTOBER CAPITAL OR LATE YEAR ORDINARY LOSS DEFERRALS | OTHER TEMPORARY DIFFERENCES | TOTAL ACCUMULATED EARNINGS | ||||||||||||||||||
AQR Large Cap Multi-Style Fund | $ | 14,853,381 | $ | (12,795,817 | ) | $ | 99,470,816 | $ | (73,038,066 | ) | $ | — | $ | 28,490,314 | ||||||||||
AQR Small Cap Multi-Style Fund | 15,446,574 | 2,402,383 | 83,360,825 | — | — | 101,209,782 | ||||||||||||||||||
AQR International Multi-Style Fund | 9,442,451 | (11,343,545 | )�� | 11,497,614 | (38,554,116 | ) | — | (28,957,596 | ) | |||||||||||||||
AQR Emerging Multi-Style Fund | 4,958,141 | (9,999,246 | ) | 20,918,113 | (33,588,415 | ) | — | (17,711,407 | ) | |||||||||||||||
AQR TM Large Cap Multi-Style Fund | 1,317,560 | — | 6,624,749 | (3,139,410 | ) | — | 4,802,899 | |||||||||||||||||
AQR TM Small Cap Multi-Style Fund | 130,224 | (3,041 | ) | 1,945,138 | (23,687 | ) | — | 2,048,634 | ||||||||||||||||
AQR TM International Multi-Style Fund | 2,812,233 | (626,421 | ) | 4,592,231 | (6,945,984 | ) | — | (167,941 | ) | |||||||||||||||
AQR TM Emerging Multi-Style Fund | 6,394,004 | (587,446 | ) | 29,963,836 | (13,176,788 | ) | — | 22,593,606 | ||||||||||||||||
AQR Large Cap Momentum Style Fund | 10,157,798 | 50,375,082 | 147,833,347 | — | — | 208,366,227 | ||||||||||||||||||
AQR Small Cap Momentum Style Fund | 1,823,249 | (4,410,052 | ) | 57,508,816 | (80,127 | ) | — | 54,841,886 | ||||||||||||||||
AQR International Momentum Style Fund | 7,252,194 | (20,675,380 | ) | 33,237,085 | (18,170,496 | ) | — | 1,643,403 | ||||||||||||||||
AQR Emerging Momentum Style Fund | 143,455 | (1,349,877 | ) | 1,303,658 | (1,282,280 | ) | — | (1,185,044 | ) | |||||||||||||||
AQR TM Large Cap Momentum Style Fund | 1,603,587 | (1,462,628 | ) | 21,430,673 | (2,075,522 | ) | — | 19,496,110 | ||||||||||||||||
AQR TM Small Cap Momentum Style Fund | 177,822 | (252,974 | ) | 4,004,680 | (523,591 | ) | — | 3,405,937 | ||||||||||||||||
AQR TM International Momentum Style Fund | 1,785,783 | (7,459,290 | ) | 6,220,296 | (5,185,595 | ) | — | (4,638,806 | ) | |||||||||||||||
AQR Large Cap Defensive Style Fund | 9,932,425 | 3,564,682 | 76,831,565 | — | — | 90,328,672 | ||||||||||||||||||
AQR International Defensive Style Fund | 1,552,780 | (218,107 | ) | 4,902,467 | (74,843 | ) | — | 6,162,297 | ||||||||||||||||
AQR Emerging Defensive Style Fund | 726,394 | (10,204,390 | ) | 748,925 | (192,675 | ) | — | (8,921,746 | ) | |||||||||||||||
AQR Global Equity Fund | 3,014,432 | 10,008,489 | 12,205,178 | — | (5,491 | ) | 25,222,608 | |||||||||||||||||
AQR International Equity Fund | 12,078,846 | 5,505,559 | 2,308,375 | — | — | 19,892,780 | ||||||||||||||||||
| AQR Funds | Annual Report | September 2016 | ||||||||||||||
223
| Notes to Financial Statements | September 30, 2016 |
The differences between book basis and tax basis components of net assets are primarily attributable to wash sales loss deferrals, mark to market on forward foreign currency exchange contracts, mark to market on regulated futures contracts, mark to market on PFIC investments, non-taxable dividends from fund investments including REITs, loss deferrals from tax straddles and capital loss carry forwards.
As of September 30, 2016, the effect of permanent book/tax reclassifications resulted in increase (decrease) to the components of net assets as follows:
| FUND | UNDISTRIBUTED NET INVESTMENT INCOME | ACCUMULATED NET REALIZED GAIN(LOSS) ON INVESTMENTS | PAID-IN CAPITAL | |||||||||
AQR Large Cap Multi-Style Fund | $ | (497,334 | ) | $ | 497,334 | $ | — | |||||
AQR Small Cap Multi-Style Fund | (270,199 | ) | 270,199 | — | ||||||||
AQR International Multi-Style Fund | 967,301 | (967,301 | ) | — | ||||||||
AQR Emerging Multi-Style Fund | 176,926 | (175,464 | ) | (1,462 | ) | |||||||
AQR TM Large Cap Multi-Style Fund | (21,284 | ) | 26,986 | (5,702 | ) | |||||||
AQR TM Small Cap Multi-Style Fund | (213 | ) | 5,940 | (5,727 | ) | |||||||
AQR TM International Multi-Style Fund | 96,939 | (90,722 | ) | (6,217 | ) | |||||||
AQR TM Emerging Multi-Style Fund | 362,486 | (353,902 | ) | (8,584 | ) | |||||||
AQR Large Cap Momentum Style Fund | (563,389 | ) | 563,389 | — | ||||||||
AQR Small Cap Momentum Style Fund | (13,350 | ) | 13,350 | — | ||||||||
AQR International Momentum Style Fund | 766,103 | (766,103 | ) | — | ||||||||
AQR Emerging Momentum Style Fund | 13,799 | (13,799 | ) | — | ||||||||
AQR TM Large Cap Momentum Style Fund | (79,324 | ) | 79,324 | — | ||||||||
AQR TM Small Cap Momentum Style Fund | (12,638 | ) | 12,638 | — | ||||||||
AQR TM International Momentum Style Fund | 90,362 | (90,362 | ) | — | ||||||||
AQR Large Cap Defensive Style Fund | (11,354 | ) | 11,354 | — | ||||||||
AQR International Defensive Style Fund | (137,247 | ) | 137,247 | — | ||||||||
AQR Emerging Defensive Style Fund | 93,890 | (93,890 | ) | — | ||||||||
AQR Global Equity Fund | 414,627 | (13,679,802 | ) | 13,265,175 | ||||||||
AQR International Equity Fund | 2,599,174 | (35,358,418 | ) | 32,759,244 | ||||||||
For financial reporting purposes, capital accounts are adjusted to reflect the tax character of permanent book/tax differences. Reclassifications are primarily due to dividend redesignations and the difference in tax treatment of certain foreign currency transactions, PFIC investments, nontaxable dividends from fund investments including REITs, securities distributed for redemption of shares and certain non-deductible expenses.
The tax character of distributions paid during the fiscal year-ends or periods September 30, 2016 and September 30, 2015 were as follows:
| SEPTEMBER 30, 2016 | SEPTEMBER 30, 2015 | |||||||||||||||
| FUND | ORDINARY INCOME | CAPITAL GAINS | ORDINARY INCOME | CAPITAL GAINS | ||||||||||||
AQR Large Cap Multi-Style Fund | $ | 12,223,105 | $ | 1,073 | $ | 2,933,755 | $ | 672,488 | ||||||||
AQR Small Cap Multi-Style Fund | 475,784 | 201 | 131,837 | 88,141 | ||||||||||||
AQR International Multi-Style Fund | 4,593,502 | — | 1,324,144 | 78,371 | ||||||||||||
AQR Emerging Multi-Style Fund | 4,825,893 | — | 164,448 | — | ||||||||||||
AQR TM Large Cap Multi-Style Fund | 322,482 | 290 | — | — | ||||||||||||
AQR TM Small Cap Multi-Style Fund | 31,887 | — | — | — | ||||||||||||
AQR TM International Multi-Style Fund | 737,644 | — | — | — | ||||||||||||
AQR TM Emerging Multi-Style Fund | 781,761 | — | — | — | ||||||||||||
AQR Large Cap Momentum Style Fund | 10,043,312 | 71,718,239 | 24,560,783 | 73,639,636 | ||||||||||||
AQR Small Cap Momentum Style Fund | 2,518,013 | 1,581,305 | 7,189,881 | 28,285,487 | ||||||||||||
AQR International Momentum Style Fund | 5,295,891 | — | 6,554,908 | 3,582,058 | ||||||||||||
AQR Emerging Momentum Style Fund | 215,877 | — | 74,317 | — | ||||||||||||
AQR TM Large Cap Momentum Style Fund | 1,415,466 | — | 1,263,697 | 1,207,604 | ||||||||||||
AQR TM Small Cap Momentum Style Fund | 154,034 | — | 13,062 | 546,861 | ||||||||||||
AQR TM International Momentum Style Fund | 1,112,857 | — | 1,179,477 | 271,835 | ||||||||||||
AQR Large Cap Defensive Style Fund | 5,340,787 | 15,813,125 | 6,386,436 | 2,527,136 | ||||||||||||
AQR International Defensive Style Fund | 767,885 | — | 862,765 | 486,716 | ||||||||||||
AQR Emerging Defensive Style Fund | 1,072,488 | — | 1,399,258 | — | ||||||||||||
AQR Global Equity Fund | 5,145,296 | 17,630,449 | 8,844,660 | 24,653,244 | ||||||||||||
AQR International Equity Fund | 15,863,761 | 8,881,523 | 25,286,786 | 37,535,197 | ||||||||||||
| AQR Funds | Annual Report | September 2016 | ||||||||||||||
224
| Notes to Financial Statements | September 30, 2016 |
During the year ended September 30, 2016, the Funds utilized capital loss carryforwards in the amounts listed below:
| FUND | SHORT-TERM | LONG-TERM | ||||||
AQR International Multi-Style Fund | $ | — | $ | 109,803 | ||||
AQR TM Small Cap Multi-Style Fund | 1,467 | — | ||||||
AQR TM International Multi-Style Fund | — | 2,052 | ||||||
AQR TM Small Cap Momentum Style Fund | — | 249 | ||||||
As of September 30, 2016, for federal income tax purposes, the following Funds have capital loss carryforwards, with no expiration, available to offset future capital gains, if any, to the extent provided by the U.S. Treasury regulations.
| FUND | SHORT-TERM | LONG-TERM | ||||||
AQR Large Cap Multi-Style Fund | $ | 12,795,817 | $ | — | ||||
AQR International Multi-Style Fund | 11,343,545 | — | ||||||
AQR Emerging Multi-Style Fund | 9,431,056 | 568,190 | ||||||
AQR TM Small Cap Multi-Style Fund | 3,041 | — | ||||||
AQR TM International Multi-Style Fund | 608,605 | 17,816 | ||||||
AQR TM Emerging Multi-Style Fund | 466,531 | 120,915 | ||||||
AQR Small Cap Momentum Style Fund | 4,410,052 | — | ||||||
AQR International Momentum Style Fund | 20,675,380 | — | ||||||
AQR Emerging Momentum Style Fund | 1,276,383 | 73,494 | ||||||
AQR TM Large Cap Momentum Style Fund | 1,462,628 | — | ||||||
AQR TM Small Cap Momentum Style Fund | 252,974 | — | ||||||
AQR TM International Momentum Style Fund | 7,342,005 | 117,285 | ||||||
AQR International Defensive Style Fund | — | 218,107 | ||||||
AQR Emerging Defensive Style Fund | 5,429,330 | 4,775,060 | ||||||
6. Investment Transactions
During the year ended September 30, 2016, the cost of purchases and the proceeds from sales of investments (excluding swap contracts, forward foreign currency exchange contracts, futures contracts and short-term investments) were as follows:
| FUND | PURCHASES | SALES | ||||||
AQR Large Cap Multi-Style Fund | $ | 1,328,193,861 | $ | 1,036,774,337 | ||||
AQR Small Cap Multi-Style Fund | 1,007,778,270 | 426,122,723 | ||||||
AQR International Multi-Style Fund | 423,385,736 | 342,970,518 | ||||||
AQR Emerging Multi-Style Fund | 242,336,183 | 195,927,780 | ||||||
AQR TM Large Cap Multi-Style Fund | 257,442,268 | 152,958,865 | ||||||
AQR TM Small Cap Multi-Style Fund | 33,266,400 | 20,294,341 | ||||||
AQR TM International Multi-Style Fund | 211,863,707 | 124,237,688 | ||||||
AQR TM Emerging Multi-Style Fund | 614,773,901 | 375,819,693 | ||||||
AQR Large Cap Momentum Style Fund | 743,780,605 | 897,290,763 | ||||||
AQR Small Cap Momentum Style Fund | 279,315,032 | 384,495,117 | ||||||
AQR International Momentum Style Fund | 278,851,688 | 277,854,572 | ||||||
AQR Emerging Momentum Style Fund | 16,427,426 | 14,360,227 | ||||||
AQR TM Large Cap Momentum Style Fund | 76,183,475 | 66,993,964 | ||||||
AQR TM Small Cap Momentum Style Fund | 35,237,742 | 24,637,975 | ||||||
AQR TM International Momentum Style Fund | 84,303,413 | 71,650,908 | ||||||
AQR Large Cap Defensive Style Fund | 604,004,051 | 40,397,152 | ||||||
AQR International Defensive Style Fund | 143,710,866 | 56,624,789 | ||||||
AQR Emerging Defensive Style Fund | 26,659,803 | 8,962,968 | ||||||
AQR Global Equity Fund | 147,051,422 | 234,592,173 | ||||||
AQR International Equity Fund | 381,711,736 | 324,364,545 | ||||||
7. Derivative Instruments and Activities
Certain funds use derivative instruments as part of their principal investment strategy to achieve their investment objectives. The Funds’ derivative contracts are not accounted for as hedging instruments under GAAP. For financial reporting purposes, the Funds do not offset financial assets and financial liabilities that are subject to master netting arrangements or similar agreements on the Statements of Assets and Liabilities. All derivative instruments held by the Funds were subject to a master netting agreement or similar arrangement.
| AQR Funds | Annual Report | September 2016 | ||||||||||||||
225
| Notes to Financial Statements | September 30, 2016 |
The following table lists the fair value of derivatives instruments held by the Funds, by primary underlying risk and contract type, as included in the Statements of Assets and Liabilities* at September 30, 2016:
| ASSETS | LIABILITIES | |||||||||||||||||||||||
| FUND | UNREALIZED APPRECIATION ON FUTURES CONTRACTS* | SWAPS AT VALUE | UNREALIZED APPRECIATION ON FORWARD CURRENCY EXCHANGE CONTRACTS | UNREALIZED DEPRECIATION ON FUTURES CONTRACTS* | SWAPS AT VALUE | UNREALIZED DEPRECIATION ON FORWARD CURRENCY EXCHANGE CONTRACTS | ||||||||||||||||||
| Equity Risk Exposure: | ||||||||||||||||||||||||
AQR Large Cap Multi-Style Fund | $ | 503,949 | $ | — | $ | — | $ | — | $ | — | $ | — | ||||||||||||
AQR Small Cap Multi-Style Fund | 363,401 | — | — | — | — | — | ||||||||||||||||||
AQR International Multi-Style Fund | 77,590 | — | — | — | — | — | ||||||||||||||||||
AQR Emerging Multi-Style Fund | — | — | — | 94,599 | — | — | ||||||||||||||||||
AQR TM International Multi-Style Fund | 28,956 | — | — | — | — | — | ||||||||||||||||||
AQR TM Emerging Multi-Style Fund | — | — | — | 51,706 | — | — | ||||||||||||||||||
AQR Large Cap Momentum Style Fund | 119,534 | — | — | — | — | — | ||||||||||||||||||
AQR Small Cap Momentum Style Fund | 124,388 | — | — | — | — | — | ||||||||||||||||||
AQR International Momentum Style Fund | 30,166 | — | — | — | — | — | ||||||||||||||||||
AQR TM Large Cap Momentum Style Fund | 21,180 | — | — | — | — | — | ||||||||||||||||||
AQR TM International Momentum Style Fund | 22,946 | — | — | — | — | — | ||||||||||||||||||
AQR Large Cap Defensive Style Fund | 554,374 | — | — | — | — | — | ||||||||||||||||||
AQR International Defensive Style Fund | 13,398 | — | — | — | — | — | ||||||||||||||||||
AQR Emerging Defensive Style Fund | — | — | — | 13,420 | — | — | ||||||||||||||||||
AQR Global Equity Fund | 148,132 | 9,626 | — | 528,424 | 9,317 | — | ||||||||||||||||||
AQR International Equity Fund | 591,373 | 187,702 | — | 1,623,207 | 15,276 | — | ||||||||||||||||||
| Foreign Exchange Rate Risk Exposure: | ||||||||||||||||||||||||
AQR Global Equity Fund | — | — | 525,485 | — | — | 238,115 | ||||||||||||||||||
AQR International Equity Fund | — | — | 1,300,717 | — | — | 783,198 | ||||||||||||||||||
| Netting: | ||||||||||||||||||||||||
AQR Global Equity Fund | (148,132 | ) | (9,317 | ) | (238,115 | ) | (148,132 | ) | (9,317 | ) | (238,115 | ) | ||||||||||||
AQR International Equity Fund | (591,373 | ) | (15,276 | ) | (783,198 | ) | (591,373 | ) | (15,276 | ) | (783,198 | ) | ||||||||||||
| Net Fair Value of Derivative Contracts: | ||||||||||||||||||||||||
AQR Large Cap Multi-Style Fund | 503,949 | — | — | — | — | — | ||||||||||||||||||
AQR Small Cap Multi-Style Fund | 363,401 | — | — | — | — | — | ||||||||||||||||||
AQR International Multi-Style Fund | 77,590 | — | — | — | — | — | ||||||||||||||||||
AQR Emerging Multi-Style Fund | — | — | — | 94,599 | — | — | ||||||||||||||||||
AQR TM International Multi-Style Fund | 28,956 | — | — | — | — | — | ||||||||||||||||||
AQR TM Emerging Multi-Style Fund | — | — | — | 51,706 | — | — | ||||||||||||||||||
AQR Large Cap Momentum Style Fund | 119,534 | — | — | — | — | — | ||||||||||||||||||
AQR Small Cap Momentum Style Fund | 124,388 | — | — | — | — | — | ||||||||||||||||||
AQR International Momentum Style Fund | 30,166 | — | — | — | — | — | ||||||||||||||||||
AQR TM Large Cap Momentum Style Fund | 21,180 | — | — | — | — | — | ||||||||||||||||||
AQR TM International Momentum Style Fund | 22,946 | — | — | — | — | — | ||||||||||||||||||
AQR Large Cap Defensive Style Fund | 554,374 | — | — | — | — | — | ||||||||||||||||||
AQR International Defensive Style Fund | 13,398 | — | — | — | — | — | ||||||||||||||||||
AQR Emerging Defensive Style Fund | — | — | — | 13,420 | — | — | ||||||||||||||||||
AQR Global Equity Fund | — | 309 | 287,370 | 380,292 | — | — | ||||||||||||||||||
AQR International Equity Fund | — | 172,426 | 517,519 | 1,031,834 | — | — | ||||||||||||||||||
| * | May include cumulative appreciation (depreciation) of exchange-traded and centrally cleared derivatives as reported in the Schedules of Investments. Only current day’s variation margin is reported within the Statements of Assets and Liabilities for exchange traded derivatives. |
| AQR Funds | Annual Report | September 2016 | ||||||||||||||
226
| Notes to Financial Statements | September 30, 2016 |
The following table indicates the effect of derivative instruments, by primary underlying risk exposure and contract type, on the Statements of Operations for the year ended September 30, 2016:
| REALIZED GAIN (LOSS) ON DERIVATIVES RECOGNIZED AS A RESULT FROM OPERATIONS | NET CHANGE IN UNREALIZED APPRECIATION (DEPRECIATION) ON DERIVATIVES RECOGNIZED AS A RESULT FROM OPERATIONS | |||||||||||||||||||||||
| FUND | FUTURES CONTRACTS | SWAPS CONTRACTS | FORWARD CURRENCY EXCHANGE CONTRACTS | FUTURES CONTRACTS | SWAPS CONTRACTS | FORWARD CURRENCY EXCHANGE CONTRACTS | ||||||||||||||||||
| Equity Risk Exposure: | ||||||||||||||||||||||||
AQR Large Cap Multi-Style Fund | $ | 8,818,063 | $ | — | $ | — | $ | 784,521 | $ | — | $ | — | ||||||||||||
AQR Small Cap Multi-Style Fund | 3,647,556 | — | — | 363,401 | — | — | ||||||||||||||||||
AQR International Multi-Style Fund | 103,916 | — | — | 77,590 | — | — | ||||||||||||||||||
AQR Emerging Multi-Style Fund | 818,028 | — | — | (94,599 | ) | — | — | |||||||||||||||||
AQR TM International Multi-Style Fund | 192,250 | — | — | 28,956 | — | — | ||||||||||||||||||
AQR TM Emerging Multi-Style Fund | 944,829 | — | — | (51,706 | ) | — | — | |||||||||||||||||
AQR Large Cap Momentum Style Fund | 1,227,713 | — | — | 522,112 | — | — | ||||||||||||||||||
AQR Small Cap Momentum Style Fund | 1,108,053 | — | — | 502,772 | — | — | ||||||||||||||||||
AQR International Momentum Style Fund | 380,314 | — | — | 210,363 | — | — | ||||||||||||||||||
AQR TM Large Cap Momentum Style Fund | 173,981 | — | — | 70,429 | — | — | ||||||||||||||||||
AQR TM International Momentum Style Fund | (123,992 | ) | — | — | 22,946 | — | — | |||||||||||||||||
AQR Large Cap Defensive Style Fund | 5,105,340 | — | — | 753,157 | — | — | ||||||||||||||||||
AQR International Defensive Style Fund | 420,342 | — | — | 13,398 | — | — | ||||||||||||||||||
AQR Emerging Defensive Style Fund | 602,116 | — | — | (15,448 | ) | — | — | |||||||||||||||||
AQR Global Equity Fund | 2,107,906 | (378,410 | ) | — | 314,270 | 168,322 | — | |||||||||||||||||
AQR International Equity Fund | 1,943,063 | 457,018 | — | 1,439,712 | (216,773 | ) | — | |||||||||||||||||
| Foreign Exchange Rate Risk Exposure: | ||||||||||||||||||||||||
AQR Emerging Multi-Style Fund | — | — | 21,056 | — | — | — | ||||||||||||||||||
AQR TM International Multi-Style Fund | — | — | (71,550 | ) | — | — | — | |||||||||||||||||
AQR TM Emerging Multi-Style Fund | — | — | (170,293 | ) | — | — | — | |||||||||||||||||
AQR International Momentum Style Fund | — | — | (4,890 | ) | — | — | — | |||||||||||||||||
AQR Emerging Momentum Style Fund | — | — | (2,743 | ) | — | — | — | |||||||||||||||||
AQR TM International Momentum Style Fund | — | — | 63,735 | — | — | — | ||||||||||||||||||
AQR International Defensive Style Fund | — | — | 208,234 | — | — | — | ||||||||||||||||||
AQR Emerging Defensive Style Fund | — | — | (151 | ) | — | — | — | |||||||||||||||||
AQR Global Equity Fund | — | — | 6,752,840 | — | — | (1,081,657 | ) | |||||||||||||||||
AQR International Equity Fund | — | — | 28,741,705 | — | — | (1,401,567 | ) | |||||||||||||||||
The following tables present the Funds’ gross OTC derivative assets and liabilities by counterparty and contract type net of amounts available for offset under netting arrangements and any related collateral received or posted by the Funds’ as of September 30, 2016:
AQR GLOBAL EQUITY FUND
GROSS AMOUNTS NOT OFFSET IN THE STATEMENT OF ASSETS & LIABILITIES | ||||||||||||||||||||||||||
| COUNTERPARTY | INVESTMENT TYPE | GROSS AMOUNTS OF RECOGNIZED ASSETS PRESENTED IN THE STATEMENT OF ASSETS & LIABILITIES | GROSS AMOUNTS OFFSET | NET AMOUNTS OF ASSETS | FINANCIAL INSTRUMENTS | COLLATERAL RECEIVED (a) | NET AMOUNT | |||||||||||||||||||
| CITG | Forward Foreign Currency Exchange Contracts | $ | 227,762 | $ | (131,791 | ) | $ | 95,971 | $ | — | $ | (95,971 | ) | $ | — | |||||||||||
| GSIN | Total Return Swap Contracts | 9,626 | (9,317 | ) | 309 | — | — | 309 | ||||||||||||||||||
| JPMC | Forward Foreign Currency Exchange Contracts | 297,723 | (106,324 | ) | 191,399 | — | — | 191,399 | ||||||||||||||||||
| Total financial instruments subject to a master netting arrangement or similar arrangement | 535,111 | (247,432 | ) | 287,679 | — | (95,971 | ) | 191,708 | ||||||||||||||||||
| AQR Funds | Annual Report | September 2016 | ||||||||||||||
227
| Notes to Financial Statements | September 30, 2016 |
AQR GLOBAL EQUITY FUND (continued)
GROSS AMOUNTS NOT OFFSET IN THE STATEMENT OF ASSETS & LIABILITIES | ||||||||||||||||||||||||||
| COUNTERPARTY | INVESTMENT TYPE | GROSS AMOUNTS OF RECOGNIZED LIABILITIES PRESENTED IN THE STATEMENT OF ASSETS & LIABILITIES | GROSS AMOUNTS OFFSET | NET AMOUNTS OF LIABILITIES | FINANCIAL INSTRUMENTS | COLLATERAL PLEDGED (b) | NET AMOUNT | |||||||||||||||||||
| CITG | Forward Foreign Currency Exchange Contracts | $ | 131,791 | $ | (131,791 | ) | $ | — | $ | — | $ | — | $ | — | ||||||||||||
| GSIN | Total Return Swap Contracts | 9,317 | (9,317 | ) | — | — | — | — | ||||||||||||||||||
| JPMC | Forward Foreign Currency Exchange Contracts | 106,324 | (106,324 | ) | — | — | — | — | ||||||||||||||||||
| Total financial instruments subject to a master netting arrangement or similar arrangement | 247,432 | (247,432 | ) | — | — | — | — | |||||||||||||||||||
| (a) | Per GAAP disclosure requirements, the table above does not include the additional collateral received from the counterparty. Total additional collateral received was $45,400. |
| (b) | Per GAAP disclosure requirements, the table above does not include the additional collateral pledged to the counterparty. Total additional collateral pledged was $1,160,000. |
AQR INTERNATIONAL EQUITY FUND
GROSS AMOUNTS NOT OFFSET IN THE STATEMENT OF ASSETS & LIABILITIES | ||||||||||||||||||||||||||
| COUNTERPARTY | INVESTMENT TYPE | GROSS AMOUNTS OF RECOGNIZED ASSETS PRESENTED IN THE STATEMENT OF ASSETS & LIABILITIES | GROSS AMOUNTS OFFSET | NET AMOUNTS OF ASSETS | FINANCIAL INSTRUMENTS | COLLATERAL RECEIVED | NET AMOUNT | |||||||||||||||||||
| CITG | Forward Foreign Currency Exchange Contracts | $ | 515,884 | $ | (336,833 | ) | $ | 179,051 | $ | — | $ | (33,752 | ) | $ | 145,299 | |||||||||||
| GSIN | Total Return Swap Contracts | 187,702 | (15,276 | ) | 172,426 | — | — | 172,426 | ||||||||||||||||||
| JPMC | Forward Foreign Currency Exchange Contracts | 784,833 | (446,365 | ) | 338,468 | — | — | 338,468 | ||||||||||||||||||
| Total financial instruments subject to a master netting arrangement or similar arrangement | 1,488,419 | (798,474 | ) | 689,945 | — | (33,752 | ) | 656,193 | ||||||||||||||||||
| AQR Funds | Annual Report | September 2016 | ||||||||||||||
228
| Notes to Financial Statements | September 30, 2016 |
AQR INTERNATIONAL EQUITY FUND (continued)
GROSS AMOUNTS NOT OFFSET IN THE STATEMENT OF ASSETS & LIABILITIES | ||||||||||||||||||||||||||
| COUNTERPARTY | INVESTMENT TYPE | GROSS AMOUNTS OF RECOGNIZED LIABILITIES PRESENTED IN THE STATEMENT OF ASSETS & LIABILITIES | GROSS AMOUNTS OFFSET | NET AMOUNTS OF LIABILITIES | FINANCIAL INSTRUMENTS | COLLATERAL PLEDGED (a) | NET AMOUNT | |||||||||||||||||||
| CITG | Forward Foreign Currency Exchange Contracts | $ | 336,833 | $ | (336,833 | ) | $ | — | $ | — | $ | — | $ | — | ||||||||||||
| GSIN | Total Return Swap Contracts | 15,276 | (15,276 | ) | — | — | — | — | ||||||||||||||||||
| JPMC | Forward Foreign Currency Exchange Contracts | 446,365 | (446,365 | ) | — | — | — | — | ||||||||||||||||||
| Total financial instruments subject to a master netting arrangement or similar arrangement | 798,474 | (798,474 | ) | — | — | — | — | |||||||||||||||||||
| (a) | Per GAAP disclosure requirements, the table above does not include the additional collateral pledged to the counterparty. Total additional collateral pledged was $8,701,101. |
For the year ended September 30, 2016, the quarterly average notional values of the derivatives held by the Funds were as follows:
Derivatives Volume Disclosure*
| AQR LARGE CAP MULTI-STYLE FUND | AQR SMALL CAP MULTI-STYLE FUND | AQR INTERNATIONAL MULTI-STYLE FUND | AQR EMERGING MULTI-STYLE FUND | AQR TM INTERNATIONAL MULTI-STYLE FUND | ||||||||||||||||
| Futures Contracts: | ||||||||||||||||||||
| Average Notional Balance—Long | $ | 34,070,911 | $ | 11,147,430 | $ | 12,039,600 | $ | 6,566,630 | $ | 3,487,995 | ||||||||||
| Average Notional Balance—Short | — | — | — | — | — | |||||||||||||||
| Ending Notional Balance—Long | 48,284,940 | 16,227,900 | 12,288,240 | 5,976,875 | 3,584,070 | |||||||||||||||
| Ending Notional Balance—Short | — | — | — | — | — | |||||||||||||||
| AQR TM EMERGING MULTI-STYLE FUND | AQR LARGE CAP MOMENTUM STYLE FUND | AQR SMALL CAP MOMENTUM STYLE FUND | AQR INTERNATIONAL MOMENTUM STYLE FUND | AQR TM LARGE CAP MOMENTUM STYLE FUND | ||||||||||||||||
| Futures Contracts: | ||||||||||||||||||||
| Average Notional Balance—Long | $ | 8,476,063 | $ | 19,901,680 | $ | 5,991,820 | $ | 5,470,203 | $ | 2,561,697 | ||||||||||
| Average Notional Balance—Short | — | — | — | — | — | |||||||||||||||
| Ending Notional Balance—Long | 4,699,375 | 19,983,700 | 7,364,970 | 4,608,090 | 2,916,540 | |||||||||||||||
| Ending Notional Balance—Short | — | — | — | — | — | |||||||||||||||
| AQR Funds | Annual Report | September 2016 | ||||||||||||||
229
| Notes to Financial Statements | September 30, 2016 |
Derivatives Volume Disclosure* (continued)
| AQR TM INTERNATIONAL MOMENTUM STYLE FUND | AQR LARGE CAP DEFENSIVE STYLE FUND | AQR INTERNATIONAL DEFENSIVE STYLE FUND | AQR EMERGING DEFENSIVE STYLE FUND | AQR GLOBAL EQUITY FUND | AQR INTERNATIONAL EQUITY FUND | |||||||||||||||||||
| Futures Contracts: | ||||||||||||||||||||||||
| Average Notional Balance—Long | $ | 1,907,805 | $ | 42,530,516 | $ | 5,022,435 | $ | 1,849,298 | $ | 34,769,755 | $ | 129,638,177 | ||||||||||||
| Average Notional Balance—Short | — | — | — | — | 19,309,884 | 66,783,349 | ||||||||||||||||||
| Ending Notional Balance—Long | 1,877,370 | 80,042,820 | 3,584,070 | 1,779,375 | 26,079,167 | 106,276,317 | ||||||||||||||||||
| Ending Notional Balance—Short | — | — | — | — | 17,031,268 | 52,785,913 | ||||||||||||||||||
| Forward Foreign Currency Exchange Contracts: | ||||||||||||||||||||||||
| Average Settlement Value—Purchased | — | — | — | — | 94,997,582 | 275,190,915 | ||||||||||||||||||
| Average Settlement Value—Sold | — | — | — | — | 73,352,516 | 219,018,241 | ||||||||||||||||||
| Ending Value—Purchased | — | — | — | — | 50,659,778 | 172,849,799 | ||||||||||||||||||
| Ending Value—Sold | — | — | — | — | 38,142,375 | 135,041,859 | ||||||||||||||||||
| Total Return Swaps: | ||||||||||||||||||||||||
| Average Notional Balance—Long | — | — | — | — | 5,665,592 | 4,303,638 | ||||||||||||||||||
| Average Notional Balance—Short | — | — | — | — | 1,092,635 | 12,172,560 | ||||||||||||||||||
| Ending Notional Balance—Long | — | — | — | — | 1,512,140 | 2,570,076 | ||||||||||||||||||
| Ending Notional Balance—Short | — | — | — | — | 1,011,993 | 20,819,765 | ||||||||||||||||||
| * | Notional values as of each quarter end are used to calculate the average represented. |
8. Investment Advisory and Other Agreements
The Adviser serves as the investment adviser to each of the Funds, pursuant to the Second Amended and Restated Investment Advisory Agreement, dated November 7, 2014, as amended, (“Investment Advisory Agreement”) and the Investment Management Agreement, dated November 7, 2014, as amended (“Investment Management Agreement”) each entered into by the Trust, on behalf of the Funds (the Investment Management Agreement and Investment Advisory Agreement collectively referred to herein as the “Advisory Agreement”). Under the Advisory Agreement, the Adviser furnishes a continuous investment program for each Fund’s portfolio, makes day-to-day investment decisions for the Funds, and manages the Funds’ investments in accordance with the stated policies of each Fund. The Adviser is also responsible for selecting brokers and dealers to execute purchase and sale orders for the portfolio transactions of each Fund, subject to its obligation to seek best execution, and also provides certain other administrative services to each Fund. The Adviser provides persons satisfactory to the Funds’ Board to serve as officers of the Funds.
Pursuant to the Advisory Agreement, the Funds currently pay the Investment Advisory fee calculated on the average daily net assets for each Fund, in the annual ratios below:
| FUND | RATIO | |||
AQR Large Cap Multi-Style Fund | 0.30 | % | ||
AQR Small Cap Multi-Style Fund | 0.50 | |||
AQR International Multi-Style Fund | 0.45 | |||
AQR Emerging Multi-Style Fund | 0.60 | |||
AQR TM Large Cap Multi-Style Fund | 0.30 | |||
AQR TM Small Cap Multi-Style Fund | 0.50 | |||
AQR TM International Multi-Style Fund | 0.45 | |||
AQR TM Emerging Multi-Style Fund | 0.60 | |||
AQR Large Cap Momentum Style Fund | 0.25 | |||
AQR Small Cap Momentum Style Fund | 0.45 | |||
AQR International Momentum Style Fund | 0.40 | |||
AQR Emerging Momentum Style Fund | 0.55 | |||
AQR TM Large Cap Momentum Style Fund | 0.25 | |||
AQR TM Small Cap Momentum Style Fund | 0.45 | |||
AQR TM International Momentum Style Fund | 0.40 | |||
AQR Large Cap Defensive Style Fund | 0.25 | |||
AQR International Defensive Style Fund | 0.40 | |||
AQR Emerging Defensive Style Fund | 0.55 | |||
AQR Global Equity Fund | 0.40 | |||
AQR International Equity Fund | 0.45 | |||
| AQR Funds | Annual Report | September 2016 | ||||||||||||||
230
| Notes to Financial Statements | September 30, 2016 |
The Trust and the Adviser have entered into a Fee Waiver and Expense Reimbursement Agreement (“Fee Waiver Agreement”) whereby the Adviser has agreed to waive its fee and/or reimburse each Fund at least through January 28, 2017 for Class I, N, and R6 shares, respectively, unless otherwise noted. Pursuant to the Fee Waiver Agreement, the Adviser has agreed to waive and/or reimburse each Fund to the extent that the total annual fund operating expense ratios, exclusive of interest, taxes, borrowing costs, acquired fund fees and expenses, dividend and interest expense related to short sales, and extraordinary expenses exceed the following ratios:
| FUND | CLASS I | CLASS N | CLASS R6 | |||||||||
AQR Large Cap Multi-Style Fund | 0.45 | % | 0.70 | % | 0.35 | % | ||||||
AQR Small Cap Multi-Style Fund | 0.65 | 0.90 | 0.55 | |||||||||
AQR International Multi-Style Fund | 0.60 | 0.85 | 0.50 | |||||||||
AQR Emerging Multi-Style Fund | 0.75 | 1.00 | 0.65 | |||||||||
AQR TM Large Cap Multi-Style Fund | 0.45 | 0.70 | 0.35 | |||||||||
AQR TM Small Cap Multi-Style Fund | 0.65 | 0.90 | 0.55 | |||||||||
AQR TM International Multi-Style Fund | 0.60 | 0.85 | 0.50 | |||||||||
AQR TM Emerging Multi-Style Fund | 0.75 | 1.00 | 0.65 | |||||||||
AQR Large Cap Momentum Style Fund | 0.40 | 0.65 | 0.30 | |||||||||
AQR Small Cap Momentum Style Fund | 0.60 | 0.85 | 0.50 | |||||||||
AQR International Momentum Style Fund | 0.55 | 0.80 | 0.45 | |||||||||
AQR Emerging Momentum Style Fund | 0.70 | 0.95 | 0.60 | |||||||||
AQR TM Large Cap Momentum Style Fund | 0.40 | 0.65 | 0.30 | |||||||||
AQR TM Small Cap Momentum Style Fund | 0.60 | 0.85 | 0.50 | |||||||||
AQR TM International Momentum Style Fund | 0.55 | 0.80 | 0.45 | |||||||||
AQR Large Cap Defensive Style Fund | 0.40 | 0.65 | 0.30 | |||||||||
AQR International Defensive Style Fund | 0.55 | 0.80 | 0.45 | |||||||||
AQR Emerging Defensive Style Fund | 0.70 | 0.95 | 0.60 | |||||||||
AQR Global Equity Fund | 0.90 | 1.15 | 0.70 | |||||||||
AQR International Equity Fund | 0.95 | 1.20 | 0.85 | |||||||||
Prior to April 1, 2016, the Fee Waiver and Expense Reimbursement Agreement for the AQR International Equity Fund was as follows:
| FUND | CLASS I | CLASS N | CLASS R6 | |||||||||
AQR International Equity Fund | 0.95 | % | 1.20 | % | 0.75 | % | ||||||
For the year ended September 30, 2016 the Funds’ Adviser waived fees and/or reimbursed expenses for each of the Funds as follows:
| FUND | INVESTMENT ADVISORY AND SHAREHOLDER SERVICES FEES WAIVED | EXPENSE REIMBURSEMENTS | TOTAL | |||||||||
AQR Large Cap Multi-Style Fund | $ | 174,397 | $ | 10,368 | $ | 184,765 | ||||||
AQR Small Cap Multi-Style Fund | 318,243 | 11,572 | 329,815 | |||||||||
AQR International Multi-Style Fund | 274,631 | 1,637 | 276,268 | |||||||||
AQR Emerging Multi-Style Fund | 436,820 | 1,632 | 438,452 | |||||||||
AQR TM Large Cap Multi-Style Fund | 137,865 | 21,148 | 159,013 | |||||||||
AQR TM Small Cap Multi-Style Fund | 57,097 | 93,553 | 150,650 | |||||||||
AQR TM International Multi-Style Fund | 207,443 | 966 | 208,409 | |||||||||
AQR TM Emerging Multi-Style Fund | 474,513 | 809 | 475,322 | |||||||||
AQR Large Cap Momentum Style Fund | 139,017 | 8,622 | 147,639 | |||||||||
AQR Small Cap Momentum Style Fund | 184,276 | 460 | 184,736 | |||||||||
AQR International Momentum Style Fund | 255,533 | 288 | 255,821 | |||||||||
AQR Emerging Momentum Style Fund | 51,696 | 144,650 | 196,346 | |||||||||
AQR TM Large Cap Momentum Style Fund | 125,123 | 392 | 125,515 | |||||||||
AQR TM Small Cap Momentum Style Fund | 122,008 | 14,350 | 136,358 | |||||||||
AQR TM International Momentum Style Fund | 177,576 | 1,036 | 178,612 | |||||||||
AQR Large Cap Defensive Style Fund | 141,305 | 11,664 | 152,969 | |||||||||
AQR International Defensive Style Fund | 152,250 | 41,721 | 193,971 | |||||||||
AQR Emerging Defensive Style Fund | 183,739 | 9,836 | 193,575 | |||||||||
AQR Global Equity Fund | 89,444 | — | 89,444 | |||||||||
AQR International Equity Fund | 72,812 | — | 72,812 | |||||||||
The Trust, in turn, agreed that the Funds will repay the fee waiver/expense reimbursement to the Adviser. Such repayment shall be made only out of the class of the Fund for which the applicable fee waiver and expense reimbursement was made. Repayments with respect to a Fund must be limited to amounts that do not cause the aggregate operating expenses of the Fund attributable to a share class during a year in which
| AQR Funds | Annual Report | September 2016 | ||||||||||||||
231
| Notes to Financial Statements | September 30, 2016 |
such repayment is made to exceed the applicable ratios when the waiver was generated. A repayment shall be payable only to the extent it can be made during the thirty-six months following the applicable period during which the Adviser waived fees or reimbursed the applicable Fund for its operating expenses under the Agreement.
For the year ended September 30, 2016, the amounts waived and reimbursed by the Adviser, as well as the amounts available for potential future recoupment by the Adviser and the expiration schedule at September 30, 2016 are as follows:
| FEES WAIVED/ REIMBURSED FOR THE PERIOD ENDED SEPTEMBER 30, 2016 | TOTAL POTENTIAL RECOUPMENT AMOUNT SEPTEMBER 30, 2016 | POTENTIAL RECOUPMENT AMOUNTS EXPIRING SEPTEMBER 30 | ||||||||||||||||||
| FUND | 2017 | 2018 | 2019 | |||||||||||||||||
| AQR LARGE CAP MULTI-STYLE FUND | ||||||||||||||||||||
Class I | $ | 76,856 | $ | 428,046 | $ | 128,928 | $ | 222,262 | $ | 76,856 | ||||||||||
Class N | 9,139 | 55,075 | 19,784 | 26,152 | 9,139 | |||||||||||||||
Class R6 | 98,770 | 267,575 | 2,087 | 166,718 | 98,770 | |||||||||||||||
| Totals | $ | 184,765 | $ | 750,696 | $ | 150,799 | $ | 415,132 | $ | 184,765 | ||||||||||
| AQR SMALL CAP MULTI-STYLE FUND | ||||||||||||||||||||
Class I | $ | 30,910 | $ | 222,051 | $ | 90,682 | $ | 100,459 | $ | 30,910 | ||||||||||
Class N | 7,778 | 70,096 | 38,319 | 23,999 | 7,778 | |||||||||||||||
Class R6 | 291,127 | 302,329 | 375 | 10,827 | 291,127 | |||||||||||||||
| Totals | $ | 329,815 | $ | 594,476 | $ | 129,376 | $ | 135,285 | $ | 329,815 | ||||||||||
| AQR INTERNATIONAL MULTI-STYLE FUND | ||||||||||||||||||||
Class I | $ | 47,320 | $ | 247,958 | $ | 146,282 | $ | 54,356 | $ | 47,320 | ||||||||||
Class N | 5,748 | 34,545 | 23,372 | 5,425 | 5,748 | |||||||||||||||
Class R6 | 223,200 | 427,597 | 4,816 | 199,581 | 223,200 | |||||||||||||||
| Totals | $ | 276,268 | $ | 710,100 | $ | 174,470 | $ | 259,362 | $ | 276,268 | ||||||||||
| AQR EMERGING MULTI-STYLE FUND | ||||||||||||||||||||
Class I | $ | 117,893 | $ | 322,131 | $ | 94,893 | $ | 109,345 | $ | 117,893 | ||||||||||
Class N | 12,126 | 54,695 | 21,322 | 21,247 | 12,126 | |||||||||||||||
Class R6 | 308,433 | 470,164 | 877 | 160,854 | 308,433 | |||||||||||||||
| Totals | $ | 438,452 | $ | 846,990 | $ | 117,092 | $ | 291,446 | $ | 438,452 | ||||||||||
| AQR TM LARGE CAP MULTI-STYLE FUND | ||||||||||||||||||||
Class I | $ | 33,748 | $ | 45,463 | $ | — | $ | 11,715 | $ | 33,748 | ||||||||||
Class N | 2,001 | 3,614 | — | 1,613 | 2,001 | |||||||||||||||
Class R6 | 123,264 | 229,823 | — | 106,559 | 123,264 | |||||||||||||||
| Totals | $ | 159,013 | $ | 278,900 | $ | — | $ | 119,887 | $ | 159,013 | ||||||||||
| AQR TM SMALL CAP MULTI-STYLE FUND | ||||||||||||||||||||
Class I | $ | 101,381 | $ | 121,741 | $ | — | $ | 20,360 | $ | 101,381 | ||||||||||
Class N | 18,924 | 23,923 | — | 4,999 | 18,924 | |||||||||||||||
Class R6 | 30,345 | 108,614 | — | 78,269 | 30,345 | |||||||||||||||
| Totals | $ | 150,650 | $ | 254,278 | $ | — | $ | 103,628 | $ | 150,650 | ||||||||||
| AQR TM INTERNATIONAL MULTI-STYLE FUND | ||||||||||||||||||||
Class I | $ | 32,691 | $ | 41,397 | $ | — | $ | 8,706 | $ | 32,691 | ||||||||||
Class N | 1,603 | 3,311 | — | 1,708 | 1,603 | |||||||||||||||
Class R6 | 174,115 | 334,349 | — | 160,234 | 174,115 | |||||||||||||||
| Totals | $ | 208,409 | $ | 379,057 | $ | — | $ | 170,648 | $ | 208,409 | ||||||||||
| AQR Funds | Annual Report | September 2016 | ||||||||||||||
232
| Notes to Financial Statements | September 30, 2016 |
| FEES WAIVED/ REIMBURSED FOR THE PERIOD ENDED SEPTEMBER 30, 2016 | TOTAL POTENTIAL RECOUPMENT AMOUNT SEPTEMBER 30, 2016 | POTENTIAL RECOUPMENT AMOUNTS EXPIRING SEPTEMBER 30 | ||||||||||||||||||
| FUND | 2017 | 2018 | 2019 | |||||||||||||||||
| AQR TM EMERGING MULTI-STYLE FUND | ||||||||||||||||||||
Class I | $ | 20,907 | $ | 47,465 | $ | — | $ | 26,558 | $ | 20,907 | ||||||||||
Class N | 3,045 | 18,990 | — | 15,945 | 3,045 | |||||||||||||||
Class R6 | 451,370 | 566,121 | — | 114,751 | 451,370 | |||||||||||||||
| Totals | $ | 475,322 | $ | 632,576 | $ | — | $ | 157,254 | $ | 475,322 | ||||||||||
| AQR LARGE CAP MOMENTUM STYLE FUND | ||||||||||||||||||||
Class I | $ | 128,280 | $ | 1,098,023 | $ | 502,936 | $ | 466,807 | $ | 128,280 | ||||||||||
Class N | 9,604 | 127,469 | 63,464 | 54,401 | 9,604 | |||||||||||||||
Class R6 | 9,755 | 25,953 | 20 | 16,178 | 9,755 | |||||||||||||||
| Totals | $ | 147,639 | $ | 1,251,445 | $ | 566,420 | $ | 537,386 | $ | 147,639 | ||||||||||
| AQR SMALL CAP MOMENTUM STYLE FUND | ||||||||||||||||||||
Class I | $ | 171,192 | $ | 439,750 | $ | 66,206 | $ | 202,352 | $ | 171,192 | ||||||||||
Class N | 4,003 | 16,593 | 7,160 | 5,430 | 4,003 | |||||||||||||||
Class R6 | 9,541 | 35,756 | 17 | 26,198 | 9,541 | |||||||||||||||
| Totals | $ | 184,736 | $ | 492,099 | $ | 73,383 | $ | 233,980 | $ | 184,736 | ||||||||||
| AQR INTERNATIONAL MOMENTUM STYLE FUND | ||||||||||||||||||||
Class I | $ | 205,356 | $ | 579,324 | $ | 162,935 | $ | 211,033 | $ | 205,356 | ||||||||||
Class N | 25,144 | 102,250 | 40,491 | 36,615 | 25,144 | |||||||||||||||
Class R6 | 25,321 | 41,931 | 19 | 16,591 | 25,321 | |||||||||||||||
| Totals | $ | 255,821 | $ | 723,505 | $ | 203,445 | $ | 264,239 | $ | 255,821 | ||||||||||
| AQR EMERGING MOMENTUM STYLE FUND | ||||||||||||||||||||
Class I | $ | 158,250 | $ | 429,231 | $ | 102,927 | $ | 168,054 | $ | 158,250 | ||||||||||
Class N | 27,182 | 74,256 | 19,986 | 27,088 | 27,182 | |||||||||||||||
Class R6 | 10,914 | 14,278 | 1,172 | 2,192 | 10,914 | |||||||||||||||
| Totals | $ | 196,346 | $ | 517,765 | $ | 124,085 | $ | 197,334 | $ | 196,346 | ||||||||||
| AQR TM LARGE CAP MOMENTUM STYLE FUND | ||||||||||||||||||||
Class I | $ | 55,980 | $ | 289,818 | $ | 101,535 | $ | 132,303 | $ | 55,980 | ||||||||||
Class N | 143 | 1,355 | 1,048 | 164 | 143 | |||||||||||||||
Class R6 | 69,392 | 122,171 | 53 | 52,726 | 69,392 | |||||||||||||||
| Totals | $ | 125,515 | $ | 413,344 | $ | 102,636 | $ | 185,193 | $ | 125,515 | ||||||||||
| AQR TM SMALL CAP MOMENTUM STYLE FUND | ||||||||||||||||||||
Class I | $ | 134,918 | $ | 377,438 | $ | 109,145 | $ | 133,375 | $ | 134,918 | ||||||||||
Class N | 710 | 3,484 | 1,920 | 854 | 710 | |||||||||||||||
Class R6 | 730 | 1,694 | 234 | 730 | 730 | |||||||||||||||
| Totals | $ | 136,358 | $ | 382,616 | $ | 111,299 | $ | 134,959 | $ | 136,358 | ||||||||||
| AQR TM INTERNATIONAL MOMENTUM STYLE FUND | ||||||||||||||||||||
Class I | $ | 60,845 | $ | 307,053 | $ | 123,731 | $ | 122,477 | $ | 60,845 | ||||||||||
Class N | 286 | 1,659 | 1,109 | 264 | 286 | |||||||||||||||
Class R6 | 117,481 | 181,033 | 75 | 63,477 | 117,481 | |||||||||||||||
| Totals | $ | 178,612 | $ | 489,745 | $ | 124,915 | $ | 186,218 | $ | 178,612 | ||||||||||
| AQR Funds | Annual Report | September 2016 | ||||||||||||||
233
| Notes to Financial Statements | September 30, 2016 |
| FEES WAIVED/ REIMBURSED FOR THE PERIOD ENDED SEPTEMBER 30, 2016 | TOTAL POTENTIAL RECOUPMENT AMOUNT SEPTEMBER 30, 2016 | POTENTIAL RECOUPMENT AMOUNTS EXPIRING SEPTEMBER 30 | ||||||||||||||||||
| FUND | 2017 | 2018 | 2019 | |||||||||||||||||
| AQR LARGE CAP DEFENSIVE STYLE FUND | ||||||||||||||||||||
Class I | $ | 93,642 | $ | 508,115 | $ | 251,857 | $ | 162,616 | $ | 93,642 | ||||||||||
Class N | 35,909 | 103,876 | 44,712 | 23,255 | 35,909 | |||||||||||||||
Class R6 | 23,418 | 23,546 | 11 | 117 | 23,418 | |||||||||||||||
| Totals | $ | 152,969 | �� | $ | 635,537 | $ | 296,580 | $ | 185,988 | $ | 152,969 | |||||||||
| AQR INTERNATIONAL DEFENSIVE STYLE FUND | ||||||||||||||||||||
Class I | $ | 161,919 | $ | 467,190 | $ | 142,854 | $ | 162,417 | $ | 161,919 | ||||||||||
Class N | 14,520 | 28,594 | 13,041 | 1,033 | 14,520 | |||||||||||||||
Class R6 | 17,532 | 18,068 | 51 | 485 | 17,532 | |||||||||||||||
| Totals | $ | 193,971 | $ | 513,852 | $ | 155,946 | $ | 163,935 | $ | 193,971 | ||||||||||
| AQR EMERGING DEFENSIVE STYLE FUND | ||||||||||||||||||||
Class I | $ | 192,290 | $ | 635,721 | $ | 193,425 | $ | 250,006 | $ | 192,290 | ||||||||||
Class N | 607 | 19,051 | 16,965 | 1,479 | 607 | |||||||||||||||
Class R6 | 678 | 1,098 | 49 | 371 | 678 | |||||||||||||||
| Totals | $ | 193,575 | $ | 655,870 | $ | 210,439 | $ | 251,856 | $ | 193,575 | ||||||||||
| AQR GLOBAL EQUITY FUND | ||||||||||||||||||||
Class I | $ | 22,196 | $ | 26,672 | $ | 4,476 | $ | — | $ | 22,196 | ||||||||||
Class N | 1,012 | 5,248 | 4,236 | — | 1,012 | |||||||||||||||
Class R6 | 66,236 | 85,432 | 15,779 | 3,417 | 66,236 | |||||||||||||||
| Totals | $ | 89,444 | $ | 117,352 | $ | 24,491 | $ | 3,417 | $ | 89,444 | ||||||||||
| AQR INTERNATIONAL EQUITY FUND | ||||||||||||||||||||
Class I | $ | 65,689 | $ | 65,689 | $ | — | $ | — | $ | 65,689 | ||||||||||
Class N | 7,123 | 7,123 | — | — | 7,123 | |||||||||||||||
Class R6 | — | — | — | — | — | |||||||||||||||
| Totals | $ | 72,812 | $ | 72,812 | $ | — | $ | — | $ | 72,812 | ||||||||||
JPMorgan Chase Bank, N.A., serves as the Funds’ Administrator, Accounting Agent, Custodian and Security Lending Agent.
ALPS Fund Services, Inc. serves as the Funds’ Transfer Agent, and ALPS Distributors, Inc. serves as the Funds’ Distributor.
9. Distribution Plan
The Trust has adopted a Plan of Distribution (the “Plan”) pursuant to Rule 12b-1 under the 1940 Act with respect to the Class N shares of the Funds. The Plan allows for the payment of services related to the distribution and servicing of these shares at a rate of up to 0.25% per annum of the average daily net asset value of the Class N shares of the Funds.
10. Shareholder Servicing Agreements
Pursuant to a Shareholder Services Agreement, between the Trust and the Adviser, the Adviser provides certain administrative and/or support services to the AQR Global Equity Fund and AQR International Equity Fund and their shareholders. These services include, among others, providing shareholders with analysis and explanations of Fund reports, information about shareholder positions in Fund shares, as well as assisting in the distribution of shareholder communications, such as prospectus materials, shareholder reports and annual reports. Under this agreement the Adviser receives an annual fee, payable monthly, calculated on the average daily net assets of each Class at the following rates:
| FUND | CLASS I | CLASS N | CLASS R6 | |||||||||
AQR Global Equity Fund | 0.30 | % | 0.30 | % | 0.20 | % | ||||||
AQR International Equity Fund* | 0.30 | 0.30 | 0.30 | |||||||||
| * | Prior to April 1, 2016, the rate was 0.20% for Class R6. |
| AQR Funds | Annual Report | September 2016 | ||||||||||||||
234
| Notes to Financial Statements | September 30, 2016 |
Fees incurred by the Funds under the Plan and/or the Shareholder Services Agreement for the year ended September 30, 2016, were as follows:
| FUND | CLASS I | CLASS N | CLASS R6 | |||||||||
AQR Global Equity Fund | $ | 100,945 | $ | 3,984 | $ | 189,994 | ||||||
AQR International Equity Fund | 1,012,829 | 110,491 | 45,388 | |||||||||
11. Capital Transactions
Investors may purchase shares of a Fund at its NAV, based on the next calculation of the NAV after the order is placed. Except as noted below, neither the Fund nor the distributor charges a sales charge or other transaction fee to purchase shares, although other institutions may impose transaction fees on shares purchased through them. The AQR Global Equity and AQR International Equity Funds’ Class Y shares charge purchase and redemption fees of 0.10% each, regardless of the period such shares may have been held.
12. Principal Risks and Concentrations
In the normal course of business the Funds trade financial instruments and enter into financial transactions where risk of potential loss exists due to changes in the market (market risk). A Fund’s investments in financial derivatives and other financial instruments may expose the Fund to various elements of market risks which include interest rate, foreign currency, equity and commodity risks.
Interest rate risk is the risk that fixed income securities will decline in value because of changes in interest rates. Convertible securities and non-convertible income producing securities are subject to certain risks, including (i) if interest rates go up, the value of convertible securities and non-convertible income producing securities in the Funds’ portfolio generally will decline; (ii) during periods of declining interest rates, the issuer of a security may exercise its option to prepay principal earlier than scheduled, forcing the Funds to reinvest in lower yielding securities (call or prepayment risk); and (iii) during periods of rising interest rates, the average life of certain types of securities may be extended because of slower than expected principal payments (extension risk).
Currency risk arises from the possibility that fluctuations in foreign exchange rates will affect the value of cash balances held in foreign currencies and non-U.S. denominated financial instruments. In addition, the Funds’ use of forward foreign currency exchange contracts may expose them to the risk that the value of the foreign currency changes unfavorably relative to the U.S. Dollar. Currency rates in foreign countries may fluctuate significantly over short periods of time for a number of reasons.
The market values of equities, such as common stocks and preferred securities or equity related investments such as futures and options, may decline due to general market conditions which are not specifically related to a particular company. They may also decline due to factors which affect a particular industry or industries. The Funds may invest in illiquid investments and may experience difficulty in selling those investments in a timely manner at the price that it believes the investments are worth. Prices may fluctuate widely over short or extended periods in response to company, market or economic news. Markets also tend to move in cycles, with periods of rising and falling prices. This volatility may cause the Fund’s net asset value to experience significant increases or decreases over short periods of time. If there is a general decline in the securities and other markets, the net asset value of a Fund may lose value, regardless of the individual results of the securities and other instruments in which the Fund invests.
Exposure to the commodities markets may subject a Fund to greater volatility than investments in traditional securities. The value of commodity-linked derivative investments and exchange-traded notes may be affected by changes in overall market movements, commodity index volatility, changes in interest rates, or factors affecting a particular industry or commodity.
In addition to market risk, the Funds may be exposed to the risk that one or more securities in the Funds’ portfolio will decline in price, or fail to pay interest or principal when due, because the issuer of the security experiences a decline in its financial status (credit risk). Credit risk is measured by the loss a Fund would record if the major financial institution or other counterparties failed to perform pursuant to terms of their obligations. Certain Funds may primarily maintain cash balances at one or several major financial institutions that may exceed federally insured limits and as such each of the Funds have credit risk associated with such financial institutions. In general, lower rated securities carry a greater degree of risk that the issuer will lose its ability to make interest and principal payments, which could have a negative impact on the Funds’ net asset value or dividends. The Funds minimize credit risk by monitoring credit exposure and collateral values, and by requiring additional collateral to be promptly deposited with or returned to each of the Funds when deemed necessary.
Similar to credit risk, a Fund may be exposed to counterparty risk, or the risk that an institution or other entity with which the Fund has unsettled or open transactions will default. Financial assets, which potentially expose a Fund to counterparty risk, consist principally of cash due from counterparties and investments. By using derivative instruments, the Funds may be exposed to the risk that derivative counterparties may not perform in accordance with the contractual provisions offset by the value of any collateral received. The Funds’ exposure to credit risk associated with counterparty non-performance is limited to the unrealized gains inherent in such transactions that are recognized in the Statements of Assets and Liabilities. The counterparties to the Funds’ derivative investments may include affiliates of the Funds’ clearing brokers and other major financial institutions. While the Funds use multiple clearing brokers and counterparties, a concentration of credit risk
| AQR Funds | Annual Report | September 2016 | ||||||||||||||
235
| Notes to Financial Statements | September 30, 2016 |
may exist because of balances held and transactions with a limited number of clearing brokers and counterparties. The Funds minimize counterparty credit risk through credit limits and approvals, credit monitoring procedures, executing master netting arrangements and managing margin and collateral requirements, as appropriate.
In the normal course of business, the Funds may enter into agreements with certain counterparties for derivative transactions. A number of each Fund’s Master Agreements contain provisions that require each Fund to maintain a predetermined level of net assets, and/or provide limits regarding the decline of a Fund’s net asset value over specified time periods. If a Fund was to violate such provisions, the counterparties to the derivative instruments could request immediate payment or demand immediate collateralization on derivative instruments in net liability positions. If such events are not cured by the Fund or waived by the counterparties, they may decide to curtail or limit extension of credit, and the Fund may be forced to unwind its derivative positions which may result in material losses.
The Funds, at times, utilize substantial leverage in their investment program. Such leverage may take the form of trading on margin, investing in derivative instruments that are inherently leveraged, entering into reverse repurchase transactions and entering into other forms of direct and indirect borrowings. There is no guarantee that the Funds’ borrowing arrangement or other arrangements for obtaining leverage will continue to be available, or if available, will be available on terms and conditions acceptable to the Funds. Unfavorable economic conditions also could increase funding costs, limit access to the capital markets or result in a decision by lenders not to extend credit to the Funds. In addition, a decline in market value of the Funds’ assets may have particular adverse consequences in instances where they have borrowed money based on the market value of those assets. A decrease in market value of those assets may result in the lender (including derivative counterparties) requiring the Funds to post additional collateral or otherwise sell assets at a time when it may not be in the Funds’ best interest to do so.
The Adviser relies heavily on quantitative models and information and data supplied by third parties. When models and data prove to be incorrect or incomplete, any decisions made in reliance thereon may expose the Fund to potential risks. Such models may produce unexpected results, which can result in losses for a Fund.
Periodically, the Funds may be a party to legal actions arising in the ordinary course of business. The Funds are currently not subject to any actions that either individually or in the aggregate are expected to have a material impact on their results of operations, cash flows or financial condition.
13. Line of Credit
Effective February 29, 2016 and terminating on February 28, 2017, the Trust renewed a committed syndicated line of credit (the “Agreement”) with Bank of America, N.A., as the Administrative Agent. Borrowing, if any, under this arrangement bears, as incurred, interest at the sum of (a) 1.0% per annum plus (b) the higher of (i) the Federal Funds Rate or (ii) the Eurodollar Rate, which is paid monthly. The maximum loan amount is the lesser of an amount which will not exceed the borrowing limits set forth in the Funds’ Prospectus and/or Registration Statement and will not cause the asset coverage ratio for any borrowings by a Fund to drop below the required amount under the Agreement (between 300-500% per Fund). The Agreement is subject to an annual commitment fee which is payable in arrears on a quarterly basis. In the event of a draw upon the line of credit, liquid assets of the borrowing Fund may be designated as collateral until its loan is repaid in full. Funds with less than $25,000,000 in net assets are ineligible to draw upon the line of credit. Effective July 22, 2016 the line of credit available was increased to $285,000,000 from $275,000,000. Prior to February 29, 2016, the line of credit available was $225,000,000, subject to substantially similar terms. The Funds did not have any borrowings for the period ended September 30, 2016.
14. Principal Ownership
As of September 30, 2016, the Funds had individual shareholder and/or omnibus accounts owning more than 5% of the total shares outstanding of the Fund as follows:
| FUND | NUMBER OF INDIVIDUAL SHAREHOLDERS AND/OR OMNIBUS ACCOUNTS | TOTAL PERCENTAGE INTEREST HELD | ||||||
AQR Large Cap Multi-Style Fund | 4 | 88.48 | % | |||||
AQR Small Cap Multi-Style Fund | 3 | 92.86 | % | |||||
AQR International Multi-Style Fund | 4 | 94.03 | % | |||||
AQR Emerging Multi-Style Fund | 4 | 94.65 | % | |||||
AQR TM Large Cap Multi-Style Fund | 4 | 95.34 | % | |||||
AQR TM Small Cap Multi-Style Fund* | 3 | 92.01 | % | |||||
AQR TM International Multi-Style Fund | 4 | 95.61 | % | |||||
AQR TM Emerging Multi-Style Fund | 3 | 95.36 | % | |||||
AQR Large Cap Momentum Style Fund | 4 | 91.99 | % | |||||
AQR Small Cap Momentum Style Fund | 3 | 87.75 | % | |||||
AQR International Momentum Style Fund | 3 | 93.13 | % | |||||
| AQR Funds | Annual Report | September 2016 | ||||||||||||||
236
| Notes to Financial Statements | September 30, 2016 |
| FUND | NUMBER OF INDIVIDUAL SHAREHOLDERS AND/OR OMNIBUS ACCOUNTS | TOTAL PERCENTAGE INTEREST HELD | ||||||
AQR Emerging Momentum Style Fund* | 4 | 90.64 | % | |||||
AQR TM Large Cap Momentum Style Fund | 3 | 97.58 | % | |||||
AQR TM Small Cap Momentum Style Fund | 2 | 95.89 | % | |||||
AQR TM International Momentum Style Fund | 3 | 99.65 | % | |||||
AQR Large Cap Defensive Style Fund | 5 | 86.22 | % | |||||
AQR International Defensive Style Fund | 3 | 93.88 | % | |||||
AQR Emerging Defensive Style Fund | 1 | 88.04 | % | |||||
AQR Global Equity Fund | 4 | 89.75 | % | |||||
AQR International Equity Fund | 6 | 81.94 | % | |||||
| * | The percentage held by the Adviser and/or affiliates is 11.07% and 42.73% respectively. |
15. Redemption In-Kind
On April 1, 2016 the AQR International Equity Fund processed an in-kind redemption. The redemption represented 51.2% of the Fund’s net assets and was paid partially in cash and in-kind. The amount of redemption proceeds paid in-kind was $28,738,734 for Class R6 and $319,560,131 for Class Y, respectively. The realized gain (loss) associated with the portion redeemed in-kind was $37,988,383.
On May 9, 2016 the AQR Global Equity Fund processed an in-kind redemption. The redemption represented 42.7% of the Fund’s net assets and was paid partially in cash and in-kind. The amount of redemption proceeds paid in-kind was $89,954,399 for Class Y. The realized gain (loss) associated with the portion redeemed in-kind was $15,005,926.
16. Subsequent Events
The Funds have evaluated subsequent events through the date of issuance of this report and have determined that there are no material events that would require accrual or disclosure.
| AQR Funds | Annual Report | September 2016 | ||||||||||||||
237
| Report of Independent Registered Public Accounting Firm |
To the Board of Trustees and Shareholders of AQR Funds:
In our opinion, the accompanying statements of assets and liabilities, including the schedules of investments, and the related statements of operations and of changes in net assets and the financial highlights present fairly, in all material respects, the financial position of the AQR Large Cap Multi-Style Fund, AQR Small Cap Multi-Style Fund, AQR International Multi-Style Fund, AQR Emerging Multi-Style Fund, AQR TM Large Cap Multi-Style Fund, AQR TM Small Cap Multi-Style Fund, AQR TM International Multi-Style Fund, AQR TM Emerging Multi-Style Fund, AQR Large Cap Momentum Style Fund, AQR Small Cap Momentum Style Fund, AQR International Momentum Style Fund, AQR Emerging Momentum Style Fund, AQR TM Large Cap Momentum Style Fund, AQR TM Small Cap Momentum Style Fund, AQR TM International Momentum Style Fund, AQR Large Cap Defensive Style Fund, AQR International Defensive Style Fund, AQR Emerging Defensive Style Fund, AQR Global Equity Fund and AQR International Equity Fund (twenty of the portfolios constituting AQR Funds, hereinafter referred to as the “Funds”) at September 30, 2016, the results of each of their operations for the year then ended, and the changes in each of their net assets and their financial highlights for each of the periods presented, in conformity with accounting principles generally accepted in the United States of America. These financial statements and financial highlights (hereafter referred to as “financial statements”) are the responsibility of the Funds’ management. Our responsibility is to express an opinion on these financial statements based on our audits. We conducted our audits of these financial statements in accordance with the standards of the Public Company Accounting Oversight Board (United States). Those standards require that we plan and perform the audit to obtain reasonable assurance about whether the financial statements are free of material misstatement. An audit includes examining, on a test basis, evidence supporting the amounts and disclosures in the financial statements, assessing the accounting principles used and significant estimates made by management, and evaluating the overall financial statement presentation. We believe that our audits, which included confirmation of securities at September 30, 2016 by correspondence with the custodian, brokers, and transfer agent, provide a reasonable basis for our opinion.
PricewaterhouseCoopers LLP
New York, New York
November 21, 2016
| AQR Funds | Annual Report | September 2016 | ||||||||||||||
238
| Other Federal Tax Information (Unaudited) |
For the fiscal year ended September 30, 2016, the Funds designate the following percentages of ordinary income dividends, or maximum amount allowable, as qualifying for the reduced tax rate under the Jobs and Growth Tax Relief Reconciliation Act of 2003:
| FUND | PERCENTAGE | |||
AQR Large Cap Multi-Style Fund | 100.00 | % | ||
AQR Small Cap Multi-Style Fund | 66.82 | % | ||
AQR International Multi-Style Fund | 98.47 | % | ||
AQR Emerging Multi-Style Fund | 51.22 | % | ||
AQR TM Large Cap Multi-Style Fund | 83.60 | % | ||
AQR TM Small Cap Multi-Style Fund | 76.09 | % | ||
AQR TM International Multi-Style Fund | 90.05 | % | ||
AQR TM Emerging Multi-Style Fund | 31.01 | % | ||
AQR Large Cap Momentum Style Fund | 100.00 | % | ||
AQR Small Cap Momentum Style Fund | 96.40 | % | ||
AQR International Momentum Style Fund | 100.00 | % | ||
AQR Emerging Momentum Style Fund | 66.94 | % | ||
AQR TM Large Cap Momentum Style Fund | 100.00 | % | ||
AQR TM Small Cap Momentum Style Fund | 81.96 | % | ||
AQR TM International Momentum Style Fund | 100.00 | % | ||
AQR Large Cap Defensive Style Fund | 72.08 | % | ||
AQR International Defensive Style Fund | 100.00 | % | ||
AQR Emerging Defensive Style Fund | 75.59 | % | ||
AQR Global Equity Fund | 100.00 | % | ||
AQR International Equity Fund | 100.00 | % | ||
For the fiscal year ended September 30, 2016, the following percentages of income dividends paid by the Fund qualify for the dividends received deductions available to corporations:
| FUND | PERCENTAGE | |||
AQR Large Cap Multi-Style Fund | 100.00 | % | ||
AQR Small Cap Multi-Style Fund | 68.92 | % | ||
AQR TM Large Cap Multi-Style Fund | 86.67 | % | ||
AQR TM Small Cap Multi-Style Fund | 73.81 | % | ||
AQR Large Cap Momentum Style Fund | 100.00 | % | ||
AQR Small Cap Momentum Style Fund | 94.62 | % | ||
AQR Emerging Momentum Style Fund | 0.06 | % | ||
AQR TM Large Cap Momentum Style Fund | 100.00 | % | ||
AQR TM Small Cap Momentum Style Fund | 81.45 | % | ||
AQR Large Cap Defensive Style Fund | 72.55 | % | ||
AQR Global Equity Fund | 56.41 | % | ||
The Funds designate the following amounts, or the maximum allowable under Section 852 of the Internal Revenue Code, as long term capital gain dividends paid during the fiscal year ended September 30, 2016:
| FUND | TOTAL | |||
AQR Large Cap Multi-Style Fund | $ | 1,073 | ||
AQR Small Cap Multi-Style Fund | $ | 201 | ||
AQR TM Large Cap Multi-Style Fund | $ | 290 | ||
AQR Large Cap Momentum Style Fund | $ | 71,718,239 | ||
AQR Small Cap Momentum Style Fund | $ | 1,581,305 | ||
AQR Large Cap Defensive Style Fund | $ | 15,813,125 | ||
AQR Global Equity Fund | $ | 17,630,449 | ||
AQR International Equity Fund | $ | 8,881,523 | ||
| AQR Funds | Annual Report | September 2016 | ||||||||||||||
239
| Other Federal Tax Information (Unaudited) |
Certain Funds have derived net income from sources within foreign countries. For the year ended September 30, 2016, the foreign source income for each Fund was as follows:
| FUND | TOTAL | PER SHARE | ||||||
AQR International Multi-Style Fund | $ | 10,926,504 | $ | 0.2953 | ||||
AQR Emerging Multi-Style Fund | $ | 6,093,480 | $ | 0.2056 | ||||
AQR TM International Multi-Style Fund | $ | 3,336,645 | $ | 0.2280 | ||||
AQR TM Emerging Multi-Style Fund | $ | 6,566,939 | $ | 0.2119 | ||||
AQR International Momentum Style Fund | $ | 8,728,767 | $ | 0.3579 | ||||
AQR Emerging Momentum Style Fund | $ | 187,463 | $ | 0.1516 | ||||
AQR TM International Momentum Style Fund | $ | 2,196,474 | $ | 0.2997 | ||||
AQR International Defensive Style Fund | $ | 2,353,242 | $ | 0.2154 | ||||
AQR Emerging Defensive Style Fund | $ | 1,162,950 | $ | 0.2046 | ||||
AQR International Equity Fund | $ | 16,403,923 | $ | 0.3972 | ||||
Certain Funds intend to elect to pass through to shareholders the credit for taxes paid to foreign countries. For the year ended September 30, 2016, the foreign taxes paid for each Fund was as follows:
| FUND | TOTAL | PER SHARE | ||||||
AQR International Multi-Style Fund | $ | 887,765 | $ | 0.0240 | ||||
AQR Emerging Multi-Style Fund | $ | 597,660 | $ | 0.0202 | ||||
AQR TM International Multi-Style Fund | $ | 282,420 | $ | 0.0193 | ||||
AQR TM Emerging Multi-Style Fund | $ | 651,154 | $ | 0.0210 | ||||
AQR International Momentum Style Fund | $ | 825,389 | $ | 0.0338 | ||||
AQR Emerging Momentum Style Fund | $ | 16,398 | $ | 0.0133 | ||||
AQR TM International Momentum Style Fund | $ | 226,531 | $ | 0.0309 | ||||
AQR International Defensive Style Fund | $ | 187,357 | $ | 0.0172 | ||||
AQR Emerging Defensive Style Fund | $ | 122,335 | $ | 0.0215 | ||||
AQR International Equity Fund | $ | 1,267,951 | $ | 0.0307 | ||||
| AQR Funds | Annual Report | September 2016 | ||||||||||||||
240
| Fund Expense Examples (Unaudited) |
As a shareholder of the Trust, you incur two types of costs: (1) transaction costs and (2) ongoing costs, including management fees; and other Fund expenses. This example is intended to help you understand your ongoing costs (in dollars) of investing in the Fund and to compare these costs with the ongoing costs of investing in other mutual funds The Example is based on an investment of $1,000 invested at the beginning of the period and held for the entire period as indicated below.
Actual Expenses
The table below provides information about actual account values and actual expenses. You may use the information together with the amount you invested, to estimate the expenses that you paid over the period. Simply divide your account value by $1,000 (for example, an $8,600 account value divided by $1,000 = 8.6), then multiply the result by the number under the heading entitled “Expenses Paid for the Period Ending 09/30/16” to estimate the expenses you paid on your account during this period. Each Fund will indirectly bear its pro rata share of the expenses incurred by the underlying investments in which the Fund invests. These expenses are not included in the table.
Hypothetical Example for Comparison Purposes
The table below also provides information about hypothetical account values and hypothetical expenses based on each Fund’s actual expense ratio and an assumed annual rate of return of 5% before expenses, which is not the Fund’s actual return. The hypothetical account values and expenses may not be used to estimate the actual ending account balance or expenses you paid for the period. You may use this information to compare the ongoing costs of investing in a Fund and other funds by comparing this 5% hypothetical example with the 5% hypothetical examples that appear in the shareholder reports of other funds. The Fund will indirectly bear its pro rata share of the expenses incurred by the underlying investments in which the Fund invests. These expenses are not included in the table.
Please note that the expenses shown in the table are meant to highlight your ongoing costs only and do not reflect any transactional costs. Therefore, the hypothetical example is useful in comparing ongoing costs only, and will not help you determine the relative total costs of owning different funds. In addition, if these transactional costs were included, your costs would have been higher.
| FUND | BEGINNING ACCOUNT DATE VALUE | ENDING ACCOUNT VALUE 9/30/16 | ANNUALIZED EXPENSE RATIO FOR THE PERIOD | EXPENSES PAID FOR THE PERIOD ENDING 9/30/16 | ||||||||||||
| AQR Large Cap Multi-Style Fund | ||||||||||||||||
| Class I | ||||||||||||||||
Actual Return | $1,000.00 | $1,031.70 | 0.47 | % | $2.39 | |||||||||||
Hypothetical Return | $1,000.00 | $1,022.65 | 0.47 | % | $2.38 | |||||||||||
| Class N | ||||||||||||||||
Actual Return | $1,000.00 | $1,030.30 | 0.70 | % | $3.55 | |||||||||||
Hypothetical Return | $1,000.00 | $1,021.50 | 0.70 | % | $3.54 | |||||||||||
| Class R6 | ||||||||||||||||
Actual Return | $1,000.00 | $1,031.70 | 0.35 | % | $1.78 | |||||||||||
Hypothetical Return | $1,000.00 | $1,023.25 | 0.35 | % | $1.77 | |||||||||||
| AQR Small Cap Multi-Style Fund | ||||||||||||||||
| Class I | ||||||||||||||||
Actual Return | $1,000.00 | $1,106.20 | 0.67 | % | $3.53 | |||||||||||
Hypothetical Return | $1,000.00 | $1,021.65 | 0.67 | % | $3.39 | |||||||||||
| Class N | ||||||||||||||||
Actual Return | $1,000.00 | $1,104.90 | 0.92 | % | $4.84 | |||||||||||
Hypothetical Return | $1,000.00 | $1,020.40 | 0.92 | % | $4.65 | |||||||||||
| Class R6 | ||||||||||||||||
Actual Return | $1,000.00 | $1,106.90 | 0.55 | % | $2.90 | |||||||||||
Hypothetical Return | $1,000.00 | $1,022.25 | 0.55 | % | $2.78 | |||||||||||
| AQR Funds | Annual Report | September 2016 | ||||||||||||||
241
| Fund Expense Examples (Unaudited) |
| FUND | BEGINNING ACCOUNT DATE VALUE | ENDING ACCOUNT VALUE 9/30/16 | ANNUALIZED EXPENSE RATIO FOR THE PERIOD | EXPENSES PAID FOR THE PERIOD ENDING 9/30/16 | ||||||||||||
| AQR International Multi-Style Fund | ||||||||||||||||
| Class I | ||||||||||||||||
Actual Return | $1,000.00 | $1,022.00 | 0.60 | % | $3.03 | |||||||||||
Hypothetical Return | $1,000.00 | $1,022.00 | 0.60 | % | $3.03 | |||||||||||
| Class N | ||||||||||||||||
Actual Return | $1,000.00 | $1,021.00 | 0.86 | % | $4.35 | |||||||||||
Hypothetical Return | $1,000.00 | $1,020.70 | 0.86 | % | $4.34 | |||||||||||
| Class R6 | ||||||||||||||||
Actual Return | $1,000.00 | $1,023.00 | 0.50 | % | $2.53 | |||||||||||
Hypothetical Return | $1,000.00 | $1,022.50 | 0.50 | % | $2.53 | |||||||||||
| AQR Emerging Multi-Style Fund | ||||||||||||||||
| Class I | ||||||||||||||||
Actual Return | $1,000.00 | $1,096.80 | 0.80 | % | $4.19 | |||||||||||
Hypothetical Return | $1,000.00 | $1,021.00 | 0.80 | % | $4.04 | |||||||||||
| Class N | ||||||||||||||||
Actual Return | $1,000.00 | $1,095.70 | 1.02 | % | $5.34 | |||||||||||
Hypothetical Return | $1,000.00 | $1,019.90 | 1.02 | % | $5.15 | |||||||||||
| Class R6 | ||||||||||||||||
Actual Return | $1,000.00 | $1,099.30 | 0.65 | % | $3.41 | |||||||||||
Hypothetical Return | $1,000.00 | $1,021.75 | 0.65 | % | $3.29 | |||||||||||
| AQR TM Large Cap Multi-Style Fund | ||||||||||||||||
| Class I | ||||||||||||||||
Actual Return | $1,000.00 | $1,028.80 | 0.45 | % | $2.28 | |||||||||||
Hypothetical Return | $1,000.00 | $1,022.75 | 0.45 | % | $2.28 | |||||||||||
| Class N | ||||||||||||||||
Actual Return | $1,000.00 | $1,027.80 | 0.71 | % | $3.60 | |||||||||||
Hypothetical Return | $1,000.00 | $1,021.45 | 0.71 | % | $3.59 | |||||||||||
| Class R6 | ||||||||||||||||
Actual Return | $1,000.00 | $1,029.80 | 0.35 | % | $1.78 | |||||||||||
Hypothetical Return | $1,000.00 | $1,023.25 | 0.35 | % | $1.77 | |||||||||||
| AQR TM Small Cap Multi-Style Fund | ||||||||||||||||
| Class I | ||||||||||||||||
Actual Return | $1,000.00 | $1,098.00 | 0.66 | % | $3.46 | |||||||||||
Hypothetical Return | $1,000.00 | $1,021.70 | 0.66 | % | $3.34 | |||||||||||
| Class N | ||||||||||||||||
Actual Return | $1,000.00 | $1,096.10 | 0.91 | % | $4.77 | |||||||||||
Hypothetical Return | $1,000.00 | $1,020.45 | 0.91 | % | $4.60 | |||||||||||
| Class R6 | ||||||||||||||||
Actual Return | $1,000.00 | $1,097.90 | 0.55 | % | $2.88 | |||||||||||
Hypothetical Return | $1,000.00 | $1,022.25 | 0.55 | % | $2.78 | |||||||||||
| AQR TM International Multi-Style Fund | ||||||||||||||||
| Class I | ||||||||||||||||
Actual Return | $1,000.00 | $1,026.10 | 0.61 | % | $3.09 | |||||||||||
Hypothetical Return | $1,000.00 | $1,021.95 | 0.61 | % | $3.08 | |||||||||||
| Class N | ||||||||||||||||
Actual Return | $1,000.00 | $1,025.00 | 0.83 | % | $4.20 | |||||||||||
Hypothetical Return | $1,000.00 | $1,020.85 | 0.83 | % | $4.19 | |||||||||||
| Class R6 | ||||||||||||||||
Actual Return | $1,000.00 | $1,026.10 | 0.50 | % | $2.53 | |||||||||||
Hypothetical Return | $1,000.00 | $1,022.50 | 0.50 | % | $2.53 | |||||||||||
| AQR Funds | Annual Report | September 2016 | ||||||||||||||
242
| Fund Expense Examples (Unaudited) |
| FUND | BEGINNING ACCOUNT DATE VALUE | ENDING ACCOUNT VALUE 9/30/16 | ANNUALIZED EXPENSE RATIO FOR THE PERIOD | EXPENSES PAID FOR THE PERIOD ENDING 9/30/16 | ||||||||||||
| AQR TM Emerging Multi-Style Fund | ||||||||||||||||
| Class I | ||||||||||||||||
Actual Return | $1,000.00 | $1,101.00 | 0.74 | % | $3.89 | |||||||||||
Hypothetical Return | $1,000.00 | $1,021.30 | 0.74 | % | $3.74 | |||||||||||
| Class N | ||||||||||||||||
Actual Return | $1,000.00 | $1,099.50 | 0.96 | % | $5.04 | |||||||||||
Hypothetical Return | $1,000.00 | $1,020.20 | 0.96 | % | $4.85 | |||||||||||
| Class R6 | ||||||||||||||||
Actual Return | $1,000.00 | $1,100.80 | 0.65 | % | $3.41 | |||||||||||
Hypothetical Return | $1,000.00 | $1,021.75 | 0.65 | % | $3.29 | |||||||||||
| AQR Large Cap Momentum Style Fund | ||||||||||||||||
| Class I | ||||||||||||||||
Actual Return | $1,000.00 | $1,052.50 | 0.40 | % | $2.05 | |||||||||||
Hypothetical Return | $1,000.00 | $1,023.00 | 0.40 | % | $2.02 | |||||||||||
| Class N | ||||||||||||||||
Actual Return | $1,000.00 | $1,051.50 | 0.64 | % | $3.28 | |||||||||||
Hypothetical Return | $1,000.00 | $1,021.80 | 0.64 | % | $3.23 | |||||||||||
| Class R6 | ||||||||||||||||
Actual Return | $1,000.00 | $1,053.10 | 0.30 | % | $1.54 | |||||||||||
Hypothetical Return | $1,000.00 | $1,023.50 | 0.30 | % | $1.52 | |||||||||||
| AQR Small Cap Momentum Style Fund | ||||||||||||||||
| Class I | ||||||||||||||||
Actual Return | $1,000.00 | $1,120.70 | 0.60 | % | $3.18 | |||||||||||
Hypothetical Return | $1,000.00 | $1,022.00 | 0.60 | % | $3.03 | |||||||||||
| Class N | ||||||||||||||||
Actual Return | $1,000.00 | $1,119.00 | 0.87 | % | $4.61 | |||||||||||
Hypothetical Return | $1,000.00 | $1,020.65 | 0.87 | % | $4.39 | |||||||||||
| Class R6 | ||||||||||||||||
Actual Return | $1,000.00 | $1,121.50 | 0.50 | % | $2.65 | |||||||||||
Hypothetical Return | $1,000.00 | $1,022.50 | 0.50 | % | $2.53 | |||||||||||
| AQR International Momentum Style Fund | ||||||||||||||||
| Class I | ||||||||||||||||
Actual Return | $1,000.00 | $1,040.50 | 0.55 | % | $2.81 | |||||||||||
Hypothetical Return | $1,000.00 | $1,022.25 | 0.55 | % | $2.78 | |||||||||||
| Class N | ||||||||||||||||
Actual Return | $1,000.00 | $1,039.90 | 0.79 | % | $4.03 | |||||||||||
Hypothetical Return | $1,000.00 | $1,021.05 | 0.79 | % | $3.99 | |||||||||||
| Class R6 | ||||||||||||||||
Actual Return | $1,000.00 | $1,041.40 | 0.45 | % | $2.30 | |||||||||||
Hypothetical Return | $1,000.00 | $1,022.75 | 0.45 | % | $2.28 | |||||||||||
| AQR Emerging Momentum Style Fund | ||||||||||||||||
| Class I | ||||||||||||||||
Actual Return | $1,000.00 | $1,076.30 | 0.64 | % | $3.32 | |||||||||||
Hypothetical Return | $1,000.00 | $1,021.80 | 0.64 | % | $3.23 | |||||||||||
| Class N | ||||||||||||||||
Actual Return | $1,000.00 | $1,075.00 | 0.90 | % | $4.67 | |||||||||||
Hypothetical Return | $1,000.00 | $1,020.50 | 0.90 | % | $4.55 | |||||||||||
| Class R6 | ||||||||||||||||
Actual Return | $1,000.00 | $1,076.20 | 0.60 | % | $3.11 | |||||||||||
Hypothetical Return | $1,000.00 | $1,022.00 | 0.60 | % | $3.03 | |||||||||||
| AQR Funds | Annual Report | September 2016 | ||||||||||||||
243
| Fund Expense Examples (Unaudited) |
| FUND | BEGINNING ACCOUNT DATE VALUE | ENDING ACCOUNT VALUE 9/30/16 | ANNUALIZED EXPENSE RATIO FOR THE PERIOD | EXPENSES PAID FOR THE PERIOD ENDING 9/30/16 | ||||||||||||
| AQR TM Large Cap Momentum Style Fund | ||||||||||||||||
| Class I | ||||||||||||||||
Actual Return | $1,000.00 | $1,043.70 | 0.41 | % | $2.09 | |||||||||||
Hypothetical Return | $1,000.00 | $1,022.95 | 0.41 | % | $2.07 | |||||||||||
| Class N | ||||||||||||||||
Actual Return | $1,000.00 | $1,043.20 | 0.57 | % | $2.91 | |||||||||||
Hypothetical Return | $1,000.00 | $1,022.15 | 0.57 | % | $2.88 | |||||||||||
| Class R6 | ||||||||||||||||
Actual Return | $1,000.00 | $1,044.40 | 0.30 | % | $1.53 | |||||||||||
Hypothetical Return | $1,000.00 | $1,023.50 | 0.30 | % | $1.52 | |||||||||||
| AQR TM Small Cap Momentum Style Fund | ||||||||||||||||
| Class I | ||||||||||||||||
Actual Return | $1,000.00 | $1,111.40 | 0.60 | % | $3.17 | |||||||||||
Hypothetical Return | $1,000.00 | $1,022.00 | 0.60 | % | $3.03 | |||||||||||
| Class N | ||||||||||||||||
Actual Return | $1,000.00 | $1,111.20 | 0.76 | % | $4.01 | |||||||||||
Hypothetical Return | $1,000.00 | $1,021.20 | 0.76 | % | $3.84 | |||||||||||
| Class R6 | ||||||||||||||||
Actual Return | $1,000.00 | $1,112.20 | 0.50 | % | $2.64 | |||||||||||
Hypothetical Return | $1,000.00 | $1,022.50 | 0.50 | % | $2.53 | |||||||||||
| AQR TM International Momentum Style Fund | ||||||||||||||||
| Class I | ||||||||||||||||
Actual Return | $1,000.00 | $1,037.20 | 0.57 | % | $2.90 | |||||||||||
Hypothetical Return | $1,000.00 | $1,022.15 | 0.57 | % | $2.88 | |||||||||||
| Class N | ||||||||||||||||
Actual Return | $1,000.00 | $1,036.50 | 0.72 | % | $3.67 | |||||||||||
Hypothetical Return | $1,000.00 | $1,021.40 | 0.72 | % | $3.64 | |||||||||||
| Class R6 | ||||||||||||||||
Actual Return | $1,000.00 | $1,037.30 | 0.45 | % | $2.29 | |||||||||||
Hypothetical Return | $1,000.00 | $1,022.75 | 0.45 | % | $2.28 | |||||||||||
| AQR Large Cap Defensive Style Fund | ||||||||||||||||
| Class I | ||||||||||||||||
Actual Return | $1,000.00 | $1,036.30 | 0.40 | % | $2.04 | |||||||||||
Hypothetical Return | $1,000.00 | $1,023.00 | 0.40 | % | $2.02 | |||||||||||
| Class N | ||||||||||||||||
Actual Return | $1,000.00 | $1,035.70 | 0.66 | % | $3.36 | |||||||||||
Hypothetical Return | $1,000.00 | $1,021.70 | 0.66 | % | $3.34 | |||||||||||
| Class R6 | ||||||||||||||||
Actual Return | $1,000.00 | $1,037.00 | 0.30 | % | $1.53 | |||||||||||
Hypothetical Return | $1,000.00 | $1,023.50 | 0.30 | % | $1.52 | |||||||||||
| AQR International Defensive Style Fund | ||||||||||||||||
| Class I | ||||||||||||||||
Actual Return | $1,000.00 | $1,057.70 | 0.54 | % | $2.78 | |||||||||||
Hypothetical Return | $1,000.00 | $1,022.30 | 0.54 | % | $2.73 | |||||||||||
| Class N | ||||||||||||||||
Actual Return | $1,000.00 | $1,056.20 | 0.78 | % | $4.01 | |||||||||||
Hypothetical Return | $1,000.00 | $1,021.10 | 0.78 | % | $3.94 | |||||||||||
| Class R6 | ||||||||||||||||
Actual Return | $1,000.00 | $1,057.70 | 0.45 | % | $2.31 | |||||||||||
Hypothetical Return | $1,000.00 | $1,022.75 | 0.45 | % | $2.28 | |||||||||||
| AQR Funds | Annual Report | September 2016 | ||||||||||||||
244
| Fund Expense Examples (Unaudited) |
| FUND | BEGINNING ACCOUNT DATE VALUE | ENDING ACCOUNT VALUE 9/30/16 | ANNUALIZED EXPENSE RATIO FOR THE PERIOD | EXPENSES PAID FOR THE PERIOD ENDING 9/30/16 | ||||||||||||
| AQR Emerging Defensive Style Fund | ||||||||||||||||
| Class I | ||||||||||||||||
Actual Return | $1,000.00 | $1,046.40 | 0.68 | % | $3.48 | |||||||||||
Hypothetical Return | $1,000.00 | $1,021.60 | 0.68 | % | $3.44 | |||||||||||
| Class N | ||||||||||||||||
Actual Return | $1,000.00 | $1,045.30 | 0.91 | % | $4.65 | |||||||||||
Hypothetical Return | $1,000.00 | $1,020.45 | 0.91 | % | $4.60 | |||||||||||
| Class R6 | ||||||||||||||||
Actual Return | $1,000.00 | $1,046.50 | 0.60 | % | $3.07 | |||||||||||
Hypothetical Return | $1,000.00 | $1,022.00 | 0.60 | % | $3.03 | |||||||||||
| AQR Global Equity Fund | ||||||||||||||||
| Class I | ||||||||||||||||
Actual Return | $1,000.00 | $1,062.80 | 0.93 | % | $4.80 | |||||||||||
Hypothetical Return | $1,000.00 | $1,020.35 | 0.93 | % | $4.70 | |||||||||||
| Class N | ||||||||||||||||
Actual Return | $1,000.00 | $1,061.80 | 1.13 | % | $5.82 | |||||||||||
Hypothetical Return | $1,000.00 | $1,019.35 | 1.13 | % | $5.70 | |||||||||||
| Class R6 | ||||||||||||||||
Actual Return | $1,000.00 | $1,063.70 | 0.70 | % | $3.61 | |||||||||||
Hypothetical Return | $1,000.00 | $1,021.50 | 0.70 | % | $3.54 | |||||||||||
| AQR International Equity Fund | ||||||||||||||||
| Class I | ||||||||||||||||
Actual Return | $1,000.00 | $1,056.10 | 0.96 | % | $4.93 | |||||||||||
Hypothetical Return | $1,000.00 | $1,020.20 | 0.96 | % | $4.85 | |||||||||||
| Class N | ||||||||||||||||
Actual Return | $1,000.00 | $1,055.00 | 1.17 | % | $6.01 | |||||||||||
Hypothetical Return | $1,000.00 | $1,019.15 | 1.17 | % | $5.91 | |||||||||||
| Class R6 | ||||||||||||||||
Actual Return | $1,000.00 | $1,055.90 | 0.88 | % | $4.52 | |||||||||||
Hypothetical Return | $1,000.00 | $1,020.60 | 0.88 | % | $4.45 | |||||||||||
Expenses are calculated using each Class’ annualized expense ratio, multiplied by the average account value for the period, multiplied by 183/366 (to reflect the one-half year period unless stated otherwise).
| AQR Funds | Annual Report | September 2016 | ||||||||||||||
245
| Trustees and Officers (Unaudited) | September 30, 2016 |
Listed in the chart below is basic information regarding the Trustees and Officers of the Trust. The address of each Officer and Trustee is Two Greenwich Plaza, 4th Floor, Greenwich CT 06830.
| NAME AND YEAR OF BIRTH | CURRENT POSITION WITH THE TRUST, TERM OF OFFICE1 AND LENGTH OF TIME SERVED | PRINCIPAL OCCUPATION(S) DURING PAST 5 YEARS | NUMBER OF FUNDS IN FUND COMPLEX OVERSEEN BY TRUSTEE | OTHER PRESENT OR PAST DIRECTORSHIPS HELD BY TRUSTEE (DURING THE PAST 5 YEARS) | ||||||||||||
Disinterested Trustees2 | ||||||||||||||||
| Timothy K. Armour, M.B.A., 1948 |
| Chairman of the Board, since 2010 and Trustee, since 2008 |
| | Interim Chief Executive Officer of Janus Capital Group (retired) (2009 to 2010) (financial services) | | 46 | | Janus Capital Group (2008- 2016); ETF Securities (2010- 2013) | | ||||||
| L. Joe Moravy, M.B.A., CPA, 1950 |
| Trustee, since 2008 |
| | Independent Consultant (since 2014); Managing Director, Finance Scholars | | 46 | | Nuveen Exchange Traded Commodities Funds (since 2012) | | ||||||
| William L. Atwell, M.B.A., 1950 | | Trustee, since 2011 | | | Managing Director, Atwell Partners LLC (since 2012) (consulting); President (CIGNA International), CIGNA (2008 to 2012) (insurance) | | 46 | | Webster Financial Corporation (since 2014) | | ||||||
| Gregg D. Behrens, M.M., 1952 | | Trustee, since 2011 | | | Retired from Northern Trust Company (since 2009) banking) | | 46 | None | ||||||||
| Brian Posner, M.B.A., 1961 | | Trustee, since 2011 | | | President, Point Rider Group LLC (since 2008) (consulting) | | 46 | | Biogen Inc. (since 2008); Arch Capital Group (since 2010); BG Medicine (2012- 2015); RiverPark Funds Trust (2010 to 2012) | | ||||||
Mark. A. Zurack, M.B.A., CFA 1957 | | Trustee, since 2014 | | | Adjunct Professor and Executive-in- Residence, Columbia Business School (since 2002) | | 46 | | Exchange Traded Concepts Trust (since 2011); Source ETF Trust (since 2014) | | ||||||
Interested Trustees3 | ||||||||||||||||
| David Kabiller, CFA, 1963 | Trustee, since 2010 | | Founding Principal, AQR Capital Management, LLC (since 1998) | | 46 | None | ||||||||||
| Marco Hanig, Ph.D., 1958 | | Trustee, since 2014; Chief Executive | | | Principal, AQR Capital Management, LLC (since 2008) | | 46 | None | ||||||||
Officers | ||||||||||||||||
| H.J. Willcox, J.D., 1966 | | Chief Compliance Officer, since 2013 | | | Managing Director and Chief Compliance Officer, AQR Capital Management, LLC (since 2013); Global Head of Compliance and Counsel KKR & Co., L.P. (2008-2013) | | N/A | N/A | ||||||||
Heather Bonner, CPA, 1977 | | Chief Financial Officer, since 2014 | | | Vice President, AQR Capital Management, LLC (since 2013); Senior Manager, PricewaterhouseCoopers, LLP (2007- 2013) | | N/A | N/A | ||||||||
| AQR Funds | Annual Report | September 2016 | ||||||||||||||
246
| Trustees and Officers (Unaudited) | September 30, 2016 |
| NAME AND YEAR OF BIRTH | CURRENT POSITION WITH THE TRUST, TERM OF OFFICE1 AND LENGTH OF TIME SERVED | PRINCIPAL OCCUPATION(S) DURING PAST 5 YEARS | NUMBER OF FUNDS IN FUND COMPLEX OVERSEEN BY TRUSTEE | OTHER PRESENT OR PAST DIRECTORSHIPS HELD BY TRUSTEE (DURING THE PAST 5 YEARS) | ||||
| Gregory McNeil, M.S./M.B.A., CPA, 1975 | Vice President and Treasurer, since 2015 | Vice President, AQR Capital Management, LLC (since 2015); Assistant Treasurer, Franklin Templeton Investments (2010-2015) | N/A | N/A | ||||
| Bradley Asness, J.D., M.B.A. 1969 | Vice President, since 2009 | Principal and Chief Legal Officer, AQR Capital Management, LLC (since 1998) | N/A | N/A | ||||
| Brendan R. Kalb, J.D., 1975 | Executive Vice President, since 2009; Secretary, since 2008 | Managing Director and General Counsel, AQR Capital Management, LLC (since 2004) | N/A | N/A | ||||
| Nicole DonVito, J.D., 1979 | Chief Legal Officer, since 2014; Vice President, since 2009 | Managing Director, Senior Counsel - Head of Registered Products, AQR Capital Management, LLC (since 2007) | N/A | N/A | ||||
| (1) | Each Trustee serves until the election and qualification of a successor, or until death, resignation or removal as provided in the Trust’s Declaration of Trust. A Disinterested Trustee may not hold office beyond December 31 of the year in which he turns 72. |
| (2) | A Disinterested Trustee is any Trustee that is not an “interested person” of the Trust within the meaning of Section 2(a)(19) of the 1940 Act. |
| (3) | An Interested Trustee is a Trustee that is an “interested person” of the Trust within the meaning of Section 2(a)(19) of the 1940 Act. Mr. Kabiller and Dr. Hanig are interested persons of the Trust because of their positions with the Adviser. |
| AQR Funds | Annual Report | September 2016 | ||||||||||||||
247
Investment Adviser
AQR Capital Management, LLC
Two Greenwich Plaza, 4th Floor
Greenwich, CT 06830
Transfer Agent
ALPS Fund Services, Inc.
1290 Broadway, Suite 1100
Denver, CO 80203
Custodian
JPMorgan Chase Bank, N.A.
4 Metro Tech Center
Brooklyn, NY 11245
Distributor
ALPS Distributors, Inc.
1290 Broadway, Suite 1100
Denver, CO 80203
Administrator
JPMorgan Chase Bank, N.A.
70 Fargo Street
Boston, MA 02210
Independent Registered Public Accounting Firm
PricewaterhouseCoopers, LLP
300 Madison Avenue
New York, NY 10017
You may obtain a description of the AQR Funds proxy voting, policies, procedures and information regarding how each Fund voted proxies relating to portfolio securities during the 12-month period ending June 30th of each year (available by August 31st of that year) without charge, upon request, by calling 1-866-290-2688 or visiting the funds website https://funds.aqr.com, or by accessing the SEC’s website at www.SEC.gov. Such reports may be reviewed and copied at the SEC’s Public Reference Room in Washington, DC. Information on the operation of the Public Reference Room may be obtained by calling 202-551-8090.
The Fund files complete schedules of the portfolio holdings with the SEC for the first and third quarters on Form N-Q. The Form N-Q is available without charge, upon request, by calling 1-800-SEC-0330, or by accessing the SEC’s website, at www.SEC.gov. It may also be reviewed and copied at the SEC’s Public Reference Room in Washington, DC.
This report has been prepared for shareholders and may be distributed to others only if preceded or accompanied by an effective prospectus, which includes information regarding the Funds’ objectives and policies, experienced of its management, marketability of shares and other information.

AQR Funds
P.O. Box 2248, Denver, CO 80201-2248
p: +1.866.290.2688 | w: https://funds.aqr.com
Item 2. Code of Ethics.
| a). | As of the end of the period, September 30, 2016, the Registrant has adopted a code of ethics, as defined in Item 2 of Form N-CSR, that applies to its principal executive officer, principal financial officer, principal accounting officer or controller, or persons performing similar functions. This code of ethics is included as Exhibit 12 (a)(1). |
| b). | Not Applicable. |
| c). | There has been no substantive amendments to the Registrant’s Code of Ethics during the fiscal year ended September 30, 2016 (“Reporting Period”). |
| d). | Registrant granted no waivers from the provisions of its Code of Ethics during the Reporting Period. |
| e). | Not Applicable. |
| f). | Attached. |
Item 3. Audit Committee Financial Expert.
| a). | The Registrant’s Board of Trustees has determined that its Audit Committee has two “audit committee financial experts”, as that term is defined under Items 3(b) and 3(c), serving on its Audit Committee. Mr. L. Joe Moravy and Mr. Brian S. Posner, the Registrant’s audit committee financial experts, are “independent”, as that term is defined under Item 3(a)(2). |
Item 4. Principal Accountant Fees and Services.
Aggregate fees for professional services rendered for the AQR Funds by PricewaterhouseCoopers LLP for the fiscal years ended September 30, 2015 and September 30, 2016 were:
| 2015 | 2016 | |||||||
Audit Fees (a) | $ | 647,820 | $ | 667,249 | ||||
Audit Related Fees (b) | $ | 5,500 | $ | 24,000 | ||||
Tax Fees (c) | $ | 241,626 | $ | 336,005 | ||||
All Other Fees (d) | $ | 0 | $ | 450 | ||||
Total: | $ | 894,946 | $ | 1,027,704 | ||||
| (a) | Audit Fees: These fees relate to professional services rendered by PricewaterhouseCoopers LLP for the audits of the Registrant’s annual financial statements or services normally provided by the independent registered public accounting firm in connection with statutory and regulatory filings or engagements. These services include the audits of the financial statements of the Registrant, issuance of consents and assistance with review of documents filed with the SEC. |
| (b) | Audit Related Fees: These fees relate to assurance and related services by PricewaterhouseCoopers LLP that are reasonably related to the performance of the audit of the Registrant’s September 30, 2015 and September 30, 2016 annual financial statements that are not reported under “Audit Fees” above. The audit related services provided by PricewaterhouseCoopers LLP for the year-ended September 30, 2015 and September 30, 2016 relate to procedures performed by PricewaterhouseCoopers LLP in connection with its review of the issuance of, and amendments to, the Registrant’s Registration Statement as well as review of the in-kind transaction for the AQR Global Equity Fund and AQR International Equity Fund during the year-ended September 30, 2016. |
| (c) | Tax Fees: These fees relate to professional services rendered by PricewaterhouseCoopers LLP for tax compliance, tax advice and tax planning. The tax services provided by PricewaterhouseCoopers LLP relate to the review of the Registrant’s federal and state income tax returns, excise tax calculations and the completion of an international taxation review. |
| (d) | All Other Fees: These fees relate to products and services provided by PricewaterhouseCoopers LLP other than those reported under “Audit Fees,” “Audit-Related Fees,” and “Tax Fees” above. |
| (e) | Audit Committee Pre-approval Policies and Procedures: |
| (i) | Per Rule 2-01(c)(7)(A) and the charter of the Registrant’s Audit Committee, the Audit Committee approves and recommends the principal accountant for the Registrant, pre-approves (i) the principal accountant’s provision of all audit and permissible non-audit services to the Registrant (including the fees and other compensation to be paid to the principal accountant), and (ii) the principal accountant’s provision of any permissible non-audit services to the Registrant’s investment adviser (the “Adviser”), sub-adviser or any entity controlling, controlled by, or under common control with any investment adviser or sub-adviser, if the engagement relates directly to the operations of the financial reporting of the Trust. |
| (ii) | 100% of services described in each of Items 4(b) through (d) were approved by the Audit Committee pursuant to paragraph (c)(7)(A) of Rule 2-01 of Regulation S-X. |
| (f) | Less than 50% of the hours expended on the principal accountant’s engagement to audit Registrant’s financial statements were attributed to work performed by persons other than the accountant’s full-time, permanent employees. |
| (g) | Disclose the aggregate non-audit fees billed by the Registrant’s accountant for services rendered to the Registrant, and rendered to the Registrant’s investment adviser (not including any sub-adviser whose role is primarily portfolio management and is subcontracted with or overseen by another investment adviser), and any entity controlling, controlled by, or under common control with the adviser that provides ongoing services to the Registrant for the fiscal years ended September 30, 2015 and September 30, 2016: $414,999 and $900, respectively. |
| (h) | Not Applicable. |
Item 5. Audit Committee of Listed Registrants.
| (a) | The Registrant is an issuer as defined in Section 10A-3 of the Securities Exchange Act of 1934 and has a separately-designated standing Audit Committee in accordance with Section 3(a)(58)(A) of such Act. All of the Board’s independent Trustees, Timothy K. Armour, William L. Atwell, Gregg D. Behrens, L. Joe Moravy, Brian S. Posner and Mark Zurack, are members of Audit Committee. |
| (b) | Not Applicable. |
Item 6. Investments
| (a) | Schedule is included as part of the report to shareholders filed under Item 1 of this Form. |
| (b) | The Registrant made no divestments of securities in accordance with Section 13(c) of the Investment Company Act of 1940. |
Item 7. Disclosure of Proxy Voting Policies and Procedures for Closed-End Management Investment Companies.
Not applicable.
Item 8. Portfolio Managers of Closed-End Management Investment Companies.
Not applicable.
Item 9. Purchases of Equity Securities by Closed-End Management Investment Company & Affiliated Purchasers.
Not applicable.
Item 10. Submission of Matters to a Vote of Security Holders.
Not applicable.
Item 11. Controls and Procedures.
| (a) | The Registrant’s principal executive officer and principal financial officer have concluded, based on their evaluation of the Registrant’s disclosure controls and procedures as conducted within 90 days of the filing date of this report, that those disclosure controls and procedures provide reasonable assurance that the material information required to be disclosed by the Registrant on this report is recorded, processed, summarized and reported within the time periods specified in the Securities and Exchange Commission’s rules and forms. |
| (b) | There have not been any changes in registrant’s control over financial reporting (as defined in Rule 30a-3(d) under the Investment Company Act of 1940) that occurred during the last fiscal quarter of the period covered by this report that has materially affected, or is reasonably likely to materially affect, the registrant’s internal control over financial reporting. |
Item 12. Exhibits.
| (a)(1) | The code of ethics that is the subject of the disclosure required by Item 2 is attached hereto. |
| (a)(2) | Certifications pursuant to Rule 30a-2(a) under the 1940 Act and Section 302 of the Sarbanes-Oxley Act of 2002 are attached hereto. |
| (a)(3) | Any written solicitation to purchase securities under Rule 23c-1 under the 1940 Act – Not Applicable. |
| (b) | Certification required by Rule 30a-2(b) under the 1940 Act and Section 906 of the Sarbanes-Oxley Act of 2002 is attached hereto. |
SIGNATURES
Pursuant to the requirements of the Securities Exchange Act of 1934 and the Investment Company Act of 1940, the Registrant has duly caused this report to be signed on its behalf by the undersigned, thereunto duly authorized.
AQR Funds
By: /s/ Marco Hanig |
| Marco Hanig, |
| Principal Executive Officer |
| December 2, 2016 |
Pursuant to the requirements of the Securities Exchange Act of 1934 and the Investment Company Act of 1940, this report has been signed below by the following persons on behalf of the Registrant and in the capacities and on the dates indicated.
By: /s/ Marco Hanig |
| Marco Hanig, |
| Principal Executive Officer |
| December 2, 2016 |
By: /s/ Heather Bonner |
| Heather Bonner, |
| Principal Financial Officer |
| December 2, 2016 |