Table of Contents
UNITED STATES
SECURITIES AND EXCHANGE COMMISSION
Washington, D.C. 20549
FORM N-CSR
CERTIFIED SHAREHOLDER REPORT OF REGISTERED
MANAGEMENT INVESTMENT COMPANIES
Investment Company Act file number: 811-22235
AQR Funds
(Exact name of registrant as specified in charter)
Two Greenwich Plaza, 4th Floor
Greenwich, CT 06830
(Address of principal executive offices) (Zip code)
William J. Fenrich, Esq.
Principal and Chief Legal Officer
AQR Capital Management, LLC
Two Greenwich Plaza, 4th Floor
Greenwich, CT 06830
(Name and Address of Agent for Service)
Registrant’s telephone number, including area code: 203-742-3600
Date of fiscal year end: September 30
Date of reporting period: October 1, 2017 to September 30, 2018
Table of Contents
Item 1. Reports to Shareholders.
The following is a copy of the report transmitted to shareholders pursuant to Rule 30e-1 under the Investment Company Act of 1940 (17 CFR 270.30e-1.)
Table of Contents
Annual Report
September 30, 2018
AQR Large Cap Multi-Style Fund
AQR Small Cap Multi-Style Fund
AQR International Multi-Style Fund
AQR Emerging Multi-Style Fund
AQR TM Large Cap Multi-Style Fund
AQR TM Small Cap Multi-Style Fund
AQR TM International Multi-Style Fund
AQR TM Emerging Multi-Style Fund
AQR Large Cap Momentum Style Fund
AQR Small Cap Momentum Style Fund
AQR International Momentum Style Fund
AQR Emerging Momentum Style Fund
AQR TM Large Cap Momentum Style Fund
AQR TM Small Cap Momentum Style Fund
AQR TM International Momentum Style Fund
AQR Large Cap Defensive Style Fund
AQR International Defensive Style Fund
AQR Emerging Defensive Style Fund
AQR Global Equity Fund
AQR International Equity Fund
AQR Large Cap Relaxed Constraint Equity Fund
AQR Small Cap Relaxed Constraint Equity Fund
AQR International Relaxed Constraint Equity Fund
AQR Emerging Relaxed Constraint Equity Fund
Table of Contents
| Shareholder Letters (unaudited) | ||
| 2 | ||
| 4 | ||
| 6 | ||
| 8 | ||
| 10 | ||
| 12 | ||
| 14 | ||
| 16 | ||
| 18 | ||
| 20 | ||
| 22 | ||
| 24 | ||
| 26 | ||
| 28 | ||
| 30 | ||
| 32 | ||
| 34 | ||
| 36 | ||
| 38 | ||
| 41 | ||
| 44 | ||
| 46 | ||
| 48 | ||
| 50 | ||
| Schedule of Investments | ||
| 52 | ||
56 | ||
64 | ||
68 | ||
73 | ||
78 | ||
86 | ||
91 | ||
96 | ||
103 | ||
113 | ||
120 | ||
125 | ||
131 | ||
141 | ||
147 | ||
152 | ||
158 | ||
163 | ||
172 | ||
| 181 | ||
| 188 | ||
| 197 | ||
| 204 | ||
| Financial Statements and Notes | 213 | |
| Report of Independent Registered Public Accounting Firm | 302 | |
| Other Federal Tax Information (unaudited) | 303 | |
| Fund Expense Examples (unaudited) | 305 | |
| Trustees and Officers (unaudited) | 311 | |
Table of Contents
Shareholder Letter (Unaudited)
| AQR LARGE CAP MULTI-STYLE FUND |

Cliff Asness
Managing & Founding Principal

Andrea Frazzini
Principal

Jacques Friedman
Principal

Ronen Israel
Principal
Dear Shareholder:
The AQR Large Cap Multi-Style Fund (the “Fund”) invests in stocks of attractively valued U.S. large and mid-cap companies that have positive momentum and strong quality. The Fund is not actively managed to outperform a growth, value or core benchmark. Rather, it seeks to provide systematic exposure to stocks that rank high on a combined score of Value, Momentum and Quality styles.
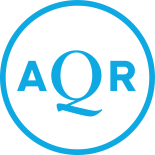
For the one year period ended September 30, 2018, the Fund’s Class I returned 14.11% while the Russell 1000® Total Return Index (the “Benchmark”) returned 17.76%. The Fund’s underperformance was driven primarily by stock selection within the information technology (-2.6%) and consumer discretionary (-0.9%) sectors, and was partially offset by positive performance within financials (0.6%).
Over the course of the period, the Fund’s largest active positions included sector overweights to information technology (4.3%) and financials (1.9%), while the portfolio was underweight energy (-3.2%) and health care (-1.7%).
| AVERAGE ANNUAL TOTAL RETURNS AS OF 9/30/2018 AQR LARGE CAP MULTI-STYLE FUND | ||||||||||||||||||||
| 1 Year | 3 year | 5 year | Since Inception | Date of Inception | ||||||||||||||||
| Fund - Class I: QCELX | 14.11% | 14.07% | 12.50% | 13.38% | 3/26/2013 | |||||||||||||||
| Fund - Class N: QCENX | 13.83% | 13.80% | 12.22% | 13.12% | 3/26/2013 | |||||||||||||||
| Fund - Class R6: QCERX | 14.20% | 14.19% | N/A | 9.98% | 7/10/2014 | |||||||||||||||
| Russell 1000® Index Total Return | 17.76% | |||||||||||||||||||
Past performance does not guarantee future results. Investment results and principal value of an investment will fluctuate so that an investor’s shares, when redeemed, may be worth more or less than their original cost. Current performance may be lower or higher than the performance data quoted. As of the latest prospectus, the gross expense ratio for the Fund’s Class I/N/R6 shares are 0.45%, 0.71% and 0.36%, respectively. Call 1-866-290-2688 or visit www.aqrfunds.com for current month-end performance.
| AQR Funds | Annual Report | September 2018 | ||||||||||||||
2
Table of Contents
Shareholder Letter (Unaudited)
| AQR LARGE CAP MULTI-STYLE FUND |
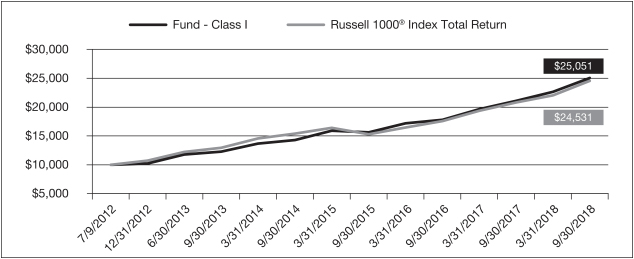
AQR LARGE CAP MULTI-STYLE FUND VS. RUSSELL 1000® INDEX TOTAL RETURN VALUE OF $10,000 INVESTED ON 3/26/2013 |
The chart above represents historical performance of a hypothetical investment of $10,000 in the Fund over the past ten years (or since inception if shorter). Performance data quoted represents past performance and does not guarantee future results. Returns shown are total returns, which assume the reinvestment of dividends and capital gains. The table and graph presented above do not reflect the deduction of taxes a shareholder would pay on fund distributions or the redemption of fund shares.
| AQR Funds | Annual Report | September 2018 | ||||||||||||||
3
Table of Contents
Shareholder Letter (Unaudited)
| AQR SMALL CAP MULTI-STYLE FUND |
Cliff Asness
Managing & Founding Principal
Andrea Frazzini
Principal
Jacques Friedman
Principal
Ronen Israel
Principal
Dear Shareholder:
The AQR Small Cap Multi-Style Fund (the “Fund”) invests in stocks of attractively valued U.S. small-cap companies that have positive momentum and strong quality. The Fund is not actively managed to outperform a growth, value or core benchmark. Rather, it seeks to provide systematic exposure to stocks that rank high on a combined score of Value, Momentum and Quality styles.
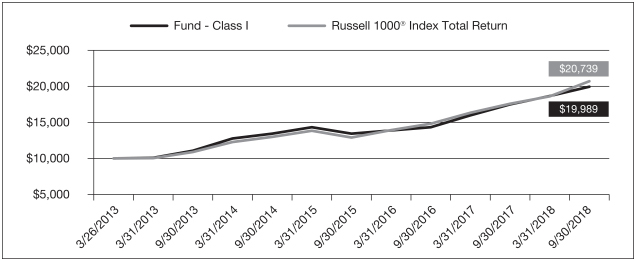
For the one year period ended September 30, 2018, the Fund’s Class I returned 9.18% while the Russell 2000® Total Return Index (the “Benchmark”) returned 15.24%. The Fund’s underperformance was driven primarily by stock selection within the information technology (-1.9%) and consumer discretionary (-1.5%) sectors, and was partially offset by positive performance within financials (0.9%).
Over the course of the period, the Fund’s largest active positions included sector overweights to consumer discretionary (3.9%) and consumer staples (2.2%); the portfolio was underweight health care (-2.6%) and utilities (-2.1%).
| AVERAGE ANNUAL TOTAL RETURNS AS OF 9/30/2018 AQR SMALL CAP MULTI-STYLE FUND | ||||||||||||||||||||
| 1 Year | 3 Year | 5 Year | Since Inception | Date of Inception | ||||||||||||||||
| Fund - Class I: QSMLX | 9.18% | 13.62% | 9.27% | 11.81% | 3/26/2013 | |||||||||||||||
| Fund - Class N: QSMNX | 8.94% | 13.36% | 8.98% | 11.52% | 3/26/2013 | |||||||||||||||
| Fund - Class R6: QSERX | 9.34% | 13.74% | N/A | 8.62% | 7/10/2014 | |||||||||||||||
| Russell 2000® Total Return Index | 15.24% | |||||||||||||||||||
Past performance does not guarantee future results. Investment results and principal value of an investment will fluctuate so that an investor’s shares, when redeemed, may be worth more or less than their original cost. Current performance may be lower or higher than the performance data quoted. As of the latest prospectus, the gross expense ratio for the Fund’s Class I/N/R6 shares are 0.70%, 0.95% and 0.60%, respectively. Call 1-866-290-2688 or visit www.aqrfunds.com for current month-end performance.
| AQR Funds | Annual Report | September 2018 | ||||||||||||||
4
Table of Contents
Shareholder Letter (Unaudited)
| AQR SMALL CAP MULTI-STYLE FUND |
AQR SMALL CAP MULTI-STYLE FUND VS. RUSSELL 2000® TOTAL RETURN INDEX VALUE OF $10,000 INVESTED ON 3/26/2013 |
The chart above represents historical performance of a hypothetical investment of $10,000 in the Fund over the past ten years (or since inception if shorter). Performance data quoted represents past performance and does not guarantee future results. Returns shown are total returns, which assume the reinvestment of dividends and capital gains. The table and graph presented above do not reflect the deduction of taxes a shareholder would pay on fund distributions or the redemption of fund shares.
| AQR Funds | Annual Report | September 2018 | ||||||||||||||
5
Table of Contents
Shareholder Letter (Unaudited)
| AQR INTERNATIONAL MULTI-STYLE FUND |
Cliff Asness
Managing & Founding Principal
Andrea Frazzini
Principal
Jacques Friedman
Principal
Ronen Israel
Principal
Dear Shareholder:
The AQR International Multi-Style Fund (the “Fund”) invests in stocks of attractively valued large and mid-cap non-U.S. companies that have positive momentum and strong quality. The Fund is not actively managed to outperform a growth, value or core benchmark. Rather, it seeks to provide systematic exposure to stocks that rank high on a combined score of Value, Momentum and Quality styles.
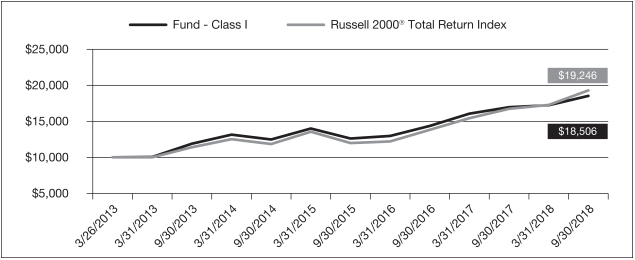
For the one year period ended September 30, 2018, the Fund’s Class I returned 0.81% while the MSCI Daily TR Net World Ex USA Index (the “Benchmark”) returned 2.67%. The Fund’s underperformance was driven primarily by stock selection within the information technology (-1.0%) and industrials (-0.6%) sectors, and was partially offset by positive performance within energy (0.7%).
Over the course of the period, the Fund’s largest active positions included sector overweights to the information technology (3.9%) and consumer discretionary (2.8%) sectors; the portfolio was underweight financials (-3.4%) and consumer staples (-2.1%).
| AVERAGE ANNUAL TOTAL RETURNS AS OF 9/30/2018 AQR INTERNATIONAL MULTI-STYLE FUND | ||||||||||||||||||||
| 1 Year | 3 Year | 5 Year | Since Inception | Date of Inception | ||||||||||||||||
| Fund - Class I: QICLX | 0.81% | 7.10% | 2.82% | 4.81% | 3/26/2013 | |||||||||||||||
| Fund - Class N: QICNX | 0.43%* | 6.77% | 2.53% | 4.53% | 3/26/2013 | |||||||||||||||
| Fund - Class R6: QICRX | 0.82%* | 7.17% | N/A | 1.84% | 7/10/2014 | |||||||||||||||
| MSCI Daily TR Net World Ex USA Index** | 2.67% | |||||||||||||||||||
Past performance does not guarantee future results. Investment results and principal value of an investment will fluctuate so that an investor’s shares, when redeemed, may be worth more or less than their original cost. Current performance may be lower or higher than the performance data quoted. As of the latest prospectus, the gross expense ratio for the Fund’s Class I/N/R6 shares are 0.65%, 0.91% and 0.56%, respectively. Call 1-866-290-2688 or visit www.aqrfunds.com for current month-end performance.
| AQR Funds | Annual Report | September 2018 | ||||||||||||||
6
Table of Contents
Shareholder Letter (Unaudited)
| AQR INTERNATIONAL MULTI-STYLE FUND |
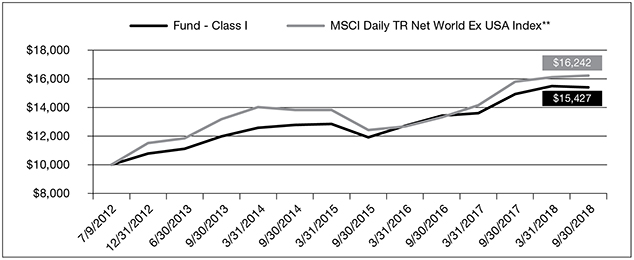
AQR INTERNATIONAL MULTI-STYLE FUND VS. MSCI DAILY TR NET WORLD EX USA INDEX** VALUE OF $10,000 INVESTED ON 3/26/2013 |
The chart above represents historical performance of a hypothetical investment of $10,000 in the Fund over the past ten years (or since inception if shorter). Performance data quoted represents past performance and does not guarantee future results. Returns shown are total returns, which assume the reinvestment of dividends and capital gains. The table and graph presented above do not reflect the deduction of taxes a shareholder would pay on fund distributions or the redemption of fund shares.
| * | Total return information is based on net asset values calculated for shareholder transactions. Certain adjustments were made to the net assets of the Fund at 9/30/2018 for financial reporting purposes, and as a result, the net asset values for shareholder transactions and the total returns based on those net asset values differ from the adjusted net asset values and total returns for financial reporting. |
| ** | MSCI makes no express or implied warranties or representations and shall have no liability whatsoever with respect to any MSCI data contained herein. The MSCI data may not be further redistributed or used as a basis for other indices or any securities or financial products. This report is not approved, reviewed, or produced by MSCI. |
| AQR Funds | Annual Report | September 2018 | ||||||||||||||
7
Table of Contents
Shareholder Letter (Unaudited)
| AQR EMERGING MULTI-STYLE FUND |
Cliff Asness
Managing & Founding Principal
Andrea Frazzini
Principal
Jacques Friedman
Principal
Ronen Israel
Principal
Dear Shareholder:
The AQR Emerging Multi-Style Fund (the “Fund”) invests in stocks of attractively valued large and midcap emerging countries’ companies that have positive momentum and strong quality. The Fund is not actively managed to outperform a growth, value or core benchmark. Rather, it seeks to provide systematic exposure to stocks that rank high on a combined score of Value, Momentum and Quality styles.
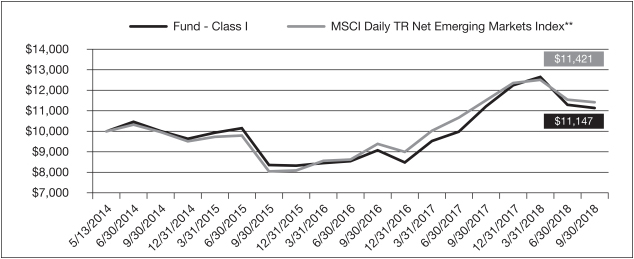
For the one year period ended September 30, 2018, the Fund’s Class I returned -3.48% while the MSCI Daily TR Net Emerging Markets Index (the “Benchmark”) returned -0.81%. The Fund’s underperformance was driven primarily by stock selection within the information technology (-0.9%) and energy (-0.7%) sectors. The Fund’s performance was positively impacted by positioning across sectors.
Over the course of the period, the Fund’s largest active positions included sector overweights to information technology (3.2%) and materials (2.4%); the portfolio was underweight financials (-4.6%) and consumer staples (-1.9%).
AVERAGE ANNUAL TOTAL RETURNS AS OF 9/30/2018 AQR EMERGING MULTI-STYLE FUND | ||||||||||||||||
| 1 Year | 3 Year | Since Inception | Date of Inception | |||||||||||||
| Fund - Class I: QEMLX | -3.48% | 9.71% | 1.98% | 5/13/2014 | ||||||||||||
| Fund - Class N: QEMNX | -3.58% | 9.44% | 1.76% | 5/13/2014 | ||||||||||||
| Fund - Class R6: QECRX | -3.29% | 9.82% | 1.05% | 7/10/2014 | ||||||||||||
| MSCI Daily TR Net Emerging Market Index** | -0.81% | |||||||||||||||
Past performance does not guarantee future results. Investment results and principal value of an investment will fluctuate so that an investor’s shares, when redeemed, may be worth more or less than their original cost. Current performance may be lower or higher than the performance data quoted. As of the latest prospectus, the gross expense ratio for the Fund’s Class I/N/R6 shares are 0.89%, 1.14% and 0.79%, respectively. Call 1-866-290-2688 or visit www.aqrfunds.com for current month-end performance.
| AQR Funds | Annual Report | September 2018 | ||||||||||||||
8
Table of Contents
Shareholder Letter (Unaudited)
| AQR EMERGING MULTI-STYLE FUND |
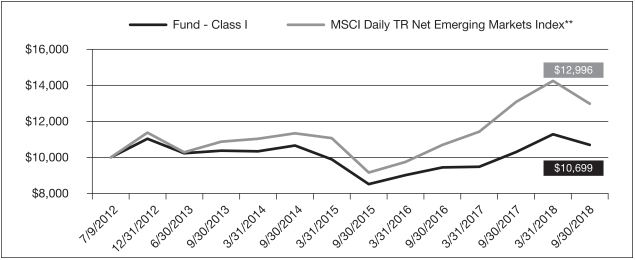
AQR EMERGING MULTI-STYLE FUND VS. MSCI DAILY TR NET EMERGING MARKETS INDEX** VALUE OF $10,000 INVESTED ON 5/13/2014 |
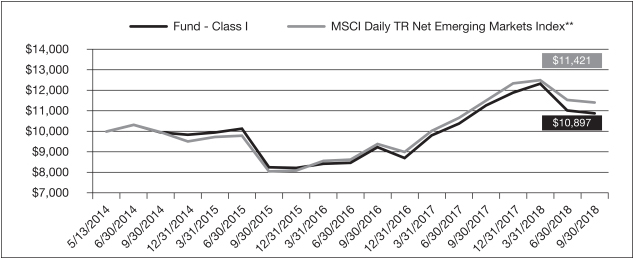
The chart above represents historical performance of a hypothetical investment of $10,000 in the Fund over the past ten years (or since inception if shorter). Performance data quoted represents past performance and does not guarantee future results. Returns shown are total returns, which assume the reinvestment of dividends and capital gains. The table and graph presented above do not reflect the deduction of taxes a shareholder would pay on fund distributions or the redemption of fund shares.
| ** | MSCI makes no express or implied warranties or representations and shall have no liability whatsoever with respect to any MSCI data contained herein. The MSCI data may not be further redistributed or used as a basis for other indices or any securities or financial products. This report is not approved, reviewed, or produced by MSCI. |
| AQR Funds | Annual Report | September 2018 | ||||||||||||||
9
Table of Contents
Shareholder Letter (Unaudited)
| AQR TM LARGE CAP MULTI-STYLE FUND |
Cliff Asness
Managing & Founding Principal
Andrea Frazzini
Principal
Jacques Friedman
Principal
Ronen Israel
Principal
Dear Shareholder:
The AQR TM Large Cap Multi-Style Fund (the “Fund”) invests in stocks of attractively valued U.S. large and mid-cap companies that have positive momentum and strong quality. The Fund is not actively managed to outperform a growth, value or core benchmark. Rather, it seeks to provide systematic exposure to stocks that rank high on a combined score of Value, Momentum and Quality styles. The Fund employs a tax management strategy which considers the potential impact of taxes on investment return.
For the one year period ended September 30, 2018, the Fund’s Class I returned 14.86% while the Russell 1000® Total Return Index (the “Benchmark”) returned 17.76%. The Fund’s underperformance was driven primarily by stock selection within the information technology (-2.4%) and consumer discretionary (-0.7%) sectors, and was partially offset by positive performance within energy (0.6%).
Over the course of the period, the Fund’s largest active positions included sector overweights to information technology (3.8%) and utilities (2.0%); the portfolio was underweight energy (-2.9%) and telecommunication services (-1.7%).
AVERAGE ANNUAL TOTAL RETURNS AS OF 9/30/2018 AQR TM LARGE CAP MULTI-STYLE FUND | ||||||||||||||||
| 1 Year | 3 Year | Since Inception | Date of Inception | |||||||||||||
| Fund - Class I: QTLLX | 14.86% | 14.49% | 10.00% | 2/11/2015 | ||||||||||||
| Fund - Class N: QTLNX | 14.57% | 14.18% | 9.69% | 2/11/2015 | ||||||||||||
| Fund - Class R6: QTLRX | 15.03% | 14.61% | 10.10% | 2/11/2015 | ||||||||||||
| Russell 1000® Index Total Return | 17.76% | |||||||||||||||
Past performance does not guarantee future results. Investment results and principal value of an investment will fluctuate so that an investor’s shares, when redeemed, may be worth more or less than their original cost. Current performance may be lower or higher than the performance data quoted. As of the latest prospectus, the gross expense ratio for the Fund’s Class I/N/R6 shares are 0.54%, 0.79% and 0.44%, respectively. Call 1-866-290-2688 or visit www.aqrfunds.com for current month-end performance.
| AQR Funds | Annual Report | September 2018 | ||||||||||||||
10
Table of Contents
Shareholder Letter (Unaudited)
| AQR TM LARGE CAP MULTI-STYLE FUND |
AQR TM LARGE CAP MULTI-STYLE FUND VS. RUSSELL 1000® INDEX TOTAL RETURN VALUE OF $10,000 INVESTED ON 2/11/2015 |
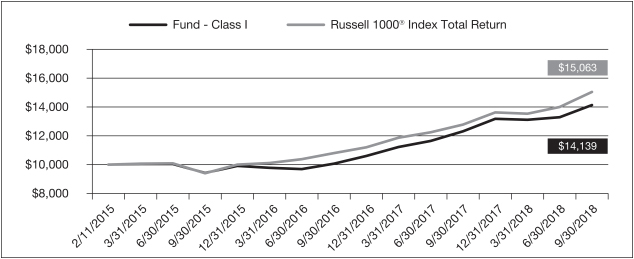
The chart above represents historical performance of a hypothetical investment of $10,000 in the Fund over the past ten years (or since inception if shorter). Performance data quoted represents past performance and does not guarantee future results. Returns shown are total returns, which assume the reinvestment of dividends and capital gains. The table and graph presented above do not reflect the deduction of taxes a shareholder would pay on fund distributions or the redemption of fund shares.
| AQR Funds | Annual Report | September 2018 | ||||||||||||||
11
Table of Contents
Shareholder Letter (Unaudited)
| AQR TM SMALL CAP MULTI-STYLE FUND |
Cliff Asness
Managing & Founding Principal
Andrea Frazzini
Principal
Jacques Friedman
Principal
Ronen Israel
Principal
Dear Shareholder:
The AQR TM Small Cap Multi-Style Fund (the “Fund”) invests in stocks of attractively valued U.S. small-cap companies that have positive momentum and strong quality. The Fund is not actively managed to outperform a growth, value or core benchmark. Rather, it seeks to provide systematic exposure to stocks that rank high on a combined score of Value, Momentum and Quality styles. The Fund employs a tax management strategy which considers the potential impact of taxes on investment return.
For the one year period ended September 30, 2018, the Fund’s Class I returned 10.23% while the Russell 2000® Total Return Index (the “Benchmark”) returned 15.24%. The Fund’s underperformance was driven primarily by stock selection within the information technology (-1.9%) and health care (-1.2%) sectors, and was partially offset by positive performance within financials (1.1%).
Over the course of the period, the Fund’s largest active positions included sector overweights to consumer discretionary (4.1%) and financials (2.0%); the portfolio was underweight health care (-2.5%) and energy (-1.9%).
AVERAGE ANNUAL TOTAL RETURNS AS OF 9/30/2018 AQR TM SMALL CAP MULTI-STYLE FUND | ||||||||||||||||
| 1 Year | 3 Year | Since Inception | Date of Inception | |||||||||||||
| Fund - Class I: QSSLX | 10.23% | 13.51% | 8.55% | 2/11/2015 | ||||||||||||
| Fund - Class N: QSSNX | 10.00% | 13.22% | 8.28% | 2/11/2015 | ||||||||||||
| Fund - Class R6: QSSRX | 10.30% | 13.61% | 8.66% | 2/11/2015 | ||||||||||||
| Russell 2000® Total Return Index | 15.24% | |||||||||||||||
Past performance does not guarantee future results. Investment results and principal value of an investment will fluctuate so that an investor’s shares, when redeemed, may be worth more or less than their original cost. Current performance may be lower or higher than the performance data quoted. As of the latest prospectus, the gross expense ratio for the Fund’s Class I/N/R6 shares are 1.24%, 1.48% and 1.14%, respectively. Call 1-866-290-2688 or visit www.aqrfunds.com for current month-end performance.
| AQR Funds | Annual Report | September 2018 | ||||||||||||||
12
Table of Contents
Shareholder Letter (Unaudited)
| AQR TM SMALL CAP MULTI-STYLE FUND |
AQR TM SMALL CAP MULTI-STYLE FUND VS. RUSSELL 2000® TOTAL RETURN INDEX VALUE OF $10,000 INVESTED ON 2/11/2015 |
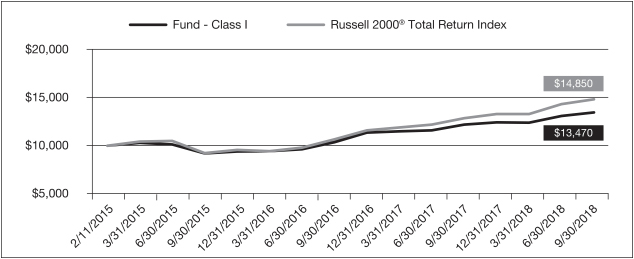
The chart above represents historical performance of a hypothetical investment of $10,000 in the Fund over the past ten years (or since inception if shorter). Performance data quoted represents past performance and does not guarantee future results. Returns shown are total returns, which assume the reinvestment of dividends and capital gains. The table and graph presented above do not reflect the deduction of taxes a shareholder would pay on fund distributions or the redemption of fund shares.
| AQR Funds | Annual Report | September 2018 | ||||||||||||||
13
Table of Contents
Shareholder Letter (Unaudited)
| AQR TM INTERNATIONAL MULTI-STYLE FUND |
Cliff Asness
Managing & Founding Principal
Andrea Frazzini
Principal
Jacques Friedman
Principal
Ronen Israel
Principal
Dear Shareholder:
The AQR TM International Multi-Style Fund (the “Fund”) invests in stocks of attractively valued large and mid-cap non-U.S. companies that have positive momentum and strong quality. The Fund is not actively managed to outperform a growth, value or core benchmark. Rather, it seeks to provide systematic exposure to stocks that rank high on a combined score of Value, Momentum and Quality styles. The Fund employs a tax management strategy which considers the potential impact of taxes on investment return.
For the one year period ended September 30, 2018, the Fund’s Class I returned 1.39% while the MSCI Daily TR Net World Ex USA Index (the “Benchmark”) returned 2.67%. The Fund’s underperformance was driven primarily by stock selection within the information technology (-1.1%) and consumer discretionary (-0.7%) sectors, and was partially offset by positive performance within energy (0.9%) and financials (0.5%).
Over the course of the period, the Fund’s largest active positions included sector overweights to the information technology (3.6%) and consumer discretionary (3.1%); the portfolio was underweight financials (-2.8%) and consumer staples (-2.2%).
AVERAGE ANNUAL TOTAL RETURNS AS OF 9/30/2018 AQR TM INTERNATIONAL MULTI-STYLE FUND | ||||||||||||||||
| 1 Year | 3 Year | Since Inception | Date of Inception | |||||||||||||
| Fund - Class I: QIMLX | 1.39% | 7.56% | 4.41% | 2/11/2015 | ||||||||||||
| Fund - Class N: QIMNX | 1.17% | 7.30% | 4.17% | 2/11/2015 | ||||||||||||
| Fund - Class R6: QIMRX | 1.56% | 7.69% | 4.54% | 2/11/2015 | ||||||||||||
| MSCI Daily TR Net World Ex USA Index** | 2.67% | |||||||||||||||
Past performance does not guarantee future results. Investment results and principal value of an investment will fluctuate so that an investor’s shares, when redeemed, may be worth more or less than their original cost. Current performance may be lower or higher than the performance data quoted. As of the latest prospectus, the gross expense ratio for the Fund’s Class I/N/R6 shares are 0.71%, 0.97% and 0.62%, respectively. Call 1-866-290-2688 or visit www.aqrfunds.com for current month-end performance.
| AQR Funds | Annual Report | September 2018 | ||||||||||||||
14
Table of Contents
Shareholder Letter (Unaudited)
| AQR TM INTERNATIONAL MULTI-STYLE FUND |
AQR TM INTERNATIONAL MULTI-STYLE FUND VS. MSCI DAILY TR NET WORLD EX USA INDEX** VALUE OF $10,000 INVESTED ON 2/11/2015 |
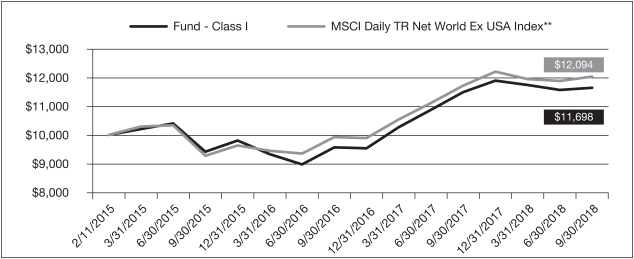
The chart above represents historical performance of a hypothetical investment of $10,000 in the Fund over the past ten years (or since inception if shorter). Performance data quoted represents past performance and does not guarantee future results. Returns shown are total returns, which assume the reinvestment of dividends and capital gains. The table and graph presented above do not reflect the deduction of taxes a shareholder would pay on fund distributions or the redemption of fund shares.
| ** | MSCI makes no express or implied warranties or representations and shall have no liability whatsoever with respect to any MSCI data contained herein. The MSCI data may not be further redistributed or used as a basis for other indices or any securities or financial products. This report is not approved, reviewed, or produced by MSCI. |
| AQR Funds | Annual Report | September 2018 | ||||||||||||||
15
Table of Contents
Shareholder Letter (Unaudited)
| AQR TM EMERGING MULTI-STYLE FUND |
Cliff Asness
Managing & Founding Principal
Andrea Frazzini
Principal
Jacques Friedman
Principal
Ronen Israel
Principal
Dear Shareholder:
The AQR TM Emerging Multi-Style Fund (the “Fund”) invests in stocks of attractively valued large and mid-cap emerging countries’ companies that have positive momentum and strong quality. The Fund is not actively managed to outperform a growth, value or core benchmark. Rather, it seeks to provide systematic exposure to stocks that rank high on a combined score of Value, Momentum and Quality styles. The Fund employs a tax management strategy which considers the potential impact of taxes on investment return.
For the one year period ended September 30, 2018, the Fund’s Class I returned -3.35% while the MSCI Daily TR Net Emerging Markets Index (the “Benchmark”) returned -0.81%. The Fund’s underperformance was driven primarily by stock selection within the consumer discretionary (-0.9%) and energy (-0.7%) sectors, and was partially offset by positive performance within financials (1.0%). The Fund’s performance was positively impacted by positioning across sectors.
Over the course of the period, the Fund’s largest active positions included sector overweights to information technology (3.0%) and materials (2.0%); the portfolio was underweight financials (-3.0%) and consumer staples (-2.3%).
AVERAGE ANNUAL TOTAL RETURNS AS OF 9/30/2018 AQR TM EMERGING MULTI-STYLE FUND | ||||||||||||||||
| 1 Year | 3 Year | Since Inception | Date of Inception | |||||||||||||
| Fund - Class I: QTELX | -3.35% | 10.01% | 2.82% | 2/11/2015 | ||||||||||||
| Fund - Class N: QTENX | -3.70% | 9.71% | 2.55% | 2/11/2015 | ||||||||||||
| Fund - Class R6: QTERX | -3.27% | 10.07% | 2.90% | 2/11/2015 | ||||||||||||
| MSCI Daily TR Net Emerging Market Index** | -0.81% | |||||||||||||||
Past performance does not guarantee future results. Investment results and principal value of an investment will fluctuate so that an investor’s shares, when redeemed, may be worth more or less than their original cost. Current performance may be lower or higher than the performance data quoted. As of the latest prospectus, the gross expense ratio for the Fund’s Class I/N/R6 shares are 0.86%, 1.12% and 0.77%, respectively. Call 1-866-290-2688 or visit www.aqrfunds.com for current month-end performance.
| AQR Funds | Annual Report | September 2018 | ||||||||||||||
16
Table of Contents
Shareholder Letter (Unaudited)
| AQR TM EMERGING MULTI-STYLE FUND |
AQR TM EMERGING MULTI-STYLE FUND VS. MSCI DAILY TR NET EMERGING MARKETS INDEX** VALUE OF $10,000 INVESTED ON 2/11/2015 |
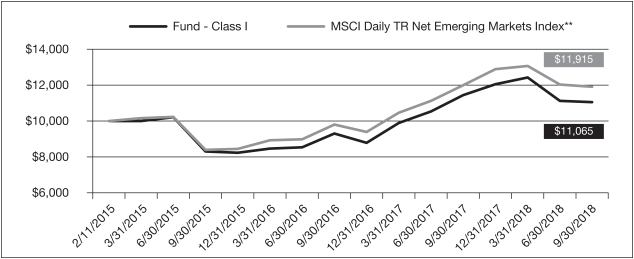
The chart above represents historical performance of a hypothetical investment of $10,000 in the Fund over the past ten years (or since inception if shorter). Performance data quoted represents past performance and does not guarantee future results. Returns shown are total returns, which assume the reinvestment of dividends and capital gains. The table and graph presented above do not reflect the deduction of taxes a shareholder would pay on fund distributions or the redemption of fund shares.
| ** | MSCI makes no express or implied warranties or representations and shall have no liability whatsoever with respect to any MSCI data contained herein. The MSCI data may not be further redistributed or used as a basis for other indices or any securities or financial products. This report is not approved, reviewed, or produced by MSCI. |
| AQR Funds | Annual Report | September 2018 | ||||||||||||||
17
Table of Contents
Shareholder Letter (Unaudited)
| AQR LARGE CAP MOMENTUM STYLE FUND |
Cliff Asness
Managing & Founding Principal
Andrea Frazzini
Principal
Jacques Friedman
Principal
Ronen Israel
Principal
Dear Shareholder:
The AQR Large Cap Momentum Style Fund (the “Fund”) invests in stocks of large and mid-cap U.S. companies with positive momentum. The Fund is not actively managed to outperform a growth, value or core benchmark. Rather, it seeks to provide systematic exposure to stocks that share the common characteristic of positive momentum.
For the one year period ended September 30, 2018, the Fund’s Class I returned 23.94% while the Russell 1000® Total Return Index (the “Benchmark”) returned 17.76%. The Fund’s outperformance was driven primarily by stock selection within the consumer discretionary (1.0%) and health care (0.9%) sectors.
Over the course of the period, the Fund’s largest active positions included sector overweights to the information technology (12.6%) and industrials (2.0%) sectors; the portfolio was underweight consumer staples (-4.8%) and energy (-3.6%).
AVERAGE ANNUAL TOTAL RETURNS AS OF 9/30/2018 AQR LARGE CAP MOMENTUM STYLE FUND | ||||||||||||||||||||
| 1 Year | 3 Year | 5 Year | Since Inception | Date of Inception | ||||||||||||||||
| Fund - Class I: AMOMX | 23.94% | 17.03% | 13.41% | 15.92% | 7/9/2009 | |||||||||||||||
| Fund - Class N: AMONX | 23.61% | 16.74% | 13.13% | 15.21% | 12/17/2012 | |||||||||||||||
| Fund - Class R6: QMORX | 24.06% | 17.14% | N/A | 11.95% | 7/10/2014 | |||||||||||||||
| Russell 1000® Index Total Return | 17.76% | |||||||||||||||||||
Past performance does not guarantee future results. Investment results and principal value of an investment will fluctuate so that an investor’s shares, when redeemed, may be worth more or less than their original cost. Current performance may be lower or higher than the performance data quoted. As of the latest prospectus, the gross expense ratio for the Fund’s Class I/N/R6 shares are 0.41%, 0.66% and 0.31%, respectively. Call 1-866-290-2688 or visit www.aqrfunds.com for current month-end performance.
| AQR Funds | Annual Report | September 2018 | ||||||||||||||
18
Table of Contents
Shareholder Letter (Unaudited)
| AQR LARGE CAP MOMENTUM STYLE FUND |
AQR LARGE CAP MOMENTUM STYLE FUND VS. RUSSELL 1000® INDEX TOTAL RETURN VALUE OF $10,000 INVESTED ON 7/9/2009 |
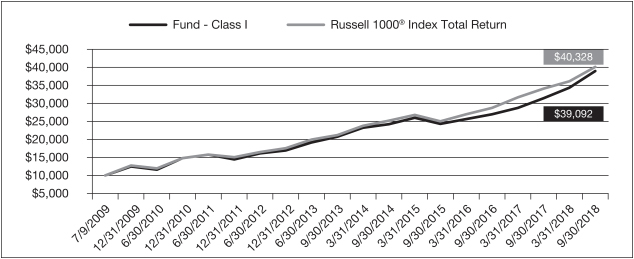
The chart above represents historical performance of a hypothetical investment of $10,000 in the Fund over the past ten years (or since inception if shorter). Performance data quoted represents past performance and does not guarantee future results. Returns shown are total returns, which assume the reinvestment of dividends and capital gains. The table and graph presented above do not reflect the deduction of taxes a shareholder would pay on fund distributions or the redemption of fund shares.
| AQR Funds | Annual Report | September 2018 | ||||||||||||||
19
Table of Contents
Shareholder Letter (Unaudited)
| AQR SMALL CAP MOMENTUM STYLE FUND |
Cliff Asness
Managing & Founding Principal
Andrea Frazzini
Principal
Jacques Friedman
Principal
Ronen Israel
Principal
Dear Shareholder:
The AQR Small Cap Momentum Style Fund (the “Fund”) invests in stocks of small-cap U.S. companies with positive momentum. The Fund is not actively managed to outperform a growth, value or core benchmark. Rather, it seeks to provide systematic exposure to stocks that share the common characteristic of positive momentum.
For the one year period ended September 30, 2018, the Fund’s Class I returned 20.11% while the Russell 2000® Total Return Index (the “Benchmark”) returned 15.24%. The Fund’s outperformance was driven primarily by stock selection within the information technology (1.2%) and health care (0.8%) sectors.
Over the course of the period, the Fund’s largest active positions included sector overweights to the health care (8.4%) and consumer discretionary (3.1%) sectors; the portfolio was underweight financials (-5.7%) and real estate (-4.5%).
| AVERAGE ANNUAL TOTAL RETURNS AS OF 9/30/2018 AQR SMALL CAP MOMENTUM STYLE FUND | ||||||||||||||||||||
| 1 Year | 3 Year | 5 Year | Since Inception | Date of Inception | ||||||||||||||||
| Fund - Class I: ASMOX | 20.11% | 16.78% | 10.68% | 16.11% | 7/9/2009 | |||||||||||||||
| Fund - Class N: ASMNX | 19.84% | 16.51% | 10.41% | 14.74% | 12/17/2012 | |||||||||||||||
| Fund - Class R6: QSMRX | 20.26% | 16.89% | N/A | 10.85% | 7/10/2014 | |||||||||||||||
| Russell 2000® Total Return Index | 15.24% | |||||||||||||||||||
Past performance does not guarantee future results. Investment results and principal value of an investment will fluctuate so that an investor’s shares, when redeemed, may be worth more or less than their original cost. Current performance may be lower or higher than the performance data quoted. As of the latest prospectus, the gross expense ratio for the Fund’s Class I/N/R6 shares are 0.64%, 0.86% and 0.54%, respectively. Call 1-866-290-2688 or visit www.aqrfunds.com for current month-end performance.
| AQR Funds | Annual Report | September 2018 | ||||||||||||||
20
Table of Contents
Shareholder Letter (Unaudited)
| AQR SMALL CAP MOMENTUM STYLE FUND |
AQR SMALL CAP MOMENTUM STYLE FUND VS. RUSSELL 2000® TOTAL RETURN INDEX VALUE OF $10,000 INVESTED ON 7/9/2009 |
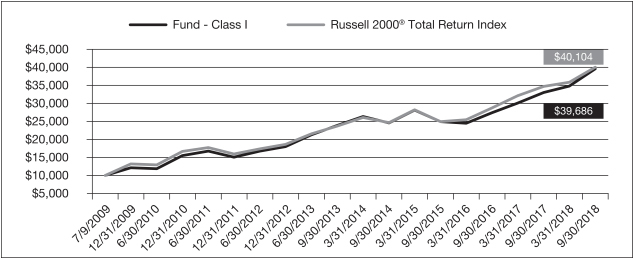
The chart above represents historical performance of a hypothetical investment of $10,000 in the Fund over the past ten years (or since inception if shorter). Performance data quoted represents past performance and does not guarantee future results. Returns shown are total returns, which assume the reinvestment of dividends and capital gains. The table and graph presented above do not reflect the deduction of taxes a shareholder would pay on fund distributions or the redemption of fund shares.
| AQR Funds | Annual Report | September 2018 | ||||||||||||||
21
Table of Contents
Shareholder Letter (Unaudited)
| AQR INTERNATIONAL MOMENTUM STYLE FUND |
Cliff Asness
Managing & Founding Principal
Andrea Frazzini
Principal
Jacques Friedman
Principal
Ronen Israel
Principal
Dear Shareholder:
The AQR International Momentum Style Fund (the “Fund”) invests in stocks of non-U.S. companies with positive momentum. The Fund is not actively managed to outperform a growth, value or core benchmark. Rather, it seeks to provide systematic exposure to stocks that share the common characteristic of positive momentum.
For the one year period ended September 30, 2018, the Fund’s Class I returned 4.31% while the MSCI Daily TR Net World Ex USA Index (the “Benchmark”) returned 2.67%. The Fund’s outperformance was driven primarily by stock selection within the consumer staples (0.5%) and consumer discretionary (0.5%) sectors.
Over the course of the period, the Fund’s largest active positions included sector overweights to information technology (6.0%) and consumer discretionary (4.9%); the portfolio was underweight consumer staples (-4.5%) and financials (-4.2%). Notable active positions also included a country overweight to Japan (9.0%) and Hong Kong (2.4%) and an underweight to the United Kingdom (-4.9%) and Canada (-3.7%).
| AVERAGE ANNUAL TOTAL RETURNS AS OF 9/30/2018 AQR INTERNATIONAL MOMENTUM STYLE FUND | ||||||||||||||||||||
| 1 Year | 3 Year | 5 Year | Since Inception | Date of Inception | ||||||||||||||||
| Fund - Class I: AIMOX | 4.31% | 8.37% | 2.98% | 7.32% | 7/9/2009 | |||||||||||||||
| Fund - Class N: AIONX | 4.02% | 8.09% | 2.72% | 5.28% | 12/17/2012 | |||||||||||||||
| Fund - Class R6: QIORX | 4.34% | 8.47% | N/A | 2.84% | 7/10/2014 | |||||||||||||||
| MSCI Daily TR Net World Ex USA Index** | 2.67% | |||||||||||||||||||
Past performance does not guarantee future results. Investment results and principal value of an investment will fluctuate so that an investor’s shares, when redeemed, may be worth more or less than their original cost. Current performance may be lower or higher than the performance data quoted. As of the latest prospectus, the gross expense ratio for the Fund’s Class I/N/R6 shares are 0.63%, 0.88% and 0.53%, respectively. Call 1-866-290-2688 or visit www.aqrfunds.com for current month-end performance.
| AQR Funds | Annual Report | September 2018 | ||||||||||||||
22
Table of Contents
Shareholder Letter (Unaudited)
| AQR INTERNATIONAL MOMENTUM STYLE FUND |
AQR INTERNATIONAL MOMENTUM STYLE FUND VS. MSCI DAILY TR NET WORLD EX USA INDEX** VALUE OF $10,000 INVESTED ON 7/9/2009 |
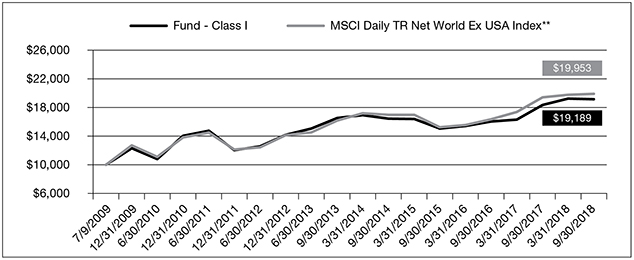
The chart above represents historical performance of a hypothetical investment of $10,000 in the Fund over the past ten years (or since inception if shorter). Performance data quoted represents past performance and does not guarantee future results. Returns shown are total returns, which assume the reinvestment of dividends and capital gains. The table and graph presented above do not reflect the deduction of taxes a shareholder would pay on fund distributions or the redemption of fund shares.
| ** | MSCI makes no express or implied warranties or representations and shall have no liability whatsoever with respect to any MSCI data contained herein. The MSCI data may not be further redistributed or used as a basis for other indices or any securities or financial products. This report is not approved, reviewed, or produced by MSCI. |
| AQR Funds | Annual Report | September 2018 | ||||||||||||||
23
Table of Contents
Shareholder Letter (Unaudited)
| AQR EMERGING MOMENTUM STYLE FUND |
Cliff Asness
Managing & Founding Principal
Andrea Frazzini
Principal
Jacques Friedman
Principal
Ronen Israel
Principal
Dear Shareholder:
The AQR Emerging Momentum Style Fund (the “Fund”) invests in stocks of emerging market companies with positive momentum. The Fund is not actively managed to outperform a growth, value or core benchmark. Rather, it seeks to provide systematic exposure to stocks that share the common characteristic of positive momentum.
For the one year period ended September 30, 2018, the Fund’s Class I returned -0.63% while the MSCI Daily TR Net Emerging Markets Index (the “Benchmark”) returned -0.81%. The Fund’s outperformance was driven primarily by stock selection within the financials (1.6%) and consumer discretionary (0.4%) sectors, while stock selection within the information technology sector detracted (-1.0%).
Over the course of the period, the Fund’s largest active positions included sector overweights to materials (3.6%) and health care (2.5%); the portfolio was underweight information technology (-6.9%) and telecommunication services (-3.3%).
| AVERAGE ANNUAL TOTAL RETURNS AS OF 9/30/2018 AQR EMERGING MOMENTUM STYLE FUND | ||||||||||||||||
| 1 Year | 3 Year | Since Inception | Date of Inception | |||||||||||||
| Fund - Class I: QEMLX | -0.63% | 10.02% | 2.51% | 5/13/2014 | ||||||||||||
| Fund - Class N: QEMNX | -0.84% | 9.77% | 2.25% | 5/13/2014 | ||||||||||||
| Fund - Class R6: QEMRX | -0.56% | 10.09% | 1.21% | 7/10/2014 | ||||||||||||
| MSCI Daily TR Net Emerging Market Index** | -0.81% | |||||||||||||||
Past performance does not guarantee future results. Investment results and principal value of an investment will fluctuate so that an investor’s shares, when redeemed, may be worth more or less than their original cost. Current performance may be lower or higher than the performance data quoted. As of the latest prospectus, the gross expense ratio for the Fund’s Class I/N/R6 shares are 2.54%, 2.75% and 2.45%, respectively. Call 1-866-290-2688 or visit www.aqrfunds.com for current month-end performance.
| AQR Funds | Annual Report | September 2018 | ||||||||||||||
24
Table of Contents
Shareholder Letter (Unaudited)
| AQR EMERGING MOMENTUM STYLE FUND |
AQR EMERGING MOMENTUM STYLE FUND VS. MSCI DAILY TR NET EMERGING MARKETS INDEX** VALUE OF $10,000 INVESTED ON 5/13/2014 |
The chart above represents historical performance of a hypothetical investment of $10,000 in the Fund over the past ten years (or since inception if shorter). Performance data quoted represents past performance and does not guarantee future results. Returns shown are total returns, which assume the reinvestment of dividends and capital gains. The table and graph presented above do not reflect the deduction of taxes a shareholder would pay on fund distributions or the redemption of fund shares.
| ** | MSCI makes no express or implied warranties or representations and shall have no liability whatsoever with respect to any MSCI data contained herein. The MSCI data may not be further redistributed or used as a basis for other indices or any securities or financial products. This report is not approved, reviewed, or produced by MSCI. |
| AQR Funds | Annual Report | September 2018 | ||||||||||||||
25
Table of Contents
Shareholder Letter (Unaudited)
| AQR TM LARGE CAP MOMENTUM STYLE FUND |
Cliff Asness
Managing & Founding Principal
Andrea Frazzini
Principal
Jacques Friedman
Principal
Ronen Israel
Principal
Dear Shareholder:
The AQR TM Large Cap Momentum Style Fund (the “Fund”) invests in stocks of large and mid-cap U.S. companies with positive momentum. The Fund is not actively managed to outperform a growth, value or core benchmark. The Fund employs a tax management strategy which considers the potential impact of taxes on investment return.
For the one year period ended September 30, 2018, the Fund’s Class I returned 24.87% while the Russell 1000® Total Return Index (the “Benchmark”) returned 17.76%. The Fund’s outperformance was driven primarily by stock selection within the consumer discretionary (1.4%) and health care (1.4%) sectors.
Over the course of the period, the Fund’s largest active positions included sector overweights to information technology (11.2%) and industrials (1.9%); the portfolio was underweight consumer staples (-4.4%) and energy (-3.4%).
| AVERAGE ANNUAL TOTAL RETURNS AS OF 9/30/2018 AQR TM LARGE CAP MOMENTUM STYLE FUND | ||||||||||||||||||||
| 1 Year | 3 Year | 5 Year | Since Inception | Date of Inception | ||||||||||||||||
| Fund - Class I: ATMOX | 24.87% | 16.93% | 13.53% | 15.52% | 1/27/2012 | |||||||||||||||
| Fund - Class N: ATMNX | 24.53% | 16.70% | 13.27% | 15.27% | 12/17/2012 | |||||||||||||||
| Fund - Class R6: QTMRX | 25.00% | 17.05% | N/A | 12.01% | 7/10/2014 | |||||||||||||||
| Russell 1000® Index Total Return | 17.76% | |||||||||||||||||||
Past performance does not guarantee future results. Investment results and principal value of an investment will fluctuate so that an investor’s shares, when redeemed, may be worth more or less than their original cost. Current performance may be lower or higher than the performance data quoted. As of the latest prospectus, the gross expense ratio for the Fund’s Class I/N/R6 shares are 0.49%, 0.71% and 0.39%, respectively. Call 1-866-290-2688 or visit www.aqrfunds.com for current month-end performance.
| AQR Funds | Annual Report | September 2018 | ||||||||||||||
26
Table of Contents
Shareholder Letter (Unaudited)
| AQR TM LARGE CAP MOMENTUM STYLE FUND |
AQR TM LARGE CAP MOMENTUM STYLE FUND VS. RUSSELL 1000® INDEX TOTAL RETURN VALUE OF $10,000 INVESTED ON 1/27/2012 |
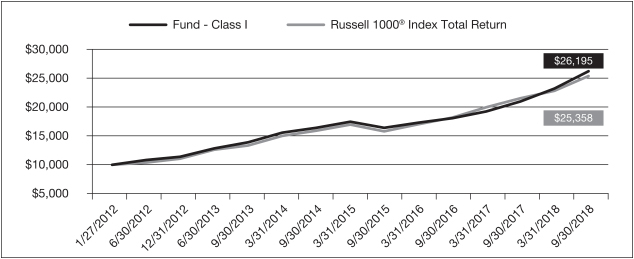
The chart above represents historical performance of a hypothetical investment of $10,000 in the Fund over the past ten years (or since inception if shorter). Performance data quoted represents past performance and does not guarantee future results. Returns shown are total returns, which assume the reinvestment of dividends and capital gains. The table and graph presented above do not reflect the deduction of taxes a shareholder would pay on fund distributions or the redemption of fund shares.
| AQR Funds | Annual Report | September 2018 | ||||||||||||||
27
Table of Contents
Shareholder Letter (Unaudited)
| AQR TM SMALL CAP MOMENTUM STYLE FUND |
Cliff Asness
Managing & Founding Principal
Andrea Frazzini
Principal
Jacques Friedman
Principal
Ronen Israel
Principal
Dear Shareholder:
The AQR TM Small Cap Momentum Style Fund (the “Fund”) invests in stocks of small-cap U.S. companies with positive momentum. The Fund employs a tax management strategy which considers the potential impact of taxes on investment return.
For the one year period ended September 30, 2018, the Fund’s Class I returned 18.75% while the Russell 2000® Total Return Index (the “Benchmark”) returned 15.24%. The Fund’s outperformance was driven primarily by stock selection within the health care (0.7%) and financials (0.7%) sectors.
Over the course of the period, the Fund’s largest active positions included sector overweights to the health care (8.9%) and information technology (3.4%) sectors; the portfolio was underweight financials (-4.5%) and real estate (-3.9%).
| AVERAGE ANNUAL TOTAL RETURNS AS OF 9/30/2018 AQR TM SMALL CAP MOMENTUM STYLE FUND | ||||||||||||||||||||
| 1 Year | 3 Year | 5 Year | Since Inception | Date of Inception | ||||||||||||||||
| Fund - Class I: ATSMX | 18.75% | 16.52% | 10.28% | 14.40% | 1/27/2012 | |||||||||||||||
| Fund - Class N: ATSNX | 18.43% | 16.28% | 10.03% | 14.51% | 12/17/2012 | |||||||||||||||
| Fund - Class R6: QTSRX | 18.85% | 16.64% | N/A | 10.86% | 7/10/2014 | |||||||||||||||
| Russell 2000® Total Return Index | 15.24% | |||||||||||||||||||
Past performance does not guarantee future results. Investment results and principal value of an investment will fluctuate so that an investor’s shares, when redeemed, may be worth more or less than their original cost. Current performance may be lower or higher than the performance data quoted. As of the latest prospectus, the gross expense ratio for the Fund’s Class I/N/R6 shares are 0.93%, 1.13% and 0.84%, respectively. Call 1-866-290-2688 or visit www.aqrfunds.com for current month-end performance.
| AQR Funds | Annual Report | September 2018 | ||||||||||||||
28
Table of Contents
Shareholder Letter (Unaudited)
| AQR TM SMALL CAP MOMENTUM STYLE FUND |
AQR TM SMALL CAP MOMENTUM STYLE FUND VS. RUSSELL 2000® TOTAL RETURN INDEX VALUE OF $10,000 INVESTED ON 1/27/2012 |
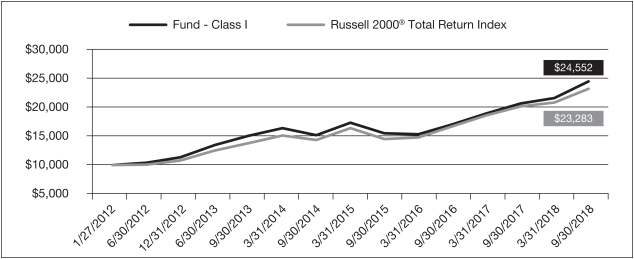
The chart above represents historical performance of a hypothetical investment of $10,000 in the Fund over the past ten years (or since inception if shorter). Performance data quoted represents past performance and does not guarantee future results. Returns shown are total returns, which assume the reinvestment of dividends and capital gains. The table and graph presented above do not reflect the deduction of taxes a shareholder would pay on fund distributions or the redemption of fund shares.
| AQR Funds | Annual Report | September 2018 | ||||||||||||||
29
Table of Contents
Shareholder Letter (Unaudited)
| AQR TM INTERNATIONAL MOMENTUM STYLE FUND |
Cliff Asness
Managing & Founding Principal
Andrea Frazzini
Principal
Jacques Friedman
Principal
Ronen Israel
Principal
Dear Shareholder:
The AQR TM International Momentum Style Fund (the “Fund”) invests in stocks of large and mid-cap non-U.S. companies with positive momentum. The Fund is not actively managed to outperform a growth, value or core benchmark. Rather, it seeks to provide systematic exposure to stocks that share the common characteristic of positive momentum. The Fund employs a tax management strategy which considers the potential impact of taxes on investment return.
For the one year period ended September 30, 2018, the Fund’s Class I returned 2.93% while the MSCI Daily TR Net World Ex USA Index (the “Benchmark”) returned 2.67%. The Fund’s outperformance was driven primarily by stock selection within the consumer staples (0.3%) and energy (0.2%) sectors.
Over the course of the period, the Fund’s largest active positions within the stock selection strategy included sector overweights to information technology (6.9%) and consumer discretionary (2.6%); the portfolio was underweight consumer staples (-3.9%) and financials (-3.1%). Notable active positions also included a country overweight to Japan (8.9%) and Germany (1.8%) and an underweight to the United Kingdom (-4.1%) and France (-3.8%).
| AVERAGE ANNUAL TOTAL RETURNS AS OF 9/30/2018 AQR TM INTERNATIONAL MOMENTUM STYLE FUND | ||||||||||||||||||||
| 1 Year | 3 Year | 5 Year | Since Inception | Date of Inception | ||||||||||||||||
| Fund - Class I: ATIMX | 2.93% | 7.76% | 2.97% | 6.83% | 1/27/2012 | |||||||||||||||
| Fund - Class N: ATNNX | 2.75% | 7.55% | 2.77% | 5.36% | 12/17/2012 | |||||||||||||||
| Fund - Class R6: QTIRX | 3.03% | 7.87% | N/A | 2.36% | 7/10/2014 | |||||||||||||||
| MSCI Daily TR Net World Ex USA Index** | 2.67% | |||||||||||||||||||
Past performance does not guarantee future results. Investment results and principal value of an investment will fluctuate so that an investor’s shares, when redeemed, may be worth more or less than their original cost. Current performance may be lower or higher than the performance data quoted. As of the latest prospectus, the gross expense ratio for the Fund’s Class I/N/R6 shares are 0.75%, 0.96% and 0.66%, respectively. Call 1-866-290-2688 or visit www.aqrfunds.com for current month-end performance.
| AQR Funds | Annual Report | September 2018 | ||||||||||||||
30
Table of Contents
Shareholder Letter (Unaudited)
| AQR TM INTERNATIONAL MOMENTUM STYLE FUND |
AQR TM INTERNATIONAL MOMENTUM STYLE FUND VS. MSCI DAILY TR NET WORLD EX USA INDEX** VALUE OF $10,000 INVESTED ON 1/27/2012 |
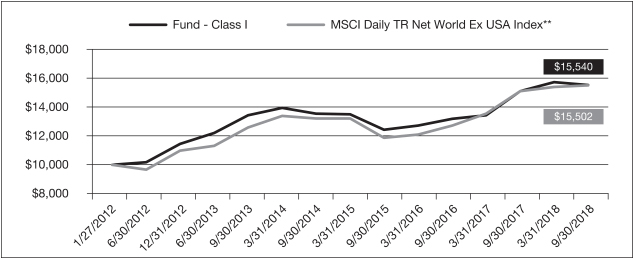
The chart above represents historical performance of a hypothetical investment of $10,000 in the Fund over the past ten years (or since inception if shorter). Performance data quoted represents past performance and does not guarantee future results. Returns shown are total returns, which assume the reinvestment of dividends and capital gains. The table and graph presented above do not reflect the deduction of taxes a shareholder would pay on fund distributions or the redemption of fund shares.
| ** | MSCI makes no express or implied warranties or representations and shall have no liability whatsoever with respect to any MSCI data contained herein. The MSCI data may not be further redistributed or used as a basis for other indices or any securities or financial products. This report is not approved, reviewed, or produced by MSCI. |
| AQR Funds | Annual Report | September 2018 | ||||||||||||||
31
Table of Contents
Shareholder Letter (Unaudited)
| AQR LARGE CAP DEFENSIVE STYLE FUND |

Michele Aghassi
Principal
Andrea Frazzini
Principal
Jacques Friedman
Principal
Dear Shareholder:
The AQR Large Cap Defensive Style Fund (the “Fund”) pursues a defensive strategy in the U.S. market, meaning it seeks to participate in rising equity markets while mitigating downside risk in declining markets. To achieve this objective, the Fund invests in a broadly diversified set of large/mid-cap companies that we believe to be profitable, stable, low-risk businesses. The Fund also favors lower beta stocks, which tend to be less sensitive to fluctuations in the overall economy and the stock market. We expect lower beta stocks to produce higher risk-adjusted returns than higher beta stocks over the long term.
For the one year period ended September 30, 2018, the Fund’s Class I returned 18.92% while the Russell 1000® Total Return Index (the “Benchmark”) returned 17.76%. The Fund’s outperformance was driven primarily by stock selection within the health care (1.6%) and consumer staples (0.7%) sectors.
Over the course of the period, the Fund’s largest active positions included sector overweights to utilities (8.0%) and consumer staples (7.6%); the portfolio was underweight energy (-5.6%) and information technology (-5.4%).
AVERAGE ANNUAL TOTAL RETURNS AS OF 9/30/2018 AQR LARGE CAP DEFENSIVE STYLE FUND | ||||||||||||||||||||
1 Year | 3 Year | 5 Year | Since | Date of | ||||||||||||||||
Fund - Class I: AUEIX | 18.92% | 17.06% | 15.31% | 15.89% | 7/9/2012 | |||||||||||||||
Fund - Class N: AUENX | 18.58% | 16.76% | 15.03% | 15.60% | 7/9/2012 | |||||||||||||||
Fund - Class R6: QUERX | 18.99% | 17.16% | N/A | 14.70% | 9/2/2014 | |||||||||||||||
Russell 1000® Index Total Return | 17.76% | |||||||||||||||||||
Past performance does not guarantee future results. Investment results and principal value of an investment will fluctuate so that an investor’s shares, when redeemed, may be worth more or less than their original cost. Current performance may be lower or higher than the performance data quoted. As of the latest prospectus, the gross expense ratio for the Fund’s Class I/N/R6 shares are 0.42%, 0.68% and 0.33%, respectively. Call 1-866-290-2688 or visit www.aqrfunds.com for current month-end performance.
| AQR Funds | Annual Report | September 2018 | ||||||||||||||
32
Table of Contents
Shareholder Letter (Unaudited)
| AQR LARGE CAP DEFENSIVE STYLE FUND |
AQR LARGE CAP DEFENSIVE STYLE FUND VS. RUSSELL 1000® INDEX TOTAL RETURN VALUE OF $10,000 INVESTED ON 7/9/2012 |
The chart above represents historical performance of a hypothetical investment of $10,000 in the Fund over the past ten years (or since inception if shorter). Performance data quoted represents past performance and does not guarantee future results. Returns shown are total returns, which assume the reinvestment of dividends and capital gains. The table and graph presented above do not reflect the deduction of taxes a shareholder would pay on fund distributions or the redemption of fund shares.
| AQR Funds | Annual Report | September 2018 | ||||||||||||||
33
Table of Contents
Shareholder Letter (Unaudited)
| AQR INTERNATIONAL DEFENSIVE STYLE FUND |
Michele Aghassi
Principal
Andrea Frazzini
Principal
Jacques Friedman
Principal
Dear Shareholder:
The AQR International Defensive Style Fund (the “Fund”) pursues a defensive strategy in developed markets outside of the U.S., meaning it seeks to participate in rising equity markets while mitigating downside risk in declining markets. To achieve this objective, the Fund invests in a broadly diversified set of large/mid-cap companies that we believe to be profitable, stable, low-risk businesses. The Fund also favors lower beta stocks, which tend to be less sensitive to fluctuations in the overall economy and the stock market. We expect lower beta stocks to produce higher risk-adjusted returns than higher beta stocks over the long term.
For the one year period ended September 30, 2018, the Fund’s Class I returned 3.15% while the MSCI Daily TR Net World Ex USA Index (the “Benchmark”) returned 2.67%. The Fund’s outperformance was driven primarily by stock selection within the financials (0.8%) and consumer staples (0.7%) sectors.
Over the course of the period, the Fund’s largest active positions included sector overweights to consumer staples (8.1%) and utilities (6.5%); the portfolio was underweight financials (-9.9%) and energy (-3.3%). Notable active positions also included a country overweight to Japan (7.2%) and Canada (3.6%) and an underweight to the United Kingdom (-5.1%) and Germany (-4.5%).
AVERAGE ANNUAL TOTAL RETURNS AS OF 9/30/2018 AQR INTERNATIONAL DEFENSIVE STYLE FUND | ||||||||||||||||||||
1 Year | 3 Year | 5 Year | Since | Date of | ||||||||||||||||
Fund - Class I: ANDIX | 3.15% | 9.01% | 5.17% | 7.21% | 7/9/2012 | |||||||||||||||
Fund - Class N: ANDNX | 2.90% | �� | 8.75% | 4.89% | 6.94% | 7/9/2012 | ||||||||||||||
Fund - Class R6: ANDRX | 3.32% | 9.14% | N/A | 3.51% | 9/2/2014 | |||||||||||||||
MSCI Daily TR Net World Ex USA Index** | 2.67% | |||||||||||||||||||
Past performance does not guarantee future results. Investment results and principal value of an investment will fluctuate so that an investor’s shares, when redeemed, may be worth more or less than their original cost. Current performance may be lower or higher than the performance data quoted. As of the latest prospectus, the gross expense ratio for the Fund’s Class I/N/R6 shares are 0.68%, 0.93% and 0.58%, respectively. Call 1-866-290-2688 or visit www.aqrfunds.com for current month-end performance.
| AQR Funds | Annual Report | September 2018 | ||||||||||||||
34
Table of Contents
Shareholder Letter (Unaudited)
| AQR INTERNATIONAL DEFENSIVE STYLE FUND |
AQR INTERNATIONAL DEFENSIVE STYLE FUND VS. MSCI DAILY TR NET WORLD EX USA INDEX** VALUE OF $10,000 INVESTED ON 7/9/2012 |
The chart above represents historical performance of a hypothetical investment of $10,000 in the Fund over the past ten years (or since inception if shorter). Performance data quoted represents past performance and does not guarantee future results. Returns shown are total returns, which assume the reinvestment of dividends and capital gains. The table and graph presented above do not reflect the deduction of taxes a shareholder would pay on fund distributions or the redemption of fund shares.
| ** | MSCI makes no express or implied warranties or representations and shall have no liability whatsoever with respect to any MSCI data contained herein. The MSCI data may not be further redistributed or used as a basis for other indices or any securities or financial products. This report is not approved, reviewed, or produced by MSCI. |
| AQR Funds | Annual Report | September 2018 | ||||||||||||||
35
Table of Contents
Shareholder Letter (Unaudited)
| AQR EMERGING DEFENSIVE STYLE FUND |
Michele Aghassi
Principal
Andrea Frazzini
Principal
Jacques Friedman
Principal
Dear Shareholder:
The AQR Emerging Defensive Style Fund (the “Fund”) pursues a defensive strategy in emerging markets, meaning it seeks to participate in rising equity markets while mitigating downside risk in declining markets. To achieve this objective, the Fund invests in a broadly diversified set of large/midcap companies that we believe to be profitable, stable, low-risk businesses. The Fund also favors lower beta stocks, which tend to be less sensitive to fluctuations in the overall economy and the stock market. We expect lower beta stocks to produce higher risk-adjusted returns than higher beta stocks over the long term.
For the one year period ended September 30, 2018, the Fund’s Class I returned 3.77% while the MSCI Daily TR Net Emerging Markets Index (the “Benchmark”) returned -0.81%. The Fund’s outperformance was driven primarily by stock selection within the consumer discretionary (1.6%) and financials (1.4%) sectors.
Over the course of the period, the Fund’s largest active positions included sector overweights to consumer staples (11%) and telecommunication services (6%); the portfolio was underweight information technology (-16%) and materials (-5%). Notable active positions also included a country overweight to Malaysia (6%) and Thailand (5%) and an underweight to China (-13%) and Russia (-3%).
AVERAGE ANNUAL TOTAL RETURNS AS OF 9/30/2018 AQR EMERGING DEFENSIVE STYLE FUND | ||||||||||||||||||||
1 Year | 3 Year | 5 Year | Since | Date of | ||||||||||||||||
Fund - Class I: AZEIX | 3.77% | 7.85% | 0.60% | 1.09% | 7/9/2012 | |||||||||||||||
Fund - Class N: AZENX | 3.39% | 7.57% | 0.38% | 0.86% | 7/9/2012 | |||||||||||||||
Fund - Class R6: AZERX | 3.76% | 7.90% | N/A | -1.42% | 9/2/2014 | |||||||||||||||
MSCI Daily TR Net Emerging Markets Index** | -0.81% | |||||||||||||||||||
Past performance does not guarantee future results. Investment results and principal value of an investment will fluctuate so that an investor’s shares, when redeemed, may be worth more or less than their original cost. Current performance may be lower or higher than the performance data quoted. As of the latest prospectus, the gross expense ratio for the Fund’s Class I/N/R6 shares are 1.08%, 1.29% and 0.98%, respectively. Call 1-866-290-2688 or visit www.aqrfunds.com for current month-end performance.
| AQR Funds | Annual Report | September 2018 | ||||||||||||||
36
Table of Contents
Shareholder Letter (Unaudited)
| AQR EMERGING DEFENSIVE STYLE FUND |
AQR EMERGING DEFENSIVE STYLE FUND VS. MSCI DAILY TR NET EMERGING MARKETS INDEX** VALUE OF $10,000 INVESTED ON 7/9/2012 |
The chart above represents historical performance of a hypothetical investment of $10,000 in the Fund over the past ten years (or since inception if shorter). Performance data quoted represents past performance and does not guarantee future results. Returns shown are total returns, which assume the reinvestment of dividends and capital gains. The table and graph presented above do not reflect the deduction of taxes a shareholder would pay on fund distributions or the redemption of fund shares.
| ** | MSCI makes no express or implied warranties or representations and shall have no liability whatsoever with respect to any MSCI data contained herein. The MSCI data may not be further redistributed or used as a basis for other indices or any securities or financial products. This report is not approved, reviewed, or produced by MSCI. |
| AQR Funds | Annual Report | September 2018 | ||||||||||||||
37
Table of Contents
Shareholder Letter (Unaudited)
| AQR GLOBAL EQUITY FUND |
Cliff Asness
Managing & Founding Principal

John Liew
Founding Principal
Jacques Friedman
Principal
Ronen Israel
Principal

Michael Katz
Principal

Oktay Kurbanov
Principal
Dear Shareholder:
The AQR Global Equity Fund (the “Fund”) is actively managed, and it seeks to outperform its benchmark in three ways: by selecting stocks within each country and by using futures and forwards contracts to over-and under-weight countries and currencies relative to the benchmark.
For the one year period ended September 30, 2018, the Fund’s Class I returned 7.65% while the MSCI Daily TR Net World Index (the “Benchmark”) returned 11.24%. The portfolio’s underperformance was driven primarily by country selection (-1.9%) and stock selection (-1.4%), with currency selection partially offsetting losses (0.6%).
Specifically within the stock selection strategy, compositional differences between the portfolio and the benchmark (-1.8%) contributed most to negative performance, with the main drivers being within the information technology (-1.6%) and consumer discretionary (-0.6%) sectors. This was partially offset by positive performance within the energy sector (0.4%). Losses in country selection were driven by underweight positions in the U.S. and Australia and an overweight position in Italy, while an overweight position in Japan partially offset losses. Within currency selection, gains were primarily driven by underweight positions in the Swedish krona and euro, with an overweight position in the Australian dollar partially offsetting gains.
Over the course of the period, the Fund’s largest active positions within the stock selection strategy included overweights to the information technology (2.7%) and materials (2.3%) sectors; the portfolio was underweight consumer staples (-3.7%) and financials (-3.6%). Our largest average overweight positions in country selection were in Japan and Hong Kong, while our largest underweight positions were in Australia and the U.S. Within currency selection, our largest average overweight positions were in the Japanese yen and Canadian dollar, while our largest underweights were in the Swiss franc and Swedish krona.
AVERAGE ANNUAL TOTAL RETURNS AS OF 9/30/2018 AQR GLOBAL EQUITY FUND PERFORMANCE SINCE COMMENCEMENT OF OPERATIONS AS A MUTUAL FUND | ||||||||||||||||||||
1 Year | 3 Year | 5 Year | Since | Date of | ||||||||||||||||
Fund - Class I: AQGIX | 7.65% | 13.09% | 9.68% | 10.32% | 12/31/2009 | |||||||||||||||
Fund - Class N: AQGNX | 7.36% | 12.81% | 9.41% | 10.02% | 12/31/2009 | |||||||||||||||
Fund - Class R6: AQGRX | 7.74% | 13.21% | N/A | 8.53% | 1/8/2014 | |||||||||||||||
MSCI Daily TR Net World Index** | 11.24% | |||||||||||||||||||
Past performance does not guarantee future results. Investment results and principal value of an investment will fluctuate so that an investor’s shares, when redeemed, may be worth more or less than their original cost. Current performance may be lower or higher than the performance data quoted. As of the latest prospectus, the gross expense ratio for the Fund’s Class I/N/R6 shares are 0.90%, 1.15% and 0.78%, respectively. Call 1-866-290-2688 or visit www.aqrfunds.com for current month-end performance.
| AQR Funds | Annual Report | September 2018 | ||||||||||||||
38
Table of Contents
Shareholder Letter (Unaudited)
| AQR GLOBAL EQUITY FUND |
AQR GLOBAL EQUITY FUND VS. MSCI DAILY TR NET WORLD INDEX** VALUE OF $10,000 INVESTED ON 12/31/2009 |
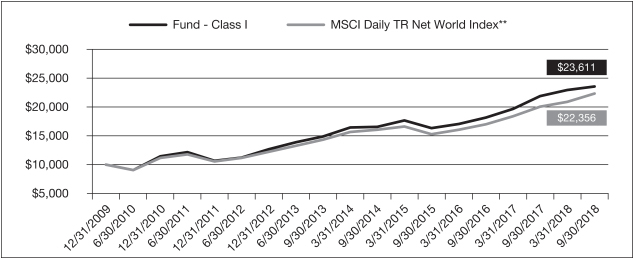
The chart above represents historical performance of a hypothetical investment of $10,000 in the Fund over the past ten years (or since inception if shorter). Performance data quoted represents past performance and does not guarantee future results. Returns shown are total returns, which assume the reinvestment of dividends and capital gains. The table and graph presented above do not reflect the deduction of taxes a shareholder would pay on fund distributions or the redemption of fund shares.
AVERAGE ANNUAL TOTAL RETURNS AS OF 9/30/2018 AQR GLOBAL EQUITY FUND PERFORMANCE SINCE INCEPTION OF PREDECESSOR LIMITED PARTNERSHIP | ||||||||||||||||||||||||
| 1 Year | 3 Year | 5 Year | 10 Year | Since Inception | Date of Inception | |||||||||||||||||||
| Fund - Class I: AQGIX | 7.65% | 13.09% | 9.68% | 9.36% | 6.34% | 6/30/2006 | ||||||||||||||||||
| Fund - Class N: AQGNX | 7.36% | 12.81% | 9.41% | 9.06% | 6.03% | 6/30/2006 | ||||||||||||||||||
| Fund - Class R6: AQGRX | 7.74% | 13.21% | N/A | N/A | 8.53% | 1/08/2014 | ||||||||||||||||||
| MSCI Daily TR Net World Index** | 11.24% | |||||||||||||||||||||||
Past performance does not guarantee future results. Investment results and principal value of an investment will fluctuate so that an investor’s shares, when redeemed, may be worth more or less than their original cost. Current performance may be lower or higher than the performance data quoted. As of the latest prospectus, the gross expense ratio for the Fund’s Class I/N/R6 shares are 0.90%, 1.15% and 0.78, respectively. Call 1-866-290-2688 or visit www.aqrfunds.com for current month-end performance.
| AQR Funds | Annual Report | September 2018 | ||||||||||||||
39
Table of Contents
Shareholder Letter (Unaudited)
| AQR GLOBAL EQUITY FUND |
AQR GLOBAL EQUITY FUND VS. MSCI DAILY TR NET WORLD INDEX** VALUE OF $10,000 INVESTED ON 6/30/2006 |
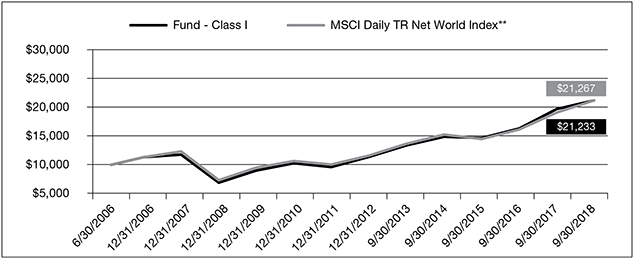
The chart above represents historical performance of a hypothetical investment of $10,000 in the Fund over the past ten years (or since inception if shorter). Performance data quoted represents past performance and does not guarantee future results. Returns shown are total returns, which assume the reinvestment of dividends and capital gains. The table and graph presented above do not reflect the deduction of taxes a shareholder would pay on fund distributions or the redemption of fund shares.
| ** | MSCI makes no express or implied warranties or representations and shall have no liability whatsoever with respect to any MSCI data contained herein. The MSCI data may not be further redistributed or used as a basis for other indices or any securities or financial products. This report is not approved, reviewed, or produced by MSCI. |
| AQR Funds | Annual Report | September 2018 | ||||||||||||||
40
Table of Contents
Shareholder Letter (Unaudited)
| AQR INTERNATIONAL EQUITY FUND |
Cliff Asness
Managing & Founding Principal
John Liew
Founding Principal
Jacques Friedman
Principal
Ronen Israel
Principal
Michael Katz
Principal
Oktay Kurbanov
Principal
Dear Shareholder:
The AQR International Equity Fund (the “Fund”) is actively managed, and it seeks to outperform its benchmark in three ways: by selecting stocks within each country and by using futures and forwards contracts to over-and under-weight countries and currencies relative to the benchmark.
For the one year period ended September 30, 2018, the Fund’s Class I returned -1.24% while the MSCI Daily TR Net EAFE Index (the “Benchmark”) returned 2.74%. The portfolio’s underperformance was driven primarily by stock selection (-3.3%), with country selection also slightly detracting (-0.1%). Losses were partially offset by currency selection (0.5%).
Specifically within the stock selection strategy, compositional differences between the portfolio and the benchmark (-3.2%) contributed most to negative performance, with the main drivers being within the information technology (-1.4%) and industrials (-1.0%) sectors. Small losses in country selection were driven by overweight positions in Italy and Germany, while gains from an overweight in Japan and an underweight in Switzerland mostly offset losses. Positive performance in currency selection was driven by an underweight in the euro and an overweight in the Japanese yen, while losses from an underweight in the British pound and an overweight in the Australian dollar partially offset gains.
Over the course of the period, the Fund’s largest active positions within the stock selection strategy included overweights to the materials (3.5%) and information technology (2.9%) sectors; the portfolio was underweight financials (-4.4%) and consumer staples (-3.8%). Our largest average overweight positions in country selection were in Japan and Hong Kong, while our largest underweight positions were in the U.K. and Switzerland. Within currency selection, our largest average overweight positions were in the Japanese yen and U.S. dollar, while our largest underweights were in the euro and Swiss franc.
AVERAGE ANNUAL TOTAL RETURNS AS OF 9/30/2018 AQR INTERNATIONAL EQUITY FUND PERFORMANCE SINCE COMMENCEMENT OF OPERATIONS AS A MUTUAL FUND | ||||||||||||||||||||
1 Year | 3 Year | 5 Year | Since | Date of | ||||||||||||||||
Fund - Class I: AQIIX | -1.24% | 9.01% | 4.56% | 6.13% | 9/29/2009 | |||||||||||||||
Fund - Class N: AQINX | -1.41% | 8.76% | 4.30% | 5.84% | 9/29/2009 | |||||||||||||||
Fund - Class R6: AQIRX | -1.23% | 9.11% | N/A | 3.67% | 1/8/2014 | |||||||||||||||
MSCI Daily TR Net EAFE Index** | 2.74% | |||||||||||||||||||
Past performance does not guarantee future results. Investment results and principal value of an investment will fluctuate so that an investor’s shares, when redeemed, may be worth more or less than their original cost. Current performance may be lower or higher than the performance data quoted. As of the latest prospectus, the gross expense ratio for the Fund’s Class I/N/R6 shares are 0.94%, 1.20% and 0.81%, respectively. Call 1-866-290-2688 or visit www.aqrfunds.com for current month-end performance.
| AQR Funds | Annual Report | September 2018 | ||||||||||||||
41
Table of Contents
Shareholder Letter (Unaudited)
| AQR INTERNATIONAL EQUITY FUND |
AQR INTERNATIONAL EQUITY FUND VS. MSCI DAILY TR NET EAFE INDEX** VALUE OF $10,000 INVESTED ON 9/29/2009 |
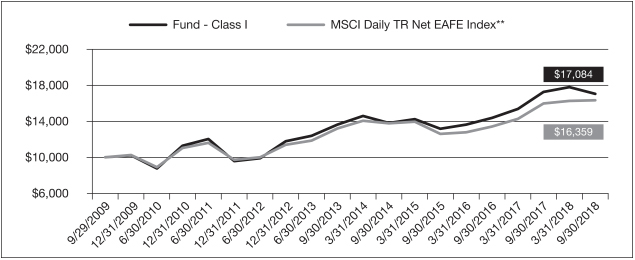
The chart above represents historical performance of a hypothetical investment of $10,000 in the Fund over the past ten years (or since inception if shorter). Performance data quoted represents past performance and does not guarantee future results. Returns shown are total returns, which assume the reinvestment of dividends and capital gains. The table and graph presented above do not reflect the deduction of taxes a shareholder would pay on fund distributions or the redemption of fund shares.
AVERAGE ANNUAL TOTAL RETURNS AS OF 9/30/2018 AQR INTERNATIONAL EQUITY FUND PERFORMANCE SINCE INCEPTION OF PREDECESSOR LIMITED PARTNERSHIP | ||||||||||||||||||||||||
| 1 Year | 3 Year | 5 Year | 10 Year | Since Inception | Date of Inception | |||||||||||||||||||
| Fund - Class I: AQIIX | -1.24% | 9.01% | 4.56% | 6.27% | 6.10% | 7/31/2004 | ||||||||||||||||||
| Fund - Class N: AQINX | -1.41% | 8.76% | 4.30% | 5.98% | 5.78% | 7/31/2004 | ||||||||||||||||||
| Fund - Class R6: AQIRX | -1.23% | 9.11% | N/A | N/A | 3.67% | 1/08/2014 | ||||||||||||||||||
| MSCI Daily TR Net EAFE Index** | 2.74% | |||||||||||||||||||||||
Past performance does not guarantee future results. Investment results and principal value of an investment will fluctuate so that an investor’s shares, when redeemed, may be worth more or less than their original cost. Current performance may be lower or higher than the performance data quoted. As of the latest prospectus, the gross expense ratio for the Fund’s Class I/N/R6 shares are 0.94%, 1.20% and 0.81%, respectively. Call 1-866-290-2688 or visit www.aqrfunds.com for current month-end performance.
| AQR Funds | Annual Report | September 2018 | ||||||||||||||
42
Table of Contents
Shareholder Letter (Unaudited)
| AQR INTERNATIONAL EQUITY FUND |
AQR INTERNATIONAL EQUITY FUND VS. MSCI DAILY TR NET EAFE INDEX** VALUE OF $10,000 INVESTED ON 7/31/2004 |
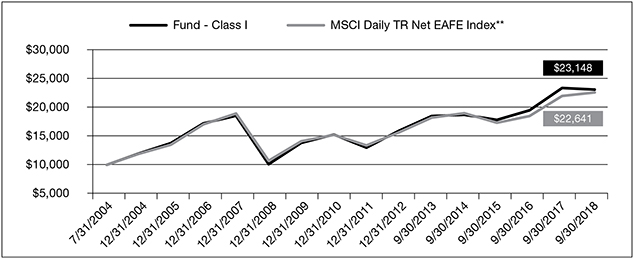
The chart above represents historical performance of a hypothetical investment of $10,000 in the Fund over the past ten years (or since inception if shorter). Performance data quoted represents past performance and does not guarantee future results. Returns shown are total returns, which assume the reinvestment of dividends and capital gains. The table and graph presented above do not reflect the deduction of taxes a shareholder would pay on fund distributions or the redemption of fund shares.
| ** | MSCI makes no express or implied warranties or representations and shall have no liability whatsoever with respect to any MSCI data contained herein. The MSCI data may not be further redistributed or used as a basis for other indices or any securities or financial products. This report is not approved, reviewed, or produced by MSCI. |
| AQR Funds | Annual Report | September 2018 | ||||||||||||||
43
Table of Contents
Shareholder Letter (Unaudited)
| AQR LARGE CAP RELAXED CONSTRAINT EQUITY FUND |
Michele Aghassi
Principal
Andrea Frazzini
Principal
Jacques Friedman
Principal
Dear Shareholder:
Using a systematic, multi-factor investment research process, the AQR Large Cap Relaxed Constraint Equity Fund (the “Fund”) develops a ranking of every stock in the investable universe. Based on these rankings, the Fund over- and underweights securities, industries, and sectors relative to its benchmark index. “Relaxed Constraint” reflects the Fund’s ability to take long and short positions in the equity securities in which it invests. The Fund generally intends to target a long exposure of 130% of the Fund’s net assets with a short exposure of 30% of the Fund’s net assets. Actual long and short exposures, however, will vary according to market conditions. The Fund’s long exposures are expected to range between 120% and 140% of the Fund’s net assets. The Fund’s short exposures are expected to range between 20% and 40% of the Fund’s net assets.
Selling securities short allows the Fund to reflect to a greater extent, compared to a long-only approach, the Fund’s views on securities it expects to underperform. Reinvesting the short sale proceeds allows the Fund to take additional long positions, increasing the portfolio’s exposure to securities the Manager expects to outperform.
For the one year period ended September 30, 2018, the Fund’s Class I returned 11.95% while the Russell 1000® Total Return Index (the “Benchmark”) returned 17.76%. The Fund’s underperformance was driven primarily by stock selection within the information technology (-2.8%) and consumer discretionary (-1.5%) sectors.
Over the course of the period, the Fund’s largest active positions included sector overweights to information technology (4.9%) and industrials (3.3%), while the portfolio was underweight consumer staples (-4.1%) and energy (-2.4%).
AVERAGE ANNUAL TOTAL RETURNS AS OF 9/30/2018 AQR LARGE CAP RELAXED CONSTRAINT EQUITY FUND | ||||||||||||
| 1 Year | Since | Date of | ||||||||||
Fund - Class I: QLRIX | 11.95% | 14.00% | 12/14/2016 | |||||||||
Fund - Class N: QLRNX | 11.72% | 13.70% | 12/14/2016 | |||||||||
Fund - Class R6: QLRRX | 12.09% | 14.08% | 12/14/2016 | |||||||||
Russell 1000® Index Total Return | 17.76% | |||||||||||
Past performance does not guarantee future results. Investment results and principal value of an investment will fluctuate so that an investor’s shares, when redeemed, may be worth more or less than their original cost. Current performance may be lower or higher than the performance data quoted. As of the latest prospectus, the gross expense ratio for the Fund’s Class I/N/R6 shares are 2.70%, 4.23% and 3.95%, respectively. Call 1-866-290-2688 or visit www.aqrfunds.com for current month-end performance.
| AQR Funds | Annual Report | September 2018 | ||||||||||||||
44
Table of Contents
Shareholder Letter (Unaudited)
| AQR LARGE CAP RELAXED CONSTRAINT EQUITY FUND |
AQR LARGE CAP RELAXED CONSTRAINT EQUITY FUND VS. RUSSELL 1000® TR INDEX VALUE OF $10,000 INVESTED ON 12/14/2016 |

The chart above represents historical performance of a hypothetical investment of $10,000 in the Fund over the past ten years (or since inception if shorter). Performance data quoted represents past performance and does not guarantee future results. Returns shown are total returns, which assume the reinvestment of dividends and capital gains. The table and graph presented above do not reflect the deduction of taxes a shareholder would pay on fund distributions or the redemption of fund shares.
| AQR Funds | Annual Report | September 2018 | ||||||||||||||
45
Table of Contents
Shareholder Letter (Unaudited)
| AQR SMALL CAP RELAXED CONSTRAINT EQUITY FUND |
Michele Aghassi
Principal
Andrea Frazzini
Principal
Jacques Friedman
Principal
Dear Shareholder:
Using a systematic, multi-factor investment research process, the AQR Small Cap Relaxed Constraint Equity Fund (the “Fund”) develops a ranking of every stock in the investable universe. Based on these rankings, the Fund over- and underweights securities, industries, and sectors relative to its benchmark index. “Relaxed Constraint” reflects the Fund’s ability to take long and short positions in the equity securities in which it invests. The Fund generally intends to target a long exposure of 130% of the Fund’s net assets with a short exposure of 30% of the Fund’s net assets. Actual long and short exposures, however, will vary according to market conditions. The Fund’s long exposures are expected to range between 120% and 140% of the Fund’s net assets. The Fund’s short exposures are expected to range between 20% and 40% of the Fund’s net assets.
Selling securities short allows the Fund to reflect to a greater extent, compared to a long-only approach, the Fund’s views on securities it expects to underperform. Reinvesting the short sale proceeds allows the Fund to take additional long positions, increasing the portfolio’s exposure to securities the Manager expects to outperform.
For the one year period ended September 30, 2018, Fund’s Class I returned 2.86% while the Russell 2000® Total Return Index (the “Benchmark”) returned 15.24%. The Fund’s underperformance was driven primarily by stock selection within the information technology (-4.3%), industrials (-2.7%) and consumer discretionary (-1.8%) sectors, and was partially offset by positive performance within energy (0.4%).
Over the course of the period, the Fund’s largest active positions included sector overweights to information technology (4.8%) and industrials (4.1%); the portfolio was underweight real estate (-4.7%) and health care (-3.0%).
AVERAGE ANNUAL TOTAL RETURNS AS OF 9/30/2018 AQR SMALL CAP RELAXED CONSTRAINT EQUITY FUND | ||||||||||||
| 1 Year | Since | Date of | ||||||||||
Fund - Class I: QSRIX | 2.86% | 3.55% | 12/14/2016 | |||||||||
Fund - Class N: QSRNX | 2.70% | 3.30% | 12/14/2016 | |||||||||
Fund - Class R6: QSRRX | 3.04% | 3.65% | 12/14/2016 | |||||||||
Russell 2000® Total Return Index | 15.24% | |||||||||||
Past performance does not guarantee future results. Investment results and principal value of an investment will fluctuate so that an investor’s shares, when redeemed, may be worth more or less than their original cost. Current performance may be lower or higher than the performance data quoted. As of the latest prospectus, the gross expense ratio for the Fund’s Class I/N/R6 shares are 6.63%, 6.83% and 6.54%, respectively. Call 1-866-290-2688 or visit www.aqrfunds.com for current month-end performance.
| AQR Funds | Annual Report | September 2018 | ||||||||||||||
46
Table of Contents
Shareholder Letter (Unaudited)
| AQR SMALL CAP RELAXED CONSTRAINT EQUITY FUND |
AQR SMALL CAP RELAXED CONSTRAINT EQUITY FUND VS. RUSSELL 2000® INDEX VALUE OF $10,000 INVESTED ON 12/14/2016 |
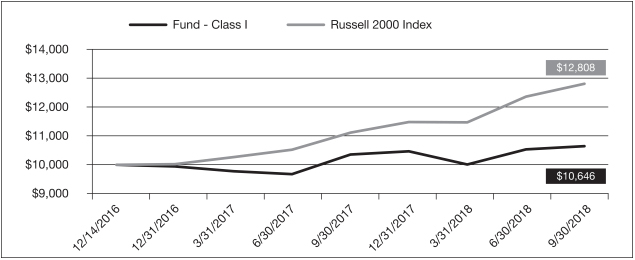
The chart above represents historical performance of a hypothetical investment of $10,000 in the Fund over the past ten years (or since inception if shorter). Performance data quoted represents past performance and does not guarantee future results. Returns shown are total returns, which assume the reinvestment of dividends and capital gains. The table and graph presented above do not reflect the deduction of taxes a shareholder would pay on fund distributions or the redemption of fund shares.
| AQR Funds | Annual Report | September 2018 | ||||||||||||||
47
Table of Contents
Shareholder Letter (Unaudited)
| AQR INTERNATIONAL RELAXED CONSTRAINT EQUITY FUND |
Michele Aghassi
Principal
Andrea Frazzini
Principal
Jacques Friedman
Principal
Dear Shareholder:
Using a systematic, multi-factor investment research process, the AQR International Relaxed Constraint Equity Fund (the “Fund”) develops a ranking of every stock in the investable universe. Based on these rankings, the Fund over- and underweights securities, industries, and sectors relative to its benchmark index. “Relaxed Constraint” reflects the Fund’s ability to take long and short positions in the equity securities in which it invests. The Fund generally intends to target a long exposure of 130% of the Fund’s net assets with a short exposure of 30% of the Fund’s net assets. Actual long and short exposures, however, will vary according to market conditions. The Fund’s long exposures are expected to range between 120% and 140% of the Fund’s net assets. The Fund’s short exposures are expected to range between 20% and 40% of the Fund’s net assets.
Selling securities short allows the Fund to reflect to a greater extent, compared to a long-only approach, the Fund’s views on securities it expects to underperform. Reinvesting the short sale proceeds allows the Fund to take additional long positions, increasing the portfolio’s exposure to securities the Manager expects to outperform.
For the one year period ended September 30, 2018, the Fund’s Class I returned -3.45% while the MSCI Daily TR Net World Ex USA Index (the “Benchmark”) returned 2.74%. The Fund’s underperformance was driven primarily by stock selection within the information technology (-2.1%), industrials (-1.8%), and consumer discretionary (-1.2%) sectors, but was partially offset by positive performance within consumer staples (0.4%).
Over the course of the period, the Fund’s largest active positions included sector overweights to the information technology (5.2%) and materials (2.8%) sectors; the portfolio was underweight financials (-5.2%) and consumer staples (-4.5%). Notable active positions also included a country overweights to Finland (0.6%), and an underweights to Japan (-0.6%) and Australia (-0.6%).
AVERAGE ANNUAL TOTAL RETURNS AS OF 9/30/2018 AQR INTERNATIONAL RELAXED CONSTRAINT EQUITY FUND | ||||||||||||
| 1 Year | Since | Date of | ||||||||||
Fund - Class I: QIRIX | -3.45% | 12.33% | 12/14/2016 | |||||||||
Fund - Class N: QIRNX | -3.68% | 12.03% | 12/14/2016 | |||||||||
Fund - Class R6: QIRRX | -3.42% | 12.39% | 12/14/2016 | |||||||||
MSCI Daily TR Net EAFE Index** | 2.74% | |||||||||||
Past performance does not guarantee future results. Investment results and principal value of an investment will fluctuate so that an investor’s shares, when redeemed, may be worth more or less than their original cost. Current performance may be lower or higher than the performance data quoted. As of the latest prospectus, the gross expense ratio for the Fund’s Class I/N/R6 shares are 3.83%, 4.21% and 4.20%, respectively. Call 1-866-290-2688 or visit www.aqrfunds.com for current month-end performance.
| AQR Funds | Annual Report | September 2018 | ||||||||||||||
48
Table of Contents
Shareholder Letter (Unaudited)
| AQR INTERNATIONAL RELAXED CONSTRAINT EQUITY FUND |
AQR INTERNATIONAL RELAXED CONSTRAINT EQUITY FUND VS. MSCI EAFE INDEX VALUE OF $10,000 INVESTED ON 12/14/2016 |
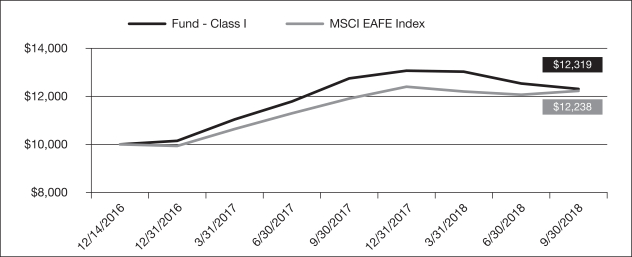
The chart above represents historical performance of a hypothetical investment of $10,000 in the Fund over the past ten years (or since inception if shorter). Performance data quoted represents past performance and does not guarantee future results. Returns shown are total returns, which assume the reinvestment of dividends and capital gains. The table and graph presented above do not reflect the deduction of taxes a shareholder would pay on fund distributions or the redemption of fund shares.
| ** | MSCI makes no express or implied warranties or representations and shall have no liability whatsoever with respect to any MSCI data contained herein. The MSCI data may not be further redistributed or used as a basis for other indices or any securities or financial products. This report is not approved, reviewed, or produced by MSCI. |
| AQR Funds | Annual Report | September 2018 | ||||||||||||||
49
Table of Contents
Shareholder Letter (Unaudited)
| AQR EMERGING RELAXED CONSTRAINT EQUITY FUND |
Michele Aghassi
Principal
Andrea Frazzini
Principal
Jacques Friedman
Principal
Dear Shareholder:
Using a systematic, multi-factor investment research process, the AQR Emerging Relaxed Constraint Equity Fund (the “Fund”) develops a ranking of every stock in the investable universe. Based on these rankings, the Fund over- and underweights securities, industries, and sectors relative to its benchmark index. “Relaxed Constraint” reflects the Fund’s ability to take long and short positions in the equity securities in which it invests. The Fund generally intends to target a long exposure of 130% of the Fund’s net assets with a short exposure of 30% of the Fund’s net assets. Actual long and short exposures, however, will vary according to market conditions. The Fund’s long exposures are expected to range between 120% and 140% of the Fund’s net assets. The Fund’s short exposures are expected to range between 20% and 40% of the Fund’s net assets.
Selling securities short allows the Fund to reflect to a greater extent, compared to a long-only approach, the Fund’s views on securities it expects to underperform. Reinvesting the short sale proceeds allows the Fund to take additional long positions, increasing the portfolio’s exposure to securities the Manager expects to outperform.
For the one year period ended September 30, 2018, the Fund’s Class I returned -1.30% while the MSCI Daily TR Net Emerging Markets Index (the “Benchmark”) returned -0.81%. The Fund’s underperformance was driven primarily by stock selection within the information technology (-2.8%) and materials (-1.5%), and healthcare (-1.0%) sectors. The Fund’s performance was positively impacted by positioning across sectors.
Over the course of the period, the Fund’s largest active positions included sector overweights to information technology (6.5%) and materials (4.7%); the portfolio was underweight consumer staples (-5.9%) and utilities (-3.9%).
AVERAGE ANNUAL TOTAL RETURNS AS OF 9/30/2018 AQR EMERGING RELAXED CONSTRAINT EQUITY FUND | ||||||||||||
| 1 Year | Since | Date of | ||||||||||
| Fund - Class I: QERIX | -1.30% | 13.37% | 12/14/2016 | |||||||||
| Fund - Class N: QERNX | -1.52%* | 13.08% | 12/14/2016 | |||||||||
| Fund - Class R6: QERRX | -1.25% | 13.45% | 12/14/2016 | |||||||||
| MSCI Daily TR Net Emerging Market Index** | -0.81% | |||||||||||
Past performance does not guarantee future results. Investment results and principal value of an investment will fluctuate so that an investor’s shares, when redeemed, may be worth more or less than their original cost. Current performance may be lower or higher than the performance data quoted. As of the latest prospectus, the gross expense ratio for the Fund’s Class I/N/R6 shares are 3.89%, 4.23% and 3.73%, respectively. Call 1-866-290-2688 or visit www.aqrfunds.com for current month-end performance.
| AQR Funds | Annual Report | September 2018 | ||||||||||||||
50
Table of Contents
Shareholder Letter (Unaudited)
| AQR EMERGING RELAXED CONSTRAINT EQUITY FUND |
AQR EMERGING RELAXED CONSTRAINT EQUITY FUND VS. MSCI EMERGING MARKETS INDEX VALUE OF $10,000 INVESTED ON 12/14/2016 |
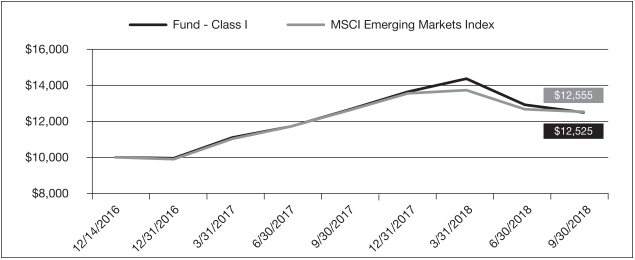
The chart above represents historical performance of a hypothetical investment of $10,000 in the Fund over the past ten years (or since inception if shorter). Performance data quoted represents past performance and does not guarantee future results. Returns shown are total returns, which assume the reinvestment of dividends and capital gains. The table and graph presented above do not reflect the deduction of taxes a shareholder would pay on fund distributions or the redemption of fund shares.
| * | Total return information is based on net asset values calculated for shareholder transactions. Certain adjustments were made to the net assets of the Fund at 9/30/2018 for financial reporting purposes, and as a result, the net asset values for shareholder transactions and the total returns based on those net asset values differ from the adjusted net asset values and total returns for financial reporting. |
| ** | MSCI makes no express or implied warranties or representations and shall have no liability whatsoever with respect to any MSCI data contained herein. The MSCI data may not be further redistributed or used as a basis for other indices or any securities or financial products. This report is not approved, reviewed, or produced by MSCI. |
| AQR Funds | Annual Report | September 2018 | ||||||||||||||
51
Table of Contents
| Schedule of Investments | September 30, 2018 |
| AQR LARGE CAP MULTI-STYLE FUND |
| INVESTMENTS | SHARES | VALUE | ||||||
| COMMON STOCKS - 97.0% | ||||||||
| Aerospace & Defense - 5.4% | ||||||||
| Boeing Co. (The) | 58,282 | $ | 21,675,076 | |||||
| Curtiss-Wright Corp. | 31,732 | 4,360,611 | ||||||
| General Dynamics Corp. | 41,024 | 8,398,433 | ||||||
| Hexcel Corp. | 12,576 | 843,221 | ||||||
| Huntington Ingalls Industries, Inc. | 71,000 | 18,181,680 | ||||||
| L3 Technologies, Inc. | 13,444 | 2,858,463 | ||||||
| Raytheon Co. | 120,660 | 24,935,596 | ||||||
| Spirit AeroSystems Holdings, Inc., Class A | 167,960 | 15,396,893 | ||||||
| Teledyne Technologies, Inc. * | 22,116 | 5,455,575 | ||||||
| Textron, Inc. | 46,291 | 3,308,418 | ||||||
|
| |||||||
| 105,413,966 | ||||||||
|
| |||||||
| Air Freight & Logistics - 1.6% | ||||||||
| CH Robinson Worldwide, Inc. | 11,145 | 1,091,318 | ||||||
| Expeditors International of Washington, Inc. | 57,508 | 4,228,563 | ||||||
| FedEx Corp. | 110,745 | 26,666,289 | ||||||
|
| |||||||
| 31,986,170 | ||||||||
|
| |||||||
| Airlines - 0.3% | ||||||||
| JetBlue Airways Corp. * | 263,227 | 5,096,075 | ||||||
|
| |||||||
| Auto Components - 0.4% | ||||||||
| Lear Corp. | 49,671 | 7,202,295 | ||||||
|
| |||||||
| Banks - 6.1% | ||||||||
| Bank of America Corp. | 275,216 | 8,107,863 | ||||||
| BB&T Corp. | 18,632 | 904,397 | ||||||
| Citigroup, Inc. | 172,695 | 12,389,139 | ||||||
| Fifth Third Bancorp | 110,423 | 3,083,010 | ||||||
| JPMorgan Chase & Co. | 360,812 | 40,714,026 | ||||||
| PNC Financial Services Group, Inc. (The) | 93,068 | 12,674,931 | ||||||
| Popular, Inc. | 11,051 | 566,364 | ||||||
| SunTrust Banks, Inc. | 218,159 | 14,570,840 | ||||||
| TCF Financial Corp. | 128,864 | 3,068,252 | ||||||
| US Bancorp | 221,818 | 11,714,209 | ||||||
| Wells Fargo & Co. | 223,191 | 11,730,919 | ||||||
|
| |||||||
| 119,523,950 | ||||||||
|
| |||||||
| Biotechnology - 3.1% | ||||||||
| AbbVie, Inc. | 108,283 | 10,241,406 | ||||||
| Amgen, Inc. | 34,578 | 7,167,674 | ||||||
| Biogen, Inc. * | 51,990 | 18,368,587 | ||||||
| Celgene Corp. * | 22,588 | 2,021,400 | ||||||
| Exelixis, Inc. * | 144,352 | 2,557,917 | ||||||
| Gilead Sciences, Inc. | 150,082 | 11,587,831 | ||||||
| United Therapeutics Corp. * | 68,652 | 8,779,218 | ||||||
|
| |||||||
| 60,724,033 | ||||||||
|
| |||||||
| Capital Markets - 1.5% | ||||||||
| Ameriprise Financial, Inc. | 65,205 | 9,628,170 | ||||||
| Bank of New York Mellon Corp. (The) | 31,477 | 1,605,012 | ||||||
| CME Group, Inc. | 49,046 | 8,348,120 | ||||||
| Federated Investors, Inc., Class B | 33,060 | 797,407 | ||||||
| MSCI, Inc. | 11,103 | 1,969,783 | ||||||
| State Street Corp. | 6,942 | 581,601 | ||||||
| T. Rowe Price Group, Inc. | 64,789 | 7,073,663 | ||||||
|
| |||||||
| 30,003,756 | ||||||||
|
| |||||||
| INVESTMENTS | SHARES | VALUE | ||||||
| Chemicals - 3.1% | ||||||||
| Eastman Chemical Co. | 144,755 | $ | 13,855,949 | |||||
| Huntsman Corp. | 510,732 | 13,907,232 | ||||||
| LyondellBasell Industries NV, Class A | 267,435 | 27,414,762 | ||||||
| Westlake Chemical Corp. | 72,469 | 6,022,898 | ||||||
|
| |||||||
| 61,200,841 | ||||||||
|
| |||||||
| Commercial Services & Supplies - 0.6% | ||||||||
| Cintas Corp. | 2,867 | 567,121 | ||||||
| Copart, Inc. * | 22,310 | 1,149,634 | ||||||
| Rollins, Inc. | 16,121 | 978,384 | ||||||
| Waste Management, Inc. | 108,604 | 9,813,458 | ||||||
|
| |||||||
| 12,508,597 | ||||||||
|
| |||||||
| Communications Equipment - 1.5% | ||||||||
| Cisco Systems, Inc. | 459,123 | 22,336,334 | ||||||
| F5 Networks, Inc. * | 29,407 | 5,864,344 | ||||||
|
| |||||||
| 28,200,678 | ||||||||
|
| |||||||
| Consumer Finance - 0.2% | ||||||||
| Credit Acceptance Corp. *(a) | 6,587 | 2,885,567 | ||||||
| Santander Consumer USA Holdings, Inc. | 27,371 | 548,515 | ||||||
|
| |||||||
| 3,434,082 | ||||||||
|
| |||||||
| Distributors - 0.1% | ||||||||
| LKQ Corp. * | 30,523 | 966,663 | ||||||
|
| |||||||
| Diversified Consumer Services - 0.0% (b) | ||||||||
| Graham Holdings Co., Class B | 1,454 | 842,302 | ||||||
|
| |||||||
| Diversified Financial Services - 1.5% | ||||||||
| Berkshire Hathaway, Inc., Class B * | 132,888 | 28,452,650 | ||||||
|
| |||||||
| Diversified Telecommunication Services - 0.4% | ||||||||
| Verizon Communications, Inc. | 145,642 | 7,775,826 | ||||||
|
| |||||||
| Electric Utilities - 1.8% | ||||||||
| Evergy, Inc. | 24,878 | 1,366,300 | ||||||
| Exelon Corp. | 729,990 | 31,871,363 | ||||||
| Pinnacle West Capital Corp. | 31,411 | 2,487,123 | ||||||
|
| |||||||
| 35,724,786 | ||||||||
|
| |||||||
| Electrical Equipment - 0.3% | ||||||||
| Eaton Corp. plc | 73,118 | 6,341,524 | ||||||
|
| |||||||
| Electronic Equipment, Instruments & Components - 0.5% | ||||||||
| Arrow Electronics, Inc. * | 29,777 | 2,195,160 | ||||||
| Coherent, Inc. * | 11,135 | 1,917,336 | ||||||
| FLIR Systems, Inc. | 63,575 | 3,907,955 | ||||||
| Jabil, Inc. | 38,131 | 1,032,588 | ||||||
| Zebra Technologies Corp., Class A * | 5,677 | 1,003,864 | ||||||
|
| |||||||
| 10,056,903 | ||||||||
|
| |||||||
| Entertainment - 1.6% | ||||||||
| Activision Blizzard, Inc. | 107,418 | 8,936,103 | ||||||
| Electronic Arts, Inc. * | 4,775 | 575,340 | ||||||
| Twenty-First Century Fox, Inc., Class A | 75,076 | 3,478,271 | ||||||
| Viacom, Inc., Class B | 447,527 | 15,108,511 | ||||||
| Walt Disney Co. (The) | 11,322 | 1,323,995 | ||||||
| Zynga, Inc., Class A * | 237,600 | 952,776 | ||||||
|
| |||||||
| 30,374,996 | ||||||||
|
| |||||||
| The accompanying notes are an integral part of these financial statements. | (Continued) |
| AQR Funds | Annual Report | September 2018 | ||||||||||||||
52
Table of Contents
| Schedule of Investments | September 30, 2018 |
| AQR LARGE CAP MULTI-STYLE FUND |
| INVESTMENTS | SHARES | VALUE | ||||||
| Food & Staples Retailing - 1.2% | ||||||||
| Kroger Co. (The) | 195,441 | $ | 5,689,288 | |||||
| Walmart, Inc. | 192,807 | 18,106,505 | ||||||
|
| |||||||
| 23,795,793 | ||||||||
|
| |||||||
| Food Products - 1.5% | ||||||||
| Archer-Daniels-Midland Co. | 137,573 | 6,915,795 | ||||||
| Ingredion, Inc. | 44,031 | 4,621,494 | ||||||
| Pilgrim’s Pride Corp. * | 253,693 | 4,589,306 | ||||||
| Tyson Foods, Inc., Class A | 203,658 | 12,123,761 | ||||||
|
| |||||||
| 28,250,356 | ||||||||
|
| |||||||
| Health Care Equipment & Supplies - 2.3% | ||||||||
| Abbott Laboratories | 82,953 | 6,085,432 | ||||||
| Align Technology, Inc. * | 3,658 | 1,431,083 | ||||||
| Baxter International, Inc. | 153,476 | 11,831,465 | ||||||
| Danaher Corp. | 147,142 | 15,988,450 | ||||||
| Medtronic plc | 88,396 | 8,695,514 | ||||||
| Varian Medical Systems, Inc. * | 5,314 | 594,796 | ||||||
|
| |||||||
| 44,626,740 | ||||||||
|
| |||||||
| Health Care Providers & Services - 3.5% | ||||||||
| Aetna, Inc. | 23,243 | 4,714,843 | ||||||
| Anthem, Inc. | 17,042 | 4,670,360 | ||||||
| Cigna Corp. | 98,500 | 20,512,625 | ||||||
| Express Scripts Holding Co. * | 42,995 | 4,084,955 | ||||||
| Humana, Inc. | 54,741 | 18,530,923 | ||||||
| UnitedHealth Group, Inc. | 6,051 | 1,609,808 | ||||||
| WellCare Health Plans, Inc. * | 42,633 | 13,663,450 | ||||||
|
| |||||||
| 67,786,964 | ||||||||
|
| |||||||
| Hotels, Restaurants & Leisure - 1.0% | ||||||||
| Carnival Corp. | 41,783 | 2,664,502 | ||||||
| Darden Restaurants, Inc. | 105,950 | 11,780,581 | ||||||
| Las Vegas Sands Corp. | 57,348 | 3,402,457 | ||||||
| Wyndham Hotels & Resorts, Inc. | 14,811 | 823,047 | ||||||
|
| |||||||
| 18,670,587 | ||||||||
|
| |||||||
| Household Durables - 0.3% | ||||||||
| PulteGroup, Inc. | 91,646 | 2,270,071 | ||||||
| Toll Brothers, Inc. | 84,224 | 2,781,919 | ||||||
|
| |||||||
| 5,051,990 | ||||||||
|
| |||||||
| Independent Power and Renewable Electricity Producers - 0.1% | ||||||||
| Vistra Energy Corp. * | 45,975 | 1,143,858 | ||||||
|
| |||||||
| Industrial Conglomerates - 0.1% | ||||||||
| Honeywell International, Inc. | 10,768 | 1,791,795 | ||||||
|
| |||||||
| Insurance - 4.9% | ||||||||
| Aflac, Inc. | 175,965 | 8,282,673 | ||||||
| Allstate Corp. (The) | 239,582 | 23,646,743 | ||||||
| American Financial Group, Inc. | 78,029 | 8,658,878 | ||||||
| Assured Guaranty Ltd. | 166,204 | 7,018,795 | ||||||
| Athene Holding Ltd., Class A * | 67,934 | 3,509,470 | ||||||
| CNA Financial Corp. | 19,946 | 910,535 | ||||||
| Everest Re Group Ltd. | 44,816 | 10,239,112 | ||||||
| Fidelity National Financial, Inc. | 22,608 | 889,625 | ||||||
| First American Financial Corp. | 91,556 | 4,723,374 | ||||||
| Old Republic International Corp. | 105,071 | 2,351,489 | ||||||
| Prudential Financial, Inc. | 37,544 | 3,803,958 | ||||||
| Reinsurance Group of America, Inc. | 54,703 | 7,907,866 | ||||||
| Travelers Cos., Inc. (The) | 101,413 | 13,154,280 | ||||||
|
| |||||||
| 95,096,798 | ||||||||
|
| |||||||
| INVESTMENTS | SHARES | VALUE | ||||||
| Interactive Media & Services - 5.4% | ||||||||
| Alphabet, Inc., Class A * | 29,042 | $ | 35,056,017 | |||||
| Alphabet, Inc., Class C * | 20,887 | 24,928,008 | ||||||
| Facebook, Inc., Class A * | 194,548 | 31,995,364 | ||||||
| IAC/InterActiveCorp * | 40,066 | 8,683,104 | ||||||
| Match Group, Inc. *(a) | 87,095 | 5,043,671 | ||||||
|
| |||||||
| 105,706,164 | ||||||||
|
| |||||||
| Internet & Direct Marketing Retail - 3.8% | ||||||||
| Amazon.com, Inc. * | 24,309 | 48,690,927 | ||||||
| Booking Holdings, Inc. * | 4,743 | 9,410,112 | ||||||
| eBay, Inc. * | 181,859 | 6,004,984 | ||||||
| Netflix, Inc. * | 21,144 | 7,910,605 | ||||||
| Qurate Retail, Inc. * | 46,579 | 1,034,520 | ||||||
|
| |||||||
| 73,051,148 | ||||||||
|
| |||||||
| IT Services - 4.3% | ||||||||
| Accenture plc, Class A | 54,344 | 9,249,349 | ||||||
| Akamai Technologies, Inc. * | 158,296 | 11,579,353 | ||||||
| Amdocs Ltd. | 23,355 | 1,540,963 | ||||||
| Booz Allen Hamilton Holding Corp. | 79,748 | 3,957,893 | ||||||
| Broadridge Financial Solutions, Inc. | 9,439 | 1,245,476 | ||||||
| Cognizant Technology Solutions Corp., Class A | 130,114 | 10,038,295 | ||||||
| CoreLogic, Inc. * | 12,137 | 599,689 | ||||||
| DXC Technology Co. | 156,881 | 14,671,511 | ||||||
| International Business Machines Corp. | 130,997 | 19,808,056 | ||||||
| Total System Services, Inc. | 58,776 | 5,803,542 | ||||||
| VeriSign, Inc. * | 15,405 | 2,466,649 | ||||||
| Visa, Inc., Class A | 19,652 | 2,949,569 | ||||||
|
| |||||||
| 83,910,345 | ||||||||
|
| |||||||
| Life Sciences Tools & Services - 1.2% | ||||||||
| Bio-Techne Corp. | 4,988 | 1,018,101 | ||||||
| Charles River Laboratories International, Inc. * | 34,207 | 4,602,210 | ||||||
| IQVIA Holdings, Inc. * | 12,803 | 1,661,061 | ||||||
| Thermo Fisher Scientific, Inc. | 61,593 | 15,033,619 | ||||||
|
| |||||||
| 22,314,991 | ||||||||
|
| |||||||
| Machinery - 1.0% | ||||||||
| Allison Transmission Holdings, Inc. | 72,855 | 3,789,188 | ||||||
| Cummins, Inc. | 17,141 | 2,503,786 | ||||||
| ITT, Inc. | 15,712 | 962,517 | ||||||
| Oshkosh Corp. | 85,049 | 6,058,891 | ||||||
| Snap-on, Inc. | 5,928 | 1,088,381 | ||||||
| Terex Corp. | 103,996 | 4,150,480 | ||||||
| Trinity Industries, Inc. | 24,673 | 904,019 | ||||||
|
| |||||||
| 19,457,262 | ||||||||
|
| |||||||
| Media - 0.1% | ||||||||
| John Wiley & Sons, Inc., Class A | 33,392 | 2,023,555 | ||||||
|
| |||||||
| Metals & Mining - 0.2% | ||||||||
| Reliance Steel & Aluminum Co. | 34,803 | 2,968,348 | ||||||
| Steel Dynamics, Inc. | 34,465 | 1,557,473 | ||||||
|
| |||||||
| 4,525,821 | ||||||||
|
| |||||||
| Multiline Retail - 2.3% | ||||||||
| Kohl’s Corp. | 184,154 | 13,728,681 | ||||||
| Macy’s, Inc. | 222,595 | 7,730,724 | ||||||
| The accompanying notes are an integral part of these financial statements. | (Continued) |
| AQR Funds | Annual Report | September 2018 | ||||||||||||||
53
Table of Contents
| Schedule of Investments | September 30, 2018 |
| AQR LARGE CAP MULTI-STYLE FUND |
| INVESTMENTS | SHARES | VALUE | ||||||
| Multiline Retail - 2.3% (continued) | ||||||||
| Target Corp. | 262,210 | $ | 23,129,544 | |||||
|
| |||||||
| 44,588,949 | ||||||||
|
| |||||||
| Multi-Utilities - 1.8% | ||||||||
| Ameren Corp. | 210,073 | 13,280,815 | ||||||
| Consolidated Edison, Inc. | 222,068 | 16,919,361 | ||||||
| DTE Energy Co. | 10,304 | 1,124,476 | ||||||
| Public Service Enterprise Group, Inc. | 80,361 | 4,242,257 | ||||||
|
| |||||||
| 35,566,909 | ||||||||
|
| |||||||
| Oil, Gas & Consumable Fuels - 3.9% | ||||||||
| ConocoPhillips | 131,294 | 10,162,155 | ||||||
| Energen Corp. * | 12,509 | 1,077,900 | ||||||
| HollyFrontier Corp. | 336,124 | 23,495,068 | ||||||
| Marathon Petroleum Corp. | 100,743 | 8,056,418 | ||||||
| PBF Energy, Inc., Class A | 307,278 | 15,336,245 | ||||||
| Pioneer Natural Resources Co. | 10,426 | 1,816,105 | ||||||
| Valero Energy Corp. | 146,881 | 16,707,714 | ||||||
|
| |||||||
| 76,651,605 | ||||||||
|
| |||||||
| Personal Products - 0.2% | ||||||||
| Estee Lauder Cos., Inc. (The), Class A | 16,214 | 2,356,219 | ||||||
| Nu Skin Enterprises, Inc., Class A | 10,808 | 890,795 | ||||||
|
| |||||||
| 3,247,014 | ||||||||
|
| |||||||
| Pharmaceuticals - 2.8% | ||||||||
| Johnson & Johnson | 122,504 | 16,926,378 | ||||||
| Merck & Co., Inc. | 72,131 | 5,116,973 | ||||||
| Mylan NV * | 133,412 | 4,882,879 | ||||||
| Nektar Therapeutics * | 14,967 | 912,388 | ||||||
| Pfizer, Inc. | 513,384 | 22,624,833 | ||||||
| Zoetis, Inc. | 34,871 | 3,192,789 | ||||||
|
| |||||||
| 53,656,240 | ||||||||
|
| |||||||
| Professional Services - 0.6% | ||||||||
| ManpowerGroup, Inc. | 12,396 | 1,065,560 | ||||||
| Robert Half International, Inc. | 163,439 | 11,502,837 | ||||||
|
| |||||||
| 12,568,397 | ||||||||
|
| |||||||
| Road & Rail - 0.9% | ||||||||
| Landstar System, Inc. | 15,599 | 1,903,078 | ||||||
| Norfolk Southern Corp. | 21,482 | 3,877,501 | ||||||
| Old Dominion Freight Line, Inc. | 12,620 | 2,035,101 | ||||||
| Union Pacific Corp. | 62,167 | 10,122,653 | ||||||
|
| |||||||
| 17,938,333 | ||||||||
|
| |||||||
| Semiconductors & Semiconductor Equipment - 5.9% | ||||||||
| Applied Materials, Inc. | 59,780 | 2,310,497 | ||||||
| Broadcom, Inc. | 13,016 | 3,211,438 | ||||||
| First Solar, Inc. * | 35,816 | 1,734,211 | ||||||
| Intel Corp. | 810,082 | 38,308,778 | ||||||
| Lam Research Corp. | 83,636 | 12,687,581 | ||||||
| Micron Technology, Inc. * | 658,397 | 29,779,296 | ||||||
| NVIDIA Corp. | 14,717 | 4,135,771 | ||||||
| ON Semiconductor Corp. * | 102,964 | 1,897,627 | ||||||
| Skyworks Solutions, Inc. | 81,816 | 7,421,529 | ||||||
| Texas Instruments, Inc. | 117,113 | 12,565,054 | ||||||
|
| |||||||
| 114,051,782 | ||||||||
|
| |||||||
| INVESTMENTS | SHARES | VALUE | ||||||
| Software - 6.2% | ||||||||
| Adobe Systems, Inc. * | 60,961 | $ | 16,456,422 | |||||
| CA, Inc. | 48,627 | 2,146,882 | ||||||
| Cadence Design Systems, Inc. * | 49,743 | 2,254,353 | ||||||
| Dell Technologies, Inc., Class V * | 6,849 | 665,175 | ||||||
| Fortinet, Inc. * | 65,903 | 6,080,870 | ||||||
| Intuit, Inc. | 3,570 | 811,818 | ||||||
| Manhattan Associates, Inc. * | 50,181 | 2,739,882 | ||||||
| Microsoft Corp. | 593,591 | 67,889,003 | ||||||
| Oracle Corp. | 243,396 | 12,549,498 | ||||||
| Paycom Software, Inc. * | 7,086 | 1,101,235 | ||||||
| VMware, Inc., Class A * | 44,520 | 6,947,791 | ||||||
|
| |||||||
| 119,642,929 | ||||||||
|
| |||||||
| Specialty Retail - 2.8% | ||||||||
| AutoNation, Inc. * | 21,381 | 888,381 | ||||||
| Best Buy Co., Inc. | 237,902 | 18,879,903 | ||||||
| Dick’s Sporting Goods, Inc. | 63,727 | 2,261,034 | ||||||
| Foot Locker, Inc. | 122,948 | 6,267,889 | ||||||
| Gap, Inc. (The) | 125,133 | 3,610,087 | ||||||
| Home Depot, Inc. (The) | 24,149 | 5,002,465 | ||||||
| Ross Stores, Inc. | 11,025 | 1,092,578 | ||||||
| TJX Cos., Inc. (The) | 18,736 | 2,098,807 | ||||||
| Urban Outfitters, Inc. * | 123,438 | 5,048,614 | ||||||
| Williams-Sonoma, Inc. (a) | 150,952 | 9,920,565 | ||||||
|
| |||||||
| 55,070,323 | ||||||||
|
| |||||||
| Technology Hardware, Storage & Peripherals - 4.0% | ||||||||
| Apple, Inc. | 312,385 | 70,517,790 | ||||||
| HP, Inc. | 134,661 | 3,470,214 | ||||||
| Western Digital Corp. | 73,850 | 4,323,179 | ||||||
|
| |||||||
| 78,311,183 | ||||||||
|
| |||||||
| Textiles, Apparel & Luxury Goods - 2.9% | ||||||||
| Carter’s, Inc. | 10,715 | 1,056,499 | ||||||
| Lululemon Athletica, Inc. * | 46,536 | 7,561,635 | ||||||
| Michael Kors Holdings Ltd. * | 287,557 | 19,714,908 | ||||||
| NIKE, Inc., Class B | 164,074 | 13,900,349 | ||||||
| Ralph Lauren Corp. | 45,613 | 6,274,068 | ||||||
| Skechers U.S.A., Inc., Class A * | 301,763 | 8,428,241 | ||||||
|
| |||||||
| 56,935,700 | ||||||||
|
| |||||||
| Thrifts & Mortgage Finance - 0.0% (b) | ||||||||
| New York Community Bancorp, Inc. (a) | 31,509 | 326,748 | ||||||
|
| |||||||
| Tobacco - 0.8% | ||||||||
| Altria Group, Inc. | 127,125 | 7,666,909 | ||||||
| Philip Morris International, Inc. | 100,862 | 8,224,287 | ||||||
|
| |||||||
| 15,891,196 | ||||||||
|
| |||||||
| Trading Companies & Distributors - 1.0% | ||||||||
| Air Lease Corp. | 106,559 | 4,888,927 | ||||||
| United Rentals, Inc. * | 46,764 | 7,650,591 | ||||||
| WW Grainger, Inc. | 17,154 | 6,131,011 | ||||||
|
| |||||||
| 18,670,529 | ||||||||
|
| |||||||
| Transportation Infrastructure - 0.0% (b) | ||||||||
| Macquarie Infrastructure Corp. (a) | 14,016 | 646,558 | ||||||
|
| |||||||
TOTAL COMMON STOCKS | 1,886,798,655 | |||||||
|
| |||||||
| The accompanying notes are an integral part of these financial statements. | (Continued) |
| AQR Funds | Annual Report | September 2018 | ||||||||||||||
54
Table of Contents
| Schedule of Investments | September 30, 2018 |
| AQR LARGE CAP MULTI-STYLE FUND |
| INVESTMENTS | SHARES | VALUE | ||||||
| SHORT-TERM INVESTMENTS - 0.2% | ||||||||
| INVESTMENT COMPANIES - 0.2% | ||||||||
| Limited Purpose Cash Investment Fund, 2.06% (c) | ||||||||
(Cost $4,632,220) | 4,632,684 | $ | 4,632,220 | |||||
|
| |||||||
| SECURITIES LENDING COLLATERAL - 0.6% | ||||||||
| Investment Companies - 0.6% | ||||||||
| Investments in a Pooled Account through Securities Lending Program with Citibank NA | ||||||||
| BlackRock Liquidity Funds T-Fund Portfolio, Institutional Shares 1.97% (c)(d) | 1,378,633 | 1,378,633 | ||||||
| Limited Purpose Cash Investment Fund 2.06% (c)(d) | 9,892,516 | 9,891,527 | ||||||
|
| |||||||
TOTAL SECURITIES LENDING COLLATERAL | 11,270,160 | |||||||
|
| |||||||
TOTAL INVESTMENTS IN SECURITIES AT VALUE - 97.8% | 1,902,701,035 | |||||||
|
| |||||||
| OTHER ASSETS IN EXCESS OF LIABILITIES - 2.2% (e) | 42,273,566 | |||||||
|
| |||||||
NET ASSETS - 100.0% |
| $ | 1,944,974,601 | |||||
|
| |||||||
| SECTOR | VALUE | % OF NET ASSETS | ||||||
| Communication Services | $ | 145,880,542 | 7.5 | % | ||||
| Consumer Discretionary | 262,379,956 | 13.5 | ||||||
| Consumer Staples | 71,184,359 | 3.7 | ||||||
| Energy | 76,651,605 | 3.9 | ||||||
| Financials | 276,837,984 | 14.2 | ||||||
| Health Care | 249,108,968 | 12.8 | ||||||
| Industrials | 232,419,206 | 12.0 | ||||||
| Information Technology | 434,173,819 | 22.3 | ||||||
| Materials | 65,726,663 | 3.4 | ||||||
| Utilities | 72,435,553 | 3.7 | ||||||
| Short-Term Investments | 4,632,220 | 0.2 | ||||||
| Securities Lending Collateral | 11,270,160 | 0.6 | ||||||
|
|
|
| |||||
Total Investments In Securities | 1,902,701,035 | 97.8 | ||||||
| Other Assets in Excess of Liabilities (e) | 42,273,566 | 2.2 | ||||||
|
|
|
| |||||
Net Assets | $ | 1,944,974,601 | 100.0 | % | ||||
|
|
|
| |||||
All securities are United States companies, unless noted otherwise in parentheses.
| * | Non-income producing security. |
| (a) | The security or a portion of this security is on loan at September 30, 2018. The total value of securities on loan at September 30, 2018 was $11,002,002. |
| (b) | Represents less than 0.05% of net assets. |
| (c) | Represents 7-day effective yield as of September 30, 2018. |
| (d) | Represents security, or portion thereof, purchased with the cash collateral received for securities on loan. |
| (e) | Includes appreciation/(depreciation) on futures contracts. |
All securities are Level 1 with respect to ASC 820 (See Note 4).
Futures contracts outstanding as of September 30, 2018:
Exchange Traded
| DESCRIPTION | NUMBER OF CONTRACTS | EXPIRATION DATE | TRADING CURRENCY | NOTIONAL AMOUNT | VALUE AND UNREALIZED APPRECIATION (DEPRECIATION) | |||||||||||
| Long Contracts | ||||||||||||||||
| S&P 500 E-Mini Index | 266 | 12/2018 | USD | $38,822,700 | $(124,860 | ) | ||||||||||
|
| |||||||||||||||
| $(124,860 | ) | |||||||||||||||
|
| |||||||||||||||
USD - United States Dollar
Collateral pledged to, or (received from), each counterparty at September 30, 2018 was as follows:
| COUNTERPARTY | OVER THE COUNTER | EXCHANGE TRADED | TOTAL | |||||||||
| GSCO | ||||||||||||
| Cash | $ | — | $ | 1,868,826 | $ | 1,868,826 | ||||||
| ||||||||||||
| The accompanying notes are an integral part of these financial statements. |
| AQR Funds | Annual Report | September 2018 | ||||||||||||||
55
Table of Contents
| Schedule of Investments | September 30, 2018 |
| AQR SMALL CAP MULTI-STYLE FUND |
| INVESTMENTS | SHARES | VALUE | ||||||
| COMMON STOCKS - 97.0% |
| |||||||
| Aerospace & Defense - 1.5% | ||||||||
| AAR Corp. | 7,851 | $ | 375,984 | |||||
| Aerovironment, Inc. * | 5,828 | 653,727 | ||||||
| Axon Enterprise, Inc. * | 41,171 | 2,817,332 | ||||||
| Ducommun, Inc. * | 7,005 | 286,084 | ||||||
| Esterline Technologies Corp. * | 20,229 | 1,839,828 | ||||||
| KLX, Inc. * | 16,030 | 1,006,363 | ||||||
| Moog, Inc., Class A | 17,130 | 1,472,666 | ||||||
| National Presto Industries, Inc. (a) | 7,871 | 1,020,475 | ||||||
| Vectrus, Inc. * | 58,602 | 1,827,796 | ||||||
|
| |||||||
| 11,300,255 | ||||||||
|
| |||||||
| Air Freight & Logistics - 1.3% | ||||||||
| Air Transport Services Group, Inc. *(a) | 32,738 | 702,885 | ||||||
| Atlas Air Worldwide Holdings, Inc. * | 50,338 | 3,209,048 | ||||||
| Echo Global Logistics, Inc. * | 20,313 | 628,687 | ||||||
| Forward Air Corp. | 14,316 | 1,026,457 | ||||||
| Hub Group, Inc., Class A * | 86,242 | 3,932,635 | ||||||
|
| |||||||
| 9,499,712 | ||||||||
|
| |||||||
| Airlines - 0.5% | ||||||||
| Allegiant Travel Co. | 5,157 | 653,908 | ||||||
| Hawaiian Holdings, Inc. | 18,265 | 732,426 | ||||||
| SkyWest, Inc. | 18,911 | 1,113,858 | ||||||
| Spirit Airlines, Inc. * | 22,895 | 1,075,378 | ||||||
|
| |||||||
| 3,575,570 | ||||||||
|
| |||||||
| Auto Components - 1.2% | ||||||||
| American Axle & Manufacturing Holdings, Inc. * | 104,451 | 1,821,625 | ||||||
| Cooper-Standard Holdings, Inc. * | 32,635 | 3,915,547 | ||||||
| Dana, Inc. | 32,901 | 614,262 | ||||||
| Stoneridge, Inc. * | 32,847 | 976,213 | ||||||
| Tenneco, Inc. | 9,308 | 392,239 | ||||||
| Tower International, Inc. | 44,568 | 1,348,182 | ||||||
|
| |||||||
| 9,068,068 | ||||||||
|
| |||||||
| Automobiles - 0.1% | ||||||||
| Winnebago Industries, Inc. | 21,124 | 700,261 | ||||||
|
| |||||||
| Banks - 6.8% | ||||||||
| 1st Source Corp. | 11,573 | 608,971 | ||||||
| Ameris Bancorp | 7,397 | 338,043 | ||||||
| BancFirst Corp. | 7,570 | 453,822 | ||||||
| BancorpSouth Bank | 11,896 | 388,999 | ||||||
| Berkshire Hills Bancorp, Inc. | 12,708 | 517,216 | ||||||
| Brookline Bancorp, Inc. | 63,300 | 1,057,110 | ||||||
| Cadence Bancorp | 61,610 | 1,609,253 | ||||||
| Cathay General Bancorp | 91,943 | 3,810,118 | ||||||
| CenterState Bank Corp. | 12,429 | 348,634 | ||||||
| Chemical Financial Corp. | 6,395 | 341,493 | ||||||
| City Holding Co. | 4,496 | 345,293 | ||||||
| Columbia Banking System, Inc. | 11,281 | 437,364 | ||||||
| Community Trust Bancorp, Inc. | 7,559 | 350,360 | ||||||
| Customers Bancorp, Inc. * | 25,088 | 590,321 | ||||||
| Eagle Bancorp, Inc. * | 26,466 | 1,339,180 | ||||||
| Enterprise Financial Services Corp. | 23,785 | 1,261,794 | ||||||
| FCB Financial Holdings, Inc., Class A * | 5,256 | 249,134 | ||||||
| Fidelity Southern Corp. | 34,506 | 855,059 | ||||||
| First Bancorp/PR * | 26,022 | 236,800 | ||||||
| INVESTMENTS | SHARES | VALUE | ||||||
| Banks - 6.8% (continued) | ||||||||
| First Busey Corp. | 8,773 | $ | 272,402 | |||||
| First Commonwealth Financial Corp. | 13,247 | 213,807 | ||||||
| First Financial Bancorp | 30,642 | 910,067 | ||||||
| First Interstate BancSystem, Inc., Class A | 57,513 | 2,576,582 | ||||||
| First Merchants Corp. | 53,707 | 2,416,278 | ||||||
| First Midwest Bancorp, Inc. | 13,483 | 358,513 | ||||||
| Flushing Financial Corp. | 14,191 | 346,260 | ||||||
| Fulton Financial Corp. | 119,260 | 1,985,679 | ||||||
| Glacier Bancorp, Inc. | 5,511 | 237,469 | ||||||
| Great Southern Bancorp, Inc. | 13,741 | 760,564 | ||||||
| Great Western Bancorp, Inc. | 103,161 | 4,352,363 | ||||||
| Hancock Whitney Corp. | 45,124 | 2,145,646 | ||||||
| Hanmi Financial Corp. | 8,975 | 223,478 | ||||||
| Heartland Financial USA, Inc. | 21,321 | 1,237,684 | ||||||
| Heritage Financial Corp. | 7,292 | 256,314 | ||||||
| Hilltop Holdings, Inc. (a) | 14,902 | 300,573 | ||||||
| Hope Bancorp, Inc. | 24,800 | 401,016 | ||||||
| Independent Bank Corp./MA | 13,463 | 1,112,044 | ||||||
| International Bancshares Corp. | 79,417 | 3,573,765 | ||||||
| LegacyTexas Financial Group, Inc. | 11,526 | 491,008 | ||||||
| Live Oak Bancshares, Inc. | 11,945 | 320,126 | ||||||
| MB Financial, Inc. | 28,531 | 1,315,564 | ||||||
| Midland States Bancorp, Inc. | 7,041 | 226,016 | ||||||
| NBT Bancorp, Inc. | 27,750 | 1,065,045 | ||||||
| OFG Bancorp | 16,345 | 263,972 | ||||||
| Old National Bancorp | 17,158 | 331,149 | ||||||
| Park National Corp. | 3,124 | 329,769 | ||||||
| Preferred Bank | 3,693 | 216,041 | ||||||
| Renasant Corp. | 15,491 | 638,384 | ||||||
| S&T Bancorp, Inc. | 9,317 | 403,985 | ||||||
| Sandy Spring Bancorp, Inc. | 7,575 | 297,773 | ||||||
| ServisFirst Bancshares, Inc. | 56,399 | 2,208,021 | ||||||
| Simmons First National Corp., Class A | 16,606 | 489,047 | ||||||
| Stock Yards Bancorp, Inc. | 6,968 | 252,938 | ||||||
| Tompkins Financial Corp. | 2,852 | 231,554 | ||||||
| TriCo Bancshares | 6,437 | 248,597 | ||||||
| Trustmark Corp. | 25,273 | 850,436 | ||||||
| UMB Financial Corp. | 4,576 | 324,438 | ||||||
| Union Bankshares Corp. | 7,445 | 286,856 | ||||||
| United Community Banks, Inc. | 11,983 | 334,206 | ||||||
| WesBanco, Inc. | 19,752 | 880,544 | ||||||
|
| |||||||
| 50,824,937 | ||||||||
|
| |||||||
| Beverages - 1.5% | ||||||||
| Boston Beer Co., Inc. (The), Class A * | 17,343 | 4,986,113 | ||||||
| Coca-Cola Bottling Co. Consolidated | 3,762 | 685,737 | ||||||
| MGP Ingredients, Inc. (a) | 14,339 | 1,132,494 | ||||||
| National Beverage Corp. *(a) | 35,238 | 4,109,456 | ||||||
|
| |||||||
| 10,913,800 | ||||||||
|
| |||||||
| Biotechnology - 5.3% | ||||||||
| Amicus Therapeutics, Inc. * | 61,340 | 741,601 | ||||||
| Array BioPharma, Inc. * | 62,800 | 954,560 | ||||||
| Arrowhead Pharmaceuticals, Inc. *(a) | 43,928 | 842,100 | ||||||
| BioSpecifics Technologies Corp. * | 12,106 | 708,080 | ||||||
| Calithera Biosciences, Inc. * | 51,502 | 270,385 | ||||||
| CareDx, Inc. * | 19,109 | 551,295 | ||||||
| Clovis Oncology, Inc. * | 15,212 | 446,776 | ||||||
| Concert Pharmaceuticals, Inc. * | 18,280 | 271,275 | ||||||
| The accompanying notes are an integral part of these financial statements. | (Continued) |
| AQR Funds | Annual Report | September 2018 | ||||||||||||||
56
Table of Contents
| Schedule of Investments | September 30, 2018 |
| AQR SMALL CAP MULTI-STYLE FUND |
| INVESTMENTS | SHARES | VALUE | ||||||
| Biotechnology - 5.3% (continued) | ||||||||
| Eagle Pharmaceuticals, Inc. *(a) | 29,225 | $ | 2,026,169 | |||||
| Emergent BioSolutions, Inc. * | 94,830 | 6,242,659 | ||||||
| Enanta Pharmaceuticals, Inc. * | 37,715 | 3,223,124 | ||||||
| FibroGen, Inc. * | 9,259 | 562,484 | ||||||
| Genomic Health, Inc. * | 8,003 | 561,971 | ||||||
| Halozyme Therapeutics, Inc. * | 44,786 | 813,762 | ||||||
| Insmed, Inc. * | 27,807 | 562,257 | ||||||
| Intercept Pharmaceuticals, Inc. * | 6,817 | 861,396 | ||||||
| Ligand Pharmaceuticals, Inc. * | 3,024 | 830,058 | ||||||
| Loxo Oncology, Inc. * | 7,663 | 1,309,070 | ||||||
| Myriad Genetics, Inc. * | 103,172 | 4,745,912 | ||||||
| PDL BioPharma, Inc. *(a) | 1,038,479 | 2,731,200 | ||||||
| Portola Pharmaceuticals, Inc. *(a) | 18,850 | 501,975 | ||||||
| Puma Biotechnology, Inc. * | 10,780 | 494,263 | ||||||
| REGENXBIO, Inc. * | 30,928 | 2,335,064 | ||||||
| Repligen Corp. * | 73,887 | 4,097,773 | ||||||
| Sorrento Therapeutics, Inc. *(a) | 171,014 | 752,462 | ||||||
| Spectrum Pharmaceuticals, Inc. * | 101,792 | 1,710,106 | ||||||
| Versartis, Inc. * | 10,403 | 14,564 | ||||||
|
| |||||||
| 39,162,341 | ||||||||
|
| |||||||
| Building Products - 1.6% | ||||||||
| Apogee Enterprises, Inc. | 48,814 | 2,016,994 | ||||||
| Builders FirstSource, Inc. * | 116,756 | 1,713,978 | ||||||
| Continental Building Products, Inc. * | 10,526 | 395,251 | ||||||
| Insteel Industries, Inc. | 15,774 | 565,971 | ||||||
| NCI Building Systems, Inc. * | 13,360 | 202,404 | ||||||
| Patrick Industries, Inc. * | 48,518 | 2,872,266 | ||||||
| Simpson Manufacturing Co., Inc. | 3,482 | 252,306 | ||||||
| Trex Co., Inc. * | 8,773 | 675,345 | ||||||
| Universal Forest Products, Inc. | 88,732 | 3,134,902 | ||||||
|
| |||||||
| 11,829,417 | ||||||||
|
| |||||||
| Capital Markets - 1.4% | ||||||||
| Artisan Partners Asset Management, Inc., Class A | 26,581 | 861,224 | ||||||
| Blucora, Inc. * | 42,209 | 1,698,912 | ||||||
| BrightSphere Investment Group plc | 21,997 | 272,763 | ||||||
| Cohen & Steers, Inc. (a) | 29,131 | 1,183,010 | ||||||
| Hamilton Lane, Inc., Class A | 7,437 | 329,310 | ||||||
| INTL. FCStone, Inc. * | 5,079 | 245,417 | ||||||
| Stifel Financial Corp. | 39,372 | 2,018,209 | ||||||
| Waddell & Reed Financial, Inc., Class A (a) | 184,182 | 3,900,975 | ||||||
|
| |||||||
| 10,509,820 | ||||||||
|
| |||||||
| Chemicals - 2.0% | ||||||||
| AdvanSix, Inc. * | 48,106 | 1,633,199 | ||||||
| FutureFuel Corp. | 36,196 | 671,074 | ||||||
| Ingevity Corp. * | 16,064 | 1,636,600 | ||||||
| Innospec, Inc. | 12,681 | 973,267 | ||||||
| Kraton Corp. * | 5,566 | 262,437 | ||||||
| Kronos Worldwide, Inc. | 114,558 | 1,861,568 | ||||||
| Rayonier Advanced Materials, Inc. | 29,726 | 547,850 | ||||||
| Stepan Co. | 29,730 | 2,586,807 | ||||||
| Trinseo SA | 63,364 | 4,961,401 | ||||||
|
| |||||||
| 15,134,203 | ||||||||
|
| |||||||
| Commercial Services & Supplies - 1.7% | ||||||||
| ACCO Brands Corp. | 235,794 | 2,664,472 | ||||||
| INVESTMENTS | SHARES | VALUE | ||||||
| Commercial Services & Supplies - 1.7% (continued) | ||||||||
| Deluxe Corp. | 27,178 | $ | 1,547,515 | |||||
| Ennis, Inc. | 66,693 | 1,363,872 | ||||||
| Herman Miller, Inc. | 38,674 | 1,485,082 | ||||||
| HNI Corp. | 12,357 | 546,674 | ||||||
| Interface, Inc. | 44,855 | 1,047,364 | ||||||
| Kimball International, Inc., Class B | 34,022 | 569,868 | ||||||
| McGrath RentCorp | 6,297 | 342,998 | ||||||
| Quad/Graphics, Inc. | 34,415 | 717,209 | ||||||
| Steelcase, Inc., Class A | 70,756 | 1,308,986 | ||||||
| UniFirst Corp. | 3,702 | 642,852 | ||||||
| Viad Corp. | 6,389 | 378,548 | ||||||
|
| |||||||
| 12,615,440 | ||||||||
|
| |||||||
| Communications Equipment - 0.1% | ||||||||
| Oclaro, Inc. * | 65,989 | 589,942 | ||||||
|
| |||||||
| Construction & Engineering - 0.9% | ||||||||
| Comfort Systems USA, Inc. | 13,206 | 744,818 | ||||||
| EMCOR Group, Inc. | 62,566 | 4,699,332 | ||||||
| KBR, Inc. | 28,260 | 597,134 | ||||||
| MYR Group, Inc. * | 8,879 | 289,811 | ||||||
| Primoris Services Corp. | 14,935 | 370,687 | ||||||
|
| |||||||
| 6,701,782 | ||||||||
|
| |||||||
| Construction Materials - 0.1% | ||||||||
| Summit Materials, Inc., Class A * | 30,932 | 562,344 | ||||||
| US Concrete, Inc. *(a) | 5,720 | 262,262 | ||||||
|
| |||||||
| 824,606 | ||||||||
|
| |||||||
| Consumer Finance - 1.7% | ||||||||
| Enova International, Inc. * | 8,411 | 242,237 | ||||||
| EZCORP, Inc., Class A * | 25,904 | 277,173 | ||||||
| FirstCash, Inc. | 37,931 | 3,110,342 | ||||||
| Green Dot Corp., Class A * | 60,704 | 5,391,729 | ||||||
| Nelnet, Inc., Class A | 36,656 | 2,095,623 | ||||||
| Regional Management Corp. * | 14,092 | 406,272 | ||||||
| World Acceptance Corp. * | 10,102 | 1,155,265 | ||||||
|
| |||||||
| 12,678,641 | ||||||||
|
| |||||||
| Distributors - 0.1% | ||||||||
| Core-Mark Holding Co., Inc. | 17,918 | 608,495 | ||||||
|
| |||||||
| Diversified Consumer Services - 1.4% | ||||||||
| Adtalem Global Education, Inc. * | 96,988 | 4,674,822 | ||||||
| American Public Education, Inc. * | 64,730 | 2,139,326 | ||||||
| Career Education Corp. * | 17,579 | 262,454 | ||||||
| K12, Inc. * | 20,082 | 355,451 | ||||||
| Sotheby’s *(a) | 6,266 | 308,225 | ||||||
| Strategic Education, Inc. | 6,224 | 852,875 | ||||||
| Weight Watchers International, Inc. * | 25,442 | 1,831,570 | ||||||
|
| |||||||
| 10,424,723 | ||||||||
|
| |||||||
| Diversified Telecommunication Services - 0.7% | ||||||||
| Iridium Communications, Inc. * | 37,107 | 834,908 | ||||||
| Vonage Holdings Corp. * | 286,651 | 4,058,978 | ||||||
|
| |||||||
| 4,893,886 | ||||||||
|
| |||||||
| Electric Utilities - 0.1% | ||||||||
| Spark Energy, Inc., Class A (a) | 50,973 | 420,527 | ||||||
|
| |||||||
| The accompanying notes are an integral part of these financial statements. | (Continued) |
| AQR Funds | Annual Report | September 2018 | ||||||||||||||
57
Table of Contents
| Schedule of Investments | September 30, 2018 |
| AQR SMALL CAP MULTI-STYLE FUND |
| INVESTMENTS | SHARES | VALUE | ||||||
| Electrical Equipment - 1.7% | ||||||||
| Allied Motion Technologies, Inc. | 9,346 | $ | 508,703 | |||||
| Atkore International Group, Inc. * | 43,247 | 1,147,343 | ||||||
| Encore Wire Corp. | 14,600 | 731,460 | ||||||
| EnerSys | 8,464 | 737,468 | ||||||
| Enphase Energy, Inc. *(a) | 406,050 | 1,969,342 | ||||||
| Generac Holdings, Inc. * | 49,532 | 2,794,100 | ||||||
| Sunrun, Inc. *(a) | 181,224 | 2,254,427 | ||||||
| TPI Composites, Inc. * | 86,658 | 2,474,086 | ||||||
|
| |||||||
| 12,616,929 | ||||||||
|
| |||||||
| Electronic Equipment, Instruments & Components - 1.9% | ||||||||
| AVX Corp. | 22,976 | 414,717 | ||||||
| CTS Corp. | 9,383 | 321,837 | ||||||
| Electro Scientific Industries, Inc. * | 175,133 | 3,056,071 | ||||||
| ePlus, Inc. * | 21,751 | 2,016,318 | ||||||
| Fabrinet (Thailand) * | 5,635 | 260,675 | ||||||
| Insight Enterprises, Inc. * | 11,885 | 642,860 | ||||||
| KEMET Corp. * | 63,066 | 1,169,874 | ||||||
| Kimball Electronics, Inc. * | 1,548 | 30,418 | ||||||
| Methode Electronics, Inc. | 48,182 | 1,744,188 | ||||||
| Plexus Corp. * | 10,670 | 624,302 | ||||||
| Rogers Corp. * | 1,595 | 234,975 | ||||||
| SYNNEX Corp. | 7,805 | 661,083 | ||||||
| Tech Data Corp. * | 14,708 | 1,052,652 | ||||||
| TTM Technologies, Inc. * | 78,977 | 1,256,524 | ||||||
| Vishay Intertechnology, Inc. | 46,171 | 939,580 | ||||||
|
| |||||||
| 14,426,074 | ||||||||
|
| |||||||
| Energy Equipment & Services - 0.5% | ||||||||
| Exterran Corp. * | 10,619 | 281,722 | ||||||
| KLX Energy Services Holdings, Inc. * | 6,412 | 205,248 | ||||||
| Mammoth Energy Services, Inc. (a) | 68,556 | 1,994,980 | ||||||
| Matrix Service Co. * | 30,077 | 741,398 | ||||||
| Smart Sand, Inc. *(a) | 73,921 | 303,815 | ||||||
|
| |||||||
| 3,527,163 | ||||||||
|
| |||||||
| Entertainment - 0.0% (b) | ||||||||
| Marcus Corp. (The) | 8,173 | 343,675 | ||||||
|
| |||||||
| Equity Real Estate Investment Trusts (REITs) - 2.9% | ||||||||
| Agree Realty Corp. | 11,618 | 617,148 | ||||||
| American Assets Trust, Inc. | 5,713 | 213,038 | ||||||
| Chesapeake Lodging Trust | 17,625 | 565,234 | ||||||
| CoreCivic, Inc. | 38,644 | 940,208 | ||||||
| Cousins Properties, Inc. | 152,602 | 1,356,632 | ||||||
| DiamondRock Hospitality Co. | 98,561 | 1,150,207 | ||||||
| EastGroup Properties, Inc. | 5,355 | 512,045 | ||||||
| First Industrial Realty Trust, Inc. | 50,404 | 1,582,686 | ||||||
| Four Corners Property Trust, Inc. | 20,560 | 528,186 | ||||||
| GEO Group, Inc. (The) | 52,351 | 1,317,151 | ||||||
| Gramercy Property Trust | 53,933 | 1,479,921 | ||||||
| LaSalle Hotel Properties | 47,297 | 1,636,003 | ||||||
| Lexington Realty Trust | 28,299 | 234,882 | ||||||
| LTC Properties, Inc. | 11,256 | 496,502 | ||||||
| National Health Investors, Inc. | 12,852 | 971,483 | ||||||
| Pebblebrook Hotel Trust (a) | 24,372 | 886,410 | ||||||
| PS Business Parks, Inc. | 4,743 | 602,788 | ||||||
| Ryman Hospitality Properties, Inc. | 19,404 | 1,672,043 | ||||||
| Select Income REIT | 28,994 | 636,128 | ||||||
| Summit Hotel Properties, Inc. | 23,783 | 321,784 | ||||||
| INVESTMENTS | SHARES | VALUE | ||||||
| Equity Real Estate Investment Trusts (REITs) - 2.9% (continued) | ||||||||
| Sunstone Hotel Investors, Inc. | 92,362 | $ | 1,511,042 | |||||
| Terreno Realty Corp. | 24,887 | 938,240 | ||||||
| Washington Prime Group, Inc. (a) | 83,033 | 606,141 | ||||||
| Xenia Hotels & Resorts, Inc. | 27,489 | 651,489 | ||||||
|
| |||||||
| 21,427,391 | ||||||||
|
| |||||||
| Food & Staples Retailing - 0.2% | ||||||||
| Ingles Markets, Inc., Class A | 34,579 | 1,184,331 | ||||||
| Weis Markets, Inc. (a) | 13,683 | 593,842 | ||||||
|
| |||||||
| 1,778,173 | ||||||||
|
| |||||||
| Food Products - 0.3% | ||||||||
| John B Sanfilippo & Son, Inc. | 19,030 | 1,358,362 | ||||||
| Sanderson Farms, Inc. | 9,849 | 1,018,091 | ||||||
|
| |||||||
| 2,376,453 | ||||||||
|
| |||||||
| Gas Utilities - 0.1% | ||||||||
| ONE Gas, Inc. | 6,300 | 518,364 | ||||||
|
| |||||||
| Health Care Equipment & Supplies - 3.1% | ||||||||
| Anika Therapeutics, Inc. * | 8,073 | 340,519 | ||||||
| AxoGen, Inc. * | 9,960 | 367,026 | ||||||
| CONMED Corp. | 3,076 | 243,681 | ||||||
| Globus Medical, Inc., Class A * | 107,392 | 6,095,570 | ||||||
| Haemonetics Corp. * | 39,458 | 4,521,098 | ||||||
| Inogen, Inc. * | 10,336 | 2,523,224 | ||||||
| Integer Holdings Corp. * | 11,755 | 975,077 | ||||||
| IntriCon Corp. * | 12,064 | 677,997 | ||||||
| iRadimed Corp. * | 4,363 | 162,085 | ||||||
| Lantheus Holdings, Inc. * | 91,784 | 1,372,171 | ||||||
| LeMaitre Vascular, Inc. | 8,505 | 329,484 | ||||||
| Merit Medical Systems, Inc. * | 35,821 | 2,201,200 | ||||||
| Neogen Corp. * | 12,486 | 893,124 | ||||||
| NuVasive, Inc. * | 4,490 | 318,700 | ||||||
| NxStage Medical, Inc. * | 25,100 | 700,039 | ||||||
| Pulse Biosciences, Inc. *(a) | 17,309 | 245,615 | ||||||
| Quidel Corp. * | 3,002 | 195,640 | ||||||
| STAAR Surgical Co. * | 20,119 | 965,712 | ||||||
| Tandem Diabetes Care, Inc. * | 6,453 | 276,447 | ||||||
|
| |||||||
| 23,404,409 | ||||||||
|
| |||||||
| Health Care Providers & Services - 1.7% | ||||||||
| Amedisys, Inc. * | 13,024 | 1,627,479 | ||||||
| AMN Healthcare Services, Inc. * | 59,054 | 3,230,254 | ||||||
| Cross Country Healthcare, Inc. * | 32,232 | 281,385 | ||||||
| Diplomat Pharmacy, Inc. * | 41,826 | 811,843 | ||||||
| Ensign Group, Inc. (The) | 8,469 | 321,144 | ||||||
| LifePoint Health, Inc. * | 11,659 | 750,840 | ||||||
| Magellan Health, Inc. * | 34,070 | 2,454,743 | ||||||
| RadNet, Inc. * | 35,718 | 537,556 | ||||||
| Select Medical Holdings Corp. * | 19,008 | 349,747 | ||||||
| Tenet Healthcare Corp. * | 22,775 | 648,177 | ||||||
| Tivity Health, Inc. * | 18,915 | 608,117 | ||||||
| Triple-S Management Corp., Class B * | 73,576 | 1,389,851 | ||||||
|
| |||||||
| 13,011,136 | ||||||||
|
| |||||||
| Health Care Technology - 0.0% (b) | ||||||||
| HMS Holdings Corp. * | 6,721 | 220,516 | ||||||
|
| |||||||
| Hotels, Restaurants & Leisure - 2.0% | ||||||||
| BBX Capital Corp. | 35,465 | 263,150 | ||||||
| The accompanying notes are an integral part of these financial statements. | (Continued) |
| AQR Funds | Annual Report | September 2018 | ||||||||||||||
58
Table of Contents
| Schedule of Investments | September 30, 2018 |
| AQR SMALL CAP MULTI-STYLE FUND |
| INVESTMENTS | SHARES | VALUE | ||||||
| Hotels, Restaurants & Leisure - 2.0% (continued) | ||||||||
| BJ’s Restaurants, Inc. | 3,769 | $ | 272,122 | |||||
| Bloomin’ Brands, Inc. | 45,367 | 897,813 | ||||||
| Brinker International, Inc. (a) | 29,340 | 1,371,058 | ||||||
| Carrols Restaurant Group, Inc. * | 20,133 | 293,942 | ||||||
| Cheesecake Factory, Inc. (The) (a) | 20,948 | 1,121,556 | ||||||
| Cracker Barrel Old Country Store, Inc. (a) | 2,568 | 377,830 | ||||||
| Dave & Buster’s Entertainment, Inc. * | 11,177 | 740,141 | ||||||
| Denny’s Corp. * | 18,705 | 275,337 | ||||||
| Eldorado Resorts, Inc. * | 21,831 | 1,060,987 | ||||||
| Marriott Vacations Worldwide Corp. | 18,527 | 2,070,392 | ||||||
| Penn National Gaming, Inc. * | 78,191 | 2,574,048 | ||||||
| Red Robin Gourmet Burgers, Inc. * | 19,953 | 801,113 | ||||||
| Ruth’s Hospitality Group, Inc. | 50,342 | 1,588,290 | ||||||
| Sonic Corp. | 14,911 | 646,243 | ||||||
| Texas Roadhouse, Inc. | 3,450 | 239,050 | ||||||
| Town Sports International Holdings, Inc. * | 29,823 | 257,969 | ||||||
|
| |||||||
| 14,851,041 | ||||||||
|
| |||||||
| Household Durables - 1.5% | ||||||||
| Bassett Furniture Industries, Inc. | 12,462 | 264,817 | ||||||
| Flexsteel Industries, Inc. | 14,703 | 437,267 | ||||||
| Hooker Furniture Corp. | 43,621 | 1,474,390 | ||||||
| KB Home | 49,703 | 1,188,399 | ||||||
| La-Z-Boy, Inc. | 88,620 | 2,800,392 | ||||||
| MDC Holdings, Inc. | 29,679 | 877,905 | ||||||
| Meritage Homes Corp. * | 18,809 | 750,479 | ||||||
| Roku, Inc. *(a) | 13,638 | 995,983 | ||||||
| Taylor Morrison Home Corp., Class A * | 39,569 | 713,825 | ||||||
| TopBuild Corp. * | 6,790 | 385,808 | ||||||
| TRI Pointe Group, Inc. * | 31,380 | 389,112 | ||||||
| ZAGG, Inc. * | 83,494 | 1,231,536 | ||||||
|
| |||||||
| 11,509,913 | ||||||||
|
| |||||||
| Household Products - 0.1% | ||||||||
| WD-40 Co. (a) | 2,726 | 469,145 | ||||||
|
| |||||||
| Insurance - 5.7% | ||||||||
| American Equity Investment Life Holding Co. | 82,916 | 2,931,910 | ||||||
| CNO Financial Group, Inc. | 84,710 | 1,797,546 | ||||||
| Employers Holdings, Inc. | 86,393 | 3,913,603 | ||||||
| FBL Financial Group, Inc., Class A | 7,913 | 595,453 | ||||||
| Genworth Financial, Inc., Class A * | 280,193 | 1,168,405 | ||||||
| Health Insurance Innovations, Inc., Class A *(a) | 13,042 | 804,039 | ||||||
| Heritage Insurance Holdings, Inc. (a) | 50,332 | 745,920 | ||||||
| Horace Mann Educators Corp. | 26,522 | 1,190,838 | ||||||
| Kemper Corp. | 42,677 | 3,433,365 | ||||||
| National General Holdings Corp. | 27,971 | 750,742 | ||||||
| National Western Life Group, Inc., Class A | 7,195 | 2,296,644 | ||||||
| Navigators Group, Inc. (The) | 7,063 | 488,053 | ||||||
| Primerica, Inc. | 51,801 | 6,244,610 | ||||||
| Selective Insurance Group, Inc. | 73,984 | 4,697,984 | ||||||
| Third Point Reinsurance Ltd. * | 184,845 | 2,402,985 | ||||||
| Trupanion, Inc. *(a) | 33,531 | 1,198,063 | ||||||
| United Fire Group, Inc. | 6,018 | 305,534 | ||||||
| Universal Insurance Holdings, Inc. | 161,292 | 7,830,726 | ||||||
|
| |||||||
| 42,796,420 | ||||||||
|
| |||||||
| INVESTMENTS | SHARES | VALUE | ||||||
| Interactive Media & Services - 0.8% | ||||||||
| Care.com, Inc. * | 18,767 | $ | 414,938 | |||||
| Cargurus, Inc. * | 15,988 | 890,372 | ||||||
| Cars.com, Inc. * | 30,397 | 839,261 | ||||||
| Meet Group, Inc. (The) * | 61,541 | 304,628 | ||||||
| QuinStreet, Inc. * | 67,731 | 919,110 | ||||||
| XO Group, Inc. * | 25,293 | 872,102 | ||||||
| Yelp, Inc. * | 38,189 | 1,878,899 | ||||||
|
| |||||||
| 6,119,310 | ||||||||
|
| |||||||
| Internet & Direct Marketing Retail - 1.9% | ||||||||
| 1-800-Flowers.com, Inc., Class A * | 100,005 | 1,180,059 | ||||||
| Etsy, Inc. * | 97,277 | 4,998,092 | ||||||
| Nutrisystem, Inc. | 19,488 | 722,030 | ||||||
| PetMed Express, Inc. (a) | 26,254 | 866,645 | ||||||
| Shutterstock, Inc. | 21,184 | 1,156,223 | ||||||
| Stamps.com, Inc. * | 22,000 | 4,976,400 | ||||||
|
| |||||||
| 13,899,449 | ||||||||
|
| |||||||
| IT Services - 2.1% | ||||||||
| Acxiom Holdings, Inc. * | 25,795 | 1,274,531 | ||||||
| Brightcove, Inc. * | 28,400 | 238,560 | ||||||
| CACI International, Inc., Class A * | 10,180 | 1,874,647 | ||||||
| Convergys Corp. | 36,695 | 871,139 | ||||||
| CSG Systems International, Inc. | 9,537 | 382,815 | ||||||
| Hackett Group, Inc. (The) | 38,091 | 767,534 | ||||||
| MAXIMUS, Inc. | 22,401 | 1,457,409 | ||||||
| NIC, Inc. | 35,843 | 530,477 | ||||||
| Perficient, Inc. * | 12,894 | 343,625 | ||||||
| Perspecta, Inc. | 48,628 | 1,250,712 | ||||||
| Sykes Enterprises, Inc. * | 72,637 | 2,214,702 | ||||||
| Syntel, Inc. * | 13,789 | 565,073 | ||||||
| Travelport Worldwide Ltd. | 87,388 | 1,474,236 | ||||||
| TTEC Holdings, Inc. | 11,128 | 288,215 | ||||||
| Unisys Corp. * | 81,864 | 1,670,026 | ||||||
| Web.com Group, Inc. * | 12,396 | 345,848 | ||||||
|
| |||||||
| 15,549,549 | ||||||||
|
| |||||||
| Leisure Products - 0.6% | ||||||||
| Acushnet Holdings Corp. | 21,914 | 601,101 | ||||||
| Callaway Golf Co. | 38,886 | 944,541 | ||||||
| Johnson Outdoors, Inc., Class A | 4,952 | 460,486 | ||||||
| Nautilus, Inc. * | 114,102 | 1,591,723 | ||||||
| Sturm Ruger & Co., Inc. (a) | 17,455 | 1,205,268 | ||||||
|
| |||||||
| 4,803,119 | ||||||||
|
| |||||||
| Life Sciences Tools & Services - 0.2% | ||||||||
| Cambrex Corp. * | 10,618 | 726,271 | ||||||
| Medpace Holdings, Inc. * | 18,721 | 1,121,575 | ||||||
|
| |||||||
| 1,847,846 | ||||||||
|
| |||||||
| Machinery - 3.1% | ||||||||
| Alamo Group, Inc. | 27,873 | 2,553,446 | ||||||
| American Railcar Industries, Inc. (a) | 6,872 | 316,799 | ||||||
| Astec Industries, Inc. | 21,435 | 1,080,538 | ||||||
| Barnes Group, Inc. | 43,723 | 3,105,645 | ||||||
| Columbus McKinnon Corp. (a) | 32,584 | 1,288,371 | ||||||
| Douglas Dynamics, Inc. | 7,816 | 343,122 | ||||||
| EnPro Industries, Inc. | 12,478 | 910,021 | ||||||
| Global Brass & Copper Holdings, Inc. | 22,254 | 821,173 | ||||||
| The accompanying notes are an integral part of these financial statements. | (Continued) |
| AQR Funds | Annual Report | September 2018 | ||||||||||||||
59
Table of Contents
| Schedule of Investments | September 30, 2018 |
| AQR SMALL CAP MULTI-STYLE FUND |
| INVESTMENTS | SHARES | VALUE | ||||||
| Machinery - 3.1% (continued) | ||||||||
| Greenbrier Cos., Inc. (The) | 66,794 | $ | 4,014,319 | |||||
| Harsco Corp. * | 18,072 | 515,956 | ||||||
| Hillenbrand, Inc. | 7,777 | 406,737 | ||||||
| Hyster-Yale Materials Handling, Inc. | 8,350 | 513,775 | ||||||
| Kadant, Inc. | 8,445 | 910,793 | ||||||
| Kennametal, Inc. | 12,150 | 529,254 | ||||||
| Lydall, Inc. * | 12,443 | 536,293 | ||||||
| Meritor, Inc. * | 220,325 | 4,265,492 | ||||||
| Proto Labs, Inc. * | 2,386 | 385,936 | ||||||
| Standex International Corp. | 2,962 | 308,789 | ||||||
| Wabash National Corp. | 12,021 | 219,143 | ||||||
|
| |||||||
| 23,025,602 | ||||||||
|
| |||||||
| Media - 1.2% | ||||||||
| Entravision Communications Corp., Class A | 336,067 | 1,646,728 | ||||||
| Gannett Co., Inc. (a) | 244,508 | 2,447,525 | ||||||
| Gray Television, Inc. * | 92,832 | 1,624,560 | ||||||
| MSG Networks, Inc., Class A * | 67,361 | 1,737,914 | ||||||
| Scholastic Corp. | 16,215 | 757,078 | ||||||
| TechTarget, Inc. * | 37,959 | 737,164 | ||||||
|
| |||||||
| 8,950,969 | ||||||||
|
| |||||||
| Metals & Mining - 1.4% | ||||||||
| Commercial Metals Co. | 32,050 | 657,666 | ||||||
| Ryerson Holding Corp. * | 26,758 | 302,365 | ||||||
| Schnitzer Steel Industries, Inc., Class A | 17,054 | 461,311 | ||||||
| Warrior Met Coal, Inc. | 326,668 | 8,833,103 | ||||||
|
| |||||||
| 10,254,445 | ||||||||
|
| |||||||
| Mortgage Real Estate Investment Trusts (REITs) - 0.5% | ||||||||
| Apollo Commercial Real Estate Finance, Inc. | 65,268 | 1,231,607 | ||||||
| Blackstone Mortgage Trust, Inc., Class A (a) | 33,505 | 1,122,753 | ||||||
| Invesco Mortgage Capital, Inc. | 35,664 | 564,205 | ||||||
| Redwood Trust, Inc. | 59,931 | 973,279 | ||||||
|
| |||||||
| 3,891,844 | ||||||||
|
| |||||||
| Multiline Retail - 0.2% | ||||||||
| Dillard’s, Inc., Class A (a) | 16,025 | 1,223,349 | ||||||
|
| |||||||
| Multi-Utilities - 0.4% | ||||||||
| Avista Corp. | 25,054 | 1,266,730 | ||||||
| Black Hills Corp. | 15,062 | 874,952 | ||||||
| NorthWestern Corp. | 18,706 | 1,097,294 | ||||||
|
| |||||||
| 3,238,976 | ||||||||
|
| |||||||
| Oil, Gas & Consumable Fuels - 2.6% | ||||||||
| Abraxas Petroleum Corp. * | 180,223 | 419,920 | ||||||
| Arch Coal, Inc., Class A | 43,206 | 3,862,616 | ||||||
| Delek US Holdings, Inc. | 7,375 | 312,921 | ||||||
| Denbury Resources, Inc. * | 185,750 | 1,151,650 | ||||||
| Oasis Petroleum, Inc. * | 54,722 | 775,958 | ||||||
| Peabody Energy Corp. | 112,461 | 4,008,110 | ||||||
| Penn Virginia Corp. * | 7,146 | 575,539 | ||||||
| Renewable Energy Group, Inc. * | 93,636 | 2,696,717 | ||||||
| REX American Resources Corp. * | 7,976 | 602,587 | ||||||
| SandRidge Energy, Inc. * | 47,707 | 518,575 | ||||||
| Southwestern Energy Co. * | 193,269 | 987,605 | ||||||
| INVESTMENTS | SHARES | VALUE | ||||||
| Oil, Gas & Consumable Fuels - 2.6% (continued) | ||||||||
| SRC Energy, Inc. * | 30,606 | $ | 272,087 | |||||
| W&T Offshore, Inc. * | 317,629 | 3,061,943 | ||||||
|
| |||||||
| 19,246,228 | ||||||||
|
| |||||||
| Paper & Forest Products - 2.0% | ||||||||
| Boise Cascade Co. | 71,876 | 2,645,037 | ||||||
| KapStone Paper and Packaging Corp. | 28,396 | 962,908 | ||||||
| Louisiana-Pacific Corp. | 228,724 | 6,058,899 | ||||||
| PH Glatfelter Co. | 11,556 | 220,835 | ||||||
| Verso Corp., Class A * | 142,892 | 4,811,174 | ||||||
|
| |||||||
| 14,698,853 | ||||||||
|
| |||||||
| Personal Products - 2.4% | ||||||||
| Inter Parfums, Inc. | 9,512 | 613,048 | ||||||
| Medifast, Inc. | 31,377 | 6,951,574 | ||||||
| Natural Health Trends Corp. | 53,657 | 1,249,135 | ||||||
| USANA Health Sciences, Inc. * | 77,361 | 9,325,869 | ||||||
|
| |||||||
| 18,139,626 | ||||||||
|
| |||||||
| Pharmaceuticals - 0.8% | ||||||||
| ANI Pharmaceuticals, Inc. * | 6,188 | 349,869 | ||||||
| Corcept Therapeutics, Inc. *(a) | 114,497 | 1,605,248 | ||||||
| Innoviva, Inc. * | 46,846 | 713,933 | ||||||
| Lannett Co., Inc. *(a) | 91,965 | 436,834 | ||||||
| Phibro Animal Health Corp., Class A | 30,159 | 1,293,821 | ||||||
| Supernus Pharmaceuticals, Inc. *(a) | 24,368 | 1,226,929 | ||||||
|
| |||||||
| 5,626,634 | ||||||||
|
| |||||||
| Professional Services - 3.0% | ||||||||
| ASGN, Inc. * | 14,529 | 1,146,774 | ||||||
| Barrett Business Services, Inc. | 22,866 | 1,526,991 | ||||||
| CBIZ, Inc. * | 17,515 | 415,106 | ||||||
| FTI Consulting, Inc. * | 34,682 | 2,538,376 | ||||||
| ICF International, Inc. | 17,752 | 1,339,388 | ||||||
| Insperity, Inc. | 72,524 | 8,554,206 | ||||||
| Kelly Services, Inc., Class A | 48,104 | 1,155,939 | ||||||
| Kforce, Inc. | 32,916 | 1,237,642 | ||||||
| Korn/Ferry International | 42,550 | 2,095,162 | ||||||
| TriNet Group, Inc. * | 5,432 | 305,930 | ||||||
| TrueBlue, Inc. * | 66,543 | 1,733,445 | ||||||
| Willdan Group, Inc. * | 10,900 | 370,164 | ||||||
|
| |||||||
| 22,419,123 | ||||||||
|
| |||||||
| Real Estate Management & Development - 0.4% | ||||||||
| HFF, Inc., Class A | 52,097 | 2,213,080 | ||||||
| Marcus & Millichap, Inc. * | 9,642 | 334,674 | ||||||
| RMR Group, Inc. (The), Class A | 7,632 | 708,250 | ||||||
|
| |||||||
| 3,256,004 | ||||||||
|
| |||||||
| Road & Rail - 1.6% | ||||||||
| ArcBest Corp. | 69,855 | 3,391,460 | ||||||
| Avis Budget Group, Inc. * | 31,052 | 998,011 | ||||||
| Covenant Transportation Group, Inc., Class A * | 9,777 | 284,120 | ||||||
| Marten Transport Ltd. | 32,888 | 692,293 | ||||||
| Saia, Inc. * | 57,605 | 4,403,902 | ||||||
| USA Truck, Inc. * | 27,571 | 557,761 | ||||||
| Werner Enterprises, Inc. | 35,295 | 1,247,678 | ||||||
|
| |||||||
| 11,575,225 | ||||||||
|
| |||||||
| The accompanying notes are an integral part of these financial statements. | (Continued) |
| AQR Funds | Annual Report | September 2018 | ||||||||||||||
60
Table of Contents
| Schedule of Investments | September 30, 2018 |
| AQR SMALL CAP MULTI-STYLE FUND |
| INVESTMENTS | SHARES | VALUE | ||||||
| Semiconductors & Semiconductor Equipment - 1.5% | ||||||||
| Advanced Energy Industries, Inc. * | 20,053 | $ | 1,035,738 | |||||
| Amkor Technology, Inc. * | 236,976 | 1,751,253 | ||||||
| Cabot Microelectronics Corp. | 22,662 | 2,338,039 | ||||||
| Diodes, Inc. * | 10,542 | 350,943 | ||||||
| Entegris, Inc. | 100,711 | 2,915,583 | ||||||
| Integrated Device Technology, Inc. * | 10,639 | 500,139 | ||||||
| Photronics, Inc. * | 31,335 | 308,650 | ||||||
| Rudolph Technologies, Inc. * | 29,461 | 720,321 | ||||||
| SMART Global Holdings, Inc. * | 55,818 | 1,604,209 | ||||||
|
| |||||||
| 11,524,875 | ||||||||
|
| |||||||
| Software - 3.0% | ||||||||
| ACI Worldwide, Inc. * | 21,507 | 605,207 | ||||||
| Alarm.com Holdings, Inc. * | 17,042 | 978,211 | ||||||
| Appfolio, Inc., Class A * | 2,541 | 199,214 | ||||||
| Avaya Holdings Corp. * | 33,702 | 746,162 | ||||||
| Blackbaud, Inc. (a) | 22,624 | 2,295,884 | ||||||
| Ebix, Inc. (a) | 31,551 | 2,497,262 | ||||||
| eGain Corp. * | 52,818 | 427,826 | ||||||
| Ellie Mae, Inc. *(a) | 7,602 | 720,442 | ||||||
| Five9, Inc. * | 15,643 | 683,443 | ||||||
| HubSpot, Inc. * | 1,818 | 274,427 | ||||||
| j2 Global, Inc. | 39,878 | 3,303,892 | ||||||
| Mitek Systems, Inc. * | 65,922 | 464,750 | ||||||
| New Relic, Inc. * | 3,550 | 334,516 | ||||||
| Progress Software Corp. | 36,877 | 1,301,389 | ||||||
| Qualys, Inc. * | 44,518 | 3,966,554 | ||||||
| Trade Desk, Inc. (The), Class A * | 13,434 | 2,027,325 | ||||||
| Verint Systems, Inc. * | 26,061 | 1,305,656 | ||||||
| Zix Corp. * | 76,300 | 423,465 | ||||||
|
| |||||||
| 22,555,625 | ||||||||
|
| |||||||
| Specialty Retail - 5.5% | ||||||||
| Aaron’s, Inc. | 8,589 | 467,757 | ||||||
| Abercrombie & Fitch Co., Class A | 201,990 | 4,266,029 | ||||||
| American Eagle Outfitters, Inc. | 235,196 | 5,839,917 | ||||||
| Asbury Automotive Group, Inc. * | 9,714 | 667,837 | ||||||
| Boot Barn Holdings, Inc. *(a) | 14,884 | 422,854 | ||||||
| Buckle, Inc. (The) (a) | 117,854 | 2,716,535 | ||||||
| Caleres, Inc. | 100,802 | 3,614,760 | ||||||
| Cato Corp. (The), Class A | 10,434 | 219,323 | ||||||
| Chico’s FAS, Inc. | 136,156 | 1,180,472 | ||||||
| Children’s Place, Inc. (The) | 27,937 | 3,570,349 | ||||||
| Citi Trends, Inc. | 19,312 | 555,606 | ||||||
| DSW, Inc., Class A | 112,255 | 3,803,199 | ||||||
| Express, Inc. * | 237,077 | 2,622,072 | ||||||
| Five Below, Inc. * | 13,527 | 1,759,322 | ||||||
| Genesco, Inc. * | 4,635 | 218,308 | ||||||
| Group 1 Automotive, Inc. | 13,337 | 865,571 | ||||||
| Haverty Furniture Cos., Inc. | 16,396 | 362,352 | ||||||
| Hibbett Sports, Inc. *(a) | 72,080 | 1,355,104 | ||||||
| Kirkland’s, Inc. * | 30,853 | 311,307 | ||||||
| Lithia Motors, Inc., Class A | 2,878 | 235,017 | ||||||
| Shoe Carnival, Inc. | 49,942 | 1,922,767 | ||||||
| Sleep Number Corp. * | 12,503 | 459,860 | ||||||
| Tailored Brands, Inc. (a) | 58,698 | 1,478,603 | ||||||
| Tilly’s, Inc., Class A | 22,003 | 416,957 | ||||||
| Zumiez, Inc. * | 55,002 | 1,449,303 | ||||||
|
| |||||||
| 40,781,181 | ||||||||
|
| |||||||
| INVESTMENTS | SHARES | VALUE | ||||||
| Textiles, Apparel & Luxury Goods - 3.3% | ||||||||
| Crocs, Inc. * | 91,298 | $ | 1,943,735 | |||||
| Deckers Outdoor Corp. * | 64,454 | 7,642,955 | ||||||
| Fossil Group, Inc. *(a) | 54,100 | 1,259,448 | ||||||
| G-III Apparel Group Ltd. * | 71,158 | 3,429,104 | ||||||
| Movado Group, Inc. | 62,270 | 2,609,113 | ||||||
| Oxford Industries, Inc. | 24,538 | 2,213,328 | ||||||
| Perry Ellis International, Inc. * | 16,846 | 460,401 | ||||||
| Rocky Brands, Inc. | 24,841 | 703,000 | ||||||
| Steven Madden Ltd. | 41,357 | 2,187,785 | ||||||
| Vera Bradley, Inc. * | 91,920 | 1,402,699 | ||||||
| Wolverine World Wide, Inc. | 11,387 | 444,663 | ||||||
|
| |||||||
| 24,296,231 | ||||||||
|
| |||||||
| Thrifts & Mortgage Finance - 3.3% | ||||||||
| Axos Financial, Inc. * | 125,148 | 4,303,840 | ||||||
| Dime Community Bancshares, Inc. | 26,665 | 475,970 | ||||||
| Federal Agricultural Mortgage Corp., Class C | 4,580 | 330,584 | ||||||
| First Defiance Financial Corp. | 30,496 | 918,235 | ||||||
| Flagstar Bancorp, Inc. * | 13,533 | 425,883 | ||||||
| HomeStreet, Inc. * | 11,814 | 313,071 | ||||||
| Meta Financial Group, Inc. | 10,474 | 865,676 | ||||||
| MGIC Investment Corp. * | 417,399 | 5,555,581 | ||||||
| Oritani Financial Corp. | 21,901 | 340,560 | ||||||
| Provident Financial Services, Inc. | 13,221 | 324,576 | ||||||
| Radian Group, Inc. | 139,707 | 2,887,744 | ||||||
| United Financial Bancorp, Inc. | 16,318 | 274,632 | ||||||
| Walker & Dunlop, Inc. | 95,850 | 5,068,548 | ||||||
| Washington Federal, Inc. | 52,350 | 1,675,200 | ||||||
| WSFS Financial Corp. | 14,776 | 696,688 | ||||||
|
| |||||||
| 24,456,788 | ||||||||
|
| |||||||
| Tobacco - 0.5% | ||||||||
| Pyxus International, Inc. *(a) | 12,697 | 292,031 | ||||||
| Turning Point Brands, Inc. | 18,349 | 760,749 | ||||||
| Universal Corp. | 31,092 | 2,020,980 | ||||||
| Vector Group Ltd. (a) | 38,959 | 536,858 | ||||||
|
| |||||||
| 3,610,618 | ||||||||
|
| |||||||
| Trading Companies & Distributors - 1.9% | ||||||||
| BlueLinx Holdings, Inc. *(a) | 9,400 | 296,006 | ||||||
| BMC Stock Holdings, Inc. * | 40,693 | 758,925 | ||||||
| CAI International, Inc. * | 91,723 | 2,097,705 | ||||||
| GATX Corp. (a) | 38,538 | 3,337,005 | ||||||
| GMS, Inc. * | 26,813 | 622,062 | ||||||
| H&E Equipment Services, Inc. | 49,195 | 1,858,587 | ||||||
| Herc Holdings, Inc. * | 7,374 | 377,549 | ||||||
| Rush Enterprises, Inc., Class A | 15,001 | 589,689 | ||||||
| Systemax, Inc. | 9,281 | 305,716 | ||||||
| Textainer Group Holdings Ltd. * | 20,649 | 264,307 | ||||||
| Titan Machinery, Inc. * | 16,190 | 250,702 | ||||||
| Triton International Ltd. | 111,902 | 3,722,980 | ||||||
|
| |||||||
| 14,481,233 | ||||||||
|
| |||||||
| Water Utilities - 0.0% (b) | ||||||||
| SJW Group | 3,769 | 230,474 | ||||||
|
| |||||||
| Wireless Telecommunication Services - 1.1% | ||||||||
| Boingo Wireless, Inc. * | 95,493 | 3,332,706 | ||||||
| NII Holdings, Inc. *(a) | 315,514 | 1,848,912 | ||||||
| The accompanying notes are an integral part of these financial statements. | (Continued) |
| AQR Funds | Annual Report | September 2018 | ||||||||||||||
61
Table of Contents
| Schedule of Investments | September 30, 2018 |
| AQR SMALL CAP MULTI-STYLE FUND |
| INVESTMENTS | SHARES | VALUE | ||||||
| Wireless Telecommunication Services - 1.1% (continued) | ||||||||
| Shenandoah Telecommunications Co. | 73,698 | $ | 2,855,797 | |||||
|
| |||||||
| 8,037,415 | ||||||||
|
| |||||||
TOTAL COMMON STOCKS | 723,293,819 | |||||||
|
| |||||||
| PREFERRED STOCKS - 0.0% (b) | ||||||||
| Media - 0.0% (b) | ||||||||
| GCI Liberty, Inc., Series A, 7.00%, 3/10/2039(c) | ||||||||
(Cost $24,899) | 2,727 | 68,366 | ||||||
|
| |||||||
| RIGHTS - 0.0% (b) | NO. OF RIGHTS | |||||||
| Media - 0.0% (b) | ||||||||
| Media General, Inc., CVR (3) *(d) | ||||||||
(Cost $10,984) | 36,985 | 627 | ||||||
|
| |||||||
| SHORT-TERM INVESTMENTS - 2.9% | SHARES | |||||||
| INVESTMENT COMPANIES - 2.9% | ||||||||
| Limited Purpose Cash Investment Fund, 2.06% (e) | ||||||||
(Cost $21,601,395) | 21,605,928 | 21,603,768 | ||||||
|
| |||||||
| SECURITIES LENDING COLLATERAL - 6.5% | ||||||||
| Investment Companies - 6.5% | ||||||||
| Investments in a Pooled Account through Securities Lending Program with Citibank NA | ||||||||
| BlackRock Liquidity Funds T-Fund Portfolio, Institutional Shares 1.97% (e)(f) | 5,936,000 | 5,936,000 | ||||||
| Limited Purpose Cash Investment Fund 2.06% (e)(f) | 42,594,357 | 42,590,097 | ||||||
|
| |||||||
TOTAL SECURITIES LENDING COLLATERAL | 48,526,097 | |||||||
|
| |||||||
TOTAL INVESTMENTS IN SECURITIES AT VALUE - 106.4% | 793,492,677 | |||||||
|
| |||||||
| LIABILITIES IN EXCESS OF OTHER ASSETS - (6.4)% (g) | (48,062,201) | |||||||
|
| |||||||
NET ASSETS - 100.0% | $ | 745,430,476 | ||||||
|
| |||||||
| SECTOR | VALUE | % OF NET ASSETS | ||||||
| Communication Services | $ | 28,414,248 | 3.8 | % | ||||
| Consumer Discretionary | 132,165,829 | 17.7 | ||||||
| Consumer Staples | 37,287,814 | 5.0 | ||||||
| Energy | 22,773,392 | 3.0 | ||||||
| Financials | 145,158,451 | 19.5 | ||||||
| Health Care | 83,272,882 | 11.2 | ||||||
| Industrials | 139,640,289 | 18.7 | ||||||
| Information Technology | 64,646,065 | 8.7 | ||||||
| Materials | 40,912,106 | 5.5 | ||||||
| Real Estate | 24,683,395 | 3.3 | ||||||
| Utilities | 4,408,341 | 0.6 | ||||||
| Short-Term Investments | 21,603,768 | 2.9 | ||||||
| Securities Lending Collateral | 48,526,097 | 6.5 | ||||||
|
|
|
| |||||
Total Investments In Securities | 793,492,677 | 106.4 | ||||||
| Liabilities in Excess of Other Assets (g) | (48,062,201 | ) | (6.4 | ) | ||||
|
|
|
| |||||
Net Assets | $ | 745,430,476 | 100.0 | % | ||||
|
|
|
| |||||
All securities are United States companies, unless noted otherwise in parentheses.
| * | Non-income producing security. |
| (a) | The security or a portion of this security is on loan at September 30, 2018. The total value of securities on loan at September 30, 2018 was $46,920,908. |
| (b) | Represents less than 0.05% of net assets. |
| (c) | Perpetual security. The rate reflected was the rate in effect on September 30, 2018. The maturity date reflects the next call date. |
| (d) | Security fair valued as of September 30, 2018 in accordance with procedures approved by the Board of Trustees. Total value of all such securities at September 30, 2018 amounted to $627, which represents approximately 0.00% of net assets of the fund. |
| (e) | Represents 7-day effective yield as of September 30, 2018. |
| (f) | Represents security, or portion thereof, purchased with the cash collateral received for securities on loan (See Note 3). |
| (g) | Includes appreciation/(depreciation) on futures contracts. |
All securities are Level 1 with respect to ASC 820, unless otherwise noted in parentheses.
| (3) | Level 3 security (See Note 4). |
Abbreviations
| CVR | - Contingent Value Rights |
| The accompanying notes are an integral part of these financial statements. | (Continued) |
| AQR Funds | Annual Report | September 2018 | ||||||||||||||
62
Table of Contents
| Schedule of Investments | September 30, 2018 |
| AQR SMALL CAP MULTI-STYLE FUND |
Futures contracts outstanding as of September 30, 2018:
Exchange Traded
| DESCRIPTION | NUMBER OF CONTRACTS | EXPIRATION DATE | TRADING CURRENCY | NOTIONAL AMOUNT | VALUE AND UNREALIZED APPRECIATION (DEPRECIATION) | |||||||||||
| Long Contracts | ||||||||||||||||
| Russell 2000 E-Mini Index | 167 | 12/2018 | USD | $14,201,680 | $(154,866 | ) | ||||||||||
|
| |||||||||||||||
| $(154,866 | ) | |||||||||||||||
|
| |||||||||||||||
| USD | - United States Dollar |
Collateral pledged to, or (received from), each counterparty at September 30, 2018 was as follows:
| COUNTERPARTY | OVER THE COUNTER | EXCHANGE TRADED | TOTAL | |||||||||
| JPMS | ||||||||||||
| Cash | $— | $824,821 | $824,821 | |||||||||
| ||||||||||||
| The accompanying notes are an integral part of these financial statements. |
| AQR Funds | Annual Report | September 2018 | ||||||||||||||
63
Table of Contents
| Schedule of Investments | September 30, 2018 |
| AQR INTERNATIONAL MULTI-STYLE FUND |
| INVESTMENTS | SHARES | VALUE | ||||||
| COMMON STOCKS - 97.1% |
| |||||||
| Australia - 5.5% | ||||||||
| Amcor Ltd. | 29,675 | $ | 293,284 | |||||
| BHP Billiton Ltd. | 77,989 | 1,942,776 | ||||||
| BlueScope Steel Ltd. | 75,851 | 930,293 | ||||||
| Caltex Australia Ltd. | 27,038 | 584,124 | ||||||
| CIMIC Group Ltd. | 41,333 | 1,534,082 | ||||||
| Coca-Cola Amatil Ltd. | 17,370 | 122,449 | ||||||
| Crown Resorts Ltd. | 58,005 | 573,653 | ||||||
| CSL Ltd. | 11,411 | 1,658,012 | ||||||
| Dexus, REIT | 104,929 | 801,610 | ||||||
| Flight Centre Travel Group Ltd. | 66,329 | 2,547,154 | ||||||
| Fortescue Metals Group Ltd. | 851,875 | 2,413,984 | ||||||
| Goodman Group, REIT | 41,832 | 313,806 | ||||||
| GPT Group (The), REIT | 196,673 | 740,729 | ||||||
| Rio Tinto Ltd. | 10,260 | 583,512 | ||||||
| Santos Ltd. | 115,784 | 607,888 | ||||||
| Scentre Group, REIT | 235,569 | 676,969 | ||||||
| South32 Ltd. | 807,013 | 2,267,953 | ||||||
| Telstra Corp. Ltd. | 994,537 | 2,291,307 | ||||||
| Woodside Petroleum Ltd. | 73,707 | 2,056,194 | ||||||
|
| |||||||
| 22,939,779 | ||||||||
|
| |||||||
| Belgium - 1.0% | ||||||||
| Ageas | 64,497 | 3,467,272 | ||||||
| Solvay SA | 1,793 | 240,358 | ||||||
| UCB SA | 2,241 | 201,385 | ||||||
| Umicore SA | 7,800 | 435,696 | ||||||
|
| |||||||
| 4,344,711 | ||||||||
|
| |||||||
| Canada - 7.3% | ||||||||
| Bank of Montreal (1) | 4,699 | 387,591 | ||||||
| Bank of Nova Scotia (The) (1) | 10,355 | 617,219 | ||||||
| BlackBerry Ltd. (1)* | 12,046 | 136,347 | ||||||
| Canadian Imperial Bank of Commerce (1) | 15,845 | 1,484,706 | ||||||
| Canadian Tire Corp. Ltd., Class A (1) | 1,029 | 120,566 | ||||||
| CCL Industries, Inc., Class B (1) | 7,415 | 334,225 | ||||||
| CGI Group, Inc., Class A (1)* | 62,511 | 4,030,439 | ||||||
| Constellation Software, Inc. (1) | 168 | 123,546 | ||||||
| Fairfax Financial Holdings Ltd. (1) | 2,547 | 1,383,759 | ||||||
| Great-West Lifeco, Inc. (1) | 3,723 | 90,333 | ||||||
| Kinross Gold Corp. (1) * | 493,673 | 1,345,356 | ||||||
| Magna International, Inc. (1) | 39,340 | 2,066,519 | ||||||
| Methanex Corp. (1) | 42,600 | 3,362,750 | ||||||
| Open Text Corp. (1) | 9,992 | 380,217 | ||||||
| Power Corp. of Canada (1) | 5,259 | 114,247 | ||||||
| Royal Bank of Canada (1) | 57,836 | 4,636,193 | ||||||
| Shopify, Inc., Class A (1)* | 11,708 | 1,924,367 | ||||||
| Toronto-Dominion Bank (The) (1) | 73,894 | 4,490,333 | ||||||
| West Fraser Timber Co. Ltd. (1) | 65,203 | 3,710,814 | ||||||
|
| |||||||
| 30,739,527 | ||||||||
|
| |||||||
| China - 0.3% | ||||||||
| Yangzijiang Shipbuilding Holdings Ltd. | 1,254,500 | 1,137,312 | ||||||
|
| |||||||
| Denmark - 2.0% | ||||||||
| Carlsberg A/S, Class B | 1,900 | 227,858 | ||||||
| Coloplast A/S, Class B | 4,476 | 457,248 | ||||||
| Genmab A/S * | 1,661 | 260,897 | ||||||
| H Lundbeck A/S | 29,062 | 1,793,951 | ||||||
| INVESTMENTS | SHARES | VALUE | ||||||
| Denmark - 2.0% (continued) | ||||||||
| Novo Nordisk A/S, Class B | 76,688 | $ | 3,609,326 | |||||
| William Demant Holding A/S * | 49,978 | 1,876,094 | ||||||
|
| |||||||
| 8,225,374 | ||||||||
|
| |||||||
| Finland - 1.4% | ||||||||
| Neste OYJ | 45,583 | 3,757,197 | ||||||
| Nokia OYJ | 143,842 | 799,728 | ||||||
| UPM-Kymmene OYJ | 32,405 | 1,270,890 | ||||||
|
| |||||||
| 5,827,815 | ||||||||
|
| |||||||
| France - 10.3% | ||||||||
| Aeroports de Paris | 2,699 | 607,683 | ||||||
| Airbus SE | 1,209 | 151,781 | ||||||
| Arkema SA | 967 | 119,839 | ||||||
| BNP Paribas SA | 34,062 | 2,085,841 | ||||||
| CNP Assurances | 72,823 | 1,755,448 | ||||||
| Dassault Aviation SA | 241 | 446,018 | ||||||
| Kering SA | 4,948 | 2,653,884 | ||||||
| L’Oreal SA | 28,212 | 6,801,552 | ||||||
| LVMH Moet Hennessy Louis Vuitton SE | 10,782 | 3,810,046 | ||||||
| Peugeot SA | 152,549 | 4,115,120 | ||||||
| Safran SA | 23,368 | 3,272,082 | ||||||
| Sanofi | 40,716 | 3,637,862 | ||||||
| Teleperformance | 4,807 | 906,864 | ||||||
| Thales SA | 25,311 | 3,596,206 | ||||||
| TOTAL SA | 142,972 | 9,296,148 | ||||||
|
| |||||||
| 43,256,374 | ||||||||
|
| |||||||
| Germany - 9.2% | ||||||||
| adidas AG | 2,115 | 517,244 | ||||||
| Allianz SE (Registered) | 24,046 | 5,351,841 | ||||||
| BASF SE | 15,811 | 1,402,960 | ||||||
| Bayer AG (Registered) | 17,347 | 1,538,690 | ||||||
| Bayerische Motoren Werke AG | 7,923 | 713,789 | ||||||
| Beiersdorf AG | 5,694 | 641,847 | ||||||
| Covestro AG (a) | 79,639 | 6,446,558 | ||||||
| Deutsche Boerse AG | 5,562 | 743,677 | ||||||
| Deutsche Lufthansa AG (Registered) | 195,064 | 4,787,637 | ||||||
| Deutsche Wohnen SE | 10,225 | 491,124 | ||||||
| Fresenius SE & Co. KGaA | 9,490 | 695,904 | ||||||
| Hannover Rueck SE | 7,094 | 1,001,306 | ||||||
| Henkel AG & Co. KGaA (Preference) | 4,546 | 533,022 | ||||||
| HUGO BOSS AG | 9,255 | 712,034 | ||||||
| Linde AG | 4,967 | 1,172,992 | ||||||
| METRO AG | 34,853 | 545,901 | ||||||
| MTU Aero Engines AG | 4,328 | 975,007 | ||||||
| Puma SE | 551 | 271,866 | ||||||
| SAP SE | 22,667 | 2,787,215 | ||||||
| Schaeffler AG (Preference) | 23,407 | 298,567 | ||||||
| Siemens Healthineers AG *(a) | 4,395 | 193,101 | ||||||
| TUI AG | 99,030 | 1,899,655 | ||||||
| Volkswagen AG (Preference) | 6,554 | 1,150,966 | ||||||
| Vonovia SE | 11,443 | 559,657 | ||||||
| Wirecard AG | 14,138 | 3,058,744 | ||||||
|
| |||||||
| 38,491,304 | ||||||||
|
| |||||||
| Hong Kong - 2.9% | ||||||||
| CLP Holdings Ltd. | 294,500 | 3,448,812 | ||||||
| Galaxy Entertainment Group Ltd. | 384,000 | 2,425,760 | ||||||
| The accompanying notes are an integral part of these financial statements. | (Continued) |
| AQR Funds | Annual Report | September 2018 | ||||||||||||||
64
Table of Contents
| Schedule of Investments | September 30, 2018 |
| AQR INTERNATIONAL MULTI-STYLE FUND |
| INVESTMENTS | SHARES | VALUE | ||||||
| Hong Kong - 2.9% (continued) | ||||||||
| Henderson Land Development Co. Ltd. | 100,100 | $ | 502,709 | |||||
| Hong Kong Exchanges & Clearing Ltd. | 28,400 | 811,519 | ||||||
| Kerry Properties Ltd. | 164,000 | 556,870 | ||||||
| Li & Fung Ltd. | 1,548,000 | 346,750 | ||||||
| Link REIT | 26,000 | 255,995 | ||||||
| NWS Holdings Ltd. | 123,000 | 243,126 | ||||||
| PCCW Ltd. | 269,000 | 156,728 | ||||||
| Sino Land Co. Ltd. | 146,000 | 250,129 | ||||||
| Sun Hung Kai Properties Ltd. | 40,000 | 580,488 | ||||||
| Swire Properties Ltd. | 161,400 | 612,020 | ||||||
| WH Group Ltd. (a) | 686,000 | 481,610 | ||||||
| Yue Yuen Industrial Holdings Ltd. | 585,500 | 1,627,681 | ||||||
|
| |||||||
| 12,300,197 | ||||||||
|
| |||||||
| Italy - 2.2% | ||||||||
| Assicurazioni Generali SpA | 181,954 | 3,133,220 | ||||||
| Enel SpA | 231,198 | 1,181,775 | ||||||
| Eni SpA | 141,483 | 2,666,895 | ||||||
| Moncler SpA | 21,662 | 932,060 | ||||||
| Poste Italiane SpA (a) | 167,021 | 1,332,221 | ||||||
| UniCredit SpA | 11,203 | 168,098 | ||||||
|
| |||||||
| 9,414,269 | ||||||||
|
| |||||||
| Japan - 21.4% | ||||||||
| Acom Co. Ltd. | 10,000 | 40,316 | ||||||
| AEON Financial Service Co. Ltd. | 2,700 | 55,919 | ||||||
| AGC, Inc. | 6,200 | 257,315 | ||||||
| Alps Electric Co. Ltd. | 25,000 | 635,566 | ||||||
| Aozora Bank Ltd. | 15,100 | 539,311 | ||||||
| Asahi Kasei Corp. | 229,800 | 3,484,252 | ||||||
| Astellas Pharma, Inc. | 95,400 | 1,665,968 | ||||||
| Bandai Namco Holdings, Inc. | 85,500 | 3,321,749 | ||||||
| Central Japan Railway Co. | 1,600 | 333,117 | ||||||
| Credit Saison Co. Ltd. | 16,800 | 273,999 | ||||||
| Daiwa House Industry Co. Ltd. | 15,100 | 447,471 | ||||||
| DeNA Co. Ltd. | 23,400 | 413,201 | ||||||
| Fujitsu Ltd. | 37,500 | 2,671,488 | ||||||
| Hitachi Ltd. | 152,600 | 5,187,125 | ||||||
| Hoya Corp. | 27,500 | 1,633,252 | ||||||
| ITOCHU Corp. | 49,700 | 909,664 | ||||||
| Japan Airlines Co. Ltd. | 5,500 | 197,682 | ||||||
| Japan Tobacco, Inc. | 27,100 | 707,671 | ||||||
| JXTG Holdings, Inc. | 218,100 | 1,649,664 | ||||||
| Kajima Corp. | 64,500 | 937,866 | ||||||
| Kamigumi Co. Ltd. | 10,000 | 220,427 | ||||||
| Kao Corp. | 37,700 | 3,045,323 | ||||||
| KDDI Corp. | 158,600 | 4,375,258 | ||||||
| Kirin Holdings Co. Ltd. | 17,400 | 446,274 | ||||||
| Konami Holdings Corp. | 40,300 | 1,577,995 | ||||||
| Kyocera Corp. | 11,500 | 690,249 | ||||||
| Kyushu Railway Co. | 37,100 | 1,129,544 | ||||||
| Marubeni Corp. | 595,200 | 5,443,470 | ||||||
| Mazda Motor Corp. | 129,200 | 1,552,984 | ||||||
| Mitsubishi Corp. | 45,100 | 1,389,203 | ||||||
| Mitsubishi Estate Co. Ltd. | 31,000 | 526,382 | ||||||
| Mitsubishi Gas Chemical Co., Inc. | 23,500 | 500,268 | ||||||
| Mitsubishi UFJ Financial Group, Inc. | 380,200 | 2,362,066 | ||||||
| Mitsui Fudosan Co. Ltd. | 24,000 | 567,621 | ||||||
| Mizuho Financial Group, Inc. | 1,861,200 | 3,243,704 | ||||||
| INVESTMENTS | SHARES | VALUE | ||||||
| Japan - 21.4% (continued) | ||||||||
| Nexon Co. Ltd. * | 492,200 | $ | 6,433,796 | |||||
| Nippon Electric Glass Co. Ltd. | 4,300 | 135,174 | ||||||
| Nippon Express Co. Ltd. | 42,800 | 2,810,832 | ||||||
| Nippon Telegraph & Telephone Corp. | 29,800 | 1,344,884 | ||||||
| Nomura Holdings, Inc. | 48,200 | 229,888 | ||||||
| Nomura Real Estate Holdings, Inc. | 8,000 | 161,382 | ||||||
| NTT DOCOMO, Inc. | 35,400 | 951,466 | ||||||
| Oji Holdings Corp. | 181,000 | 1,314,413 | ||||||
| Otsuka Corp. | 3,300 | 123,090 | ||||||
| Recruit Holdings Co. Ltd. | 7,000 | 233,810 | ||||||
| Resona Holdings, Inc. | 687,200 | 3,858,262 | ||||||
| Sega Sammy Holdings, Inc. | 31,500 | 464,478 | ||||||
| Shimano, Inc. | 2,500 | 403,122 | ||||||
| Sony Corp. | 89,600 | 5,446,575 | ||||||
| SUMCO Corp. | 38,800 | 565,224 | ||||||
| Sumitomo Dainippon Pharma Co. Ltd. | 58,600 | 1,345,837 | ||||||
| Sumitomo Heavy Industries Ltd. | 31,000 | 1,106,438 | ||||||
| Sumitomo Mitsui Financial Group, Inc. | 97,200 | 3,911,704 | ||||||
| Taisei Corp. | 27,300 | 1,244,425 | ||||||
| Tokyo Electron Ltd. | 9,200 | 1,267,948 | ||||||
| Toshiba Corp. * | 18,300 | 528,838 | ||||||
| Toyo Seikan Group Holdings Ltd. | 4,200 | 87,154 | ||||||
| Toyota Motor Corp. | 36,900 | 2,298,973 | ||||||
| Yamaha Corp. | 28,100 | 1,488,960 | ||||||
|
| |||||||
| 90,190,037 | ||||||||
|
| |||||||
| Macau - 0.7% | ||||||||
| Sands China Ltd. | 38,800 | 174,736 | ||||||
| SJM Holdings Ltd. | 1,418,000 | 1,306,493 | ||||||
| Wynn Macau Ltd. | 590,800 | 1,356,830 | ||||||
|
| |||||||
| 2,838,059 | ||||||||
|
| |||||||
| Netherlands - 5.5% | ||||||||
| Aegon NV | 176,262 | 1,144,036 | ||||||
| ING Groep NV | 96,440 | 1,251,704 | ||||||
| Koninklijke Ahold Delhaize NV | 110,731 | 2,540,449 | ||||||
| Koninklijke Philips NV | 47,123 | 2,147,936 | ||||||
| NN Group NV | 39,224 | 1,750,663 | ||||||
| Royal Dutch Shell plc, Class A | 230,008 | 7,886,622 | ||||||
| Royal Dutch Shell plc, Class B | 97,616 | 3,417,201 | ||||||
| Wolters Kluwer NV | 50,039 | 3,119,428 | ||||||
|
| |||||||
| 23,258,039 | ||||||||
|
| |||||||
| Singapore - 0.9% | ||||||||
| CapitaLand Commercial Trust, REIT | 273,500 | 356,329 | ||||||
| Genting Singapore Ltd. | 1,455,000 | 1,127,821 | ||||||
| SATS Ltd. | 142,000 | 542,114 | ||||||
| Venture Corp. Ltd. | 121,900 | 1,571,865 | ||||||
|
| |||||||
| 3,598,129 | ||||||||
|
| |||||||
| South Africa - 0.3% | ||||||||
| Investec plc | 152,069 | 1,066,782 | ||||||
|
| |||||||
| Spain - 1.7% | ||||||||
| Aena SME SA (a) | 5,192 | 899,551 | ||||||
| Amadeus IT Group SA | 8,110 | 751,707 | ||||||
| Banco Bilbao Vizcaya Argentaria SA | 181,833 | 1,152,866 | ||||||
| Banco Santander SA | 66,525 | 333,068 | ||||||
| Grifols SA | 7,841 | 220,471 | ||||||
| Mapfre SA | 450,217 | 1,408,211 | ||||||
| The accompanying notes are an integral part of these financial statements. | (Continued) |
| AQR Funds | Annual Report | September 2018 | ||||||||||||||
65
Table of Contents
| Schedule of Investments | September 30, 2018 |
| AQR INTERNATIONAL MULTI-STYLE FUND |
| INVESTMENTS | SHARES | VALUE | ||||||
| Spain - 1.7% (continued) | ||||||||
| Repsol SA | 125,567 | $ | 2,499,702 | |||||
|
| |||||||
| 7,265,576 | ||||||||
|
| |||||||
| Sweden - 2.2% | ||||||||
| Atlas Copco AB, Class A | 6,163 | 177,237 | ||||||
| Electrolux AB, Series B | 13,628 | 300,214 | ||||||
| Essity AB, Class B | 60,887 | 1,528,342 | ||||||
| Hexagon AB, Class B | 9,392 | 549,871 | ||||||
| Investor AB, Class B | 8,330 | 383,860 | ||||||
| Sandvik AB | 112,359 | 1,989,233 | ||||||
| SKF AB, Class B | 12,568 | 247,300 | ||||||
| Swedbank AB, Class A | 45,795 | 1,132,609 | ||||||
| Telefonaktiebolaget LM Ericsson, Class B | 74,353 | 658,083 | ||||||
| Volvo AB, Class B | 138,084 | 2,435,380 | ||||||
|
| |||||||
| 9,402,129 | ||||||||
|
| |||||||
| Switzerland - 8.0% | ||||||||
| Coca-Cola HBC AG * | 17,489 | 595,836 | ||||||
| Ferguson plc | 7,834 | 664,495 | ||||||
| Lonza Group AG (Registered) * | 2,171 | 742,693 | ||||||
| Nestle SA (Registered) | 64,681 | 5,383,828 | ||||||
| Novartis AG (Registered) | 70,945 | 6,106,837 | ||||||
| Partners Group Holding AG | 386 | 305,989 | ||||||
| Roche Holding AG | 43,007 | 10,399,757 | ||||||
| SGS SA (Registered) | 56 | 147,444 | ||||||
| Sika AG (Registered) | 4,349 | 632,864 | ||||||
| Sonova Holding AG (Registered) | 10,137 | 2,011,871 | ||||||
| Straumann Holding AG (Registered) | 1,303 | 981,632 | ||||||
| Swatch Group AG (The) | 2,651 | 1,053,597 | ||||||
| Swiss Life Holding AG (Registered) * | 8,121 | 3,079,251 | ||||||
| Zurich Insurance Group AG | 4,754 | 1,498,961 | ||||||
|
| |||||||
| 33,605,055 | ||||||||
|
| |||||||
| United Kingdom - 12.5% | ||||||||
| 3i Group plc | 23,824 | 291,722 | ||||||
| BAE Systems plc | 345,236 | 2,830,925 | ||||||
| Barratt Developments plc | 74,788 | 552,306 | ||||||
| Berkeley Group Holdings plc | 47,642 | 2,282,374 | ||||||
| BP plc | 580,741 | 4,451,230 | ||||||
| British American Tobacco plc | 66,191 | 3,085,857 | ||||||
| British Land Co. plc (The), REIT | 80,014 | 643,566 | ||||||
| Burberry Group plc | 60,959 | 1,600,740 | ||||||
| Compass Group plc | 78,079 | 1,735,955 | ||||||
| Direct Line Insurance Group plc | 444,814 | 1,877,470 | ||||||
| Experian plc | 21,133 | 542,274 | ||||||
| Hammerson plc, REIT | 43,773 | 260,456 | ||||||
| HSBC Holdings plc | 184,849 | 1,612,879 | ||||||
| Imperial Brands plc | 25,501 | 887,383 | ||||||
| International Consolidated Airlines Group SA | 356,298 | 3,056,528 | ||||||
| Intertek Group plc | 7,874 | 512,222 | ||||||
| J Sainsbury plc | 355,007 | 1,487,301 | ||||||
| Johnson Matthey plc | 21,845 | 1,013,678 | ||||||
| Land Securities Group plc, REIT | 25,856 | 297,706 | ||||||
| Legal & General Group plc | 460,171 | 1,570,929 | ||||||
| Lloyds Banking Group plc | 3,829,583 | 2,945,287 | ||||||
| London Stock Exchange Group plc | 9,340 | 558,128 | ||||||
| Marks & Spencer Group plc | 32,494 | 122,257 | ||||||
| Meggitt plc | 102,218 | 754,666 | ||||||
| INVESTMENTS | SHARES | VALUE | ||||||
| United Kingdom - 12.5% (continued) | ||||||||
| Mondi plc | 5,198 | $ | 142,320 | |||||
| Next plc | 35,277 | 2,524,638 | ||||||
| Persimmon plc | 86,666 | 2,668,215 | ||||||
| Prudential plc | 49,661 | 1,138,630 | ||||||
| RELX plc * | 27,549 | 578,782 | ||||||
| RELX plc | 50,161 | 1,055,219 | ||||||
| Rolls-Royce Holdings plc * | 85,868 | 1,104,726 | ||||||
| Royal Mail plc | 133,649 | 830,814 | ||||||
| Segro plc, REIT | 105,872 | 880,992 | ||||||
| Sky plc | 27,519 | 620,099 | ||||||
| Taylor Wimpey plc | 522,800 | 1,168,562 | ||||||
| Travis Perkins plc | 29,002 | 402,462 | ||||||
| Unilever NV, CVA | 43,657 | 2,428,413 | ||||||
| Unilever plc | 31,184 | 1,713,066 | ||||||
|
| |||||||
| 52,230,777 | ||||||||
|
| |||||||
| United States - 1.8% | ||||||||
| Bausch Health Cos., Inc. (1)* | 226,978 | 5,828,871 | ||||||
| Shire plc | 25,582 | 1,545,559 | ||||||
|
| |||||||
| 7,374,430 | ||||||||
|
| |||||||
TOTAL COMMON STOCKS |
| 407,505,675 | ||||||
|
| |||||||
| SHORT-TERM INVESTMENTS - 0.9% | ||||||||
| INVESTMENT COMPANIES - 0.9% | ||||||||
| Limited Purpose Cash Investment Fund, 2.06% (1)(b) | ||||||||
(Cost $3,577,234) | 3,577,592 | 3,577,234 | ||||||
|
| |||||||
TOTAL INVESTMENTS IN SECURITIES AT VALUE - 98.0% | 411,082,909 | |||||||
|
| |||||||
| OTHER ASSETS IN EXCESS OF LIABILITIES - 2.0% (c) | 8,324,044 | |||||||
|
| |||||||
Net Assets - 100.0% | $ | 419,406,953 | ||||||
|
| |||||||
| SECTOR | VALUE | % OF NET ASSETS | ||||||
| Communication Services | $ | 18,164,736 | 4.3 | % | ||||
| Consumer Discretionary | 59,734,891 | 14.2 | ||||||
| Consumer Staples | 33,203,980 | 7.9 | ||||||
| Energy | 38,872,865 | 9.3 | ||||||
| Financials | 72,073,040 | 17.2 | ||||||
| Health Care | 50,553,155 | 12.1 | ||||||
| Industrials | 56,291,231 | 13.4 | ||||||
| Information Technology | 28,047,990 | 6.7 | ||||||
| Materials | 35,449,190 | 8.4 | ||||||
| Real Estate | 10,484,011 | 2.5 | ||||||
| Utilities | 4,630,586 | 1.1 | ||||||
| Short-Term Investments | 3,577,234 | 0.9 | ||||||
|
|
|
| |||||
Total Investments In Securities | 411,082,909 | 98.0 | ||||||
| Other Assets in Excess of Liabilities (c) | 8,324,044 | 2.0 | ||||||
|
|
|
| |||||
Net Assets | $ | 419,406,953 | 100.0 | % | ||||
|
|
|
| |||||
| The accompanying notes are an integral part of these financial statements. | (Continued) |
| AQR Funds | Annual Report | September 2018 | ||||||||||||||
66
Table of Contents
| Schedule of Investments | September 30, 2018 |
| AQR INTERNATIONAL MULTI-STYLE FUND |
| * | Non-income producing security. |
| (a) | Securities exempt from registration under Rule 144A or section 4(2), of the Securities Act of 1933. Under procedures approved by the Board of Trustees, such securities have been determined to be liquid by the investment adviser and may be resold, normally to qualified institutional buyers in transactions exempt from registration. Total value of all such securities at September 30, 2018 amounted to $9,353,041, which represents approximately 2.23% of net assets of the fund. |
| (b) | Represents 7-day effective yield as of September 30, 2018. |
| (c) | Includes appreciation/(depreciation) on futures contracts. |
All securities are Level 2 with respect to ASC 820, unless otherwise noted in parentheses.
| (1) | Level 1 security (See Note 4). |
Abbreviations
CVA - Dutch Certification
OYJ - Public Traded Company
Preference - A special type of equity investment that shares in the earnings of the company, has limited voting rights, and may have a dividend preference. Preference shares may also have liquidation preference.
REIT - Real Estate Investment Trust
Futures contracts outstanding as of September 30, 2018:
Exchange Traded
| Description | NUMBER OF CONTRACTS | EXPIRATION DATE | TRADING CURRENCY | NOTIONAL AMOUNT | VALUE AND UNREALIZED APPRECIATION (DEPRECIATION) | |||||||||||
| Long Contracts | ||||||||||||||||
| MSCI EAFE E-Mini Index | 80 | 12/2018 | USD | $7,902,000 | $(9,809 | ) | ||||||||||
|
| |||||||||||||||
| $(9,809 | ) | |||||||||||||||
|
| |||||||||||||||
USD - United States Dollar
| COUNTERPARTY | OVER THE COUNTER | EXCHANGE TRADED | TOTAL | |||||||||
| JPMS | ||||||||||||
| Cash | $— | $327 | $327 | |||||||||
| ||||||||||||
| The accompanying notes are an integral part of these financial statements. |
| AQR Funds | Annual Report | September 2018 | ||||||||||||||
67
Table of Contents
| Schedule of Investments | September 30, 2018 |
| AQR EMERGING MULTI-STYLE FUND |
| INVESTMENTS | SHARES | VALUE | ||||||
| COMMON STOCKS - 97.2% |
| |||||||
| Brazil - 6.9% | ||||||||
| Banco Bradesco SA, ADR (1)* | 97,732 | $ | 691,943 | |||||
| Banco do Brasil SA (1)* | 239,300 | 1,741,473 | ||||||
| Banco Santander Brasil SA, ADR (1) | 76,968 | 678,088 | ||||||
| Braskem SA (Preference), Class A (1) | 11,200 | 161,626 | ||||||
| Centrais Eletricas Brasileiras SA (1)* | 77,800 | 298,790 | ||||||
| Embraer SA, ADR (1) | 9,597 | 188,005 | ||||||
| Fibria Celulose SA, ADR (1)(a) | 19,411 | 359,686 | ||||||
| Hypera SA (1)* | 54,000 | 380,944 | ||||||
| Itau Unibanco Holding SA, ADR (1) | 35,791 | 392,985 | ||||||
| Itausa—Investimentos Itau SA (Preference) (1) | 357,495 | 890,518 | ||||||
| M Dias Branco SA (1)* | 13,600 | 132,782 | ||||||
| Natura Cosmeticos SA (1) | 15,100 | 106,037 | ||||||
| Petroleo Brasileiro SA (Preference) (1)* | 401,300 | 2,096,651 | ||||||
| Porto Seguro SA (1) | 35,100 | 516,955 | ||||||
| Sul America SA (1) | 196,497 | 1,262,606 | ||||||
| Suzano Papel e Celulose SA (1) | 311,700 | 3,703,924 | ||||||
| TIM Participacoes SA, ADR (1) | 168,454 | 2,440,898 | ||||||
| Vale SA, ADR (1) | 351,237 | 5,212,358 | ||||||
|
| |||||||
| 21,256,269 | ||||||||
|
| |||||||
| Chile - 1.9% | ||||||||
| Banco de Chile, ADR (1)(a) | 5,881 | 535,465 | ||||||
| Banco de Credito e Inversiones SA | 4,944 | 334,403 | ||||||
| Banco Santander Chile, ADR (1) | 51,060 | 1,632,898 | ||||||
| Cencosud SA | 174,342 | 414,438 | ||||||
| Cia Cervecerias Unidas SA, ADR (1)(a) | 4,818 | 134,422 | ||||||
| Empresas CMPC SA | 209,890 | 847,056 | ||||||
| Empresas COPEC SA | 16,824 | 259,910 | ||||||
| Enel Americas SA, ADR (1) | 108,678 | 840,081 | ||||||
| Enel Chile SA, ADR (1) | 68,690 | 344,137 | ||||||
| Latam Airlines Group SA, ADR (1)(a) | 52,224 | 490,906 | ||||||
|
| |||||||
| 5,833,716 | ||||||||
|
| |||||||
| China - 27.5% | ||||||||
| 3SBio, Inc. (b) | 73,000 | 122,326 | ||||||
| 58.com, Inc., ADR (1)* | 4,817 | 354,531 | ||||||
| AAC Technologies Holdings, Inc. | 13,000 | 134,242 | ||||||
| Agricultural Bank of China Ltd., Class A* | 1,060,471 | 599,937 | ||||||
| Agricultural Bank of China Ltd., Class H | 2,752,000 | 1,349,639 | ||||||
| Air China Ltd., Class H | 406,000 | 390,543 | ||||||
| Alibaba Group Holding Ltd., ADR (1)* | 69,182 | 11,398,425 | ||||||
| Alibaba Health Information Technology Ltd. * | 664,000 | 649,320 | ||||||
| Anhui Conch Cement Co. Ltd., Class H | 111,000 | 666,544 | ||||||
| ANTA Sports Products Ltd. | 159,000 | 759,040 | ||||||
| Autohome, Inc., ADR (1) | 2,981 | 230,759 | ||||||
| BAIC Motor Corp. Ltd., Class H (b) | 324,500 | 261,193 | ||||||
| Baidu, Inc., ADR (1)* | 16,444 | 3,760,414 | ||||||
| Bank of China Ltd., Class A * | 1,038,900 | 562,004 | ||||||
| Bank of China Ltd., Class H | 3,116,000 | 1,376,783 | ||||||
| China Communications Services Corp. Ltd., Class H | 912,000 | 840,963 | ||||||
| China Construction Bank Corp., Class H | 5,620,000 | 4,912,445 | ||||||
| China Evergrande Group | 585,000 | 1,633,259 | ||||||
| China Huarong Asset Management Co. Ltd., Class H (b) | 1,073,000 | 197,216 | ||||||
| INVESTMENTS | SHARES | VALUE | ||||||
| China - 27.5% (continued) | ||||||||
| China Medical System Holdings Ltd. | 117,000 | $ | 162,920 | |||||
| China Mobile Ltd. | 380,175 | 3,737,821 | ||||||
| China National Building Material Co. Ltd., Class H | 1,830,000 | 1,622,865 | ||||||
| China Overseas Land & Investment Ltd. | 380,000 | 1,189,751 | ||||||
| China Petroleum & Chemical Corp., Class H | 2,500,000 | 2,511,874 | ||||||
| China Resources Beer Holdings Co. Ltd. | 242,000 | 970,459 | ||||||
| China Resources Cement Holdings Ltd. | 996,000 | 1,158,279 | ||||||
| China Resources Land Ltd. | 290,000 | 1,016,190 | ||||||
| China Shenhua Energy Co. Ltd., Class H | 300,000 | 683,239 | ||||||
| China Vanke Co. Ltd., Class H | 214,000 | 705,503 | ||||||
| Chongqing Rural Commercial Bank Co. Ltd., Class H | 1,189,000 | 648,862 | ||||||
| CNOOC Ltd., ADR (1) | 14,206 | 2,806,253 | ||||||
| Country Garden Holdings Co. Ltd. | 1,591,000 | 2,004,947 | ||||||
| CSPC Pharmaceutical Group Ltd. | 938,000 | 1,984,090 | ||||||
| Ctrip.com International Ltd., ADR (1)* | 20,700 | 769,419 | ||||||
| Far East Horizon Ltd. | 332,000 | 316,642 | ||||||
| GCL-Poly Energy Holdings Ltd. *(a) | 3,503,000 | 245,917 | ||||||
| Great Wall Motor Co. Ltd., Class H (a) | 186,500 | 118,533 | ||||||
| Huaneng Renewables Corp. Ltd., Class H | 594,000 | 177,123 | ||||||
| Huazhu Group Ltd., ADR (1) | 7,502 | 242,315 | ||||||
| Industrial & Commercial Bank of China Ltd., Class H | 5,532,000 | 4,038,878 | ||||||
| Industrial Bank Co. Ltd., Class A * | 63,643 | 147,668 | ||||||
| JD.com, Inc., ADR (1)* | 41,989 | 1,095,493 | ||||||
| Jiangsu Hengrui Medicine Co. Ltd. *, Class A | 22,282 | 205,751 | ||||||
| Kingdee International Software Group Co. Ltd. | 560,000 | 607,832 | ||||||
| Luye Pharma Group Ltd. | 406,500 | 363,943 | ||||||
| Momo, Inc., ADR (1)* | 6,789 | 297,358 | ||||||
| NetEase, Inc., ADR (1) | 4,926 | 1,124,360 | ||||||
| New Oriental Education & Technology Group, Inc., ADR (1)* | 7,867 | 582,237 | ||||||
| Nexteer Automotive Group Ltd. | 249,000 | 394,265 | ||||||
| People’s Insurance Co. Group of China Ltd. (The), Class H | 426,000 | 190,904 | ||||||
| PICC Property & Casualty Co. Ltd., Class H | 1,224,000 | 1,440,541 | ||||||
| Shandong Weigao Group Medical Polymer Co. Ltd., Class H | 240,000 | 236,835 | ||||||
| Shanghai Pharmaceuticals Holding Co. Ltd., Class H | 89,200 | 222,980 | ||||||
| Shenzhou International Group Holdings Ltd. | 32,000 | 410,596 | ||||||
| Sihuan Pharmaceutical Holdings Group Ltd. | 1,005,000 | 205,319 | ||||||
| SINA Corp. (1)* | 3,734 | 259,438 | ||||||
| Sinopec Shanghai Petrochemical Co. Ltd., Class H | 2,450,000 | 1,494,250 | ||||||
| Sinopharm Group Co. Ltd., Class H | 170,400 | 833,488 | ||||||
| Sinotruk Hong Kong Ltd. (a) | 417,000 | 909,798 | ||||||
| TAL Education Group, ADR (1)* | 16,458 | 423,135 | ||||||
| Tencent Holdings Ltd. | 256,000 | 10,452,691 | ||||||
| Tingyi Cayman Islands Holding Corp. | 478,000 | 877,713 | ||||||
| TravelSky Technology Ltd., Class H | 154,000 | 400,419 | ||||||
| Tsingtao Brewery Co. Ltd., Class H | 176,000 | 825,606 | ||||||
| Vipshop Holdings Ltd., ADR (1)* | 24,408 | 152,306 | ||||||
| The accompanying notes are an integral part of these financial statements. | (Continued) |
| AQR Funds | Annual Report | September 2018 | ||||||||||||||
68
Table of Contents
| Schedule of Investments | September 30, 2018 |
| AQR EMERGING MULTI-STYLE FUND |
| INVESTMENTS | SHARES | VALUE | ||||||
| China - 27.5% (continued) | ||||||||
| Weibo Corp., ADR (1)*(a) | 2,743 | $ | 200,596 | |||||
| Weichai Power Co. Ltd., Class H | 1,501,000 | 1,858,156 | ||||||
| Yum China Holdings, Inc. (1) | 25,244 | 886,317 | ||||||
| Zhongsheng Group Holdings Ltd. | 370,000 | 898,048 | ||||||
|
| |||||||
| 85,309,506 | ||||||||
|
| |||||||
| Hong Kong - 2.9% | ||||||||
| Bank of Communications Co. Ltd. * | 302,824 | 257,200 | ||||||
| Haier Electronics Group Co. Ltd. * | 876,000 | 2,371,634 | ||||||
| Kingboard Holdings Ltd. | 96,500 | 314,128 | ||||||
| Kingboard Laminates Holdings Ltd. | 327,500 | 290,375 | ||||||
| Nine Dragons Paper Holdings Ltd. | 2,272,000 | 2,449,923 | ||||||
| Sino Biopharmaceutical Ltd. | 1,687,500 | 1,569,602 | ||||||
| SSY Group Ltd. | 238,000 | 230,425 | ||||||
| Sun Art Retail Group Ltd. | 1,240,000 | 1,608,657 | ||||||
|
| |||||||
| 9,091,944 | ||||||||
|
| |||||||
| Hungary - 0.1% | ||||||||
| MOL Hungarian Oil & Gas plc | 38,304 | 412,570 | ||||||
|
| |||||||
| India - 8.3% | ||||||||
| Aurobindo Pharma Ltd. | 14,610 | 150,036 | ||||||
| Axis Bank Ltd., GDR *(c) | 10,786 | 456,206 | ||||||
| Coal India Ltd. | 37,327 | 137,139 | ||||||
| Dabur India Ltd. | 18,276 | 107,642 | ||||||
| Dr Reddy’s Laboratories Ltd., ADR (1) | 23,550 | 814,830 | ||||||
| Godrej Consumer Products Ltd. | 12,669 | 134,363 | ||||||
| Hero MotoCorp Ltd. | 2,340 | 94,702 | ||||||
| Hindustan Unilever Ltd. | 118,167 | 2,622,500 | ||||||
| Indian Oil Corp. Ltd. | 339,879 | 718,920 | ||||||
| Infosys Ltd., ADR (1) | 643,580 | 6,545,208 | ||||||
| JSW Steel Ltd. | 20,085 | 105,798 | ||||||
| Larsen & Toubro Ltd., GDR (c) | 5,188 | 90,011 | ||||||
| NTPC Ltd. | 46,969 | 108,079 | ||||||
| Oil & Natural Gas Corp. Ltd. | 243,558 | 595,697 | ||||||
| Reliance Industries Ltd., GDR (b) | 102,474 | 3,526,021 | ||||||
| State Bank of India, GDR *(c) | 11,670 | 430,873 | ||||||
| Sun Pharmaceutical Industries Ltd. | 28,407 | 244,234 | ||||||
| Tata Consultancy Services Ltd. | 114,958 | 3,463,116 | ||||||
| Tata Motors Ltd., ADR (1)* | 7,932 | 121,836 | ||||||
| Tech Mahindra Ltd. | 279,044 | 2,869,964 | ||||||
| Vedanta Ltd., ADR (1) | 13,149 | 168,307 | ||||||
| Wipro Ltd., ADR (1)(a) | 406,684 | 2,118,824 | ||||||
|
| |||||||
| 25,624,306 | ||||||||
|
| |||||||
| Indonesia - 2.8% | ||||||||
| Adaro Energy Tbk. PT | 15,338,700 | 1,887,329 | ||||||
| Bank Central Asia Tbk. PT | 420,200 | 680,619 | ||||||
| Bank Mandiri Persero Tbk. PT | 1,170,500 | 527,443 | ||||||
| Bank Negara Indonesia Persero Tbk. PT | 1,509,700 | 749,705 | ||||||
| Bank Rakyat Indonesia Persero Tbk. PT | 7,912,000 | 1,671,953 | ||||||
| Gudang Garam Tbk. PT | 65,800 | 326,906 | ||||||
| Indah Kiat Pulp & Paper Corp. Tbk. PT | 523,600 | 609,227 | ||||||
| Indofood CBP Sukses Makmur Tbk. PT | 224,100 | 132,808 | ||||||
| Indofood Sukses Makmur Tbk. PT | 1,539,300 | 609,509 | ||||||
| United Tractors Tbk. PT | 603,100 | 1,335,283 | ||||||
|
| |||||||
| 8,530,782 | ||||||||
|
| |||||||
| INVESTMENTS | SHARES | VALUE | ||||||
| Malaysia - 3.3% | ||||||||
| AirAsia Group Bhd. | 1,855,592 | $ | 1,416,427 | |||||
| CIMB Group Holdings Bhd. | 69,100 | 100,321 | ||||||
| Genting Bhd. | 288,600 | 544,566 | ||||||
| Hartalega Holdings Bhd. | 52,300 | 83,612 | ||||||
| Hong Leong Bank Bhd. | 118,500 | 589,330 | ||||||
| Malayan Banking Bhd. | 1,005,300 | 2,377,664 | ||||||
| Malaysia Airports Holdings Bhd. | 40,000 | 85,995 | ||||||
| My EG Services Bhd. | 612,100 | 258,619 | ||||||
| Petronas Chemicals Group Bhd. | 397,800 | 899,618 | ||||||
| Public Bank Bhd. | 284,100 | 1,715,894 | ||||||
| Sime Darby Bhd. | 687,200 | 433,298 | ||||||
| Tenaga Nasional Bhd. | 400,400 | 1,497,089 | ||||||
| Top Glove Corp. Bhd. | 67,700 | 174,297 | ||||||
|
| |||||||
| 10,176,730 | ||||||||
|
| |||||||
| Mexico - 2.2% | ||||||||
| Alfa SAB de CV, Class A (1)(a) | 115,500 | 148,927 | ||||||
| America Movil SAB de CV, Class L, ADR (1) | 48,215 | 774,333 | ||||||
| Arca Continental SAB de CV (1) | 23,000 | 148,565 | ||||||
| Coca-Cola Femsa SAB de CV, ADR (1) | 2,337 | 143,118 | ||||||
| Fomento Economico Mexicano SAB de CV, ADR (1) | 5,851 | 579,073 | ||||||
| Grupo Aeroportuario del Pacifico SAB de CV, Class B (1)(a) | 34,000 | 371,685 | ||||||
| Grupo Bimbo SAB de CV, Series A (1) | 52,100 | 111,110 | ||||||
| Grupo Financiero Banorte SAB de CV, Class O (1) | 163,400 | 1,181,363 | ||||||
| Grupo Financiero Inbursa SAB de CV, Class O (1) | 101,700 | 159,555 | ||||||
| Wal-Mart de Mexico SAB de CV (1) | 1,030,400 | 3,140,093 | ||||||
|
| |||||||
| 6,757,822 | ||||||||
|
| |||||||
| Peru - 0.3% | ||||||||
| Credicorp Ltd. (1) | 3,587 | 800,188 | ||||||
|
| |||||||
| Philippines - 0.6% | ||||||||
| Ayala Corp. | 8,590 | 147,505 | ||||||
| Ayala Land, Inc. | 183,900 | 136,316 | ||||||
| BDO Unibank, Inc. | 152,970 | 339,175 | ||||||
| International Container Terminal Services, Inc. | 124,280 | 216,307 | ||||||
| JG Summit Holdings, Inc. | 92,080 | 91,871 | ||||||
| Jollibee Foods Corp. | 26,930 | 128,042 | ||||||
| Security Bank Corp. | 80,110 | 228,268 | ||||||
| SM Investments Corp. | 25,640 | 428,837 | ||||||
|
| |||||||
| 1,716,321 | ||||||||
|
| |||||||
| Poland - 2.1% | ||||||||
| Bank Polska Kasa Opieki SA | 6,104 | 175,673 | ||||||
| Grupa Lotos SA | 39,591 | 805,263 | ||||||
| Jastrzebska Spolka Weglowa SA * | 20,255 | 364,429 | ||||||
| LPP SA | 306 | 715,869 | ||||||
| PGE Polska Grupa Energetyczna SA * | 146,720 | 379,224 | ||||||
| Polski Koncern Naftowy ORLEN SA | 79,132 | 2,169,089 | ||||||
| Polskie Gornictwo Naftowe i Gazownictwo SA * | 407,484 | 715,249 | ||||||
| Powszechna Kasa Oszczednosci Bank Polski SA | 70,126 | 814,668 | ||||||
| Powszechny Zaklad Ubezpieczen SA | 11,212 | 120,660 | ||||||
| The accompanying notes are an integral part of these financial statements. | (Continued) |
| AQR Funds | Annual Report | September 2018 | ||||||||||||||
69
Table of Contents
| Schedule of Investments | September 30, 2018 |
| AQR EMERGING MULTI-STYLE FUND |
| INVESTMENTS | SHARES | VALUE | ||||||
| Poland - 2.1% (continued) | ||||||||
| Santander Bank Polska SA | 1,575 | $ | 160,180 | |||||
| Tauron Polska Energia SA * | 278,523 | 133,736 | ||||||
|
| |||||||
| 6,554,040 | ||||||||
|
| |||||||
| Russia - 3.4% | ||||||||
| Gazprom PJSC, ADR | 350,088 | 1,746,950 | ||||||
| LUKOIL PJSC, ADR | 24,570 | 1,881,407 | ||||||
| Magnit PJSC, GDR (c) | 11,089 | 157,309 | ||||||
| Mobile TeleSystems PJSC, ADR (1) | 61,619 | 525,610 | ||||||
| Novatek PJSC, GDR (c) | 5,239 | 960,892 | ||||||
| Novolipetsk Steel PJSC, GDR (c) | 40,723 | 1,096,050 | ||||||
| Rosneft Oil Co. PJSC, GDR (c) | 68,272 | 510,112 | ||||||
| Severstal PJSC, GDR (c) | 89,292 | 1,487,162 | ||||||
| Surgutneftegas PJSC, ADR | 88,464 | 365,219 | ||||||
| Tatneft PJSC, ADR | 22,939 | 1,750,243 | ||||||
|
| |||||||
| 10,480,954 | ||||||||
|
| |||||||
| South Africa - 4.7% | ||||||||
| Absa Group Ltd. | 34,911 | 374,427 | ||||||
| Aspen Pharmacare Holdings Ltd. | 6,824 | 81,658 | ||||||
| Bidvest Group Ltd. (The) | 124,689 | 1,631,024 | ||||||
| Exxaro Resources Ltd. | 48,077 | 494,245 | ||||||
| Foschini Group Ltd. (The) | 59,971 | 735,919 | ||||||
| Growthpoint Properties Ltd., REIT | 84,208 | 138,178 | ||||||
| Imperial Holdings Ltd. | 179,549 | 2,219,940 | ||||||
| Investec Ltd. | 125,661 | 883,530 | ||||||
| Kumba Iron Ore Ltd. | 38,953 | 882,616 | ||||||
| Life Healthcare Group Holdings Ltd. | 110,547 | 191,956 | ||||||
| Mr Price Group Ltd. | 28,761 | 463,842 | ||||||
| Nedbank Group Ltd. | 20,461 | 382,760 | ||||||
| Netcare Ltd. | 231,199 | 395,104 | ||||||
| Pick n Pay Stores Ltd. | 114,317 | 556,261 | ||||||
| Redefine Properties Ltd., REIT | 217,038 | 153,713 | ||||||
| Remgro Ltd. | 28,077 | 391,291 | ||||||
| Sappi Ltd. | 76,092 | 477,350 | ||||||
| SPAR Group Ltd. (The) | 13,751 | 179,094 | ||||||
| Standard Bank Group Ltd. | 124,074 | 1,534,239 | ||||||
| Telkom SA SOC Ltd. | 67,136 | 245,192 | ||||||
| Truworths International Ltd. | 354,966 | 2,093,635 | ||||||
| Woolworths Holdings Ltd. | 25,277 | 88,619 | ||||||
|
| |||||||
| 14,594,593 | ||||||||
|
| |||||||
| South Korea - 14.7% | ||||||||
| Celltrion Healthcare Co. Ltd. * | 4,665 | 387,824 | ||||||
| Celltrion, Inc. * | 12,978 | 3,478,052 | ||||||
| Daelim Industrial Co. Ltd. | 6,698 | 498,786 | ||||||
| DB Insurance Co. Ltd. | 9,803 | 643,333 | ||||||
| E-MART, Inc. | 2,079 | 388,969 | ||||||
| Hana Financial Group, Inc. | 16,694 | 670,311 | ||||||
| Hanwha Chemical Corp. | 9,744 | 169,510 | ||||||
| Hanwha Corp. | 45,008 | 1,331,090 | ||||||
| Hanwha Life Insurance Co. Ltd. | 61,659 | 294,065 | ||||||
| Hyundai Department Store Co. Ltd. | 1,872 | 167,756 | ||||||
| Hyundai Marine & Fire Insurance Co. Ltd. | 41,668 | 1,575,104 | ||||||
| Hyundai Mobis Co. Ltd. | 1,441 | 296,092 | ||||||
| Korea Investment Holdings Co. Ltd. | 1,686 | 115,612 | ||||||
| Korean Air Lines Co. Ltd. | 7,241 | 183,394 | ||||||
| Kumho Petrochemical Co. Ltd. | 4,523 | 401,584 | ||||||
| LG Corp. | 5,888 | 385,400 | ||||||
| INVESTMENTS | SHARES | VALUE | ||||||
| South Korea - 14.7% (continued) | ||||||||
| LG Electronics, Inc. | 65,516 | $ | 4,192,412 | |||||
| Lotte Chemical Corp. | 11,161 | 2,797,035 | ||||||
| Medy-Tox, Inc. | 429 | 239,458 | ||||||
| POSCO | 9,346 | 2,480,866 | ||||||
| Posco Daewoo Corp. | 12,448 | 234,870 | ||||||
| S-1 Corp. | 1,090 | 89,808 | ||||||
| Samsung Electronics Co. Ltd. | 306,854 | 12,842,108 | ||||||
| Samsung SDS Co. Ltd. | 2,461 | 512,414 | ||||||
| SillaJen, Inc. * | 10,685 | 985,867 | ||||||
| SK Hynix, Inc. | 116,587 | 7,713,152 | ||||||
| SK Innovation Co. Ltd. | 2,089 | 404,932 | ||||||
| SK Telecom Co. Ltd. | 6,090 | 1,544,029 | ||||||
| ViroMed Co. Ltd. * | 1,374 | 298,340 | ||||||
|
| |||||||
| 45,322,173 | ||||||||
|
| |||||||
| Taiwan - 10.9% | ||||||||
| Acer, Inc. * | 131,000 | 108,201 | ||||||
| ASE Technology Holding Co. Ltd. | 60,500 | 147,773 | ||||||
| AU Optronics Corp. | 2,447,000 | 1,031,950 | ||||||
| Cathay Financial Holding Co. Ltd. | 374,000 | 642,759 | ||||||
| China Airlines Ltd. | 301,000 | 91,171 | ||||||
| China Life Insurance Co. Ltd. | 1,631,283 | 1,640,242 | ||||||
| CTBC Financial Holding Co. Ltd. | 1,499,559 | 1,129,043 | ||||||
| E.Sun Financial Holding Co. Ltd. | 1,354,498 | 1,000,064 | ||||||
| Eva Airways Corp. | 786,322 | 382,361 | ||||||
| First Financial Holding Co. Ltd. | 2,128,797 | 1,449,785 | ||||||
| Formosa Chemicals & Fibre Corp. | 78,000 | 326,870 | ||||||
| Foxconn Technology Co. Ltd. | 38,000 | 92,732 | ||||||
| Fubon Financial Holding Co. Ltd. | 468,000 | 793,795 | ||||||
| General Interface Solution Holding Ltd. | 77,000 | 324,502 | ||||||
| Globalwafers Co. Ltd. | 128,000 | 1,410,563 | ||||||
| Hiwin Technologies Corp. | 44,000 | 363,549 | ||||||
| Hon Hai Precision Industry Co. Ltd. | 182,493 | 473,237 | ||||||
| Innolux Corp. | 5,526,000 | 1,918,968 | ||||||
| Macronix International | 353,000 | 294,085 | ||||||
| Mega Financial Holding Co. Ltd. | 525,000 | 472,661 | ||||||
| Nanya Technology Corp. | 952,000 | 1,817,932 | ||||||
| Phison Electronics Corp. | 83,000 | 661,490 | ||||||
| Pou Chen Corp. | 859,000 | 906,970 | ||||||
| Powertech Technology, Inc. | 305,000 | 830,992 | ||||||
| Realtek Semiconductor Corp. * | 65,000 | 289,657 | ||||||
| Shin Kong Financial Holding Co. Ltd. | 6,401,885 | 2,503,673 | ||||||
| Synnex Technology International Corp. | 107,000 | 136,364 | ||||||
| Taishin Financial Holding Co. Ltd. | 360,555 | 174,122 | ||||||
| Taiwan Business Bank | 339,040 | 123,232 | ||||||
| Taiwan Cooperative Financial Holding Co. Ltd. | 175,100 | 106,651 | ||||||
| Taiwan Semiconductor Manufacturing Co. Ltd., ADR (1) | 219,584 | 9,696,830 | ||||||
| Uni-President Enterprises Corp. | 449,000 | 1,171,443 | ||||||
| United Microelectronics Corp. | 554,000 | 292,298 | ||||||
| Winbond Electronics Corp. | 1,234,000 | 586,910 | ||||||
| WPG Holdings Ltd. | 84,640 | 102,958 | ||||||
| Zhen Ding Technology Holding Ltd. | 75,000 | 167,465 | ||||||
|
| |||||||
| 33,663,298 | ||||||||
|
| |||||||
| Thailand - 3.0% | ||||||||
| Bangkok Dusit Medical Services PCL, NVDR | 908,500 | 716,308 | ||||||
| The accompanying notes are an integral part of these financial statements. | (Continued) |
| AQR Funds | Annual Report | September 2018 | ||||||||||||||
70
Table of Contents
| Schedule of Investments | September 30, 2018 |
| AQR EMERGING MULTI-STYLE FUND |
| INVESTMENTS | SHARES | VALUE | ||||||
| Thailand - 3.0% (continued) | ||||||||
| Bumrungrad Hospital PCL, NVDR | 22,800 | $ | 131,062 | |||||
| Central Pattana PCL, NVDR | 36,900 | 94,705 | ||||||
| Krung Thai Bank PCL, NVDR | 608,800 | 380,276 | ||||||
| PTT Exploration & Production PCL, NVDR | 100,100 | 480,410 | ||||||
| PTT Global Chemical PCL, NVDR | 1,916,500 | 4,815,994 | ||||||
| Siam Cement PCL (The), NVDR | 67,500 | 931,538 | ||||||
| Thai Oil PCL, NVDR | 626,800 | 1,716,235 | ||||||
|
| |||||||
| 9,266,528 | ||||||||
|
| |||||||
| Turkey - 0.8% | ||||||||
| Akbank T.A.S. | 131,668 | 150,817 | ||||||
| Turkiye Garanti Bankasi A/S | 478,455 | 610,004 | ||||||
| Turkiye Sise ve Cam Fabrikalari A/S | 907,953 | 876,857 | ||||||
| Turkiye Vakiflar Bankasi TAO, Class D | 406,336 | 254,436 | ||||||
| Yapi ve Kredi Bankasi A/S * | 1,584,510 | 492,377 | ||||||
|
| |||||||
| 2,384,491 | ||||||||
|
| |||||||
| United Kingdom - 0.8% | ||||||||
| Mondi Ltd. | 85,143 | 2,338,193 | ||||||
|
| |||||||
TOTAL COMMON STOCKS |
| 300,114,424 | ||||||
|
| |||||||
| SHORT-TERM INVESTMENTS - 2.3% | ||||||||
| INVESTMENT COMPANIES - 2.3% | ||||||||
| Limited Purpose Cash Investment Fund, 2.06% (1)(d) | ||||||||
(Cost $7,034,358) | 7,036,264 | 7,035,561 | ||||||
|
| |||||||
| SECURITIES LENDING COLLATERAL - 0.8% | ||||||||
| Investment Companies - 0.8% | ||||||||
| Investments in a Pooled Account through Securities Lending Program with Citibank NA | ||||||||
| BlackRock Liquidity Funds T-Fund Portfolio, Institutional Shares | ||||||||
| 1.97% (1)(d)(e) | 304,521 | 304,521 | ||||||
| Limited Purpose Cash Investment Fund | ||||||||
| 2.06% (1)(d)(e) | 2,185,121 | 2,184,903 | ||||||
|
| |||||||
TOTAL SECURITIES LENDING COLLATERAL | 2,489,424 | |||||||
|
| |||||||
TOTAL INVESTMENTS IN SECURITIES AT VALUE - 100.3% |
| 309,639,409 | ||||||
|
| |||||||
LIABILITIES IN EXCESS OF OTHER ASSETS - (0.3)% (f) | (1,022,153) | |||||||
|
| |||||||
NET ASSETS - 100.0% |
| $ | 308,617,256 | |||||
|
| |||||||
| SECTOR | VALUE | % OF NET ASSETS | ||||||
| Communication Services | $ | 26,788,994 | 8.7 | % | ||||
| Consumer Discretionary | 33,533,156 | 10.9 | ||||||
| Consumer Staples | 15,578,877 | 5.1 | ||||||
| Energy | 30,971,132 | 10.0 | ||||||
| Financials | 56,931,904 | 18.4 | ||||||
| Health Care | 15,540,579 | 5.0 | ||||||
| Industrials | 13,189,076 | 4.3 | ||||||
| Information Technology | 58,701,227 | 19.0 | ||||||
| Materials | 38,028,658 | 12.3 | ||||||
| Real Estate | 7,072,563 | 2.3 | ||||||
| Utilities | 3,778,258 | 1.2 | ||||||
| Short-Term Investments | 7,035,561 | 2.3 | ||||||
| Securities Lending Collateral | 2,489,424 | 0.8 | ||||||
|
|
|
| |||||
Total Investments In Securities At Value | 309,639,409 | 100.3 | ||||||
| Liabilities in Excess of Other Assets (f) | (1,022,153 | ) | (0.3 | ) | ||||
|
|
|
| |||||
Net Assets | $ | 308,617,256 | 100.0 | % | ||||
|
|
|
| |||||
| * | Non-income producing security. |
| (a) | The security or a portion of this security is on loan at September 30, 2018. The total value of securities on loan at September 30, 2018 was $3,115,254. |
| (b) | Securities exempt from registration under Rule 144A or section 4(2), of the Securities Act of 1933. Under procedures approved by the Board of Trustees, such securities have been determined to be liquid by the investment adviser and may be resold, normally to qualified institutional buyers in transactions exempt from registration. Total value of all such securities at September 30, 2018 amounted to $4,106,756, which represents approximately 1.33% of net assets of the fund. |
| (c) | Security exempt from registration pursuant to Regulation S under the Securities Act of 1933. Regulation S applies to securities offerings that are made outside of the United States and do not involve direct selling efforts in the United States. At September 30, 2018, the value of these securities amounted to $5,188,615 or 1.68% of net assets. |
| (d) | Represents 7-day effective yield as of September 30, 2018. |
| (e) | Represents security, or portion thereof, purchased with the cash collateral received for securities on loan; additional non-cash collateral of $754,856 was received (See Note 3). |
| (f) | Includes appreciation/(depreciation) on futures contracts. |
All securities are Level 2 with respect to ASC 820, unless otherwise noted in parentheses.
| (1) | Level 1 security (See Note 4). |
Abbreviations
ADR - American Depositary Receipt
GDR - Global Depositary Receipt
NVDR - Non-Voting Depositary Receipt
PJSC - Public Joint Stock Company
Preference - A special type of equity investment that shares in the earnings of the company, has limited voting rights, and may have a dividend preference. Preference shares may also have liquidation preference.
REIT - Real Estate Investment Trust
| The accompanying notes are an integral part of these financial statements. | (Continued) |
| AQR Funds | Annual Report | September 2018 | ||||||||||||||
71
Table of Contents
| Schedule of Investments | September 30, 2018 |
| AQR EMERGING MULTI-STYLE FUND |
Futures contracts outstanding as of September 30, 2018:
Exchange Traded
| Description | Number of Contracts | Expiration Date | Trading Currency | Notional Amount | Value and Unrealized Appreciation (Depreciation) | |||||||||||
| Long Contracts | ||||||||||||||||
| MSCI Emerging Markets E-Mini Index | 68 | 12/2018 | USD | $3,568,980 | $60,750 | |||||||||||
|
| |||||||||||||||
| $60,750 | ||||||||||||||||
|
| |||||||||||||||
USD - United States Dollar
Collateral pledged to, or (received from), each counterparty at September 30, 2018 was as follows:
| COUNTERPARTY | OVER THE COUNTER | EXCHANGE TRADED | TOTAL | |||||||||
| BARC | ||||||||||||
| Cash | $— | $111,193 | $111,193 | |||||||||
| ||||||||||||
| The accompanying notes are an integral part of these financial statements. |
| AQR Funds | Annual Report | September 2018 | ||||||||||||||
72
Table of Contents
| Schedule of Investments | September 30, 2018 |
| AQR TM LARGE CAP MULTI-STYLE FUND |
| INVESTMENTS | SHARES | VALUE | ||||||
| COMMON STOCKS - 97.0% |
| |||||||
| Aerospace & Defense - 5.4% | ||||||||
| Boeing Co. (The) | 14,027 | $ | 5,216,641 | |||||
| Curtiss-Wright Corp. | 3,970 | 545,557 | ||||||
| General Dynamics Corp. | 1,880 | 384,874 | ||||||
| Huntington Ingalls Industries, Inc. | 10,430 | 2,670,914 | ||||||
| L3 Technologies, Inc. | 1,491 | 317,016 | ||||||
| Northrop Grumman Corp. | 3,315 | 1,052,082 | ||||||
| Raytheon Co. | 16,353 | 3,379,511 | ||||||
| Spirit AeroSystems Holdings, Inc., Class A | 22,271 | 2,041,583 | ||||||
| Teledyne Technologies, Inc. * | 2,603 | 642,108 | ||||||
| Textron, Inc. | 1,868 | 133,506 | ||||||
|
| |||||||
| 16,383,792 | ||||||||
|
| |||||||
| Air Freight & Logistics - 1.4% | ||||||||
| CH Robinson Worldwide, Inc. | 1,495 | 146,390 | ||||||
| Expeditors International of Washington, Inc. | 4,299 | 316,106 | ||||||
| FedEx Corp. | 15,887 | 3,825,431 | ||||||
|
| |||||||
| 4,287,927 | ||||||||
|
| |||||||
| Airlines - 0.0% (a) | ||||||||
| JetBlue Airways Corp. * | 4,468 | 86,500 | ||||||
|
| |||||||
| Auto Components - 0.4% | ||||||||
| Lear Corp. | 7,246 | 1,050,670 | ||||||
|
| |||||||
| Banks - 5.3% | ||||||||
| Bank of America Corp. | 69,166 | 2,037,630 | ||||||
| Citigroup, Inc. | 25,449 | 1,825,711 | ||||||
| East West Bancorp, Inc. | 2,023 | 122,129 | ||||||
| Fifth Third Bancorp | 13,001 | 362,988 | ||||||
| JPMorgan Chase & Co. | 47,907 | 5,405,826 | ||||||
| PNC Financial Services Group, Inc. (The) | 9,463 | 1,288,766 | ||||||
| Popular, Inc. | 9,098 | 466,273 | ||||||
| Regions Financial Corp. | 31,659 | 580,943 | ||||||
| SunTrust Banks, Inc. | 19,632 | 1,311,221 | ||||||
| TCF Financial Corp. | 9,898 | 235,671 | ||||||
| US Bancorp | 16,190 | 854,994 | ||||||
| Wells Fargo & Co. | 27,883 | 1,465,530 | ||||||
|
| |||||||
| 15,957,682 | ||||||||
|
| |||||||
| Beverages - 0.3% | ||||||||
| Constellation Brands, Inc., Class A | 4,814 | 1,037,995 | ||||||
|
| |||||||
| Biotechnology - 2.5% | ||||||||
| AbbVie, Inc. | 12,170 | 1,151,039 | ||||||
| Amgen, Inc. | 2,652 | 549,733 | ||||||
| Biogen, Inc. * | 8,381 | 2,961,091 | ||||||
| Exelixis, Inc. * | 24,575 | 435,469 | ||||||
| Gilead Sciences, Inc. | 16,292 | 1,257,905 | ||||||
| United Therapeutics Corp. * | 9,651 | 1,234,170 | ||||||
|
| |||||||
| 7,589,407 | ||||||||
|
| |||||||
| Capital Markets - 1.7% | ||||||||
| Ameriprise Financial, Inc. | 6,428 | 949,158 | ||||||
| Bank of New York Mellon Corp. (The) | 7,816 | 398,538 | ||||||
| CME Group, Inc. | 12,336 | 2,099,711 | ||||||
| Morgan Stanley | 5,289 | 246,309 | ||||||
| MSCI, Inc. | 534 | 94,737 | ||||||
| INVESTMENTS | SHARES | VALUE | ||||||
| Capital Markets - 1.7% (continued) | ||||||||
| S&P Global, Inc. | 1,350 | $ | 263,776 | |||||
| State Street Corp. | 4,693 | 393,180 | ||||||
| T. Rowe Price Group, Inc. | 6,319 | 689,908 | ||||||
|
| |||||||
| 5,135,317 | ||||||||
|
| |||||||
| Chemicals - 2.8% | ||||||||
| Celanese Corp. | 5,419 | 617,766 | ||||||
| Eastman Chemical Co. | 13,249 | 1,268,194 | ||||||
| Huntsman Corp. | 58,820 | 1,601,669 | ||||||
| LyondellBasell Industries NV, Class A | 37,286 | 3,822,188 | ||||||
| Westlake Chemical Corp. | 13,690 | 1,137,776 | ||||||
|
| |||||||
| 8,447,593 | ||||||||
|
| |||||||
| Commercial Services & Supplies - 0.7% | ||||||||
| Cintas Corp. | 1,315 | 260,120 | ||||||
| Republic Services, Inc. | 1,912 | 138,926 | ||||||
| Rollins, Inc. | 2,483 | 150,693 | ||||||
| Waste Management, Inc. | 18,416 | 1,664,070 | ||||||
|
| |||||||
| 2,213,809 | ||||||||
|
| |||||||
| Communications Equipment - 1.2% | ||||||||
| Cisco Systems, Inc. | 54,710 | 2,661,641 | ||||||
| F5 Networks, Inc. * | 4,847 | 966,589 | ||||||
|
| |||||||
| 3,628,230 | ||||||||
|
| |||||||
| Consumer Finance - 0.2% | ||||||||
| Capital One Financial Corp. | 2,959 | 280,898 | ||||||
| Credit Acceptance Corp. *(b) | 229 | 100,318 | ||||||
| Discover Financial Services | 1,777 | 135,852 | ||||||
|
| |||||||
| 517,068 | ||||||||
|
| |||||||
| Containers & Packaging - 0.4% | ||||||||
| Owens-Illinois, Inc. * | 60,973 | 1,145,683 | ||||||
|
| |||||||
| Distributors - 0.0% (a) | ||||||||
| LKQ Corp. * | 2,069 | 65,525 | ||||||
|
| |||||||
| Diversified Consumer Services - 0.0% (a) | ||||||||
| Graham Holdings Co., Class B | 215 | 124,550 | ||||||
|
| |||||||
| Diversified Financial Services - 1.4% | ||||||||
| Berkshire Hathaway, Inc., Class B * | 19,901 | 4,261,003 | ||||||
|
| |||||||
| Diversified Telecommunication Services - 0.4% | ||||||||
| Verizon Communications, Inc. | 20,277 | 1,082,589 | ||||||
|
| |||||||
| Electric Utilities - 1.9% | ||||||||
| Evergy, Inc. | 1,148 | 63,048 | ||||||
| Exelon Corp. | 108,950 | 4,756,757 | ||||||
| NextEra Energy, Inc. | 2,054 | 344,250 | ||||||
| Pinnacle West Capital Corp. | 7,960 | 630,273 | ||||||
|
| |||||||
| 5,794,328 | ||||||||
|
| |||||||
| Electrical Equipment - 0.5% | ||||||||
| Eaton Corp. plc | 16,996 | 1,474,063 | ||||||
|
| |||||||
| Electronic Equipment, Instruments & Components - 0.6% | ||||||||
| Arrow Electronics, Inc. * | 8,314 | 612,908 | ||||||
| CDW Corp. | 1,805 | 160,501 | ||||||
| The accompanying notes are an integral part of these financial statements. | (Continued) |
| AQR Funds | Annual Report | September 2018 | ||||||||||||||
73
Table of Contents
| Schedule of Investments | September 30, 2018 |
| AQR TM LARGE CAP MULTI-STYLE FUND |
| INVESTMENTS | SHARES | VALUE | ||||||
| Electronic Equipment, Instruments & Components - 0.6% (continued) | ||||||||
| FLIR Systems, Inc. | 10,781 | $ | 662,708 | |||||
| Zebra Technologies Corp., Class A * | 1,928 | 340,928 | ||||||
|
| |||||||
| 1,777,045 | ||||||||
|
| |||||||
| Entertainment - 2.2% | ||||||||
| Activision Blizzard, Inc. | 21,514 | 1,789,750 | ||||||
| Electronic Arts, Inc. * | 4,571 | 550,760 | ||||||
| Twenty-First Century Fox, Inc., Class A | 9,941 | 460,566 | ||||||
| Viacom, Inc., Class B | 91,457 | 3,087,588 | ||||||
| Walt Disney Co. (The) | 3,867 | 452,207 | ||||||
| Zynga, Inc., Class A * | 34,181 | 137,066 | ||||||
|
| |||||||
| 6,477,937 | ||||||||
|
| |||||||
| Equity Real Estate Investment Trusts (REITs) - 0.1% | ||||||||
| American Tower Corp. | 1,403 | 203,856 | ||||||
| Public Storage | 649 | 130,858 | ||||||
| Simon Property Group, Inc. | 526 | 92,970 | ||||||
|
| |||||||
| 427,684 | ||||||||
|
| |||||||
| Food & Staples Retailing - 1.2% | ||||||||
| Costco Wholesale Corp. | 1,193 | 280,212 | ||||||
| Kroger Co. (The) | 28,416 | 827,190 | ||||||
| Walmart, Inc. | 27,903 | 2,620,370 | ||||||
|
| |||||||
| 3,727,772 | ||||||||
|
| |||||||
| Food Products - 0.9% | ||||||||
| Archer-Daniels-Midland Co. | 13,809 | 694,179 | ||||||
| Ingredion, Inc. | 3,716 | 390,031 | ||||||
| Pilgrim’s Pride Corp. * | 26,085 | 471,878 | ||||||
| Tyson Foods, Inc., Class A | 19,863 | 1,182,444 | ||||||
|
| |||||||
| 2,738,532 | ||||||||
|
| |||||||
| Health Care Equipment & Supplies - 2.5% | ||||||||
| Abbott Laboratories | 11,750 | 861,980 | ||||||
| Align Technology, Inc. * | 1,687 | 659,988 | ||||||
| Baxter International, Inc. | 19,226 | 1,482,133 | ||||||
| Danaher Corp. | 24,991 | 2,715,522 | ||||||
| Medtronic plc | 16,000 | 1,573,920 | ||||||
| Varian Medical Systems, Inc. *(b) | 1,297 | 145,173 | ||||||
|
| |||||||
| 7,438,716 | ||||||||
|
| |||||||
| Health Care Providers & Services - 5.0% | ||||||||
| Aetna, Inc. | 3,078 | 624,372 | ||||||
| Anthem, Inc. | 7,414 | 2,031,807 | ||||||
| Centene Corp. * | 6,197 | 897,202 | ||||||
| Cigna Corp. | 15,751 | 3,280,146 | ||||||
| Express Scripts Holding Co. * | 5,708 | 542,317 | ||||||
| Humana, Inc. | 5,965 | 2,019,272 | ||||||
| UnitedHealth Group, Inc. | 7,879 | 2,096,129 | ||||||
| WellCare Health Plans, Inc. * | 11,523 | 3,693,006 | ||||||
|
| |||||||
| 15,184,251 | ||||||||
|
| |||||||
| Hotels, Restaurants & Leisure - 0.9% | ||||||||
| Carnival Corp. | 8,980 | 572,655 | ||||||
| Darden Restaurants, Inc. | 15,496 | 1,723,000 | ||||||
| Las Vegas Sands Corp. | 1,754 | 104,065 | ||||||
| McDonald’s Corp. | 1,933 | 323,371 | ||||||
|
| |||||||
| 2,723,091 | ||||||||
|
| |||||||
| INVESTMENTS | SHARES | VALUE | ||||||
| Household Durables - 0.1% | ||||||||
| PulteGroup, Inc. (b) | 15,185 | $ | 376,132 | |||||
|
| |||||||
| Independent Power and Renewable Electricity Producers - 0.1% | ||||||||
| Vistra Energy Corp. * | 7,299 | 181,599 | ||||||
|
| |||||||
| Insurance - 5.0% | ||||||||
| Aflac, Inc. | 20,736 | 976,044 | ||||||
| Allstate Corp. (The) | 36,129 | 3,565,932 | ||||||
| American Financial Group, Inc. | 5,631 | 624,872 | ||||||
| Assurant, Inc. | 6,651 | 717,975 | ||||||
| Assured Guaranty Ltd. | 32,097 | 1,355,456 | ||||||
| Athene Holding Ltd., Class A * | 18,261 | 943,363 | ||||||
| Chubb Ltd. | 5,879 | 785,670 | ||||||
| CNA Financial Corp. | 2,758 | 125,903 | ||||||
| Everest Re Group Ltd. | 2,552 | 583,055 | ||||||
| First American Financial Corp. | 15,261 | 787,315 | ||||||
| Hanover Insurance Group, Inc. (The) | 1,071 | 132,129 | ||||||
| Old Republic International Corp. | 35,246 | 788,805 | ||||||
| Prudential Financial, Inc. | 9,843 | 997,293 | ||||||
| Reinsurance Group of America, Inc. | 7,701 | 1,113,257 | ||||||
| Travelers Cos., Inc. (The) | 10,842 | 1,406,316 | ||||||
|
| |||||||
| 14,903,385 | ||||||||
|
| |||||||
| Interactive Media & Services - 5.3% | ||||||||
| Alphabet, Inc., Class A * | 4,461 | 5,384,784 | ||||||
| Alphabet, Inc., Class C * | 3,173 | 3,786,880 | ||||||
| Facebook, Inc., Class A * | 28,473 | 4,682,670 | ||||||
| IAC/InterActiveCorp * | 6,383 | 1,383,324 | ||||||
| Match Group, Inc. *(b) | 10,316 | 597,399 | ||||||
|
| |||||||
| 15,835,057 | ||||||||
|
| |||||||
| Internet & Direct Marketing Retail - 3.9% | ||||||||
| Amazon.com, Inc. * | 4,199 | 8,410,597 | ||||||
| Booking Holdings, Inc. * | 479 | 950,336 | ||||||
| eBay, Inc. * | 32,436 | 1,071,037 | ||||||
| Netflix, Inc. * | 3,607 | 1,349,487 | ||||||
|
| |||||||
| 11,781,457 | ||||||||
|
| |||||||
| IT Services - 4.3% | ||||||||
| Accenture plc, Class A | 7,680 | 1,307,136 | ||||||
| Akamai Technologies, Inc. * | 25,752 | 1,883,759 | ||||||
| Amdocs Ltd. | 2,488 | 164,158 | ||||||
| Booz Allen Hamilton Holding Corp. | 7,483 | 371,381 | ||||||
| Broadridge Financial Solutions, Inc. | 2,980 | 393,211 | ||||||
| Cognizant Technology Solutions Corp., Class A | 17,950 | 1,384,842 | ||||||
| DXC Technology Co. | 28,868 | 2,699,735 | ||||||
| Euronet Worldwide, Inc. * | 875 | 87,693 | ||||||
| International Business Machines Corp. | 13,578 | 2,053,129 | ||||||
| Leidos Holdings, Inc. | 1,612 | 111,486 | ||||||
| Sabre Corp. | 8,157 | 212,735 | ||||||
| Total System Services, Inc. | 8,174 | 807,101 | ||||||
| VeriSign, Inc. * | 1,127 | 180,455 | ||||||
| Visa, Inc., Class A (b) | 8,619 | 1,293,626 | ||||||
|
| |||||||
| 12,950,447 | ||||||||
|
| |||||||
| Life Sciences Tools & Services - 1.3% | ||||||||
| Bio-Techne Corp. | 547 | 111,648 | ||||||
| Charles River Laboratories International, Inc. * | 3,517 | 473,177 | ||||||
| The accompanying notes are an integral part of these financial statements. | (Continued) |
| AQR Funds | Annual Report | September 2018 | ||||||||||||||
74
Table of Contents
| Schedule of Investments | September 30, 2018 |
| AQR TM LARGE CAP MULTI-STYLE FUND |
| INVESTMENTS | SHARES | VALUE | ||||||
| Life Sciences Tools & Services - 1.3% (continued) | ||||||||
| IQVIA Holdings, Inc. * | 5,203 | $ | 675,037 | |||||
| Thermo Fisher Scientific, Inc. | 10,247 | 2,501,088 | ||||||
|
| |||||||
| 3,760,950 | ||||||||
|
| |||||||
| Machinery - 1.5% | ||||||||
| Allison Transmission Holdings, Inc. | 5,629 | 292,764 | ||||||
| Caterpillar, Inc. | 1,367 | 208,454 | ||||||
| Cummins, Inc. | 2,375 | 346,916 | ||||||
| Ingersoll-Rand plc | 2,242 | 229,357 | ||||||
| Oshkosh Corp. | 21,361 | 1,521,758 | ||||||
| Snap-on, Inc. | 2,611 | 479,379 | ||||||
| Stanley Black & Decker, Inc. (b) | 1,629 | 238,551 | ||||||
| Terex Corp. | 14,066 | 561,374 | ||||||
| Trinity Industries, Inc. | 13,809 | 505,962 | ||||||
|
| |||||||
| 4,384,515 | ||||||||
|
| |||||||
| Media - 0.3% | ||||||||
| Comcast Corp., Class A | 18,515 | 655,616 | ||||||
| John Wiley & Sons, Inc., Class A | 3,393 | 205,616 | ||||||
|
| |||||||
| 861,232 | ||||||||
|
| |||||||
| Metals & Mining - 0.2% | ||||||||
| Reliance Steel & Aluminum Co. | 3,505 | 298,941 | ||||||
| Steel Dynamics, Inc. | 8,267 | 373,586 | ||||||
|
| |||||||
| 672,527 | ||||||||
|
| |||||||
| Multiline Retail - 2.3% | ||||||||
| Kohl’s Corp. | 20,588 | 1,534,836 | ||||||
| Macy’s, Inc. | 50,325 | 1,747,787 | ||||||
| Target Corp. | 42,639 | 3,761,186 | ||||||
|
| |||||||
| 7,043,809 | ||||||||
|
| |||||||
| Multi-Utilities - 1.4% | ||||||||
| Ameren Corp. | 16,399 | 1,036,745 | ||||||
| Consolidated Edison, Inc. | 30,933 | 2,356,785 | ||||||
| DTE Energy Co. (b) | 1,863 | 203,309 | ||||||
| Public Service Enterprise Group, Inc. | 10,287 | 543,051 | ||||||
|
| |||||||
| 4,139,890 | ||||||||
|
| |||||||
| Oil, Gas & Consumable Fuels - 3.9% | ||||||||
| ConocoPhillips | 28,096 | 2,174,630 | ||||||
| Energen Corp. * | 944 | 81,344 | ||||||
| HollyFrontier Corp. | 46,663 | 3,261,744 | ||||||
| Marathon Petroleum Corp. | 15,977 | 1,277,681 | ||||||
| PBF Energy, Inc., Class A | 45,827 | 2,287,225 | ||||||
| Pioneer Natural Resources Co. | 794 | 138,307 | ||||||
| Valero Energy Corp. | 21,109 | 2,401,149 | ||||||
|
| |||||||
| 11,622,080 | ||||||||
|
| |||||||
| Personal Products - 0.2% | ||||||||
| Estee Lauder Cos., Inc. (The), Class A | 2,294 | 333,364 | ||||||
| Nu Skin Enterprises, Inc., Class A | 1,653 | 136,240 | ||||||
|
| |||||||
| 469,604 | ||||||||
|
| |||||||
| Pharmaceuticals - 3.0% | ||||||||
| Johnson & Johnson | 24,955 | 3,448,032 | ||||||
| Merck & Co., Inc. | 12,897 | 914,913 | ||||||
| Mylan NV * | 27,881 | 1,020,445 | ||||||
| Pfizer, Inc. | 71,283 | 3,141,442 | ||||||
| Zoetis, Inc. | 6,398 | 585,801 | ||||||
|
| |||||||
| 9,110,633 | ||||||||
|
| |||||||
| INVESTMENTS | SHARES | VALUE | ||||||
| Professional Services - 0.5% | ||||||||
| ManpowerGroup, Inc. | 1,044 | $ | 89,742 | |||||
| Robert Half International, Inc. | 21,056 | 1,481,922 | ||||||
|
| |||||||
| 1,571,664 | ||||||||
|
| |||||||
| Road & Rail - 0.7% | ||||||||
| CSX Corp. | 5,373 | 397,871 | ||||||
| Landstar System, Inc. | 2,365 | 288,530 | ||||||
| Norfolk Southern Corp. | 991 | 178,875 | ||||||
| Old Dominion Freight Line, Inc. | 1,018 | 164,163 | ||||||
| Union Pacific Corp. | 7,322 | 1,192,241 | ||||||
|
| |||||||
| 2,221,680 | ||||||||
|
| |||||||
| Semiconductors & Semiconductor Equipment - 5.7% | ||||||||
| Applied Materials, Inc. | 27,483 | 1,062,218 | ||||||
| Intel Corp. | 130,446 | 6,168,791 | ||||||
| Lam Research Corp. | 7,714 | 1,170,214 | ||||||
| Micron Technology, Inc. * | 100,165 | 4,530,463 | ||||||
| NVIDIA Corp. | 6,312 | 1,773,798 | ||||||
| ON Semiconductor Corp. * | 6,682 | 123,149 | ||||||
| Skyworks Solutions, Inc. | 5,004 | 453,913 | ||||||
| Texas Instruments, Inc. | 17,805 | 1,910,299 | ||||||
|
| |||||||
| 17,192,845 | ||||||||
|
| |||||||
| Software - 5.9% | ||||||||
| Adobe Systems, Inc. * | 7,762 | 2,095,352 | ||||||
| CA, Inc. | 3,327 | 146,887 | ||||||
| Cadence Design Systems, Inc. * | 3,460 | 156,807 | ||||||
| Citrix Systems, Inc. * | 2,630 | 292,351 | ||||||
| Dell Technologies, Inc., Class V * | 1,085 | 105,375 | ||||||
| Fortinet, Inc. * | 8,732 | 805,702 | ||||||
| Intuit, Inc. | 404 | 91,870 | ||||||
| Manhattan Associates, Inc. * | 4,944 | 269,942 | ||||||
| Microsoft Corp. | 89,987 | 10,291,813 | ||||||
| Oracle Corp. | 30,452 | 1,570,105 | ||||||
| VMware, Inc., Class A * | 11,650 | 1,818,099 | ||||||
|
| |||||||
| 17,644,303 | ||||||||
|
| |||||||
| Specialty Retail - 3.2% | ||||||||
| Best Buy Co., Inc. | 39,734 | 3,153,290 | ||||||
| Dick’s Sporting Goods, Inc. | 20,212 | 717,122 | ||||||
| Foot Locker, Inc. | 25,826 | 1,316,609 | ||||||
| Gap, Inc. (The) | 18,676 | 538,803 | ||||||
| Home Depot, Inc. (The) | 9,652 | 1,999,412 | ||||||
| TJX Cos., Inc. (The) | 869 | 97,345 | ||||||
| Urban Outfitters, Inc. * | 18,475 | 755,628 | ||||||
| Williams-Sonoma, Inc. (b) | 15,453 | 1,015,571 | ||||||
|
| |||||||
| 9,593,780 | ||||||||
|
| |||||||
| Technology Hardware, Storage & Peripherals - 4.2% | ||||||||
| Apple, Inc. | 50,166 | 11,324,473 | ||||||
| Hewlett Packard Enterprise Co. | 8,858 | 144,474 | ||||||
| HP, Inc. | 33,050 | 851,698 | ||||||
| NetApp, Inc. | 3,703 | 318,051 | ||||||
|
| |||||||
| 12,638,696 | ||||||||
|
| |||||||
| Textiles, Apparel & Luxury Goods - 2.5% | ||||||||
| Lululemon Athletica, Inc. * | 2,613 | 424,586 | ||||||
| Michael Kors Holdings Ltd. * | 37,849 | 2,594,928 | ||||||
| NIKE, Inc., Class B | 25,760 | 2,182,387 | ||||||
| PVH Corp. | 1,360 | 196,384 | ||||||
| The accompanying notes are an integral part of these financial statements. | (Continued) |
| AQR Funds | Annual Report | September 2018 | ||||||||||||||
75
Table of Contents
| Schedule of Investments | September 30, 2018 |
| AQR TM LARGE CAP MULTI-STYLE FUND |
| INVESTMENTS | SHARES | VALUE | ||||||
| Textiles, Apparel & Luxury Goods - 2.5% (continued) | ||||||||
| Ralph Lauren Corp. | 6,336 | $ | 871,517 | |||||
| Skechers U.S.A., Inc., Class A * | 40,390 | 1,128,093 | ||||||
|
| |||||||
| 7,397,895 | ||||||||
|
| |||||||
| Thrifts & Mortgage Finance - 0.0% (a) | ||||||||
| New York Community Bancorp, Inc. (b) | 5,186 | 53,779 | ||||||
|
| |||||||
| Tobacco - 0.7% | ||||||||
| Altria Group, Inc. | 18,086 | 1,090,767 | ||||||
| Philip Morris International, Inc. | 13,396 | 1,092,310 | ||||||
|
| |||||||
| 2,183,077 | ||||||||
|
| |||||||
| Trading Companies & Distributors - 0.9% | ||||||||
| Air Lease Corp. | 16,184 | 742,522 | ||||||
| United Rentals, Inc. * | 7,664 | 1,253,830 | ||||||
| WW Grainger, Inc. | 2,097 | 749,489 | ||||||
|
| |||||||
| 2,745,841 | ||||||||
|
| |||||||
TOTAL COMMON STOCKS |
| 292,115,636 | ||||||
|
| |||||||
| SHORT-TERM INVESTMENTS - 3.3% | ||||||||
| Investment Companies - 3.3% | ||||||||
| Limited Purpose Cash Investment Fund, 2.06% (c) | ||||||||
(Cost $9,949,098) | 9,950,718 | 9,949,723 | ||||||
|
| |||||||
| SECURITIES LENDING COLLATERAL - 0.6% | ||||||||
| Investment Companies - 0.6% | ||||||||
| Investments in a Pooled Account through Securities Lending Program with Citibank NA | ||||||||
| BlackRock Liquidity Funds T-Fund Portfolio, Institutional Shares | ||||||||
| 1.97% (c)(d) | 198,015 | 198,015 | ||||||
| Limited Purpose Cash Investment Fund | ||||||||
| 2.06% (c)(d) | 1,420,880 | 1,420,738 | ||||||
|
| |||||||
TOTAL SECURITIES LENDING COLLATERAL | 1,618,753 | |||||||
|
| |||||||
TOTAL INVESTMENTS IN SECURITIES | 303,684,112 | |||||||
|
| |||||||
| LIABILITIES IN EXCESS OF OTHER ASSETS - (0.9)% (e) | (2,604,308) | |||||||
|
| |||||||
NET ASSETS - 100.0% | $ | 301,079,804 | ||||||
|
| |||||||
| SECTOR | VALUE | % OF NET ASSETS | ||||||
| Communication Services | $ | 24,256,815 | 8.0 | % | ||||
| Consumer Discretionary | 40,156,908 | 13.3 | ||||||
| Consumer Staples | 10,156,980 | 3.4 | ||||||
| Energy | 11,622,080 | 3.9 | ||||||
| Financials | 40,828,234 | 13.6 | ||||||
| Health Care | 43,083,957 | 14.3 | ||||||
| Industrials | 35,369,791 | 11.7 | ||||||
| Information Technology | 65,831,566 | 21.9 | ||||||
| Materials | 10,265,803 | 3.4 | ||||||
| Real Estate | 427,684 | 0.1 | ||||||
| Utilities | 10,115,818 | 3.4 | ||||||
| Short-Term Investments | 9,949,723 | 3.3 | ||||||
| Securities Lending Collateral | 1,618,753 | 0.6 | ||||||
|
|
|
| |||||
Total Investments In Securities At Value | 303,684,112 | 100.9 | ||||||
| Liabilities in Excess of Other Assets (e) | (2,604,308 | ) | (0.9 | ) | ||||
|
|
|
| |||||
Net Assets | $ | 301,079,804 | 100.0 | % | ||||
|
|
|
| |||||
All securities are United States companies, unless noted otherwise in parentheses.
| * | Non-income producing security. |
| (a) | Represents less than 0.05% of net assets. |
| (b) | The security or a portion of this security is on loan at September 30, 2018. The total value of securities on loan at September 30, 2018 was $2,729,408. |
| (c) | Represents 7-day effective yield as of September 30, 2018. |
| (d) | Represents security, or portion thereof, purchased with the cash collateral received for securities on loan; additional non-cash collateral of $1,180,444 was received (See Note 3). |
| (e) | Includes appreciation/(depreciation) on futures contracts. |
All securities are Level 1 with respect to ASC 820 (See Note 4).
| The accompanying notes are an integral part of these financial statements. | (Continued) |
| AQR Funds | Annual Report | September 2018 | ||||||||||||||
76
Table of Contents
| Schedule of Investments | September 30, 2018 |
| AQR TM LARGE CAP MULTI-STYLE FUND |
Futures contracts outstanding as of September 30, 2018:
Exchange Traded
| DESCRIPTION | NUMBER OF CONTRACTS | EXPIRATION DATE | TRADING CURRENCY | NOTIONAL AMOUNT | VALUE AND UNREALIZED APPRECIATION (DEPRECIATION) | |||||||||||
| Long Contracts | ||||||||||||||||
| S&P 500 E-Mini Index | 38 | 12/2018 | USD | $5,546,100 | $24,624 | |||||||||||
|
| |||||||||||||||
| $24,624 | ||||||||||||||||
|
| |||||||||||||||
USD - United States Dollar
Collateral pledged to, or (received from), each counterparty at September 30, 2018 was as follows:
| COUNTERPARTY | OVER THE COUNTER | EXCHANGE TRADED | TOTAL | |||||||||
| JPMS | ||||||||||||
| Cash | $— | $286,285 | $286,285 | |||||||||
| ||||||||||||
| The accompanying notes are an integral part of these financial statements. |
| AQR Funds | Annual Report | September 2018 | ||||||||||||||
77
Table of Contents
| Schedule of Investments | September 30, 2018 |
| AQR TM SMALL CAP MULTI-STYLE FUND |
| INVESTMENTS | SHARES | VALUE | ||||||
| COMMON STOCKS - 97.4% | ||||||||
| Aerospace & Defense - 1.5% | ||||||||
| Aerovironment, Inc. * | 275 | $ | 30,847 | |||||
| Axon Enterprise, Inc. * | 2,029 | 138,845 | ||||||
| Ducommun, Inc. * | 687 | 28,057 | ||||||
| Esterline Technologies Corp. * | 599 | 54,479 | ||||||
| KLX, Inc. * | 750 | 47,085 | ||||||
| Moog, Inc., Class A | 620 | 53,301 | ||||||
| National Presto Industries, Inc. | 153 | 19,836 | ||||||
| Vectrus, Inc. * | 4,573 | 142,632 | ||||||
|
| |||||||
| 515,082 | ||||||||
|
| |||||||
| Air Freight & Logistics - 1.2% | ||||||||
| Air Transport Services Group, Inc. *(a) | 1,042 | 22,372 | ||||||
| Atlas Air Worldwide Holdings, Inc. * | 2,162 | 137,828 | ||||||
| Echo Global Logistics, Inc. * | 1,000 | 30,950 | ||||||
| Forward Air Corp. | 782 | 56,069 | ||||||
| Hub Group, Inc., Class A * | 4,052 | 184,771 | ||||||
|
| |||||||
| 431,990 | ||||||||
|
| |||||||
| Airlines - 0.3% | ||||||||
| Allegiant Travel Co. | 100 | 12,680 | ||||||
| Hawaiian Holdings, Inc. | 353 | 14,155 | ||||||
| SkyWest, Inc. | 613 | 36,106 | ||||||
| Spirit Airlines, Inc. * | 1,087 | 51,056 | ||||||
|
| |||||||
| 113,997 | ||||||||
|
| |||||||
| Auto Components - 1.3% | ||||||||
| American Axle & Manufacturing Holdings, Inc. * | 4,494 | 78,375 | ||||||
| Cooper-Standard Holdings, Inc. * | 1,603 | 192,328 | ||||||
| Dana, Inc. | 1,579 | 29,480 | ||||||
| Stoneridge, Inc. * | 2,017 | 59,945 | ||||||
| Tenneco, Inc. | 798 | 33,628 | ||||||
| Tower International, Inc. | 1,648 | 49,852 | ||||||
|
| |||||||
| 443,608 | ||||||||
|
| |||||||
| Automobiles - 0.0% (b) | ||||||||
| Winnebago Industries, Inc. | 192 | 6,365 | ||||||
|
| |||||||
| Banks - 6.8% | ||||||||
| 1st Source Corp. | 596 | 31,362 | ||||||
| Ameris Bancorp | 295 | 13,481 | ||||||
| BancFirst Corp. | 657 | 39,387 | ||||||
| BancorpSouth Bank | 1,587 | 51,895 | ||||||
| Berkshire Hills Bancorp, Inc. | 616 | 25,071 | ||||||
| Brookline Bancorp, Inc. | 960 | 16,032 | ||||||
| Cadence Bancorp | 3,610 | 94,293 | ||||||
| Cathay General Bancorp | 4,603 | 190,748 | ||||||
| CenterState Bank Corp. | 1,055 | 29,593 | ||||||
| Chemical Financial Corp. | 379 | 20,239 | ||||||
| City Holding Co. | 216 | 16,589 | ||||||
| Columbia Banking System, Inc. | 643 | 24,929 | ||||||
| Community Trust Bancorp, Inc. | 310 | 14,368 | ||||||
| Customers Bancorp, Inc. * | 571 | 13,436 | ||||||
| Eagle Bancorp, Inc. * | 1,279 | 64,717 | ||||||
| Enterprise Financial Services Corp. | 898 | 47,639 | ||||||
| FCB Financial Holdings, Inc., Class A * | 290 | 13,746 | ||||||
| Fidelity Southern Corp. | 888 | 22,005 | ||||||
| First Busey Corp. | 462 | 14,345 | ||||||
| INVESTMENTS | SHARES | VALUE | ||||||
| Banks - 6.8% (continued) | ||||||||
| First Commonwealth Financial Corp. | 1,715 | $ | 27,680 | |||||
| First Financial Bancorp | 386 | 11,464 | ||||||
| First Interstate BancSystem, Inc., Class A | 2,605 | 116,704 | ||||||
| First Merchants Corp. | 1,693 | 76,168 | ||||||
| First Midwest Bancorp, Inc. | 1,160 | 30,844 | ||||||
| Flushing Financial Corp. | 605 | 14,762 | ||||||
| Fulton Financial Corp. | 5,301 | 88,262 | ||||||
| Great Southern Bancorp, Inc. | 519 | 28,727 | ||||||
| Great Western Bancorp, Inc. | 4,716 | 198,968 | ||||||
| Hancock Whitney Corp. | 1,367 | 65,001 | ||||||
| Hanmi Financial Corp. | 414 | 10,309 | ||||||
| Heartland Financial USA, Inc. | 1,081 | 62,752 | ||||||
| Heritage Financial Corp. | 437 | 15,361 | ||||||
| Hilltop Holdings, Inc. (a) | 795 | 16,035 | ||||||
| Hope Bancorp, Inc. | 1,431 | 23,139 | ||||||
| Independent Bank Corp./MA | 875 | 72,275 | ||||||
| Independent Bank Group, Inc. | 221 | 14,652 | ||||||
| International Bancshares Corp. | 4,313 | 194,085 | ||||||
| LegacyTexas Financial Group, Inc. | 1,077 | 45,880 | ||||||
| Live Oak Bancshares, Inc. | 562 | 15,062 | ||||||
| MB Financial, Inc. | 1,415 | 65,246 | ||||||
| Midland States Bancorp, Inc. | 480 | 15,408 | ||||||
| NBT Bancorp, Inc. | 1,108 | 42,525 | ||||||
| OFG Bancorp | 770 | 12,436 | ||||||
| Old National Bancorp | 1,544 | 29,799 | ||||||
| Preferred Bank | 505 | 29,542 | ||||||
| Renasant Corp. | 657 | 27,075 | ||||||
| Sandy Spring Bancorp, Inc. | 415 | 16,314 | ||||||
| ServisFirst Bancshares, Inc. | 2,223 | 87,030 | ||||||
| Simmons First National Corp., Class A | 1,325 | 39,021 | ||||||
| Towne Bank (a) | 394 | 12,155 | ||||||
| TriCo Bancshares | 365 | 14,096 | ||||||
| Trustmark Corp. | 1,520 | 51,148 | ||||||
| UMB Financial Corp. | 154 | 10,919 | ||||||
| United Community Banks, Inc. | 833 | 23,232 | ||||||
| WesBanco, Inc. | 798 | 35,575 | ||||||
|
| |||||||
| 2,383,526 | ||||||||
|
| |||||||
| Beverages - 1.4% | ||||||||
| Boston Beer Co., Inc. (The), Class A * | 847 | 243,512 | ||||||
| Craft Brew Alliance, Inc. * | 676 | 11,053 | ||||||
| MGP Ingredients, Inc. (a) | 1,049 | 82,850 | ||||||
| National Beverage Corp. *(a) | 1,335 | 155,688 | ||||||
|
| |||||||
| 493,103 | ||||||||
|
| |||||||
| Biotechnology - 5.3% | ||||||||
| Acorda Therapeutics, Inc. * | 409 | 8,037 | ||||||
| Amicus Therapeutics, Inc. *(a) | 1,954 | 23,624 | ||||||
| Array BioPharma, Inc. * | 2,096 | 31,859 | ||||||
| Arrowhead Pharmaceuticals, Inc. *(a) | 1,862 | 35,695 | ||||||
| BioSpecifics Technologies Corp. * | 653 | 38,194 | ||||||
| Calithera Biosciences, Inc. * | 2,018 | 10,594 | ||||||
| CareDx, Inc. * | 1,267 | 36,553 | ||||||
| Clovis Oncology, Inc. * | 479 | 14,068 | ||||||
| Concert Pharmaceuticals, Inc. * | 1,080 | 16,027 | ||||||
| Eagle Pharmaceuticals, Inc. *(a) | 1,048 | 72,658 | ||||||
| Emergent BioSolutions, Inc. * | 4,569 | 300,777 | ||||||
| Enanta Pharmaceuticals, Inc. * | 1,660 | 141,864 | ||||||
| The accompanying notes are an integral part of these financial statements. | (Continued) |
| AQR Funds | Annual Report | September 2018 | ||||||||||||||
78
Table of Contents
| Schedule of Investments | September 30, 2018 |
| AQR TM SMALL CAP MULTI-STYLE FUND |
| INVESTMENTS | SHARES | VALUE | ||||||
| Biotechnology - 5.3% (continued) | ||||||||
| FibroGen, Inc. * | 529 | $ | 32,137 | |||||
| Genomic Health, Inc. * | 279 | 19,591 | ||||||
| Halozyme Therapeutics, Inc. * | 1,617 | 29,381 | ||||||
| Insmed, Inc. * | 1,004 | 20,301 | ||||||
| Intercept Pharmaceuticals, Inc. * | 320 | 40,435 | ||||||
| Ligand Pharmaceuticals, Inc. * | 216 | 59,290 | ||||||
| Loxo Oncology, Inc. * | 424 | 72,432 | ||||||
| Momenta Pharmaceuticals, Inc. * | 505 | 13,281 | ||||||
| Myriad Genetics, Inc. * | 5,816 | 267,536 | ||||||
| PDL BioPharma, Inc. * | 48,401 | 127,295 | ||||||
| Portola Pharmaceuticals, Inc. *(a) | 648 | 17,256 | ||||||
| Puma Biotechnology, Inc. * | 386 | 17,698 | ||||||
| REGENXBIO, Inc. * | 1,486 | 112,193 | ||||||
| Repligen Corp. * | 3,331 | 184,737 | ||||||
| Sorrento Therapeutics, Inc. *(a) | 8,565 | 37,686 | ||||||
| Spectrum Pharmaceuticals, Inc. * | 5,027 | 84,454 | ||||||
|
| |||||||
| 1,865,653 | ||||||||
|
| |||||||
| Building Products - 1.4% | ||||||||
| Apogee Enterprises, Inc. | 1,640 | 67,765 | ||||||
| Builders FirstSource, Inc. * | 5,936 | 87,140 | ||||||
| Continental Building Products, Inc. * | 491 | 18,437 | ||||||
| Insteel Industries, Inc. | 325 | 11,661 | ||||||
| Patrick Industries, Inc. * | 2,462 | 145,750 | ||||||
| Simpson Manufacturing Co., Inc. | 404 | 29,274 | ||||||
| Trex Co., Inc. * | 394 | 30,330 | ||||||
| Universal Forest Products, Inc. | 2,844 | 100,479 | ||||||
|
| |||||||
| 490,836 | ||||||||
|
| |||||||
| Capital Markets - 1.4% | ||||||||
| Artisan Partners Asset Management, Inc., Class A | 1,083 | 35,089 | ||||||
| Blucora, Inc. * | 2,123 | 85,451 | ||||||
| Cohen & Steers, Inc. (a) | 1,470 | 59,697 | ||||||
| INTL. FCStone, Inc. * | 473 | 22,855 | ||||||
| Stifel Financial Corp. | 1,508 | 77,300 | ||||||
| Waddell & Reed Financial, Inc., Class A (a) | 9,378 | 198,626 | ||||||
|
| |||||||
| 479,018 | ||||||||
|
| |||||||
| Chemicals - 1.8% | ||||||||
| AdvanSix, Inc. * | 1,661 | 56,391 | ||||||
| American Vanguard Corp. | 513 | 9,234 | ||||||
| Chase Corp. | 391 | 46,979 | ||||||
| FutureFuel Corp. | 1,388 | 25,733 | ||||||
| Ingevity Corp. * | 517 | 52,672 | ||||||
| Innospec, Inc. | 465 | 35,689 | ||||||
| Kraton Corp. * | 365 | 17,210 | ||||||
| Kronos Worldwide, Inc. | 5,025 | 81,656 | ||||||
| PolyOne Corp. | 327 | 14,296 | ||||||
| Rayonier Advanced Materials, Inc. | 1,595 | 29,396 | ||||||
| Stepan Co. | 785 | 68,303 | ||||||
| Trinseo SA | 2,424 | 189,799 | ||||||
|
| |||||||
| 627,358 | ||||||||
|
| |||||||
| Commercial Services & Supplies - 2.0% | ||||||||
| ACCO Brands Corp. | 13,454 | 152,030 | ||||||
| Brink’s Co. (The) | 197 | 13,741 | ||||||
| Deluxe Corp. | 973 | 55,403 | ||||||
| Ennis, Inc. | 4,365 | 89,264 | ||||||
| INVESTMENTS | SHARES | VALUE | ||||||
| Commercial Services & Supplies - 2.0% (continued) | ||||||||
| Herman Miller, Inc. | 2,019 | $ | 77,529 | |||||
| HNI Corp. | 324 | 14,334 | ||||||
| Interface, Inc. | 3,192 | 74,533 | ||||||
| Kimball International, Inc., Class B | 1,589 | 26,616 | ||||||
| Quad/Graphics, Inc. | 2,012 | 41,930 | ||||||
| Steelcase, Inc., Class A | 3,334 | 61,679 | ||||||
| Tetra Tech, Inc. | 213 | 14,548 | ||||||
| UniFirst Corp. | 198 | 34,383 | ||||||
| Viad Corp. | 484 | 28,677 | ||||||
|
| |||||||
| 684,667 | ||||||||
|
| |||||||
| Communications Equipment - 0.1% | ||||||||
| Ciena Corp. * | 404 | 12,621 | ||||||
| InterDigital, Inc. | 129 | 10,320 | ||||||
| Plantronics, Inc. | 234 | 14,110 | ||||||
|
| |||||||
| 37,051 | ||||||||
|
| |||||||
| Construction & Engineering - 0.7% | ||||||||
| Argan, Inc. | 248 | 10,664 | ||||||
| Comfort Systems USA, Inc. | 778 | 43,879 | ||||||
| EMCOR Group, Inc. | 2,083 | 156,454 | ||||||
| KBR, Inc. | 990 | 20,919 | ||||||
| Primoris Services Corp. | 453 | 11,243 | ||||||
|
| |||||||
| 243,159 | ||||||||
|
| |||||||
| Construction Materials - 0.1% | ||||||||
| Summit Materials, Inc., Class A * | 1,368 | 24,870 | ||||||
| US Concrete, Inc. * | 110 | 5,044 | ||||||
|
| |||||||
| 29,914 | ||||||||
|
| |||||||
| Consumer Finance - 1.9% | ||||||||
| Enova International, Inc. * | 670 | 19,296 | ||||||
| EZCORP, Inc., Class A * | 1,187 | 12,701 | ||||||
| FirstCash, Inc. | 1,974 | 161,868 | ||||||
| Green Dot Corp., Class A * | 2,790 | 247,808 | ||||||
| Nelnet, Inc., Class A | 1,981 | 113,254 | ||||||
| World Acceptance Corp. * | 824 | 94,232 | ||||||
|
| |||||||
| 649,159 | ||||||||
|
| |||||||
| Distributors - 0.0% (b) | ||||||||
| Core-Mark Holding Co., Inc. | 182 | 6,181 | ||||||
|
| |||||||
| Diversified Consumer Services - 1.4% | ||||||||
| Adtalem Global Education, Inc. * | 4,179 | 201,428 | ||||||
| American Public Education, Inc. * | 3,161 | 104,471 | ||||||
| Career Education Corp. * | 1,079 | 16,109 | ||||||
| K12, Inc. * | 733 | 12,974 | ||||||
| Strategic Education, Inc. | 354 | 48,509 | ||||||
| Weight Watchers International, Inc. * | 1,476 | 106,257 | ||||||
|
| |||||||
| 489,748 | ||||||||
|
| |||||||
| Diversified Telecommunication Services - 0.7% | ||||||||
| Iridium Communications, Inc. * | 1,863 | 41,917 | ||||||
| Vonage Holdings Corp. * | 14,272 | 202,092 | ||||||
|
| |||||||
| 244,009 | ||||||||
|
| |||||||
| Electric Utilities - 0.0% (b) | ||||||||
| Spark Energy, Inc., Class A (a) | 1,876 | 15,477 | ||||||
|
| |||||||
| The accompanying notes are an integral part of these financial statements. | (Continued) |
| AQR Funds | Annual Report | September 2018 | ||||||||||||||
79
Table of Contents
| Schedule of Investments | September 30, 2018 |
| AQR TM SMALL CAP MULTI-STYLE FUND |
| INVESTMENTS | SHARES | VALUE | ||||||
| Electrical Equipment - 2.2% | ||||||||
| Allied Motion Technologies, Inc. | 443 | $ | 24,112 | |||||
| Atkore International Group, Inc. * | 3,786 | 100,443 | ||||||
| Encore Wire Corp. | 898 | 44,990 | ||||||
| EnerSys | 589 | 51,319 | ||||||
| Enphase Energy, Inc. *(a) | 20,413 | 99,003 | ||||||
| Generac Holdings, Inc. * | 3,058 | 172,502 | ||||||
| Sunrun, Inc. *(a) | 10,665 | 132,673 | ||||||
| TPI Composites, Inc. * | 4,636 | 132,358 | ||||||
|
| |||||||
| 757,400 | ||||||||
|
| |||||||
| Electronic Equipment, Instruments & Components - 2.1% | ||||||||
| AVX Corp. | 825 | 14,891 | ||||||
| Electro Scientific Industries, Inc. * | 9,920 | 173,104 | ||||||
| ePlus, Inc. * | 812 | 75,272 | ||||||
| Fabrinet (Thailand) * | 327 | 15,127 | ||||||
| Insight Enterprises, Inc. * | 755 | 40,838 | ||||||
| KEMET Corp. * | 2,920 | 54,166 | ||||||
| Kimball Electronics, Inc. * | 146 | 2,869 | ||||||
| Methode Electronics, Inc. | 1,584 | 57,341 | ||||||
| Plexus Corp. * | 371 | 21,707 | ||||||
| Rogers Corp. * | 309 | 45,522 | ||||||
| SYNNEX Corp. | 554 | 46,924 | ||||||
| Tech Data Corp. * | 902 | 64,556 | ||||||
| TTM Technologies, Inc. * | 4,738 | 75,382 | ||||||
| Vishay Intertechnology, Inc. | 2,321 | 47,232 | ||||||
|
| |||||||
| 734,931 | ||||||||
|
| |||||||
| Energy Equipment & Services - 0.3% | ||||||||
| KLX Energy Services Holdings, Inc. * | 300 | 9,603 | ||||||
| Mammoth Energy Services, Inc. (a) | 3,318 | 96,554 | ||||||
| Smart Sand, Inc. *(a) | 2,967 | 12,194 | ||||||
|
| |||||||
| 118,351 | ||||||||
|
| |||||||
| Entertainment - 0.0% (b) | ||||||||
| Marcus Corp. (The) | 360 | 15,138 | ||||||
|
| |||||||
| Equity Real Estate Investment Trusts (REITs) - 2.8% | ||||||||
| Agree Realty Corp. | 510 | 27,091 | ||||||
| Alexander & Baldwin, Inc. | 742 | 16,836 | ||||||
| American Assets Trust, Inc. | 393 | 14,655 | ||||||
| CareTrust REIT, Inc. | 689 | 12,202 | ||||||
| Chesapeake Lodging Trust | 493 | 15,811 | ||||||
| CoreCivic, Inc. | 1,834 | 44,621 | ||||||
| Cousins Properties, Inc. | 2,843 | 25,274 | ||||||
| DiamondRock Hospitality Co. | 3,310 | 38,628 | ||||||
| EastGroup Properties, Inc. | 345 | 32,989 | ||||||
| First Industrial Realty Trust, Inc. | 1,565 | 49,141 | ||||||
| Four Corners Property Trust, Inc. | 2,196 | 56,415 | ||||||
| Franklin Street Properties Corp. | 1,279 | 10,219 | ||||||
| GEO Group, Inc. (The) | 2,602 | 65,466 | ||||||
| Gramercy Property Trust | 2,337 | 64,127 | ||||||
| LaSalle Hotel Properties | 1,494 | 51,678 | ||||||
| Lexington Realty Trust | 1,955 | 16,227 | ||||||
| LTC Properties, Inc. | 501 | 22,099 | ||||||
| Monmouth Real Estate Investment Corp. | 1,239 | 20,716 | ||||||
| National Health Investors, Inc. | 812 | 61,379 | ||||||
| National Storage Affiliates Trust | 538 | 13,687 | ||||||
| Pebblebrook Hotel Trust (a) | 739 | 26,878 | ||||||
| PS Business Parks, Inc. | 158 | 20,080 | ||||||
| INVESTMENTS | SHARES | VALUE | ||||||
| Equity Real Estate Investment Trusts (REITs) - 2.8% (continued) | ||||||||
| Rexford Industrial Realty, Inc. | 832 | $ | 26,591 | |||||
| Ryman Hospitality Properties, Inc. | 689 | 59,371 | ||||||
| Select Income REIT | 598 | 13,120 | ||||||
| Summit Hotel Properties, Inc. | 1,140 | 15,424 | ||||||
| Sunstone Hotel Investors, Inc. | 3,628 | 59,354 | ||||||
| Terreno Realty Corp. | 1,043 | 39,321 | ||||||
| Washington Prime Group, Inc. (a) | 3,717 | 27,134 | ||||||
| Xenia Hotels & Resorts, Inc. | 1,121 | 26,568 | ||||||
|
| |||||||
| 973,102 | ||||||||
|
| |||||||
| Food & Staples Retailing - 0.2% | ||||||||
| Ingles Markets, Inc., Class A | 942 | 32,263 | ||||||
| Weis Markets, Inc. (a) | 629 | 27,299 | ||||||
|
| |||||||
| 59,562 | ||||||||
|
| |||||||
| Food Products - 0.4% | ||||||||
| Cal-Maine Foods, Inc. | 410 | 19,803 | ||||||
| John B Sanfilippo & Son, Inc. | 657 | 46,897 | ||||||
| Sanderson Farms, Inc. | 642 | 66,363 | ||||||
|
| |||||||
| 133,063 | ||||||||
|
| |||||||
| Gas Utilities - 0.3% | ||||||||
| ONE Gas, Inc. | 1,128 | 92,812 | ||||||
|
| |||||||
| Health Care Equipment & Supplies - 3.2% | ||||||||
| AxoGen, Inc. * | 270 | 9,949 | ||||||
| Globus Medical, Inc., Class A * | 4,617 | 262,061 | ||||||
| Haemonetics Corp. * | 1,855 | 212,546 | ||||||
| Heska Corp. * | 308 | 34,899 | ||||||
| Inogen, Inc. * | 500 | 122,060 | ||||||
| Integer Holdings Corp. * | 717 | 59,475 | ||||||
| IntriCon Corp. * | 623 | 35,013 | ||||||
| Lantheus Holdings, Inc. * | 2,678 | 40,036 | ||||||
| LeMaitre Vascular, Inc. | 647 | 25,065 | ||||||
| Merit Medical Systems, Inc. * | 1,835 | 112,761 | ||||||
| Neogen Corp. * | 725 | 51,859 | ||||||
| NuVasive, Inc. * | 498 | 35,348 | ||||||
| NxStage Medical, Inc. * | 937 | 26,133 | ||||||
| STAAR Surgical Co. * | 1,325 | 63,600 | ||||||
| Tandem Diabetes Care, Inc. * | 352 | 15,080 | ||||||
|
| |||||||
| 1,105,885 | ||||||||
|
| |||||||
| Health Care Providers & Services - 1.8% | ||||||||
| Amedisys, Inc. * | 1,010 | 126,209 | ||||||
| AMN Healthcare Services, Inc. * | 3,250 | 177,775 | ||||||
| Diplomat Pharmacy, Inc. * | 1,851 | 35,928 | ||||||
| Ensign Group, Inc. (The) | 321 | 12,172 | ||||||
| LifePoint Health, Inc. * | 549 | 35,356 | ||||||
| Magellan Health, Inc. * | 1,626 | 117,153 | ||||||
| RadNet, Inc. * | 1,896 | 28,535 | ||||||
| Select Medical Holdings Corp. * | 871 | 16,026 | ||||||
| Tenet Healthcare Corp. * | 1,021 | 29,058 | ||||||
| Tivity Health, Inc. * | 291 | 9,356 | ||||||
| Triple-S Management Corp., Class B * | 3,136 | 59,239 | ||||||
|
| |||||||
| 646,807 | ||||||||
|
| |||||||
| Health Care Technology - 0.0% (b) | ||||||||
| HMS Holdings Corp. * | 316 | 10,368 | ||||||
|
| |||||||
| The accompanying notes are an integral part of these financial statements. | (Continued) |
| AQR Funds | Annual Report | September 2018 | ||||||||||||||
80
Table of Contents
| Schedule of Investments | September 30, 2018 |
| AQR TM SMALL CAP MULTI-STYLE FUND |
| INVESTMENTS | SHARES | VALUE | ||||||
| Hotels, Restaurants & Leisure - 1.7% | ||||||||
| BBX Capital Corp. | 1,533 | $ | 11,375 | |||||
| BJ’s Restaurants, Inc. | 197 | 14,223 | ||||||
| Bloomin’ Brands, Inc. | 1,971 | 39,006 | ||||||
| Bojangles’, Inc. * | 779 | 12,230 | ||||||
| Brinker International, Inc. | 1,313 | 61,357 | ||||||
| Cracker Barrel Old Country Store, Inc. | 338 | 49,730 | ||||||
| Dave & Buster’s Entertainment, Inc. * | 529 | 35,030 | ||||||
| Eldorado Resorts, Inc. * | 1,760 | 85,536 | ||||||
| Marriott Vacations Worldwide Corp. | 508 | 56,769 | ||||||
| Penn National Gaming, Inc. * | 3,066 | 100,933 | ||||||
| Ruth’s Hospitality Group, Inc. | 1,008 | 31,802 | ||||||
| Sonic Corp. | 786 | 34,065 | ||||||
| Texas Roadhouse, Inc. | 529 | 36,655 | ||||||
| Town Sports International Holdings, Inc. * | 1,581 | 13,676 | ||||||
|
| |||||||
| 582,387 | ||||||||
|
| |||||||
| Household Durables - 1.3% | ||||||||
| Bassett Furniture Industries, Inc. | 456 | 9,690 | ||||||
| Flexsteel Industries, Inc. | 1,277 | 37,978 | ||||||
| Hamilton Beach Brands Holding Co., Class A | 746 | 16,367 | ||||||
| Hooker Furniture Corp. | 1,609 | 54,384 | ||||||
| KB Home | 2,196 | 52,506 | ||||||
| La-Z-Boy, Inc. | 3,449 | 108,989 | ||||||
| MDC Holdings, Inc. | 1,117 | 33,041 | ||||||
| Meritage Homes Corp. * | 339 | 13,526 | ||||||
| Roku, Inc. *(a) | 640 | 46,739 | ||||||
| Taylor Morrison Home Corp., Class A * | 542 | 9,778 | ||||||
| TopBuild Corp. * | 651 | 36,990 | ||||||
| TRI Pointe Group, Inc. * | 1,208 | 14,979 | ||||||
| ZAGG, Inc. * | 1,893 | 27,922 | ||||||
|
| |||||||
| 462,889 | ||||||||
|
| |||||||
| Household Products - 0.1% | ||||||||
| WD-40 Co. (a) | 128 | 22,029 | ||||||
|
| |||||||
| Insurance - 5.9% | ||||||||
| American Equity Investment Life Holding Co. | 3,811 | 134,757 | ||||||
| AMERISAFE, Inc. | 400 | 24,780 | ||||||
| Argo Group International Holdings Ltd. | 172 | 10,845 | ||||||
| CNO Financial Group, Inc. | 4,891 | 103,787 | ||||||
| Employers Holdings, Inc. | 3,538 | 160,271 | ||||||
| Enstar Group Ltd. * | 107 | 22,310 | ||||||
| FBL Financial Group, Inc., Class A | 241 | 18,135 | ||||||
| Genworth Financial, Inc., Class A * | 7,815 | 32,589 | ||||||
| Health Insurance Innovations, Inc., Class A * | 939 | 57,889 | ||||||
| Heritage Insurance Holdings, Inc. (a) | 1,800 | 26,676 | ||||||
| Horace Mann Educators Corp. | 702 | 31,520 | ||||||
| Kemper Corp. | 1,856 | 149,315 | ||||||
| National General Holdings Corp. | 1,600 | 42,944 | ||||||
| National Western Life Group, Inc., Class A | 347 | 110,762 | ||||||
| Navigators Group, Inc. (The) | 355 | 24,530 | ||||||
| Primerica, Inc. | 2,628 | 316,805 | ||||||
| Selective Insurance Group, Inc. | 2,479 | 157,417 | ||||||
| Third Point Reinsurance Ltd. * | 9,111 | 118,443 | ||||||
| Trupanion, Inc. *(a) | 1,987 | 70,996 | ||||||
| Universal Insurance Holdings, Inc. | 8,880 | 431,124 | ||||||
|
| |||||||
| 2,045,895 | ||||||||
|
| |||||||
| INVESTMENTS | SHARES | VALUE | ||||||
| Interactive Media & Services - 0.9% | ||||||||
| Care.com, Inc. * | 970 | $ | 21,447 | |||||
| Cargurus, Inc. * | 751 | 41,823 | ||||||
| Cars.com, Inc. * | 1,290 | 35,617 | ||||||
| Meet Group, Inc. (The) * | 2,906 | 14,385 | ||||||
| QuinStreet, Inc. * | 3,652 | 49,558 | ||||||
| XO Group, Inc. * | 1,570 | 54,133 | ||||||
| Yelp, Inc. * | 1,787 | 87,920 | ||||||
|
| |||||||
| 304,883 | ||||||||
|
| |||||||
| Internet & Direct Marketing Retail - 1.8% | ||||||||
| 1-800-Flowers.com, Inc., Class A * | 4,121 | 48,628 | ||||||
| Etsy, Inc. * | 4,668 | 239,842 | ||||||
| Nutrisystem, Inc. | 815 | 30,196 | ||||||
| PetMed Express, Inc. | 665 | 21,951 | ||||||
| Shutterstock, Inc. | 884 | 48,249 | ||||||
| Stamps.com, Inc. * | 1,045 | 236,379 | ||||||
|
| |||||||
| 625,245 | ||||||||
|
| |||||||
| IT Services - 2.1% | ||||||||
| Acxiom Holdings, Inc. * | 1,215 | 60,033 | ||||||
| CACI International, Inc., Class A * | 596 | 109,753 | ||||||
| Convergys Corp. | 1,378 | 32,714 | ||||||
| Hackett Group, Inc. (The) | 1,786 | 35,988 | ||||||
| MAXIMUS, Inc. | 1,327 | 86,335 | ||||||
| Perspecta, Inc. | 2,308 | 59,362 | ||||||
| Sykes Enterprises, Inc. * | 3,059 | 93,269 | ||||||
| Syntel, Inc. * | 1,262 | 51,717 | ||||||
| Travelport Worldwide Ltd. | 4,993 | 84,232 | ||||||
| TTEC Holdings, Inc. | 541 | 14,012 | ||||||
| Unisys Corp. * | 3,758 | 76,663 | ||||||
| Web.com Group, Inc. * | 615 | 17,158 | ||||||
|
| |||||||
| 721,236 | ||||||||
|
| |||||||
| Leisure Products - 1.6% | ||||||||
| Acushnet Holdings Corp. | 1,433 | 39,307 | ||||||
| Callaway Golf Co. | 1,589 | 38,597 | ||||||
| Johnson Outdoors, Inc., Class A | 2,942 | 273,577 | ||||||
| MCBC Holdings, Inc. * | 1,726 | 61,929 | ||||||
| Nautilus, Inc. * | 5,352 | 74,660 | ||||||
| Sturm Ruger & Co., Inc. | 945 | 65,252 | ||||||
|
| |||||||
| 553,322 | ||||||||
|
| |||||||
| Life Sciences Tools & Services - 0.4% | ||||||||
| Cambrex Corp. * | 1,043 | 71,341 | ||||||
| Medpace Holdings, Inc. * | 922 | 55,237 | ||||||
|
| |||||||
| 126,578 | ||||||||
|
| |||||||
| Machinery - 2.8% | ||||||||
| Alamo Group, Inc. | 905 | 82,907 | ||||||
| Altra Industrial Motion Corp. (a) | 302 | 12,473 | ||||||
| Barnes Group, Inc. | 1,408 | 100,010 | ||||||
| Columbus McKinnon Corp. | 1,533 | 60,615 | ||||||
| EnPro Industries, Inc. | 858 | 62,574 | ||||||
| Federal Signal Corp. | 438 | 11,730 | ||||||
| FreightCar America, Inc. * | 689 | 11,072 | ||||||
| Global Brass & Copper Holdings, Inc. | 905 | 33,394 | ||||||
| Greenbrier Cos., Inc. (The) | 2,523 | 151,632 | ||||||
| Harsco Corp. * | 478 | 13,647 | ||||||
| The accompanying notes are an integral part of these financial statements. | (Continued) |
| AQR Funds | Annual Report | September 2018 | ||||||||||||||
81
Table of Contents
| Schedule of Investments | September 30, 2018 |
| AQR TM SMALL CAP MULTI-STYLE FUND |
| INVESTMENTS | SHARES | VALUE | ||||||
| Machinery - 2.8% (continued) | ||||||||
| Hillenbrand, Inc. | 1,342 | $ | 70,187 | |||||
| Hyster-Yale Materials Handling, Inc. | 446 | 27,442 | ||||||
| Kadant, Inc. | 399 | 43,032 | ||||||
| Lydall, Inc. * | 355 | 15,300 | ||||||
| Meritor, Inc. * | 9,214 | 178,383 | ||||||
| Proto Labs, Inc. * | 126 | 20,381 | ||||||
| Spartan Motors, Inc. | 1,653 | 24,382 | ||||||
| Wabash National Corp. | 2,433 | 44,354 | ||||||
|
| |||||||
| 963,515 | ||||||||
|
| |||||||
| Media - 1.1% | ||||||||
| Entravision Communications Corp., Class A | 10,835 | 53,091 | ||||||
| Gannett Co., Inc. | 11,389 | 114,004 | ||||||
| Gray Television, Inc. * | 3,996 | 69,930 | ||||||
| MSG Networks, Inc., Class A *(a) | 3,185 | 82,173 | ||||||
| Scholastic Corp. | 317 | 14,801 | ||||||
| TechTarget, Inc. * | 1,843 | 35,791 | ||||||
|
| |||||||
| 369,790 | ||||||||
|
| |||||||
| Metals & Mining - 1.4% | ||||||||
| Commercial Metals Co. | 1,334 | 27,374 | ||||||
| Schnitzer Steel Industries, Inc., Class A | 804 | 21,748 | ||||||
| Warrior Met Coal, Inc. | 15,582 | 421,337 | ||||||
| Worthington Industries, Inc. | 605 | 26,233 | ||||||
|
| |||||||
| 496,692 | ||||||||
|
| |||||||
| Mortgage Real Estate Investment Trusts (REITs) - 0.6% | ||||||||
| Apollo Commercial Real Estate Finance, Inc. | 2,545 | 48,024 | ||||||
| Blackstone Mortgage Trust, Inc., Class A (a) | 1,590 | 53,281 | ||||||
| Invesco Mortgage Capital, Inc. | 3,514 | 55,591 | ||||||
| Redwood Trust, Inc. | 2,553 | 41,461 | ||||||
|
| |||||||
| 198,357 | ||||||||
|
| |||||||
| Multiline Retail - 0.1% | ||||||||
| Dillard’s, Inc., Class A (a) | 716 | 54,659 | ||||||
|
| |||||||
| Multi-Utilities - 0.3% | ||||||||
| Avista Corp. | 935 | 47,274 | ||||||
| Black Hills Corp. | 573 | 33,285 | ||||||
| NorthWestern Corp. | 698 | 40,945 | ||||||
|
| |||||||
| 121,504 | ||||||||
|
| |||||||
| Oil, Gas & Consumable Fuels - 2.5% | ||||||||
| Abraxas Petroleum Corp. * | 12,469 | 29,053 | ||||||
| Arch Coal, Inc., Class A | 1,686 | 150,729 | ||||||
| Delek US Holdings, Inc. | 231 | 9,801 | ||||||
| Denbury Resources, Inc. * | 8,452 | 52,402 | ||||||
| NACCO Industries, Inc., Class A | 213 | 6,976 | ||||||
| Oasis Petroleum, Inc. * | 1,606 | 22,773 | ||||||
| Peabody Energy Corp. | 4,827 | 172,034 | ||||||
| Penn Virginia Corp. * | 227 | 18,283 | ||||||
| Renewable Energy Group, Inc. * | 5,732 | 165,082 | ||||||
| REX American Resources Corp. * | 173 | 13,070 | ||||||
| SandRidge Energy, Inc. * | 2,411 | 26,208 | ||||||
| Southwestern Energy Co. * | 9,076 | 46,378 | ||||||
| W&T Offshore, Inc. * | 15,138 | 145,930 | ||||||
|
| |||||||
| 858,719 | ||||||||
|
| |||||||
| Paper & Forest Products - 2.0% | ||||||||
| Boise Cascade Co. | 3,301 | 121,477 | ||||||
| INVESTMENTS | SHARES | VALUE | ||||||
| Paper & Forest Products - 2.0% (continued) | ||||||||
| KapStone Paper and Packaging Corp. | 1,268 | $ | 42,998 | |||||
| Louisiana-Pacific Corp. | 10,596 | 280,688 | ||||||
| Neenah, Inc. | 279 | 24,078 | ||||||
| PH Glatfelter Co. | 622 | 11,886 | ||||||
| Verso Corp., Class A * | 6,579 | 221,515 | ||||||
|
| |||||||
| 702,642 | ||||||||
|
| |||||||
| Personal Products - 2.3% | ||||||||
| Inter Parfums, Inc. | 454 | 29,260 | ||||||
| Medifast, Inc. | 1,585 | 351,157 | ||||||
| Natural Health Trends Corp. | 2,054 | 47,817 | ||||||
| USANA Health Sciences, Inc. * | 3,257 | 392,632 | ||||||
|
| |||||||
| 820,866 | ||||||||
|
| |||||||
| Pharmaceuticals - 0.9% | ||||||||
| ANI Pharmaceuticals, Inc. * | 292 | 16,510 | ||||||
| Corcept Therapeutics, Inc. *(a) | 6,308 | 88,438 | ||||||
| Horizon Pharma plc * | 1,116 | 21,851 | ||||||
| Innoviva, Inc. * | 1,681 | 25,618 | ||||||
| Mallinckrodt plc * | 712 | 20,869 | ||||||
| Phibro Animal Health Corp., Class A | 1,471 | 63,106 | ||||||
| Supernus Pharmaceuticals, Inc. *(a) | 1,427 | 71,850 | ||||||
|
| |||||||
| 308,242 | ||||||||
|
| |||||||
| Professional Services - 3.0% | ||||||||
| ASGN, Inc. * | 801 | 63,223 | ||||||
| Barrett Business Services, Inc. | 1,074 | 71,722 | ||||||
| CBIZ, Inc. * | 831 | 19,695 | ||||||
| FTI Consulting, Inc. * | 1,591 | 116,445 | ||||||
| ICF International, Inc. | 485 | 36,593 | ||||||
| Insperity, Inc. | 3,357 | 395,958 | ||||||
| Kelly Services, Inc., Class A | 1,957 | 47,027 | ||||||
| Kforce, Inc. | 1,827 | 68,695 | ||||||
| Korn/Ferry International | 1,902 | 93,654 | ||||||
| TriNet Group, Inc. * | 591 | 33,285 | ||||||
| TrueBlue, Inc. * | 3,428 | 89,299 | ||||||
| Willdan Group, Inc. * | 461 | 15,656 | ||||||
|
| |||||||
| 1,051,252 | ||||||||
|
| |||||||
| Real Estate Management & Development - 0.3% | ||||||||
| HFF, Inc., Class A | 1,647 | 69,965 | ||||||
| Marcus & Millichap, Inc. * | 453 | 15,724 | ||||||
| RMR Group, Inc. (The), Class A | 288 | 26,726 | ||||||
|
| |||||||
| 112,415 | ||||||||
|
| |||||||
| Road & Rail - 1.6% | ||||||||
| ArcBest Corp. | 3,981 | 193,277 | ||||||
| Covenant Transportation Group, Inc., Class A * | 786 | 22,841 | ||||||
| Marten Transport Ltd. | 2,522 | 53,088 | ||||||
| Saia, Inc. * | 2,529 | 193,342 | ||||||
| USA Truck, Inc. * | 1,303 | 26,360 | ||||||
| Werner Enterprises, Inc. | 1,708 | 60,378 | ||||||
|
| |||||||
| 549,286 | ||||||||
|
| |||||||
| Semiconductors & Semiconductor Equipment - 1.7% | ||||||||
| Advanced Energy Industries, Inc. * | 1,709 | 88,270 | ||||||
| Alpha & Omega Semiconductor Ltd. * | 878 | 10,211 | ||||||
| Amkor Technology, Inc. * | 9,252 | 68,372 | ||||||
| Cabot Microelectronics Corp. | 1,094 | 112,868 | ||||||
| Diodes, Inc. * | 494 | 16,445 | ||||||
| The accompanying notes are an integral part of these financial statements. | (Continued) |
| AQR Funds | Annual Report | September 2018 | ||||||||||||||
82
Table of Contents
| Schedule of Investments | September 30, 2018 |
| AQR TM SMALL CAP MULTI-STYLE FUND |
| INVESTMENTS | SHARES | VALUE | ||||||
| Semiconductors & Semiconductor Equipment - 1.7% (continued) | ||||||||
| Entegris, Inc. | 4,311 | $ | 124,804 | |||||
| Integrated Device Technology, Inc. * | 1,046 | 49,173 | ||||||
| Photronics, Inc. * | 1,645 | 16,203 | ||||||
| Rudolph Technologies, Inc. * | 1,473 | 36,015 | ||||||
| Silicon Laboratories, Inc. * | 138 | 12,668 | ||||||
| SMART Global Holdings, Inc. * | 2,453 | 70,499 | ||||||
|
| |||||||
| 605,528 | ||||||||
|
| |||||||
| Software - 3.0% | ||||||||
| ACI Worldwide, Inc. * | 900 | 25,326 | ||||||
| Alarm.com Holdings, Inc. * | 758 | 43,509 | ||||||
| Avaya Holdings Corp. * | 1,583 | 35,048 | ||||||
| Blackbaud, Inc. (a) | 432 | 43,839 | ||||||
| Ebix, Inc. (a) | 1,605 | 127,036 | ||||||
| eGain Corp. * | 2,732 | 22,129 | ||||||
| Ellie Mae, Inc. *(a) | 472 | 44,731 | ||||||
| Five9, Inc. * | 316 | 13,806 | ||||||
| HubSpot, Inc. * | 177 | 26,718 | ||||||
| j2 Global, Inc. | 2,063 | 170,920 | ||||||
| MicroStrategy, Inc., Class A * | 92 | 12,937 | ||||||
| Mitek Systems, Inc. * | 2,473 | 17,435 | ||||||
| Progress Software Corp. | 2,042 | 72,062 | ||||||
| Qualys, Inc. * | 2,236 | 199,228 | ||||||
| Trade Desk, Inc. (The), Class A * | 794 | 119,823 | ||||||
| Verint Systems, Inc. * | 1,235 | 61,873 | ||||||
| Zix Corp. * | 2,274 | 12,621 | ||||||
|
| |||||||
| 1,049,041 | ||||||||
|
| |||||||
| Specialty Retail - 5.6% | ||||||||
| Aaron’s, Inc. | 454 | 24,725 | ||||||
| Abercrombie & Fitch Co., Class A | 9,670 | 204,230 | ||||||
| American Eagle Outfitters, Inc. | 11,016 | 273,527 | ||||||
| Asbury Automotive Group, Inc. * | 552 | 37,950 | ||||||
| Boot Barn Holdings, Inc. *(a) | 545 | 15,483 | ||||||
| Buckle, Inc. (The) | 5,468 | 126,037 | ||||||
| Caleres, Inc. | 4,796 | 171,985 | ||||||
| Cato Corp. (The), Class A | 1,409 | 29,617 | ||||||
| Chico’s FAS, Inc. | 5,753 | 49,879 | ||||||
| Children’s Place, Inc. (The) | 1,183 | 151,187 | ||||||
| Citi Trends, Inc. | 926 | 26,641 | ||||||
| DSW, Inc., Class A | 4,996 | 169,265 | ||||||
| Express, Inc. * | 11,213 | 124,016 | ||||||
| Five Below, Inc. * | 736 | 95,724 | ||||||
| Genesco, Inc. * | 486 | 22,891 | ||||||
| Group 1 Automotive, Inc. | 480 | 31,152 | ||||||
| Haverty Furniture Cos., Inc. | 511 | 11,293 | ||||||
| Hibbett Sports, Inc. *(a) | 3,646 | 68,545 | ||||||
| RH * | 213 | 27,905 | ||||||
| Shoe Carnival, Inc. | 2,530 | 97,405 | ||||||
| Sleep Number Corp. * | 587 | 21,590 | ||||||
| Sportsman’s Warehouse Holdings, Inc. * | 2,998 | 17,538 | ||||||
| Tailored Brands, Inc. (a) | 2,971 | 74,840 | ||||||
| Tilly’s, Inc., Class A | 543 | 10,290 | ||||||
| Zumiez, Inc. * | 3,032 | 79,893 | ||||||
|
| |||||||
| 1,963,608 | ||||||||
|
| |||||||
| Textiles, Apparel & Luxury Goods - 3.1% | ||||||||
| Crocs, Inc. * | 4,154 | 88,439 | ||||||
| Deckers Outdoor Corp. * | 2,944 | 349,100 | ||||||
| Fossil Group, Inc. *(a) | 2,686 | 62,530 | ||||||
| INVESTMENTS | SHARES | VALUE | ||||||
| Textiles, Apparel & Luxury Goods - 3.1% (continued) | ||||||||
| G-III Apparel Group Ltd. * | 3,443 | $ | 165,918 | |||||
| Movado Group, Inc. | 2,301 | 96,412 | ||||||
| Oxford Industries, Inc. | 1,202 | 108,420 | ||||||
| Rocky Brands, Inc. | 1,175 | 33,252 | ||||||
| Steven Madden Ltd. | 1,531 | 80,990 | ||||||
| Vera Bradley, Inc. * | 4,169 | 63,619 | ||||||
| Wolverine World Wide, Inc. | 425 | 16,596 | ||||||
|
| |||||||
| 1,065,276 | ||||||||
|
| |||||||
| Thrifts & Mortgage Finance - 3.3% | ||||||||
| Axos Financial, Inc. * | 6,631 | 228,040 | ||||||
| Dime Community Bancshares, Inc. | 671 | 11,977 | ||||||
| Essent Group Ltd. * | 490 | 21,682 | ||||||
| Federal Agricultural Mortgage Corp., Class C | 611 | 44,102 | ||||||
| First Defiance Financial Corp. | 1,436 | 43,238 | ||||||
| Flagstar Bancorp, Inc. * | 364 | 11,455 | ||||||
| HomeStreet, Inc. * | 672 | 17,808 | ||||||
| Meridian Bancorp, Inc. | 807 | 13,719 | ||||||
| Meta Financial Group, Inc. | 419 | 34,630 | ||||||
| MGIC Investment Corp. * | 19,076 | 253,902 | ||||||
| Oritani Financial Corp. | 820 | 12,751 | ||||||
| Provident Financial Services, Inc. | 940 | 23,077 | ||||||
| Radian Group, Inc. | 6,798 | 140,515 | ||||||
| United Financial Bancorp, Inc. | 672 | 11,310 | ||||||
| Walker & Dunlop, Inc. | 3,720 | 196,714 | ||||||
| Washington Federal, Inc. | 1,913 | 61,216 | ||||||
| WSFS Financial Corp. | 309 | 14,569 | ||||||
|
| |||||||
| 1,140,705 | ||||||||
|
| |||||||
| Tobacco - 0.5% | ||||||||
| Pyxus International, Inc. * | 598 | 13,754 | ||||||
| Turning Point Brands, Inc. | 1,129 | 46,808 | ||||||
| Universal Corp. | 1,530 | 99,450 | ||||||
| Vector Group Ltd. (a) | 852 | 11,735 | ||||||
|
| |||||||
| 171,747 | ||||||||
|
| |||||||
| Trading Companies & Distributors - 1.8% | ||||||||
| Applied Industrial Technologies, Inc. | 193 | 15,102 | ||||||
| BlueLinx Holdings, Inc. *(a) | 551 | 17,351 | ||||||
| BMC Stock Holdings, Inc. * | 2,139 | 39,892 | ||||||
| CAI International, Inc. * | 4,111 | 94,019 | ||||||
| DXP Enterprises, Inc. * | 433 | 17,350 | ||||||
| GATX Corp. | 1,682 | 145,644 | ||||||
| H&E Equipment Services, Inc. | 2,257 | 85,270 | ||||||
| Herc Holdings, Inc. * | 316 | 16,179 | ||||||
| Rush Enterprises, Inc., Class A | 591 | 23,232 | ||||||
| Systemax, Inc. | 437 | 14,395 | ||||||
| Titan Machinery, Inc. * | 581 | 8,997 | ||||||
| Triton International Ltd. | 4,373 | 145,490 | ||||||
|
| |||||||
| 622,921 | ||||||||
|
| |||||||
| Wireless Telecommunication Services - 1.1% | ||||||||
| Boingo Wireless, Inc. * | 5,104 | 178,130 | ||||||
| NII Holdings, Inc. *(a) | 14,910 | 87,373 | ||||||
| Shenandoah Telecommunications Co. | 2,778 | 107,647 | ||||||
|
| |||||||
| 373,150 | ||||||||
|
| |||||||
TOTAL COMMON STOCKS | 33,941,699 | |||||||
|
| |||||||
| The accompanying notes are an integral part of these financial statements. | (Continued) |
| AQR Funds | Annual Report | September 2018 | ||||||||||||||
83
Table of Contents
| Schedule of Investments | September 30, 2018 |
| AQR TM SMALL CAP MULTI-STYLE FUND |
| INVESTMENTS | SHARES | VALUE | ||||||
| PREFERRED STOCKS - 0.0% (b) | ||||||||
| Media - 0.0% (b) | ||||||||
| GCI Liberty, Inc., Series A, 7.00%, 3/10/2039 (c) | ||||||||
(Cost $903) | 105 | $ | 2,632 | |||||
|
| |||||||
| NO. OF RIGHTS | ||||||||
| RIGHTS - 0.0% (b) | ||||||||
| Media - 0.0% (b) | ||||||||
| Media General, Inc., CVR (3)*(d) | ||||||||
(Cost $221) | 744 | 13 | ||||||
|
| |||||||
| SHARES | ||||||||
| SHORT-TERM INVESTMENTS - 2.6% | ||||||||
| Investment Companies - 2.6% | ||||||||
| Limited Purpose Cash Investment Fund, 2.06% (e) | ||||||||
(Cost $886,557) | 886,688 | 886,599 | ||||||
|
| |||||||
| SECURITIES LENDING COLLATERAL - 6.0% | ||||||||
| Investment Companies - 6.0% | ||||||||
| Investments in a Pooled Account through Securities Lending Program with Citibank NA | ||||||||
| BlackRock Liquidity Funds T-Fund Portfolio, Institutional Shares | ||||||||
| 1.97% (e)(f) | 257,210 | 257,210 | ||||||
| Limited Purpose Cash Investment Fund | ||||||||
| 2.06% (e)(f) | 1,845,633 | 1,845,448 | ||||||
|
| |||||||
TOTAL SECURITIES LENDING COLLATERAL | 2,102,658 | |||||||
|
| |||||||
TOTAL INVESTMENTS IN SECURITIES | 36,933,601 | |||||||
|
| |||||||
| LIABILITIES IN EXCESS OF OTHER ASSETS - (6.0)% (g) | (2,098,940) | |||||||
|
| |||||||
NET ASSETS - 100.0% | $ | 34,834,661 | ||||||
|
| |||||||
| SECTOR | VALUE | % OF NET ASSETS | ||||||
| Communication Services | $ | 1,309,615 | 3.8 | % | ||||
| Consumer Discretionary | 6,253,288 | 17.9 | ||||||
| Consumer Staples | 1,700,369 | 4.9 | ||||||
| Energy | 977,070 | 2.8 | ||||||
| Financials | 6,896,660 | 19.8 | ||||||
| Health Care | 4,063,533 | 11.7 | ||||||
| Industrials | 6,424,106 | 18.4 | ||||||
| Information Technology | 3,147,787 | 9.0 | ||||||
| Materials | 1,856,606 | 5.3 | ||||||
| Real Estate | 1,085,517 | 3.1 | ||||||
| Utilities | 229,793 | 0.7 | ||||||
| Short-Term Investments | 886,599 | 2.6 | ||||||
| Securities Lending Collateral | 2,102,658 | 6.0 | ||||||
|
|
|
| |||||
Total Investments In Securities At Value | 36,933,601 | 106.0 | ||||||
| Liabilities in Excess of Other Assets (g) | (2,098,940 | ) | (6.0 | ) | ||||
|
|
|
| |||||
Net Assets | $ | 34,834,661 | 100.0 | % | ||||
|
|
|
| |||||
| * | Non-income producing security. |
| (a) | The security or a portion of this security is on loan at September 30, 2018. The total value of securities on loan at September 30, 2018 was $2,030,699. |
| (b) | Represents less than 0.05% of net assets. |
| (c) | Perpetual security. The rate reflected was the rate in effect on September 30, 2018. The maturity date reflects the next call date. |
| (d) | Security fair valued as of September 30, 2018 in accordance with procedures approved by the Board of Trustees. Total value of all such securities at September 30, 2018 amounted to $13, which represents approximately 0.00% of net assets of the fund. |
| (e) | Represents 7-day effective yield as of September 30, 2018. |
| (f) | Represents security, or portion thereof, purchased with the cash collateral received for securities on loan (See Note 3). |
| (g) | Includes appreciation/(depreciation) on futures contracts. |
All securities are United States companies, unless noted otherwise in parentheses.
All securities are Level 1 with respect to ASC 820, unless otherwise noted in parentheses.
| (3) | Level 3 security (See Note 4). |
| The accompanying notes are an integral part of these financial statements. | (Continued) |
| AQR Funds | Annual Report | September 2018 | ||||||||||||||
84
Table of Contents
| Schedule of Investments | September 30, 2018 |
| AQR TM SMALL CAP MULTI-STYLE FUND |
Futures contracts outstanding as of September 30, 2018:
Exchange Traded
| DESCRIPTION | NUMBER OF CONTRACTS | EXPIRATION DATE | TRADING CURRENCY | NOTIONAL AMOUNT | VALUE AND UNREALIZED APPRECIATION (DEPRECIATION) | |||||||||||
| Long Contracts | ||||||||||||||||
| Russell 2000 E-Mini Index | 5 | 12/2018 | USD | $425,200 | $(4,102 | ) | ||||||||||
|
| |||||||||||||||
| $(4,102 | ) | |||||||||||||||
|
| |||||||||||||||
USD - United States Dollar
Collateral pledged to, or (received from), each counterparty at September 30, 2018 was as follows:
| COUNTERPARTY | OVER THE COUNTER | EXCHANGE TRADED | TOTAL | |||||||||
| JPMS | ||||||||||||
| Cash | $— | $24,734 | $24,734 | |||||||||
| ||||||||||||
| The accompanying notes are an integral part of these financial statements. |
| AQR Funds | Annual Report | September 2018 | ||||||||||||||
85
Table of Contents
| Schedule of Investments | September 30, 2018 |
| AQR TM INTERNATIONAL MULTI-STYLE FUND |
| INVESTMENTS | SHARES | VALUE | ||||||
| COMMON STOCKS - 96.4% | ||||||||
| Australia - 5.5% | ||||||||
| Amcor Ltd. | 10,220 | $ | 101,006 | |||||
| Aristocrat Leisure Ltd. | 66,517 | 1,366,056 | ||||||
| BHP Billiton Ltd. | 31,889 | 794,384 | ||||||
| BlueScope Steel Ltd. | 57,840 | 709,393 | ||||||
| Caltex Australia Ltd. | 12,558 | 271,301 | ||||||
| CIMIC Group Ltd. | 19,409 | 720,369 | ||||||
| Cochlear Ltd. | 3,464 | 502,266 | ||||||
| CSL Ltd. | 4,834 | 702,377 | ||||||
| Dexus, REIT | 33,527 | 256,131 | ||||||
| Flight Centre Travel Group Ltd. | 17,110 | 657,055 | ||||||
| Fortescue Metals Group Ltd. | 266,270 | 754,537 | ||||||
| Goodman Group, REIT | 30,886 | 231,694 | ||||||
| GPT Group (The), REIT | 19,876 | 74,859 | ||||||
| Macquarie Group Ltd. | 5,407 | 491,866 | ||||||
| Rio Tinto Ltd. | 3,006 | 170,959 | ||||||
| Santos Ltd. | 77,141 | 405,005 | ||||||
| Scentre Group, REIT | 71,981 | 206,856 | ||||||
| South32 Ltd. | 292,405 | 821,747 | ||||||
| Telstra Corp. Ltd. | 244,163 | 562,526 | ||||||
| Treasury Wine Estates Ltd. | 4,204 | 53,063 | ||||||
| Woodside Petroleum Ltd. | 27,943 | 779,522 | ||||||
|
| |||||||
| 10,632,972 | ||||||||
|
| |||||||
| Belgium - 1.3% | ||||||||
| Ageas | 19,178 | 1,030,983 | ||||||
| Groupe Bruxelles Lambert SA | 1,467 | 153,776 | ||||||
| KBC Group NV | 5,595 | 416,035 | ||||||
| UCB SA | 3,823 | 343,550 | ||||||
| Umicore SA | 8,430 | 470,887 | ||||||
|
| |||||||
| 2,415,231 | ||||||||
|
| |||||||
| Canada - 6.8% | ||||||||
| Bank of Montreal (1) | 8,976 | 740,373 | ||||||
| Bank of Nova Scotia (The) (1) | 15,059 | 897,606 | ||||||
| Canadian Imperial Bank of Commerce (1) | 5,176 | 485,001 | ||||||
| Canadian Natural Resources Ltd. (1) | 6,385 | 208,607 | ||||||
| Canadian Tire Corp. Ltd., Class A (1) | 2,858 | 334,866 | ||||||
| CCL Industries, Inc., Class B (1) | 2,455 | 110,657 | ||||||
| CGI Group, Inc., Class A (1)* | 22,265 | 1,435,551 | ||||||
| Constellation Software, Inc. (1) | 288 | 211,793 | ||||||
| Fairfax Financial Holdings Ltd. (1) | 414 | 224,922 | ||||||
| Great-West Lifeco, Inc. (1) | 2,283 | 55,394 | ||||||
| Kinross Gold Corp. (1)* | 216,711 | 590,580 | ||||||
| Magna International, Inc. (1) | 22,614 | 1,187,907 | ||||||
| Methanex Corp. (1) | 10,571 | 834,451 | ||||||
| Open Text Corp. (1) | 17,556 | 668,043 | ||||||
| Royal Bank of Canada (1) | 20,862 | 1,672,319 | ||||||
| Shopify, Inc., Class A (1)* | 1,092 | 179,485 | ||||||
| Teck Resources Ltd., Class B (1) | 5,850 | 140,991 | ||||||
| Toronto-Dominion Bank (The) (1) | 27,150 | 1,649,830 | ||||||
| West Fraser Timber Co. Ltd. (1) | 25,831 | 1,470,086 | ||||||
|
| |||||||
| 13,098,462 | ||||||||
|
| |||||||
| China - 0.4% | ||||||||
| BOC Hong Kong Holdings Ltd. | 108,500 | 514,976 | ||||||
| Yangzijiang Shipbuilding Holdings Ltd. | 382,500 | 346,769 | ||||||
|
| |||||||
| 861,745 | ||||||||
|
| |||||||
| INVESTMENTS | SHARES | VALUE | ||||||
| Denmark - 1.9% | ||||||||
| Coloplast A/S, Class B | 4,737 | $ | 483,910 | |||||
| DSV A/S | 6,997 | 635,822 | ||||||
| Genmab A/S * | 618 | 97,071 | ||||||
| H Lundbeck A/S | 8,633 | 532,901 | ||||||
| Novo Nordisk A/S, Class B | 23,511 | 1,106,547 | ||||||
| Orsted A/S (a) | 1,630 | 110,763 | ||||||
| Vestas Wind Systems A/S | 2,134 | 144,165 | ||||||
| William Demant Holding A/S * | 16,192 | 607,822 | ||||||
|
| |||||||
| 3,719,001 | ||||||||
|
| |||||||
| Finland - 1.4% | ||||||||
| Neste OYJ | 25,367 | 2,090,885 | ||||||
| Nokia OYJ | 42,143 | 234,305 | ||||||
| UPM-Kymmene OYJ | 7,749 | 303,908 | ||||||
|
| |||||||
| 2,629,098 | ||||||||
|
| |||||||
| France - 10.1% | ||||||||
| Aeroports de Paris | 1,501 | 337,952 | ||||||
| Airbus SE | 1,221 | 153,288 | ||||||
| Atos SE | 8,563 | 1,018,886 | ||||||
| AXA SA | 19,281 | 516,648 | ||||||
| BNP Paribas SA | 8,357 | 511,754 | ||||||
| Cie Generale des Etablissements Michelin SCA | 3,242 | 386,951 | ||||||
| CNP Assurances | 68,834 | 1,659,291 | ||||||
| Dassault Aviation SA | 50 | 92,535 | ||||||
| Gecina SA, REIT | 483 | 80,707 | ||||||
| L’Oreal SA | 14,125 | 3,405,356 | ||||||
| LVMH Moet Hennessy Louis Vuitton SE | 6,662 | 2,354,158 | ||||||
| Peugeot SA | 60,526 | 1,632,733 | ||||||
| Safran SA | 9,190 | 1,286,821 | ||||||
| Sanofi | 2,650 | 236,770 | ||||||
| Societe BIC SA (b) | 604 | 55,313 | ||||||
| Societe Generale SA | 6,653 | 285,683 | ||||||
| Thales SA | 9,098 | 1,292,651 | ||||||
| TOTAL SA | 59,621 | 3,876,601 | ||||||
| Unibail-Rodamco-Westfield, REIT | 333 | 67,082 | ||||||
|
| |||||||
| 19,251,180 | ||||||||
|
| |||||||
| Germany - 8.9% | ||||||||
| adidas AG | 5,846 | 1,429,695 | ||||||
| Allianz SE (Registered) | 10,737 | 2,389,699 | ||||||
| BASF SE | 7,689 | 682,269 | ||||||
| Bayer AG (Registered) | 5,350 | 474,549 | ||||||
| Bayerische Motoren Werke AG | 4,167 | 375,408 | ||||||
| Beiersdorf AG | 756 | 85,219 | ||||||
| Covestro AG (a) | 31,719 | 2,567,567 | ||||||
| Deutsche Boerse AG | 2,105 | 281,453 | ||||||
| Deutsche Lufthansa AG (Registered) | 78,336 | 1,922,673 | ||||||
| Deutsche Post AG (Registered) | 7,039 | 250,267 | ||||||
| Deutsche Wohnen SE | 4,001 | 192,175 | ||||||
| Fresenius SE & Co. KGaA | 2,780 | 203,858 | ||||||
| Hannover Rueck SE | 3,453 | 487,385 | ||||||
| HUGO BOSS AG | 3,281 | 252,424 | ||||||
| Infineon Technologies AG | 56,350 | 1,282,293 | ||||||
| Linde AG | 1,919 | 453,185 | ||||||
| MTU Aero Engines AG | 1,729 | 389,507 | ||||||
| SAP SE | 13,550 | 1,666,156 | ||||||
| Siemens AG (Registered) | 4,195 | 536,388 | ||||||
| The accompanying notes are an integral part of these financial statements. | (Continued) |
| AQR Funds | Annual Report | September 2018 | ||||||||||||||
86
Table of Contents
| Schedule of Investments | September 30, 2018 |
| AQR TM INTERNATIONAL MULTI-STYLE FUND |
| INVESTMENTS | SHARES | VALUE | ||||||
| Germany - 8.9% (continued) | ||||||||
| Siemens Healthineers AG *(a) | 2,100 | $ | 92,267 | |||||
| TUI AG | 41,515 | 796,367 | ||||||
| Vonovia SE | 3,353 | 163,989 | ||||||
| Wirecard AG | 481 | 104,064 | ||||||
|
| |||||||
| 17,078,857 | ||||||||
|
| |||||||
| Hong Kong - 2.5% | ||||||||
| CLP Holdings Ltd. | 101,000 | 1,182,784 | ||||||
| Galaxy Entertainment Group Ltd. | 69,000 | 435,879 | ||||||
| Henderson Land Development Co. Ltd. | 14,300 | 71,816 | ||||||
| Hong Kong Exchanges & Clearing Ltd. | 13,300 | 380,042 | ||||||
| Kerry Properties Ltd. | 62,000 | 210,524 | ||||||
| Li & Fung Ltd. | 1,310,000 | 293,438 | ||||||
| Link REIT | 13,000 | 127,997 | ||||||
| NWS Holdings Ltd. | 45,000 | 88,949 | ||||||
| PCCW Ltd. | 30,000 | 17,479 | ||||||
| Sino Land Co. Ltd. | 64,000 | 109,646 | ||||||
| Sun Hung Kai Properties Ltd. | 30,000 | 435,366 | ||||||
| Swire Properties Ltd. | 42,000 | 159,262 | ||||||
| WH Group Ltd. (a) | 542,500 | 380,865 | ||||||
| Wheelock & Co. Ltd. | 28,000 | 168,339 | ||||||
| Yue Yuen Industrial Holdings Ltd. | 273,500 | 760,326 | ||||||
|
| |||||||
| 4,822,712 | ||||||||
|
| |||||||
| Italy - 1.1% | ||||||||
| Assicurazioni Generali SpA | 3,271 | 56,326 | ||||||
| Enel SpA | 116,795 | 597,001 | ||||||
| Eni SpA | 37,219 | 701,562 | ||||||
| Moncler SpA | 4,749 | 204,337 | ||||||
| Poste Italiane SpA (a) | 70,837 | 565,022 | ||||||
|
| |||||||
| 2,124,248 | ||||||||
|
| |||||||
| Japan - 21.4% | ||||||||
| Acom Co. Ltd. | 16,500 | 66,522 | ||||||
| AEON Financial Service Co. Ltd. | 800 | 16,569 | ||||||
| Alps Electric Co. Ltd. | 8,500 | 216,092 | ||||||
| Aozora Bank Ltd. | 4,100 | 146,436 | ||||||
| Asahi Kasei Corp. | 95,000 | 1,440,400 | ||||||
| Astellas Pharma, Inc. | 11,100 | 193,839 | ||||||
| Bandai Namco Holdings, Inc. | 35,100 | 1,363,665 | ||||||
| Credit Saison Co. Ltd. | 2,900 | 47,297 | ||||||
| Dai-ichi Life Holdings, Inc. | 6,600 | 137,579 | ||||||
| Daiwa House Industry Co. Ltd. | 4,400 | 130,389 | ||||||
| DeNA Co. Ltd. | 19,600 | 346,100 | ||||||
| Fujitsu Ltd. | 17,100 | 1,218,199 | ||||||
| Hitachi High-Technologies Corp. | 8,000 | 276,226 | ||||||
| Hitachi Ltd. | 68,000 | 2,311,433 | ||||||
| Hoya Corp. | 5,400 | 320,711 | ||||||
| ITOCHU Corp. | 65,300 | 1,195,192 | ||||||
| Japan Airlines Co. Ltd. | 29,200 | 1,049,510 | ||||||
| Japan Real Estate Investment Corp., REIT | 15 | 78,657 | ||||||
| Japan Tobacco, Inc. | 7,900 | 206,295 | ||||||
| JXTG Holdings, Inc. | 129,900 | 982,537 | ||||||
| Kao Corp. | 14,700 | 1,187,433 | ||||||
| KDDI Corp. | 92,800 | 2,560,051 | ||||||
| Kirin Holdings Co. Ltd. | 19,100 | 489,875 | ||||||
| Konami Holdings Corp. | 28,200 | 1,104,205 | ||||||
| Kuraray Co. Ltd. | 9,300 | 139,812 | ||||||
| Kyocera Corp. | 1,300 | 78,028 | ||||||
| INVESTMENTS | SHARES | VALUE | ||||||
| Japan - 21.4% (continued) | ||||||||
| Kyushu Railway Co. | 13,900 | $ | 423,198 | |||||
| Marubeni Corp. | 221,400 | 2,024,839 | ||||||
| Mazda Motor Corp. | 94,700 | 1,138,294 | ||||||
| Mitsubishi Chemical Holdings Corp. | 12,100 | 115,804 | ||||||
| Mitsubishi Electric Corp. | 30,200 | 413,720 | ||||||
| Mitsubishi Estate Co. Ltd. | 9,000 | 152,820 | ||||||
| Mitsubishi Gas Chemical Co., Inc. | 30,900 | 657,800 | ||||||
| Mitsubishi UFJ Financial Group, Inc. | 207,300 | 1,287,891 | ||||||
| Mitsui & Co. Ltd. | 17,500 | 310,987 | ||||||
| Mitsui Fudosan Co. Ltd. | 7,000 | 165,556 | ||||||
| Mizuho Financial Group, Inc. | 1,194,900 | 2,082,474 | ||||||
| Nexon Co. Ltd. * | 176,400 | 2,305,814 | ||||||
| Nippon Express Co. Ltd. | 9,700 | 637,034 | ||||||
| Nippon Telegraph & Telephone Corp. | 12,100 | 546,077 | ||||||
| Nomura Real Estate Holdings, Inc. | 2,700 | 54,466 | ||||||
| Nomura Real Estate Master Fund, Inc., REIT | 65 | 88,863 | ||||||
| NTT DOCOMO, Inc. | 10,400 | 279,527 | ||||||
| Oji Holdings Corp. | 14,000 | 101,667 | ||||||
| Omron Corp. | 1,900 | 80,290 | ||||||
| Resona Holdings, Inc. | 255,100 | 1,432,251 | ||||||
| Sega Sammy Holdings, Inc. | 17,700 | 260,993 | ||||||
| Shinsei Bank Ltd. | 9,200 | 150,302 | ||||||
| Shionogi & Co. Ltd. | 8,000 | 522,957 | ||||||
| Sony Corp. | 14,500 | 881,421 | ||||||
| SUMCO Corp. | 11,800 | 171,898 | ||||||
| Sumitomo Corp. | 25,200 | 419,964 | ||||||
| Sumitomo Dainippon Pharma Co. Ltd. | 15,300 | 351,387 | ||||||
| Sumitomo Heavy Industries Ltd. | 16,300 | 581,772 | ||||||
| Sumitomo Mitsui Financial Group, Inc. | 40,800 | 1,641,950 | ||||||
| Suzuki Motor Corp. | 27,000 | 1,547,401 | ||||||
| Taisei Corp. | 10,400 | 474,067 | ||||||
| Tokyo Electron Ltd. | 8,900 | 1,226,602 | ||||||
| Toshiba Corp. * | 7,100 | 205,178 | ||||||
| Toyo Seikan Group Holdings Ltd. | 5,000 | 103,755 | ||||||
| Yamaha Corp. | 11,900 | 630,556 | ||||||
| Yokogawa Electric Corp. | 3,600 | 76,151 | ||||||
|
| |||||||
| 40,848,778 | ||||||||
|
| |||||||
| Macau - 0.6% | ||||||||
| Sands China Ltd. | 83,600 | 376,494 | ||||||
| SJM Holdings Ltd. | 304,000 | 280,094 | ||||||
| Wynn Macau Ltd. | 206,000 | 473,099 | ||||||
|
| |||||||
| 1,129,687 | ||||||||
|
| |||||||
| Netherlands - 5.8% | ||||||||
| ASML Holding NV | 2,977 | 558,945 | ||||||
| ING Groep NV | 38,548 | 500,318 | ||||||
| Koninklijke Ahold Delhaize NV | 45,832 | 1,051,502 | ||||||
| Koninklijke Philips NV | 6,106 | 278,321 | ||||||
| NN Group NV | 31,476 | 1,404,851 | ||||||
| Randstad NV | 896 | 47,824 | ||||||
| Royal Dutch Shell plc, Class A | 104,016 | 3,566,548 | ||||||
| Royal Dutch Shell plc, Class B | 41,664 | 1,458,514 | ||||||
| Wolters Kluwer NV | 37,405 | 2,331,825 | ||||||
|
| |||||||
| 11,198,648 | ||||||||
|
| |||||||
| Singapore - 1.0% | ||||||||
| CapitaLand Commercial Trust, REIT | 70,800 | 92,242 | ||||||
| The accompanying notes are an integral part of these financial statements. | (Continued) |
| AQR Funds | Annual Report | September 2018 | ||||||||||||||
87
Table of Contents
| Schedule of Investments | September 30, 2018 |
| AQR TM INTERNATIONAL MULTI-STYLE FUND |
| INVESTMENTS | SHARES | VALUE | ||||||
| Singapore - 1.0% (continued) | ||||||||
| DBS Group Holdings Ltd. | 6,700 | $ | 127,817 | |||||
| Genting Singapore Ltd. | 1,253,900 | 971,941 | ||||||
| SATS Ltd. | 20,600 | 78,645 | ||||||
| United Overseas Bank Ltd. | 4,900 | 96,865 | ||||||
| Venture Corp. Ltd. | 48,700 | 627,972 | ||||||
|
| |||||||
| 1,995,482 | ||||||||
|
| |||||||
| South Africa - 0.6% | ||||||||
| Anglo American plc | 29,113 | 651,286 | ||||||
| Investec plc | 80,442 | 564,310 | ||||||
|
| |||||||
| 1,215,596 | ||||||||
|
| |||||||
| Spain - 2.1% | ||||||||
| Aena SME SA (a) | 9,515 | 1,648,541 | ||||||
| Banco Bilbao Vizcaya Argentaria SA | 129,027 | 818,063 | ||||||
| Banco Santander SA | 22,700 | 113,651 | ||||||
| Endesa SA | 12,688 | 273,676 | ||||||
| Mapfre SA | 86,849 | 271,651 | ||||||
| Repsol SA | 49,991 | 995,187 | ||||||
|
| |||||||
| 4,120,769 | ||||||||
|
| |||||||
| Sweden - 2.4% | ||||||||
| Essity AB, Class B | 18,131 | 455,112 | ||||||
| Hexagon AB, Class B | 9,024 | 528,326 | ||||||
| Husqvarna AB, Class B | 8,284 | 70,426 | ||||||
| Investor AB, Class B | 2,740 | 126,264 | ||||||
| Sandvik AB | 70,600 | 1,249,920 | ||||||
| Securitas AB, Class B | 10,323 | 179,471 | ||||||
| Swedbank AB, Class A | 20,022 | 495,187 | ||||||
| Swedish Match AB | 1,210 | 61,850 | ||||||
| Telefonaktiebolaget LM Ericsson, Class B | 21,784 | 192,806 | ||||||
| Volvo AB, Class B | 65,062 | 1,147,494 | ||||||
|
| |||||||
| 4,506,856 | ||||||||
|
| |||||||
| Switzerland - 8.4% | ||||||||
| ABB Ltd. (Registered) | 8,144 | 192,644 | ||||||
| Baloise Holding AG (Registered) | 2,886 | 439,796 | ||||||
| Cie Financiere Richemont SA (Registered) | 3,785 | 308,592 | ||||||
| Coca-Cola HBC AG * | 15,368 | 523,575 | ||||||
| Ferguson plc | 3,235 | 274,399 | ||||||
| Lonza Group AG (Registered) * | 814 | 278,467 | ||||||
| Nestle SA (Registered) | 23,630 | 1,966,881 | ||||||
| Novartis AG (Registered) | 31,414 | 2,704,070 | ||||||
| Roche Holding AG | 19,450 | 4,703,311 | ||||||
| SGS SA (Registered) | 72 | 189,571 | ||||||
| Sika AG (Registered) | 2,160 | 314,322 | ||||||
| Sonova Holding AG (Registered) | 5,332 | 1,058,232 | ||||||
| STMicroelectronics NV | 27,367 | 500,887 | ||||||
| Straumann Holding AG (Registered) | 586 | 441,471 | ||||||
| Swatch Group AG (The) | 1,172 | 465,793 | ||||||
| Swiss Life Holding AG (Registered) * | 2,494 | 945,653 | ||||||
| Zurich Insurance Group AG | 2,811 | 886,323 | ||||||
|
| |||||||
| 16,193,987 | ||||||||
|
| |||||||
| United Kingdom - 12.4% | ||||||||
| 3i Group plc | 6,980 | 85,469 | ||||||
| Ashtead Group plc | 19,007 | 603,059 | ||||||
| Auto Trader Group plc (a) | 44,090 | 256,482 | ||||||
| BAE Systems plc | 154,183 | 1,264,296 | ||||||
| Barclays plc | 91,428 | 202,790 | ||||||
| INVESTMENTS | SHARES | VALUE | ||||||
| United Kingdom - 12.4% (continued) | ||||||||
| Barratt Developments plc | 93,661 | $ | 691,682 | |||||
| Berkeley Group Holdings plc | 23,615 | 1,131,318 | ||||||
| BP plc | 275,328 | 2,110,319 | ||||||
| British American Tobacco plc | 25,048 | 1,167,750 | ||||||
| British Land Co. plc (The), REIT | 9,564 | 76,925 | ||||||
| Burberry Group plc | 23,334 | 612,734 | ||||||
| Compass Group plc | 37,655 | 837,196 | ||||||
| Diageo plc | 5,686 | 201,444 | ||||||
| Direct Line Insurance Group plc | 87,036 | 367,361 | ||||||
| Fiat Chrysler Automobiles NV * | 89,488 | 1,565,057 | ||||||
| Hammerson plc, REIT | 10,122 | 60,227 | ||||||
| HSBC Holdings plc | 278,163 | 2,427,080 | ||||||
| Imperial Brands plc | 10,124 | 352,295 | ||||||
| International Consolidated Airlines Group SA | 105,176 | 902,260 | ||||||
| J Sainsbury plc | 91,742 | 384,353 | ||||||
| Land Securities Group plc, REIT | 6,550 | 75,417 | ||||||
| Legal & General Group plc | 102,969 | 351,515 | ||||||
| Lloyds Banking Group plc | 305,356 | 234,846 | ||||||
| London Stock Exchange Group plc | 3,501 | 209,208 | ||||||
| Meggitt plc | 44,858 | 331,183 | ||||||
| Mondi plc | 13,262 | 363,110 | ||||||
| Next plc | 14,776 | 1,057,461 | ||||||
| Persimmon plc | 42,836 | 1,318,806 | ||||||
| Prudential plc | 24,067 | 551,809 | ||||||
| RELX plc * | 10,814 | 227,193 | ||||||
| RELX plc | 7,916 | 166,526 | ||||||
| Rolls-Royce Holdings plc * | 42,299 | 544,193 | ||||||
| Royal Mail plc | 68,102 | 423,348 | ||||||
| Segro plc, REIT | 68,409 | 569,251 | ||||||
| Sky plc | 10,586 | 238,540 | ||||||
| Smith & Nephew plc | 9,281 | 169,329 | ||||||
| Taylor Wimpey plc | 28,885 | 64,564 | ||||||
| Unilever NV, CVA | 8,077 | 449,282 | ||||||
| Unilever plc | 12,180 | 669,098 | ||||||
| Wm Morrison Supermarkets plc | 81,409 | 275,242 | ||||||
|
| |||||||
| 23,590,018 | ||||||||
|
| |||||||
| United States - 1.8% | ||||||||
| Bausch Health Cos., Inc. (1)* | 111,338 | 2,859,196 | ||||||
| Shire plc | 9,516 | 574,918 | ||||||
|
| |||||||
| 3,434,114 | ||||||||
|
| |||||||
TOTAL COMMON STOCKS |
| 184,867,441 | ||||||
|
| |||||||
| SHORT-TERM INVESTMENTS - 2.5% | ||||||||
| Investment Companies - 2.5% | ||||||||
| Limited Purpose Cash Investment Fund, 2.06% (1) (c) | ||||||||
(Cost $4,695,809) | 4,696,973 | 4,696,503 | ||||||
|
| |||||||
| The accompanying notes are an integral part of these financial statements. | (Continued) |
| AQR Funds | Annual Report | September 2018 | ||||||||||||||
88
Table of Contents
| Schedule of Investments | September 30, 2018 |
| AQR TM INTERNATIONAL MULTI-STYLE FUND |
| INVESTMENTS | SHARES | VALUE | ||||||
| SECURITIES LENDING COLLATERAL - 0.0% (d) | ||||||||
| Investment Companies - 0.0% (d) | ||||||||
| Investments in a Pooled Account through Securities Lending Program with Citibank NA | ||||||||
| BlackRock Liquidity Funds T-Fund Portfolio, Institutional Shares | ||||||||
| 1.97% (1)(c)(e) | 6,401 | $ | 6,401 | |||||
| Limited Purpose Cash Investment Fund | ||||||||
| 2.06% (1)(c)(e) | 45,933 | 45,929 | ||||||
|
| |||||||
TOTAL SECURITIES LENDING COLLATERAL |
| 52,330 | ||||||
|
| |||||||
TOTAL INVESTMENTS IN SECURITIES | 189,616,274 | |||||||
|
| |||||||
| OTHER ASSETS IN EXCESS OF LIABILITIES - 1.1% (f) | 2,055,376 | |||||||
|
| |||||||
NET ASSETS - 100.0% | $ | 191,671,650 | ||||||
|
| |||||||
| SECTOR | VALUE | % OF NET ASSETS | ||||||
| Communication Services | $ | 8,216,800 | 4.3 | % | ||||
| Consumer Discretionary | 28,515,187 | 14.9 | ||||||
| Consumer Staples | 13,366,489 | 7.0 | ||||||
| Energy | 17,446,589 | 9.1 | ||||||
| Financials | 33,696,484 | 17.6 | ||||||
| Health Care | 19,840,096 | 10.3 | ||||||
| Industrials | 27,791,324 | 14.5 | ||||||
| Information Technology | 14,864,429 | 7.7 | ||||||
| Materials | 14,864,562 | 7.8 | ||||||
| Real Estate | 4,101,256 | 2.1 | ||||||
| Utilities | 2,164,225 | 1.1 | ||||||
| Short-Term Investments | 4,696,503 | 2.5 | ||||||
| Securities Lending Collateral | 52,330 | 0.0 | (d) | |||||
|
|
|
| |||||
Total Investments In Securities At Value | 189,616,274 | 98.9 | ||||||
| Other Assets in Excess of Liabilities (f) | 2,055,376 | 1.1 | ||||||
|
|
|
| |||||
Net Assets | $ | 191,671,650 | 100.0 | % | ||||
|
|
|
| |||||
| * | Non-income producing security. |
| (a) | Securities exempt from registration under Rule 144A or section 4(2), of the Securities Act of 1933. Under procedures approved by the Board of Trustees, such securities have been determined to be liquid by the investment adviser and may be resold, normally to qualified institutional buyers in transactions exempt from registration. Total value of all such securities at September 30, 2018 amounted to $5,621,507, which represents approximately 2.93% of net assets of the fund. |
| (b) | The security or a portion of this security is on loan at September 30, 2018. The total value of securities on loan at September 30, 2018 was $50,138. |
| (c) | Represents 7-day effective yield as of September 30, 2018. |
| (d) | Represents less than 0.05% of net assets. |
| (e) | Represents security, or portion thereof, purchased with the cash collateral received for securities on loan (See Note 3). |
| (f) | Includes appreciation/(depreciation) on futures contracts. |
All securities are Level 2 with respect to ASC 820, unless otherwise noted in parentheses.
| (1) | Level 1 security (See Note 4). |
Abbreviations
CVA - Dutch Certification
OYJ - Public Traded Company
REIT - Real Estate Investment Trust
SCA - Limited partnership with share capital
Futures contracts outstanding as of September 30, 2018:
Exchange Traded
| DESCRIPTION | NUMBER OF CONTRACTS | EXPIRATION DATE | TRADING CURRENCY | NOTIONAL AMOUNT | VALUE AND UNREALIZED APPRECIATION (DEPRECIATION) | |||||||||||
| Long Contracts | ||||||||||||||||
| MSCI EAFE E-Mini Index | 48 | 12/2018 | USD | $4,741,200 | $26,906 | |||||||||||
|
| |||||||||||||||
| $26,906 | ||||||||||||||||
|
| |||||||||||||||
USD - United States Dollar
| The accompanying notes are an integral part of these financial statements. | (Continued) |
| AQR Funds | Annual Report | September 2018 | ||||||||||||||
89
Table of Contents
| Schedule of Investments | September 30, 2018 |
| AQR TM INTERNATIONAL MULTI-STYLE FUND |
Collateral pledged to, or (received from), each counterparty at September 30, 2018 was as follows:
| COUNTERPARTY | OVER THE COUNTER | EXCHANGE TRADED | TOTAL | |||||||||
| JPMS | ||||||||||||
| Cash | $ | — | $ | 168,955 | $ | 168,955 | ||||||
| ||||||||||||
| The accompanying notes are an integral part of these financial statements. |
| AQR Funds | Annual Report | September 2018 | ||||||||||||||
90
Table of Contents
| Schedule of Investments | September 30, 2018 |
| AQR TM EMERGING MULTI-STYLE FUND |
| INVESTMENTS | SHARES | VALUE | ||||||
| COMMON STOCKS - 96.7% |
| |||||||
| Brazil - 6.7% | ||||||||
| Ambev SA, ADR (1) | 177,084 | $ | 809,274 | |||||
| Banco Bradesco SA, ADR (1)* | 228,516 | 1,617,893 | ||||||
| Banco do Brasil SA (1)* | 74,700 | 543,619 | ||||||
| Banco Santander Brasil SA, ADR (1) | 30,759 | 270,987 | ||||||
| Braskem SA (Preference), Class A (1) | 211,300 | 3,049,255 | ||||||
| Cia de Saneamento Basico do Estado de Sao Paulo, ADR (1)* | 22,092 | 130,343 | ||||||
| Cia Siderurgica Nacional SA (1)* | 76,000 | 175,954 | ||||||
| Embraer SA, ADR (1) | 10,244 | 200,680 | ||||||
| Fibria Celulose SA (1) | 25,800 | 481,049 | ||||||
| Itau Unibanco Holding SA, ADR (1) | 144,881 | 1,590,793 | ||||||
| Itausa - Investimentos Itau SA (Preference) (1) | 456,100 | 1,136,142 | ||||||
| M Dias Branco SA (1)* | 26,700 | 260,683 | ||||||
| Petrobras Distribuidora SA (1) | 20,700 | 99,795 | ||||||
| Petroleo Brasileiro SA (Preference) (1)* | 296,100 | 1,547,018 | ||||||
| Porto Seguro SA (1) | 20,800 | 306,344 | ||||||
| Sul America SA (1) | 198,185 | 1,273,452 | ||||||
| Suzano Papel e Celulose SA (1) | 247,500 | 2,941,037 | ||||||
| TIM Participacoes SA, ADR (1) | 187,660 | 2,719,193 | ||||||
| Vale SA, ADR (1) | 204,521 | 3,035,092 | ||||||
|
| |||||||
| 22,188,603 | ||||||||
|
| |||||||
| Chile - 1.9% | ||||||||
| Banco de Chile, ADR (1)(a) | 4,020 | 366,021 | ||||||
| Banco de Credito e Inversiones SA | 2,196 | 148,533 | ||||||
| Banco Santander Chile, ADR (1) | 20,668 | 660,963 | ||||||
| Cencosud SA | 581,007 | 1,381,142 | ||||||
| Cia Cervecerias Unidas SA, ADR (1)(a) | 23,944 | 668,038 | ||||||
| Empresas CMPC SA | 180,152 | 727,042 | ||||||
| Empresas COPEC SA | 19,174 | 296,215 | ||||||
| Enel Americas SA, ADR (1) | 125,409 | 969,412 | ||||||
| Enel Chile SA, ADR (1) | 49,740 | 249,197 | ||||||
| Itau CorpBanca | 13,863,093 | 142,743 | ||||||
| Latam Airlines Group SA, ADR (1)(a) | 38,904 | 365,698 | ||||||
| Sociedad Quimica y Minera de Chile SA, ADR (1)(a) | 4,982 | 227,777 | ||||||
|
| |||||||
| 6,202,781 | ||||||||
|
| |||||||
| China - 27.7% | ||||||||
| 3SBio, Inc. (b) | 80,000 | 134,056 | ||||||
| 58.com, Inc., ADR (1)* | 5,066 | 372,858 | ||||||
| Agricultural Bank of China Ltd., Class A * | 630,700 | 356,804 | ||||||
| Agricultural Bank of China Ltd., Class H | 2,532,000 | 1,241,747 | ||||||
| Air China Ltd., Class H | 874,000 | 840,726 | ||||||
| Alibaba Group Holding Ltd., ADR (1)* | 73,305 | 12,077,731 | ||||||
| Alibaba Health Information Technology Ltd. * | 634,000 | 619,983 | ||||||
| Anhui Conch Cement Co. Ltd., Class H | 317,000 | 1,903,552 | ||||||
| ANTA Sports Products Ltd. | 80,000 | 381,907 | ||||||
| Autohome, Inc., ADR (1) | 3,195 | 247,325 | ||||||
| Baidu, Inc., ADR (1)* | 16,725 | 3,824,672 | ||||||
| Bank of China Ltd., Class A * | 803,600 | 434,716 | ||||||
| Bank of China Ltd., Class H | 1,778,000 | 785,597 | ||||||
| Baoshan Iron & Steel Co. Ltd. * | 84,501 | 96,453 | ||||||
| China Communications Services Corp. Ltd., Class H | 1,226,000 | 1,130,505 | ||||||
| INVESTMENTS | SHARES | VALUE | ||||||
| China - 27.7% (continued) | ||||||||
| China Construction Bank Corp., Class H | 6,795,000 | $ | 5,939,512 | |||||
| China Everbright Bank Co. Ltd., Class H | 234,000 | 103,643 | ||||||
| China Evergrande Group | 786,000 | 2,194,430 | ||||||
| China Medical System Holdings Ltd. | 346,000 | 481,797 | ||||||
| China Merchants Bank Co. Ltd., Class H | 621,000 | 2,511,062 | ||||||
| China Minsheng Banking Corp. Ltd., Class H | 321,000 | 238,023 | ||||||
| China Mobile Ltd. | 278,000 | 2,733,252 | ||||||
| China National Building Material Co. Ltd., Class H | 1,170,000 | 1,037,570 | ||||||
| China Overseas Land & Investment Ltd. | 400,000 | 1,252,370 | ||||||
| China Petroleum & Chemical Corp., Class H | 1,896,000 | 1,905,005 | ||||||
| China Resources Beer Holdings Co. Ltd. | 118,000 | 473,199 | ||||||
| China Resources Cement Holdings Ltd. | 982,000 | 1,141,998 | ||||||
| China Resources Land Ltd. | 302,000 | 1,058,239 | ||||||
| China Shenhua Energy Co. Ltd., Class H | 238,500 | 543,175 | ||||||
| China Southern Airlines Co. Ltd., Class H | 286,000 | 182,291 | ||||||
| China Vanke Co. Ltd., Class H | 373,700 | 1,231,993 | ||||||
| Chongqing Rural Commercial Bank Co. Ltd., Class H | 953,000 | 520,072 | ||||||
| CNOOC Ltd., ADR (1) | 13,620 | 2,690,495 | ||||||
| Country Garden Holdings Co. Ltd. | 1,935,000 | 2,438,449 | ||||||
| CSPC Pharmaceutical Group Ltd. | 370,000 | 782,637 | ||||||
| Ctrip.com International Ltd., ADR (1)* | 22,693 | 843,499 | ||||||
| Far East Horizon Ltd. | 329,000 | 313,781 | ||||||
| Geely Automobile Holdings Ltd. | 805,000 | 1,603,126 | ||||||
| Genscript Biotech Corp. * | 50,000 | 83,878 | ||||||
| Hengan International Group Co. Ltd. | 12,500 | 114,876 | ||||||
| Huaneng Renewables Corp. Ltd., Class H | 886,000 | 264,193 | ||||||
| Huazhu Group Ltd., ADR (1) | 8,063 | 260,435 | ||||||
| Industrial & Commercial Bank of China Ltd., Class A * | 120,900 | 101,447 | ||||||
| Industrial & Commercial Bank of China Ltd., Class H | 5,453,000 | 3,981,200 | ||||||
| Industrial Bank Co. Ltd., Class A * | 96,390 | 223,649 | ||||||
| JD.com, Inc., ADR (1)* | 46,823 | 1,221,612 | ||||||
| Jiangsu Hengrui Medicine Co. Ltd. * | 50,868 | 469,714 | ||||||
| Kingdee International Software Group Co. Ltd. | 396,000 | 429,824 | ||||||
| Kingsoft Corp. Ltd. | 88,000 | 166,894 | ||||||
| Luye Pharma Group Ltd. | 642,500 | 575,236 | ||||||
| Momo, Inc., ADR (1)* | 7,296 | 319,565 | ||||||
| NetEase, Inc., ADR (1) | 5,427 | 1,238,713 | ||||||
| New Oriental Education & Technology Group, Inc., ADR (1)* | 8,807 | 651,806 | ||||||
| PICC Property & Casualty Co. Ltd., Class H | 244,000 | 287,167 | ||||||
| Ping An Insurance Group Co. of China Ltd., Class H | 90,500 | 916,784 | ||||||
| Shandong Weigao Group Medical Polymer Co. Ltd., Class H | 252,000 | 248,677 | ||||||
| Shanghai Fosun Pharmaceutical Group Co. Ltd., Class H | 38,500 | 151,290 | ||||||
| Shanghai Pharmaceuticals Holding Co. Ltd., Class H | 95,100 | 237,728 | ||||||
| Shenzhou International Group Holdings Ltd. | 11,000 | 141,142 | ||||||
| SINA Corp. (1)* | 4,017 | 279,101 | ||||||
| Sinopec Shanghai Petrochemical Co. Ltd., Class H | 2,718,000 | 1,657,703 | ||||||
| The accompanying notes are an integral part of these financial statements. | (Continued) |
| AQR Funds | Annual Report | September 2018 | ||||||||||||||
91
Table of Contents
| Schedule of Investments | September 30, 2018 |
| AQR TM EMERGING MULTI-STYLE FUND |
| INVESTMENTS | SHARES | VALUE | ||||||
| China - 27.7% (continued) | ||||||||
| Sinopharm Group Co. Ltd., Class H | 147,600 | $ | 721,965 | |||||
| Sinotruk Hong Kong Ltd. (a) | 404,500 | 882,526 | ||||||
| TAL Education Group, ADR (1)* | 17,856 | 459,078 | ||||||
| Tencent Holdings Ltd. | 290,000 | 11,840,939 | ||||||
| Tingyi Cayman Islands Holding Corp. | 386,000 | 708,781 | ||||||
| TravelSky Technology Ltd., Class H | 647,000 | 1,682,279 | ||||||
| Tsingtao Brewery Co. Ltd., Class H | 132,000 | 619,204 | ||||||
| Vipshop Holdings Ltd., ADR (1)*(a) | 27,558 | 171,962 | ||||||
| Weibo Corp., ADR (1)*(a) | 2,989 | 218,586 | ||||||
| Weichai Power Co. Ltd., Class H | 1,642,000 | 2,032,706 | ||||||
| Wuxi Biologics Cayman, Inc.*(b) | 16,500 | 166,974 | ||||||
| Yum China Holdings, Inc. (1) | 27,400 | 962,014 | ||||||
| Zhongsheng Group Holdings Ltd. | 373,500 | 906,543 | ||||||
|
| |||||||
| 92,064,441 | ||||||||
|
| |||||||
| Hong Kong - 2.1% | ||||||||
| Bank of Communications Co. Ltd. * | 216,500 | 183,882 | ||||||
| Haier Electronics Group Co. Ltd. * | 593,000 | 1,605,455 | ||||||
| Kingboard Holdings Ltd. | 95,000 | 309,245 | ||||||
| Kingboard Laminates Holdings Ltd. | 294,000 | 260,673 | ||||||
| Lee & Man Paper Manufacturing Ltd. | 103,000 | 95,374 | ||||||
| Nine Dragons Paper Holdings Ltd. | 2,022,000 | 2,180,345 | ||||||
| Sino Biopharmaceutical Ltd. | 1,288,500 | 1,198,479 | ||||||
| SSY Group Ltd. | 224,000 | 216,870 | ||||||
| Sun Art Retail Group Ltd. | 599,500 | 777,734 | ||||||
|
| |||||||
| 6,828,057 | ||||||||
|
| |||||||
| Hungary - 0.3% | ||||||||
| MOL Hungarian Oil & Gas plc | 59,392 | 639,707 | ||||||
| Richter Gedeon Nyrt | 16,642 | 311,235 | ||||||
|
| |||||||
| 950,942 | ||||||||
|
| |||||||
| India - 8.5% | ||||||||
| Ashok Leyland Ltd. | 88,344 | 145,194 | ||||||
| Aurobindo Pharma Ltd. | 88,145 | 905,195 | ||||||
| Axis Bank Ltd., GDR *(c) | 12,578 | 532,001 | ||||||
| Dabur India Ltd. | 31,245 | 184,027 | ||||||
| Dr Reddy’s Laboratories Ltd., ADR (1) | 2,738 | 94,735 | ||||||
| Glenmark Pharmaceuticals Ltd. | 26,012 | 226,929 | ||||||
| Godrej Consumer Products Ltd. | 12,177 | 129,145 | ||||||
| HCL Technologies Ltd. | 22,387 | 335,960 | ||||||
| Hindustan Unilever Ltd. | 100,311 | 2,226,219 | ||||||
| Indian Oil Corp. Ltd. | 62,954 | 133,162 | ||||||
| Infosys Ltd., ADR (1) | 732,692 | 7,451,478 | ||||||
| InterGlobe Aviation Ltd. (b) | 22,560 | 257,125 | ||||||
| JSW Steel Ltd. | 50,159 | 264,213 | ||||||
| Larsen & Toubro Ltd., GDR (c) | 9,010 | 156,321 | ||||||
| Oil & Natural Gas Corp. Ltd. | 278,672 | 681,579 | ||||||
| Reliance Industries Ltd., GDR (b) | 88,364 | 3,040,512 | ||||||
| State Bank of India, GDR *(c) | 14,240 | 525,761 | ||||||
| Sun Pharmaceutical Industries Ltd. | 70,882 | 609,419 | ||||||
| Tata Consultancy Services Ltd. | 171,857 | 5,177,202 | ||||||
| Tata Motors Ltd., ADR (1)* | 8,267 | 126,981 | ||||||
| Tech Mahindra Ltd. | 321,193 | 3,303,466 | ||||||
| United Spirits Ltd. * | 24,679 | 175,145 | ||||||
| Wipro Ltd., ADR (1)(a) | 308,567 | 1,607,634 | ||||||
|
| |||||||
| 28,289,403 | ||||||||
|
| |||||||
| INVESTMENTS | SHARES | VALUE | ||||||
| Indonesia - 2.1% | ||||||||
| Adaro Energy Tbk. PT | 13,117,800 | $ | 1,614,061 | |||||
| Bank Central Asia Tbk. PT | 477,700 | 773,755 | ||||||
| Bank Mandiri Persero Tbk. PT | 902,700 | 406,769 | ||||||
| Bank Negara Indonesia Persero Tbk. PT | 650,500 | 323,033 | ||||||
| Bank Rakyat Indonesia Persero Tbk. PT | 6,705,900 | 1,417,082 | ||||||
| Gudang Garam Tbk. PT | 39,900 | 198,230 | ||||||
| Indah Kiat Pulp & Paper Corp. Tbk. PT | 531,700 | 618,651 | ||||||
| Indofood CBP Sukses Makmur Tbk. PT | 291,800 | 172,928 | ||||||
| Indofood Sukses Makmur Tbk. PT | 712,900 | 282,284 | ||||||
| Telekomunikasi Indonesia Persero Tbk. PT | 462,300 | 113,160 | ||||||
| United Tractors Tbk. PT | 539,300 | 1,194,028 | ||||||
|
| |||||||
| 7,113,981 | ||||||||
|
| |||||||
| Malaysia - 3.3% | ||||||||
| AirAsia Group Bhd. | 2,020,008 | 1,541,930 | ||||||
| CIMB Group Holdings Bhd. | 76,600 | 111,210 | ||||||
| Genting Bhd. | 255,400 | 481,920 | ||||||
| Hartalega Holdings Bhd. | 55,800 | 89,207 | ||||||
| Hong Leong Bank Bhd. | 127,200 | 632,598 | ||||||
| Malayan Banking Bhd. | 1,147,200 | 2,713,275 | ||||||
| Malaysia Airports Holdings Bhd. | 95,000 | 204,239 | ||||||
| Petronas Chemicals Group Bhd. | 294,800 | 666,685 | ||||||
| Petronas Dagangan Bhd. | 18,100 | 114,861 | ||||||
| Public Bank Bhd. | 481,200 | 2,906,329 | ||||||
| Sime Darby Bhd. | 819,900 | 516,969 | ||||||
| Tenaga Nasional Bhd. | 183,400 | 685,730 | ||||||
| Top Glove Corp. Bhd. | 69,300 | 178,416 | ||||||
|
| |||||||
| 10,843,369 | ||||||||
|
| |||||||
| Mexico - 2.5% | ||||||||
| America Movil SAB de CV, Class L, ADR (1) | 92,052 | 1,478,355 | ||||||
| Arca Continental SAB de CV (1) | 87,200 | 563,254 | ||||||
| Cemex SAB de CV, ADR (1)* | 21,479 | 151,212 | ||||||
| Fomento Economico Mexicano SAB de CV, ADR (1) | 2,036 | 201,503 | ||||||
| Gentera SAB de CV (1) | 35,400 | 35,922 | ||||||
| Grupo Aeroportuario del Pacifico SAB de CV, Class B (1) | 90,600 | 990,432 | ||||||
| Grupo Financiero Banorte SAB de CV, Class O (1) | 236,800 | 1,712,036 | ||||||
| Grupo Televisa SAB, ADR (1) | 5,879 | 104,293 | ||||||
| Wal-Mart de Mexico SAB de CV (1) | 1,021,600 | 3,113,277 | ||||||
|
| |||||||
| 8,350,284 | ||||||||
|
| |||||||
| Peru - 0.3% | ||||||||
| Credicorp Ltd. (1) | 4,593 | 1,024,606 | ||||||
|
| |||||||
| Philippines - 0.5% | ||||||||
| Ayala Corp. | 6,500 | 111,616 | ||||||
| Bank of the Philippine Islands | 58,230 | 89,783 | ||||||
| BDO Unibank, Inc. | 175,940 | 390,106 | ||||||
| Globe Telecom, Inc. | 665 | 27,069 | ||||||
| International Container Terminal Services, Inc. | 79,240 | 137,916 | ||||||
| JG Summit Holdings, Inc. | 99,060 | 98,835 | ||||||
| Jollibee Foods Corp. | 27,120 | 128,946 | ||||||
| Security Bank Corp. | 27,770 | 79,129 | ||||||
| SM Investments Corp. | 39,465 | 660,063 | ||||||
|
| |||||||
| 1,723,463 | ||||||||
|
| |||||||
| The accompanying notes are an integral part of these financial statements. | (Continued) |
| AQR Funds | Annual Report | September 2018 | ||||||||||||||
92
Table of Contents
| Schedule of Investments | September 30, 2018 |
| AQR TM EMERGING MULTI-STYLE FUND |
| INVESTMENTS | SHARES | VALUE | ||||||
| Poland - 1.6% | ||||||||
| Grupa Lotos SA | 18,723 | $ | 380,817 | |||||
| Jastrzebska Spolka Weglowa SA * | 21,787 | 391,993 | ||||||
| LPP SA | 170 | 397,705 | ||||||
| PGE Polska Grupa Energetyczna SA * | 86,640 | 223,936 | ||||||
| Polski Koncern Naftowy ORLEN SA | 110,407 | 3,026,370 | ||||||
| Polskie Gornictwo Naftowe i Gazownictwo SA * | 306,744 | 538,422 | ||||||
| Santander Bank Polska SA | 2,222 | 225,981 | ||||||
| Tauron Polska Energia SA * | 144,914 | 69,582 | ||||||
|
| |||||||
| 5,254,806 | ||||||||
|
| |||||||
| Russia - 3.7% | ||||||||
| Gazprom PJSC, ADR | 400,359 | 1,997,804 | ||||||
| LUKOIL PJSC, ADR | 28,399 | 2,174,608 | ||||||
| Magnit PJSC, GDR (c) | 6,719 | 95,316 | ||||||
| Mobile TeleSystems PJSC, ADR (1) | 201,369 | 1,717,678 | ||||||
| Novatek PJSC, GDR (c) | 5,992 | 1,099,000 | ||||||
| Novolipetsk Steel PJSC, GDR (c) | 32,959 | 887,084 | ||||||
| Rosneft Oil Co. PJSC, GDR (c) | 78,075 | 583,357 | ||||||
| Severstal PJSC, GDR (c) | 95,902 | 1,597,251 | ||||||
| Surgutneftegas PJSC, ADR | 101,167 | 417,662 | ||||||
| Tatneft PJSC, ADR | 24,469 | 1,866,982 | ||||||
|
| |||||||
| 12,436,742 | ||||||||
|
| |||||||
| South Africa - 5.0% | ||||||||
| Absa Group Ltd. | 56,286 | 603,678 | ||||||
| Bidvest Group Ltd. (The) | 186,992 | 2,445,994 | ||||||
| Capitec Bank Holdings Ltd. | 12,654 | 915,338 | ||||||
| Exxaro Resources Ltd. | 132,133 | 1,358,365 | ||||||
| FirstRand Ltd. | 21,471 | 102,993 | ||||||
| Foschini Group Ltd. (The) | 35,201 | 431,960 | ||||||
| Imperial Holdings Ltd. | 199,843 | 2,470,853 | ||||||
| Investec Ltd. | 46,127 | 324,322 | ||||||
| Kumba Iron Ore Ltd. | 29,133 | 660,110 | ||||||
| Life Healthcare Group Holdings Ltd. | 117,856 | 204,647 | ||||||
| Naspers Ltd., Class N | 13,727 | 2,956,095 | ||||||
| Netcare Ltd. | 105,788 | 180,785 | ||||||
| Pick n Pay Stores Ltd. | 128,940 | 627,415 | ||||||
| Redefine Properties Ltd., REIT | 425,319 | 301,225 | ||||||
| Remgro Ltd. | 32,110 | 447,497 | ||||||
| RMB Holdings Ltd. | 22,581 | 126,247 | ||||||
| Standard Bank Group Ltd. | 128,221 | 1,585,519 | ||||||
| Telkom SA SOC Ltd. | 31,756 | 115,978 | ||||||
| Truworths International Ltd. | 152,923 | 901,959 | ||||||
|
| |||||||
| 16,760,980 | ||||||||
|
| |||||||
| South Korea - 14.7% | ||||||||
| Celltrion Healthcare Co. Ltd. * | 11,350 | 943,580 | ||||||
| Celltrion, Inc.* | 2,841 | 761,377 | ||||||
| Daelim Industrial Co. Ltd. | 5,434 | 404,659 | ||||||
| DB Insurance Co. Ltd. | 10,983 | 720,772 | ||||||
| DGB Financial Group, Inc. | 13,816 | 126,393 | ||||||
| E-MART, Inc. | 4,169 | 779,996 | ||||||
| GS Engineering & Construction Corp. | 3,641 | 171,601 | ||||||
| Hana Financial Group, Inc. | 5,895 | 236,701 | ||||||
| Hanwha Chemical Corp. | 8,032 | 139,728 | ||||||
| Hanwha Corp. | 29,527 | 873,247 | ||||||
| Hanwha Life Insurance Co. Ltd. | 26,267 | 125,273 | ||||||
| Hyundai Department Store Co. Ltd. | 4,698 | 421,004 | ||||||
| INVESTMENTS | SHARES | VALUE | ||||||
| South Korea - 14.7% (continued) | ||||||||
| Hyundai Marine & Fire Insurance Co. Ltd. | 49,266 | $ | 1,862,318 | |||||
| KB Financial Group, Inc. | 16,063 | 782,332 | ||||||
| Kumho Petrochemical Co. Ltd. | 4,987 | 442,781 | ||||||
| LG Electronics, Inc. | 45,970 | 2,941,651 | ||||||
| Lotte Chemical Corp. | 16,324 | 4,090,924 | ||||||
| POSCO | 10,988 | 2,916,730 | ||||||
| Posco Daewoo Corp. | 11,494 | 216,870 | ||||||
| S-1 Corp. | 2,690 | 221,637 | ||||||
| Samsung Biologics Co. Ltd. *(b) | 1,300 | 625,589 | ||||||
| Samsung Electronics Co. Ltd. | 329,239 | 13,778,939 | ||||||
| Samsung SDS Co. Ltd. | 2,159 | 449,534 | ||||||
| SillaJen, Inc. * | 9,010 | 831,321 | ||||||
| SK Hynix, Inc. | 114,524 | 7,576,667 | ||||||
| SK Innovation Co. Ltd. | 17,729 | 3,436,589 | ||||||
| SK Telecom Co. Ltd. | 2,235 | 566,651 | ||||||
| ViroMed Co. Ltd. * | 2,044 | 443,819 | ||||||
| Woori Bank | 118,554 | 1,805,251 | ||||||
|
| |||||||
| 48,693,934 | ||||||||
|
| |||||||
| Taiwan - 11.3% | ||||||||
| ASE Technology Holding Co. Ltd. | 43,000 | 105,028 | ||||||
| AU Optronics Corp. | 5,801,000 | 2,446,399 | ||||||
| Cathay Financial Holding Co. Ltd. | 353,000 | 606,668 | ||||||
| China Airlines Ltd. | 636,000 | 192,639 | ||||||
| China Life Insurance Co. Ltd. | 2,063,956 | 2,075,291 | ||||||
| CTBC Financial Holding Co. Ltd. | 1,356,480 | 1,021,317 | ||||||
| E.Sun Financial Holding Co. Ltd. | 594,335 | 438,814 | ||||||
| Eva Airways Corp. | 458,289 | 222,850 | ||||||
| First Financial Holding Co. Ltd. | 1,495,143 | 1,018,244 | ||||||
| Formosa Chemicals & Fibre Corp. | 62,000 | 259,820 | ||||||
| Formosa Petrochemical Corp. | 46,000 | 222,972 | ||||||
| Foxconn Technology Co. Ltd. | 62,000 | 151,300 | ||||||
| Fubon Financial Holding Co. Ltd. | 518,000 | 878,602 | ||||||
| General Interface Solution Holding Ltd. | 76,000 | 320,288 | ||||||
| Globalwafers Co. Ltd. | 8,000 | 88,160 | ||||||
| Hiwin Technologies Corp. | 28,000 | 231,349 | ||||||
| Hon Hai Precision Industry Co. Ltd. | 1,209,545 | 3,136,568 | ||||||
| Hua Nan Financial Holdings Co. Ltd. | 282,150 | 170,896 | ||||||
| Innolux Corp. | 1,902,000 | 660,492 | ||||||
| Inventec Corp. | 164,000 | 147,151 | ||||||
| Macronix International | 89,000 | 74,146 | ||||||
| Mega Financial Holding Co. Ltd. | 684,000 | 615,810 | ||||||
| Nanya Technology Corp. | 776,000 | 1,481,844 | ||||||
| Phison Electronics Corp. | 36,000 | 286,911 | ||||||
| Pou Chen Corp. | 755,000 | 797,162 | ||||||
| Powertech Technology, Inc. | 517,000 | 1,408,600 | ||||||
| Realtek Semiconductor Corp. * | 230,000 | 1,024,942 | ||||||
| Shin Kong Financial Holding Co. Ltd. | 5,042,587 | 1,972,074 | ||||||
| Synnex Technology International Corp. | 84,000 | 107,052 | ||||||
| Taishin Financial Holding Co. Ltd. | 971,827 | 469,322 | ||||||
| Taiwan Business Bank | 586,560 | 213,199 | ||||||
| Taiwan Cement Corp. | 70,000 | 94,186 | ||||||
| Taiwan Cooperative Financial Holding Co. Ltd. | 301,295 | 183,514 | ||||||
| Taiwan Semiconductor Manufacturing Co. Ltd., ADR (1) | 267,044 | 11,792,664 | ||||||
| Uni-President Enterprises Corp. | 552,000 | 1,440,171 | ||||||
| United Microelectronics Corp. | 808,000 | 426,312 | ||||||
| Winbond Electronics Corp. | 848,000 | 403,323 | ||||||
| WPG Holdings Ltd. | 173,880 | 211,512 | ||||||
| The accompanying notes are an integral part of these financial statements. | (Continued) |
| AQR Funds | Annual Report | September 2018 | ||||||||||||||
93
Table of Contents
| Schedule of Investments | September 30, 2018 |
| AQR TM EMERGING MULTI-STYLE FUND |
| INVESTMENTS | SHARES | VALUE | ||||||
| Taiwan - 11.3% (continued) | ||||||||
| Zhen Ding Technology Holding Ltd. | 47,000 | $ | 104,945 | |||||
|
| |||||||
| 37,502,537 | ||||||||
|
| |||||||
| Thailand - 3.3% | ||||||||
| Bangkok Dusit Medical Services PCL, NVDR | 856,000 | 674,914 | ||||||
| Bumrungrad Hospital PCL, NVDR | 27,200 | 156,354 | ||||||
| Home Product Center PCL, NVDR | 582,300 | 284,656 | ||||||
| Indorama Ventures PCL, NVDR | 55,300 | 100,909 | ||||||
| Krung Thai Bank PCL, NVDR | 1,643,500 | 1,026,583 | ||||||
| PTT Exploration & Production PCL, NVDR | 86,100 | 413,220 | ||||||
| PTT Global Chemical PCL, NVDR | 1,652,700 | 4,153,090 | ||||||
| PTT PCL, NVDR | 868,700 | 1,458,363 | ||||||
| Robinson PCL, NVDR | 61,700 | 134,644 | ||||||
| Siam Cement PCL (The), NVDR | 19,400 | 267,731 | ||||||
| Thai Oil PCL, NVDR | 753,500 | 2,063,151 | ||||||
| Thai Union Group PCL, NVDR | 346,396 | 191,720 | ||||||
|
| |||||||
| 10,925,335 | ||||||||
|
| |||||||
| Turkey - 0.8% | ||||||||
| TAV Havalimanlari Holding A/S | 20,962 | 108,428 | ||||||
| Turkiye Garanti Bankasi A/S | 819,834 | 1,045,244 | ||||||
| Turkiye Halk Bankasi A/S | 279,324 | 309,651 | ||||||
| Turkiye Sise ve Cam Fabrikalari A/S | 725,414 | 700,570 | ||||||
| Turkiye Vakiflar Bankasi TAO, Class D | 300,707 | 188,294 | ||||||
| Yapi ve Kredi Bankasi A/S * | 655,036 | 203,548 | ||||||
|
| |||||||
| 2,555,735 | ||||||||
|
| |||||||
| United Kingdom - 0.4% | ||||||||
| Mondi Ltd. | 53,181 | 1,460,454 | ||||||
|
| |||||||
TOTAL COMMON STOCKS |
| 321,170,453 | ||||||
|
| |||||||
| SHORT-TERM INVESTMENTS - 2.8% | ||||||||
| Investment Companies - 2.8% | ||||||||
| Limited Purpose Cash Investment Fund, 2.06% (1)(d) | ||||||||
(Cost $9,202,452) | 9,204,440 | 9,203,520 | ||||||
|
| |||||||
| SECURITIES LENDING COLLATERAL - 0.7% | ||||||||
| Investment Companies - 0.7% | ||||||||
| Investments in a Pooled Account through Securities Lending Program with Citibank NA | ||||||||
| BlackRock Liquidity Funds T-Fund Portfolio, Institutional Shares | ||||||||
| 1.97% (1)(d)(e) | 292,871 | 292,871 | ||||||
| Limited Purpose Cash Investment Fund | ||||||||
| 2.06% (1)(d)(e) | 2,101,528 | 2,101,318 | ||||||
|
| |||||||
TOTAL SECURITIES LENDING COLLATERAL | 2,394,189 | |||||||
|
| |||||||
TOTAL INVESTMENTS IN SECURITIES |
| 332,768,162 | ||||||
|
| |||||||
| Liabilities IN EXCESS OF OTHER ASSETS - (0.2)% (f) | (757,256) | |||||||
|
| |||||||
NET ASSETS - 100.0% |
| $ | 332,010,906 | |||||
|
| |||||||
| SECTOR | VALUE | % OF NET ASSETS | ||||||
| Communication Services | $ | 32,003,989 | 9.6 | % | ||||
| Consumer Discretionary | 30,905,549 | 9.3 | ||||||
| Consumer Staples | 16,193,559 | 4.9 | ||||||
| Energy | 35,437,499 | 10.7 | ||||||
| Financials | 62,409,275 | 18.8 | ||||||
| Health Care | 13,326,806 | 4.0 | ||||||
| Industrials | 15,003,497 | 4.5 | ||||||
| Information Technology | 66,907,431 | 20.1 | ||||||
| Materials | 37,913,749 | 11.4 | ||||||
| Real Estate | 8,476,706 | 2.6 | ||||||
| Utilities | 2,592,393 | 0.8 | ||||||
| Short-Term Investments | 9,203,520 | 2.8 | ||||||
| Securities Lending Collateral | 2,394,189 | 0.7 | ||||||
|
|
|
| |||||
Total Investments In Securities At Value | 332,768,162 | 100.2 | ||||||
| Liabilities in Excess of Other Assets (f) | (757,256 | ) | (0.2 | ) | ||||
|
|
|
| |||||
Net Assets | $ | 332,010,906 | 100.0 | % | ||||
|
|
|
| |||||
| * | Non-income producing security. |
| (a) | The security or a portion of this security is on loan at September 30, 2018. The total value of securities on loan at September 30, 2018 was $2,998,511. |
| (b) | Securities exempt from registration under Rule 144A or section 4(2), of the Securities Act of 1933. Under procedures approved by the Board of Trustees, such securities have been determined to be liquid by the investment adviser and may be resold, normally to qualified institutional buyers in transactions exempt from registration. Total value of all such securities at September 30, 2018 amounted to $4,224,256, which represents approximately 1.27% of net assets of the fund. |
| (c) | Security exempt from registration pursuant to Regulation S under the Securities Act of 1933. Regulation S applies to securities offerings that are made outside of the United States and do not involve direct selling efforts in the United States. At September 30, 2018, the value of these securities amounted to $5,476,091 or 1.65% of net assets. |
| (d) | Represents 7-day effective yield as of September 30, 2018. |
| (e) | Represents security, or portion thereof, purchased with the cash collateral received for securities on loan; additional non-cash collateral of $724,522 was received (See Note 3). |
| (f) | Includes appreciation/(depreciation) on futures contracts. |
All securities are Level 2 with respect to ASC 820, unless otherwise noted in parentheses.
| (1) | Level 1 security (See Note 4). |
Abbreviations
ADR - American Depositary Receipt
GDR - Global Depositary Receipt
NVDR - Non-Voting Depositary Receipt
PJSC - Public Joint Stock Company
Preference - A special type of equity investment that shares in the earnings of the company, has limited voting rights, and may have a dividend preference. Preference shares may also have liquidation preference.
REIT - Real Estate Investment Trust
| The accompanying notes are an integral part of these financial statements. | (Continued) |
| AQR Funds | Annual Report | September 2018 | ||||||||||||||
94
Table of Contents
| Schedule of Investments | September 30, 2018 |
| AQR TM EMERGING MULTI-STYLE FUND |
Futures contracts outstanding as of September 30, 2018:
Exchange Traded
| DESCRIPTION | NUMBER OF CONTRACTS | EXPIRATION DATE | TRADING CURRENCY | NOTIONAL AMOUNT | VALUE AND UNREALIZED APPRECIATION (DEPRECIATION) | |||||||||||
| Long Contracts | ||||||||||||||||
| MSCI Emerging Markets E-Mini Index | 106 | 12/2018 | USD | $5,563,410 | $119,288 | |||||||||||
|
| |||||||||||||||
| $119,288 | ||||||||||||||||
|
| |||||||||||||||
USD - United States Dollar
Collateral pledged to, or (received from), each counterparty at September 30, 2018 was as follows:
| COUNTERPARTY | OVER THE COUNTER | EXCHANGE TRADED | TOTAL | |||||||||
| JPMS | ||||||||||||
| Cash | $— | $148,246 | $148,246 | |||||||||
| ||||||||||||
| The accompanying notes are an integral part of these financial statements. |
| AQR Funds | Annual Report | September 2018 | ||||||||||||||
95
Table of Contents
| Schedule of Investments | September 30, 2018 |
| AQR LARGE CAP MOMENTUM STYLE FUND |
| INVESTMENTS | SHARES | VALUE | ||||||
| COMMON STOCKS - 97.8% | ||||||||
| Aerospace & Defense - 3.0% | ||||||||
| Boeing Co. (The) | 47,261 | $ | 17,576,366 | |||||
| BWX Technologies, Inc. | 15,551 | 972,559 | ||||||
| General Dynamics Corp. | 2,253 | 461,234 | ||||||
| Harris Corp. | 12,881 | 2,179,594 | ||||||
| HEICO Corp. | 7,098 | 657,346 | ||||||
| Huntington Ingalls Industries, Inc. | 7,264 | 1,860,165 | ||||||
| L3 Technologies, Inc. | 2,318 | 492,853 | ||||||
| Lockheed Martin Corp. | 5,776 | 1,998,265 | ||||||
| Northrop Grumman Corp. | 11,510 | 3,652,929 | ||||||
| Raytheon Co. | 15,257 | 3,153,012 | ||||||
| Spirit AeroSystems Holdings, Inc., Class A | 6,113 | 560,379 | ||||||
| Textron, Inc. | 7,880 | 563,183 | ||||||
| TransDigm Group, Inc. * | 2,517 | 937,079 | ||||||
|
| |||||||
| 35,064,964 | ||||||||
|
| |||||||
| Air Freight & Logistics - 0.5% | ||||||||
| CH Robinson Worldwide, Inc. | 6,008 | 588,303 | ||||||
| Expeditors International of Washington, Inc. | 7,296 | 536,475 | ||||||
| FedEx Corp. | 10,445 | 2,515,052 | ||||||
| XPO Logistics, Inc. * | 22,842 | 2,607,871 | ||||||
|
| |||||||
| 6,247,701 | ||||||||
|
| |||||||
| Auto Components - 0.2% | ||||||||
| Aptiv plc | 17,210 | 1,443,919 | ||||||
| Gentex Corp. | 26,000 | 557,960 | ||||||
| Lear Corp. | 5,514 | 799,530 | ||||||
|
| |||||||
| 2,801,409 | ||||||||
|
| |||||||
| Automobiles - 0.0% (a) | ||||||||
| Thor Industries, Inc. | 6,141 | 514,002 | ||||||
|
| |||||||
| Banks - 4.1% | ||||||||
| Bank of America Corp. | 518,692 | 15,280,666 | ||||||
| Bank of Hawaii Corp. | 4,749 | 374,744 | ||||||
| BB&T Corp. | 22,135 | 1,074,433 | ||||||
| Citizens Financial Group, Inc. | 32,213 | 1,242,455 | ||||||
| Comerica, Inc. | 27,044 | 2,439,369 | ||||||
| Commerce Bancshares, Inc. | 15,784 | 1,042,060 | ||||||
| Cullen/Frost Bankers, Inc. | 4,627 | 483,244 | ||||||
| East West Bancorp, Inc. | 15,899 | 959,823 | ||||||
| Fifth Third Bancorp | 28,074 | 783,826 | ||||||
| JPMorgan Chase & Co. | 96,331 | 10,869,990 | ||||||
| PNC Financial Services Group, Inc. (The) | 8,180 | 1,114,034 | ||||||
| Regions Financial Corp. | 121,005 | 2,220,442 | ||||||
| SunTrust Banks, Inc. | 24,085 | 1,608,637 | ||||||
| SVB Financial Group * | 12,674 | 3,939,459 | ||||||
| Synovus Financial Corp. | 9,723 | 445,216 | ||||||
| TCF Financial Corp. | 46,629 | 1,110,236 | ||||||
| Western Alliance Bancorp *(b) | 28,719 | 1,633,824 | ||||||
| Wintrust Financial Corp. | 5,910 | 501,995 | ||||||
| ZB NA | 20,370 | 1,021,556 | ||||||
|
| |||||||
| 48,146,009 | ||||||||
|
| |||||||
| Beverages - 0.4% | ||||||||
| Brown-Forman Corp., Class B | 13,195 | 667,007 | ||||||
| Constellation Brands, Inc., Class A | 13,025 | 2,808,451 | ||||||
| INVESTMENTS | SHARES | VALUE | ||||||
| Beverages - 0.4% (continued) | ||||||||
| Monster Beverage Corp. * | 10,879 | $ | 634,028 | |||||
|
| |||||||
| 4,109,486 | ||||||||
|
| |||||||
| Biotechnology - 2.2% | ||||||||
| AbbVie, Inc. | 107,579 | 10,174,822 | ||||||
| Agios Pharmaceuticals, Inc. *(b) | 9,845 | 759,246 | ||||||
| Alkermes plc * | 9,735 | 413,153 | ||||||
| Alnylam Pharmaceuticals, Inc. * | 9,052 | 792,231 | ||||||
| Bluebird Bio, Inc. *(b) | 10,348 | 1,510,808 | ||||||
| Exact Sciences Corp.* | 24,391 | 1,924,938 | ||||||
| Exelixis, Inc. * | 25,623 | 454,040 | ||||||
| Ionis Pharmaceuticals, Inc. *(b) | 9,483 | 489,133 | ||||||
| Neurocrine Biosciences, Inc. * | 21,844 | 2,685,720 | ||||||
| Sage Therapeutics, Inc. * | 9,414 | 1,329,728 | ||||||
| Sarepta Therapeutics, Inc. * | 20,946 | 3,382,988 | ||||||
| Seattle Genetics, Inc. * | 7,385 | 569,531 | ||||||
| Vertex Pharmaceuticals, Inc. * | 6,780 | 1,306,777 | ||||||
|
| |||||||
| 25,793,115 | ||||||||
|
| |||||||
| Building Products - 0.4% | ||||||||
| Allegion plc | 5,355 | 485,003 | ||||||
| AO Smith Corp. | 28,579 | 1,525,261 | ||||||
| Lennox International, Inc. | 5,769 | 1,259,950 | ||||||
| Masco Corp. | 13,277 | 485,938 | ||||||
| Owens Corning | 5,942 | 322,472 | ||||||
|
| |||||||
| 4,078,624 | ||||||||
|
| |||||||
| Capital Markets - 3.5% | ||||||||
| BlackRock, Inc. | 8,051 | 3,794,678 | ||||||
| Cboe Global Markets, Inc. | 9,630 | 924,095 | ||||||
| Charles Schwab Corp. (The) | 88,447 | 4,347,170 | ||||||
| CME Group, Inc. | 29,882 | 5,086,215 | ||||||
| E*TRADE Financial Corp. * | 57,294 | 3,001,633 | ||||||
| Evercore, Inc., Class A | 5,062 | 508,984 | ||||||
| FactSet Research Systems, Inc. | 2,228 | 498,426 | ||||||
| Interactive Brokers Group, Inc., Class A | 54,623 | 3,021,198 | ||||||
| Intercontinental Exchange, Inc. | 22,090 | 1,654,320 | ||||||
| LPL Financial Holdings, Inc. | 24,345 | 1,570,496 | ||||||
| MarketAxess Holdings, Inc. | 6,866 | 1,225,512 | ||||||
| Moody’s Corp. | 10,272 | 1,717,478 | ||||||
| Morgan Stanley | 6,952 | 323,755 | ||||||
| Morningstar, Inc. | 7,785 | 980,132 | ||||||
| MSCI, Inc. | 14,254 | 2,528,802 | ||||||
| Nasdaq, Inc. | 16,104 | 1,381,723 | ||||||
| Raymond James Financial, Inc. | 8,241 | 758,584 | ||||||
| S&P Global, Inc. | 21,127 | 4,128,005 | ||||||
| SEI Investments Co. | 7,582 | 463,260 | ||||||
| T. Rowe Price Group, Inc. | 21,382 | 2,334,487 | ||||||
| Virtu Financial, Inc., Class A (b) | 27,849 | 569,512 | ||||||
|
| |||||||
| 40,818,465 | ||||||||
|
| |||||||
| Chemicals - 0.7% | ||||||||
| Celanese Corp. | 8,943 | 1,019,502 | ||||||
| CF Industries Holdings, Inc. | 18,261 | 994,129 | ||||||
| Chemours Co. (The) | 22,828 | 900,336 | ||||||
| Eastman Chemical Co. | 5,067 | 485,013 | ||||||
| FMC Corp. | 5,870 | 511,747 | ||||||
| Huntsman Corp. | 17,050 | 464,272 | ||||||
| LyondellBasell Industries NV, Class A | 17,844 | 1,829,189 | ||||||
| NewMarket Corp. | 1,083 | 439,167 | ||||||
| The accompanying notes are an integral part of these financial statements. | (Continued) |
| AQR Funds | Annual Report | September 2018 | ||||||||||||||
96
Table of Contents
| Schedule of Investments | September 30, 2018 |
| AQR LARGE CAP MOMENTUM STYLE FUND |
| INVESTMENTS | SHARES | VALUE | ||||||
| Chemicals - 0.7% (continued) | ||||||||
| Praxair, Inc. | 5,137 | $ | 825,670 | |||||
| Sherwin-Williams Co. (The) | 1,659 | 755,193 | ||||||
| Westlake Chemical Corp. | 5,428 | 451,121 | ||||||
|
| |||||||
| 8,675,339 | ||||||||
|
| |||||||
| Commercial Services & Supplies - 0.9% | ||||||||
| Cintas Corp. | 23,846 | 4,716,977 | ||||||
| Copart, Inc. * | 38,096 | 1,963,087 | ||||||
| Republic Services, Inc. | 14,540 | 1,056,476 | ||||||
| Rollins, Inc. | 21,305 | 1,293,001 | ||||||
| Waste Management, Inc. | 21,419 | 1,935,421 | ||||||
|
| |||||||
| 10,964,962 | ||||||||
|
| |||||||
| Communications Equipment - 2.1% | ||||||||
| Arista Networks, Inc. * | 13,716 | 3,646,536 | ||||||
| Cisco Systems, Inc. | 319,550 | 15,546,108 | ||||||
| CommScope Holding Co., Inc. * | 17,711 | 544,790 | ||||||
| F5 Networks, Inc. * | 3,403 | 678,626 | ||||||
| Motorola Solutions, Inc. | 9,034 | 1,175,685 | ||||||
| Palo Alto Networks, Inc. * | 10,894 | 2,453,982 | ||||||
| Ubiquiti Networks, Inc. (b) | 7,376 | 729,191 | ||||||
|
| |||||||
| 24,774,918 | ||||||||
|
| |||||||
| Construction & Engineering - 0.1% | ||||||||
| Quanta Services, Inc. * | 15,443 | 515,487 | ||||||
|
| |||||||
| Construction Materials - 0.1% | ||||||||
| Eagle Materials, Inc. | 4,574 | 389,888 | ||||||
| Martin Marietta Materials, Inc. | 2,511 | 456,876 | ||||||
| Vulcan Materials Co. | 3,683 | 409,550 | ||||||
|
| |||||||
| 1,256,314 | ||||||||
|
| |||||||
| Consumer Finance - 0.6% | ||||||||
| Ally Financial, Inc. | 19,154 | 506,623 | ||||||
| American Express Co. | 18,471 | 1,966,977 | ||||||
| Credit Acceptance Corp. * | 3,817 | 1,672,113 | ||||||
| Navient Corp. | 24,987 | 336,825 | ||||||
| Santander Consumer USA Holdings, Inc. | 27,419 | 549,477 | ||||||
| SLM Corp. * | 77,304 | 861,940 | ||||||
| Synchrony Financial | 15,291 | 475,244 | ||||||
|
| |||||||
| 6,369,199 | ||||||||
|
| |||||||
| Containers & Packaging - 0.2% | ||||||||
| Avery Dennison Corp. | 10,046 | 1,088,484 | ||||||
| Berry Global Group, Inc. * | 8,130 | 393,411 | ||||||
| Packaging Corp. of America | 5,028 | 551,521 | ||||||
| Sealed Air Corp. | 10,067 | 404,190 | ||||||
| WestRock Co. | 6,631 | 354,361 | ||||||
|
| |||||||
| 2,791,967 | ||||||||
|
| |||||||
| Diversified Consumer Services - 0.3% | ||||||||
| Graham Holdings Co., Class B | 737 | 426,944 | ||||||
| Grand Canyon Education, Inc. * | 4,577 | 516,286 | ||||||
| Service Corp. International | 15,037 | 664,635 | ||||||
| ServiceMaster Global Holdings, Inc. * | 20,653 | 1,281,106 | ||||||
|
| |||||||
| 2,888,971 | ||||||||
|
| |||||||
| Diversified Financial Services - 0.1% | ||||||||
| Voya Financial, Inc. | 15,148 | 752,401 | ||||||
|
| |||||||
| INVESTMENTS | SHARES | VALUE | ||||||
| Diversified Telecommunication Services - 0.0% (a) | ||||||||
| Zayo Group Holdings, Inc. * | 13,596 | $ | 472,053 | |||||
|
| |||||||
| Electric Utilities - 0.4% | ||||||||
| Avangrid, Inc. | 9,819 | 470,625 | ||||||
| NextEra Energy, Inc. | 25,230 | 4,228,548 | ||||||
|
| |||||||
| 4,699,173 | ||||||||
|
| |||||||
| Electrical Equipment - 0.0% (a) | ||||||||
| Rockwell Automation, Inc. | 2,596 | 486,802 | ||||||
|
| |||||||
| Electronic Equipment, Instruments & Components - 1.0% | ||||||||
| Amphenol Corp., Class A | 16,337 | 1,536,005 | ||||||
| Arrow Electronics, Inc. * | 6,077 | 447,997 | ||||||
| CDW Corp. | 25,023 | 2,225,045 | ||||||
| Cognex Corp. | 25,382 | 1,416,823 | ||||||
| Coherent, Inc. * | 2,823 | 486,092 | ||||||
| Corning, Inc. | 14,950 | 527,735 | ||||||
| Dolby Laboratories, Inc., Class A | 9,601 | 671,782 | ||||||
| FLIR Systems, Inc. | 9,790 | 601,791 | ||||||
| IPG Photonics Corp. * | 7,588 | 1,184,259 | ||||||
| Keysight Technologies, Inc. * | 9,183 | 608,649 | ||||||
| Trimble, Inc. * | 15,515 | 674,282 | ||||||
| Zebra Technologies Corp., Class A * | 6,156 | 1,088,566 | ||||||
|
| |||||||
| 11,469,026 | ||||||||
|
| |||||||
| Energy Equipment & Services - 0.3% | ||||||||
| Helmerich & Payne, Inc. | 12,318 | 847,109 | ||||||
| National Oilwell Varco, Inc. | 14,703 | 633,405 | ||||||
| RPC, Inc. (b) | 61,872 | 957,779 | ||||||
| Transocean Ltd. *(b) | 59,813 | 834,391 | ||||||
|
| |||||||
| 3,272,684 | ||||||||
|
| |||||||
| Entertainment – 0.9% | ||||||||
| Activision Blizzard, Inc. | 27,699 | 2,304,280 | ||||||
| Electronic Arts, Inc. * | 25,554 | 3,079,002 | ||||||
| Live Nation Entertainment, Inc. * | 16,566 | 902,350 | ||||||
| Madison Square Garden Co. (The), Class A * | 2,525 | 796,183 | ||||||
| Take-Two Interactive Software, Inc. * | 25,467 | 3,514,191 | ||||||
|
| |||||||
| 10,596,006 | ||||||||
|
| |||||||
| Equity Real Estate Investment Trusts (REITs) - 1.0% | ||||||||
| Alexandria Real Estate Equities, Inc. | 3,486 | 438,504 | ||||||
| American Homes 4 Rent, Class A | 20,868 | 456,800 | ||||||
| American Tower Corp. | 3,374 | 490,242 | ||||||
| Apartment Investment & Management Co., Class A | 10,844 | 478,546 | ||||||
| Camden Property Trust | 4,628 | 433,042 | ||||||
| CoreSite Realty Corp. | 6,557 | 728,745 | ||||||
| CyrusOne, Inc. | 18,322 | 1,161,615 | ||||||
| Digital Realty Trust, Inc. | 5,040 | 566,899 | ||||||
| EPR Properties | 6,107 | 417,780 | ||||||
| Equity LifeStyle Properties, Inc. | 25,892 | 2,497,283 | ||||||
| Iron Mountain, Inc. | 14,569 | 502,922 | ||||||
| Lamar Advertising Co., Class A | 6,042 | 470,068 | ||||||
| Prologis, Inc. | 17,975 | 1,218,525 | ||||||
| SBA Communications Corp. * | 8,811 | 1,415,311 | ||||||
| Senior Housing Properties Trust | 21,759 | 382,088 | ||||||
| STORE Capital Corp. | 16,605 | 461,453 | ||||||
|
| |||||||
| 12,119,823 | ||||||||
|
| |||||||
| The accompanying notes are an integral part of these financial statements. | (Continued) |
| AQR Funds | Annual Report | September 2018 | ||||||||||||||
97
Table of Contents
| Schedule of Investments | September 30, 2018 |
| AQR LARGE CAP MOMENTUM STYLE FUND |
| INVESTMENTS | SHARES | VALUE | ||||||
| Food & Staples Retailing - 0.6% | ||||||||
| Costco Wholesale Corp. | 12,012 | $ | 2,821,379 | |||||
| Kroger Co. (The) | 20,568 | 598,734 | ||||||
| Sysco Corp. | 10,680 | 782,310 | ||||||
| Walmart, Inc. | 27,022 | 2,537,636 | ||||||
|
| |||||||
| 6,740,059 | ||||||||
|
| |||||||
| Food Products - 0.1% | ||||||||
| Lamb Weston Holdings, Inc. | 12,710 | 846,486 | ||||||
| Tyson Foods, Inc., Class A | 11,282 | 671,617 | ||||||
|
| |||||||
| 1,518,103 | ||||||||
|
| |||||||
| Health Care Equipment & Supplies - 3.7% | ||||||||
| Abbott Laboratories | 100,412 | 7,366,224 | ||||||
| ABIOMED, Inc. * | 9,985 | 4,490,754 | ||||||
| Align Technology, Inc. * | 13,897 | 5,436,784 | ||||||
| Baxter International, Inc. | 20,336 | 1,567,702 | ||||||
| Becton Dickinson and Co. | 2,351 | 613,611 | ||||||
| Boston Scientific Corp. * | 28,532 | 1,098,482 | ||||||
| Cooper Cos., Inc. (The) | 2,695 | 746,919 | ||||||
| Danaher Corp. | 3,948 | 428,990 | ||||||
| DexCom, Inc. * | 12,214 | 1,747,091 | ||||||
| Edwards Lifesciences Corp. * | 7,476 | 1,301,572 | ||||||
| Hologic, Inc. * | 11,378 | 466,271 | ||||||
| ICU Medical, Inc. * | 1,594 | 450,704 | ||||||
| IDEXX Laboratories, Inc. * | 7,993 | 1,995,532 | ||||||
| Insulet Corp. * | 8,795 | 931,830 | ||||||
| Intuitive Surgical, Inc. * | 11,921 | 6,842,654 | ||||||
| Penumbra, Inc. * | 6,859 | 1,026,792 | ||||||
| ResMed, Inc. | 10,915 | 1,258,936 | ||||||
| Stryker Corp. | 20,149 | 3,580,074 | ||||||
| Teleflex, Inc. | 6,906 | 1,837,618 | ||||||
|
| |||||||
| 43,188,540 | ||||||||
|
| |||||||
| Health Care Providers & Services - 3.7% | ||||||||
| Anthem, Inc. | 24,584 | 6,737,245 | ||||||
| Centene Corp. * | 19,136 | 2,770,510 | ||||||
| Chemed Corp. | 1,649 | 526,987 | ||||||
| Cigna Corp. | 6,863 | 1,429,220 | ||||||
| Encompass Health Corp. | 4,203 | 327,624 | ||||||
| HCA Healthcare, Inc. | 13,665 | 1,901,075 | ||||||
| Humana, Inc. | 13,816 | 4,676,992 | ||||||
| Laboratory Corp. of America Holdings * | 2,327 | 404,153 | ||||||
| Molina Healthcare, Inc. * | 8,506 | 1,264,842 | ||||||
| Quest Diagnostics, Inc. | 6,306 | 680,481 | ||||||
| UnitedHealth Group, Inc. | 76,757 | 20,420,432 | ||||||
| Universal Health Services, Inc., Class B | 3,522 | 450,253 | ||||||
| WellCare Health Plans, Inc. * | 6,090 | 1,951,784 | ||||||
|
| |||||||
| 43,541,598 | ||||||||
|
| |||||||
| Health Care Technology - 0.2% | ||||||||
| Veeva Systems, Inc., Class A * | 17,859 | 1,944,309 | ||||||
|
| |||||||
| Hotels, Restaurants & Leisure - 1.6% | ||||||||
| Aramark | 18,212 | 783,480 | ||||||
| Carnival Corp. | 8,991 | 573,356 | ||||||
| Darden Restaurants, Inc. | 9,289 | 1,032,844 | ||||||
| Domino’s Pizza, Inc. | 6,312 | 1,860,778 | ||||||
| Hilton Worldwide Holdings, Inc. | 21,662 | 1,749,856 | ||||||
| Hyatt Hotels Corp., Class A | 6,571 | 522,986 | ||||||
| International Game Technology plc | 26,574 | 524,836 | ||||||
| INVESTMENTS | SHARES | VALUE | ||||||
| Hotels, Restaurants & Leisure - 1.6% (continued) | ||||||||
| Las Vegas Sands Corp. | 28,726 | $ | 1,704,314 | |||||
| Marriott International, Inc., Class A | 30,951 | 4,086,460 | ||||||
| McDonald’s Corp. | 3,879 | 648,918 | ||||||
| Royal Caribbean Cruises Ltd. | 6,280 | 816,023 | ||||||
| Six Flags Entertainment Corp. | 13,268 | 926,372 | ||||||
| Vail Resorts, Inc. | 3,751 | 1,029,349 | ||||||
| Wyndham Hotels & Resorts, Inc. | 6,422 | 356,871 | ||||||
| Wynn Resorts Ltd. | 7,562 | 960,828 | ||||||
| Yum! Brands, Inc. | 12,855 | 1,168,648 | ||||||
|
| |||||||
| 18,745,919 | ||||||||
|
| |||||||
| Household Durables - 0.4% | ||||||||
| DR Horton, Inc. | 31,579 | 1,332,002 | ||||||
| Garmin Ltd. | 22,664 | 1,587,613 | ||||||
| NVR, Inc. * | 669 | 1,652,965 | ||||||
| PulteGroup, Inc. (b) | 22,751 | 563,543 | ||||||
|
| |||||||
| 5,136,123 | ||||||||
|
| |||||||
| Household Products - 0.1% | ||||||||
| Energizer Holdings, Inc. | 13,144 | 770,896 | ||||||
|
| |||||||
| Independent Power and Renewable Electricity Producers - 0.2% | ||||||||
| NRG Energy, Inc. | 56,267 | 2,104,386 | ||||||
| Vistra Energy Corp. * | 16,553 | 411,838 | ||||||
|
| |||||||
| 2,516,224 | ||||||||
|
| |||||||
| Industrial Conglomerates - 0.3% | ||||||||
| Honeywell International, Inc. | 10,553 | 1,756,019 | ||||||
| Roper Technologies, Inc. | 5,359 | 1,587,390 | ||||||
|
| |||||||
| 3,343,409 | ||||||||
|
| |||||||
| Insurance - 1.5% | ||||||||
| Allstate Corp. (The) | 7,369 | 727,320 | ||||||
| American Financial Group, Inc. | 11,412 | 1,266,390 | ||||||
| Aon plc | 8,518 | 1,309,898 | ||||||
| Arch Capital Group Ltd. * | 12,804 | 381,687 | ||||||
| Assurant, Inc. | 6,148 | 663,677 | ||||||
| Assured Guaranty Ltd. | 12,466 | 526,439 | ||||||
| Axis Capital Holdings Ltd. | 7,392 | 426,592 | ||||||
| Cincinnati Financial Corp. | 17,923 | 1,376,666 | ||||||
| Erie Indemnity Co., Class A | 6,993 | 891,817 | ||||||
| Fidelity National Financial, Inc. | 22,711 | 893,678 | ||||||
| Hanover Insurance Group, Inc. (The) | 11,713 | 1,445,033 | ||||||
| Markel Corp. * | 611 | 726,167 | ||||||
| Marsh & McLennan Cos., Inc. | 13,699 | 1,133,181 | ||||||
| Progressive Corp. (The) | 50,181 | 3,564,858 | ||||||
| RenaissanceRe Holdings Ltd. (b) | 3,643 | 486,632 | ||||||
| Torchmark Corp. | 8,659 | 750,649 | ||||||
| WR Berkley Corp. | 10,543 | 842,702 | ||||||
|
| |||||||
| 17,413,386 | ||||||||
|
| |||||||
| Interactive Media & Services - 2.8% | ||||||||
| Alphabet, Inc., Class A * | 12,402 | 14,970,206 | ||||||
| Facebook, Inc., Class A * | 45,117 | 7,419,942 | ||||||
| IAC/InterActiveCorp * | 13,407 | 2,905,565 | ||||||
| Match Group, Inc. *(b) | 61,954 | 3,587,756 | ||||||
| Twitter, Inc. * | 91,692 | 2,609,554 | ||||||
| Zillow Group, Inc., Class C *(b) | 25,352 | 1,121,826 | ||||||
|
| |||||||
| 32,614,849 | ||||||||
|
| |||||||
| The accompanying notes are an integral part of these financial statements. | (Continued) |
| AQR Funds | Annual Report | September 2018 | ||||||||||||||
98
Table of Contents
| Schedule of Investments | September 30, 2018 |
| AQR LARGE CAP MOMENTUM STYLE FUND |
| INVESTMENTS | SHARES | VALUE | ||||||
| Internet & Direct Marketing Retail - 8.2% | ||||||||
| Amazon.com, Inc. * | 37,951 | $ | 76,015,853 | |||||
| Expedia Group, Inc. | 3,949 | 515,266 | ||||||
| GrubHub, Inc. * | 21,151 | 2,931,952 | ||||||
| Netflix, Inc. * | 36,733 | 13,742,917 | ||||||
| Qurate Retail, Inc. * | 19,602 | 435,360 | ||||||
| Wayfair, Inc., Class A * | 13,819 | 2,040,652 | ||||||
|
| |||||||
| 95,682,000 | ||||||||
|
| |||||||
| IT Services - 8.5% | ||||||||
| Accenture plc, Class A | 19,107 | 3,252,011 | ||||||
| Akamai Technologies, Inc. * | 10,041 | 734,499 | ||||||
| Amdocs Ltd. | 12,968 | 855,629 | ||||||
| Automatic Data Processing, Inc. | 10,531 | 1,586,600 | ||||||
| Black Knight, Inc. * | 6,963 | 361,728 | ||||||
| Booz Allen Hamilton Holding Corp. | 14,749 | 731,993 | ||||||
| Broadridge Financial Solutions, Inc. | 16,600 | 2,190,370 | ||||||
| Cognizant Technology Solutions Corp., Class A | 24,538 | 1,893,107 | ||||||
| CoreLogic, Inc. * | 18,100 | 894,321 | ||||||
| DXC Technology Co. | 44,039 | 4,118,527 | ||||||
| EPAM Systems, Inc. * | 5,901 | 812,568 | ||||||
| Fidelity National Information Services, Inc. | 3,584 | 390,907 | ||||||
| Fiserv, Inc. * | 18,738 | 1,543,636 | ||||||
| FleetCor Technologies, Inc. * | 3,109 | 708,354 | ||||||
| Gartner, Inc. * | 4,604 | 729,734 | ||||||
| Genpact Ltd. | 37,076 | 1,134,896 | ||||||
| Global Payments, Inc. | 19,770 | 2,518,698 | ||||||
| GoDaddy, Inc., Class A * | 31,406 | 2,618,946 | ||||||
| Jack Henry & Associates, Inc. | 17,949 | 2,873,276 | ||||||
| Mastercard, Inc., Class A | 81,978 | 18,249,122 | ||||||
| Okta, Inc. * | 47,416 | 3,336,190 | ||||||
| PayPal Holdings, Inc. * | 103,315 | 9,075,190 | ||||||
| Sabre Corp. | 18,021 | 469,988 | ||||||
| Square, Inc., Class A * | 65,163 | 6,451,789 | ||||||
| Total System Services, Inc. | 22,204 | 2,192,423 | ||||||
| Twilio, Inc., Class A * | 34,306 | 2,959,922 | ||||||
| VeriSign, Inc. * | 13,036 | 2,087,324 | ||||||
| Visa, Inc., Class A (b) | 146,734 | 22,023,306 | ||||||
| WEX, Inc. * | 3,405 | 683,588 | ||||||
| Worldpay, Inc. * | 15,662 | 1,586,091 | ||||||
|
| |||||||
| 99,064,733 | ||||||||
|
| |||||||
| Leisure Products - 0.1% | ||||||||
| Hasbro, Inc. | 6,091 | 640,286 | ||||||
| Polaris Industries, Inc. | 4,304 | 434,489 | ||||||
|
| |||||||
| 1,074,775 | ||||||||
|
| |||||||
| Life Sciences Tools & Services - 1.5% | ||||||||
| Agilent Technologies, Inc. | 14,186 | 1,000,680 | ||||||
| Bio-Rad Laboratories, Inc., Class A * | 5,986 | 1,873,558 | ||||||
| Bruker Corp. | 24,778 | 828,824 | ||||||
| Charles River Laboratories International, Inc. * | 5,176 | 696,379 | ||||||
| Illumina, Inc. * | 12,565 | 4,612,109 | ||||||
| IQVIA Holdings, Inc. * | 4,935 | 640,267 | ||||||
| Mettler-Toledo International, Inc. * | 982 | 598,018 | ||||||
| PerkinElmer, Inc. | 9,553 | 929,220 | ||||||
| QIAGEN NV * | 14,637 | 554,450 | ||||||
| Thermo Fisher Scientific, Inc. | 20,503 | 5,004,372 | ||||||
| Waters Corp. * | 3,336 | 649,453 | ||||||
|
| |||||||
| 17,387,330 | ||||||||
|
| |||||||
| INVESTMENTS | SHARES | VALUE | ||||||
| Machinery - 1.4% | ||||||||
| Caterpillar, Inc. | 20,334 | $ | 3,100,732 | |||||
| Crane Co. | 5,907 | 580,953 | ||||||
| Deere & Co. | 17,129 | 2,575,003 | ||||||
| Fortive Corp. | 26,313 | 2,215,555 | ||||||
| Illinois Tool Works, Inc. | 5,904 | 833,172 | ||||||
| Ingersoll-Rand plc | 4,580 | 468,534 | ||||||
| Nordson Corp. | 6,333 | 879,654 | ||||||
| Oshkosh Corp. | 15,746 | 1,121,745 | ||||||
| Parker-Hannifin Corp. | 2,365 | 434,994 | ||||||
| Toro Co. (The) | 21,148 | 1,268,245 | ||||||
| Trinity Industries, Inc. | 19,588 | 717,704 | ||||||
| Xylem, Inc. | 20,472 | 1,635,099 | ||||||
|
| |||||||
| 15,831,390 | ||||||||
|
| |||||||
| Media - 0.1% | ||||||||
| Sirius XM Holdings, Inc. (b) | 237,228 | 1,499,281 | ||||||
|
| |||||||
| Metals & Mining - 0.4% | ||||||||
| Alcoa Corp.* | 25,322 | 1,023,009 | ||||||
| Freeport-McMoRan, Inc. | 38,076 | 530,018 | ||||||
| Reliance Steel & Aluminum Co. | 5,371 | 458,093 | ||||||
| Steel Dynamics, Inc. | 46,850 | 2,117,151 | ||||||
| United States Steel Corp. | 24,614 | 750,235 | ||||||
|
| |||||||
| 4,878,506 | ||||||||
|
| |||||||
| Multiline Retail - 0.8% | ||||||||
| Dollar General Corp. | 18,895 | 2,065,223 | ||||||
| Dollar Tree, Inc. * | 12,241 | 998,254 | ||||||
| Kohl’s Corp. | 20,060 | 1,495,473 | ||||||
| Macy’s, Inc. | 39,343 | 1,366,382 | ||||||
| Target Corp. | 40,950 | 3,612,200 | ||||||
|
| |||||||
| 9,537,532 | ||||||||
|
| |||||||
| Multi-Utilities - 0.2% | ||||||||
| Ameren Corp. | 7,363 | 465,489 | ||||||
| MDU Resources Group, Inc. | 15,343 | 394,162 | ||||||
| NiSource, Inc. | 26,619 | 663,345 | ||||||
| Public Service Enterprise Group, Inc. | 8,142 | 429,816 | ||||||
|
| |||||||
| 1,952,812 | ||||||||
|
| |||||||
| Oil, Gas & Consumable Fuels - 5.1% | ||||||||
| Anadarko Petroleum Corp. | 42,997 | 2,898,428 | ||||||
| Cheniere Energy, Inc. * | 16,257 | 1,129,699 | ||||||
| Chevron Corp. | 25,906 | 3,167,786 | ||||||
| CNX Resources Corp. * | 27,683 | 396,144 | ||||||
| Concho Resources, Inc. * | 10,561 | 1,613,193 | ||||||
| ConocoPhillips | 112,043 | 8,672,128 | ||||||
| Continental Resources, Inc. * | 41,103 | 2,806,513 | ||||||
| Devon Energy Corp. | 28,774 | 1,149,234 | ||||||
| Diamondback Energy, Inc. (b) | 17,632 | 2,383,670 | ||||||
| EOG Resources, Inc. | 39,581 | 5,049,348 | ||||||
| Hess Corp. | 19,752 | 1,413,848 | ||||||
| HollyFrontier Corp. | 38,955 | 2,722,954 | ||||||
| Marathon Oil Corp. | 96,883 | 2,255,436 | ||||||
| Marathon Petroleum Corp. | 44,342 | 3,546,030 | ||||||
| Noble Energy, Inc. | 15,700 | 489,683 | ||||||
| Occidental Petroleum Corp. | 53,611 | 4,405,216 | ||||||
| ONEOK, Inc. | 31,720 | 2,150,299 | ||||||
| PBF Energy, Inc., Class A | 24,392 | 1,217,405 | ||||||
| Phillips 66 | 31,012 | 3,495,673 | ||||||
| The accompanying notes are an integral part of these financial statements. | (Continued) |
| AQR Funds | Annual Report | September 2018 | ||||||||||||||
99
Table of Contents
| Schedule of Investments | September 30, 2018 |
| AQR LARGE CAP MOMENTUM STYLE FUND |
| INVESTMENTS | SHARES | VALUE | ||||||
| Oil, Gas & Consumable Fuels - 5.1% (continued) | ||||||||
| SM Energy Co. | 19,699 | $ | 621,109 | |||||
| Valero Energy Corp. | 44,240 | 5,032,300 | ||||||
| Whiting Petroleum Corp. * | 28,187 | 1,495,038 | ||||||
| WPX Energy, Inc. * | 82,986 | 1,669,678 | ||||||
|
| |||||||
| 59,780,812 | ||||||||
|
| |||||||
| Personal Products - 0.4% | ||||||||
| Estee Lauder Cos., Inc. (The), Class A | 26,946 | 3,915,793 | ||||||
| Nu Skin Enterprises, Inc., Class A | 8,923 | 735,433 | ||||||
|
| |||||||
| 4,651,226 | ||||||||
|
| |||||||
| Pharmaceuticals - 0.6% | ||||||||
| Eli Lilly & Co. | 3,218 | 345,324 | ||||||
| Nektar Therapeutics * | 37,769 | 2,302,398 | ||||||
| Zoetis, Inc. | 42,927 | 3,930,396 | ||||||
|
| |||||||
| 6,578,118 | ||||||||
|
| |||||||
| Professional Services - 0.4% | ||||||||
| CoStar Group, Inc. * | 3,684 | 1,550,374 | ||||||
| TransUnion | 24,147 | 1,776,736 | ||||||
| Verisk Analytics, Inc. * | 10,952 | 1,320,264 | ||||||
|
| |||||||
| 4,647,374 | ||||||||
|
| |||||||
| Real Estate Management & Development - 0.1% | ||||||||
| CBRE Group, Inc., Class A * | 11,886 | 524,173 | ||||||
|
| |||||||
| Road & Rail - 1.2% | ||||||||
| AMERCO | 2,826 | 1,007,893 | ||||||
| CSX Corp. | 35,630 | 2,638,401 | ||||||
| JB Hunt Transport Services, Inc. | 7,806 | 928,446 | ||||||
| Norfolk Southern Corp. | 13,364 | 2,412,202 | ||||||
| Old Dominion Freight Line, Inc. | 14,404 | 2,322,789 | ||||||
| Schneider National, Inc., Class B | 19,681 | 491,631 | ||||||
| Union Pacific Corp. | 25,579 | 4,165,029 | ||||||
|
| |||||||
| 13,966,391 | ||||||||
|
| |||||||
| Semiconductors & Semiconductor Equipment - 4.7% | ||||||||
| Advanced Micro Devices, Inc. *(b) | 67,785 | 2,093,879 | ||||||
| Analog Devices, Inc. | 3,743 | 346,078 | ||||||
| Applied Materials, Inc. | 14,788 | 571,556 | ||||||
| Cypress Semiconductor Corp. (b) | 19,917 | 288,597 | ||||||
| First Solar, Inc. * | 10,736 | 519,837 | ||||||
| Intel Corp. | 333,415 | 15,767,195 | ||||||
| KLA-Tencor Corp. | 3,110 | 316,318 | ||||||
| Lam Research Corp. | 6,659 | 1,010,170 | ||||||
| Marvell Technology Group Ltd. | 73,655 | 1,421,542 | ||||||
| Maxim Integrated Products, Inc. | 23,643 | 1,333,229 | ||||||
| Microchip Technology, Inc. (b) | 7,564 | 596,875 | ||||||
| Micron Technology, Inc. * | 107,599 | 4,866,703 | ||||||
| MKS Instruments, Inc. | 3,770 | 302,165 | ||||||
| Monolithic Power Systems, Inc. | 3,941 | 494,714 | ||||||
| NVIDIA Corp. | 52,189 | 14,666,153 | ||||||
| ON Semiconductor Corp. * | 82,670 | 1,523,608 | ||||||
| Qorvo, Inc. * | 6,903 | 530,772 | ||||||
| Teradyne, Inc. | 19,431 | 718,558 | ||||||
| Texas Instruments, Inc. | 65,385 | 7,015,157 | ||||||
| Universal Display Corp. | 4,424 | 521,590 | ||||||
| Xilinx, Inc. | 4,771 | 382,491 | ||||||
|
| |||||||
| 55,287,187 | ||||||||
|
| |||||||
| INVESTMENTS | SHARES | VALUE | ||||||
| Software - 12.2% | ||||||||
| 2U, Inc. * | 20,244 | $ | 1,522,146 | |||||
| Adobe Systems, Inc. * | 47,452 | 12,809,667 | ||||||
| ANSYS, Inc. * | 5,600 | 1,045,408 | ||||||
| Aspen Technology, Inc. * | 3,695 | 420,897 | ||||||
| Atlassian Corp. plc, Class A * | 32,680 | 3,141,855 | ||||||
| Autodesk, Inc. * | 14,877 | 2,322,448 | ||||||
| Cadence Design Systems, Inc. * | 36,394 | 1,649,376 | ||||||
| CDK Global, Inc. | 19,935 | 1,247,134 | ||||||
| Citrix Systems, Inc. * | 7,459 | 829,142 | ||||||
| Dell Technologies, Inc., Class V * | 10,736 | 1,042,680 | ||||||
| Fortinet, Inc. * | 22,333 | 2,060,666 | ||||||
| Guidewire Software, Inc. * | 5,955 | 601,515 | ||||||
| Intuit, Inc. | 20,180 | 4,588,932 | ||||||
| LogMeIn, Inc. | 4,906 | 437,125 | ||||||
| Microsoft Corp. | 576,188 | 65,898,622 | ||||||
| Nuance Communications, Inc. * | 37,159 | 643,594 | ||||||
| Nutanix, Inc., Class A * | 47,659 | 2,035,993 | ||||||
| Paycom Software, Inc. * | 11,261 | 1,750,072 | ||||||
| Proofpoint, Inc. * | 4,610 | 490,181 | ||||||
| PTC, Inc. * | 17,229 | 1,829,548 | ||||||
| RealPage, Inc. * | 9,828 | 647,665 | ||||||
| Red Hat, Inc. * | 21,139 | 2,880,823 | ||||||
| RingCentral, Inc., Class A * | 20,590 | 1,915,900 | ||||||
| salesforce.com, Inc. * | 59,330 | 9,435,250 | ||||||
| ServiceNow, Inc. * | 22,253 | 4,353,354 | ||||||
| Splunk, Inc. * | 20,971 | 2,535,604 | ||||||
| SS&C Technologies Holdings, Inc. | 16,904 | 960,654 | ||||||
| Synopsys, Inc. * | 12,830 | 1,265,166 | ||||||
| Tableau Software, Inc., Class A * | 14,524 | 1,622,912 | ||||||
| Ultimate Software Group, Inc. (The) * | 5,637 | 1,816,185 | ||||||
| VMware, Inc., Class A * | 29,673 | 4,630,768 | ||||||
| Workday, Inc., Class A * | 8,306 | 1,212,510 | ||||||
| Zendesk, Inc. * | 29,087 | 2,065,177 | ||||||
|
| |||||||
| 141,708,969 | ||||||||
|
| |||||||
| Specialty Retail - 3.5% | ||||||||
| Advance Auto Parts, Inc. | 3,098 | 521,486 | ||||||
| Best Buy Co., Inc. | 32,472 | 2,576,978 | ||||||
| Burlington Stores, Inc. * | 21,539 | 3,509,134 | ||||||
| Foot Locker, Inc. | 6,931 | 353,342 | ||||||
| Gap, Inc. (The) | 51,721 | 1,492,151 | ||||||
| Home Depot, Inc. (The) | 62,670 | 12,982,091 | ||||||
| Lowe’s Cos., Inc. | 44,722 | 5,134,980 | ||||||
| Michaels Cos., Inc. (The) * | 21,313 | 345,910 | ||||||
| O’Reilly Automotive, Inc. * | 5,139 | 1,784,877 | ||||||
| Ross Stores, Inc. | 39,799 | 3,944,081 | ||||||
| Tiffany & Co. | 6,188 | 798,066 | ||||||
| TJX Cos., Inc. (The) | 40,884 | 4,579,826 | ||||||
| Tractor Supply Co. | 6,709 | 609,714 | ||||||
| Ulta Beauty, Inc. * | 1,844 | 520,229 | ||||||
| Urban Outfitters, Inc. * | 43,703 | 1,787,453 | ||||||
| Williams-Sonoma, Inc. (b) | 5,100 | 335,172 | ||||||
|
| |||||||
| 41,275,490 | ||||||||
|
| |||||||
| Technology Hardware, Storage & Peripherals - 7.4% | ||||||||
| Apple, Inc. | 348,336 | 78,633,368 | ||||||
| Hewlett Packard Enterprise Co. | 30,948 | 504,762 | ||||||
| HP, Inc. | 100,523 | 2,590,478 | ||||||
| NCR Corp. * | 12,848 | 365,012 | ||||||
| The accompanying notes are an integral part of these financial statements. | (Continued) |
| AQR Funds | Annual Report | September 2018 | ||||||||||||||
100
Table of Contents
| Schedule of Investments | September 30, 2018 |
| AQR LARGE CAP MOMENTUM STYLE FUND |
| INVESTMENTS | SHARES | VALUE | ||||||
| Technology Hardware, Storage & Peripherals - 7.4% (continued) | ||||||||
| NetApp, Inc. | 31,972 | $ | 2,746,075 | |||||
| Pure Storage, Inc., Class A * | 39,834 | 1,033,692 | ||||||
|
| |||||||
| 85,873,387 | ||||||||
|
| |||||||
| Textiles, Apparel & Luxury Goods - 2.1% | ||||||||
| Carter’s, Inc. | 4,817 | 474,956 | ||||||
| Columbia Sportswear Co. | 4,328 | 402,807 | ||||||
| Lululemon Athletica, Inc. * | 25,851 | 4,200,529 | ||||||
| Michael Kors Holdings Ltd. * | 10,597 | 726,530 | ||||||
| NIKE, Inc., Class B | 113,314 | 9,599,962 | ||||||
| PVH Corp. | 12,443 | 1,796,769 | ||||||
| Ralph Lauren Corp. | 14,148 | 1,946,058 | ||||||
| Skechers U.S.A., Inc., Class A * | 37,364 | 1,043,577 | ||||||
| Tapestry, Inc. | 17,800 | 894,806 | ||||||
| VF Corp. | 39,671 | 3,707,255 | ||||||
|
| |||||||
| 24,793,249 | ||||||||
|
| |||||||
| Thrifts & Mortgage Finance - 0.1% | ||||||||
| TFS Financial Corp. | 41,075 | 616,536 | ||||||
|
| |||||||
| Trading Companies & Distributors - 0.4% | ||||||||
| MSC Industrial Direct Co., Inc., Class A | 4,795 | 422,488 | ||||||
| United Rentals, Inc. * | 10,441 | 1,708,148 | ||||||
| Watsco, Inc. | 3,619 | 644,544 | ||||||
| WESCO International, Inc. * | 8,625 | 530,006 | ||||||
| WW Grainger, Inc. | 3,457 | 1,235,566 | ||||||
|
| |||||||
| 4,540,752 | ||||||||
|
| |||||||
| Water Utilities - 0.2% | ||||||||
| American Water Works Co., Inc. | 12,675 | 1,115,020 | ||||||
| Aqua America, Inc. | 15,473 | 570,953 | ||||||
|
| |||||||
| 1,685,973 | ||||||||
|
| |||||||
TOTAL COMMON STOCKS |
| 1,139,990,311 | ||||||
|
| |||||||
| SHORT-TERM INVESTMENTS - 2.5% | ||||||||
| Investment Companies - 2.5% | ||||||||
| Limited Purpose Cash Investment Fund, 2.06% (c) | ||||||||
(Cost $29,732,533) | 29,739,651 | 29,736,678 | ||||||
|
| |||||||
| SECURITIES LENDING COLLATERAL - 1.3% | ||||||||
| Investment Companies - 1.3% | ||||||||
| Investments in a Pooled Account through Securities Lending Program with Citibank NA | ||||||||
| BlackRock Liquidity Funds T-Fund Portfolio, Institutional Shares | ||||||||
| 1.97% (c)(d) | 1,800,051 | 1,800,051 | ||||||
| Limited Purpose Cash Investment Fund 2.06% (c)(d) | 12,916,448 | 12,915,157 | ||||||
|
| |||||||
TOTAL SECURITIES LENDING COLLATERAL | 14,715,208 | |||||||
|
| |||||||
TOTAL INVESTMENTS IN SECURITIES |
| 1,184,442,197 | ||||||
|
| |||||||
| LIABILITIES IN EXCESS OF OTHER ASSETS - (1.6)% (e) | (18,632,543) | |||||||
|
| |||||||
NET ASSETS - 100.0% |
| $ | 1,165,809,654 | |||||
|
| |||||||
| SECTOR | VALUE | % OF NET ASSETS | ||||||
| Communication Services | $ | 45,182,189 | 3.9 | % | ||||
| Consumer Discretionary | 202,449,468 | 17.4 | ||||||
| Consumer Staples | 17,789,770 | 1.5 | ||||||
| Energy | 63,053,496 | 5.4 | ||||||
| Financials | 114,115,996 | 9.8 | ||||||
| Health Care | 138,433,011 | 11.9 | ||||||
| Industrials | 99,687,856 | 8.5 | ||||||
| Information Technology | 418,178,221 | 35.9 | ||||||
| Materials | 17,602,125 | 1.5 | ||||||
| Real Estate | 12,643,996 | 1.1 | ||||||
| Utilities | 10,854,183 | 0.9 | ||||||
| Short-Term Investments | 29,736,678 | 2.5 | ||||||
| Securities Lending Collateral | 14,715,208 | 1.3 | ||||||
|
|
|
| |||||
Total Investments In Securities At Value | 1,184,442,197 | 101.6 | ||||||
| Liabilities in Excess of Other Assets (e) | (18,632,543 | ) | (1.6 | ) | ||||
|
|
|
| |||||
Net Assets | $ | 1,165,809,654 | 100.0 | % | ||||
|
|
|
| |||||
All securities are United States companies, unless noted otherwise in parentheses.
| * | Non-income producing security. |
| (a) | Represents less than 0.05% of net assets. |
| (b) | The security or a portion of this security is on loan at September 30, 2018. The total value of securities on loan at September 30, 2018 was $31,122,264. |
| (c) | Represents 7-day effective yield as of September 30, 2018. |
| (d) | Represents security, or portion thereof, purchased with the cash collateral received for securities on loan; additional non-cash collateral of $17,129,783 was received (See Note 3). |
| (e) | Includes appreciation/(depreciation) on futures contracts. |
All securities are Level 1 with respect to ASC 820 (See Note 4).
| The accompanying notes are an integral part of these financial statements. | (Continued) |
| AQR Funds | Annual Report | September 2018 | ||||||||||||||
101
Table of Contents
| Schedule of Investments | September 30, 2018 |
| AQR LARGE CAP MOMENTUM STYLE FUND |
Futures contracts outstanding as of September 30, 2018:
Exchange Traded
| DESCRIPTION | NUMBER OF CONTRACTS | EXPIRATION DATE | TRADING CURRENCY | NOTIONAL AMOUNT | VALUE AND UNREALIZED APPRECIATION (DEPRECIATION) | |||||||||||
| Long Contracts | ||||||||||||||||
| S&P 500 E-Mini Index | 145 | 12/2018 | USD | $21,162,750 | $99,080 | |||||||||||
|
| |||||||||||||||
| $99,080 | ||||||||||||||||
|
| |||||||||||||||
USD - United States Dollar
Collateral pledged to, or (received from), each counterparty at September 30, 2018 was as follows:
| COUNTERPARTY | OVER THE COUNTER | EXCHANGE TRADED | TOTAL | |||||||||
| BARC | ||||||||||||
| Cash | $— | $851,445 | $851,445 | |||||||||
| ||||||||||||
| The accompanying notes are an integral part of these financial statements. |
| AQR Funds | Annual Report | September 2018 | ||||||||||||||
102
Table of Contents
| Schedule of Investments | September 30, 2018 |
| AQR SMALL CAP MOMENTUM STYLE FUND |
| INVESTMENTS | SHARES | VALUE | ||||||
| COMMON STOCKS - 99.1% | ||||||||
| Aerospace & Defense - 1.2% | ||||||||
| AAR Corp. | 6,382 | $ | 305,634 | |||||
| Aerojet Rocketdyne Holdings, Inc. * | 7,651 | 260,057 | ||||||
| Aerovironment, Inc. * | 11,410 | 1,279,860 | ||||||
| Axon Enterprise, Inc. * | 21,197 | 1,450,511 | ||||||
| Cubic Corp., Class R | 4,976 | 363,497 | ||||||
| Ducommun, Inc. * | 7,860 | 321,002 | ||||||
| Moog, Inc., Class A | 2,268 | 194,980 | ||||||
| National Presto Industries, Inc. | 1,715 | 222,350 | ||||||
| Vectrus, Inc. * | 4,424 | 137,984 | ||||||
|
| |||||||
| 4,535,875 | ||||||||
|
| |||||||
| Air Freight & Logistics - 0.3% | ||||||||
| Air Transport Services Group, Inc. * | 10,047 | 215,709 | ||||||
| Atlas Air Worldwide Holdings, Inc. * | 6,647 | 423,746 | ||||||
| Echo Global Logistics, Inc. * | 14,107 | 436,612 | ||||||
|
| |||||||
| 1,076,067 | ||||||||
|
| |||||||
| Airlines - 0.3% | ||||||||
| SkyWest, Inc. | 17,935 | 1,056,371 | ||||||
|
| |||||||
| Auto Components - 0.4% | ||||||||
| Cooper-Standard Holdings, Inc. * | 1,609 | 193,048 | ||||||
| Fox Factory Holding Corp. * | 7,195 | 504,010 | ||||||
| Modine Manufacturing Co. * | 17,016 | 253,538 | ||||||
| Stoneridge, Inc. * | 13,854 | 411,741 | ||||||
| Tower International, Inc. | 5,389 | 163,017 | ||||||
|
| |||||||
| 1,525,354 | ||||||||
|
| |||||||
| Automobiles - 0.0% (a) | ||||||||
| Winnebago Industries, Inc. | 4,017 | 133,164 | ||||||
|
| |||||||
| Banks - 2.1% | ||||||||
| 1st Source Corp. | 3,559 | 187,274 | ||||||
| BancFirst Corp. | 8,043 | 482,178 | ||||||
| Bancorp, Inc. (The) * | 13,272 | 127,278 | ||||||
| Boston Private Financial Holdings, Inc. | 11,604 | 158,395 | ||||||
| Bryn Mawr Bank Corp. | 4,179 | 195,995 | ||||||
| Cadence Bancorp | 9,698 | 253,312 | ||||||
| Camden National Corp. | 3,937 | 171,023 | ||||||
| Carolina Financial Corp. | 4,301 | 162,234 | ||||||
| CenterState Bank Corp. | 3,654 | 102,495 | ||||||
| Central Pacific Financial Corp. | 5,772 | 152,554 | ||||||
| ConnectOne Bancorp, Inc. | 6,347 | 150,741 | ||||||
| Enterprise Financial Services Corp. | 2,473 | 131,193 | ||||||
| Fidelity Southern Corp. | 7,992 | 198,042 | �� | |||||
| First Bancorp/NC | 5,202 | 210,733 | ||||||
| First Bancorp/PR * | 37,876 | 344,672 | ||||||
| First Commonwealth Financial Corp. | 9,574 | 154,524 | ||||||
| First Financial Bankshares, Inc. | 5,160 | 304,956 | ||||||
| First Merchants Corp. | 3,901 | 175,506 | ||||||
| German American Bancorp, Inc. | 3,585 | 126,479 | ||||||
| Great Southern Bancorp, Inc. | 3,025 | 167,434 | ||||||
| Independent Bank Corp./MA | 1,564 | 129,186 | ||||||
| Independent Bank Corp./MI | 10,733 | 253,835 | ||||||
| Independent Bank Group, Inc. | 1,625 | 107,737 | ||||||
| Lakeland Bancorp, Inc. | 12,306 | 222,123 | ||||||
| Lakeland Financial Corp. | 4,960 | 230,541 | ||||||
| Live Oak Bancshares, Inc. | 4,888 | 130,998 | ||||||
| INVESTMENTS | SHARES | VALUE | ||||||
| Banks - 2.1% (continued) | ||||||||
| OFG Bancorp | 21,091 | $ | 340,620 | |||||
| Opus Bank | 4,849 | 132,863 | ||||||
| Preferred Bank | 2,336 | 136,656 | ||||||
| QCR Holdings, Inc. | 4,236 | 173,041 | ||||||
| Republic First Bancorp, Inc. *(b) | 28,763 | 205,655 | ||||||
| ServisFirst Bancshares, Inc. | 13,000 | 508,950 | ||||||
| Southside Bancshares, Inc. | 4,216 | 146,717 | ||||||
| Stock Yards Bancorp, Inc. | 4,504 | 163,495 | ||||||
| Tompkins Financial Corp. | 1,707 | 138,591 | ||||||
| Towne Bank | 8,720 | 269,012 | ||||||
| TriState Capital Holdings, Inc. * | 7,060 | 194,856 | ||||||
| Triumph Bancorp, Inc. * | 9,529 | 364,008 | ||||||
| Washington Trust Bancorp, Inc. | 2,583 | 142,840 | ||||||
|
| |||||||
| 7,948,742 | ||||||||
|
| |||||||
| Beverages - 0.4% | ||||||||
| Boston Beer Co., Inc. (The), Class A * | 2,113 | 607,488 | ||||||
| Castle Brands, Inc. * | 33,003 | 35,313 | ||||||
| Craft Brew Alliance, Inc. * | 13,506 | 220,823 | ||||||
| MGP Ingredients, Inc. (b) | 7,286 | 575,448 | ||||||
| National Beverage Corp. *(b) | 1,135 | 132,364 | ||||||
|
| |||||||
| 1,571,436 | ||||||||
|
| |||||||
| Biotechnology - 11.9% | ||||||||
| Abeona Therapeutics, Inc. * | 24,350 | 311,680 | ||||||
| Acceleron Pharma, Inc. * | 6,516 | 372,911 | ||||||
| Acorda Therapeutics, Inc. * | 10,978 | 215,718 | ||||||
| Adamas Pharmaceuticals, Inc. *(b) | 14,009 | 280,460 | ||||||
| Adverum Biotechnologies, Inc. * | 31,216 | 188,857 | ||||||
| Aeglea BioTherapeutics, Inc. * | 24,559 | 235,030 | ||||||
| Aimmune Therapeutics, Inc. * | 14,223 | 388,003 | ||||||
| Alder Biopharmaceuticals, Inc. * | 19,119 | 318,331 | ||||||
| Amicus Therapeutics, Inc. * | 34,225 | 413,780 | ||||||
| AnaptysBio, Inc. * | 10,729 | 1,070,432 | ||||||
| Arbutus Biopharma Corp. (Canada) * | 39,727 | 375,420 | ||||||
| Arena Pharmaceuticals, Inc. * | 19,871 | 914,463 | ||||||
| ArQule, Inc. * | 99,194 | 561,438 | ||||||
| Array BioPharma, Inc. * | 81,902 | 1,244,910 | ||||||
| Arrowhead Pharmaceuticals, Inc. *(b) | 50,786 | 973,568 | ||||||
| Atara Biotherapeutics, Inc. *(b) | 18,386 | 760,261 | ||||||
| Athersys, Inc. *(b) | 94,458 | 198,362 | ||||||
| Audentes Therapeutics, Inc. * | 17,065 | 675,603 | ||||||
| AVEO Pharmaceuticals, Inc. *(b) | 54,175 | 179,319 | ||||||
| Avid Bioservices, Inc. *(b) | 25,915 | 177,777 | ||||||
| Biohaven Pharmaceutical Holding Co. Ltd. * | 5,216 | 195,861 | ||||||
| Blueprint Medicines Corp. * | 13,253 | 1,034,529 | ||||||
| CareDx, Inc. * | 37,654 | 1,086,318 | ||||||
| CASI Pharmaceuticals, Inc. * | 76,154 | 355,639 | ||||||
| Catalyst Biosciences, Inc. * | 19,224 | 207,235 | ||||||
| Catalyst Pharmaceuticals, Inc. * | 58,126 | 219,716 | ||||||
| ChemoCentryx, Inc. * | 18,847 | 238,226 | ||||||
| Concert Pharmaceuticals, Inc. * | 11,763 | 174,563 | ||||||
| CTI BioPharma Corp. * | 7,700 | 16,632 | ||||||
| CytomX Therapeutics, Inc. * | 18,950 | 350,575 | ||||||
| Dicerna Pharmaceuticals, Inc. * | 36,665 | 559,508 | ||||||
| Dynavax Technologies Corp. * | 20,024 | 248,298 | ||||||
| Editas Medicine, Inc. * | 16,973 | 540,081 | ||||||
| Emergent BioSolutions, Inc. * | 16,732 | 1,101,468 | ||||||
| The accompanying notes are an integral part of these financial statements. | (Continued) |
| AQR Funds | Annual Report | September 2018 | ||||||||||||||
103
Table of Contents
| Schedule of Investments | September 30, 2018 |
| AQR SMALL CAP MOMENTUM STYLE FUND |
| INVESTMENTS | SHARES | VALUE | ||||||
| Biotechnology - 11.9% (continued) | ||||||||
| Enanta Pharmaceuticals, Inc. * | 7,817 | $ | 668,041 | |||||
| Fate Therapeutics, Inc. * | 40,772 | 664,176 | ||||||
| Fennec Pharmaceuticals, Inc. (Canada) * | 18,214 | 149,355 | ||||||
| FibroGen, Inc. * | 25,771 | 1,565,588 | ||||||
| G1 Therapeutics, Inc. * | 16,307 | 852,693 | ||||||
| Genomic Health, Inc. * | 6,269 | 440,209 | ||||||
| Geron Corp. *(b) | 86,930 | 152,997 | ||||||
| Global Blood Therapeutics, Inc. *(b) | 17,263 | 655,994 | ||||||
| GlycoMimetics, Inc. * | 7,660 | 110,304 | ||||||
| GTx, Inc. *(b) | 19,419 | 30,488 | ||||||
| Halozyme Therapeutics, Inc. * | 44,209 | 803,278 | ||||||
| ImmunoGen, Inc. * | 60,638 | 574,242 | ||||||
| Immunomedics, Inc. *(b) | 67,573 | 1,407,546 | ||||||
| Insmed, Inc. * | 27,122 | 548,407 | ||||||
| Intellia Therapeutics, Inc. * | 9,420 | 269,600 | ||||||
| Iovance Biotherapeutics, Inc. * | 40,010 | 450,112 | ||||||
| Karyopharm Therapeutics, Inc. * | 24,946 | �� | 424,830 | |||||
| Kindred Biosciences, Inc. * | 10,260 | 143,127 | ||||||
| Kura Oncology, Inc. * | 16,561 | 289,817 | ||||||
| Ligand Pharmaceuticals, Inc. * | 7,901 | 2,168,745 | ||||||
| Loxo Oncology, Inc. * | 10,036 | 1,714,450 | ||||||
| Madrigal Pharmaceuticals, Inc. *(b) | 5,706 | 1,221,826 | ||||||
| Mirati Therapeutics, Inc. * | 17,874 | 841,865 | ||||||
| Momenta Pharmaceuticals, Inc. * | 14,935 | 392,791 | ||||||
| Myriad Genetics, Inc. * | 28,114 | 1,293,244 | ||||||
| Natera, Inc. * | 12,918 | 309,257 | ||||||
| Novavax, Inc. *(b) | 103,766 | 195,080 | ||||||
| Ohr Pharmaceutical, Inc. * | 7,600 | 1,406 | ||||||
| PDL BioPharma, Inc. * | 68,788 | 180,912 | ||||||
| Pieris Pharmaceuticals, Inc. * | 27,593 | 154,521 | ||||||
| PolarityTE, Inc. *(b) | 5,690 | 108,679 | ||||||
| PTC Therapeutics, Inc. * | 20,729 | 974,263 | ||||||
| REGENXBIO, Inc. * | 14,844 | 1,120,722 | ||||||
| Retrophin, Inc. * | 8,762 | 251,732 | ||||||
| Rigel Pharmaceuticals, Inc. * | 61,779 | 198,311 | ||||||
| Sangamo Therapeutics, Inc. *(b) | 34,398 | 583,046 | ||||||
| Savara, Inc. * | 14,983 | 167,210 | ||||||
| Sorrento Therapeutics, Inc. *(b) | 73,542 | 323,585 | ||||||
| Spark Therapeutics, Inc. *(b) | 3,405 | 185,743 | ||||||
| Spectrum Pharmaceuticals, Inc. * | 44,052 | 740,074 | ||||||
| Stemline Therapeutics, Inc. * | 12,296 | 204,114 | ||||||
| T2 Biosystems, Inc. * | 35,903 | 267,477 | ||||||
| TG Therapeutics, Inc. * | 13,534 | 75,790 | ||||||
| Ultragenyx Pharmaceutical, Inc. * | 6,528 | 498,348 | ||||||
| Verastem, Inc. *(b) | 57,442 | 416,455 | ||||||
| Vericel Corp. * | 32,614 | 461,488 | ||||||
| Viking Therapeutics, Inc. *(b) | 48,819 | 850,427 | ||||||
| Vital Therapies, Inc. * | 38,569 | 10,622 | ||||||
| Voyager Therapeutics, Inc. * | 16,301 | 308,415 | ||||||
| Xencor, Inc. * | 20,925 | 815,447 | ||||||
| XOMA Corp. *(b) | 10,539 | 185,170 | ||||||
| Zafgen, Inc. * | 35,435 | 414,235 | ||||||
|
| |||||||
| 44,021,226 | ||||||||
|
| |||||||
| Building Products - 1.2% | ||||||||
| AAON, Inc. | 6,791 | 256,700 | ||||||
| Advanced Drainage Systems, Inc. | 8,996 | 277,976 | ||||||
| Builders FirstSource, Inc. * | 25,937 | 380,755 | ||||||
| Gibraltar Industries, Inc. * | 3,457 | 157,639 | ||||||
| INVESTMENTS | SHARES | VALUE | ||||||
| Building Products - 1.2% (continued) | ||||||||
| Griffon Corp. | 7,115 | $ | 114,907 | |||||
| Insteel Industries, Inc. | 5,358 | 192,245 | ||||||
| Patrick Industries, Inc. * | 5,549 | 328,501 | ||||||
| PGT Innovations, Inc. * | 20,710 | 447,336 | ||||||
| Simpson Manufacturing Co., Inc. | 10,319 | 747,715 | ||||||
| Trex Co., Inc. * | 22,006 | 1,694,022 | ||||||
|
| |||||||
| 4,597,796 | ||||||||
|
| |||||||
| Capital Markets - 1.9% | ||||||||
| Artisan Partners Asset Management, Inc., Class A | 11,448 | 370,915 | ||||||
| B. Riley Financial, Inc. | 12,270 | 277,916 | ||||||
| Blucora, Inc. * | 22,917 | 922,409 | ||||||
| Diamond Hill Investment Group, Inc. | 1,290 | 213,353 | ||||||
| GAIN Capital Holdings, Inc. (b) | 24,292 | 157,898 | ||||||
| Greenhill & Co., Inc. | 5,697 | 150,116 | ||||||
| Hamilton Lane, Inc., Class A | 24,644 | 1,091,236 | ||||||
| Houlihan Lokey, Inc. | 21,351 | 959,301 | ||||||
| Moelis & Co., Class A | 22,631 | 1,240,179 | ||||||
| Piper Jaffray Cos. | 3,001 | 229,126 | ||||||
| PJT Partners, Inc., Class A | 14,422 | 754,992 | ||||||
| Stifel Financial Corp. | 13,609 | 697,597 | ||||||
|
| |||||||
| 7,065,038 | ||||||||
|
| |||||||
| Chemicals - 1.3% | ||||||||
| AdvanSix, Inc. * | 4,373 | 148,463 | ||||||
| American Vanguard Corp. | 9,893 | 178,074 | ||||||
| Chase Corp. | 1,439 | 172,896 | ||||||
| Ferro Corp. * | 15,471 | 359,237 | ||||||
| GCP Applied Technologies, Inc. * | 5,503 | 146,105 | ||||||
| Ingevity Corp. * | 14,708 | 1,498,451 | ||||||
| Innophos Holdings, Inc. | 3,701 | 164,324 | ||||||
| Innospec, Inc. | 2,779 | 213,288 | ||||||
| Intrepid Potash, Inc. * | 95,924 | 344,367 | ||||||
| Koppers Holdings, Inc. * | 4,164 | 129,709 | ||||||
| Kraton Corp. * | 6,401 | 301,807 | ||||||
| Kronos Worldwide, Inc. | 8,962 | 145,632 | ||||||
| PolyOne Corp. | 7,316 | 319,856 | ||||||
| Quaker Chemical Corp. | 1,532 | 309,786 | ||||||
| Rayonier Advanced Materials, Inc. | 9,952 | 183,415 | ||||||
| Valhi, Inc. | 47,889 | 109,187 | ||||||
|
| |||||||
| 4,724,597 | ||||||||
|
| |||||||
| Commercial Services & Supplies - 1.8% | ||||||||
| Brady Corp., Class A | 8,072 | 353,150 | ||||||
| Brink’s Co. (The) | 1,546 | 107,833 | ||||||
| Casella Waste Systems, Inc., Class A * | 28,374 | 881,296 | ||||||
| Cimpress NV (Netherlands) * | 10,238 | 1,398,613 | ||||||
| Ennis, Inc. | 10,681 | 218,426 | ||||||
| Interface, Inc. | 14,239 | 332,481 | ||||||
| Kimball International, Inc., Class B | 9,927 | 166,277 | ||||||
| McGrath RentCorp | 8,832 | 481,079 | ||||||
| Mobile Mini, Inc. | 11,662 | 511,379 | ||||||
| MSA Safety, Inc. | 5,569 | 592,764 | ||||||
| Multi-Color Corp. | 2,315 | 144,109 | ||||||
| Quad/Graphics, Inc. | 6,078 | 126,666 | ||||||
| SP Plus Corp. * | 4,630 | 168,995 | ||||||
| Tetra Tech, Inc. | 3,423 | 233,791 | ||||||
| UniFirst Corp. | 2,067 | 358,935 | ||||||
| The accompanying notes are an integral part of these financial statements. | (Continued) |
| AQR Funds | Annual Report | September 2018 | ||||||||||||||
104
Table of Contents
| Schedule of Investments | September 30, 2018 |
| AQR SMALL CAP MOMENTUM STYLE FUND |
| INVESTMENTS | SHARES | VALUE | ||||||
| Commercial Services & Supplies - 1.8% (continued) | ||||||||
| US Ecology, Inc. | 3,206 | $ | 236,443 | |||||
| Viad Corp. | 8,505 | 503,921 | ||||||
|
| |||||||
| 6,816,158 | ||||||||
|
| |||||||
| Communications Equipment - 0.5% | ||||||||
| CalAmp Corp. * | 8,123 | 194,627 | ||||||
| Comtech Telecommunications Corp. | 12,001 | 435,276 | ||||||
| Harmonic, Inc. *(b) | 37,222 | 204,721 | ||||||
| NETGEAR, Inc. * | 4,283 | 269,187 | ||||||
| Plantronics, Inc. | 10,679 | 643,944 | ||||||
|
| |||||||
| 1,747,755 | ||||||||
|
| |||||||
| Construction & Engineering - 0.7% | ||||||||
| Aegion Corp. * | 6,788 | 172,279 | ||||||
| Ameresco, Inc., Class A * | 12,117 | 165,397 | ||||||
| Comfort Systems USA, Inc. | 8,170 | 460,788 | ||||||
| EMCOR Group, Inc. | 5,818 | 436,990 | ||||||
| Granite Construction, Inc. | 3,842 | 175,579 | ||||||
| HC2 Holdings, Inc. * | 27,896 | 170,724 | ||||||
| MYR Group, Inc. * | 3,964 | 129,385 | ||||||
| NV5 Global, Inc. * | 6,530 | 566,151 | ||||||
| Primoris Services Corp. | 5,764 | 143,063 | ||||||
| Sterling Construction Co., Inc. * | 16,276 | 233,072 | ||||||
|
| |||||||
| 2,653,428 | ||||||||
|
| |||||||
| Consumer Finance - 1.3% | ||||||||
| Encore Capital Group, Inc. *(b) | 4,940 | 177,099 | ||||||
| Enova International, Inc. * | 16,676 | 480,269 | ||||||
| EZCORP, Inc., Class A * | 23,761 | 254,243 | ||||||
| FirstCash, Inc. | 12,909 | 1,058,538 | ||||||
| Green Dot Corp., Class A * | 19,403 | 1,723,374 | ||||||
| Nelnet, Inc., Class A | 5,692 | 325,412 | ||||||
| Regional Management Corp. * | 7,164 | 206,538 | ||||||
| World Acceptance Corp. * | 3,717 | 425,076 | ||||||
|
| |||||||
| 4,650,549 | ||||||||
|
| |||||||
| Containers & Packaging - 0.0% (a) | ||||||||
| Greif, Inc., Class A | 3,271 | 175,522 | ||||||
|
| |||||||
| Diversified Consumer Services - 1.6% | ||||||||
| Adtalem Global Education, Inc. * | 20,180 | 972,676 | ||||||
| American Public Education, Inc. * | 8,656 | 286,081 | ||||||
| Cambium Learning Group, Inc. * | 25,112 | 297,326 | ||||||
| Career Education Corp. * | 35,599 | 531,493 | ||||||
| Carriage Services, Inc. | 7,513 | 161,905 | ||||||
| Chegg, Inc. * | 46,875 | 1,332,656 | ||||||
| K12, Inc. * | 10,436 | 184,717 | ||||||
| Regis Corp. * | 12,677 | 258,991 | ||||||
| Sotheby’s * | 3,132 | 154,063 | ||||||
| Strategic Education, Inc. | 2,525 | 346,001 | ||||||
| Weight Watchers International, Inc. * | 19,858 | 1,429,578 | ||||||
|
| |||||||
| 5,955,487 | ||||||||
|
| |||||||
| Diversified Financial Services - 0.1% | ||||||||
| Cannae Holdings, Inc. * | 16,228 | 339,977 | ||||||
| On Deck Capital, Inc. * | 26,444 | 200,181 | ||||||
|
| |||||||
| 540,158 | ||||||||
|
| |||||||
| Diversified Telecommunication Services - 1.1% | ||||||||
| Cogent Communications Holdings, Inc. | 2,636 | 147,089 | ||||||
| INVESTMENTS | SHARES | VALUE | ||||||
| Diversified Telecommunication Services - 1.1% (continued) | ||||||||
| Intelsat SA * | 60,812 | $ | 1,824,360 | |||||
| Iridium Communications, Inc. * | 27,577 | 620,482 | ||||||
| Ooma, Inc. * | 8,095 | 134,377 | ||||||
| ORBCOMM, Inc. * | 11,895 | 129,180 | ||||||
| Vonage Holdings Corp. * | 88,996 | 1,260,183 | ||||||
|
| |||||||
| 4,115,671 | ||||||||
|
| |||||||
| Electric Utilities - 0.1% | ||||||||
| Otter Tail Corp. | 3,477 | 166,548 | ||||||
| Spark Energy, Inc., Class A (b) | 15,794 | 130,301 | ||||||
|
| |||||||
| 296,849 | ||||||||
|
| |||||||
| Electrical Equipment - 0.9% | ||||||||
| Allied Motion Technologies, Inc. | 5,034 | 274,000 | ||||||
| Enphase Energy, Inc. *(b) | 83,262 | 403,821 | ||||||
| Generac Holdings, Inc. * | 13,471 | 759,899 | ||||||
| Plug Power, Inc. *(b) | 80,747 | 155,034 | ||||||
| Sunrun, Inc. *(b) | 48,622 | 604,858 | ||||||
| TPI Composites, Inc. * | 10,905 | 311,338 | ||||||
| Vicor Corp. * | 18,226 | 838,396 | ||||||
| Vivint Solar, Inc. *(b) | 30,632 | 159,286 | ||||||
|
| |||||||
| 3,506,632 | ||||||||
|
| |||||||
| Electronic Equipment, Instruments & Components - 1.4% | ||||||||
| AVX Corp. | 12,390 | 223,639 | ||||||
| Badger Meter, Inc. | 6,336 | 335,491 | ||||||
| Control4 Corp. * | 4,792 | 164,509 | ||||||
| CTS Corp. | 12,200 | 418,460 | ||||||
| Electro Scientific Industries, Inc. * | 23,887 | 416,828 | ||||||
| ePlus, Inc. * | 2,245 | 208,112 | ||||||
| FARO Technologies, Inc. * | 6,012 | 386,872 | ||||||
| II-VI, Inc. * | 9,636 | 455,783 | ||||||
| Insight Enterprises, Inc. * | 2,513 | 135,928 | ||||||
| Mesa Laboratories, Inc. | 1,267 | 235,181 | ||||||
| Novanta, Inc. * | 16,513 | 1,129,489 | ||||||
| PAR Technology Corp. * | 11,163 | 248,042 | ||||||
| PC Connection, Inc. | 4,953 | 192,622 | ||||||
| Rogers Corp. * | 880 | 129,642 | ||||||
| Vishay Intertechnology, Inc. | 8,583 | 174,664 | ||||||
| Vishay Precision Group, Inc. * | 6,027 | 225,410 | ||||||
|
| |||||||
| 5,080,672 | ||||||||
|
| |||||||
| Energy Equipment & Services - 1.5% | ||||||||
| Bristow Group, Inc. *(b) | 24,354 | 295,414 | ||||||
| Diamond Offshore Drilling, Inc. *(b) | 11,865 | 237,300 | ||||||
| Exterran Corp. * | 7,812 | 207,252 | ||||||
| Helix Energy Solutions Group, Inc. * | 45,733 | 451,842 | ||||||
| ION Geophysical Corp. * | 22,940 | 356,717 | ||||||
| Mammoth Energy Services, Inc. | 19,175 | 557,993 | ||||||
| Matrix Service Co. * | 17,996 | 443,602 | ||||||
| Newpark Resources, Inc. * | 27,872 | 288,475 | ||||||
| Noble Corp. plc * | 130,851 | 919,883 | ||||||
| Oil States International, Inc. * | 5,450 | 180,940 | ||||||
| Pioneer Energy Services Corp. * | 69,939 | 206,320 | ||||||
| Profire Energy, Inc. * | 54,895 | 175,115 | ||||||
| ProPetro Holding Corp. * | 15,366 | 253,385 | ||||||
| SEACOR Holdings, Inc. * | 6,780 | 335,000 | ||||||
| Solaris Oilfield Infrastructure, Inc., Class A * | 17,070 | 322,452 | ||||||
| The accompanying notes are an integral part of these financial statements. | (Continued) |
| AQR Funds | Annual Report | September 2018 | ||||||||||||||
105
Table of Contents
| Schedule of Investments | September 30, 2018 |
| AQR SMALL CAP MOMENTUM STYLE FUND |
| INVESTMENTS | SHARES | VALUE | ||||||
| Energy Equipment & Services - 1.5% (continued) | ||||||||
| TETRA Technologies, Inc. * | 26,574 | $ | 119,849 | |||||
| Unit Corp. * | 7,606 | 198,212 | ||||||
|
| |||||||
| 5,549,751 | ||||||||
|
| |||||||
| Entertainment - 0.9% | ||||||||
| Liberty Media Corp.-Liberty Braves, Class C * | 6,881 | 187,507 | ||||||
| Marcus Corp. (The) | 6,900 | 290,145 | ||||||
| World Wrestling Entertainment, Inc., Class A | 31,334 | 3,030,938 | ||||||
|
| |||||||
| 3,508,590 | ||||||||
|
| |||||||
| Equity Real Estate Investment Trusts (REITs) - 1.5% | ||||||||
| Chesapeake Lodging Trust | 5,682 | 182,222 | ||||||
| Community Healthcare Trust, Inc. | 6,453 | 199,914 | ||||||
| CorePoint Lodging, Inc. | 9,519 | 185,145 | ||||||
| EastGroup Properties, Inc. | 3,534 | 337,921 | ||||||
| First Industrial Realty Trust, Inc. | 5,968 | 187,395 | ||||||
| Innovative Industrial Properties, Inc. (b) | 12,651 | 610,284 | ||||||
| Jernigan Capital, Inc. | 8,682 | 167,476 | ||||||
| Monmouth Real Estate Investment Corp. | 9,260 | 154,827 | ||||||
| National Storage Affiliates Trust | 5,807 | 147,730 | ||||||
| NexPoint Residential Trust, Inc. | 13,524 | 448,997 | ||||||
| Pebblebrook Hotel Trust (b) | 9,022 | 328,130 | ||||||
| Rexford Industrial Realty, Inc. | 12,163 | 388,729 | ||||||
| Ryman Hospitality Properties, Inc. | 10,862 | 935,979 | ||||||
| STAG Industrial, Inc. | 4,629 | 127,297 | ||||||
| Terreno Realty Corp. | 11,229 | 423,333 | ||||||
| UMH Properties, Inc. | 9,125 | 142,715 | ||||||
| Xenia Hotels & Resorts, Inc. | 18,347 | 434,824 | ||||||
|
| |||||||
| 5,402,918 | ||||||||
|
| |||||||
| Food & Staples Retailing - 0.3% | ||||||||
| Chefs’ Warehouse, Inc. (The) * | 11,924 | 433,438 | ||||||
| Performance Food Group Co. * | 21,894 | 729,070 | ||||||
|
| |||||||
| 1,162,508 | ||||||||
|
| |||||||
| Food Products - 0.6% | ||||||||
| Calavo Growers, Inc. (b) | 4,606 | 444,940 | ||||||
| Cal-Maine Foods, Inc. | 11,898 | 574,673 | ||||||
| Darling Ingredients, Inc. * | 9,800 | 189,336 | ||||||
| Freshpet, Inc. * | 16,338 | 599,605 | ||||||
| John B Sanfilippo & Son, Inc. | 2,196 | 156,750 | ||||||
| Lancaster Colony Corp. | 724 | 108,028 | ||||||
|
| |||||||
| 2,073,332 | ||||||||
|
| |||||||
| Gas Utilities - 0.0% (a) | ||||||||
| Chesapeake Utilities Corp. | 2,140 | 179,546 | ||||||
|
| |||||||
| Health Care Equipment & Supplies - 7.0% | ||||||||
| Antares Pharma, Inc. * | 36,080 | 121,229 | ||||||
| AtriCure, Inc. * | 7,251 | 254,003 | ||||||
| Atrion Corp. | 378 | 262,634 | ||||||
| Avanos Medical, Inc. * | 13,112 | 898,172 | ||||||
| AxoGen, Inc. * | 17,307 | 637,763 | ||||||
| Cerus Corp. * | 74,489 | 537,066 | ||||||
| CONMED Corp. | 6,307 | 499,641 | ||||||
| CryoLife, Inc. * | 13,209 | 464,957 | ||||||
| CryoPort, Inc. * | 29,417 | 376,832 | ||||||
| Cutera, Inc. * | 8,451 | 275,080 | ||||||
| INVESTMENTS | SHARES | VALUE | ||||||
| Health Care Equipment & Supplies - 7.0% (continued) | ||||||||
| CytoSorbents Corp. * | 27,542 | $ | 355,292 | |||||
| Globus Medical, Inc., Class A * | 29,863 | 1,695,024 | ||||||
| Haemonetics Corp. * | 20,728 | 2,375,014 | ||||||
| Inogen, Inc. * | 8,437 | 2,059,640 | ||||||
| Integer Holdings Corp. * | 10,594 | 878,772 | ||||||
| IntriCon Corp. * | 10,020 | 563,124 | ||||||
| Invacare Corp. | 12,156 | 176,870 | ||||||
| iRhythm Technologies, Inc. * | 9,663 | 914,700 | ||||||
| LeMaitre Vascular, Inc. | 4,223 | 163,599 | ||||||
| LivaNova plc * | 16,834 | 2,086,911 | ||||||
| Merit Medical Systems, Inc. * | 13,844 | 850,714 | ||||||
| Neogen Corp. * | 14,291 | 1,022,235 | ||||||
| Novocure Ltd. * | 38,156 | 1,999,374 | ||||||
| Nuvectra Corp. * | 9,786 | 215,096 | ||||||
| Orthofix Medical, Inc. * | 4,178 | 241,530 | ||||||
| Quidel Corp. * | 14,619 | 952,720 | ||||||
| Senseonics Holdings, Inc. *(b) | 69,780 | 332,851 | ||||||
| Sientra, Inc. * | 17,087 | 408,038 | ||||||
| STAAR Surgical Co. * | 22,651 | 1,087,248 | ||||||
| Surmodics, Inc. * | 6,370 | 475,520 | ||||||
| Tactile Systems Technology, Inc. * | 9,919 | 704,745 | ||||||
| Tandem Diabetes Care, Inc. * | 28,666 | 1,228,051 | ||||||
| TransEnterix, Inc. *(b) | 138,240 | 801,792 | ||||||
| ViewRay, Inc. * | 11,945 | 111,805 | ||||||
|
| |||||||
| 26,028,042 | ||||||||
|
| |||||||
| Health Care Providers & Services - 2.7% | ||||||||
| Addus HomeCare Corp. * | 7,028 | 493,014 | ||||||
| Amedisys, Inc. * | 4,105 | 512,961 | ||||||
| AMN Healthcare Services, Inc. * | 13,291 | 727,018 | ||||||
| BioTelemetry, Inc. * | 6,035 | 388,956 | ||||||
| CorVel Corp. * | 5,062 | 304,985 | ||||||
| Cross Country Healthcare, Inc. * | 14,589 | 127,362 | ||||||
| Diplomat Pharmacy, Inc. * | 18,743 | 363,802 | ||||||
| Ensign Group, Inc. (The) | 16,839 | 638,535 | ||||||
| HealthEquity, Inc. * | 21,509 | 2,030,665 | ||||||
| LHC Group, Inc. * | 3,859 | 397,438 | ||||||
| Magellan Health, Inc. * | 1,537 | 110,741 | ||||||
| MedCath Corp. (3)*(c) | 10,300 | — | ||||||
| National HealthCare Corp. | 1,886 | 142,148 | ||||||
| Providence Service Corp. (The) * | 4,751 | 319,647 | ||||||
| Quorum Health Corp. * | 37,399 | 219,158 | ||||||
| R1 RCM, Inc. * | 65,590 | 666,394 | ||||||
| RadNet, Inc. * | 26,958 | 405,718 | ||||||
| Select Medical Holdings Corp. * | 25,621 | 471,426 | ||||||
| Tenet Healthcare Corp. * | 37,556 | 1,068,844 | ||||||
| Triple-S Management Corp., Class B * | 13,893 | 262,439 | ||||||
| US Physical Therapy, Inc. | 3,234 | 383,552 | ||||||
|
| |||||||
| 10,034,803 | ||||||||
|
| |||||||
| Health Care Technology - 0.9% | ||||||||
| Omnicell, Inc. * | 3,137 | 225,550 | ||||||
| Tabula Rasa HealthCare, Inc. * | 11,883 | 964,781 | ||||||
| Teladoc Health, Inc. * | 23,092 | 1,993,994 | ||||||
| Vocera Communications, Inc. * | 3,442 | 125,909 | ||||||
|
| |||||||
| 3,310,234 | ||||||||
|
| |||||||
| Hotels, Restaurants & Leisure - 4.7% | ||||||||
| BBX Capital Corp. | 23,184 | 172,025 | ||||||
| The accompanying notes are an integral part of these financial statements. | (Continued) |
| AQR Funds | Annual Report | September 2018 | ||||||||||||||
106
Table of Contents
| Schedule of Investments | September 30, 2018 |
| AQR SMALL CAP MOMENTUM STYLE FUND |
| INVESTMENTS | SHARES | VALUE | ||||||
| Hotels, Restaurants & Leisure - 4.7% (continued) | ||||||||
| BJ’s Restaurants, Inc. | 9,923 | $ | 716,441 | |||||
| Bloomin’ Brands, Inc. | 7,214 | 142,765 | ||||||
| Boyd Gaming Corp. | 39,000 | 1,320,150 | ||||||
| Brinker International, Inc. (b) | 5,892 | 275,333 | ||||||
| Carrols Restaurant Group, Inc. * | 11,164 | 162,994 | ||||||
| Churchill Downs, Inc. | 4,071 | 1,130,517 | ||||||
| Del Taco Restaurants, Inc. * | 12,276 | 144,980 | ||||||
| Denny’s Corp. * | 16,550 | 243,616 | ||||||
| Dine Brands Global, Inc. | 8,635 | 702,112 | ||||||
| Drive Shack, Inc., REIT * | 36,066 | 214,953 | ||||||
| Eldorado Resorts, Inc. *(b) | 29,796 | 1,448,086 | ||||||
| Golden Entertainment, Inc. *(b) | 14,586 | 350,210 | ||||||
| International Speedway Corp., Class A | 3,567 | 156,235 | ||||||
| Monarch Casino & Resort, Inc. * | 7,349 | 334,012 | ||||||
| Noodles & Co. * | 40,637 | 491,708 | ||||||
| Penn National Gaming, Inc. * | 33,709 | 1,109,700 | ||||||
| Planet Fitness, Inc., Class A * | 35,984 | 1,944,215 | ||||||
| RCI Hospitality Holdings, Inc. | 11,399 | 337,524 | ||||||
| Red Lion Hotels Corp. * | 10,911 | 136,387 | ||||||
| Red Rock Resorts, Inc., Class A | 35,410 | 943,676 | ||||||
| Ruth’s Hospitality Group, Inc. | 9,641 | 304,174 | ||||||
| Scientific Games Corp. * | 25,629 | 650,977 | ||||||
| SeaWorld Entertainment, Inc. * | 17,051 | 535,913 | ||||||
| Shake Shack, Inc., Class A *(b) | 16,028 | 1,009,924 | ||||||
| Sonic Corp. | 3,096 | 134,181 | ||||||
| Texas Roadhouse, Inc. | 17,304 | 1,198,994 | ||||||
| Town Sports International Holdings, Inc. * | 23,172 | 200,438 | ||||||
| Wingstop, Inc. | 13,170 | 899,116 | ||||||
|
| |||||||
| 17,411,356 | ||||||||
|
| |||||||
| Household Durables - 0.8% | ||||||||
| Bassett Furniture Industries, Inc. | 8,255 | 175,419 | ||||||
| Cavco Industries, Inc. * | 2,640 | 667,920 | ||||||
| Century Communities, Inc. * | 6,191 | 162,514 | ||||||
| Hooker Furniture Corp. | 4,478 | 151,356 | ||||||
| KB Home | 10,848 | 259,376 | ||||||
| LGI Homes, Inc. *(b) | 3,902 | 185,111 | ||||||
| Meritage Homes Corp. * | 3,247 | 129,555 | ||||||
| TopBuild Corp. * | 10,790 | 613,088 | ||||||
| TRI Pointe Group, Inc. * | 33,215 | 411,866 | ||||||
| ZAGG, Inc. * | 17,070 | 251,782 | ||||||
|
| |||||||
| 3,007,987 | ||||||||
|
| |||||||
| Household Products - 0.3% | ||||||||
| Central Garden & Pet Co., Class A * | 17,448 | 578,227 | ||||||
| WD-40 Co. | 2,305 | 396,690 | ||||||
|
| |||||||
| 974,917 | ||||||||
|
| |||||||
| Industrial Conglomerates - 0.1% | ||||||||
| Raven Industries, Inc. | 6,777 | 310,048 | ||||||
|
| |||||||
| Insurance - 2.9% | ||||||||
| American Equity Investment Life Holding Co. | 14,544 | 514,276 | ||||||
| AMERISAFE, Inc. | 3,029 | 187,647 | ||||||
| CNO Financial Group, Inc. | 6,235 | 132,307 | ||||||
| eHealth, Inc. * | 4,221 | 119,285 | ||||||
| Employers Holdings, Inc. | 2,918 | 132,185 | ||||||
| Enstar Group Ltd. * | 725 | 151,163 | ||||||
| INVESTMENTS | SHARES | VALUE | ||||||
| Insurance - 2.9% (continued) | ||||||||
| FBL Financial Group, Inc., Class A | 6,161 | $ | 463,615 | |||||
| HCI Group, Inc. | 467 | 20,431 | ||||||
| Health Insurance Innovations, Inc., Class A * | 6,482 | 399,615 | ||||||
| Heritage Insurance Holdings, Inc. (b) | 11,635 | 172,431 | ||||||
| Horace Mann Educators Corp. | 3,809 | 171,024 | ||||||
| James River Group Holdings Ltd. | 4,897 | 208,710 | ||||||
| Kemper Corp. | 23,233 | 1,869,095 | ||||||
| Kinsale Capital Group, Inc. | 8,421 | 537,765 | ||||||
| National General Holdings Corp. | 12,773 | 342,827 | ||||||
| National Western Life Group, Inc., Class A | 528 | 168,538 | ||||||
| Primerica, Inc. | 16,110 | 1,942,061 | ||||||
| RLI Corp. | 6,973 | 547,938 | ||||||
| Safety Insurance Group, Inc. | 1,836 | 164,506 | ||||||
| Selective Insurance Group, Inc. | 9,561 | 607,124 | ||||||
| Third Point Reinsurance Ltd. * | 13,375 | 173,875 | ||||||
| Trupanion, Inc. *(b) | 16,943 | 605,373 | ||||||
| United Fire Group, Inc. | 5,138 | 260,856 | ||||||
| United Insurance Holdings Corp. | 8,652 | 193,632 | ||||||
| Universal Insurance Holdings, Inc. | 11,879 | 576,725 | ||||||
|
| |||||||
| 10,663,004 | ||||||||
|
| |||||||
| Interactive Media & Services - 0.6% | ||||||||
| Care.com, Inc. * | 12,036 | 266,116 | ||||||
| QuinStreet, Inc. * | 43,077 | 584,555 | ||||||
| Travelzoo * | 12,075 | 143,089 | ||||||
| XO Group, Inc. * | 13,043 | 449,722 | ||||||
| Yelp, Inc. * | 12,170 | 598,764 | ||||||
|
| |||||||
| 2,042,246 | ||||||||
|
| |||||||
| Internet & Direct Marketing Retail - 1.7% | ||||||||
| Etsy, Inc. * | 47,750 | 2,453,395 | ||||||
| Gaia, Inc. * | 12,901 | 198,675 | ||||||
| Groupon, Inc. * | 111,706 | 421,132 | ||||||
| Lands’ End, Inc. * | 10,340 | 181,467 | ||||||
| Liberty TripAdvisor Holdings, Inc., Class A * | 11,955 | 177,532 | ||||||
| Overstock.com, Inc. *(b) | 15,969 | 442,341 | ||||||
| Quotient Technology, Inc. * | 10,253 | 158,921 | ||||||
| Remark Holdings, Inc. *(b) | 44,517 | 142,009 | ||||||
| Shutterfly, Inc. * | 12,767 | 841,218 | ||||||
| Shutterstock, Inc. | 2,163 | 118,057 | ||||||
| Stamps.com, Inc. * | 4,430 | 1,002,066 | ||||||
|
| |||||||
| 6,136,813 | ||||||||
|
| |||||||
| IT Services - 1.9% | ||||||||
| Brightcove, Inc. * | 14,222 | 119,465 | ||||||
| CACI International, Inc., Class A * | 7,258 | 1,336,561 | ||||||
| Carbonite, Inc. * | 14,510 | 517,281 | ||||||
| CSG Systems International, Inc. | 3,860 | 154,940 | ||||||
| Everi Holdings, Inc. * | 27,890 | 255,751 | ||||||
| EVERTEC, Inc. | 13,799 | 332,556 | ||||||
| ExlService Holdings, Inc. * | 3,131 | 207,272 | ||||||
| GTT Communications, Inc. *(b) | 16,026 | 695,528 | ||||||
| Hackett Group, Inc. (The) | 15,924 | 320,869 | ||||||
| Internap Corp. * | 9,341 | 117,977 | ||||||
| Limelight Networks, Inc. * | 69,674 | 349,763 | ||||||
| ManTech International Corp., Class A | 12,567 | 795,491 | ||||||
| MAXIMUS, Inc. | 2,537 | 165,057 | ||||||
| The accompanying notes are an integral part of these financial statements. | (Continued) |
| AQR Funds | Annual Report | September 2018 | ||||||||||||||
107
Table of Contents
| Schedule of Investments | September 30, 2018 |
| AQR SMALL CAP MOMENTUM STYLE FUND |
| INVESTMENTS | SHARES | VALUE | ||||||
| IT Services - 1.9% (continued) | ||||||||
| Perficient, Inc. * | 7,395 | $ | 197,077 | |||||
| Travelport Worldwide Ltd. | 31,143 | 525,382 | ||||||
| TTEC Holdings, Inc. | 6,525 | 168,998 | ||||||
| Tucows, Inc., Class A *(b) | 2,229 | 124,267 | ||||||
| Unisys Corp. * | 7,532 | 153,653 | ||||||
| Virtusa Corp. * | 11,132 | 597,900 | ||||||
|
| |||||||
| 7,135,788 | ||||||||
|
| |||||||
| Leisure Products - 0.7% | ||||||||
| Acushnet Holdings Corp. | 5,872 | 161,069 | ||||||
| Callaway Golf Co. | 27,445 | 666,639 | ||||||
| Johnson Outdoors, Inc., Class A | 5,571 | 518,048 | ||||||
| Malibu Boats, Inc., Class A * | 12,549 | 686,681 | ||||||
| MCBC Holdings, Inc. * | 11,366 | 407,812 | ||||||
|
| |||||||
| 2,440,249 | ||||||||
|
| |||||||
| Life Sciences Tools & Services - 0.6% | ||||||||
| Codexis, Inc. * | 47,723 | 818,449 | ||||||
| Luminex Corp. | 6,573 | 199,228 | ||||||
| Medpace Holdings, Inc. * | 12,723 | 762,235 | ||||||
| NeoGenomics, Inc. * | 25,131 | 385,761 | ||||||
|
| |||||||
| 2,165,673 | ||||||||
|
| |||||||
| Machinery - 3.7% | ||||||||
| Alamo Group, Inc. | 1,947 | 178,365 | ||||||
| Albany International Corp., Class A | 6,350 | 504,825 | ||||||
| Barnes Group, Inc. | 5,224 | 371,061 | ||||||
| Chart Industries, Inc. * | 12,323 | 965,261 | ||||||
| Columbus McKinnon Corp. | 10,083 | 398,682 | ||||||
| Commercial Vehicle Group, Inc. * | 14,417 | 132,060 | ||||||
| DMC Global, Inc. | 11,504 | 469,363 | ||||||
| Douglas Dynamics, Inc. | 9,186 | 403,265 | ||||||
| ESCO Technologies, Inc. | 1,780 | 121,129 | ||||||
| Federal Signal Corp. | 13,957 | 373,768 | ||||||
| Franklin Electric Co., Inc. | 3,130 | 147,892 | ||||||
| Global Brass & Copper Holdings, Inc. | 4,697 | 173,319 | ||||||
| Greenbrier Cos., Inc. (The) | 2,396 | 144,000 | ||||||
| Harsco Corp. * | 35,429 | 1,011,498 | ||||||
| Hillenbrand, Inc. | 10,768 | 563,166 | ||||||
| Kadant, Inc. | 4,335 | 467,530 | ||||||
| Meritor, Inc. * | 23,167 | 448,513 | ||||||
| Mueller Water Products, Inc., Class A | 13,903 | 160,024 | ||||||
| Navistar International Corp. * | 28,219 | 1,086,431 | ||||||
| NN, Inc. | 6,236 | 97,282 | ||||||
| Proto Labs, Inc. * | 9,781 | 1,582,077 | ||||||
| RBC Bearings, Inc. * | 4,075 | 612,717 | ||||||
| Rexnord Corp. * | 22,797 | 702,148 | ||||||
| Spartan Motors, Inc. | 25,080 | 369,930 | ||||||
| SPX Corp. * | 23,372 | 778,521 | ||||||
| SPX FLOW, Inc. * | 3,945 | 205,140 | ||||||
| Standex International Corp. | 1,932 | 201,411 | ||||||
| Sun Hydraulics Corp. | 3,146 | 172,338 | ||||||
| Tennant Co. | 2,238 | 169,976 | ||||||
| TriMas Corp. * | 4,367 | 132,757 | ||||||
| Watts Water Technologies, Inc., Class A | 3,399 | 282,117 | ||||||
| Woodward, Inc. | 1,833 | 148,216 | ||||||
|
| |||||||
| 13,574,782 | ||||||||
|
| |||||||
| INVESTMENTS | SHARES | VALUE | ||||||
| Marine - 0.1% | ||||||||
| Genco Shipping & Trading Ltd. * | 17,407 | $ | 243,698 | |||||
| Safe Bulkers, Inc. (Greece) * | 55,946 | 161,124 | ||||||
|
| |||||||
| 404,822 | ||||||||
|
| |||||||
| Media - 0.6% | ||||||||
| Entravision Communications Corp., Class A | 32,308 | 158,309 | ||||||
| Gannett Co., Inc. | 31,650 | 316,817 | ||||||
| New Media Investment Group, Inc. | 12,241 | 192,061 | ||||||
| New York Times Co. (The), Class A | 48,390 | 1,120,229 | ||||||
| TechTarget, Inc. * | 22,408 | 435,163 | ||||||
|
| |||||||
| 2,222,579 | ||||||||
|
| |||||||
| Metals & Mining - 1.1% | ||||||||
| Allegheny Technologies, Inc. * | 43,472 | 1,284,597 | ||||||
| Carpenter Technology Corp. | 12,568 | 740,884 | ||||||
| Commercial Metals Co. | 7,194 | 147,621 | ||||||
| Gold Resource Corp. | 34,240 | 175,994 | ||||||
| Kaiser Aluminum Corp. | 2,184 | 238,187 | ||||||
| Materion Corp. | 7,121 | 430,820 | ||||||
| Schnitzer Steel Industries, Inc., Class A | 10,401 | 281,347 | ||||||
| SunCoke Energy, Inc. * | 10,996 | 127,773 | ||||||
| Warrior Met Coal, Inc. | 27,393 | 740,707 | ||||||
|
| |||||||
| 4,167,930 | ||||||||
|
| |||||||
| Multiline Retail - 0.7% | ||||||||
| Dillard’s, Inc., Class A (b) | 8,527 | 650,951 | ||||||
| Ollie’s Bargain Outlet Holdings, Inc. * | 21,714 | 2,086,716 | ||||||
|
| |||||||
| 2,737,667 | ||||||||
|
| |||||||
| Multi-Utilities - 0.0% (a) | ||||||||
| Unitil Corp. | 2,791 | 142,062 | ||||||
|
| |||||||
| Oil, Gas & Consumable Fuels - 3.9% | ||||||||
| Abraxas Petroleum Corp. * | 70,384 | 163,995 | ||||||
| Amyris, Inc. * | 37,876 | 300,736 | ||||||
| Approach Resources, Inc. *(b) | 65,375 | 145,786 | ||||||
| California Resources Corp. * | 23,029 | 1,117,597 | ||||||
| Carrizo Oil & Gas, Inc. * | 18,287 | 460,832 | ||||||
| CVR Energy, Inc. | 33,387 | 1,342,825 | ||||||
| Delek US Holdings, Inc. | 30,308 | 1,285,969 | ||||||
| Denbury Resources, Inc. * | 207,931 | 1,289,172 | ||||||
| GasLog Ltd. (Monaco) | 8,559 | 169,040 | ||||||
| HighPoint Resources Corp. * | 95,800 | 467,504 | ||||||
| Matador Resources Co. * | 14,732 | 486,893 | ||||||
| Northern Oil and Gas, Inc. * | 107,515 | 430,060 | ||||||
| Oasis Petroleum, Inc. * | 73,271 | 1,038,983 | ||||||
| PDC Energy, Inc. * | 11,617 | 568,768 | ||||||
| Peabody Energy Corp. | 40,562 | 1,445,630 | ||||||
| Penn Virginia Corp. * | 6,278 | 505,630 | ||||||
| Renewable Energy Group, Inc. * | 10,705 | 308,304 | ||||||
| REX American Resources Corp. * | 2,433 | 183,813 | ||||||
| Ring Energy, Inc. * | 10,251 | 101,587 | ||||||
| SRC Energy, Inc. * | 77,408 | 688,157 | ||||||
| Uranium Energy Corp. * | 74,930 | 128,880 | ||||||
| W&T Offshore, Inc. * | 80,660 | 777,562 | ||||||
| WildHorse Resource Development Corp. * | 40,427 | 955,694 | ||||||
| Zion Oil & Gas, Inc. * | 13,634 | 17,452 | ||||||
|
| |||||||
| 14,380,869 | ||||||||
|
| |||||||
| The accompanying notes are an integral part of these financial statements. | (Continued) |
| AQR Funds | Annual Report | September 2018 | ||||||||||||||
108
Table of Contents
| Schedule of Investments | September 30, 2018 |
| AQR SMALL CAP MOMENTUM STYLE FUND |
| INVESTMENTS | SHARES | VALUE | ||||||
| Paper & Forest Products - 0.4% | ||||||||
| Boise Cascade Co. | 11,542 | $ | 424,745 | |||||
| Louisiana-Pacific Corp. | 3,938 | 104,318 | ||||||
| Neenah, Inc. | 1,864 | 160,863 | ||||||
| Verso Corp., Class A * | 27,185 | 915,319 | ||||||
|
| |||||||
| 1,605,245 | ||||||||
|
| |||||||
| Personal Products - 0.9% | ||||||||
| Inter Parfums, Inc. | 8,628 | 556,074 | ||||||
| Medifast, Inc. | 6,440 | 1,426,782 | ||||||
| USANA Health Sciences, Inc. * | 10,185 | 1,227,802 | ||||||
|
| |||||||
| 3,210,658 | ||||||||
|
| |||||||
| Pharmaceuticals - 2.4% | ||||||||
| Amphastar Pharmaceuticals, Inc. * | 6,875 | 132,275 | ||||||
| ANI Pharmaceuticals, Inc. * | 1,974 | 111,610 | ||||||
| Assembly Biosciences, Inc. * | 12,363 | 459,162 | ||||||
| Collegium Pharmaceutical, Inc. *(b) | 17,435 | 256,992 | ||||||
| Corcept Therapeutics, Inc. *(b) | 15,564 | 218,207 | ||||||
| Corium International, Inc. *(b) | 29,669 | 282,152 | ||||||
| Cymabay Therapeutics, Inc. * | 34,793 | 385,506 | ||||||
| Durect Corp. * | 103,018 | 113,320 | ||||||
| Endo International plc * | 14,161 | 238,330 | ||||||
| Endocyte, Inc. * | 43,129 | 765,971 | ||||||
| Horizon Pharma plc * | 50,950 | 997,601 | ||||||
| Intersect ENT, Inc. * | 6,828 | 196,305 | ||||||
| Intra-Cellular Therapies, Inc. * | 22,435 | 486,840 | ||||||
| Marinus Pharmaceuticals, Inc. *(b) | 57,454 | 574,540 | ||||||
| MyoKardia, Inc. * | 18,527 | 1,207,960 | ||||||
| Phibro Animal Health Corp., Class A | 10,376 | 445,130 | ||||||
| Reata Pharmaceuticals, Inc., Class A * | 1,523 | 124,521 | ||||||
| Revance Therapeutics, Inc. * | 7,281 | 180,933 | ||||||
| TherapeuticsMD, Inc. *(b) | 29,986 | 196,708 | ||||||
| WaVe Life Sciences Ltd. * | 12,181 | 609,050 | ||||||
| Zogenix, Inc. * | 17,389 | 862,494 | ||||||
|
| |||||||
| 8,845,607 | ||||||||
|
| |||||||
| Professional Services - 2.9% | ||||||||
| ASGN, Inc. * | 16,768 | 1,323,498 | ||||||
| Barrett Business Services, Inc. | 2,777 | 185,448 | ||||||
| CBIZ, Inc. * | 11,492 | 272,361 | ||||||
| CRA International, Inc. | 8,044 | 403,970 | ||||||
| Exponent, Inc. | 15,441 | 827,638 | ||||||
| FTI Consulting, Inc. * | 16,186 | 1,184,653 | ||||||
| Heidrick & Struggles International, Inc. | 8,965 | 303,465 | ||||||
| ICF International, Inc. | 5,218 | 393,698 | ||||||
| Insperity, Inc. | 18,319 | 2,160,726 | ||||||
| Kelly Services, Inc., Class A | 11,443 | 274,975 | ||||||
| Kforce, Inc. | 10,385 | 390,476 | ||||||
| Korn/Ferry International | 20,845 | 1,026,408 | ||||||
| Mistras Group, Inc. * | 8,171 | 177,066 | ||||||
| Navigant Consulting, Inc. | 6,717 | 154,894 | ||||||
| TriNet Group, Inc. * | 23,494 | 1,323,182 | ||||||
| Willdan Group, Inc. * | 5,298 | 179,920 | ||||||
|
| |||||||
| 10,582,378 | ||||||||
|
| |||||||
| Real Estate Management & Development - 0.4% | ||||||||
| HFF, Inc., Class A | 5,932 | 251,991 | ||||||
| Marcus & Millichap, Inc. * | 9,112 | 316,278 | ||||||
| Maui Land & Pineapple Co., Inc. * | 367 | 4,698 | ||||||
| RMR Group, Inc. (The), Class A | 9,458 | 877,702 | ||||||
|
| |||||||
| 1,450,669 | ||||||||
|
| |||||||
| INVESTMENTS | SHARES | VALUE | ||||||
| Road & Rail - 1.0% | ||||||||
| ArcBest Corp. | 11,572 | $ | 561,821 | |||||
| Avis Budget Group, Inc. * | 10,921 | 351,001 | ||||||
| Covenant Transportation Group, Inc., Class A * | 10,692 | 310,709 | ||||||
| Hertz Global Holdings, Inc. * | 7,907 | 129,121 | ||||||
| Marten Transport Ltd. | 14,702 | 309,477 | ||||||
| Saia, Inc. * | 11,522 | 880,857 | ||||||
| Universal Logistics Holdings, Inc. | 6,917 | 254,546 | ||||||
| USA Truck, Inc. * | 10,206 | 206,467 | ||||||
| Werner Enterprises, Inc. | 18,171 | 642,345 | ||||||
|
| |||||||
| 3,646,344 | ||||||||
|
| |||||||
| Semiconductors & Semiconductor Equipment - 2.5% | ||||||||
| Adesto Technologies Corp. *(b) | 28,558 | 169,920 | ||||||
| Alpha & Omega Semiconductor Ltd. * | 14,897 | 173,252 | ||||||
| AXT, Inc. * | 20,103 | 143,737 | ||||||
| Cabot Microelectronics Corp. | 7,508 | 774,600 | ||||||
| CEVA, Inc. * | 4,800 | 138,000 | ||||||
| Cohu, Inc. | 5,184 | 130,118 | ||||||
| Cree, Inc. * | 39,525 | 1,496,812 | ||||||
| Diodes, Inc. * | 16,230 | 540,297 | ||||||
| Entegris, Inc. | 45,525 | 1,317,949 | ||||||
| Integrated Device Technology, Inc. * | 24,908 | 1,170,925 | ||||||
| Lattice Semiconductor Corp. * | 13,731 | 109,848 | ||||||
| Nanometrics, Inc. * | 3,094 | 116,087 | ||||||
| NVE Corp. | 1,674 | 177,243 | ||||||
| Photronics, Inc. * | 17,287 | 170,277 | ||||||
| Rudolph Technologies, Inc. * | 6,345 | 155,135 | ||||||
| Semtech Corp. * | 14,576 | 810,426 | ||||||
| Silicon Laboratories, Inc. * | 13,899 | 1,275,928 | ||||||
| SMART Global Holdings, Inc. * | 13,877 | 398,825 | ||||||
|
| |||||||
| 9,269,379 | ||||||||
|
| |||||||
| Software - 8.4% | ||||||||
| 8x8, Inc. * | 24,115 | 512,444 | ||||||
| Alteryx, Inc., Class A * | 27,439 | 1,569,785 | ||||||
| Appfolio, Inc., Class A * | 17,142 | 1,343,933 | ||||||
| Apptio, Inc., Class A * | 21,450 | 792,792 | ||||||
| Blackbaud, Inc. | 6,272 | 636,483 | ||||||
| Blackline, Inc. * | 6,008 | 339,272 | ||||||
| Bottomline Technologies DE, Inc. * | 18,470 | 1,342,954 | ||||||
| Cornerstone OnDemand, Inc. * | 2,770 | 157,197 | ||||||
| Coupa Software, Inc. * | 22,875 | 1,809,412 | ||||||
| Digimarc Corp. * | 4,547 | 143,003 | ||||||
| Ebix, Inc. (b) | 10,348 | 819,044 | ||||||
| eGain Corp. * | 35,045 | 283,864 | ||||||
| Envestnet, Inc. * | 13,554 | 826,116 | ||||||
| Everbridge, Inc. * | 13,191 | 760,329 | ||||||
| Five9, Inc. * | 25,258 | 1,103,522 | ||||||
| Glu Mobile, Inc. * | 73,889 | 550,473 | ||||||
| Hortonworks, Inc. * | 31,896 | 727,548 | ||||||
| HubSpot, Inc. * | 13,834 | 2,088,242 | ||||||
| Instructure, Inc. * | 13,215 | 467,811 | ||||||
| LivePerson, Inc. * | 31,411 | 815,115 | ||||||
| MINDBODY, Inc., Class A * | 14,831 | 602,880 | ||||||
| Mitek Systems, Inc. *(b) | 18,525 | 130,601 | ||||||
| MobileIron, Inc. * | 34,224 | 181,387 | ||||||
| Model N, Inc. * | 12,062 | 191,183 | ||||||
| New Relic, Inc. * | 20,958 | 1,974,872 | ||||||
| The accompanying notes are an integral part of these financial statements. | (Continued) |
| AQR Funds | Annual Report | September 2018 | ||||||||||||||
109
Table of Contents
| Schedule of Investments | September 30, 2018 |
| AQR SMALL CAP MOMENTUM STYLE FUND |
| INVESTMENTS | SHARES | VALUE | ||||||
| Software - 8.4% (continued) | ||||||||
| NextGen Healthcare Information Systems LLC * | 12,397 | $ | 248,932 | |||||
| OneSpan, Inc. * | 9,853 | 187,700 | ||||||
| Paylocity Holding Corp. * | 13,130 | 1,054,602 | ||||||
| Progress Software Corp. | 12,969 | 457,676 | ||||||
| PROS Holdings, Inc. * | 7,211 | 252,529 | ||||||
| Q2 Holdings, Inc. * | 13,016 | 788,119 | ||||||
| Qualys, Inc. * | 16,663 | 1,484,673 | ||||||
| Rapid7, Inc. * | 18,829 | 695,167 | ||||||
| ShotSpotter, Inc. * | 9,171 | 562,091 | ||||||
| SPS Commerce, Inc. * | 2,021 | 200,564 | ||||||
| Trade Desk, Inc. (The), Class A * | 15,500 | 2,339,105 | ||||||
| Upland Software, Inc. * | 15,043 | 486,039 | ||||||
| Varonis Systems, Inc. * | 12,194 | 893,211 | ||||||
| Veritone, Inc. * | 11,088 | 115,648 | ||||||
| Workiva, Inc. * | 12,211 | 482,335 | ||||||
| Yext, Inc. * | 16,675 | 395,198 | ||||||
| Zix Corp. * | 34,017 | 188,794 | ||||||
|
| |||||||
| 31,002,645 | ||||||||
|
| |||||||
| Specialty Retail - 4.9% | ||||||||
| Aaron’s, Inc. | 2,225 | 121,174 | ||||||
| Abercrombie & Fitch Co., Class A | 32,570 | 687,878 | ||||||
| American Eagle Outfitters, Inc. | 69,638 | 1,729,112 | ||||||
| America’s Car-Mart, Inc. * | 1,783 | 139,431 | ||||||
| Asbury Automotive Group, Inc. * | 1,588 | 109,175 | ||||||
| Ascena Retail Group, Inc. * | 62,021 | 283,436 | ||||||
| At Home Group, Inc. * | 24,177 | 762,301 | ||||||
| Boot Barn Holdings, Inc. * | 26,901 | 764,257 | ||||||
| Buckle, Inc. (The) (b) | 15,515 | 357,621 | ||||||
| Caleres, Inc. | 9,997 | 358,492 | ||||||
| Carvana Co. *(b) | 53,705 | 3,173,428 | ||||||
| Cato Corp. (The), Class A | 7,921 | 166,499 | ||||||
| Children’s Place, Inc. (The) | 880 | 112,464 | ||||||
| Citi Trends, Inc. | 7,878 | 226,650 | ||||||
| Conn’s, Inc. *(b) | 18,389 | 650,051 | ||||||
| Container Store Group, Inc. (The) * | 23,523 | 261,105 | ||||||
| DSW, Inc., Class A | 28,386 | 961,718 | ||||||
| Express, Inc. * | 24,057 | 266,070 | ||||||
| Five Below, Inc. * | 21,483 | 2,794,079 | ||||||
| Guess?, Inc. | 38,856 | 878,146 | ||||||
| Haverty Furniture Cos., Inc. | 6,653 | 147,031 | ||||||
| New York & Co., Inc. * | 50,685 | 195,644 | ||||||
| RH * | 9,077 | 1,189,178 | ||||||
| Shoe Carnival, Inc. | 8,029 | 309,117 | ||||||
| Tailored Brands, Inc. | 24,553 | 618,490 | ||||||
| Tilly’s, Inc., Class A | 29,207 | 553,473 | ||||||
| Zumiez, Inc. * | 15,186 | 400,151 | ||||||
|
| |||||||
| 18,216,171 | ||||||||
|
| |||||||
| Technology Hardware, Storage & Peripherals - 0.2% | ||||||||
| Cray, Inc. * | 8,425 | 181,137 | ||||||
| Immersion Corp. * | 12,745 | 134,715 | ||||||
| USA Technologies, Inc. * | 41,558 | 299,218 | ||||||
|
| |||||||
| 615,070 | ||||||||
|
| |||||||
| Textiles, Apparel & Luxury Goods - 1.8% | ||||||||
| Crocs, Inc. * | 38,424 | 818,047 | ||||||
| Culp, Inc. | 1,321 | 31,968 | ||||||
| INVESTMENTS | SHARES | VALUE | ||||||
| Textiles, Apparel & Luxury Goods - 1.8% (continued) | ||||||||
| Deckers Outdoor Corp. * | 11,503 | $ | 1,364,026 | |||||
| Fossil Group, Inc. * | 22,018 | 512,579 | ||||||
| G-III Apparel Group Ltd. * | 18,234 | 878,697 | ||||||
| Movado Group, Inc. | 11,417 | 478,372 | ||||||
| Oxford Industries, Inc. | 4,517 | 407,433 | ||||||
| Rocky Brands, Inc. | 9,865 | 279,180 | ||||||
| Steven Madden Ltd. | 4,272 | 225,989 | ||||||
| Unifi, Inc. * | 5,876 | 166,467 | ||||||
| Vera Bradley, Inc. * | 20,099 | 306,711 | ||||||
| Wolverine World Wide, Inc. | 26,007 | 1,015,573 | ||||||
|
| |||||||
| 6,485,042 | ||||||||
|
| |||||||
| Thrifts & Mortgage Finance - 1.1% | ||||||||
| Axos Financial, Inc. * | 16,999 | 584,596 | ||||||
| Federal Agricultural Mortgage Corp., Class C | 6,143 | 443,402 | ||||||
| First Defiance Financial Corp. | 6,000 | 180,660 | ||||||
| Flagstar Bancorp, Inc. * | 4,807 | 151,276 | ||||||
| LendingTree, Inc. *(b) | 1,292 | 297,289 | ||||||
| Meridian Bancorp, Inc. | 12,356 | 210,052 | ||||||
| Meta Financial Group, Inc. | 1,853 | 153,150 | ||||||
| NMI Holdings, Inc., Class A * | 31,611 | 715,989 | ||||||
| Northfield Bancorp, Inc. | 9,328 | 148,502 | ||||||
| Ocwen Financial Corp. * | 44,367 | 174,806 | ||||||
| PennyMac Financial Services, Inc., Class A | 9,506 | 198,675 | ||||||
| Walker & Dunlop, Inc. | 3,088 | 163,293 | ||||||
| Waterstone Financial, Inc. | 21,385 | 366,753 | ||||||
| WSFS Financial Corp. | 3,177 | 149,796 | ||||||
|
| |||||||
| 3,938,239 | ||||||||
|
| |||||||
| Tobacco - 0.2% | ||||||||
| 22nd Century Group, Inc. *(b) | 52,101 | 146,404 | ||||||
| Pyxus International, Inc. * | 12,268 | 282,164 | ||||||
| Turning Point Brands, Inc. | 10,547 | 437,278 | ||||||
|
| |||||||
| 865,846 | ||||||||
|
| |||||||
| Trading Companies & Distributors - 1.2% | ||||||||
| Applied Industrial Technologies, Inc. | 4,235 | 331,389 | ||||||
| BlueLinx Holdings, Inc. *(b) | 9,699 | 305,421 | ||||||
| CAI International, Inc. * | 5,049 | 115,471 | ||||||
| DXP Enterprises, Inc. * | 2,609 | 104,543 | ||||||
| GATX Corp. | 2,715 | 235,092 | ||||||
| H&E Equipment Services, Inc. | 12,691 | 479,466 | ||||||
| Herc Holdings, Inc. * | 7,990 | 409,088 | ||||||
| Kaman Corp. | 2,836 | 189,388 | ||||||
| Rush Enterprises, Inc., Class A | 3,660 | 143,875 | ||||||
| SiteOne Landscape Supply, Inc. * | 15,010 | 1,130,853 | ||||||
| Systemax, Inc. | 20,028 | 659,722 | ||||||
| Textainer Group Holdings Ltd. * | 11,721 | 150,029 | ||||||
| Titan Machinery, Inc. * | 10,563 | 163,568 | ||||||
|
| |||||||
| 4,417,905 | ||||||||
|
| |||||||
| Water Utilities - 0.1% | ||||||||
| American States Water Co. | 6,678 | 408,293 | ||||||
| Middlesex Water Co. | 2,990 | 144,776 | ||||||
|
| |||||||
| 553,069 | ||||||||
|
| |||||||
| The accompanying notes are an integral part of these financial statements. | (Continued) |
| AQR Funds | Annual Report | September 2018 | ||||||||||||||
110
Table of Contents
| Schedule of Investments | September 30, 2018 |
| AQR SMALL CAP MOMENTUM STYLE FUND |
| INVESTMENTS | SHARES | VALUE | ||||||
| Wireless Telecommunication Services - 0.4% | ||||||||
| Boingo Wireless, Inc. * | 23,279 | $ | 812,437 | |||||
| NII Holdings, Inc. *(b) | 103,634 | 607,295 | ||||||
| Shenandoah Telecommunications Co. | 5,532 | 214,365 | ||||||
|
| |||||||
| 1,634,097 | ||||||||
|
| |||||||
TOTAL COMMON STOCKS | 367,301,427 | |||||||
|
| |||||||
| NO. OF WARRANTS | ||||||||
| WARRANTS - 0.0% | ||||||||
| Diversified Consumer Services - 0.0% | ||||||||
| Education Management Corp., expiring 1/5/2022 (3)*(c) | ||||||||
(Cost $—) | 6,600 | — | ||||||
|
| |||||||
| SHARES | ||||||||
| SHORT-TERM INVESTMENTS - 1.0% | ||||||||
| Investment Companies - 1.0% | ||||||||
| Limited Purpose Cash Investment Fund, 2.06% (d) | ||||||||
(Cost $3,720,954) | 3,721,484 | 3,721,112 | ||||||
|
| |||||||
| SECURITIES LENDING COLLATERAL - 6.2% | ||||||||
| Investment Companies - 6.2% | ||||||||
| Investments in a Pooled Account through Securities Lending Program with Citibank NA | ||||||||
| BlackRock Liquidity Funds T-Fund Portfolio, Institutional Shares 1.97% (d)(e) | 2,802,351 | 2,802,351 | ||||||
| Limited Purpose Cash Investment Fund 2.06% (d)(e) | 20,108,551 | 20,106,540 | ||||||
|
| |||||||
TOTAL SECURITIES LENDING COLLATERAL | 22,908,891 | |||||||
|
| |||||||
TOTAL INVESTMENTS IN SECURITIES AT VALUE - 106.3% | 393,931,430 | |||||||
|
| |||||||
| LIABILITIES IN EXCESS OF OTHER ASSETS - (6.3)% (f) | (23,269,383) | |||||||
|
| |||||||
NET ASSETS - 100.0% |
| $ | 370,662,047 | |||||
|
| |||||||
| SECTOR | VALUE | % OF NET ASSETS | ||||||
| Communication Services | $ | 13,523,184 | 3.6 | % | ||||
| Consumer Discretionary | 64,049,288 | 17.3 | ||||||
| Consumer Staples | 9,858,697 | 2.7 | ||||||
| Energy | 19,930,620 | 5.4 | ||||||
| Financials | 34,805,730 | 9.4 | ||||||
| Health Care | 94,405,585 | 25.4 | ||||||
| Industrials | 57,178,607 | 15.4 | ||||||
| Information Technology | 54,851,309 | 14.8 | ||||||
| Materials | 10,673,295 | 2.9 | ||||||
| Real Estate | 6,853,587 | 1.9 | ||||||
| Utilities | 1,171,525 | 0.3 | ||||||
| Short-Term Investments | 3,721,112 | 1.0 | ||||||
| Securities Lending Collateral | 22,908,891 | 6.2 | ||||||
|
|
|
| |||||
Total Investments In Securities | 393,931,430 | 106.3 | ||||||
| Liabilities in Excess of Other Assets (f) | (23,269,383 | ) | (6.3 | ) | ||||
|
|
|
| |||||
Net Assets | $ | 370,662,047 | 100.0 | % | ||||
|
|
|
| |||||
All securities are United States companies, unless noted otherwise in parentheses.
| * | Non-income producing security. |
| (a) | Represents less than 0.05% of net assets. |
| (b) | The security or a portion of this security is on loan at September 30, 2018. The total value of securities on loan at September 30, 2018 was $22,135,678. |
| (c) | Security fair valued as of September 30, 2018 in accordance with procedures approved by the Board of Trustees. Total value of all such securities at September 30, 2018 amounted to $0, which represents approximately 0.00% of net assets of the fund. |
| (d) | Represents 7-day effective yield as of September 30, 2018. |
| (e) | Represents security, or portion thereof, purchased with the cash collateral received for securities on loan. |
| (f) | Includes appreciation/(depreciation) on futures contracts. |
All securities are Level 1 with respect to ASC 820, unless otherwise noted in parentheses.
| (3) | Level 3 security (See Note 4). |
Abbreviations
| CVR | - Contingent Value Rights |
| The accompanying notes are an integral part of these financial statements. | (Continued) |
| AQR Funds | Annual Report | September 2018 | ||||||||||||||
111
Table of Contents
| Schedule of Investments | September 30, 2018 |
| AQR SMALL CAP MOMENTUM STYLE FUND |
Futures contracts outstanding as of September 30, 2018:
Exchange Traded
| DESCRIPTION | NUMBER OF CONTRACTS | EXPIRATION DATE | TRADING CURRENCY | NOTIONAL AMOUNT | VALUE AND UNREALIZED APPRECIATION (DEPRECIATION) | |||||||||||
| Long Contracts | ||||||||||||||||
| Russell 2000 E-Mini Index | 5 | 12/2018 | USD | $425,200 | $(2,170 | ) | ||||||||||
|
| |||||||||||||||
| $(2,170 | ) | |||||||||||||||
|
| |||||||||||||||
USD - United States Dollar
Collateral pledged to, or (received from), each counterparty at September 30, 2018 was as follows:
| COUNTERPARTY | OVER THE COUNTER | EXCHANGE TRADED | TOTAL | |||||||||
| BARC | ||||||||||||
| Cash | $— | $ 22,553 | $ 22,553 | |||||||||
| ||||||||||||
| The accompanying notes are an integral part of these financial statements. |
| AQR Funds | Annual Report | September 2018 | ||||||||||||||
112
Table of Contents
| Schedule of Investments | September 30, 2018 |
| AQR INTERNATIONAL MOMENTUM STYLE FUND |
| INVESTMENTS | SHARES | VALUE | ||||||
| COMMON STOCKS - 96.2% | ||||||||
| Australia - 6.0% | ||||||||
| AGL Energy Ltd. | 23,781 | $ | 335,463 | |||||
| Alumina Ltd. | 402,987 | 806,712 | ||||||
| Aristocrat Leisure Ltd. | 68,194 | 1,400,497 | ||||||
| ASX Ltd. | 8,860 | 407,532 | ||||||
| AusNet Services | 141,964 | 166,753 | ||||||
| BHP Billiton plc | 51,896 | 1,132,453 | ||||||
| BlueScope Steel Ltd. | 36,604 | 448,939 | ||||||
| Boral Ltd. | 33,886 | 169,150 | ||||||
| Caltex Australia Ltd. | 14,322 | 309,410 | ||||||
| Challenger Ltd. | 16,050 | 129,867 | ||||||
| CIMIC Group Ltd. | 16,147 | 599,299 | ||||||
| Cochlear Ltd. | 6,051 | 877,371 | ||||||
| Computershare Ltd. | 50,863 | 732,488 | ||||||
| CSL Ltd. | 31,534 | 4,581,872 | ||||||
| Flight Centre Travel Group Ltd. | 14,095 | 541,273 | ||||||
| Goodman Group, REIT | 93,982 | 705,014 | ||||||
| Incitec Pivot Ltd. | 54,550 | 156,845 | ||||||
| Insurance Australia Group Ltd. | 115,133 | 608,675 | ||||||
| Macquarie Group Ltd. | 22,135 | 2,013,585 | ||||||
| Medibank Pvt Ltd. | 92,539 | 194,584 | ||||||
| Mirvac Group, REIT | 109,763 | 191,317 | ||||||
| Oil Search Ltd. | 57,455 | 375,291 | ||||||
| Orica Ltd. | 12,346 | 151,866 | ||||||
| Origin Energy Ltd. * | 197,617 | 1,177,926 | ||||||
| REA Group Ltd. | 7,651 | 474,687 | ||||||
| Rio Tinto plc | 66,351 | 3,346,848 | ||||||
| Santos Ltd. | 158,262 | 830,905 | ||||||
| SEEK Ltd. | 8,938 | 133,830 | ||||||
| South32 Ltd. | 212,200 | 596,347 | ||||||
| Treasury Wine Estates Ltd. | 92,617 | 1,169,004 | ||||||
| Wesfarmers Ltd. | 52,484 | 1,889,908 | ||||||
| Woodside Petroleum Ltd. | 24,668 | 688,160 | ||||||
|
| |||||||
| 27,343,871 | ||||||||
|
| |||||||
| Austria - 0.6% | ||||||||
| ANDRITZ AG | 6,457 | 376,607 | ||||||
| Erste Group Bank AG * | 4,956 | 205,757 | ||||||
| OMV AG | 27,902 | 1,565,275 | ||||||
| Raiffeisen Bank International AG | 12,211 | 351,451 | ||||||
|
| |||||||
| 2,499,090 | ||||||||
|
| |||||||
| Belgium - 0.7% | ||||||||
| Ageas | 18,084 | 972,172 | ||||||
| Colruyt SA | 2,172 | 122,918 | ||||||
| Groupe Bruxelles Lambert SA | 2,194 | 229,982 | ||||||
| Solvay SA | 983 | 131,775 | ||||||
| UCB SA | 2,732 | 245,508 | ||||||
| Umicore SA | 26,644 | 1,488,293 | ||||||
|
| |||||||
| 3,190,648 | ||||||||
|
| |||||||
| Canada - 9.5% | ||||||||
| Bank of Montreal (1) | 7,496 | 618,297 | ||||||
| BlackBerry Ltd. (1)* | 22,716 | 257,119 | ||||||
| Bombardier, Inc., Class B (1)* | 334,482 | 1,191,203 | ||||||
| Brookfield Asset Management, Inc., Class A (1) | 12,260 | 545,680 | ||||||
| CAE, Inc. (1) | 24,149 | 490,215 | ||||||
| Canadian Imperial Bank of Commerce (1) | 17,662 | 1,654,962 | ||||||
| INVESTMENTS | SHARES | VALUE | ||||||
| Canada - 9.5% (continued) | ||||||||
| Canadian National Railway Co. (1) | 10,646 | $ | 955,268 | |||||
| Canadian Natural Resources Ltd. (1) | 83,188 | 2,717,868 | ||||||
| Canadian Pacific Railway Ltd. (1) | 8,508 | 1,799,745 | ||||||
| Canadian Tire Corp. Ltd., Class A (1) | 4,986 | 584,199 | ||||||
| CCL Industries, Inc., Class B (1) | 6,024 | 271,527 | ||||||
| Cenovus Energy, Inc. (1) | 76,875 | 771,934 | ||||||
| CGI Group, Inc., Class A (1)* | 17,600 | 1,134,772 | ||||||
| Constellation Software, Inc. (1) | 2,165 | 1,592,125 | ||||||
| Dollarama, Inc. (1) | 40,695 | 1,281,988 | ||||||
| Empire Co. Ltd., Class A (1) | 29,872 | 544,410 | ||||||
| Encana Corp. (1) | 65,681 | 860,898 | ||||||
| Fairfax Financial Holdings Ltd. (1) | 1,335 | 725,292 | ||||||
| Finning International, Inc. (1)(a) | 15,923 | 388,937 | ||||||
| Fortis, Inc. (1) | 5,586 | 181,118 | ||||||
| Husky Energy, Inc. (1) | 28,988 | 508,998 | ||||||
| Imperial Oil Ltd. (1)(a) | 23,654 | 765,484 | ||||||
| International Petroleum Corp. * | 14,226 | 92,775 | ||||||
| Magna International, Inc. (1) | 29,181 | 1,532,869 | ||||||
| Manulife Financial Corp. (1) | 16,003 | 286,075 | ||||||
| Methanex Corp. (1) | 9,135 | 721,097 | ||||||
| National Bank of Canada (1) | 21,351 | 1,066,352 | ||||||
| Nutrien Ltd. (1) | 35,235 | 2,034,472 | ||||||
| Onex Corp. (1) | 2,666 | 182,315 | ||||||
| Open Text Corp. (1) | 4,828 | 183,716 | ||||||
| Pembina Pipeline Corp. (1) | 11,754 | 399,398 | ||||||
| Restaurant Brands International, Inc. (1) | 8,288 | 490,741 | ||||||
| Rogers Communications, Inc., Class B (1) | 16,748 | 861,355 | ||||||
| Shopify, Inc., Class A (1)* | 13,287 | 2,183,897 | ||||||
| Sun Life Financial, Inc. (1) | 24,189 | 961,642 | ||||||
| Suncor Energy, Inc. (1) | 134,928 | 5,220,999 | ||||||
| Teck Resources Ltd., Class B (1) | 17,790 | 428,756 | ||||||
| Toronto-Dominion Bank (The) (1) | 90,739 | 5,513,959 | ||||||
| West Fraser Timber Co. Ltd. (1) | 10,381 | 590,800 | ||||||
| WSP Global, Inc. (1) | 10,798 | 590,958 | ||||||
|
| |||||||
| 43,184,215 | ||||||||
|
| |||||||
| Chile - 0.1% | ||||||||
| Antofagasta plc | 22,791 | 253,262 | ||||||
|
| |||||||
| China - 0.1% | ||||||||
| BOC Hong Kong Holdings Ltd. | 67,500 | 320,376 | ||||||
| Minth Group Ltd. | 38,000 | 156,335 | ||||||
|
| |||||||
| 476,711 | ||||||||
|
| |||||||
| Denmark - 1.8% | ||||||||
| Carlsberg A/S, Class B | 5,330 | 639,201 | ||||||
| Chr Hansen Holding A/S | 9,055 | 918,047 | ||||||
| Coloplast A/S, Class B | 3,571 | 364,797 | ||||||
| DSV A/S | 21,347 | 1,939,815 | ||||||
| H Lundbeck A/S | 6,229 | 384,506 | ||||||
| Novo Nordisk A/S, Class B | 20,026 | 942,525 | ||||||
| Novozymes A/S, Class B | 5,348 | 293,330 | ||||||
| Orsted A/S (b) | 24,922 | 1,693,523 | ||||||
| Tryg A/S | 15,092 | 375,805 | ||||||
| William Demant Holding A/S * | 16,574 | 622,161 | ||||||
|
| |||||||
| 8,173,710 | ||||||||
|
| |||||||
| Finland - 1.3% | ||||||||
| Fortum OYJ | 53,182 | 1,332,813 | ||||||
| Neste OYJ | 14,615 | 1,204,647 | ||||||
| The accompanying notes are an integral part of these financial statements. | (Continued) |
| AQR Funds | Annual Report | September 2018 | ||||||||||||||
113
Table of Contents
| Schedule of Investments | September 30, 2018 |
| AQR INTERNATIONAL MOMENTUM STYLE FUND |
| INVESTMENTS | SHARES | VALUE | ||||||
| Finland - 1.3% (continued) | ||||||||
| Stora Enso OYJ, Class R | 60,118 | $ | 1,148,021 | |||||
| UPM-Kymmene OYJ | 48,553 | 1,904,198 | ||||||
| Wartsila OYJ Abp | 9,217 | 179,360 | ||||||
|
| |||||||
| 5,769,039 | ||||||||
|
| |||||||
| France - 9.7% | ||||||||
| Accor SA | 3,636 | 186,788 | ||||||
| Aeroports de Paris | 624 | 140,494 | ||||||
| Air Liquide SA | 3,179 | 417,473 | ||||||
| Airbus SE | 33,677 | 4,227,902 | ||||||
| AXA SA | 23,258 | 623,214 | ||||||
| BNP Paribas SA | 21,264 | 1,302,135 | ||||||
| Bouygues SA | 5,122 | 221,580 | ||||||
| Capgemini SE | 10,168 | 1,280,129 | ||||||
| Cie Generale des Etablissements Michelin SCA | 4,645 | 554,408 | ||||||
| CNP Assurances | 10,550 | 254,315 | ||||||
| Credit Agricole SA | 63,552 | 913,559 | ||||||
| Danone SA | 2,756 | 214,183 | ||||||
| Dassault Systemes SE | 13,270 | 1,985,688 | ||||||
| Edenred | 9,804 | 373,606 | ||||||
| Electricite de France SA | 28,185 | 495,686 | ||||||
| Essilor International Cie Generale d’Optique SA | 4,465 | 660,908 | ||||||
| Faurecia SA | 2,551 | 153,417 | ||||||
| Hermes International | 2,446 | 1,620,534 | ||||||
| Ipsen SA | 4,868 | 819,542 | ||||||
| Kering SA | 5,908 | 3,168,785 | ||||||
| Legrand SA | 2,988 | 217,874 | ||||||
| L’Oreal SA | 2,369 | 571,136 | ||||||
| LVMH Moet Hennessy Louis Vuitton SE | 16,345 | 5,775,849 | ||||||
| Natixis SA | 69,229 | 470,125 | ||||||
| Orange SA | 33,131 | 527,168 | ||||||
| Pernod Ricard SA | 4,394 | 720,650 | ||||||
| Peugeot SA | 17,342 | 467,813 | ||||||
| Safran SA | 10,025 | 1,403,741 | ||||||
| Sanofi | 1,956 | 174,763 | ||||||
| Schneider Electric SE | 10,401 | 835,169 | ||||||
| SCOR SE | 9,686 | 449,058 | ||||||
| SEB SA | 1,036 | 176,210 | ||||||
| Sodexo SA | 3,300 | 349,954 | ||||||
| Thales SA | 10,010 | 1,422,228 | ||||||
| TOTAL SA | 95,885 | 6,234,516 | ||||||
| Ubisoft Entertainment SA * | 4,740 | 511,829 | ||||||
| Valeo SA | 12,850 | 556,416 | ||||||
| Veolia Environnement SA | 28,559 | 569,884 | ||||||
| Vinci SA | 20,644 | 1,964,066 | ||||||
| Vivendi SA | 30,525 | 785,013 | ||||||
|
| |||||||
| 43,797,808 | ||||||||
|
| |||||||
| Germany - 5.5% | ||||||||
| 1&1 Drillisch AG (a) | 3,752 | 182,392 | ||||||
| adidas AG | 8,848 | 2,163,863 | ||||||
| Allianz SE (Registered) | 2,875 | 639,879 | ||||||
| Axel Springer SE | 6,231 | 418,903 | ||||||
| Continental AG | 1,139 | 197,895 | ||||||
| Covestro AG (b) | 14,697 | 1,189,682 | ||||||
| Deutsche Boerse AG | 13,082 | 1,749,151 | ||||||
| Deutsche Wohnen SE | 32,446 | 1,558,436 | ||||||
| INVESTMENTS | SHARES | VALUE | ||||||
| Germany - 5.5% (continued) | ||||||||
| E.ON SE | 175,101 | $ | 1,781,783 | |||||
| Fraport AG Frankfurt Airport Services Worldwide | 6,432 | 567,830 | ||||||
| Hannover Rueck SE | 3,094 | 436,713 | ||||||
| HOCHTIEF AG | 2,782 | 461,187 | ||||||
| HUGO BOSS AG | 5,863 | 451,070 | ||||||
| Infineon Technologies AG | 70,020 | 1,593,366 | ||||||
| KION Group AG | 2,705 | 166,090 | ||||||
| LANXESS AG | 4,094 | 299,470 | ||||||
| MTU Aero Engines AG | 4,451 | 1,002,716 | ||||||
| Puma SE | 1,223 | 603,435 | ||||||
| RWE AG | 39,136 | 966,244 | ||||||
| SAP SE | 17,845 | 2,194,286 | ||||||
| Symrise AG | 4,626 | 421,793 | ||||||
| United Internet AG (Registered) | 12,079 | 571,094 | ||||||
| Volkswagen AG | 1,135 | 197,350 | ||||||
| Vonovia SE | 43,455 | 2,125,306 | ||||||
| Wirecard AG | 13,385 | 2,895,834 | ||||||
| Zalando SE *(b) | 6,250 | 242,864 | ||||||
|
| |||||||
| 25,078,632 | ||||||||
|
| |||||||
| Hong Kong - 3.9% | ||||||||
| AIA Group Ltd. | 561,400 | 5,005,959 | ||||||
| ASM Pacific Technology Ltd. | 12,100 | 123,648 | ||||||
| Bank of East Asia Ltd. (The) | 38,600 | 143,650 | ||||||
| CK Asset Holdings Ltd. | 99,500 | 745,871 | ||||||
| CLP Holdings Ltd. | 27,500 | 322,045 | ||||||
| Galaxy Entertainment Group Ltd. | 203,000 | 1,282,368 | ||||||
| Hang Lung Properties Ltd. | 113,000 | 220,439 | ||||||
| Hang Seng Bank Ltd. | 47,300 | 1,283,438 | ||||||
| Henderson Land Development Co. Ltd. | 77,000 | 386,699 | ||||||
| Hong Kong & China Gas Co. Ltd. | 342,723 | 679,294 | ||||||
| Hong Kong Exchanges & Clearing Ltd. | 55,900 | 1,597,320 | ||||||
| Hysan Development Co. Ltd. | 54,000 | 272,704 | ||||||
| Kerry Properties Ltd. | 70,500 | 239,386 | ||||||
| Kingston Financial Group Ltd. | 114,000 | 30,368 | ||||||
| Li & Fung Ltd. | 892,000 | 199,807 | ||||||
| Link REIT | 158,500 | 1,560,584 | ||||||
| MTR Corp. Ltd. | 46,500 | 244,540 | ||||||
| New World Development Co. Ltd. | 374,000 | 507,977 | ||||||
| NWS Holdings Ltd. | 109,000 | 215,453 | ||||||
| PCCW Ltd. | 302,000 | 175,955 | ||||||
| Power Assets Holdings Ltd. | 27,500 | 191,151 | ||||||
| Shangri-La Asia Ltd. | 180,000 | 266,421 | ||||||
| Sino Land Co. Ltd. | 134,000 | 229,570 | ||||||
| Sun Hung Kai Properties Ltd. | 24,000 | 348,293 | ||||||
| Techtronic Industries Co. Ltd. | 152,000 | 969,561 | ||||||
| WH Group Ltd. (b) | 179,500 | 126,019 | ||||||
| Wharf Real Estate Investment Co. Ltd. | 26,000 | 167,506 | ||||||
| Wheelock & Co. Ltd. | 40,000 | 240,485 | ||||||
|
| |||||||
| 17,776,511 | ||||||||
|
| |||||||
| Italy - 1.7% | ||||||||
| Assicurazioni Generali SpA | 30,202 | 520,074 | ||||||
| Davide Campari-Milano SpA | 36,647 | 312,075 | ||||||
| Enel SpA | 449,173 | 2,295,959 | ||||||
| Eni SpA | 115,682 | 2,180,557 | ||||||
| Ferrari NV | 13,970 | 1,918,868 | ||||||
| Moncler SpA | 14,620 | 629,061 | ||||||
|
| |||||||
| 7,856,594 | ||||||||
|
| |||||||
| The accompanying notes are an integral part of these financial statements. | (Continued) |
| AQR Funds | Annual Report | September 2018 | ||||||||||||||
114
Table of Contents
| Schedule of Investments | September 30, 2018 |
| AQR INTERNATIONAL MOMENTUM STYLE FUND |
| INVESTMENTS | SHARES | VALUE | ||||||
| Japan - 28.9% | ||||||||
| Aeon Co. Ltd. | 47,500 | $ | 1,144,527 | |||||
| Aeon Mall Co. Ltd. | 10,300 | 176,827 | ||||||
| Alfresa Holdings Corp. | 12,600 | 337,501 | ||||||
| ANA Holdings, Inc. (a) | 34,800 | 1,215,723 | ||||||
| Asahi Group Holdings Ltd. | 38,000 | 1,648,716 | ||||||
| Asahi Kasei Corp. | 102,400 | 1,552,599 | ||||||
| Astellas Pharma, Inc. | 120,000 | 2,095,557 | ||||||
| Bandai Namco Holdings, Inc. | 9,500 | 369,083 | ||||||
| Bank of Kyoto Ltd. (The) | 5,600 | 292,301 | ||||||
| Benesse Holdings, Inc. | 11,300 | 321,773 | ||||||
| Brother Industries Ltd. | 8,200 | 161,911 | ||||||
| Canon, Inc. | 23,700 | 751,517 | ||||||
| Central Japan Railway Co. | 8,500 | 1,769,682 | ||||||
| Chiba Bank Ltd. (The) | 44,100 | 301,183 | ||||||
| Chubu Electric Power Co., Inc. | 8,800 | 133,302 | ||||||
| Chugai Pharmaceutical Co. Ltd. | 25,000 | 1,607,083 | ||||||
| Coca-Cola Bottlers Japan Holdings, Inc. | 10,900 | 291,731 | ||||||
| CyberAgent, Inc. | 14,500 | 771,642 | ||||||
| Daifuku Co. Ltd. | 16,400 | 835,820 | ||||||
| Dai-ichi Life Holdings, Inc. | 6,900 | 143,833 | ||||||
| Daiichi Sankyo Co. Ltd. | 53,200 | 2,306,109 | ||||||
| Daikin Industries Ltd. | 5,900 | 785,311 | ||||||
| Daito Trust Construction Co. Ltd. | 1,600 | 206,186 | ||||||
| Daiwa House Industry Co. Ltd. | 18,900 | 560,079 | ||||||
| Denso Corp. | 22,100 | 1,167,498 | ||||||
| Disco Corp. | 800 | 133,970 | ||||||
| Don Quijote Holdings Co. Ltd. | 10,700 | 541,459 | ||||||
| Eisai Co. Ltd. | 20,400 | 1,987,311 | ||||||
| FANUC Corp. | 1,000 | 188,133 | ||||||
| Fast Retailing Co. Ltd. | 3,900 | 1,975,735 | ||||||
| Fuji Electric Co. Ltd. | 12,200 | 488,694 | ||||||
| Fukuoka Financial Group, Inc. | 5,600 | 154,003 | ||||||
| Hamamatsu Photonics KK | 7,000 | 278,786 | ||||||
| Hikari Tsushin, Inc. | 3,600 | 711,481 | ||||||
| Hisamitsu Pharmaceutical Co., Inc. | 8,000 | 613,538 | ||||||
| Hitachi Construction Machinery Co. Ltd. | 20,500 | 685,359 | ||||||
| Hitachi High-Technologies Corp. | 4,500 | 155,377 | ||||||
| Hitachi Ltd. | 39,600 | 1,346,069 | ||||||
| Honda Motor Co. Ltd. | 65,800 | 1,981,650 | ||||||
| Hoya Corp. | 3,900 | 231,625 | ||||||
| Hulic Co. Ltd. | 19,900 | 195,276 | ||||||
| Idemitsu Kosan Co. Ltd. | 7,300 | 386,495 | ||||||
| Inpex Corp. | 60,700 | 758,419 | ||||||
| Isuzu Motors Ltd. | 11,200 | 176,563 | ||||||
| ITOCHU Corp. | 109,900 | 2,011,511 | ||||||
| J Front Retailing Co. Ltd. (a) | 12,600 | 195,418 | ||||||
| Japan Airlines Co. Ltd. | 10,100 | 363,015 | ||||||
| Japan Airport Terminal Co. Ltd. | 2,900 | 131,922 | ||||||
| JFE Holdings, Inc. | 32,300 | 740,960 | ||||||
| JGC Corp. (a) | 17,300 | 396,707 | ||||||
| JSR Corp. | 11,400 | 212,824 | ||||||
| JXTG Holdings, Inc. | 276,100 | 2,088,364 | ||||||
| Kajima Corp. | 18,000 | 261,730 | ||||||
| Kakaku.com, Inc. | 12,400 | 242,271 | ||||||
| Kamigumi Co. Ltd. | 9,000 | 198,384 | ||||||
| Kaneka Corp. | 4,200 | 194,028 | ||||||
| Kansai Electric Power Co., Inc. (The) | 18,000 | 271,692 | ||||||
| Kao Corp. | 33,500 | 2,706,056 | ||||||
| INVESTMENTS | SHARES | VALUE | ||||||
| Japan - 28.9% (continued) | ||||||||
| Keisei Electric Railway Co. Ltd. | 12,000 | $ | 422,373 | |||||
| Keyence Corp. | 5,380 | 3,125,172 | ||||||
| Kikkoman Corp. | 14,300 | 851,660 | ||||||
| Kirin Holdings Co. Ltd. | 75,500 | 1,936,419 | ||||||
| Kobayashi Pharmaceutical Co. Ltd. | 4,100 | 301,846 | ||||||
| Koito Manufacturing Co. Ltd. | 10,500 | 689,502 | ||||||
| Komatsu Ltd. | 38,000 | 1,156,374 | ||||||
| Konami Holdings Corp. | 4,800 | 187,950 | ||||||
| Kose Corp. | 5,300 | 1,009,891 | ||||||
| Kurita Water Industries Ltd. | 6,600 | 192,273 | ||||||
| Kyowa Hakko Kirin Co. Ltd. | 17,300 | 324,626 | ||||||
| Kyushu Electric Power Co., Inc. | 16,200 | 195,809 | ||||||
| Lion Corp. | 9,500 | 210,992 | ||||||
| M3, Inc. | 37,800 | 857,243 | ||||||
| Makita Corp. | 12,500 | 625,952 | ||||||
| Marubeni Corp. | 68,200 | 623,731 | ||||||
| Marui Group Co. Ltd. | 29,200 | 720,477 | ||||||
| McDonald’s Holdings Co. Japan Ltd. | 12,900 | 566,508 | ||||||
| Medipal Holdings Corp. | 8,800 | 183,848 | ||||||
| MINEBEA MITSUMI, Inc. | 26,000 | 471,269 | ||||||
| MISUMI Group, Inc. | 18,600 | 481,266 | ||||||
| Mitsubishi Chemical Holdings Corp. | 53,200 | 509,155 | ||||||
| Mitsubishi Corp. | 89,500 | 2,756,845 | ||||||
| Mitsubishi Gas Chemical Co., Inc. | 20,900 | 444,919 | ||||||
| Mitsubishi Motors Corp. | 64,500 | 455,661 | ||||||
| Mitsubishi Tanabe Pharma Corp. | 8,700 | 145,609 | ||||||
| Mitsui & Co. Ltd. | 93,000 | 1,652,672 | ||||||
| Mitsui Chemicals, Inc. | 7,700 | 192,539 | ||||||
| Mitsui OSK Lines Ltd. | 6,300 | 183,838 | ||||||
| Nabtesco Corp. | 8,100 | 215,363 | ||||||
| Nexon Co. Ltd. * | 62,600 | 818,276 | ||||||
| NGK Spark Plug Co. Ltd. | 9,400 | 274,006 | ||||||
| Nidec Corp. | 19,700 | 2,832,778 | ||||||
| Nikon Corp. | 7,900 | 148,451 | ||||||
| Nintendo Co. Ltd. | 3,300 | 1,200,650 | ||||||
| Nippon Express Co. Ltd. | 8,800 | 577,928 | ||||||
| Nippon Paint Holdings Co. Ltd. | 3,500 | 130,641 | ||||||
| Nippon Telegraph & Telephone Corp. | 5,600 | 252,730 | ||||||
| Nissan Chemical Corp. | 10,300 | 544,051 | ||||||
| Nisshin Seifun Group, Inc. | 21,700 | 475,895 | ||||||
| Nissin Foods Holdings Co. Ltd. | 3,400 | 233,876 | ||||||
| Nitori Holdings Co. Ltd. | 4,700 | 673,538 | ||||||
| Nomura Real Estate Holdings, Inc. | 12,500 | 252,160 | ||||||
| Nomura Real Estate Master Fund, Inc., REIT | 123 | 168,156 | ||||||
| Nomura Research Institute Ltd. | 13,000 | 656,474 | ||||||
| NTT DOCOMO, Inc. | 30,800 | 827,829 | ||||||
| Obic Co. Ltd. | 8,700 | 822,861 | ||||||
| Oji Holdings Corp. | 66,000 | 479,289 | ||||||
| Omron Corp. | 12,500 | 528,222 | ||||||
| Ono Pharmaceutical Co. Ltd. | 9,300 | 263,250 | ||||||
| Oracle Corp. Japan | 5,800 | 467,319 | ||||||
| Oriental Land Co. Ltd. | 18,700 | 1,955,179 | ||||||
| Otsuka Corp. | 18,400 | 686,321 | ||||||
| Otsuka Holdings Co. Ltd. | 5,600 | 282,459 | ||||||
| Panasonic Corp. | 36,700 | 425,398 | ||||||
| Persol Holdings Co. Ltd. | 22,300 | 523,393 | ||||||
| Pola Orbis Holdings, Inc. | 20,400 | 745,073 | ||||||
| Recruit Holdings Co. Ltd. | 93,300 | 3,116,358 | ||||||
| The accompanying notes are an integral part of these financial statements. | (Continued) |
| AQR Funds | Annual Report | September 2018 | ||||||||||||||
115
Table of Contents
| Schedule of Investments | September 30, 2018 |
| AQR INTERNATIONAL MOMENTUM STYLE FUND |
| INVESTMENTS | SHARES | VALUE | ||||||
| Japan - 28.9% (continued) | ||||||||
| Resona Holdings, Inc. | 22,900 | $ | 128,571 | |||||
| Rohm Co. Ltd. | 6,700 | 490,173 | ||||||
| Ryohin Keikaku Co. Ltd. | 2,700 | 802,546 | ||||||
| Sankyo Co. Ltd. | 3,400 | 133,006 | ||||||
| Santen Pharmaceutical Co. Ltd. | 17,300 | 274,306 | ||||||
| Sega Sammy Holdings, Inc. | 13,200 | 194,638 | ||||||
| Sekisui Chemical Co. Ltd. | 8,700 | 160,437 | ||||||
| Shimadzu Corp. | 27,100 | 849,250 | ||||||
| Shin-Etsu Chemical Co. Ltd. | 3,600 | 318,270 | ||||||
| Shiseido Co. Ltd. | 35,400 | 2,741,657 | ||||||
| SMC Corp. | 1,000 | 320,071 | ||||||
| Sony Corp. | 84,200 | 5,118,324 | ||||||
| Stanley Electric Co. Ltd. | 11,500 | 393,158 | ||||||
| SUMCO Corp. | 29,900 | 435,572 | ||||||
| Sumitomo Chemical Co. Ltd. | 29,000 | 169,718 | ||||||
| Sumitomo Corp. | 81,900 | 1,364,883 | ||||||
| Sumitomo Dainippon Pharma Co. Ltd. | 13,400 | 307,751 | ||||||
| Sumitomo Metal Mining Co. Ltd. | 22,300 | 781,935 | ||||||
| Sumitomo Mitsui Financial Group, Inc. | 7,500 | 301,829 | ||||||
| Sumitomo Mitsui Trust Holdings, Inc. | 8,300 | 341,516 | ||||||
| Sumitomo Realty & Development Co. Ltd. | 25,000 | 896,862 | ||||||
| Sundrug Co. Ltd. | 10,100 | 360,393 | ||||||
| Suzuken Co. Ltd. | 4,800 | 227,756 | ||||||
| Suzuki Motor Corp. | 30,800 | 1,765,183 | ||||||
| Sysmex Corp. | 11,900 | 1,026,178 | ||||||
| Taiheiyo Cement Corp. | 5,200 | 163,087 | ||||||
| Taisei Corp. | 19,700 | 897,992 | ||||||
| Taisho Pharmaceutical Holdings Co. Ltd. | 4,300 | 526,036 | ||||||
| TDK Corp. | 10,000 | 1,089,592 | ||||||
| Terumo Corp. | 27,000 | 1,597,970 | ||||||
| Tobu Railway Co. Ltd. | 7,400 | 218,777 | ||||||
| Toho Co. Ltd. | 5,500 | 172,743 | ||||||
| Tokio Marine Holdings, Inc. | 27,700 | 1,375,127 | ||||||
| Tokyo Century Corp. | 3,900 | 242,232 | ||||||
| Tokyo Electric Power Co. Holdings, Inc. * | 27,400 | 134,646 | ||||||
| Tokyo Electron Ltd. | 11,400 | 1,571,153 | ||||||
| Tokyu Fudosan Holdings Corp. | 41,100 | 286,341 | ||||||
| TOTO Ltd. | 14,000 | 580,641 | ||||||
| Toyoda Gosei Co. Ltd. | 7,500 | 185,222 | ||||||
| Toyota Motor Corp. | 138,300 | 8,616,478 | ||||||
| Toyota Tsusho Corp. | 14,300 | 539,922 | ||||||
| Trend Micro, Inc. | 13,100 | 842,641 | ||||||
| Tsuruha Holdings, Inc. | 4,100 | 504,668 | ||||||
| Unicharm Corp. | 15,900 | 526,062 | ||||||
| USS Co. Ltd. | 10,400 | 193,064 | ||||||
| West Japan Railway Co. | 6,900 | 480,996 | ||||||
| Yakult Honsha Co. Ltd. | 6,700 | 549,471 | ||||||
| Yamaha Corp. | 18,400 | 974,977 | ||||||
| Yamaha Motor Co. Ltd. | 11,400 | 319,688 | ||||||
| Yamato Holdings Co. Ltd. | 26,800 | 822,868 | ||||||
| Yaskawa Electric Corp. | 26,100 | 775,199 | ||||||
| Yokogawa Electric Corp. | 8,500 | 179,800 | ||||||
| Yokohama Rubber Co. Ltd. (The) | 9,400 | 202,608 | ||||||
| ZOZO, Inc. | 17,000 | 514,244 | ||||||
|
| |||||||
| 130,994,890 | ||||||||
|
| |||||||
| Luxembourg - 0.3% | ||||||||
| ArcelorMittal | 19,959 | 619,653 | ||||||
| Tenaris SA | 30,729 | 514,632 | ||||||
|
| |||||||
| 1,134,285 | ||||||||
|
| |||||||
| INVESTMENTS | SHARES | VALUE | ||||||
| Macau - 0.4% | ||||||||
| MGM China Holdings Ltd. | 159,600 | $ | 251,969 | |||||
| Sands China Ltd. | 147,200 | 662,918 | ||||||
| SJM Holdings Ltd. | 174,000 | 160,317 | ||||||
| Wynn Macau Ltd. | 264,000 | 606,301 | ||||||
|
| |||||||
| 1,681,505 | ||||||||
|
| |||||||
| Mongolia - 0.0% (c) | ||||||||
| Turquoise Hill Resources Ltd. (1)* | 13,990 | 29,786 | ||||||
|
| |||||||
| Netherlands - 7.1% | ||||||||
| Aegon NV | 85,975 | 558,024 | ||||||
| Akzo Nobel NV | 3,899 | 364,725 | ||||||
| ASML Holding NV | 30,741 | 5,771,764 | ||||||
| EXOR NV | 10,102 | 674,013 | ||||||
| Koninklijke Ahold Delhaize NV | 48,978 | 1,123,679 | ||||||
| Koninklijke DSM NV | 16,751 | 1,774,154 | ||||||
| Koninklijke Philips NV | 54,923 | 2,503,472 | ||||||
| Koninklijke Vopak NV | 2,561 | 126,171 | ||||||
| NN Group NV | 24,467 | 1,092,022 | ||||||
| Royal Dutch Shell plc, Class A | 485,334 | 16,641,358 | ||||||
| Wolters Kluwer NV | 26,159 | 1,630,750 | ||||||
|
| |||||||
| 32,260,132 | ||||||||
|
| |||||||
| Norway - 1.4% | ||||||||
| Equinor ASA | 166,139 | 4,671,209 | ||||||
| Marine Harvest ASA | 26,393 | 611,578 | ||||||
| Telenor ASA | 48,326 | 945,045 | ||||||
|
| |||||||
| 6,227,832 | ||||||||
|
| |||||||
| Portugal - 0.3% | ||||||||
| Galp Energia SGPS SA | 72,973 | 1,446,897 | ||||||
|
| |||||||
| Singapore - 1.4% | ||||||||
| Ascendas REIT | 103,900 | 200,694 | ||||||
| CapitaLand Commercial Trust, REIT | 215,200 | 280,373 | ||||||
| CapitaLand Mall Trust, REIT | 113,500 | 184,469 | ||||||
| ComfortDelGro Corp. Ltd. | 125,500 | 223,044 | ||||||
| DBS Group Holdings Ltd. | 111,100 | 2,119,472 | ||||||
| Genting Singapore Ltd. | 173,000 | 134,098 | ||||||
| Jardine Cycle & Carriage Ltd. | 6,800 | 159,161 | ||||||
| Keppel Corp. Ltd. | 63,400 | 322,786 | ||||||
| Oversea-Chinese Banking Corp. Ltd. | 116,100 | 971,490 | ||||||
| Singapore Airlines Ltd. | 25,600 | 182,356 | ||||||
| United Overseas Bank Ltd. | 50,400 | 996,330 | ||||||
| UOL Group Ltd. | 27,100 | 136,669 | ||||||
| Venture Corp. Ltd. | 16,500 | 212,763 | ||||||
|
| |||||||
| 6,123,705 | ||||||||
|
| |||||||
| South Africa - 0.5% | ||||||||
| Anglo American plc | 108,309 | 2,422,978 | ||||||
|
| |||||||
| Spain - 0.8% | ||||||||
| Aena SME SA (b) | 1,055 | 182,786 | ||||||
| Amadeus IT Group SA | 31,768 | 2,944,542 | ||||||
| Repsol SA | 26,004 | 517,670 | ||||||
|
| |||||||
| 3,644,998 | ||||||||
|
| |||||||
| Sweden - 2.0% | ||||||||
| Alfa Laval AB | 18,809 | 508,940 | ||||||
| Atlas Copco AB, Class A | 43,726 | 1,257,481 | ||||||
| The accompanying notes are an integral part of these financial statements. | (Continued) |
| AQR Funds | Annual Report | September 2018 | ||||||||||||||
116
Table of Contents
| Schedule of Investments | September 30, 2018 |
| AQR INTERNATIONAL MOMENTUM STYLE FUND |
| INVESTMENTS | SHARES | VALUE | ||||||
| Sweden - 2.0% (continued) | ||||||||
| Boliden AB | 10,239 | $ | 284,755 | |||||
| Epiroc AB, Class A * | 34,815 | 388,786 | ||||||
| Hexagon AB, Class B | 20,620 | 1,207,234 | ||||||
| Husqvarna AB, Class B | 26,290 | 223,504 | ||||||
| Kinnevik AB, Class B | 5,531 | 167,017 | ||||||
| L E Lundbergforetagen AB, Class B | 4,698 | 158,311 | ||||||
| Lundin Petroleum AB | 33,623 | 1,281,615 | ||||||
| Sandvik AB | 11,079 | 196,145 | ||||||
| Swedish Match AB | 24,529 | 1,253,808 | ||||||
| Tele2 AB, Class B | 65,160 | 783,114 | ||||||
| Telefonaktiebolaget LM Ericsson, Class B | 102,845 | 910,260 | ||||||
| Telia Co. AB | 47,726 | 218,852 | ||||||
| Volvo AB, Class B | 10,202 | 179,932 | ||||||
|
| |||||||
| 9,019,754 | ||||||||
|
| |||||||
| Switzerland - 4.1% | ||||||||
| Baloise Holding AG (Registered) | 3,045 | 464,026 | ||||||
| Barry Callebaut AG (Registered) | 381 | 721,474 | ||||||
| Chocoladefabriken Lindt & Spruengli AG | 53 | 370,920 | ||||||
| Cie Financiere Richemont SA (Registered) | 6,020 | 490,813 | ||||||
| Clariant AG (Registered) * | 19,065 | 495,943 | ||||||
| Coca-Cola HBC AG * | 15,239 | 519,180 | ||||||
| Credit Suisse Group AG (Registered) * | 8,589 | 128,882 | ||||||
| Dufry AG (Registered) * | 1,253 | 141,569 | ||||||
| EMS-Chemie Holding AG (Registered) | 766 | 456,833 | ||||||
| Ferguson plc | 7,344 | 622,932 | ||||||
| Geberit AG (Registered) | 408 | 189,370 | ||||||
| Glencore plc * | 244,152 | 1,052,461 | ||||||
| Julius Baer Group Ltd. * | 11,589 | 579,173 | ||||||
| Kuehne + Nagel International AG (Registered) | 2,855 | 453,018 | ||||||
| Lonza Group AG (Registered) * | 6,844 | 2,341,315 | ||||||
| Partners Group Holding AG | 2,964 | 2,349,618 | ||||||
| SGS SA (Registered) | 56 | 147,444 | ||||||
| Sika AG (Registered) | 14,362 | 2,089,951 | ||||||
| Sonova Holding AG (Registered) | 800 | 158,774 | ||||||
| STMicroelectronics NV | 80,448 | 1,472,408 | ||||||
| Straumann Holding AG (Registered) | 1,893 | 1,426,117 | ||||||
| Swatch Group AG (The) | 3,308 | 1,314,711 | ||||||
| Vifor Pharma AG | 4,262 | 738,905 | ||||||
|
| |||||||
| 18,725,837 | ||||||||
|
| |||||||
| United Arab Emirates - 0.1% | ||||||||
| NMC Health plc | 9,428 | 416,765 | ||||||
|
| |||||||
| United Kingdom - 7.5% | ||||||||
| 3i Group plc | 56,789 | 695,373 | ||||||
| Admiral Group plc | 13,052 | 353,804 | ||||||
| Ashtead Group plc | 29,553 | 937,666 | ||||||
| AstraZeneca plc | 9,765 | 761,124 | ||||||
| Auto Trader Group plc (b) | 38,748 | 225,407 | ||||||
| Aviva plc | 36,331 | 231,809 | ||||||
| BAE Systems plc | 68,337 | 560,361 | ||||||
| Barratt Developments plc | 64,724 | 477,984 | ||||||
| Berkeley Group Holdings plc | 5,516 | 264,254 | ||||||
| BP plc | 1,047,192 | 8,026,457 | ||||||
| British American Tobacco plc | 7,024 | 327,462 | ||||||
| Bunzl plc | 10,364 | 325,825 | ||||||
| Compass Group plc | 56,457 | 1,255,227 | ||||||
| INVESTMENTS | SHARES | VALUE | ||||||
| United Kingdom - 7.5% (continued) | ||||||||
| Croda International plc | 4,629 | $ | 313,771 | |||||
| DCC plc | 1,961 | 177,866 | ||||||
| Diageo plc | 78,501 | 2,781,140 | ||||||
| Direct Line Insurance Group plc | 141,918 | 599,007 | ||||||
| easyJet plc | 16,101 | 275,522 | ||||||
| Experian plc | 22,546 | 578,532 | ||||||
| Fiat Chrysler Automobiles NV * | 90,201 | 1,577,527 | ||||||
| GVC Holdings plc | 9,195 | 110,032 | ||||||
| Hargreaves Lansdown plc | 25,853 | 752,596 | ||||||
| HSBC Holdings plc | 149,249 | 1,302,255 | ||||||
| InterContinental Hotels Group plc | 4,330 | 269,530 | ||||||
| International Consolidated Airlines Group SA | 29,745 | 255,170 | ||||||
| Intertek Group plc | 14,454 | 940,266 | ||||||
| ITV plc | 141,143 | 289,677 | ||||||
| J Sainsbury plc | 30,275 | 126,837 | ||||||
| Legal & General Group plc | 133,260 | 454,922 | ||||||
| London Stock Exchange Group plc | 3,542 | 211,658 | ||||||
| Merlin Entertainments plc (b) | 36,725 | 191,527 | ||||||
| Mondi plc | 10,030 | 274,619 | ||||||
| National Grid plc | 37,232 | 384,561 | ||||||
| Next plc | 3,026 | 216,559 | ||||||
| Persimmon plc | 33,854 | 1,042,274 | ||||||
| Prudential plc | 47,510 | 1,089,312 | ||||||
| Reckitt Benckiser Group plc | 3,645 | 332,971 | ||||||
| Rolls-Royce Holdings plc * | 13,134 | 168,974 | ||||||
| Royal Mail plc | 29,034 | 180,487 | ||||||
| Sage Group plc (The) | 48,044 | 366,938 | ||||||
| Schroders plc | 3,675 | 148,023 | ||||||
| Severn Trent plc | 5,220 | 125,828 | ||||||
| Smith & Nephew plc | 18,671 | 340,646 | ||||||
| St James’s Place plc | 20,354 | 303,389 | ||||||
| Taylor Wimpey plc | 76,654 | 171,337 | ||||||
| Tesco plc | 509,289 | 1,592,299 | ||||||
| Vodafone Group plc | 246,481 | 528,116 | ||||||
| Weir Group plc (The) | 10,950 | 251,213 | ||||||
| Whitbread plc | 7,536 | 463,177 | ||||||
| WPP plc | 10,076 | 147,559 | ||||||
|
| |||||||
| 33,778,870 | ||||||||
|
| |||||||
| United States - 0.3% | ||||||||
| Bausch Health Cos., Inc. (1)* | 46,007 | 1,181,475 | ||||||
| QIAGEN NV * | 10,296 | 389,936 | ||||||
|
| |||||||
| 1,571,411 | ||||||||
|
| |||||||
| Zambia - 0.2% | ||||||||
First Quantum Minerals Ltd. (1) | 61,388 | 699,119 | ||||||
|
| |||||||
TOTAL COMMON STOCKS |
| 435,578,855 | ||||||
|
| |||||||
| SHORT-TERM INVESTMENTS - 2.9% | ||||||||
| Investment Companies - 2.9% | ||||||||
| J.P. Morgan U.S. Treasury Plus Money Market Fund - IM Shares, 2.00% (1)(d) | 15 | 15 | ||||||
| Limited Purpose Cash Investment Fund, 2.06% (1)(d) | 13,194,969 | 13,193,650 | ||||||
|
| |||||||
TOTAL SHORT-TERM INVESTMENTS |
| 13,193,665 | ||||||
|
| |||||||
| The accompanying notes are an integral part of these financial statements. | (Continued) |
| AQR Funds | Annual Report | September 2018 | ||||||||||||||
117
Table of Contents
| Schedule of Investments | September 30, 2018 |
| AQR INTERNATIONAL MOMENTUM STYLE FUND |
| INVESTMENTS | SHARES | VALUE | ||||||
| SECURITIES LENDING COLLATERAL - 0.5% | ||||||||
| Investment Companies - 0.5% | ||||||||
| Investments in a Pooled Account through Securities Lending Program with Citibank NA | ||||||||
| BlackRock Liquidity Funds T-Fund Portfolio, Institutional Shares 1.97% (1)(d)(e) | 296,802 | $ | 296,802 | |||||
| Limited Purpose Cash Investment Fund 2.06% (1)(d)(e) | 2,129,735 | 2,129,522 | ||||||
|
| |||||||
TOTAL SECURITIES LENDING COLLATERAL | 2,426,324 | |||||||
|
| |||||||
TOTAL INVESTMENTS IN SECURITIES AT VALUE - 99.6% | 451,198,844 | |||||||
|
| |||||||
| OTHER ASSETS IN EXCESS OF LIABILITIES - 0.4% (f) | 1,874,333 | |||||||
|
| |||||||
NET ASSETS - 100.0% | $ | 453,073,177 | ||||||
|
| |||||||
| SECTOR | VALUE | % OF NET ASSETS | ||||||
| Communication Services | $ | 12,120,258 | 2.7 | % | ||||
| Consumer Discretionary | 71,228,381 | 15.7 | ||||||
| Consumer Staples | 32,309,783 | 7.1 | ||||||
| Energy | 62,364,328 | 13.8 | ||||||
| Financials | 52,464,443 | 11.6 | ||||||
| Health Care | 35,128,240 | 7.8 | ||||||
| Industrials | 63,637,918 | 14.0 | ||||||
| Information Technology | 44,390,351 | 9.8 | ||||||
| Materials | 36,633,918 | 8.1 | ||||||
| Real Estate | 13,043,680 | 2.9 | ||||||
| Utilities | 12,257,555 | 2.7 | ||||||
| Short-Term Investments | 13,193,665 | 2.9 | ||||||
| Securities Lending Collateral | 2,426,324 | 0.5 | ||||||
|
|
|
| |||||
Total Investments In Securities At Value | 451,198,844 | 99.6 | ||||||
| Other Assets in Excess of Liabilities (f) | 1,874,333 | 0.4 | ||||||
|
|
|
| |||||
Net Assets | $ | 453,073,177 | 100.0 | % | ||||
|
|
|
| |||||
| * | Non-income producing security. |
| (a) | The security or a portion of this security is on loan at September 30, 2018. The total value of securities on loan at September 30, 2018 was $2,424,445. |
| (b) | Securities exempt from registration under Rule 144A or section 4(2), of the Securities Act of 1933. Under procedures approved by the Board of Trustees, such securities have been determined to be liquid by the investment adviser and may be resold, normally to qualified institutional buyers in transactions exempt from registration. Total value of all such securities at September 30, 2018 amounted to $3,851,808, which represents approximately 0.85% of net assets of the fund. |
| (c) | Represents less than 0.05% of net assets. |
| (d) | Represents 7-day effective yield as of September 30, 2018. |
| (e) | Represents security, or portion thereof, purchased with the cash collateral received for securities on loan; additional non-cash collateral of $118,464 was received (See Note 3). |
| (f) | Includes appreciation/(depreciation) on futures contracts. |
All securities are Level 2 with respect to ASC 820, unless otherwise noted in parentheses.
| (1) | Level 1 security (See Note 4). |
Abbreviations
OYJ - Public Traded Company
REIT - Real Estate Investment Trust
SCA - Limited partnership with share capital
SGPS - Sociedade Gestora de Participacões Sociais
| The accompanying notes are an integral part of these financial statements. | (Continued) |
| AQR Funds | Annual Report | September 2018 | ||||||||||||||
118
Table of Contents
| Schedule of Investments | September 30, 2018 |
| AQR INTERNATIONAL MOMENTUM STYLE FUND |
Futures contracts outstanding as of September 30, 2018:
Exchange Traded
| DESCRIPTION | NUMBER OF CONTRACTS | EXPIRATION DATE | TRADING CURRENCY | NOTIONAL AMOUNT | VALUE AND UNREALIZED APPRECIATION (DEPRECIATION) | |||||||||||
| Long Contracts | ||||||||||||||||
| MSCI EAFE E-Mini Index | 122 | 12/2018 | USD | $12,050,550 | $86,250 | |||||||||||
|
| |||||||||||||||
| $86,250 | ||||||||||||||||
|
| |||||||||||||||
USD - United States Dollar
Collateral pledged to, or (received from), each counterparty at September 30, 2018 was as follows:
| COUNTERPARTY | OVER THE COUNTER | EXCHANGE TRADED | TOTAL | |||||||||
| BARC | ||||||||||||
| Cash | $— | $ 409,857 | $ 409,857 | |||||||||
| ||||||||||||
| The accompanying notes are an integral part of these financial statements. |
| AQR Funds | Annual Report | September 2018 | ||||||||||||||
119
Table of Contents
| Schedule of Investments | September 30, 2018 |
| AQR EMERGING MOMENTUM STYLE FUND |
| INVESTMENTS | SHARES | VALUE | ||||||
| COMMON STOCKS - 94.6% | ||||||||
| Brazil - 6.5% | ||||||||
| B3 SA - Brasil Bolsa Balcao (1)* | 4,500 | $ | 26,074 | |||||
| Banco Santander Brasil SA, ADR (1) | 2,723 | 23,990 | ||||||
| Braskem SA (Preference), Class A (1) | 2,600 | 37,520 | ||||||
| Equatorial Energia SA (1) | 2,300 | 32,661 | ||||||
| Gerdau SA, ADR (1) | 6,326 | 26,632 | ||||||
| Hypera SA (1)* | 1,300 | 9,171 | ||||||
| Itausa - Investimentos Itau SA (Preference) (1) | 19,030 | 47,404 | ||||||
| Klabin SA (1) | 700 | 3,434 | ||||||
| Localiza Rent a Car SA (1)* | 5,985 | 33,878 | ||||||
| Lojas Americanas SA (Preference) (1)* | 1,740 | 6,812 | ||||||
| Lojas Renner SA (1) | 1,060 | 8,126 | ||||||
| Magazine Luiza SA (1) | 900 | 27,411 | ||||||
| Petroleo Brasileiro SA (Preference) (1)* | 23,600 | 123,302 | ||||||
| Raia Drogasil SA (1)* | 1,000 | 17,940 | ||||||
| Rumo SA (1)* | 5,000 | 18,484 | ||||||
| Suzano Papel e Celulose SA (1) | 3,100 | 36,837 | ||||||
| TIM Participacoes SA, ADR (1) | 380 | 5,506 | ||||||
| Vale SA, ADR (1) | 20,954 | 310,957 | ||||||
| WEG SA (1) | 1,300 | 6,341 | ||||||
|
| |||||||
| 802,480 | ||||||||
|
| |||||||
| Chile - 1.3% | ||||||||
| Banco de Chile, ADR (1) | 343 | 31,230 | ||||||
| Banco Santander Chile, ADR (1) | 1,424 | 45,539 | ||||||
| Cia Cervecerias Unidas SA, ADR (1) | 238 | 6,640 | ||||||
| Embotelladora Andina SA (Preference), Class B | 1,425 | 5,547 | ||||||
| Empresas COPEC SA | 1,532 | 23,668 | ||||||
| SACI Falabella | 852 | 6,935 | ||||||
| Sociedad Quimica y Minera de Chile SA, ADR (1)(a) | 774 | 35,387 | ||||||
|
| |||||||
| 154,946 | ||||||||
|
| |||||||
| China - 33.6% | ||||||||
| 3SBio, Inc. (b) | 13,500 | 22,622 | ||||||
| AAC Technologies Holdings, Inc. | 2,000 | 20,653 | ||||||
| Agile Group Holdings Ltd. | 16,000 | 22,673 | ||||||
| Agricultural Bank of China Ltd., Class H | 261,000 | 128,000 | ||||||
| Air China Ltd., Class H | 14,000 | 13,467 | ||||||
| Alibaba Health Information Technology Ltd. * | 26,000 | 25,425 | ||||||
| Aluminum Corp. of China Ltd., Class H * | 8,000 | 3,555 | ||||||
| Angang Steel Co. Ltd., Class H | 22,000 | 19,636 | ||||||
| Anhui Conch Cement Co. Ltd., Class H | 15,000 | 90,073 | ||||||
| ANTA Sports Products Ltd. | 9,000 | 42,965 | ||||||
| Beijing Capital International Airport Co. Ltd., Class H | 4,000 | 4,851 | ||||||
| Brilliance China Automotive Holdings Ltd. | 4,000 | 6,450 | ||||||
| BYD Co. Ltd., Class H | 1,000 | 7,110 | ||||||
| CAR, Inc. *(a) | 6,000 | 4,747 | ||||||
| China Conch Venture Holdings Ltd. | 10,000 | 34,921 | ||||||
| China Construction Bank Corp., Class H | 157,000 | 137,234 | ||||||
| China Eastern Airlines Corp. Ltd., Class H | 26,000 | 16,613 | ||||||
| China Evergrande Group | 11,000 | 30,711 | ||||||
| China International Capital Corp. Ltd., Class H (a)(b) | 8,800 | 16,208 | ||||||
| China Jinmao Holdings Group Ltd. | 30,000 | 13,652 | ||||||
| China Longyuan Power Group Corp. Ltd., Class H | 13,000 | 10,947 | ||||||
| INVESTMENTS | SHARES | VALUE | ||||||
| China - 33.6% (continued) | ||||||||
| China Medical System Holdings Ltd. | 8,000 | $ | 11,140 | |||||
| China Mengniu Dairy Co. Ltd. * | 19,000 | 63,164 | ||||||
| China Merchants Bank Co. Ltd., Class H | 71,000 | 287,094 | ||||||
| China Molybdenum Co. Ltd., Class H | 15,000 | 6,266 | ||||||
| China National Building Material Co. Ltd., Class H | 26,000 | 23,057 | ||||||
| China Petroleum & Chemical Corp., Class H | 150,000 | 150,712 | ||||||
| China Resources Beer Holdings Co. Ltd. | 14,000 | 56,142 | ||||||
| China Resources Cement Holdings Ltd. | 28,000 | 32,562 | ||||||
| China Resources Gas Group Ltd. | 2,000 | 8,133 | ||||||
| China Resources Land Ltd. | 14,000 | 49,057 | ||||||
| China Shenhua Energy Co. Ltd., Class H | 6,000 | 13,665 | ||||||
| China Southern Airlines Co. Ltd., Class H | 6,000 | 3,824 | ||||||
| China Taiping Insurance Holdings Co. Ltd. | 4,200 | 14,715 | ||||||
| China Traditional Chinese Medicine Holdings Co. Ltd. | 28,000 | 18,983 | ||||||
| China Travel International Investment Hong Kong Ltd. | 32,000 | 10,290 | ||||||
| China Vanke Co. Ltd., Class H | 21,600 | 71,210 | ||||||
| CIFI Holdings Group Co. Ltd. | 30,000 | 13,738 | ||||||
| CITIC Securities Co. Ltd., Class H | 14,000 | 24,821 | ||||||
| CNOOC Ltd. | 75,000 | 148,510 | ||||||
| Country Garden Holdings Co. Ltd. | 50,000 | 63,009 | ||||||
| CSPC Pharmaceutical Group Ltd. | 30,000 | 63,457 | ||||||
| Dali Foods Group Co. Ltd. (b) | 11,000 | 7,911 | ||||||
| ENN Energy Holdings Ltd. | 6,000 | 52,162 | ||||||
| Far East Horizon Ltd. | 6,000 | 5,722 | ||||||
| Fosun International Ltd. | 11,500 | 20,264 | ||||||
| Fuyao Glass Industry Group Co. Ltd., Class H (b) | 4,400 | 15,942 | ||||||
| Geely Automobile Holdings Ltd. | 14,000 | 27,880 | ||||||
| Genscript Biotech Corp. * | 8,000 | 13,420 | ||||||
| Guangdong Investment Ltd. | 14,000 | 24,807 | ||||||
| Guangzhou Automobile Group Co. Ltd., Class H | 10,800 | 11,933 | ||||||
| Guangzhou R&F Properties Co. Ltd., Class H | 11,600 | 21,282 | ||||||
| Haitian International Holdings Ltd. | 4,000 | 8,902 | ||||||
| Hanergy Thin Film Power Group Ltd. (3)*(c) | 86,000 | — | ||||||
| Hengan International Group Co. Ltd. | 3,000 | 27,570 | ||||||
| Huaneng Renewables Corp. Ltd., Class H | 34,000 | 10,138 | ||||||
| Industrial & Commercial Bank of China Ltd., Class H | 167,000 | 121,926 | ||||||
| Jiangsu Expressway Co. Ltd., Class H | 6,000 | 7,697 | ||||||
| Jiayuan International Group Ltd. | 18,000 | 30,797 | ||||||
| Kaisa Group Holdings Ltd. | 29,000 | 9,272 | ||||||
| Kingdee International Software Group Co. Ltd. | 30,000 | 32,562 | ||||||
| KWG Group Holdings Ltd. | 13,500 | 12,354 | ||||||
| Legend Holdings Corp., Class H (b) | 2,400 | 7,335 | ||||||
| Logan Property Holdings Co. Ltd. | 18,000 | 20,277 | ||||||
| Longfor Group Holdings Ltd. | 13,500 | 34,800 | ||||||
| Luye Pharma Group Ltd. | 21,000 | 18,801 | ||||||
| MMG Ltd. * | 28,000 | 14,415 | ||||||
| PetroChina Co. Ltd., Class H | 102,000 | 82,558 | ||||||
| Ping An Insurance Group Co. of China Ltd., Class H | 55,500 | 562,227 | ||||||
| Postal Savings Bank of China Co. Ltd., Class H (b) | 40,000 | 25,136 | ||||||
| The accompanying notes are an integral part of these financial statements. | (Continued) |
| AQR Funds | Annual Report | September 2018 | ||||||||||||||
120
Table of Contents
| Schedule of Investments | September 30, 2018 |
| AQR EMERGING MOMENTUM STYLE FUND |
| INVESTMENTS | SHARES | VALUE | ||||||
| China - 33.6% (continued) | ||||||||
| Semiconductor Manufacturing International Corp. * | 3,000 | $ | 3,233 | |||||
| Shanghai Fosun Pharmaceutical Group Co. Ltd., Class H | 10,000 | 39,296 | ||||||
| Shenzhen International Holdings Ltd. | 8,000 | 16,484 | ||||||
| Shenzhou International Group Holdings Ltd. | 6,000 | 76,987 | ||||||
| Shimao Property Holdings Ltd. | 11,000 | 27,317 | ||||||
| Sino-Ocean Group Holding Ltd. | 20,500 | 9,062 | ||||||
| Sinopec Engineering Group Co. Ltd., Class H | 3,500 | 3,998 | ||||||
| Sinopec Shanghai Petrochemical Co. Ltd., Class H | 42,000 | 25,616 | ||||||
| Sinotrans Ltd., Class H | 12,000 | 4,881 | ||||||
| Sinotruk Hong Kong Ltd. (a) | 11,500 | 25,090 | ||||||
| Sunac China Holdings Ltd. | 16,000 | 49,026 | ||||||
| Sunny Optical Technology Group Co. Ltd. | 3,100 | 35,790 | ||||||
| Tencent Holdings Ltd. | 12,400 | 506,302 | ||||||
| Tingyi Cayman Islands Holding Corp. | 18,000 | 33,052 | ||||||
| Towngas China Co. Ltd. * | 20,000 | 17,456 | ||||||
| TravelSky Technology Ltd., Class H | 7,000 | 18,201 | ||||||
| Tsingtao Brewery Co. Ltd., Class H | 2,000 | 9,382 | ||||||
| Uni-President China Holdings Ltd. | 21,000 | 22,351 | ||||||
| Want Want China Holdings Ltd. | 20,000 | 16,824 | ||||||
| Weichai Power Co. Ltd., Class H | 39,000 | 48,280 | ||||||
| Wuxi Biologics Cayman, Inc. *(b) | 3,500 | 35,419 | ||||||
| Xinjiang Goldwind Science & Technology Co. Ltd., Class H | 18,400 | 19,697 | ||||||
| Xinyi Solar Holdings Ltd. | 14,000 | 4,327 | ||||||
| Yanzhou Coal Mining Co. Ltd., Class H | 26,000 | 30,062 | ||||||
| Yuexiu Property Co. Ltd. | 42,000 | 7,496 | ||||||
| Yuzhou Properties Co. Ltd. | 13,000 | 5,272 | ||||||
| Zhongsheng Group Holdings Ltd. | 5,500 | 13,349 | ||||||
| Zhuzhou CRRC Times Electric Co. Ltd., Class H | 1,000 | 5,712 | ||||||
| Zijin Mining Group Co. Ltd., Class H | 34,000 | 13,062 | ||||||
| ZTE Corp., Class H * | 8,000 | 14,616 | ||||||
|
| |||||||
| 4,171,792 | ||||||||
|
| |||||||
| Hong Kong - 1.8% | ||||||||
| China First Capital Group Ltd. * | 38,000 | 20,382 | ||||||
| China Gas Holdings Ltd. | 16,600 | 46,982 | ||||||
| Fullshare Holdings Ltd. *(a) | 50,000 | 24,008 | ||||||
| Haier Electronics Group Co. Ltd. * | 11,000 | 29,781 | ||||||
| Lee & Man Paper Manufacturing Ltd. | 6,000 | 5,556 | ||||||
| Nine Dragons Paper Holdings Ltd. | 13,000 | 14,018 | ||||||
| Sino Biopharmaceutical Ltd. | 53,500 | 49,763 | ||||||
| SSY Group Ltd. | 24,000 | 23,236 | ||||||
| Sun Art Retail Group Ltd. | 9,500 | 12,324 | ||||||
|
| |||||||
| 226,050 | ||||||||
|
| |||||||
| Hungary - 0.4% | ||||||||
| MOL Hungarian Oil & Gas plc | 619 | 6,667 | ||||||
| OTP Bank Nyrt | 1,259 | 46,657 | ||||||
|
| |||||||
| 53,324 | ||||||||
|
| |||||||
| India - 11.2% | ||||||||
| Ashok Leyland Ltd. | 8,834 | 14,519 | ||||||
| Asian Paints Ltd. | 1,714 | 30,600 | ||||||
| Avenue Supermarts Ltd. *(b) | 1,722 | 33,187 | ||||||
| Bajaj Finance Ltd. | 2,055 | 61,517 | ||||||
| INVESTMENTS | SHARES | VALUE | ||||||
| India - 11.2% (continued) | ||||||||
| Bajaj Finserv Ltd. | 424 | $ | 35,162 | |||||
| Bharat Forge Ltd. | 1,248 | 10,352 | ||||||
| Britannia Industries Ltd. | 740 | 59,439 | ||||||
| Coal India Ltd. | 2,415 | 8,873 | ||||||
| Dabur India Ltd. | 6,833 | 40,245 | ||||||
| Eicher Motors Ltd. | 16 | 5,339 | ||||||
| GAIL India Ltd. | 2,801 | 14,646 | ||||||
| Godrej Consumer Products Ltd. | 1,371 | 14,540 | ||||||
| Hindustan Unilever Ltd. | 3,339 | 74,103 | ||||||
| Housing Development Finance Corp. Ltd. | 4,789 | 115,922 | ||||||
| Indiabulls Housing Finance Ltd. | 312 | 3,690 | ||||||
| Infosys Ltd., ADR (1) | 18,078 | 183,853 | ||||||
| JSW Steel Ltd. | 6,662 | 35,092 | ||||||
| Larsen & Toubro Ltd., GDR (d) | 2,414 | 41,882 | ||||||
| Mahindra & Mahindra Financial Services Ltd. | 3,482 | 19,244 | ||||||
| Mahindra & Mahindra Ltd. | 4,708 | 55,929 | ||||||
| Motherson Sumi Systems Ltd. | 2,029 | 7,191 | ||||||
| Nestle India Ltd. | 206 | 27,569 | ||||||
| Pidilite Industries Ltd. | 952 | 13,738 | ||||||
| Piramal Enterprises Ltd. | 230 | 7,296 | ||||||
| Reliance Industries Ltd., GDR (b) | 7,158 | 246,300 | ||||||
| State Bank of India, GDR *(d) | 106 | 3,914 | ||||||
| Sun Pharmaceutical Industries Ltd. | 1,344 | 11,555 | ||||||
| Tata Consultancy Services Ltd. | 4,513 | 135,954 | ||||||
| Tata Steel Ltd. | 1,813 | 14,543 | ||||||
| Tech Mahindra Ltd. | 3,840 | 39,494 | ||||||
| United Spirits Ltd. * | 1,752 | 12,434 | ||||||
| Wipro Ltd., ADR (1)(a) | 837 | 4,361 | ||||||
| Zee Entertainment Enterprises Ltd. | 1,484 | 8,986 | ||||||
|
| |||||||
| 1,391,469 | ||||||||
|
| |||||||
| Indonesia - 1.1% | ||||||||
| Adaro Energy Tbk. PT | 56,200 | 6,915 | ||||||
| Bank Central Asia Tbk. PT | 3,700 | 5,993 | ||||||
| Bank Mandiri Persero Tbk. PT | 8,200 | 3,695 | ||||||
| Bank Negara Indonesia Persero Tbk. PT | 33,700 | 16,735 | ||||||
| Bank Rakyat Indonesia Persero Tbk. PT | 100,000 | 21,132 | ||||||
| Charoen Pokphand Indonesia Tbk. PT | 10,700 | 3,644 | ||||||
| Indah Kiat Pulp & Paper Corp. Tbk. PT | 23,500 | 27,343 | ||||||
| Indofood CBP Sukses Makmur Tbk. PT | 11,300 | 6,697 | ||||||
| Telekomunikasi Indonesia Persero Tbk. PT | 46,800 | 11,455 | ||||||
| Unilever Indonesia Tbk. PT | 2,100 | 6,628 | ||||||
| United Tractors Tbk. PT | 12,900 | 28,561 | ||||||
|
| |||||||
| 138,798 | ||||||||
|
| |||||||
| Malaysia - 2.8% | ||||||||
| AirAsia Group Bhd. | 6,400 | 4,885 | ||||||
| CIMB Group Holdings Bhd. | 10,400 | 15,099 | ||||||
| Dialog Group Bhd. | 31,200 | 26,309 | ||||||
| Fraser & Neave Holdings Bhd. | 1,500 | 13,675 | ||||||
| Genting Malaysia Bhd. | 9,100 | 10,970 | ||||||
| Hartalega Holdings Bhd. | 27,800 | 44,444 | ||||||
| Hong Leong Bank Bhd. | 2,200 | 10,941 | ||||||
| Malayan Banking Bhd. | 11,400 | 26,962 | ||||||
| Malaysia Airports Holdings Bhd. | 6,400 | 13,759 | ||||||
| Nestle Malaysia Bhd. | 600 | 21,220 | ||||||
| Petronas Chemicals Group Bhd. | 7,000 | 15,830 | ||||||
| Petronas Dagangan Bhd. | 600 | 3,808 | ||||||
| PPB Group Bhd. | 2,000 | 8,105 | ||||||
| The accompanying notes are an integral part of these financial statements. | (Continued) |
| AQR Funds | Annual Report | September 2018 | ||||||||||||||
121
Table of Contents
| Schedule of Investments | September 30, 2018 |
| AQR EMERGING MOMENTUM STYLE FUND |
| INVESTMENTS | SHARES | VALUE | ||||||
| Malaysia - 2.8% (continued) | ||||||||
| Press Metal Aluminium Holdings Bhd. | 20,300 | $ | 23,830 | |||||
| Public Bank Bhd. | 10,700 | 64,625 | ||||||
| Tenaga Nasional Bhd. | 4,300 | 16,078 | ||||||
| Top Glove Corp. Bhd. | 10,900 | 28,063 | ||||||
|
| |||||||
| 348,603 | ||||||||
|
| |||||||
| Mexico - 0.5% | ||||||||
| America Movil SAB de CV, Class L, ADR (1) | 714 | 11,467 | ||||||
| Grupo Aeroportuario del Pacifico SAB de CV, Class B (1) | 600 | 6,559 | ||||||
| Wal-Mart de Mexico SAB de CV (1) | 15,400 | 46,931 | ||||||
|
| |||||||
| 64,957 | ||||||||
|
| |||||||
| Peru - 1.8% | ||||||||
| Cia de Minas Buenaventura SAA, ADR (1) | 569 | 7,630 | ||||||
| Credicorp Ltd. (1) | 310 | 69,155 | ||||||
| Southern Copper Corp. (1) | 3,448 | 148,747 | ||||||
|
| |||||||
| 225,532 | ||||||||
|
| |||||||
| Poland - 0.9% | ||||||||
| Alior Bank SA * | 196 | 3,345 | ||||||
| Bank Millennium SA * | 2,095 | 5,257 | ||||||
| CCC SA | 65 | 3,875 | ||||||
| CD Projekt SA * | 598 | 30,362 | ||||||
| Dino Polska SA *(b) | 607 | 16,390 | ||||||
| LPP SA | 10 | 23,394 | ||||||
| Powszechna Kasa Oszczednosci Bank Polski SA | 2,412 | 28,021 | ||||||
|
| |||||||
| 110,644 | ||||||||
|
| |||||||
| Russia - 1.9% | ||||||||
| Magnitogorsk Iron & Steel Works PJSC, GDR (d) | 2,802 | 28,930 | ||||||
| MMC Norilsk Nickel PJSC, ADR | 3,232 | 55,813 | ||||||
| Mobile TeleSystems PJSC, ADR (1) | 555 | 4,734 | ||||||
| Novolipetsk Steel PJSC, GDR (d) | 1,290 | 34,720 | ||||||
| Severstal PJSC, GDR (d) | 2,453 | 40,855 | ||||||
| Tatneft PJSC, ADR | 910 | 69,433 | ||||||
|
| |||||||
| 234,485 | ||||||||
|
| |||||||
| Singapore - 0.0% (e) | ||||||||
| BOC Aviation Ltd. (b) | 700 | 5,431 | ||||||
|
| |||||||
| South Africa - 5.1% | ||||||||
| Bidvest Group Ltd. (The) | 1,536 | 20,092 | ||||||
| Capitec Bank Holdings Ltd. | 452 | 32,696 | ||||||
| Clicks Group Ltd. | 1,763 | 21,790 | ||||||
| Discovery Ltd. | 1,840 | 22,098 | ||||||
| Exxaro Resources Ltd. | 1,496 | 15,379 | ||||||
| FirstRand Ltd. | 7,974 | 38,250 | ||||||
| Foschini Group Ltd. (The) | 1,069 | 13,118 | ||||||
| Growthpoint Properties Ltd., REIT | 4,286 | 7,033 | ||||||
| Imperial Holdings Ltd. | 763 | 9,434 | ||||||
| Kumba Iron Ore Ltd. | 945 | 21,412 | ||||||
| Mr Price Group Ltd. | 1,704 | 27,481 | ||||||
| Naspers Ltd., Class N | 651 | 140,192 | ||||||
| Nedbank Group Ltd. | 1,305 | 24,412 | ||||||
| Pick n Pay Stores Ltd. | 2,213 | 10,768 | ||||||
| PSG Group Ltd. | 295 | 4,779 | ||||||
| INVESTMENTS | SHARES | VALUE | ||||||
| South Africa - 5.1% (continued) | ||||||||
| Sappi Ltd. | 1,371 | $ | 8,601 | |||||
| Sasol Ltd. | 2,427 | 93,770 | ||||||
| Shoprite Holdings Ltd. | 1,779 | 24,089 | ||||||
| SPAR Group Ltd. (The) | 948 | 12,347 | ||||||
| Standard Bank Group Ltd. | 5,345 | 66,094 | ||||||
| Tiger Brands Ltd. | 388 | 7,271 | ||||||
| Truworths International Ltd. | 872 | 5,143 | ||||||
|
| |||||||
| 626,249 | ||||||||
|
| |||||||
| South Korea - 9.2% | ||||||||
| Celltrion Pharm, Inc. * | 294 | 21,219 | ||||||
| Celltrion, Inc. * | 421 | 112,826 | ||||||
| GS Engineering & Construction Corp. | 214 | 10,086 | ||||||
| GS Holdings Corp. | 84 | 4,173 | ||||||
| Hana Financial Group, Inc. | 325 | 13,050 | ||||||
| Hanmi Pharm Co. Ltd. | 22 | 9,916 | ||||||
| HDC Hyundai Development Co.-Engineering & Construction * | 103 | 4,725 | ||||||
| HLB, Inc. * | 367 | 39,691 | ||||||
| Hotel Shilla Co. Ltd. | 311 | 30,411 | ||||||
| Hyundai Engineering & Construction Co. Ltd. | 388 | 23,598 | ||||||
| Hyundai Marine & Fire Insurance Co. Ltd. | 158 | 5,973 | ||||||
| Kakao Corp. | 100 | 10,724 | ||||||
| KB Financial Group, Inc. | 232 | 11,299 | ||||||
| Korea Gas Corp. * | 76 | 4,156 | ||||||
| Korea Investment Holdings Co. Ltd. | 437 | 29,966 | ||||||
| Kumho Petrochemical Co. Ltd. | 107 | 9,500 | ||||||
| LG Chem Ltd. | 132 | 43,487 | ||||||
| LG Electronics, Inc. | 222 | 14,206 | ||||||
| LG Household & Health Care Ltd. | 49 | 56,356 | ||||||
| Lotte Chemical Corp. | 43 | 10,776 | ||||||
| Lotte Shopping Co. Ltd. | 41 | 7,748 | ||||||
| Medy-Tox, Inc. | 39 | 21,769 | ||||||
| NAVER Corp. | 16 | 10,327 | ||||||
| NCSoft Corp. | 29 | 11,570 | ||||||
| OCI Co. Ltd. | 101 | 10,014 | ||||||
| POSCO | 313 | 83,085 | ||||||
| Samsung Biologics Co. Ltd. *(b) | 112 | 53,897 | ||||||
| Samsung Electro-Mechanics Co. Ltd. | 285 | 35,696 | ||||||
| Samsung Electronics Co. Ltd. | 568 | 23,771 | ||||||
| Samsung Engineering Co. Ltd. * | 398 | 6,924 | ||||||
| Samsung SDI Co. Ltd. | 223 | 51,935 | ||||||
| Samsung SDS Co. Ltd. | 181 | 37,687 | ||||||
| Shinhan Financial Group Co. Ltd. | 210 | 8,486 | ||||||
| Shinsegae, Inc. | 56 | 18,308 | ||||||
| SillaJen, Inc. * | 506 | 46,687 | ||||||
| SK Holdings Co. Ltd. | 39 | 10,092 | ||||||
| SK Hynix, Inc. | 2,190 | 144,885 | ||||||
| SK Innovation Co. Ltd. | 162 | 31,402 | ||||||
| S-Oil Corp. | 144 | 17,787 | ||||||
| ViroMed Co. Ltd. * | 148 | 32,136 | ||||||
| Woori Bank | 376 | 5,725 | ||||||
|
| |||||||
| 1,136,069 | ||||||||
|
| |||||||
| Taiwan - 11.5% | ||||||||
| Acer, Inc. * | 26,000 | 21,475 | ||||||
| Advantech Co. Ltd. | 1,317 | 9,802 | ||||||
| ASE Technology Holding Co. Ltd. | 9,000 | 21,983 | ||||||
| Asia Cement Corp. | 11,000 | 14,948 | ||||||
| The accompanying notes are an integral part of these financial statements. | (Continued) |
| AQR Funds | Annual Report | September 2018 | ||||||||||||||
122
Table of Contents
| Schedule of Investments | September 30, 2018 |
| AQR EMERGING MOMENTUM STYLE FUND |
| INVESTMENTS | SHARES | VALUE | ||||||
| Taiwan - 11.5% (continued) | ||||||||
| Catcher Technology Co. Ltd. | 2,000 | $ | 21,986 | |||||
| Cathay Financial Holding Co. Ltd. | 29,600 | 50,871 | ||||||
| Chailease Holding Co. Ltd. | 9,139 | 31,986 | ||||||
| Chang Hwa Commercial Bank Ltd. | 10,400 | 6,436 | ||||||
| China Development Financial Holding Corp. | 45,000 | 16,790 | ||||||
| China Life Insurance Co. Ltd. | 27,822 | 27,975 | ||||||
| CTBC Financial Holding Co. Ltd. | 15,832 | 11,920 | ||||||
| E.Sun Financial Holding Co. Ltd. | 45,608 | 33,674 | ||||||
| Far Eastern New Century Corp. | 13,000 | 15,201 | ||||||
| First Financial Holding Co. Ltd. | 26,988 | 18,380 | ||||||
| Formosa Chemicals & Fibre Corp. | 17,000 | 71,241 | ||||||
| Formosa Petrochemical Corp. | 10,000 | 48,472 | ||||||
| Formosa Plastics Corp. | 21,000 | 80,446 | ||||||
| Fubon Financial Holding Co. Ltd. | 8,000 | 13,569 | ||||||
| Globalwafers Co. Ltd. | 3,000 | 33,060 | ||||||
| Hiwin Technologies Corp. | 3,131 | 25,870 | ||||||
| Hon Hai Precision Industry Co. Ltd. | 4,441 | 11,516 | ||||||
| Innolux Corp. | 13,000 | 4,514 | ||||||
| Inventec Corp. | 8,000 | 7,178 | ||||||
| Macronix International | 14,280 | 11,897 | ||||||
| MediaTek, Inc. | 6,000 | 48,414 | ||||||
| Mega Financial Holding Co. Ltd. | 26,000 | 23,408 | ||||||
| Micro-Star International Co. Ltd. | 5,000 | 13,525 | ||||||
| Nan Ya Plastics Corp. | 22,000 | 61,080 | ||||||
| Nanya Technology Corp. | 11,000 | 21,006 | ||||||
| Novatek Microelectronics Corp. | 1,000 | 4,935 | ||||||
| Powertech Technology, Inc. | 5,000 | 13,623 | ||||||
| President Chain Store Corp. | 4,000 | 46,963 | ||||||
| Ruentex Development Co. Ltd. | 4,000 | 4,671 | ||||||
| Ruentex Industries Ltd. | 7,000 | 13,909 | ||||||
| Shin Kong Financial Holding Co. Ltd. | 85,209 | 33,324 | ||||||
| SinoPac Financial Holdings Co. Ltd. | 41,000 | 14,967 | ||||||
| Standard Foods Corp. | 2,537 | 4,218 | ||||||
| Synnex Technology International Corp. | 3,000 | 3,823 | ||||||
| TaiMed Biologics, Inc. * | 3,000 | 18,492 | ||||||
| Taiwan Business Bank | 16,640 | 6,048 | ||||||
| Taiwan Cement Corp. | 19,200 | 25,834 | ||||||
| Taiwan Cooperative Financial Holding Co. Ltd. | 36,000 | 21,927 | ||||||
| Taiwan Semiconductor Manufacturing Co. Ltd., ADR (1) | 5,902 | 260,633 | ||||||
| Uni-President Enterprises Corp. | 26,000 | 67,834 | ||||||
| United Microelectronics Corp. | 42,000 | 22,160 | ||||||
| Walsin Technology Corp. | 3,000 | 20,930 | ||||||
| Win Semiconductors Corp. | 1,000 | 4,402 | ||||||
| Wistron Corp. | 15,142 | 9,863 | ||||||
| Yageo Corp. | 2,396 | 35,979 | ||||||
| Yuanta Financial Holding Co. Ltd. | 22,000 | 11,597 | ||||||
|
| |||||||
| 1,424,755 | ||||||||
|
| |||||||
| Thailand - 4.6% | ||||||||
| Advanced Info Service PCL, NVDR | 1,700 | 10,568 | ||||||
| Airports of Thailand PCL, NVDR | 25,200 | 51,039 | ||||||
| Bangkok Dusit Medical Services PCL, NVDR | 47,700 | 37,609 | ||||||
| Bangkok Expressway & Metro PCL, NVDR | 81,100 | 21,817 | ||||||
| Banpu PCL, NVDR | 16,400 | 9,688 | ||||||
| Berli Jucker PCL, NVDR | 7,700 | 14,167 | ||||||
| Bumrungrad Hospital PCL, NVDR | 900 | 5,173 | ||||||
| Central Pattana PCL, NVDR | 13,200 | 33,878 | ||||||
| INVESTMENTS | SHARES | VALUE | ||||||
| Thailand - 4.6% (continued) | ||||||||
| CP All PCL, NVDR | 29,600 | $ | 63,167 | |||||
| Electricity Generating PCL, NVDR | 600 | 4,374 | ||||||
| Energy Absolute PCL, NVDR | 4,700 | 7,007 | ||||||
| Home Product Center PCL, NVDR | 58,100 | 28,402 | ||||||
| Indorama Ventures PCL, NVDR | 21,800 | 39,780 | ||||||
| IRPC PCL, NVDR | 162,600 | 34,198 | ||||||
| Kasikornbank PCL, NVDR | 1,500 | 10,018 | ||||||
| Land & Houses PCL, NVDR | 20,000 | 7,107 | ||||||
| PTT Exploration & Production PCL, NVDR | 7,100 | 34,075 | ||||||
| PTT Global Chemical PCL, NVDR | 12,700 | 31,914 | ||||||
| PTT PCL, NVDR | 66,000 | 110,801 | ||||||
| Thai Oil PCL, NVDR | 5,500 | 15,059 | ||||||
|
| |||||||
| 569,841 | ||||||||
|
| |||||||
| Turkey - 0.3% | ||||||||
| Eregli Demir ve Celik Fabrikalari TAS | 13,786 | 25,153 | ||||||
| Turk Hava Yollari AO * | 4,921 | 15,522 | ||||||
|
| |||||||
| 40,675 | ||||||||
|
| |||||||
| United States - 0.1% | ||||||||
| JBS SA (1) | 4,000 | 9,261 | ||||||
|
| |||||||
TOTAL COMMON STOCKS | 11,735,361 | |||||||
|
| |||||||
| EXCHANGE TRADED FUNDS - 3.9% | ||||||||
| United States - 3.9% | ||||||||
| iShares MSCI Emerging Markets ETF (1) | ||||||||
(Cost $477,325) | 11,141 | 478,172 | ||||||
|
| |||||||
| SHORT-TERM INVESTMENTS - 1.4% | ||||||||
| Investment Companies - 1.4% | ||||||||
| Limited Purpose Cash Investment Fund, 2.06% (1)(f) | ||||||||
(Cost $174,003) | 174,033 | 174,016 | ||||||
|
| |||||||
| SECURITIES LENDING COLLATERAL - 0.7% | ||||||||
| Investment Companies - 0.7% | ||||||||
| Investments in a Pooled Account through Securities Lending Program with Citibank NA | ||||||||
| BlackRock Liquidity Funds T-Fund Portfolio, Institutional Shares 1.97% (1)(f)(g) | 9,965 | 9,965 | ||||||
| Limited Purpose Cash Investment Fund 2.06% (1)(f)(g) | 71,508 | 71,501 | ||||||
|
| |||||||
TOTAL SECURITIES LENDING COLLATERAL | 81,466 | |||||||
|
| |||||||
TOTAL INVESTMENTS IN SECURITIES | 12,469,015 | |||||||
|
| |||||||
| LIABILITIES IN EXCESS OF OTHER ASSETS - (0.6)% | (75,698) | |||||||
|
| |||||||
NET ASSETS - 100.0% | $ | 12,393,317 | ||||||
|
| |||||||
| The accompanying notes are an integral part of these financial statements. | (Continued) |
| AQR Funds | Annual Report | September 2018 | ||||||||||||||
123
Table of Contents
| Schedule of Investments | September 30, 2018 |
| AQR EMERGING MOMENTUM STYLE FUND |
| SECTOR | VALUE | % OF NET ASSETS | ||||||
| Communication Services | $ | 762,193 | 6.1 | % | ||||
| Consumer Discretionary | 637,252 | 5.1 | ||||||
| Consumer Staples | 1,001,884 | 8.1 | ||||||
| Energy | 1,297,382 | 10.5 | ||||||
| Exchange Traded Funds | 478,172 | 3.9 | ||||||
| Financials | 2,650,104 | 21.4 | ||||||
| Health Care | 781,814 | 6.3 | ||||||
| Industrials | 614,142 | 4.9 | ||||||
| Information Technology | 1,397,058 | 11.3 | ||||||
| Materials | 1,807,296 | 14.6 | ||||||
| Real Estate | 543,694 | 4.4 | ||||||
| Utilities | 242,542 | 1.9 | ||||||
| Short-Term Investments | 174,016 | 1.4 | ||||||
| Securities Lending Collateral | 81,466 | 0.7 | ||||||
|
|
|
| |||||
Total Investments In Securities At Value | 12,469,015 | 100.6 | ||||||
| Liabilities in Excess of Other Assets | (75,698 | ) | (0.6 | ) | ||||
|
|
|
| |||||
Net Assets | $ | 12,393,317 | 100.0 | % | ||||
|
|
|
| |||||
| * | Non-income producing security. |
| (a) | The security or a portion of this security is on loan at September 30, 2018. The total value of securities on loan at September 30, 2018 was $88,670. |
| (b) | Securities exempt from registration under Rule 144A or section 4(2), of the Securities Act of 1933. Under procedures approved by the Board of Trustees, such securities have been determined to be liquid by the investment adviser and may be resold, normally to qualified institutional buyers in transactions exempt from registration. Total value of all such securities at September 30, 2018 amounted to $485,778, which represents approximately 3.92% of net assets of the fund. |
| (c) | Security fair valued as of September 30, 2018 in accordance with procedures approved by the Board of Trustees. Total value of all such securities at September 30, 2018 amounted to $0, which represents approximately 0.00% of net assets of the fund. |
| (d) | Security exempt from registration pursuant to Regulation S under the Securities Act of 1933. Regulation S applies to securities offerings that are made outside of the United States and do not involve direct selling efforts in the United States. At September 30, 2018, the value of these securities amounted to $150,301 or 1.21% of net assets. |
| (e) | Represents less than 0.05% of net assets. |
| (f) | Represents 7-day effective yield as of September 30, 2018. |
| (g) | Represents security, or portion thereof, purchased with the cash collateral received for securities on loan; additional non-cash collateral of $53,659 was received (See Note 3). |
All securities are Level 2 with respect to ASC 820, unless otherwise noted in parentheses.
| (1) | Level 1 security (See Note 4). |
| (3) | Level 3 security (See Note 4). |
Abbreviations
ADR - American Depositary Receipt
GDR - Global Depositary Receipt
NVDR - Non-Voting Depositary Receipt
PJSC - Public Joint Stock Company
Preference - A special type of equity investment that shares in the earnings of the company, has limited voting rights, and may have a dividend preference. Preference shares may also have liquidation preference.
REIT - Real Estate Investment Trust
| The accompanying notes are an integral part of these financial statements. |
| AQR Funds | Annual Report | September 2018 | ||||||||||||||
124
Table of Contents
| Schedule of Investments | September 30, 2018 |
| AQR TM LARGE CAP MOMENTUM STYLE FUND |
| INVESTMENTS | SHARES | VALUE | ||||||
| COMMON STOCKS - 96.7% |
| |||||||
| Aerospace & Defense - 4.3% | ||||||||
| Boeing Co. (The) | 6,968 | $ | 2,591,399 | |||||
| BWX Technologies, Inc. | 1,737 | 108,632 | ||||||
| General Dynamics Corp. | 5,500 | 1,125,960 | ||||||
| Huntington Ingalls Industries, Inc. | 1,500 | 384,120 | ||||||
| Lockheed Martin Corp. | 6,149 | 2,127,308 | ||||||
| Northrop Grumman Corp. | 5,628 | 1,786,158 | ||||||
| Raytheon Co. | 6,254 | 1,292,452 | ||||||
| Teledyne Technologies, Inc. * | 513 | 126,547 | ||||||
| Textron, Inc. | 2,100 | 150,087 | ||||||
| TransDigm Group, Inc. * | 269 | 100,149 | ||||||
|
| |||||||
| 9,792,812 | ||||||||
|
| |||||||
| Air Freight & Logistics - 0.5% | ||||||||
| Expeditors International of Washington, Inc. | 1,395 | 102,574 | ||||||
| FedEx Corp. | 2,577 | 620,516 | ||||||
| United Parcel Service, Inc., Class B | 939 | 109,628 | ||||||
| XPO Logistics, Inc. * | 1,947 | 222,289 | ||||||
|
| |||||||
| 1,055,007 | ||||||||
|
| |||||||
| Airlines - 0.6% | ||||||||
| Alaska Air Group, Inc. | 1,420 | 97,781 | ||||||
| Delta Air Lines, Inc. | 7,213 | 417,128 | ||||||
| Southwest Airlines Co. | 9,927 | 619,941 | ||||||
| United Continental Holdings, Inc. * | 2,545 | 226,658 | ||||||
|
| |||||||
| 1,361,508 | ||||||||
|
| |||||||
| Auto Components - 0.1% | ||||||||
| Aptiv plc | 1,223 | 102,610 | ||||||
| Goodyear Tire & Rubber Co. (The) | 3,168 | 74,099 | ||||||
|
| |||||||
| 176,709 | ||||||||
|
| |||||||
| Banks - 6.1% | ||||||||
| Bank of America Corp. | 140,251 | 4,131,794 | ||||||
| Citigroup, Inc. | 12,296 | 882,115 | ||||||
| Citizens Financial Group, Inc. | 5,964 | 230,032 | ||||||
| Comerica, Inc. | 9,013 | 812,973 | ||||||
| Fifth Third Bancorp | 12,279 | 342,830 | ||||||
| First Republic Bank | 4,040 | 387,840 | ||||||
| Huntington Bancshares, Inc. | 10,400 | 155,168 | ||||||
| JPMorgan Chase & Co. | 27,679 | 3,123,298 | ||||||
| Regions Financial Corp. | 82,334 | 1,510,829 | ||||||
| SunTrust Banks, Inc. | 1,093 | 73,001 | ||||||
| SVB Financial Group * | 2,258 | 701,854 | ||||||
| TCF Financial Corp. | 17,620 | 419,532 | ||||||
| Western Alliance Bancorp * | 1,975 | 112,358 | ||||||
| ZB NA | 20,642 | 1,035,196 | ||||||
|
| |||||||
| 13,918,820 | ||||||||
|
| |||||||
| Beverages - 0.5% | ||||||||
| Constellation Brands, Inc., Class A | 4,147 | 894,176 | ||||||
| Monster Beverage Corp. * | 4,800 | 279,744 | ||||||
|
| |||||||
| 1,173,920 | ||||||||
|
| |||||||
| Biotechnology - 1.9% | ||||||||
| AbbVie, Inc. | 12,406 | 1,173,359 | ||||||
| Agios Pharmaceuticals, Inc. *(a) | 2,096 | 161,644 | ||||||
| Amgen, Inc. | 901 | 186,768 | ||||||
| BioMarin Pharmaceutical, Inc. * | 864 | 83,782 | ||||||
| INVESTMENTS | SHARES | VALUE | ||||||
| Biotechnology - 1.9% (continued) | ||||||||
| Bluebird Bio, Inc. *(a) | 1,504 | $ | 219,584 | |||||
| Exact Sciences Corp. * | 3,222 | 254,280 | ||||||
| Incyte Corp. * | 2,919 | 201,645 | ||||||
| Neurocrine Biosciences, Inc. * | 5,260 | 646,717 | ||||||
| Regeneron Pharmaceuticals, Inc. * | 635 | 256,565 | ||||||
| Sage Therapeutics, Inc. * | 1,400 | 197,750 | ||||||
| Sarepta Therapeutics, Inc. *(a) | 3,286 | 530,722 | ||||||
| Vertex Pharmaceuticals, Inc. * | 2,305 | 444,266 | ||||||
|
| |||||||
| 4,357,082 | ||||||||
|
| |||||||
| Building Products - 0.3% | ||||||||
| AO Smith Corp. | 5,764 | 307,625 | ||||||
| Fortune Brands Home & Security, Inc. | 3,007 | 157,446 | ||||||
| Lennox International, Inc. | 462 | 100,901 | ||||||
| Masco Corp. | 4,334 | 158,624 | ||||||
|
| |||||||
| 724,596 | ||||||||
|
| |||||||
| Capital Markets - 2.8% | ||||||||
| BlackRock, Inc. | 365 | 172,036 | ||||||
| Cboe Global Markets, Inc. | 1,552 | 148,930 | ||||||
| Charles Schwab Corp. (The) | 18,855 | 926,723 | ||||||
| CME Group, Inc. | 4,535 | 771,902 | ||||||
| E*TRADE Financial Corp. * | 15,352 | 804,291 | ||||||
| Evercore, Inc., Class A | 1,851 | 186,118 | ||||||
| Interactive Brokers Group, Inc., Class A | 2,818 | 155,864 | ||||||
| Intercontinental Exchange, Inc. | 4,335 | 324,648 | ||||||
| LPL Financial Holdings, Inc. | 9,563 | 616,909 | ||||||
| Moody’s Corp. | 2,295 | 383,724 | ||||||
| Morgan Stanley | 16,146 | 751,919 | ||||||
| MSCI, Inc. | 1,038 | 184,152 | ||||||
| Northern Trust Corp. | 2,636 | 269,215 | ||||||
| Raymond James Financial, Inc. | 1,908 | 175,631 | ||||||
| S&P Global, Inc. | 3,044 | 594,767 | ||||||
|
| |||||||
| 6,466,829 | ||||||||
|
| |||||||
| Chemicals - 0.8% | ||||||||
| Air Products & Chemicals, Inc. | 1,700 | 283,985 | ||||||
| Albemarle Corp. (a) | 687 | 68,549 | ||||||
| CF Industries Holdings, Inc. | 1,478 | 80,462 | ||||||
| Chemours Co. (The) | 1,717 | 67,719 | ||||||
| DowDuPont, Inc. | 2,240 | 144,055 | ||||||
| Ecolab, Inc. | 1,821 | 285,496 | ||||||
| LyondellBasell Industries NV, Class A | 961 | 98,512 | ||||||
| PPG Industries, Inc. | 2,626 | 286,575 | ||||||
| Sherwin-Williams Co. (The) | 961 | 437,457 | ||||||
|
| |||||||
| 1,752,810 | ||||||||
|
| |||||||
| Commercial Services & Supplies - 0.2% | ||||||||
| Cintas Corp. | 848 | 167,743 | ||||||
| Copart, Inc. * | 2,972 | 153,147 | ||||||
| Republic Services, Inc. | 1,427 | 103,686 | ||||||
| Waste Management, Inc. | 963 | 87,017 | ||||||
|
| |||||||
| 511,593 | ||||||||
|
| |||||||
| Communications Equipment - 1.6% | ||||||||
| Arista Networks, Inc. * | 3,977 | 1,057,325 | ||||||
| Cisco Systems, Inc. | 36,783 | 1,789,493 | ||||||
| F5 Networks, Inc. * | 1,500 | 299,130 | ||||||
| Palo Alto Networks, Inc. * | 1,309 | 294,865 | ||||||
| Ubiquiti Networks, Inc. (a) | 1,254 | 123,971 | ||||||
|
| |||||||
| 3,564,784 | ||||||||
|
| |||||||
| The accompanying notes are an integral part of these financial statements. | (Continued) |
| AQR Funds | Annual Report | September 2018 | ||||||||||||||
125
Table of Contents
| Schedule of Investments | September 30, 2018 |
| AQR TM LARGE CAP MOMENTUM STYLE FUND |
| INVESTMENTS | SHARES | VALUE | ||||||
| Construction Materials - 0.1% | ||||||||
| Vulcan Materials Co. | 1,445 | $ | 160,684 | |||||
|
| |||||||
| Consumer Finance - 0.6% | ||||||||
| Ally Financial, Inc. | 3,921 | 103,710 | ||||||
| American Express Co. | 2,415 | 257,173 | ||||||
| Credit Acceptance Corp. *(a) | 746 | 326,800 | ||||||
| Discover Financial Services | 3,539 | 270,557 | ||||||
| OneMain Holdings, Inc. * | 2,548 | 85,638 | ||||||
| Santander Consumer USA Holdings, Inc. | 18,692 | 374,588 | ||||||
|
| |||||||
| 1,418,466 | ||||||||
|
| |||||||
| Containers & Packaging - 0.1% | ||||||||
| Ball Corp. | 2,800 | 123,172 | ||||||
|
| |||||||
| Diversified Consumer Services - 0.1% | ||||||||
| Grand Canyon Education, Inc. * | 783 | 88,322 | ||||||
| ServiceMaster Global Holdings, Inc. * | 2,514 | 155,944 | ||||||
|
| |||||||
| 244,266 | ||||||||
|
| |||||||
| Diversified Financial Services - 0.0% (b) | ||||||||
| Berkshire Hathaway, Inc., Class B * | 365 | 78,150 | ||||||
|
| |||||||
| Diversified Telecommunication Services - 0.0% (b) | ||||||||
| Zayo Group Holdings, Inc. * | 2,420 | 84,022 | ||||||
|
| |||||||
| Electric Utilities - 0.8% | ||||||||
| Alliant Energy Corp. | 3,241 | 137,969 | ||||||
| American Electric Power Co., Inc. | 2,331 | 165,221 | ||||||
| Avangrid, Inc. | 2,699 | 129,363 | ||||||
| NextEra Energy, Inc. | 7,518 | 1,260,017 | ||||||
| Xcel Energy, Inc. | 5,012 | 236,617 | ||||||
|
| |||||||
| 1,929,187 | ||||||||
|
| |||||||
| Electrical Equipment - 0.1% | ||||||||
| Eaton Corp. plc | 2,886 | 250,303 | ||||||
|
| |||||||
| Electronic Equipment, Instruments & Components - 0.4% | ||||||||
| Cognex Corp. | 4,716 | 263,247 | ||||||
| Corning, Inc. | 11,812 | 416,964 | ||||||
| Dolby Laboratories, Inc., Class A | 1,816 | 127,065 | ||||||
| Keysight Technologies, Inc. * | 1,063 | 70,456 | ||||||
| Zebra Technologies Corp., Class A * | 696 | 123,074 | ||||||
|
| |||||||
| 1,000,806 | ||||||||
|
| |||||||
| Energy Equipment & Services - 0.1% | ||||||||
| National Oilwell Varco, Inc. | 4,360 | 187,829 | ||||||
| Transocean Ltd. *(a) | 7,824 | 109,145 | ||||||
|
| |||||||
| 296,974 | ||||||||
|
| |||||||
| Entertainment - 1.2% | ||||||||
| Activision Blizzard, Inc. | 16,034 | 1,333,869 | ||||||
| Electronic Arts, Inc. * | 8,290 | 998,862 | ||||||
| Madison Square Garden Co. (The), Class A * | 316 | 99,641 | ||||||
| Take-Two Interactive Software, Inc. * | 2,784 | 384,164 | ||||||
|
| |||||||
| 2,816,536 | ||||||||
|
| |||||||
| Equity Real Estate Investment Trusts (REITs) - 1.2% | ||||||||
| American Tower Corp. | 4,094 | 594,858 | ||||||
| AvalonBay Communities, Inc. | 1,887 | 341,830 | ||||||
| CyrusOne, Inc. | 1,564 | 99,158 | ||||||
| INVESTMENTS | SHARES | VALUE | ||||||
| Equity Real Estate Investment Trusts (REITs) - 1.2% (continued) | ||||||||
| Digital Realty Trust, Inc. | 4,081 | $ | 459,031 | |||||
| Equinix, Inc. | 459 | 198,696 | ||||||
| Equity LifeStyle Properties, Inc. | 3,053 | 294,462 | ||||||
| Essex Property Trust, Inc. | 1,200 | 296,052 | ||||||
| Extra Space Storage, Inc. | 1,500 | 129,960 | ||||||
| Public Storage | 1,321 | 266,353 | ||||||
| Realty Income Corp. | 1,500 | 85,335 | ||||||
| UDR, Inc. | 2,100 | 84,903 | ||||||
|
| |||||||
| 2,850,638 | ||||||||
|
| |||||||
| Food & Staples Retailing - 0.3% | ||||||||
| Costco Wholesale Corp. | 1,560 | 366,413 | ||||||
| Kroger Co. (The) (a) | 2,883 | 83,924 | ||||||
| Sysco Corp. | 1,418 | 103,868 | ||||||
| Walgreens Boots Alliance, Inc. | 1,551 | 113,068 | ||||||
|
| |||||||
| 667,273 | ||||||||
|
| |||||||
| Food Products - 0.2% | ||||||||
| Conagra Brands, Inc. | 1,869 | 63,490 | ||||||
| Tyson Foods, Inc., Class A | 5,589 | 332,713 | ||||||
|
| |||||||
| 396,203 | ||||||||
|
| |||||||
| Health Care Equipment & Supplies - 4.5% | ||||||||
| Abbott Laboratories | 10,679 | 783,411 | ||||||
| ABIOMED, Inc. * | 4,030 | 1,812,492 | ||||||
| Align Technology, Inc. * | 2,675 | 1,046,513 | ||||||
| Baxter International, Inc. | 4,579 | 352,995 | ||||||
| Becton Dickinson and Co. | 1,800 | 469,800 | ||||||
| Boston Scientific Corp. * | 20,239 | 779,201 | ||||||
| Danaher Corp. | 5,248 | 570,248 | ||||||
| DexCom, Inc. * | 2,200 | 314,688 | ||||||
| Edwards Lifesciences Corp. * | 3,270 | 569,307 | ||||||
| IDEXX Laboratories, Inc. * | 2,339 | 583,955 | ||||||
| Intuitive Surgical, Inc. * | 2,336 | 1,340,864 | ||||||
| Medtronic plc | 5,559 | 546,839 | ||||||
| Penumbra, Inc. * | 1,970 | 294,909 | ||||||
| ResMed, Inc. | 1,105 | 127,451 | ||||||
| Stryker Corp. | 2,501 | 444,378 | ||||||
| Teleflex, Inc. | 1,073 | 285,515 | ||||||
|
| |||||||
| 10,322,566 | ||||||||
|
| |||||||
| Health Care Providers & Services - 3.4% | ||||||||
| AmerisourceBergen Corp. | 1,061 | 97,845 | ||||||
| Anthem, Inc. | 5,677 | 1,555,782 | ||||||
| Centene Corp. * | 4,020 | 582,016 | ||||||
| Chemed Corp. | 333 | 106,420 | ||||||
| HCA Healthcare, Inc. | 2,023 | 281,440 | ||||||
| Humana, Inc. | 1,534 | 519,290 | ||||||
| Molina Healthcare, Inc. * | 1,419 | 211,005 | ||||||
| UnitedHealth Group, Inc. | 16,053 | 4,270,740 | ||||||
| WellCare Health Plans, Inc. * | 276 | 88,455 | ||||||
|
| |||||||
| 7,712,993 | ||||||||
|
| |||||||
| Health Care Technology - 0.1% | ||||||||
| Veeva Systems, Inc., Class A * | 3,215 | 350,017 | ||||||
|
| |||||||
| Hotels, Restaurants & Leisure - 1.3% | ||||||||
| Carnival Corp. | 4,534 | 289,133 | ||||||
| Domino’s Pizza, Inc. | 432 | 127,354 | ||||||
| International Game Technology plc | 4,680 | 92,430 | ||||||
| The accompanying notes are an integral part of these financial statements. | (Continued) |
| AQR Funds | Annual Report | September 2018 | ||||||||||||||
126
Table of Contents
| Schedule of Investments | September 30, 2018 |
| AQR TM LARGE CAP MOMENTUM STYLE FUND |
| INVESTMENTS | SHARES | VALUE | ||||||
| Hotels, Restaurants & Leisure - 1.3% (continued) | ||||||||
| Las Vegas Sands Corp. | 3,358 | $ | 199,230 | |||||
| Marriott International, Inc., Class A | 2,977 | 393,053 | ||||||
| McDonald’s Corp. | 3,466 | 579,827 | ||||||
| Starbucks Corp. | 14,319 | 813,892 | ||||||
| Wynn Resorts Ltd. | 2,804 | 356,276 | ||||||
| Yum! Brands, Inc. | 1,024 | 93,092 | ||||||
|
| |||||||
| 2,944,287 | ||||||||
|
| |||||||
| Household Durables - 0.2% | ||||||||
| DR Horton, Inc. | 1,518 | 64,029 | ||||||
| Garmin Ltd. | 2,624 | 183,811 | ||||||
| Mohawk Industries, Inc. * | 936 | 164,128 | ||||||
| Whirlpool Corp. | 544 | 64,600 | ||||||
|
| |||||||
| 476,568 | ||||||||
|
| |||||||
| Industrial Conglomerates - 0.9% | ||||||||
| 3M Co. | 5,514 | 1,161,855 | ||||||
| Honeywell International, Inc. | 5,345 | 889,408 | ||||||
| Roper Technologies, Inc. (a) | 290 | 85,901 | ||||||
|
| |||||||
| 2,137,164 | ||||||||
|
| |||||||
| Insurance - 1.3% | ||||||||
| American Financial Group, Inc. | 1,717 | 190,535 | ||||||
| Arch Capital Group Ltd. * | 8,904 | 265,428 | ||||||
| Chubb Ltd. | 4,582 | 612,338 | ||||||
| Everest Re Group Ltd. | 999 | 228,242 | ||||||
| Hartford Financial Services Group, Inc. (The) | 3,282 | 163,969 | ||||||
| Markel Corp. * | 231 | 274,541 | ||||||
| Principal Financial Group, Inc. | 1,500 | 87,885 | ||||||
| Progressive Corp. (The) | 7,943 | 564,271 | ||||||
| RenaissanceRe Holdings Ltd. (a) | 513 | 68,527 | ||||||
| Travelers Cos., Inc. (The) | 3,459 | 448,667 | ||||||
|
| |||||||
| 2,904,403 | ||||||||
|
| |||||||
| Interactive Media & Services - 2.8% | ||||||||
| Alphabet, Inc., Class A * | 2,431 | 2,934,411 | ||||||
| Facebook, Inc., Class A * | 13,041 | 2,144,723 | ||||||
| IAC/InterActiveCorp * | 1,557 | 337,433 | ||||||
| Match Group, Inc. *(a) | 8,491 | 491,714 | ||||||
| Twitter, Inc. * | 11,160 | 317,614 | ||||||
| Zillow Group, Inc., Class C *(a) | 5,250 | 232,312 | ||||||
|
| |||||||
| 6,458,207 | ||||||||
|
| |||||||
| Internet & Direct Marketing Retail - 8.8% | ||||||||
| Amazon.com, Inc. * | 7,340 | 14,702,020 | ||||||
| Booking Holdings, Inc. * | 426 | 845,184 | ||||||
| eBay, Inc. * | 5,946 | 196,337 | ||||||
| Expedia Group, Inc. | 1,086 | 141,701 | ||||||
| GrubHub, Inc. * | 3,130 | 433,880 | ||||||
| Netflix, Inc. * | 8,775 | 3,282,991 | ||||||
| Wayfair, Inc., Class A * | 2,955 | 436,365 | ||||||
|
| |||||||
| 20,038,478 | ||||||||
|
| |||||||
| IT Services - 7.0% | ||||||||
| Accenture plc, Class A | 7,038 | 1,197,868 | ||||||
| Akamai Technologies, Inc. * | 1,027 | 75,125 | ||||||
| Amdocs Ltd. | 1,750 | 115,465 | ||||||
| Automatic Data Processing, Inc. | 3,980 | 599,627 | ||||||
| INVESTMENTS | SHARES | VALUE | ||||||
| IT Services - 7.0% (continued) | ||||||||
| Cognizant Technology Solutions Corp., Class A | 4,878 | $ | 376,338 | |||||
| DXC Technology Co. | 7,944 | 742,923 | ||||||
| EPAM Systems, Inc. * | 1,173 | 161,522 | ||||||
| Fiserv, Inc. * | 6,684 | 550,628 | ||||||
| FleetCor Technologies, Inc. * | 1,395 | 317,837 | ||||||
| Global Payments, Inc. | 919 | 117,080 | ||||||
| GoDaddy, Inc., Class A * | 5,725 | 477,408 | ||||||
| Jack Henry & Associates, Inc. | 1,350 | 216,108 | ||||||
| Mastercard, Inc., Class A | 12,391 | 2,758,360 | ||||||
| Okta, Inc. * | 8,140 | 572,730 | ||||||
| PayPal Holdings, Inc. * | 13,825 | 1,214,388 | ||||||
| Square, Inc., Class A * | 15,511 | 1,535,744 | ||||||
| Total System Services, Inc. | 2,522 | 249,022 | ||||||
| Twilio, Inc., Class A * | 8,796 | 758,919 | ||||||
| VeriSign, Inc. * | 939 | 150,353 | ||||||
| Visa, Inc., Class A (a) | 22,996 | 3,451,470 | ||||||
| WEX, Inc. * | 350 | 70,266 | ||||||
| Worldpay, Inc. * | 2,419 | 244,972 | ||||||
|
| |||||||
| 15,954,153 | ||||||||
|
| |||||||
| Leisure Products - 0.1% | ||||||||
| Brunswick Corp. | 1,969 | 131,962 | ||||||
|
| |||||||
| Life Sciences Tools & Services - 1.0% | ||||||||
| Illumina, Inc. * | 2,189 | 803,494 | ||||||
| IQVIA Holdings, Inc. * | 1,617 | 209,790 | ||||||
| Thermo Fisher Scientific, Inc. | 5,346 | 1,304,852 | ||||||
|
| |||||||
| 2,318,136 | ||||||||
|
| |||||||
| Machinery - 2.2% | ||||||||
| Caterpillar, Inc. | 7,666 | 1,168,988 | ||||||
| Deere & Co. | 2,753 | 413,859 | ||||||
| Dover Corp. | 2,076 | 183,788 | ||||||
| Fortive Corp. | 2,886 | 243,001 | ||||||
| Illinois Tool Works, Inc. | 4,089 | 577,040 | ||||||
| Ingersoll-Rand plc | 3,592 | 367,462 | ||||||
| Middleby Corp. (The) *(a) | 1,800 | 232,830 | ||||||
| Nordson Corp. | 909 | 126,260 | ||||||
| Oshkosh Corp. | 3,056 | 217,709 | ||||||
| Parker-Hannifin Corp. | 1,500 | 275,895 | ||||||
| Trinity Industries, Inc. | 17,214 | 630,721 | ||||||
| WABCO Holdings, Inc. * | 800 | 94,352 | ||||||
| Xylem, Inc. | 6,645 | 530,736 | ||||||
|
| |||||||
| 5,062,641 | ||||||||
|
| |||||||
| Media - 0.4% | ||||||||
| CBS Corp. (Non-Voting), Class B | 1,432 | 82,268 | ||||||
| Comcast Corp., Class A | 19,352 | 685,254 | ||||||
| Liberty Broadband Corp., Class C * | 872 | 73,510 | ||||||
| Sirius XM Holdings, Inc. (a) | 15,350 | 97,012 | ||||||
|
| |||||||
| 938,044 | ||||||||
|
| |||||||
| Metals & Mining - 0.4% | ||||||||
| Royal Gold, Inc. | 1,081 | 83,302 | ||||||
| Steel Dynamics, Inc. | 10,719 | 484,392 | ||||||
| United States Steel Corp. | 8,213 | 250,332 | ||||||
|
| |||||||
| 818,026 | ||||||||
|
| |||||||
| The accompanying notes are an integral part of these financial statements. | (Continued) |
| AQR Funds | Annual Report | September 2018 | ||||||||||||||
127
Table of Contents
| Schedule of Investments | September 30, 2018 |
| AQR TM LARGE CAP MOMENTUM STYLE FUND |
| INVESTMENTS | SHARES | VALUE | ||||||
| Multiline Retail - 0.7% | ||||||||
| Dollar General Corp. | 1,884 | $ | 205,921 | |||||
| Dollar Tree, Inc. * | 2,285 | 186,342 | ||||||
| Kohl’s Corp. | 2,775 | 206,876 | ||||||
| Macy’s, Inc. | 11,026 | 382,933 | ||||||
| Target Corp. | 6,867 | 605,738 | ||||||
|
| |||||||
| 1,587,810 | ||||||||
|
| |||||||
| Multi-Utilities - 0.4% | ||||||||
| Ameren Corp. | 4,264 | 269,570 | ||||||
| CMS Energy Corp. | 2,100 | 102,900 | ||||||
| Consolidated Edison, Inc. | 1,980 | 150,856 | ||||||
| DTE Energy Co. | 3,287 | 358,711 | ||||||
|
| |||||||
| 882,037 | ||||||||
|
| |||||||
| Oil, Gas & Consumable Fuels - 4.7% | ||||||||
| Anadarko Petroleum Corp. | 6,902 | 465,264 | ||||||
| Cheniere Energy, Inc. * | 3,787 | 263,159 | ||||||
| CNX Resources Corp. * | 9,336 | 133,598 | ||||||
| Concho Resources, Inc. * | 484 | 73,931 | ||||||
| ConocoPhillips | 18,796 | 1,454,810 | ||||||
| Continental Resources, Inc. * | 8,876 | 606,053 | ||||||
| Devon Energy Corp. | 5,542 | 221,348 | ||||||
| Diamondback Energy, Inc. | 8,282 | 1,119,644 | ||||||
| EOG Resources, Inc. | 5,751 | 733,655 | ||||||
| Hess Corp. | 5,481 | 392,330 | ||||||
| HollyFrontier Corp. | 4,920 | 343,908 | ||||||
| Kosmos Energy Ltd. (Ghana) *(a) | 13,878 | 129,759 | ||||||
| Marathon Oil Corp. | 24,762 | 576,459 | ||||||
| Marathon Petroleum Corp. | 7,052 | 563,948 | ||||||
| Occidental Petroleum Corp. | 6,628 | 544,623 | ||||||
| ONEOK, Inc. | 7,446 | 504,764 | ||||||
| Phillips 66 | 4,393 | 495,179 | ||||||
| QEP Resources, Inc. * | 9,109 | 103,114 | ||||||
| SM Energy Co. | 7,014 | 221,151 | ||||||
| Valero Energy Corp. | 6,265 | 712,644 | ||||||
| Whiting Petroleum Corp. * | 8,689 | 460,865 | ||||||
| WPX Energy, Inc. * | 26,497 | 533,120 | ||||||
|
| |||||||
| 10,653,326 | ||||||||
|
| |||||||
| Personal Products - 0.2% | ||||||||
| Estee Lauder Cos., Inc. (The), Class A | 2,994 | 435,088 | ||||||
| Nu Skin Enterprises, Inc., Class A | 1,366 | 112,586 | ||||||
|
| |||||||
| 547,674 | ||||||||
|
| |||||||
| Pharmaceuticals - 1.2% | ||||||||
| Bristol-Myers Squibb Co. | 1,287 | 79,897 | ||||||
| Eli Lilly & Co. | 7,307 | 784,114 | ||||||
| Johnson & Johnson | 4,729 | 653,406 | ||||||
| Nektar Therapeutics * | 8,815 | 537,363 | ||||||
| Zoetis, Inc. | 6,713 | 614,642 | ||||||
|
| |||||||
| 2,669,422 | ||||||||
|
| |||||||
| Professional Services - 0.4% | ||||||||
| CoStar Group, Inc. * | 838 | 352,664 | ||||||
| Equifax, Inc. | 651 | 85,001 | ||||||
| TransUnion | 4,008 | 294,909 | ||||||
| Verisk Analytics, Inc. * | 906 | 109,218 | ||||||
|
| |||||||
| 841,792 | ||||||||
|
| |||||||
| INVESTMENTS | SHARES | VALUE | ||||||
| Road & Rail - 0.8% | ||||||||
| CSX Corp. | 10,461 | $ | 774,637 | |||||
| Norfolk Southern Corp. | 2,500 | 451,250 | ||||||
| Old Dominion Freight Line, Inc. | 1,956 | 315,425 | ||||||
| Union Pacific Corp. | 2,312 | 376,463 | ||||||
|
| |||||||
| 1,917,775 | ||||||||
|
| |||||||
| Semiconductors & Semiconductor Equipment - 5.9% | ||||||||
| Advanced Micro Devices, Inc. * | 7,285 | 225,034 | ||||||
| Analog Devices, Inc. | 977 | 90,333 | ||||||
| Applied Materials, Inc. | 25,474 | 984,570 | ||||||
| Broadcom, Inc. | 3,010 | 742,657 | ||||||
| Cypress Semiconductor Corp. (a) | 17,005 | 246,402 | ||||||
| Intel Corp. | 22,390 | 1,058,823 | ||||||
| Lam Research Corp. | 1,937 | 293,843 | ||||||
| Marvell Technology Group Ltd. | 5,944 | 114,719 | ||||||
| Microchip Technology, Inc. (a) | 1,024 | 80,804 | ||||||
| Micron Technology, Inc. * | 37,507 | 1,696,442 | ||||||
| NVIDIA Corp. | 18,364 | 5,160,651 | ||||||
| ON Semiconductor Corp. * | 25,190 | 464,252 | ||||||
| Skyworks Solutions, Inc. | 3,805 | 345,152 | ||||||
| Texas Instruments, Inc. | 16,400 | 1,759,556 | ||||||
| Xilinx, Inc. | 2,840 | 227,683 | ||||||
|
| |||||||
| 13,490,921 | ||||||||
|
| |||||||
| Software - 10.4% | ||||||||
| 2U, Inc. *(a) | 765 | 57,520 | ||||||
| Adobe Systems, Inc. * | 10,510 | 2,837,175 | ||||||
| ANSYS, Inc. * | 2,671 | 498,622 | ||||||
| Aspen Technology, Inc. * | 1,210 | 137,831 | ||||||
| Atlassian Corp. plc, Class A * | 9,509 | 914,195 | ||||||
| Autodesk, Inc. * | 2,283 | 356,399 | ||||||
| Fortinet, Inc. * | 3,221 | 297,202 | ||||||
| Guidewire Software, Inc. * | 2,220 | 224,242 | ||||||
| Intuit, Inc. | 4,182 | 950,987 | ||||||
| Microsoft Corp. | 96,879 | 11,080,051 | ||||||
| Nutanix, Inc., Class A * | 7,699 | 328,901 | ||||||
| Paycom Software, Inc. * | 2,747 | 426,911 | ||||||
| PTC, Inc. * | 2,038 | 216,415 | ||||||
| RealPage, Inc. * | 2,693 | 177,469 | ||||||
| Red Hat, Inc. * | 2,671 | 364,004 | ||||||
| RingCentral, Inc., Class A * | 5,519 | 513,543 | ||||||
| salesforce.com, Inc. * | 8,264 | 1,314,224 | ||||||
| ServiceNow, Inc. * | 4,455 | 871,532 | ||||||
| Splunk, Inc. * | 2,785 | 336,735 | ||||||
| SS&C Technologies Holdings, Inc. | 2,522 | 143,325 | ||||||
| Tableau Software, Inc., Class A * | 2,627 | 293,541 | ||||||
| Tyler Technologies, Inc. * | 831 | 203,645 | ||||||
| VMware, Inc., Class A * | 4,579 | 714,599 | ||||||
| Zendesk, Inc. * | 8,499 | 603,429 | ||||||
|
| |||||||
| 23,862,497 | ||||||||
|
| |||||||
| Specialty Retail - 3.2% | ||||||||
| Best Buy Co., Inc. | 4,524 | 359,025 | ||||||
| Burlington Stores, Inc. * | 4,332 | 705,769 | ||||||
| Floor & Decor Holdings, Inc., Class A * | 2,043 | 61,637 | ||||||
| Gap, Inc. (The) | 10,735 | 309,705 | ||||||
| Home Depot, Inc. (The) | 9,771 | 2,024,063 | ||||||
| Lowe’s Cos., Inc. | 6,384 | 733,011 | ||||||
| O’Reilly Automotive, Inc. * | 1,392 | 483,469 | ||||||
| The accompanying notes are an integral part of these financial statements. | (Continued) |
| AQR Funds | Annual Report | September 2018 | ||||||||||||||
128
Table of Contents
| Schedule of Investments | September 30, 2018 |
| AQR TM LARGE CAP MOMENTUM STYLE FUND |
| INVESTMENTS | SHARES | VALUE | ||||||
| Specialty Retail - 3.2% (continued) | ||||||||
| Ross Stores, Inc. | 10,017 | $ | 992,685 | |||||
| TJX Cos., Inc. (The) | 5,142 | 576,007 | ||||||
| Ulta Beauty, Inc. * | 1,847 | 521,076 | ||||||
| Urban Outfitters, Inc. * | 14,376 | 587,978 | ||||||
|
| |||||||
| 7,354,425 | ||||||||
|
| |||||||
| Technology Hardware, Storage & Peripherals - 6.9% | ||||||||
| Apple, Inc. | 63,144 | 14,254,127 | ||||||
| Hewlett Packard Enterprise Co. | 5,467 | 89,167 | ||||||
| HP, Inc. | 25,956 | 668,886 | ||||||
| NetApp, Inc. | 4,402 | 378,088 | ||||||
| Pure Storage, Inc., Class A * | 10,992 | 285,242 | ||||||
|
| |||||||
| 15,675,510 | ||||||||
|
| |||||||
| Textiles, Apparel & Luxury Goods - 1.7% | ||||||||
| Columbia Sportswear Co. | 5,508 | 512,629 | ||||||
| Lululemon Athletica, Inc. * | 3,226 | 524,193 | ||||||
| Michael Kors Holdings Ltd. * | 900 | 61,704 | ||||||
| NIKE, Inc., Class B | 18,929 | 1,603,665 | ||||||
| PVH Corp. | 759 | 109,600 | ||||||
| Ralph Lauren Corp. | 2,251 | 309,625 | ||||||
| VF Corp. | 7,224 | 675,083 | ||||||
|
| |||||||
| 3,796,499 | ||||||||
|
| |||||||
| Tobacco - 0.2% | ||||||||
| Altria Group, Inc. | 8,400 | 506,604 | ||||||
|
| |||||||
| Trading Companies & Distributors - 0.4% | ||||||||
| HD Supply Holdings, Inc. * | 2,092 | 89,517 | ||||||
| United Rentals, Inc. * | 3,686 | 603,029 | ||||||
| WW Grainger, Inc. | 327 | 116,873 | ||||||
|
| |||||||
| 809,419 | ||||||||
|
| |||||||
| Wireless Telecommunication Services - 0.3% | ||||||||
| T-Mobile US, Inc. * | 8,471 | 594,495 | ||||||
|
| |||||||
TOTAL COMMON STOCKS | 220,931,001 | |||||||
|
| |||||||
| SHORT-TERM INVESTMENTS - 3.2% | ||||||||
| Investment Companies - 3.2% | ||||||||
| Limited Purpose Cash Investment Fund, 2.06% (c) | ||||||||
(Cost $7,352,714) | 7,353,907 | 7,353,171 | ||||||
|
| |||||||
| INVESTMENTS | SHARES | VALUE | ||||||
| SECURITIES LENDING COLLATERAL - 1.2% | ||||||||
| Investment Companies - 1.2% | ||||||||
| Investments in a Pooled Account through Securities Lending Program with Citibank NA | ||||||||
| BlackRock Liquidity Funds T-Fund Portfolio, Institutional Shares 1.97% (c)(d) | 320,131 | $ | 320,131 | |||||
| Limited Purpose Cash Investment Fund 2.06% (c)(d) | 2,297,129 | 2,296,899 | ||||||
|
| |||||||
TOTAL SECURITIES LENDING COLLATERAL | 2,617,030 | |||||||
|
| |||||||
TOTAL INVESTMENTS IN SECURITIES |
| 230,901,202 | ||||||
|
| |||||||
| LIABILITIES IN EXCESS OF OTHER ASSETS - (1.1)% (e) | (2,489,640) | |||||||
|
| |||||||
NET ASSETS - 100.0% | $ | 228,411,562 | ||||||
|
| |||||||
| SECTOR | VALUE | % OF NET ASSETS | ||||||
| Communication Services | $ | 10,891,305 | 4.8 | % | ||||
| Consumer Discretionary | 36,751,005 | 16.1 | ||||||
| Consumer Staples | 3,291,674 | 1.4 | ||||||
| Energy | 10,950,299 | 4.8 | ||||||
| Financials | 24,786,669 | 10.9 | ||||||
| Health Care | 27,730,216 | 12.1 | ||||||
| Industrials | 24,464,610 | 10.7 | ||||||
| Information Technology | 73,548,669 | 32.2 | ||||||
| Materials | 2,854,692 | 1.3 | ||||||
| Real Estate | 2,850,638 | 1.2 | ||||||
| Utilities | 2,811,224 | 1.2 | ||||||
| Short-Term Investments | 7,353,171 | 3.2 | ||||||
| Securities Lending Collateral | 2,617,030 | 1.2 | ||||||
|
|
|
| |||||
Total Investments In Securities At Value | 230,901,202 | 101.1 | ||||||
| Liabilities in Excess of Other Assets (e) | (2,489,640 | ) | (1.1 | ) | ||||
|
|
|
| |||||
Net Assets | $ | 228,411,562 | 100.0 | % | ||||
|
|
|
| |||||
| The accompanying notes are an integral part of these financial statements. | (Continued) |
| AQR Funds | Annual Report | September 2018 | ||||||||||||||
129
Table of Contents
| Schedule of Investments | September 30, 2018 |
| AQR TM LARGE CAP MOMENTUM STYLE FUND |
| * | Non-income producing security. |
| (a) | The security or a portion of this security is on loan at September 30, 2018. The total value of securities on loan at September 30, 2018 was $5,184,280. |
| (b) | Represents less than 0.05% of net assets. |
| (c) | Represents 7-day effective yield as of September 30, 2018. |
| (d) | Represents security, or portion thereof, purchased with the cash collateral received for securities on loan; additional non-cash collateral of $2,689,054 was received (See Note 3). |
| (e) | Includes appreciation/(depreciation) on futures contracts. |
All securities are Level 1 with respect to ASC 820 (See Note 4).
Futures contracts outstanding as of September 30, 2018:
Exchange Traded
| DESCRIPTION | NUMBER OF CONTRACTS | EXPIRATION DATE | TRADING CURRENCY | NOTIONAL AMOUNT | VALUE AND UNREALIZED APPRECIATION (DEPRECIATION) | |||||||||||
| Long Contracts | ||||||||||||||||
| S&P 500 E-Mini Index | 30 | 12/2018 | USD | $4,378,500 | $20,957 | |||||||||||
|
| |||||||||||||||
| $20,957 | ||||||||||||||||
|
| |||||||||||||||
USD - United States Dollar
Collateral pledged to, or (received from), each counterparty at September 30, 2018 was as follows:
| COUNTERPARTY | OVER THE COUNTER | EXCHANGE TRADED | TOTAL | |||||||||
| GSCO | ||||||||||||
| Cash | $— | $175,396 | $175,396 | |||||||||
| ||||||||||||
| The accompanying notes are an integral part of these financial statements. |
| AQR Funds | Annual Report | September 2018 | ||||||||||||||
130
Table of Contents
| Schedule of Investments | September 30, 2018 |
| AQR TM SMALL CAP MOMENTUM STYLE FUND |
| INVESTMENTS | SHARES | VALUE | ||||||
| COMMON STOCKS - 97.3% |
| |||||||
| Aerospace & Defense - 1.4% | ||||||||
| AAR Corp. | 1,190 | $ | 56,989 | |||||
| Aerojet Rocketdyne Holdings, Inc. * | 2,469 | 83,921 | ||||||
| Aerovironment, Inc. * | 1,689 | 189,455 | ||||||
| Axon Enterprise, Inc. * | 3,739 | 255,860 | ||||||
| Cubic Corp., Class R | 322 | 23,522 | ||||||
| Ducommun, Inc. * | 1,446 | 59,055 | ||||||
| Engility Holdings, Inc. * | 1,335 | 48,047 | ||||||
| Esterline Technologies Corp. * | 275 | 25,011 | ||||||
| Kratos Defense & Security Solutions, Inc. * | 6,806 | 100,593 | ||||||
| Mercury Systems, Inc. *(a) | 1,839 | 101,733 | ||||||
| Vectrus, Inc. * | 904 | 28,196 | ||||||
|
| |||||||
| 972,382 | ||||||||
|
| |||||||
| Air Freight & Logistics - 0.2% | ||||||||
| Air Transport Services Group, Inc. * | 995 | 21,363 | ||||||
| Atlas Air Worldwide Holdings, Inc. * | 400 | 25,500 | ||||||
| Echo Global Logistics, Inc. * | 1,869 | 57,845 | ||||||
| Hub Group, Inc., Class A * | 406 | 18,514 | ||||||
|
| |||||||
| 123,222 | ||||||||
|
| |||||||
| Airlines - 0.2% | ||||||||
| Allegiant Travel Co. | 284 | 36,011 | ||||||
| SkyWest, Inc. | 1,846 | 108,730 | ||||||
|
| |||||||
| 144,741 | ||||||||
|
| |||||||
| Auto Components - 0.6% | ||||||||
| Cooper-Standard Holdings, Inc. * | 845 | 101,383 | ||||||
| Dorman Products, Inc. * | 322 | 24,768 | ||||||
| Fox Factory Holding Corp. * | 1,895 | 132,745 | ||||||
| Gentherm, Inc. * | 1,057 | 48,041 | ||||||
| LCI Industries | 235 | 19,458 | ||||||
| Modine Manufacturing Co. * | 2,061 | 30,709 | ||||||
| Motorcar Parts of America, Inc. * | 1,306 | 30,626 | ||||||
| Standard Motor Products, Inc. | 641 | 31,550 | ||||||
| Tower International, Inc. | 753 | 22,778 | ||||||
|
| |||||||
| 442,058 | ||||||||
|
| |||||||
| Automobiles - 0.0% (b) | ||||||||
| Winnebago Industries, Inc. | 548 | 18,166 | ||||||
|
| |||||||
| Banks - 3.3% | ||||||||
| Allegiance Bancshares, Inc. * | 1,709 | 71,265 | ||||||
| Ameris Bancorp | 1,938 | 88,567 | ||||||
| Banc of California, Inc. | 1,072 | 20,261 | ||||||
| Blue Hills Bancorp, Inc. | 1,200 | 28,920 | ||||||
| Boston Private Financial Holdings, Inc. | 1,715 | 23,410 | ||||||
| Carolina Financial Corp. | 2,944 | 111,048 | ||||||
| CenterState Bank Corp. | 1,137 | 31,893 | ||||||
| Central Pacific Financial Corp. | 835 | 22,069 | ||||||
| Central Valley Community Bancorp | 399 | 8,622 | ||||||
| ConnectOne Bancorp, Inc. | 1,237 | 29,379 | ||||||
| Eagle Bancorp, Inc. * | 980 | 49,588 | ||||||
| Enterprise Financial Services Corp. | 1,251 | 66,366 | ||||||
| Fidelity Southern Corp. | 1,125 | 27,877 | ||||||
| First Bancorp/PR * | 13,278 | 120,830 | ||||||
| First Commonwealth Financial Corp. | 1,291 | 20,837 | ||||||
| First Interstate BancSystem, Inc., Class A | 2,466 | 110,477 | ||||||
| First Merchants Corp. | 654 | 29,423 | ||||||
| INVESTMENTS | SHARES | VALUE | ||||||
| Banks - 3.3% (continued) | ||||||||
| Great Western Bancorp, Inc. | 2,149 | $ | 90,666 | |||||
| Horizon Bancorp, Inc. | 1,113 | 21,982 | ||||||
| Independent Bank Corp./MA | 552 | 45,595 | ||||||
| Independent Bank Corp./MI | 4,596 | 108,695 | ||||||
| Independent Bank Group, Inc. | 858 | 56,885 | ||||||
| Lakeland Financial Corp. | 1,783 | 82,874 | ||||||
| LegacyTexas Financial Group, Inc. | 700 | 29,820 | ||||||
| National Bank Holdings Corp., Class A | 1,243 | 46,799 | ||||||
| National Commerce Corp. * | 585 | 24,161 | ||||||
| OFG Bancorp | 3,429 | 55,378 | ||||||
| Old Second Bancorp, Inc. | 3,326 | 51,387 | ||||||
| Pacific Premier Bancorp, Inc. * | 850 | 31,620 | ||||||
| Peoples Bancorp, Inc. | 732 | 25,642 | ||||||
| People’s Utah Bancorp | 1,275 | 43,286 | ||||||
| Preferred Bank | 1,222 | 71,487 | ||||||
| QCR Holdings, Inc. | 517 | 21,119 | ||||||
| Republic First Bancorp, Inc. * | 10,891 | 77,871 | ||||||
| Seacoast Banking Corp. of Florida * | 1,369 | 39,975 | ||||||
| ServisFirst Bancshares, Inc. | 5,062 | 198,177 | ||||||
| Southside Bancshares, Inc. | 813 | 28,292 | ||||||
| Towne Bank (a) | 1,096 | 33,812 | ||||||
| TriState Capital Holdings, Inc. * | 1,369 | 37,784 | ||||||
| Triumph Bancorp, Inc. * | 1,976 | 75,483 | ||||||
| United Community Banks, Inc. | 2,355 | 65,681 | ||||||
| Veritex Holdings, Inc. * | 1,029 | 29,080 | ||||||
|
| |||||||
| 2,254,383 | ||||||||
|
| |||||||
| Beverages - 0.7% | ||||||||
| Boston Beer Co., Inc. (The), Class A * | 309 | 88,837 | ||||||
| Coca-Cola Bottling Co. Consolidated | 135 | 24,608 | ||||||
| Craft Brew Alliance, Inc. * | 1,463 | 23,920 | ||||||
| MGP Ingredients, Inc. (a) | 1,264 | 99,831 | ||||||
| National Beverage Corp. *(a) | 1,810 | 211,082 | ||||||
|
| |||||||
| 448,278 | ||||||||
|
| |||||||
| Biotechnology - 11.4% | ||||||||
| Abeona Therapeutics, Inc. * | 5,422 | 69,402 | ||||||
| Acceleron Pharma, Inc. * | 538 | 30,790 | ||||||
| Acorda Therapeutics, Inc. * | 1,537 | 30,202 | ||||||
| Adamas Pharmaceuticals, Inc. *(a) | 888 | 17,778 | ||||||
| Adverum Biotechnologies, Inc. * | 5,990 | 36,239 | ||||||
| Aeglea BioTherapeutics, Inc. * | 3,738 | 35,773 | ||||||
| Aimmune Therapeutics, Inc. * | 3,053 | 83,286 | ||||||
| Alder Biopharmaceuticals, Inc. *(a) | 1,585 | 26,390 | ||||||
| Amicus Therapeutics, Inc. *(a) | 5,721 | 69,167 | ||||||
| AnaptysBio, Inc. * | 1,714 | 171,006 | ||||||
| Arbutus Biopharma Corp. (Canada) *(a) | 6,849 | 64,723 | ||||||
| Arena Pharmaceuticals, Inc. * | 3,480 | 160,150 | ||||||
| ArQule, Inc. *(a) | 20,323 | 115,028 | ||||||
| Array BioPharma, Inc. * | 13,008 | 197,722 | ||||||
| Arrowhead Pharmaceuticals, Inc. *(a) | 13,299 | 254,942 | ||||||
| Atara Biotherapeutics, Inc. *(a) | 3,145 | 130,046 | ||||||
| Athersys, Inc. * | 13,981 | 29,360 | ||||||
| Audentes Therapeutics, Inc. * | 2,271 | 89,909 | ||||||
| AVEO Pharmaceuticals, Inc. *(a) | 22,930 | 75,898 | ||||||
| Avid Bioservices, Inc. *(a) | 1,371 | 9,405 | ||||||
| Biohaven Pharmaceutical Holding Co. Ltd. * | 558 | 20,953 | ||||||
| BioSpecifics Technologies Corp. * | 495 | 28,953 | ||||||
| Blueprint Medicines Corp. * | 2,780 | 217,007 | ||||||
| The accompanying notes are an integral part of these financial statements. | (Continued) |
| AQR Funds | Annual Report | September 2018 | ||||||||||||||
131
Table of Contents
| Schedule of Investments | September 30, 2018 |
| AQR TM SMALL CAP MOMENTUM STYLE FUND |
| INVESTMENTS | SHARES | VALUE | ||||||
| Biotechnology - 11.4% (continued) | ||||||||
| Cara Therapeutics, Inc. * | 1,783 | $ | 42,703 | |||||
| CareDx, Inc. * | 9,426 | 271,940 | ||||||
| CASI Pharmaceuticals, Inc. * | 12,548 | 58,599 | ||||||
| Catalyst Biosciences, Inc. * | 3,929 | 42,355 | ||||||
| Catalyst Pharmaceuticals, Inc. * | 27,771 | 104,974 | ||||||
| Cellular Biomedicine Group, Inc. * | 1,560 | 28,314 | ||||||
| ChemoCentryx, Inc. * | 3,517 | 44,455 | ||||||
| CTI BioPharma Corp. * | 370 | 799 | ||||||
| CytomX Therapeutics, Inc. * | 1,995 | 36,907 | ||||||
| Dicerna Pharmaceuticals, Inc. *(a) | 7,394 | 112,832 | ||||||
| Eagle Pharmaceuticals, Inc. * | 385 | 26,692 | ||||||
| Editas Medicine, Inc. * | 2,947 | 93,774 | ||||||
| Emergent BioSolutions, Inc. * | 1,332 | 87,686 | ||||||
| Enanta Pharmaceuticals, Inc. * | 1,711 | 146,222 | ||||||
| Epizyme, Inc. *(a) | 2,095 | 22,207 | ||||||
| Esperion Therapeutics, Inc. * | 1,412 | 62,650 | ||||||
| Fate Therapeutics, Inc. * | 6,292 | 102,497 | ||||||
| Fennec Pharmaceuticals, Inc. (Canada) * | 2,346 | 19,237 | ||||||
| FibroGen, Inc. * | 4,305 | 261,529 | ||||||
| Flexion Therapeutics, Inc. *(a) | 1,317 | 24,641 | ||||||
| G1 Therapeutics, Inc. * | 2,644 | 138,255 | ||||||
| Genomic Health, Inc. * | 827 | 58,072 | ||||||
| Geron Corp. *(a) | 13,653 | 24,029 | ||||||
| Global Blood Therapeutics, Inc. *(a) | 2,463 | 93,594 | ||||||
| GTx, Inc. * | 4,236 | 6,651 | ||||||
| Halozyme Therapeutics, Inc. * | 3,681 | 66,884 | ||||||
| ImmunoGen, Inc. * | 8,871 | 84,008 | ||||||
| Immunomedics, Inc. *(a) | 15,035 | 313,179 | ||||||
| Insmed, Inc. * | 2,533 | 51,217 | ||||||
| Intellia Therapeutics, Inc. *(a) | 1,028 | 29,421 | ||||||
| Iovance Biotherapeutics, Inc. * | 6,539 | 73,564 | ||||||
| Ironwood Pharmaceuticals, Inc. * | 1,510 | 27,875 | ||||||
| Karyopharm Therapeutics, Inc. * | 5,708 | 97,207 | ||||||
| Kura Oncology, Inc. * | 1,793 | 31,378 | ||||||
| Lexicon Pharmaceuticals, Inc. * | 2,244 | 23,943 | ||||||
| Ligand Pharmaceuticals, Inc. * | 1,111 | 304,958 | ||||||
| Loxo Oncology, Inc. * | 2,350 | 401,451 | ||||||
| Madrigal Pharmaceuticals, Inc. *(a) | 1,335 | 285,864 | ||||||
| Mirati Therapeutics, Inc. * | 3,812 | 179,545 | ||||||
| Momenta Pharmaceuticals, Inc. * | 2,008 | 52,810 | ||||||
| Myriad Genetics, Inc. * | 4,728 | 217,488 | ||||||
| Natera, Inc. * | 2,727 | 65,284 | ||||||
| Pieris Pharmaceuticals, Inc. * | 6,644 | 37,206 | ||||||
| PolarityTE, Inc. *(a) | 1,145 | 21,870 | ||||||
| PTC Therapeutics, Inc. * | 2,980 | 140,060 | ||||||
| REGENXBIO, Inc. * | 3,555 | 268,403 | ||||||
| Repligen Corp. * | 1,280 | 70,989 | ||||||
| Retrophin, Inc. * | 2,107 | 60,534 | ||||||
| Sangamo Therapeutics, Inc. *(a) | 4,833 | 81,919 | ||||||
| Savara, Inc. * | 3,138 | 35,020 | ||||||
| Sorrento Therapeutics, Inc. *(a) | 10,873 | 47,841 | ||||||
| Spectrum Pharmaceuticals, Inc. * | 7,436 | 124,925 | ||||||
| Stemline Therapeutics, Inc. * | 2,583 | 42,878 | ||||||
| T2 Biosystems, Inc. * | 6,373 | 47,479 | ||||||
| TG Therapeutics, Inc. * | 3,414 | 19,118 | ||||||
| Ultragenyx Pharmaceutical, Inc. * | 272 | 20,764 | ||||||
| Vanda Pharmaceuticals, Inc. * | 1,751 | 40,185 | ||||||
| Verastem, Inc. *(a) | 9,980 | 72,355 | ||||||
| Vericel Corp. * | 6,001 | 84,914 | ||||||
| INVESTMENTS | SHARES | VALUE | ||||||
| Biotechnology - 11.4% (continued) | ||||||||
| Viking Therapeutics, Inc. *(a) | 12,115 | $ | 211,043 | |||||
| Vital Therapies, Inc. * | 9,540 | 2,627 | ||||||
| Voyager Therapeutics, Inc. * | 2,610 | 49,381 | ||||||
| Xencor, Inc. * | 2,514 | 97,971 | ||||||
| XOMA Corp. *(a) | 1,852 | 32,540 | ||||||
| Zafgen, Inc. * | 5,715 | 66,808 | ||||||
|
| |||||||
| 7,858,649 | ||||||||
|
| |||||||
| Building Products - 1.2% | ||||||||
| AAON, Inc. (a) | 1,050 | 39,690 | ||||||
| Advanced Drainage Systems, Inc. | 641 | 19,807 | ||||||
| American Woodmark Corp. * | 503 | 39,460 | ||||||
| Apogee Enterprises, Inc. | 791 | 32,684 | ||||||
| Builders FirstSource, Inc. * | 2,458 | 36,084 | ||||||
| Continental Building Products, Inc. * | 1,526 | 57,301 | ||||||
| Gibraltar Industries, Inc. * | 1,568 | 71,501 | ||||||
| Masonite International Corp. * | 767 | 49,165 | ||||||
| NCI Building Systems, Inc. * | 1,241 | 18,801 | ||||||
| Patrick Industries, Inc. * | 3,099 | 183,461 | ||||||
| PGT Innovations, Inc. * | 2,087 | 45,079 | ||||||
| Simpson Manufacturing Co., Inc. | 709 | 51,374 | ||||||
| Trex Co., Inc. * | 2,200 | 169,356 | ||||||
|
| |||||||
| 813,763 | ||||||||
|
| |||||||
| Capital Markets - 1.4% | ||||||||
| Blucora, Inc. * | 4,127 | 166,112 | ||||||
| Hamilton Lane, Inc., Class A | 3,174 | 140,545 | ||||||
| Houlihan Lokey, Inc. | 3,975 | 178,597 | ||||||
| Investment Technology Group, Inc. | 1,146 | 24,822 | ||||||
| Ladenburg Thalmann Financial Services, Inc. | 9,591 | 25,896 | ||||||
| Moelis & Co., Class A | 3,290 | 180,292 | ||||||
| Oppenheimer Holdings, Inc., Class A | 1,046 | 33,053 | ||||||
| Piper Jaffray Cos. | 826 | 63,065 | ||||||
| PJT Partners, Inc., Class A | 2,344 | 122,708 | ||||||
| Stifel Financial Corp. | 987 | 50,594 | ||||||
|
| |||||||
| 985,684 | ||||||||
|
| |||||||
| Chemicals - 1.5% | ||||||||
| AdvanSix, Inc. * | 705 | 23,935 | ||||||
| Chase Corp. | 298 | 35,805 | ||||||
| Ferro Corp. * | 3,584 | 83,220 | ||||||
| Ingevity Corp. * | 1,654 | 168,510 | ||||||
| Innophos Holdings, Inc. | 508 | 22,555 | ||||||
| Innospec, Inc. | 332 | 25,481 | ||||||
| Intrepid Potash, Inc. * | 10,284 | 36,920 | ||||||
| Kraton Corp. * | 1,461 | 68,886 | ||||||
| Kronos Worldwide, Inc. | 5,539 | 90,009 | ||||||
| Minerals Technologies, Inc. | 500 | 33,800 | ||||||
| PolyOne Corp. | 639 | 27,937 | ||||||
| Rayonier Advanced Materials, Inc. | 1,897 | 34,962 | ||||||
| Sensient Technologies Corp. (a) | 883 | 67,558 | ||||||
| Trinseo SA | 2,538 | 198,725 | ||||||
| Tronox Ltd., Class A | 4,270 | 51,027 | ||||||
| Valhi, Inc. | 11,680 | 26,630 | ||||||
|
| |||||||
| 995,960 | ||||||||
|
| |||||||
| Commercial Services & Supplies - 1.4% | ||||||||
| ACCO Brands Corp. | 1,709 | 19,312 | ||||||
| Brady Corp., Class A | 570 | 24,938 | ||||||
| Brink’s Co. (The) | 1,295 | 90,326 | ||||||
| The accompanying notes are an integral part of these financial statements. | (Continued) |
| AQR Funds | Annual Report | September 2018 | ||||||||||||||
132
Table of Contents
| Schedule of Investments | September 30, 2018 |
| AQR TM SMALL CAP MOMENTUM STYLE FUND |
| INVESTMENTS | SHARES | VALUE | ||||||
| Commercial Services & Supplies - 1.4% (continued) | ||||||||
| Casella Waste Systems, Inc., Class A * | 1,226 | $ | 38,080 | |||||
| Cimpress NV (Netherlands) *(a) | 1,521 | 207,784 | ||||||
| Healthcare Services Group, Inc. (a) | 645 | 26,200 | ||||||
| Interface, Inc. | 1,215 | 28,370 | ||||||
| Kimball International, Inc., Class B | 1,371 | 22,964 | ||||||
| McGrath RentCorp | 1,981 | 107,905 | ||||||
| Mobile Mini, Inc. | 2,267 | 99,408 | ||||||
| MSA Safety, Inc. | 319 | 33,954 | ||||||
| Multi-Color Corp. | 444 | 27,639 | ||||||
| Quad/Graphics, Inc. | 1,804 | 37,595 | ||||||
| SP Plus Corp. * | 660 | 24,090 | ||||||
| Team, Inc. *(a) | 872 | 19,620 | ||||||
| Tetra Tech, Inc. | 727 | 49,654 | ||||||
| UniFirst Corp. | 112 | 19,449 | ||||||
| US Ecology, Inc. | 349 | 25,739 | ||||||
| Viad Corp. | 445 | 26,366 | ||||||
|
| |||||||
| 929,393 | ||||||||
|
| |||||||
| Communications Equipment - 0.5% | ||||||||
| Comtech Telecommunications Corp. | 1,497 | 54,296 | ||||||
| Extreme Networks, Inc. * | 3,374 | 18,490 | ||||||
| InterDigital, Inc. | 771 | 61,680 | ||||||
| Lumentum Holdings, Inc. *(a) | 1,946 | 116,663 | ||||||
| NETGEAR, Inc. * | 297 | 18,666 | ||||||
| Plantronics, Inc. | 464 | 27,979 | ||||||
| ViaSat, Inc. *(a) | 411 | 26,283 | ||||||
| Viavi Solutions, Inc. * | 2,785 | 31,582 | ||||||
|
| |||||||
| 355,639 | ||||||||
|
| |||||||
| Construction & Engineering - 0.7% | ||||||||
| Argan, Inc. | 520 | 22,360 | ||||||
| Comfort Systems USA, Inc. | 1,586 | 89,450 | ||||||
| Dycom Industries, Inc. *(a) | 600 | 50,760 | ||||||
| EMCOR Group, Inc. | 545 | 40,935 | ||||||
| HC2 Holdings, Inc. * | 962 | 5,887 | ||||||
| MasTec, Inc. * | 2,344 | 104,660 | ||||||
| NV5 Global, Inc. * | 1,032 | 89,474 | ||||||
| Primoris Services Corp. | 853 | 21,172 | ||||||
| Sterling Construction Co., Inc. * | 4,619 | 66,144 | ||||||
|
| |||||||
| 490,842 | ||||||||
|
| |||||||
| Construction Materials - 0.1% | ||||||||
| US Concrete, Inc. * | 1,036 | 47,501 | ||||||
|
| |||||||
| Consumer Finance - 0.7% | ||||||||
| Enova International, Inc. * | 2,038 | 58,694 | ||||||
| EZCORP, Inc., Class A * | 5,444 | 58,251 | ||||||
| FirstCash, Inc. | 796 | 65,272 | ||||||
| Green Dot Corp., Class A * | 2,962 | 263,085 | ||||||
| Nelnet, Inc., Class A | 400 | 22,868 | ||||||
|
| |||||||
| 468,170 | ||||||||
|
| |||||||
| Containers & Packaging - 0.1% | ||||||||
| Greif, Inc., Class A | 1,484 | 79,631 | ||||||
|
| |||||||
| Distributors - 0.1% | ||||||||
| Core-Mark Holding Co., Inc. | 991 | 33,654 | ||||||
|
| |||||||
| INVESTMENTS | SHARES | VALUE | ||||||
| Diversified Consumer Services - 1.5% | ||||||||
| Adtalem Global Education, Inc. * | 1,915 | $ | 92,303 | |||||
| American Public Education, Inc. * | 721 | 23,829 | ||||||
| Cambium Learning Group, Inc. * | 2,935 | 34,750 | ||||||
| Career Education Corp. * | 9,718 | 145,090 | ||||||
| Chegg, Inc. * | 8,559 | 243,332 | ||||||
| Regis Corp. * | 3,971 | 81,128 | ||||||
| Sotheby’s* (a) | 639 | 31,432 | ||||||
| Strategic Education, Inc. | 484 | 66,323 | ||||||
| Weight Watchers International, Inc. * | 4,701 | 338,425 | ||||||
|
| |||||||
| 1,056,612 | ||||||||
|
| |||||||
| Diversified Financial Services - 0.1% | ||||||||
| On Deck Capital, Inc. * | 5,553 | 42,036 | ||||||
|
| |||||||
| Diversified Telecommunication Services - 1.1% | ||||||||
| Cogent Communications Holdings, Inc. | 1,056 | 58,925 | ||||||
| Intelsat SA * | 12,697 | 380,910 | ||||||
| Iridium Communications, Inc. * | 4,295 | 96,637 | ||||||
| Ooma, Inc. * | 1,998 | 33,167 | ||||||
| ORBCOMM, Inc. * | 3,221 | 34,980 | ||||||
| Vonage Holdings Corp. * | 11,129 | 157,587 | ||||||
|
| |||||||
| 762,206 | ||||||||
|
| |||||||
| Electric Utilities - 0.3% | ||||||||
| ALLETE, Inc. | 673 | 50,482 | ||||||
| El Paso Electric Co. | 636 | 36,379 | ||||||
| MGE Energy, Inc. | 949 | 60,594 | ||||||
| Otter Tail Corp. | 739 | 35,398 | ||||||
| PNM Resources, Inc. | 1,251 | 49,352 | ||||||
|
| |||||||
| 232,205 | ||||||||
|
| |||||||
| Electrical Equipment - 0.6% | ||||||||
| Allied Motion Technologies, Inc. | 678 | 36,904 | ||||||
| Enphase Energy, Inc. *(a) | 18,427 | 89,371 | ||||||
| Generac Holdings, Inc. * | 1,329 | 74,969 | ||||||
| Plug Power, Inc. *(a) | 15,010 | 28,819 | ||||||
| Sunrun, Inc. *(a) | 6,676 | 83,049 | ||||||
| Vicor Corp. * | 2,745 | 126,270 | ||||||
|
| |||||||
| 439,382 | ||||||||
|
| |||||||
| Electronic Equipment, Instruments & Components - 2.0% | ||||||||
| Badger Meter, Inc. | 1,137 | 60,204 | ||||||
| Control4 Corp. * | 3,053 | 104,810 | ||||||
| CTS Corp. | 722 | 24,765 | ||||||
| Electro Scientific Industries, Inc. * | 2,544 | 44,393 | ||||||
| ePlus, Inc. * | 1,100 | 101,970 | ||||||
| Fabrinet (Thailand) * | 1,258 | 58,195 | ||||||
| FARO Technologies, Inc. * | 308 | 19,820 | ||||||
| II-VI, Inc. * | 2,226 | 105,290 | ||||||
| Insight Enterprises, Inc. * | 904 | 48,897 | ||||||
| Itron, Inc. * | 514 | 32,999 | ||||||
| KEMET Corp. * | 4,555 | 84,495 | ||||||
| Mesa Laboratories, Inc. | 432 | 80,188 | ||||||
| Methode Electronics, Inc. | 887 | 32,109 | ||||||
| Novanta, Inc. * | 2,973 | 203,353 | ||||||
| OSI Systems, Inc. * | 393 | 29,990 | ||||||
| PAR Technology Corp. * | 1,152 | 25,597 | ||||||
| Plexus Corp. * | 600 | 35,106 | ||||||
| Rogers Corp. * | 541 | 79,700 | ||||||
| The accompanying notes are an integral part of these financial statements. | (Continued) |
| AQR Funds | Annual Report | September 2018 | ||||||||||||||
133
Table of Contents
| Schedule of Investments | September 30, 2018 |
| AQR TM SMALL CAP MOMENTUM STYLE FUND |
| INVESTMENTS | SHARES | VALUE | ||||||
| Electronic Equipment, Instruments & Components - 2.0% (continued) | ||||||||
| Sanmina Corp. * | 1,295 | $ | 35,742 | |||||
| SYNNEX Corp. | 743 | 62,932 | ||||||
| Tech Data Corp. * | 282 | 20,183 | ||||||
| TTM Technologies, Inc. * | 3,581 | 56,974 | ||||||
| Vishay Intertechnology, Inc. | 895 | 18,213 | ||||||
| Vishay Precision Group, Inc. * | 778 | 29,097 | ||||||
|
| |||||||
| 1,395,022 | ||||||||
|
| |||||||
| Energy Equipment & Services - 1.4% | ||||||||
| Archrock, Inc. | 5,634 | 68,735 | ||||||
| Bristow Group, Inc. *(a) | 4,713 | 57,169 | ||||||
| Diamond Offshore Drilling, Inc. *(a) | 1,710 | 34,200 | ||||||
| Era Group, Inc. * | 2,427 | 29,974 | ||||||
| Exterran Corp. * | 2,163 | 57,384 | ||||||
| Helix Energy Solutions Group, Inc. * | 8,531 | 84,286 | ||||||
| ION Geophysical Corp. * | 4,068 | 63,257 | ||||||
| Mammoth Energy Services, Inc. (a) | 3,520 | 102,432 | ||||||
| Matrix Service Co. * | 4,167 | 102,717 | ||||||
| McDermott International, Inc. * | 1,116 | 20,568 | ||||||
| Noble Corp. plc* | 28,013 | 196,931 | ||||||
| Profire Energy, Inc. * | 9,021 | 28,777 | ||||||
| Solaris Oilfield Infrastructure, Inc., Class A * | 3,013 | 56,916 | ||||||
| TETRA Technologies, Inc. * | 5,634 | 25,409 | ||||||
| Unit Corp. * | 1,929 | 50,270 | ||||||
|
| |||||||
| 979,025 | ||||||||
|
| |||||||
| Entertainment - 0.8% | ||||||||
| Liberty Media Corp.-Liberty Braves, Class C * | 1,059 | 28,858 | ||||||
| World Wrestling Entertainment, Inc., Class A | 5,660 | 547,492 | ||||||
|
| |||||||
| 576,350 | ||||||||
|
| |||||||
| Equity Real Estate Investment Trusts (REITs) - 1.7% | ||||||||
| Agree Realty Corp. | 570 | 30,278 | ||||||
| CareTrust REIT, Inc. | 2,224 | 39,387 | ||||||
| EastGroup Properties, Inc. | 528 | 50,487 | ||||||
| Four Corners Property Trust, Inc. | 799 | 20,526 | ||||||
| Getty Realty Corp. | 891 | 25,447 | ||||||
| Gladstone Commercial Corp. | 2,247 | 43,030 | ||||||
| Independence Realty Trust, Inc. | 2,998 | 31,569 | ||||||
| Innovative Industrial Properties, Inc. (a) | 2,031 | 97,975 | ||||||
| Jernigan Capital, Inc. | 1,105 | 21,315 | ||||||
| Monmouth Real Estate Investment Corp. | 2,816 | 47,084 | ||||||
| National Storage Affiliates Trust | 3,565 | 90,694 | ||||||
| NexPoint Residential Trust, Inc. | 2,537 | 84,228 | ||||||
| Preferred Apartment Communities, Inc., Class A | 1,886 | 33,156 | ||||||
| PS Business Parks, Inc. | 1,113 | 141,451 | ||||||
| Rexford Industrial Realty, Inc. | 3,858 | 123,302 | ||||||
| Ryman Hospitality Properties, Inc. | 1,233 | 106,248 | ||||||
| STAG Industrial, Inc. | 753 | 20,708 | ||||||
| Terreno Realty Corp. | 2,242 | 84,523 | ||||||
| UMH Properties, Inc. | 1,668 | 26,088 | ||||||
| Universal Health Realty Income Trust | 544 | 40,479 | ||||||
| Xenia Hotels & Resorts, Inc. | 1,185 | 28,085 | ||||||
|
| |||||||
| 1,186,060 | ||||||||
|
| |||||||
| Food & Staples Retailing - 0.1% | ||||||||
| Chefs’ Warehouse, Inc. (The) * | 1,187 | 43,147 | ||||||
| Performance Food Group Co. * | 842 | 28,039 | ||||||
|
| |||||||
| 71,186 | ||||||||
|
| |||||||
| INVESTMENTS | SHARES | VALUE | ||||||
| Food Products - 0.7% | ||||||||
| Calavo Growers, Inc. (a) | 432 | $ | 41,731 | |||||
| Darling Ingredients, Inc. * | 1,560 | 30,139 | ||||||
| Fresh Del Monte Produce, Inc. | 1,226 | 41,549 | ||||||
| Freshpet, Inc. * | 741 | 27,195 | ||||||
| J&J Snack Foods Corp. (a) | 693 | 104,567 | ||||||
| John B Sanfilippo & Son, Inc. | 879 | 62,743 | ||||||
| Lancaster Colony Corp. | 718 | 107,133 | ||||||
| Sanderson Farms, Inc. | 306 | 31,631 | ||||||
|
| |||||||
| 446,688 | ||||||||
|
| |||||||
| Gas Utilities - 0.6% | ||||||||
| Chesapeake Utilities Corp. | 631 | 52,941 | ||||||
| New Jersey Resources Corp. | 914 | 42,135 | ||||||
| Northwest Natural Gas Co. | 369 | 24,686 | ||||||
| ONE Gas, Inc. | 2,675 | 220,099 | ||||||
| Southwest Gas Holdings, Inc. | 463 | 36,591 | ||||||
|
| |||||||
| 376,452 | ||||||||
|
| |||||||
| Health Care Equipment & Supplies - 6.8% | ||||||||
| Antares Pharma, Inc. * | 20,432 | 68,652 | ||||||
| AtriCure, Inc. * | 1,381 | 48,376 | ||||||
| Avanos Medical, Inc. * | 573 | 39,250 | ||||||
| AxoGen, Inc. * | 5,638 | 207,760 | ||||||
| Cardiovascular Systems, Inc. * | 1,382 | 54,091 | ||||||
| Cerus Corp. * | 17,213 | 124,106 | ||||||
| CONMED Corp. | 730 | 57,831 | ||||||
| CryoPort, Inc. *(a) | 6,759 | 86,583 | ||||||
| Cutera, Inc. * | 2,049 | 66,695 | ||||||
| CytoSorbents Corp. * | 5,195 | 67,016 | ||||||
| Glaukos Corp. * | 685 | 44,457 | ||||||
| Globus Medical, Inc., Class A * | 4,422 | 250,993 | ||||||
| Haemonetics Corp. * | 4,230 | 484,673 | ||||||
| Heska Corp. * | 1,066 | 120,788 | ||||||
| Inogen, Inc. * | 1,821 | 444,543 | ||||||
| Integer Holdings Corp. * | 1,071 | 88,839 | ||||||
| IntriCon Corp. * | 2,452 | 137,802 | ||||||
| iRhythm Technologies, Inc. * | 1,097 | 103,842 | ||||||
| LeMaitre Vascular, Inc. | 1,791 | 69,383 | ||||||
| LivaNova plc* | 2,386 | 295,792 | ||||||
| Merit Medical Systems, Inc. *(a) | 1,284 | 78,902 | ||||||
| Natus Medical, Inc. * | 1,100 | 39,215 | ||||||
| Neogen Corp. * | 1,223 | 87,481 | ||||||
| Novocure Ltd. * | 6,834 | 358,102 | ||||||
| Nuvectra Corp. * | 2,698 | 59,302 | ||||||
| OraSure Technologies, Inc. * | 2,087 | 32,244 | ||||||
| Quidel Corp. * | 2,429 | 158,298 | ||||||
| Senseonics Holdings, Inc. *(a) | 12,072 | 57,583 | ||||||
| Sientra, Inc. *(a) | 2,258 | 53,921 | ||||||
| STAAR Surgical Co. * | 4,538 | 217,824 | ||||||
| Surmodics, Inc. * | 1,358 | 101,375 | ||||||
| Tactile Systems Technology, Inc. * | 1,533 | 108,920 | ||||||
| Tandem Diabetes Care, Inc. * | 5,498 | 235,534 | ||||||
| TransEnterix, Inc. *(a) | 33,717 | 195,559 | ||||||
| ViewRay, Inc. * | 6,435 | 60,232 | ||||||
|
| |||||||
| 4,705,964 | ||||||||
|
| |||||||
| Health Care Providers & Services - 2.6% | ||||||||
| AAC Holdings, Inc. * | 3,968 | 30,276 | ||||||
| Addus HomeCare Corp. * | 1,804 | 126,551 | ||||||
| The accompanying notes are an integral part of these financial statements. | (Continued) |
| AQR Funds | Annual Report | September 2018 | ||||||||||||||
134
Table of Contents
| Schedule of Investments | September 30, 2018 |
| AQR TM SMALL CAP MOMENTUM STYLE FUND |
| INVESTMENTS | SHARES | VALUE | ||||||
| Health Care Providers & Services - 2.6% (continued) | ||||||||
| Amedisys, Inc. * | 1,383 | $ | 172,820 | |||||
| AMN Healthcare Services, Inc. * | 1,696 | 92,771 | ||||||
| BioTelemetry, Inc. * | 3,065 | 197,539 | ||||||
| CorVel Corp. * | 404 | 24,341 | ||||||
| Diplomat Pharmacy, Inc. * | 2,496 | 48,447 | ||||||
| Ensign Group, Inc. (The) | 2,325 | 88,164 | ||||||
| HealthEquity, Inc. * | 3,369 | 318,067 | ||||||
| LHC Group, Inc. * | 1,013 | 104,329 | ||||||
| Providence Service Corp. (The) * | 400 | 26,912 | ||||||
| R1 RCM, Inc. * | 10,525 | 106,934 | ||||||
| RadNet, Inc. * | 2,195 | 33,035 | ||||||
| Select Medical Holdings Corp. * | 3,001 | 55,218 | ||||||
| Tenet Healthcare Corp. * | 6,114 | 174,005 | ||||||
| Tivity Health, Inc. * | 2,933 | 94,296 | ||||||
| Triple-S Management Corp., Class B * | 2,436 | 46,016 | ||||||
| US Physical Therapy, Inc. | 392 | 46,491 | ||||||
|
| |||||||
| 1,786,212 | ||||||||
|
| |||||||
| Health Care Technology - 1.3% | ||||||||
| Allscripts Healthcare Solutions, Inc. * | 2,012 | 28,671 | ||||||
| Evolent Health, Inc., Class A *(a) | 1,307 | 37,119 | ||||||
| Inovalon Holdings, Inc., Class A *(a) | 2,353 | 23,648 | ||||||
| Medidata Solutions, Inc. * | 1,338 | 98,089 | ||||||
| Omnicell, Inc. * | 1,035 | 74,416 | ||||||
| Tabula Rasa HealthCare, Inc. * | 2,561 | 207,928 | ||||||
| Teladoc Health, Inc. *(a) | 4,468 | 385,812 | ||||||
| Vocera Communications, Inc. * | 901 | 32,958 | ||||||
|
| |||||||
| 888,641 | ||||||||
|
| |||||||
| Hotels, Restaurants & Leisure - 4.0% | ||||||||
| BJ’s Restaurants, Inc. | 1,103 | 79,637 | ||||||
| Boyd Gaming Corp. | 5,217 | 176,595 | ||||||
| Brinker International, Inc. | 467 | 21,823 | ||||||
| Churchill Downs, Inc. | 406 | 112,746 | ||||||
| Cracker Barrel Old Country Store, Inc. (a) | 385 | 56,645 | ||||||
| Dave & Buster’s Entertainment, Inc. * | 867 | 57,413 | ||||||
| Denny’s Corp. * | 2,000 | 29,440 | ||||||
| Dine Brands Global, Inc. (a) | 1,238 | 100,662 | ||||||
| Drive Shack, Inc., REIT * | 5,264 | 31,373 | ||||||
| Eldorado Resorts, Inc. * | 7,283 | 353,954 | ||||||
| Golden Entertainment, Inc. * | 1,870 | 44,899 | ||||||
| Jack in the Box, Inc. | 818 | 68,573 | ||||||
| Marriott Vacations Worldwide Corp. | 982 | 109,739 | ||||||
| Nathan’s Famous, Inc. | 443 | 36,503 | ||||||
| Noodles & Co. * | 8,403 | 101,676 | ||||||
| Penn National Gaming, Inc. * | 4,764 | 156,831 | ||||||
| Planet Fitness, Inc., Class A * | 5,837 | 315,373 | ||||||
| RCI Hospitality Holdings, Inc. | 2,273 | 67,304 | ||||||
| Red Rock Resorts, Inc., Class A (a) | 3,360 | 89,544 | ||||||
| Ruth’s Hospitality Group, Inc. | 1,920 | 60,576 | ||||||
| Scientific Games Corp. * | 4,057 | 103,048 | ||||||
| SeaWorld Entertainment, Inc. * | 2,616 | 82,221 | ||||||
| Shake Shack, Inc., Class A * | 1,416 | 89,222 | ||||||
| Sonic Corp. | 727 | 31,508 | ||||||
| Texas Roadhouse, Inc. | 2,332 | 161,584 | ||||||
| Town Sports International Holdings, Inc. * | 9,299 | 80,436 | ||||||
| Wingstop, Inc. | 2,345 | 160,093 | ||||||
|
| |||||||
| 2,779,418 | ||||||||
|
| |||||||
| INVESTMENTS | SHARES | VALUE | ||||||
| Household Durables - 0.9% | ||||||||
| Cavco Industries, Inc. * | 433 | $ | 109,549 | |||||
| Helen of Troy Ltd. * | 962 | 125,926 | ||||||
| Hooker Furniture Corp. | 780 | 26,364 | ||||||
| Installed Building Products, Inc. * | 1,672 | 65,208 | ||||||
| KB Home | 1,057 | 25,273 | ||||||
| La-Z-Boy, Inc. | 722 | 22,815 | ||||||
| LGI Homes, Inc. *(a) | 2,234 | 105,981 | ||||||
| MDC Holdings, Inc. | 747 | 22,096 | ||||||
| TopBuild Corp. * | 1,686 | 95,799 | ||||||
|
| |||||||
| 599,011 | ||||||||
|
| |||||||
| Household Products - 0.3% | ||||||||
| Central Garden & Pet Co., Class A * | 3,085 | 102,237 | ||||||
| WD-40 Co. (a) | 543 | 93,450 | ||||||
|
| |||||||
| 195,687 | ||||||||
|
| |||||||
| Independent Power and Renewable Electricity Producers - 0.0% (b) | ||||||||
| Clearway Energy, Inc., Class C | 1,476 | 28,413 | ||||||
|
| |||||||
| Insurance - 2.5% | ||||||||
| American Equity Investment Life Holding Co. | 1,528 | 54,030 | ||||||
| AMERISAFE, Inc. | 907 | 56,189 | ||||||
| Argo Group International Holdings Ltd. | 2,019 | 127,298 | ||||||
| CNO Financial Group, Inc. | 1,609 | 34,143 | ||||||
| Employers Holdings, Inc. | 574 | 26,002 | ||||||
| Enstar Group Ltd. * | 673 | 140,320 | ||||||
| Health Insurance Innovations, Inc., Class A * | 3,654 | 225,269 | ||||||
| James River Group Holdings Ltd. | 2,244 | 95,639 | ||||||
| Kemper Corp. | 3,884 | 312,468 | ||||||
| National General Holdings Corp. | 1,414 | 37,952 | ||||||
| Primerica, Inc. | 1,888 | 227,598 | ||||||
| RLI Corp. | 1,284 | 100,897 | ||||||
| Selective Insurance Group, Inc. | 768 | 48,768 | ||||||
| Trupanion, Inc. *(a) | 2,219 | 79,285 | ||||||
| United Fire Group, Inc. | 1,284 | 65,189 | ||||||
| United Insurance Holdings Corp. | 2,600 | 58,188 | ||||||
| Universal Insurance Holdings, Inc. | 1,100 | 53,405 | ||||||
|
| |||||||
| 1,742,640 | ||||||||
|
| |||||||
| Interactive Media & Services - 0.4% | ||||||||
| QuinStreet, Inc. * | 7,756 | 105,249 | ||||||
| Travelzoo * | 2,494 | 29,554 | ||||||
| TrueCar, Inc. * | 2,890 | 40,749 | ||||||
| XO Group, Inc. * | 2,632 | 90,751 | ||||||
| Yelp, Inc. * | 802 | 39,459 | ||||||
|
| |||||||
| 305,762 | ||||||||
|
| |||||||
| Internet & Direct Marketing Retail - 1.8% | ||||||||
| 1-800-Flowers.com, Inc., Class A * | 3,613 | 42,633 | ||||||
| Etsy, Inc. * | 10,006 | 514,108 | ||||||
| Gaia, Inc. * | 1,586 | 24,424 | ||||||
| Groupon, Inc. * | 14,802 | 55,804 | ||||||
| Lands’ End, Inc. * | 832 | 14,602 | ||||||
| Nutrisystem, Inc. (a) | 1,547 | 57,316 | ||||||
| Overstock.com, Inc. *(a) | 1,956 | 54,181 | ||||||
| PetMed Express, Inc. | 584 | 19,278 | ||||||
| Quotient Technology, Inc. * | 2,633 | 40,812 | ||||||
| Remark Holdings, Inc. * | 7,357 | 23,469 | ||||||
| The accompanying notes are an integral part of these financial statements. | (Continued) |
| AQR Funds | Annual Report | September 2018 | ||||||||||||||
135
Table of Contents
| Schedule of Investments | September 30, 2018 |
| AQR TM SMALL CAP MOMENTUM STYLE FUND |
| INVESTMENTS | SHARES | VALUE | ||||||
| Internet & Direct Marketing Retail - 1.8% (continued) | ||||||||
| Shutterfly, Inc. * | 1,961 | $ | 129,210 | |||||
| Shutterstock, Inc. | 422 | 23,033 | ||||||
| Stamps.com, Inc. * | 1,062 | 240,224 | ||||||
|
| |||||||
| 1,239,094 | ||||||||
|
| |||||||
| IT Services - 1.5% | ||||||||
| CACI International, Inc., Class A * | 837 | 154,133 | ||||||
| Carbonite, Inc. * | 3,115 | 111,050 | ||||||
| CSG Systems International, Inc. | 958 | 38,454 | ||||||
| Everi Holdings, Inc. * | 11,920 | 109,306 | ||||||
| EVERTEC, Inc. | 853 | 20,557 | ||||||
| ExlService Holdings, Inc. * | 709 | 46,936 | ||||||
| GTT Communications, Inc. *(a) | 1,439 | 62,453 | ||||||
| Limelight Networks, Inc. * | 5,392 | 27,068 | ||||||
| ManTech International Corp., Class A | 1,205 | 76,276 | ||||||
| MAXIMUS, Inc. | 1,045 | 67,988 | ||||||
| Perficient, Inc. * | 1,387 | 36,964 | ||||||
| Science Applications International Corp. | 553 | 44,572 | ||||||
| Tucows, Inc., Class A * | 1,347 | 75,095 | ||||||
| Unisys Corp. * | 2,742 | 55,937 | ||||||
| Virtusa Corp. * | 1,988 | 106,775 | ||||||
|
| |||||||
| 1,033,564 | ||||||||
|
| |||||||
| Leisure Products - 0.2% | ||||||||
| Callaway Golf Co. | 2,957 | 71,826 | ||||||
| Johnson Outdoors, Inc., Class A | 384 | 35,708 | ||||||
| Malibu Boats, Inc., Class A * | 414 | 22,654 | ||||||
| Sturm Ruger & Co., Inc. | 385 | 26,584 | ||||||
|
| |||||||
| 156,772 | ||||||||
|
| |||||||
| Life Sciences Tools & Services - 0.7% | ||||||||
| Accelerate Diagnostics, Inc. *(a) | 2,058 | 47,231 | ||||||
| Cambrex Corp. * | 854 | 58,413 | ||||||
| Codexis, Inc. *(a) | 10,086 | 172,975 | ||||||
| Harvard Bioscience, Inc. * | 5,732 | 30,093 | ||||||
| Medpace Holdings, Inc. * | 2,186 | 130,963 | ||||||
| NeoGenomics, Inc. * | 2,416 | 37,086 | ||||||
| Syneos Health, Inc. * | 420 | 21,651 | ||||||
|
| |||||||
| 498,412 | ||||||||
|
| |||||||
| Machinery - 3.5% | ||||||||
| Alamo Group, Inc. | 289 | 26,475 | ||||||
| Albany International Corp., Class A | 692 | 55,014 | ||||||
| Barnes Group, Inc. | 873 | 62,009 | ||||||
| Chart Industries, Inc. * | 1,484 | 116,242 | ||||||
| Columbus McKinnon Corp. | 620 | 24,515 | ||||||
| DMC Global, Inc. | 2,204 | 89,923 | ||||||
| Douglas Dynamics, Inc. | 969 | 42,539 | ||||||
| EnPro Industries, Inc. | 521 | 37,997 | ||||||
| Federal Signal Corp. | 2,000 | 53,560 | ||||||
| Global Brass & Copper Holdings, Inc. | 3,107 | 114,648 | ||||||
| Greenbrier Cos., Inc. (The) | 726 | 43,633 | ||||||
| Harsco Corp. * | 4,007 | 114,400 | ||||||
| Hillenbrand, Inc. | 913 | 47,750 | ||||||
| John Bean Technologies Corp.(a) | 1,454 | 173,462 | ||||||
| Kadant, Inc. | 620 | 66,867 | ||||||
| Kennametal, Inc. | 2,429 | 105,807 | ||||||
| Lydall, Inc. * | 737 | 31,765 | ||||||
| Manitowoc Co., Inc. (The) * | 1,095 | 26,269 | ||||||
| INVESTMENTS | SHARES | VALUE | ||||||
| Machinery - 3.5% (continued) | ||||||||
| Meritor, Inc. * | 4,408 | $ | 85,339 | |||||
| Mueller Water Products, Inc., Class A | 5,126 | 59,000 | ||||||
| Navistar International Corp. *(a) | 4,684 | 180,334 | ||||||
| Proto Labs, Inc. * | 1,443 | 233,405 | ||||||
| RBC Bearings, Inc. * | 504 | 75,781 | ||||||
| Rexnord Corp. * | 1,006 | 30,985 | ||||||
| Spartan Motors, Inc. | 7,354 | 108,472 | ||||||
| SPX Corp. * | 4,606 | 153,426 | ||||||
| SPX FLOW, Inc. * | 638 | 33,176 | ||||||
| Standex International Corp. | 358 | 37,321 | ||||||
| Sun Hydraulics Corp. | 453 | 24,815 | ||||||
| Tennant Co. | 497 | 37,747 | ||||||
| Watts Water Technologies, Inc., Class A | 425 | 35,275 | ||||||
| Woodward, Inc. | 689 | 55,713 | ||||||
|
| |||||||
| 2,383,664 | ||||||||
|
| |||||||
| Marine - 0.2% | ||||||||
| Genco Shipping & Trading Ltd. * | 4,726 | 66,164 | ||||||
| Safe Bulkers, Inc. (Greece) * | 7,778 | 22,400 | ||||||
| Scorpio Bulkers, Inc. | 4,339 | 31,458 | ||||||
|
| |||||||
| 120,022 | ||||||||
|
| |||||||
| Media - 0.6% | ||||||||
| Gray Television, Inc. * | 2,135 | 37,363 | ||||||
| New York Times Co. (The), Class A | 7,234 | 167,467 | ||||||
| Nexstar Media Group, Inc., Class A (a) | 356 | 28,978 | ||||||
| TechTarget, Inc. * | 7,440 | 144,485 | ||||||
|
| |||||||
| 378,293 | ||||||||
|
| |||||||
| Metals & Mining - 1.0% | ||||||||
| Allegheny Technologies, Inc. *(a) | 4,725 | 139,624 | ||||||
| Carpenter Technology Corp. | 777 | 45,804 | ||||||
| Century Aluminum Co. * | 4,009 | 47,988 | ||||||
| Cleveland-Cliffs, Inc. *(a) | 6,004 | 76,011 | ||||||
| Gold Resource Corp. | 6,116 | 31,436 | ||||||
| Kaiser Aluminum Corp. | 680 | 74,161 | ||||||
| Materion Corp. | 515 | 31,157 | ||||||
| Schnitzer Steel Industries, Inc., Class A | 769 | 20,801 | ||||||
| SunCoke Energy, Inc. * | 3,986 | 46,317 | ||||||
| Warrior Met Coal, Inc. | 4,515 | 122,086 | ||||||
| Worthington Industries, Inc. | 1,413 | 61,268 | ||||||
|
| |||||||
| 696,653 | ||||||||
|
| |||||||
| Multiline Retail - 0.8% | ||||||||
| Dillard’s, Inc., Class A (a) | 676 | 51,606 | ||||||
| Ollie’s Bargain Outlet Holdings, Inc. * | 5,105 | 490,590 | ||||||
|
| |||||||
| 542,196 | ||||||||
|
| |||||||
| Multi-Utilities - 0.0% (b) | ||||||||
| Unitil Corp. | 507 | 25,806 | ||||||
|
| |||||||
| Oil, Gas & Consumable Fuels - 3.7% | ||||||||
| Abraxas Petroleum Corp. * | 19,535 | 45,516 | ||||||
| Amyris, Inc. * | 5,198 | 41,272 | ||||||
| Arch Coal, Inc., Class A | 372 | 33,257 | ||||||
| California Resources Corp. * | 5,024 | 243,815 | ||||||
| Callon Petroleum Co. * | 1,986 | 23,812 | ||||||
| Carrizo Oil & Gas, Inc. * | 1,529 | 38,531 | ||||||
| CVR Energy, Inc. | 5,397 | 217,067 | ||||||
| The accompanying notes are an integral part of these financial statements. | (Continued) |
| AQR Funds | Annual Report | September 2018 | ||||||||||||||
136
Table of Contents
| Schedule of Investments | September 30, 2018 |
| AQR TM SMALL CAP MOMENTUM STYLE FUND |
| INVESTMENTS | SHARES | VALUE | ||||||
| Oil, Gas & Consumable Fuels - 3.7% (continued) | ||||||||
| Delek US Holdings, Inc. | 4,780 | $ | 202,815 | |||||
| Denbury Resources, Inc. * | 43,200 | 267,840 | ||||||
| GasLog Ltd. (Monaco) | 1,757 | 34,701 | ||||||
| Golar LNG Ltd. | 1,216 | 33,805 | ||||||
| HighPoint Resources Corp. * | 19,829 | 96,765 | ||||||
| Matador Resources Co. * | 1,372 | 45,345 | ||||||
| Northern Oil and Gas, Inc. *(a) | 21,610 | 86,440 | ||||||
| Oasis Petroleum, Inc. * | 10,892 | 154,449 | ||||||
| Pacific Ethanol, Inc. * | 900 | 1,710 | ||||||
| Par Pacific Holdings, Inc. * | 1,283 | 26,173 | ||||||
| PDC Energy, Inc. * | 847 | 41,469 | ||||||
| Peabody Energy Corp. | 5,776 | 205,857 | ||||||
| Penn Virginia Corp. * | 1,028 | 82,795 | ||||||
| Renewable Energy Group, Inc. * | 734 | 21,139 | ||||||
| Resolute Energy Corp. *(a) | 1,632 | 61,706 | ||||||
| REX American Resources Corp. * | 300 | 22,665 | ||||||
| Ring Energy, Inc. * | 3,361 | 33,307 | ||||||
| SRC Energy, Inc. * | 10,058 | 89,416 | ||||||
| Uranium Energy Corp. * | 20,939 | 36,015 | ||||||
| W&T Offshore, Inc. * | 19,690 | 189,812 | ||||||
| WildHorse Resource Development Corp. * | 7,275 | 171,981 | ||||||
|
| |||||||
| 2,549,475 | ||||||||
|
| |||||||
| Paper & Forest Products - 0.5% | ||||||||
| Boise Cascade Co. | 465 | 17,112 | ||||||
| Louisiana-Pacific Corp. | 3,731 | 98,834 | ||||||
| Verso Corp., Class A * | 6,115 | 205,892 | ||||||
|
| |||||||
| 321,838 | ||||||||
|
| |||||||
| Personal Products - 0.8% | ||||||||
| Inter Parfums, Inc. | 315 | 20,302 | ||||||
| Medifast, Inc. | 1,259 | 278,932 | ||||||
| USANA Health Sciences, Inc. * | 1,846 | 222,535 | ||||||
|
| |||||||
| 521,769 | ||||||||
|
| |||||||
| Pharmaceuticals - 2.5% | ||||||||
| Aerie Pharmaceuticals, Inc. * | 1,454 | 89,494 | ||||||
| Amphastar Pharmaceuticals, Inc. * | 1,336 | 25,705 | ||||||
| ANI Pharmaceuticals, Inc. * | 400 | 22,616 | ||||||
| Assembly Biosciences, Inc. * | 2,620 | 97,307 | ||||||
| Collegium Pharmaceutical, Inc. *(a) | 1,711 | 25,220 | ||||||
| Corcept Therapeutics, Inc. *(a) | 5,479 | 76,815 | ||||||
| Cymabay Therapeutics, Inc. * | 5,714 | 63,311 | ||||||
| Durect Corp. * | 23,677 | 26,045 | ||||||
| Endo International plc* | 1,400 | 23,562 | ||||||
| Endocyte, Inc. * | 8,959 | 159,112 | ||||||
| Horizon Pharma plc* | 4,125 | 80,767 | ||||||
| Intersect ENT, Inc. * | 1,881 | 54,079 | ||||||
| Intra-Cellular Therapies, Inc. * | 2,531 | 54,923 | ||||||
| Marinus Pharmaceuticals, Inc. * | 12,261 | 122,610 | ||||||
| MyoKardia, Inc. * | 2,930 | 191,036 | ||||||
| Omeros Corp. * | 1,122 | 27,388 | ||||||
| Phibro Animal Health Corp., Class A | 2,245 | 96,310 | ||||||
| Reata Pharmaceuticals, Inc., Class A *(a) | 1,337 | 109,313 | ||||||
| Revance Therapeutics, Inc. * | 805 | 20,004 | ||||||
| Supernus Pharmaceuticals, Inc. * | 2,382 | 119,934 | ||||||
| WaVe Life Sciences Ltd. * | 1,647 | 82,350 | ||||||
| Zogenix, Inc. *(a) | 3,119 | 154,702 | ||||||
|
| |||||||
| 1,722,603 | ||||||||
|
| |||||||
| INVESTMENTS | SHARES | VALUE | ||||||
| Professional Services - 1.8% | ||||||||
| ASGN, Inc. * | 2,356 | $ | 185,959 | |||||
| Exponent, Inc. | 1,410 | 75,576 | ||||||
| FTI Consulting, Inc. * | 2,526 | 184,878 | ||||||
| Heidrick & Struggles International, Inc. | 869 | 29,416 | ||||||
| ICF International, Inc. | 295 | 22,258 | ||||||
| Insperity, Inc. | 2,810 | 331,439 | ||||||
| Kforce, Inc. | 1,137 | 42,751 | ||||||
| Korn/Ferry International | 2,978 | 146,637 | ||||||
| TriNet Group, Inc. * | 2,764 | 155,668 | ||||||
| Willdan Group, Inc. * | 2,362 | 80,214 | ||||||
|
| |||||||
| 1,254,796 | ||||||||
|
| |||||||
| Real Estate Management & Development - 0.4% | ||||||||
| HFF, Inc., Class A | 1,572 | 66,778 | ||||||
| RE/MAX Holdings, Inc., Class A | 817 | 36,234 | ||||||
| RMR Group, Inc. (The), Class A | 1,492 | 138,458 | ||||||
|
| |||||||
| 241,470 | ||||||||
|
| |||||||
| Road & Rail - 1.1% | ||||||||
| ArcBest Corp. | 3,427 | 166,381 | ||||||
| Covenant Transportation Group, Inc., Class A * | 1,000 | 29,060 | ||||||
| Heartland Express, Inc. | 1,825 | 36,007 | ||||||
| Hertz Global Holdings, Inc. * | 1,261 | 20,592 | ||||||
| Marten Transport Ltd. | 1,333 | 28,060 | ||||||
| Saia, Inc. * | 1,580 | 120,791 | ||||||
| Universal Logistics Holdings, Inc. | 5,496 | 202,253 | ||||||
| USA Truck, Inc. * | 3,949 | 79,888 | ||||||
| Werner Enterprises, Inc. | 1,643 | 58,080 | ||||||
|
| |||||||
| 741,112 | ||||||||
|
| |||||||
| Semiconductors & Semiconductor Equipment - 2.4% | ||||||||
| Advanced Energy Industries, Inc. * | 1,474 | 76,132 | ||||||
| Amkor Technology, Inc. * | 7,188 | 53,119 | ||||||
| Axcelis Technologies, Inc. * | 1,873 | 36,804 | ||||||
| AXT, Inc. * | 3,076 | 21,993 | ||||||
| Brooks Automation, Inc. | 3,242 | 113,567 | ||||||
| Cabot Microelectronics Corp. | 773 | 79,750 | ||||||
| CEVA, Inc. * | 693 | 19,924 | ||||||
| Cohu, Inc. | 1,054 | 26,455 | ||||||
| Cree, Inc. *(a) | 7,857 | 297,545 | ||||||
| Diodes, Inc. * | 1,888 | 62,851 | ||||||
| Entegris, Inc. | 5,309 | 153,696 | ||||||
| FormFactor, Inc. * | 1,789 | 24,599 | ||||||
| Integrated Device Technology, Inc. * | 4,871 | 228,986 | ||||||
| MaxLinear, Inc. * | 2,748 | 54,630 | ||||||
| Nanometrics, Inc. * | 818 | 30,691 | ||||||
| Power Integrations, Inc. | 424 | 26,797 | ||||||
| Rambus, Inc. * | 3,205 | 34,967 | ||||||
| Rudolph Technologies, Inc. * | 786 | 19,218 | ||||||
| Semtech Corp. * | 2,146 | 119,318 | ||||||
| Silicon Laboratories, Inc. * | 1,036 | 95,105 | ||||||
| SMART Global Holdings, Inc. * | 2,924 | 84,036 | ||||||
|
| |||||||
| 1,660,183 | ||||||||
|
| |||||||
| Software - 8.4% | ||||||||
| 8x8, Inc. * | 4,163 | 88,464 | ||||||
| ACI Worldwide, Inc. * | 1,294 | 36,413 | ||||||
| Alarm.com Holdings, Inc. * | 2,412 | 138,449 | ||||||
| The accompanying notes are an integral part of these financial statements. | (Continued) |
| AQR Funds | Annual Report | September 2018 | ||||||||||||||
137
Table of Contents
| Schedule of Investments | September 30, 2018 |
| AQR TM SMALL CAP MOMENTUM STYLE FUND |
| INVESTMENTS | SHARES | VALUE | ||||||
| Software - 8.4% (continued) | ||||||||
| Alteryx, Inc., Class A *(a) | 4,182 | $ | 239,252 | |||||
| Appfolio, Inc., Class A * | 3,881 | 304,270 | ||||||
| Apptio, Inc., Class A * | 4,081 | 150,834 | ||||||
| Blackbaud, Inc. | 1,818 | 184,491 | ||||||
| Blackline, Inc. * | 655 | 36,988 | ||||||
| Bottomline Technologies DE, Inc. * | 5,131 | 373,075 | ||||||
| Box, Inc., Class A * | 3,222 | 77,038 | ||||||
| CommVault Systems, Inc. * | 357 | 24,990 | ||||||
| Cornerstone OnDemand, Inc. * | 360 | 20,430 | ||||||
| Coupa Software, Inc. * | 3,578 | 283,020 | ||||||
| Ebix, Inc. (a) | 1,032 | 81,683 | ||||||
| eGain Corp. * | 5,705 | 46,210 | ||||||
| Ellie Mae, Inc. *(a) | 1,154 | 109,365 | ||||||
| Envestnet, Inc. * | 1,531 | 93,314 | ||||||
| Everbridge, Inc. * | 1,964 | 113,205 | ||||||
| Five9, Inc. * | 7,053 | 308,145 | ||||||
| Glu Mobile, Inc. * | 14,137 | 105,321 | ||||||
| Hortonworks, Inc. * | 5,038 | 114,917 | ||||||
| HubSpot, Inc. * | 2,161 | 326,203 | ||||||
| Instructure, Inc. * | 1,728 | 61,171 | ||||||
| j2 Global, Inc. | 616 | 51,036 | ||||||
| LivePerson, Inc. * | 4,871 | 126,402 | ||||||
| MicroStrategy, Inc., Class A * | 200 | 28,124 | ||||||
| MINDBODY, Inc., Class A * | 4,142 | 168,372 | ||||||
| New Relic, Inc. * | 3,717 | 350,253 | ||||||
| Paylocity Holding Corp. * | 2,192 | 176,061 | ||||||
| Progress Software Corp. | 661 | 23,327 | ||||||
| PROS Holdings, Inc. * | 1,046 | 36,631 | ||||||
| Q2 Holdings, Inc. *(a) | 1,876 | 113,592 | ||||||
| QAD, Inc., Class A | 335 | 18,978 | ||||||
| Qualys, Inc. * | 2,725 | 242,797 | ||||||
| Rapid7, Inc. * | 3,479 | 128,445 | ||||||
| ShotSpotter, Inc. *(a) | 1,733 | 106,216 | ||||||
| SPS Commerce, Inc. * | 733 | 72,743 | ||||||
| Trade Desk, Inc. (The), Class A * | 2,815 | 424,812 | ||||||
| Upland Software, Inc. * | 2,969 | 95,928 | ||||||
| Varonis Systems, Inc. * | 2,240 | 164,080 | ||||||
| Verint Systems, Inc. * | 900 | 45,090 | ||||||
| Veritone, Inc. * | 2,761 | 28,797 | ||||||
| VirnetX Holding Corp. * | 80 | 372 | ||||||
| Workiva, Inc. * | 533 | 21,053 | ||||||
| Yext, Inc. * | 2,341 | 55,482 | ||||||
|
| |||||||
| 5,795,839 | ||||||||
|
| |||||||
| Specialty Retail - 5.0% | ||||||||
| Aaron’s, Inc. | 2,148 | 116,980 | ||||||
| Abercrombie & Fitch Co., Class A | 6,239 | 131,768 | ||||||
| American Eagle Outfitters, Inc. | 14,265 | 354,200 | ||||||
| Ascena Retail Group, Inc. * | 12,313 | 56,270 | ||||||
| At Home Group, Inc. *(a) | 2,835 | 89,388 | ||||||
| Boot Barn Holdings, Inc. * | 5,347 | 151,908 | ||||||
| Buckle, Inc. (The) | 3,056 | 70,441 | ||||||
| Caleres, Inc. | 931 | 33,386 | ||||||
| Carvana Co. *(a) | 11,337 | 669,903 | ||||||
| Children’s Place, Inc. (The) | 826 | 105,563 | ||||||
| Conn’s, Inc. * | 3,466 | 122,523 | ||||||
| Container Store Group, Inc. (The) * | 1,772 | 19,669 | ||||||
| DSW, Inc., Class A | 4,567 | 154,730 | ||||||
| Express, Inc. * | 3,365 | 37,217 | ||||||
| INVESTMENTS | SHARES | VALUE | ||||||
| Specialty Retail - 5.0% (continued) | ||||||||
| Five Below, Inc. * | 3,647 | $ | 474,329 | |||||
| Guess?, Inc. | 6,093 | 137,702 | ||||||
| Lithia Motors, Inc., Class A | 321 | 26,213 | ||||||
| New York & Co., Inc. * | 21,876 | 84,441 | ||||||
| Party City Holdco, Inc. * | 1,551 | 21,016 | ||||||
| RH * | 1,645 | 215,512 | ||||||
| Shoe Carnival, Inc. | 1,726 | 66,451 | ||||||
| Sleep Number Corp. * | 1,158 | 42,591 | ||||||
| Tailored Brands, Inc. (a) | 4,046 | 101,919 | ||||||
| Tilly’s, Inc., Class A | 5,051 | 95,716 | ||||||
| Zumiez, Inc. * | 2,447 | 64,478 | ||||||
|
| |||||||
| 3,444,314 | ||||||||
|
| |||||||
| Technology Hardware, Storage & Peripherals - 0.1% | ||||||||
| USA Technologies, Inc. * | 5,970 | 42,984 | ||||||
|
| |||||||
| Textiles, Apparel & Luxury Goods - 1.7% | ||||||||
| Crocs, Inc. * | 9,832 | 209,323 | ||||||
| Deckers Outdoor Corp. * | 2,201 | 260,995 | ||||||
| Fossil Group, Inc. *(a) | 4,530 | 105,458 | ||||||
| G-III Apparel Group Ltd. * | 4,160 | 200,471 | ||||||
| Movado Group, Inc. | 2,133 | 89,373 | ||||||
| Oxford Industries, Inc. | 831 | 74,956 | ||||||
| Rocky Brands, Inc. | 1,617 | 45,761 | ||||||
| Steven Madden Ltd. | 947 | 50,096 | ||||||
| Vera Bradley, Inc. * | 2,284 | 34,854 | ||||||
| Wolverine World Wide, Inc. | 3,321 | 129,685 | ||||||
|
| |||||||
| 1,200,972 | ||||||||
|
| |||||||
| Thrifts & Mortgage Finance - 1.5% | ||||||||
| Axos Financial, Inc. * | 3,235 | 111,252 | ||||||
| Essent Group Ltd. * | 2,281 | 100,934 | ||||||
| Federal Agricultural Mortgage Corp., Class C | 480 | 34,646 | ||||||
| First Defiance Financial Corp. | 1,450 | 43,659 | ||||||
| HomeStreet, Inc. * | 1,444 | 38,266 | ||||||
| Kearny Financial Corp. | 3,143 | 43,531 | ||||||
| LendingTree, Inc. *(a) | 622 | 143,122 | ||||||
| Meta Financial Group, Inc. | 1,311 | 108,354 | ||||||
| MGIC Investment Corp. * | 6,288 | 83,693 | ||||||
| NMI Holdings, Inc., Class A * | 1,635 | 37,033 | ||||||
| Northwest Bancshares, Inc. | 5,435 | 94,134 | ||||||
| Radian Group, Inc. | 2,374 | 49,071 | ||||||
| Walker & Dunlop, Inc. | 1,468 | 77,628 | ||||||
| Waterstone Financial, Inc. | 2,000 | 34,300 | ||||||
|
| |||||||
| 999,623 | ||||||||
|
| |||||||
| Tobacco - 0.1% | ||||||||
| Pyxus International, Inc. * | 1,872 | 43,056 | ||||||
|
| |||||||
| Trading Companies & Distributors - 1.1% | ||||||||
| Aircastle Ltd. | 1,474 | 32,295 | ||||||
| Beacon Roofing Supply, Inc. * | 529 | 19,144 | ||||||
| BlueLinx Holdings, Inc. *(a) | 1,821 | 57,343 | ||||||
| CAI International, Inc. * | 2,335 | 53,401 | ||||||
| DXP Enterprises, Inc. * | 1,558 | 62,429 | ||||||
| H&E Equipment Services, Inc. | 1,734 | 65,511 | ||||||
| Herc Holdings, Inc. * | 433 | 22,170 | ||||||
| MRC Global, Inc. * | 3,293 | 61,810 | ||||||
| The accompanying notes are an integral part of these financial statements. | (Continued) |
| AQR Funds | Annual Report | September 2018 | ||||||||||||||
138
Table of Contents
| Schedule of Investments | September 30, 2018 |
| AQR TM SMALL CAP MOMENTUM STYLE FUND |
| INVESTMENTS | SHARES | VALUE | ||||||
| Trading Companies & Distributors - 1.1% (continued) | ||||||||
| Rush Enterprises, Inc., Class A | 1,230 | $ | 48,351 | |||||
| SiteOne Landscape Supply, Inc. * | 2,272 | 171,172 | ||||||
| Systemax, Inc. | 2,922 | 96,251 | ||||||
| Triton International Ltd. | 2,128 | 70,799 | ||||||
|
| |||||||
| 760,676 | ||||||||
|
| |||||||
| Water Utilities - 0.2% | ||||||||
| American States Water Co. | 1,106 | 67,621 | ||||||
| Cadiz, Inc. * | 2,241 | 24,987 | ||||||
| Middlesex Water Co. | 1,085 | 52,536 | ||||||
|
| |||||||
| 145,144 | ||||||||
|
| |||||||
| Wireless Telecommunication Services - 0.5% | ||||||||
| Boingo Wireless, Inc. * | 3,806 | 132,829 | ||||||
| NII Holdings, Inc. *(a) | 20,496 | 120,107 | ||||||
| Shenandoah Telecommunications Co. | 2,014 | 78,042 | ||||||
|
| |||||||
| 330,978 | ||||||||
|
| |||||||
TOTAL COMMON STOCKS | 66,908,396 | |||||||
|
| |||||||
| SHORT-TERM INVESTMENTS - 2.7% | ||||||||
| Investment Companies - 2.7% | ||||||||
| Limited Purpose Cash Investment Fund, 2.06% (c) | ||||||||
(Cost $1,834,051) | 1,834,308 | 1,834,124 | ||||||
|
| |||||||
| SECURITIES LENDING COLLATERAL - 12.7% | ||||||||
| Investment Companies - 12.7% | ||||||||
| Investments in a Pooled Account through Securities Lending Program with Citibank NA | ||||||||
| BlackRock Liquidity Funds T-Fund Portfolio, Institutional Shares 1.97% (c)(d) | 1,066,907 | 1,066,907 | ||||||
| Limited Purpose Cash Investment Fund 2.06% (c)(d) | 7,655,700 | 7,654,935 | ||||||
|
| |||||||
TOTAL SECURITIES LENDING COLLATERAL | 8,721,842 | |||||||
|
| |||||||
TOTAL INVESTMENTS IN SECURITIES | 77,464,362 | |||||||
|
| |||||||
LIABILITIES IN EXCESS OF OTHER | (8,715,933 | ) | ||||||
|
| |||||||
NET ASSETS - 100.0% | $ | 68,748,429 | ||||||
|
| |||||||
| SECTOR | VALUE | % OF NET ASSETS | ||||||
| Communication Services | $ | 2,353,588 | 3.4 | % | ||||
| Consumer Discretionary | 11,512,267 | 16.8 | ||||||
| Consumer Staples | 1,726,664 | 2.5 | ||||||
| Energy | 3,528,500 | 5.1 | ||||||
| Financials | 6,492,536 | 9.4 | ||||||
| Health Care | 17,460,481 | 25.4 | ||||||
| Industrials | 9,173,995 | 13.3 | ||||||
| Information Technology | 10,283,232 | 15.0 | ||||||
| Materials | 2,141,583 | 3.1 | ||||||
| Real Estate | 1,427,530 | 2.1 | ||||||
| Utilities | 808,020 | 1.2 | ||||||
| Short-Term Investments | 1,834,124 | 2.7 | ||||||
| Securities Lending Collateral | 8,721,842 | 12.7 | ||||||
|
|
|
| |||||
Total Investments In Securities At Value | 77,464,362 | 112.7 | ||||||
| Liabilities in Excess of Other Assets (e) | (8,715,933 | ) | (12.7 | ) | ||||
|
|
|
| |||||
Net Assets | $ | 68,748,429 | 100.0 | % | ||||
|
|
|
| |||||
All securities are United States companies, unless noted otherwise in parentheses.
| * | Non-income producing security. |
| (a) | The security or a portion of this security is on loan at September 30, 2018. The total value of securities on loan at September 30, 2018 was $8,434,961. |
| (b) | Represents less than 0.05% of net assets. |
| (c) | Represents 7-day effective yield as of September 30, 2018. |
| (d) | Represents security, or portion thereof, purchased with the cash collateral received for securities on loan. |
| (e) | Includes appreciation/(depreciation) on futures contracts. |
All securities are Level 1 with respect to ASC 820 (See Note 4).
| The accompanying notes are an integral part of these financial statements. | (Continued) |
| AQR Funds | Annual Report | September 2018 | ||||||||||||||
139
Table of Contents
| Schedule of Investments | September 30, 2018 |
| AQR TM SMALL CAP MOMENTUM STYLE FUND |
Futures contracts outstanding as of September 30, 2018:
Exchange Traded
| DESCRIPTION | NUMBER OF CONTRACTS | EXPIRATION DATE | TRADING CURRENCY | NOTIONAL AMOUNT | VALUE AND UNREALIZED APPRECIATION (DEPRECIATION) | |||||||||||
| Long Contracts | ||||||||||||||||
| Russell 2000 E-Mini Index | 14 | 12/2018 | USD | $1,190,560 | $(12,493 | ) | ||||||||||
|
| |||||||||||||||
| $(12,493 | ) | |||||||||||||||
|
| |||||||||||||||
USD - United States Dollar
Collateral pledged to, or (received from), each counterparty at September 30, 2018 was as follows:
| COUNTERPARTY | OVER THE COUNTER | EXCHANGE TRADED | TOTAL | |||||||||
| GSCO | ||||||||||||
| Cash | $— | $69,208 | $69,208 | |||||||||
| ||||||||||||
| The accompanying notes are an integral part of these financial statements. |
| AQR Funds | Annual Report | September 2018 | ||||||||||||||
140
Table of Contents
| Schedule of Investments | September 30, 2018 |
| AQR TM INTERNATIONAL MOMENTUM STYLE FUND |
| INVESTMENTS | SHARES | VALUE | ||||||
| COMMON STOCKS - 96.7% |
| |||||||
| Australia - 5.4% | ||||||||
| AGL Energy Ltd. | 14,330 | $ | 202,144 | |||||
| Alumina Ltd. | 157,524 | 315,337 | ||||||
| Amcor Ltd. | 28,362 | 280,308 | ||||||
| Aristocrat Leisure Ltd. | 16,818 | 345,391 | ||||||
| BHP Billiton plc | 15,882 | 346,570 | ||||||
| BlueScope Steel Ltd. | 13,466 | 165,157 | ||||||
| Caltex Australia Ltd. | 6,874 | 148,505 | ||||||
| CIMIC Group Ltd. | 1,392 | 51,664 | ||||||
| Cochlear Ltd. | 852 | 123,537 | ||||||
| Computershare Ltd. | 4,413 | 63,552 | ||||||
| CSL Ltd. | 9,109 | 1,323,533 | ||||||
| Dexus, REIT | 12,369 | 94,494 | ||||||
| Flight Centre Travel Group Ltd. | 1,887 | 72,464 | ||||||
| Goodman Group, REIT | 9,510 | 71,340 | ||||||
| Insurance Australia Group Ltd. | 27,972 | 147,880 | ||||||
| Macquarie Group Ltd. | 2,588 | 235,426 | ||||||
| Medibank Pvt Ltd. | 36,704 | 77,178 | ||||||
| Oil Search Ltd. | 9,518 | 62,171 | ||||||
| Origin Energy Ltd. * | 51,235 | 305,394 | ||||||
| Ramsay Health Care Ltd. | 4,824 | 191,392 | ||||||
| REA Group Ltd. | 962 | 59,685 | ||||||
| Rio Tinto plc | 13,589 | 685,450 | ||||||
| Santos Ltd. | 39,363 | 206,663 | ||||||
| South32 Ltd. | 120,841 | 339,600 | ||||||
| Treasury Wine Estates Ltd. | 52,959 | 668,444 | ||||||
| Wesfarmers Ltd. | 6,805 | 245,043 | ||||||
| Woodside Petroleum Ltd. | 3,381 | 94,319 | ||||||
|
| |||||||
| 6,922,641 | ||||||||
|
| |||||||
| Austria - 0.5% | ||||||||
| ANDRITZ AG | 2,003 | 116,826 | ||||||
| OMV AG | 6,031 | 338,333 | ||||||
| Raiffeisen Bank International AG | 8,448 | 243,146 | ||||||
|
| |||||||
| 698,305 | ||||||||
|
| |||||||
| Belgium - 0.7% | ||||||||
| Ageas | 9,048 | 486,408 | ||||||
| Colruyt SA | 624 | 35,314 | ||||||
| Umicore SA | 7,052 | 393,914 | ||||||
|
| |||||||
| 915,636 | ||||||||
|
| |||||||
| Canada - 9.7% | ||||||||
| Alimentation Couche-Tard, Inc., Class B (1) | 2,207 | 110,397 | ||||||
| BlackBerry Ltd. (1)* | 7,514 | 85,050 | ||||||
| Bombardier, Inc., Class B (1)* | 86,336 | 307,472 | ||||||
| Brookfield Asset Management, Inc., Class A (1) | 4,940 | 219,874 | ||||||
| CAE, Inc. (1) | 3,067 | 62,259 | ||||||
| Canadian Imperial Bank of Commerce (1) | 2,202 | 206,331 | ||||||
| Canadian National Railway Co. (1) | 2,046 | 183,588 | ||||||
| Canadian Natural Resources Ltd. (1) | 24,816 | 810,773 | ||||||
| Canadian Pacific Railway Ltd. (1) | 1,804 | 381,610 | ||||||
| Canadian Tire Corp. Ltd., Class A (1) | 1,511 | 177,041 | ||||||
| CCL Industries, Inc., Class B (1) | 5,217 | 235,152 | ||||||
| Cenovus Energy, Inc. (1) | 12,854 | 129,072 | ||||||
| CGI Group, Inc., Class A (1)* | 3,368 | 217,154 | ||||||
| Constellation Software, Inc. (1) | 723 | 531,689 | ||||||
| Dollarama, Inc. (1) | 16,098 | 507,125 | ||||||
| INVESTMENTS | SHARES | VALUE | ||||||
| Canada - 9.7% (continued) | ||||||||
| Empire Co. Ltd., Class A (1) | 4,422 | $ | 80,590 | |||||
| Encana Corp. (1) | 13,462 | 176,450 | ||||||
| Fairfax Financial Holdings Ltd. (1) | 329 | 178,742 | ||||||
| Finning International, Inc. (1) | 4,203 | 102,663 | ||||||
| Fortis, Inc. (1) | 7,587 | 245,998 | ||||||
| Franco-Nevada Corp. (1) | 1,902 | 118,981 | ||||||
| Gildan Activewear, Inc. (1) | 2,257 | 68,672 | ||||||
| Husky Energy, Inc. (1) | 7,055 | 123,878 | ||||||
| Imperial Oil Ltd. (1)(a) | 6,093 | 197,180 | ||||||
| International Petroleum Corp. * | 3,493 | 22,780 | ||||||
| Magna International, Inc. (1) | 7,886 | 414,249 | ||||||
| Manulife Financial Corp. (1) | 7,335 | 131,123 | ||||||
| Methanex Corp. (1) | 2,303 | 181,794 | ||||||
| National Bank of Canada (1) | 5,523 | 275,840 | ||||||
| Nutrien Ltd. (1) | 6,033 | 348,346 | ||||||
| Onex Corp. (1) | 1,464 | 100,116 | ||||||
| Open Text Corp. (1) | 1,890 | 71,918 | ||||||
| Pembina Pipeline Corp. (1) | 3,384 | 114,988 | ||||||
| Restaurant Brands International, Inc. (1) | 4,206 | 249,042 | ||||||
| Rogers Communications, Inc., Class B (1) | 7,436 | 382,436 | ||||||
| Royal Bank of Canada (1) | 1,750 | 140,282 | ||||||
| Shopify, Inc., Class A (1)* | 4,859 | 798,642 | ||||||
| Sun Life Financial, Inc. (1) | 6,877 | 273,398 | ||||||
| Suncor Energy, Inc. (1) | 47,579 | 1,841,054 | ||||||
| Teck Resources Ltd., Class B (1) | 4,969 | 119,758 | ||||||
| Toronto-Dominion Bank (The) (1) | 22,163 | 1,346,784 | ||||||
| West Fraser Timber Co. Ltd. (1) | 911 | 51,847 | ||||||
| WSP Global, Inc. (1) | 2,856 | 156,304 | ||||||
|
| |||||||
| 12,478,442 | ||||||||
|
| |||||||
| Chile - 0.0% (b) | ||||||||
| Antofagasta plc | 3,557 | 39,527 | ||||||
|
| |||||||
| China - 0.4% | ||||||||
| BOC Hong Kong Holdings Ltd. | 89,500 | 424,796 | ||||||
| Minth Group Ltd. (a) | 14,000 | 57,597 | ||||||
| Yangzijiang Shipbuilding Holdings Ltd. | 45,600 | 41,340 | ||||||
|
| |||||||
| 523,733 | ||||||||
|
| |||||||
| Denmark - 2.3% | ||||||||
| Carlsberg A/S, Class B | 874 | 104,815 | ||||||
| Chr Hansen Holding A/S | 1,773 | 179,757 | ||||||
| Coloplast A/S, Class B | 914 | 93,370 | ||||||
| DSV A/S | 4,230 | 384,383 | ||||||
| Genmab A/S * | 317 | 49,792 | ||||||
| H Lundbeck A/S | 3,070 | 189,506 | ||||||
| ISS A/S | 1,327 | 46,622 | ||||||
| Novo Nordisk A/S, Class B | 13,374 | 629,448 | ||||||
| Novozymes A/S, Class B | 1,164 | 63,844 | ||||||
| Orsted A/S (c) | 10,618 | 721,523 | ||||||
| Pandora A/S | 641 | 39,981 | ||||||
| Tryg A/S | 11,965 | 297,939 | ||||||
| William Demant Holding A/S * | 3,964 | 148,802 | ||||||
|
| |||||||
| 2,949,782 | ||||||||
|
| |||||||
| Finland - 1.6% | ||||||||
| Elisa OYJ | 1,415 | 59,988 | ||||||
| Fortum OYJ | 22,341 | 559,896 | ||||||
| Kone OYJ, Class B | 2,741 | 146,311 | ||||||
| The accompanying notes are an integral part of these financial statements. | (Continued) |
| AQR Funds | Annual Report | September 2018 | ||||||||||||||
141
Table of Contents
| Schedule of Investments | September 30, 2018 |
| AQR TM INTERNATIONAL MOMENTUM STYLE FUND |
| INVESTMENTS | SHARES | VALUE | ||||||
| Finland - 1.6% (continued) | ||||||||
| Metso OYJ | 1,670 | $ | 59,105 | |||||
| Neste OYJ | 3,922 | 323,272 | ||||||
| Nokian Renkaat OYJ | 1,449 | 59,310 | ||||||
| Sampo OYJ, Class A | 3,563 | 184,382 | ||||||
| Stora Enso OYJ, Class R | 12,318 | 235,226 | ||||||
| UPM-Kymmene OYJ | 7,635 | 299,437 | ||||||
| Wartsila OYJ Abp | 5,676 | 110,453 | ||||||
|
| |||||||
| 2,037,380 | ||||||||
|
| |||||||
| France - 4.8% | ||||||||
| Accor SA | 917 | 47,108 | ||||||
| Airbus SE | 10,257 | 1,287,690 | ||||||
| AXA SA | 6,712 | 179,853 | ||||||
| BNP Paribas SA | 10,463 | 640,719 | ||||||
| Capgemini SE | 1,863 | 234,548 | ||||||
| Credit Agricole SA | 26,078 | 374,871 | ||||||
| Dassault Systemes SE | 2,145 | 320,972 | ||||||
| Essilor International Cie Generale d’Optique SA | 726 | 107,462 | ||||||
| Hermes International | 304 | 201,407 | ||||||
| Iliad SA (a) | 513 | 67,010 | ||||||
| L’Oreal SA | 548 | 132,116 | ||||||
| LVMH Moet Hennessy Louis Vuitton SE | 1,666 | 588,716 | ||||||
| Orange SA | 18,570 | 295,479 | ||||||
| Peugeot SA | 2,366 | 63,825 | ||||||
| Renault SA | 555 | 48,009 | ||||||
| Safran SA | 2,841 | 397,808 | ||||||
| Sanofi | 811 | 72,461 | ||||||
| Societe Generale SA | 5,264 | 226,038 | ||||||
| TOTAL SA | 10,152 | 660,091 | ||||||
| Valeo SA | 5,598 | 242,398 | ||||||
|
| |||||||
| 6,188,581 | ||||||||
|
| |||||||
| Germany - 7.8% | ||||||||
| 1&1 Drillisch AG | 1,015 | 49,341 | ||||||
| adidas AG | 4,540 | 1,110,301 | ||||||
| Allianz SE (Registered) | 4,554 | 1,013,569 | ||||||
| Axel Springer SE | 845 | 56,808 | ||||||
| BASF SE | 1,815 | 161,051 | ||||||
| Beiersdorf AG | 526 | 59,292 | ||||||
| Brenntag AG | 669 | 41,258 | ||||||
| Continental AG | 988 | 171,660 | ||||||
| Covestro AG (c) | 3,603 | 291,653 | ||||||
| Deutsche Boerse AG | 2,453 | 327,983 | ||||||
| Deutsche Post AG (Registered) | 6,482 | 230,463 | ||||||
| Deutsche Wohnen SE | 9,053 | 434,831 | ||||||
| E.ON SE | 67,552 | 687,392 | ||||||
| Fraport AG Frankfurt Airport Services Worldwide | 1,128 | 99,582 | ||||||
| Fresenius Medical Care AG & Co. KGaA | 459 | 47,159 | ||||||
| Hannover Rueck SE | 3,192 | 450,545 | ||||||
| HeidelbergCement AG | 577 | 45,068 | ||||||
| HOCHTIEF AG | 255 | 42,273 | ||||||
| HUGO BOSS AG | 1,731 | 133,175 | ||||||
| Infineon Technologies AG | 33,811 | 769,399 | ||||||
| KION Group AG | 804 | 49,366 | ||||||
| LANXESS AG | 1,584 | 115,867 | ||||||
| MAN SE | 419 | 45,549 | ||||||
| MTU Aero Engines AG | 445 | 100,249 | ||||||
| INVESTMENTS | SHARES | VALUE | ||||||
| Germany - 7.8% (continued) | ||||||||
| Puma SE | 380 | $ | 187,494 | |||||
| RWE AG | 13,533 | 334,122 | ||||||
| SAP SE | 7,794 | 958,378 | ||||||
| Siemens AG (Registered) | 1,201 | 153,564 | ||||||
| Symrise AG | 943 | 85,982 | ||||||
| United Internet AG (Registered) | 2,114 | 99,950 | ||||||
| Vonovia SE | 9,941 | 486,197 | ||||||
| Wirecard AG | 5,088 | 1,100,784 | ||||||
| Zalando SE *(c) | 3,246 | 126,134 | ||||||
|
| |||||||
| 10,066,439 | ||||||||
|
| |||||||
| Hong Kong - 3.7% | ||||||||
| AIA Group Ltd. | 191,600 | 1,708,481 | ||||||
| ASM Pacific Technology Ltd. | 7,400 | 75,619 | ||||||
| CK Asset Holdings Ltd. | 34,500 | 258,619 | ||||||
| CK Hutchison Holdings Ltd. | 7,000 | 80,575 | ||||||
| CLP Holdings Ltd. (a) | 26,000 | 304,479 | ||||||
| Galaxy Entertainment Group Ltd. | 50,000 | 315,854 | ||||||
| Hang Seng Bank Ltd. | 2,400 | 65,122 | ||||||
| Henderson Land Development Co. Ltd. | 21,961 | 110,290 | ||||||
| Hong Kong Exchanges & Clearing Ltd. | 18,900 | 540,059 | ||||||
| Link REIT | 30,500 | 300,302 | ||||||
| MTR Corp. Ltd. | 19,500 | 102,549 | ||||||
| New World Development Co. Ltd. | 39,000 | 52,971 | ||||||
| PCCW Ltd. | 75,000 | 43,697 | ||||||
| Power Assets Holdings Ltd. | 7,000 | 48,657 | ||||||
| Shangri-La Asia Ltd. | 32,000 | 47,364 | ||||||
| Sun Hung Kai Properties Ltd. | 13,000 | 188,659 | ||||||
| Techtronic Industries Co. Ltd. | 27,500 | 175,414 | ||||||
| WH Group Ltd. (c) | 251,500 | 176,567 | ||||||
| Wharf Holdings Ltd. (The) | 16,000 | 43,563 | ||||||
| Wharf Real Estate Investment Co. Ltd. | 16,000 | 103,081 | ||||||
| Wheelock & Co. Ltd. | 9,000 | 54,109 | ||||||
|
| |||||||
| 4,796,031 | ||||||||
|
| |||||||
| Italy - 1.7% | ||||||||
| Assicurazioni Generali SpA | 6,913 | 119,041 | ||||||
| Atlantia SpA | 3,173 | 65,829 | ||||||
| Enel SpA | 102,597 | 524,428 | ||||||
| Eni SpA | 18,286 | 344,683 | ||||||
| Ferrari NV (a) | 3,660 | 502,725 | ||||||
| Intesa Sanpaolo SpA | 78,923 | 201,090 | ||||||
| Mediobanca Banca di Credito Finanziario SpA | 8,681 | 86,391 | ||||||
| Moncler SpA | 2,560 | 110,150 | ||||||
| Prysmian SpA | 2,292 | 53,215 | ||||||
| Recordati SpA | 1,120 | 37,872 | ||||||
| Terna Rete Elettrica Nazionale SpA | 23,336 | 124,658 | ||||||
|
| |||||||
| 2,170,082 | ||||||||
|
| |||||||
| Japan - 29.1% | ||||||||
| Aeon Co. Ltd. | 5,400 | 130,115 | ||||||
| AGC, Inc. | 3,300 | 136,958 | ||||||
| Aisin Seiki Co. Ltd. | 1,800 | 87,695 | ||||||
| Alfresa Holdings Corp. | 1,900 | 50,893 | ||||||
| ANA Holdings, Inc. (a) | 9,000 | 314,411 | ||||||
| Asahi Group Holdings Ltd. | 9,400 | 407,840 | ||||||
| Asahi Kasei Corp. | 24,200 | 366,923 | ||||||
| Astellas Pharma, Inc. | 17,700 | 309,095 | ||||||
| The accompanying notes are an integral part of these financial statements. | (Continued) |
| AQR Funds | Annual Report | September 2018 | ||||||||||||||
142
Table of Contents
| Schedule of Investments | September 30, 2018 |
| AQR TM INTERNATIONAL MOMENTUM STYLE FUND |
| INVESTMENTS | SHARES | VALUE | ||||||
| Japan - 29.1% (continued) | ||||||||
| Bank of Kyoto Ltd. (The) | 1,000 | $ | 52,197 | |||||
| Benesse Holdings, Inc. | 2,100 | 59,799 | ||||||
| Bridgestone Corp. | 7,300 | 275,892 | ||||||
| Brother Industries Ltd. | 6,600 | 130,318 | ||||||
| Canon, Inc. | 15,200 | 481,985 | ||||||
| Central Japan Railway Co. | 1,600 | 333,117 | ||||||
| Chiba Bank Ltd. (The) | 15,000 | 102,443 | ||||||
| Chugai Pharmaceutical Co. Ltd. | 7,600 | 488,553 | ||||||
| Coca-Cola Bottlers Japan Holdings, Inc. | 2,200 | 58,881 | ||||||
| CyberAgent, Inc. | 3,200 | 170,293 | ||||||
| Daicel Corp. | 3,400 | 39,495 | ||||||
| Daifuku Co. Ltd. | 5,700 | 290,498 | ||||||
| Dai-ichi Life Holdings, Inc. | 7,000 | 145,917 | ||||||
| Daiichi Sankyo Co. Ltd. | 12,800 | 554,853 | ||||||
| Daikin Industries Ltd. | 3,100 | 412,621 | ||||||
| Daito Trust Construction Co. Ltd. | 900 | 115,979 | ||||||
| Daiwa House Industry Co. Ltd. | 10,100 | 299,302 | ||||||
| Denso Corp. | 4,800 | 253,574 | ||||||
| Disco Corp. | 700 | 117,224 | ||||||
| Don Quijote Holdings Co. Ltd. | 1,300 | 65,785 | ||||||
| Eisai Co. Ltd. | 3,800 | 370,185 | ||||||
| FANUC Corp. | 1,000 | 188,133 | ||||||
| Fast Retailing Co. Ltd. | 800 | 405,279 | ||||||
| Fuji Electric Co. Ltd. | 1,200 | 48,068 | ||||||
| FUJIFILM Holdings Corp. | 2,000 | 89,978 | ||||||
| Fujitsu Ltd. | 600 | 42,744 | ||||||
| Fukuoka Financial Group, Inc. | 2,400 | 66,001 | ||||||
| Hikari Tsushin, Inc. | 400 | 79,054 | ||||||
| Hisamitsu Pharmaceutical Co., Inc. | 700 | 53,685 | ||||||
| Hitachi Construction Machinery Co. Ltd. | 5,300 | 177,190 | ||||||
| Hitachi Ltd. | 14,600 | 496,278 | ||||||
| Honda Motor Co. Ltd. | 1,500 | 45,174 | ||||||
| Hoshizaki Corp. | 1,200 | 124,205 | ||||||
| Hoya Corp. | 6,900 | 409,798 | ||||||
| Idemitsu Kosan Co. Ltd. | 9,200 | 487,089 | ||||||
| IHI Corp. | 1,200 | 45,464 | ||||||
| Iida Group Holdings Co. Ltd. | 2,400 | 42,654 | ||||||
| Inpex Corp. | 15,100 | 188,668 | ||||||
| ITOCHU Corp. | 27,600 | 505,166 | ||||||
| Japan Airlines Co. Ltd. | 2,300 | 82,667 | ||||||
| JFE Holdings, Inc. | 5,900 | 135,346 | ||||||
| JXTG Holdings, Inc. | 69,800 | 527,953 | ||||||
| Kajima Corp. | 10,500 | 152,676 | ||||||
| Kakaku.com, Inc. | 3,100 | 60,568 | ||||||
| Kaneka Corp. | 1,400 | 64,676 | ||||||
| Kansai Electric Power Co., Inc. (The) | 17,900 | 270,183 | ||||||
| Kao Corp. | 8,700 | 702,767 | ||||||
| Keihan Holdings Co. Ltd. | 2,600 | 99,293 | ||||||
| Keisei Electric Railway Co. Ltd. | 2,700 | 95,034 | ||||||
| Keyence Corp. | 2,100 | 1,219,862 | ||||||
| Kikkoman Corp. | 2,900 | 172,714 | ||||||
| Kirin Holdings Co. Ltd. | 18,600 | 477,052 | ||||||
| Kobayashi Pharmaceutical Co. Ltd. | 800 | 58,897 | ||||||
| Koito Manufacturing Co. Ltd. | 5,000 | 328,334 | ||||||
| Komatsu Ltd. | 13,600 | 413,860 | ||||||
| Konami Holdings Corp. | 3,000 | 117,469 | ||||||
| Kose Corp. | 1,900 | 362,036 | ||||||
| Kyocera Corp. | 1,300 | 78,028 | ||||||
| Kyowa Hakko Kirin Co. Ltd. | 2,300 | 43,158 | ||||||
| INVESTMENTS | SHARES | VALUE | ||||||
| Japan - 29.1% (continued) | ||||||||
| Lion Corp. | 4,900 | $ | 108,827 | |||||
| M3, Inc. | 13,600 | 308,426 | ||||||
| Mabuchi Motor Co. Ltd. | 900 | 36,305 | ||||||
| Makita Corp. | 1,300 | 65,099 | ||||||
| Marubeni Corp. | 8,300 | 75,909 | ||||||
| Marui Group Co. Ltd. | 3,700 | 91,293 | ||||||
| McDonald’s Holdings Co. Japan Ltd. | 3,000 | 131,746 | ||||||
| MEIJI Holdings Co. Ltd. | 1,100 | 73,933 | ||||||
| MINEBEA MITSUMI, Inc. | 13,700 | 248,323 | ||||||
| MISUMI Group, Inc. | 8,400 | 217,346 | ||||||
| Mitsubishi Chemical Holdings Corp. | 29,200 | 279,461 | ||||||
| Mitsubishi Corp. | 19,900 | 612,974 | ||||||
| Mitsubishi Electric Corp. | 7,100 | 97,265 | ||||||
| Mitsubishi Gas Chemical Co., Inc. | 10,600 | 225,653 | ||||||
| Mitsubishi Motors Corp. | 20,000 | 141,290 | ||||||
| Mitsubishi Tanabe Pharma Corp. | 4,300 | 71,968 | ||||||
| Mitsui & Co. Ltd. | 13,400 | 238,127 | ||||||
| Mitsui Chemicals, Inc. | 2,000 | 50,010 | ||||||
| Nabtesco Corp. | 2,200 | 58,494 | ||||||
| Nexon Co. Ltd. * | 19,000 | 248,359 | ||||||
| Nidec Corp. | 5,700 | 819,636 | ||||||
| Nintendo Co. Ltd. | 1,200 | 436,600 | ||||||
| Nippon Electric Glass Co. Ltd. | 1,600 | 50,297 | ||||||
| Nippon Express Co. Ltd. | 1,000 | 65,674 | ||||||
| Nippon Paint Holdings Co. Ltd. | 2,900 | 108,246 | ||||||
| Nippon Telegraph & Telephone Corp. | 3,000 | 135,391 | ||||||
| Nisshin Seifun Group, Inc. | 5,000 | 109,653 | ||||||
| Nissin Foods Holdings Co. Ltd. | 900 | 61,908 | ||||||
| Nitori Holdings Co. Ltd. | 2,700 | 386,926 | ||||||
| Nitto Denko Corp. | 800 | 59,980 | ||||||
| Nomura Research Institute Ltd. | 3,150 | 159,069 | ||||||
| NSK Ltd. | 5,000 | 57,312 | ||||||
| NTT Data Corp. | 12,500 | 173,040 | ||||||
| NTT DOCOMO, Inc. | 1,500 | 40,316 | ||||||
| Obayashi Corp. | 15,000 | 142,070 | ||||||
| Obic Co. Ltd. | 2,600 | 245,912 | ||||||
| Omron Corp. | 4,100 | 173,257 | ||||||
| Oracle Corp. Japan | 1,300 | 104,744 | ||||||
| Oriental Land Co. Ltd. | 5,700 | 595,964 | ||||||
| Otsuka Corp. | 5,100 | 190,230 | ||||||
| Otsuka Holdings Co. Ltd. | 5,500 | 277,415 | ||||||
| Panasonic Corp. | 24,300 | 281,667 | ||||||
| Park24 Co. Ltd. | 2,900 | 87,650 | ||||||
| Persol Holdings Co. Ltd. | 6,200 | 145,517 | ||||||
| Pola Orbis Holdings, Inc. | 5,200 | 189,920 | ||||||
| Recruit Holdings Co. Ltd. | 29,800 | 995,364 | ||||||
| Renesas Electronics Corp. * | 6,500 | 40,697 | ||||||
| Resona Holdings, Inc. | 7,700 | 43,231 | ||||||
| Rohm Co. Ltd. | 3,000 | 219,480 | ||||||
| Ryohin Keikaku Co. Ltd. | 900 | 267,515 | ||||||
| Santen Pharmaceutical Co. Ltd. | 3,800 | 60,252 | ||||||
| Secom Co. Ltd. | 700 | 57,044 | ||||||
| Shimadzu Corp. | 5,900 | 184,892 | ||||||
| Shimano, Inc. | 1,100 | 177,374 | ||||||
| Shimizu Corp. | 12,000 | 109,563 | ||||||
| Shin-Etsu Chemical Co. Ltd. | 2,700 | 238,702 | ||||||
| Shionogi & Co. Ltd. | 4,300 | 281,090 | ||||||
| Shiseido Co. Ltd. | 12,500 | 968,099 | ||||||
| SMC Corp. | 800 | 256,057 | ||||||
| The accompanying notes are an integral part of these financial statements. | (Continued) |
| AQR Funds | Annual Report | September 2018 | ||||||||||||||
143
Table of Contents
| Schedule of Investments | September 30, 2018 |
| AQR TM INTERNATIONAL MOMENTUM STYLE FUND |
| INVESTMENTS | SHARES | VALUE | ||||||
| Japan - 29.1% (continued) | ||||||||
| SoftBank Group Corp. | 1,100 | $ | 109,890 | |||||
| Sohgo Security Services Co. Ltd. | 2,000 | 87,883 | ||||||
| Sony Corp. | 24,700 | 1,501,456 | ||||||
| Sony Financial Holdings, Inc. | 2,900 | 63,951 | ||||||
| Stanley Electric Co. Ltd. | 1,500 | 51,282 | ||||||
| SUMCO Corp. | 7,200 | 104,887 | ||||||
| Sumitomo Chemical Co. Ltd. | 17,000 | 99,490 | ||||||
| Sumitomo Corp. | 14,100 | 234,980 | ||||||
| Sumitomo Dainippon Pharma Co. Ltd. | 1,900 | 43,636 | ||||||
| Sumitomo Heavy Industries Ltd. | 4,800 | 171,320 | ||||||
| Sumitomo Metal Mining Co. Ltd. | 5,200 | 182,335 | ||||||
| Sumitomo Realty & Development Co. Ltd. | 3,000 | 107,623 | ||||||
| Sundrug Co. Ltd. | 1,400 | 49,956 | ||||||
| Suzuki Motor Corp. | 9,300 | 532,994 | ||||||
| Sysmex Corp. | 2,800 | 241,454 | ||||||
| T&D Holdings, Inc. | 10,800 | 178,358 | ||||||
| Taisei Corp. | 4,100 | 186,892 | ||||||
| Taisho Pharmaceutical Holdings Co. Ltd. | 500 | 61,167 | ||||||
| Takeda Pharmaceutical Co. Ltd. | 5,300 | 226,618 | ||||||
| TDK Corp. | 900 | 98,063 | ||||||
| Terumo Corp. | 6,100 | 361,023 | ||||||
| THK Co. Ltd. | 1,800 | 45,803 | ||||||
| Tokyo Electron Ltd. | 3,800 | 523,718 | ||||||
| Toray Industries, Inc. | 5,000 | 37,515 | ||||||
| Tosoh Corp. | 5,300 | 81,630 | ||||||
| TOTO Ltd. | 3,500 | 145,160 | ||||||
| Toyota Motor Corp. | 31,000 | 1,931,386 | ||||||
| Toyota Tsusho Corp. | 3,100 | 117,046 | ||||||
| Trend Micro, Inc. | 3,700 | 237,998 | ||||||
| Tsuruha Holdings, Inc. | 700 | 86,163 | ||||||
| USS Co. Ltd. | 4,900 | 90,963 | ||||||
| West Japan Railway Co. | 1,000 | 69,710 | ||||||
| Yakult Honsha Co. Ltd. | 3,700 | 303,439 | ||||||
| Yamaha Corp. | 6,000 | 317,927 | ||||||
| Yamaha Motor Co. Ltd. | 6,000 | 168,257 | ||||||
| Yamato Holdings Co. Ltd. | 4,800 | 147,379 | ||||||
| Yaskawa Electric Corp. | 9,800 | 291,071 | ||||||
| Yokogawa Electric Corp. | 2,900 | 61,344 | ||||||
| ZOZO, Inc. | 10,400 | 314,596 | ||||||
|
| |||||||
| 37,624,967 | ||||||||
|
| |||||||
| Luxembourg - 0.2% | ||||||||
| ArcelorMittal | 7,713 | 239,460 | ||||||
| Tenaris SA | 3,839 | 64,293 | ||||||
|
| |||||||
| 303,753 | ||||||||
|
| |||||||
| Macau - 0.3% | ||||||||
| MGM China Holdings Ltd. (a) | 27,600 | 43,574 | ||||||
| Sands China Ltd. | 45,200 | 203,558 | ||||||
| SJM Holdings Ltd. | 47,000 | 43,304 | ||||||
| Wynn Macau Ltd. | 40,000 | 91,864 | ||||||
|
| |||||||
| 382,300 | ||||||||
|
| |||||||
| Netherlands - 6.1% | ||||||||
| ASML Holding NV | 8,315 | 1,561,180 | ||||||
| EXOR NV | 2,559 | 170,738 | ||||||
| Heineken NV | 385 | 36,132 | ||||||
| Koninklijke Ahold Delhaize NV | 7,831 | 179,663 | ||||||
| Koninklijke DSM NV | 2,304 | 244,024 | ||||||
| INVESTMENTS | SHARES | VALUE | ||||||
| Netherlands - 6.1% (continued) | ||||||||
| Koninklijke Philips NV | 15,798 | $ | 720,096 | |||||
| Koninklijke Vopak NV | 760 | 37,442 | ||||||
| NN Group NV | 3,452 | 154,071 | ||||||
| Randstad NV | 1,696 | 90,523 | ||||||
| Royal Dutch Shell plc, Class A | 99,599 | 3,415,098 | ||||||
| Royal Dutch Shell plc, Class B | 22,851 | 799,935 | ||||||
| Wolters Kluwer NV | 7,280 | 453,835 | ||||||
|
| |||||||
| 7,862,737 | ||||||||
|
| |||||||
| Norway - 2.0% | ||||||||
| DNB ASA | 1,811 | 38,112 | ||||||
| Equinor ASA | 77,715 | 2,185,056 | ||||||
| Marine Harvest ASA | 6,051 | 140,214 | ||||||
| Norsk Hydro ASA | 22,252 | 133,442 | ||||||
| Telenor ASA | 4,865 | 95,138 | ||||||
|
| |||||||
| 2,591,962 | ||||||||
|
| |||||||
| Portugal - 0.5% | ||||||||
| Galp Energia SGPS SA | 29,307 | 581,094 | ||||||
|
| |||||||
| Singapore - 1.9% | ||||||||
| CapitaLand Commercial Trust, REIT | 39,000 | 50,811 | ||||||
| City Developments Ltd. | 10,300 | 68,672 | ||||||
| DBS Group Holdings Ltd. | 48,400 | 923,334 | ||||||
| Genting Singapore Ltd. | 130,400 | 101,078 | ||||||
| Keppel Corp. Ltd. | 25,400 | 129,318 | ||||||
| Oversea-Chinese Banking Corp. Ltd. | 57,600 | 481,979 | ||||||
| Singapore Telecommunications Ltd. | 54,500 | 129,148 | ||||||
| United Overseas Bank Ltd. | 24,500 | 484,327 | ||||||
| UOL Group Ltd. | 9,700 | 48,919 | ||||||
|
| |||||||
| 2,417,586 | ||||||||
|
| |||||||
| South Africa - 0.5% | ||||||||
| Anglo American plc | 27,870 | 623,479 | ||||||
|
| |||||||
| Spain - 0.9% | ||||||||
| Aena SME SA (c) | 716 | 124,052 | ||||||
| Amadeus IT Group SA | 7,796 | 722,603 | ||||||
| Ferrovial SA | 7,001 | 144,873 | ||||||
| Grifols SA | 3,042 | 85,534 | ||||||
| Iberdrola SA | 17,701 | 130,011 | ||||||
|
| |||||||
| 1,207,073 | ||||||||
|
| |||||||
| Sweden - 2.4% | ||||||||
| Assa Abloy AB, Class B | 10,741 | 215,291 | ||||||
| Atlas Copco AB, Class A | 16,607 | 477,587 | ||||||
| Boliden AB | 11,374 | 316,321 | ||||||
| Electrolux AB, Series B | 1,668 | 36,745 | ||||||
| Epiroc AB, Class A * | 16,607 | 185,453 | ||||||
| Hexagon AB, Class B | 3,302 | 193,321 | ||||||
| Kinnevik AB, Class B | 2,239 | 67,610 | ||||||
| Lundin Petroleum AB | 12,379 | 471,853 | ||||||
| Sandvik AB | 29,575 | 523,604 | ||||||
| Swedish Match AB | 5,661 | 289,364 | ||||||
| Tele2 AB, Class B | 7,236 | 86,965 | ||||||
| Telefonaktiebolaget LM Ericsson, Class B | 5,916 | 52,361 | ||||||
| Volvo AB, Class B | 13,588 | 239,651 | ||||||
|
| |||||||
| 3,156,126 | ||||||||
|
| |||||||
| The accompanying notes are an integral part of these financial statements. | (Continued) |
| AQR Funds | Annual Report | September 2018 | ||||||||||||||
144
Table of Contents
| Schedule of Investments | September 30, 2018 |
| AQR TM INTERNATIONAL MOMENTUM STYLE FUND |
| INVESTMENTS | SHARES | VALUE | ||||||
| Switzerland - 5.7% | ||||||||
| ABB Ltd. (Registered) | 10,867 | $ | 257,056 | |||||
| Baloise Holding AG (Registered) | 623 | 94,939 | ||||||
| Barry Callebaut AG (Registered) | 80 | 151,491 | ||||||
| Chocoladefabriken Lindt & Spruengli AG | 9 | 62,986 | ||||||
| Cie Financiere Richemont SA (Registered) | 9,450 | 770,462 | ||||||
| Coca-Cola HBC AG * | 2,201 | 74,986 | ||||||
| EMS-Chemie Holding AG (Registered) | 460 | 274,339 | ||||||
| Geberit AG (Registered) | 528 | 245,067 | ||||||
| Givaudan SA (Registered) | 118 | 290,349 | ||||||
| Glencore plc * | 131,000 | 564,699 | ||||||
| Julius Baer Group Ltd. * | 1,875 | 93,705 | ||||||
| Kuehne + Nagel International AG (Registered) | 582 | 92,349 | ||||||
| LafargeHolcim Ltd. (Registered) * | 974 | 48,220 | ||||||
| Lonza Group AG (Registered)*(a) | 2,711 | 927,426 | ||||||
| Partners Group Holding AG | 1,400 | 1,109,805 | ||||||
| Schindler Holding AG | 335 | 83,601 | ||||||
| Sika AG (Registered) | 3,240 | 471,483 | ||||||
| Sonova Holding AG (Registered) | 662 | 131,386 | ||||||
| STMicroelectronics NV | 13,589 | 248,714 | ||||||
| Straumann Holding AG (Registered) | 850 | 640,359 | ||||||
| Swatch Group AG (The) | 1,069 | 424,857 | ||||||
| Swisscom AG (Registered) | 108 | 48,984 | ||||||
| Vifor Pharma AG | 377 | 65,361 | ||||||
| Zurich Insurance Group AG | 492 | 155,130 | ||||||
|
| |||||||
| 7,327,754 | ||||||||
|
| |||||||
| United Kingdom - 8.0% | ||||||||
| 3i Group plc | 5,219 | 63,906 | ||||||
| Admiral Group plc | 1,746 | 47,329 | ||||||
| Ashtead Group plc | 4,765 | 151,185 | ||||||
| Associated British Foods plc | 1,417 | 42,291 | ||||||
| AstraZeneca plc | 3,436 | 267,816 | ||||||
| Auto Trader Group plc (c) | 29,518 | 171,714 | ||||||
| BAE Systems plc | 37,113 | 304,326 | ||||||
| Barratt Developments plc | 7,602 | 56,140 | ||||||
| BP plc | 188,276 | 1,443,086 | ||||||
| British American Tobacco plc | 28,247 | 1,316,889 | ||||||
| Bunzl plc | 6,811 | 214,125 | ||||||
| CNH Industrial NV | 14,972 | 179,670 | ||||||
| Compass Group plc | 27,316 | 607,325 | ||||||
| Diageo plc | 1,887 | 66,853 | ||||||
| Direct Line Insurance Group plc | 42,210 | 178,160 | ||||||
| Experian plc | 5,258 | 134,921 | ||||||
| Fiat Chrysler Automobiles NV * | 35,383 | 618,814 | ||||||
| HSBC Holdings plc | 147,837 | 1,289,935 | ||||||
| International Consolidated Airlines Group SA | 30,216 | 259,210 | ||||||
| Intertek Group plc | 3,758 | 244,467 | ||||||
| Legal & General Group plc | 45,149 | 154,129 | ||||||
| Persimmon plc | 12,600 | 387,920 | ||||||
| Prudential plc | 20,491 | 469,819 | ||||||
| Reckitt Benckiser Group plc | 5,607 | 512,200 | ||||||
| Sage Group plc (The) | 32,325 | 246,884 | ||||||
| Smith & Nephew plc | 3,009 | 54,898 | ||||||
| Standard Chartered plc | 21,181 | 175,489 | ||||||
| Taylor Wimpey plc | 76,759 | 171,572 | ||||||
| Vodafone Group plc | 183,657 | 393,508 | ||||||
| Whitbread plc | 1,309 | 80,454 | ||||||
|
| |||||||
| 10,305,035 | ||||||||
|
| |||||||
| INVESTMENTS | SHARES | VALUE | ||||||
| United States - 0.3% | ||||||||
| Bausch Health Cos., Inc. (1)* | 12,552 | $ | 322,339 | |||||
| QIAGEN NV * | 1,704 | 64,535 | ||||||
|
| |||||||
| 386,874 | ||||||||
|
| |||||||
| Zambia - 0.2% | ||||||||
| First Quantum Minerals Ltd. (1) | 17,104 | 194,789 | ||||||
|
| |||||||
TOTAL COMMON STOCKS | 124,752,108 | |||||||
|
| |||||||
| SHORT-TERM INVESTMENTS - 2.8% | ||||||||
| Investment Companies - 2.8% | ||||||||
| Limited Purpose Cash Investment Fund, 2.06% (1)(d) | ||||||||
(Cost $3,656,911) | 3,657,783 | 3,657,418 | ||||||
|
| |||||||
| SECURITIES LENDING COLLATERAL - 1.1% | ||||||||
| Investment Companies - 1.1% | ||||||||
| Investments in a Pooled Account through Securities Lending Program with Citibank NA | ||||||||
| BlackRock Liquidity Funds T-Fund Portfolio, Institutional Shares 1.97% (1)(d)(e) | 180,858 | 180,858 | ||||||
| Limited Purpose Cash Investment Fund 2.06% (1)(d)(e) | 1,297,767 | 1,297,638 | ||||||
|
| |||||||
TOTAL SECURITIES LENDING COLLATERAL | 1,478,496 | |||||||
|
| |||||||
TOTAL INVESTMENTS IN SECURITIES | 129,888,022 | |||||||
|
| |||||||
| LIABILITIES IN EXCESS OF OTHER ASSETS - (0.6)% (f) | (768,555) | |||||||
|
| |||||||
NET ASSETS - 100.0% | $ | 129,119,467 | ||||||
|
| |||||||
| SECTOR | VALUE | % OF NET ASSETS | ||||||
| Communication Services | $ | 3,358,736 | 2.6 | % | ||||
| Consumer Discretionary | 18,326,145 | 14.2 | ||||||
| Consumer Staples | 8,807,847 | 6.8 | ||||||
| Energy | 16,101,176 | 12.5 | ||||||
| Financials | 17,708,028 | 13.7 | ||||||
| Health Care | 10,507,352 | 8.1 | ||||||
| Industrials | 18,662,000 | 14.6 | ||||||
| Information Technology | 13,767,886 | 10.7 | ||||||
| Materials | 10,469,688 | 8.1 | ||||||
| Real Estate | 2,889,759 | 2.2 | ||||||
| Utilities | 4,153,491 | 3.2 | ||||||
| Short-Term Investments | 3,657,418 | 2.8 | ||||||
| Securities Lending Collateral | 1,478,496 | 1.1 | ||||||
|
|
|
| |||||
Total Investments In Securities | 129,888,022 | 100.6 | ||||||
| Liabilities in Excess of Other Assets (f) | (768,555 | ) | (0.6 | ) | ||||
|
|
|
| |||||
Net Assets | $ | 129,119,467 | 100.0 | % | ||||
|
|
|
| |||||
| The accompanying notes are an integral part of these financial statements. | (Continued) |
| AQR Funds | Annual Report | September 2018 | ||||||||||||||
145
Table of Contents
| Schedule of Investments | September 30, 2018 |
| AQR TM INTERNATIONAL MOMENTUM STYLE FUND |
| * | Non-income producing security. |
| (a) | The security or a portion of this security is on loan at September 30, 2018. The total value of securities on loan at September 30, 2018 was $1,405,879. |
| (b) | Represents less than 0.05% of net assets. |
| (c) | Securities exempt from registration under Rule 144A or section 4(2), of the Securities Act of 1933. Under procedures approved by the Board of Trustees, such securities have been determined to be liquid by the investment adviser and may be resold, normally to qualified institutional buyers in transactions exempt from registration. Total value of all such securities at September 30, 2018 amounted to $1,611,643, which represents approximately 1.25% of net assets of the fund. |
| (d) | Represents 7-day effective yield as of September 30, 2018. |
| (e) | Represents security, or portion thereof, purchased with the cash collateral received for securities on loan (See Note 3). |
| (f) | Includes appreciation/(depreciation) on futures contracts. |
All securities are Level 2 with respect to ASC 820, unless otherwise noted in parentheses.
| (1) | Level 1 security (See Note 4). |
Abbreviations
OYJ - Public Traded Company
REIT - Real Estate Investment Trust
Futures contracts outstanding as of September 30, 2018:
Exchange Traded
| DESCRIPTION | NUMBER OF CONTRACTS | EXPIRATION DATE | TRADING CURRENCY | NOTIONAL AMOUNT | VALUE AND UNREALIZED APPRECIATION (DEPRECIATION) | |||||||||||
| Long Contracts | ||||||||||||||||
| MSCI EAFE E-Mini Index | 35 | 12/2018 | USD | $3,457,125 | $20,679 | |||||||||||
|
| |||||||||||||||
| $20,679 | ||||||||||||||||
|
| |||||||||||||||
USD - United States Dollar
Collateral pledged to, or (received from), each counterparty at September 30, 2018 was as follows:
| COUNTERPARTY | OVER THE COUNTER | EXCHANGE TRADED | TOTAL | |||||||||
| JPMS | ||||||||||||
| Cash | $— | $121,749 | $121,749 | |||||||||
| ||||||||||||
| The accompanying notes are an integral part of these financial statements. |
| AQR Funds | Annual Report | September 2018 | ||||||||||||||
146
Table of Contents
| Schedule of Investments | September 30, 2018 |
| AQR LARGE CAP DEFENSIVE STYLE FUND |
| INVESTMENTS | SHARES | VALUE | ||||||
| COMMON STOCKS - 96.2% | ||||||||
| Aerospace & Defense - 3.9% | ||||||||
| Boeing Co. (The) | 51,963 | $ | 19,325,040 | |||||
| Curtiss-Wright Corp. | 24,126 | 3,315,395 | ||||||
| General Dynamics Corp. | 35,818 | 7,332,661 | ||||||
| Harris Corp. | 7,261 | 1,228,634 | ||||||
| Huntington Ingalls Industries, Inc. | 1,805 | 462,224 | ||||||
| Lockheed Martin Corp. | 23,009 | 7,960,194 | ||||||
| Northrop Grumman Corp. | 28,065 | 8,906,989 | ||||||
| Raytheon Co. | 128,558 | 26,567,796 | ||||||
| Teledyne Technologies, Inc. * | 11,285 | 2,783,784 | ||||||
| United Technologies Corp. | 30,524 | 4,267,560 | ||||||
|
| |||||||
| 82,150,277 | ||||||||
|
| |||||||
| Air Freight & Logistics - 0.5% | ||||||||
| CH Robinson Worldwide, Inc. | 25,824 | 2,528,686 | ||||||
| Expeditors International of Washington, Inc. | 71,959 | 5,291,145 | ||||||
| FedEx Corp. | 4,513 | 1,086,685 | ||||||
| United Parcel Service, Inc., Class B | 6,285 | 733,774 | ||||||
|
| |||||||
| 9,640,290 | ||||||||
|
| |||||||
| Airlines - 0.2% | ||||||||
| Southwest Airlines Co. | 81,070 | 5,062,822 | ||||||
|
| |||||||
| Banks - 4.4% | ||||||||
| Bank of Hawaii Corp. | 19,357 | 1,527,461 | ||||||
| BB&T Corp. | 52,967 | 2,571,018 | ||||||
| BOK Financial Corp. (a) | 3,011 | 292,910 | ||||||
| Commerce Bancshares, Inc. | 34,850 | 2,300,797 | ||||||
| East West Bancorp, Inc. | 71,950 | 4,343,621 | ||||||
| JPMorgan Chase & Co. | 131,344 | 14,820,857 | ||||||
| M&T Bank Corp. | 49,427 | 8,132,719 | ||||||
| PacWest Bancorp | 10,904 | 519,576 | ||||||
| PNC Financial Services Group, Inc. (The) | 82,260 | 11,202,989 | ||||||
| SunTrust Banks, Inc. | 110,383 | 7,372,481 | ||||||
| SVB Financial Group * | 23,108 | 7,182,660 | ||||||
| TCF Financial Corp. | 103,623 | 2,467,264 | ||||||
| US Bancorp | 359,215 | 18,970,144 | ||||||
| Wells Fargo & Co. | 239,599 | 12,593,323 | ||||||
|
| |||||||
| 94,297,820 | ||||||||
|
| |||||||
| Beverages - 3.0% | ||||||||
| Brown-Forman Corp., Class B | 58,785 | 2,971,582 | ||||||
| Coca-Cola Co. (The) | 473,086 | 21,851,842 | ||||||
| Constellation Brands, Inc., Class A | 46,232 | 9,968,544 | ||||||
| Monster Beverage Corp. * | 76,753 | 4,473,165 | ||||||
| PepsiCo, Inc. | 221,604 | 24,775,327 | ||||||
|
| |||||||
| 64,040,460 | ||||||||
|
| |||||||
| Biotechnology - 1.0% | ||||||||
| AbbVie, Inc. | 9,784 | 925,371 | ||||||
| Amgen, Inc. | 26,031 | 5,395,966 | ||||||
| Biogen, Inc. * | 25,508 | 9,012,231 | ||||||
| Gilead Sciences, Inc. | 38,032 | 2,936,451 | ||||||
| Vertex Pharmaceuticals, Inc. * | 11,076 | 2,134,788 | ||||||
|
| |||||||
| 20,404,807 | ||||||||
|
| |||||||
| Capital Markets - 2.7% | ||||||||
| BlackRock, Inc. | 14,181 | 6,683,931 | ||||||
| INVESTMENTS | SHARES | VALUE | ||||||
| Capital Markets - 2.7% (continued) | ||||||||
| Cboe Global Markets, Inc. | 31,091 | $ | 2,983,492 | |||||
| CME Group, Inc. | 102,933 | 17,520,226 | ||||||
| FactSet Research Systems, Inc. | 7,520 | 1,682,299 | ||||||
| Intercontinental Exchange, Inc. | 104,317 | 7,812,300 | ||||||
| MarketAxess Holdings, Inc. | 9,268 | 1,654,245 | ||||||
| MSCI, Inc. | 2,198 | 389,947 | ||||||
| S&P Global, Inc. | 31,179 | 6,092,065 | ||||||
| SEI Investments Co. | 11,120 | 679,432 | ||||||
| T. Rowe Price Group, Inc. | 108,842 | 11,883,370 | ||||||
|
| |||||||
| 57,381,307 | ||||||||
|
| |||||||
| Chemicals - 2.8% | ||||||||
| Air Products & Chemicals, Inc. | 50,037 | 8,358,681 | ||||||
| Ecolab, Inc. | 80,722 | 12,655,595 | ||||||
| Huntsman Corp. | 14,376 | 391,458 | ||||||
| LyondellBasell Industries NV, Class A | 58,306 | 5,976,948 | ||||||
| PPG Industries, Inc. | 26,741 | 2,918,245 | ||||||
| Praxair, Inc. | 127,998 | 20,573,119 | ||||||
| Sherwin-Williams Co. (The) | 19,428 | 8,843,820 | ||||||
|
| |||||||
| 59,717,866 | ||||||||
|
| |||||||
| Commercial Services & Supplies - 2.0% | ||||||||
| Cintas Corp. | 50,045 | 9,899,401 | ||||||
| Copart, Inc. * | 66,509 | 3,427,209 | ||||||
| Republic Services, Inc. | 140,313 | 10,195,143 | ||||||
| Rollins, Inc. | 44,829 | 2,720,672 | ||||||
| Waste Management, Inc. | 182,746 | 16,512,928 | ||||||
|
| |||||||
| 42,755,353 | ||||||||
|
| |||||||
| Communications Equipment - 1.3% | ||||||||
| Arista Networks, Inc. * | 17,410 | 4,628,623 | ||||||
| Cisco Systems, Inc. | 190,943 | 9,289,377 | ||||||
| F5 Networks, Inc. * | 54,899 | 10,947,958 | ||||||
| Palo Alto Networks, Inc. * | 7,688 | 1,731,799 | ||||||
| Ubiquiti Networks, Inc. (a) | 5,328 | 526,726 | ||||||
|
| |||||||
| 27,124,483 | ||||||||
|
| |||||||
| Consumer Finance - 0.6% | ||||||||
| American Express Co. | 45,711 | 4,867,764 | ||||||
| Credit Acceptance Corp. * | 6,069 | 2,658,647 | ||||||
| Discover Financial Services | 69,059 | 5,279,561 | ||||||
|
| |||||||
| 12,805,972 | ||||||||
|
| |||||||
| Containers & Packaging - 0.1% | ||||||||
| Avery Dennison Corp. | 15,124 | 1,638,685 | ||||||
|
| |||||||
| Distributors - 0.1% | ||||||||
| Pool Corp. | 10,717 | 1,788,453 | ||||||
|
| |||||||
| Diversified Consumer Services - 0.1% | ||||||||
| Bright Horizons Family Solutions, Inc. * | 15,059 | 1,774,552 | ||||||
| Grand Canyon Education, Inc. * | 7,757 | 874,990 | ||||||
|
| |||||||
| 2,649,542 | ||||||||
|
| |||||||
| Diversified Telecommunication Services - 0.4% | ||||||||
| Verizon Communications, Inc. | 179,905 | 9,605,128 | ||||||
|
| |||||||
| Electric Utilities - 5.5% | ||||||||
| Alliant Energy Corp. | 42,277 | 1,799,732 | ||||||
| American Electric Power Co., Inc. | 190,164 | 13,478,824 | ||||||
| The accompanying notes are an integral part of these financial statements. | (Continued) |
| AQR Funds | Annual Report | September 2018 | ||||||||||||||
147
Table of Contents
| Schedule of Investments | September 30, 2018 |
| AQR LARGE CAP DEFENSIVE STYLE FUND |
| INVESTMENTS | SHARES | VALUE | ||||||
| Electric Utilities - 5.5% (continued) | ||||||||
| Avangrid, Inc. | 40,399 | $ | 1,936,324 | |||||
| Duke Energy Corp. | 189,541 | 15,167,071 | ||||||
| Evergy, Inc. | 79,393 | 4,360,264 | ||||||
| Eversource Energy | 81,462 | 5,005,025 | ||||||
| Exelon Corp. | 151,388 | 6,609,600 | ||||||
| NextEra Energy, Inc. | 183,018 | 30,673,817 | ||||||
| OGE Energy Corp. | 157,972 | 5,737,543 | ||||||
| Pinnacle West Capital Corp. | 94,042 | 7,446,246 | ||||||
| Southern Co. (The) | 207,304 | 9,038,454 | ||||||
| Xcel Energy, Inc. | 341,149 | 16,105,644 | ||||||
|
| |||||||
| 117,358,544 | ||||||||
|
| |||||||
| Electrical Equipment - 0.9% | ||||||||
| Emerson Electric Co. | 116,682 | 8,935,508 | ||||||
| Rockwell Automation, Inc. | 59,943 | 11,240,511 | ||||||
|
| |||||||
| 20,176,019 | ||||||||
|
| |||||||
| Electronic Equipment, Instruments & Components - 0.5% | ||||||||
| Amphenol Corp., Class A | 19,003 | 1,786,662 | ||||||
| Dolby Laboratories, Inc., Class A | 26,488 | 1,853,365 | ||||||
| FLIR Systems, Inc. | 83,532 | 5,134,712 | ||||||
| IPG Photonics Corp. * | 1,817 | 283,579 | ||||||
| National Instruments Corp. | 45,993 | 2,222,842 | ||||||
|
| |||||||
| 11,281,160 | ||||||||
|
| |||||||
| Entertainment - 0.9% | ||||||||
| Activision Blizzard, Inc. | 29,124 | 2,422,826 | ||||||
| Walt Disney Co. (The) | 138,530 | 16,199,698 | ||||||
|
| |||||||
| 18,622,524 | ||||||||
|
| |||||||
| Food & Staples Retailing - 2.4% | ||||||||
| Costco Wholesale Corp. | 83,174 | 19,535,909 | ||||||
| Sysco Corp. | 164,548 | 12,053,141 | ||||||
| Walmart, Inc. | 213,542 | 20,053,729 | ||||||
|
| |||||||
| 51,642,779 | ||||||||
|
| |||||||
| Food Products - 2.2% | ||||||||
| Flowers Foods, Inc. | 103,542 | 1,932,094 | ||||||
| Hershey Co. (The) | 75,199 | 7,670,298 | ||||||
| Hormel Foods Corp. (a) | 277,828 | 10,946,423 | ||||||
| Ingredion, Inc. | 58,046 | 6,092,508 | ||||||
| Kellogg Co. | 13,287 | 930,356 | ||||||
| Lamb Weston Holdings, Inc. | 97,662 | 6,504,289 | ||||||
| McCormick & Co., Inc. (Non-Voting) | 67,964 | 8,954,257 | ||||||
| Mondelez International, Inc., Class A | 102,020 | 4,382,779 | ||||||
|
| |||||||
| 47,413,004 | ||||||||
|
| |||||||
| Gas Utilities - 0.4% | ||||||||
| Atmos Energy Corp. | 38,449 | 3,610,746 | ||||||
| UGI Corp. | 79,711 | 4,422,366 | ||||||
|
| |||||||
| 8,033,112 | ||||||||
|
| |||||||
| Health Care Equipment & Supplies - 5.6% | ||||||||
| Abbott Laboratories | 163,950 | 12,027,372 | ||||||
| ABIOMED, Inc. * | 23,266 | 10,463,883 | ||||||
| Align Technology, Inc. * | 30,999 | 12,127,429 | ||||||
| Baxter International, Inc. | 12,700 | 979,043 | ||||||
| Becton Dickinson and Co. | 13,089 | 3,416,229 | ||||||
| Danaher Corp. | 114,535 | 12,445,373 | ||||||
| DexCom, Inc. * | 6,101 | 872,687 | ||||||
| INVESTMENTS | SHARES | VALUE | ||||||
| Health Care Equipment & Supplies - 5.6% (continued) | ||||||||
| Edwards Lifesciences Corp. * | 57,776 | $ | 10,058,802 | |||||
| ICU Medical, Inc. * | 18,833 | 5,325,031 | ||||||
| IDEXX Laboratories, Inc. * | 16,231 | 4,052,231 | ||||||
| Intuitive Surgical, Inc. * | 27,870 | 15,997,380 | ||||||
| Medtronic plc | 64,564 | 6,351,161 | ||||||
| ResMed, Inc. | 72,594 | 8,372,992 | ||||||
| Stryker Corp. | 46,469 | 8,256,612 | ||||||
| Varian Medical Systems, Inc. * | 46,830 | 5,241,682 | ||||||
| West Pharmaceutical Services, Inc. | 17,404 | 2,148,872 | ||||||
|
| |||||||
| 118,136,779 | ||||||||
|
| |||||||
| Health Care Providers & Services - 3.7% | ||||||||
| Anthem, Inc. | 41,375 | 11,338,819 | ||||||
| Chemed Corp. | 13,075 | 4,178,508 | ||||||
| Cigna Corp. | 60,409 | 12,580,174 | ||||||
| Humana, Inc. | 44,723 | 15,139,630 | ||||||
| UnitedHealth Group, Inc. | 115,183 | 30,643,285 | ||||||
| WellCare Health Plans, Inc. * | 16,146 | 5,174,632 | ||||||
|
| |||||||
| 79,055,048 | ||||||||
|
| |||||||
| Hotels, Restaurants & Leisure - 2.0% | ||||||||
| Darden Restaurants, Inc. | 49,546 | 5,509,020 | ||||||
| Domino’s Pizza, Inc. | 7,900 | 2,328,920 | ||||||
| Las Vegas Sands Corp. | 157,657 | 9,353,790 | ||||||
| McDonald’s Corp. | 93,761 | 15,685,278 | ||||||
| Starbucks Corp. | 56,746 | 3,225,443 | ||||||
| Yum! Brands, Inc. | 74,360 | 6,760,067 | ||||||
|
| |||||||
| 42,862,518 | ||||||||
|
| |||||||
| Household Durables - 0.3% | ||||||||
| Garmin Ltd. | 77,665 | 5,440,433 | ||||||
|
| |||||||
| Household Products - 2.1% | ||||||||
| Church & Dwight Co., Inc. | 57,086 | 3,389,196 | ||||||
| Clorox Co. (The) | 37,109 | 5,581,565 | ||||||
| Colgate-Palmolive Co. | 172,619 | 11,556,842 | ||||||
| Kimberly-Clark Corp. | 18,581 | 2,111,545 | ||||||
| Procter & Gamble Co. (The) | 270,398 | 22,505,225 | ||||||
|
| |||||||
| 45,144,373 | ||||||||
|
| |||||||
| Independent Power and Renewable Electricity Producers - 0.1% | ||||||||
| Vistra Energy Corp. * | 72,552 | 1,805,094 | ||||||
|
| |||||||
| Industrial Conglomerates - 2.0% | ||||||||
| 3M Co. | 101,493 | 21,385,590 | ||||||
| Honeywell International, Inc. | 130,105 | 21,649,472 | ||||||
|
| |||||||
| 43,035,062 | ||||||||
|
| |||||||
| Insurance - 6.5% | ||||||||
| Aflac, Inc. | 37,396 | 1,760,230 | ||||||
| Alleghany Corp. | 3,867 | 2,523,334 | ||||||
| Allstate Corp. (The) | 186,310 | 18,388,797 | ||||||
| American Financial Group, Inc. | 28,418 | 3,153,545 | ||||||
| Aon plc (a) | 87,862 | 13,511,418 | ||||||
| Arch Capital Group Ltd. * | 84,453 | 2,517,544 | ||||||
| Assurant, Inc. | 10,450 | 1,128,077 | ||||||
| Chubb Ltd. | 103,905 | 13,885,864 | ||||||
| Cincinnati Financial Corp. | 3,010 | 231,198 | ||||||
| CNA Financial Corp. | 8,681 | 396,288 | ||||||
| Erie Indemnity Co., Class A | 1,885 | 240,394 | ||||||
| The accompanying notes are an integral part of these financial statements. | (Continued) |
| AQR Funds | Annual Report | September 2018 | ||||||||||||||
148
Table of Contents
| Schedule of Investments | September 30, 2018 |
| AQR LARGE CAP DEFENSIVE STYLE FUND |
| INVESTMENTS | SHARES | VALUE | ||||||
| Insurance - 6.5% (continued) | ||||||||
| Everest Re Group Ltd. | 25,315 | $ | 5,783,718 | |||||
| Fidelity National Financial, Inc. | 112,373 | 4,421,878 | ||||||
| First American Financial Corp. | 54,392 | 2,806,083 | ||||||
| Hanover Insurance Group, Inc. (The) | 17,586 | 2,169,585 | ||||||
| Markel Corp. * | 2,686 | 3,192,284 | ||||||
| Marsh & McLennan Cos., Inc. | 194,579 | 16,095,575 | ||||||
| Old Republic International Corp. | 25,086 | 561,425 | ||||||
| Progressive Corp. (The) | 298,111 | 21,177,805 | ||||||
| RenaissanceRe Holdings Ltd. | 12,642 | 1,688,718 | ||||||
| Travelers Cos., Inc. (The) | 129,421 | 16,787,198 | ||||||
| Willis Towers Watson plc | 21,223 | 2,991,170 | ||||||
| WR Berkley Corp. | 28,441 | 2,273,289 | ||||||
|
| |||||||
| 137,685,417 | ||||||||
|
| |||||||
| Interactive Media & Services - 2.3% | ||||||||
| Alphabet, Inc., Class A * | 25,565 | 30,859,000 | ||||||
| Facebook, Inc., Class A * | 109,742 | 18,048,170 | ||||||
|
| |||||||
| 48,907,170 | ||||||||
|
| |||||||
| Internet & Direct Marketing Retail - 1.6% | ||||||||
| Amazon.com, Inc. * | 10,410 | 20,851,230 | ||||||
| Booking Holdings, Inc. * | 4,372 | 8,674,048 | ||||||
| Netflix, Inc. * | 11,953 | 4,471,976 | ||||||
|
| |||||||
| 33,997,254 | ||||||||
|
| |||||||
| IT Services - 7.8% | ||||||||
| Accenture plc, Class A | 135,790 | 23,111,458 | ||||||
| Akamai Technologies, Inc. * | 58,603 | 4,286,809 | ||||||
| Amdocs Ltd. | 43,899 | 2,896,456 | ||||||
| Automatic Data Processing, Inc. | 82,914 | 12,491,823 | ||||||
| Black Knight, Inc. * | 23,686 | 1,230,488 | ||||||
| Broadridge Financial Solutions, Inc. | 36,384 | 4,800,869 | ||||||
| Cognizant Technology Solutions Corp., Class A | 195,934 | 15,116,308 | ||||||
| EPAM Systems, Inc. * | 19,921 | 2,743,122 | ||||||
| Fiserv, Inc. * | 61,178 | 5,039,844 | ||||||
| Gartner, Inc. * | 8,089 | 1,282,106 | ||||||
| International Business Machines Corp. | 65,974 | 9,975,928 | ||||||
| Jack Henry & Associates, Inc. | 28,136 | 4,504,011 | ||||||
| Mastercard, Inc., Class A | 135,883 | 30,248,915 | ||||||
| Paychex, Inc. | 117,926 | 8,685,250 | ||||||
| PayPal Holdings, Inc. * | 39,050 | 3,430,152 | ||||||
| Square, Inc., Class A* | 29,605 | 2,931,191 | ||||||
| Teradata Corp. * | 19,257 | 726,181 | ||||||
| VeriSign, Inc. * | 47,083 | 7,538,930 | ||||||
| Visa, Inc., Class A (a) | 160,298 | 24,059,127 | ||||||
|
| |||||||
| 165,098,968 | ||||||||
|
| |||||||
| Leisure Products - 0.0% (b) | ||||||||
| Hasbro, Inc. (a) | 9,898 | 1,040,478 | ||||||
|
| |||||||
| Life Sciences Tools & Services - 2.0% | ||||||||
| Agilent Technologies, Inc. | 43,917 | 3,097,905 | ||||||
| Bio-Techne Corp. | 12,142 | 2,478,304 | ||||||
| Illumina, Inc. * | 35,066 | 12,871,326 | ||||||
| Mettler-Toledo International, Inc. * | 13,634 | 8,302,833 | ||||||
| Thermo Fisher Scientific, Inc. | 40,557 | 9,899,153 | ||||||
| Waters Corp. * | 31,783 | 6,187,514 | ||||||
|
| |||||||
| 42,837,035 | ||||||||
|
| |||||||
| INVESTMENTS | SHARES | VALUE | ||||||
| Machinery - 1.2% | ||||||||
| Cummins, Inc. | 9,380 | $ | 1,370,137 | |||||
| Dover Corp. | 41,412 | 3,666,204 | ||||||
| Fortive Corp. | 32,796 | 2,761,423 | ||||||
| IDEX Corp. | 13,226 | 1,992,629 | ||||||
| Illinois Tool Works, Inc. | 79,835 | 11,266,315 | ||||||
| Parker-Hannifin Corp. | 4,392 | 807,821 | ||||||
| Toro Co. (The) | 11,368 | 681,739 | ||||||
| Xylem, Inc. | 25,180 | 2,011,127 | ||||||
|
| |||||||
| 24,557,395 | ||||||||
|
| |||||||
| Media - 0.1% | ||||||||
| Cable One, Inc. | 686 | 606,156 | ||||||
| John Wiley & Sons, Inc., Class A | 9,971 | 604,243 | ||||||
|
| |||||||
| 1,210,399 | ||||||||
|
| |||||||
| Metals & Mining - 0.0% (b) | ||||||||
| Royal Gold, Inc. | 4,901 | 377,671 | ||||||
|
| |||||||
| Multiline Retail - 0.1% | ||||||||
| Target Corp. | 20,336 | 1,793,839 | ||||||
|
| |||||||
| Multi-Utilities - 3.6% | ||||||||
| Ameren Corp. | 155,221 | 9,813,072 | ||||||
| CenterPoint Energy, Inc. | 24,123 | 667,001 | ||||||
| CMS Energy Corp. | 249,524 | 12,226,676 | ||||||
| Consolidated Edison, Inc. | 176,940 | 13,481,058 | ||||||
| Dominion Energy, Inc. | 56,413 | 3,964,706 | ||||||
| DTE Energy Co. | 66,062 | 7,209,346 | ||||||
| NiSource, Inc. | 8,190 | 204,095 | ||||||
| Public Service Enterprise Group, Inc. | 232,509 | 12,274,150 | ||||||
| Sempra Energy | 27,191 | 3,092,976 | ||||||
| WEC Energy Group, Inc. | 195,154 | 13,028,481 | ||||||
|
| |||||||
| 75,961,561 | ||||||||
|
| |||||||
| Oil, Gas & Consumable Fuels - 1.1% | ||||||||
| Chevron Corp. | 5,893 | 720,596 | ||||||
| ConocoPhillips | 50,013 | 3,871,006 | ||||||
| EOG Resources, Inc. | 16,644 | 2,123,275 | ||||||
| Exxon Mobil Corp. | 86,161 | 7,325,408 | ||||||
| HollyFrontier Corp. | 19,446 | 1,359,276 | ||||||
| Marathon Oil Corp. | 165,587 | 3,854,865 | ||||||
| Valero Energy Corp. | 27,797 | 3,161,909 | ||||||
|
| |||||||
| 22,416,335 | ||||||||
|
| |||||||
| Personal Products - 0.6% | ||||||||
| Estee Lauder Cos., Inc. (The), Class A | 68,244 | 9,917,218 | ||||||
| Nu Skin Enterprises, Inc., Class A | 25,042 | 2,063,962 | ||||||
|
| |||||||
| 11,981,180 | ||||||||
|
| |||||||
| Pharmaceuticals - 3.9% | ||||||||
| Bristol-Myers Squibb Co. | 82,947 | 5,149,350 | ||||||
| Eli Lilly & Co. | 127,291 | 13,659,597 | ||||||
| Johnson & Johnson | 218,799 | 30,231,458 | ||||||
| Merck & Co., Inc. | 159,893 | 11,342,810 | ||||||
| Pfizer, Inc. | 276,561 | 12,188,043 | ||||||
| Zoetis, Inc. | 115,357 | 10,562,087 | ||||||
|
| |||||||
| 83,133,345 | ||||||||
|
| |||||||
| Professional Services - 0.6% | ||||||||
| CoStar Group, Inc. * | 8,308 | 3,496,339 | ||||||
| The accompanying notes are an integral part of these financial statements. | (Continued) |
| AQR Funds | Annual Report | September 2018 | ||||||||||||||
149
Table of Contents
| Schedule of Investments | September 30, 2018 |
| AQR LARGE CAP DEFENSIVE STYLE FUND |
| INVESTMENTS | SHARES | VALUE | ||||||
| Professional Services - 0.6% (continued) | ||||||||
| Equifax, Inc. | 3,815 | $ | 498,124 | |||||
| Robert Half International, Inc. | 90,368 | 6,360,100 | ||||||
| Verisk Analytics, Inc. * | 15,675 | 1,889,621 | ||||||
|
| |||||||
| 12,244,184 | ||||||||
|
| |||||||
| Road & Rail - 0.7% | ||||||||
| Landstar System, Inc. | 33,243 | 4,055,646 | ||||||
| Old Dominion Freight Line, Inc. | 35,782 | 5,770,205 | ||||||
| Union Pacific Corp. | 36,731 | 5,980,909 | ||||||
|
| |||||||
| 15,806,760 | ||||||||
|
| |||||||
| Semiconductors & Semiconductor Equipment - 3.0% | ||||||||
| Analog Devices, Inc. | 54,893 | 5,075,407 | ||||||
| Intel Corp. | 203,534 | 9,625,123 | ||||||
| KLA-Tencor Corp. | 8,121 | 825,987 | ||||||
| Maxim Integrated Products, Inc. | 89,173 | 5,028,465 | ||||||
| NVIDIA Corp. | 37,663 | 10,584,056 | ||||||
| Skyworks Solutions, Inc. | 54,158 | 4,912,672 | ||||||
| Texas Instruments, Inc. | 210,894 | 22,626,817 | ||||||
| Xilinx, Inc. | 51,009 | 4,089,392 | ||||||
|
| |||||||
| 62,767,919 | ||||||||
|
| |||||||
| Software - 3.8% | ||||||||
| Adobe Systems, Inc. * | 60,495 | 16,330,625 | ||||||
| ANSYS, Inc. * | 12,963 | 2,419,933 | ||||||
| Aspen Technology, Inc. * | 28,340 | 3,228,209 | ||||||
| Cadence Design Systems, Inc. * | 29,426 | 1,333,586 | ||||||
| Citrix Systems, Inc. * | 2,892 | 321,475 | ||||||
| Fortinet, Inc. * | 56,770 | 5,238,168 | ||||||
| Intuit, Inc. | 64,463 | 14,658,886 | ||||||
| Manhattan Associates, Inc. * | 25,696 | 1,403,002 | ||||||
| Microsoft Corp. | 240,881 | 27,549,560 | ||||||
| Oracle Corp. | 61,492 | 3,170,527 | ||||||
| Red Hat, Inc. * | 21,489 | 2,928,521 | ||||||
| salesforce.com, Inc. * | 4,538 | 721,678 | ||||||
| Synopsys, Inc. * | 2,890 | 284,983 | ||||||
| VMware, Inc., Class A * | 2,209 | 344,737 | ||||||
|
| |||||||
| 79,933,890 | ||||||||
|
| |||||||
| Specialty Retail - 2.3% | ||||||||
| AutoZone, Inc. * | 510 | 395,607 | ||||||
| Best Buy Co., Inc. | 129,367 | 10,266,565 | ||||||
| Home Depot, Inc. (The) | 81,193 | 16,819,130 | ||||||
| Lowe’s Cos., Inc. | 40,548 | 4,655,721 | ||||||
| O’Reilly Automotive, Inc. * | 918 | 318,840 | ||||||
| Ross Stores, Inc. | 56,089 | 5,558,420 | ||||||
| TJX Cos., Inc. (The) | 76,418 | 8,560,344 | ||||||
| Ulta Beauty, Inc. * | 4,533 | 1,278,850 | ||||||
| Williams-Sonoma, Inc. (a) | 13,580 | 892,478 | ||||||
|
| |||||||
| 48,745,955 | ||||||||
|
| |||||||
| Technology Hardware, Storage & Peripherals - 0.5% | ||||||||
| Apple, Inc. | 46,736 | 10,550,185 | ||||||
|
| |||||||
| Textiles, Apparel & Luxury Goods - 1.7% | ||||||||
| Lululemon Athletica, Inc. * | 77,869 | 12,652,934 | ||||||
| Michael Kors Holdings Ltd. * | 9,724 | 666,677 | ||||||
| NIKE, Inc., Class B | 208,816 | 17,690,892 | ||||||
| VF Corp. | 45,432 | 4,245,620 | ||||||
|
| |||||||
| 35,256,123 | ||||||||
|
| |||||||
| INVESTMENTS | SHARES | VALUE | ||||||
| Thrifts & Mortgage Finance - 0.0% (b) | ||||||||
| TFS Financial Corp. | 14,500 | $ | 217,645 | |||||
|
| |||||||
| Tobacco - 0.4% | ||||||||
| Altria Group, Inc. | 138,145 | 8,331,525 | ||||||
|
| |||||||
| Trading Companies & Distributors - 0.3% | ||||||||
| Fastenal Co. | 32,122 | 1,863,718 | ||||||
| WW Grainger, Inc. | 10,238 | 3,659,164 | ||||||
|
| |||||||
| 5,522,882 | ||||||||
|
| |||||||
| Water Utilities - 0.4% | ||||||||
| American Water Works Co., Inc. | 75,272 | 6,621,678 | ||||||
| Aqua America, Inc. | 52,345 | 1,931,530 | ||||||
|
| |||||||
| 8,553,208 | ||||||||
|
| |||||||
TOTAL COMMON STOCKS | 2,039,998,037 | |||||||
|
| |||||||
| SHORT-TERM INVESTMENTS - 3.6% | ||||||||
| Investment Companies - 3.6% | ||||||||
| Limited Purpose Cash Investment Fund, 2.06%(c) | ||||||||
(Cost $75,576,962) | 75,593,895 | 75,586,336 | ||||||
|
| |||||||
| SECURITIES LENDING COLLATERAL - 0.3% | ||||||||
| Investment Companies - 0.3% | ||||||||
| Investments in a Pooled Account through Securities Lending Program with Citibank NA | ||||||||
| BlackRock Liquidity Funds T-Fund Portfolio, Institutional Shares 1.97% (c)(d) | 799,721 | 799,721 | ||||||
| Limited Purpose Cash Investment Fund 2.06% (c)(d) | 5,738,479 | 5,737,906 | ||||||
|
| |||||||
TOTAL SECURITIES LENDING |
| 6,537,627 | ||||||
|
| |||||||
TOTAL INVESTMENTS IN SECURITIES |
| 2,122,122,000 | ||||||
|
| |||||||
| LIABILITIES IN EXCESS OF OTHER ASSETS - (0.1)% (e) | (1,206,645) | |||||||
|
| |||||||
NET ASSETS - 100.0% | $ | 2,120,915,355 | ||||||
|
| |||||||
| The accompanying notes are an integral part of these financial statements. | (Continued) |
| AQR Funds | Annual Report | September 2018 | ||||||||||||||
150
Table of Contents
| Schedule of Investments | September 30, 2018 |
| AQR LARGE CAP DEFENSIVE STYLE FUND |
| SECTOR | VALUE | % OF NET ASSETS | ||||||
| Communication Services | $ | 78,345,220 | 3.7 | % | ||||
| Consumer Discretionary | 173,574,594 | 8.2 | ||||||
| Consumer Staples | 228,553,321 | 10.8 | ||||||
| Energy | 22,416,335 | 1.0 | ||||||
| Financials | 302,388,161 | 14.3 | ||||||
| Health Care | 343,567,014 | 16.2 | ||||||
| Industrials | 260,951,044 | 12.3 | ||||||
| Information Technology | 356,756,606 | 16.8 | ||||||
| Materials | 61,734,223 | 2.9 | ||||||
| Utilities | 211,711,519 | 10.0 | ||||||
| Short-Term Investments | 75,586,336 | 3.6 | ||||||
| Securities Lending Collateral | 6,537,627 | 0.3 | ||||||
|
|
|
| |||||
Total Investments In Securities | 2,122,122,000 | 100.1 | ||||||
| Liabilities in Excess of Other Assets (e) | (1,206,645 | ) | (0.1 | ) | ||||
|
|
|
| |||||
Net Assets | $ | 2,120,915,355 | 100.0 | % | ||||
|
|
|
| |||||
| * | Non-income producing security. |
| (a) | The security or a portion of this security is on loan at September 30, 2018. The total value of securities on loan at September 30, 2018 was $22,109,794. |
| (b) | Represents less than 0.05% of net assets. |
| (c) | Represents 7-day effective yield as of September 30, 2018. |
| (d) | Represents security, or portion thereof, purchased with the cash collateral received for securities on loan; additional non-cash collateral of $16,043,343 was received (See Note 3). |
| (e) | Includes appreciation/(depreciation) on futures contracts. |
All securities are Level 1 with respect to ASC 820 (See Note 4).
Futures contracts outstanding as of September 30, 2018:
Exchange Traded
| DESCRIPTION | NUMBER OF CONTRACTS | EXPIRATION DATE | TRADING CURRENCY | NOTIONAL AMOUNT | VALUE AND UNREALIZED APPRECIATION (DEPRECIATION) | |||||||||||
| Long Contracts | ||||||||||||||||
| S&P 500 E-Mini Index | 391 | 12/2018 | USD | $57,066,450 | $45,563 | |||||||||||
|
| |||||||||||||||
| $45,563 | ||||||||||||||||
|
| |||||||||||||||
USD - United States Dollar
Collateral pledged to, or (received from), each counterparty at September 30, 2018 was as follows:
| COUNTERPARTY | OVER THE COUNTER | EXCHANGE TRADED | TOTAL | |||||||||
| GSCO | ||||||||||||
| Cash | $— | $1,851,822 | $1,851,822 | |||||||||
| ||||||||||||
| The accompanying notes are an integral part of these financial statements. |
| AQR Funds | Annual Report | September 2018 | ||||||||||||||
151
Table of Contents
| Schedule of Investments | September 30, 2018 |
| AQR INTERNATIONAL DEFENSIVE STYLE FUND |
| INVESTMENTS | SHARES | VALUE | ||||||
| COMMON STOCKS - 95.2% | ||||||||
| Australia - 7.8% | ||||||||
| AGL Energy Ltd. | 90,641 | $ | 1,278,614 | |||||
| Aristocrat Leisure Ltd. | 3,419 | 70,216 | ||||||
| Aurizon Holdings Ltd. | 31,404 | 93,237 | ||||||
| AusNet Services | 94,515 | 111,019 | ||||||
| Australia & New Zealand Banking Group Ltd. | 34,236 | 696,931 | ||||||
| BHP Billiton plc | 11,661 | 254,462 | ||||||
| BlueScope Steel Ltd. | 23,605 | 289,509 | ||||||
| Caltex Australia Ltd. | 71,903 | 1,553,380 | ||||||
| CIMIC Group Ltd. | 3,710 | 137,697 | ||||||
| Coca-Cola Amatil Ltd. | 63,441 | 447,225 | ||||||
| Cochlear Ltd. | 6,566 | 952,044 | ||||||
| Commonwealth Bank of Australia | 8,215 | 424,006 | ||||||
| Crown Resorts Ltd. | 19,855 | 196,360 | ||||||
| CSL Ltd. | 3,379 | 490,967 | ||||||
| Flight Centre Travel Group Ltd. | 30,107 | 1,156,163 | ||||||
| Fortescue Metals Group Ltd. | 243,743 | 690,702 | ||||||
| Insurance Australia Group Ltd. | 13,408 | 70,884 | ||||||
| Newcrest Mining Ltd. | 51,007 | 716,255 | ||||||
| REA Group Ltd. | 4,942 | 306,614 | ||||||
| Rio Tinto plc | 2,342 | 118,134 | ||||||
| South32 Ltd. | 420,047 | 1,180,460 | ||||||
| Telstra Corp. Ltd. | 469,285 | 1,081,183 | ||||||
| Wesfarmers Ltd. | 47,947 | 1,726,534 | ||||||
| Westpac Banking Corp. | 18,552 | 373,093 | ||||||
| Woolworths Group Ltd. | 86,966 | 1,763,828 | ||||||
|
| |||||||
| 16,179,517 | ||||||||
|
| |||||||
| Austria - 0.1% | ||||||||
| OMV AG | 4,356 | 244,367 | ||||||
|
| |||||||
| Belgium - 1.2% | ||||||||
| Ageas | 4,538 | 243,957 | ||||||
| Anheuser-Busch InBev SA/NV | 834 | 73,005 | ||||||
| Colruyt SA | 23,928 | 1,354,140 | ||||||
| Groupe Bruxelles Lambert SA | 618 | 64,781 | ||||||
| KBC Group NV | 525 | 39,038 | ||||||
| Proximus SADP | 18,794 | 448,952 | ||||||
| Solvay SA | 616 | 82,577 | ||||||
| UCB SA | 1,007 | 90,493 | ||||||
|
| |||||||
| 2,396,943 | ||||||||
|
| |||||||
| Canada - 11.4% | ||||||||
| Agnico Eagle Mines Ltd. (1) | 11,684 | 399,100 | ||||||
| Alimentation Couche-Tard, Inc., Class B (1) | 1,149 | 57,474 | ||||||
| Atco Ltd., Class I (1) | 1,360 | 39,748 | ||||||
| Bank of Montreal (1) | 11,490 | 947,737 | ||||||
| Bank of Nova Scotia (The) (1) | 17,764 | 1,058,840 | ||||||
| Barrick Gold Corp. (1) | 36,900 | 408,238 | ||||||
| BCE, Inc. (1) | 51,234 | 2,075,699 | ||||||
| Canadian Imperial Bank of Commerce (1) | 10,966 | 1,027,535 | ||||||
| Canadian National Railway Co. (1) | 13,103 | 1,175,735 | ||||||
| Canadian Tire Corp. Ltd., Class A (1) | 1,447 | 169,542 | ||||||
| Canadian Utilities Ltd., Class A (1) | 7,678 | 188,792 | ||||||
| CI Financial Corp. (1) | 46,030 | 730,906 | ||||||
| Constellation Software, Inc. (1) | 221 | 162,522 | ||||||
| Emera, Inc. (1)(a) | 2,988 | 92,903 | ||||||
| Empire Co. Ltd., Class A (1) | 33,594 | 612,242 | ||||||
| INVESTMENTS | SHARES | VALUE | ||||||
| Canada - 11.4% (continued) | ||||||||
| Fortis, Inc. (1) | 11,469 | $ | 371,867 | |||||
| Franco-Nevada Corp. (1) | 9,986 | 624,681 | ||||||
| George Weston Ltd. (1) | 2,270 | 171,825 | ||||||
| Goldcorp, Inc. (1) | 31,892 | 324,932 | ||||||
| Hydro One Ltd. (1)(b) | 70,539 | 1,072,571 | ||||||
| Imperial Oil Ltd. (1)(a) | 19,218 | 621,927 | ||||||
| Intact Financial Corp. (1) | 13,650 | 1,134,990 | ||||||
| Kinross Gold Corp. (1)* | 147,606 | 402,255 | ||||||
| Loblaw Cos. Ltd. (1) | 11,624 | 597,196 | ||||||
| Manulife Financial Corp. (1) | 27,430 | 490,349 | ||||||
| Methanex Corp. (1) | 3,238 | 255,601 | ||||||
| Metro, Inc. (1) | 3,452 | 107,383 | ||||||
| Power Financial Corp. (1) | 43,665 | 1,000,308 | ||||||
| Rogers Communications, Inc., Class B (1) | 13,888 | 714,265 | ||||||
| Royal Bank of Canada (1) | 17,262 | 1,383,740 | ||||||
| Saputo, Inc. (1) | 28,577 | 850,020 | ||||||
| Seven Generations Energy Ltd., Class A (1)* | 5,109 | 60,913 | ||||||
| Shaw Communications, Inc., Class B (1) | 20,800 | 405,323 | ||||||
| Sun Life Financial, Inc. (1) | 9,175 | 364,755 | ||||||
| Suncor Energy, Inc. (1) | 14,742 | 570,437 | ||||||
| Teck Resources Ltd., Class B (1) | 13,731 | 330,930 | ||||||
| Thomson Reuters Corp. (1) | 2,445 | 111,569 | ||||||
| Toronto-Dominion Bank (The) (1) | 24,133 | 1,466,496 | ||||||
| Tourmaline Oil Corp. (1) | 8,182 | 144,047 | ||||||
| Wheaton Precious Metals Corp. (1) | 50,723 | 887,500 | ||||||
|
| |||||||
| 23,612,893 | ||||||||
|
| |||||||
| Chile - 0.1% | ||||||||
| Antofagasta plc | 10,954 | 121,725 | ||||||
| Lundin Mining Corp. (1) | 19,050 | 100,880 | ||||||
|
| |||||||
| 222,605 | ||||||||
|
| |||||||
| China - 0.2% | ||||||||
| BOC Hong Kong Holdings Ltd. | 70,500 | 334,615 | ||||||
|
| |||||||
| Denmark - 2.8% | ||||||||
| Coloplast A/S, Class B | 12,676 | 1,294,922 | ||||||
| Danske Bank A/S | 3,404 | 89,227 | ||||||
| DSV A/S | 12,130 | 1,102,260 | ||||||
| H Lundbeck A/S | 7,242 | 447,037 | ||||||
| Novo Nordisk A/S, Class B | 29,678 | 1,396,798 | ||||||
| Novozymes A/S, Class B | 11,837 | 649,242 | ||||||
| Orsted A/S (b) | 11,227 | 762,908 | ||||||
|
| |||||||
| 5,742,394 | ||||||||
|
| |||||||
| Finland - 1.7% | ||||||||
| Elisa OYJ | 6,108 | 258,945 | ||||||
| Fortum OYJ | 3,366 | 84,357 | ||||||
| Kone OYJ, Class B | 20,352 | 1,086,364 | ||||||
| Neste OYJ | 16,343 | 1,347,078 | ||||||
| Nokian Renkaat OYJ | 1,153 | 47,194 | ||||||
| Orion OYJ, Class B | 3,800 | 143,820 | ||||||
| Sampo OYJ, Class A | 11,313 | 585,437 | ||||||
|
| |||||||
| 3,553,195 | ||||||||
|
| |||||||
| France - 6.7% | ||||||||
| Aeroports de Paris | 2,096 | 471,917 | ||||||
| Air Liquide SA | 2,476 | 325,154 | ||||||
| The accompanying notes are an integral part of these financial statements. | (Continued) |
| AQR Funds | Annual Report | September 2018 | ||||||||||||||
152
Table of Contents
| Schedule of Investments | September 30, 2018 |
| AQR INTERNATIONAL DEFENSIVE STYLE FUND |
| INVESTMENTS | SHARES | VALUE | ||||||
| France - 6.7% (continued) | ||||||||
| AXA SA | 8,895 | $ | 238,348 | |||||
| BNP Paribas SA | 4,427 | 271,094 | ||||||
| Bouygues SA | 12,582 | 544,303 | ||||||
| Cie Generale des Etablissements Michelin SCA | 2,529 | 301,851 | ||||||
| Danone SA | 7,784 | 604,935 | ||||||
| Dassault Systemes SE | 8,273 | 1,237,950 | ||||||
| Electricite de France SA | 1,824 | 32,078 | ||||||
| Engie SA | 69,716 | 1,026,376 | ||||||
| Essilor International Cie Generale d’Optique SA | 289 | 42,778 | ||||||
| Hermes International | 2,019 | 1,337,636 | ||||||
| Imerys SA | 1,346 | 99,395 | ||||||
| Kering SA | 76 | 40,763 | ||||||
| L’Oreal SA | 7,915 | 1,908,206 | ||||||
| LVMH Moet Hennessy Louis Vuitton SE | 1,483 | 524,049 | ||||||
| Pernod Ricard SA | 2,024 | 331,952 | ||||||
| Remy Cointreau SA | 303 | 39,517 | ||||||
| Sanofi | 3,828 | 342,021 | ||||||
| Societe BIC SA (a) | 11,282 | 1,033,190 | ||||||
| Societe Generale SA | 7,780 | 334,076 | ||||||
| Sodexo SA | 2,939 | 311,671 | ||||||
| Suez | 2,973 | 42,291 | ||||||
| Thales SA | 5,982 | 849,927 | ||||||
| TOTAL SA | 18,359 | 1,193,716 | ||||||
| Vinci SA | 3,641 | 346,404 | ||||||
|
| |||||||
| 13,831,598 | ||||||||
|
| |||||||
| Germany - 4.6% | ||||||||
| Allianz SE (Registered) | 2,588 | 576,003 | ||||||
| BASF SE | 6,846 | 607,467 | ||||||
| Bayer AG (Registered) | 3,544 | 314,355 | ||||||
| Beiersdorf AG | 7,238 | 815,892 | ||||||
| Continental AG | 367 | 63,764 | ||||||
| Covestro AG (b) | 4,880 | 395,023 | ||||||
| Delivery Hero SE *(b) | 4,646 | 223,096 | ||||||
| Deutsche Post AG (Registered) | 5,438 | 193,344 | ||||||
| FUCHS PETROLUB SE (Preference) | 1,561 | 87,108 | ||||||
| Hannover Rueck SE | 2,483 | 350,471 | ||||||
| Henkel AG & Co. KGaA (Preference) | 3,714 | 435,469 | ||||||
| HOCHTIEF AG | 1,022 | 169,423 | ||||||
| HUGO BOSS AG | 6,368 | 489,923 | ||||||
| MAN SE | 14,212 | 1,544,971 | ||||||
| METRO AG | 13,457 | 210,776 | ||||||
| Muenchener Rueckversicherungs-Gesellschaft AG in Muenchen (Registered) | 1,286 | 284,060 | ||||||
| ProSiebenSat.1 Media SE | 10,928 | 283,123 | ||||||
| SAP SE | 15,462 | 1,901,263 | ||||||
| Schaeffler AG (Preference) | 5,743 | 73,255 | ||||||
| Siemens AG (Registered) | 273 | 34,907 | ||||||
| Siemens Healthineers AG *(b) | 5,937 | 260,852 | ||||||
| TUI AG | 6,141 | 117,800 | ||||||
| Wirecard AG | 616 | 133,271 | ||||||
|
| |||||||
| 9,565,616 | ||||||||
|
| |||||||
| Hong Kong - 3.5% | ||||||||
| CK Hutchison Holdings Ltd. | 23,000 | 264,747 | ||||||
| CLP Holdings Ltd. | 138,000 | 1,616,081 | ||||||
| Galaxy Entertainment Group Ltd. | 107,000 | 675,928 | ||||||
| INVESTMENTS | SHARES | VALUE | ||||||
| Hong Kong - 3.5% (continued) | ||||||||
| Hang Seng Bank Ltd. | 16,800 | $ | 455,851 | |||||
| HK Electric Investments & HK Electric Investments Ltd. (b) | 679,000 | 685,597 | ||||||
| HKT Trust & HKT Ltd. | 210,000 | 288,762 | ||||||
| Hong Kong & China Gas Co. Ltd. | 704,015 | 1,395,393 | ||||||
| MTR Corp. Ltd. (a) | 178,500 | 938,718 | ||||||
| Power Assets Holdings Ltd. | 98,500 | 684,668 | ||||||
| Techtronic Industries Co. Ltd. | 12,500 | 79,734 | ||||||
| WH Group Ltd. (b) | 83,000 | 58,271 | ||||||
|
| |||||||
| 7,143,750 | ||||||||
|
| |||||||
| Italy - 0.3% | ||||||||
| Enel SpA | 89,661 | 458,305 | ||||||
| UniCredit SpA | 8,172 | 122,618 | ||||||
|
| |||||||
| 580,923 | ||||||||
|
| |||||||
| Japan - 29.0% | ||||||||
| ABC-Mart, Inc. | 11,200 | 623,038 | ||||||
| AGC, Inc. | 800 | 33,202 | ||||||
| Amada Holdings Co. Ltd. | 2,000 | 21,353 | ||||||
| ANA Holdings, Inc. (a) | 4,900 | 171,179 | ||||||
| Asahi Group Holdings Ltd. | 7,500 | 325,404 | ||||||
| Asahi Kasei Corp. | 22,800 | 345,696 | ||||||
| Astellas Pharma, Inc. | 99,800 | 1,742,804 | ||||||
| Bandai Namco Holdings, Inc. | 13,200 | 512,831 | ||||||
| Bank of Kyoto Ltd. (The) | 1,600 | 83,515 | ||||||
| Benesse Holdings, Inc. | 8,800 | 250,584 | ||||||
| Bridgestone Corp. | 28,800 | 1,088,453 | ||||||
| Brother Industries Ltd. | 10,100 | 199,427 | ||||||
| Calbee, Inc. (a) | 25,500 | 839,617 | ||||||
| Canon, Inc. | 27,600 | 875,184 | ||||||
| Casio Computer Co. Ltd. (a) | 25,400 | 415,170 | ||||||
| Central Japan Railway Co. | 2,300 | 478,855 | ||||||
| Chubu Electric Power Co., Inc. | 1,600 | 24,237 | ||||||
| Chugai Pharmaceutical Co. Ltd. | 8,400 | 539,980 | ||||||
| Coca-Cola Bottlers Japan Holdings, Inc. | 11,900 | 318,495 | ||||||
| Daicel Corp. | 21,500 | 249,745 | ||||||
| Dai-ichi Life Holdings, Inc. | 68,600 | 1,429,988 | ||||||
| Daiichi Sankyo Co. Ltd. | 9,100 | 394,466 | ||||||
| DeNA Co. Ltd. | 2,000 | 35,316 | ||||||
| Disco Corp. | 3,900 | 653,105 | ||||||
| East Japan Railway Co. | 5,000 | 464,446 | ||||||
| Eisai Co. Ltd. | 1,900 | 185,093 | ||||||
| FANUC Corp. | 300 | 56,440 | ||||||
| Fast Retailing Co. Ltd. | 600 | 303,959 | ||||||
| FUJIFILM Holdings Corp. | 1,700 | 76,482 | ||||||
| Fujitsu Ltd. | 1,500 | 106,860 | ||||||
| Hakuhodo DY Holdings, Inc. | 49,500 | 869,387 | ||||||
| Hirose Electric Co. Ltd. | 735 | 80,285 | ||||||
| Hisamitsu Pharmaceutical Co., Inc. | 12,700 | 973,992 | ||||||
| Hitachi Chemical Co. Ltd. | 1,100 | 22,384 | ||||||
| Hitachi Ltd. | 11,000 | 373,908 | ||||||
| Hoshizaki Corp. | 4,300 | 445,070 | ||||||
| Hoya Corp. | 17,300 | 1,027,464 | ||||||
| ITOCHU Corp. | 14,300 | 261,734 | ||||||
| Japan Airlines Co. Ltd. | 29,600 | 1,063,887 | ||||||
| Japan Airport Terminal Co. Ltd. | 5,400 | 245,648 | ||||||
| Japan Post Bank Co. Ltd. | 2,600 | 30,723 | ||||||
| Japan Tobacco, Inc. | 18,000 | 470,039 | ||||||
| The accompanying notes are an integral part of these financial statements. | (Continued) |
| AQR Funds | Annual Report | September 2018 | ||||||||||||||
153
Table of Contents
| Schedule of Investments | September 30, 2018 |
| AQR INTERNATIONAL DEFENSIVE STYLE FUND |
| INVESTMENTS | SHARES | VALUE | ||||||
| Japan - 29.0% (continued) | ||||||||
| Kajima Corp. | 7,500 | $ | 109,054 | |||||
| Kakaku.com, Inc. | 4,700 | 91,828 | ||||||
| Kamigumi Co. Ltd. | 29,000 | 639,238 | ||||||
| Kansai Paint Co. Ltd. | 6,100 | 112,424 | ||||||
| Kao Corp. | 5,500 | 444,278 | ||||||
| KDDI Corp. | 81,800 | 2,256,595 | ||||||
| Kikkoman Corp. | 7,300 | 434,764 | ||||||
| Kirin Holdings Co. Ltd. | 14,400 | 369,330 | ||||||
| Komatsu Ltd. | 7,000 | 213,016 | ||||||
| Konica Minolta, Inc. | 18,100 | 192,619 | ||||||
| Kose Corp. | 2,600 | 495,418 | ||||||
| Kuraray Co. Ltd. | 9,700 | 145,825 | ||||||
| Kurita Water Industries Ltd. | 5,600 | 163,141 | ||||||
| Kyushu Railway Co. | 26,600 | 809,862 | ||||||
| Lawson, Inc. | 4,900 | 298,422 | ||||||
| Lion Corp. | 14,600 | 324,261 | ||||||
| M3, Inc. | 5,000 | 113,392 | ||||||
| Makita Corp. | 8,800 | 440,670 | ||||||
| Mazda Motor Corp. | 57,400 | 689,948 | ||||||
| McDonald’s Holdings Co. Japan Ltd. | 6,100 | 267,884 | ||||||
| MEIJI Holdings Co. Ltd. | 4,300 | 289,012 | ||||||
| MISUMI Group, Inc. | 1,700 | 43,987 | ||||||
| Mitsubishi Electric Corp. | 6,400 | 87,676 | ||||||
| Mitsubishi Motors Corp. | 15,800 | 111,619 | ||||||
| Mitsubishi Tanabe Pharma Corp. | 39,700 | 664,447 | ||||||
| Mitsubishi UFJ Financial Group, Inc. | 19,600 | 121,769 | ||||||
| Mitsui & Co. Ltd. | 7,900 | 140,388 | ||||||
| Mizuho Financial Group, Inc. | 183,700 | 320,153 | ||||||
| Murata Manufacturing Co. Ltd. | 500 | 76,828 | ||||||
| Nexon Co. Ltd. * | 50,200 | 656,190 | ||||||
| NH Foods Ltd. | 1,000 | 36,942 | ||||||
| Nidec Corp. | 600 | 86,277 | ||||||
| Nikon Corp. | 7,500 | 140,935 | ||||||
| Nippon Express Co. Ltd. | 3,400 | 223,290 | ||||||
| Nippon Paint Holdings Co. Ltd. | 1,900 | 70,920 | ||||||
| Nippon Telegraph & Telephone Corp. | 32,100 | 1,448,683 | ||||||
| Nissan Motor Co. Ltd. (a) | 44,200 | 413,603 | ||||||
| Nisshin Seifun Group, Inc. | 8,400 | 184,218 | ||||||
| Nissin Foods Holdings Co. Ltd. | 9,700 | 667,234 | ||||||
| Nitori Holdings Co. Ltd. | 3,700 | 530,232 | ||||||
| Nitto Denko Corp. | 8,300 | 622,291 | ||||||
| Nomura Research Institute Ltd. | 1,287 | 64,991 | ||||||
| Obayashi Corp. | 11,400 | 107,973 | ||||||
| Obic Co. Ltd. | 700 | 66,207 | ||||||
| Omron Corp. | 25,000 | 1,056,443 | ||||||
| Oracle Corp. Japan | 8,900 | 717,093 | ||||||
| Oriental Land Co. Ltd. | 9,100 | 951,451 | ||||||
| Osaka Gas Co. Ltd. | 74,600 | 1,456,683 | ||||||
| Otsuka Corp. | 23,400 | 872,822 | ||||||
| Otsuka Holdings Co. Ltd. | 5,000 | 252,195 | ||||||
| Pola Orbis Holdings, Inc. | 18,500 | 675,679 | ||||||
| Recruit Holdings Co. Ltd. | 54,300 | 1,813,699 | ||||||
| Rinnai Corp. | 600 | 45,742 | ||||||
| Ryohin Keikaku Co. Ltd. | 1,700 | 505,307 | ||||||
| Secom Co. Ltd. | 1,200 | 97,790 | ||||||
| Sekisui Chemical Co. Ltd. | 3,900 | 71,920 | ||||||
| Seven & i Holdings Co. Ltd. | 21,700 | 967,493 | ||||||
| Seven Bank Ltd. | 27,700 | 87,486 | ||||||
| Shimamura Co. Ltd. | 5,200 | 493,265 | ||||||
| INVESTMENTS | SHARES | VALUE | ||||||
| Japan - 29.0% (continued) | ||||||||
| Shimano, Inc. | 3,800 | $ | 612,745 | |||||
| Shin-Etsu Chemical Co. Ltd. | 800 | 70,727 | ||||||
| Shionogi & Co. Ltd. | 15,000 | 980,545 | ||||||
| SMC Corp. | 1,400 | 448,100 | ||||||
| Sony Corp. | 1,800 | 109,418 | ||||||
| Sony Financial Holdings, Inc. | 2,000 | 44,104 | ||||||
| Stanley Electric Co. Ltd. | 9,500 | 324,783 | ||||||
| Subaru Corp. | 36,100 | 1,106,621 | ||||||
| Sumitomo Corp. | 7,900 | 131,655 | ||||||
| Sumitomo Dainippon Pharma Co. Ltd. | 7,000 | 160,766 | ||||||
| Sumitomo Heavy Industries Ltd. | 1,200 | 42,830 | ||||||
| Sumitomo Mitsui Financial Group, Inc. | 3,300 | 132,805 | ||||||
| Sundrug Co. Ltd. | 27,000 | 963,428 | ||||||
| Suntory Beverage & Food Ltd. | 9,300 | 394,004 | ||||||
| Suzuken Co. Ltd. | 3,400 | 161,327 | ||||||
| Suzuki Motor Corp. | 8,400 | 481,414 | ||||||
| Sysmex Corp. | 7,300 | 629,504 | ||||||
| T&D Holdings, Inc. | 48,100 | 794,351 | ||||||
| Taisei Corp. | 5,600 | 255,267 | ||||||
| Toho Co. Ltd. | 2,700 | 84,801 | ||||||
| Toho Gas Co. Ltd. | 18,500 | 703,872 | ||||||
| Tohoku Electric Power Co., Inc. | 2,200 | 29,924 | ||||||
| Tokyo Electric Power Co. Holdings, Inc. * | 48,800 | 239,807 | ||||||
| Tokyo Electron Ltd. | 1,000 | 137,820 | ||||||
| Tokyo Gas Co. Ltd. | 50,700 | 1,247,120 | ||||||
| Tosoh Corp. | 17,400 | 267,994 | ||||||
| TOTO Ltd. | 2,200 | 91,244 | ||||||
| Toyo Suisan Kaisha Ltd. | 25,300 | 982,207 | ||||||
| Trend Micro, Inc. | 14,100 | 906,965 | ||||||
| Tsuruha Holdings, Inc. | 3,500 | 430,814 | ||||||
| USS Co. Ltd. | 16,100 | 298,878 | ||||||
| West Japan Railway Co. | 4,900 | 341,577 | ||||||
| Yakult Honsha Co. Ltd. | 11,700 | 959,523 | ||||||
| Yamada Denki Co. Ltd. (a) | 7,900 | 39,968 | ||||||
| Yamaha Motor Co. Ltd. | 8,100 | 227,147 | ||||||
| Yamato Holdings Co. Ltd. | 1,200 | 36,845 | ||||||
| Yamazaki Baking Co. Ltd. | 19,100 | 382,612 | ||||||
| Yokogawa Electric Corp. | 4,600 | 97,304 | ||||||
| ZOZO, Inc. | 4,600 | 139,148 | ||||||
|
| |||||||
| 60,052,311 | ||||||||
|
| |||||||
| Macau - 0.6% | ||||||||
| Sands China Ltd. | 170,800 | 769,201 | ||||||
| SJM Holdings Ltd. | 248,000 | 228,498 | ||||||
| Wynn Macau Ltd. | 115,200 | 264,568 | ||||||
|
| |||||||
| 1,262,267 | ||||||||
|
| |||||||
| Netherlands - 1.2% | ||||||||
| Heineken NV | 2,163 | 202,999 | ||||||
| Koninklijke Ahold Delhaize NV | 43,960 | 1,008,554 | ||||||
| Koninklijke Philips NV | 5,681 | 258,948 | ||||||
| Koninklijke Vopak NV | 4,116 | 202,780 | ||||||
| Randstad NV | 4,463 | 238,211 | ||||||
| Royal Dutch Shell plc, Class A | 19,109 | 655,218 | ||||||
|
| |||||||
| 2,566,710 | ||||||||
|
| |||||||
| Norway - 1.6% | ||||||||
| DNB ASA | 1,949 | 41,016 | ||||||
| Gjensidige Forsikring ASA | 16,603 | 279,827 | ||||||
| The accompanying notes are an integral part of these financial statements. | (Continued) |
| AQR Funds | Annual Report | September 2018 | ||||||||||||||
154
Table of Contents
| Schedule of Investments | September 30, 2018 |
| AQR INTERNATIONAL DEFENSIVE STYLE FUND |
| INVESTMENTS | SHARES | VALUE | ||||||
| Norway - 1.6% (continued) | ||||||||
| Marine Harvest ASA | 34,948 | $ | 809,814 | |||||
| Norsk Hydro ASA | 24,142 | 144,776 | ||||||
| Orkla ASA | 76,822 | 649,071 | ||||||
| Telenor ASA | 67,116 | 1,312,497 | ||||||
| Yara International ASA | 1,334 | 65,470 | ||||||
|
| |||||||
| 3,302,471 | ||||||||
|
| |||||||
| Portugal - 0.0% (c) | ||||||||
| Jeronimo Martins SGPS SA | 2,999 | 44,204 | ||||||
|
| |||||||
| Singapore - 3.8% | ||||||||
| ComfortDelGro Corp. Ltd. | 243,200 | 432,225 | ||||||
| DBS Group Holdings Ltd. | 68,100 | 1,299,154 | ||||||
| Genting Singapore Ltd. | 502,900 | 389,815 | ||||||
| Jardine Cycle & Carriage Ltd. | 1,700 | 39,790 | ||||||
| Oversea-Chinese Banking Corp. Ltd. | 134,400 | 1,124,619 | ||||||
| SATS Ltd. | 140,200 | 535,242 | ||||||
| Singapore Airlines Ltd. | 88,900 | 633,259 | ||||||
| Singapore Telecommunications Ltd. | 499,600 | 1,183,899 | ||||||
| StarHub Ltd. | 11,200 | 15,317 | ||||||
| United Overseas Bank Ltd. | 58,200 | 1,150,524 | ||||||
| Venture Corp. Ltd. | 42,300 | 545,446 | ||||||
| Wilmar International Ltd. | 205,800 | 484,564 | ||||||
|
| |||||||
| 7,833,854 | ||||||||
|
| |||||||
| South Africa - 0.1% | ||||||||
| Anglo American plc | 8,862 | 198,252 | ||||||
|
| |||||||
| Spain - 0.7% | ||||||||
| Endesa SA | 13,559 | 292,464 | ||||||
| Iberdrola SA | 77,077 | 566,119 | ||||||
| Industria de Diseno Textil SA | 9,673 | 292,236 | ||||||
| Mapfre SA | 65,467 | 204,771 | ||||||
| Red Electrica Corp. SA | 5,122 | 107,078 | ||||||
| Repsol SA | 2,886 | 57,453 | ||||||
|
| |||||||
| 1,520,121 | ||||||||
|
| |||||||
| Sweden - 3.9% | ||||||||
| Assa Abloy AB, Class B | 3,685 | 73,862 | ||||||
| Atlas Copco AB, Class A | 19,161 | 551,036 | ||||||
| Boliden AB | 1,762 | 49,003 | ||||||
| Essity AB, Class B | 23,725 | 595,528 | ||||||
| Hennes & Mauritz AB, Class B (a) | 20,322 | 375,420 | ||||||
| ICA Gruppen AB (a) | 19,296 | 612,038 | ||||||
| Investor AB, Class B | 23,812 | 1,097,296 | ||||||
| L E Lundbergforetagen AB, Class B | 8,324 | 280,498 | ||||||
| Nordea Bank AB | 27,239 | 296,377 | ||||||
| Sandvik AB | 19,119 | 338,488 | ||||||
| Skanska AB, Class B | 13,587 | 266,406 | ||||||
| SKF AB, Class B | 2,488 | 48,956 | ||||||
| Svenska Handelsbanken AB, Class A | 2,802 | 35,338 | ||||||
| Swedish Match AB | 27,891 | 1,425,657 | ||||||
| Tele2 AB, Class B (a) | 68,457 | 822,738 | ||||||
| Telia Co. AB | 139,404 | 639,250 | ||||||
| Volvo AB, Class B | 28,527 | 503,129 | ||||||
|
| |||||||
| 8,011,020 | ||||||||
|
| |||||||
| Switzerland - 4.8% | ||||||||
| ABB Ltd. (Registered) | 18,150 | 429,334 | ||||||
| INVESTMENTS | SHARES | VALUE | ||||||
| Switzerland - 4.8% (continued) | ||||||||
| Adecco Group AG (Registered) | 1,325 | $ | 69,652 | |||||
| Chocoladefabriken Lindt & Spruengli AG | 65 | 454,902 | ||||||
| Coca-Cola HBC AG * | 25,235 | 859,735 | ||||||
| Ferguson plc | 3,329 | 282,372 | ||||||
| Geberit AG (Registered) | 423 | 196,332 | ||||||
| Kuehne + Nagel International AG (Registered) | 6,330 | 1,004,414 | ||||||
| Nestle SA (Registered) | 21,363 | 1,778,185 | ||||||
| Novartis AG (Registered) | 11,270 | 970,104 | ||||||
| Partners Group Holding AG | 212 | 168,056 | ||||||
| Roche Holding AG | 6,777 | 1,638,783 | ||||||
| Schindler Holding AG | 1,889 | 471,412 | ||||||
| SGS SA (Registered) | 52 | 136,913 | ||||||
| Sika AG (Registered) | 2,220 | 323,053 | ||||||
| Sonova Holding AG (Registered) | 1,598 | 317,152 | ||||||
| Swatch Group AG (The) | 314 | 124,794 | ||||||
| Swiss Re AG | 2,604 | 239,923 | ||||||
| Swisscom AG (Registered) | 694 | 314,770 | ||||||
| Zurich Insurance Group AG | 638 | 201,165 | ||||||
|
| |||||||
| 9,981,051 | ||||||||
|
| |||||||
| United Kingdom - 9.1% | ||||||||
| Admiral Group plc | 20,048 | 543,446 | ||||||
| Associated British Foods plc | 27,947 | 834,090 | ||||||
| AstraZeneca plc | 10,504 | 818,725 | ||||||
| BAE Systems plc | 47,484 | 389,367 | ||||||
| BP plc | 57,637 | 441,773 | ||||||
| British American Tobacco plc | 8,440 | 393,477 | ||||||
| BT Group plc | 226,103 | 663,690 | ||||||
| Bunzl plc | 3,697 | 116,227 | ||||||
| Burberry Group plc | 55,930 | 1,468,681 | ||||||
| Centrica plc | 144,546 | 292,110 | ||||||
| Compass Group plc | 12,485 | 277,583 | ||||||
| Diageo plc | 39,111 | 1,385,627 | ||||||
| Direct Line Insurance Group plc | 170,849 | 721,119 | ||||||
| easyJet plc | 6,543 | 111,965 | ||||||
| Fiat Chrysler Automobiles NV * | 1,982 | 34,663 | ||||||
| GlaxoSmithKline plc | 24,653 | 494,409 | ||||||
| Hargreaves Lansdown plc | 10,356 | 301,469 | ||||||
| HSBC Holdings plc | 89,959 | 784,927 | ||||||
| Imperial Brands plc | 11,065 | 385,039 | ||||||
| International Consolidated Airlines Group SA | 4,841 | 41,529 | ||||||
| ITV plc | 55,063 | 113,010 | ||||||
| Kingfisher plc | 103,321 | 349,352 | ||||||
| Marks & Spencer Group plc | 98,848 | 371,910 | ||||||
| Mondi plc | 26,110 | 714,885 | ||||||
| National Grid plc | 101,740 | 1,050,849 | ||||||
| Next plc | 4,707 | 336,862 | ||||||
| Pearson plc | 58,828 | 681,015 | ||||||
| Reckitt Benckiser Group plc | 10,025 | 915,784 | ||||||
| Royal Mail plc | 167,833 | 1,043,315 | ||||||
| Sage Group plc (The) | 17,119 | 130,747 | ||||||
| Smith & Nephew plc | 51,219 | 934,473 | ||||||
| SSE plc | 41,219 | 615,559 | ||||||
| Travis Perkins plc | 2,417 | 33,541 | ||||||
| Unilever NV, CVA | 5,592 | 311,054 | ||||||
| United Utilities Group plc | 2,762 | 25,355 | ||||||
| Vodafone Group plc | 228,022 | 488,565 | ||||||
| The accompanying notes are an integral part of these financial statements. | (Continued) |
| AQR Funds | Annual Report | September 2018 | ||||||||||||||
155
Table of Contents
| Schedule of Investments | September 30, 2018 |
| AQR INTERNATIONAL DEFENSIVE STYLE FUND |
| INVESTMENTS | SHARES | VALUE | ||||||
| United Kingdom - 9.1% (continued) | ||||||||
| Whitbread plc | 1,298 | $ | 79,778 | |||||
| WPP plc | 2,453 | 35,923 | ||||||
|
| |||||||
| 18,731,893 | ||||||||
|
| |||||||
| Zambia - 0.0% (c) | ||||||||
| First Quantum Minerals Ltd. (1) | 4,929 | 56,134 | ||||||
|
| |||||||
TOTAL COMMON STOCKS | 196,968,704 | |||||||
|
| |||||||
| SHORT-TERM INVESTMENTS - 3.8% | ||||||||
| Investment Companies - 3.8% | ||||||||
| Limited Purpose Cash Investment Fund, 2.06% (1)(d) | ||||||||
(Cost $7,932,788) | 7,934,080 | 7,933,286 | ||||||
|
| |||||||
| SECURITIES LENDING COLLATERAL - 1.9% | ||||||||
| Investment Companies - 1.9% | ||||||||
| Investments in a Pooled Account through Securities Lending Program with Citibank NA | ||||||||
| BlackRock Liquidity Funds T-Fund Portfolio, Institutional Shares 1.97%(1)(d)(e) | 472,586 | 472,586 | ||||||
| Limited Purpose Cash Investment Fund 2.06% (1)(d)(e) | 3,391,089 | 3,390,750 | ||||||
|
| |||||||
TOTAL SECURITIES LENDING |
| 3,863,336 | ||||||
|
| |||||||
TOTAL INVESTMENTS IN SECURITIES |
| 208,765,326 | ||||||
|
| |||||||
| LIABILITIES IN EXCESS OF OTHER ASSETS - (0.9)% (f) | (1,826,741) | |||||||
|
| |||||||
NET ASSETS - 100.0% | $ | 206,938,585 | ||||||
|
| |||||||
| SECTOR | VALUE | % OF NET ASSETS | ||||||
| Communication Services | $ | 17,576,340 | 8.5 | % | ||||
| Consumer Discretionary | 22,038,159 | 10.6 | ||||||
| Consumer Staples | 36,569,407 | 17.7 | ||||||
| Energy | 7,093,090 | 3.4 | ||||||
| Financials | 27,086,134 | 13.1 | ||||||
| Health Care | 19,034,656 | 9.2 | ||||||
| Industrials | 27,499,724 | 13.3 | ||||||
| Information Technology | 10,665,541 | 5.2 | ||||||
| Materials | 12,810,910 | 6.2 | ||||||
| Utilities | 16,594,743 | 8.0 | ||||||
| Short-Term Investments | 7,933,286 | 3.8 | ||||||
| Securities Lending Collateral | 3,863,336 | 1.9 | ||||||
|
|
|
| |||||
Total Investments In Securities | 208,765,326 | 100.9 | ||||||
| Liabilities in Excess of Other Assets (f) | (1,826,741 | ) | (0.9 | ) | ||||
|
|
|
| |||||
Net Assets | $ | 206,938,585 | 100.0 | % | ||||
|
|
|
| |||||
| * | Non-income producing security. |
| (a) | The security or a portion of this security is on loan at September 30, 2018. The total value of securities on loan at September 30, 2018 was $3,590,896. |
| (b) | Securities exempt from registration under Rule 144A or section 4(2), of the Securities Act of 1933. Under procedures approved by the Board of Trustees, such securities have been determined to be liquid by the investment adviser and may be resold, normally to qualified institutional buyers in transactions exempt from registration. Total value of all such securities at September 30, 2018 amounted to $3,458,318, which represents approximately 1.67% of net assets of the fund. |
| (c) | Represents less than 0.05% of net assets. |
| (d) | Represents 7-day effective yield as of September 30, 2018. |
| (e) | Represents security, or portion thereof, purchased with the cash collateral received for securities on loan; additional non-cash collateral of $392,324 was received (See Note 3). |
| (f) | Includes appreciation/(depreciation) on futures contracts. |
All securities are Level 2 with respect to ASC 820, unless otherwise noted in parentheses.
| (1) | Level 1 security (See Note 4). |
Abbreviations
CVA - Dutch Certification
OYJ - Public Traded Company
Preference - A special type of equity investment that shares in the earnings of the company, has limited voting rights, and may have a dividend preference. Preference shares may also have liquidation preference.
SCA - Limited partnership with share capital
| The accompanying notes are an integral part of these financial statements. | (Continued) |
| AQR Funds | Annual Report | September 2018 | ||||||||||||||
156
Table of Contents
| Schedule of Investments | September 30, 2018 |
| AQR INTERNATIONAL DEFENSIVE STYLE FUND |
Futures contracts outstanding as of September 30, 2018:
Exchange Traded
| DESCRIPTION | NUMBER OF CONTRACTS | EXPIRATION DATE | TRADING CURRENCY | NOTIONAL AMOUNT | VALUE AND UNREALIZED APPRECIATION (DEPRECIATION) | |||||||||||
| Long Contracts | ||||||||||||||||
| MSCI EAFE E-Mini Index | 80 | 12/2018 | USD | $7,902,000 | $63,217 | |||||||||||
|
| |||||||||||||||
| $63,217 | ||||||||||||||||
|
| |||||||||||||||
USD - United States Dollar
Collateral pledged to, or (received from), each counterparty at September 30, 2018 was as follows:
| COUNTERPARTY | OVER THE COUNTER | EXCHANGE TRADED | TOTAL | |||||||||
| JPMS | ||||||||||||
| Cash | $— | $262,953 | $262,953 | |||||||||
| ||||||||||||
| The accompanying notes are an integral part of these financial statements. |
| AQR Funds | Annual Report | September 2018 | ||||||||||||||
157
Table of Contents
| Schedule of Investments | September 30, 2018 |
| AQR EMERGING DEFENSIVE STYLE FUND |
| INVESTMENTS | SHARES | VALUE | ||||||
| COMMON STOCKS - 94.3% | ||||||||
| Brazil - 3.2% | ||||||||
| Ambev SA, ADR (1) | 148,089 | $ | 676,767 | |||||
| BB Seguridade Participacoes SA (1) | 15,000 | 89,289 | ||||||
| Engie Brasil Energia SA (1) | 29,900 | 263,200 | ||||||
| Equatorial Energia SA (1) | 3,800 | 53,962 | ||||||
| Hypera SA (1)* | 7,800 | 55,025 | ||||||
| IRB Brasil Resseguros S/A (1) | 4,100 | 67,157 | ||||||
| Localiza Rent a Car SA (1)* | 24,290 | 137,492 | ||||||
| Lojas Renner SA (1) | 12,600 | 96,593 | ||||||
| M Dias Branco SA (1)* | 4,100 | 40,030 | ||||||
| Odontoprev SA (1) | 138,000 | 437,385 | ||||||
| Raia Drogasil SA (1)* | 3,700 | 66,377 | ||||||
| Sul America SA (1) | 14,200 | 91,243 | ||||||
| Telefonica Brasil SA, ADR (1) | 12,990 | 126,393 | ||||||
| TIM Participacoes SA, ADR (1) | 21,702 | 314,462 | ||||||
| Ultrapar Participacoes SA (1) | 2,700 | 24,930 | ||||||
| WEG SA (1) | 40,554 | 197,822 | ||||||
|
| |||||||
| 2,738,127 | ||||||||
|
| |||||||
| Chile - 4.2% | ||||||||
| Aguas Andinas SA, Class A | 1,020,599 | 564,857 | ||||||
| Banco de Chile | 5,904,291 | 899,036 | ||||||
| Banco de Credito e Inversiones SA | 496 | 33,549 | ||||||
| Banco Santander Chile, ADR (1) | 6,318 | 202,050 | ||||||
| Cia Cervecerias Unidas SA, ADR (1)(a) | 14,930 | 416,547 | ||||||
| Embotelladora Andina SA (Preference), Class B | 32,762 | 127,527 | ||||||
| Empresas COPEC SA | 3,262 | 50,394 | ||||||
| Enel Americas SA, ADR (1) | 24,890 | 192,400 | ||||||
| Enel Chile SA, ADR (1) | 36,540 | 183,065 | ||||||
| Enel Generacion Chile SA, ADR (1) | 589 | 12,228 | ||||||
| SACI Falabella | 75,507 | 614,572 | ||||||
| Sociedad Quimica y Minera de Chile SA, ADR (1) | 6,765 | 309,296 | ||||||
|
| |||||||
| 3,605,521 | ||||||||
|
| |||||||
| China - 16.5% | ||||||||
| 3SBio, Inc. (b) | 28,500 | 47,758 | ||||||
| Agricultural Bank of China Ltd., Class H | 639,000 | 313,379 | ||||||
| ANTA Sports Products Ltd. | 111,000 | 529,896 | ||||||
| Bank of China Ltd., Class H | 513,000 | 226,665 | ||||||
| Beijing Capital International Airport Co. Ltd., Class H | 152,000 | 184,353 | ||||||
| China Communications Services Corp. Ltd., Class H | 1,010,000 | 931,330 | ||||||
| China Construction Bank Corp., Class H | 631,000 | 551,557 | ||||||
| China Everbright Bank Co. Ltd., Class H | 97,000 | 42,963 | ||||||
| China Huishan Dairy Holdings Co. Ltd. (3)*(c) | 700,000 | 1 | ||||||
| China Longyuan Power Group Corp. Ltd., Class H | 342,000 | 287,995 | ||||||
| China Medical System Holdings Ltd. | 74,000 | 103,043 | ||||||
| China Merchants Bank Co. Ltd., Class H | 39,500 | 159,721 | ||||||
| China Mobile Ltd. | 133,000 | 1,307,636 | ||||||
| China Petroleum & Chemical Corp., Class H | 418,000 | 419,985 | ||||||
| China Resources Beer Holdings Co. Ltd. | 26,000 | 104,264 | ||||||
| China Resources Gas Group Ltd. | 150,000 | 609,977 | ||||||
| China Resources Pharmaceutical Group Ltd. (b) | 33,000 | 52,400 | ||||||
| INVESTMENTS | SHARES | VALUE | ||||||
| China - 16.5% (continued) | ||||||||
| China Resources Power Holdings Co. Ltd. | 308,000 | $ | 543,403 | |||||
| China Shenhua Energy Co. Ltd., Class H | 95,500 | 217,498 | ||||||
| China Telecom Corp. Ltd., Class H | 1,262,000 | 627,340 | ||||||
| China Unicom Hong Kong Ltd. | 426,000 | 497,676 | ||||||
| Chong Sing Holdings FinTech Gr * | 716,000 | 38,451 | ||||||
| CSPC Pharmaceutical Group Ltd. | 348,000 | 736,102 | ||||||
| ENN Energy Holdings Ltd. | 43,000 | 373,825 | ||||||
| Fuyao Glass Industry Group Co. Ltd., Class H (b) | 15,200 | 55,072 | ||||||
| Geely Automobile Holdings Ltd. | 83,000 | 165,291 | ||||||
| Great Wall Motor Co. Ltd., Class H (a) | 55,500 | 35,274 | ||||||
| Guangdong Investment Ltd. | 610,000 | 1,080,898 | ||||||
| Haitian International Holdings Ltd. | 71,000 | 158,010 | ||||||
| Hengan International Group Co. Ltd. | 3,500 | 32,165 | ||||||
| HengTen Networks Group Ltd. * | 4,760,000 | 179,008 | ||||||
| Huaneng Power International, Inc., Class H | 54,000 | 35,384 | ||||||
| Huaneng Renewables Corp. Ltd., Class H | 494,000 | 147,304 | ||||||
| Industrial & Commercial Bank of China Ltd., Class H | 735,000 | 536,619 | ||||||
| Jiangsu Expressway Co. Ltd., Class H | 170,000 | 218,070 | ||||||
| Kingdee International Software Group Co. Ltd. | 36,000 | 39,075 | ||||||
| Luye Pharma Group Ltd. | 46,500 | 41,632 | ||||||
| Nexteer Automotive Group Ltd. | 59,000 | 93,420 | ||||||
| PICC Property & Casualty Co. Ltd., Class H | 20,000 | 23,538 | ||||||
| Shenzhou International Group Holdings Ltd. | 16,000 | 205,298 | ||||||
| Sinopharm Group Co. Ltd., Class H | 5,600 | 27,392 | ||||||
| Sinotruk Hong Kong Ltd. (a) | 122,000 | 266,176 | ||||||
| Sunny Optical Technology Group Co. Ltd. | 2,000 | 23,090 | ||||||
| Tencent Holdings Ltd. | 10,600 | 432,807 | ||||||
| Tingyi Cayman Islands Holding Corp. | 196,000 | 359,899 | ||||||
| Towngas China Co. Ltd. * | 137,000 | 119,575 | ||||||
| TravelSky Technology Ltd., Class H | 38,000 | 98,805 | ||||||
| Tsingtao Brewery Co. Ltd., Class H | 38,000 | 178,256 | ||||||
| Uni-President China Holdings Ltd. | 422,000 | 449,155 | ||||||
| Want Want China Holdings Ltd. (a) | 371,000 | 312,090 | ||||||
| Wuxi Biologics Cayman, Inc. *(b) | 3,000 | 30,359 | ||||||
| Zhongsheng Group Holdings Ltd. | 22,000 | 53,397 | ||||||
|
| |||||||
| 14,304,277 | ||||||||
|
| |||||||
| Hong Kong - 1.3% | ||||||||
| China Gas Holdings Ltd. | 43,000 | 121,701 | ||||||
| Haier Electronics Group Co. Ltd. * | 104,000 | 281,564 | ||||||
| Kingboard Laminates Holdings Ltd. | 43,500 | 38,569 | ||||||
| Sino Biopharmaceutical Ltd. | 653,500 | 607,843 | ||||||
| SSY Group Ltd. | 62,000 | 60,027 | ||||||
|
| |||||||
| 1,109,704 | ||||||||
|
| |||||||
| India - 7.9% | ||||||||
| Axis Bank Ltd., GDR *(d) | 6,187 | 261,686 | ||||||
| Bajaj Finance Ltd. | 598 | 17,901 | ||||||
| Bharti Infratel Ltd. | 59,678 | 216,528 | ||||||
| Dr Reddy’s Laboratories Ltd., ADR (1) | 12,378 | 428,279 | ||||||
| Hindustan Unilever Ltd. | 43,567 | 966,890 | ||||||
| Infosys Ltd., ADR (1) | 106,912 | 1,087,295 | ||||||
| Larsen & Toubro Ltd., GDR (d) | 20,109 | 348,887 | ||||||
| Nestle India Ltd. | 3,832 | 512,839 | ||||||
| Reliance Industries Ltd., GDR (b) | 35,228 | 1,212,158 | ||||||
| State Bank of India, GDR *(d) | 9,615 | 354,999 | ||||||
| The accompanying notes are an integral part of these financial statements. | (Continued) |
| AQR Funds | Annual Report | September 2018 | ||||||||||||||
158
Table of Contents
| Schedule of Investments | September 30, 2018 |
| AQR EMERGING DEFENSIVE STYLE FUND |
| INVESTMENTS | SHARES | VALUE | ||||||
| India - 7.9% (continued) | ||||||||
| Tata Consultancy Services Ltd. | 14,448 | $ | 435,247 | |||||
| Tata Motors Ltd., ADR (1)* | 1,375 | 21,120 | ||||||
| Wipro Ltd., ADR (1)(a) | 195,853 | 1,020,394 | ||||||
|
| |||||||
| 6,884,223 | ||||||||
|
| |||||||
| Indonesia - 2.9% | ||||||||
| Bank Central Asia Tbk. PT | 400,600 | 648,872 | ||||||
| Bank Mandiri Persero Tbk. PT | 234,000 | 105,444 | ||||||
| Bank Rakyat Indonesia Persero Tbk. PT | 864,000 | 182,579 | ||||||
| Hanjaya Mandala Sampoerna Tbk. PT | 1,409,900 | 364,182 | ||||||
| Indofood CBP Sukses Makmur Tbk. PT | 220,300 | 130,556 | ||||||
| Kalbe Farma Tbk. PT | 2,964,400 | 274,575 | ||||||
| Telekomunikasi Indonesia Persero Tbk. PT | 1,102,600 | 269,889 | ||||||
| Unilever Indonesia Tbk. PT | 153,200 | 483,507 | ||||||
| United Tractors Tbk. PT | 39,800 | 88,119 | ||||||
|
| |||||||
| 2,547,723 | ||||||||
|
| |||||||
| Malaysia - 7.7% | ||||||||
| DiGi.Com Bhd. | 360,700 | 420,002 | ||||||
| Fraser & Neave Holdings Bhd. | 21,600 | 196,919 | ||||||
| Hong Leong Bank Bhd. | 103,700 | 515,726 | ||||||
| IHH Healthcare Bhd. | 144,000 | 181,254 | ||||||
| Kuala Lumpur Kepong Bhd. | 26,100 | 157,400 | ||||||
| Malayan Banking Bhd. | 306,300 | 724,439 | ||||||
| Malaysia Airports Holdings Bhd. | 39,700 | 85,350 | ||||||
| Nestle Malaysia Bhd. | 4,400 | 155,614 | ||||||
| Petronas Chemicals Group Bhd. | 338,500 | 765,512 | ||||||
| Petronas Dagangan Bhd. | 9,600 | 60,921 | ||||||
| Petronas Gas Bhd. | 105,800 | 482,664 | ||||||
| PPB Group Bhd. | 68,400 | 277,202 | ||||||
| Public Bank Bhd. | 187,800 | 1,134,265 | ||||||
| Sime Darby Plantation Bhd. | 245,100 | 313,519 | ||||||
| Telekom Malaysia Bhd. | 312,200 | 242,936 | ||||||
| Tenaga Nasional Bhd. | 160,100 | 598,611 | ||||||
| Westports Holdings Bhd. | 430,500 | 395,144 | ||||||
|
| |||||||
| 6,707,478 | ||||||||
|
| |||||||
| Mexico - 5.8% | ||||||||
| America Movil SAB de CV, Class L, ADR (1) | 4,647 | 74,631 | ||||||
| Arca Continental SAB de CV (1) | 76,300 | 492,847 | ||||||
| Coca-Cola Femsa SAB de CV, ADR (1) | 2,295 | 140,546 | ||||||
| El Puerto de Liverpool SAB de CV, Class C1 (1) | 3,700 | 27,767 | ||||||
| Fomento Economico Mexicano SAB de CV, ADR (1) | 3,354 | 331,945 | ||||||
| Gruma SAB de CV, Class B (1) | 29,345 | 375,147 | ||||||
| Grupo Aeroportuario del Pacifico SAB de CV, ADR (1) | 6,914 | 754,870 | ||||||
| Grupo Aeroportuario del Sureste SAB de CV, ADR (1)(a) | 2,477 | 508,107 | ||||||
| Grupo Bimbo SAB de CV, Series A (1) | 107,500 | 229,258 | ||||||
| Grupo Financiero Banorte SAB de CV, Class O (1) | 24,300 | 175,686 | ||||||
| Infraestructura Energetica Nova SAB de CV (1) | 84,100 | 417,894 | ||||||
| Kimberly-Clark de Mexico SAB de CV, Class A (1) | 21,300 | 37,902 | ||||||
| Promotora y Operadora de Infraestructura SAB de CV (1) | 16,930 | 180,111 | ||||||
| INVESTMENTS | SHARES | VALUE | ||||||
| Mexico - 5.8% (continued) | ||||||||
| Wal-Mart de Mexico SAB de CV (1) | 430,400 | $ | 1,311,622 | |||||
|
| |||||||
| 5,058,333 | ||||||||
|
| |||||||
| Philippines - 0.5% | ||||||||
| Ayala Corp. | 4,000 | 68,687 | ||||||
| Bank of the Philippine Islands | 176,330 | 271,878 | ||||||
| BDO Unibank, Inc. | 12,190 | 27,028 | ||||||
| Jollibee Foods Corp. | 5,120 | 24,344 | ||||||
|
| |||||||
| 391,937 | ||||||||
|
| |||||||
| Poland - 2.5% | ||||||||
| Bank Polska Kasa Opieki SA | 10,096 | 290,563 | ||||||
| Jastrzebska Spolka Weglowa SA * | 4,277 | 76,952 | ||||||
| LPP SA | 243 | 568,484 | ||||||
| PGE Polska Grupa Energetyczna SA * | 67,912 | 175,530 | ||||||
| Polski Koncern Naftowy ORLEN SA | 9,306 | 255,087 | ||||||
| Polskie Gornictwo Naftowe i Gazownictwo SA * | 30,228 | 53,059 | ||||||
| Powszechna Kasa Oszczednosci Bank Polski SA | 4,356 | 50,605 | ||||||
| Powszechny Zaklad Ubezpieczen SA | 30,380 | 326,939 | ||||||
| Santander Bank Polska SA | 3,292 | 334,801 | ||||||
|
| |||||||
| 2,132,020 | ||||||||
|
| |||||||
| Russia - 0.8% | ||||||||
| Mobile TeleSystems PJSC, ADR (1) | 16,755 | 142,920 | ||||||
| Novolipetsk Steel PJSC, GDR (d) | 4,160 | 111,965 | ||||||
| Severstal PJSC, GDR (d) | 20,460 | 340,763 | ||||||
| Tatneft PJSC, ADR | 1,177 | 89,805 | ||||||
|
| |||||||
| 685,453 | ||||||||
|
| |||||||
| South Africa - 5.8% | ||||||||
| Bidvest Group Ltd. (The) | 22,037 | 288,260 | ||||||
| Capitec Bank Holdings Ltd. | 5,945 | 430,037 | ||||||
| Clicks Group Ltd. | 7,756 | 95,860 | ||||||
| Coronation Fund Managers Ltd. | 27,834 | 106,020 | ||||||
| FirstRand Ltd. | 93,749 | 449,699 | ||||||
| Kumba Iron Ore Ltd. | 10,004 | 226,676 | ||||||
| Mr Price Group Ltd. | 20,222 | 326,129 | ||||||
| Nedbank Group Ltd. | 2,862 | 53,539 | ||||||
| Netcare Ltd. | 17,991 | 30,745 | ||||||
| Pick n Pay Stores Ltd. | 130,952 | 637,206 | ||||||
| RMB Holdings Ltd. | 99,315 | 555,256 | ||||||
| Sanlam Ltd. | 6,667 | 37,246 | ||||||
| Shoprite Holdings Ltd. | 15,793 | 213,851 | ||||||
| SPAR Group Ltd. (The) | 13,671 | 178,052 | ||||||
| Standard Bank Group Ltd. | 6,730 | 83,220 | ||||||
| Tiger Brands Ltd. | 30,449 | 570,614 | ||||||
| Truworths International Ltd. | 55,184 | 325,482 | ||||||
| Vodacom Group Ltd. | 48,827 | 434,584 | ||||||
|
| |||||||
| 5,042,476 | ||||||||
|
| |||||||
| South Korea - 12.8% | ||||||||
| Amorepacific Corp. | 476 | 111,959 | ||||||
| BGF retail Co. Ltd. | 180 | 33,362 | ||||||
| Celltrion, Inc. * | 2,456 | 658,198 | ||||||
| Cheil Worldwide, Inc. | 9,056 | 176,834 | ||||||
| CJ Logistics Corp. * | 192 | 27,345 | ||||||
| Coway Co. Ltd. | 2,743 | 214,619 | ||||||
| DB Insurance Co. Ltd. | 9,486 | 622,529 | ||||||
| The accompanying notes are an integral part of these financial statements. | (Continued) |
| AQR Funds | Annual Report | September 2018 | ||||||||||||||
159
Table of Contents
| Schedule of Investments | September 30, 2018 |
| AQR EMERGING DEFENSIVE STYLE FUND |
| INVESTMENTS | SHARES | VALUE | ||||||
| South Korea - 12.8% (continued) | ||||||||
| E-MART, Inc. | 140 | $ | 26,193 | |||||
| Hanmi Science Co. Ltd. | 1,393 | 110,244 | ||||||
| Hanon Systems | 50,161 | 572,065 | ||||||
| Hanssem Co. Ltd. | 1,290 | 89,090 | ||||||
| Hanwha Life Insurance Co. Ltd. | 16,322 | 77,843 | ||||||
| Hotel Shilla Co. Ltd. | 1,680 | 164,276 | ||||||
| Hyundai Engineering & Construction Co. Ltd. | 2,835 | 172,426 | ||||||
| Hyundai Glovis Co. Ltd. | 2,099 | 245,963 | ||||||
| Hyundai Marine & Fire Insurance Co. Ltd. | 7,322 | 276,781 | ||||||
| Hyundai Mobis Co. Ltd. | 689 | 141,574 | ||||||
| Kangwon Land, Inc. | 14,048 | 363,458 | ||||||
| Kia Motors Corp. | 4,700 | 148,670 | ||||||
| KT Corp. | 1,517 | 41,240 | ||||||
| KT&G Corp. | 4,999 | 468,630 | ||||||
| LG Chem Ltd. | 962 | 316,926 | ||||||
| LG Household & Health Care Ltd. | 270 | 310,532 | ||||||
| Medy-Tox, Inc. | 231 | 128,939 | ||||||
| NAVER Corp. | 206 | 132,965 | ||||||
| NCSoft Corp. | 1,533 | 611,627 | ||||||
| Ottogi Corp. | 51 | 34,342 | ||||||
| S-1 Corp. | 8,200 | 675,623 | ||||||
| Samsung Biologics Co. Ltd. *(b) | 1,023 | 492,291 | ||||||
| Samsung Electronics Co. Ltd. | 20,750 | 868,405 | ||||||
| Samsung Fire & Marine Insurance Co. Ltd. | 1,206 | 308,723 | ||||||
| Samsung Life Insurance Co. Ltd. | 2,063 | 180,956 | ||||||
| Samsung SDS Co. Ltd. | 2,010 | 418,510 | ||||||
| SillaJen, Inc. * | 5,093 | 469,913 | ||||||
| SK Hynix, Inc. | 13,687 | 905,502 | ||||||
| SK Innovation Co. Ltd. | 197 | 38,186 | ||||||
| SK Telecom Co. Ltd. | 1,506 | 381,824 | ||||||
| Woori Bank | 4,221 | 64,274 | ||||||
|
| |||||||
| 11,082,837 | ||||||||
|
| |||||||
| Taiwan - 14.6% | ||||||||
| Advantech Co. Ltd. | 33,998 | 253,040 | ||||||
| Asustek Computer, Inc. | 34,000 | 294,129 | ||||||
| Catcher Technology Co. Ltd. | 5,000 | 54,964 | ||||||
| Chang Hwa Commercial Bank Ltd. | 830,051 | 513,663 | ||||||
| Cheng Shin Rubber Industry Co. Ltd. | 16,000 | 25,150 | ||||||
| Chunghwa Telecom Co. Ltd. | 334,600 | 1,205,210 | ||||||
| CTBC Financial Holding Co. Ltd. | 321,000 | 241,686 | ||||||
| Delta Electronics, Inc. | 10,000 | 42,868 | ||||||
| E.Sun Financial Holding Co. Ltd. | 489,180 | 361,175 | ||||||
| Far EasTone Telecommunications Co. Ltd. | 407,000 | 970,404 | ||||||
| Feng TAY Enterprise Co. Ltd. | 19,040 | 117,255 | ||||||
| First Financial Holding Co. Ltd. | 1,386,394 | 944,182 | ||||||
| Formosa Chemicals & Fibre Corp. | 8,000 | 33,525 | ||||||
| Formosa Petrochemical Corp. | 130,000 | 630,139 | ||||||
| Formosa Plastics Corp. | 10,000 | 38,308 | ||||||
| Fubon Financial Holding Co. Ltd. | 119,000 | 201,841 | ||||||
| Globalwafers Co. Ltd. | 24,000 | 264,481 | ||||||
| Hon Hai Precision Industry Co. Ltd. | 44,583 | 115,612 | ||||||
| Hua Nan Financial Holdings Co. Ltd. | 701,063 | 424,628 | ||||||
| Lite-On Technology Corp. | 31,023 | 38,983 | ||||||
| MediaTek, Inc. | 3,000 | 24,207 | ||||||
| Mega Financial Holding Co. Ltd. | 571,000 | 514,076 | ||||||
| Micro-Star International Co. Ltd. | 75,000 | 202,869 | ||||||
| Nanya Technology Corp. | 11,000 | 21,006 | ||||||
| INVESTMENTS | SHARES | VALUE | ||||||
| Taiwan - 14.6% (continued) | ||||||||
| Nien Made Enterprise Co. Ltd. | 26,000 | $ | 203,486 | |||||
| Novatek Microelectronics Corp. | 28,000 | 138,176 | ||||||
| President Chain Store Corp. | 105,000 | 1,232,776 | ||||||
| Realtek Semiconductor Corp. * | 62,442 | 278,258 | ||||||
| TaiMed Biologics, Inc. * | 7,000 | 43,149 | ||||||
| Taiwan Cooperative Financial Holding Co. Ltd. | 610,176 | 371,648 | ||||||
| Taiwan Mobile Co. Ltd. | 250,000 | 896,405 | ||||||
| Taiwan Semiconductor Manufacturing Co. Ltd., ADR (1) | 29,421 | 1,299,232 | ||||||
| Teco Electric and Machinery Co. Ltd. | 35,000 | 25,385 | ||||||
| Uni-President Enterprises Corp. | 192,172 | 501,378 | ||||||
| United Microelectronics Corp. | 43,000 | 22,687 | ||||||
| Vanguard International Semiconductor Corp. | 38,000 | 84,808 | ||||||
| Win Semiconductors Corp. | 10,000 | 44,025 | ||||||
|
| |||||||
| 12,674,814 | ||||||||
|
| |||||||
| Thailand - 6.6% | ||||||||
| Airports of Thailand PCL, NVDR | 519,900 | 1,052,982 | ||||||
| Bangkok Bank PCL, NVDR | 35,200 | 228,625 | ||||||
| Bangkok Dusit Medical Services PCL, NVDR | 384,900 | 303,475 | ||||||
| BTS Group Holdings PCL, NVDR | 651,100 | 187,255 | ||||||
| Bumrungrad Hospital PCL, NVDR | 144,300 | 829,483 | ||||||
| CP All PCL, NVDR | 12,700 | 27,102 | ||||||
| Delta Electronics Thailand PCL, NVDR | 140,600 | 303,253 | ||||||
| Electricity Generating PCL, NVDR | 16,800 | 122,484 | ||||||
| Glow Energy PCL, NVDR | 104,500 | 284,399 | ||||||
| Home Product Center PCL, NVDR | 1,798,000 | 878,949 | ||||||
| Kasikornbank PCL, NVDR | 50,300 | 335,951 | ||||||
| Krung Thai Bank PCL, NVDR | 299,700 | 187,202 | ||||||
| Robinson PCL, NVDR | 229,600 | 501,043 | ||||||
| Siam Cement PCL (The), NVDR | 3,700 | 51,062 | ||||||
| Siam Commercial Bank PCL (The), NVDR | 96,900 | 446,423 | ||||||
|
| |||||||
| 5,739,688 | ||||||||
|
| |||||||
| Turkey - 0.9% | ||||||||
| BIM Birlesik Magazalar A/S | 46,255 | 622,652 | ||||||
| TAV Havalimanlari Holding A/S | 13,073 | 67,621 | ||||||
| Turkiye Sise ve Cam Fabrikalari A/S | 76,358 | 73,743 | ||||||
|
| |||||||
| 764,016 | ||||||||
|
| |||||||
| United Kingdom - 0.3% | ||||||||
| Mondi Ltd. | 10,770 | 295,765 | ||||||
|
| |||||||
TOTAL COMMON STOCKS | 81,764,392 | |||||||
|
| |||||||
| NO. OF WARRANTS | ||||||||
| WARRANTS - 0.0% | ||||||||
| Thailand - 0.0% | ||||||||
| BTS Group Holdings PCL, expiring 12/31/2019 (3)*(c) | ||||||||
(Cost $—) | 72,344 | — | ||||||
|
| |||||||
| SHARES | ||||||||
| SHORT-TERM INVESTMENTS - 4.7% | ||||||||
| Investment Companies - 4.7% | ||||||||
| Limited Purpose Cash Investment Fund, 2.06% (1)(e) | ||||||||
(Cost $4,053,706) | 4,054,527 | 4,054,121 | ||||||
|
| |||||||
| The accompanying notes are an integral part of these financial statements. | (Continued) |
| AQR Funds | Annual Report | September 2018 | ||||||||||||||
160
Table of Contents
| Schedule of Investments | September 30, 2018 |
| AQR EMERGING DEFENSIVE STYLE FUND |
| INVESTMENTS | SHARES | VALUE | ||||||
| SECURITIES LENDING COLLATERAL - 1.4% | ||||||||
| Investment Companies - 1.4% | ||||||||
| Investments in a Pooled Account through Securities Lending Program with Citibank NA | ||||||||
| BlackRock Liquidity Funds T-Fund Portfolio, Institutional Shares | ||||||||
| 1.97% (1)(e)(f) | 149,880 | $ | 149,880 | |||||
| Limited Purpose Cash Investment Fund | ||||||||
| 2.06% (1)(e)(f) | 1,075,481 | 1,075,374 | ||||||
|
| |||||||
TOTAL SECURITIES LENDING COLLATERAL | 1,225,254 | |||||||
|
| |||||||
TOTAL INVESTMENTS IN SECURITIES | 87,043,767 | |||||||
|
| |||||||
| LIABILITIES IN EXCESS OF OTHER ASSETS - (0.4)% (g) | (377,621) | |||||||
|
| |||||||
NET ASSETS - 100.0% |
| $ | 86,666,146 | |||||
|
| |||||||
| SECTOR | VALUE | % OF NET ASSETS | ||||||
| Communication Services | $ | 10,455,640 | 12.1 | % | ||||
| Consumer Discretionary | 7,022,347 | 8.1 | ||||||
| Consumer Staples | 14,305,478 | 16.5 | ||||||
| Energy | 3,140,281 | 3.6 | ||||||
| Financials | 16,784,542 | 19.4 | ||||||
| Health Care | 6,149,510 | 7.1 | ||||||
| Industrials | 6,250,995 | 7.2 | ||||||
| Information Technology | 8,417,491 | 9.7 | ||||||
| Materials | 2,566,749 | 2.9 | ||||||
| Utilities | 6,671,359 | 7.7 | ||||||
| Short-Term Investments | 4,054,121 | 4.7 | ||||||
| Securities Lending Collateral | 1,225,254 | 1.4 | ||||||
|
|
|
| |||||
Total Investments In Securities At Value | 87,043,767 | 100.4 | ||||||
| Liabilities in Excess of Other Assets (g) | (377,621 | ) | (0.4 | ) | ||||
|
|
|
| |||||
Net Assets | $ | 86,666,146 | 100.0 | % | ||||
|
|
|
| |||||
| * | Non-income producing security. |
| (a) | The security or a portion of this security is on loan at September 30, 2018. The total value of securities on loan at September 30, 2018 was $1,376,799. |
| (b) | Securities exempt from registration under Rule 144A or section 4(2), of the Securities Act of 1933. Under procedures approved by the Board of Trustees, such securities have been determined to be liquid by the investment adviser and may be resold, normally to qualified institutional buyers in transactions exempt from registration. Total value of all such securities at September 30, 2018 amounted to $1,890,038, which represents approximately 2.18% of net assets of the fund. |
| (c) | Security fair valued as of September 30, 2018 in accordance with procedures approved by the Board of Trustees. Total value of all such securities at September 30, 2018 amounted to $1, which represents approximately 0.00% of net assets of the fund. |
| (d) | Security exempt from registration pursuant to Regulation S under the Securities Act of 1933. Regulation S applies to securities offerings that are made outside of the United States and do not involve direct selling efforts in the United States. At September 30, 2018, the value of these securities amounted to $1,418,300 or 1.64% of net assets. |
| (e) | Represents 7-day effective yield as of September 30, 2018. |
| (f) | Represents security, or portion thereof, purchased with the cash collateral received for securities on loan; additional non-cash collateral of $214,878 was received (See Note 3). |
| (g) | Includes appreciation/(depreciation) on futures contracts. |
All securities are Level 2 with respect to ASC 820, unless otherwise noted in parentheses.
| (1) | Level 1 security (See Note 4). |
| (3) | Level 3 security (See Note 4). |
Abbreviations
ADR - American Depositary Receipt
GDR - Global Depositary Receipt
NVDR - Non-Voting Depositary Receipt
PJSC - Public Joint Stock Company
Preference - A special type of equity investment that shares in the earnings of the company, has limited voting rights, and may have a dividend preference. Preference shares may also have liquidation preference.
| The accompanying notes are an integral part of these financial statements. | (Continued) |
| AQR Funds | Annual Report | September 2018 | ||||||||||||||
161
Table of Contents
| Schedule of Investments | September 30, 2018 |
| AQR EMERGING DEFENSIVE STYLE FUND |
Futures contracts outstanding as of September 30, 2018:
Exchange Traded
| DESCRIPTION | NUMBER OF CONTRACTS | EXPIRATION DATE | TRADING CURRENCY | NOTIONAL AMOUNT | VALUE AND UNREALIZED APPRECIATION (DEPRECIATION) | |||||||||||||||
| Long Contracts | ||||||||||||||||||||
| MSCI Emerging Markets E-Mini Index | 68 | 12/2018 | USD | $ | 3,568,980 | $ | 52,103 | |||||||||||||
|
| |||||||||||||||||||
| $ | 52,103 | |||||||||||||||||||
|
| |||||||||||||||||||
USD - United States Dollar
Collateral pledged to, or (received from), each counterparty at September 30, 2018 was as follows:
| COUNTERPARTY | OVER THE COUNTER | EXCHANGE TRADED | TOTAL | |||||||||
| JPMS | ||||||||||||
| Cash | $— | $119,751 | $119,751 | |||||||||
| ||||||||||||
| The accompanying notes are an integral part of these financial statements. |
| AQR Funds | Annual Report | September 2018 | ||||||||||||||
162
Table of Contents
| Schedule of Investments | September 30, 2018 |
| AQR GLOBAL EQUITY FUND |
| INVESTMENTS | SHARES | VALUE | ||||||
| COMMON STOCKS - 88.2% |
| |||||||
| Australia - 1.3% | ||||||||
| ASX Ltd. | 891 | $ | 40,983 | |||||
| Aurizon Holdings Ltd. | 300,669 | 892,670 | ||||||
| BHP Billiton Ltd. | 14,837 | 369,603 | ||||||
| BlueScope Steel Ltd. | 22,904 | 280,912 | ||||||
| Caltex Australia Ltd. | 40,036 | 864,931 | ||||||
| CIMIC Group Ltd. | 15,991 | 593,509 | ||||||
| Crown Resorts Ltd. | 14,618 | 144,568 | ||||||
| CSL Ltd. | 873 | 126,846 | ||||||
| Dexus, REIT | 14,068 | 107,473 | ||||||
| Goodman Group, REIT | 25,367 | 190,293 | ||||||
| GPT Group (The), REIT | 42,925 | 161,668 | ||||||
| LendLease Group | 2,927 | 41,587 | ||||||
| Macquarie Group Ltd. | 1,429 | 129,994 | ||||||
| Mirvac Group, REIT | 95,677 | 166,765 | ||||||
| Rio Tinto plc | 6,451 | 325,398 | ||||||
| Scentre Group, REIT | 45,435 | 130,569 | ||||||
| Stockland, REIT | 49,658 | 149,170 | ||||||
| Vicinity Centres, REIT | 79,436 | 150,710 | ||||||
|
| |||||||
| 4,867,649 | ||||||||
|
| |||||||
| Belgium - 0.7% | ||||||||
| Ageas | 13,688 | 735,848 | ||||||
| UCB SA | 20,535 | 1,845,356 | ||||||
|
| |||||||
| 2,581,204 | ||||||||
|
| |||||||
| Canada - 2.1% | ||||||||
| BlackBerry Ltd. (1) * | 44,320 | 501,652 | ||||||
| Canadian Natural Resources Ltd. (1) | 11,221 | 366,606 | ||||||
| CGI Group, Inc., Class A (1) * | 7,145 | 460,679 | ||||||
| Constellation Software, Inc. (1) | 1,648 | 1,211,928 | ||||||
| Crescent Point Energy Corp. (1) | 1,800 | 11,455 | ||||||
| Finning International, Inc. (1) | 30,670 | 749,149 | ||||||
| Great-West Lifeco, Inc. (1) | 1,345 | 32,634 | ||||||
| Husky Energy, Inc. (1) | 38,608 | 677,915 | ||||||
| Industrial Alliance Insurance & Financial Services, Inc. (1) | 2,730 | 109,166 | ||||||
| Magna International, Inc. (1) | 2,804 | 147,293 | ||||||
| Manulife Financial Corp. (1) | 33,048 | 590,778 | ||||||
| Methanex Corp. (1) | 11,311 | 892,865 | ||||||
| Power Corp. of Canada (1) | 1,646 | 35,758 | ||||||
| RioCan REIT (1) | 6,747 | 128,917 | ||||||
| Suncor Energy, Inc. (1) | 30,745 | 1,189,668 | ||||||
| West Fraser Timber Co. Ltd. (1) | 10,117 | 575,776 | ||||||
|
| |||||||
| 7,682,239 | ||||||||
|
| |||||||
| Chile - 0.0% (a) | ||||||||
| Antofagasta plc | 13,063 | 145,161 | ||||||
|
| |||||||
| China - 0.0% (a) | ||||||||
| Yangzijiang Shipbuilding Holdings Ltd. | 117,000 | 106,071 | ||||||
|
| |||||||
| Denmark - 1.4% | ||||||||
| Carlsberg A/S, Class B | 821 | 98,459 | ||||||
| Danske Bank A/S | 41,516 | 1,088,239 | ||||||
| H Lundbeck A/S | 5,485 | 338,580 | ||||||
| Novo Nordisk A/S, Class B | 74,108 | 3,487,899 | ||||||
| Orsted A/S (b) | 2,628 | 178,580 | ||||||
|
| |||||||
| 5,191,757 | ||||||||
|
| |||||||
| INVESTMENTS | SHARES | VALUE | ||||||
| Finland - 1.1% | ||||||||
| Fortum OYJ | 30,668 | $ | 768,581 | |||||
| Neste OYJ | 6,125 | 504,856 | ||||||
| Orion OYJ, Class B | 2,650 | 100,296 | ||||||
| Sampo OYJ, Class A | 10,729 | 555,215 | ||||||
| UPM-Kymmene OYJ | 51,131 | 2,005,304 | ||||||
|
| |||||||
| 3,934,252 | ||||||||
|
| |||||||
| France - 3.7% | ||||||||
| Aeroports de Paris | 1,274 | 286,843 | ||||||
| Atos SE | 5,553 | 660,735 | ||||||
| AXA SA | 12,775 | 342,315 | ||||||
| Capgemini SE | 5,438 | 684,632 | ||||||
| Cie de Saint-Gobain | 21,303 | 918,180 | ||||||
| Cie Generale des Etablissements Michelin SCA | 6,988 | 834,058 | ||||||
| CNP Assurances | 14,403 | 347,194 | ||||||
| Engie SA | 153,968 | 2,266,756 | ||||||
| Hermes International | 1,349 | 893,745 | ||||||
| Klepierre SA, REIT | 4,718 | 167,652 | ||||||
| Peugeot SA | 57,119 | 1,540,826 | ||||||
| Safran SA | 1,352 | 189,313 | ||||||
| Sanofi | 3,421 | 305,657 | ||||||
| Societe Generale SA | 5,908 | 253,692 | ||||||
| Thales SA | 3,231 | 459,063 | ||||||
| TOTAL SA | 48,869 | 3,177,499 | ||||||
| Unibail-Rodamco-Westfield, REIT | 2,005 | 403,901 | ||||||
|
| |||||||
| 13,732,061 | ||||||||
|
| |||||||
| Germany - 3.5% | ||||||||
| Allianz SE (Registered) | 9,740 | 2,167,800 | ||||||
| BASF SE | 1,122 | 99,559 | ||||||
| Bayer AG (Registered) | 8,999 | 798,217 | ||||||
| Commerzbank AG * | 19,998 | 207,778 | ||||||
| Covestro AG (b) | 45,421 | 3,676,704 | ||||||
| Deutsche Lufthansa AG (Registered) | 36,174 | 887,852 | ||||||
| E.ON SE | 46,540 | 473,579 | ||||||
| Fresenius SE & Co. KGaA | 1,365 | 100,096 | ||||||
| HeidelbergCement AG | 2,122 | 165,745 | ||||||
| Infineon Technologies AG | 5,507 | 125,317 | ||||||
| Linde AG | 1,365 | 322,354 | ||||||
| Porsche Automobil Holding SE (Preference) | 865 | 58,230 | ||||||
| SAP SE | 5,710 | 702,122 | ||||||
| Schaeffler AG (Preference) | 22,678 | 289,268 | ||||||
| TUI AG | 23,465 | 450,120 | ||||||
| United Internet AG (Registered) | 2,050 | 96,924 | ||||||
| Wirecard AG | 11,098 | 2,401,043 | ||||||
|
| |||||||
| 13,022,708 | ||||||||
|
| |||||||
| Hong Kong - 0.8% | ||||||||
| CK Infrastructure Holdings Ltd. | 2,749 | 21,755 | ||||||
| Henderson Land Development Co. Ltd. | 62,700 | 314,884 | ||||||
| Hong Kong Exchanges & Clearing Ltd. | 5,269 | 150,560 | ||||||
| Kerry Properties Ltd. | 154,500 | 524,612 | ||||||
| Li & Fung Ltd. | 990,000 | 221,758 | ||||||
| Link REIT | 18,329 | 180,467 | ||||||
| PCCW Ltd. | 19,406 | 11,307 | ||||||
| Power Assets Holdings Ltd. | 23,000 | 159,872 | ||||||
| Sino Land Co. Ltd. | 214,000 | 366,627 | ||||||
| The accompanying notes are an integral part of these financial statements. | (Continued) |
| AQR Funds | Annual Report | September 2018 | ||||||||||||||
163
Table of Contents
| Schedule of Investments | September 30, 2018 |
| AQR GLOBAL EQUITY FUND |
| INVESTMENTS | SHARES | VALUE | ||||||
| Hong Kong - 0.8% (continued) | ||||||||
| Sun Hung Kai Properties Ltd. | 34,000 | $ | 493,415 | |||||
| Techtronic Industries Co. Ltd. | 25,000 | 159,467 | ||||||
| Wharf Holdings Ltd. (The) | 118,000 | 321,276 | ||||||
| Wharf Real Estate Investment Co. Ltd. | 7,000 | 45,098 | ||||||
| Wheelock & Co. Ltd. | 35,000 | 210,424 | ||||||
|
| |||||||
| 3,181,522 | ||||||||
|
| |||||||
| Italy - 1.5% | ||||||||
| Eni SpA | 210,529 | 3,968,382 | ||||||
| Moncler SpA | 5,624 | 241,986 | ||||||
| Poste Italiane SpA (b) | 37,456 | 298,763 | ||||||
| UniCredit SpA | 75,989 | 1,140,193 | ||||||
|
| |||||||
| 5,649,324 | ||||||||
|
| |||||||
| Japan - 6.8% | ||||||||
| Aeon Mall Co. Ltd. | 700 | 12,017 | ||||||
| Alfresa Holdings Corp. | 6,200 | 166,072 | ||||||
| Alps Electric Co. Ltd. | 5,000 | 127,113 | ||||||
| ANA Holdings, Inc. | 11,800 | 412,228 | ||||||
| Astellas Pharma, Inc. | 78,200 | 1,365,605 | ||||||
| Bandai Namco Holdings, Inc. | 5,200 | 202,025 | ||||||
| Brother Industries Ltd. | 8,500 | 167,834 | ||||||
| Daicel Corp. | 9,000 | 104,544 | ||||||
| Daiichi Sankyo Co. Ltd. | 8,400 | 364,122 | ||||||
| Daito Trust Construction Co. Ltd. | 486 | 62,629 | ||||||
| Daiwa House Industry Co. Ltd. | 2,451 | 72,632 | ||||||
| Fujitsu Ltd. | 1,612 | 114,803 | ||||||
| Hitachi High-Technologies Corp. | 3,258 | 112,493 | ||||||
| Hitachi Ltd. | 37,600 | 1,278,086 | ||||||
| Hulic Co. Ltd. | 1,500 | 14,719 | ||||||
| Idemitsu Kosan Co. Ltd. | 19,500 | 1,032,418 | ||||||
| Inpex Corp. | 24,400 | 304,867 | ||||||
| ITOCHU Corp. | 20,500 | 375,214 | ||||||
| Japan Airlines Co. Ltd. | 46,200 | 1,660,526 | ||||||
| Japan Real Estate Investment Corp., REIT | 30 | 157,314 | ||||||
| Japan Retail Fund Investment Corp., REIT | 64 | 116,146 | ||||||
| JXTG Holdings, Inc. | 230,700 | 1,744,967 | ||||||
| Kajima Corp. | 26,500 | 385,325 | ||||||
| Kamigumi Co. Ltd. | 9,000 | 198,384 | ||||||
| Kao Corp. | 3,500 | 282,722 | ||||||
| Konami Holdings Corp. | 4,800 | 187,950 | ||||||
| Kose Corp. | 1,300 | 247,709 | ||||||
| Marubeni Corp. | 39,900 | 364,910 | ||||||
| McDonald’s Holdings Co. Japan Ltd. | 2,600 | 114,180 | ||||||
| Mitsubishi Corp. | 13,600 | 418,917 | ||||||
| Mitsubishi Electric Corp. | 10,600 | 145,213 | ||||||
| Mitsubishi Estate Co. Ltd. | 5,764 | 97,873 | ||||||
| Mitsubishi Gas Chemical Co., Inc. | 6,300 | 134,114 | ||||||
| Mitsubishi UFJ Financial Group, Inc. | 135,900 | 844,305 | ||||||
| Mitsui & Co. Ltd. | 19,900 | 353,636 | ||||||
| Mitsui Fudosan Co. Ltd. | 4,598 | 108,747 | ||||||
| Mizuho Financial Group, Inc. | 186,400 | 324,858 | ||||||
| MS&AD Insurance Group Holdings, Inc. | 5,200 | 173,701 | ||||||
| Nexon Co. Ltd. * | 45,500 | 594,754 | ||||||
| Nikon Corp. | 28,900 | 543,069 | ||||||
| Nintendo Co. Ltd. | 800 | 291,067 | ||||||
| Nippon Building Fund, Inc., REIT | 21 | 121,427 | ||||||
| Nippon Express Co. Ltd. | 4,600 | 302,099 | ||||||
| Nippon Telegraph & Telephone Corp. | 22,296 | 1,006,226 | ||||||
| INVESTMENTS | SHARES | VALUE | ||||||
| Japan - 6.8% (continued) | ||||||||
| NOK Corp. | 5,700 | $ | 97,842 | |||||
| Nomura Real Estate Holdings, Inc. | 1,000 | 20,173 | ||||||
| Nomura Real Estate Master Fund, Inc., REIT | 117 | 159,953 | ||||||
| Nomura Research Institute Ltd. | 3,400 | 171,693 | ||||||
| NTT DOCOMO, Inc. | 5,300 | 142,451 | ||||||
| Omron Corp. | 6,900 | 291,578 | ||||||
| Oracle Corp. Japan | 3,100 | 249,774 | ||||||
| ORIX Corp. | 44,100 | 714,051 | ||||||
| Otsuka Corp. | 15,500 | 578,151 | ||||||
| Panasonic Corp. | 13,900 | 161,118 | ||||||
| Pola Orbis Holdings, Inc. | 4,400 | 160,702 | ||||||
| Recruit Holdings Co. Ltd. | 12,200 | 407,498 | ||||||
| Resona Holdings, Inc. | 144,800 | 812,975 | ||||||
| Rohm Co. Ltd. | 3,300 | 241,429 | ||||||
| Ryohin Keikaku Co. Ltd. | 600 | 178,344 | ||||||
| Shimadzu Corp. | 9,600 | 300,841 | ||||||
| Shionogi & Co. Ltd. | 2,600 | 169,961 | ||||||
| Shiseido Co. Ltd. | 6,800 | 526,646 | ||||||
| Sony Corp. | 3,000 | 182,363 | ||||||
| Sumitomo Corp. | 6,400 | 106,658 | ||||||
| Sumitomo Heavy Industries Ltd. | 11,100 | 396,176 | ||||||
| Sumitomo Mitsui Financial Group, Inc. | 3,900 | 156,951 | ||||||
| Sumitomo Realty & Development Co. Ltd. | 2,624 | 94,135 | ||||||
| Taisei Corp. | 16,400 | 747,567 | ||||||
| Tokyo Electric Power Co. Holdings, Inc. * | 34,200 | 168,061 | ||||||
| Tokyo Electron Ltd. | 3,500 | 482,372 | ||||||
| Tokyo Tatemono Co. Ltd. | 1,200 | 14,635 | ||||||
| Tokyu Fudosan Holdings Corp. | 2,900 | 20,204 | ||||||
| Tosoh Corp. | 14,600 | 224,868 | ||||||
| Toyota Tsusho Corp. | 4,500 | 169,906 | ||||||
|
| |||||||
| 25,358,636 | ||||||||
|
| |||||||
| Luxembourg - 0.1% | ||||||||
| SES SA, FDR | 13,750 | 301,612 | ||||||
|
| |||||||
| Macau - 0.1% | ||||||||
| Wynn Macau Ltd. | 103,600 | 237,927 | ||||||
|
| |||||||
| Malta - 0.0% (a) | ||||||||
| BGP Holdings plc (3)*(c) | 96,388 | 140 | ||||||
|
| |||||||
| Netherlands - 2.0% | ||||||||
| Aegon NV | 92,070 | 597,584 | ||||||
| ASML Holding NV | 1,683 | 315,991 | ||||||
| ING Groep NV | 19,668 | 255,273 | ||||||
| Koninklijke Ahold Delhaize NV | 105,645 | 2,423,764 | ||||||
| Koninklijke DSM NV | 12,811 | 1,356,856 | ||||||
| Koninklijke Philips NV | 14,576 | 664,396 | ||||||
| NN Group NV | 4,798 | 214,146 | ||||||
| Royal Dutch Shell plc, Class A | 29,075 | 996,937 | ||||||
| Royal Dutch Shell plc, Class B | 22,741 | 796,084 | ||||||
|
| |||||||
| 7,621,031 | ||||||||
|
| |||||||
| Singapore - 0.2% | ||||||||
| ComfortDelGro Corp. Ltd. | 61,300 | 108,945 | ||||||
| Genting Singapore Ltd. | 465,800 | 361,058 | ||||||
| Sembcorp Industries Ltd. | 4,477 | 10,112 | ||||||
| The accompanying notes are an integral part of these financial statements. | (Continued) |
| AQR Funds | Annual Report | September 2018 | ||||||||||||||
164
Table of Contents
| Schedule of Investments | September 30, 2018 |
| AQR GLOBAL EQUITY FUND |
| INVESTMENTS | SHARES | VALUE | ||||||
| Singapore - 0.2% (continued) | ||||||||
| Singapore Airlines Ltd. | 22,000 | $ | 156,712 | |||||
| Singapore Exchange Ltd. | 4,067 | 21,919 | ||||||
|
| |||||||
| 658,746 | ||||||||
|
| |||||||
| South Africa - 0.1% | ||||||||
| Investec plc | 41,947 | 294,263 | ||||||
|
| |||||||
| Spain - 0.7% | ||||||||
| ACS Actividades de Construccion y Servicios SA | 8,719 | 370,321 | ||||||
| Banco Bilbao Vizcaya Argentaria SA | 20,443 | 129,614 | ||||||
| Endesa SA | 30,601 | 660,054 | ||||||
| Mapfre SA | 296,971 | 928,881 | ||||||
| Repsol SA | 29,117 | 579,641 | ||||||
|
| |||||||
| 2,668,511 | ||||||||
|
| |||||||
| Sweden - 0.8% | ||||||||
| Electrolux AB, Series B | 16,648 | 366,742 | ||||||
| Investor AB, Class B | 2,204 | 101,564 | ||||||
| Kinnevik AB, Class B | 1,380 | 41,671 | ||||||
| Sandvik AB | 30,597 | 541,697 | ||||||
| Swedish Match AB | 19,599 | 1,001,810 | ||||||
| Volvo AB, Class B | 51,887 | 915,128 | ||||||
|
| |||||||
| 2,968,612 | ||||||||
|
| |||||||
| Switzerland - 3.2% | ||||||||
| Adecco Group AG (Registered) | 30,030 | 1,578,598 | ||||||
| Barry Callebaut AG (Registered) | 59 | 111,724 | ||||||
| Coca-Cola HBC AG * | 12,053 | 410,636 | ||||||
| Nestle SA (Registered) | 13,772 | 1,146,335 | ||||||
| Novartis AG (Registered) | 13,971 | 1,202,602 | ||||||
| Partners Group Holding AG | 277 | 219,583 | ||||||
| Roche Holding AG | 15,665 | 3,788,038 | ||||||
| Sika AG (Registered) | 1,696 | 246,801 | ||||||
| Sonova Holding AG (Registered) | 2,576 | 511,254 | ||||||
| STMicroelectronics NV | 15,341 | 280,780 | ||||||
| Swiss Life Holding AG (Registered) * | 2,281 | 864,890 | ||||||
| Swiss Re AG | 1,625 | 149,722 | ||||||
| Vifor Pharma AG | 3,066 | 531,554 | ||||||
| Zurich Insurance Group AG | 2,945 | 928,574 | ||||||
|
| |||||||
| 11,971,091 | ||||||||
|
| |||||||
| United Kingdom - 3.6% | ||||||||
| 3i Group plc | 9,545 | 116,877 | ||||||
| Ashtead Group plc | 16,469 | 522,533 | ||||||
| AstraZeneca plc | 3,140 | 244,744 | ||||||
| Aviva plc | 54,011 | 344,616 | ||||||
| Barclays plc | 492,610 | 1,092,621 | ||||||
| Berkeley Group Holdings plc | 25,194 | 1,206,963 | ||||||
| BP plc | 220,181 | 1,687,631 | ||||||
| British Land Co. plc (The), REIT | 12,747 | 102,526 | ||||||
| Burberry Group plc | 48,127 | 1,263,781 | ||||||
| Direct Line Insurance Group plc | 49,995 | 211,019 | ||||||
| easyJet plc | 8,799 | 150,570 | ||||||
| GVC Holdings plc | 25,837 | 309,179 | ||||||
| Hammerson plc, REIT | 17,591 | 104,669 | ||||||
| International Consolidated Airlines Group SA | 103,606 | 888,792 | ||||||
| Land Securities Group plc, REIT | 13,737 | 158,168 | ||||||
| INVESTMENTS | SHARES | VALUE | ||||||
| United Kingdom - 3.6% (continued) | ||||||||
| Meggitt plc | 31,332 | $ | 231,321 | |||||
| Next plc | 5,316 | 380,445 | ||||||
| Persimmon plc | 18,005 | 554,326 | ||||||
| Randgold Resources Ltd. | 867 | 61,322 | ||||||
| Royal Bank of Scotland Group plc | 319,165 | 1,034,126 | ||||||
| Royal Mail plc | 75,306 | 468,131 | ||||||
| Standard Life Aberdeen plc | 301,147 | 1,199,959 | ||||||
| Taylor Wimpey plc | 270,867 | 605,441 | ||||||
| Tesco plc | 32,461 | 101,490 | ||||||
| Unilever plc | 5,942 | 326,419 | ||||||
| Vodafone Group plc | 69,344 | 148,578 | ||||||
|
| |||||||
| 13,516,247 | ||||||||
|
| |||||||
| United States - 54.5% | ||||||||
| AbbVie, Inc. (1) | 6,818 | 644,846 | ||||||
| ABIOMED, Inc. (1)* | 6,558 | 2,949,461 | ||||||
| Accenture plc, Class A (1) | 4,002 | 681,140 | ||||||
| Adobe Systems, Inc. (1)* | 13,729 | 3,706,144 | ||||||
| Aetna, Inc. (1) | 3,218 | 652,771 | ||||||
| Aflac, Inc. (1) | 21,000 | 988,470 | ||||||
| Agilent Technologies, Inc. (1) | 3,516 | 248,019 | ||||||
| Align Technology, Inc. (1)* | 3,262 | 1,276,160 | ||||||
| Allstate Corp. (The) (1) | 16,622 | 1,640,591 | ||||||
| Alphabet, Inc., Class A (1)* | 2,446 | 2,952,518 | ||||||
| Alphabet, Inc., Class C (1)* | 2,378 | 2,838,072 | ||||||
| Amazon.com, Inc. (1)* | 3,041 | 6,091,123 | ||||||
| American Tower Corp., REIT (1) | 4,396 | 638,739 | ||||||
| Ameriprise Financial, Inc. (1) | 2,227 | 328,839 | ||||||
| Amgen, Inc. (1) | 5,649 | 1,170,981 | ||||||
| Anadarko Petroleum Corp. (1) | 28,304 | 1,907,973 | ||||||
| Anthem, Inc. (1) | 5,406 | 1,481,514 | ||||||
| Apple, Inc. (1) | 40,037 | 9,037,952 | ||||||
| Applied Materials, Inc. (1) | 49,054 | 1,895,937 | ||||||
| AutoZone, Inc. (1)* | 729 | 565,485 | ||||||
| AvalonBay Communities, Inc., REIT (1) | 811 | 146,913 | ||||||
| Bausch Health Cos., Inc. (1)* | 4,960 | 127,374 | ||||||
| Baxter International, Inc. (1) | 2,238 | 172,527 | ||||||
| Berkshire Hathaway, Inc., Class B (1)* | 9,984 | 2,137,674 | ||||||
| Best Buy Co., Inc. (1) | 38,533 | 3,057,979 | ||||||
| Biogen, Inc. (1)* | 10,170 | 3,593,163 | ||||||
| Boeing Co. (The) (1) | 12,149 | 4,518,213 | ||||||
| Boston Properties, Inc., REIT (1) | 1,213 | 149,308 | ||||||
| Bristol-Myers Squibb Co. (1) | 20,480 | 1,271,398 | ||||||
| Cadence Design Systems, Inc. (1)* | 10,407 | 471,645 | ||||||
| Caterpillar, Inc. (1) | 711 | 108,420 | ||||||
| Centene Corp. (1)* | 5,545 | 802,805 | ||||||
| Chevron Corp. (1) | 13,604 | 1,663,497 | ||||||
| Cigna Corp. (1) | 9,903 | 2,062,300 | ||||||
| Cisco Systems, Inc. (1) | 63,356 | 3,082,269 | ||||||
| Cognizant Technology Solutions Corp., Class A (1) | 14,045 | 1,083,572 | ||||||
| Comcast Corp., Class A (1) | 9,048 | 320,390 | ||||||
| ConocoPhillips (1) | 32,265 | 2,497,311 | ||||||
| Copart, Inc. (1)* | 6,594 | 339,789 | ||||||
| Costco Wholesale Corp. (1) | 2,854 | 670,348 | ||||||
| Crown Castle International Corp., REIT (1) | 1,970 | 219,320 | ||||||
| Darden Restaurants, Inc. (1) | 18,453 | 2,051,789 | ||||||
| Dell Technologies, Inc., Class V (1)* | 1,353 | 131,403 | ||||||
| Delta Air Lines, Inc. (1) | 15,697 | 907,758 | ||||||
| The accompanying notes are an integral part of these financial statements. | (Continued) |
| AQR Funds | Annual Report | September 2018 | ||||||||||||||
165
Table of Contents
| Schedule of Investments | September 30, 2018 |
| AQR GLOBAL EQUITY FUND |
| INVESTMENTS | SHARES | VALUE | ||||||
| United States - 54.5% (continued) | ||||||||
| Dollar General Corp. (1) | 1,624 | $ | 177,503 | |||||
| DXC Technology Co. (1) | 3,587 | 335,456 | ||||||
| eBay, Inc. (1)* | 10,645 | 351,498 | ||||||
| Electronic Arts, Inc. (1)* | 8,474 | 1,021,032 | ||||||
| Eli Lilly & Co. (1) | 2,789 | 299,288 | ||||||
| Equinix, Inc., REIT (1) | 445 | 192,636 | ||||||
| Equity Residential, REIT (1) | 2,048 | 135,700 | ||||||
| Essex Property Trust, Inc., REIT (1) | 720 | 177,631 | ||||||
| Express Scripts Holding Co. (1)* | 4,465 | 424,220 | ||||||
| Exxon Mobil Corp. (1) | 8,782 | 746,646 | ||||||
| F5 Networks, Inc. (1)* | 1,511 | 301,324 | ||||||
| Facebook, Inc., Class A (1)* | 33,868 | 5,569,931 | ||||||
| Fidelity National Financial, Inc. (1) | 38,455 | 1,513,204 | ||||||
| FLIR Systems, Inc. (1) | 8,075 | 496,370 | ||||||
| Fortinet, Inc. (1)* | 5,824 | 537,380 | ||||||
| Gap, Inc. (The) (1) | 55,805 | 1,609,974 | ||||||
| General Dynamics Corp. (1) | 1,892 | 387,330 | ||||||
| Gilead Sciences, Inc. (1) | 23,005 | 1,776,216 | ||||||
| HCA Healthcare, Inc. (1) | 9,187 | 1,278,095 | ||||||
| HD Supply Holdings, Inc. (1)* | 10,607 | 453,874 | ||||||
| HollyFrontier Corp. (1) | 39,492 | 2,760,491 | ||||||
| Home Depot, Inc. (The) (1) | 8,473 | 1,755,182 | ||||||
| Honeywell International, Inc. (1) | 5,980 | 995,072 | ||||||
| Host Hotels & Resorts, Inc., REIT (1) | 5,400 | 113,940 | ||||||
| HP, Inc. (1) | 39,131 | 1,008,406 | ||||||
| Humana, Inc. (1) | 10,770 | 3,645,860 | ||||||
| Huntington Ingalls Industries, Inc. (1) | 3,693 | 945,703 | ||||||
| IAC/InterActiveCorp (1)* | 3,951 | 856,261 | ||||||
| Intel Corp. (1) | 79,764 | 3,772,040 | ||||||
| International Business Machines Corp. (1) | 10,815 | 1,635,336 | ||||||
| Intuit, Inc. (1) | 3,157 | 717,902 | ||||||
| Intuitive Surgical, Inc. (1)* | 540 | 309,960 | ||||||
| IQVIA Holdings, Inc. (1) * | 1,795 | 232,883 | ||||||
| Johnson & Johnson (1) | 18,743 | 2,589,720 | ||||||
| JPMorgan Chase & Co. (1) | 26,819 | 3,026,256 | ||||||
| KLA-Tencor Corp. (1) | 4,638 | 471,731 | ||||||
| Kohl’s Corp. (1) | 11,937 | 889,903 | ||||||
| Kroger Co. (The) (1) | 30,315 | 882,470 | ||||||
| Lam Research Corp. (1) | 3,647 | 553,250 | ||||||
| Las Vegas Sands Corp. (1) | 6,315 | 374,669 | ||||||
| Lockheed Martin Corp. (1) | 2,739 | 947,584 | ||||||
| Lowe’s Cos., Inc. (1) | 12,621 | 1,449,143 | ||||||
| Lululemon Athletica, Inc. (1)* | 10,120 | 1,644,399 | ||||||
| LyondellBasell Industries NV, Class A (1) | 13,606 | 1,394,751 | ||||||
| Macy’s, Inc. (1) | 40,633 | 1,411,184 | ||||||
| ManpowerGroup, Inc. (1) | 12,687 | 1,090,575 | ||||||
| Marathon Oil Corp. (1) | 15,740 | 366,427 | ||||||
| Marathon Petroleum Corp. (1) | 14,689 | 1,174,679 | ||||||
| Mastercard, Inc., Class A (1) | 4,465 | 993,954 | ||||||
| Maxim Integrated Products, Inc. (1) | 9,285 | 523,581 | ||||||
| McKesson Corp. (1) | 6,475 | 858,909 | ||||||
| Merck & Co., Inc. (1) | 33,037 | 2,343,645 | ||||||
| Michael Kors Holdings Ltd. (1)* | 47,230 | 3,238,089 | ||||||
| Micron Technology, Inc. (1)* | 93,231 | 4,216,838 | ||||||
| Microsoft Corp. (1) | 90,903 | 10,396,576 | ||||||
| NetApp, Inc. (1) | 1,186 | 101,866 | ||||||
| NIKE, Inc., Class B (1) | 10,905 | 923,872 | ||||||
| Norfolk Southern Corp. (1) | 2,984 | 538,612 | ||||||
| Northrop Grumman Corp. (1) | 4,546 | 1,442,764 | ||||||
| INVESTMENTS | SHARES | VALUE | ||||||
| United States - 54.5% (continued) | ||||||||
| NVIDIA Corp. (1) | 8,550 | $ | 2,402,721 | |||||
| NVR, Inc. (1)* | 163 | 402,740 | ||||||
| Old Dominion Freight Line, Inc. (1) | 697 | 112,398 | ||||||
| Oracle Corp. (1) | 3,986 | 205,518 | ||||||
| PayPal Holdings, Inc. (1)* | 2,365 | 207,742 | ||||||
| PepsiCo, Inc. (1) | 1,474 | 164,793 | ||||||
| Pfizer, Inc. (1) | 56,388 | 2,485,019 | ||||||
| Phillips 66 (1) | 10,863 | 1,224,477 | ||||||
| PNC Financial Services Group, Inc. (The) (1) | 8,527 | 1,161,292 | ||||||
| Procter & Gamble Co. (The) (1) | 4,605 | 383,274 | ||||||
| Progressive Corp. (The) (1) | 10,152 | 721,198 | ||||||
| Prologis, Inc., REIT (1) | 2,980 | 202,014 | ||||||
| Public Storage, REIT (1) | 2,236 | 450,845 | ||||||
| Ralph Lauren Corp. (1) | 10,634 | 1,462,707 | ||||||
| Raytheon Co. (1) | 9,452 | 1,953,350 | ||||||
| Reinsurance Group of America, Inc. (1) | 6,562 | 948,603 | ||||||
| ResMed, Inc. (1) | 914 | 105,421 | ||||||
| Robert Half International, Inc. (1) | 18,018 | 1,268,107 | ||||||
| Ross Stores, Inc. (1) | 21,517 | 2,132,335 | ||||||
| S&P Global, Inc. (1) | 1,101 | 215,124 | ||||||
| Seagate Technology plc (1) | 4,782 | 226,428 | ||||||
| Shire plc | 3,495 | 211,154 | ||||||
| Simon Property Group, Inc., REIT (1) | 1,352 | 238,966 | ||||||
| Skyworks Solutions, Inc. (1) | 16,667 | 1,511,864 | ||||||
| Southwest Airlines Co. (1) | 53,226 | 3,323,964 | ||||||
| Steel Dynamics, Inc. (1) | 20,816 | 940,675 | ||||||
| Synchrony Financial (1) | 37,516 | 1,165,997 | ||||||
| T. Rowe Price Group, Inc. (1) | 985 | 107,542 | ||||||
| Target Corp. (1) | 24,450 | 2,156,735 | ||||||
| Texas Instruments, Inc. (1) | 20,677 | 2,218,435 | ||||||
| Tiffany & Co. (1) | 1,023 | 131,936 | ||||||
| TJX Cos., Inc. (The) (1) | 22,727 | 2,545,879 | ||||||
| Total System Services, Inc. (1) | 4,772 | 471,187 | ||||||
| Travelers Cos., Inc. (The) (1) | 3,049 | 395,486 | ||||||
| Twenty-First Century Fox, Inc., Class A (1) | 8,466 | 392,230 | ||||||
| Tyson Foods, Inc., Class A (1) | 3,883 | 231,155 | ||||||
| United Therapeutics Corp. (1)* | 5,592 | 715,105 | ||||||
| UnitedHealth Group, Inc. (1) | 11,208 | 2,981,776 | ||||||
| Valero Energy Corp. (1) | 30,141 | 3,428,539 | ||||||
| Ventas, Inc., REIT (1) | 2,800 | 152,264 | ||||||
| Vertex Pharmaceuticals, Inc. (1)* | 5,074 | 977,963 | ||||||
| VMware, Inc., Class A (1)* | 654 | 102,063 | ||||||
| Walmart, Inc. (1) | 57,663 | 5,415,132 | ||||||
| Waste Management, Inc. (1) | 17,721 | 1,601,270 | ||||||
| Wells Fargo & Co. (1) | 7,687 | 404,029 | ||||||
| Welltower, Inc., REIT (1) | 3,001 | 193,024 | ||||||
| Western Digital Corp. (1) | 2,976 | 174,215 | ||||||
| Weyerhaeuser Co., REIT (1) | 3,285 | 106,007 | ||||||
| WW Grainger, Inc. (1) | 618 | 220,879 | ||||||
|
| |||||||
| 204,615,268 | ||||||||
|
| |||||||
TOTAL COMMON STOCKS |
| 330,306,032 | ||||||
|
| |||||||
| The accompanying notes are an integral part of these financial statements. | (Continued) |
| AQR Funds | Annual Report | September 2018 | ||||||||||||||
166
Table of Contents
| Schedule of Investments | September 30, 2018 |
| AQR GLOBAL EQUITY FUND |
| INVESTMENTS | SHARES | VALUE | ||||||
| SHORT-TERM INVESTMENTS - 9.8% | ||||||||
| Investment Companies - 9.8% | ||||||||
| J.P. Morgan U.S. Treasury Plus Money Market Fund - IM Shares, 2.00% (1)(d)(e) | 10,552,488 | $ | 10,552,488 | |||||
| Limited Purpose Cash Investment Fund, 2.06% (1)(d) | 26,081,059 | 26,078,451 | ||||||
|
| |||||||
TOTAL SHORT-TERM INVESTMENTS |
| 36,630,939 | ||||||
|
| |||||||
TOTAL INVESTMENTS IN SECURITIES |
| 366,936,971 | ||||||
|
| |||||||
| OTHER ASSETS IN EXCESS OF LIABILITIES - 2.0% (f) | 7,562,485 | |||||||
|
| |||||||
NET ASSETS - 100.0% |
| $ | 374,499,456 | |||||
|
| |||||||
| SECTOR | VALUE | % OF NET ASSETS | ||||||
| Communication Services | $ | 16,731,301 | 4.5 | % | ||||
| Consumer Discretionary | 46,170,247 | 12.3 | ||||||
| Consumer Staples | 14,585,585 | 3.9 | ||||||
| Energy | 33,673,899 | 9.0 | ||||||
| Financials | 34,755,099 | 9.3 | ||||||
| Health Care | 53,799,849 | 14.4 | ||||||
| Industrials | 38,625,425 | 10.3 | ||||||
| Information Technology | 65,133,290 | 17.4 | ||||||
| Materials | 13,323,314 | 3.6 | ||||||
| Real Estate | 8,810,784 | 2.3 | ||||||
| Utilities | 4,697,239 | 1.2 | ||||||
| Short-Term Investments | 36,630,939 | 9.8 | ||||||
|
|
|
| |||||
Total Investments In Securities At Value | 366,936,971 | 98.0 | ||||||
| Other Assets in Excess of Liabilities (f) | 7,562,485 | 2.0 | ||||||
|
|
|
| |||||
Net Assets | $ | 374,499,456 | 100.0 | % | ||||
|
|
|
| |||||
| * | Non-income producing security. |
| (a) | Represents less than 0.05% of net assets. |
| (b) | Securities exempt from registration under Rule 144A or section 4(2), of the Securities Act of 1933. Under procedures approved by the Board of Trustees, such securities have been determined to be liquid by the investment adviser and may be resold, normally to qualified institutional buyers in transactions exempt from registration. Total value of all such securities at September 30, 2018 amounted to $4,154,047, which represents approximately 1.11% of net assets of the fund. |
| (c) | Security fair valued as of September 30, 2018 in accordance with procedures approved by the Board of Trustees. Total value of all such securities at September 30, 2018 amounted to $140, which represents approximately 0.00% of net assets of the fund. |
| (d) | Represents 7-day effective yield as of September 30, 2018. |
| (e) | All or a portion of the security pledged as collateral for forward foreign currency exchange and swap contracts. |
| (f) | Includes appreciation/(depreciation) on forward foreign currency exchange, futures and swap contracts. |
All securities are Level 2 with respect to ASC 820, unless otherwise noted in parentheses.
| (1) | Level 1 security (See Note 4). |
| (3) | Level 3 security (See Note 4). |
Abbreviations
FDR - Fiduciary Depositary Receipt
OYJ - Public Traded Company
Preference - A special type of equity investment that shares in the earnings of the company, has limited voting rights, and may have a dividend preference. Preference shares may also have liquidation preference.
REIT - Real Estate Investment Trust
SCA - Limited partnership with share capital
Total return swap contracts outstanding as of September 30, 2018:
Over the Counter
| REFERENCE ENTITY | PAYMENTS MADE BY | PAYMENTS RECEIVED BY FUND | PAYMENT FREQUENCY | COUNTERPARTY | MATURITY DATE | NOTIONAL AMOUNT | VALUE AND UNREALIZED APPRECIATION (DEPRECIATION) | |||||||||||||
| Hang Seng Index October Futures | Decreases in total return of reference entity | Increases in total return of reference entity | At termination | GSIN | 10/30/2018 | HKD 61,329,400 | $48,960 | |||||||||||||
| The accompanying notes are an integral part of these financial statements. | (Continued) |
| AQR Funds | Annual Report | September 2018 | ||||||||||||||
167
Table of Contents
| Schedule of Investments | September 30, 2018 |
| AQR GLOBAL EQUITY FUND |
| REFERENCE ENTITY | PAYMENTS MADE BY | PAYMENTS RECEIVED BY FUND | PAYMENT FREQUENCY | COUNTERPARTY | MATURITY DATE | NOTIONAL AMOUNT | VALUE AND UNREALIZED APPRECIATION (DEPRECIATION) | |||||||||||||
| MSCI Hong Kong Net Return Index | Decreases in total return of reference entity and pays the Hong Kong Interbank Offered Rate (“HIBOR”) plus or minus a specified spread (0.15%) | Increases in total return of reference entity | Monthly | JPMC | 12/21/2018 | HKD 20,245,418 | $ 33,913 | |||||||||||||
| MSCI Japan Net Return Index | Decreases in total return of reference entity and pays the London Interbank Offered Rate (“LIBOR”) plus or minus a specified spread (0.10%) | Increases in total return of reference entity | Monthly | JPMC | 12/25/2018 | JPY 2,367,438,740 | 1,183,604 | |||||||||||||
| MSCI Singapore Net Return Index | Decreases in total return of reference entity and pays the Singapore Swap Offered Rate (“SOR”) plus or minus a specified spread (0.60%) | Increases in total return of reference entity | Monthly | JPMC | 12/24/2018 | SGD 1,090,101 | 26,515 | |||||||||||||
| MSCI Singapore Net Return Index | Decreases in total return of reference entity and pays the SOR plus or minus a specified spread (0.60%) | Increases in total return of reference entity | Monthly | JPMC | 12/24/2018 | SGD 33,178 | 1,083 | |||||||||||||
|
| |||||||||||||||||||
| 1,294,075 | ||||||||||||||||||||
|
| |||||||||||||||||||
| MSCI Italy Net Return Index | Decreases in total return of reference entity and pays the Euro Interbank Offered Rate (“EURIBOR”) plus or minus a specified spread (0.05%) | Increases in total return of reference entity | Monthly | JPMC | 12/21/2018 | EUR 5,638,213 | (32,572 | ) | ||||||||||||
| The accompanying notes are an integral part of these financial statements. | (Continued) |
| AQR Funds | Annual Report | September 2018 | ||||||||||||||
168
Table of Contents
| Schedule of Investments | September 30, 2018 |
| AQR GLOBAL EQUITY FUND |
| REFERENCE ENTITY | PAYMENTS MADE BY | PAYMENTS RECEIVED BY FUND | PAYMENT FREQUENCY | COUNTERPARTY | MATURITY DATE | NOTIONAL AMOUNT | VALUE AND UNREALIZED APPRECIATION (DEPRECIATION) | |||||||||||||
| MSCI Spain Net Return Index | Increases in total return of reference entity | Decreases in total return of reference entity and receives the EURIBOR plus or minus a specified spread (-0.70%) | Monthly | JPMC | 12/19/2018 | EUR (184,460 | ) | $ (912 | ) | |||||||||||
| MSCI Sweden Net Return Index | Increases in total return of reference entity | Decreases in total return of reference entity and receives the Stockholm Interbank Offered Rate (“STIBOR”) plus or minus a specified spread (-0.8%) | Monthly | JPMC | 12/19/2018 | SEK (22,772,531 | ) | (44,775 | ) | |||||||||||
| Swiss Market Index December Futures | Increases in total return of reference entity | Decreases in total return of reference entity | At termination | GSIN | 12/21/2018 | CHF (6,255,540 | ) | (118,678 | ) | |||||||||||
|
| |||||||||||||||||||
| (196,937 | ) | |||||||||||||||||||
|
| |||||||||||||||||||
| $1,097,138 | ||||||||||||||||||||
|
| |||||||||||||||||||
Futures contracts outstanding as of September 30, 2018:
Exchange Traded
| DESCRIPTION | NUMBER OF CONTRACTS | EXPIRATION DATE | TRADING CURRENCY | NOTIONAL AMOUNT | VALUE AND UNREALIZED APPRECIATION (DEPRECIATION) | |||||||||||||
| Long Contracts |
| |||||||||||||||||
| Hang Seng Index | 10 | 10/2018 | HKD | $1,780,516 | $(4,265 | ) | ||||||||||||
| MSCI Singapore Index | 1 | 10/2018 | SGD | 27,084 | 415 | |||||||||||||
| DAX Index | 27 | 12/2018 | EUR | 9,593,771 | 48,390 | |||||||||||||
| FTSE 100 Index | 19 | 12/2018 | GBP | 1,854,002 | 8,697 | |||||||||||||
| FTSE/MIB Index | 35 | 12/2018 | EUR | 4,202,043 | (49,802 | ) | ||||||||||||
| TOPIX Index | 169 | 12/2018 | JPY | 27,033,752 | 2,079,964 | |||||||||||||
|
| |||||||||||||||||
| 2,083,399 | ||||||||||||||||||
|
| |||||||||||||||||
| Short Contracts |
| |||||||||||||||||
| Amsterdam Exchange Index | (3 | ) | 10/2018 | EUR | (382,763 | ) | (6,147 | ) | ||||||||||
| CAC 40 10 Euro Index | (24 | ) | 10/2018 | EUR | (1,529,660 | ) | (10,768 | ) | ||||||||||
| IBEX 35 Index | (40 | ) | 10/2018 | EUR | (4,350,687 | ) | 10,934 | |||||||||||
| OMXS30 Index | (319 | ) | 10/2018 | SEK | (5,958,323 | ) | (122,326 | ) | ||||||||||
| S&P 500 E-Mini Index | (99 | ) | 12/2018 | USD | (14,449,050 | ) | (20,264 | ) | ||||||||||
| S&P/TSX 60 Index | (4 | ) | 12/2018 | CAD | (588,581 | ) | (325 | ) | ||||||||||
| SPI 200 Index | (124 | ) | 12/2018 | AUD | (13,879,731 | ) | (78,020 | ) | ||||||||||
|
| |||||||||||||||||
| (226,916 | ) | |||||||||||||||||
|
| |||||||||||||||||
| $1,856,483 | ||||||||||||||||||
|
| |||||||||||||||||
| The accompanying notes are an integral part of these financial statements. | (Continued) |
| AQR Funds | Annual Report | September 2018 | ||||||||||||||
169
Table of Contents
| Schedule of Investments | September 30, 2018 |
| AQR GLOBAL EQUITY FUND |
Forward foreign currency contracts outstanding as of September 30, 2018:
Over the Counter
| CURRENCY PURCHASED | CURRENCY SOLD | COUNTERPARTY | SETTLEMENT DATE | UNREALIZED APPRECIATION (DEPRECIATION) | ||||||||||||||||
| AUD | 7,343,722 | USD | 5,266,356 | CITG | 12/19/2018 | $45,320 | ||||||||||||||
| AUD | 11,015,583 | USD | 7,899,544 | JPMC | 12/19/2018 | 67,971 | ||||||||||||||
| CAD | 24,440,670 | USD | 18,700,348 | CITG | 12/19/2018 | 254,565 | ||||||||||||||
| CAD | 36,661,003 | USD | 28,050,556 | JPMC | 12/19/2018 | 381,811 | ||||||||||||||
| DKK | 316,400 | USD | 49,515 | CITG | 12/19/2018 | 103 | ||||||||||||||
| DKK | 474,600 | USD | 74,273 | JPMC | 12/19/2018 | 154 | ||||||||||||||
| GBP | 3,154,066 | USD | 4,091,555 | CITG | 12/19/2018 | 35,408 | ||||||||||||||
| GBP | 4,731,097 | USD | 6,137,338 | JPMC | 12/19/2018 | 53,105 | ||||||||||||||
| HKD | 5,470,800 | USD | 698,476 | CITG | 12/19/2018 | 1,174 | ||||||||||||||
| HKD | 8,206,200 | USD | 1,047,716 | JPMC | 12/19/2018 | 1,759 | ||||||||||||||
| NZD | 1,374,950 | USD | 903,172 | CITG | 12/19/2018 | 8,637 | ||||||||||||||
| NZD | 2,062,426 | USD | 1,354,760 | JPMC | 12/19/2018 | 12,952 | ||||||||||||||
| SEK | 9,738,000 | USD | 1,077,031 | CITG | 12/19/2018 | 26,427 | ||||||||||||||
| SEK | 14,607,000 | USD | 1,615,549 | JPMC | 12/19/2018 | 39,639 | ||||||||||||||
| SGD | 20,000 | USD | 14,601 | CITG | 12/19/2018 | 54 | ||||||||||||||
| SGD | 30,000 | USD | 21,902 | JPMC | 12/19/2018 | 81 | ||||||||||||||
| USD | 1,106,509 | AUD | 1,508,800 | CITG | 12/19/2018 | 15,202 | ||||||||||||||
| USD | 1,659,761 | AUD | 2,263,200 | JPMC | 12/19/2018 | 22,800 | ||||||||||||||
| USD | 21,770,116 | CHF | 20,983,990 | CITG | 12/19/2018 | 222,812 | ||||||||||||||
| USD | 32,655,132 | CHF | 31,475,985 | JPMC | 12/19/2018 | 334,177 | ||||||||||||||
| USD | 69,971 | DKK | 442,000 | CITG | 12/19/2018 | 657 | ||||||||||||||
| USD | 104,957 | DKK | 663,000 | JPMC | 12/19/2018 | 985 | ||||||||||||||
| USD | 16,519,637 | EUR | 14,053,232 | CITG | 12/19/2018 | 92,731 | ||||||||||||||
| USD | 24,779,426 | EUR | 21,079,849 | JPMC | 12/19/2018 | 139,064 | ||||||||||||||
| USD | 5,294,282 | GBP | 4,022,400 | CITG | 12/19/2018 | 31,140 | ||||||||||||||
| USD | 7,941,413 | GBP | 6,033,600 | JPMC | 12/19/2018 | 46,700 | ||||||||||||||
| USD | 144,891 | HKD | 1,130,800 | CITG | 12/19/2018 | 276 | ||||||||||||||
| USD | 217,337 | HKD | 1,696,200 | JPMC | 12/19/2018 | 413 | ||||||||||||||
| USD | 2,357 | ILS | 8,400 | CITG | 12/19/2018 | 34 | ||||||||||||||
| USD | 3,536 | ILS | 12,600 | JPMC | 12/19/2018 | 50 | ||||||||||||||
| USD | 2,556,598 | JPY | 283,029,200 | CITG | 12/19/2018 | 49,287 | ||||||||||||||
| USD | 3,834,892 | JPY | 424,543,800 | JPMC | 12/19/2018 | 73,926 | ||||||||||||||
| USD | 287,622 | SEK | 2,508,800 | CITG | 12/19/2018 | 3,338 | ||||||||||||||
| USD | 431,432 | SEK | 3,763,200 | JPMC | 12/19/2018 | 5,006 | ||||||||||||||
| USD | 9,384 | SGD | 12,800 | CITG | 12/19/2018 | 4 | ||||||||||||||
| USD | 14,076 | SGD | 19,200 | JPMC | 12/19/2018 | 6 | ||||||||||||||
|
| |||||||||||||||||||
| Total unrealized appreciation | 1,967,768 | |||||||||||||||||||
|
| |||||||||||||||||||
| AUD | 7,589,478 | USD | 5,547,529 | CITG | 12/19/2018 | (58,095 | ) | |||||||||||||
| AUD | 11,384,217 | USD | 8,321,303 | JPMC | 12/19/2018 | (87,157 | ) | |||||||||||||
| CAD | 2,027,730 | USD | 1,575,890 | CITG | 12/19/2018 | (3,288 | ) | |||||||||||||
| CAD | 3,041,595 | USD | 2,363,839 | JPMC | 12/19/2018 | (4,936 | ) | |||||||||||||
| CHF | 8,444,800 | USD | 8,804,945 | CITG | 12/19/2018 | (133,447 | ) | |||||||||||||
| CHF | 12,667,200 | USD | 13,205,603 | JPMC | 12/19/2018 | (198,352 | ) | |||||||||||||
| DKK | 495,200 | USD | 78,445 | CITG | 12/19/2018 | (788 | ) | |||||||||||||
| DKK | 742,800 | USD | 117,668 | JPMC | 12/19/2018 | (1,182 | ) | |||||||||||||
| EUR | 443,200 | USD | 525,787 | CITG | 12/19/2018 | (7,728 | ) | |||||||||||||
| EUR | 664,800 | USD | 788,681 | JPMC | 12/19/2018 | (11,593 | ) | |||||||||||||
| GBP | 493,134 | USD | 648,018 | CITG | 12/19/2018 | (2,772 | ) | |||||||||||||
| GBP | 739,700 | USD | 972,026 | JPMC | 12/19/2018 | (4,160 | ) | |||||||||||||
| ILS | 1,056,000 | USD | 293,355 | CITG | 12/19/2018 | (1,223 | ) | |||||||||||||
| ILS | 1,583,999 | USD | 440,032 | JPMC | 12/19/2018 | (1,837 | ) | |||||||||||||
| JPY | 1,182,106,800 | USD | 10,710,185 | CITG | 12/19/2018 | (238,092 | ) | |||||||||||||
| The accompanying notes are an integral part of these financial statements. | (Continued) |
| AQR Funds | Annual Report | September 2018 | ||||||||||||||
170
Table of Contents
| Schedule of Investments | September 30, 2018 |
| AQR GLOBAL EQUITY FUND |
| CURRENCY PURCHASED | CURRENCY SOLD | COUNTERPARTY | SETTLEMENT DATE | UNREALIZED APPRECIATION (DEPRECIATION) | ||||||||||||||||
| JPY | 1,773,160,200 | USD | 16,065,298 | JPMC | 12/19/2018 | $ (357,152 | ) | |||||||||||||
| NZD | 3,275,850 | USD | 2,191,863 | CITG | 12/19/2018 | (19,460 | ) | |||||||||||||
| NZD | 4,913,775 | USD | 3,287,798 | JPMC | 12/19/2018 | (29,194 | ) | |||||||||||||
| SGD | 544,000 | USD | 399,731 | CITG | 12/19/2018 | (1,103 | ) | |||||||||||||
| SGD | 816,000 | USD | 599,597 | JPMC | 12/19/2018 | (1,655 | ) | |||||||||||||
| USD | 491,138 | CAD | 634,800 | CITG | 12/19/2018 | (1,179 | ) | |||||||||||||
| USD | 736,707 | �� | CAD | 952,200 | JPMC | 12/19/2018 | (1,770 | ) | ||||||||||||
| USD | 1,939,823 | CHF | 1,890,810 | CITG | 12/19/2018 | (1,745 | ) | |||||||||||||
| USD | 2,909,732 | CHF | 2,836,215 | JPMC | 12/19/2018 | (2,621 | ) | |||||||||||||
| USD | 1,268,171 | DKK | 8,102,800 | CITG | 12/19/2018 | (2,510 | ) | |||||||||||||
| USD | 1,902,254 | DKK | 12,154,200 | JPMC | 12/19/2018 | (3,767 | ) | |||||||||||||
| USD | 7,100,299 | EUR | 6,088,768 | CITG | 12/19/2018 | (16,899 | ) | |||||||||||||
| USD | 10,650,434 | EUR | 9,133,151 | JPMC | 12/19/2018 | (25,361 | ) | |||||||||||||
| USD | 3,702,504 | GBP | 2,861,600 | CITG | 12/19/2018 | (41,778 | ) | |||||||||||||
| USD | 5,554,788 | GBP | 4,292,400 | JPMC | 12/19/2018 | (61,636 | ) | |||||||||||||
| USD | 157,376 | HKD | 1,233,200 | CITG | 12/19/2018 | (336 | ) | |||||||||||||
| USD | 236,064 | HKD | 1,849,800 | JPMC | 12/19/2018 | (503 | ) | |||||||||||||
| USD | 6,068,418 | NOK | 50,476,800 | CITG | 12/19/2018 | (155,096 | ) | |||||||||||||
| USD | 9,102,616 | NOK | 75,715,199 | JPMC | 12/19/2018 | (232,655 | ) | |||||||||||||
| USD | 12,238,562 | SEK | 110,480,005 | CITG | 12/19/2018 | (280,448 | ) | |||||||||||||
| USD | 18,357,819 | SEK | 165,719,996 | JPMC | 12/19/2018 | (420,695 | ) | |||||||||||||
| USD | 62,067 | SGD | 85,200 | CITG | 12/19/2018 | (365 | ) | |||||||||||||
| USD | 93,101 | SGD | 127,800 | JPMC | 12/19/2018 | (547 | ) | |||||||||||||
|
| |||||||||||||||||||
| Total unrealized depreciation | (2,413,125 | ) | ||||||||||||||||||
|
| |||||||||||||||||||
| Net unrealized depreciation | $ | (445,357 | ) | |||||||||||||||||
|
| |||||||||||||||||||
AUD - Australian Dollar
CAD - Canadian Dollar
CHF - Swiss Franc
DKK - Danish Krone
EUR - Euro
GBP - British Pound
HKD - Hong Kong Dollar
ILS - Israeli Shekel
JPY - Japanese Yen
NOK - Norwegian Krone
NZD - New Zealand Dollar
SEK - Swedish Krona
SGD - Singapore Dollar
USD - United States Dollar
Collateral pledged to, or (received from), each counterparty at September 30, 2018 was as follows:
| COUNTERPARTY | OVER THE COUNTER | EXCHANGE TRADED | TOTAL | |||||||||
| BARC | ||||||||||||
| Cash | $— | $2,480,973 | $2,480,973 | |||||||||
| ||||||||||||
| GSIN | ||||||||||||
| Investment Companies | 280,585 | — | 280,585 | |||||||||
| ||||||||||||
| CITG | ||||||||||||
| Investment Companies | 810,710 | — | 810,710 | |||||||||
| ||||||||||||
| JPMC | ||||||||||||
| Investment Companies | 9,461,193 | — | 9,461,193 | |||||||||
| ||||||||||||
| The accompanying notes are an integral part of these financial statements. |
| AQR Funds | Annual Report | September 2018 | ||||||||||||||
171
Table of Contents
| Schedule of Investments | September 30, 2018 |
| AQR INTERNATIONAL EQUITY FUND |
| INVESTMENTS | SHARES | VALUE | ||||||
| COMMON STOCKS - 87.4% | ||||||||
| Australia - 6.6% | ||||||||
| Alumina Ltd. | 323,755 | $ | 648,103 | |||||
| ASX Ltd. | 5,022 | 230,996 | ||||||
| Aurizon Holdings Ltd. | 545,197 | 1,618,659 | ||||||
| Australia & New Zealand Banking Group Ltd. | 44,842 | 912,834 | ||||||
| BHP Billiton Ltd. | 92,900 | 2,314,223 | ||||||
| BHP Billiton plc | 57,482 | 1,254,349 | ||||||
| BlueScope Steel Ltd. | 177,824 | 2,180,966 | ||||||
| Caltex Australia Ltd. | 113,850 | 2,459,595 | ||||||
| CIMIC Group Ltd. | 84,208 | 3,125,397 | ||||||
| Crown Resorts Ltd. | 81,040 | 801,462 | ||||||
| CSL Ltd. | 3,018 | 438,514 | ||||||
| Dexus, REIT | 23,093 | 176,420 | ||||||
| Goodman Group, REIT | 54,028 | 405,296 | ||||||
| GPT Group (The), REIT | 55,477 | 208,943 | ||||||
| LendLease Group | 24,576 | 349,175 | ||||||
| Macquarie Group Ltd. | 3,979 | 361,963 | ||||||
| Mirvac Group, REIT | 104,753 | 182,585 | ||||||
| Newcrest Mining Ltd. | 121,611 | 1,707,696 | ||||||
| Rio Tinto Ltd. | 12,593 | 716,195 | ||||||
| Rio Tinto plc | 113,464 | 5,723,301 | ||||||
| Scentre Group, REIT | 147,628 | 424,247 | ||||||
| South32 Ltd. | 873,545 | 2,454,928 | ||||||
| Stockland, REIT | 62,453 | 187,606 | ||||||
| Vicinity Centres, REIT | 94,695 | 179,660 | ||||||
| Wesfarmers Ltd. | 11,060 | 398,262 | ||||||
| Woodside Petroleum Ltd. | 7,058 | 196,896 | ||||||
|
| |||||||
| 29,658,271 | ||||||||
|
| |||||||
| Belgium - 1.7% | ||||||||
| Ageas | 48,984 | 2,633,314 | ||||||
| Groupe Bruxelles Lambert SA | 1,290 | 135,222 | ||||||
| KBC Group NV | 6,844 | 508,909 | ||||||
| UCB SA | 46,103 | 4,142,997 | ||||||
|
| |||||||
| 7,420,442 | ||||||||
|
| |||||||
| Chile - 0.4% | ||||||||
| Antofagasta plc | 141,752 | 1,575,199 | ||||||
|
| |||||||
| China - 0.1% | ||||||||
| Yangzijiang Shipbuilding Holdings Ltd. | 332,100 | 301,077 | ||||||
|
| |||||||
| Denmark - 2.3% | ||||||||
| Coloplast A/S, Class B | 16,453 | 1,680,763 | ||||||
| Danske Bank A/S | 19,842 | 520,109 | ||||||
| H Lundbeck A/S | 7,652 | 472,346 | ||||||
| Novo Nordisk A/S, Class B | 164,957 | 7,763,713 | ||||||
| Orsted A/S (a) | 1,795 | 121,976 | ||||||
|
| |||||||
| 10,558,907 | ||||||||
|
| |||||||
| Finland - 1.7% | ||||||||
| Fortum OYJ | 78,985 | 1,979,471 | ||||||
| Neste OYJ | 15,635 | 1,288,721 | ||||||
| Sampo OYJ, Class A | 3,243 | 167,822 | ||||||
| UPM-Kymmene OYJ | 109,836 | 4,307,653 | ||||||
|
| |||||||
| 7,743,667 | ||||||||
|
| |||||||
| France - 9.7% | ||||||||
| Atos SE | 24,468 | 2,911,374 | ||||||
| INVESTMENTS | SHARES | VALUE | ||||||
| France - 9.7% (continued) | ||||||||
| AXA SA | 60,641 | $ | 1,624,918 | |||||
| BNP Paribas SA | 30,408 | 1,862,083 | ||||||
| Capgemini SE | 11,872 | 1,494,659 | ||||||
| Cie Generale des Etablissements Michelin SCA | 8,909 | 1,063,341 | ||||||
| CNP Assurances | 27,886 | 672,211 | ||||||
| Credit Agricole SA | 31,352 | 450,685 | ||||||
| Dassault Aviation SA | 106 | 196,174 | ||||||
| Dassault Systemes SE | 4,903 | 733,672 | ||||||
| Engie SA | 318,409 | 4,687,697 | ||||||
| Essilor International Cie Generale d’Optique SA | 1,483 | 219,513 | ||||||
| Hermes International | 2,667 | 1,766,952 | ||||||
| Ipsen SA | 1,121 | 188,724 | ||||||
| Kering SA | 1,464 | 785,224 | ||||||
| Klepierre SA, REIT | 3,302 | 117,335 | ||||||
| L’Oreal SA | 3,439 | 829,099 | ||||||
| Natixis SA | 91,592 | 621,989 | ||||||
| Pernod Ricard SA | 2,708 | 444,133 | ||||||
| Peugeot SA | 149,386 | 4,029,795 | ||||||
| Renault SA | 6,509 | 563,041 | ||||||
| Safran SA | 17,080 | 2,391,611 | ||||||
| Sanofi | 14,125 | 1,262,030 | ||||||
| Schneider Electric SE | 1,683 | 135,140 | ||||||
| Societe Generale SA | 18,458 | 792,594 | ||||||
| Thales SA | 31,320 | 4,449,969 | ||||||
| TOTAL SA | 130,702 | 8,498,342 | ||||||
| Ubisoft Entertainment SA * | 1,105 | 119,319 | ||||||
| Unibail-Rodamco-Westfield, REIT | 3,742 | 753,813 | ||||||
|
| |||||||
| 43,665,437 | ||||||||
|
| |||||||
| Germany - 8.9% | ||||||||
| adidas AG | 6,286 | 1,537,302 | ||||||
| Allianz SE (Registered) | 25,187 | 5,605,789 | ||||||
| BASF SE | 16,677 | 1,479,803 | ||||||
| Bayer AG (Registered) | 24,080 | 2,135,912 | ||||||
| Continental AG | 2,445 | 424,806 | ||||||
| Covestro AG (a) | 75,680 | 6,126,087 | ||||||
| Deutsche Boerse AG | 5,074 | 678,428 | ||||||
| Deutsche Lufthansa AG (Registered) | 99,286 | 2,436,868 | ||||||
| Deutsche Wohnen SE | 9,934 | 477,147 | ||||||
| E.ON SE | 119,355 | 1,214,526 | ||||||
| Fresenius Medical Care AG & Co. KGaA | 1,245 | 127,916 | ||||||
| Fresenius SE & Co. KGaA | 10,315 | 756,402 | ||||||
| Hannover Rueck SE | 2,823 | 398,462 | ||||||
| Infineon Technologies AG | 113,246 | 2,577,011 | ||||||
| Linde AG | 5,612 | 1,325,314 | ||||||
| Porsche Automobil Holding SE (Preference) | 4,664 | 313,969 | ||||||
| SAP SE | 56,483 | 6,945,350 | ||||||
| Schaeffler AG (Preference) | 64,985 | 828,913 | ||||||
| TUI AG | 35,934 | 689,308 | ||||||
| Vonovia SE | 7,064 | 345,488 | ||||||
| Wirecard AG | 17,265 | 3,735,268 | ||||||
|
| |||||||
| 40,160,069 | ||||||||
|
| |||||||
| Hong Kong - 2.2% | ||||||||
| CK Asset Holdings Ltd. | 25,500 | 191,153 | ||||||
| CK Infrastructure Holdings Ltd. | 17,827 | 141,082 | ||||||
| The accompanying notes are an integral part of these financial statements. | (Continued) |
| AQR Funds | Annual Report | September 2018 | ||||||||||||||
172
Table of Contents
| Schedule of Investments | September 30, 2018 |
| AQR INTERNATIONAL EQUITY FUND |
| INVESTMENTS | SHARES | VALUE | ||||||
| Hong Kong - 2.2% (continued) | ||||||||
| CLP Holdings Ltd. (b) | 20,500 | $ | 240,070 | |||||
| Henderson Land Development Co. Ltd. | 156,800 | 787,461 | ||||||
| Hong Kong Exchanges & Clearing Ltd. | 32,254 | 921,645 | ||||||
| Kerry Properties Ltd. | 332,500 | 1,129,021 | ||||||
| Li & Fung Ltd. | 3,178,000 | 711,867 | ||||||
| Link, REIT | 67,882 | 668,363 | ||||||
| NWS Holdings Ltd. | 67,000 | 132,435 | ||||||
| PCCW Ltd. | 64,000 | 37,289 | ||||||
| Sino Land Co. Ltd. | 620,000 | 1,062,191 | ||||||
| Sun Hung Kai Properties Ltd. | 105,000 | 1,523,781 | ||||||
| Wharf Holdings Ltd. (The) | 152,000 | 413,846 | ||||||
| Wharf Real Estate Investment Co. Ltd. | 42,000 | 270,587 | ||||||
| Wheelock & Co. Ltd. | 149,000 | 895,806 | ||||||
| Yue Yuen Industrial Holdings Ltd. | 260,000 | 722,796 | ||||||
|
| |||||||
| 9,849,393 | ||||||||
|
| |||||||
| Italy - 2.7% | ||||||||
| Enel SpA | 281,694 | 1,439,886 | ||||||
| Eni SpA | 371,953 | 7,011,157 | ||||||
| Intesa Sanpaolo SpA | 411,610 | 1,048,754 | ||||||
| Moncler SpA | 33,101 | 1,424,251 | ||||||
| Poste Italiane SpA (a) | 21,698 | 173,071 | ||||||
| UniCredit SpA | 73,669 | 1,105,382 | ||||||
|
| |||||||
| 12,202,501 | ||||||||
|
| |||||||
| Japan - 20.6% | ||||||||
| Alfresa Holdings Corp. | 20,600 | 551,787 | ||||||
| Alps Electric Co. Ltd. | 40,600 | 1,032,159 | ||||||
| ANA Holdings, Inc. | 10,400 | 363,320 | ||||||
| Asahi Kasei Corp. | 16,600 | 251,691 | ||||||
| Astellas Pharma, Inc. | 354,200 | 6,185,384 | ||||||
| Bandai Namco Holdings, Inc. | 55,500 | 2,156,223 | ||||||
| Brother Industries Ltd. | 48,300 | 953,693 | ||||||
| Credit Saison Co. Ltd. | 7,200 | 117,428 | ||||||
| CyberAgent, Inc. | 5,500 | 292,692 | ||||||
| Daiichi Sankyo Co. Ltd. | 23,700 | 1,027,345 | ||||||
| Daito Trust Construction Co. Ltd. | 2,487 | 320,490 | ||||||
| Daiwa House Industry Co. Ltd. | 8,395 | 248,776 | ||||||
| Eisai Co. Ltd. | 23,800 | 2,318,530 | ||||||
| Fast Retailing Co. Ltd. | 2,100 | 1,063,857 | ||||||
| Fuji Electric Co. Ltd. | 12,000 | 480,683 | ||||||
| Fujitsu Ltd. | 13,100 | 933,240 | ||||||
| Hikari Tsushin, Inc. | 600 | 118,580 | ||||||
| Hitachi Construction Machinery Co. Ltd. | 8,600 | 287,517 | ||||||
| Hitachi High-Technologies Corp. | 29,300 | 1,011,679 | ||||||
| Hitachi Ltd. | 121,800 | 4,140,181 | ||||||
| Hoya Corp. | 12,800 | 760,205 | ||||||
| Hulic Co. Ltd. | 8,000 | 78,503 | ||||||
| Idemitsu Kosan Co. Ltd. | 26,800 | 1,418,913 | ||||||
| Inpex Corp. | 23,900 | 298,620 | ||||||
| ITOCHU Corp. | 59,500 | 1,089,034 | ||||||
| Japan Airlines Co. Ltd. | 94,900 | 3,410,907 | ||||||
| Japan Real Estate Investment Corp., REIT | 41 | 214,996 | ||||||
| Japan Retail Fund Investment Corp., REIT | 73 | 132,479 | ||||||
| JFE Holdings, Inc. | 9,100 | 208,753 | ||||||
| JXTG Holdings, Inc. | 509,400 | 3,852,998 | ||||||
| Kajima Corp. | 32,500 | 472,568 | ||||||
| Kakaku.com, Inc. | 26,800 | 523,617 | ||||||
| Kamigumi Co. Ltd. | 9,500 | 209,406 | ||||||
| INVESTMENTS | SHARES | VALUE | ||||||
| Japan - 20.6% (continued) | ||||||||
| Kao Corp. | 2,600 | $ | 210,022 | |||||
| Konami Holdings Corp. | 12,400 | 485,537 | ||||||
| Kose Corp. | 4,900 | 933,673 | ||||||
| Kyocera Corp. | 6,900 | 414,149 | ||||||
| Mabuchi Motor Co. Ltd. | 4,700 | 189,593 | ||||||
| Marubeni Corp. | 188,000 | 1,719,376 | ||||||
| McDonald’s Holdings Co. Japan Ltd. | 4,400 | 193,228 | ||||||
| Mebuki Financial Group, Inc. | 37,900 | 131,136 | ||||||
| Medipal Holdings Corp. | 9,600 | 200,561 | ||||||
| MINEBEA MITSUMI, Inc. | 6,200 | 112,380 | ||||||
| Mitsubishi Corp. | 47,700 | 1,469,290 | ||||||
| Mitsubishi Electric Corp. | 30,900 | 423,309 | ||||||
| Mitsubishi Estate Co. Ltd. | 38,020 | 645,582 | ||||||
| Mitsubishi Gas Chemical Co., Inc. | 54,000 | 1,149,553 | ||||||
| Mitsubishi Motors Corp. | 284,800 | 2,011,971 | ||||||
| Mitsubishi UFJ Financial Group, Inc. | 209,991 | 1,304,610 | ||||||
| Mitsui & Co. Ltd. | 118,800 | 2,111,155 | ||||||
| Mitsui Fudosan Co. Ltd. | 29,205 | 690,723 | ||||||
| Mizuho Financial Group, Inc. | 231,100 | 402,762 | ||||||
| Murata Manufacturing Co. Ltd. | 2,300 | 353,409 | ||||||
| Nexon Co. Ltd. * | 199,600 | 2,609,073 | ||||||
| Nikon Corp. | 112,200 | 2,108,385 | ||||||
| Nippon Building Fund, Inc., REIT | 41 | 237,071 | ||||||
| Nippon Express Co. Ltd. | 23,100 | 1,517,061 | ||||||
| Nippon Telegraph & Telephone Corp. | 2,938 | 132,593 | ||||||
| Nomura Real Estate Holdings, Inc. | 3,900 | 78,674 | ||||||
| Nomura Research Institute Ltd. | 9,300 | 469,632 | ||||||
| NTT DOCOMO, Inc. | 39,500 | 1,061,664 | ||||||
| Omron Corp. | 13,900 | 587,382 | ||||||
| Oracle Corp. Japan | 1,800 | 145,030 | ||||||
| Oriental Land Co. Ltd. | 14,100 | 1,474,226 | ||||||
| ORIX Corp. | 40,000 | 647,665 | ||||||
| Otsuka Corp. | 38,400 | 1,432,323 | ||||||
| Panasonic Corp. | 34,800 | 403,375 | ||||||
| Pola Orbis Holdings, Inc. | 26,700 | 975,169 | ||||||
| Recruit Holdings Co. Ltd. | 66,100 | 2,207,837 | ||||||
| Resona Holdings, Inc. | 254,400 | 1,428,320 | ||||||
| Rohm Co. Ltd. | 20,200 | 1,477,835 | ||||||
| Ryohin Keikaku Co. Ltd. | 1,400 | 416,135 | ||||||
| Sega Sammy Holdings, Inc. | 13,800 | 203,486 | ||||||
| Shimadzu Corp. | 35,800 | 1,121,888 | ||||||
| Shinsei Bank Ltd. | 23,800 | 388,824 | ||||||
| Shionogi & Co. Ltd. | 14,500 | 947,860 | ||||||
| Shiseido Co. Ltd. | 29,800 | 2,307,949 | ||||||
| Sony Corp. | 71,800 | 4,364,555 | ||||||
| Stanley Electric Co. Ltd. | 5,900 | 201,707 | ||||||
| Sumitomo Corp. | 35,600 | 593,283 | ||||||
| Sumitomo Dainippon Pharma Co. Ltd. | 78,600 | 1,805,167 | ||||||
| Sumitomo Heavy Industries Ltd. | 33,000 | 1,177,822 | ||||||
| Sumitomo Mitsui Financial Group, Inc. | 32,536 | 1,309,374 | ||||||
| Sumitomo Realty & Development Co. Ltd. | 12,261 | 439,857 | ||||||
| Suzuken Co. Ltd. | 8,700 | 412,808 | ||||||
| Taiheiyo Cement Corp. | 11,100 | 348,129 | ||||||
| Taisei Corp. | 40,300 | 1,837,008 | ||||||
| Taisho Pharmaceutical Holdings Co. Ltd. | 1,700 | 207,968 | ||||||
| THK Co. Ltd. | 13,900 | 353,703 | ||||||
| Tokyo Electron Ltd. | 14,600 | 2,012,178 | ||||||
| Tokyu Fudosan Holdings Corp. | 12,883 | 89,755 | ||||||
| Toshiba Corp. * | 16,200 | 468,152 | ||||||
| The accompanying notes are an integral part of these financial statements. | (Continued) |
| AQR Funds | Annual Report | September 2018 | ||||||||||||||
173
Table of Contents
| Schedule of Investments | September 30, 2018 |
| AQR INTERNATIONAL EQUITY FUND |
| INVESTMENTS | SHARES | VALUE | ||||||
| Japan - 20.6% (continued) | ||||||||
| Tosoh Corp. | 12,500 | $ | 192,524 | |||||
| Toyota Tsusho Corp. | 17,200 | 649,417 | ||||||
|
| |||||||
| 92,521,137 | ||||||||
|
| |||||||
| Luxembourg - 0.1% | ||||||||
| SES SA, FDR | 21,766 | 477,446 | ||||||
|
| |||||||
| Macau - 0.1% | ||||||||
| Wynn Macau Ltd. | 162,800 | 373,886 | ||||||
|
| |||||||
| Malta - 0.0% (c) | ||||||||
| BGP Holdings plc (3)*(d) | 143,427 | 208 | ||||||
|
| |||||||
| Netherlands - 5.7% | ||||||||
| ASML Holding NV | 17,557 | 3,296,407 | ||||||
| ING Groep NV | 98,316 | 1,276,053 | ||||||
| Koninklijke Ahold Delhaize NV | 214,313 | 4,916,882 | ||||||
| Koninklijke DSM NV | 12,212 | 1,293,413 | ||||||
| Koninklijke Philips NV | 80,669 | 3,677,013 | ||||||
| NN Group NV | 24,869 | 1,109,964 | ||||||
| Royal Dutch Shell plc, Class A | 172,706 | 5,921,824 | ||||||
| Royal Dutch Shell plc, Class B | 96,178 | 3,366,862 | ||||||
| Wolters Kluwer NV | 11,867 | 739,788 | ||||||
|
| |||||||
| 25,598,206 | ||||||||
|
| |||||||
| Singapore - 0.5% | ||||||||
| Ascendas, REIT | 102,137 | 197,288 | ||||||
| CapitaLand Commercial Trust, REIT | 121,300 | 158,036 | ||||||
| CapitaLand Mall Trust, REIT | 120,594 | 195,999 | ||||||
| DBS Group Holdings Ltd. | 6,300 | 120,186 | ||||||
| Genting Singapore Ltd. | 1,020,800 | 791,258 | ||||||
| Sembcorp Industries Ltd. | 29,317 | 66,216 | ||||||
| Singapore Exchange Ltd. | 25,572 | 137,822 | ||||||
| United Overseas Bank Ltd. | 23,200 | 458,628 | ||||||
|
| |||||||
| 2,125,433 | ||||||||
|
| |||||||
| South Africa - 0.6% | ||||||||
| Anglo American plc | 80,290 | 1,796,166 | ||||||
| Investec plc | 145,353 | 1,019,668 | ||||||
|
| |||||||
| 2,815,834 | ||||||||
|
| |||||||
| Spain - 1.5% | ||||||||
| ACS Actividades de Construccion y Servicios SA | 10,430 | 442,992 | ||||||
| Banco Bilbao Vizcaya Argentaria SA | 139,609 | 885,156 | ||||||
| CaixaBank SA | 27,248 | 123,922 | ||||||
| Endesa SA | 96,030 | 2,071,338 | ||||||
| Iberdrola SA | 33,096 | 243,085 | ||||||
| Mapfre SA | 856,351 | 2,678,536 | ||||||
| Repsol SA | 10,995 | 218,881 | ||||||
|
| |||||||
| 6,663,910 | ||||||||
|
| |||||||
| Sweden - 3.2% | ||||||||
| Atlas Copco AB, Class B | 6,481 | 172,675 | ||||||
| Boliden AB | 16,802 | 467,278 | ||||||
| Electrolux AB, Series B | 10,774 | 237,343 | ||||||
| Hexagon AB, Class B | 9,734 | 569,894 | ||||||
| Investor AB, Class B | 9,454 | 435,656 | ||||||
| Nordea Bank AB | 77,960 | 848,251 | ||||||
| Sandvik AB | 193,886 | 3,432,608 | ||||||
| INVESTMENTS | SHARES | VALUE | ||||||
| Sweden - 3.2% (continued) | ||||||||
| Skandinaviska Enskilda Banken AB, Class A | 48,469 | $ | 540,336 | |||||
| Swedish Match AB | 97,429 | 4,980,114 | ||||||
| Volvo AB, Class B | 150,365 | 2,651,979 | ||||||
|
| |||||||
| 14,336,134 | ||||||||
|
| |||||||
| Switzerland - 9.2% | ||||||||
| Adecco Group AG (Registered) | 45,559 | 2,394,916 | ||||||
| Coca-Cola HBC AG * | 76,543 | 2,607,756 | ||||||
| Ferguson plc | 6,272 | 532,003 | ||||||
| Nestle SA (Registered) | 121,085 | 10,078,707 | ||||||
| Novartis AG (Registered) | 41,068 | 3,535,070 | ||||||
| Partners Group Holding AG | 831 | 658,749 | ||||||
| Roche Holding AG | 43,578 | 10,537,834 | ||||||
| Sika AG (Registered) | 4,193 | 610,163 | ||||||
| Sonova Holding AG (Registered) | 6,680 | 1,325,767 | ||||||
| STMicroelectronics NV | 109,730 | 2,008,344 | ||||||
| Straumann Holding AG (Registered) | 177 | 133,345 | ||||||
| Swatch Group AG (The) | 3,529 | 1,402,544 | ||||||
| Swiss Life Holding AG (Registered) * | 1,911 | 724,597 | ||||||
| Vifor Pharma AG | 4,147 | 718,968 | ||||||
| Zurich Insurance Group AG | 12,470 | 3,931,856 | ||||||
|
| |||||||
| 41,200,619 | ||||||||
|
| |||||||
| United Kingdom - 9.3% | ||||||||
| 3i Group plc | 29,271 | 358,419 | ||||||
| Ashtead Group plc | 76,466 | 2,426,135 | ||||||
| AstraZeneca plc | 7,252 | 565,251 | ||||||
| Auto Trader Group plc (a) | 22,605 | 131,499 | ||||||
| Aviva plc | 144,390 | 921,276 | ||||||
| Barclays plc | 1,964,917 | 4,358,234 | ||||||
| Berkeley Group Holdings plc | 5,891 | 282,219 | ||||||
| BP plc | 792,467 | 6,074,056 | ||||||
| British Land Co. plc (The), REIT | 28,168 | 226,560 | ||||||
| Burberry Group plc | 220,537 | 5,791,144 | ||||||
| Centrica plc | 181,213 | 366,210 | ||||||
| Direct Line Insurance Group plc | 28,825 | 121,664 | ||||||
| Hammerson plc, REIT | 24,134 | 143,601 | ||||||
| International Consolidated Airlines Group SA | 334,826 | 2,872,329 | ||||||
| Land Securities Group plc, REIT | 21,547 | 248,093 | ||||||
| Lloyds Banking Group plc | 3,071,138 | 2,361,976 | ||||||
| London Stock Exchange Group plc | 8,751 | 522,931 | ||||||
| Meggitt plc | 55,077 | 406,628 | ||||||
| Next plc | 4,107 | 293,922 | ||||||
| Persimmon plc | 55,267 | 1,701,524 | ||||||
| Randgold Resources Ltd. | 1,836 | 129,858 | ||||||
| RELX plc * | 25,248 | 530,440 | ||||||
| RELX plc | 53,063 | 1,116,267 | ||||||
| Rolls-Royce Holdings plc * | 75,204 | 967,529 | ||||||
| Royal Bank of Scotland Group plc | 653,036 | 2,115,902 | ||||||
| Royal Mail plc | 345,729 | 2,149,185 | ||||||
| Sky plc | 35,934 | 809,719 | ||||||
| Smith & Nephew plc | 25,972 | 473,850 | ||||||
| Standard Life Aberdeen plc | 200,999 | 800,906 | ||||||
| Taylor Wimpey plc | 378,536 | 846,103 | ||||||
| Unilever plc | 31,121 | 1,709,605 | ||||||
|
| |||||||
| 41,823,035 | ||||||||
|
| |||||||
| The accompanying notes are an integral part of these financial statements. | (Continued) |
| AQR Funds | Annual Report | September 2018 | ||||||||||||||
174
Table of Contents
| Schedule of Investments | September 30, 2018 |
| AQR INTERNATIONAL EQUITY FUND |
| INVESTMENTS | SHARES | VALUE | ||||||
| United States - 0.3% | ||||||||
| Shire plc | 25,194 | $ | 1,522,118 | |||||
|
| |||||||
TOTAL COMMON STOCKS | 392,592,929 | |||||||
|
| |||||||
| SHORT-TERM INVESTMENTS - 9.9% | ||||||||
| Investment Companies - 9.9% | ||||||||
| J.P. Morgan U.S. Treasury Plus Money Market Fund - IM Shares, 2.00% (1)(e)(f) | 15,436,473 | 15,436,473 | ||||||
| Limited Purpose Cash Investment Fund, 2.06% (1)(e) | 29,145,568 | 29,142,653 | ||||||
|
| |||||||
TOTAL SHORT-TERM INVESTMENTS | 44,579,126 | |||||||
|
| |||||||
| SECURITIES LENDING COLLATERAL - 0.1% | ||||||||
| Investment Companies - 0.1% | ||||||||
| Investments in a Pooled Account through Securities Lending Program with Citibank NA | ||||||||
| BlackRock Liquidity Funds T-Fund Portfolio, Institutional Shares 1.97% (1)(e)(g) | 32,031 | 32,031 | ||||||
| Limited Purpose Cash Investment Fund 2.06% (1)(e)(g) | 229,843 | 229,820 | ||||||
|
| |||||||
TOTAL SECURITIES LENDING COLLATERAL | 261,851 | |||||||
|
| |||||||
TOTAL INVESTMENTS IN SECURITIES AT VALUE - 97.4% | 437,433,906 | |||||||
|
| |||||||
| OTHER ASSETS IN EXCESS OF LIABILITIES -2.6% (h) | 11,906,933 | |||||||
|
| |||||||
NET ASSETS - 100.0% |
| $ | 449,340,839 | |||||
|
| |||||||
| SECTOR | VALUE | % OF NET ASSETS | ||||||
| Communication Services | $ | 6,680,447 | 1.5 | % | ||||
| Consumer Discretionary | 42,098,699 | 9.4 | ||||||
| Consumer Staples | 30,391,370 | 6.8 | ||||||
| Energy | 40,606,865 | 9.0 | ||||||
| Financials | 53,668,198 | 11.9 | ||||||
| Health Care | 56,095,661 | 12.5 | ||||||
| Industrials | 56,831,838 | 12.6 | ||||||
| Information Technology | 40,356,759 | 9.0 | ||||||
| Materials | 38,261,345 | 8.5 | ||||||
| Real Estate | 15,096,406 | 3.4 | ||||||
| Utilities | 12,505,341 | 2.8 | ||||||
| Short-Term Investments | 44,579,126 | 9.9 | ||||||
| Securities Lending Collateral | 261,851 | 0.1 | ||||||
|
|
|
| |||||
Total Investments In Securities At Value | 437,433,906 | 97.4 | ||||||
| Other Assets in Excess of Liabilities (h) | 11,906,933 | 2.6 | ||||||
|
|
|
| |||||
Net Assets | $ | 449,340,839 | 100.0 | % | ||||
|
|
|
| |||||
| * | Non-income producing security. |
| (a) | Securities exempt from registration under Rule 144A or section 4(2), of the Securities Act of 1933. Under procedures approved by the Board of Trustees, such securities have been determined to be liquid by the investment adviser and may be resold, normally to qualified institutional buyers in transactions exempt from registration. Total value of all such securities at September 30, 2018 amounted to $6,552,633, which represents approximately 1.46% of net assets of the fund. |
| (b) | The security or a portion of this security is on loan at September 30, 2018. The total value of securities on loan at September 30, 2018 was $114,361. |
| (c) | Represents less than 0.05% of net assets. |
| (d) | Security fair valued as of September 30, 2018 in accordance with procedures approved by the Board of Trustees. Total value of all such securities at September 30, 2018 amounted to $208, which represents approximately 0.00% of net assets of the fund. |
| (e) | Represents 7-day effective yield as of September 30, 2018. |
| (f) | All or a portion of the security pledged as collateral for forward foreign currency exchange and swap contracts. |
| (g) | Represents security, or portion thereof, purchased with the cash collateral received for securities on loan. |
| (h) | Includes appreciation/(depreciation) on forward foreign currency exchange, futures and swap contracts. |
All securities are Level 2 with respect to ASC 820, unless otherwise noted in parentheses.
| (1) | Level 1 security (See Note 4). |
| (3) | Level 3 security (See Note 4). |
Abbreviations
FDR - Fiduciary Depositary Receipt
OYJ - Public Traded Company
Preference - A special type of equity investment that shares in the earnings of the company, has limited voting rights, and may have a dividend preference. Preference shares may also have liquidation preference.
REIT - Real Estate Investment Trust
SCA - Limited partnership with share capital
| The accompanying notes are an integral part of these financial statements. | (Continued) |
| AQR Funds | Annual Report | September 2018 | ||||||||||||||
175
Table of Contents
| Schedule of Investments | September 30, 2018 |
| AQR INTERNATIONAL EQUITY FUND |
Total return swap contracts outstanding as of September 30, 2018:
Over the Counter
| REFERENCE ENTITY | PAYMENTS MADE BY FUND | PAYMENTS RECEIVED BY FUND | PAYMENT FREQUENCY | COUNTERPARTY | MATURITY DATE | NOTIONAL AMOUNT | VALUE AND UNREALIZED APPRECIATION (DEPRECIATION) | |||||||||||||
| Hang Seng Index October Futures | Decreases in total return of reference entity | Increases in total return of reference entity | At termination | GSIN | 10/30/2018 | HKD | 16,726,200 | $13,353 | ||||||||||||
| Hang Seng Index October Futures | Decreases in total return of reference entity | Increases in total return of reference entity | At termination | JPMC | 10/30/2018 | HKD | 98,963,350 | 156,393 | ||||||||||||
| MSCI Japan Net Return Index | Decreases in total return of reference entity and pays the LIBOR plus or minus a specified spread (0.10%) | Increases in total return of reference entity | Monthly | JPMC | 12/25/2018 | JPY | 1,206,157,381 | 603,019 | ||||||||||||
| MSCI Singapore Net Return Index | Decreases in total return of reference entity and pays the SOR plus or minus a specified spread (0.40%) | Increases in total return of reference entity | Monthly | JPMC | 12/24/2018 | SGD | 138,448 | 4,351 | ||||||||||||
| MSCI Singapore Net Return Index | Decreases in total return of reference entity and pays the SOR plus or minus a specified spread (0.60%) | Increases in total return of reference entity | Monthly | JPMC | 12/24/2018 | SGD | 3,298,253 | 80,223 | ||||||||||||
| MSCI Singapore Net Return Index | Decreases in total return of reference entity and pays the SOR plus or minus a specified spread (0.60%) | Increases in total return of reference entity | Monthly | JPMC | 12/24/2018 | SGD | 138,242 | 4,514 | ||||||||||||
|
| |||||||||||||||||||
| 861,853 | ||||||||||||||||||||
|
| |||||||||||||||||||
| MSCI Italy Net Return Index | Decreases in total return of reference entity and pays the EURIBOR plus or minus a specified spread (0.05%) | Increases in total return of reference entity | Monthly | JPMC | 12/21/2018 | EUR | 5,977,604 | (34,532 | ) | |||||||||||
| The accompanying notes are an integral part of these financial statements. | (Continued) |
| AQR Funds | Annual Report | September 2018 | ||||||||||||||
176
Table of Contents
| Schedule of Investments | September 30, 2018 |
| AQR INTERNATIONAL EQUITY FUND |
| REFERENCE ENTITY | PAYMENTS MADE BY FUND | PAYMENTS RECEIVED BY FUND | PAYMENT FREQUENCY | COUNTERPARTY | MATURITY DATE | NOTIONAL AMOUNT | VALUE AND UNREALIZED APPRECIATION (DEPRECIATION) | |||||||||||||
| MSCI Netherlands Net Return Index | Increases in total return of reference entity | Decreases in total return of reference entity and receives the EURIBOR plus or minus a specified spread (-0.15%) | Monthly | JPMC | 12/19/2018 | EUR | (1,724,999 | ) | $(86 | ) | ||||||||||
| MSCI Spain Net Return Index | Increases in total return of reference entity | Decreases in total return of reference entity and receives the EURIBOR plus or minus a specified spread (-0.70%) | Monthly | JPMC | 12/19/2018 | EUR | (1,245,878 | ) | (6,160 | ) | ||||||||||
| MSCI Sweden Net Return Index | Increases in total return of reference entity | Decreases in total return of reference entity and receives the STIBOR plus or minus a specified spread (-0.80%) | Monthly | JPMC | 12/19/2018 | SEK | (19,290,134 | ) | (37,928 | ) | ||||||||||
| MSCI Switzerland Net Return Index | Increases in total return of reference entity | Decreases in total return of reference entity and receives the LIBOR plus or minus a specified spread (-0.15%) | Monthly | JPMC | 12/19/2018 | CHF | (2,912,025 | ) | (35,248 | ) | ||||||||||
| Swiss Market Index December Futures | Increases in total return of reference entity | Decreases in total return of reference entity | At termination | GSIN | 12/21/2018 | CHF | (5,983,560 | ) | (113,518 | ) | ||||||||||
| Swiss Market Index December Futures | Increases in total return of reference entity | Decreases in total return of reference entity | At termination | JPMC | 12/21/2018 | CHF | (24,659,520 | ) | (469,465 | ) | ||||||||||
|
| |||||||||||||||||||
| (696,937 | ) | |||||||||||||||||||
|
| |||||||||||||||||||
| $164,916 | ||||||||||||||||||||
|
| |||||||||||||||||||
| The accompanying notes are an integral part of these financial statements. | (Continued) |
| AQR Funds | Annual Report | September 2018 | ||||||||||||||
177
Table of Contents
| Schedule of Investments | September 30, 2018 |
| AQR INTERNATIONAL EQUITY FUND |
Futures contracts outstanding as of September 30, 2018:
Exchange Traded
| DESCRIPTION | NUMBER OF CONTRACTS | EXPIRATION DATE | TRADING CURRENCY | NOTIONAL AMOUNT | VALUE AND UNREALIZED APPRECIATION (DEPRECIATION) | |||||||||||||
| Long Contracts | ||||||||||||||||||
| Hang Seng Index | 20 | 10/2018 | HKD | $ | 3,561,031 | $15,532 | ||||||||||||
| MSCI Singapore Index | 19 | 10/2018 | SGD | 514,593 | 4,170 | |||||||||||||
| DAX Index | 6 | 12/2018 | EUR | 2,131,949 | 31,742 | |||||||||||||
| FTSE/MIB Index | 95 | 12/2018 | EUR | 11,405,546 | (121,013 | ) | ||||||||||||
| TOPIX Index | 506 | 12/2018 | JPY | 80,941,296 | 6,230,294 | |||||||||||||
|
| |||||||||||||||||
| 6,160,725 | ||||||||||||||||||
|
| |||||||||||||||||
| Short Contracts |
| |||||||||||||||||
| Amsterdam Exchange Index | (22 | ) | 10/2018 | EUR | (2,806,931 | ) | (45,076 | ) | ||||||||||
| CAC 40 10 Euro Index | (205 | ) | 10/2018 | EUR | (13,065,847 | ) | (333,663 | ) | ||||||||||
| IBEX 35 Index | (65 | ) | 10/2018 | EUR | (7,069,866 | ) | 21,245 | |||||||||||
| OMXS30 Index | (610 | ) | 10/2018 | SEK | (11,393,658 | ) | (227,450 | ) | ||||||||||
| FTSE 100 Index | (135 | ) | 12/2018 | GBP | (13,173,171 | ) | (365,783 | ) | ||||||||||
| SPI 200 Index | (16 | ) | 12/2018 | AUD | (1,790,933 | ) | (6,431 | ) | ||||||||||
|
| |||||||||||||||||
| (957,158 | ) | |||||||||||||||||
|
| |||||||||||||||||
| $ | 5,203,567 | |||||||||||||||||
|
| |||||||||||||||||
Forward foreign currency contracts outstanding as of September 30, 2018:
Over the Counter
| CURRENCY PURCHASED | CURRENCY SOLD | COUNTERPARTY | SETTLEMENT DATE | UNREALIZED APPRECIATION (DEPRECIATION) | ||||||||||||||||
| AUD | 14,242,019 | USD | 10,219,498 | CITG | 12/19/2018 | $81,683 | ||||||||||||||
| AUD | 21,363,027 | USD | 15,329,265 | JPMC | 12/19/2018 | 122,506 | ||||||||||||||
| DKK | 95,600 | USD | 14,960 | CITG | 12/19/2018 | 32 | ||||||||||||||
| DKK | 143,400 | USD | 22,440 | JPMC | 12/19/2018 | 48 | ||||||||||||||
| GBP | 5,700,110 | USD | 7,396,206 | CITG | 12/19/2018 | 62,147 | ||||||||||||||
| GBP | 8,550,165 | USD | 11,094,323 | JPMC | 12/19/2018 | 93,207 | ||||||||||||||
| HKD | 16,965,600 | USD | 2,166,030 | CITG | 12/19/2018 | 3,667 | ||||||||||||||
| HKD | 25,448,400 | USD | 3,249,049 | JPMC | 12/19/2018 | 5,496 | ||||||||||||||
| NZD | 4,415,900 | USD | 2,901,284 | CITG | 12/19/2018 | 27,151 | ||||||||||||||
| NZD | 6,623,850 | USD | 4,351,931 | JPMC | 12/19/2018 | 40,722 | ||||||||||||||
| SEK | 1,952,000 | USD | 216,939 | CITG | 12/19/2018 | 4,251 | ||||||||||||||
| SEK | 2,928,000 | USD | 325,409 | JPMC | 12/19/2018 | 6,377 | ||||||||||||||
| SGD | 105,200 | USD | 76,827 | CITG | 12/19/2018 | 261 | ||||||||||||||
| SGD | 157,800 | USD | 115,241 | JPMC | 12/19/2018 | 391 | ||||||||||||||
| USD | 3,624,902 | AUD | 4,942,800 | CITG | 12/19/2018 | 49,800 | ||||||||||||||
| USD | 5,437,347 | AUD | 7,414,200 | JPMC | 12/19/2018 | 74,693 | ||||||||||||||
| USD | 13,193,998 | CHF | 12,715,538 | CITG | 12/19/2018 | 137,113 | ||||||||||||||
| USD | 19,790,973 | CHF | 19,073,307 | JPMC | 12/19/2018 | 205,645 | ||||||||||||||
| USD | 162,368 | DKK | 1,022,400 | CITG | 12/19/2018 | 2,035 | ||||||||||||||
| USD | 243,552 | DKK | 1,533,600 | JPMC | 12/19/2018 | 3,053 | ||||||||||||||
| USD | 27,798,805 | EUR | 23,644,120 | CITG | 12/19/2018 | 161,051 | ||||||||||||||
| USD | 41,698,155 | EUR | 35,466,180 | JPMC | 12/19/2018 | 241,526 | ||||||||||||||
| USD | 7,147,211 | GBP | 5,426,000 | CITG | 12/19/2018 | 47,517 | ||||||||||||||
| USD | 10,720,803 | GBP | 8,139,000 | JPMC | 12/19/2018 | 71,264 | ||||||||||||||
| USD | 17,172 | ILS | 61,600 | CITG | 12/19/2018 | 131 | ||||||||||||||
| USD | 25,757 | ILS | 92,400 | JPMC | 12/19/2018 | 196 | ||||||||||||||
| The accompanying notes are an integral part of these financial statements. | (Continued) |
| AQR Funds | Annual Report | September 2018 | ||||||||||||||
178
Table of Contents
| Schedule of Investments | September 30, 2018 |
| AQR INTERNATIONAL EQUITY FUND |
| CURRENCY PURCHASED | CURRENCY SOLD | COUNTERPARTY | SETTLEMENT DATE | UNREALIZED APPRECIATION (DEPRECIATION) | ||||||||||||||||
| USD | 7,341,713 | JPY | 814,683,600 | CITG | 12/19/2018 | $124,561 | ||||||||||||||
| USD | 11,012,556 | JPY | 1,222,025,400 | JPMC | 12/19/2018 | 186,828 | ||||||||||||||
| USD | 194,430 | SEK | 1,699,200 | CITG | 12/19/2018 | 1,885 | ||||||||||||||
| USD | 291,644 | SEK | 2,548,800 | JPMC | 12/19/2018 | 2,828 | ||||||||||||||
|
| |||||||||||||||||||
| Total unrealized appreciation | 1,758,065 | |||||||||||||||||||
|
| |||||||||||||||||||
| AUD | 12,423,621 | USD | 9,080,739 | CITG | 12/19/2018 | (94,797 | ) | |||||||||||||
| AUD | 18,635,433 | USD | 13,621,127 | JPMC | 12/19/2018 | (142,212 | ) | |||||||||||||
| CHF | 574,400 | USD | 597,687 | CITG | 12/19/2018 | (7,866 | ) | |||||||||||||
| CHF | 861,600 | USD | 896,531 | JPMC | 12/19/2018 | (11,803 | ) | |||||||||||||
| DKK | 855,200 | USD | 135,185 | CITG | 12/19/2018 | (1,073 | ) | |||||||||||||
| DKK | 1,282,800 | USD | 202,778 | JPMC | 12/19/2018 | (1,610 | ) | |||||||||||||
| EUR | 4,000 | USD | 4,681 | CITG | 12/19/2018 | (6 | ) | |||||||||||||
| EUR | 6,000 | USD | 7,022 | JPMC | 12/19/2018 | (9 | ) | |||||||||||||
| GBP | 477,210 | USD | 625,887 | CITG | 12/19/2018 | (1,478 | ) | |||||||||||||
| GBP | 715,815 | USD | 938,832 | JPMC | 12/19/2018 | (2,218 | ) | |||||||||||||
| ILS | 3,701,600 | USD | 1,028,773 | CITG | 12/19/2018 | (4,765 | ) | |||||||||||||
| ILS | 5,552,400 | USD | 1,543,161 | JPMC | 12/19/2018 | (7,149 | ) | |||||||||||||
| JPY | 2,425,389,120 | USD | 21,919,893 | CITG | 12/19/2018 | (433,756 | ) | |||||||||||||
| JPY | 3,638,083,680 | USD | 32,879,881 | JPMC | 12/19/2018 | (650,676 | ) | |||||||||||||
| NZD | 8,232,100 | USD | 5,508,054 | CITG | 12/19/2018 | (48,881 | ) | |||||||||||||
| NZD | 12,348,150 | USD | 8,262,092 | JPMC | 12/19/2018 | (73,331 | ) | |||||||||||||
| SEK | 53,600 | USD | 6,140 | CITG | 12/19/2018 | (66 | ) | |||||||||||||
| SEK | 80,400 | USD | 9,210 | JPMC | 12/19/2018 | (99 | ) | |||||||||||||
| SGD | 1,777,720 | USD | 1,306,102 | CITG | 12/19/2018 | (3,440 | ) | |||||||||||||
| SGD | 2,666,580 | USD | 1,959,155 | JPMC | 12/19/2018 | (5,161 | ) | |||||||||||||
| USD | 1,140,807 | CHF | 1,111,982 | CITG | 12/19/2018 | (1,026 | ) | |||||||||||||
| USD | 1,711,208 | CHF | 1,667,973 | JPMC | 12/19/2018 | (1,542 | ) | |||||||||||||
| USD | 1,202,003 | DKK | 7,680,000 | CITG | 12/19/2018 | (2,374 | ) | |||||||||||||
| USD | 1,803,003 | DKK | 11,520,000 | JPMC | 12/19/2018 | (3,564 | ) | |||||||||||||
| USD | 11,542,026 | EUR | 9,897,720 | CITG | 12/19/2018 | (27,478 | ) | |||||||||||||
| USD | 17,313,017 | EUR | 14,846,580 | JPMC | 12/19/2018 | (41,240 | ) | |||||||||||||
| USD | 5,268,109 | GBP | 4,076,400 | CITG | 12/19/2018 | (65,688 | ) | |||||||||||||
| USD | 7,902,153 | GBP | 6,114,600 | JPMC | 12/19/2018 | (98,544 | ) | |||||||||||||
| USD | 121,437 | HKD | 951,600 | CITG | 12/19/2018 | (261 | ) | |||||||||||||
| USD | 182,156 | HKD | 1,427,400 | JPMC | 12/19/2018 | (391 | ) | |||||||||||||
| USD | 5,374,694 | SEK | 48,508,795 | CITG | 12/19/2018 | (122,066 | ) | |||||||||||||
| USD | 8,062,032 | SEK | 72,763,205 | JPMC | 12/19/2018 | (183,110 | ) | |||||||||||||
| USD | 105,994 | SGD | 145,600 | CITG | 12/19/2018 | (698 | ) | |||||||||||||
| USD | 158,990 | SGD | 218,400 | JPMC | 12/19/2018 | (1,047 | ) | |||||||||||||
|
| |||||||||||||||||||
| Total unrealized depreciation | (2,039,425 | ) | ||||||||||||||||||
|
| |||||||||||||||||||
| Net unrealized depreciation | $(281,360 | ) | ||||||||||||||||||
|
| |||||||||||||||||||
AUD - Australian Dollar
CHF - Swiss Franc
DKK - Danish Krone
EUR - Euro
GBP - British Pound
HKD - Hong Kong Dollar
ILS - Israeli Shekel
JPY - Japanese Yen
NZD - New Zealand Dollar
SEK - Swedish Krona
SGD - Singapore Dollar
USD - United States Dollar
| The accompanying notes are an integral part of these financial statements. | (Continued) |
| AQR Funds | Annual Report | September 2018 | ||||||||||||||
179
Table of Contents
| Schedule of Investments | September 30, 2018 |
| AQR INTERNATIONAL EQUITY FUND |
Collateral pledged to, or (received from), each counterparty at September 30, 2018 was as follows:
| COUNTERPARTY | OVER THE COUNTER | EXCHANGE TRADED | TOTAL | |||||||||
| BARC | ||||||||||||
| Cash | $— | $ | 2,269,749 | $2,269,749 | ||||||||
| ||||||||||||
| CITG | ||||||||||||
| Investment Companies | 681,298 | — | 681,298 | |||||||||
| ||||||||||||
| GSIN | ||||||||||||
| Investment Companies | 941,573 | — | 941,573 | |||||||||
| ||||||||||||
| JPMC | ||||||||||||
| Investment Companies | 13,813,602 | — | 13,813,602 | |||||||||
| ||||||||||||
| The accompanying notes are an integral part of these financial statements. |
| AQR Funds | Annual Report | September 2018 | ||||||||||||||
180
Table of Contents
| Schedule of Investments | September 30, 2018 |
| AQR LARGE CAP RELAXED CONSTRAINT EQUITY FUND |
| INVESTMENTS | SHARES | VALUE | ||||||
| LONG POSITIONS - 130.0% | ||||||||
| COMMON STOCKS - 126.3% | ||||||||
| Aerospace & Defense - 5.8% | ||||||||
| Boeing Co. (The) (a) | 997 | $ | 370,784 | |||||
| Curtiss-Wright Corp. | 277 | 38,065 | ||||||
| Esterline Technologies Corp. * | 239 | 21,737 | ||||||
| General Dynamics Corp. | 202 | 41,354 | ||||||
| Huntington Ingalls Industries, Inc. | 459 | 117,541 | ||||||
| L3 Technologies, Inc. | 168 | 35,720 | ||||||
| Lockheed Martin Corp. | 156 | 53,970 | ||||||
| Northrop Grumman Corp. | 132 | 41,893 | ||||||
| Raytheon Co. (a) | 916 | 189,301 | ||||||
| Spirit AeroSystems Holdings, Inc., Class A (a) | 1,339 | 122,746 | ||||||
| Teledyne Technologies, Inc. * | 299 | 73,757 | ||||||
|
| |||||||
| 1,106,868 | ||||||||
|
| |||||||
| Air Freight & Logistics - 0.7% | ||||||||
| Expeditors International of Washington, Inc. | 148 | 10,882 | ||||||
| FedEx Corp. | 534 | 128,582 | ||||||
|
| |||||||
| 139,464 | ||||||||
|
| |||||||
| Airlines - 0.0% (b) | ||||||||
| Southwest Airlines Co. | 36 | 2,248 | ||||||
|
| |||||||
| Auto Components - 0.8% | ||||||||
| Lear Corp. (a) | 1,010 | 146,450 | ||||||
|
| |||||||
| Banks - 6.2% | ||||||||
| Bank of America Corp. (a) | 4,962 | 146,180 | ||||||
| Citigroup, Inc. | 1,670 | 119,806 | ||||||
| Citizens Financial Group, Inc. | 1,710 | 65,955 | ||||||
| Comerica, Inc. | 344 | 31,029 | ||||||
| Fifth Third Bancorp | 336 | 9,381 | ||||||
| First Citizens BancShares, Inc., Class A | 51 | 23,066 | ||||||
| JPMorgan Chase & Co. (a) | 2,596 | 292,933 | ||||||
| KeyCorp | 2,209 | 43,937 | ||||||
| M&T Bank Corp. | 154 | 25,339 | ||||||
| PNC Financial Services Group, Inc. (The) (a) | 1,080 | 147,085 | ||||||
| Popular, Inc. | 1,037 | 53,146 | ||||||
| Regions Financial Corp. | 2,955 | 54,224 | ||||||
| TCF Financial Corp. | 2,313 | 55,073 | ||||||
| Wells Fargo & Co. | 2,392 | 125,724 | ||||||
|
| |||||||
| 1,192,878 | ||||||||
|
| |||||||
| Beverages - 0.4% | ||||||||
| Boston Beer Co., Inc. (The), Class A * | 65 | 18,688 | ||||||
| PepsiCo, Inc. | 488 | 54,558 | ||||||
|
| |||||||
| 73,246 | ||||||||
|
| |||||||
| Biotechnology - 4.6% | ||||||||
| AbbVie, Inc. | 1,337 | 126,454 | ||||||
| Amgen, Inc. | 444 | 92,037 | ||||||
| Biogen, Inc. * | 488 | 172,415 | ||||||
| Celgene Corp. * | 1,750 | 156,608 | ||||||
| Exelixis, Inc. * | 1,964 | 34,802 | ||||||
| Gilead Sciences, Inc. | 1,616 | 124,771 | ||||||
| Regeneron Pharmaceuticals, Inc. * | 14 | 5,657 | ||||||
| United Therapeutics Corp. * | 538 | 68,799 | ||||||
| Vertex Pharmaceuticals, Inc. * | 533 | 102,730 | ||||||
|
| |||||||
| 884,273 | ||||||||
|
| |||||||
| INVESTMENTS | SHARES | VALUE | ||||||
| Building Products - 0.2% | ||||||||
| Armstrong World Industries, Inc. * | 544 | $ | 37,863 | |||||
|
| |||||||
| Capital Markets - 1.6% | ||||||||
| Ameriprise Financial, Inc. | 87 | 12,846 | ||||||
| BlackRock, Inc. | 104 | 49,018 | ||||||
| CME Group, Inc. | 243 | 41,361 | ||||||
| Federated Investors, Inc., Class B | 3,149 | 75,954 | ||||||
| Goldman Sachs Group, Inc. (The) | 105 | 23,545 | ||||||
| Moody’s Corp. | 115 | 19,228 | ||||||
| Morgan Stanley | 130 | 6,054 | ||||||
| S&P Global, Inc. | 152 | 29,699 | ||||||
| State Street Corp. | 88 | 7,373 | ||||||
| T. Rowe Price Group, Inc. | 458 | 50,005 | ||||||
|
| |||||||
| 315,083 | ||||||||
|
| |||||||
| Chemicals - 3.3% | ||||||||
| Cabot Corp. | 662 | 41,521 | ||||||
| Celanese Corp. | 829 | 94,506 | ||||||
| Chemours Co. (The) | 1,529 | 60,304 | ||||||
| Eastman Chemical Co. | 818 | 78,299 | ||||||
| Huntsman Corp. | 2,338 | 63,664 | ||||||
| LyondellBasell Industries NV, Class A (a) | 1,950 | 199,894 | ||||||
| Olin Corp. | 791 | 20,313 | ||||||
| PolyOne Corp. | 881 | 38,517 | ||||||
| Westlake Chemical Corp. | 383 | 31,831 | ||||||
|
| |||||||
| 628,849 | ||||||||
|
| |||||||
| Commercial Services & Supplies - 0.7% | ||||||||
| Herman Miller, Inc. | 1,005 | 38,592 | ||||||
| KAR Auction Services, Inc. | 469 | 27,995 | ||||||
| Waste Management, Inc. | 812 | 73,372 | ||||||
|
| |||||||
| 139,959 | ||||||||
|
| |||||||
| Communications Equipment - 1.3% | ||||||||
| Arista Networks, Inc. * | 70 | 18,610 | ||||||
| Cisco Systems, Inc. | 3,223 | 156,799 | ||||||
| F5 Networks, Inc. * | 340 | 67,803 | ||||||
|
| |||||||
| 243,212 | ||||||||
|
| |||||||
| Construction & Engineering - 0.7% | ||||||||
| EMCOR Group, Inc. | 1,254 | 94,188 | ||||||
| KBR, Inc. | 2,170 | 45,852 | ||||||
|
| |||||||
| 140,040 | ||||||||
|
| |||||||
| Containers & Packaging - 0.1% | ||||||||
| Greif, Inc., Class A | 418 | 22,430 | ||||||
|
| |||||||
| Diversified Consumer Services - 0.0% (b) | ||||||||
| Graham Holdings Co., Class B | 6 | 3,476 | ||||||
|
| |||||||
| Diversified Financial Services - 1.4% | ||||||||
| Berkshire Hathaway, Inc., Class B *(a) | 1,237 | 264,854 | ||||||
|
| |||||||
| Diversified Telecommunication Services - 0.5% | ||||||||
| AT&T, Inc. | 1,358 | 45,602 | ||||||
| Verizon Communications, Inc. | 978 | 52,215 | ||||||
|
| |||||||
| 97,817 | ||||||||
|
| |||||||
| Electric Utilities - 1.2% | ||||||||
| Exelon Corp. (a) | 4,226 | 184,507 | ||||||
| The accompanying notes are an integral part of these financial statements. | (Continued) |
| AQR Funds | Annual Report | September 2018 | ||||||||||||||
181
Table of Contents
| Schedule of Investments | September 30, 2018 |
| AQR LARGE CAP RELAXED CONSTRAINT EQUITY FUND |
| INVESTMENTS | SHARES | VALUE | ||||||
| Electric Utilities - 1.2% (continued) | ||||||||
| OGE Energy Corp. | 1,419 | $ | 51,538 | |||||
|
| |||||||
| 236,045 | ||||||||
|
| |||||||
| Electrical Equipment - 0.6% | ||||||||
| Eaton Corp. plc | 590 | 51,171 | ||||||
| Emerson Electric Co. | 250 | 19,145 | ||||||
| nVent Electric plc (United Kingdom) | 1,315 | 35,715 | ||||||
|
| |||||||
| 106,031 | ||||||||
|
| |||||||
| Electronic Equipment, Instruments & Components - 0.6% | ||||||||
| CDW Corp. | 527 | 46,861 | ||||||
| Jabil, Inc. | 1,238 | 33,525 | ||||||
| Zebra Technologies Corp., Class A * | 143 | 25,287 | ||||||
|
| |||||||
| 105,673 | ||||||||
|
| |||||||
| Energy Equipment & Services - 0.6% | ||||||||
| Halliburton Co. | 836 | 33,883 | ||||||
| Helmerich & Payne, Inc. | 232 | 15,955 | ||||||
| Patterson-UTI Energy, Inc. | 2,695 | 46,112 | ||||||
| Schlumberger Ltd. | 209 | 12,732 | ||||||
|
| |||||||
| 108,682 | ||||||||
|
| |||||||
| Entertainment - 1.6% | ||||||||
| Activision Blizzard, Inc. | 271 | 22,544 | ||||||
| Electronic Arts, Inc. * | 537 | 64,703 | ||||||
| Take-Two Interactive Software, Inc. * | 199 | 27,460 | ||||||
| Twenty-First Century Fox, Inc., Class A | 666 | 30,856 | ||||||
| Viacom, Inc., Class B | 1,620 | 54,691 | ||||||
| Walt Disney Co. (The) | 624 | 72,971 | ||||||
| Zynga, Inc., Class A * | 10,408 | 41,736 | ||||||
|
| |||||||
| 314,961 | ||||||||
|
| |||||||
| Equity Real Estate Investment Trusts (REITs) - 2.8% | ||||||||
| American Tower Corp. | 248 | 36,035 | ||||||
| AvalonBay Communities, Inc. | 34 | 6,159 | ||||||
| Boston Properties, Inc. | 183 | 22,526 | ||||||
| Crown Castle International Corp. | 212 | 23,602 | ||||||
| Digital Realty Trust, Inc. | 220 | 24,746 | ||||||
| Equinix, Inc. | 49 | 21,212 | ||||||
| Equity Residential | 274 | 18,155 | ||||||
| Host Hotels & Resorts, Inc. | 664 | 14,010 | ||||||
| Prologis, Inc. | 751 | 50,910 | ||||||
| Public Storage | 408 | 82,265 | ||||||
| Realty Income Corp. | 977 | 55,582 | ||||||
| SBA Communications Corp. * | 80 | 12,850 | ||||||
| Simon Property Group, Inc. | 340 | 60,095 | ||||||
| Ventas, Inc. | 772 | 41,981 | ||||||
| Welltower, Inc. | 595 | 38,270 | ||||||
| Weyerhaeuser Co. | 578 | 18,652 | ||||||
|
| |||||||
| 527,050 | ||||||||
|
| |||||||
| Food & Staples Retailing - 1.4% | ||||||||
| Costco Wholesale Corp. | 159 | 37,346 | ||||||
| Kroger Co. (The) | 182 | 5,298 | ||||||
| US Foods Holding Corp. * | 557 | 17,167 | ||||||
| Walmart, Inc. (a) | 2,150 | 201,906 | ||||||
|
| |||||||
| 261,717 | ||||||||
|
| |||||||
| Food Products - 0.7% | ||||||||
| Archer-Daniels-Midland Co. | 1,560 | 78,421 | ||||||
| INVESTMENTS | SHARES | VALUE | ||||||
| Food Products - 0.7% (continued) | ||||||||
| Ingredion, Inc. | 197 | $ | 20,677 | |||||
| Tyson Foods, Inc., Class A | 660 | 39,290 | ||||||
|
| |||||||
| 138,388 | ||||||||
|
| |||||||
| Gas Utilities - 0.0% (b) | ||||||||
| UGI Corp. | 146 | 8,100 | ||||||
|
| |||||||
| Health Care Equipment & Supplies - 5.8% | ||||||||
| Abbott Laboratories | 185 | 13,572 | ||||||
| ABIOMED, Inc. * | 334 | 150,216 | ||||||
| Align Technology, Inc. * | 253 | 98,979 | ||||||
| Baxter International, Inc. (a) | 2,432 | 187,483 | ||||||
| Boston Scientific Corp. * | 759 | 29,221 | ||||||
| Cantel Medical Corp. | 692 | 63,705 | ||||||
| Danaher Corp. | 560 | 60,850 | ||||||
| DexCom, Inc. * | 386 | 55,213 | ||||||
| Edwards Lifesciences Corp. * | 76 | 13,232 | ||||||
| Globus Medical, Inc., Class A * | 924 | 52,446 | ||||||
| Haemonetics Corp. * | 1,606 | 184,015 | ||||||
| Hill-Rom Holdings, Inc. | 149 | 14,066 | ||||||
| ICU Medical, Inc. * | 29 | 8,200 | ||||||
| IDEXX Laboratories, Inc. * | 16 | 3,995 | ||||||
| Intuitive Surgical, Inc. * | 138 | 79,212 | ||||||
| Medtronic plc | 857 | 84,303 | ||||||
| Varian Medical Systems, Inc. * | 28 | 3,134 | ||||||
|
| |||||||
| 1,101,842 | ||||||||
|
| |||||||
| Health Care Providers & Services - 4.2% | ||||||||
| Aetna, Inc. | 206 | 41,787 | ||||||
| Anthem, Inc. | 103 | 28,227 | ||||||
| Cardinal Health, Inc. | 527 | 28,458 | ||||||
| Centene Corp. * | 533 | 77,168 | ||||||
| Cigna Corp. | 433 | 90,172 | ||||||
| Envision Healthcare Corp. * | 76 | 3,475 | ||||||
| Express Scripts Holding Co. * | 375 | 35,629 | ||||||
| Humana, Inc. | 444 | 150,303 | ||||||
| McKesson Corp. | 445 | 59,029 | ||||||
| MEDNAX, Inc. * | 82 | 3,826 | ||||||
| UnitedHealth Group, Inc. | 540 | 143,662 | ||||||
| WellCare Health Plans, Inc. * | 451 | 144,541 | ||||||
|
| |||||||
| 806,277 | ||||||||
|
| |||||||
| Hotels, Restaurants & Leisure - 1.6% | ||||||||
| Darden Restaurants, Inc. | 434 | 48,257 | ||||||
| Extended Stay America, Inc. | 2,366 | 47,864 | ||||||
| Hyatt Hotels Corp., Class A | 323 | 25,708 | ||||||
| Las Vegas Sands Corp. | 1,691 | 100,327 | ||||||
| Starbucks Corp. | 143 | 8,128 | ||||||
| Wyndham Hotels & Resorts, Inc. | 78 | 4,334 | ||||||
| Wynn Resorts Ltd. | 484 | 61,497 | ||||||
|
| |||||||
| 296,115 | ||||||||
|
| |||||||
| Household Durables - 0.6% | ||||||||
| DR Horton, Inc. | 1,061 | 44,753 | ||||||
| NVR, Inc. * | 26 | 64,241 | ||||||
| Toll Brothers, Inc. | 294 | 9,711 | ||||||
|
| |||||||
| 118,705 | ||||||||
|
| |||||||
| Household Products - 0.2% | ||||||||
| Procter & Gamble Co. (The) | 383 | 31,877 | ||||||
|
| |||||||
| The accompanying notes are an integral part of these financial statements. | (Continued) |
| AQR Funds | Annual Report | September 2018 | ||||||||||||||
182
Table of Contents
| Schedule of Investments | September 30, 2018 |
| AQR LARGE CAP RELAXED CONSTRAINT EQUITY FUND |
| INVESTMENTS | SHARES | VALUE | ||||||
| Independent Power and Renewable Electricity Producers - 0.0% (b) | ||||||||
| Vistra Energy Corp. * | 156 | $ | 3,881 | |||||
|
| |||||||
| Industrial Conglomerates - 0.3% | ||||||||
| Honeywell International, Inc. | 390 | 64,896 | ||||||
|
| |||||||
| Insurance - 2.9% | ||||||||
| Aflac, Inc. | 2,284 | 107,508 | ||||||
| Allstate Corp. (The) | 1,082 | 106,793 | ||||||
| Assured Guaranty Ltd. | 946 | 39,950 | ||||||
| Everest Re Group Ltd. | 34 | 7,768 | ||||||
| Fidelity National Financial, Inc. (a) | 3,070 | 120,805 | ||||||
| First American Financial Corp. | 683 | 35,236 | ||||||
| Hanover Insurance Group, Inc. (The) | 140 | 17,272 | ||||||
| Progressive Corp. (The) | 105 | 7,459 | ||||||
| Reinsurance Group of America, Inc. | 372 | 53,776 | ||||||
| Travelers Cos., Inc. (The) | 419 | 54,348 | ||||||
| Unum Group | 72 | 2,813 | ||||||
|
| |||||||
| 553,728 | ||||||||
|
| |||||||
| Interactive Media & Services - 6.1% | ||||||||
| Alphabet, Inc., Class A *(a) | 209 | 252,280 | ||||||
| Alphabet, Inc., Class C *(a) | 210 | 250,629 | ||||||
| Facebook, Inc., Class A *(a) | 2,618 | 430,556 | ||||||
| IAC/InterActiveCorp * | 744 | 161,240 | ||||||
| Match Group, Inc. * | 483 | 27,970 | ||||||
| Twitter, Inc. * | 1,591 | 45,280 | ||||||
|
| |||||||
| 1,167,955 | ||||||||
|
| |||||||
| Internet & Direct Marketing Retail - 5.3% | ||||||||
| Amazon.com, Inc. *(a) | 356 | 713,068 | ||||||
| Booking Holdings, Inc. * | 65 | 128,960 | ||||||
| eBay, Inc. * | 795 | 26,251 | ||||||
| Netflix, Inc. * | 341 | 127,578 | ||||||
| TripAdvisor, Inc. * | 345 | 17,619 | ||||||
|
| |||||||
| 1,013,476 | ||||||||
|
| |||||||
| IT Services - 6.2% | ||||||||
| Accenture plc, Class A | 25 | 4,255 | ||||||
| Akamai Technologies, Inc. * | 780 | 57,057 | ||||||
| Booz Allen Hamilton Holding Corp. | 142 | 7,047 | ||||||
| Broadridge Financial Solutions, Inc. | 868 | 114,533 | ||||||
| Cognizant Technology Solutions Corp., Class A | 1,150 | 88,722 | ||||||
| DXC Technology Co. | 1,249 | 116,806 | ||||||
| EPAM Systems, Inc. * | 442 | 60,863 | ||||||
| International Business Machines Corp. (a) | 1,389 | 210,031 | ||||||
| Mastercard, Inc., Class A | 447 | 99,507 | ||||||
| MAXIMUS, Inc. | 863 | 56,147 | ||||||
| PayPal Holdings, Inc. *(a) | 1,858 | 163,207 | ||||||
| Science Applications International Corp. | 933 | 75,200 | ||||||
| Teradata Corp. * | 432 | 16,291 | ||||||
| Total System Services, Inc. | 1,050 | 103,677 | ||||||
| Twilio, Inc., Class A * | 173 | 14,926 | ||||||
|
| |||||||
| 1,188,269 | ||||||||
|
| |||||||
| Leisure Products - 0.3% | ||||||||
| Brunswick Corp. | 705 | 47,249 | ||||||
|
| |||||||
| Life Sciences Tools & Services - 1.1% | ||||||||
| Agilent Technologies, Inc. | 1,022 | 72,092 | ||||||
| INVESTMENTS | SHARES | VALUE | ||||||
| Life Sciences Tools & Services - 1.1% (continued) | ||||||||
| Bruker Corp. | 2,016 | $ | 67,435 | |||||
| Charles River Laboratories International, Inc. * | 160 | 21,526 | ||||||
| IQVIA Holdings, Inc. * | 29 | 3,763 | ||||||
| Thermo Fisher Scientific, Inc. | 210 | 51,257 | ||||||
|
| |||||||
| 216,073 | ||||||||
|
| |||||||
| Machinery - 2.2% | ||||||||
| Caterpillar, Inc. | 348 | 53,067 | ||||||
| Crane Co. | 326 | 32,062 | ||||||
| Cummins, Inc. | 655 | 95,676 | ||||||
| Ingersoll-Rand plc | 1,017 | 104,039 | ||||||
| ITT, Inc. | 832 | 50,968 | ||||||
| Oshkosh Corp. | 940 | 66,966 | ||||||
| PACCAR, Inc. | 159 | 10,842 | ||||||
|
| |||||||
| 413,620 | ||||||||
|
| |||||||
| Media - 0.9% | ||||||||
| Comcast Corp., Class A | 4,114 | 145,677 | ||||||
| John Wiley & Sons, Inc., Class A | 540 | 32,724 | ||||||
|
| |||||||
| 178,401 | ||||||||
|
| |||||||
| Metals & Mining - 1.3% | ||||||||
| Alcoa Corp. * | 1,592 | 64,317 | ||||||
| Freeport-McMoRan, Inc. | 4,131 | 57,503 | ||||||
| Reliance Steel & Aluminum Co. | 788 | 67,209 | ||||||
| Steel Dynamics, Inc. | 1,491 | 67,378 | ||||||
|
| |||||||
| 256,407 | ||||||||
|
| |||||||
| Multiline Retail - 2.9% | ||||||||
| Big Lots, Inc. | 280 | 11,701 | ||||||
| Dollar General Corp. | 38 | 4,153 | ||||||
| Kohl’s Corp. | 1,149 | 85,658 | ||||||
| Macy’s, Inc. | 3,389 | 117,700 | ||||||
| Ollie’s Bargain Outlet Holdings, Inc. * | 399 | 38,344 | ||||||
| Target Corp. (a) | 3,342 | 294,798 | ||||||
|
| |||||||
| 552,354 | ||||||||
|
| |||||||
| Multi-Utilities - 0.7% | ||||||||
| CenterPoint Energy, Inc. | 2,385 | 65,945 | ||||||
| MDU Resources Group, Inc. | 794 | 20,398 | ||||||
| NorthWestern Corp. | 903 | 52,970 | ||||||
|
| |||||||
| 139,313 | ||||||||
|
| |||||||
| Oil, Gas & Consumable Fuels - 9.8% | ||||||||
| Anadarko Petroleum Corp. | 2,487 | 167,649 | ||||||
| Chevron Corp. | 1,678 | 205,186 | ||||||
| CNX Resources Corp. * | 2,565 | 36,705 | ||||||
| ConocoPhillips (a) | 3,798 | 293,965 | ||||||
| CONSOL Energy, Inc. * | 916 | 37,382 | ||||||
| Devon Energy Corp. | 1,579 | 63,065 | ||||||
| Energen Corp. * | 60 | 5,170 | ||||||
| EOG Resources, Inc. | 436 | 55,621 | ||||||
| Exxon Mobil Corp. (a) | 2,388 | 203,028 | ||||||
| HollyFrontier Corp. | 2,920 | 204,108 | ||||||
| Marathon Oil Corp. | 3,930 | 91,490 | ||||||
| Marathon Petroleum Corp. | 365 | 29,189 | ||||||
| Newfield Exploration Co. * | 954 | 27,504 | ||||||
| Occidental Petroleum Corp. | 1,546 | 127,035 | ||||||
| PBF Energy, Inc., Class A | 511 | 25,504 | ||||||
| Phillips 66 | 619 | 69,774 | ||||||
| The accompanying notes are an integral part of these financial statements. | (Continued) |
| AQR Funds | Annual Report | September 2018 | ||||||||||||||
183
Table of Contents
| Schedule of Investments | September 30, 2018 |
| AQR LARGE CAP RELAXED CONSTRAINT EQUITY FUND |
| INVESTMENTS | SHARES | VALUE | ||||||
| Oil, Gas & Consumable Fuels - 9.8% (continued) | ||||||||
| Pioneer Natural Resources Co. | 96 | $ | 16,722 | |||||
| Southwestern Energy Co. * | 2,475 | 12,647 | ||||||
| Valero Energy Corp. | 1,367 | 155,496 | ||||||
| Whiting Petroleum Corp. * | 798 | 42,326 | ||||||
| World Fuel Services Corp. | 371 | 10,269 | ||||||
|
| |||||||
| 1,879,835 | ||||||||
|
| |||||||
| Personal Products - 0.1% | ||||||||
| Nu Skin Enterprises, Inc., Class A | 127 | 10,467 | ||||||
|
| |||||||
| Pharmaceuticals - 2.9% | ||||||||
| Bristol-Myers Squibb Co. | 793 | 49,230 | ||||||
| Johnson & Johnson (a) | 1,231 | 170,087 | ||||||
| Merck & Co., Inc. | 2,089 | 148,194 | ||||||
| Nektar Therapeutics * | 41 | 2,499 | ||||||
| Pfizer, Inc. (a) | 4,048 | 178,395 | ||||||
|
| |||||||
| 548,405 | ||||||||
|
| |||||||
| Professional Services - 1.0% | ||||||||
| Dun & Bradstreet Corp. (The) | 635 | 90,494 | ||||||
| ManpowerGroup, Inc. | 191 | 16,418 | ||||||
| Robert Half International, Inc. | 1,123 | 79,037 | ||||||
|
| |||||||
| 185,949 | ||||||||
|
| |||||||
| Road & Rail - 1.8% | ||||||||
| CSX Corp. | 668 | 49,465 | ||||||
| Kansas City Southern | 348 | 39,421 | ||||||
| Norfolk Southern Corp. | 732 | 132,126 | ||||||
| Old Dominion Freight Line, Inc. | 153 | 24,673 | ||||||
| Ryder System, Inc. | 111 | 8,111 | ||||||
| Union Pacific Corp. | 553 | 90,045 | ||||||
|
| |||||||
| 343,841 | ||||||||
|
| |||||||
| Semiconductors & Semiconductor Equipment - 7.3% | ||||||||
| Applied Materials, Inc. (a) | 3,370 | 130,250 | ||||||
| Cirrus Logic, Inc. * | 82 | 3,165 | ||||||
| First Solar, Inc. * | 1,062 | 51,422 | ||||||
| Intel Corp. (a) | 5,883 | 278,207 | ||||||
| KLA-Tencor Corp. | 541 | 55,025 | ||||||
| Lam Research Corp. | 531 | 80,553 | ||||||
| Marvell Technology Group Ltd. | 93 | 1,795 | ||||||
| Maxim Integrated Products, Inc. | 1,127 | 63,552 | ||||||
| Micron Technology, Inc. *(a) | 6,187 | 279,838 | ||||||
| MKS Instruments, Inc. | 355 | 28,453 | ||||||
| NVIDIA Corp. | 633 | 177,886 | ||||||
| ON Semiconductor Corp. * | 1,166 | 21,489 | ||||||
| Skyworks Solutions, Inc. | 1,010 | 91,617 | ||||||
| Texas Instruments, Inc. | 1,240 | 133,040 | ||||||
|
| |||||||
| 1,396,292 | ||||||||
|
| |||||||
| Software - 8.2% | ||||||||
| Adobe Systems, Inc. *(a) | 870 | 234,856 | ||||||
| Aspen Technology, Inc. * | 851 | 96,937 | ||||||
| Cadence Design Systems, Inc. * | 1,667 | 75,548 | ||||||
| Citrix Systems, Inc. * | 311 | 34,571 | ||||||
| Dell Technologies, Inc., Class V * | 464 | 45,064 | ||||||
| Fortinet, Inc. * | 758 | 69,941 | ||||||
| Intuit, Inc. | 237 | 53,894 | ||||||
| Manhattan Associates, Inc. * | 476 | 25,990 | ||||||
| INVESTMENTS | SHARES | VALUE | ||||||
| Software - 8.2% (continued) | ||||||||
| Microsoft Corp. (a) | 6,074 | $ | 694,683 | |||||
| Nutanix, Inc., Class A * | 363 | 15,507 | ||||||
| Oracle Corp. | 2,262 | 116,629 | ||||||
| Red Hat, Inc. * | 238 | 32,435 | ||||||
| salesforce.com, Inc. * | 217 | 34,509 | ||||||
| Splunk, Inc. * | 349 | 42,198 | ||||||
|
| |||||||
| 1,572,762 | ||||||||
|
| |||||||
| Specialty Retail - 6.2% | ||||||||
| American Eagle Outfitters, Inc. | 7,288 | 180,961 | ||||||
| AutoZone, Inc. * | 35 | 27,149 | ||||||
| Best Buy Co., Inc. | 1,337 | 106,104 | ||||||
| Burlington Stores, Inc. * | 966 | 157,381 | ||||||
| Foot Locker, Inc. | 3,927 | 200,198 | ||||||
| Gap, Inc. (The) | 2,741 | 79,078 | ||||||
| Home Depot, Inc. (The) | 410 | 84,932 | ||||||
| Lowe’s Cos., Inc. | 557 | 63,955 | ||||||
| Ross Stores, Inc. | 554 | 54,901 | ||||||
| TJX Cos., Inc. (The) | 933 | 104,515 | ||||||
| Urban Outfitters, Inc. * | 3,162 | 129,326 | ||||||
|
| |||||||
| 1,188,500 | ||||||||
|
| |||||||
| Technology Hardware, Storage & Peripherals - 4.0% | ||||||||
| Apple, Inc. (a) | 3,074 | 693,925 | ||||||
| Hewlett Packard Enterprise Co. | 193 | 3,148 | ||||||
| HP, Inc. | 2,051 | 52,854 | ||||||
| Seagate Technology plc | 176 | 8,334 | ||||||
| Western Digital Corp. | 280 | 16,391 | ||||||
|
| |||||||
| 774,652 | ||||||||
|
| |||||||
| Textiles, Apparel & Luxury Goods - 3.2% | ||||||||
| Carter’s, Inc. | 281 | 27,707 | ||||||
| Columbia Sportswear Co. | 138 | 12,844 | ||||||
| Deckers Outdoor Corp. * | 1,129 | 133,877 | ||||||
| Lululemon Athletica, Inc. * | 654 | 106,268 | ||||||
| Michael Kors Holdings Ltd. * | 3,226 | 221,174 | ||||||
| PVH Corp. | 21 | 3,032 | ||||||
| Ralph Lauren Corp. | 285 | 39,202 | ||||||
| Skechers U.S.A., Inc., Class A * | 2,599 | 72,590 | ||||||
|
| |||||||
| 616,694 | ||||||||
|
| |||||||
| Tobacco - 0.1% | ||||||||
| Philip Morris International, Inc. | 190 | 15,493 | ||||||
|
| |||||||
| Trading Companies & Distributors - 1.3% | ||||||||
| HD Supply Holdings, Inc. * | 1,905 | 81,515 | ||||||
| MSC Industrial Direct Co., Inc., Class A | 187 | 16,477 | ||||||
| United Rentals, Inc. * | 133 | 21,759 | ||||||
| WESCO International, Inc. * | 638 | 39,205 | ||||||
| WW Grainger, Inc. | 237 | 84,706 | ||||||
|
| |||||||
| 243,662 | ||||||||
|
| |||||||
TOTAL COMMON STOCKS |
| 24,172,647 | ||||||
|
| |||||||
| EXCHANGE TRADED FUNDS - 2.3% | ||||||||
SPDR S&P 500 ETF Trust | 1,531 | 445,092 | ||||||
|
| |||||||
| The accompanying notes are an integral part of these financial statements. | (Continued) |
| AQR Funds | Annual Report | September 2018 | ||||||||||||||
184
Table of Contents
| Schedule of Investments | September 30, 2018 |
| AQR LARGE CAP RELAXED CONSTRAINT EQUITY FUND |
| INVESTMENTS | SHARES | VALUE | ||||||
| SHORT-TERM INVESTMENTS - 1.4% | ||||||||
| Investment Companies - 1.4% | ||||||||
| BlackRock Liquidity Funds T-Fund Portfolio, Institutional Shares, 1.97% (c) | 2,728 | $ | 2,728 | |||||
| Dreyfus Treasury & Agency Cash Management, Institutional Shares, 1.96% (c) | 10,910 | 10,910 | ||||||
| Limited Purpose Cash Investment Fund, 2.06% (c) | 249,706 | 249,680 | ||||||
| UBS Select Treasury Preferred Fund, Class I, 1.97% (c) | 13,637 | 13,637 | ||||||
|
| |||||||
TOTAL SHORT-TERM INVESTMENTS (Cost $276,954) | 276,955 | |||||||
|
| |||||||
TOTAL LONG POSITIONS |
| 24,894,694 | ||||||
|
| |||||||
| SHORT POSITIONS - (29.5)% | ||||||||
| COMMON STOCKS - (29.5)% | ||||||||
| Airlines - (0.5)% | ||||||||
| American Airlines Group, Inc. | (753 | ) | (31,122 | ) | ||||
| Spirit Airlines, Inc. * | (1,330 | ) | (62,470 | ) | ||||
|
| |||||||
| (93,592 | ) | |||||||
|
| |||||||
| Auto Components - (0.5)% | ||||||||
| Adient plc | (2,397 | ) | (94,226 | ) | ||||
| Visteon Corp. * | (89 | ) | (8,268 | ) | ||||
|
| |||||||
| (102,494 | ) | |||||||
|
| |||||||
| Automobiles - (0.8)% | ||||||||
| Harley-Davidson, Inc. | (165 | ) | (7,474 | ) | ||||
| Tesla, Inc. * | (561 | ) | (148,536 | ) | ||||
|
| |||||||
| (156,010 | ) | |||||||
|
| |||||||
| Banks - (2.9)% | ||||||||
| Bank OZK | (79 | ) | (2,999 | ) | ||||
| Chemical Financial Corp. | (1,511 | ) | (80,687 | ) | ||||
| Home BancShares, Inc. | (2,012 | ) | (44,063 | ) | ||||
| Pinnacle Financial Partners, Inc. | (983 | ) | (59,128 | ) | ||||
| Sterling Bancorp | (9,134 | ) | (200,948 | ) | ||||
| Texas Capital Bancshares, Inc. * | (171 | ) | (14,133 | ) | ||||
| United Bankshares, Inc. | (3,987 | ) | (144,927 | ) | ||||
|
| |||||||
| (546,885 | ) | |||||||
|
| |||||||
| Biotechnology - (1.6)% | ||||||||
| Agios Pharmaceuticals, Inc. * | (939 | ) | (72,416 | ) | ||||
| Alkermes plc * | (344 | ) | (14,599 | ) | ||||
| Alnylam Pharmaceuticals, Inc. * | (393 | ) | (34,395 | ) | ||||
| BioMarin Pharmaceutical, Inc. * | (164 | ) | (15,903 | ) | ||||
| Bluebird Bio, Inc. * | (212 | ) | (30,952 | ) | ||||
| Exact Sciences Corp. * | (814 | ) | (64,241 | ) | ||||
| Ionis Pharmaceuticals, Inc. * | (142 | ) | (7,324 | ) | ||||
| OPKO Health, Inc. * | (9,487 | ) | (32,825 | ) | ||||
| Seattle Genetics, Inc. * | (530 | ) | (40,874 | ) | ||||
|
| |||||||
| (313,529 | ) | |||||||
|
| |||||||
| Capital Markets - (0.3)% | ||||||||
| Charles Schwab Corp. (The) | (400 | ) | (19,660 | ) | ||||
| MarketAxess Holdings, Inc. | (109 | ) | (19,456 | ) | ||||
| Stifel Financial Corp. | (482 | ) | (24,707 | ) | ||||
|
| |||||||
| (63,823 | ) | |||||||
|
| |||||||
| INVESTMENTS | SHARES | VALUE | ||||||
| Chemicals - (0.9)% | ||||||||
| Albemarle Corp. | (1,557 | ) | $ | (155,357 | ) | |||
| Platform Specialty Products Corp. * | (353 | ) | (4,402 | ) | ||||
| Valvoline, Inc. | (596 | ) | (12,820 | ) | ||||
|
| |||||||
| (172,579 | ) | |||||||
|
| |||||||
| Commercial Services & Supplies - (0.3)% | ||||||||
| Healthcare Services Group, Inc. | (1,244 | ) | (50,531 | ) | ||||
| Stericycle, Inc. * | (249 | ) | (14,612 | ) | ||||
|
| |||||||
| (65,143 | ) | |||||||
|
| |||||||
| Communications Equipment - (0.8)% | ||||||||
| CommScope Holding Co., Inc. * | (235 | ) | (7,229 | ) | ||||
| EchoStar Corp., Class A * | (311 | ) | (14,421 | ) | ||||
| NetScout Systems, Inc. * | (372 | ) | (9,393 | ) | ||||
| ViaSat, Inc. * | (1,891 | ) | (120,929 | ) | ||||
|
| |||||||
| (151,972 | ) | |||||||
|
| |||||||
| Construction & Engineering - 0.0% (b) | ||||||||
| Granite Construction, Inc. | (91 | ) | (4,159 | ) | ||||
|
| |||||||
| Containers & Packaging - (0.7)% | ||||||||
| Ball Corp. | (417 | ) | (18,344 | ) | ||||
| Crown Holdings, Inc. * | (2,226 | ) | (106,848 | ) | ||||
|
| |||||||
| (125,192 | ) | |||||||
|
| |||||||
| Diversified Telecommunication Services - (0.4)% | ||||||||
| CenturyLink, Inc. | (2,527 | ) | (53,572 | ) | ||||
| Zayo Group Holdings, Inc. * | (425 | ) | (14,756 | ) | ||||
|
| |||||||
| (68,328 | ) | |||||||
|
| |||||||
| Electric Utilities - (1.0)% | ||||||||
| PPL Corp. | (6,589 | ) | (192,794 | ) | ||||
|
| |||||||
| Electrical Equipment - 0.0% (b) | ||||||||
| GrafTech International Ltd. | (382 | ) | (7,453 | ) | ||||
|
| |||||||
| Electronic Equipment, Instruments & Components - (1.0)% | ||||||||
| Belden, Inc. | (1,445 | ) | (103,187 | ) | ||||
| Cognex Corp. | (964 | ) | (53,811 | ) | ||||
| Corning, Inc. | (787 | ) | (27,781 | ) | ||||
|
| |||||||
| (184,779 | ) | |||||||
|
| |||||||
| Energy Equipment & Services - (2.4)% | ||||||||
| Baker Hughes a GE Co. | (305 | ) | (10,318 | ) | ||||
| Core Laboratories NV | (162 | ) | (18,765 | ) | ||||
| Dril-Quip, Inc. * | (634 | ) | (33,127 | ) | ||||
| Ensco plc, Class A | (10,376 | ) | (87,573 | ) | ||||
| Nabors Industries Ltd. | (12,056 | ) | (74,265 | ) | ||||
| Rowan Cos. plc, Class A * | (2,548 | ) | (47,979 | ) | ||||
| Transocean Ltd. * | (4,732 | ) | (66,011 | ) | ||||
| Weatherford International plc * | (42,531 | ) | (115,259 | ) | ||||
|
| |||||||
| (453,297 | ) | |||||||
|
| |||||||
| Entertainment - (0.4)% | ||||||||
| Lions Gate Entertainment Corp., Class A | (569 | ) | (13,878 | ) | ||||
| Pandora Media, Inc. * | (7,114 | ) | (67,654 | ) | ||||
|
| |||||||
| (81,532 | ) | |||||||
|
| |||||||
| Food & Staples Retailing - (0.3)% | ||||||||
| Casey’s General Stores, Inc. | (214 | ) | (27,630 | ) | ||||
| The accompanying notes are an integral part of these financial statements. | (Continued) |
| AQR Funds | Annual Report | September 2018 | ||||||||||||||
185
Table of Contents
| Schedule of Investments | September 30, 2018 |
| AQR LARGE CAP RELAXED CONSTRAINT EQUITY FUND |
| INVESTMENTS | SHARES | VALUE | ||||||
| Food & Staples Retailing - (0.3)% (continued) | ||||||||
| Rite Aid Corp. * | (23,150 | ) | $ | (29,632 | ) | |||
|
| |||||||
| (57,262 | ) | |||||||
|
| |||||||
| Food Products - (1.5)% | ||||||||
| Campbell Soup Co. | (3,612 | ) | (132,308 | ) | ||||
| Hain Celestial Group, Inc. (The) * | (1,696 | ) | (45,996 | ) | ||||
| Kraft Heinz Co. (The) | (995 | ) | (54,834 | ) | ||||
| McCormick & Co., Inc. (Non-Voting) | (171 | ) | (22,529 | ) | ||||
| Post Holdings, Inc. * | (98 | ) | (9,608 | ) | ||||
| TreeHouse Foods, Inc. * | (297 | ) | (14,211 | ) | ||||
|
| |||||||
| (279,486 | ) | |||||||
|
| |||||||
| Health Care Providers & Services - (0.8)% | ||||||||
| Acadia Healthcare Co., Inc. * | (2,200 | ) | (77,440 | ) | ||||
| Henry Schein, Inc. * | (201 | ) | (17,091 | ) | ||||
| Premier, Inc., Class A * | (1,302 | ) | (59,606 | ) | ||||
|
| |||||||
| (154,137 | ) | |||||||
|
| |||||||
| Health Care Technology - (0.1)% | ||||||||
| Medidata Solutions, Inc. * | (342 | ) | (25,072 | ) | ||||
|
| |||||||
| Hotels, Restaurants & Leisure - (1.1)% | ||||||||
| Caesars Entertainment Corp. * | (17,290 | ) | (177,223 | ) | ||||
| Scientific Games Corp. * | (1,213 | ) | (30,810 | ) | ||||
|
| |||||||
| (208,033 | ) | |||||||
|
| |||||||
| Household Durables - (1.3)% | ||||||||
| Leggett & Platt, Inc. | (391 | ) | (17,122 | ) | ||||
| Newell Brands, Inc. | (7,967 | ) | (161,730 | ) | ||||
| Tempur Sealy International, Inc. * | (1,232 | ) | (65,173 | ) | ||||
|
| |||||||
| (244,025 | ) | |||||||
|
| |||||||
| Insurance - (0.1)% | ||||||||
| Kemper Corp. | (286 | ) | (23,009 | ) | ||||
| ProAssurance Corp. | (128 | ) | (6,009 | ) | ||||
|
| |||||||
| (29,018 | ) | |||||||
|
| |||||||
| IT Services - (0.6)% | ||||||||
| Gartner, Inc. * | (742 | ) | (117,607 | ) | ||||
|
| |||||||
| Leisure Products - (0.3)% | ||||||||
| Mattel, Inc. * | (3,538 | ) | (55,547 | ) | ||||
|
| |||||||
| Life Sciences Tools & Services - (0.2)% | ||||||||
| Syneos Health, Inc. * | (775 | ) | (39,951 | ) | ||||
|
| |||||||
| Machinery - (1.4)% | ||||||||
| Colfax Corp. * | (2,426 | ) | (87,481 | ) | ||||
| Flowserve Corp. | (1,888 | ) | (103,255 | ) | ||||
| Middleby Corp. (The) * | (443 | ) | (57,302 | ) | ||||
| Wabtec Corp. | (136 | ) | (14,264 | ) | ||||
|
| |||||||
| (262,302 | ) | |||||||
|
| |||||||
| Media - (2.4)% | ||||||||
| Charter Communications, Inc., Class A * | (192 | ) | (62,569 | ) | ||||
| Discovery, Inc., Class A * | (6,100 | ) | (195,200 | ) | ||||
| DISH Network Corp., Class A * | (330 | ) | (11,801 | ) | ||||
| GCI Liberty, Inc., Class A * | (922 | ) | (47,022 | ) | ||||
| Liberty Broadband Corp., Class C * | (205 | ) | (17,281 | ) | ||||
| Meredith Corp. | (830 | ) | (42,371 | ) | ||||
| INVESTMENTS | SHARES | VALUE | ||||||
| Media - (2.4)% (continued) | ||||||||
| New York Times Co. (The), Class A | (3,199 | ) | $ | (74,057 | ) | |||
| Sirius XM Holdings, Inc. | (1,774 | ) | (11,212 | ) | ||||
|
| |||||||
| (461,513 | ) | |||||||
|
| |||||||
| Metals & Mining - (1.2)% | ||||||||
| Allegheny Technologies, Inc. * | (3,774 | ) | (111,522 | ) | ||||
| Compass Minerals International, Inc. | (608 | ) | (40,858 | ) | ||||
| Royal Gold, Inc. | (1,056 | ) | (81,375 | ) | ||||
|
| |||||||
| (233,755 | ) | |||||||
|
| |||||||
| Multi-Utilities - (0.1)% | ||||||||
| Black Hills Corp. | (399 | ) | (23,178 | ) | ||||
|
| |||||||
| Oil, Gas & Consumable Fuels - (0.7)% | ||||||||
| Callon Petroleum Co. * | (2,932 | ) | (35,155 | ) | ||||
| Chesapeake Energy Corp. * | (3,303 | ) | (14,830 | ) | ||||
| Extraction Oil & Gas, Inc. * | (523 | ) | (5,905 | ) | ||||
| Matador Resources Co. * | (563 | ) | (18,607 | ) | ||||
| Targa Resources Corp. | (1,097 | ) | (61,772 | ) | ||||
|
| |||||||
| (136,269 | ) | |||||||
|
| |||||||
| Personal Products - (0.3)% | ||||||||
| Coty, Inc., Class A | (4,083 | ) | (51,283 | ) | ||||
|
| |||||||
| Pharmaceuticals - (0.3)% | ||||||||
| Akorn, Inc. * | (1,668 | ) | (21,651 | ) | ||||
| Prestige Consumer Healthcare, Inc. * | (846 | ) | (32,055 | ) | ||||
|
| |||||||
| (53,706 | ) | |||||||
|
| |||||||
| Semiconductors & Semiconductor Equipment - (0.9)% | ||||||||
| Advanced Micro Devices, Inc. * | (2,313 | ) | (71,448 | ) | ||||
| Cree, Inc. * | (132 | ) | (4,999 | ) | ||||
| Cypress Semiconductor Corp. | (185 | ) | (2,681 | ) | ||||
| Microchip Technology, Inc. | (41 | ) | (3,235 | ) | ||||
| Universal Display Corp. | (709 | ) | (83,591 | ) | ||||
|
| |||||||
| (165,954 | ) | |||||||
|
| |||||||
| Software - (0.2)% | ||||||||
| FireEye, Inc. * | (1,310 | ) | (22,270 | ) | ||||
| Workday, Inc., Class A * | (69 | ) | (10,073 | ) | ||||
|
| |||||||
| (32,343 | ) | |||||||
|
| |||||||
| Specialty Retail - (0.7)% | ||||||||
| CarMax, Inc. * | (734 | ) | (54,808 | ) | ||||
| Floor & Decor Holdings, Inc., Class A * | (873 | ) | (26,338 | ) | ||||
| L Brands, Inc. | (899 | ) | (27,240 | ) | ||||
| Office Depot, Inc. | (7,198 | ) | (23,105 | ) | ||||
|
| |||||||
| (131,491 | ) | |||||||
|
| |||||||
| Technology Hardware, Storage & Peripherals - (0.1)% | ||||||||
| NCR Corp. * | (701 | ) | (19,915 | ) | ||||
|
| |||||||
| Textiles, Apparel & Luxury Goods - (0.3)% | ||||||||
| Under Armour, Inc., Class A * | (2,810 | ) | (59,628 | ) | ||||
|
| |||||||
| Thrifts & Mortgage Finance - 0.0% (b) | ||||||||
| LendingTree, Inc. * | (22 | ) | (5,062 | ) | ||||
|
| |||||||
| The accompanying notes are an integral part of these financial statements. | (Continued) |
| AQR Funds | Annual Report | September 2018 | ||||||||||||||
186
Table of Contents
| Schedule of Investments | September 30, 2018 |
| AQR LARGE CAP RELAXED CONSTRAINT EQUITY FUND |
| INVESTMENTS | SHARES | VALUE | ||||||
| Trading Companies & Distributors - (0.1)% | ||||||||
| NOW, Inc. * | (1,457 | ) | $ | (24,113 | ) | |||
|
| |||||||
TOTAL COMMON STOCKS |
| (5,654,211 | ) | |||||
|
| |||||||
TOTAL SHORT POSITIONS |
| (5,654,211 | ) | |||||
|
| |||||||
TOTAL INVESTMENTS IN SECURITIES AT | 19,240,483 | |||||||
|
| |||||||
| LIABILITIES IN EXCESS OF OTHER ASSETS - (0.5)% | (96,313) | |||||||
|
| |||||||
| NET ASSETS - 100.0% | $19,144,170 | |||||||
|
| |||||||
| SECTOR | VALUE | % OF NET ASSETS | ||||||
| Communication Services | $ | 1,147,760 | 6.0 | % | ||||
| Consumer Discretionary | 3,025,791 | 15.8 | ||||||
| Consumer Staples | 143,158 | 0.7 | ||||||
| Energy | 1,398,951 | 7.3 | ||||||
| Exchange Traded Funds | 445,092 | 2.3 | ||||||
| Financials | 1,681,755 | 8.8 | ||||||
| Health Care | 2,970,475 | 15.5 | ||||||
| Industrials | 2,467,679 | 12.9 | ||||||
| Information Technology | 4,608,289 | 24.1 | ||||||
| Materials | 376,160 | 2.0 | ||||||
| Real Estate | 527,050 | 2.8 | ||||||
| Utilities | 171,368 | 0.9 | ||||||
| Short-Term Investments | 276,955 | 1.4 | ||||||
|
|
|
| |||||
Total Investments In Securities At Value | 19,240,483 | 100.5 | ||||||
| Liabilities in Excess of Other Assets | (96,313 | ) | (0.5 | ) | ||||
|
|
|
| |||||
Net Assets | $ | 19,144,170 | 100.0 | % | ||||
|
|
|
| |||||
All securities are United States companies, unless noted otherwise in parentheses.
| * | Non-income producing security. |
| (a) | All or a portion of this security is segregated in connection with obligations for securities sold short with a total value of $6,220,510. |
| (b) | Represents less than 0.05% of net assets. |
| (c) | Represents 7-day effective yield as of September 30, 2018. |
All securities are Level 1 with respect to ASC 820 (See Note 4).
Abbreviations
SPDR - Standard & Poor’s Depositary Receipt
| The accompanying notes are an integral part of these financial statements. |
| AQR Funds | Annual Report | September 2018 | ||||||||||||||
187
Table of Contents
| Schedule of Investments | September 30, 2018 |
| AQR SMALL CAP RELAXED CONSTRAINT EQUITY FUND |
| INVESTMENTS | SHARES | VALUE | ||||||
| LONG POSITIONS - 131.8% | ||||||||
| COMMON STOCKS - 128.6% | ||||||||
| Aerospace & Defense - 2.4% | ||||||||
| AAR Corp. | 153 | $ | 7,327 | |||||
| Axon Enterprise, Inc. * | 121 | 8,280 | ||||||
| Engility Holdings, Inc. * | 37 | 1,332 | ||||||
| Esterline Technologies Corp. *(a) | 177 | 16,098 | ||||||
| KLX, Inc. * | 78 | 4,897 | ||||||
| Moog, Inc., Class A | 159 | 13,669 | ||||||
| Vectrus, Inc. * | 922 | 28,757 | ||||||
|
| |||||||
| 80,360 | ||||||||
|
| |||||||
| Air Freight & Logistics - 0.3% | ||||||||
| Hub Group, Inc., Class A * | 190 | 8,664 | ||||||
|
| |||||||
| Airlines - 0.2% | ||||||||
| Allegiant Travel Co. | 14 | 1,775 | ||||||
| SkyWest, Inc. | 80 | 4,712 | ||||||
|
| |||||||
| 6,487 | ||||||||
|
| |||||||
| Auto Components - 2.0% | ||||||||
| Cooper-Standard Holdings, Inc. * | 88 | 10,558 | ||||||
| Dana, Inc. | 124 | 2,315 | ||||||
| Stoneridge, Inc. * | 726 | 21,577 | ||||||
| Tenneco, Inc. | 153 | 6,447 | ||||||
| Tower International, Inc. | 846 | 25,592 | ||||||
|
| |||||||
| 66,489 | ||||||||
|
| |||||||
| Banks - 7.6% | ||||||||
| 1st Source Corp. (a) | 288 | 15,154 | ||||||
| BancFirst Corp. | 85 | 5,096 | ||||||
| Bancorp, Inc. (The) * | 1,362 | 13,062 | ||||||
| Bank of Marin Bancorp | 29 | 2,433 | ||||||
| Cathay General Bancorp | 109 | 4,517 | ||||||
| Central Pacific Financial Corp. | 292 | 7,717 | ||||||
| CoBiz Financial, Inc. | 184 | 4,074 | ||||||
| Community Trust Bancorp, Inc. | 102 | 4,728 | ||||||
| Customers Bancorp, Inc. * | 231 | 5,435 | ||||||
| Eagle Bancorp, Inc. * | 223 | 11,284 | ||||||
| Fidelity Southern Corp. | 51 | 1,264 | ||||||
| Financial Institutions, Inc. | 365 | 11,461 | ||||||
| First Bancorp/PR * | 3,428 | 31,195 | ||||||
| First Busey Corp. | 96 | 2,981 | ||||||
| First of Long Island Corp. (The) | 111 | 2,414 | ||||||
| Fulton Financial Corp. | 233 | 3,879 | ||||||
| Great Southern Bancorp, Inc. | 248 | 13,727 | ||||||
| Great Western Bancorp, Inc. | 114 | 4,810 | ||||||
| Hanmi Financial Corp. | 468 | 11,653 | ||||||
| Hilltop Holdings, Inc. | 612 | 12,344 | ||||||
| IBERIABANK Corp. | 37 | 3,010 | ||||||
| Independent Bank Corp./MI | 753 | 17,808 | ||||||
| International Bancshares Corp. (a) | 365 | 16,425 | ||||||
| Investors Bancorp, Inc. | 203 | 2,491 | ||||||
| MB Financial, Inc. | 134 | 6,179 | ||||||
| Mercantile Bank Corp. | 63 | 2,102 | ||||||
| National Commerce Corp. * | 126 | 5,204 | ||||||
| OFG Bancorp | 100 | 1,615 | ||||||
| Opus Bank | 20 | 548 | ||||||
| Peapack Gladstone Financial Corp. | 123 | 3,799 | ||||||
| INVESTMENTS | SHARES | VALUE | ||||||
| Banks - 7.6% (continued) | ||||||||
| Sandy Spring Bancorp, Inc. | 131 | $ | 5,150 | |||||
| TriCo Bancshares | 117 | 4,518 | ||||||
| Triumph Bancorp, Inc. * | 164 | 6,265 | ||||||
| United Community Banks, Inc. | 185 | 5,160 | ||||||
|
| |||||||
| 249,502 | ||||||||
|
| |||||||
| Beverages - 0.0% (b) | ||||||||
| National Beverage Corp. * | 11 | 1,283 | ||||||
|
| |||||||
| Biotechnology - 6.7% | ||||||||
| Acorda Therapeutics, Inc. * | 423 | 8,312 | ||||||
| Adverum Biotechnologies, Inc. * | 411 | 2,487 | ||||||
| Amicus Therapeutics, Inc. * | 215 | 2,599 | ||||||
| Arena Pharmaceuticals, Inc. * | 79 | 3,636 | ||||||
| Array BioPharma, Inc. * | 252 | 3,830 | ||||||
| Blueprint Medicines Corp. * | 10 | 781 | ||||||
| CareDx, Inc. * | 286 | 8,251 | ||||||
| Catalyst Biosciences, Inc. * | 188 | 2,027 | ||||||
| Clovis Oncology, Inc. * | 52 | 1,527 | ||||||
| Concert Pharmaceuticals, Inc. * | 373 | 5,535 | ||||||
| CytomX Therapeutics, Inc. * | 56 | 1,036 | ||||||
| Eagle Pharmaceuticals, Inc. * | 55 | 3,813 | ||||||
| Emergent BioSolutions, Inc. *(a) | 282 | 18,564 | ||||||
| Enanta Pharmaceuticals, Inc. *(a) | 186 | 15,896 | ||||||
| FibroGen, Inc. * | 104 | 6,318 | ||||||
| Genomic Health, Inc. *(a) | 388 | 27,245 | ||||||
| Halozyme Therapeutics, Inc. * | 187 | 3,398 | ||||||
| ImmunoGen, Inc. * | 174 | 1,648 | ||||||
| Insmed, Inc. * | 120 | 2,426 | ||||||
| Intercept Pharmaceuticals, Inc. * | 33 | 4,170 | ||||||
| Ligand Pharmaceuticals, Inc. * | 26 | 7,137 | ||||||
| Loxo Oncology, Inc. * | 53 | 9,054 | ||||||
| Mirati Therapeutics, Inc. * | 83 | 3,909 | ||||||
| Momenta Pharmaceuticals, Inc. * | 20 | 526 | ||||||
| Myriad Genetics, Inc. *(a) | 437 | 20,102 | ||||||
| Natera, Inc. * | 27 | 646 | ||||||
| Palatin Technologies, Inc. * | 1,021 | 1,018 | ||||||
| PDL BioPharma, Inc. * | 3,120 | 8,206 | ||||||
| Pieris Pharmaceuticals, Inc. * | 332 | 1,859 | ||||||
| Portola Pharmaceuticals, Inc. * | 71 | 1,891 | ||||||
| PTC Therapeutics, Inc. * | 84 | 3,948 | ||||||
| Puma Biotechnology, Inc. * | 41 | 1,880 | ||||||
| REGENXBIO, Inc. *(a) | 240 | 18,120 | ||||||
| Sangamo Therapeutics, Inc. * | 144 | 2,441 | ||||||
| Spectrum Pharmaceuticals, Inc. * | 419 | 7,039 | ||||||
| Vericel Corp. * | 628 | 8,886 | ||||||
|
| |||||||
| 220,161 | ||||||||
|
| |||||||
| Building Products - 3.5% | ||||||||
| Armstrong Flooring, Inc. * | 303 | 5,484 | ||||||
| Builders FirstSource, Inc. * | 778 | 11,421 | ||||||
| Continental Building Products, Inc. *(a) | 743 | 27,900 | ||||||
| CSW Industrials, Inc. * | 238 | 12,781 | ||||||
| Insteel Industries, Inc. | 129 | 4,628 | ||||||
| NCI Building Systems, Inc. *(a) | 1,882 | 28,512 | ||||||
| PGT Innovations, Inc. * | 459 | 9,914 | ||||||
| Simpson Manufacturing Co., Inc. | 136 | 9,855 | ||||||
| Universal Forest Products, Inc. | 126 | 4,452 | ||||||
|
| |||||||
| 114,947 | ||||||||
|
| |||||||
| The accompanying notes are an integral part of these financial statements. | (Continued) |
| AQR Funds | Annual Report | September 2018 | ||||||||||||||
188
Table of Contents
| Schedule of Investments | September 30, 2018 |
| AQR SMALL CAP RELAXED CONSTRAINT EQUITY FUND |
| INVESTMENTS | SHARES | VALUE | ||||||
| Capital Markets - 0.9% | ||||||||
| Blucora, Inc. * | 122 | $ | 4,910 | |||||
| BrightSphere Investment Group plc | 118 | 1,463 | ||||||
| Diamond Hill Investment Group, Inc. | 4 | 661 | ||||||
| Federated Investors, Inc., Class B | 280 | 6,754 | ||||||
| Investment Technology Group, Inc. | 298 | 6,455 | ||||||
| Oppenheimer Holdings, Inc., Class A | 263 | 8,311 | ||||||
| Waddell & Reed Financial, Inc., Class A | 39 | 826 | ||||||
|
| |||||||
| 29,380 | ||||||||
|
| |||||||
| Chemicals - 3.6% | ||||||||
| AdvanSix, Inc. * | 337 | 11,441 | ||||||
| FutureFuel Corp. | 1,552 | 28,774 | ||||||
| Hawkins, Inc. | 119 | 4,933 | ||||||
| Ingevity Corp. * | 59 | 6,011 | ||||||
| Innospec, Inc. | 34 | 2,609 | ||||||
| Kraton Corp. * | 113 | 5,328 | ||||||
| OMNOVA Solutions, Inc. * | 1,217 | 11,987 | ||||||
| PolyOne Corp. | 248 | 10,843 | ||||||
| Stepan Co. | 78 | 6,787 | ||||||
| Trinseo SA (a) | 350 | 27,405 | ||||||
| Valhi, Inc. | 1,516 | 3,456 | ||||||
|
| |||||||
| 119,574 | ||||||||
|
| |||||||
| Commercial Services & Supplies - 3.4% | ||||||||
| Brady Corp., Class A | 73 | 3,194 | ||||||
| Ennis, Inc. | 218 | 4,458 | ||||||
| Heritage-Crystal Clean, Inc. * | 659 | 14,070 | ||||||
| Herman Miller, Inc. | 208 | 7,987 | ||||||
| Interface, Inc. (a) | 722 | 16,859 | ||||||
| Kimball International, Inc., Class B | 686 | 11,490 | ||||||
| McGrath RentCorp (a) | 311 | 16,940 | ||||||
| Pitney Bowes, Inc. | 358 | 2,535 | ||||||
| SP Plus Corp. * | 299 | 10,913 | ||||||
| Steelcase, Inc., Class A | 663 | 12,265 | ||||||
| UniFirst Corp. | 27 | 4,689 | ||||||
| VSE Corp. | 163 | 5,400 | ||||||
|
| |||||||
| 110,800 | ||||||||
|
| |||||||
| Communications Equipment - 0.7% | ||||||||
| Aerohive Networks, Inc. * | 2,741 | 11,293 | ||||||
| Comtech Telecommunications Corp. | 19 | 689 | ||||||
| NETGEAR, Inc. * | 74 | 4,651 | ||||||
| Ribbon Communications, Inc. * | 702 | 4,795 | ||||||
|
| |||||||
| 21,428 | ||||||||
|
| |||||||
| Construction & Engineering - 1.4% | ||||||||
| Comfort Systems USA, Inc. | 115 | 6,486 | ||||||
| EMCOR Group, Inc. (a) | 170 | 12,769 | ||||||
| KBR, Inc. (a) | 717 | 15,150 | ||||||
| MYR Group, Inc. * | 13 | 424 | ||||||
| Primoris Services Corp. | 407 | 10,102 | ||||||
|
| |||||||
| 44,931 | ||||||||
|
| |||||||
| Consumer Finance - 0.9% | ||||||||
| Enova International, Inc. * | 354 | 10,195 | ||||||
| FirstCash, Inc. | 49 | 4,018 | ||||||
| Green Dot Corp., Class A * | 68 | 6,040 | ||||||
| LendingClub Corp. * | 451 | 1,750 | ||||||
| Regional Management Corp. * | 277 | 7,986 | ||||||
|
| |||||||
| 29,989 | ||||||||
|
| |||||||
| INVESTMENTS | SHARES | VALUE | ||||||
| Diversified Consumer Services - 1.9% | ||||||||
| Adtalem Global Education, Inc. * | 96 | $ | 4,627 | |||||
| American Public Education, Inc. * | 725 | 23,961 | ||||||
| Cambium Learning Group, Inc. * | 735 | 8,702 | ||||||
| Career Education Corp. * | 544 | 8,122 | ||||||
| K12, Inc. * | 474 | 8,390 | ||||||
| Strategic Education, Inc. | 16 | 2,193 | ||||||
| Weight Watchers International, Inc. * | 75 | 5,399 | ||||||
|
| |||||||
| 61,394 | ||||||||
|
| |||||||
| Diversified Telecommunication Services - 0.0% (b) | ||||||||
| Vonage Holdings Corp. * | 58 | 821 | ||||||
|
| |||||||
| Electrical Equipment - 1.4% | ||||||||
| Allied Motion Technologies, Inc. | 49 | 2,667 | ||||||
| Atkore International Group, Inc. *(a) | 1,027 | 27,246 | ||||||
| Encore Wire Corp. | 141 | 7,064 | ||||||
| EnerSys | 68 | 5,925 | ||||||
| Generac Holdings, Inc. * | 48 | 2,708 | ||||||
| Vicor Corp. * | 38 | 1,748 | ||||||
|
| |||||||
| 47,358 | ||||||||
|
| |||||||
| Electronic Equipment, Instruments & Components - 2.5% | ||||||||
| Anixter International, Inc. * | 36 | 2,531 | ||||||
| Control4 Corp. * | 203 | 6,969 | ||||||
| Electro Scientific Industries, Inc. * | 199 | 3,472 | ||||||
| ePlus, Inc. *(a) | 187 | 17,335 | ||||||
| FARO Technologies, Inc. * | 49 | 3,153 | ||||||
| Insight Enterprises, Inc. *(a) | 365 | 19,743 | ||||||
| KEMET Corp. * | 539 | 9,998 | ||||||
| Methode Electronics, Inc. | 63 | 2,280 | ||||||
| Rogers Corp. * | 34 | 5,009 | ||||||
| ScanSource, Inc. * | 84 | 3,352 | ||||||
| SYNNEX Corp. | 47 | 3,981 | ||||||
| Tech Data Corp. * | 7 | 501 | ||||||
| Vishay Precision Group, Inc. * | 107 | 4,002 | ||||||
|
| |||||||
| 82,326 | ||||||||
|
| |||||||
| Energy Equipment & Services - 1.1% | ||||||||
| ION Geophysical Corp. * | 241 | 3,747 | ||||||
| KLX Energy Services Holdings, Inc. * | 31 | 999 | ||||||
| Mammoth Energy Services, Inc. | 182 | 5,296 | ||||||
| Matrix Service Co. * | 823 | 20,287 | ||||||
| Ocean Rig UDW, Inc., Class A (Angola) * | 79 | 2,735 | ||||||
| Pioneer Energy Services Corp. * | 1 | 3 | ||||||
| Profire Energy, Inc. * | 499 | 1,592 | ||||||
|
| |||||||
| 34,659 | ||||||||
|
| |||||||
| Entertainment - 0.2% | ||||||||
| Rosetta Stone, Inc. * | 345 | 6,862 | ||||||
|
| |||||||
| Equity Real Estate Investment Trusts (REITs) - 1.5% | ||||||||
| Alexander’s, Inc. | 3 | 1,030 | ||||||
| Ashford Hospitality Trust, Inc. | 435 | 2,780 | ||||||
| Cedar Realty Trust, Inc. | 595 | 2,773 | ||||||
| CoreCivic, Inc. | 175 | 4,258 | ||||||
| CorePoint Lodging, Inc. | 63 | 1,225 | ||||||
| GEO Group, Inc. (The) | 115 | 2,893 | ||||||
| Getty Realty Corp. | 183 | 5,226 | ||||||
| Gramercy Property Trust | 249 | 6,832 | ||||||
| Kite Realty Group Trust | 180 | 2,997 | ||||||
| The accompanying notes are an integral part of these financial statements. | (Continued) |
| AQR Funds | Annual Report | September 2018 | ||||||||||||||
189
Table of Contents
| Schedule of Investments | September 30, 2018 |
| AQR SMALL CAP RELAXED CONSTRAINT EQUITY FUND |
| INVESTMENTS | SHARES | VALUE | ||||||
| Equity Real Estate Investment Trusts (REITs) - 1.5% (continued) | ||||||||
| LaSalle Hotel Properties | 179 | $ | 6,192 | |||||
| MedEquities Realty Trust, Inc. | 118 | 1,147 | ||||||
| Ramco-Gershenson Properties Trust | 136 | 1,850 | ||||||
| Select Income REIT | 133 | 2,918 | ||||||
| Xenia Hotels & Resorts, Inc. | 337 | 7,987 | ||||||
|
| |||||||
| 50,108 | ||||||||
|
| |||||||
| Food & Staples Retailing - 0.1% | ||||||||
| Performance Food Group Co. * | 79 | 2,631 | ||||||
| SpartanNash Co. | 44 | 882 | ||||||
|
| |||||||
| 3,513 | ||||||||
|
| |||||||
| Food Products - 0.9% | ||||||||
| Darling Ingredients, Inc. * | 507 | 9,795 | ||||||
| Dean Foods Co. | 142 | 1,008 | ||||||
| John B Sanfilippo & Son, Inc. | 150 | 10,707 | ||||||
| Sanderson Farms, Inc. | 94 | 9,717 | ||||||
|
| |||||||
| 31,227 | ||||||||
|
| |||||||
| Health Care Equipment & Supplies - 7.6% | ||||||||
| AngioDynamics, Inc. * | 159 | 3,457 | ||||||
| Atrion Corp. | 1 | 695 | ||||||
| Cardiovascular Systems, Inc. * | 303 | 11,859 | ||||||
| Cerus Corp. * | 886 | 6,388 | ||||||
| Cutera, Inc. * | 196 | 6,380 | ||||||
| Globus Medical, Inc., Class A *(a) | 364 | 20,661 | ||||||
| Haemonetics Corp. *(a) | 238 | 27,270 | ||||||
| Inogen, Inc. *(a) | 73 | 17,821 | ||||||
| Integer Holdings Corp. * | 20 | 1,659 | ||||||
| IntriCon Corp. * | 137 | 7,699 | ||||||
| Lantheus Holdings, Inc. * | 833 | 12,453 | ||||||
| LeMaitre Vascular, Inc. | 324 | 12,552 | ||||||
| LivaNova plc * | 14 | 1,735 | ||||||
| Meridian Bioscience, Inc. | 59 | 879 | ||||||
| Merit Medical Systems, Inc. * | 148 | 9,095 | ||||||
| Natus Medical, Inc. * | 178 | 6,346 | ||||||
| Novocure Ltd. * | 334 | 17,502 | ||||||
| NuVasive, Inc. * | 51 | 3,620 | ||||||
| OraSure Technologies, Inc. * | 371 | 5,732 | ||||||
| Orthofix Medical, Inc. * | 224 | 12,949 | ||||||
| STAAR Surgical Co. *(a) | 508 | 24,384 | ||||||
| Surmodics, Inc. * | 188 | 14,034 | ||||||
| Tandem Diabetes Care, Inc. *(a) | 493 | 21,120 | ||||||
| Utah Medical Products, Inc. | 54 | 5,087 | ||||||
|
| |||||||
| 251,377 | ||||||||
|
| |||||||
| Health Care Providers & Services - 3.0% | ||||||||
| Addus HomeCare Corp. * | 106 | 7,436 | ||||||
| Amedisys, Inc. * | 64 | 7,997 | ||||||
| Civitas Solutions, Inc. * | 212 | 3,127 | ||||||
| CorVel Corp. *(a) | 294 | 17,714 | ||||||
| Cross Country Healthcare, Inc. * | 375 | 3,274 | ||||||
| LHC Group, Inc. * | 13 | 1,339 | ||||||
| LifePoint Health, Inc. * | 52 | 3,349 | ||||||
| Magellan Health, Inc. * | 145 | 10,447 | ||||||
| National HealthCare Corp. | 63 | 4,748 | ||||||
| Patterson Cos., Inc. | 114 | 2,787 | ||||||
| Providence Service Corp. (The) * | 63 | 4,239 | ||||||
| RadNet, Inc. * | 1,406 | 21,160 | ||||||
| INVESTMENTS | SHARES | VALUE | ||||||
| Health Care Providers & Services - 3.0% (continued) | ||||||||
| Tenet Healthcare Corp. * | 23 | $ | 655 | |||||
| Triple-S Management Corp., Class B * | 552 | 10,427 | ||||||
|
| |||||||
| 98,699 | ||||||||
|
| |||||||
| Health Care Technology - 1.8% | ||||||||
| Castlight Health, Inc., Class B * | 3,944 | 10,649 | ||||||
| HealthStream, Inc. | 629 | 19,505 | ||||||
| HMS Holdings Corp. * | 432 | 14,174 | ||||||
| Inovalon Holdings, Inc., Class A * | 67 | 673 | ||||||
| Tabula Rasa HealthCare, Inc. *(a) | 192 | 15,589 | ||||||
|
| |||||||
| 60,590 | ||||||||
|
| |||||||
| Hotels, Restaurants & Leisure - 3.5% | ||||||||
| BJ’s Restaurants, Inc. (a) | 217 | 15,667 | ||||||
| Bloomin’ Brands, Inc. | 683 | 13,517 | ||||||
| Bojangles’, Inc. * | 118 | 1,853 | ||||||
| Boyd Gaming Corp. | 256 | 8,666 | ||||||
| Carrols Restaurant Group, Inc. * | 208 | 3,037 | ||||||
| Cheesecake Factory, Inc. (The) | 8 | 428 | ||||||
| Dave & Buster’s Entertainment, Inc. * | 204 | 13,509 | ||||||
| Del Frisco’s Restaurant Group, Inc. * | 279 | 2,316 | ||||||
| International Speedway Corp., Class A | 118 | 5,168 | ||||||
| Marriott Vacations Worldwide Corp. | 3 | 335 | ||||||
| Monarch Casino & Resort, Inc. * | 70 | 3,182 | ||||||
| OBH, Inc. * | 9 | 1,632 | ||||||
| Penn National Gaming, Inc. *(a) | 483 | 15,900 | ||||||
| Pinnacle Entertainment, Inc. * | 83 | 2,796 | ||||||
| RCI Hospitality Holdings, Inc. | 118 | 3,494 | ||||||
| Ruth’s Hospitality Group, Inc. | 571 | 18,015 | ||||||
| Texas Roadhouse, Inc. | 30 | 2,079 | ||||||
| Town Sports International Holdings, Inc. * | 373 | 3,226 | ||||||
|
| |||||||
| 114,820 | ||||||||
|
| |||||||
| Household Durables - 1.4% | ||||||||
| Cavco Industries, Inc. * | 36 | 9,108 | ||||||
| Flexsteel Industries, Inc. | 167 | 4,967 | ||||||
| Hooker Furniture Corp. | 22 | 744 | ||||||
| La-Z-Boy, Inc. | 69 | 2,180 | ||||||
| Meritage Homes Corp. * | 62 | 2,474 | ||||||
| Roku, Inc. * | 62 | 4,528 | ||||||
| Taylor Morrison Home Corp., Class A * | 362 | 6,530 | ||||||
| ZAGG, Inc. * | 1,010 | 14,897 | ||||||
|
| |||||||
| 45,428 | ||||||||
|
| |||||||
| Insurance - 3.6% | ||||||||
| Ambac Financial Group, Inc. * | 550 | 11,231 | ||||||
| Argo Group International Holdings Ltd. | 187 | 11,790 | ||||||
| CNO Financial Group, Inc. | 545 | 11,565 | ||||||
| Employers Holdings, Inc. (a) | 530 | 24,009 | ||||||
| Enstar Group Ltd. * | 12 | 2,502 | ||||||
| FedNat Holding Co. | 310 | 7,899 | ||||||
| Genworth Financial, Inc., Class A * | 530 | 2,210 | ||||||
| National Western Life Group, Inc., Class A | 29 | 9,257 | ||||||
| Safety Insurance Group, Inc. | 101 | 9,049 | ||||||
| Stewart Information Services Corp. | 78 | 3,511 | ||||||
| Third Point Reinsurance Ltd. * | 716 | 9,308 | ||||||
| United Fire Group, Inc. | 8 | 406 | ||||||
| Universal Insurance Holdings, Inc. (a) | 332 | 16,119 | ||||||
|
| |||||||
| 118,856 | ||||||||
|
| |||||||
| The accompanying notes are an integral part of these financial statements. | (Continued) |
| AQR Funds | Annual Report | September 2018 | ||||||||||||||
190
Table of Contents
| Schedule of Investments | September 30, 2018 |
| AQR SMALL CAP RELAXED CONSTRAINT EQUITY FUND |
| INVESTMENTS | SHARES | VALUE | ||||||
| Interactive Media & Services - 2.7% | ||||||||
| Care.com, Inc. * | 796 | $ | 17,600 | |||||
| Cargurus, Inc. * | 71 | 3,954 | ||||||
| Cars.com, Inc. * | 107 | 2,954 | ||||||
| QuinStreet, Inc. * | 1,198 | 16,257 | ||||||
| TrueCar, Inc. * | 591 | 8,333 | ||||||
| XO Group, Inc. * | 627 | 21,619 | ||||||
| Yelp, Inc. *(a) | 404 | 19,877 | ||||||
|
| |||||||
| 90,594 | ||||||||
|
| |||||||
| Internet & Direct Marketing Retail - 2.6% | ||||||||
| 1-800-Flowers.com, Inc., Class A * | 1,983 | 23,399 | ||||||
| Etsy, Inc. *(a) | 503 | 25,844 | ||||||
| Groupon, Inc. * | 4,133 | 15,581 | ||||||
| Lands’ End, Inc. * | 29 | 509 | ||||||
| Liberty TripAdvisor Holdings, Inc., Class A * | 175 | 2,599 | ||||||
| Overstock.com, Inc. * | 107 | 2,964 | ||||||
| PetMed Express, Inc. | 79 | 2,608 | ||||||
| Shutterfly, Inc. * | 40 | 2,636 | ||||||
| Shutterstock, Inc. | 35 | 1,910 | ||||||
| Stamps.com, Inc. * | 39 | 8,822 | ||||||
|
| |||||||
| 86,872 | ||||||||
|
| |||||||
| IT Services - 2.7% | ||||||||
| Acxiom Holdings, Inc. * | 116 | 5,732 | ||||||
| Brightcove, Inc. * | 1,254 | 10,534 | ||||||
| CACI International, Inc., Class A * | 4 | 737 | ||||||
| EVERTEC, Inc. | 603 | 14,532 | ||||||
| Hackett Group, Inc. (The) | 202 | 4,070 | ||||||
| Limelight Networks, Inc. * | 1,909 | 9,583 | ||||||
| MAXIMUS, Inc. | 133 | 8,653 | ||||||
| MoneyGram International, Inc. * | 250 | 1,337 | ||||||
| NIC, Inc. | 38 | 562 | ||||||
| Perficient, Inc. * | 43 | 1,146 | ||||||
| Perspecta, Inc. | 220 | 5,658 | ||||||
| Science Applications International Corp. | 9 | 725 | ||||||
| ServiceSource International, Inc. * | 843 | 2,403 | ||||||
| Sykes Enterprises, Inc. * | 37 | 1,128 | ||||||
| Syntel, Inc. * | 52 | 2,131 | ||||||
| Travelport Worldwide Ltd. | 839 | 14,154 | ||||||
| Unisys Corp. * | 229 | 4,672 | ||||||
| Web.com Group, Inc. * | 59 | 1,646 | ||||||
|
| |||||||
| 89,403 | ||||||||
|
| |||||||
| Leisure Products - 1.4% | ||||||||
| Johnson Outdoors, Inc., Class A | 139 | 12,926 | ||||||
| MCBC Holdings, Inc. * | 542 | 19,447 | ||||||
| Nautilus, Inc. * | 971 | 13,545 | ||||||
|
| |||||||
| 45,918 | ||||||||
|
| |||||||
| Life Sciences Tools & Services - 0.7% | ||||||||
| Enzo Biochem, Inc. * | 493 | 2,031 | ||||||
| Luminex Corp. | 83 | 2,516 | ||||||
| Medpace Holdings, Inc. *(a) | 289 | 17,314 | ||||||
|
| |||||||
| 21,861 | ||||||||
|
| |||||||
| Machinery - 4.3% | ||||||||
| Alamo Group, Inc. | 30 | 2,748 | ||||||
| Barnes Group, Inc. | 55 | 3,907 | ||||||
| Briggs & Stratton Corp. | 183 | 3,519 | ||||||
| Columbus McKinnon Corp. | 252 | 9,964 | ||||||
| INVESTMENTS | SHARES | VALUE | ||||||
| Machinery - 4.3% (continued) | ||||||||
| Commercial Vehicle Group, Inc. * | 908 | $ | 8,317 | |||||
| DMC Global, Inc. | 106 | 4,325 | ||||||
| EnPro Industries, Inc. | 26 | 1,896 | ||||||
| Global Brass & Copper Holdings, Inc. | 583 | 21,513 | ||||||
| Gorman-Rupp Co. (The) | 79 | 2,883 | ||||||
| Harsco Corp. * | 438 | 12,505 | ||||||
| Kadant, Inc. | 81 | 8,736 | ||||||
| Lydall, Inc. * | 26 | 1,121 | ||||||
| Meritor, Inc. *(a) | 758 | 14,675 | ||||||
| Milacron Holdings Corp. * | 218 | 4,414 | ||||||
| Mueller Water Products, Inc., Class A | 1,011 | 11,637 | ||||||
| Spartan Motors, Inc. | 411 | 6,062 | ||||||
| SPX Corp. * | 113 | 3,764 | ||||||
| Standex International Corp. | 35 | 3,649 | ||||||
| TriMas Corp. * | 417 | 12,677 | ||||||
| Wabash National Corp. | 172 | 3,135 | ||||||
|
| |||||||
| 141,447 | ||||||||
|
| |||||||
| Marine - 0.0% (b) | ||||||||
| Genco Shipping & Trading Ltd. * | 44 | 616 | ||||||
|
| |||||||
| Media - 0.8% | ||||||||
| Entravision Communications Corp., Class A | 3,424 | 16,778 | ||||||
| TechTarget, Inc. * | 310 | 6,020 | ||||||
| tronc, Inc. * | 242 | 3,952 | ||||||
|
| |||||||
| 26,750 | ||||||||
|
| |||||||
| Metals & Mining - 1.7% | ||||||||
| Materion Corp. | 182 | 11,011 | ||||||
| Ryerson Holding Corp. * | 1,093 | 12,351 | ||||||
| SunCoke Energy, Inc. * | 1,268 | 14,734 | ||||||
| Warrior Met Coal, Inc. | 611 | 16,522 | ||||||
|
| |||||||
| 54,618 | ||||||||
|
| |||||||
| Mortgage Real Estate Investment Trusts (REITs) - 0.3% | ||||||||
| Apollo Commercial Real Estate Finance, Inc. | 181 | 3,415 | ||||||
| Blackstone Mortgage Trust, Inc., Class A | 152 | 5,094 | ||||||
|
| |||||||
| 8,509 | ||||||||
|
| |||||||
| Multiline Retail - 0.3% | ||||||||
| Big Lots, Inc. | 210 | 8,776 | ||||||
|
| |||||||
| Multi-Utilities - 0.2% | ||||||||
| Avista Corp. | 148 | 7,483 | ||||||
|
| |||||||
| Oil, Gas & Consumable Fuels - 7.2% | ||||||||
| Abraxas Petroleum Corp. * | 5,174 | 12,055 | ||||||
| Arch Coal, Inc., Class A (a) | 273 | 24,406 | ||||||
| Bonanza Creek Energy, Inc. * | 505 | 15,039 | ||||||
| California Resources Corp. * | 262 | 12,715 | ||||||
| Clean Energy Fuels Corp. * | 419 | 1,089 | ||||||
| Delek US Holdings, Inc. (a) | 284 | 12,050 | ||||||
| Denbury Resources, Inc. * | 2,524 | 15,649 | ||||||
| Evolution Petroleum Corp. | 1,823 | 20,144 | ||||||
| HighPoint Resources Corp. * | 607 | 2,962 | ||||||
| Laredo Petroleum, Inc. * | 172 | 1,405 | ||||||
| Midstates Petroleum Co., Inc. * | 259 | 2,308 | ||||||
| Northern Oil and Gas, Inc. * | 4,158 | 16,632 | ||||||
| Oasis Petroleum, Inc. * | 260 | 3,687 | ||||||
| Overseas Shipholding Group, Inc., Class A * | 5,160 | 16,254 | ||||||
| The accompanying notes are an integral part of these financial statements. | (Continued) |
| AQR Funds | Annual Report | September 2018 | ||||||||||||||
191
Table of Contents
| Schedule of Investments | September 30, 2018 |
| AQR SMALL CAP RELAXED CONSTRAINT EQUITY FUND |
| INVESTMENTS | SHARES | VALUE | ||||||
| Oil, Gas & Consumable Fuels - 7.2% (continued) | ||||||||
| PDC Energy, Inc. * | 170 | $ | 8,323 | |||||
| Peabody Energy Corp. | 275 | 9,801 | ||||||
| Penn Virginia Corp. *(a) | 175 | 14,095 | ||||||
| SandRidge Energy, Inc. * | 55 | 598 | ||||||
| Southwestern Energy Co. * | 901 | 4,604 | ||||||
| W&T Offshore, Inc. *(a) | 4,148 | 39,987 | ||||||
| WildHorse Resource Development Corp. * | 215 | 5,083 | ||||||
|
| |||||||
| 238,886 | ||||||||
|
| |||||||
| Paper & Forest Products - 1.9% | ||||||||
| Boise Cascade Co. | 162 | 5,962 | ||||||
| KapStone Paper and Packaging Corp. | 135 | 4,578 | ||||||
| Louisiana-Pacific Corp. (a) | 952 | 25,218 | ||||||
| Schweitzer-Mauduit International, Inc. | 21 | 805 | ||||||
| Verso Corp., Class A *(a) | 735 | 24,747 | ||||||
|
| |||||||
| 61,310 | ||||||||
|
| |||||||
| Personal Products - 1.3% | ||||||||
| Medifast, Inc. (a) | 102 | 22,598 | ||||||
| USANA Health Sciences, Inc. *(a) | 171 | 20,614 | ||||||
|
| |||||||
| 43,212 | ||||||||
|
| |||||||
| Pharmaceuticals - 1.3% | ||||||||
| Assertio Therapeutics, Inc. * | 124 | 729 | ||||||
| Corcept Therapeutics, Inc. * | 306 | 4,290 | ||||||
| Durect Corp. * | 1,450 | 1,595 | ||||||
| Endo International plc * | 290 | 4,881 | ||||||
| Horizon Pharma plc * | 342 | 6,696 | ||||||
| Innoviva, Inc. * | 239 | 3,642 | ||||||
| Intersect ENT, Inc. * | 33 | 949 | ||||||
| Intra-Cellular Therapies, Inc. * | 91 | 1,975 | ||||||
| Mallinckrodt plc * | 73 | 2,140 | ||||||
| Phibro Animal Health Corp., Class A (a) | 329 | 14,114 | ||||||
| Supernus Pharmaceuticals, Inc. * | 26 | 1,309 | ||||||
| Zogenix, Inc. * | 22 | 1,091 | ||||||
|
| |||||||
| 43,411 | ||||||||
|
| |||||||
| Professional Services - 4.8% | ||||||||
| Acacia Research Corp. * | 1,979 | 6,333 | ||||||
| Barrett Business Services, Inc. | 251 | 16,762 | ||||||
| CRA International, Inc. | 142 | 7,131 | ||||||
| Heidrick & Struggles International, Inc. | 251 | 8,496 | ||||||
| ICF International, Inc. | 172 | 12,977 | ||||||
| Insperity, Inc. (a) | 351 | 41,401 | ||||||
| Kelly Services, Inc., Class A | 88 | 2,115 | ||||||
| Kforce, Inc. | 1,027 | 38,615 | ||||||
| Navigant Consulting, Inc. | 446 | 10,285 | ||||||
| Resources Connection, Inc. | 117 | 1,942 | ||||||
| TrueBlue, Inc. * | 475 | 12,374 | ||||||
|
| |||||||
| 158,431 | ||||||||
|
| |||||||
| Real Estate Management & Development - 0.4% | ||||||||
| HFF, Inc., Class A (a) | 348 | 14,783 | ||||||
|
| |||||||
| Road & Rail - 0.9% | ||||||||
| ArcBest Corp. | 147 | 7,137 | ||||||
| Covenant Transportation Group, Inc., Class A * | 371 | 10,781 | ||||||
| Marten Transport Ltd. | 246 | 5,178 | ||||||
| USA Truck, Inc. * | 147 | 2,974 | ||||||
| INVESTMENTS | SHARES | VALUE | ||||||
| Road & Rail - 0.9% (continued) | ||||||||
| YRC Worldwide, Inc. * | 403 | $ | 3,619 | |||||
|
| |||||||
| 29,689 | ||||||||
|
| |||||||
| Semiconductors & Semiconductor Equipment - 4.9% | ||||||||
| Advanced Energy Industries, Inc. * | 213 | 11,001 | ||||||
| Alpha & Omega Semiconductor Ltd. * | 550 | 6,397 | ||||||
| Amkor Technology, Inc. * | 1,306 | 9,651 | ||||||
| Axcelis Technologies, Inc. * | 258 | 5,070 | ||||||
| Brooks Automation, Inc. | 102 | 3,573 | ||||||
| Cabot Microelectronics Corp. | 113 | 11,658 | ||||||
| Cirrus Logic, Inc. * | 66 | 2,548 | ||||||
| Entegris, Inc. (a) | 622 | 18,007 | ||||||
| FormFactor, Inc. * | 932 | 12,815 | ||||||
| Ichor Holdings Ltd. * | 126 | 2,573 | ||||||
| Lattice Semiconductor Corp. * | 1,117 | 8,936 | ||||||
| Nanometrics, Inc. * | 291 | 10,918 | ||||||
| Photronics, Inc. * | 501 | 4,935 | ||||||
| Rudolph Technologies, Inc. * | 675 | 16,504 | ||||||
| Semtech Corp. * | 203 | 11,287 | ||||||
| SMART Global Holdings, Inc. * | 495 | 14,226 | ||||||
| Synaptics, Inc. * | 64 | 2,920 | ||||||
| Ultra Clean Holdings, Inc. * | 564 | 7,078 | ||||||
|
| |||||||
| 160,097 | ||||||||
|
| |||||||
| Software - 8.2% | ||||||||
| 8x8, Inc. * | 459 | 9,754 | ||||||
| A10 Networks, Inc. * | 780 | 4,742 | ||||||
| Appfolio, Inc., Class A *(a) | 243 | 19,051 | ||||||
| Apptio, Inc., Class A * | 106 | 3,918 | ||||||
| Box, Inc., Class A * | 405 | 9,684 | ||||||
| CommVault Systems, Inc. * | 57 | 3,990 | ||||||
| eGain Corp. * | 1,635 | 13,243 | ||||||
| Five9, Inc. * | 89 | 3,888 | ||||||
| Glu Mobile, Inc. *(a) | 2,480 | 18,476 | ||||||
| Hortonworks, Inc. * | 326 | 7,436 | ||||||
| Imperva, Inc. * | 168 | 7,804 | ||||||
| j2 Global, Inc. | 66 | 5,468 | ||||||
| LivePerson, Inc. *(a) | 707 | 18,347 | ||||||
| MicroStrategy, Inc., Class A * | 84 | 11,812 | ||||||
| Mitek Systems, Inc. * | 1,000 | 7,050 | ||||||
| MobileIron, Inc. * | 1,045 | 5,538 | ||||||
| New Relic, Inc. * | 56 | 5,277 | ||||||
| NextGen Healthcare Information Systems LLC *(a) | 934 | 18,755 | ||||||
| OneSpan, Inc. * | 578 | 11,011 | ||||||
| Progress Software Corp. | 228 | 8,046 | ||||||
| Qualys, Inc. * | 119 | 10,603 | ||||||
| Rapid7, Inc. * | 364 | 13,439 | ||||||
| SPS Commerce, Inc. * | 134 | 13,298 | ||||||
| Varonis Systems, Inc. * | 88 | 6,446 | ||||||
| Verint Systems, Inc. * | 274 | 13,727 | ||||||
| Zix Corp. * | 3,238 | 17,971 | ||||||
|
| |||||||
| 268,774 | ||||||||
|
| |||||||
| Specialty Retail - 7.5% | ||||||||
| Abercrombie & Fitch Co., Class A | 829 | 17,509 | ||||||
| American Eagle Outfitters, Inc. (a) | 1,363 | 33,843 | ||||||
| America’s Car-Mart, Inc. * | 16 | 1,251 | ||||||
| Asbury Automotive Group, Inc. * | 57 | 3,919 | ||||||
| The accompanying notes are an integral part of these financial statements. | (Continued) |
| AQR Funds | Annual Report | September 2018 | ||||||||||||||
192
Table of Contents
| Schedule of Investments | September 30, 2018 |
| AQR SMALL CAP RELAXED CONSTRAINT EQUITY FUND |
| INVESTMENTS | SHARES | VALUE | ||||||
| Specialty Retail - 7.5% (continued) | ||||||||
| Ascena Retail Group, Inc. * | 181 | $ | 827 | |||||
| Barnes & Noble Education, Inc. * | 562 | 3,237 | ||||||
| Bed Bath & Beyond, Inc. | 346 | 5,190 | ||||||
| Boot Barn Holdings, Inc. * | 378 | 10,739 | ||||||
| Buckle, Inc. (The) | 189 | 4,356 | ||||||
| Caleres, Inc. | 151 | 5,415 | ||||||
| Cato Corp. (The), Class A | 489 | 10,279 | ||||||
| Chico’s FAS, Inc. | 1,181 | 10,239 | ||||||
| Children’s Place, Inc. (The) | 145 | 18,531 | ||||||
| Citi Trends, Inc. | 765 | 22,009 | ||||||
| DSW, Inc., Class A (a) | 691 | 23,411 | ||||||
| Express, Inc. * | 955 | 10,562 | ||||||
| Francesca’s Holdings Corp. * | 711 | 2,638 | ||||||
| Genesco, Inc. * | 193 | 9,090 | ||||||
| Haverty Furniture Cos., Inc. | 194 | 4,287 | ||||||
| Hibbett Sports, Inc. * | 282 | 5,302 | ||||||
| J. Jill, Inc. * | 468 | 2,892 | ||||||
| Shoe Carnival, Inc. | 177 | 6,815 | ||||||
| Signet Jewelers Ltd. | 82 | 5,406 | ||||||
| Tailored Brands, Inc. | 367 | 9,245 | ||||||
| Tilly’s, Inc., Class A | 725 | 13,739 | ||||||
| Zumiez, Inc. * | 190 | 5,007 | ||||||
|
| |||||||
| 245,738 | ||||||||
|
| |||||||
| Technology Hardware, Storage & Peripherals - 0.2% | ||||||||
| Immersion Corp. * | 774 | 8,181 | ||||||
|
| |||||||
| Textiles, Apparel & Luxury Goods - 3.1% | ||||||||
| Crocs, Inc. * | 493 | 10,496 | ||||||
| Deckers Outdoor Corp. *(a) | 194 | 23,005 | ||||||
| Fossil Group, Inc. *(a) | 861 | 20,044 | ||||||
| Movado Group, Inc. | 245 | 10,265 | ||||||
| Perry Ellis International, Inc. * | 445 | 12,162 | ||||||
| Rocky Brands, Inc. | 223 | 6,311 | ||||||
| Unifi, Inc. * | 154 | 4,363 | ||||||
| Vera Bradley, Inc. * | 1,088 | 16,603 | ||||||
|
| |||||||
| 103,249 | ||||||||
|
| |||||||
| Thrifts & Mortgage Finance - 3.1% | ||||||||
| Dime Community Bancshares, Inc. | 635 | 11,335 | ||||||
| Essent Group Ltd. * | 77 | 3,407 | ||||||
| Federal Agricultural Mortgage Corp., Class C | 14 | 1,011 | ||||||
| First Defiance Financial Corp. | 514 | 15,477 | ||||||
| MGIC Investment Corp. *(a) | 2,695 | 35,870 | ||||||
| Ocwen Financial Corp. * | 166 | 654 | ||||||
| PHH Corp. * | 50 | 550 | ||||||
| Radian Group, Inc. (a) | 741 | 15,316 | ||||||
| TrustCo Bank Corp. | 1,176 | 9,996 | ||||||
| Walker & Dunlop, Inc. | 73 | 3,860 | ||||||
| Washington Federal, Inc. | 197 | 6,304 | ||||||
|
| |||||||
| 103,780 | ||||||||
|
| |||||||
| Tobacco - 0.4% | ||||||||
| Pyxus International, Inc. * | 457 | 10,511 | ||||||
| Vector Group Ltd. | 105 | 1,447 | ||||||
|
| |||||||
| 11,958 | ||||||||
|
| |||||||
| Trading Companies & Distributors - 1.6% | ||||||||
| BMC Stock Holdings, Inc. * | 266 | 4,961 | ||||||
| GMS, Inc. * | 849 | 19,697 | ||||||
| INVESTMENTS | SHARES | VALUE | ||||||
| Trading Companies & Distributors - 1.6% (continued) | ||||||||
| H&E Equipment Services, Inc. | 16 | $ | 604 | |||||
| Herc Holdings, Inc. * | 22 | 1,126 | ||||||
| Nexeo Solutions, Inc. * | 606 | 7,424 | ||||||
| Rush Enterprises, Inc., Class A | 247 | 9,710 | ||||||
| Systemax, Inc. | 283 | 9,322 | ||||||
|
| |||||||
| 52,844 | ||||||||
|
| |||||||
TOTAL COMMON STOCKS | 4,239,223 | |||||||
|
| |||||||
| EXCHANGE TRADED FUNDS - 0.9% | ||||||||
iShares Russell 2000 ETF | 170 | 28,654 | ||||||
|
| |||||||
| NO. OF RIGHTS | ||||||||
| RIGHTS - 0.0% (b) | ||||||||
| Food Products - 0.0% (b) | ||||||||
| Schuman, Inc., CVR (3)*(c) | 44 | 87 | ||||||
|
| |||||||
| Media - 0.0% (b) | ||||||||
Media General, Inc., CVR (3)*(c) | 112 | 2 | ||||||
|
| |||||||
TOTAL RIGHTS |
| 89 | ||||||
|
| |||||||
| SHARES | ||||||||
| SHORT-TERM INVESTMENTS - 2.3% | ||||||||
| Investment Companies - 2.3% | ||||||||
| BlackRock Liquidity Funds T-Fund Portfolio, Institutional Shares, 1.97% (d) | 3,706 | 3,706 | ||||||
| Dreyfus Treasury & Agency Cash Management, Institutional Shares, 1.96% (d) | 14,824 | 14,824 | ||||||
| Limited Purpose Cash Investment Fund, 2.06% (d) | 39,838 | 39,833 | ||||||
| UBS Select Treasury Preferred Fund, Class I, 1.97% (d) | 18,529 | 18,529 | ||||||
|
| |||||||
TOTAL SHORT-TERM INVESTMENTS | 76,892 | |||||||
|
| |||||||
TOTAL LONG POSITIONS |
| 4,344,858 | ||||||
|
| |||||||
| SHORT POSITIONS - (30.5)% | ||||||||
| COMMON STOCKS - (30.5)% | ||||||||
| Aerospace & Defense - (1.2)% | ||||||||
| KeyW Holding Corp. (The) * | (1,989 | ) | (17,225 | ) | ||||
| Kratos Defense & Security Solutions, Inc. * | (590 | ) | (8,720 | ) | ||||
| Mercury Systems, Inc. * | (229 | ) | (12,668 | ) | ||||
|
| |||||||
| (38,613 | ) | |||||||
|
| |||||||
| Auto Components - (1.4)% | ||||||||
| Cooper Tire & Rubber Co. | (209 | ) | (5,915 | ) | ||||
| Motorcar Parts of America, Inc. * | (714 | ) | (16,743 | ) | ||||
| Superior Industries International, Inc. | (1,409 | ) | (24,023 | ) | ||||
|
| |||||||
| (46,681 | ) | |||||||
|
| |||||||
| Beverages - 0.0% (b) | ||||||||
| MGP Ingredients, Inc. | (11 | ) | (869 | ) | ||||
|
| |||||||
| The accompanying notes are an integral part of these financial statements. | (Continued) |
| AQR Funds | Annual Report | September 2018 | ||||||||||||||
193
Table of Contents
| Schedule of Investments | September 30, 2018 |
| AQR SMALL CAP RELAXED CONSTRAINT EQUITY FUND |
| INVESTMENTS | SHARES | VALUE | ||||||
| Biotechnology - (0.9)% | ||||||||
| Adamas Pharmaceuticals, Inc. * | (186 | ) | $ | (3,724 | ) | |||
| Aduro Biotech, Inc. * | (236 | ) | (1,734 | ) | ||||
| Agenus, Inc. * | (1,299 | ) | (2,780 | ) | ||||
| Bellicum Pharmaceuticals, Inc. * | (381 | ) | (2,347 | ) | ||||
| Fate Therapeutics, Inc. * | (138 | ) | (2,248 | ) | ||||
| Flexion Therapeutics, Inc. * | (193 | ) | (3,611 | ) | ||||
| Inovio Pharmaceuticals, Inc. * | (491 | ) | (2,730 | ) | ||||
| Lexicon Pharmaceuticals, Inc. * | (422 | ) | (4,503 | ) | ||||
| Ra Pharmaceuticals, Inc. * | (29 | ) | (525 | ) | ||||
| Radius Health, Inc. * | (119 | ) | (2,118 | ) | ||||
| Selecta Biosciences, Inc. * | (150 | ) | (2,332 | ) | ||||
|
| |||||||
| (28,652 | ) | |||||||
|
| |||||||
| Building Products - (0.8)% | ||||||||
| AAON, Inc. | (293 | ) | (11,075 | ) | ||||
| American Woodmark Corp. * | (150 | ) | (11,768 | ) | ||||
| Gibraltar Industries, Inc. * | (49 | ) | (2,234 | ) | ||||
| Griffon Corp. | (105 | ) | (1,696 | ) | ||||
|
| |||||||
| (26,773 | ) | |||||||
|
| |||||||
| Capital Markets - (0.2)% | ||||||||
| Cowen, Inc. * | (288 | ) | (4,695 | ) | ||||
| Greenhill & Co., Inc. | (72 | ) | (1,897 | ) | ||||
|
| |||||||
| (6,592 | ) | |||||||
|
| |||||||
| Chemicals - (1.5)% | ||||||||
| Flotek Industries, Inc. * | (5,235 | ) | (12,564 | ) | ||||
| Intrepid Potash, Inc. * | (725 | ) | (2,603 | ) | ||||
| LSB Industries, Inc. * | (1,896 | ) | (18,543 | ) | ||||
| Rayonier Advanced Materials, Inc. | (658 | ) | (12,127 | ) | ||||
| Tronox Ltd., Class A | (276 | ) | (3,298 | ) | ||||
|
| |||||||
| (49,135 | ) | |||||||
|
| |||||||
| Commercial Services & Supplies - (0.9)% | ||||||||
| LSC Communications, Inc. | (204 | ) | (2,256 | ) | ||||
| Multi-Color Corp. | (306 | ) | (19,049 | ) | ||||
| Team, Inc. * | (412 | ) | (9,270 | ) | ||||
|
| |||||||
| (30,575 | ) | |||||||
|
| |||||||
| Communications Equipment - (0.9)% | ||||||||
| Acacia Communications, Inc. * | (443 | ) | (18,327 | ) | ||||
| Finisar Corp. * | (102 | ) | (1,943 | ) | ||||
| Harmonic, Inc. * | (175 | ) | (962 | ) | ||||
| Infinera Corp. * | (724 | ) | (5,285 | ) | ||||
| ViaSat, Inc. * | (29 | ) | (1,855 | ) | ||||
|
| |||||||
| (28,372 | ) | |||||||
|
| |||||||
| Construction & Engineering - (0.3)% | ||||||||
| NV5 Global, Inc. * | (110 | ) | (9,537 | ) | ||||
|
| |||||||
| Diversified Telecommunication Services - (0.7)% | ||||||||
| Consolidated Communications Holdings, Inc. | (910 | ) | (11,867 | ) | ||||
| ORBCOMM, Inc. * | (935 | ) | (10,154 | ) | ||||
|
| |||||||
| (22,021 | ) | |||||||
|
| |||||||
| Electronic Equipment, Instruments & Components - (0.3)% | ||||||||
| II-VI, Inc. * | (47 | ) | (2,223 | ) | ||||
| Iteris, Inc. * | (1,439 | ) | (7,742 | ) | ||||
|
| |||||||
| (9,965 | ) | |||||||
|
| |||||||
| INVESTMENTS | SHARES | VALUE | ||||||
| Energy Equipment & Services - (2.5)% | ||||||||
| Basic Energy Services, Inc. * | (263 | ) | $ | (2,627 | ) | |||
| Bristow Group, Inc. * | (204 | ) | (2,475 | ) | ||||
| CARBO Ceramics, Inc. * | (118 | ) | (856 | ) | ||||
| Dril-Quip, Inc. * | (163 | ) | (8,517 | ) | ||||
| Forum Energy Technologies, Inc. * | (607 | ) | (6,283 | ) | ||||
| Frank’s International NV * | (1,918 | ) | (16,648 | ) | ||||
| NCS Multistage Holdings, Inc. * | (483 | ) | (7,974 | ) | ||||
| Noble Corp. plc * | (1,076 | ) | (7,564 | ) | ||||
| Oil States International, Inc. * | (236 | ) | (7,835 | ) | ||||
| Rowan Cos. plc, Class A * | (448 | ) | (8,436 | ) | ||||
| SEACOR Marine Holdings, Inc. * | (494 | ) | (11,179 | ) | ||||
| Tidewater, Inc. * | (70 | ) | (2,183 | ) | ||||
|
| |||||||
| (82,577 | ) | |||||||
|
| |||||||
| Entertainment - (0.4)% | ||||||||
| AMC Entertainment Holdings, Inc., Class A | (556 | ) | (11,398 | ) | ||||
| Liberty Media Corp.-Liberty Braves, Class C * | (121 | ) | (3,297 | ) | ||||
|
| |||||||
| (14,695 | ) | |||||||
|
| |||||||
| Equity Real Estate Investment Trusts (REITs) - (1.1)% | ||||||||
| Bluerock Residential Growth REIT, Inc. | (1,898 | ) | (18,600 | ) | ||||
| Front Yard Residential Corp. | (435 | ) | (4,720 | ) | ||||
| Government Properties Income Trust | (269 | ) | (3,037 | ) | ||||
| New Senior Investment Group, Inc. | (105 | ) | (620 | ) | ||||
| Pennsylvania REIT | (213 | ) | (2,015 | ) | ||||
| Preferred Apartment Communities, Inc., Class A | (374 | ) | (6,575 | ) | ||||
|
| |||||||
| (35,567 | ) | |||||||
|
| |||||||
| Food & Staples Retailing - (0.1)% | ||||||||
| Smart & Final Stores, Inc. * | (412 | ) | (2,348 | ) | ||||
|
| |||||||
| Food Products - (0.3)% | ||||||||
| Hostess Brands, Inc. * | (920 | ) | (10,184 | ) | ||||
|
| |||||||
| Health Care Equipment & Supplies - (0.1)% | ||||||||
| GenMark Diagnostics, Inc. * | (400 | ) | (2,940 | ) | ||||
|
| |||||||
| Health Care Providers & Services - (0.9)% | ||||||||
| BioScrip, Inc. * | (3,545 | ) | (10,989 | ) | ||||
| Capital Senior Living Corp. * | (1,558 | ) | (14,708 | ) | ||||
| Quorum Health Corp. * | (531 | ) | (3,112 | ) | ||||
|
| |||||||
| (28,809 | ) | |||||||
|
| |||||||
| Health Care Technology - (0.1)% | ||||||||
| Evolent Health, Inc., Class A * | (178 | ) | (5,055 | ) | ||||
|
| |||||||
| Hotels, Restaurants & Leisure - (0.4)% | ||||||||
| Dine Brands Global, Inc. | (124 | ) | (10,082 | ) | ||||
| Golden Entertainment, Inc. * | (191 | ) | (4,586 | ) | ||||
|
| |||||||
| (14,668 | ) | |||||||
|
| |||||||
| Household Durables - (0.6)% | ||||||||
| Hovnanian Enterprises, Inc., Class A * | (623 | ) | (997 | ) | ||||
| Universal Electronics, Inc. * | (466 | ) | (18,337 | ) | ||||
|
| |||||||
| (19,334 | ) | |||||||
|
| |||||||
| Independent Power and Renewable Electricity Producers - (0.7)% | ||||||||
| Pattern Energy Group, Inc., Class A | (1,143 | ) | (22,711 | ) | ||||
| The accompanying notes are an integral part of these financial statements. | (Continued) |
| AQR Funds | Annual Report | September 2018 | ||||||||||||||
194
Table of Contents
| Schedule of Investments | September 30, 2018 |
| AQR SMALL CAP RELAXED CONSTRAINT EQUITY FUND |
| INVESTMENTS | SHARES | VALUE | ||||||
| Independent Power and Renewable Electricity Producers - (0.7)% (continued) | ||||||||
| TerraForm Power, Inc., Class A | (63 | ) | $ | (728 | ) | |||
|
| |||||||
| (23,439 | ) | |||||||
|
| |||||||
| Insurance - (0.2)% | ||||||||
| HCI Group, Inc. | (34 | ) | (1,488 | ) | ||||
| MBIA, Inc. * | (215 | ) | (2,298 | ) | ||||
| State Auto Financial Corp. | (42 | ) | (1,283 | ) | ||||
|
| |||||||
| (5,069 | ) | |||||||
|
| |||||||
| Internet & Direct Marketing Retail - (0.1)% | ||||||||
| Fluent, Inc. * | (1,212 | ) | (2,606 | ) | ||||
|
| |||||||
| IT Services - (0.1)% | ||||||||
| Internap Corp. * | (229 | ) | (2,892 | ) | ||||
|
| |||||||
| Life Sciences Tools & Services - (0.2)% | ||||||||
| Accelerate Diagnostics, Inc. * | (44 | ) | (1,010 | ) | ||||
| Pacific Biosciences of California, Inc. * | (1,126 | ) | (6,091 | ) | ||||
|
| |||||||
| (7,101 | ) | |||||||
|
| |||||||
| Machinery - (0.7)% | ||||||||
| CIRCOR International, Inc. | (389 | ) | (18,477 | ) | ||||
| Energy Recovery, Inc. * | (487 | ) | (4,359 | ) | ||||
|
| |||||||
| (22,836 | ) | |||||||
|
| |||||||
| Marine - (0.1)% | ||||||||
| Scorpio Bulkers, Inc. | (693 | ) | (5,024 | ) | ||||
|
| |||||||
| Media - (1.0)% | ||||||||
| Entercom Communications Corp., Class A | (1,231 | ) | (9,725 | ) | ||||
| EW Scripps Co. (The), Class A | (1,149 | ) | (18,959 | ) | ||||
| Nexstar Media Group, Inc., Class A | (16 | ) | (1,302 | ) | ||||
| WideOpenWest, Inc. * | (314 | ) | (3,520 | ) | ||||
|
| |||||||
| (33,506 | ) | |||||||
|
| |||||||
| Metals & Mining - (3.3)% | ||||||||
| AK Steel Holding Corp. * | (4,022 | ) | (19,708 | ) | ||||
| Allegheny Technologies, Inc. * | (351 | ) | (10,372 | ) | ||||
| Coeur Mining, Inc. * | (1,085 | ) | (5,783 | ) | ||||
| Compass Minerals International, Inc. | (306 | ) | (20,563 | ) | ||||
| Hecla Mining Co. | (16,274 | ) | (45,405 | ) | ||||
| TimkenSteel Corp. * | (561 | ) | (8,342 | ) | ||||
|
| |||||||
| (110,173 | ) | |||||||
|
| |||||||
| Oil, Gas & Consumable Fuels - (2.7)% | ||||||||
| Alta Mesa Resources, Inc. * | (2,749 | ) | (11,491 | ) | ||||
| Callon Petroleum Co. * | (410 | ) | (4,916 | ) | ||||
| DHT Holdings, Inc. | (921 | ) | (4,329 | ) | ||||
| Dorian LPG Ltd. * | (46 | ) | (367 | ) | ||||
| Eclipse Resources Corp. * | (1,571 | ) | (1,869 | ) | ||||
| Golar LNG Ltd. | (346 | ) | (9,619 | ) | ||||
| Green Plains, Inc. | (950 | ) | (16,340 | ) | ||||
| Halcon Resources Corp. * | (173 | ) | (773 | ) | ||||
| International Seaways, Inc. * | (168 | ) | (3,363 | ) | ||||
| Lilis Energy, Inc. * | (1,144 | ) | (5,606 | ) | ||||
| Matador Resources Co. * | (90 | ) | (2,975 | ) | ||||
| Ring Energy, Inc. * | (486 | ) | (4,816 | ) | ||||
| Scorpio Tankers, Inc. (Monaco) | (6,118 | ) | (12,297 | ) | ||||
| INVESTMENTS | SHARES | VALUE | ||||||
| Oil, Gas & Consumable Fuels - (2.7)% (continued) | ||||||||
| SemGroup Corp., Class A | (442 | ) | $ | (9,746 | ) | |||
|
| |||||||
| (88,507 | ) | |||||||
|
| |||||||
| Pharmaceuticals - (1.2)% | ||||||||
| Aclaris Therapeutics, Inc. * | (484 | ) | (7,028 | ) | ||||
| Aerie Pharmaceuticals, Inc. * | (64 | ) | (3,939 | ) | ||||
| Corium International, Inc. * | (692 | ) | (6,581 | ) | ||||
| Dermira, Inc. * | (358 | ) | (3,902 | ) | ||||
| Medicines Co. (The) * | (117 | ) | (3,500 | ) | ||||
| Ocular Therapeutix, Inc. * | (656 | ) | (4,513 | ) | ||||
| Paratek Pharmaceuticals, Inc. * | (1,132 | ) | (10,980 | ) | ||||
| Tetraphase Pharmaceuticals, Inc. * | (197 | ) | (544 | ) | ||||
|
| |||||||
| (40,987 | ) | |||||||
|
| |||||||
| Professional Services - (1.0)% | ||||||||
| WageWorks, Inc. * | (72 | ) | (3,078 | ) | ||||
| Willdan Group, Inc. * | (895 | ) | (30,394 | ) | ||||
|
| |||||||
| (33,472 | ) | |||||||
|
| |||||||
| Real Estate Management & Development - 0.0% (b) | ||||||||
| Kennedy-Wilson Holdings, Inc. | (52 | ) | (1,118 | ) | ||||
|
| |||||||
| Semiconductors & Semiconductor Equipment - (1.9)% | ||||||||
| Adesto Technologies Corp. * | (1,974 | ) | (11,745 | ) | ||||
| AXT, Inc. * | (1,216 | ) | (8,694 | ) | ||||
| Inphi Corp. * | (169 | ) | (6,419 | ) | ||||
| Kopin Corp. * | (3,844 | ) | (9,302 | ) | ||||
| MACOM Technology Solutions Holdings, Inc. * | (101 | ) | (2,081 | ) | ||||
| MaxLinear, Inc. * | (881 | ) | (17,514 | ) | ||||
| PDF Solutions, Inc. * | (593 | ) | (5,355 | ) | ||||
|
| |||||||
| (61,110 | ) | |||||||
|
| |||||||
| Software - 0.0% (b) | ||||||||
| PROS Holdings, Inc. * | (47 | ) | (1,646 | ) | ||||
|
| |||||||
| Specialty Retail - (0.2)% | ||||||||
| Camping World Holdings, Inc., Class A | (264 | ) | (5,628 | ) | ||||
|
| |||||||
| Thrifts & Mortgage Finance - (1.3)% | ||||||||
| LendingTree, Inc. * | (97 | ) | (22,320 | ) | ||||
| Meta Financial Group, Inc. | (233 | ) | (19,257 | ) | ||||
|
| |||||||
| (41,577 | ) | |||||||
|
| |||||||
| Trading Companies & Distributors - (0.2)% | ||||||||
| Beacon Roofing Supply, Inc. * | (68 | ) | (2,461 | ) | ||||
| SiteOne Landscape Supply, Inc. * | (52 | ) | (3,918 | ) | ||||
|
| |||||||
| (6,379 | ) | |||||||
|
| |||||||
TOTAL COMMON STOCKS | (1,007,032 | ) | ||||||
|
| |||||||
TOTAL SHORT POSITIONS | (1,007,032 | ) | ||||||
|
| |||||||
TOTAL INVESTMENTS IN SECURITIES AT | 3,337,826 | |||||||
|
| |||||||
| LIABILITIES IN EXCESS OF OTHER ASSETS - (1.3)% | (41,471) | |||||||
|
| |||||||
NET ASSETS - 100.0% | $ | 3,296,355 | ||||||
|
| |||||||
| The accompanying notes are an integral part of these financial statements. | (Continued) |
| AQR Funds | Annual Report | September 2018 | ||||||||||||||
195
Table of Contents
| Schedule of Investments | September 30, 2018 |
| AQR SMALL CAP RELAXED CONSTRAINT EQUITY FUND |
| SECTOR | VALUE | % OF NET ASSETS | ||||||
| Communication Services | $ | 54,807 | 1.7 | % | ||||
| Consumer Discretionary | 689,766 | 20.9 | ||||||
| Consumer Staples | 77,879 | 2.4 | ||||||
| Energy | 102,461 | 3.1 | ||||||
| Exchange Traded Funds | 28,654 | 0.9 | ||||||
| Financials | 486,780 | 14.8 | ||||||
| Health Care | 582,554 | 17.7 | ||||||
| Industrials | 623,365 | 18.9 | ||||||
| Information Technology | 526,224 | 16.0 | ||||||
| Materials | 76,194 | 2.3 | ||||||
| Real Estate | 28,206 | 0.8 | ||||||
| Utilities | (15,956 | ) | (0.5 | ) | ||||
| Short-Term Investments | 76,892 | 2.3 | ||||||
|
|
|
| |||||
Total Investments In Securities At Value | 3,337,826 | 101.3 | ||||||
| Liabilities in Excess of Other Assets | (41,471 | ) | (1.3 | ) | ||||
|
|
|
| |||||
Net Assets | $ | 3,296,355 | 100.0 | % | ||||
|
|
|
| |||||
| * | Non-income producing security. |
| (a) | All or a portion of this security is segregated in connection with obligations for securities sold short with a total value of $1,107,990. |
| (b) | Represents less than 0.05% of net assets. |
| (c) | Security fair valued as of September 30, 2018 in accordance with procedures approved by the Board of Trustees. Total value of all such securities at September 30, 2018 amounted to $89, which represents approximately 0.00% of net assets of the fund. |
| (d) | Represents 7-day effective yield as of September 30, 2018. |
All securities are Level 1 with respect to ASC 820, unless otherwise noted in parentheses.
| (3) | Level 3 security (See Note 4). |
Abbreviations
CVR - Contingent Value Rights
| The accompanying notes are an integral part of these financial statements. |
| AQR Funds | Annual Report | September 2018 | ||||||||||||||
196
Table of Contents
| Schedule of Investments | September 30, 2018 |
| AQR INTERNATIONAL RELAXED CONSTRAINT EQUITY FUND |
| INVESTMENTS | SHARES | VALUE | ||||||
| LONG POSITIONS - 127.8% | ||||||||
| COMMON STOCKS - 125.3% | ||||||||
| Australia - 9.9% | ||||||||
| AGL Energy Ltd. | 3,400 | $ | 47,962 | |||||
| Alumina Ltd. | 68,677 | 137,480 | ||||||
| Ansell Ltd. | 8,472 | 154,536 | ||||||
| Aurizon Holdings Ltd. | 89,333 | 265,225 | ||||||
| Australia & New Zealand Banking Group Ltd. | 16,269 | 331,183 | ||||||
| BHP Billiton Ltd. | 13,029 | 324,564 | ||||||
| BHP Billiton plc | 1,723 | 37,599 | ||||||
| BlueScope Steel Ltd. | 46,748 | 573,352 | ||||||
| Caltex Australia Ltd. | 22,610 | 488,462 | ||||||
| CIMIC Group Ltd. | 960 | 35,631 | ||||||
| Cochlear Ltd. | 859 | 124,552 | ||||||
| Crown Resorts Ltd. | 15,142 | 149,750 | ||||||
| CSL Ltd. | 210 | 30,513 | ||||||
| Dexus, REIT | 18,310 | 139,880 | ||||||
| Goodman Group, REIT | 5,489 | 41,176 | ||||||
| GPT Group (The), REIT | 5,521 | 20,794 | ||||||
| LendLease Group | 27,394 | 389,213 | ||||||
| Macquarie Group Ltd. | 2,124 | 193,217 | ||||||
| Mirvac Group, REIT | 12,917 | 22,514 | ||||||
| National Australia Bank Ltd. | 9,969 | 200,138 | ||||||
| Newcrest Mining Ltd. | 27,252 | 382,680 | ||||||
| Orica Ltd. | 1,652 | 20,321 | ||||||
| Origin Energy Ltd. * | 70,208 | 418,485 | ||||||
| Qantas Airways Ltd. | 117,211 | 499,583 | ||||||
| REA Group Ltd. | 2,262 | 140,340 | ||||||
| Rio Tinto Ltd. | 994 | 56,531 | ||||||
| Rio Tinto plc | 10,665 | 537,959 | ||||||
| Scentre Group, REIT | 20,611 | 59,231 | ||||||
| South32 Ltd. | 164,053 | 461,039 | ||||||
| Star Entertainment Grp Ltd. (The) | 16,074 | 60,251 | ||||||
| Suncorp Group Ltd. | 15,907 | 166,203 | ||||||
| Vicinity Centres, REIT | 11,572 | 21,955 | ||||||
| Wesfarmers Ltd. | 5,546 | 199,707 | ||||||
| Woodside Petroleum Ltd. | 7,984 | 222,729 | ||||||
|
| |||||||
| 6,954,755 | ||||||||
|
| |||||||
| Belgium - 1.7% | ||||||||
| Ageas | 5,235 | 281,427 | ||||||
| Bekaert SA | 791 | 19,653 | ||||||
| KBC Group NV | 3,626 | 269,624 | ||||||
| UCB SA (a) | 6,825 | 613,321 | ||||||
|
| |||||||
| 1,184,025 | ||||||||
|
| |||||||
| Chile - 0.4% | ||||||||
| Antofagasta plc | 27,745 | 308,312 | ||||||
|
| |||||||
| China - 0.1% | ||||||||
| Yangzijiang Shipbuilding Holdings Ltd. | 97,900 | 88,755 | ||||||
|
| |||||||
| Denmark - 4.4% | ||||||||
| Coloplast A/S, Class B | 2,309 | 235,877 | ||||||
| Danske Bank A/S | 1,509 | 39,555 | ||||||
| Dfds A/S | 877 | 43,375 | ||||||
| GN Store Nord A/S (a) | 20,217 | 984,090 | ||||||
| H Lundbeck A/S | 3,520 | 217,284 | ||||||
| INVESTMENTS | SHARES | VALUE | ||||||
| Denmark - 4.4% (continued) | ||||||||
| Jyske Bank A/S (Registered) | 750 | $ | 36,316 | |||||
| Novo Nordisk A/S, Class B (a) | 26,261 | 1,235,976 | ||||||
| Rockwool International A/S, Class B | 661 | 282,831 | ||||||
| William Demant Holding A/S * | 521 | 19,558 | ||||||
|
| |||||||
| 3,094,862 | ||||||||
|
| |||||||
| Finland - 2.7% | ||||||||
| Fortum OYJ | 12,451 | 312,039 | ||||||
| Kesko OYJ, Class B | 367 | 19,910 | ||||||
| Neste OYJ (a) | 6,741 | 555,630 | ||||||
| Nokia OYJ | 7,083 | 39,380 | ||||||
| Orion OYJ, Class B | 2,224 | 84,173 | ||||||
| Stora Enso OYJ, Class R | 6,209 | 118,568 | ||||||
| UPM-Kymmene OYJ (a) | 18,942 | 742,884 | ||||||
|
| |||||||
| 1,872,584 | ||||||||
|
| |||||||
| France - 12.9% | ||||||||
| Aeroports de Paris | 325 | 73,174 | ||||||
| Airbus SE | 664 | 83,360 | ||||||
| Amundi SA (b) | 1,926 | 144,234 | ||||||
| Arkema SA | 429 | 53,166 | ||||||
| Atos SE | 2,385 | 283,784 | ||||||
| BioMerieux | 255 | 21,285 | ||||||
| BNP Paribas SA | 7,848 | 480,585 | ||||||
| Bouygues SA | 3,535 | 152,926 | ||||||
| Capgemini SE | 2,081 | 261,993 | ||||||
| Cie de Saint-Gobain | 9,078 | 391,271 | ||||||
| Cie Generale des Etablissements Michelin SCA | 4,334 | 517,288 | ||||||
| CNP Assurances | 2,216 | 53,418 | ||||||
| Dassault Aviation SA | 41 | 75,879 | ||||||
| Eiffage SA | 190 | 21,225 | ||||||
| Engie SA (a) | 50,783 | 747,639 | ||||||
| Faurecia SA | 1,056 | 63,508 | ||||||
| Hermes International (a) | 858 | 568,445 | ||||||
| Kering SA | 288 | 154,470 | ||||||
| Klepierre SA, REIT | 785 | 27,895 | ||||||
| L’Oreal SA | 158 | 38,092 | ||||||
| LVMH Moet Hennessy Louis Vuitton SE | 988 | 349,131 | ||||||
| Natixis SA | 3,038 | 20,631 | ||||||
| Peugeot SA (a) | 32,082 | 865,434 | ||||||
| Renault SA | 1,322 | 114,356 | ||||||
| Safran SA | 3,822 | 535,171 | ||||||
| Sanofi | 4,190 | 374,365 | ||||||
| Sartorius Stedim Biotech | 243 | 33,460 | ||||||
| Societe BIC SA | 344 | 31,503 | ||||||
| Societe Generale SA | 4,218 | 181,123 | ||||||
| Sopra Steria Group | 412 | 66,043 | ||||||
| Teleperformance | 1,472 | 277,700 | ||||||
| Thales SA | 1,225 | 174,049 | ||||||
| TOTAL SA (a) | 21,981 | 1,429,220 | ||||||
| Ubisoft Entertainment SA * | 900 | 97,183 | ||||||
| Unibail-Rodamco-Westfield, REIT | 881 | 177,475 | ||||||
| Veolia Environnement SA | 1,447 | 28,874 | ||||||
| Vinci SA | 1,164 | 110,743 | ||||||
|
| |||||||
| 9,080,098 | ||||||||
|
| |||||||
| Germany - 12.4% | ||||||||
| adidas AG | 1,528 | 373,687 | ||||||
| The accompanying notes are an integral part of these financial statements. | (Continued) |
| AQR Funds | Annual Report | September 2018 | ||||||||||||||
197
Table of Contents
| Schedule of Investments | September 30, 2018 |
| AQR INTERNATIONAL RELAXED CONSTRAINT EQUITY FUND |
| INVESTMENTS | SHARES | VALUE | ||||||
| Germany - 12.4% (continued) | ||||||||
| Allianz SE (Registered) (a) | 5,348 | $ | 1,190,287 | |||||
| Aurubis AG | 1,911 | 133,367 | ||||||
| BASF SE | 4,470 | 396,637 | ||||||
| Bayer AG (Registered) | 1,046 | 92,781 | ||||||
| Carl Zeiss Meditec AG | 323 | 27,151 | ||||||
| Covestro AG (a)(b) | 14,460 | 1,170,497 | ||||||
| Deutsche Boerse AG | 942 | 125,952 | ||||||
| Deutsche Lufthansa AG (Registered) | 3,377 | 82,885 | ||||||
| Deutsche Wohnen SE | 1,675 | 80,453 | ||||||
| E.ON SE | 48,985 | 498,459 | ||||||
| Fresenius Medical Care AG & Co. KGaA | 3,337 | 342,855 | ||||||
| Fresenius SE & Co. KGaA | 1,557 | 114,175 | ||||||
| HeidelbergCement AG | 1,012 | 79,045 | ||||||
| Hella GmbH & Co. KGaA * | 3,921 | 218,518 | ||||||
| HOCHTIEF AG | 547 | 90,679 | ||||||
| Infineon Technologies AG (a) | 23,467 | 534,012 | ||||||
| Linde AG | 672 | 158,698 | ||||||
| Muenchener Rueckversicherungs-Gesellschaft AG in Muenchen (Registered) | 95 | 20,984 | ||||||
| Puma SE | 41 | 20,230 | ||||||
| Rheinmetall AG | 4,027 | 420,942 | ||||||
| Salzgitter AG | 4,178 | 208,453 | ||||||
| SAP SE (a) | 5,952 | 731,879 | ||||||
| Schaeffler AG (Preference) | 11,872 | 151,433 | ||||||
| Scout24 AG (b) | 976 | 45,459 | ||||||
| Software AG | 7,564 | 344,383 | ||||||
| STADA Arzneimittel AG | 592 | 55,736 | ||||||
| Talanx AG | 4,062 | 154,341 | ||||||
| TUI AG | 11,273 | 216,246 | ||||||
| Vonovia SE | 1,077 | 52,674 | ||||||
| Wacker Chemie AG | 152 | 19,081 | ||||||
| Wirecard AG | 2,695 | 583,061 | ||||||
|
| |||||||
| 8,735,040 | ||||||||
|
| |||||||
| Hong Kong - 3.1% | ||||||||
| CK Asset Holdings Ltd. | 10,500 | 78,710 | ||||||
| CLP Holdings Ltd. | 23,000 | 269,347 | ||||||
| Hang Lung Properties Ltd. | 11,000 | 21,459 | ||||||
| Henderson Land Development Co. Ltd. | 17,510 | 87,936 | ||||||
| Hong Kong Exchanges & Clearing Ltd. | 3,600 | 102,869 | ||||||
| Kerry Properties Ltd. | 29,000 | 98,471 | ||||||
| Li & Fung Ltd. | 810,000 | 181,439 | ||||||
| Link REIT | 2,500 | 24,615 | ||||||
| Sino Land Co. Ltd. | 98,000 | 167,895 | ||||||
| Sun Hung Kai Properties Ltd. | 27,000 | 391,829 | ||||||
| Swire Properties Ltd. | 19,400 | 73,564 | ||||||
| Techtronic Industries Co. Ltd. | 6,500 | 41,461 | ||||||
| Wharf Holdings Ltd. (The) | 82,000 | 223,259 | ||||||
| Wharf Real Estate Investment Co. Ltd. | 3,000 | 19,328 | ||||||
| Wheelock & Co. Ltd. | 19,000 | 114,230 | ||||||
| Yue Yuen Industrial Holdings Ltd. | 97,500 | 271,048 | ||||||
|
| |||||||
| 2,167,460 | ||||||||
|
| |||||||
| Italy - 3.3% | ||||||||
| A2A SpA | 31,337 | 54,346 | ||||||
| Autogrill SpA | 8,485 | 86,597 | ||||||
| BPER Banca | 89,163 | 411,247 | ||||||
| Eni SpA (a) | 58,613 | 1,104,830 | ||||||
| Hera SpA | 23,712 | 73,739 | ||||||
| INVESTMENTS | SHARES | VALUE | ||||||
| Italy - 3.3% (continued) | ||||||||
| Luxottica Group SpA | 56 | $ | 3,795 | |||||
| Mediobanca Banca di Credito Finanziario SpA | 13,729 | 136,628 | ||||||
| Moncler SpA | 2,460 | 105,847 | ||||||
| Poste Italiane SpA (b) | 7,918 | 63,157 | ||||||
| UniCredit SpA | 14,509 | 217,703 | ||||||
| Unipol Gruppo SpA | 10,671 | 47,428 | ||||||
|
| |||||||
| 2,305,317 | ||||||||
|
| |||||||
| Japan - 28.0% | ||||||||
| Advantest Corp. | 10,000 | 211,346 | ||||||
| Alfresa Holdings Corp. | 13,200 | 353,573 | ||||||
| Alps Electric Co. Ltd. | 10,100 | 256,769 | ||||||
| Amada Holdings Co. Ltd. | 8,100 | 86,481 | ||||||
| ANA Holdings, Inc. | 6,700 | 234,062 | ||||||
| Asahi Intecc Co. Ltd. | 4,000 | 174,419 | ||||||
| Asahi Kasei Corp. | 8,500 | 128,878 | ||||||
| Astellas Pharma, Inc. (a) | 36,000 | 628,666 | ||||||
| Bandai Namco Holdings, Inc. | 6,600 | 256,416 | ||||||
| Brother Industries Ltd. | 7,900 | 155,987 | ||||||
| Canon Marketing Japan, Inc. | 4,600 | 97,593 | ||||||
| Canon, Inc. | 1,100 | 34,881 | ||||||
| Citizen Watch Co. Ltd. | 7,300 | 48,105 | ||||||
| Credit Saison Co. Ltd. | 8,500 | 138,630 | ||||||
| Daicel Corp. | 4,800 | 55,757 | ||||||
| Daiichi Sankyo Co. Ltd. | 7,900 | 342,448 | ||||||
| Daiwa House Industry Co. Ltd. | 1,300 | 38,524 | ||||||
| Disco Corp. | 500 | 83,731 | ||||||
| Eisai Co. Ltd. | 5,300 | 516,310 | ||||||
| Electric Power Development Co. Ltd. | 900 | 24,912 | ||||||
| Ezaki Glico Co. Ltd. | 400 | 19,657 | ||||||
| Fast Retailing Co. Ltd. | 100 | 50,660 | ||||||
| Fuji Electric Co. Ltd. | 1,400 | 56,080 | ||||||
| FUJIFILM Holdings Corp. | 1,200 | 53,987 | ||||||
| GungHo Online Entertainment, Inc. | 20,300 | 41,776 | ||||||
| Haseko Corp. | 23,400 | 303,917 | ||||||
| Hiroshima Bank Ltd. (The) | 3,200 | 21,654 | ||||||
| Hitachi Construction Machinery Co. Ltd. | 5,400 | 180,534 | ||||||
| Hitachi High-Technologies Corp. | 1,300 | 44,887 | ||||||
| Hitachi Ltd. (a) | 19,600 | 666,235 | ||||||
| Hoya Corp. | 6,700 | 397,920 | ||||||
| Idemitsu Kosan Co. Ltd. | 4,800 | 254,134 | ||||||
| Inpex Corp. | 12,700 | 158,681 | ||||||
| ITOCHU Corp. | 13,800 | 252,583 | ||||||
| Itochu Techno-Solutions Corp. | 4,600 | 99,936 | ||||||
| Japan Airlines Co. Ltd. (a) | 22,800 | 819,479 | ||||||
| JFE Holdings, Inc. | 6,500 | 149,110 | ||||||
| JXTG Holdings, Inc. (a) | 90,300 | 683,010 | ||||||
| Kajima Corp. | 17,500 | 254,460 | ||||||
| Kakaku.com, Inc. | 4,600 | 89,875 | ||||||
| Kamigumi Co. Ltd. | 11,000 | 242,470 | ||||||
| Konami Holdings Corp. | 1,000 | 39,156 | ||||||
| Kose Corp. | 700 | 133,382 | ||||||
| Kyocera Corp. | 3,500 | 210,076 | ||||||
| Kyushu Railway Co. | 4,700 | 143,096 | ||||||
| Lion Corp. | 3,900 | 86,618 | ||||||
| Marubeni Corp. | 28,500 | 260,650 | ||||||
| Matsumotokiyoshi Holdings Co. Ltd. | 6,200 | 254,251 | ||||||
| McDonald’s Holdings Co. Japan Ltd. | 1,100 | 48,307 | ||||||
| The accompanying notes are an integral part of these financial statements. | (Continued) |
| AQR Funds | Annual Report | September 2018 | ||||||||||||||
198
Table of Contents
| Schedule of Investments | September 30, 2018 |
| AQR INTERNATIONAL RELAXED CONSTRAINT EQUITY FUND |
| INVESTMENTS | SHARES | VALUE | ||||||
| Japan - 28.0% (continued) | ||||||||
| Mebuki Financial Group, Inc. | 6,100 | $ | 21,106 | |||||
| Medipal Holdings Corp. | 7,200 | 150,421 | ||||||
| MINEBEA MITSUMI, Inc. | 4,800 | 87,004 | ||||||
| Mitsubishi Chemical Holdings Corp. | 5,100 | 48,810 | ||||||
| Mitsubishi Corp. | 11,100 | 341,910 | ||||||
| Mitsubishi Electric Corp. | 10,700 | 146,583 | ||||||
| Mitsubishi Estate Co. Ltd. | 2,300 | 39,054 | ||||||
| Mitsubishi Gas Chemical Co., Inc. | 4,900 | 104,311 | ||||||
| Mitsubishi Motors Corp. | 16,700 | 117,977 | ||||||
| Mitsubishi Tanabe Pharma Corp. | 5,900 | 98,747 | ||||||
| Mitsubishi UFJ Financial Group, Inc. | 11,000 | 68,340 | ||||||
| Mitsui & Co. Ltd. | 17,200 | 305,655 | ||||||
| Mitsui Fudosan Co. Ltd. | 1,600 | 37,841 | ||||||
| Mixi, Inc. | 4,100 | 98,340 | ||||||
| Mizuho Financial Group, Inc. | 11,800 | 20,565 | ||||||
| Murata Manufacturing Co. Ltd. | 1,700 | 261,215 | ||||||
| Nexon Co. Ltd. * | 16,400 | 214,373 | ||||||
| NHK Spring Co. Ltd. | 11,900 | 123,753 | ||||||
| Nikon Corp. | 14,200 | 266,837 | ||||||
| Nintendo Co. Ltd. | 300 | 109,150 | ||||||
| Nippon Express Co. Ltd. | 3,700 | 242,993 | ||||||
| Nippon Shinyaku Co. Ltd. | 500 | 32,801 | ||||||
| Nitto Denko Corp. | 300 | 22,492 | ||||||
| Nomura Research Institute Ltd. | 600 | 30,299 | ||||||
| NTT DOCOMO, Inc. | 5,100 | 137,076 | ||||||
| Obic Co. Ltd. | 500 | 47,291 | ||||||
| Omron Corp. | 5,500 | 232,418 | ||||||
| Oriental Land Co. Ltd. | 1,200 | 125,466 | ||||||
| ORIX Corp. | 8,500 | 137,629 | ||||||
| Otsuka Corp. | 5,200 | 193,960 | ||||||
| Panasonic Corp. | 12,600 | 146,049 | ||||||
| Pola Orbis Holdings, Inc. | 6,100 | 222,791 | ||||||
| Recruit Holdings Co. Ltd. | 6,900 | 230,470 | ||||||
| Resona Holdings, Inc. | 50,000 | 280,723 | ||||||
| Rohm Co. Ltd. | 5,100 | 373,117 | ||||||
| Ryohin Keikaku Co. Ltd. | 900 | 267,515 | ||||||
| Sega Sammy Holdings, Inc. | 3,500 | 51,609 | ||||||
| Seiko Epson Corp. | 2,800 | 47,767 | ||||||
| Seven & i Holdings Co. Ltd. | 500 | 22,292 | ||||||
| SG Holdings Co. Ltd. | 4,100 | 107,413 | ||||||
| Shikoku Electric Power Co., Inc. | 1,500 | 19,599 | ||||||
| Shimadzu Corp. | 6,100 | 191,160 | ||||||
| Shimamura Co. Ltd. | 800 | 75,887 | ||||||
| Shimizu Corp. | 4,500 | 41,086 | ||||||
| Shinsei Bank Ltd. | 5,300 | 86,587 | ||||||
| Shionogi & Co. Ltd. | 3,600 | 235,331 | ||||||
| Shiseido Co. Ltd. | 4,600 | 356,261 | ||||||
| Sojitz Corp. | 115,100 | 415,341 | ||||||
| Sony Corp. | 7,300 | 443,749 | ||||||
| Square Enix Holdings Co. Ltd. | 3,000 | 124,039 | ||||||
| Stanley Electric Co. Ltd. | 600 | 20,513 | ||||||
| Sugi Holdings Co. Ltd. | 500 | 24,557 | ||||||
| Sumitomo Chemical Co. Ltd. | 7,000 | 40,966 | ||||||
| Sumitomo Corp. | 2,800 | 46,663 | ||||||
| Sumitomo Dainippon Pharma Co. Ltd. | 17,300 | 397,320 | ||||||
| Sumitomo Heavy Industries Ltd. | 5,100 | 182,027 | ||||||
| Sumitomo Mitsui Financial Group, Inc. | 2,800 | 112,683 | ||||||
| Suzuken Co. Ltd. | 3,500 | 166,072 | ||||||
| Taiheiyo Cement Corp. | 1,000 | 31,363 | ||||||
| INVESTMENTS | SHARES | VALUE | ||||||
| Japan - 28.0% (continued) | ||||||||
| Taisei Corp. | 6,700 | $ | 305,408 | |||||
| THK Co. Ltd. | 3,500 | 89,062 | ||||||
| Tokyo Electron Ltd. | 2,900 | 399,679 | ||||||
| Toshiba Corp. * | 1,400 | 40,458 | ||||||
| Tosoh Corp. | 17,200 | 264,913 | ||||||
| Toyo Suisan Kaisha Ltd. | 800 | 31,058 | ||||||
| Toyota Boshoku Corp. | 1,200 | 22,427 | ||||||
| Toyota Tsusho Corp. | 3,600 | 135,924 | ||||||
|
| |||||||
| 19,798,365 | ||||||||
|
| |||||||
| Luxembourg - 0.5% | ||||||||
| Aperam SA | 2,994 | 136,959 | ||||||
| ArcelorMittal | 2,400 | 74,511 | ||||||
| SES SA, FDR | 5,868 | 128,717 | ||||||
|
| |||||||
| 340,187 | ||||||||
|
| |||||||
| Macau - 0.3% | ||||||||
| Sands China Ltd. | 10,400 | 46,837 | ||||||
| Wynn Macau Ltd. | 76,400 | 175,460 | ||||||
|
| |||||||
| 222,297 | ||||||||
|
| |||||||
| Malta - 0.6% | ||||||||
| Kindred Group plc, SDR | 39,020 | 437,400 | ||||||
|
| |||||||
| Netherlands - 7.2% | ||||||||
| Aalberts Industries NV | 507 | 21,592 | ||||||
| ASM International NV | 3,891 | 201,578 | ||||||
| ASML Holding NV | 3,991 | 749,328 | ||||||
| ASR Nederland NV (a) | 15,650 | 745,972 | ||||||
| ING Groep NV | 15,785 | 204,875 | ||||||
| Koninklijke Ahold Delhaize NV (a) | 28,107 | 644,846 | ||||||
| Koninklijke DSM NV | 2,349 | 248,790 | ||||||
| Koninklijke Philips NV (a) | 13,009 | 592,970 | ||||||
| Royal Dutch Shell plc, Class A | 20,855 | 715,086 | ||||||
| Royal Dutch Shell plc, Class B | 18,239 | 638,485 | ||||||
| Signify NV (b) | 11,253 | 291,282 | ||||||
|
| |||||||
| 5,054,804 | ||||||||
|
| |||||||
| Norway - 2.7% | ||||||||
| Equinor ASA (a) | 27,825 | 782,334 | ||||||
| Leroy Seafood Group ASA | 50,179 | 409,768 | ||||||
| Norsk Hydro ASA | 3,615 | 21,679 | ||||||
| Salmar ASA | 9,988 | 498,970 | ||||||
| Telenor ASA | 11,264 | 220,275 | ||||||
|
| |||||||
| 1,933,026 | ||||||||
|
| |||||||
| Portugal - 0.1% | ||||||||
| Galp Energia SGPS SA | 3,177 | 62,993 | ||||||
|
| |||||||
| Russia - 0.5% | ||||||||
| Evraz plc | 46,049 | 338,940 | ||||||
|
| |||||||
| Singapore - 1.4% | ||||||||
| ComfortDelGro Corp. Ltd. | 76,300 | 135,604 | ||||||
| DBS Group Holdings Ltd. | 6,800 | 129,725 | ||||||
| Genting Singapore Ltd. | 466,300 | 361,444 | ||||||
| Singapore Airlines Ltd. | 20,700 | 147,452 | ||||||
| United Overseas Bank Ltd. | 7,900 | 156,171 | ||||||
| Venture Corp. Ltd. | 5,200 | 67,052 | ||||||
|
| |||||||
| 997,448 | ||||||||
|
| |||||||
| The accompanying notes are an integral part of these financial statements. | (Continued) |
| AQR Funds | Annual Report | September 2018 | ||||||||||||||
199
Table of Contents
| Schedule of Investments | September 30, 2018 |
| AQR INTERNATIONAL RELAXED CONSTRAINT EQUITY FUND |
| INVESTMENTS | SHARES | VALUE | ||||||
| South Africa - 0.6% | ||||||||
| Anglo American plc | 17,845 | $ | 399,210 | |||||
| Investec plc | 8,172 | 57,328 | ||||||
|
| |||||||
| 456,538 | ||||||||
|
| |||||||
| Spain - 3.4% | ||||||||
| Acerinox SA | 15,657 | 223,359 | ||||||
| ACS Actividades de Construccion y Servicios SA | 2,281 | 96,881 | ||||||
| Amadeus IT Group SA | 2,047 | 189,734 | ||||||
| Banco Bilbao Vizcaya Argentaria SA | 77,641 | 492,263 | ||||||
| Banco de Sabadell SA | 23,626 | 36,523 | ||||||
| Banco Santander SA | 27,220 | 136,281 | ||||||
| Cia de Distribucion Integral Logista Holdings SA | 1,591 | 40,875 | ||||||
| Endesa SA (a) | 27,321 | 589,306 | ||||||
| Mapfre SA | 57,464 | 179,739 | ||||||
| Mediaset Espana Comunicacion SA | 2,811 | 20,465 | ||||||
| Melia Hotels International SA | 4,490 | 50,183 | ||||||
| Repsol SA | 18,489 | 368,066 | ||||||
|
| |||||||
| 2,423,675 | ||||||||
|
| |||||||
| Sweden - 3.5% | ||||||||
| Ahlsell AB (b) | 7,206 | 40,329 | ||||||
| Atlas Copco AB, Class B | 307 | 8,179 | ||||||
| Boliden AB | 7,169 | 199,376 | ||||||
| Electrolux AB, Series B | 5,796 | 127,681 | ||||||
| Elekta AB, Class B | 11,788 | 158,499 | ||||||
| Investor AB, Class B | 1,119 | 51,565 | ||||||
| Nordea Bank AB | 6,154 | 66,959 | ||||||
| Sandvik AB | 25,084 | 444,094 | ||||||
| Skandinaviska Enskilda Banken AB, Class A | 15,925 | 177,533 | ||||||
| SKF AB, Class B | 1,115 | 21,940 | ||||||
| SSAB AB, Class A | 21,284 | 106,831 | ||||||
| Swedbank AB, Class A | 1,265 | 31,286 | ||||||
| Swedish Match AB | 3,607 | 184,373 | ||||||
| Swedish Orphan Biovitrum AB * | 14,091 | 412,025 | ||||||
| Volvo AB, Class B | 26,112 | 460,537 | ||||||
|
| |||||||
| 2,491,207 | ||||||||
|
| |||||||
| Switzerland - 10.0% | ||||||||
| Adecco Group AG (Registered) | 9,423 | 495,342 | ||||||
| Bucher Industries AG (Registered) | 368 | 118,491 | ||||||
| Coca-Cola HBC AG * | 2,625 | 89,432 | ||||||
| GAM Holding AG * | 37,984 | 270,091 | ||||||
| Georg Fischer AG (Registered) | 259 | 293,361 | ||||||
| Helvetia Holding AG (Registered) | 51 | 31,067 | ||||||
| Idorsia Ltd. * | 1,300 | 32,685 | ||||||
| IWG plc | 49,429 | 156,215 | ||||||
| Nestle SA (Registered) (a) | 8,425 | 701,269 | ||||||
| Novartis AG (Registered) (a) | 11,339 | 976,044 | ||||||
| OC Oerlikon Corp. AG (Registered) * | 6,246 | 85,837 | ||||||
| Partners Group Holding AG | 42 | 33,294 | ||||||
| Roche Holding AG (a) | 6,272 | 1,516,665 | ||||||
| Sonova Holding AG (Registered) | 2,753 | 546,383 | ||||||
| STMicroelectronics NV (a) | 37,078 | 679,335 | ||||||
| STMicroelectronics NV | 516 | 9,444 | ||||||
| Swatch Group AG (The) | 573 | 227,730 | ||||||
| Swiss Life Holding AG (Registered) * | 539 | 204,373 | ||||||
| Temenos AG (Registered) * | 1,865 | 303,757 | ||||||
| INVESTMENTS | SHARES | VALUE | ||||||
| Switzerland - 10.0% (continued) | ||||||||
| Zurich Insurance Group AG | 917 | $ | 289,135 | |||||
|
| |||||||
| 7,059,950 | ||||||||
|
| |||||||
| United Kingdom - 15.2% | ||||||||
| Ashtead Group plc | 3,874 | 122,915 | ||||||
| Associated British Foods plc | 5,481 | 163,583 | ||||||
| BAE Systems plc | 2,601 | 21,328 | ||||||
| Balfour Beatty plc | 5,647 | 20,145 | ||||||
| Barclays plc | 182,453 | 404,685 | ||||||
| BBA Aviation plc | 24,202 | 94,734 | ||||||
| Bellway plc | 3,678 | 144,350 | ||||||
| Berkeley Group Holdings plc | 8,081 | 387,134 | ||||||
| BP plc | 130,012 | 996,509 | ||||||
| British Land Co. plc (The), REIT | 4,014 | 32,285 | ||||||
| BT Group plc | 184,106 | 540,415 | ||||||
| BTG plc * | 8,512 | 61,135 | ||||||
| Burberry Group plc | 36,772 | 965,606 | ||||||
| Close Brothers Group plc | 6,072 | 125,146 | ||||||
| Dialog Semiconductor plc * | 4,550 | 99,577 | ||||||
| Direct Line Insurance Group plc | 9,033 | 38,126 | ||||||
| Dixons Carphone plc | 135,077 | 297,770 | ||||||
| Drax Group plc | 19,986 | 101,041 | ||||||
| Fiat Chrysler Automobiles NV * | 15,665 | 273,965 | ||||||
| GlaxoSmithKline plc | 2,806 | 56,274 | ||||||
| Hammerson plc, REIT | 7,915 | 47,095 | ||||||
| Hays plc | 40,236 | 106,809 | ||||||
| Howden Joinery Group plc | 4,066 | 24,830 | ||||||
| HSBC Holdings plc | 25,624 | 223,579 | ||||||
| Inchcape plc | 26,236 | 228,447 | ||||||
| Intermediate Capital Group plc | 2,649 | 37,572 | ||||||
| International Consolidated Airlines Group SA | 2,435 | 20,933 | ||||||
| JD Sports Fashion plc | 44,779 | 267,592 | ||||||
| Just Eat plc * | 23,128 | 201,852 | ||||||
| Land Securities Group plc, REIT | 4,815 | 55,440 | ||||||
| Lloyds Banking Group plc | 496,412 | 381,785 | ||||||
| London Stock Exchange Group plc | 925 | 55,275 | ||||||
| Man Group plc | 167,014 | 383,124 | ||||||
| Meggitt plc | 17,481 | 129,061 | ||||||
| Melrose Industries plc | 12,830 | 33,398 | ||||||
| Mondi plc | 936 | 25,627 | ||||||
| Moneysupermarket.com Group plc | 99,200 | 360,964 | ||||||
| Next plc | 956 | 68,417 | ||||||
| Persimmon plc | 7,972 | 245,437 | ||||||
| Playtech plc | 6,304 | 40,009 | ||||||
| Provident Financial plc * | 3,493 | 27,480 | ||||||
| RELX plc * | 4,136 | 86,894 | ||||||
| RELX plc | 5,134 | 108,002 | ||||||
| Royal Bank of Scotland Group plc | 95,193 | 308,435 | ||||||
| Royal Mail plc | 45,112 | 280,434 | ||||||
| Segro plc, REIT | 5,458 | 45,418 | ||||||
| Sky plc | 4,482 | 100,995 | ||||||
| Smith & Nephew plc | 28,202 | 514,536 | ||||||
| Spectris plc | 4,013 | 123,952 | ||||||
| Standard Life Aberdeen plc | 76,885 | 306,358 | ||||||
| Tate & Lyle plc | 3,513 | 31,239 | ||||||
| Taylor Wimpey plc | 26,198 | 58,558 | ||||||
| Thomas Cook Group plc | 134,344 | 101,250 | ||||||
| Unilever plc | 5,326 | 292,579 | ||||||
| The accompanying notes are an integral part of these financial statements. | (Continued) |
| AQR Funds | Annual Report | September 2018 | ||||||||||||||
200
Table of Contents
| Schedule of Investments | September 30, 2018 |
| AQR INTERNATIONAL RELAXED CONSTRAINT EQUITY FUND |
| INVESTMENTS | SHARES | VALUE | ||||||
| United Kingdom - 15.2% (continued) | ||||||||
| Vodafone Group plc | 52,292 | $ | 112,042 | |||||
| WH Smith plc | 2,855 | 76,657 | ||||||
| William Hill plc | 104,916 | 344,754 | ||||||
|
| |||||||
| 10,803,552 | ||||||||
|
| |||||||
| United States - 0.4% | ||||||||
| Shire plc | 4,253 | 256,949 | ||||||
|
| |||||||
TOTAL COMMON STOCKS |
| 88,468,539 | ||||||
|
| |||||||
| SHORT-TERM INVESTMENTS - 2.5% | ||||||||
| Investment Companies - 2.5% | ||||||||
| BlackRock Liquidity Funds T-Fund Portfolio, Institutional Shares, 1.97% (1)(c) | 3,381 | 3,381 | ||||||
| Dreyfus Treasury & Agency Cash Management, Institutional Shares, 1.96% (1)(c) | 13,524 | 13,524 | ||||||
| Limited Purpose Cash Investment Fund, 2.06% (1)(c) | 1,733,564 | 1,733,392 | ||||||
| UBS Select Treasury Preferred Fund, Class I, 1.97% (1)(c) | 16,905 | 16,905 | ||||||
|
| |||||||
TOTAL SHORT-TERM INVESTMENTS |
| 1,767,202 | ||||||
|
| |||||||
TOTAL LONG POSITIONS |
| 90,235,741 | ||||||
|
| |||||||
| SHORT POSITIONS - (29.2)% | ||||||||
| COMMON STOCKS - (29.2)% | ||||||||
| Australia - (3.1)% | ||||||||
| APA Group | (9,205 | ) | (66,381 | ) | ||||
| Challenger Ltd. | (60,767 | ) | (491,689 | ) | ||||
| Fortescue Metals Group Ltd. | (97,966 | ) | (277,609 | ) | ||||
| Healthscope Ltd. | (26,578 | ) | (40,318 | ) | ||||
| Magellan Financial Group Ltd. | (8,601 | ) | (171,952 | ) | ||||
| SEEK Ltd. | (35,791 | ) | (535,902 | ) | ||||
| Tabcorp Holdings Ltd. | (29,798 | ) | (104,838 | ) | ||||
| TPG Telecom Ltd. | (37,786 | ) | (233,082 | ) | ||||
| Transurban Group | (2,492 | ) | (20,196 | ) | ||||
| Vocus Group Ltd. * | (102,320 | ) | (242,319 | ) | ||||
|
| |||||||
| (2,184,286 | ) | |||||||
|
| |||||||
| Austria - (0.3)% | ||||||||
| ams AG * | (3,340 | ) | (187,991 | ) | ||||
|
| |||||||
| Belgium - (0.5)% | ||||||||
| Telenet Group Holding NV * | (5,966 | ) | (328,721 | ) | ||||
|
| |||||||
| Colombia - (0.2)% | ||||||||
| Millicom International Cellular SA, SDR | (2,447 | ) | (140,338 | ) | ||||
|
| |||||||
| Denmark - (1.9)% | ||||||||
| AP Moller - Maersk A/S, Class B | (661 | ) | (928,619 | ) | ||||
| Chr Hansen Holding A/S | (658 | ) | (66,712 | ) | ||||
| Genmab A/S * | (867 | ) | (136,182 | ) | ||||
| ISS A/S | (795 | ) | (27,931 | ) | ||||
| Pandora A/S | (988 | ) | (61,624 | ) | ||||
| INVESTMENTS | SHARES | VALUE | ||||||
| Denmark - (1.9)% (continued) | ||||||||
| Vestas Wind Systems A/S | (2,116 | ) | $ | (142,949 | ) | |||
|
| |||||||
| (1,364,017 | ) | |||||||
|
| |||||||
| Finland - (0.7)% | ||||||||
| Huhtamaki OYJ | (5,747 | ) | (184,095 | ) | ||||
| Outokumpu OYJ | (54,611 | ) | (320,265 | ) | ||||
|
| |||||||
| (504,360 | ) | |||||||
|
| |||||||
| France - (3.2)% | ||||||||
| Air France-KLM * | (47,391 | ) | (493,924 | ) | ||||
| Bollore SA | (17,810 | ) | (76,929 | ) | ||||
| Elior Group SA (b) | (3,782 | ) | (58,564 | ) | ||||
| Iliad SA | (4,263 | ) | (556,848 | ) | ||||
| Ingenico Group SA | (3,516 | ) | (267,326 | ) | ||||
| SPIE SA | (1,780 | ) | (35,449 | ) | ||||
| Suez | (28,204 | ) | (401,199 | ) | ||||
| Technicolor SA (Registered) * | (98,431 | ) | (118,002 | ) | ||||
| Valeo SA | (6,222 | ) | (269,418 | ) | ||||
|
| |||||||
| (2,277,659 | ) | |||||||
|
| |||||||
| Germany - (2.0)% | ||||||||
| 1&1 Drillisch AG | (2,799 | ) | (136,065 | ) | ||||
| Daimler AG (Registered) | (4,644 | ) | (292,675 | ) | ||||
| Delivery Hero SE *(b) | (378 | ) | (18,151 | ) | ||||
| Deutsche Bank AG (Registered) | (37,618 | ) | (428,459 | ) | ||||
| Fraport AG Frankfurt Airport Services Worldwide | (261 | ) | (23,042 | ) | ||||
| GEA Group AG | (2,153 | ) | (76,634 | ) | ||||
| OSRAM Licht AG | (1,292 | ) | (51,301 | ) | ||||
| Sartorius AG (Preference) | (342 | ) | (55,435 | ) | ||||
| thyssenkrupp AG | (12,793 | ) | (322,722 | ) | ||||
| Zalando SE *(b) | (474 | ) | (18,419 | ) | ||||
|
| |||||||
| (1,422,903 | ) | |||||||
|
| |||||||
| Ireland - (0.4)% | ||||||||
| James Hardie Industries plc, CHESS | (16,771 | ) | (254,038 | ) | ||||
|
| |||||||
| Italy - (2.5)% | ||||||||
| Banco BPM SpA * | (99,814 | ) | (245,117 | ) | ||||
| Brembo SpA | (19,509 | ) | (255,099 | ) | ||||
| Buzzi Unicem SpA | (8,487 | ) | (175,981 | ) | ||||
| Davide Campari-Milano SpA | (13,558 | ) | (115,456 | ) | ||||
| Leonardo SpA | (30,567 | ) | (367,392 | ) | ||||
| Pirelli & C SpA *(b) | (14,842 | ) | (124,357 | ) | ||||
| Recordati SpA | (5,479 | ) | (185,266 | ) | ||||
| Unione di Banche Italiane SpA | (69,679 | ) | (278,849 | ) | ||||
|
| |||||||
| (1,747,517 | ) | |||||||
|
| |||||||
| Japan - (5.3)% | ||||||||
| Acom Co. Ltd. | (7,600 | ) | (30,640 | ) | ||||
| Bank of Kyoto Ltd. (The) | (3,300 | ) | (172,249 | ) | ||||
| Calbee, Inc. | (1,300 | ) | (42,804 | ) | ||||
| Chugoku Electric Power Co., Inc. (The) | (10,900 | ) | (140,075 | ) | ||||
| Denso Corp. | (3,700 | ) | (195,464 | ) | ||||
| Hitachi Metals Ltd. | (21,000 | ) | (260,042 | ) | ||||
| Hokuriku Electric Power Co. * | (40,400 | ) | (413,899 | ) | ||||
| Kansai Paint Co. Ltd. | (6,400 | ) | (117,953 | ) | ||||
| Keikyu Corp. | (22,000 | ) | (400,970 | ) | ||||
| Kyushu Electric Power Co., Inc. | (2,200 | ) | (26,591 | ) | ||||
| The accompanying notes are an integral part of these financial statements. | (Continued) |
| AQR Funds | Annual Report | September 2018 | ||||||||||||||
201
Table of Contents
| Schedule of Investments | September 30, 2018 |
| AQR INTERNATIONAL RELAXED CONSTRAINT EQUITY FUND |
| INVESTMENTS | SHARES | VALUE | ||||||
| Japan - (5.3)% (continued) | ||||||||
| LINE Corp. * | (4,900 | ) | $ | (206,437 | ) | |||
| Marui Group Co. Ltd. | (8,200 | ) | (202,326 | ) | ||||
| Nagoya Railroad Co. Ltd. | (900 | ) | (22,288 | ) | ||||
| Nifco, Inc. | (2,600 | ) | (69,910 | ) | ||||
| Nippon Paint Holdings Co. Ltd. | (5,700 | ) | (212,759 | ) | ||||
| Odakyu Electric Railway Co. Ltd. | (6,000 | ) | (141,941 | ) | ||||
| Ricoh Co. Ltd. | (12,200 | ) | (131,084 | ) | ||||
| Sawai Pharmaceutical Co. Ltd. | (400 | ) | (21,593 | ) | ||||
| Seven Bank Ltd. | (10,700 | ) | (33,794 | ) | ||||
| Sony Financial Holdings, Inc. | (1,100 | ) | (24,257 | ) | ||||
| Sosei Group Corp. * | (14,700 | ) | (177,354 | ) | ||||
| Suzuki Motor Corp. | (2,000 | ) | (114,622 | ) | ||||
| Toho Gas Co. Ltd. | (1,600 | ) | (60,875 | ) | ||||
| Toray Industries, Inc. | (40,800 | ) | (306,124 | ) | ||||
| Toyota Industries Corp. | (700 | ) | (41,431 | ) | ||||
| Yokohama Rubber Co. Ltd. (The) | (6,500 | ) | (140,102 | ) | ||||
|
| |||||||
| (3,707,584 | ) | |||||||
|
| |||||||
| Luxembourg - (0.6)% | ||||||||
| Eurofins Scientific SE | (366 | ) | (208,229 | ) | ||||
| Tenaris SA | (14,389 | ) | (240,979 | ) | ||||
|
| |||||||
| (449,208 | ) | |||||||
|
| |||||||
| Netherlands - (1.4)% | ||||||||
| ABN AMRO Group NV, CVA (b) | (3,751 | ) | (102,155 | ) | ||||
| ALTICE EUROPE NV * | (35,075 | ) | (94,601 | ) | ||||
| Boskalis Westminster | (9,623 | ) | (303,014 | ) | ||||
| Koninklijke KPN NV | (15,940 | ) | (42,050 | ) | ||||
| Koninklijke Vopak NV | (1,115 | ) | (54,932 | ) | ||||
| OCI NV * | (9,171 | ) | (293,195 | ) | ||||
| SBM Offshore NV | (4,302 | ) | (77,659 | ) | ||||
|
| |||||||
| (967,606 | ) | |||||||
|
| |||||||
| Norway - (0.7)% | ||||||||
| Gjensidige Forsikring ASA | (4,570 | ) | (77,023 | ) | ||||
| Schibsted ASA, Class A | (783 | ) | (29,392 | ) | ||||
| Yara International ASA | (8,421 | ) | (413,288 | ) | ||||
|
| |||||||
| (519,703) | ||||||||
|
| |||||||
| Portugal - 0.0% (d) | ||||||||
| NOS SGPS SA | (3,933 | ) | (23,556 | ) | ||||
|
| |||||||
| Spain - (1.2)% | ||||||||
| Bankia SA | (69,384 | ) | (270,855 | ) | ||||
| Cellnex Telecom SA (b) | (19,824 | ) | (519,929 | ) | ||||
| Distribuidora Internacional de Alimentacion SA | (38,478 | ) | (89,181 | ) | ||||
|
| |||||||
| (879,965 | ) | |||||||
|
| |||||||
| Sweden - (0.6)% | ||||||||
| Getinge AB, Class B | (17,288 | ) | (198,541 | ) | ||||
| Saab AB, Class B | (3,134 | ) | (157,606 | ) | ||||
| Tele2 AB, Class B | (7,955 | ) | (95,606 | ) | ||||
|
| |||||||
| (451,753) | ||||||||
|
| |||||||
| United Kingdom - (4.4)% | ||||||||
| Babcock International Group plc | (9,141 | ) | (86,089 | ) | ||||
| ConvaTec Group plc (b) | (112,432 | ) | (340,182 | ) | ||||
| Greene King plc | (8,226 | ) | (52,525 | ) | ||||
| John Wood Group plc | (80,845 | ) | (811,100 | ) | ||||
| INVESTMENTS | SHARES | VALUE | ||||||
| United Kingdom - (4.4)% (continued) | ||||||||
| Merlin Entertainments plc (b) | (65,028 | ) | $ | (339,132 | ) | |||
| Metro Bank plc * | (966 | ) | (37,398 | ) | ||||
| Micro Focus International plc | (22,181 | ) | (412,497 | ) | ||||
| Pennon Group plc | (5,811 | ) | (54,006 | ) | ||||
| Severn Trent plc | (12,976 | ) | (312,785 | ) | ||||
| Subsea 7 SA | (11,917 | ) | (175,751 | ) | ||||
| United Utilities Group plc | (52,825 | ) | (484,930 | ) | ||||
|
| |||||||
| (3,106,395 | ) | |||||||
|
| |||||||
| United States - (0.2)% | ||||||||
| QIAGEN NV * | (3,243 | ) | (122,821 | ) | ||||
|
| |||||||
TOTAL COMMON STOCKS |
| (20,640,421 | ) | |||||
|
| |||||||
TOTAL SHORT POSITIONS |
| (20,640,421 | ) | |||||
|
| |||||||
TOTAL INVESTMENTS IN SECURITIES | 69,595,320 | |||||||
|
| |||||||
| OTHER ASSETS IN EXCESS OF LIABILITIES - 1.4% (e) | 985,719 | |||||||
|
| |||||||
| NET ASSETS - 100.0% | $70,581,039 | |||||||
|
| |||||||
| SECTOR | VALUE | % OF NET ASSETS | ||||||
| Communication Services | $ | (300,833 | ) | (0.4 | )% | |||
| Consumer Discretionary | 10,062,454 | 14.3 | ||||||
| Consumer Staples | 4,177,192 | 5.9 | ||||||
| Energy | 7,518,237 | 10.7 | ||||||
| Financials | 8,977,473 | 12.7 | ||||||
| Health Care | 11,893,959 | 16.9 | ||||||
| Industrials | 9,000,110 | 12.7 | ||||||
| Information Technology | 7,705,804 | 10.9 | ||||||
| Materials | 5,356,988 | 7.6 | ||||||
| Real Estate | 2,630,214 | 3.7 | ||||||
| Utilities | 806,520 | 1.1 | ||||||
| Short-Term Investments | 1,767,202 | 2.5 | ||||||
|
|
|
| |||||
Total Investments In Securities At Value | 69,595,320 | 98.6 | ||||||
| Other Assets in Excess of Liabilities (e) | 985,719 | 1.4 | ||||||
|
|
|
| |||||
Net Assets | $ | 70,581,039 | 100.0 | % | ||||
|
|
|
| |||||
| * | Non-income producing security. |
| (a) | All or a portion of this security is segregated in connection with obligations for securities sold short with a total value of $22,821,449. |
| (b) | Securities exempt from registration under Rule 144A or section 4(2), of the Securities Act of 1933. Under procedures approved by the Board of Trustees, such securities have been determined to be liquid by the investment adviser and may be resold, normally to qualified institutional buyers in transactions exempt from registration. Total value of all such securities at September 30, 2018 amounted to $234,069, which represents approximately 0.33% of net assets of the fund. |
| (c) | Represents 7-day effective yield as of September 30, 2018. |
| (d) | Represents less than 0.05% of net assets. |
| (e) | Includes appreciation/(depreciation) on futures contracts. |
| The accompanying notes are an integral part of these financial statements. | (Continued) |
| AQR Funds | Annual Report | September 2018 | ||||||||||||||
202
Table of Contents
| Schedule of Investments | September 30, 2018 |
| AQR INTERNATIONAL RELAXED CONSTRAINT EQUITY FUND |
All securities are Level 2 with respect to ASC 820, unless otherwise noted in parentheses.
| (1) | Level 1 security (See Note 4). |
Abbreviations
CHESS - Clearing House Electronic Subregister System Depository Interest
CVA - Dutch Certification
FDR - Fiduciary Depositary Receipt
OYJ - Public Traded Company
Preference - A special type of equity investment that shares in the earnings of the company, has limited voting rights, and may have a dividend preference. Preference shares may also have liquidation preference.
REIT - Real Estate Investment Trust
SCA - Limited partnership with share capital
SDR - Swedish Depositary Receipt
Futures contracts outstanding as of September 30, 2018:
Exchange Traded
| DESCRIPTION | NUMBER OF CONTRACTS | EXPIRATION DATE | TRADING CURRENCY | NOTIONAL AMOUNT | VALUE AND UNREALIZED APPRECIATION (DEPRECIATION) | |||||||||||
| Long Contracts | ||||||||||||||||
| MSCI EAFE E-Mini Index | 15 | 12/2018 | USD | $1,481,625 | $15,643 | |||||||||||
|
| |||||||||||||||
| $15,643 | ||||||||||||||||
|
| |||||||||||||||
| USD | - United States Dollar |
Collateral pledged to, or (received from), each counterparty at September 30, 2018 was as follows:
| COUNTERPARTY | OVER THE COUNTER | EXCHANGE TRADED | TOTAL | |||||||||
| JPMS | ||||||||||||
| Cash | $— | $47,017 | $47,017 | |||||||||
| ||||||||||||
| The accompanying notes are an integral part of these financial statements. |
| AQR Funds | Annual Report | September 2018 | ||||||||||||||
203
Table of Contents
| Schedule of Investments | September 30, 2018 |
| AQR EMERGING RELAXED CONSTRAINT EQUITY FUND |
| INVESTMENTS | SHARES | VALUE | ||||||
| COMMON STOCKS - 71.2% | ||||||||
| Brazil - 7.6% | ||||||||
| Braskem SA (Preference), Class A (1) | 14,200 | $ | 204,919 | |||||
| Cia Brasileira de Distribuicao (Preference) (1)* | 600 | 12,924 | ||||||
| Embraer SA, ADR (1) | 1,320 | 25,859 | ||||||
| IRB Brasil Resseguros S/A (1) | 1,000 | 16,380 | ||||||
| Odontoprev SA (1) | 12,400 | 39,301 | ||||||
| Petrobras Distribuidora SA (1) | 13,200 | 63,638 | ||||||
| Petroleo Brasileiro SA (Preference) (1)* | 71,400 | 373,040 | ||||||
| Porto Seguro SA (1) | 6,000 | 88,368 | ||||||
| Sul America SA (1) | 18,540 | 119,130 | ||||||
| Suzano Papel e Celulose SA (1) | 67,100 | 797,348 | ||||||
| TIM Participacoes SA, ADR (1) | 11,588 | 167,910 | ||||||
| Vale SA, ADR (1) | 63,869 | 947,816 | ||||||
|
| |||||||
| 2,856,633 | ||||||||
|
| |||||||
| Chile - 1.6% | ||||||||
| Banco de Chile, ADR (1) | 1,653 | 150,505 | ||||||
| Banco de Credito e Inversiones SA | 288 | 19,480 | ||||||
| Banco Santander Chile, ADR (1) | 5,557 | 177,712 | ||||||
| Empresas CMPC SA | 24,756 | 99,908 | ||||||
| Empresas COPEC SA | 4,786 | 73,938 | ||||||
| Enel Americas SA, ADR (1) | 2,697 | 20,848 | ||||||
| Enel Chile SA, ADR (1) | 8,670 | 43,437 | ||||||
| Itau CorpBanca | 1,781,511 | 18,344 | ||||||
|
| |||||||
| 604,172 | ||||||||
|
| |||||||
| China - 7.5% | ||||||||
| 58.com, Inc., ADR (1)* | 858 | 63,149 | ||||||
| Alibaba Group Holding Ltd., ADR (1)* | 8,250 | 1,359,269 | ||||||
| Autohome, Inc., ADR (1) | 520 | 40,253 | ||||||
| Baidu, Inc., ADR (1)* | 1,949 | 445,697 | ||||||
| Ctrip.com International Ltd., ADR (1)* | 3,695 | 137,343 | ||||||
| Huazhu Group Ltd., ADR (1) | 1,296 | 41,861 | ||||||
| JD.com, Inc., ADR (1)* | 6,072 | 158,418 | ||||||
| Momo, Inc., ADR (1)* | 1,127 | 49,363 | ||||||
| NetEase, Inc., ADR (1) | 549 | 125,309 | ||||||
| New Oriental Education & Technology Group, Inc., ADR (1)* | 1,251 | 92,587 | ||||||
| SINA Corp. (1)* | 568 | 39,465 | ||||||
| TAL Education Group, ADR (1)* | 2,653 | 68,209 | ||||||
| Vipshop Holdings Ltd., ADR (1)* | 3,741 | 23,344 | ||||||
| Weibo Corp., ADR (1)* | 222 | 16,235 | ||||||
| Yum China Holdings, Inc. (1) | 3,591 | 126,080 | ||||||
|
| |||||||
| 2,786,582 | ||||||||
|
| |||||||
| Hungary - 0.2% | ||||||||
| MOL Hungarian Oil & Gas plc | 4,222 | 45,475 | ||||||
| OTP Bank Nyrt | 853 | 31,611 | ||||||
|
| |||||||
| 77,086 | ||||||||
|
| |||||||
| India - 6.4% | ||||||||
| Dr Reddy’s Laboratories Ltd., ADR (1) | 7,816 | 270,434 | ||||||
| ICICI Bank Ltd., ADR (1) | 34,404 | 292,090 | ||||||
| Infosys Ltd., ADR (1) | 84,546 | 859,833 | ||||||
| Tata Motors Ltd., ADR (1)* | 10,188 | 156,488 | ||||||
| Vedanta Ltd., ADR (1) | 16,413 | 210,086 | ||||||
| Wipro Ltd., ADR (1) | 113,916 | 593,502 | ||||||
|
| |||||||
| 2,382,433 | ||||||||
|
| |||||||
| INVESTMENTS | SHARES | VALUE | ||||||
| Indonesia - 2.6% | ||||||||
| Adaro Energy Tbk. PT | 3,269,200 | $ | 402,255 | |||||
| Bank Central Asia Tbk. PT | 70,500 | 114,192 | ||||||
| Bank Mandiri Persero Tbk. PT | 62,200 | 28,028 | ||||||
| Bank Negara Indonesia Persero Tbk. PT | 343,200 | 170,430 | ||||||
| Indah Kiat Pulp & Paper Corp. Tbk. PT | 14,600 | 16,988 | ||||||
| Perusahaan Gas Negara Persero Tbk. | 246,500 | 37,183 | ||||||
| United Tractors Tbk. PT | 98,200 | 217,418 | ||||||
|
| |||||||
| 986,494 | ||||||||
|
| |||||||
| Peru - 0.3% | ||||||||
| Credicorp Ltd. (1) | 441 | 98,378 | ||||||
| Southern Copper Corp. (1) | 529 | 22,821 | ||||||
|
| |||||||
| 121,199 | ||||||||
|
| |||||||
| Philippines - 0.6% | ||||||||
| Ayala Corp. | 610 | 10,475 | ||||||
| Ayala Land, Inc. | 64,900 | 48,107 | ||||||
| Jollibee Foods Corp. | 17,050 | 81,067 | ||||||
| Metro Pacific Investments Corp. | 109,100 | 9,583 | ||||||
| SM Investments Corp. | 1,000 | 16,725 | ||||||
| SM Prime Holdings, Inc. | 97,800 | 65,444 | ||||||
|
| |||||||
| 231,401 | ||||||||
|
| |||||||
| Poland - 1.5% | ||||||||
| Alior Bank SA * | 893 | 15,240 | ||||||
| CD Projekt SA * | 293 | 14,876 | ||||||
| Jastrzebska Spolka Weglowa SA * | 14,919 | 268,424 | ||||||
| LPP SA | 26 | 60,825 | ||||||
| PGE Polska Grupa Energetyczna SA * | 65,135 | 168,353 | ||||||
| Polskie Gornictwo Naftowe i Gazownictwo SA * | 16,739 | 29,382 | ||||||
|
| |||||||
| 557,100 | ||||||||
|
| |||||||
| Qatar - 0.6% | ||||||||
| Industries Qatar QSC | 1,440 | 49,461 | ||||||
| Qatar National Bank QPSC | 3,516 | 171,468 | ||||||
|
| |||||||
| 220,929 | ||||||||
|
| |||||||
| Romania - 0.1% | ||||||||
| NEPI Rockcastle plc | 4,687 | 42,463 | ||||||
| New Europe Property Investments plc (3)*(a) | 246 | — | ||||||
|
| |||||||
| 42,463 | ||||||||
|
| |||||||
| South Africa - 4.9% | ||||||||
| Anglo American Platinum Ltd. | 1,167 | 38,153 | ||||||
| Bid Corp. Ltd. | 3,200 | 66,699 | ||||||
| Exxaro Resources Ltd. | 61,201 | 629,165 | ||||||
| Gold Fields Ltd., ADR (1) | 9,363 | 22,658 | ||||||
| Growthpoint Properties Ltd., REIT | 45,523 | 74,699 | ||||||
| MMI Holdings Ltd. * | 32,169 | 39,453 | ||||||
| Mr Price Group Ltd. | 27,891 | 449,811 | ||||||
| Naspers Ltd., Class N | 1,239 | 266,817 | ||||||
| Netcare Ltd. | 56,601 | 96,727 | ||||||
| Pick n Pay Stores Ltd. | 5,328 | 25,926 | ||||||
| Redefine Properties Ltd., REIT | 73,102 | 51,773 | ||||||
| Remgro Ltd. | 4,935 | 68,776 | ||||||
| RMB Holdings Ltd. | 2,038 | 11,394 | ||||||
|
| |||||||
| 1,842,051 | ||||||||
|
| |||||||
| The accompanying notes are an integral part of these financial statements. | (Continued) |
| AQR Funds | Annual Report | September 2018 | ||||||||||||||
204
Table of Contents
| Schedule of Investments | September 30, 2018 |
| AQR EMERGING RELAXED CONSTRAINT EQUITY FUND |
| INVESTMENTS | SHARES | VALUE | ||||||
| South Korea - 24.8% | ||||||||
| BGF retail Co. Ltd. | 8 | $ | 1,483 | |||||
| BNK Financial Group, Inc. | 19,118 | 148,188 | ||||||
| Daelim Industrial Co. Ltd. | 1,574 | 117,213 | ||||||
| DB Insurance Co. Ltd. | 1,170 | 76,783 | ||||||
| DGB Financial Group, Inc. | 1,374 | 12,570 | ||||||
| Doosan Bobcat, Inc. | 644 | 23,455 | ||||||
| Hana Financial Group, Inc. | 8,512 | 341,781 | ||||||
| Hanwha Corp. | 6,060 | 179,222 | ||||||
| Hanwha Life Insurance Co. Ltd. | 35,381 | 168,739 | ||||||
| HDC Hyundai Development Co.-Engineering & Construction * | 263 | 12,065 | ||||||
| Hotel Shilla Co. Ltd. | 2,585 | 252,769 | ||||||
| Hyundai Department Store Co. Ltd. | 2,381 | 213,370 | ||||||
| Hyundai Marine & Fire Insurance Co. Ltd. | 2,213 | 83,654 | ||||||
| Korea Investment Holdings Co. Ltd. | 5,747 | 394,083 | ||||||
| KT Corp., ADR (1) | 11,280 | 167,508 | ||||||
| Kumho Petrochemical Co. Ltd. | 758 | 67,301 | ||||||
| LG Corp. | 7,942 | 519,844 | ||||||
| LG Electronics, Inc. | 1,214 | 77,685 | ||||||
| Lotte Chemical Corp. | 492 | 123,299 | ||||||
| Lotte Shopping Co. Ltd. | 1,603 | 302,933 | ||||||
| Medy-Tox, Inc. | 356 | 198,711 | ||||||
| NCSoft Corp. | 882 | 351,895 | ||||||
| OCI Co. Ltd. | 1,440 | 142,772 | ||||||
| POSCO | 586 | 155,552 | ||||||
| Posco Daewoo Corp. | 4,883 | 92,133 | ||||||
| Samsung Electro-Mechanics Co. Ltd. | 1,040 | 130,259 | ||||||
| Samsung Electronics Co. Ltd. | 64,227 | 2,687,955 | ||||||
| Samsung SDS Co. Ltd. | 2,948 | 613,814 | ||||||
| Shinsegae, Inc. | 174 | 56,885 | ||||||
| SK Hynix, Inc. | 19,250 | 1,273,539 | ||||||
| SK Innovation Co. Ltd. | 1,495 | 289,791 | ||||||
|
| |||||||
| 9,277,251 | ||||||||
|
| |||||||
| Taiwan - 11.7% | ||||||||
| Catcher Technology Co. Ltd. | 51,000 | 560,637 | ||||||
| China Airlines Ltd. | 379,000 | 114,796 | ||||||
| China Development Financial Holding Corp. | 1,014,000 | 378,337 | ||||||
| China Life Insurance Co. Ltd. | 37,280 | 37,485 | ||||||
| CTBC Financial Holding Co. Ltd. | 312,000 | 234,910 | ||||||
| E.Sun Financial Holding Co. Ltd. | 148,250 | 109,457 | ||||||
| Eva Airways Corp. | 196,350 | 95,478 | ||||||
| First Financial Holding Co. Ltd. | 326,472 | 222,339 | ||||||
| Formosa Chemicals & Fibre Corp. | 17,000 | 71,241 | ||||||
| Globalwafers Co. Ltd. | 24,000 | 264,481 | ||||||
| Hiwin Technologies Corp. | 15,690 | 129,638 | ||||||
| Nanya Technology Corp. | 120,000 | 229,151 | ||||||
| Novatek Microelectronics Corp. | 10,000 | 49,349 | ||||||
| Phison Electronics Corp. | 2,000 | 15,940 | ||||||
| President Chain Store Corp. | 2,000 | 23,481 | ||||||
| Realtek Semiconductor Corp. * | 25,000 | 111,407 | ||||||
| Shin Kong Financial Holding Co. Ltd. | 338,809 | 132,503 | ||||||
| SinoPac Financial Holdings Co. Ltd. | 42,840 | 15,639 | ||||||
| Taiwan Cooperative Financial Holding Co. Ltd. | 20,600 | 12,547 | ||||||
| Taiwan Semiconductor Manufacturing Co. Ltd., ADR (1) | 34,420 | 1,519,986 | ||||||
| Uni-President Enterprises Corp. | 16,000 | 41,744 | ||||||
|
| |||||||
| 4,370,546 | ||||||||
|
| |||||||
| INVESTMENTS | SHARES | VALUE | ||||||
| United Arab Emirates - 0.5% | ||||||||
| Emaar Properties PJSC | 37,388 | $ | 50,400 | |||||
| Emirates Telecommunications Group Co. PJSC | 16,258 | 73,915 | ||||||
| First Abu Dhabi Bank PJSC | 11,250 | 43,900 | ||||||
|
| |||||||
| 168,215 | ||||||||
|
| |||||||
| United Kingdom - 0.3% | ||||||||
| Mondi Ltd. | 3,434 | 94,304 | ||||||
|
| |||||||
TOTAL COMMON STOCKS |
| 26,618,859 | ||||||
|
| |||||||
| SHORT-TERM INVESTMENTS - 26.7% | ||||||||
| Investment Companies - 26.7% | ||||||||
| J.P. Morgan U.S. Treasury Plus Money Market Fund - IM Shares, 2.00% (1)(b)(c) | 6,595,297 | 6,595,297 | ||||||
| Limited Purpose Cash Investment Fund, 2.06% (1)(b) | 3,370,314 | 3,369,977 | ||||||
|
| |||||||
TOTAL SHORT-TERM INVESTMENTS |
| 9,965,274 | ||||||
|
| |||||||
TOTAL INVESTMENTS IN SECURITIES |
| 36,584,133 | ||||||
|
| |||||||
| OTHER ASSETS IN EXCESS OF LIABILITIES - 2.1% (d) | 785,037 | |||||||
|
| |||||||
NET ASSETS - 100.0% |
| $ | 37,369,170 | |||||
|
| |||||||
| SECTOR | VALUE | % OF NET ASSETS | ||||||
| Communication Services | $ | 1,822,392 | 4.9 | % | ||||
| Consumer Discretionary | 3,722,581 | 10.0 | ||||||
| Consumer Staples | 172,257 | 0.4 | ||||||
| Energy | 2,060,461 | 5.5 | ||||||
| Financials | 4,063,953 | 10.9 | ||||||
| Health Care | 605,174 | 1.6 | ||||||
| Industrials | 1,375,889 | 3.7 | ||||||
| Information Technology | 8,909,855 | 23.8 | ||||||
| Materials | 3,283,590 | 8.8 | ||||||
| Real Estate | 332,887 | 0.9 | ||||||
| Utilities | 269,820 | 0.7 | ||||||
| Short-Term Investments | 9,965,274 | 26.7 | ||||||
|
|
|
| |||||
Total Investments In Securities At Value | 36,584,133 | 97.9 | ||||||
| Other Assets in Excess of Liabilities (d) | 785,037 | 2.1 | ||||||
|
|
|
| |||||
Net Assets | $ | 37,369,170 | 100.0 | % | ||||
|
|
|
| |||||
| The accompanying notes are an integral part of these financial statements. | (Continued) |
| AQR Funds | Annual Report | September 2018 | ||||||||||||||
205
Table of Contents
| Schedule of Investments | September 30, 2018 |
| AQR EMERGING RELAXED CONSTRAINT EQUITY FUND |
| * | Non-income producing security. |
| (a) | Security fair valued as of September 30, 2018 in accordance with procedures approved by the Board of Trustees. Total value of all such securities at September 30, 2018 amounted to $0, which represents approximately 0.00% of net assets of the fund. |
| (b) | Represents 7-day effective yield as of September 30, 2018. |
| (c) | All or a portion of the security pledged as collateral for forward foreign currency exchange and swap contracts. |
| (d) | Includes appreciation/(depreciation) on futures contracts and swap contracts. |
All securities are Level 2 with respect to ASC 820, unless otherwise noted in parentheses.
| (1) | Level 1 security (See Note 4). |
| (3) | Level 3 security (See Note 4). |
Abbreviations
ADR - American Depositary Receipt
PJSC - Public Joint Stock Company
Preference - A special type of equity investment that shares in the earnings of the company, has limited voting rights, and may have a dividend preference. Preference shares may also have liquidation preference.
REIT - Real Estate Investment Trust
Futures contracts outstanding as of September 30, 2018:
Exchange Traded
| DESCRIPTION | NUMBER OF CONTRACTS | EXPIRATION DATE | TRADING CURRENCY | NOTIONAL AMOUNT | VALUE AND UNREALIZED APPRECIATION (DEPRECIATION) | |||||||||||
| Long Contracts |
| |||||||||||||||
| MSCI Emerging Markets E-Mini Index | 19 | 12/2018 | USD | $997,215 | $14,479 | |||||||||||
|
| |||||||||||||||
| $14,479 | ||||||||||||||||
|
| |||||||||||||||
USD - United States Dollar
Total Return Basket Swaps Outstanding at September 30, 2018
Over the Counter
| COUNTERPARTY | DESCRIPTION | TERMINATION DATE | ABSOLUTE NOTIONAL VALUE | NET UNREALIZED APPRECIATION (DEPRECIATION) | NET CASH AND OTHER RECEIVABLES (PAYABLES) | VALUE (Note 5) | ||||||||||||||
| JPMC | The Fund receives the total return on a portfolio of long and short equity positions and pays or receives the Warsaw Interbank Effective Rate plus or minus a specified spread (-0.70% to -0.40%), which is denominated in PLN based on the local currencies of the positions within the swap. | 53-61 months maturity ranging from 02/06/2023-08/02/2023 | $151,760 | $6,275 | $1,276 | $7,551 | ||||||||||||||
|
| |||||||||||||||||||
| The accompanying notes are an integral part of these financial statements. | (Continued) |
| AQR Funds | Annual Report | September 2018 | ||||||||||||||
206
Table of Contents
| Schedule of Investments | September 30, 2018 |
| AQR EMERGING RELAXED CONSTRAINT EQUITY FUND |
| COUNTERPARTY | DESCRIPTION | TERMINATION DATE | ABSOLUTE NOTIONAL VALUE | NET UNREALIZED APPRECIATION (DEPRECIATION) | NET CASH AND OTHER RECEIVABLES (PAYABLES) | VALUE (Note 5) | ||||||||||||||
| JPMC | The Fund receives the total return on a portfolio of long and short equity positions and pays or receives the Johannesburg Interbank Agreed Rate plus or minus a specified spread (-0.75%), which is denominated in ZAR based on the local currencies of the positions within the swap. | 50-61 months maturity ranging from 10/18/2022-09/13/2023 | $107,765 | $13,550 | $51,301 | $64,851 | ||||||||||||||
|
| |||||||||||||||||||
| JPMC | The Fund receives the total return on a portfolio of long and short equity positions and pays or receives the LIBOR or Federal Funds Floating Rate plus or minus a specified spread (-3.25% to 0.75%), which is denominated in USD based on the local currencies of the positions within the swap. | 40-61 months maturity ranging from 12/20/2021-09/14/2023 | $9,956,817 | $543,853 | $27,762 | $571,615 | ||||||||||||||
|
| |||||||||||||||||||
The following table represents required component disclosures associated with the total return basket swap as of period end.
| REFERENCE ENTITY | SHARES | NOTIONAL VALUE | NET UNREALIZED APPRECIATION (DEPRECIATION) | PERCENTAGE OF SWAP VALUE | ||||||||||||
| Long Positions |
| |||||||||||||||
| Common Stock |
| |||||||||||||||
| China | ||||||||||||||||
| Bank of China Ltd. | 174,600 | $94,394 | $5,234 | 0.9 | % | |||||||||||
| Bank of Communications Co. Ltd. | 40,413 | 34,303 | 1,746 | 0.3 | ||||||||||||
| Jiangsu Hengrui Medicine Co. Ltd. | 8,000 | 73,827 | (8,789 | ) | (1.5 | ) | ||||||||||
| India | ||||||||||||||||
| Axis Bank Ltd. | 3,120 | 131,964 | 2,956 | 0.5 | ||||||||||||
| Larsen & Toubro Ltd. | 8,914 | 154,656 | (27,962 | ) | (4.9 | ) | ||||||||||
| Reliance Industries Ltd. | 13,394 | 460,873 | 79,385 | 13.9 | ||||||||||||
| State Bank of India | 3,621 | 133,692 | (15,116 | ) | (2.6 | ) | ||||||||||
| Malaysia | ||||||||||||||||
| AirAsia Bhd. | 85,000 | 64,883 | (20,128 | ) | (3.5 | ) | ||||||||||
| Hartalega Holdings Bhd. | 15,200 | 24,300 | (2,994 | ) | (0.5 | ) | ||||||||||
| Hong Leong Bank Bhd. | 13,100 | 65,150 | 3,627 | 0.6 | ||||||||||||
| Malayan Banking Bhd. | 52,400 | 123,933 | (19,232 | ) | (3.4 | ) | ||||||||||
| Malaysia Airports Holdings Bhd. | 152,800 | 328,502 | (13,113 | ) | (2.3 | ) | ||||||||||
| My EG Services Bhd. | 707,600 | 298,969 | 110,599 | 19.3 | ||||||||||||
| Public Bank Bhd. | 26,100 | 157,638 | 4,937 | 0.9 | ||||||||||||
| Top Glove Corp. Bhd. | 70,700 | 182,020 | (3,349 | ) | (0.6 | ) | ||||||||||
| The accompanying notes are an integral part of these financial statements. | (Continued) |
| AQR Funds | Annual Report | September 2018 | ||||||||||||||
207
Table of Contents
| Schedule of Investments | September 30, 2018 |
| AQR EMERGING RELAXED CONSTRAINT EQUITY FUND |
| REFERENCE ENTITY | SHARES | NOTIONAL VALUE | NET UNREALIZED APPRECIATION (DEPRECIATION) | PERCENTAGE OF SWAP VALUE | ||||||||||||
| Russia | ||||||||||||||||
| Gazprom PJSC, ADR | 40,385 | $ | 201,522 | $ | 4,360 | 0.8 | % | |||||||||
| LUKOIL PJSC, ADR | 3,338 | 255,602 | 36,210 | 6.3 | ||||||||||||
| Novatek PJSC | 634 | 116,283 | 29,199 | 5.1 | ||||||||||||
| Novolipetsk Steel PJSC | 5,508 | 148,247 | 5,253 | 0.9 | ||||||||||||
| Rosneft Oil Co. PJSC | 11,077 | 82,765 | 19,515 | 3.4 | ||||||||||||
| Severstal PJSC | 15,633 | 260,368 | 4,547 | 0.8 | ||||||||||||
| Surgutneftegas PJSC, ADR | 5,639 | 23,280 | (4,114 | ) | (0.7 | ) | ||||||||||
| Tatneft PJSC, ADR | 2,369 | 180,754 | 40,043 | 7.0 | ||||||||||||
| Thailand | ||||||||||||||||
| Bangkok Dusit Medical Services PCL | 75,900 | 59,843 | (920 | ) | (0.2 | ) | ||||||||||
| Bumrungrad Hospital PCL | 5,500 | 31,616 | (852 | ) | (0.1 | ) | ||||||||||
| Central Pattana PCL | 10,900 | 27,975 | (763 | ) | (0.1 | ) | ||||||||||
| Home Product Center PCL | 504,400 | 246,575 | 19,997 | 3.5 | ||||||||||||
| PTT Exploration & Production PCL | 17,800 | 85,428 | 8,660 | 1.5 | ||||||||||||
| PTT Global Chemical PCL | 102,800 | 258,327 | (37,533 | ) | (6.6 | ) | ||||||||||
| PTT PCL | 71,200 | 119,530 | 7,181 | 1.3 | ||||||||||||
| Thai Oil PCL | 168,600 | 461,642 | (74,243 | ) | (13.0 | ) | ||||||||||
| Short Positions | ||||||||||||||||
| Common Stock | ||||||||||||||||
| Brazil | ||||||||||||||||
| B3 SA - Brasil Bolsa Balcao | (2,700 | ) | (15,644 | ) | (1,088 | ) | (0.2 | ) | ||||||||
| BRF SA | (137,000 | ) | (745,290 | ) | 9,655 | 1.7 | ||||||||||
| Mexico | ||||||||||||||||
| Grupo Televisa SAB, ADR | (9,068 | ) | (160,866 | ) | 5,928 | 1.0 | ||||||||||
| Russia | ||||||||||||||||
| Magnit PJSC | (6,381 | ) | (90,521 | ) | 7,077 | 1.2 | ||||||||||
| South Korea | ||||||||||||||||
| Amorepacific Corp. | (66 | ) | (15,524 | ) | 1,601 | 0.3 | ||||||||||
| CJ CheilJedang Corp. | (2,262 | ) | (679,901 | ) | 11,220 | 2.0 | ||||||||||
| CJ Corp. | (1,169 | ) | (142,258 | ) | 28,740 | 5.0 | ||||||||||
| CJ Logistics Corp. | (3,004 | ) | (427,831 | ) | (41,681 | ) | (7.3 | ) | ||||||||
| GS Retail Co. Ltd. | (7,762 | ) | (269,474 | ) | (16,078 | ) | (2.8 | ) | ||||||||
| Hanssem Co. Ltd. | (2,872 | ) | (198,346 | ) | 176,040 | 30.8 | ||||||||||
| Hyundai Heavy Industries Co. Ltd. | (6,321 | ) | (766,153 | ) | (140,589 | ) | (24.6 | ) | ||||||||
| Hyundai Motor Co. | (956 | ) | (111,593 | ) | (6,204 | ) | (1.1 | ) | ||||||||
| Kakao Corp. | (719 | ) | (77,104 | ) | (2,901 | ) | (0.5 | ) | ||||||||
| Korea Aerospace Industries Ltd. | (21,493 | ) | (680,834 | ) | 297,980 | 52.1 | ||||||||||
| Lotte Corp. | (3,099 | ) | (159,531 | ) | (5,767 | ) | (1.0 | ) | ||||||||
| Ottogi Corp. | (36 | ) | (24,242 | ) | 1,025 | 0.2 | ||||||||||
| Pan Ocean Co. Ltd. | (61,386 | ) | (289,953 | ) | 44,421 | 7.8 | ||||||||||
| Samsung C&T Corp. | (1,157 | ) | (135,013 | ) | 15,270 | 2.7 | ||||||||||
| Thailand | ||||||||||||||||
| True Corp. PCL | (210,100 | ) | (39,314 | ) | 6,785 | 1.2 | ||||||||||
| The accompanying notes are an integral part of these financial statements. | (Continued) |
| AQR Funds | Annual Report | September 2018 | ||||||||||||||
208
Table of Contents
| Schedule of Investments | September 30, 2018 |
| AQR EMERGING RELAXED CONSTRAINT EQUITY FUND |
| COUNTERPARTY | DESCRIPTION | TERMINATION DATE | ABSOLUTE NOTIONAL VALUE | NET UNREALIZED APPRECIATION (DEPRECIATION) | NET CASH AND OTHER RECEIVABLES (PAYABLES) | VALUE (Note 5) | ||||||||||||||
| JPMC | The Fund receives the total return on a portfolio of long and short equity positions and pays or receives the Mexico Equilibrium Interbank Interest Rate plus or minus a specified spread (0.50%), which is denominated in MXN based on the local currencies of the positions within the swap. | 43-55 months maturity ranging from 12/20/2021-08/15/2022 | $1,638,712 | $311,194 | $(4,306 | ) | $306,888 | |||||||||||||
|
| |||||||||||||||||||
The following table represents required component disclosures associated with the total return basket swap as of period end.
| REFERENCE ENTITY | SHARES | NOTIONAL VALUE | NET UNREALIZED APPRECIATION (DEPRECIATION) | PERCENTAGE OF SWAP VALUE | ||||||||||||
| Long Positions |
| |||||||||||||||
| Common Stock |
| |||||||||||||||
| Mexico | ||||||||||||||||
| Fibra Uno Administracion SA de CV | 41,400 | $ | 54,443 | $ | (6,450 | ) | (2.1 | )% | ||||||||
| Mexichem SAB de CV | 127,178 | 437,382 | 64,216 | 20.9 | ||||||||||||
| Wal-Mart de Mexico SAB de CV | 376,343 | 1,146,887 | 253,428 | 82.6 | ||||||||||||
| COUNTERPARTY | DESCRIPTION | TERMINATION DATE | ABSOLUTE NOTIONAL VALUE | NET UNREALIZED APPRECIATION (DEPRECIATION) | NET CASH AND OTHER RECEIVABLES (PAYABLES) | VALUE (Note 5) | ||||||||||||||
| JPMC | The Fund receives the total return on a portfolio of long and short equity positions and pays or receives the HIBOR plus or minus a specified spread (-6.00% to 0.40%), which is denominated in HKD based on the local currencies of the positions within the swap. | 40-61 months maturity ranging from 12/20/2021-09/14/2023 | $19,572,327 | $(973,590 | ) | $21,360 | $(952,230 | ) | ||||||||||||
|
| |||||||||||||||||||
The following table represents required component disclosures associated with the total return basket swap as of period end.
| REFERENCE ENTITY | SHARES | NOTIONAL VALUE | NET UNREALIZED APPRECIATION (DEPRECIATION) | PERCENTAGE OF SWAP VALUE | ||||||||||||
| Long Positions | ||||||||||||||||
| Common Stock |
| |||||||||||||||
| China | ||||||||||||||||
| AAC Technologies Holdings, Inc. | 19,500 | $ | 201,363 | $ | (154,766 | ) | 16.3 | % | ||||||||
| ANTA Sports Products Ltd. | 135,000 | 644,468 | (32,130 | ) | 3.4 | |||||||||||
| China CITIC Bank Corp. Ltd. | 131,000 | 83,655 | 4,833 | (0.5 | ) | |||||||||||
| China Construction Bank Corp. | 887,000 | 775,327 | (174,080 | ) | 18.3 | |||||||||||
| China Evergrande Group | 38,000 | 106,092 | (8,160 | ) | 0.9 | |||||||||||
| China Longyuan Power Group Corp. Ltd. | 95,000 | 79,999 | 1,985 | (0.2 | ) | |||||||||||
| The accompanying notes are an integral part of these financial statements. | (Continued) |
| AQR Funds | Annual Report | September 2018 | ||||||||||||||
209
Table of Contents
| Schedule of Investments | September 30, 2018 |
| AQR EMERGING RELAXED CONSTRAINT EQUITY FUND |
| REFERENCE ENTITY | SHARES | NOTIONAL VALUE | NET UNREALIZED APPRECIATION (DEPRECIATION) | PERCENTAGE OF SWAP VALUE | ||||||||||||
| China (continued) | ||||||||||||||||
| China Medical System Holdings Ltd. | 71,000 | $ | 98,866 | $ | (30,957 | ) | 3.3 | % | ||||||||
| China Mengniu Dairy Co. Ltd. | 39,000 | 129,652 | 6,910 | (0.7 | ) | |||||||||||
| China Mobile Ltd. | 52,000 | 511,256 | 34,815 | (3.7 | ) | |||||||||||
| China National Building Material Co. Ltd. | 642,000 | 569,333 | (134,677 | ) | 14.1 | |||||||||||
| China Overseas Land & Investment Ltd. | 40,000 | 125,237 | (17,965 | ) | 1.9 | |||||||||||
| China Petroleum & Chemical Corp. | 410,000 | 411,947 | 34,028 | (3.6 | ) | |||||||||||
| China Resources Cement Holdings Ltd. | 676,000 | 786,141 | 44,130 | (4.6 | ) | |||||||||||
| China Resources Gas Group Ltd. | 32,000 | 130,129 | 1,455 | (0.2 | ) | |||||||||||
| China Resources Land Ltd. | 30,000 | 105,123 | (7,359 | ) | 0.8 | |||||||||||
| China Shenhua Energy Co. Ltd. | 128,500 | 292,654 | (40,596 | ) | 4.3 | |||||||||||
| CNOOC Ltd. | 484,000 | 958,382 | 174,564 | (18.3 | ) | |||||||||||
| Country Garden Holdings Co. Ltd. | 104,000 | 131,059 | (48,185 | ) | 5.1 | |||||||||||
| CSPC Pharmaceutical Group Ltd. | 446,000 | 943,394 | (248,187 | ) | 26.1 | |||||||||||
| Far East Horizon Ltd. | 88,000 | 83,929 | (3,941 | ) | 0.4 | |||||||||||
| Fosun International Ltd. | 101,500 | 178,849 | (33,938 | ) | 3.6 | |||||||||||
| Haitian International Holdings Ltd. | 109,000 | 242,578 | (62,854 | ) | 6.6 | |||||||||||
| Kingdee International Software Group Co. Ltd. | 212,000 | 230,108 | (11,576 | ) | 1.2 | |||||||||||
| Luye Pharma Group Ltd. | 132,500 | 118,628 | (21,265 | ) | 2.2 | |||||||||||
| MMG Ltd. | 240,000 | 123,556 | (43,408 | ) | 4.6 | |||||||||||
| People’s Insurance Co. Group of China Ltd. (The) | 366,000 | 164,016 | (21,975 | ) | 2.3 | |||||||||||
| PetroChina Co. Ltd. | 236,000 | 191,017 | 13,627 | (1.4 | ) | |||||||||||
| PICC Property & Casualty Co. Ltd. | 109,000 | 128,284 | 85,935 | (9.0 | ) | |||||||||||
| Shandong Weigao Group Medical Polymer Co. Ltd. | 100,000 | 98,681 | 18,652 | (2.0 | ) | |||||||||||
| Sinotruk Hong Kong Ltd. | 421,000 | 918,525 | 311,789 | (32.7 | ) | |||||||||||
| Sunac China Holdings Ltd. | 30,000 | 91,923 | (23,476 | ) | 2.5 | |||||||||||
| Sunny Optical Technology Group Co. Ltd. | 6,600 | 76,197 | (45,073 | ) | 4.7 | |||||||||||
| Tencent Holdings Ltd. | 13,900 | 567,549 | (118,208 | ) | 12.4 | |||||||||||
| Tingyi Cayman Islands Holding Corp. | 94,000 | 172,605 | (806 | ) | 0.1 | |||||||||||
| Uni-President China Holdings Ltd. | 467,000 | 497,051 | 18,304 | (1.9 | ) | |||||||||||
| Yanzhou Coal Mining Co. Ltd. | 134,000 | 154,936 | (14,335 | ) | 1.5 | |||||||||||
| Hong Kong | ||||||||||||||||
| Haier Electronics Group Co. Ltd. | 278,000 | 752,642 | (218,608 | ) | 23.0 | |||||||||||
| Kingboard Laminates Holdings Ltd. | 177,000 | 156,936 | (46,728 | ) | 4.9 | |||||||||||
| Sino Biopharmaceutical Ltd. | 1,146,000 | 1,065,934 | (197,892 | ) | 20.8 | |||||||||||
| SSY Group Ltd. | 172,000 | 166,525 | (5,122 | ) | 0.5 | |||||||||||
| Short Positions | ||||||||||||||||
| Common Stock | ||||||||||||||||
| China | ||||||||||||||||
| Beijing Enterprises Water Group Ltd. | (1,576,000 | ) | (840,190 | ) | 5,156 | (0.5 | ) | |||||||||
| Brilliance China Automotive Holdings Ltd. | (604,000 | ) | (973,933 | ) | 69,234 | (7.3 | ) | |||||||||
| BYD Co. Ltd. | (63,500 | ) | (451,472 | ) | 18,424 | (1.9 | ) | |||||||||
| CGN Power Co. Ltd. | (1,670,000 | ) | (396,253 | ) | 47,408 | (5.0 | ) | |||||||||
| China Galaxy Securities Co. Ltd. | (782,500 | ) | (364,020 | ) | 130,097 | (13.7 | ) | |||||||||
| China International Capital Corp. Ltd. | (70,400 | ) | (129,668 | ) | (4,510 | ) | 0.5 | |||||||||
| China State Construction International Holdings Ltd. | (568,000 | ) | (601,666 | ) | 137,625 | (14.5 | ) | |||||||||
| Lenovo Group Ltd. | (1,452,000 | ) | (1,057,918 | ) | (319,425 | ) | 33.5 | |||||||||
| Semiconductor Manufacturing International Corp. | (186,000 | ) | (200,441 | ) | 25,516 | (2.7 | ) | |||||||||
| Hong Kong | ||||||||||||||||
| Alibaba Pictures Group Ltd. | (2,330,000 | ) | (318,915 | ) | (18,178 | ) | 1.9 | |||||||||
| The accompanying notes are an integral part of these financial statements. | (Continued) |
| AQR Funds | Annual Report | September 2018 | ||||||||||||||
210
Table of Contents
| Schedule of Investments | September 30, 2018 |
| AQR EMERGING RELAXED CONSTRAINT EQUITY FUND |
Collateral pledged to, or (received from), each counterparty at September 30, 2018 was as follows:
| COUNTERPARTY | OVER THE COUNTER | EXCHANGE TRADED | TOTAL | |||||||||
| JPMC | ||||||||||||
| Investment Companies | $6,595,297 | $— | $6,595,297 | |||||||||
| ||||||||||||
| JPMS | ||||||||||||
| Cash | — | 20,476 | 20,476 | |||||||||
| ||||||||||||
| The accompanying notes are an integral part of these financial statements. |
| AQR Funds | Annual Report | September 2018 | ||||||||||||||
211
Table of Contents
| Schedule of Investments |
The following reference rates, and their values as of period-end, are used for security descriptions:
Euro Interbank Offered Rate (“EURIBOR”): -0.37%
Federal Fund Floating Rate: 2.18%
Hong Kong Interbank Offered Rate (“HIBOR”): 2.23%
Johannesburg Interbank Agreed Rate: 6.78%
London Interbank Offered Rate (“LIBOR”): 2.26%
Mexico Equilibrium Interbank Interest Rate: 8.12%
Singapore Swap Offered Rate (“SOR”): 1.51%
Stockholm Interbank Offered Rate (“STIBOR”): -0.49%
Warsaw Interbank Effective Rate: 1.54%
The following abbreviations are used for counterparty descriptions:
BARC - Barclays Capital, Inc.
CITG - Citigroup Global Markets, Inc.
GSCO - Goldman Sachs & Co.
GSIN - Goldman Sachs International
JPMC - J.P. Morgan Chase Bank NA
JPMS - J.P. Morgan Securities LLC
| The accompanying notes are an integral part of these financial statements. |
| AQR Funds | Annual Report | September 2018 | ||||||||||||||
212
Table of Contents
| Statements of Assets and Liabilities | September 30, 2018 |
| AQR LARGE CAP MULTI-STYLE FUND | AQR SMALL CAP MULTI-STYLE FUND | AQR INTERNATIONAL MULTI-STYLE FUND | AQR EMERGING MULTI-STYLE FUND | |||||||||||||
| ASSETS: | ||||||||||||||||
| Investments in securities of unaffiliated issuers, at cost | $ | 1,462,877,979 | $ | 655,041,115 | $ | 369,851,718 | $ | 265,088,483 | ||||||||
| Investments in securities of unaffiliated issuers, at value* | $ | 1,902,701,035 | $ | 793,492,677 | $ | 411,082,909 | $ | 309,639,409 | ||||||||
| Cash | — | 16,949 | — | 8,312 | ||||||||||||
| Cash denominated in foreign currencies‡ | — | — | 1,609,689 | 993,803 | ||||||||||||
| Deposits with brokers for futures contracts | 1,755,234 | 633,844 | 396,326 | 194,440 | ||||||||||||
| Variation margin on futures contracts | — | 36,111 | — | — | ||||||||||||
| Receivables: | ||||||||||||||||
Securities sold | 123,225,380 | — | 114,266,618 | — | ||||||||||||
Foreign tax reclaims | — | — | 1,229,371 | — | ||||||||||||
Dividends | 1,337,225 | 432,503 | 1,517,564 | 588,336 | ||||||||||||
Capital shares sold | 826,272 | 230,750 | 312,195 | 412,153 | ||||||||||||
| Prepaid expenses | 50,923 | 31,370 | 31,782 | 30,417 | ||||||||||||
| Total Assets | 2,029,896,069 | 794,874,204 | 530,446,454 | 311,866,870 | ||||||||||||
| LIABILITIES: | ||||||||||||||||
| Due to custodian | 73,946 | — | 3,279 | — | ||||||||||||
| Variation margin on futures contracts | 11,268 | — | 405,808 | 22,497 | ||||||||||||
| Payables: | ||||||||||||||||
Securities purchased | 47,411,990 | — | 63,137,706 | 9,558 | ||||||||||||
Collateral received on securities loaned | 11,270,160 | 48,526,097 | — | 2,489,424 | ||||||||||||
Accrued investment advisory fees | 533,697 | 313,055 | 152,497 | 104,450 | ||||||||||||
Accrued distribution fees—Class N | 14,650 | 1,629 | 1,420 | 1,077 | ||||||||||||
Capital shares redeemed | 1,153,461 | 372,039 | 154,219 | 84,603 | ||||||||||||
Line of credit (Note 12) | 24,000,000 | — | 47,000,000 | — | ||||||||||||
| Other accrued expenses and liabilities | 452,296 | 230,908 | 184,572 | 538,005 | ||||||||||||
| Total Liabilities | 84,921,468 | 49,443,728 | 111,039,501 | 3,249,614 | ||||||||||||
| Net Assets | $ | 1,944,974,601 | $ | 745,430,476 | $ | 419,406,953 | $ | 308,617,256 | ||||||||
| NET ASSETS CONSIST OF: | ||||||||||||||||
| Paid-in capital ($0.001 par value common stock, unlimited authorized shares) | $ | 1,409,604,374 | $ | 542,733,261 | $ | 386,260,430 | $ | 287,258,862 | ||||||||
| Total distributable earnings (loss) | 535,370,227 | 202,697,215 | 33,146,523 | 21,358,394 | ||||||||||||
| Net Assets | $ | 1,944,974,601 | $ | 745,430,476 | $ | 419,406,953 | $ | 308,617,256 | ||||||||
| NET ASSETS: | ||||||||||||||||
| Class I | $ | 507,108,323 | $ | 61,690,253 | $ | 82,660,697 | $ | 34,903,061 | ||||||||
| Class N | 71,104,038 | 7,795,354 | 6,891,830 | 5,311,303 | ||||||||||||
| Class R6 | 1,366,762,240 | 675,944,869 | 329,854,426 | 268,402,892 | ||||||||||||
| SHARES OUTSTANDING: | ||||||||||||||||
| Class I | 26,927,588 | 3,884,358 | 7,029,983 | 3,431,269 | ||||||||||||
| Class N | 3,794,725 | 492,827 | 587,720 | 522,910 | ||||||||||||
| Class R6 | 72,590,387 | 42,484,766 | 28,081,392 | 26,340,267 | ||||||||||||
| NET ASSET VALUE: | ||||||||||||||||
| Class I | $ | 18.83 | $ | 15.88 | $ | 11.76 | $ | 10.17 | ||||||||
| Class N | $ | 18.74 | $ | 15.82 | $ | 11.73 | $ | 10.16 | ||||||||
| Class R6 | $ | 18.83 | $ | 15.91 | $ | 11.75 | $ | 10.19 | ||||||||
* Includes market value of securities out on loan | $ | 11,002,002 | $ | 46,920,908 | $ | — | $ | 3,115,254 | ||||||||
‡ Cash denominated in foreign currencies at cost | $ | — | $ | — | $ | 1,613,213 | $ | 987,760 | ||||||||
| The accompanying notes are an integral part of these financial statements. |
| AQR Funds | Annual Report | September 2018 | ||||||||||||||
213
Table of Contents
| Statements of Assets and Liabilities | September 30, 2018 |
| AQR TM LARGE CAP MULTI-STYLE FUND | AQR TM SMALL CAP MULTI-STYLE FUND | AQR TM INTERNATIONAL MULTI-STYLE FUND | AQR TM EMERGING MULTI-STYLE FUND | |||||||||||||
| ASSETS: | ||||||||||||||||
| Investments in securities of unaffiliated issuers, at cost | $ | 233,132,744 | $ | 29,948,710 | $ | 161,486,214 | $ | 260,365,133 | ||||||||
| Investments in securities of unaffiliated issuers, at value* | $ | 303,684,112 | $ | 36,933,601 | $ | 189,616,274 | $ | 332,768,162 | ||||||||
| Cash | 8 | 734 | 2,965 | 8,889 | ||||||||||||
| Cash denominated in foreign currencies‡ | — | — | 675,109 | 1,408,267 | ||||||||||||
| Due from broker | 3,053 | — | — | — | ||||||||||||
| Deposits with brokers for futures contracts | 247,752 | 18,968 | 237,772 | 303,885 | ||||||||||||
| Variation margin on futures contracts | 63,157 | 1,664 | — | — | ||||||||||||
| Receivables: | ||||||||||||||||
Securities sold | 9,549,092 | — | 177,688 | — | ||||||||||||
Foreign tax reclaims | — | — | 529,912 | — | ||||||||||||
Dividends | 207,702 | 20,885 | 602,644 | 652,360 | ||||||||||||
Capital shares sold | 98,607 | 22,611 | 276,744 | 29,834 | ||||||||||||
| Prepaid expenses | 21,538 | 16,419 | 19,056 | 18,701 | ||||||||||||
| Total Assets | 313,875,021 | 37,014,882 | 192,138,164 | 335,190,098 | ||||||||||||
| LIABILITIES: | ||||||||||||||||
| Variation margin on futures contracts | — | — | 41,911 | 36,351 | ||||||||||||
| Payables: | ||||||||||||||||
Securities purchased | 10,909,089 | — | 176,889 | 7,831 | ||||||||||||
Collateral received on securities loaned | 1,618,753 | 2,102,658 | 52,330 | 2,394,189 | ||||||||||||
Accrued investment advisory fees | 65,420 | 2,393 | 55,901 | 113,310 | ||||||||||||
Accrued distribution fees—Class N | 467 | 1,360 | 316 | 340 | ||||||||||||
Capital shares redeemed | 91,458 | 1,723 | 29,778 | 14,877 | ||||||||||||
| Other accrued expenses and liabilities | 110,030 | 72,087 | 109,389 | 612,294 | ||||||||||||
| Total Liabilities | 12,795,217 | 2,180,221 | 466,514 | 3,179,192 | ||||||||||||
| Net Assets | $ | 301,079,804 | $ | 34,834,661 | $ | 191,671,650 | $ | 332,010,906 | ||||||||
| NET ASSETS CONSIST OF: | ||||||||||||||||
| Paid-in capital ($0.001 par value common stock, unlimited authorized shares) | $ | 227,935,306 | $ | 26,762,587 | $ | 166,308,877 | $ | 265,624,963 | ||||||||
| Total distributable earnings (loss) | 73,144,498 | 8,072,074 | 25,362,773 | 66,385,943 | ||||||||||||
| Net Assets | $ | 301,079,804 | $ | 34,834,661 | $ | 191,671,650 | $ | 332,010,906 | ||||||||
| NET ASSETS: | ||||||||||||||||
| Class I | $ | 87,555,999 | $ | 25,754,716 | $ | 28,703,272 | $ | 17,266,544 | ||||||||
| Class N | 2,295,000 | 6,512,369 | 1,546,147 | 1,674,714 | ||||||||||||
| Class R6 | 211,228,805 | 2,567,576 | 161,422,231 | 313,069,648 | ||||||||||||
| SHARES OUTSTANDING: | ||||||||||||||||
| Class I | 6,377,943 | 1,995,387 | 2,596,584 | 1,632,300 | ||||||||||||
| Class N | 167,713 | 506,568 | 140,413 | 158,387 | ||||||||||||
| Class R6 | 15,366,286 | 198,460 | 14,573,362 | 29,565,703 | ||||||||||||
| NET ASSET VALUE: | ||||||||||||||||
| Class I | $ | 13.73 | $ | 12.91 | $ | 11.05 | $ | 10.58 | ||||||||
| Class N | $ | 13.68 | $ | 12.86 | $ | 11.01 | $ | 10.57 | ||||||||
| Class R6 | $ | 13.75 | $ | 12.94 | $ | 11.08 | $ | 10.59 | ||||||||
* Includes market value of securities out on loan | $ | 2,729,408 | $ | 2,030,699 | $ | 50,138 | $ | 2,998,511 | ||||||||
‡ Cash denominated in foreign currencies at cost | $ | — | $ | — | $ | 676,311 | $ | 1,402,274 | ||||||||
| The accompanying notes are an integral part of these financial statements. |
| AQR Funds | Annual Report | September 2018 | ||||||||||||||
214
Table of Contents
| Statements of Assets and Liabilities | September 30, 2018 |
| AQR LARGE CAP MOMENTUM STYLE FUND | AQR SMALL CAP MOMENTUM STYLE FUND | AQR INTERNATIONAL MOMENTUM STYLE FUND | AQR EMERGING MOMENTUM STYLE FUND | |||||||||||||
| ASSETS: | ||||||||||||||||
| Investments in securities of unaffiliated issuers, at cost | $ | 849,233,088 | $ | 301,214,150 | $ | 391,272,698 | $ | 10,489,524 | ||||||||
| Investments in securities of unaffiliated issuers, at value* | $ | 1,184,442,197 | $ | 393,931,430 | $ | 451,198,844 | $ | 12,469,015 | ||||||||
| Cash | — | 1,195 | 36,094 | 1,433 | ||||||||||||
| Cash denominated in foreign currencies‡ | 406 | — | 1,479,328 | 31,722 | ||||||||||||
| Deposits with brokers for futures contracts | 956,761 | 19,150 | 603,986 | — | ||||||||||||
| Variation margin on futures contracts | — | 1,233 | — | — | ||||||||||||
| Receivables: | ||||||||||||||||
Securities sold | — | — | 431,043 | 9,321 | ||||||||||||
Foreign tax reclaims | — | — | 1,002,326 | — | ||||||||||||
Dividends | 458,056 | 163,058 | 1,260,862 | 25,668 | ||||||||||||
Capital shares sold | 956,248 | 121,912 | 433,961 | 24,051 | ||||||||||||
Due from Investment Adviser | — | — | — | 4,519 | ||||||||||||
| Prepaid expenses | 41,027 | 30,166 | 32,398 | 25,581 | ||||||||||||
| Total Assets | 1,186,854,695 | 394,268,144 | 456,478,842 | 12,591,310 | ||||||||||||
| LIABILITIES: | ||||||||||||||||
| Variation margin on futures contracts | 6,236 | — | 107,879 | — | ||||||||||||
| Payables: | ||||||||||||||||
Securities purchased | — | — | 429,570 | 9,472 | ||||||||||||
Collateral received on securities loaned | 14,715,208 | 22,908,891 | 2,426,324 | 81,466 | ||||||||||||
Accrued investment advisory fees | 251,129 | 141,689 | 128,303 | — | ||||||||||||
Accrued distribution fees—Class N | 15,827 | 582 | 8,185 | 233 | ||||||||||||
Capital shares redeemed | 5,656,727 | 367,034 | 84,474 | 4,174 | ||||||||||||
| Other accrued expenses and liabilities | 399,914 | 187,901 | 220,930 | 102,648 | ||||||||||||
| Total Liabilities | 21,045,041 | 23,606,097 | 3,405,665 | 197,993 | ||||||||||||
| Net Assets | $ | 1,165,809,654 | $ | 370,662,047 | $ | 453,073,177 | $ | 12,393,317 | ||||||||
| NET ASSETS CONSIST OF: | ||||||||||||||||
| Paid-in capital ($0.001 par value common stock, unlimited authorized shares) | $ | 747,054,928 | $ | 223,638,677 | $ | 397,491,307 | $ | 11,397,302 | ||||||||
| Total distributable earnings (loss) | 418,754,726 | 147,023,370 | 55,581,870 | 996,015 | ||||||||||||
| Net Assets | $ | 1,165,809,654 | $ | 370,662,047 | $ | 453,073,177 | $ | 12,393,317 | ||||||||
| NET ASSETS: | ||||||||||||||||
| Class I | $ | 986,457,883 | $ | 346,665,402 | $ | 348,643,668 | $ | 8,935,163 | ||||||||
| Class N | 77,380,907 | 2,834,704 | 40,451,768 | 1,147,588 | ||||||||||||
| Class R6 | 101,970,864 | 21,161,941 | 63,977,741 | 2,310,566 | ||||||||||||
| SHARES OUTSTANDING: | ||||||||||||||||
| Class I | 39,475,038 | 12,775,107 | 22,041,901 | 862,744 | ||||||||||||
| Class N | 3,100,311 | 104,431 | 2,564,776 | 110,889 | ||||||||||||
| Class R6 | 4,088,262 | 780,973 | 4,048,617 | 222,785 | ||||||||||||
| NET ASSET VALUE: | ||||||||||||||||
| Class I | $ | 24.99 | $ | 27.14 | $ | 15.82 | $ | 10.36 | ||||||||
| Class N | $ | 24.96 | $ | 27.14 | $ | 15.77 | $ | 10.35 | ||||||||
| Class R6 | $ | 24.94 | $ | 27.10 | $ | 15.80 | $ | 10.37 | ||||||||
* Includes market value of securities out on loan | $ | 31,122,264 | $ | 22,135,678 | $ | 2,424,445 | $ | 88,670 | ||||||||
‡ Cash denominated in foreign currencies at cost | $ | 425 | $ | — | $ | 1,483,195 | $ | 31,560 | ||||||||
| The accompanying notes are an integral part of these financial statements. |
| AQR Funds | Annual Report | September 2018 | ||||||||||||||
215
Table of Contents
| Statements of Assets and Liabilities | September 30, 2018 |
| AQR TM LARGE CAP MOMENTUM STYLE FUND | AQR TM SMALL CAP MOMENTUM STYLE FUND | AQR TM INTERNATIONAL MOMENTUM STYLE FUND | AQR LARGE CAP DEFENSIVE STYLE FUND | |||||||||||||
| ASSETS: | ||||||||||||||||
| Investments in securities of unaffiliated issuers, at cost | $ | 145,891,335 | $ | 60,408,522 | $ | 112,836,740 | $ | 1,678,161,991 | ||||||||
| Investments in securities of unaffiliated issuers, at value* | $ | 230,901,202 | $ | 77,464,362 | $ | 129,888,022 | $ | 2,122,122,000 | ||||||||
| Cash | — | — | 10,823 | — | ||||||||||||
| Cash denominated in foreign currencies‡ | — | — | 401,157 | — | ||||||||||||
| Deposits with brokers for futures contracts | 197,501 | 53,262 | 173,322 | 2,580,017 | ||||||||||||
| Variation margin on futures contracts | — | 3,453 | — | — | ||||||||||||
| Receivables: | ||||||||||||||||
Securities sold | — | — | 88,229 | — | ||||||||||||
Foreign tax reclaims | — | — | 284,116 | — | ||||||||||||
Dividends | 112,527 | 27,674 | 319,792 | 1,783,702 | ||||||||||||
Capital shares sold | 5,066 | 1,132 | 23,446 | 3,678,035 | ||||||||||||
| Prepaid expenses | 21,397 | 20,865 | 22,175 | 61,473 | ||||||||||||
| Total Assets | 231,237,693 | 77,570,748 | 131,211,082 | 2,130,225,227 | ||||||||||||
| LIABILITIES: | ||||||||||||||||
| Variation margin on futures contracts | 1,148 | — | 30,894 | 682,632 | ||||||||||||
| Payables: | ||||||||||||||||
Securities purchased | — | — | 87,849 | — | ||||||||||||
Collateral received on securities loaned | 2,617,030 | 8,721,842 | 1,478,496 | 6,537,627 | ||||||||||||
Accrued investment advisory fees | 39,910 | 15,317 | 19,789 | 409,108 | ||||||||||||
Accrued distribution fees—Class N | 2,760 | 1,184 | 1,582 | 60,221 | ||||||||||||
Capital shares redeemed | 60,100 | 8,386 | 368,151 | 1,031,048 | ||||||||||||
| Other accrued expenses and liabilities | 105,183 | 75,590 | 104,854 | 589,236 | ||||||||||||
| Total Liabilities | 2,826,131 | 8,822,319 | 2,091,615 | 9,309,872 | ||||||||||||
| Net Assets | $ | 228,411,562 | $ | 68,748,429 | $ | 129,119,467 | $ | 2,120,915,355 | ||||||||
| NET ASSETS CONSIST OF: | ||||||||||||||||
| Paid-in capital ($0.001 par value common stock, unlimited authorized shares) | $ | 143,358,463 | $ | 47,438,780 | $ | 122,814,861 | $ | 1,650,414,274 | ||||||||
| Total distributable earnings (loss) | 85,053,099 | 21,309,649 | 6,304,606 | 470,501,081 | ||||||||||||
| Net Assets | $ | 228,411,562 | $ | 68,748,429 | $ | 129,119,467 | $ | 2,120,915,355 | ||||||||
| NET ASSETS: | ||||||||||||||||
| Class I | $ | 112,850,666 | $ | 62,799,896 | $ | 58,512,210 | $ | 1,502,430,635 | ||||||||
| Class N | 13,547,881 | 5,720,340 | 7,817,498 | 309,273,945 | ||||||||||||
| Class R6 | 102,013,015 | 228,193 | 62,789,759 | 309,210,775 | ||||||||||||
| SHARES OUTSTANDING: | ||||||||||||||||
| Class I | 4,686,066 | 2,783,889 | 4,221,232 | 70,944,959 | ||||||||||||
| Class N | 566,003 | 255,490 | 567,899 | 14,651,012 | ||||||||||||
| Class R6 | 4,240,403 | 10,115 | 4,539,868 | 14,618,977 | ||||||||||||
| NET ASSET VALUE: | ||||||||||||||||
| Class I | $ | 24.08 | $ | 22.56 | $ | 13.86 | $ | 21.18 | ||||||||
| Class N | $ | 23.94 | $ | 22.39 | $ | 13.77 | $ | 21.11 | ||||||||
| Class R6 | $ | 24.06 | $ | 22.56 | $ | 13.83 | $ | 21.15 | ||||||||
* Includes market value of securities out on loan | $ | 5,184,280 | $ | 8,434,961 | $ | 1,405,879 | $ | 22,109,794 | ||||||||
‡ Cash denominated in foreign currencies at cost | $ | — | $ | — | $ | 401,085 | $ | — | ||||||||
| The accompanying notes are an integral part of these financial statements. |
| AQR Funds | Annual Report | September 2018 | ||||||||||||||
216
Table of Contents
| Statements of Assets and Liabilities | September 30, 2018 |
| AQR INTERNATIONAL DEFENSIVE STYLE FUND | AQR EMERGING DEFENSIVE STYLE FUND | AQR GLOBAL EQUITY FUND | AQR INTERNATIONAL EQUITY FUND | |||||||||||||
| ASSETS: | ||||||||||||||||
| Investments in securities of unaffiliated issuers, at cost | $ | 187,298,097 | $ | 79,167,762 | $ | 324,238,390 | $ | 408,076,410 | ||||||||
| Investments in securities of unaffiliated issuers, at value | $ | 208,765,326 | $ | 87,043,767 | $ | 366,936,971 | $ | 437,433,906 | ||||||||
| Cash | 8,255 | 20,631 | 278,186 | 421,342 | ||||||||||||
| Cash denominated in foreign currencies‡ | 709,334 | 273,713 | 1,474,101 | 1,554,145 | ||||||||||||
| Unrealized appreciation on forward foreign currency exchange contracts | — | — | 1,967,768 | 1,758,065 | ||||||||||||
| Unrealized appreciation on OTC swaps | — | — | 1,294,075 | 861,853 | ||||||||||||
| Due from broker | — | — | — | 23,535 | ||||||||||||
| Deposits with brokers for futures contracts | 396,410 | 195,056 | 4,297,047 | 6,810,823 | ||||||||||||
| Variation margin on futures contracts | — | — | 40,409 | 662,493 | ||||||||||||
| Receivables: | ||||||||||||||||
Securities sold | 113,412 | — | 576,305 | 641,988 | ||||||||||||
Foreign tax reclaims | 325,140 | 5,257 | 457,020 | 1,931,886 | ||||||||||||
Dividends | 792,188 | 113,042 | 492,005 | 1,182,617 | ||||||||||||
Capital shares sold | 210,167 | 457,851 | 307,736 | 300,049 | ||||||||||||
Due from custodian | — | — | — | 522,194 | ||||||||||||
| Prepaid expenses | 28,787 | 23,836 | 20,703 | 38,264 | ||||||||||||
| Total Assets | 211,349,019 | 88,133,153 | 378,142,326 | 454,143,160 | ||||||||||||
| LIABILITIES: | ||||||||||||||||
| Due to broker | — | — | 65,321 | 20,810 | ||||||||||||
| Unrealized depreciation on forward foreign currency exchange contracts | — | — | 2,413,125 | 2,039,425 | ||||||||||||
| Unrealized depreciation on OTC swaps | — | — | 196,937 | 696,937 | ||||||||||||
| Variation margin on futures contracts | 70,240 | 23,202 | — | — | ||||||||||||
| Payables: | ||||||||||||||||
Securities purchased | 113,560 | 2,091 | 575,062 | 1,162,393 | ||||||||||||
Collateral received on securities loaned | 3,863,336 | 1,225,254 | — | 261,851 | ||||||||||||
Accrued investment advisory fees | 53,391 | 14,884 | 172,234 | 214,205 | ||||||||||||
Accrued distribution fees—Class N | 857 | 2,009 | 414 | 2,528 | ||||||||||||
Capital shares redeemed | 177,458 | 24,785 | 4,800 | 97,890 | ||||||||||||
| Other accrued expenses and liabilities | 131,592 | 174,782 | 214,977 | 306,282 | ||||||||||||
| Total Liabilities | 4,410,434 | 1,467,007 | 3,642,870 | 4,802,321 | ||||||||||||
| Net Assets | $ | 206,938,585 | $ | 86,666,146 | $ | 374,499,456 | $ | 449,340,839 | ||||||||
| NET ASSETS CONSIST OF: | ||||||||||||||||
| Paid-in capital ($0.001 par value common stock, unlimited authorized shares) | $ | 181,876,321 | $ | 89,104,118 | $ | 327,939,796 | $ | 416,522,850 | ||||||||
| Total distributable earnings (loss) | 25,062,264 | (2,437,972 | ) | 46,559,660 | 32,817,989 | |||||||||||
| Net Assets | $ | 206,938,585 | $ | 86,666,146 | $ | 374,499,456 | $ | 449,340,839 | ||||||||
| NET ASSETS: | ||||||||||||||||
| Class I | $ | 173,931,950 | $ | 76,490,984 | $ | 198,953,621 | $ | 391,508,688 | ||||||||
| Class N | 4,265,619 | 9,977,482 | 2,120,536 | 13,090,228 | ||||||||||||
| Class R6 | 28,741,016 | 197,680 | 173,425,299 | 44,741,923 | ||||||||||||
| SHARES OUTSTANDING: | ||||||||||||||||
| Class I | 12,996,510 | 7,937,988 | 21,833,772 | 37,314,673 | ||||||||||||
| Class N | 311,098 | 1,011,849 | 234,167 | 1,219,218 | ||||||||||||
| Class R6 | 2,148,850 | 20,571 | 18,868,677 | 3,993,723 | ||||||||||||
| NET ASSET VALUE: | ||||||||||||||||
| Class I | $ | 13.38 | $ | 9.64 | $ | 9.11 | $ | 10.49 | ||||||||
| Class N | $ | 13.71 | $ | 9.86 | $ | 9.06 | $ | 10.74 | ||||||||
| Class R6 | $ | 13.38 | $ | 9.61 | $ | 9.19 | $ | 11.20 | ||||||||
* Includes market value of securities out on loan | $ | 3,590,896 | $ | 1,376,799 | $ | — | $ | 114,361 | ||||||||
‡ Cash denominated in foreign currencies at cost | $ | 709,481 | $ | 271,939 | $ | 1,478,929 | $ | 1,554,598 | ||||||||
| The accompanying notes are an integral part of these financial statements. |
| AQR Funds | Annual Report | September 2018 | ||||||||||||||
217
Table of Contents
| Statements of Assets and Liabilities | September 30, 2018 |
| AQR LARGE CAP RELAXED CONSTRAINT EQUITY FUND | AQR SMALL CAP RELAXED CONSTRAINT EQUITY FUND | AQR INTERNATIONAL RELAXED CONSTRAINT EQUITY FUND | AQR EMERGING RELAXED CONSTRAINT EQUITY FUND | |||||||||||||
| ASSETS: | ||||||||||||||||
| Investments in securities of unaffiliated issuers, at cost | $ | 21,251,477 | $ | 3,726,098 | $ | 92,101,959 | $ | 37,308,656 | ||||||||
| Investments in securities of unaffiliated issuers, at value | $ | 24,894,694 | $ | 4,344,858 | $ | 90,235,741 | $ | 36,584,133 | ||||||||
| Cash | 250,494 | 37 | 90,059 | 600,423 | ||||||||||||
| Cash denominated in foreign currencies‡ | — | — | 368,405 | 111,821 | ||||||||||||
| Unrealized appreciation on OTC swaps | — | — | — | 950,905 | ||||||||||||
| Deposits with brokers for futures contracts | — | — | 75,024 | 54,426 | ||||||||||||
| Receivables: | ||||||||||||||||
Securities sold | — | — | 150,373 | 47,084 | ||||||||||||
Foreign tax reclaims | — | — | 72,055 | 618 | ||||||||||||
Dividends | 14,859 | 2,153 | 252,016 | 40,521 | ||||||||||||
Capital shares sold | — | — | 341,186 | 80,052 | ||||||||||||
Due from Investment Adviser | — | 4,621 | — | 4,131 | ||||||||||||
| Prepaid expenses | 11,844 | 11,761 | 12,892 | 12,669 | ||||||||||||
| Total Assets | 25,171,891 | 4,363,430 | 91,597,751 | 38,486,783 | ||||||||||||
| LIABILITIES: | ||||||||||||||||
| Securities sold short, at value (proceeds $5,517,155, $987,246, $21,356,798 and $—, respectively) | 5,654,211 | 1,007,032 | 20,640,421 | — | ||||||||||||
| Unrealized depreciation on OTC swaps | — | — | — | 952,230 | ||||||||||||
| Variation margin on futures contracts | — | — | 12,364 | 19,471 | ||||||||||||
| Payables: | ||||||||||||||||
Securities purchased | 297,880 | — | 149,699 | 47,839 | ||||||||||||
Accrued investment advisory fees | 5,549 | — | 29,181 | — | ||||||||||||
Accrued distribution fees—Class N | 158 | 121 | 2,723 | 2,103 | ||||||||||||
Capital shares redeemed | — | — | 51,088 | — | ||||||||||||
Dividends payable on securities sold short | 9,277 | 1,834 | 44,085 | — | ||||||||||||
| Other accrued expenses and liabilities | 60,646 | 58,088 | 87,151 | 95,970 | ||||||||||||
| Total Liabilities | 6,027,721 | 1,067,075 | 21,016,712 | 1,117,613 | ||||||||||||
| Net Assets | $ | 19,144,170 | $ | 3,296,355 | $ | 70,581,039 | $ | 37,369,170 | ||||||||
| NET ASSETS CONSIST OF: | ||||||||||||||||
| Paid-in capital ($0.001 par value common stock, unlimited authorized shares) | $ | 16,023,013 | $ | 3,080,692 | $ | 73,845,010 | $ | 41,110,704 | ||||||||
| Total distributable earnings (loss) | 3,121,157 | 215,663 | (3,263,971 | ) | (3,741,534 | ) | ||||||||||
| Net Assets | $ | 19,144,170 | $ | 3,296,355 | $ | 70,581,039 | $ | 37,369,170 | ||||||||
| NET ASSETS: | ||||||||||||||||
| Class I | $ | 16,556,243 | $ | 1,375,978 | $ | 55,144,439 | $ | 21,062,523 | ||||||||
| Class N | 772,969 | 583,806 | 13,443,631 | 10,383,427 | ||||||||||||
| Class R6 | 1,814,958 | 1,336,571 | 1,992,969 | 5,923,220 | ||||||||||||
| SHARES OUTSTANDING: | ||||||||||||||||
| Class I | 1,320,495 | 130,496 | 4,512,297 | 1,703,182 | ||||||||||||
| Class N | 61,640 | 55,474 | 1,104,502 | 841,893 | ||||||||||||
| Class R6 | 144,619 | 126,690 | 162,897 | 478,572 | ||||||||||||
| NET ASSET VALUE: | ||||||||||||||||
| Class I | $ | 12.54 | $ | 10.54 | $ | 12.22 | $ | 12.37 | ||||||||
| Class N | $ | 12.54 | $ | 10.52 | $ | 12.17 | $ | 12.33 | ||||||||
| Class R6 | $ | 12.55 | $ | 10.55 | $ | 12.23 | $ | 12.38 | ||||||||
‡ Cash denominated in foreign currencies at cost | $ | — | $ | — | $ | 368,793 | $ | 110,875 | ||||||||
| The accompanying notes are an integral part of these financial statements. |
| AQR Funds | Annual Report | September 2018 | ||||||||||||||
218
Table of Contents
| Statements of Operations | September 30, 2018 |
| AQR LARGE CAP MULTI-STYLE FUND | AQR SMALL CAP MULTI-STYLE FUND | AQR INTERNATIONAL MULTI-STYLE FUND | AQR EMERGING MULTI-STYLE FUND | |||||||||||||
| FOR THE YEAR ENDED SEPTEMBER 30, 2018 | FOR THE YEAR ENDED SEPTEMBER 30, 2018 | FOR THE YEAR ENDED SEPTEMBER 30, 2018 | FOR THE YEAR ENDED SEPTEMBER 30, 2018 | |||||||||||||
INVESTMENT INCOME: Dividend income: | ||||||||||||||||
Unaffiliated issuers† | $ | 33,841,170 | $ | 8,520,014 | $ | 14,040,648 | $ | 8,437,687 | ||||||||
Securities lending income, net | 64,467 | 990,771 | 17,311 | 24,091 | ||||||||||||
| Total Income | 33,905,637 | 9,510,785 | 14,057,959 | 8,461,778 | ||||||||||||
| EXPENSES: | ||||||||||||||||
Investment advisory fees | 5,917,551 | 3,713,936 | 2,151,092 | 1,980,948 | ||||||||||||
Custody fees | 57,288 | 34,675 | 92,182 | 268,774 | ||||||||||||
Administration & accounting fees | 358,730 | 137,152 | 90,049 | 62,491 | ||||||||||||
Legal fees | 42,042 | 14,910 | 10,883 | 7,752 | ||||||||||||
Audit & tax fees | 57,919 | 56,462 | 47,026 | 56,934 | ||||||||||||
Shareholder reporting fees | 100,377 | 130,966 | 65,075 | 61,413 | ||||||||||||
Transfer agent fees | 506,371 | 81,692 | 109,638 | 87,302 | ||||||||||||
Trustee fees | 60,698 | 23,557 | 15,603 | 11,069 | ||||||||||||
Distribution fees—Class N | 176,423 | 19,134 | 19,385 | 16,660 | ||||||||||||
Interest expense | 2,596 | 6,501 | — | — | ||||||||||||
Recoupment of waiver | 176,087 | 2,679 | — | — | ||||||||||||
Registration fees | 87,953 | 56,382 | 55,955 | 49,522 | ||||||||||||
Pricing fee | 7 | 1,326 | 22,556 | 22,594 | ||||||||||||
Other expenses | 57,646 | 23,006 | 14,303 | 10,779 | ||||||||||||
| Total Expenses | 7,601,688 | 4,302,378 | 2,693,747 | 2,636,238 | ||||||||||||
Less fee waivers and/or reimbursements | — | (114,621 | ) | (187,593 | ) | (401,363 | ) | |||||||||
| Net Expenses | 7,601,688 | 4,187,757 | 2,506,154 | 2,234,875 | ||||||||||||
| Net Investment Income (Loss) | 26,303,949 | 5,323,028 | 11,551,805 | 6,226,903 | ||||||||||||
| REALIZED GAIN (LOSS) AND CHANGE IN UNREALIZED APPRECIATION (DEPRECIATION): | ||||||||||||||||
| Net realized gain (loss) from: | ||||||||||||||||
Transactions in investment securities of unaffiliated issuers | 111,738,641 | 70,753,702 | 17,350,239 | 8,789,969 | ||||||||||||
Settlement of foreign currency and foreign currency transactions | — | — | (79,444 | ) | (155,922 | ) | ||||||||||
Expiration or closing of futures contracts | 4,218,931 | 2,608,205 | 471,709 | (23,963 | ) | |||||||||||
| Net realized gain (loss) | 115,957,572 | 73,361,907 | 17,742,504 | 8,610,084 | ||||||||||||
| Net change in unrealized appreciation (depreciation) on: | ||||||||||||||||
Investment securities of unaffiliated issuers (net of increase in deferred capital gain country tax accruals of $—, $—, $— and $294,104) | 114,779,415 | (11,741,248 | ) | (24,497,629 | ) | (24,961,709 | ) | |||||||||
Foreign currency and foreign currency transactions | — | — | 30,057 | 11,220 | ||||||||||||
Futures contracts | (589,811 | ) | (870,445 | ) | (52,195 | ) | 83,728 | |||||||||
| Net change in unrealized appreciation (depreciation) | 114,189,604 | (12,611,693 | ) | (24,519,767 | ) | (24,866,761 | ) | |||||||||
| Net realized gain (loss) and net change in unrealized appreciation (depreciation) | 230,147,176 | 60,750,214 | (6,777,263 | ) | (16,256,677 | ) | ||||||||||
| Net increase (decrease) in net assets resulting from operations | $256,451,125 | $66,073,242 | $4,774,542 | $(10,029,774 | ) | |||||||||||
† Net of foreign taxes withheld of | $474 | $— | $1,446,664 | $793,834 | ||||||||||||
| The accompanying notes are an integral part of these financial statements. |
| AQR Funds | Annual Report | September 2018 | ||||||||||||||
219
Table of Contents
| Statements of Operations | September 30, 2018 |
| AQR TM LARGE CAP MULTI-STYLE FUND | AQR TM SMALL CAP MULTI-STYLE FUND | AQR TM INTERNATIONAL MULTI-STYLE FUND | AQR TM EMERGING MULTI-STYLE FUND | |||||||||||||
| FOR THE YEAR ENDED SEPTEMBER 30, 2018 | FOR THE YEAR ENDED SEPTEMBER 30, 2018 | FOR THE YEAR ENDED SEPTEMBER 30, 2018 | FOR THE YEAR ENDED SEPTEMBER 30, 2018 | |||||||||||||
| INVESTMENT INCOME: | ||||||||||||||||
| Dividend income: | ||||||||||||||||
Unaffiliated issuers† | $ | 4,709,068 | $ | 360,292 | $ | 5,347,370 | $ | 9,732,583 | ||||||||
Securities lending income, net | 4,956 | 34,887 | 385 | 31,107 | ||||||||||||
| Total Income | 4,714,024 | 395,179 | 5,347,755 | 9,763,690 | ||||||||||||
| EXPENSES: | ||||||||||||||||
Investment advisory fees | 802,742 | 163,736 | 847,279 | 2,152,033 | ||||||||||||
Custody fees | 16,161 | 18,832 | 50,611 | 301,229 | ||||||||||||
Administration & accounting fees | 46,030 | 5,789 | 34,858 | 67,867 | ||||||||||||
Legal fees | 6,164 | 921 | 4,473 | 8,572 | ||||||||||||
Audit & tax fees | 44,954 | 49,076 | 46,333 | 55,197 | ||||||||||||
Shareholder reporting fees | 20,751 | 3,894 | 21,461 | 23,952 | ||||||||||||
Transfer agent fees | 95,468 | 47,249 | 45,542 | 36,767 | ||||||||||||
Trustee fees | 9,055 | 1,987 | 6,738 | 11,911 | ||||||||||||
Distribution fees—Class N | 5,976 | 15,606 | 5,283 | 5,669 | ||||||||||||
Interest expense | — | 105 | — | — | ||||||||||||
Registration fees | 59,332 | 50,757 | 51,259 | 52,274 | ||||||||||||
Pricing fee | 7 | 70 | 21,531 | 21,600 | ||||||||||||
Other expenses | 8,236 | 2,678 | 6,377 | 11,515 | ||||||||||||
| Total Expenses | 1,114,876 | 360,700 | 1,141,745 | 2,748,586 | ||||||||||||
Less fee waivers and/or reimbursements | (89,070 | ) | (133,943 | ) | (163,415 | ) | (385,696 | ) | ||||||||
| Net Expenses | 1,025,806 | 226,757 | 978,330 | 2,362,890 | ||||||||||||
| Net Investment Income (Loss) | 3,688,218 | 168,422 | 4,369,425 | 7,400,800 | ||||||||||||
| REALIZED GAIN (LOSS) AND CHANGE IN UNREALIZED APPRECIATION (DEPRECIATION): | ||||||||||||||||
| Net realized gain (loss) from: | ||||||||||||||||
Transactions in investment securities of unaffiliated issuers | 2,024,985 | 1,185,400 | 1,562,283 | 873,388 | ||||||||||||
Settlement of foreign currency and foreign currency transactions | — | — | (25,835 | ) | (169,463 | ) | ||||||||||
Expiration or closing of futures contracts | 680,338 | 29,734 | (461 | ) | (186,085 | ) | ||||||||||
| Net realized gain (loss) | 2,705,323 | 1,215,134 | 1,535,987 | 517,840 | ||||||||||||
| Net change in unrealized appreciation (depreciation) on: | ||||||||||||||||
Investment securities of unaffiliated issuers (net of increase in deferred capital gain country tax accruals of $—, $—, $— and $360,398) | 29,860,727 | 1,835,420 | (3,302,914 | ) | (18,597,422 | ) | ||||||||||
Foreign currency and foreign currency transactions | — | — | (13,027 | ) | 15,646 | |||||||||||
Futures contracts | 24,624 | (4,102 | ) | 4,940 | 178,928 | |||||||||||
| Net change in unrealized appreciation (depreciation) | 29,885,351 | 1,831,318 | (3,311,001 | ) | (18,402,848 | ) | ||||||||||
| Net realized gain (loss) and net change in unrealized appreciation (depreciation) | 32,590,674 | 3,046,452 | (1,775,014 | ) | (17,885,008 | ) | ||||||||||
| Net increase (decrease) in net assets resulting from operations | $36,278,892 | $3,214,874 | $2,594,411 | $(10,484,208 | ) | |||||||||||
† Net of foreign taxes withheld of | $121 | $7 | $532,369 | $931,153 | ||||||||||||
| The accompanying notes are an integral part of these financial statements. |
| AQR Funds | Annual Report | September 2018 | ||||||||||||||
220
Table of Contents
| Statements of Operations | September 30, 2018 |
| AQR LARGE CAP MOMENTUM STYLE FUND | AQR SMALL CAP MOMENTUM STYLE FUND | AQR INTERNATIONAL MOMENTUM STYLE FUND | AQR EMERGING MOMENTUM STYLE FUND | |||||||||||||
| FOR THE YEAR ENDED SEPTEMBER 30, 2018 | FOR THE YEAR ENDED SEPTEMBER 30, 2018 | FOR THE YEAR ENDED SEPTEMBER 30, 2018 | FOR THE YEAR ENDED SEPTEMBER 30, 2018 | |||||||||||||
| INVESTMENT INCOME: | ||||||||||||||||
| Dividend income: | ||||||||||||||||
Unaffiliated issuers† | $ | 13,150,625 | $ | 2,444,165 | $ | 10,315,376 | $ | 328,595 | ||||||||
Securities lending income, net | 125,222 | 665,935 | 32,732 | 1,431 | ||||||||||||
| Total Income | 13,275,847 | 3,110,100 | 10,348,108 | 330,026 | ||||||||||||
| EXPENSES: | ||||||||||||||||
Investment advisory fees | 2,684,496 | 1,717,051 | 1,724,451 | 73,371 | ||||||||||||
Custody fees | 43,323 | 35,193 | 99,891 | 54,006 | ||||||||||||
Administration & accounting fees | 198,605 | 70,964 | 79,991 | 2,535 | ||||||||||||
Legal fees | 21,358 | 7,789 | 9,409 | 3,088 | ||||||||||||
Audit & tax fees | 51,013 | 55,888 | 63,730 | 56,548 | ||||||||||||
Shareholder reporting fees | 71,399 | 29,054 | 44,796 | 2,942 | ||||||||||||
Transfer agent fees | 952,127 | 381,575 | 396,337 | 26,007 | ||||||||||||
Trustee fees | 33,404 | 12,478 | 14,124 | 1,406 | ||||||||||||
Distribution fees—Class N | 169,945 | 4,248 | 93,411 | 3,156 | ||||||||||||
Interest expense | — | — | — | 361 | ||||||||||||
Recoupment of waiver | 29,155 | 1,540 | — | — | ||||||||||||
Registration fees | 64,190 | 50,820 | 57,057 | 45,110 | ||||||||||||
Pricing fee | 16 | 287 | 22,675 | 22,785 | ||||||||||||
Other expenses | 31,564 | 11,542 | 12,692 | 2,291 | ||||||||||||
| Total Expenses | 4,350,595 | 2,378,429 | 2,618,564 | 293,606 | ||||||||||||
Less fee waivers and/or reimbursements | (7,872 | ) | (95,456 | ) | (198,531 | ) | (200,851 | ) | ||||||||
| Net Expenses | 4,342,723 | 2,282,973 | 2,420,033 | 92,755 | ||||||||||||
| Net Investment Income (Loss) | 8,933,124 | 827,127 | 7,928,075 | 237,271 | ||||||||||||
| REALIZED GAIN (LOSS) AND CHANGE IN UNREALIZED APPRECIATION (DEPRECIATION): | ||||||||||||||||
| Net realized gain (loss) from: | ||||||||||||||||
Transactions in investment securities of unaffiliated issuers | 88,359,582 | 59,688,954 | 16,785,185 | 1,242,008 | ||||||||||||
Settlement of foreign currency and foreign currency transactions | — | — | 38,977 | 1,792 | ||||||||||||
Expiration or closing of futures contracts | 3,319,796 | 1,023,109 | 69,260 | — | ||||||||||||
| Net realized gain (loss) | 91,679,378 | 60,712,063 | 16,893,422 | 1,243,800 | ||||||||||||
| Net change in unrealized appreciation (depreciation) on: | ||||||||||||||||
Investment securities of unaffiliated issuers (net of increase in deferred capital gain country tax accruals of $—, $—, $— and $2,226) | 129,662,009 | 8,737,537 | (7,568,969 | ) | (1,475,499 | ) | ||||||||||
Foreign currency and foreign currency transactions | (8 | ) | — | (22,400 | ) | (29 | ) | |||||||||
Futures contracts | (127,311 | ) | (190,261 | ) | 32,617 | — | ||||||||||
| Net change in unrealized appreciation (depreciation) | 129,534,690 | 8,547,276 | (7,558,752 | ) | (1,475,528 | ) | ||||||||||
| Net realized gain (loss) and net change in unrealized appreciation (depreciation) | 221,214,068 | 69,259,339 | 9,334,670 | (231,728 | ) | |||||||||||
| Net increase (decrease) in net assets resulting from operations | $230,147,192 | $70,086,466 | $17,262,745 | $5,543 | ||||||||||||
† Net of foreign taxes withheld of | $1,233 | $391 | $1,152,405 | $30,115 | ||||||||||||
| The accompanying notes are an integral part of these financial statements. |
| AQR Funds | Annual Report | September 2018 | ||||||||||||||
221
Table of Contents
| Statements of Operations | September 30, 2018 |
| AQR TM LARGE CAP MOMENTUM STYLE FUND | AQR TM SMALL CAP MOMENTUM STYLE FUND | AQR TM INTERNATIONAL MOMENTUM STYLE FUND | AQR LARGE CAP DEFENSIVE STYLE FUND | |||||||||||||
| FOR THE YEAR ENDED SEPTEMBER 30, 2018 | FOR THE YEAR ENDED SEPTEMBER 30, 2018 | FOR THE YEAR ENDED SEPTEMBER 30, 2018 | FOR THE YEAR ENDED SEPTEMBER 30, 2018 | |||||||||||||
| INVESTMENT INCOME: | ||||||||||||||||
| Dividend income: | ||||||||||||||||
Unaffiliated issuers† | $ | 2,508,104 | $ | 392,163 | $ | 2,904,786 | $ | 28,803,554 | ||||||||
Securities lending income, net | 14,574 | 103,080 | 20,723 | 38,785 | ||||||||||||
| Total Income | 2,522,678 | 495,243 | 2,925,509 | 28,842,339 | ||||||||||||
| EXPENSES: | ||||||||||||||||
Investment advisory fees | 516,166 | 272,874 | 480,886 | 3,771,414 | ||||||||||||
Custody fees | 21,200 | 21,396 | 53,490 | 43,549 | ||||||||||||
Administration & accounting fees | 37,431 | 10,554 | 21,714 | 257,489 | ||||||||||||
Legal fees | 4,746 | 1,307 | 2,501 | 31,879 | ||||||||||||
Audit & tax fees | 43,225 | 44,768 | 48,819 | 55,209 | ||||||||||||
Shareholder reporting fees | 10,353 | 6,655 | 8,865 | 109,810 | ||||||||||||
Transfer agent fees | 128,802 | 77,449 | 75,200 | 1,129,155 | ||||||||||||
Trustee fees | 7,213 | 2,808 | 4,647 | 45,771 | ||||||||||||
Distribution fees—Class N | 28,050 | 11,574 | 16,062 | 701,548 | ||||||||||||
Recoupment of waiver | — | — | — | 13,352 | ||||||||||||
Registration fees | 61,623 | 52,254 | 58,006 | 194,448 | ||||||||||||
Pricing fee | 11 | 69 | 22,624 | 8 | ||||||||||||
Other expenses | 6,742 | 3,355 | 4,628 | 40,864 | ||||||||||||
| Total Expenses | 865,562 | 505,063 | 797,442 | 6,394,496 | ||||||||||||
Less fee waivers and/or reimbursements | (102,301 | ) | (128,626 | ) | (180,018 | ) | (29,563 | ) | ||||||||
| Net Expenses | 763,261 | 376,437 | 617,424 | 6,364,933 | ||||||||||||
| Net Investment Income (Loss) | 1,759,417 | 118,806 | 2,308,085 | 22,477,406 | ||||||||||||
| REALIZED GAIN (LOSS) AND CHANGE IN UNREALIZED APPRECIATION (DEPRECIATION): | ||||||||||||||||
| Net realized gain (loss) from: | ||||||||||||||||
Transactions in investment securities of unaffiliated issuers | 980,442 | 4,126,999 | (253,000 | ) | 1,361,390 | |||||||||||
Settlement of foreign currency and foreign currency transactions | — | — | 1,208 | — | ||||||||||||
Expiration or closing of futures contracts | 764,572 | 141,208 | 205,715 | 10,201,063 | ||||||||||||
| Net realized gain (loss) | 1,745,014 | 4,268,207 | (46,077 | ) | 11,562,453 | |||||||||||
| Net change in unrealized appreciation (depreciation) on: | ||||||||||||||||
Investment securities of unaffiliated issuers | 41,806,755 | 6,097,898 | 771,020 | 228,130,472 | ||||||||||||
Foreign currency and foreign currency transactions | — | — | (5,822 | ) | — | |||||||||||
Futures contracts | (9,928 | ) | (12,493 | ) | 7,236 | (698,856 | ) | |||||||||
| Net change in unrealized appreciation (depreciation) | 41,796,827 | 6,085,405 | 772,434 | 227,431,616 | ||||||||||||
| Net realized gain (loss) and net change in unrealized appreciation (depreciation) | 43,541,841 | 10,353,612 | 726,357 | 238,994,069 | ||||||||||||
| Net increase (decrease) in net assets resulting from operations | $ | 45,301,258 | $ | 10,472,418 | $3,034,442 | $ | 261,471,475 | |||||||||
† Net of foreign taxes withheld of | $193 | $110 | $300,444 | $— | ||||||||||||
| The accompanying notes are an integral part of these financial statements. |
| AQR Funds | Annual Report | September 2018 | ||||||||||||||
222
Table of Contents
| Statements of Operations | September 30, 2018 |
| AQR INTERNATIONAL DEFENSIVE STYLE FUND | AQR EMERGING DEFENSIVE STYLE FUND | AQR GLOBAL EQUITY FUND | AQR INTERNATIONAL EQUITY FUND | |||||||||||||
| FOR THE YEAR ENDED SEPTEMBER 30, 2018 | FOR THE YEAR ENDED SEPTEMBER 30, 2018 | FOR THE YEAR ENDED SEPTEMBER 30, 2018 | FOR THE YEAR ENDED SEPTEMBER 30, 2018 | |||||||||||||
| INVESTMENT INCOME: | ||||||||||||||||
| Dividend income: | ||||||||||||||||
Unaffiliated issuers† | $ | 5,796,007 | $ | 2,080,042 | $ | 7,166,183 | $ | 12,475,325 | ||||||||
Securities lending income, net | 10,498 | 6,345 | 1,029 | 1,107 | ||||||||||||
| Total Income | 5,806,505 | 2,086,387 | 7,167,212 | 12,476,432 | ||||||||||||
| EXPENSES: | ||||||||||||||||
Investment advisory fees | 790,632 | 430,392 | 1,996,394 | 2,935,218 | ||||||||||||
Custody fees | 46,723 | 72,371 | 102,802 | 110,466 | ||||||||||||
Administration & accounting fees | 36,646 | 14,001 | 55,472 | 84,531 | ||||||||||||
Legal fees | 4,872 | 1,805 | 3,606 | 3,968 | ||||||||||||
Audit & tax fees | 44,926 | 56,010 | 78,530 | 128,089 | ||||||||||||
Shareholder reporting fees | 18,059 | 11,091 | 12,948 | 30,421 | ||||||||||||
Transfer agent fees | 191,367 | 94,344 | 171,457 | 384,648 | ||||||||||||
Trustee fees | 7,022 | 3,378 | 11,066 | 14,428 | ||||||||||||
Distribution fees—Class N | 44,460 | 17,346 | 5,255 | 41,532 | ||||||||||||
Recoupment of waiver | — | — | 8,810 | 12,409 | ||||||||||||
Registration fees | 51,821 | 49,650 | 76,993 | 73,991 | ||||||||||||
Pricing fee | 22,587 | 18,289 | 25,733 | 26,973 | ||||||||||||
Other expenses | 6,725 | 3,788 | 9,665 | 13,136 | ||||||||||||
| Total Expenses | 1,265,840 | 772,465 | 2,558,731 | 3,859,810 | ||||||||||||
Less fee waivers and/or reimbursements | (154,359 | ) | (207,124 | ) | (61,918 | ) | (86,583 | ) | ||||||||
| Net Expenses | 1,111,481 | 565,341 | 2,496,813 | 3,773,227 | ||||||||||||
| Net Investment Income (Loss) | 4,695,024 | 1,521,046 | 4,670,399 | 8,703,205 | ||||||||||||
| REALIZED GAIN (LOSS) AND CHANGE IN UNREALIZED APPRECIATION (DEPRECIATION): | ||||||||||||||||
| Net realized gain (loss) from: | ||||||||||||||||
Transactions in investment securities of unaffiliated issuers | 446,925 | (234,796 | ) | 2,121,464 | 5,957,038 | |||||||||||
Settlement of foreign currency and foreign currency transactions | (38,138 | ) | (28,888 | ) | (254,514 | ) | (402,112 | ) | ||||||||
Settlement of forward foreign currency contracts | — | — | 1,198,349 | (2,684,483 | ) | |||||||||||
Expiration or closing of futures contracts | (390,308 | ) | (179,149 | ) | (1,438,750 | ) | 2,375,390 | |||||||||
Expiration or closing of swap contracts | — | — | (1,810,064 | ) | (2,342,017 | ) | ||||||||||
| Net realized gain (loss) | 18,479 | (442,833 | ) | (183,515 | ) | 2,903,816 | ||||||||||
| Net change in unrealized appreciation (depreciation) on: | ||||||||||||||||
Investment securities of unaffiliated issuers (net of increase in deferred capital gain country tax accruals of $—, $54,241, $— and $—) | 1,422,049 | 1,018,628 | 11,366,877 | (25,004,563 | ) | |||||||||||
Foreign currency and foreign currency transactions | (6,027 | ) | 1,208 | (19,051 | ) | (54,078 | ) | |||||||||
Forward foreign currency exchange contracts | — | — | 886,830 | 3,513,165 | ||||||||||||
Futures contracts | 28,383 | 70,850 | 509,864 | 2,006,546 | ||||||||||||
Swap contracts | — | — | 1,246,089 | 540,913 | ||||||||||||
| Net change in unrealized appreciation (depreciation) | 1,444,405 | 1,090,686 | 13,990,609 | (18,998,017 | ) | |||||||||||
| Net realized gain (loss) and net change in unrealized appreciation (depreciation) | 1,462,884 | 647,853 | 13,807,094 | (16,094,201 | ) | |||||||||||
| Net increase (decrease) in net assets resulting from operations | $6,157,908 | $2,168,899 | $18,477,493 | $(7,390,996 | ) | |||||||||||
† Net of foreign taxes withheld of | $565,405 | $243,015 | $409,721 | $1,200,181 | ||||||||||||
| The accompanying notes are an integral part of these financial statements. |
| AQR Funds | Annual Report | September 2018 | ||||||||||||||
223
Table of Contents
| Statements of Operations | September 30, 2018 |
| AQR LARGE CAP RELAXED CONSTRAINT EQUITY FUND | AQR SMALL CAP RELAXED CONSTRAINT EQUITY FUND | AQR INTERNATIONAL RELAXED CONSTRAINT EQUITY FUND | AQR EMERGING RELAXED CONSTRAINT EQUITY FUND | |||||||||||||
| FOR THE YEAR ENDED SEPTEMBER 30, 2018 | FOR THE YEAR ENDED SEPTEMBER 30, 2018 | FOR THE YEAR ENDED SEPTEMBER 30, 2018 | FOR THE YEAR ENDED SEPTEMBER 30, 2018 | |||||||||||||
| INVESTMENT INCOME: | ||||||||||||||||
| Dividend income: | ||||||||||||||||
Unaffiliated issuers† | $ | 385,720 | $ | 38,564 | $ | 2,406,542 | $ | 899,946 | ||||||||
| Total Income | 385,720 | 38,564 | 2,406,542 | 899,946 | ||||||||||||
| EXPENSES: | ||||||||||||||||
Investment advisory fees | 104,815 | 27,263 | 419,233 | 399,436 | ||||||||||||
Custody fees | 456 | — | 1,893 | 63,696 | ||||||||||||
Administration & accounting fees | 2,815 | 591 | 8,913 | 6,793 | ||||||||||||
Legal fees | 2,024 | 1,458 | 3,159 | 2,249 | ||||||||||||
Audit & tax fees | 48,002 | 50,298 | 55,883 | 59,807 | ||||||||||||
Shareholder reporting fees | 2,306 | 815 | 4,763 | 4,778 | ||||||||||||
Transfer agent fees | 32,374 | 18,672 | 70,522 | 41,880 | ||||||||||||
Trustee fees | 1,522 | 1,102 | 2,722 | 2,272 | ||||||||||||
Offering costs | 5,813 | 4,359 | 4,337 | 4,552 | ||||||||||||
Distribution fees—Class N | 1,714 | 1,457 | 27,714 | 18,778 | ||||||||||||
Dividends and interest on securities sold short (Note 3) | 92,445 | 24,352 | 553,807 | — | ||||||||||||
Interest expense | 427 | — | 21 | — | ||||||||||||
Registration fees | 62,535 | 49,003 | 58,327 | 54,106 | ||||||||||||
Pricing fee | 118 | 417 | 1,027 | 1,031 | ||||||||||||
Other expenses | 2,396 | 1,944 | 3,178 | 2,968 | ||||||||||||
| Total Expenses | 359,762 | 181,731 | 1,215,499 | 662,346 | ||||||||||||
Less fee waivers and/or reimbursements | (127,212 | ) | (123,588 | ) | (104,883 | ) | (176,795 | ) | ||||||||
| Net Expenses | 232,550 | 58,143 | 1,110,616 | 485,551 | ||||||||||||
| Net Investment Income (Loss) | 153,170 | (19,579 | ) | 1,295,926 | 414,395 | |||||||||||
| REALIZED GAIN (LOSS) AND CHANGE IN UNREALIZED APPRECIATION (DEPRECIATION): | ||||||||||||||||
| Net realized gain (loss) from: | ||||||||||||||||
Transactions in investment securities of unaffiliated issuers | 413,025 | 49,220 | (2,860,422 | ) | (2,426,658 | ) | ||||||||||
Settlement of foreign currency and foreign currency transactions | — | — | (72,790 | ) | (68,820 | ) | ||||||||||
Expiration or closing of futures contracts | — | — | 42,551 | (425,140 | ) | |||||||||||
Closed short positions in securities | (861,939 | ) | (285,212 | ) | (471,196 | ) | — | |||||||||
Expiration or closing of swap contracts | — | — | — | (333,737 | ) | |||||||||||
| Net realized gain (loss) | (448,914 | ) | (235,992 | ) | (3,361,857 | ) | (3,254,355 | ) | ||||||||
| Net change in unrealized appreciation (depreciation) on: | ||||||||||||||||
Investment securities of unaffiliated | 2,288,723 | 320,766 | (3,395,430 | ) | (1,353,960 | ) | ||||||||||
Foreign currency and foreign currency transactions | — | — | (2,479 | ) | 1,918 | |||||||||||
Futures contracts | — | — | 15,643 | 14,479 | ||||||||||||
Short positions in securities | 19,118 | 33,976 | 858,547 | — | ||||||||||||
Swap contracts | — | — | — | (176,033 | ) | |||||||||||
| Net change in unrealized appreciation (depreciation) | 2,307,841 | 354,742 | (2,523,719 | ) | (1,513,596 | ) | ||||||||||
| Net realized gain (loss) and net change in unrealized appreciation (depreciation) | 1,858,927 | 118,750 | (5,885,576 | ) | (4,767,951 | ) | ||||||||||
| Net increase (decrease) in net assets resulting from operations | $2,012,097 | $99,171 | $(4,589,650 | ) | $(4,353,556 | ) | ||||||||||
† Net of foreign taxes withheld of | $185 | $9 | $251,582 | $94,922 | ||||||||||||
| The accompanying notes are an integral part of these financial statements. |
| AQR Funds | Annual Report | September 2018 | ||||||||||||||
224
Table of Contents
| Statements of Changes in Net Assets | September 30, 2018 |
| AQR LARGE CAP MULTI-STYLE FUND | AQR SMALL CAP MULTI-STYLE FUND | |||||||||||||||
| FOR THE YEAR ENDED SEPTEMBER 30, 2018 | FOR THE YEAR ENDED SEPTEMBER 30, 2017 | FOR THE YEAR ENDED SEPTEMBER 30, 2018 | FOR THE YEAR ENDED SEPTEMBER 30, 2017 | |||||||||||||
| OPERATIONS: |
| |||||||||||||||
Net investment income (loss) | $ | 26,303,949 | $ | 23,973,165 | $ | 5,323,028 | $ | 6,623,510 | ||||||||
Net realized gain (loss) | 115,957,572 | 73,435,382 | 73,361,907 | 58,774,178 | ||||||||||||
Net change in unrealized appreciation (depreciation) | 114,189,604 | 224,902,747 | (12,611,693 | ) | 65,323,839 | |||||||||||
Net increase (decrease) in net assets resulting from operations | 256,451,125 | 322,311,294 | 66,073,242 | 130,721,527 | ||||||||||||
| DISTRIBUTIONS TO SHAREHOLDERS(a): |
| |||||||||||||||
Class I | (10,776,250 | ) | (4,975,827 | ) | (5,462,948 | ) | (1,262,080 | ) | ||||||||
Class N | (1,302,797 | ) | (669,401 | ) | (690,037 | ) | (247,535 | ) | ||||||||
Class R6 | (30,638,035 | ) | (15,350,782 | ) | (64,425,548 | ) | (18,973,901 | ) | ||||||||
Total distributions | (42,717,082 | ) | (20,996,010 | ) | (70,578,533 | ) | (20,483,516 | ) | ||||||||
| CAPITAL TRANSACTIONS: |
| |||||||||||||||
| CLASS I | ||||||||||||||||
Proceeds from shares sold | 95,787,362 | 140,833,316 | 15,582,728 | 28,720,541 | ||||||||||||
Reinvestment of distributions | 9,776,384 | 4,346,415 | 5,462,948 | 1,261,541 | ||||||||||||
Cost of shares redeemed | (108,671,308 | ) | (390,857,879 | ) | (14,167,311 | ) | (26,858,961 | ) | ||||||||
Net increase (decrease) from capital transactions | (3,107,562 | ) | (245,678,148 | ) | 6,878,365 | 3,123,121 | ||||||||||
| CLASS N |
| |||||||||||||||
Proceeds from shares sold | 25,335,787 | 10,166,505 | 3,216,149 | 3,396,863 | ||||||||||||
Reinvestment of distributions | 1,300,872 | 668,290 | 687,488 | 246,619 | ||||||||||||
Cost of shares redeemed | (25,474,909 | ) | (24,588,845 | ) | (4,669,146 | ) | (6,058,076 | ) | ||||||||
Net increase (decrease) from capital transactions | 1,161,750 | (13,754,050 | ) | (765,509 | ) | (2,414,594 | ) | |||||||||
| CLASS R6 | ||||||||||||||||
Proceeds from shares sold | 350,817,533 | 443,553,869 | 83,802,921 | 116,160,936 | ||||||||||||
Reinvestment of distributions | 30,519,773 | 15,022,031 | 59,088,320 | 17,579,880 | ||||||||||||
Cost of shares redeemed | (414,196,743 | ) | (219,065,217 | ) | (196,791,558 | ) | (190,166,011 | ) | ||||||||
Net increase (decrease) from capital transactions | (32,859,437 | ) | 239,510,683 | (53,900,317 | ) | (56,425,195 | ) | |||||||||
| Net increase (decrease) in net assets resulting from capital transactions | (34,805,249 | ) | (19,921,515 | ) | (47,787,461 | ) | (55,716,668 | ) | ||||||||
| Total increase (decrease) in net assets | 178,928,794 | 281,393,769 | (52,292,752 | ) | 54,521,343 | |||||||||||
| NET ASSETS: | ||||||||||||||||
Beginning of period | 1,766,045,807 | 1,484,652,038 | 797,723,228 | 743,201,885 | ||||||||||||
End of period | $ | 1,944,974,601 | $ | 1,766,045,807 | $ | 745,430,476 | $ | 797,723,228 | ||||||||
| The accompanying notes are an integral part of these financial statements. | (continued on p. 226) |
| AQR Funds | Annual Report | September 2018 | ||||||||||||||
225
Table of Contents
| Statements of Changes in Net Assets | September 30, 2018 |
| AQR LARGE CAP MULTI-STYLE FUND | AQR SMALL CAP MULTI-STYLE FUND | |||||||||||||||
| FOR THE YEAR ENDED SEPTEMBER 30, 2018 | FOR THE YEAR ENDED SEPTEMBER 30, 2017 | FOR THE YEAR ENDED SEPTEMBER 30, 2018 | FOR THE YEAR ENDED SEPTEMBER 30, 2017 | |||||||||||||
| CHANGES IN SHARES OUTSTANDING: | ||||||||||||||||
| CLASS I | ||||||||||||||||
Shares outstanding, beginning of period | 27,105,928 | 44,811,070 | 3,425,976 | 3,258,870 | ||||||||||||
Shares sold | 5,333,007 | 9,220,046 | 999,126 | 1,907,423 | ||||||||||||
Shares issued on reinvestment of distributions | 550,162 | 294,273 | 365,415 | 82,453 | ||||||||||||
Shares redeemed | (6,061,509 | ) | (27,219,461 | ) | (906,159 | ) | (1,822,770 | ) | ||||||||
Shares outstanding, end of period | 26,927,588 | 27,105,928 | 3,884,358 | 3,425,976 | ||||||||||||
| CLASS N | ||||||||||||||||
Shares outstanding, beginning of period | 3,733,125 | 4,643,563 | 538,645 | 700,486 | ||||||||||||
Shares sold | 1,415,274 | 665,568 | 205,765 | 228,754 | ||||||||||||
Shares issued on reinvestment of distributions | 73,454 | 45,369 | 46,078 | 16,161 | ||||||||||||
Shares redeemed | (1,427,128 | ) | (1,621,375 | ) | (297,661 | ) | (406,756 | ) | ||||||||
Shares outstanding, end of period | 3,794,725 | 3,733,125 | 492,827 | 538,645 | ||||||||||||
| CLASS R6 | ||||||||||||||||
Shares outstanding, beginning of period | 73,872,372 | 56,611,041 | 45,548,724 | 49,226,271 | ||||||||||||
Shares sold | 19,575,372 | 30,560,220 | 5,393,761 | 7,765,757 | ||||||||||||
Shares issued on reinvestment of distributions | 1,719,424 | 1,017,753 | 3,949,754 | 1,147,512 | ||||||||||||
Shares redeemed | (22,576,781 | ) | (14,316,642 | ) | (12,407,473 | ) | (12,590,816 | ) | ||||||||
Shares outstanding, end of period | 72,590,387 | 73,872,372 | 42,484,766 | 45,548,724 | ||||||||||||
| (a) | As disclosed in Note 14, the AQR Funds adopted amendments to Regulation S-X included in the Securities and Exchange Commission’s Disclosure Update and Simplification rule. Accordingly, the prior year distributions have been revised to conform to current period presentation. Please refer to Note 5 to review the character of each respective Funds’ distributable earnings for the year ended September 30, 2017, which was previously reported in the Statement of Changes of Net Assets prior to the adoption of the Disclosure Update and Simplification rule. |
| The accompanying notes are an integral part of these financial statements. |
| AQR Funds | Annual Report | September 2018 | ||||||||||||||
226
Table of Contents
| Statements of Changes in Net Assets | September 30, 2018 |
| AQR INTERNATIONAL MULTI-STYLE FUND | AQR EMERGING MULTI-STYLE FUND | |||||||||||||||
| FOR THE YEAR ENDED SEPTEMBER 30, 2018 | FOR THE YEAR ENDED SEPTEMBER 30, 2017 | FOR THE YEAR ENDED SEPTEMBER 30, 2018 | FOR THE YEAR ENDED SEPTEMBER 30, 2017 | |||||||||||||
| OPERATIONS: |
| |||||||||||||||
Net investment income (loss) | $ | 11,551,805 | $ | 9,925,411 | $ | 6,226,903 | $ | 5,648,402 | ||||||||
Net realized gain (loss) | 17,742,504 | 15,744,900 | 8,610,084 | 8,322,666 | ||||||||||||
Net change in unrealized appreciation (depreciation) | (24,519,767 | ) | 53,141,324 | (24,866,761 | ) | 45,882,489 | ||||||||||
Net increase (decrease) in net assets resulting from operations | 4,774,542 | 78,811,635 | (10,029,774 | ) | 59,853,557 | |||||||||||
| DISTRIBUTIONS TO SHAREHOLDERS(a): |
| |||||||||||||||
Class I | (1,871,811 | ) | (1,615,459 | ) | (1,550,648 | ) | (1,429,461 | ) | ||||||||
Class N | (162,279 | ) | (194,539 | ) | (84,835 | ) | (130,267 | ) | ||||||||
Class R6 | (9,653,985 | ) | (7,987,798 | ) | (3,875,940 | ) | (3,682,831 | ) | ||||||||
Total distributions | (11,688,075 | ) | (9,797,796 | ) | (5,511,423 | ) | (5,242,559 | ) | ||||||||
| CAPITAL TRANSACTIONS: |
| |||||||||||||||
| CLASS I | ||||||||||||||||
Proceeds from shares sold | 26,293,510 | 19,633,543 | 25,979,657 | 37,682,958 | ||||||||||||
Reinvestment of distributions | 1,868,748 | 1,612,750 | 1,550,537 | 1,428,298 | ||||||||||||
Cost of shares redeemed | (20,451,269 | ) | (24,211,103 | ) | (95,086,495 | ) | (31,081,689 | ) | ||||||||
Net increase (decrease) from capital transactions | 7,710,989 | (2,964,810 | ) | (67,556,301 | ) | 8,029,567 | ||||||||||
| CLASS N | ||||||||||||||||
Proceeds from shares sold | 2,806,811 | 2,954,447 | 9,802,946 | 2,013,359 | ||||||||||||
Reinvestment of distributions | 161,205 | 193,541 | 84,835 | 130,267 | ||||||||||||
Cost of shares redeemed | (4,820,322 | ) | (4,121,548 | ) | (11,280,986 | ) | (4,308,730 | ) | ||||||||
Net increase (decrease) from capital transactions | (1,852,306 | ) | (973,560 | ) | (1,393,205 | ) | (2,165,104 | ) | ||||||||
| CLASS R6 | ||||||||||||||||
Proceeds from shares sold | 56,823,039 | 79,290,772 | 112,121,781 | 36,137,353 | ||||||||||||
Reinvestment of distributions | 9,578,079 | 7,922,560 | 3,839,830 | 3,653,343 | ||||||||||||
Cost of shares redeemed | (116,207,995 | ) | (60,093,576 | ) | (49,354,536 | ) | (39,269,853 | ) | ||||||||
Net increase (decrease) from capital transactions | (49,806,877 | ) | 27,119,756 | 66,607,075 | 520,843 | |||||||||||
| Net increase (decrease) in net assets resulting from capital transactions | (43,948,194 | ) | 23,181,386 | (2,342,431 | ) | 6,385,306 | ||||||||||
Total increase (decrease) in net assets | (50,861,727 | ) | 92,195,225 | (17,883,628 | ) | 60,996,304 | ||||||||||
| NET ASSETS: | ||||||||||||||||
Beginning of period | 470,268,680 | 378,073,455 | 326,500,884 | 265,504,580 | ||||||||||||
End of period | $ | 419,406,953 | $ | 470,268,680 | $ | 308,617,256 | $ | 326,500,884 | ||||||||
| The accompanying notes are an integral part of these financial statements. | (continued on p. 228) |
| AQR Funds | Annual Report | September 2018 | ||||||||||||||
227
Table of Contents
| Statements of Changes in Net Assets | September 30, 2018 |
| AQR INTERNATIONAL MULTI-STYLE FUND | AQR EMERGING MULTI-STYLE FUND | |||||||||||||||
| FOR THE YEAR ENDED SEPTEMBER 30, 2018 | FOR THE YEAR ENDED SEPTEMBER 30, 2017 | FOR THE YEAR ENDED SEPTEMBER 30, 2018 | FOR THE YEAR ENDED SEPTEMBER 30, 2017 | |||||||||||||
| CHANGES IN SHARES OUTSTANDING: |
| |||||||||||||||
| CLASS I | ||||||||||||||||
Shares outstanding, beginning of period | 6,382,844 | 6,677,387 | 9,084,086 | 8,243,713 | ||||||||||||
Shares sold | 2,185,654 | 1,849,100 | 2,323,815 | 3,799,597 | ||||||||||||
Shares issued on reinvestment of distributions | 156,381 | 163,898 | 141,990 | 174,183 | ||||||||||||
Shares redeemed | (1,694,896 | ) | (2,307,541 | ) | (8,118,622 | ) | (3,133,407 | ) | ||||||||
Shares outstanding, end of period | 7,029,983 | 6,382,844 | 3,431,269 | 9,084,086 | ||||||||||||
| CLASS N | ||||||||||||||||
Shares outstanding, beginning of period | 741,408 | 832,639 | 629,566 | 850,737 | ||||||||||||
Shares sold | 233,747 | 286,397 | 900,890 | 226,977 | ||||||||||||
Shares issued on reinvestment of distributions | 13,501 | 19,689 | 7,769 | 15,886 | ||||||||||||
Shares redeemed | (400,936 | ) | (397,317 | ) | (1,015,315 | ) | (464,034 | ) | ||||||||
Shares outstanding, end of period | 587,720 | 741,408 | 522,910 | 629,566 | ||||||||||||
| CLASS R6 | ||||||||||||||||
Shares outstanding, beginning of period | 32,248,885 | 29,492,098 | 20,749,080 | 20,536,218 | ||||||||||||
Shares sold | 4,735,673 | 7,577,114 | 9,659,418 | 3,893,741 | ||||||||||||
Shares issued on reinvestment of distributions | 802,856 | 805,957 | 351,311 | 444,987 | ||||||||||||
Shares redeemed | (9,706,022 | ) | (5,626,284 | ) | (4,419,542 | ) | (4,125,866 | ) | ||||||||
Shares outstanding, end of period | 28,081,392 | 32,248,885 | 26,340,267 | 20,749,080 | ||||||||||||
| (a) | As disclosed in Note 14, the AQR Funds adopted amendments to Regulation S-X included in the Securities and Exchange Commission’s Disclosure Update and Simplification rule. Accordingly, the prior year distributions have been revised to conform to current period presentation. Please refer to Note 5 to review the character of each respective Funds’ distributable earnings for the year ended September 30, 2017, which was previously reported in the Statement of Changes of Net Assets prior to the adoption of the Disclosure Update and Simplification rule. |
| The accompanying notes are an integral part of these financial statements. |
| AQR Funds | Annual Report | September 2018 | ||||||||||||||
228
Table of Contents
| Statements of Changes in Net Assets | September 30, 2018 |
| AQR TM LARGE CAP MULTI-STYLE FUND | AQR TM SMALL CAP MULTI-STYLE FUND | |||||||||||||||
| FOR THE YEAR ENDED SEPTEMBER 30, 2018 | FOR THE YEAR ENDED SEPTEMBER 30, 2017 | FOR THE YEAR ENDED SEPTEMBER 30, 2018 | FOR THE YEAR ENDED SEPTEMBER 30, 2017 | |||||||||||||
| OPERATIONS: | ||||||||||||||||
Net investment income (loss) | $ | 3,688,218 | $ | 2,766,020 | $ | 168,422 | $ | 181,185 | ||||||||
Net realized gain (loss) | 2,705,323 | 424,382 | 1,215,134 | 439,324 | ||||||||||||
Net change in unrealized appreciation (depreciation) | 29,885,351 | 33,816,540 | 1,831,318 | 3,195,344 | ||||||||||||
Net increase (decrease) in net assets resulting from operations | 36,278,892 | 37,006,942 | 3,214,874 | 3,815,853 | ||||||||||||
| DISTRIBUTIONS TO SHAREHOLDERS(a): |
| |||||||||||||||
Class I | (818,162 | ) | (560,731 | ) | (602,144 | ) | (154,814 | ) | ||||||||
Class N | (21,911 | ) | (22,922 | ) | (137,360 | ) | (25,593 | ) | ||||||||
Class R6 | (2,148,486 | ) | (1,372,023 | ) | (65,206 | ) | (22,170 | ) | ||||||||
Total distributions | (2,988,559 | ) | (1,955,676 | ) | (804,710 | ) | (202,577 | ) | ||||||||
| CAPITAL TRANSACTIONS: |
| |||||||||||||||
| CLASS I | ||||||||||||||||
Proceeds from shares sold | 21,740,496 | 18,063,674 | 5,052,196 | 6,781,869 | ||||||||||||
Reinvestment of distributions | 813,559 | 556,533 | 601,692 | 154,181 | ||||||||||||
Cost of shares redeemed | (8,616,650 | ) | (4,512,759 | ) | (2,891,525 | ) | (2,124,391 | ) | ||||||||
Net increase (decrease) from capital transactions | 13,937,405 | 14,107,448 | 2,762,363 | 4,811,659 | ||||||||||||
| CLASS N | ||||||||||||||||
Proceeds from shares sold | 659,520 | 991,351 | 1,998,957 | 3,690,705 | ||||||||||||
Reinvestment of distributions | 21,911 | 22,922 | 137,360 | 25,593 | ||||||||||||
Cost of shares redeemed | (892,234 | ) | (1,389,436 | ) | (1,601,248 | ) | (1,836,542 | ) | ||||||||
Net increase (decrease) from capital transactions | (210,803 | ) | (375,163 | ) | 535,069 | 1,879,756 | ||||||||||
| CLASS R6 | ||||||||||||||||
Proceeds from shares sold | 49,575,877 | 52,090,671 | — | — | ||||||||||||
Reinvestment of distributions | 2,145,431 | 1,367,976 | 65,206 | 22,170 | ||||||||||||
Cost of shares redeemed | (25,434,061 | ) | (14,687,541 | ) | — | — | ||||||||||
Net increase (decrease) from capital transactions | 26,287,247 | 38,771,106 | 65,206 | 22,170 | ||||||||||||
| Net increase (decrease) in net assets resulting from capital transactions | 40,013,849 | 52,503,391 | 3,362,638 | 6,713,585 | ||||||||||||
| Total increase (decrease) in net assets | 73,304,182 | 87,554,657 | 5,772,802 | 10,326,861 | ||||||||||||
| NET ASSETS: | ||||||||||||||||
Beginning of period | 227,775,622 | 140,220,965 | 29,061,859 | 18,734,998 | ||||||||||||
End of period | $ | 301,079,804 | $ | 227,775,622 | $ | 34,834,661 | $ | 29,061,859 | ||||||||
| The accompanying notes are an integral part of these financial statements. | (continued on p. 230) |
| AQR Funds | Annual Report | September 2018 | ||||||||||||||
229
Table of Contents
| Statements of Changes in Net Assets | September 30, 2018 |
| AQR TM LARGE CAP MULTI-STYLE FUND | AQR TM SMALL CAP MULTI-STYLE FUND | |||||||||||||||
| FOR THE YEAR ENDED SEPTEMBER 30, 2018 | FOR THE YEAR ENDED SEPTEMBER 30, 2017 | FOR THE YEAR ENDED SEPTEMBER 30, 2018 | FOR THE YEAR ENDED SEPTEMBER 30, 2017 | |||||||||||||
| CHANGES IN SHARES OUTSTANDING: |
| |||||||||||||||
| CLASS I | ||||||||||||||||
Shares outstanding, beginning of period | 5,295,943 | 3,995,600 | 1,766,988 | 1,338,219 | ||||||||||||
Shares sold | 1,676,676 | 1,651,972 | 410,222 | 604,397 | ||||||||||||
Shares issued on reinvestment of distributions | 63,214 | 52,652 | 49,974 | 13,489 | ||||||||||||
Shares redeemed | (657,890 | ) | (404,281 | ) | (231,797 | ) | (189,117 | ) | ||||||||
Shares outstanding, end of period | 6,377,943 | 5,295,943 | 1,995,387 | 1,766,988 | ||||||||||||
| CLASS N | ||||||||||||||||
Shares outstanding, beginning of period | 183,388 | 217,083 | 457,078 | 289,019 | ||||||||||||
Shares sold | 50,916 | 91,182 | 166,366 | 329,990 | ||||||||||||
Shares issued on reinvestment of distributions | 1,705 | 2,171 | 11,437 | 2,243 | ||||||||||||
Shares redeemed | (68,296 | ) | (127,048 | ) | (128,313 | ) | (164,174 | ) | ||||||||
Shares outstanding, end of period | 167,713 | 183,388 | 506,568 | 457,078 | ||||||||||||
| CLASS R6 | ||||||||||||||||
Shares outstanding, beginning of period | 13,352,220 | 9,800,397 | 193,053 | 191,117 | ||||||||||||
Shares sold | 3,792,122 | 4,764,209 | — | — | ||||||||||||
Shares issued on reinvestment of distributions | 166,700 | 129,420 | 5,407 | 1,936 | ||||||||||||
Shares redeemed | (1,944,756 | ) | (1,341,806 | ) | — | — | ||||||||||
Shares outstanding, end of period | 15,366,286 | 13,352,220 | 198,460 | 193,053 | ||||||||||||
| (a) | As disclosed in Note 14, the AQR Funds adopted amendments to Regulation S-X included in the Securities and Exchange Commission’s Disclosure Update and Simplification rule. Accordingly, the prior year distributions have been revised to conform to current period presentation. Please refer to Note 5 to review the character of each respective Funds’ distributable earnings for the year ended September 30, 2017, which was previously reported in the Statement of Changes of Net Assets prior to the adoption of the Disclosure Update and Simplification rule. |
| The accompanying notes are an integral part of these financial statements. |
| AQR Funds | Annual Report | September 2018 | ||||||||||||||
230
Table of Contents
| Statements of Changes in Net Assets | September 30, 2018 |
| AQR TM INTERNATIONAL MULTI-STYLE FUND | AQR TM EMERGING MULTI-STYLE FUND | |||||||||||||||
| FOR THE YEAR ENDED SEPTEMBER 30, 2018 | FOR THE YEAR ENDED SEPTEMBER 30, 2017 | FOR THE YEAR ENDED SEPTEMBER 30, 2018 | FOR THE YEAR ENDED SEPTEMBER 30, 2017 | |||||||||||||
| OPERATIONS: | ||||||||||||||||
Net investment income (loss) | $ | 4,369,425 | $ | 3,739,025 | $ | 7,400,800 | $ | 5,997,876 | ||||||||
Net realized gain (loss) | 1,535,987 | 61,909 | 517,840 | 2,417,623 | ||||||||||||
Net change in unrealized appreciation (depreciation) | (3,311,001 | ) | 26,561,545 | (18,402,848 | ) | 58,623,612 | ||||||||||
Net increase (decrease) in net assets resulting from operations | 2,594,411 | 30,362,479 | (10,484,208 | ) | 67,039,111 | |||||||||||
| DISTRIBUTIONS TO SHAREHOLDERS(a): |
| |||||||||||||||
Class I | (644,479 | ) | (422,289 | ) | (286,290 | ) | (296,146 | ) | ||||||||
Class N | (47,940 | ) | (30,453 | ) | (31,785 | ) | (49,154 | ) | ||||||||
Class R6 | (3,770,415 | ) | (2,510,600 | ) | (5,586,088 | ) | (6,513,104 | ) | ||||||||
Total distributions | (4,462,834 | ) | (2,963,342 | ) | (5,904,163 | ) | (6,858,404 | ) | ||||||||
| CAPITAL TRANSACTIONS: |
| |||||||||||||||
| CLASS I | ||||||||||||||||
Proceeds from shares sold | 8,564,970 | 5,883,701 | 5,010,657 | 3,979,959 | ||||||||||||
Reinvestment of distributions | 639,789 | 413,893 | �� | 277,677 | 283,665 | |||||||||||
Cost of shares redeemed | (5,986,354 | ) | (4,563,660 | ) | (4,025,314 | ) | (2,771,277 | ) | ||||||||
Net increase (decrease) from capital transactions | 3,218,405 | 1,733,934 | 1,263,020 | 1,492,347 | ||||||||||||
| CLASS N | ||||||||||||||||
Proceeds from shares sold | 539,743 | 828,696 | 537,217 | 781,758 | ||||||||||||
Reinvestment of distributions | 47,940 | 30,453 | 31,785 | 49,154 | ||||||||||||
Cost of shares redeemed | (1,087,872 | ) | (686,814 | ) | (1,093,736 | ) | (1,165,523 | ) | ||||||||
Net increase (decrease) from capital transactions | (500,189 | ) | 172,335 | (524,734 | ) | (334,611 | ) | |||||||||
| CLASS R6 | ||||||||||||||||
Proceeds from shares sold | 27,806,384 | 26,791,516 | 15,239,075 | 16,416,631 | ||||||||||||
Reinvestment of distributions | 3,766,767 | 2,506,738 | 5,584,281 | 6,510,144 | ||||||||||||
Cost of shares redeemed | (20,020,485 | ) | (17,661,501 | ) | (26,016,762 | ) | (19,083,778 | ) | ||||||||
Net increase (decrease) from capital transactions | 11,552,666 | 11,636,753 | (5,193,406 | ) | 3,842,997 | |||||||||||
| Net increase (decrease) in net assets resulting from capital transactions | 14,270,882 | 13,543,022 | (4,455,120 | ) | 5,000,733 | |||||||||||
| Total increase (decrease) in net assets | 12,402,459 | 40,942,159 | (20,843,491 | ) | 65,181,440 | |||||||||||
| NET ASSETS: | ||||||||||||||||
Beginning of period | 179,269,191 | 138,327,032 | 352,854,397 | 287,672,957 | ||||||||||||
End of period | $ | 191,671,650 | $ | 179,269,191 | $ | 332,010,906 | $ | 352,854,397 | ||||||||
| The accompanying notes are an integral part of these financial statements. | (continued on p. 232) |
| AQR Funds | Annual Report | September 2018 | ||||||||||||||
231
Table of Contents
| Statements of Changes in Net Assets | September 30, 2018 |
| AQR TM INTERNATIONAL MULTI-STYLE FUND | AQR TM EMERGING MULTI-STYLE FUND | |||||||||||||||
| FOR THE YEAR ENDED SEPTEMBER 30, 2018 | FOR THE YEAR ENDED SEPTEMBER 30, 2017 | FOR THE YEAR ENDED SEPTEMBER 30, 2018 | FOR THE YEAR ENDED SEPTEMBER 30, 2017 | |||||||||||||
| CHANGES IN SHARES OUTSTANDING: |
| |||||||||||||||
| CLASS I | ||||||||||||||||
Shares outstanding, beginning of period | 2,306,712 | 2,128,774 | 1,529,628 | 1,370,519 | ||||||||||||
Shares sold | 764,768 | 585,383 | 447,137 | 407,778 | ||||||||||||
Shares issued on reinvestment of distributions | 57,073 | 45,086 | 24,552 | 33,451 | ||||||||||||
Shares redeemed | (531,969 | ) | (452,531 | ) | (369,017 | ) | (282,120 | ) | ||||||||
Shares outstanding, end of period | 2,596,584 | 2,306,712 | 1,632,300 | 1,529,628 | ||||||||||||
| CLASS N | ||||||||||||||||
Shares outstanding, beginning of period | 186,870 | 168,987 | 207,005 | 233,206 | ||||||||||||
Shares sold | 48,084 | 85,293 | 46,682 | 84,653 | ||||||||||||
Shares issued on reinvestment of distributions | 4,284 | 3,325 | 2,808 | 5,789 | ||||||||||||
Shares redeemed | (98,825 | ) | (70,735 | ) | (98,108 | ) | (116,643 | ) | ||||||||
Shares outstanding, end of period | 140,413 | 186,870 | 158,387 | 207,005 | ||||||||||||
| CLASS R6 | ||||||||||||||||
Shares outstanding, beginning of period | 13,549,216 | 12,337,482 | 29,960,986 | 29,394,195 | ||||||||||||
Shares sold | 2,458,198 | 2,714,486 | 1,347,163 | 1,733,236 | ||||||||||||
Shares issued on reinvestment of distributions | 335,420 | 272,768 | 493,747 | 767,706 | ||||||||||||
Shares redeemed | (1,769,472 | ) | (1,775,520 | ) | (2,236,193 | ) | (1,934,151 | ) | ||||||||
Shares outstanding, end of period | 14,573,362 | 13,549,216 | 29,565,703 | 29,960,986 | ||||||||||||
| (a) | As disclosed in Note 14, the AQR Funds adopted amendments to Regulation S-X included in the Securities and Exchange Commission’s Disclosure Update and Simplification rule. Accordingly, the prior year distributions have been revised to conform to current period presentation. Please refer to Note 5 to review the character of each respective Funds’ distributable earnings for the year ended September 30, 2017, which was previously reported in the Statement of Changes of Net Assets prior to the adoption of the Disclosure Update and Simplification rule. |
| The accompanying notes are an integral part of these financial statements. |
| AQR Funds | Annual Report | September 2018 | ||||||||||||||
232
Table of Contents
| Statements of Changes in Net Assets | September 30, 2018 |
| AQR LARGE CAP MOMENTUM STYLE FUND | AQR SMALL CAP MOMENTUM STYLE FUND | |||||||||||||||
| FOR THE YEAR ENDED SEPTEMBER 30, 2018 | FOR THE YEAR ENDED SEPTEMBER 30, 2017 | FOR THE YEAR ENDED SEPTEMBER 30, 2018 | FOR THE YEAR ENDED SEPTEMBER 30, 2017 | |||||||||||||
| OPERATIONS: | ||||||||||||||||
Net investment income (loss) | $ | 8,933,124 | $ | 10,923,780 | $ | 827,127 | $ | 1,572,201 | ||||||||
Net realized gain (loss) | 91,679,378 | 73,752,927 | 60,712,063 | 36,171,814 | ||||||||||||
Net change in unrealized appreciation (depreciation) | 129,534,690 | 57,914,342 | 8,547,276 | 26,319,546 | ||||||||||||
Net increase (decrease) in net assets resulting from operations | 230,147,192 | 142,591,049 | 70,086,466 | 64,063,561 | ||||||||||||
| DISTRIBUTIONS TO SHAREHOLDERS(a): |
| |||||||||||||||
Class I | (76,341,133 | ) | (60,101,472 | ) | (32,807,701 | ) | (2,567,241 | ) | ||||||||
Class N | (5,133,765 | ) | (4,122,187 | ) | (99,309 | ) | — | |||||||||
Class R6 | (5,802,831 | ) | (4,515,475 | ) | (1,143,211 | ) | (79,227 | ) | ||||||||
Total distributions | (87,277,729 | ) | (68,739,134 | ) | (34,050,221 | ) | (2,646,468 | ) | ||||||||
| CAPITAL TRANSACTIONS: |
| |||||||||||||||
| CLASS I | ||||||||||||||||
Proceeds from shares sold | 163,829,903 | 154,774,327 | 45,235,866 | 51,370,096 | ||||||||||||
Reinvestment of distributions | 76,128,358 | 60,037,357 | 32,791,199 | 2,558,986 | ||||||||||||
Cost of shares redeemed | (246,125,073 | ) | (230,601,389 | ) | (125,115,397 | ) | (70,940,111 | ) | ||||||||
Net increase (decrease) from capital transactions | (6,166,812 | ) | (15,789,705 | ) | (47,088,332 | ) | (17,011,029 | ) | ||||||||
| CLASS N | ||||||||||||||||
Proceeds from shares sold | 15,958,025 | 7,404,914 | 1,813,033 | 396,727 | ||||||||||||
Reinvestment of distributions | 5,133,360 | 4,121,868 | 99,309 | — | ||||||||||||
Cost of shares redeemed | (11,837,299 | ) | (14,419,255 | ) | (951,481 | ) | (531,776 | ) | ||||||||
Net increase (decrease) from capital transactions | 9,254,086 | (2,892,473 | ) | 960,861 | (135,049 | ) | ||||||||||
| CLASS R6 | ||||||||||||||||
Proceeds from shares sold | 42,405,165 | 16,080,377 | 8,229,692 | 2,308,572 | ||||||||||||
Reinvestment of distributions | 5,772,894 | 4,492,109 | 1,142,144 | 79,139 | ||||||||||||
Cost of shares redeemed | (22,976,645 | ) | (18,757,198 | ) | (1,722,087 | ) | (773,259 | ) | ||||||||
Net increase (decrease) from capital transactions | 25,201,414 | 1,815,288 | 7,649,749 | 1,614,452 | ||||||||||||
| Net increase (decrease) in net assets resulting from capital transactions | 28,288,688 | (16,866,890 | ) | (38,477,722 | ) | (15,531,626 | ) | |||||||||
| Total increase (decrease) in net assets | 171,158,151 | 56,985,025 | (2,441,477 | ) | 45,885,467 | |||||||||||
| NET ASSETS: | ||||||||||||||||
Beginning of period | 994,651,503 | 937,666,478 | 373,103,524 | 327,218,057 | ||||||||||||
End of period | $ | 1,165,809,654 | $ | 994,651,503 | $ | 370,662,047 | $ | 373,103,524 | ||||||||
| The accompanying notes are an integral part of these financial statements. | (continued on p. 234) |
| AQR Funds | Annual Report | September 2018 | ||||||||||||||
233
Table of Contents
| Statements of Changes in Net Assets | September 30, 2018 |
| AQR LARGE CAP MOMENTUM STYLE FUND | AQR SMALL CAP MOMENTUM STYLE FUND | |||||||||||||||
| FOR THE YEAR ENDED SEPTEMBER 30, 2018 | FOR THE YEAR ENDED SEPTEMBER 30, 2017 | FOR THE YEAR ENDED SEPTEMBER 30, 2018 | FOR THE YEAR ENDED SEPTEMBER 30, 2017 | |||||||||||||
| CHANGES IN SHARES OUTSTANDING: |
| |||||||||||||||
| CLASS I | ||||||||||||||||
Shares outstanding, beginning of period | 39,535,338 | 40,158,763 | 14,479,520 | 15,247,228 | ||||||||||||
Shares sold | 7,100,399 | 7,605,960 | 1,806,138 | 2,290,061 | ||||||||||||
Shares issued on reinvestment of distributions | 3,516,321 | 3,118,824 | 1,394,777 | 114,240 | ||||||||||||
Shares redeemed | (10,677,020 | ) | (11,348,209 | ) | (4,905,328 | ) | (3,172,009 | ) | ||||||||
Shares outstanding, end of period | 39,475,038 | 39,535,338 | 12,775,107 | 14,479,520 | ||||||||||||
| CLASS N | ||||||||||||||||
Shares outstanding, beginning of period | 2,686,851 | 2,823,181 | 69,288 | 76,105 | ||||||||||||
Shares sold | 691,541 | 363,923 | 68,924 | 17,898 | ||||||||||||
Shares issued on reinvestment of distributions | 236,888 | 213,901 | 4,217 | — | ||||||||||||
Shares redeemed | (514,969 | ) | (714,154 | ) | (37,998 | ) | (24,715 | ) | ||||||||
Shares outstanding, end of period | 3,100,311 | 2,686,851 | 104,431 | 69,288 | ||||||||||||
| CLASS R6 | ||||||||||||||||
Shares outstanding, beginning of period | 3,001,708 | 2,895,803 | 480,490 | 408,690 | ||||||||||||
Shares sold | 1,830,232 | 791,962 | 318,663 | 102,839 | ||||||||||||
Shares issued on reinvestment of distributions | 267,388 | 233,842 | 48,705 | 3,541 | ||||||||||||
Shares redeemed | (1,011,066 | ) | (919,899 | ) | (66,885 | ) | (34,580 | ) | ||||||||
Shares outstanding, end of period | 4,088,262 | 3,001,708 | 780,973 | 480,490 | ||||||||||||
| (a) | As disclosed in Note 14, the AQR Funds adopted amendments to Regulation S-X included in the Securities and Exchange Commission’s Disclosure Update and Simplification rule. Accordingly, the prior year distributions have been revised to conform to current period presentation. Please refer to Note 5 to review the character of each respective Funds’ distributable earnings for the year ended September 30, 2017, which was previously reported in the Statement of Changes of Net Assets prior to the adoption of the Disclosure Update and Simplification rule. |
| The accompanying notes are an integral part of these financial statements. |
| AQR Funds | Annual Report | September 2018 | ||||||||||||||
234
Table of Contents
| Statements of Changes in Net Assets | September 30, 2018 |
| AQR INTERNATIONAL MOMENTUM STYLE FUND | AQR EMERGING MOMENTUM STYLE FUND | |||||||||||||||
| FOR THE YEAR ENDED SEPTEMBER 30, 2018 | FOR THE YEAR ENDED SEPTEMBER 30, 2017 | FOR THE YEAR ENDED SEPTEMBER 30, 2018 | FOR THE YEAR ENDED SEPTEMBER 30, 2017 | |||||||||||||
| OPERATIONS: | ||||||||||||||||
Net investment income (loss) | $ | 7,928,075 | $ | 8,066,811 | $ | 237,271 | $ | 255,005 | ||||||||
Net realized gain (loss) | 16,893,422 | 11,516,102 | 1,243,800 | 289,377 | ||||||||||||
Net change in unrealized appreciation (depreciation) | (7,558,752 | ) | 33,527,943 | (1,475,528 | ) | 2,041,026 | ||||||||||
Net increase (decrease) in net assets resulting from operations | 17,262,745 | 53,110,856 | 5,543 | 2,585,408 | ||||||||||||
| DISTRIBUTIONS TO SHAREHOLDERS(a): |
| |||||||||||||||
Class I | (7,041,640 | ) | (6,221,505 | ) | (197,095 | ) | (124,339 | ) | ||||||||
Class N | (676,884 | ) | (598,973 | ) | (22,047 | ) | (12,317 | ) | ||||||||
Class R6 | (1,097,301 | ) | (869,430 | ) | (39,256 | ) | (14,922 | ) | ||||||||
Total distributions | (8,815,825 | ) | (7,689,908 | ) | (258,398 | ) | (151,578 | ) | ||||||||
| CAPITAL TRANSACTIONS: |
| |||||||||||||||
| CLASS I | ||||||||||||||||
Proceeds from shares sold | 72,031,543 | 74,964,141 | 1,447,045 | 1,485,262 | ||||||||||||
Reinvestment of distributions | 7,039,182 | 6,218,003 | 197,095 | 124,339 | ||||||||||||
Cost of shares redeemed | (63,862,539 | ) | (63,513,055 | ) | (3,299,564 | ) | (1,563,236 | ) | ||||||||
Net increase (decrease) from capital transactions | 15,208,186 | 17,669,089 | (1,655,424 | ) | 46,365 | |||||||||||
| CLASS N | ||||||||||||||||
Proceeds from shares sold | 9,462,734 | 5,679,592 | 44,782 | 53,618 | ||||||||||||
Reinvestment of distributions | 676,884 | 598,973 | 22,047 | 12,317 | ||||||||||||
Cost of shares redeemed | (4,340,652 | ) | (6,388,590 | ) | (90,261 | ) | (217,315 | ) | ||||||||
Net increase (decrease) from capital transactions | 5,798,966 | (110,025 | ) | (23,432 | ) | (151,380 | ) | |||||||||
| CLASS R6 | ||||||||||||||||
Proceeds from shares sold | 23,220,150 | 11,815,084 | 891,752 | 676,411 | ||||||||||||
Reinvestment of distributions | 1,097,301 | 868,265 | 39,256 | 14,922 | ||||||||||||
Cost of shares redeemed | (7,166,865 | ) | (7,080,653 | ) | (297,908 | ) | (155,649 | ) | ||||||||
Net increase (decrease) from capital transactions | 17,150,586 | 5,602,696 | 633,100 | 535,684 | ||||||||||||
| Net increase (decrease) in net assets resulting from capital transactions | 38,157,738 | 23,161,760 | (1,045,756 | ) | 430,669 | |||||||||||
| Total increase (decrease) in net assets | 46,604,658 | 68,582,708 | (1,298,611 | ) | 2,864,499 | |||||||||||
| NET ASSETS: | ||||||||||||||||
Beginning of period | 406,468,519 | 337,885,811 | 13,691,928 | 10,827,429 | ||||||||||||
End of period | $ | 453,073,177 | $ | 406,468,519 | $ | 12,393,317 | $ | 13,691,928 | ||||||||
| The accompanying notes are an integral part of these financial statements. | (continued on p. 236) |
| AQR Funds | Annual Report | September 2018 | ||||||||||||||
235
Table of Contents
| Statements of Changes in Net Assets | September 30, 2018 |
| AQR INTERNATIONAL MOMENTUM STYLE FUND | AQR EMERGING MOMENTUM STYLE FUND | |||||||||||||||
| FOR THE YEAR ENDED SEPTEMBER 30, 2018 | FOR THE YEAR ENDED SEPTEMBER 30, 2017 | FOR THE YEAR ENDED SEPTEMBER 30, 2018 | FOR THE YEAR ENDED SEPTEMBER 30, 2017 | |||||||||||||
| CHANGES IN SHARES OUTSTANDING: |
| |||||||||||||||
| CLASS I | ||||||||||||||||
Shares outstanding, beginning of period | 21,061,118 | 19,627,772 | 1,008,926 | 1,003,384 | ||||||||||||
Shares sold | 4,535,715 | 5,546,955 | 125,054 | 166,954 | ||||||||||||
Shares issued on reinvestment of distributions | 450,363 | 488,837 | 17,788 | 15,699 | ||||||||||||
Shares redeemed | (4,005,295 | ) | (4,602,446 | ) | (289,024 | ) | (177,111 | ) | ||||||||
Shares outstanding, end of period | 22,041,901 | 21,061,118 | 862,744 | 1,008,926 | ||||||||||||
| CLASS N | ||||||||||||||||
Shares outstanding, beginning of period | 2,200,569 | 2,207,600 | 112,797 | 126,465 | ||||||||||||
Shares sold | 594,470 | 415,499 | 3,879 | 5,909 | ||||||||||||
Shares issued on reinvestment of distributions | 43,362 | 47,126 | 1,986 | 1,553 | ||||||||||||
Shares redeemed | (273,625 | ) | (469,656 | ) | (7,773 | ) | (21,130 | ) | ||||||||
Shares outstanding, end of period | 2,564,776 | 2,200,569 | 110,889 | 112,797 | ||||||||||||
| CLASS R6 | ||||||||||||||||
Shares outstanding, beginning of period | 2,964,194 | 2,555,356 | 166,502 | 107,058 | ||||||||||||
Shares sold | 1,465,684 | 858,078 | 78,904 | 73,914 | ||||||||||||
Shares issued on reinvestment of distributions | 70,340 | 68,367 | 3,540 | 1,882 | ||||||||||||
Shares redeemed | (451,601 | ) | (517,607 | ) | (26,161 | ) | (16,352 | ) | ||||||||
Shares outstanding, end of period | 4,048,617 | 2,964,194 | 222,785 | 166,502 | ||||||||||||
| (a) | As disclosed in Note 14, the AQR Funds adopted amendments to Regulation S-X included in the Securities and Exchange Commission’s Disclosure Update and Simplification rule. Accordingly, the prior year distributions have been revised to conform to current period presentation. Please refer to Note 5 to review the character of each respective Funds’ distributable earnings for the year ended September 30, 2017, which was previously reported in the Statement of Changes of Net Assets prior to the adoption of the Disclosure Update and Simplification rule. |
| The accompanying notes are an integral part of these financial statements. |
| AQR Funds | Annual Report | September 2018 | ||||||||||||||
236
Table of Contents
| Statements of Changes in Net Assets | September 30, 2018 |
| AQR TM LARGE CAP MOMENTUM STYLE FUND | AQR TM SMALL CAP MOMENTUM STYLE FUND | |||||||||||||||
| FOR THE YEAR ENDED SEPTEMBER 30, 2018 | FOR THE YEAR ENDED SEPTEMBER 30, 2017 | FOR THE YEAR ENDED SEPTEMBER 30, 2018 | FOR THE YEAR ENDED SEPTEMBER 30, 2017 | |||||||||||||
| OPERATIONS: | ||||||||||||||||
Net investment income (loss) | $ | 1,759,417 | $ | 1,841,956 | $ | 118,806 | $ | 187,402 | ||||||||
Net realized gain (loss) | 1,745,014 | 367,291 | 4,268,207 | 771,880 | ||||||||||||
Net change in unrealized appreciation (depreciation) | 41,796,827 | 21,797,950 | 6,085,405 | 6,910,549 | ||||||||||||
Net increase (decrease) in net assets resulting from operations | 45,301,258 | 24,007,197 | 10,472,418 | 7,869,831 | ||||||||||||
| DISTRIBUTIONS TO SHAREHOLDERS(a): |
| |||||||||||||||
Class I | (716,329 | ) | (955,242 | ) | (169,922 | ) | (254,946 | ) | ||||||||
Class N | (65,175 | ) | (2,128 | ) | (10,537 | ) | (918 | ) | ||||||||
Class R6 | (777,211 | ) | (1,235,381 | ) | (821 | ) | (1,393 | ) | ||||||||
Total distributions | (1,558,715 | ) | (2,192,751 | ) | (181,280 | ) | (257,257 | ) | ||||||||
| CAPITAL TRANSACTIONS: |
| |||||||||||||||
| CLASS I | ||||||||||||||||
Proceeds from shares sold | 16,390,697 | 21,637,497 | 10,834,814 | 11,256,908 | ||||||||||||
Reinvestment of distributions | 716,292 | 955,242 | 169,922 | 254,946 | ||||||||||||
Cost of shares redeemed | (12,862,332 | ) | (13,438,274 | ) | (5,456,512 | ) | (4,321,955 | ) | ||||||||
Net increase (decrease) from capital transactions | 4,244,657 | 9,154,465 | 5,548,224 | 7,189,899 | ||||||||||||
| CLASS N | ||||||||||||||||
Proceeds from shares sold | 5,079,649 | 8,608,192 | 2,527,376 | 3,053,888 | ||||||||||||
Reinvestment of distributions | 65,175 | 2,128 | 10,537 | 918 | ||||||||||||
Cost of shares redeemed | (2,566,725 | ) | (521,673 | ) | (898,531 | ) | (129,774 | ) | ||||||||
Net increase (decrease) from capital transactions | 2,578,099 | 8,088,647 | 1,639,382 | 2,925,032 | ||||||||||||
| CLASS R6 | ||||||||||||||||
Proceeds from shares sold | 18,538,623 | 12,410,098 | — | — | ||||||||||||
Reinvestment of distributions | 776,372 | 1,234,108 | 821 | 1,393 | ||||||||||||
Cost of shares redeemed | (21,657,707 | ) | (20,260,706 | ) | (8,633 | ) | (105 | ) | ||||||||
Net increase (decrease) from capital transactions | (2,342,712 | ) | (6,616,500 | ) | (7,812 | ) | 1,288 | |||||||||
| Net increase (decrease) in net assets resulting from capital transactions | 4,480,044 | 10,626,612 | 7,179,794 | 10,116,219 | ||||||||||||
| Total increase (decrease) in net assets | 48,222,587 | 32,441,058 | 17,470,932 | 17,728,793 | ||||||||||||
| NET ASSETS: | ||||||||||||||||
Beginning of period | 180,188,975 | 147,747,917 | 51,277,497 | 33,548,704 | ||||||||||||
End of period | $ | 228,411,562 | $ | 180,188,975 | $ | 68,748,429 | $ | 51,277,497 | ||||||||
| The accompanying notes are an integral part of these financial statements. | (continued on p. 238) |
| AQR Funds | Annual Report | September 2018 | ||||||||||||||
237
Table of Contents
| Statements of Changes in Net Assets | September 30, 2018 |
| AQR TM LARGE CAP MOMENTUM STYLE FUND | AQR TM SMALL CAP MOMENTUM STYLE FUND | |||||||||||||||
| FOR THE YEAR ENDED SEPTEMBER 30, 2018 | FOR THE YEAR ENDED SEPTEMBER 30, 2017 | FOR THE YEAR ENDED SEPTEMBER 30, 2018 | FOR THE YEAR ENDED SEPTEMBER 30, 2017 | |||||||||||||
| CHANGES IN SHARES OUTSTANDING: |
| |||||||||||||||
| CLASS I | ||||||||||||||||
Shares outstanding, beginning of period | 4,484,510 | 3,971,690 | 2,509,919 | 2,094,916 | ||||||||||||
Shares sold | 751,698 | 1,220,231 | 524,732 | 650,112 | ||||||||||||
Shares issued on reinvestment of distributions | 34,388 | 55,764 | 8,638 | 14,866 | ||||||||||||
Shares redeemed | (584,530 | ) | (763,175 | ) | (259,400 | ) | (249,975 | ) | ||||||||
Shares outstanding, end of period | 4,686,066 | 4,484,510 | 2,783,889 | 2,509,919 | ||||||||||||
| CLASS N | ||||||||||||||||
Shares outstanding, beginning of period | 440,406 | 9,538 | 170,348 | 9,764 | ||||||||||||
Shares sold | 238,388 | 458,095 | 127,061 | 167,850 | ||||||||||||
Shares issued on reinvestment of distributions | 3,142 | 125 | 539 | 54 | ||||||||||||
Shares redeemed | (115,933 | ) | (27,352 | ) | (42,458 | ) | (7,320 | ) | ||||||||
Shares outstanding, end of period | 566,003 | 440,406 | 255,490 | 170,348 | ||||||||||||
| CLASS R6 | ||||||||||||||||
Shares outstanding, beginning of period | 4,353,778 | 4,730,865 | 10,527 | 10,452 | ||||||||||||
Shares sold | 860,572 | 684,733 | — | — | ||||||||||||
Shares issued on reinvestment of distributions | 37,344 | 72,170 | 42 | 81 | ||||||||||||
Shares redeemed | (1,011,291 | ) | (1,133,990 | ) | (454 | ) | (6 | ) | ||||||||
Shares outstanding, end of period | 4,240,403 | 4,353,778 | 10,115 | 10,527 | ||||||||||||
| (a) | As disclosed in Note 14, the AQR Funds adopted amendments to Regulation S-X included in the Securities and Exchange Commission’s Disclosure Update and Simplification rule. Accordingly, the prior year distributions have been revised to conform to current period presentation. Please refer to Note 5 to review the character of each respective Funds’ distributable earnings for the year ended September 30, 2017, which was previously reported in the Statement of Changes of Net Assets prior to the adoption of the Disclosure Update and Simplification rule. |
| The accompanying notes are an integral part of these financial statements. |
| AQR Funds | Annual Report | September 2018 | ||||||||||||||
238
Table of Contents
| Statements of Changes in Net Assets | September 30, 2018 |
| AQR TM INTERNATIONAL MOMENTUM STYLE FUND | AQR LARGE CAP DEFENSIVE STYLE FUND | |||||||||||||||
| FOR THE YEAR ENDED SEPTEMBER 30, 2018 | FOR THE YEAR ENDED SEPTEMBER 30, 2017 | FOR THE YEAR ENDED SEPTEMBER 30, 2018 | FOR THE YEAR ENDED SEPTEMBER 30, 2017 | |||||||||||||
| OPERATIONS: | ||||||||||||||||
Net investment income (loss) | $ | 2,308,085 | $ | 1,967,026 | $ | 22,477,406 | $ | 16,836,566 | ||||||||
Net realized gain (loss) | (46,077 | ) | (50,751 | ) | 11,562,453 | 10,732,066 | ||||||||||
Net change in unrealized appreciation (depreciation) | 772,434 | 9,894,957 | 227,431,616 | 138,976,696 | ||||||||||||
Net increase (decrease) in net assets resulting from operations | 3,034,442 | 11,811,232 | 261,471,475 | 166,545,328 | ||||||||||||
| DISTRIBUTIONS TO SHAREHOLDERS(a): |
| |||||||||||||||
Class I | (797,114 | ) | (685,240 | ) | (18,654,170 | ) | (10,646,267 | ) | ||||||||
Class N | (85,403 | ) | (3,572 | ) | (5,492,715 | ) | (3,989,741 | ) | ||||||||
Class R6 | (1,116,578 | ) | (1,215,630 | ) | (6,324,648 | ) | (2,736,853 | ) | ||||||||
Total distributions | (1,999,095 | ) | (1,904,442 | ) | (30,471,533 | ) | (17,372,861 | ) | ||||||||
| CAPITAL TRANSACTIONS: |
| |||||||||||||||
| CLASS I | ||||||||||||||||
Proceeds from shares sold | 19,357,361 | 18,560,003 | 810,293,817 | 326,890,251 | ||||||||||||
Reinvestment of distributions | 797,114 | 685,240 | 18,133,691 | 10,296,185 | ||||||||||||
Cost of shares redeemed | (6,113,073 | ) | (13,430,020 | ) | (267,178,907 | ) | (155,458,852 | ) | ||||||||
Net increase (decrease) from capital transactions | 14,041,402 | 5,815,223 | 561,248,601 | 181,727,584 | ||||||||||||
| CLASS N | ||||||||||||||||
Proceeds from shares sold | 3,893,025 | 4,746,198 | 186,299,595 | 101,293,568 | ||||||||||||
Reinvestment of distributions | 85,403 | 3,572 | 5,487,991 | 3,988,957 | ||||||||||||
Cost of shares redeemed | (979,905 | ) | (271,772 | ) | (162,802,126 | ) | (126,268,724 | ) | ||||||||
Net increase (decrease) from capital transactions | 2,998,523 | 4,477,998 | 28,985,460 | (20,986,199 | ) | |||||||||||
| CLASS R6 | ||||||||||||||||
Proceeds from shares sold | 12,953,829 | 10,548,840 | 149,983,329 | 66,260,633 | ||||||||||||
Reinvestment of distributions | 1,114,827 | 1,215,630 | 6,238,950 | 2,735,594 | ||||||||||||
Cost of shares redeemed | (8,789,957 | ) | (15,985,275 | ) | (87,148,011 | ) | (21,617,756 | ) | ||||||||
Net increase (decrease) from capital transactions | 5,278,699 | (4,220,805 | ) | 69,074,268 | 47,378,471 | |||||||||||
| Net increase (decrease) in net assets resulting from capital transactions | 22,318,624 | 6,072,416 | 659,308,329 | 208,119,856 | ||||||||||||
| Total increase (decrease) in net assets | 23,353,971 | 15,979,206 | 890,308,271 | 357,292,323 | ||||||||||||
| NET ASSETS: | ||||||||||||||||
Beginning of period | 105,765,496 | 89,786,290 | 1,230,607,084 | 873,314,761 | ||||||||||||
End of period | $ | 129,119,467 | $ | 105,765,496 | $ | 2,120,915,355 | $ | 1,230,607,084 | ||||||||
| The accompanying notes are an integral part of these financial statements. | (continued on p. 240) |
| AQR Funds | Annual Report | September 2018 | ||||||||||||||
239
Table of Contents
| Statements of Changes in Net Assets | September 30, 2018 |
| AQR TM INTERNATIONAL MOMENTUM STYLE FUND | AQR LARGE CAP DEFENSIVE STYLE FUND | |||||||||||||||
| FOR THE YEAR ENDED SEPTEMBER 30, 2018 | FOR THE YEAR ENDED SEPTEMBER 30, 2017 | FOR THE YEAR ENDED SEPTEMBER 30, 2018 | FOR THE YEAR ENDED SEPTEMBER 30, 2017 | |||||||||||||
| CHANGES IN SHARES OUTSTANDING: |
| |||||||||||||||
| CLASS I | ||||||||||||||||
Shares outstanding, beginning of period | 3,220,835 | 2,762,443 | 43,542,452 | 33,090,713 | ||||||||||||
Shares sold | 1,378,829 | 1,550,374 | 40,283,448 | 19,100,641 | ||||||||||||
Shares issued on reinvestment of distributions | 57,512 | 60,856 | 947,919 | 637,535 | ||||||||||||
Shares redeemed | (435,944 | ) | (1,152,838 | ) | (13,828,860 | ) | (9,286,437 | ) | ||||||||
Shares outstanding, end of period | 4,221,232 | 3,220,835 | 70,944,959 | 43,542,452 | ||||||||||||
| CLASS N | ||||||||||||||||
Shares outstanding, beginning of period | 352,156 | 13,105 | 13,152,323 | 14,418,150 | ||||||||||||
Shares sold | 279,751 | 359,329 | 9,463,472 | 5,985,115 | ||||||||||||
Shares issued on reinvestment of distributions | 6,193 | 318 | 287,329 | 247,147 | ||||||||||||
Shares redeemed | (70,201 | ) | (20,596 | ) | (8,252,112 | ) | (7,498,089 | ) | ||||||||
Shares outstanding, end of period | 567,899 | 352,156 | 14,651,012 | 13,152,323 | ||||||||||||
| CLASS R6 | ||||||||||||||||
Shares outstanding, beginning of period | 4,159,523 | 4,552,606 | 10,858,002 | 8,114,231 | ||||||||||||
Shares sold | 925,199 | 856,159 | 7,774,083 | 3,882,814 | ||||||||||||
Shares issued on reinvestment of distributions | 80,668 | 108,249 | 326,818 | 169,702 | ||||||||||||
Shares redeemed | (625,522 | ) | (1,357,491 | ) | (4,339,926 | ) | (1,308,745 | ) | ||||||||
Shares outstanding, end of period | 4,539,868 | 4,159,523 | 14,618,977 | 10,858,002 | ||||||||||||
| (a) | As disclosed in Note 14, the AQR Funds adopted amendments to Regulation S-X included in the Securities and Exchange Commission’s Disclosure Update and Simplification rule. Accordingly, the prior year distributions have been revised to conform to current period presentation. Please refer to Note 5 to review the character of each respective Funds’ distributable earnings for the year ended September 30, 2017, which was previously reported in the Statement of Changes of Net Assets prior to the adoption of the Disclosure Update and Simplification rule. |
| The accompanying notes are an integral part of these financial statements. |
| AQR Funds | Annual Report | September 2018 | ||||||||||||||
240
Table of Contents
| Statements of Changes in Net Assets | September 30, 2018 |
| AQR INTERNATIONAL DEFENSIVE STYLE FUND | AQR EMERGING DEFENSIVE STYLE FUND | |||||||||||||||
| FOR THE YEAR ENDED SEPTEMBER 30, 2018 | FOR THE YEAR ENDED SEPTEMBER 30, 2017 | FOR THE YEAR ENDED SEPTEMBER 30, 2018 | FOR THE YEAR ENDED SEPTEMBER 30, 2017 | |||||||||||||
| OPERATIONS: | ||||||||||||||||
Net investment income (loss) | $ | 4,695,024 | $ | 3,846,795 | $ | 1,521,046 | $ | 1,143,552 | ||||||||
Net realized gain (loss) | 18,479 | 432,068 | (442,833 | ) | (871,477 | ) | ||||||||||
Net change in unrealized appreciation (depreciation) | 1,444,405 | 14,750,315 | 1,090,686 | 5,963,387 | ||||||||||||
Net increase (decrease) in net assets resulting from operations | 6,157,908 | 19,029,178 | 2,168,899 | 6,235,462 | ||||||||||||
| DISTRIBUTIONS TO SHAREHOLDERS(a): |
| |||||||||||||||
Class I | (3,331,251 | ) | (1,376,647 | ) | (1,062,921 | ) | (775,009 | ) | ||||||||
Class N | (496,071 | ) | (325,467 | ) | (73,559 | ) | (2,256 | ) | ||||||||
Class R6 | (542,164 | ) | (216,668 | ) | (3,683 | ) | (3,159 | ) | ||||||||
Total distributions | (4,369,486 | ) | (1,918,782 | ) | (1,140,163 | ) | (780,424 | ) | ||||||||
| CAPITAL TRANSACTIONS: |
| |||||||||||||||
| CLASS I | ||||||||||||||||
Proceeds from shares sold | 55,344,839 | 59,917,668 | 19,640,073 | 20,433,053 | ||||||||||||
Reinvestment of distributions | 3,331,251 | 1,376,647 | 1,062,921 | 774,826 | ||||||||||||
Cost of shares redeemed | (30,897,704 | ) | (24,967,749 | ) | (7,485,865 | ) | (13,445,045 | ) | ||||||||
Net increase (decrease) from capital transactions | 27,778,386 | 36,326,566 | 13,217,129 | 7,762,834 | ||||||||||||
| CLASS N | ||||||||||||||||
Proceeds from shares sold | 1,017,221 | 17,910,739 | 6,009,703 | 4,546,034 | ||||||||||||
Reinvestment of distributions | 496,071 | 325,467 | 73,559 | 2,256 | ||||||||||||
Cost of shares redeemed | (27,897,011 | ) | (12,515,245 | ) | (1,037,741 | ) | (387,794 | ) | ||||||||
Net increase (decrease) from capital transactions | (26,383,719 | ) | 5,720,961 | 5,045,521 | 4,160,496 | |||||||||||
| CLASS R6 | ||||||||||||||||
Proceeds from shares sold | 12,207,346 | 7,431,980 | — | — | ||||||||||||
Reinvestment of distributions | 542,164 | 216,668 | 3,683 | 3,159 | ||||||||||||
Cost of shares redeemed | (3,902,657 | ) | (4,545,300 | ) | (19,572 | ) | — | |||||||||
Net increase (decrease) from capital transactions | 8,846,853 | 3,103,348 | (15,889 | ) | 3,159 | |||||||||||
| Net increase (decrease) in net assets resulting from capital transactions | 10,241,520 | 45,150,875 | 18,246,761 | 11,926,489 | ||||||||||||
| Total increase (decrease) in net assets | 12,029,942 | 62,261,271 | 19,275,497 | 17,381,527 | ||||||||||||
| NET ASSETS: | ||||||||||||||||
Beginning of period | 194,908,643 | 132,647,372 | 67,390,649 | 50,009,122 | ||||||||||||
End of period | $ | 206,938,585 | $ | 194,908,643 | $ | 86,666,146 | $ | 67,390,649 | ||||||||
| The accompanying notes are an integral part of these financial statements. | (continued on p. 242) |
| AQR Funds | Annual Report | September 2018 | ||||||||||||||
241
Table of Contents
| Statements of Changes in Net Assets | September 30, 2018 |
| AQR INTERNATIONAL DEFENSIVE STYLE FUND | AQR EMERGING DEFENSIVE STYLE FUND | |||||||||||||||
| FOR THE YEAR ENDED SEPTEMBER 30, 2018 | FOR THE YEAR ENDED SEPTEMBER 30, 2017 | FOR THE YEAR ENDED SEPTEMBER 30, 2018 | FOR THE YEAR ENDED SEPTEMBER 30, 2017 | |||||||||||||
| CHANGES IN SHARES OUTSTANDING: |
| |||||||||||||||
| CLASS I | ||||||||||||||||
Shares outstanding, beginning of period | 10,933,855 | 8,004,942 | 6,592,892 | 5,639,656 | ||||||||||||
Shares sold | 4,112,394 | 4,874,827 | 1,993,757 | 2,394,166 | ||||||||||||
Shares issued on reinvestment of distributions | 250,470 | 122,805 | 108,683 | 98,079 | ||||||||||||
Shares redeemed | (2,300,209 | ) | (2,068,719 | ) | (757,344 | ) | (1,539,009 | ) | ||||||||
Shares outstanding, end of period | 12,996,510 | 10,933,855 | 7,937,988 | 6,592,892 | ||||||||||||
| CLASS N | ||||||||||||||||
Shares outstanding, beginning of period | 2,216,623 | 1,704,809 | 509,044 | 22,961 | ||||||||||||
Shares sold | 74,336 | 1,474,453 | 599,651 | 527,245 | ||||||||||||
Shares issued on reinvestment of distributions | 36,342 | 28,326 | 7,341 | 279 | ||||||||||||
Shares redeemed | (2,016,203 | ) | (990,965 | ) | (104,187 | ) | (41,441 | ) | ||||||||
Shares outstanding, end of period | 311,098 | 2,216,623 | 1,011,849 | 509,044 | ||||||||||||
| CLASS R6 | ||||||||||||||||
Shares outstanding, beginning of period | 1,486,721 | 1,213,597 | 22,106 | 21,705 | ||||||||||||
Shares sold | 910,345 | 619,312 | — | — | ||||||||||||
Shares issued on reinvestment of distributions | 40,826 | 19,363 | 378 | 401 | ||||||||||||
Shares redeemed | (289,042 | ) | (365,551 | ) | (1,913 | ) | — | |||||||||
Shares outstanding, end of period | 2,148,850 | 1,486,721 | 20,571 | 22,106 | ||||||||||||
| (a) | As disclosed in Note 14, the AQR Funds adopted amendments to Regulation S-X included in the Securities and Exchange Commission’s Disclosure Update and Simplification rule. Accordingly, the prior year distributions have been revised to conform to current period presentation. Please refer to Note 5 to review the character of each respective Funds’ distributable earnings for the year ended September 30, 2017, which was previously reported in the Statement of Changes of Net Assets prior to the adoption of the Disclosure Update and Simplification rule. |
| The accompanying notes are an integral part of these financial statements. |
| AQR Funds | Annual Report | September 2018 | ||||||||||||||
242
Table of Contents
| Statements of Changes in Net Assets | September 30, 2018 |
| AQR GLOBAL EQUITY FUND | AQR INTERNATIONAL EQUITY FUND | |||||||||||||||
| FOR THE YEAR ENDED SEPTEMBER 30, 2018 | FOR THE YEAR ENDED SEPTEMBER 30, 2017 | FOR THE YEAR ENDED SEPTEMBER 30, 2018 | FOR THE YEAR ENDED SEPTEMBER 30, 2017 | |||||||||||||
| OPERATIONS: | ||||||||||||||||
Net investment income (loss) | $ | 4,670,399 | $ | 2,290,063 | $ | 8,703,205 | $ | 7,839,516 | ||||||||
Net realized gain (loss) | (183,515 | ) | 11,600,253 | 2,903,816 | 27,108,617 | |||||||||||
Net change in unrealized appreciation (depreciation) | 13,990,609 | 16,779,337 | (18,998,017 | ) | 40,336,968 | |||||||||||
Net increase (decrease) in net assets resulting from operations | 18,477,493 | 30,669,653 | (7,390,996 | ) | 75,285,101 | |||||||||||
| DISTRIBUTIONS TO SHAREHOLDERS(a): |
| |||||||||||||||
Class I | (5,971,499 | ) | (2,836,396 | ) | (32,028,888 | ) | (15,797,705 | ) | ||||||||
Class N | (93,517 | ) | (135,011 | ) | (1,432,451 | ) | (1,458,842 | ) | ||||||||
Class R6 | (8,440,765 | ) | (10,323,682 | ) | (3,935,384 | ) | (671,372 | ) | ||||||||
Total distributions | (14,505,781 | ) | (13,295,089 | ) | (37,396,723 | ) | (17,927,919 | ) | ||||||||
| CAPITAL TRANSACTIONS: |
| |||||||||||||||
| CLASS I | ||||||||||||||||
Proceeds from shares sold | 189,043,769 | 12,128,871 | 150,167,056 | 84,815,575 | ||||||||||||
Reinvestment of distributions | 5,948,575 | 2,835,116 | 29,711,153 | 14,138,963 | ||||||||||||
Cost of shares redeemed | (37,557,817 | ) | (10,315,994 | ) | (95,825,332 | ) | (171,249,833 | ) | ||||||||
Net increase (decrease) from capital transactions | 157,434,527 | 4,647,993 | 84,052,877 | (72,295,295 | ) | |||||||||||
| CLASS N | ||||||||||||||||
Proceeds from shares sold | 1,143,324 | 1,153,074 | 13,150,275 | 9,270,889 | ||||||||||||
Reinvestment of distributions | 93,517 | 135,011 | 1,312,338 | 1,335,280 | ||||||||||||
Cost of shares redeemed | (1,421,316 | ) | (939,549 | ) | (14,711,432 | ) | (37,068,943 | ) | ||||||||
Net increase (decrease) from capital transactions | (184,475 | ) | 348,536 | (248,819 | ) | (26,462,774 | ) | |||||||||
| CLASS R6 | ||||||||||||||||
Proceeds from shares sold | 28,557,257 | 16,049,836 | 12,877,931 | 26,475,529 | ||||||||||||
Reinvestment of distributions | 8,440,765 | 10,323,682 | 3,935,384 | 671,372 | ||||||||||||
Cost of shares redeemed | (13,692,590 | ) | (70,541 | ) | (11,544,367 | ) | (2,904,530 | ) | ||||||||
Net increase (decrease) from capital transactions | 23,305,432 | 26,302,977 | 5,268,948 | 24,242,371 | ||||||||||||
| Net increase (decrease) in net assets resulting from capital transactions | 180,555,484 | 31,299,506 | 89,073,006 | (74,515,698 | ) | |||||||||||
| Total increase (decrease) in net assets | 184,527,196 | 48,674,070 | 44,285,287 | (17,158,516 | ) | |||||||||||
| NET ASSETS: | ||||||||||||||||
Beginning of period | 189,972,260 | 141,298,190 | 405,055,552 | 422,214,068 | ||||||||||||
End of period | $ | 374,499,456 | $ | 189,972,260 | $ | 449,340,839 | $ | 405,055,552 | ||||||||
| The accompanying notes are an integral part of these financial statements. | (continued on p. 244) |
| AQR Funds | Annual Report | September 2018 | ||||||||||||||
243
Table of Contents
| Statements of Changes in Net Assets | September 30, 2018 |
| AQR GLOBAL EQUITY FUND | AQR INTERNATIONAL EQUITY FUND | |||||||||||||||
| FOR THE YEAR ENDED SEPTEMBER 30, 2018 | FOR THE YEAR ENDED SEPTEMBER 30, 2017 | FOR THE YEAR ENDED SEPTEMBER 30, 2018 | FOR THE YEAR ENDED SEPTEMBER 30, 2017 | |||||||||||||
| CHANGES IN SHARES OUTSTANDING: |
| |||||||||||||||
| CLASS I | ||||||||||||||||
Shares outstanding, beginning of period | 4,671,412 | 4,067,125 | 29,670,936 | 36,446,082 | ||||||||||||
Shares sold | 20,630,784 | 1,502,926 | 13,619,612 | 8,011,359 | ||||||||||||
Shares issued on reinvestment of distributions | 667,629 | 376,010 | 2,728,297 | 1,482,072 | ||||||||||||
Shares redeemed | (4,136,053 | ) | (1,274,649 | ) | (8,704,172 | ) | (16,268,577 | ) | ||||||||
Shares outstanding, end of period | 21,833,772 | 4,671,412 | 37,314,673 | 29,670,936 | ||||||||||||
| CLASS N | ||||||||||||||||
Shares outstanding, beginning of period | 255,046 | 212,001 | 1,251,644 | 3,604,797 | ||||||||||||
Shares sold | 126,366 | 141,204 | 1,137,530 | 875,834 | ||||||||||||
Shares issued on reinvestment of distributions | 10,531 | 17,978 | 117,593 | 137,092 | ||||||||||||
Shares redeemed | (157,776 | ) | (116,137 | ) | (1,287,549 | ) | (3,366,079 | ) | ||||||||
Shares outstanding, end of period | 234,167 | 255,046 | 1,219,218 | 1,251,644 | ||||||||||||
| CLASS R6 | ||||||||||||||||
Shares outstanding, beginning of period | 16,309,218 | 13,023,243 | 3,560,850 | 1,335,884 | ||||||||||||
Shares sold | 3,120,635 | 1,934,027 | 1,083,990 | 2,411,991 | ||||||||||||
Shares issued on reinvestment of distributions | 939,952 | 1,360,169 | 338,673 | 66,341 | ||||||||||||
Shares redeemed | (1,501,128 | ) | (8,221 | ) | (989,790 | ) | (253,366 | ) | ||||||||
Shares outstanding, end of period | 18,868,677 | 16,309,218 | 3,993,723 | 3,560,850 | ||||||||||||
| (a) | As disclosed in Note 14, the AQR Funds adopted amendments to Regulation S-X included in the Securities and Exchange Commission’s Disclosure Update and Simplification rule. Accordingly, the prior year distributions have been revised to conform to current period presentation. Please refer to Note 5 to review the character of each respective Funds’ distributable earnings for the year ended September 30, 2017, which was previously reported in the Statement of Changes of Net Assets prior to the adoption of the Disclosure Update and Simplification rule. |
| The accompanying notes are an integral part of these financial statements. |
| AQR Funds | Annual Report | September 2018 | ||||||||||||||
244
Table of Contents
| Statements of Changes in Net Assets | September 30, 2018 |
| AQR LARGE CAP RELAXED CONSTRAINT EQUITY FUND | AQR SMALL CAP RELAXED CONSTRAINT EQUITY FUND | |||||||||||||||
| FOR THE YEAR ENDED SEPTEMBER 30, 2018 | FOR THE PERIOD 12/14/16*- 9/30/17 | FOR THE YEAR ENDED SEPTEMBER 30, 2018 | FOR THE PERIOD 12/14/16*- 9/30/17 | |||||||||||||
| OPERATIONS: | ||||||||||||||||
Net investment income (loss) | $ | 153,170 | $ | 69,027 | $ | (19,579 | ) | $ | (2,677 | ) | ||||||
Net realized gain (loss) | (448,914 | ) | (39,665 | ) | (235,992 | ) | (130,457 | ) | ||||||||
Net change in unrealized appreciation (depreciation) | 2,307,841 | 1,198,320 | 354,742 | 244,232 | ||||||||||||
Net increase (decrease) in net assets resulting from operations | 2,012,097 | 1,227,682 | 99,171 | 111,098 | ||||||||||||
| DISTRIBUTIONS TO SHAREHOLDERS: |
| |||||||||||||||
| Distributable earnings: | ||||||||||||||||
Class I | (133,818 | ) | — | (12,632 | ) | — | ||||||||||
Class N | (2,636 | ) | — | (3,898 | ) | — | ||||||||||
Class R6 | (19,501 | ) | — | (13,750 | ) | — | ||||||||||
Total | (155,955 | ) | — | (30,280 | ) | — | ||||||||||
| Return of capital: |
| |||||||||||||||
Class I | — | — | (1,266 | ) | — | |||||||||||
Class N | — | — | (500 | ) | — | |||||||||||
Class R6 | — | — | (1,160 | ) | — | |||||||||||
Total | — | — | (2,926 | ) | — | |||||||||||
Total distributions | (155,955 | ) | — | (33,206 | ) | — | ||||||||||
| CAPITAL TRANSACTIONS: |
| |||||||||||||||
| CLASS I | ||||||||||||||||
Proceeds from shares sold | 5,959,715 | 12,983,234 | 714,894 | 1,490,338 | ||||||||||||
Reinvestment of distributions | 133,818 | — | 13,898 | — | ||||||||||||
Cost of shares redeemed | (4,690,532 | ) | (286,671 | ) | (737,762 | ) | (189,170 | ) | ||||||||
Net increase (decrease) from capital transactions | 1,403,001 | 12,696,563 | (8,970 | ) | 1,301,168 | |||||||||||
| CLASS N | ||||||||||||||||
Proceeds from shares sold | 146,602 | 1,186,574 | 208 | 652,860 | ||||||||||||
Reinvestment of distributions | 2,636 | — | 4,398 | — | ||||||||||||
Cost of shares redeemed | (473,515 | ) | (302,831 | ) | (8,008 | ) | (92,255 | ) | ||||||||
Net increase (decrease) from capital transactions | (324,277 | ) | 883,743 | (3,402 | ) | 560,605 | ||||||||||
| CLASS R6 | ||||||||||||||||
Proceeds from shares sold | — | 1,754,717 | 20,000 | 1,291,979 | ||||||||||||
Reinvestment of distributions | 19,501 | — | 14,910 | — | ||||||||||||
Cost of shares redeemed | (372,902 | ) | — | (56,998 | ) | — | ||||||||||
Net increase (decrease) from capital transactions | (353,401 | ) | 1,754,717 | (22,088 | ) | 1,291,979 | ||||||||||
| Net increase (decrease) in net assets resulting from capital transactions | 725,323 | 15,335,023 | (34,460 | ) | 3,153,752 | |||||||||||
| Total increase (decrease) in net assets | 2,581,465 | 16,562,705 | 31,505 | 3,264,850 | ||||||||||||
| NET ASSETS: | ||||||||||||||||
Beginning of period | 16,562,705 | — | 3,264,850 | — | ||||||||||||
End of period | $ | 19,144,170 | $ | 16,562,705 | $ | 3,296,355 | $ | 3,264,850 | ||||||||
| The accompanying notes are an integral part of these financial statements. | (continued on p. 246) |
| AQR Funds | Annual Report | September 2018 | ||||||||||||||
245
Table of Contents
| Statements of Changes in Net Assets | September 30, 2018 |
| AQR LARGE CAP RELAXED CONSTRAINT EQUITY FUND | AQR SMALL CAP RELAXED CONSTRAINT EQUITY FUND | |||||||||||||||
| FOR THE YEAR ENDED SEPTEMBER 30, 2018 | FOR THE PERIOD 12/14/16*- 9/30/17 | FOR THE YEAR ENDED SEPTEMBER 30, 2018 | FOR THE PERIOD 12/14/16*- 9/30/17 | |||||||||||||
| CHANGES IN SHARES OUTSTANDING: |
| |||||||||||||||
| CLASS I | ||||||||||||||||
Shares outstanding, beginning of period | 1,201,816 | — | 130,756 | — | ||||||||||||
Shares sold | 496,007 | 1,228,307 | 69,373 | 150,276 | ||||||||||||
Shares issued on reinvestment of distributions | 11,096 | — | 1,323 | — | ||||||||||||
Shares redeemed | (388,424 | ) | (26,491 | ) | (70,956 | ) | (19,520 | ) | ||||||||
Shares outstanding, end of period | 1,320,495 | 1,201,816 | 130,496 | 130,756 | ||||||||||||
| CLASS N | ||||||||||||||||
Shares outstanding, beginning of period | 90,163 | — | 55,789 | — | ||||||||||||
Shares sold | 11,944 | 118,572 | 19 | 65,305 | ||||||||||||
Shares issued on reinvestment of distributions | 218 | — | 419 | — | ||||||||||||
Shares redeemed | (40,685 | ) | (28,409 | ) | (753 | ) | (9,516 | ) | ||||||||
Shares outstanding, end of period | 61,640 | 90,163 | 55,474 | 55,789 | ||||||||||||
| CLASS R6 | ||||||||||||||||
Shares outstanding, beginning of period | 174,492 | — | 129,090 | — | ||||||||||||
Shares sold | — | 174,492 | 1,907 | 129,090 | ||||||||||||
Shares issued on reinvestment of distributions | 1,616 | — | 1,420 | — | ||||||||||||
Shares redeemed | (31,489 | ) | — | (5,727 | ) | — | ||||||||||
Shares outstanding, end of period | 144,619 | 174,492 | 126,690 | 129,090 | ||||||||||||
| * | Commencement of operations. |
| The accompanying notes are an integral part of these financial statements. |
| AQR Funds | Annual Report | September 2018 | ||||||||||||||
246
Table of Contents
| Statements of Changes in Net Assets | September 30, 2018 |
| AQR INTERNATIONAL RELAXED CONSTRAINT EQUITY FUND | AQR EMERGING RELAXED CONSTRAINT EQUITY FUND | |||||||||||||||
| FOR THE YEAR ENDED SEPTEMBER 30, 2018 | FOR THE PERIOD 12/14/16*- 9/30/17 | FOR THE YEAR ENDED SEPTEMBER 30, 2018 | FOR THE PERIOD 12/14/16*- 9/30/17 | |||||||||||||
| OPERATIONS: | ||||||||||||||||
Net investment income (loss) | $ | 1,295,926 | $ | 123,723 | $ | 414,395 | $ | 43,615 | ||||||||
Net realized gain (loss) | (3,361,857 | ) | 43,434 | (3,254,355 | ) | 72,887 | ||||||||||
Net change in unrealized appreciation (depreciation) | (2,523,719 | ) | 1,387,106 | (1,513,596 | ) | 804,369 | ||||||||||
Net increase (decrease) in net assets resulting from operations | (4,589,650 | ) | 1,554,263 | (4,353,556 | ) | 920,871 | ||||||||||
| DISTRIBUTIONS TO SHAREHOLDERS: |
| |||||||||||||||
Class I | (179,771 | ) | — | (84,119 | ) | — | ||||||||||
Class N | (62,248 | ) | — | (19,157 | ) | — | ||||||||||
Class R6 | (22,470 | ) | — | (241,766 | ) | — | ||||||||||
Total distributions | (264,489 | ) | — | (345,042 | ) | — | ||||||||||
| CAPITAL TRANSACTIONS: |
| |||||||||||||||
| CLASS I | ||||||||||||||||
Proceeds from shares sold | 59,836,354 | 6,484,383 | 23,216,965 | 4,817,453 | ||||||||||||
Reinvestment of distributions | 179,771 | — | 82,736 | — | ||||||||||||
Cost of shares redeemed | (8,145,103 | ) | (76,732 | ) | (4,717,912 | ) | (69,013 | ) | ||||||||
Net increase (decrease) from capital transactions | 51,871,022 | 6,407,651 | 18,581,789 | 4,748,440 | ||||||||||||
| CLASS N | ||||||||||||||||
Proceeds from shares sold | 13,627,325 | 1,816,453 | 11,184,219 | 1,797,659 | ||||||||||||
Reinvestment of distributions | 62,248 | — | 19,157 | — | ||||||||||||
Cost of shares redeemed | (1,377,377 | ) | (99,652 | ) | (1,399,406 | ) | (114,361 | ) | ||||||||
Net increase (decrease) from capital transactions | 12,312,196 | 1,716,801 | 9,803,970 | 1,683,298 | ||||||||||||
| CLASS R6 | ||||||||||||||||
Proceeds from shares sold | 1,012,141 | 2,099,000 | 511,840 | 17,599,000 | ||||||||||||
Reinvestment of distributions | 22,470 | — | 241,766 | — | ||||||||||||
Cost of shares redeemed | (1,560,366 | ) | — | (12,023,206 | ) | — | ||||||||||
Net increase (decrease) from capital transactions | (525,755 | ) | 2,099,000 | (11,269,600 | ) | 17,599,000 | ||||||||||
| Net increase (decrease) in net assets resulting from capital transactions | 63,657,463 | 10,223,452 | 17,116,159 | 24,030,738 | ||||||||||||
| Total increase (decrease) in net assets | 58,803,324 | 11,777,715 | 12,417,561 | 24,951,609 | ||||||||||||
| NET ASSETS: | ||||||||||||||||
Beginning of period | 11,777,715 | — | 24,951,609 | — | ||||||||||||
End of period | $ | 70,581,039 | $ | 11,777,715 | $ | 37,369,170 | $ | 24,951,609 | ||||||||
| The accompanying notes are an integral part of these financial statements. | (continued on p. 248) |
| AQR Funds | Annual Report | September 2018 | ||||||||||||||
247
Table of Contents
| Statements of Changes in Net Assets | September 30, 2018 |
| AQR INTERNATIONAL RELAXED CONSTRAINT EQUITY FUND | AQR EMERGING RELAXED CONSTRAINT EQUITY FUND | |||||||||||||||
| FOR THE YEAR ENDED SEPTEMBER 30, 2018 | FOR THE PERIOD 12/14/16*- 9/30/17 | FOR THE YEAR ENDED SEPTEMBER 30, 2018 | FOR THE PERIOD 12/14/16*- 9/30/17 | |||||||||||||
| CHANGES IN SHARES OUTSTANDING: |
| |||||||||||||||
| CLASS I | ||||||||||||||||
Shares outstanding, beginning of period | 559,080 | — | 406,006 | — | ||||||||||||
Shares sold | 4,587,751 | 565,347 | 1,651,223 | 411,586 | ||||||||||||
Shares issued on reinvestment of distributions | 13,957 | — | 6,249 | — | ||||||||||||
Shares redeemed | (648,491 | ) | (6,267 | ) | (360,296 | ) | (5,580 | ) | ||||||||
Shares outstanding, end of period | 4,512,297 | 559,080 | 1,703,182 | 406,006 | ||||||||||||
| CLASS N | ||||||||||||||||
Shares outstanding, beginning of period | 156,150 | — | 154,227 | — | ||||||||||||
Shares sold | 1,051,980 | 164,254 | 791,443 | 163,536 | ||||||||||||
Shares issued on reinvestment of distributions | 4,844 | — | 1,448 | — | ||||||||||||
Shares redeemed | (108,472 | ) | (8,104 | ) | (105,225 | ) | (9,309 | ) | ||||||||
Shares outstanding, end of period | 1,104,502 | 156,150 | 841,893 | 154,227 | ||||||||||||
| CLASS R6 | ||||||||||||||||
Shares outstanding, beginning of period | 207,857 | — | 1,405,781 | — | ||||||||||||
Shares sold | 78,149 | 207,857 | 37,048 | 1,405,781 | ||||||||||||
Shares issued on reinvestment of distributions | 1,745 | — | 18,260 | — | ||||||||||||
Shares redeemed | (124,854 | ) | — | (982,517 | ) | — | ||||||||||
Shares outstanding, end of period | 162,897 | 207,857 | 478,572 | 1,405,781 | ||||||||||||
| * | Commencement of operations. |
| The accompanying notes are an integral part of these financial statements. |
| AQR Funds | Annual Report | September 2018 | ||||||||||||||
248
Table of Contents
| Statements of Cash Flows | September 30, 2018 |
| AQR LARGE CAP RELAXED CONSTRAINT EQUITY FUND | AQR SMALL CAP RELAXED CONSTRAINT EQUITY FUND | AQR INTERNATIONAL RELAXED CONSTRAINT EQUITY FUND | ||||||||||
| CASH FLOWS FROM OPERATING ACTIVITIES: | ||||||||||||
Net increase (decrease) in net assets resulting from operations | $ | 2,012,097 | $ | 99,171 | $ | (4,589,650 | ) | |||||
| Adjustments to reconcile net increase (decrease) in net assets resulting from operations to net cash provided by (used in) operating activities: | ||||||||||||
Payments to purchase securities | (20,082,755 | ) | (4,308,876 | ) | (118,717,031 | ) | ||||||
Payments to cover short positions in securities | (7,247,513 | ) | (1,541,688 | ) | (15,675,225 | ) | ||||||
Proceeds from short positions in securities | 7,160,131 | 1,374,128 | 33,246,197 | |||||||||
Proceeds from sale of securities | 19,538,872 | 4,568,109 | 39,117,745 | |||||||||
(Purchases) sales of short-term investments, net | 77,171 | (26,196 | ) | (1,717,796 | ) | |||||||
Realized (gain) loss on investments in securities | (413,025 | ) | (49,220 | ) | 2,860,422 | |||||||
Realized (gain) loss on short positions in securities | 861,939 | 285,212 | 471,196 | |||||||||
Change in unrealized (appreciation) depreciation on investments in securities | (2,288,723 | ) | (320,766 | ) | 3,395,430 | |||||||
Change in unrealized (appreciation) depreciation on short positions in securities | (19,118 | ) | (33,976 | ) | (858,547 | ) | ||||||
| (Increases) decreases in operating assets | ||||||||||||
Deposits with brokers for futures contracts | — | — | (75,024 | ) | ||||||||
Foreign tax reclaim | — | — | (66,434 | ) | ||||||||
Dividends | 5,216 | 163 | (209,778 | ) | ||||||||
Due from Investment Adviser | 1,051 | 3,087 | — | |||||||||
Prepaid expenses | 22,730 | 7,950 | 6,801 | |||||||||
| Increases (decreases) in operating liabilities | ||||||||||||
Variation margin on futures contracts | — | — | 12,364 | |||||||||
Accrued investment advisory fees | 5,549 | — | 20,837 | |||||||||
Accrued distribution fees—Class N | (51 | ) | 8 | 2,319 | ||||||||
Dividends payable on securities sold short | 4,995 | 1,063 | 36,195 | |||||||||
Other accrued expenses and liabilities | 9,101 | 9,501 | 36,700 | |||||||||
Net cash provided by (used in) operating activities | $ | (352,333 | ) | $ | 67,670 | $ | (62,703,279 | ) | ||||
| CASH FLOWS FROM FINANCING ACTIVITIES | ||||||||||||
Proceeds from shares sold | 6,126,282 | 735,102 | 74,134,634 | |||||||||
Payments on shares redeemed | (5,536,949 | ) | (802,768 | ) | (11,032,258 | ) | ||||||
Net cash provided by (used in) financing activities | $ | 589,333 | $ | (67,666 | ) | $ | 63,102,376 | |||||
| Net change in cash and cash denominated in foreign currencies | 237,000 | 4 | 399,097 | |||||||||
Cash, beginning of period | 13,494 | 33 | 59,367 | |||||||||
Cash, end of period** | $ | 250,494 | $ | 37 | $ | 458,464 | ||||||
Supplemental disclosure of cash flow information:
Cash paid during the period for interest in the amount of $39,285, $12,944 and $163,526.
Non-cash financing activities consist of reinvestment of distributions in the amount $155,955, $33,206, and $264,489.
| ** | The following is a reconciliation of cash and cash held in foreign currencies reported within the Statements of Assets and Liabilities that sum to the total of the same such amounts disclosed in the Statements of Cash Flows: |
| FUND | CASH | CASH DENOMINATED IN FOREIGN CURRENCIES | TOTAL CASH AND CASH DENOMINATED IN FOREIGN CURRENCIES | |||||||||
AQR Large Cap Relaxed Constraint Equity Fund | $ | 250,494 | $ | — | $ | 250,494 | ||||||
AQR Small Cap Relaxed Constraint Equity Fund | 37 | — | 37 | |||||||||
AQR International Relaxed Constraint Equity Fund | 90,059 | 368,405 | 458,464 | |||||||||
| The accompanying notes are an integral part of these financial statements. |
| AQR Funds | Annual Report | September 2018 | ||||||||||||||
249
Table of Contents
| Financial Highlights | September 30, 2018 |
| PER SHARE OPERATING PERFORMANCE | ||||||||||||||||||||||||||||
| Change in Net Assets Resulting from Operations1 | Less Dividends and Distributions | |||||||||||||||||||||||||||
| Net Asset Value, Beginning of Period | Net Investment Income (Loss) | Net Realized and Unrealized Gain (Loss) | Net Increase (Decrease) in Net Asset Value from Operations | Distributions from Net Investment Income | Distributions from Net Realized Gains | Total Distributions | ||||||||||||||||||||||
| AQR LARGE CAP MULTI-STYLE FUND CLASS I6 |
| |||||||||||||||||||||||||||
| FOR THE YEAR ENDED SEPTEMBER 30, 2018 | $ | 16.87 | 0.23 | 2.13 | 2.36 | (0.22 | ) | (0.18 | ) | (0.40 | ) | |||||||||||||||||
| FOR THE YEAR ENDED SEPTEMBER 30, 2017 | $ | 14.00 | 0.22 | 2.84 | 3.06 | (0.19 | ) | — | (0.19 | ) | ||||||||||||||||||
| FOR THE YEAR ENDED SEPTEMBER 30, 2016 | $ | 13.25 | 0.19 | 0.68 | 0.87 | (0.12 | ) | (0.00 | )7 | (0.12 | ) | |||||||||||||||||
| FOR THE YEAR ENDED SEPTEMBER 30, 2015 | $ | 13.36 | 0.16 | (0.15 | ) | 0.01 | (0.06 | ) | (0.06 | ) | (0.12 | ) | ||||||||||||||||
| FOR THE YEAR ENDED SEPTEMBER 30, 2014 | $ | 11.09 | 0.15 | 2.21 | 2.36 | (0.04 | ) | (0.05 | ) | (0.09 | ) | |||||||||||||||||
| AQR LARGE CAP MULTI-STYLE FUND CLASS N | ||||||||||||||||||||||||||||
| FOR THE YEAR ENDED SEPTEMBER 30, 2018 | $ | 16.79 | 0.18 | 2.13 | 2.31 | (0.18 | ) | (0.18 | ) | (0.36 | ) | |||||||||||||||||
| FOR THE YEAR ENDED SEPTEMBER 30, 2017 | $ | 13.94 | 0.18 | 2.82 | 3.00 | (0.15 | ) | — | (0.15 | ) | ||||||||||||||||||
| FOR THE YEAR ENDED SEPTEMBER 30, 2016 | $ | 13.19 | 0.16 | 0.68 | 0.84 | (0.09 | ) | (0.00 | )7 | (0.09 | ) | |||||||||||||||||
| FOR THE YEAR ENDED SEPTEMBER 30, 2015 | $ | 13.33 | 0.13 | (0.16 | ) | (0.03 | ) | (0.05 | ) | (0.06 | ) | (0.11 | ) | |||||||||||||||
| FOR THE YEAR ENDED SEPTEMBER 30, 2014 | $ | 11.09 | 0.11 | 2.21 | 2.32 | (0.03 | ) | (0.05 | ) | (0.08 | ) | |||||||||||||||||
| AQR LARGE CAP MULTI-STYLE FUND CLASS R6 | ||||||||||||||||||||||||||||
| FOR THE YEAR ENDED SEPTEMBER 30, 2018 | $ | 16.87 | 0.25 | 2.13 | 2.38 | (0.24 | ) | (0.18 | ) | (0.42 | ) | |||||||||||||||||
| FOR THE YEAR ENDED SEPTEMBER 30, 2017 | $ | 14.00 | 0.24 | 2.84 | 3.08 | (0.21 | ) | — | (0.21 | ) | ||||||||||||||||||
| FOR THE YEAR ENDED SEPTEMBER 30, 2016 | $ | 13.25 | 0.21 | 0.68 | 0.89 | (0.14 | ) | (0.00 | )7 | (0.14 | ) | |||||||||||||||||
| FOR THE YEAR ENDED SEPTEMBER 30, 2015 | $ | 13.36 | 0.18 | (0.17 | ) | 0.01 | (0.06 | ) | (0.06 | ) | (0.12 | ) | ||||||||||||||||
| FOR THE PERIOD 7/10/148—9/30/14 | $ | 13.32 | 0.04 | 0.00 | 7 | 0.04 | — | — | — | |||||||||||||||||||
| AQR SMALL CAP MULTI-STYLE FUND CLASS I6 | ||||||||||||||||||||||||||||
| FOR THE YEAR ENDED SEPTEMBER 30, 2018 | $ | 16.09 | 0.10 | 1.27 | 1.37 | (0.12 | ) | (1.46 | ) | (1.58 | ) | |||||||||||||||||
| FOR THE YEAR ENDED SEPTEMBER 30, 2017 | $ | 13.96 | 0.12 | 9 | 2.39 | 2.51 | (0.14 | ) | (0.24 | ) | (0.38 | ) | ||||||||||||||||
| FOR THE YEAR ENDED SEPTEMBER 30, 2016 | $ | 12.30 | 0.13 | 1.56 | 1.69 | (0.03 | ) | (0.00 | )7 | (0.03 | ) | |||||||||||||||||
| FOR THE YEAR ENDED SEPTEMBER 30, 2015 | $ | 12.34 | 0.12 | 10 | 0.02 | 11 | 0.14 | (0.03 | ) | (0.15 | ) | (0.18 | ) | |||||||||||||||
| FOR THE YEAR ENDED SEPTEMBER 30, 2014 | $ | 11.88 | 0.05 | 12 | 0.57 | 0.62 | (0.04 | ) | (0.12 | ) | (0.16 | ) | ||||||||||||||||
| AQR SMALL CAP MULTI-STYLE FUND CLASS N | ||||||||||||||||||||||||||||
| FOR THE YEAR ENDED SEPTEMBER 30, 2018 | $ | 16.01 | 0.06 | 1.28 | 1.34 | (0.07 | ) | (1.46 | ) | (1.53 | ) | |||||||||||||||||
| FOR THE YEAR ENDED SEPTEMBER 30, 2017 | $ | 13.90 | 0.08 | 9 | 2.37 | 2.45 | (0.10 | ) | (0.24 | ) | (0.34 | ) | ||||||||||||||||
| FOR THE YEAR ENDED SEPTEMBER 30, 2016 | $ | 12.25 | 0.10 | 1.55 | 1.65 | (0.00 | )7 | (0.00 | )7 | (0.00 | )7 | |||||||||||||||||
| FOR THE YEAR ENDED SEPTEMBER 30, 2015 | $ | 12.30 | 0.09 | 10 | 0.01 | 11 | 0.10 | (0.00 | )7 | (0.15 | ) | (0.15 | ) | |||||||||||||||
| FOR THE YEAR ENDED SEPTEMBER 30, 2014 | $ | 11.87 | 0.01 | 12 | 0.56 | 0.57 | (0.02 | ) | (0.12 | ) | (0.14 | ) | ||||||||||||||||
| AQR SMALL CAP MULTI-STYLE FUND CLASS R6 | ||||||||||||||||||||||||||||
| FOR THE YEAR ENDED SEPTEMBER 30, 2018 | $ | 16.11 | 0.11 | 1.29 | 1.40 | (0.14 | ) | (1.46 | ) | (1.60 | ) | |||||||||||||||||
| FOR THE YEAR ENDED SEPTEMBER 30, 2017 | $ | 13.98 | 0.13 | 9 | 2.39 | 2.52 | (0.15 | ) | (0.24 | ) | (0.39 | ) | ||||||||||||||||
| FOR THE YEAR ENDED SEPTEMBER 30, 2016 | $ | 12.31 | 0.16 | 1.55 | 1.71 | (0.04 | ) | (0.00 | )7 | (0.04 | ) | |||||||||||||||||
| FOR THE YEAR ENDED SEPTEMBER 30, 2015 | $ | 12.35 | 0.15 | 10 | 0.00 | 7,11 | 0.15 | (0.04 | ) | (0.15 | ) | (0.19 | ) | |||||||||||||||
| FOR THE PERIOD 7/10/148—9/30/14 | $ | 12.95 | 0.01 | 12 | (0.61 | )11 | (0.60 | ) | — | — | — | |||||||||||||||||
| AQR INTERNATIONAL MULTI-STYLE FUND CLASS I6 | ||||||||||||||||||||||||||||
| FOR THE YEAR ENDED SEPTEMBER 30, 2018 | $ | 11.95 | 0.28 | (0.18 | ) | 0.10 | (0.29 | ) | — | (0.29 | ) | |||||||||||||||||
| FOR THE YEAR ENDED SEPTEMBER 30, 2017 | $ | 10.23 | 0.24 | 1.74 | 1.98 | (0.26 | ) | — | (0.26 | ) | ||||||||||||||||||
| FOR THE YEAR ENDED SEPTEMBER 30, 2016 | $ | 10.21 | 0.26 | (0.09 | ) | 0.17 | (0.15 | ) | — | (0.15 | ) | |||||||||||||||||
| FOR THE YEAR ENDED SEPTEMBER 30, 2015 | $ | 11.47 | 0.27 | 10 | (1.26 | ) | (0.99 | ) | (0.19 | ) | (0.08 | ) | (0.27 | ) | ||||||||||||||
| FOR THE YEAR ENDED SEPTEMBER 30, 2014 | $ | 11.28 | 0.28 | 0.01 | 11 | 0.29 | (0.10 | ) | — | (0.10 | ) | |||||||||||||||||
| AQR INTERNATIONAL MULTI-STYLE FUND CLASS N | ||||||||||||||||||||||||||||
| FOR THE YEAR ENDED SEPTEMBER 30, 2018 | $ | 11.92 | 0.24 | (0.17 | ) | 0.07 | (0.26 | ) | — | (0.26 | ) | |||||||||||||||||
| FOR THE YEAR ENDED SEPTEMBER 30, 2017 | $ | 10.20 | 0.21 | 1.75 | 1.96 | (0.24 | ) | — | (0.24 | ) | ||||||||||||||||||
| FOR THE YEAR ENDED SEPTEMBER 30, 2016 | $ | 10.20 | 0.23 | (0.10 | ) | 0.13 | (0.13 | ) | — | (0.13 | ) | |||||||||||||||||
| FOR THE YEAR ENDED SEPTEMBER 30, 2015 | $ | 11.44 | 0.24 | 10 | (1.25 | ) | (1.01 | ) | (0.15 | ) | (0.08 | ) | (0.23 | ) | ||||||||||||||
| FOR THE YEAR ENDED SEPTEMBER 30, 2014 | $ | 11.27 | 0.24 | 0.01 | 11 | 0.25 | (0.08 | ) | — | (0.08 | ) | |||||||||||||||||
| AQR INTERNATIONAL MULTI-STYLE FUND CLASS R6 | ||||||||||||||||||||||||||||
| FOR THE YEAR ENDED SEPTEMBER 30, 2018 | $ | 11.94 | 0.29 | (0.18 | ) | 0.11 | (0.30 | ) | — | (0.30 | ) | |||||||||||||||||
| FOR THE YEAR ENDED SEPTEMBER 30, 2017 | $ | 10.22 | 0.26 | 1.73 | 1.99 | (0.27 | ) | — | (0.27 | ) | ||||||||||||||||||
| FOR THE YEAR ENDED SEPTEMBER 30, 2016 | $ | 10.20 | 0.25 | (0.07 | ) | 0.18 | (0.16 | ) | — | (0.16 | ) | |||||||||||||||||
| FOR THE YEAR ENDED SEPTEMBER 30, 2015 | $ | 11.47 | 0.30 | 10 | (1.28 | ) | (0.98 | ) | (0.21 | ) | (0.08 | ) | (0.29 | ) | ||||||||||||||
| FOR THE PERIOD 7/10/148—9/30/14 | $ | 11.94 | 0.13 | (0.60 | ) | (0.47 | ) | — | — | — | ||||||||||||||||||
| The accompanying notes are an integral part of these financial statements. |
| AQR Funds | Annual Report | September 2018 | ||||||||||||||
250
Table of Contents
| Financial Highlights | September 30, 2018 |
| RATIOS/SUPPLEMENTAL DATA | ||||||||||||||||||||||||||||||||||
| Ratios to Average Net Assets of:* | ||||||||||||||||||||||||||||||||||
| Net Asset Value, End of Period | Total Return2,3 | Net Assets, End of Period (000’s) | Expenses, Before Reimbursements and/or Waivers4 | Expenses, Net of Reimbursements and/or Waivers4 | Expenses, Net of Reimbursements and/or Waivers (Excluding Dividend Short Expense & Interest Expense)4 | Net Investment Income (Loss) | Portfolio Turnover Rate5 | |||||||||||||||||||||||||||
| $18.83 | 14.11 | % | $507,109 | 0.44 | % | 0.44 | % | 0.44 | % | 1.28 | % | 64 | % | |||||||||||||||||||||
| $16.87 | 22.01 | % | $457,339 | 0.45 | % | 0.44 | % | 0.44 | % | 1.46 | % | 61 | % | |||||||||||||||||||||
| $14.00 | 6.61 | % | $627,269 | 0.46 | % | 0.45 | % | 0.45 | % | 1.43 | % | 80 | % | |||||||||||||||||||||
| $13.25 | 0.03 | % | $490,709 | 0.54 | % | 0.49 | % | 0.49 | % | 1.17 | % | 59 | % | |||||||||||||||||||||
| $13.36 | 21.39 | % | $166,058 | 0.71 | % | 0.54 | % | 0.54 | % | 1.17 | % | 277 | % | |||||||||||||||||||||
| $18.74 | 13.83 | % | $71,104 | 0.70 | % | 0.70 | % | 0.70 | % | 1.02 | % | 64 | % | |||||||||||||||||||||
| $16.79 | 21.69 | % | $62,679 | 0.71 | % | 0.70 | % | 0.70 | % | 1.19 | % | 61 | % | |||||||||||||||||||||
| $13.94 | 6.40 | % | $64,718 | 0.71 | % | 0.70 | % | 0.70 | % | 1.18 | % | 80 | % | |||||||||||||||||||||
| $13.19 | (0.25 | )% | $59,733 | 0.79 | % | 0.74 | % | 0.74 | % | 0.93 | % | 59 | % | |||||||||||||||||||||
| $13.33 | 21.05 | % | $10,328 | 1.14 | % | 0.79 | % | 0.79 | % | 0.90 | % | 277 | % | |||||||||||||||||||||
| $18.83 | 14.20 | % | $1,366,762 | 0.35 | % | 0.35 | % | 0.35 | % | 1.37 | % | 64 | % | |||||||||||||||||||||
| $16.87 | 22.18 | % | $1,246,028 | 0.36 | % | 0.35 | % | 0.35 | % | 1.54 | % | 61 | % | |||||||||||||||||||||
| $14.00 | 6.71 | % | $792,665 | 0.37 | % | 0.35 | % | 0.35 | % | 1.52 | % | 80 | % | |||||||||||||||||||||
| $13.25 | 0.07 | % | $563,785 | 0.42 | % | 0.36 | % | 0.36 | % | 1.28 | % | 59 | % | |||||||||||||||||||||
| $13.36 | 0.30 | % | $42,256 | 0.61 | % | 0.44 | % | 0.44 | % | 1.23 | % | 277 | % | |||||||||||||||||||||
| $15.88 | 9.18 | % | $61,690 | 0.66 | % | 0.65 | % | 0.64 | % | 0.63 | % | 64 | % | |||||||||||||||||||||
| $16.09 | 18.12 | % | $55,115 | 0.69 | % | 0.65 | % | 0.65 | % | 0.79 | %9 | 61 | % | |||||||||||||||||||||
| $13.96 | 13.74 | % | $45,483 | 0.75 | % | 0.65 | % | 0.65 | % | 1.00 | % | 96 | % | |||||||||||||||||||||
| $12.30 | 1.02 | % | $26,634 | 1.17 | % | 0.68 | % | 0.68 | % | 0.88 | %10 | 228 | % | |||||||||||||||||||||
| $12.34 | 5.13 | % | $8,233 | 2.58 | % | 0.75 | % | 0.75 | % | 0.37 | %12 | 189 | % | |||||||||||||||||||||
| $15.82 | 8.94 | % | $7,795 | 0.92 | % | 0.90 | % | 0.90 | % | 0.38 | % | 64 | % | |||||||||||||||||||||
| $16.01 | 17.79 | % | $8,624 | 0.94 | % | 0.90 | % | 0.90 | % | 0.53 | %9 | 61 | % | |||||||||||||||||||||
| $13.90 | 13.51 | % | $9,733 | 0.99 | % | 0.90 | % | 0.90 | % | 0.76 | % | 96 | % | |||||||||||||||||||||
| $12.25 | 0.72 | % | $5,681 | 1.40 | % | 0.93 | % | 0.93 | % | 0.65 | %10 | 228 | % | |||||||||||||||||||||
| $12.30 | 4.78 | % | $1,284 | 3.27 | % | 1.00 | % | 1.00 | % | 0.11 | %12 | 189 | % | |||||||||||||||||||||
| $15.91 | 9.34 | % | $675,945 | 0.57 | % | 0.55 | % | 0.55 | % | 0.73 | % | 64 | % | |||||||||||||||||||||
| $16.11 | 18.17 | % | $733,984 | 0.59 | % | 0.55 | % | 0.55 | % | 0.89 | %9 | 61 | % | |||||||||||||||||||||
| $13.98 | 13.90 | % | $687,986 | 0.62 | % | 0.55 | % | 0.55 | % | 1.23 | % | 96 | % | |||||||||||||||||||||
| $12.31 | 1.06 | % | $9,494 | 0.96 | % | 0.55 | % | 0.55 | % | 1.17 | %10 | 228 | % | |||||||||||||||||||||
| $12.35 | (4.63 | )% | $95 | 2.34 | % | 0.65 | % | 0.65 | % | 0.45 | %12 | 189 | % | |||||||||||||||||||||
| $11.76 | 0.81 | % | $82,661 | 0.64 | % | 0.60 | % | 0.60 | % | 2.36 | % | 61 | % | |||||||||||||||||||||
| $11.95 | 19.91 | % | $76,307 | 0.65 | % | 0.60 | %13 | 0.60 | %13 | 2.26 | %14 | 55 | % | |||||||||||||||||||||
| $10.23 | 1.62 | % | $68,288 | 0.68 | % | 0.59 | % | 0.59 | % | 2.62 | % | 106 | % | |||||||||||||||||||||
| $10.21 | (8.78 | )% | $40,047 | 0.82 | % | 0.64 | % | 0.64 | % | 2.45 | %10 | 236 | % | |||||||||||||||||||||
| $11.47 | 2.53 | % | $26,729 | 1.38 | % | 0.70 | % | 0.70 | % | 2.36 | % | 204 | % | |||||||||||||||||||||
| $11.73 | 0.51 | % | $6,892 | 0.89 | % | 0.85 | % | 0.85 | % | 2.04 | % | 61 | % | |||||||||||||||||||||
| $11.92 | 19.69 | % | $8,836 | 0.91 | % | 0.85 | %13 | 0.85 | %13 | 1.95 | %14 | 55 | % | |||||||||||||||||||||
| $10.20 | 1.28 | % | $8,491 | 0.93 | % | 0.85 | % | 0.85 | % | 2.32 | % | 106 | % | |||||||||||||||||||||
| $10.20 | (8.92 | )% | $4,142 | 1.06 | % | 0.88 | % | 0.88 | % | 2.19 | %10 | 236 | % | |||||||||||||||||||||
| $11.44 | 2.19 | % | $2,756 | 1.85 | % | 0.95 | % | 0.95 | % | 2.02 | % | 204 | % | |||||||||||||||||||||
| $11.75 | 0.90 | % | $329,854 | 0.54 | % | 0.50 | % | 0.50 | % | 2.44 | % | 61 | % | |||||||||||||||||||||
| $11.94 | 20.04 | % | $385,126 | 0.56 | % | 0.50 | %13 | 0.50 | %13 | 2.41 | %14 | 55 | % | |||||||||||||||||||||
| $10.22 | 1.71 | % | $301,294 | 0.59 | % | 0.50 | % | 0.50 | % | 2.52 | % | 106 | % | |||||||||||||||||||||
| $10.20 | (8.68 | )% | $241,780 | 0.66 | % | 0.51 | % | 0.51 | % | 2.70 | %10 | 236 | % | |||||||||||||||||||||
| $11.47 | (3.94 | )% | $26,412 | 1.34 | % | 0.60 | % | 0.60 | % | 5.13 | % | 204 | % | |||||||||||||||||||||
| The accompanying notes are an integral part of these financial statements. |
| AQR Funds | Annual Report | September 2018 | ||||||||||||||
251
Table of Contents
| Financial Highlights | September 30, 2018 |
| PER SHARE OPERATING PERFORMANCE | ||||||||||||||||||||||||||||
| Change in Net Assets Resulting from Operations1 | Less Dividends and Distributions | |||||||||||||||||||||||||||
| Net Asset Value, Beginning of Period | Net Investment Income (Loss) | Net Realized and Unrealized Gain (Loss) | Net Increase (Decrease) in Net Asset Value from Operations | Distributions from Net Investment Income | Distributions from Net Realized Gains | Total Distributions | ||||||||||||||||||||||
| AQR EMERGING MULTI-STYLE FUND CLASS I6 | ||||||||||||||||||||||||||||
| FOR THE YEAR ENDED SEPTEMBER 30, 2018 | $10.71 | 0.15 | (0.51 | ) | (0.36 | ) | (0.18 | ) | — | (0.18 | ) | |||||||||||||||||
| FOR THE YEAR ENDED SEPTEMBER 30, 2017 | $8.95 | 0.18 | 1.75 | 1.93 | (0.17 | ) | — | (0.17 | ) | |||||||||||||||||||
| FOR THE YEAR ENDED SEPTEMBER 30, 2016 | $8.19 | 0.15 | 0.81 | 0.96 | (0.20 | ) | — | (0.20 | ) | |||||||||||||||||||
| FOR THE YEAR ENDED SEPTEMBER 30, 2015 | $9.96 | 0.27 | (1.97 | ) | (1.70 | ) | (0.07 | ) | — | (0.07 | ) | |||||||||||||||||
| FOR THE PERIOD 5/13/1415—9/30/14 | $10.00 | 0.14 | (0.18 | ) | (0.04 | ) | — | — | — | |||||||||||||||||||
| AQR EMERGING MULTI-STYLE FUND CLASS N | ||||||||||||||||||||||||||||
| FOR THE YEAR ENDED SEPTEMBER 30, 2018 | $10.68 | 0.16 | (0.53 | ) | (0.37 | ) | (0.15 | ) | — | (0.15 | ) | |||||||||||||||||
| FOR THE YEAR ENDED SEPTEMBER 30, 2017 | $8.93 | 0.14 | 1.76 | 1.90 | (0.15 | ) | — | (0.15 | ) | |||||||||||||||||||
| FOR THE YEAR ENDED SEPTEMBER 30, 2016 | $8.17 | 0.13 | 0.81 | 0.94 | (0.18 | ) | — | (0.18 | ) | |||||||||||||||||||
| FOR THE YEAR ENDED SEPTEMBER 30, 2015 | $9.95 | 0.29 | (2.01 | ) | (1.72 | ) | (0.06 | ) | — | (0.06 | ) | |||||||||||||||||
| FOR THE PERIOD 5/13/1415—9/30/14 | $10.00 | 0.14 | (0.19 | ) | (0.05 | ) | — | — | — | |||||||||||||||||||
| AQR EMERGING MULTI-STYLE FUND CLASS R6 | ||||||||||||||||||||||||||||
| FOR THE YEAR ENDED SEPTEMBER 30, 2018 | $10.72 | 0.22 | (0.56 | ) | (0.34 | ) | (0.19 | ) | — | (0.19 | ) | |||||||||||||||||
| FOR THE YEAR ENDED SEPTEMBER 30, 2017 | $8.97 | 0.19 | 1.74 | 1.93 | (0.18 | ) | — | (0.18 | ) | |||||||||||||||||||
| FOR THE YEAR ENDED SEPTEMBER 30, 2016 | $8.20 | 0.16 | 0.81 | 0.97 | (0.20 | ) | — | (0.20 | ) | |||||||||||||||||||
| FOR THE YEAR ENDED SEPTEMBER 30, 2015 | $9.96 | 0.45 | (2.14 | ) | (1.69 | ) | (0.07 | ) | — | (0.07 | ) | |||||||||||||||||
| FOR THE PERIOD 7/10/148—9/30/14 | $10.47 | 0.05 | (0.56 | ) | (0.51 | ) | — | — | — | |||||||||||||||||||
| AQR TM LARGE CAP MULTI-STYLE FUND CLASS I6 | ||||||||||||||||||||||||||||
| FOR THE YEAR ENDED SEPTEMBER 30, 2018 | $12.09 | 0.17 | 1.62 | 1.79 | (0.15 | ) | — | (0.15 | ) | |||||||||||||||||||
| FOR THE YEAR ENDED SEPTEMBER 30, 2017 | $10.00 | 0.16 | 2.05 | 2.21 | (0.12 | ) | (0.00 | )7 | (0.12 | ) | ||||||||||||||||||
| FOR THE YEAR ENDED SEPTEMBER 30, 2016 | $9.42 | 0.15 | 0.49 | 0.64 | (0.05 | ) | (0.01 | ) | (0.06 | ) | ||||||||||||||||||
| FOR THE PERIOD 2/11/1515—9/30/15 | $10.00 | 0.08 | (0.66 | ) | (0.58 | ) | — | — | — | |||||||||||||||||||
| AQR TM LARGE CAP MULTI-STYLE FUND CLASS N | ||||||||||||||||||||||||||||
| FOR THE YEAR ENDED SEPTEMBER 30, 2018 | $12.05 | 0.14 | 1.61 | 1.75 | (0.12 | ) | — | (0.12 | ) | |||||||||||||||||||
| FOR THE YEAR ENDED SEPTEMBER 30, 2017 | $9.97 | 0.13 | 2.05 | 2.18 | (0.10 | ) | (0.00 | )7 | (0.10 | ) | ||||||||||||||||||
| FOR THE YEAR ENDED SEPTEMBER 30, 2016 | $9.40 | 0.13 | 0.48 | 0.61 | (0.03 | ) | (0.01 | ) | (0.04 | ) | ||||||||||||||||||
| FOR THE PERIOD 2/11/1515—9/30/15 | $10.00 | 0.06 | (0.66 | ) | (0.60 | ) | — | — | — | |||||||||||||||||||
| AQR TM LARGE CAP MULTI-STYLE FUND CLASS R6 | ||||||||||||||||||||||||||||
| FOR THE YEAR ENDED SEPTEMBER 30, 2018 | $12.10 | 0.18 | 1.63 | 1.81 | (0.16 | ) | — | (0.16 | ) | |||||||||||||||||||
| FOR THE YEAR ENDED SEPTEMBER 30, 2017 | $10.01 | 0.17 | 2.05 | 2.22 | (0.13 | ) | (0.00 | )7 | (0.13 | ) | ||||||||||||||||||
| FOR THE YEAR ENDED SEPTEMBER 30, 2016 | $9.42 | 0.16 | 0.49 | 0.65 | (0.05 | ) | (0.01 | ) | (0.06 | ) | ||||||||||||||||||
| FOR THE PERIOD 2/11/1515—9/30/15 | $10.00 | 0.08 | (0.66 | ) | (0.58 | ) | — | — | — | |||||||||||||||||||
| AQR TM SMALL CAP MULTI-STYLE FUND CLASS I6 | ||||||||||||||||||||||||||||
| FOR THE YEAR ENDED SEPTEMBER 30, 2018 | $12.03 | 0.07 | 1.14 | 1.21 | (0.07 | ) | (0.26 | ) | (0.33 | ) | ||||||||||||||||||
| FOR THE YEAR ENDED SEPTEMBER 30, 2017 | $10.31 | 0.09 | 1.74 | 1.83 | (0.11 | ) | — | (0.11 | ) | |||||||||||||||||||
| FOR THE YEAR ENDED SEPTEMBER 30, 2016 | $9.21 | 0.12 | 18 | 1.04 | 1.16 | (0.06 | ) | — | (0.06 | ) | ||||||||||||||||||
| FOR THE PERIOD 2/11/1515—9/30/15 | $10.00 | 0.05 | (0.84 | ) | (0.79 | ) | — | — | — | |||||||||||||||||||
| AQR TM SMALL CAP MULTI-STYLE FUND CLASS N | ||||||||||||||||||||||||||||
| FOR THE YEAR ENDED SEPTEMBER 30, 2018 | $11.98 | 0.04 | 1.14 | 1.18 | (0.04 | ) | (0.26 | ) | (0.30 | ) | ||||||||||||||||||
| FOR THE YEAR ENDED SEPTEMBER 30, 2017 | $10.28 | 0.05 | 1.74 | 1.79 | (0.09 | ) | — | (0.09 | ) | |||||||||||||||||||
| FOR THE YEAR ENDED SEPTEMBER 30, 2016 | $ 9.20 | 0.10 | 18 | 1.03 | 1.13 | (0.05 | ) | — | (0.05 | ) | ||||||||||||||||||
| FOR THE PERIOD 2/11/1515—9/30/15 | $10.00 | 0.04 | (0.84 | ) | (0.80 | ) | — | — | — | |||||||||||||||||||
| AQR TM SMALL CAP MULTI-STYLE FUND CLASS R6 | ||||||||||||||||||||||||||||
| FOR THE YEAR ENDED SEPTEMBER 30, 2018 | $12.06 | 0.08 | 1.14 | 1.22 | (0.08 | ) | (0.26 | ) | (0.34 | ) | ||||||||||||||||||
| FOR THE YEAR ENDED SEPTEMBER 30, 2017 | $10.32 | 0.10 | 1.76 | 1.86 | (0.12 | ) | — | (0.12 | ) | |||||||||||||||||||
| FOR THE YEAR ENDED SEPTEMBER 30, 2016 | $9.22 | 0.12 | 18 | 1.04 | 1.16 | (0.06 | ) | — | (0.06 | ) | ||||||||||||||||||
| FOR THE PERIOD 2/11/1515—9/30/15 | $10.00 | 0.06 | (0.84 | ) | (0.78 | ) | — | — | — | |||||||||||||||||||
| The accompanying notes are an integral part of these financial statements. |
| AQR Funds | Annual Report | September 2018 | ||||||||||||||
252
Table of Contents
| Financial Highlights | September 30, 2018 |
| RATIOS/SUPPLEMENTAL DATA | ||||||||||||||||||||||||||||||||||
| Ratios to Average Net Assets of:* | ||||||||||||||||||||||||||||||||||
| Net Asset Value, End of Period | Total Return2,3 | Net Assets, End of Period (000’s) | Expenses, Before Reimbursements and/or Waivers4 | Expenses, Net of Reimbursements and/or Waivers4 | Expenses, Net of Reimbursements and/or Waivers (Excluding Dividend Short Expense & Interest Expense)4 | Net Investment Income (Loss) | Portfolio Turnover Rate5 | |||||||||||||||||||||||||||
| $10.17 | (3.48 | )% | $34,903 | 0.87 | % | 0.75 | % | 0.75 | % | 1.33 | % | 60 | % | |||||||||||||||||||||
| $10.71 | 22.17 | % | $97,264 | 0.89 | % | 0.75 | % | 0.75 | % | 1.93 | % | 53 | % | |||||||||||||||||||||
| $8.95 | 11.97 | % | $73,793 | 0.95 | % | 0.75 | % | 0.75 | % | 1.85 | % | 94 | % | |||||||||||||||||||||
| $8.19 | (17.14 | )% | $48,992 | 1.39 | % | 0.79 | % | 0.79 | % | 2.79 | % | 317 | % | |||||||||||||||||||||
| $9.96 | (0.40 | )% | $11,572 | 3.30 | %16,17 | 0.85 | % | 0.85 | % | 3.49 | % | 154 | % | |||||||||||||||||||||
| $10.16 | (3.58 | )% | $5,311 | 1.12 | % | 1.00 | % | 1.00 | % | 1.42 | % | 60 | % | |||||||||||||||||||||
| $10.68 | 21.82 | % | $6,726 | 1.14 | % | 1.00 | % | 1.00 | % | 1.54 | % | 53 | % | |||||||||||||||||||||
| $8.93 | 11.72 | % | $7,600 | 1.20 | % | 1.00 | % | 1.00 | % | 1.64 | % | 94 | % | |||||||||||||||||||||
| $8.17 | (17.34 | )% | $4,494 | 1.61 | % | 1.04 | % | 1.04 | % | 2.98 | % | 317 | % | |||||||||||||||||||||
| $9.95 | (0.50 | )% | $2,388 | 3.55 | %16,17 | 1.10 | % | 1.10 | % | 3.49 | % | 154 | % | |||||||||||||||||||||
| $10.19 | (3.29 | )% | $268,403 | 0.77 | % | 0.65 | % | 0.65 | % | 2.02 | % | 60 | % | |||||||||||||||||||||
| $10.72 | 22.13 | % | $222,511 | 0.79 | % | 0.65 | % | 0.65 | % | 2.01 | % | 53 | % | |||||||||||||||||||||
| $8.97 | 12.13 | % | $184,112 | 0.85 | % | 0.65 | % | 0.65 | % | 1.96 | % | 94 | % | |||||||||||||||||||||
| $8.20 | (17.06 | )% | $135,503 | 0.89 | % | 0.65 | % | 0.65 | % | 4.66 | % | 317 | % | |||||||||||||||||||||
| $9.96 | (4.87 | )% | $95 | 2.73 | %16,17 | 0.75 | % | 0.75 | % | 2.09 | % | 154 | % | |||||||||||||||||||||
| $13.73 | 14.86 | % | $87,556 | 0.48 | % | 0.45 | % | 0.45 | % | 1.31 | % | 69 | % | |||||||||||||||||||||
| $12.09 | 22.33 | % | $64,006 | 0.53 | % | 0.45 | % | 0.45 | % | 1.44 | % | 77 | % | |||||||||||||||||||||
| $10.00 | 6.82 | % | $39,964 | 0.59 | %16 | 0.43 | % | 0.43 | % | 1.57 | % | 173 | % | |||||||||||||||||||||
| $9.42 | (5.80 | )% | $2,087 | 1.66 | %16 | 0.46 | % | 0.46 | % | 1.20 | % | 207 | % | |||||||||||||||||||||
| $13.68 | 14.57 | % | $2,295 | 0.74 | % | 0.70 | % | 0.70 | % | 1.05 | % | 69 | % | |||||||||||||||||||||
| $12.05 | 22.04 | % | $2,210 | 0.78 | % | 0.70 | % | 0.70 | % | 1.20 | % | 77 | % | |||||||||||||||||||||
| $9.97 | 6.48 | % | $2,165 | 0.84 | %16 | 0.69 | % | 0.69 | % | 1.34 | % | 173 | % | |||||||||||||||||||||
| $9.40 | (6.00 | )% | $135 | 2.48 | %16 | 0.70 | % | 0.70 | % | 0.99 | % | 207 | % | |||||||||||||||||||||
| $13.75 | 15.03 | % | $211,229 | 0.39 | % | 0.35 | % | 0.35 | % | 1.41 | % | 69 | % | |||||||||||||||||||||
| $12.10 | 22.37 | % | $161,560 | 0.43 | % | 0.35 | % | 0.35 | % | 1.54 | % | 77 | % | |||||||||||||||||||||
| $10.01 | 6.95 | % | $98,092 | 0.53 | %16 | 0.35 | % | 0.35 | % | 1.63 | % | 173 | % | |||||||||||||||||||||
| $9.42 | (5.80 | )% | $26,703 | 1.41 | %16 | 0.36 | % | 0.36 | % | 1.33 | % | 207 | % | |||||||||||||||||||||
| $12.91 | 10.23 | % | $25,755 | 1.06 | % | 0.65 | % | 0.65 | % | 0.56 | % | 80 | % | |||||||||||||||||||||
| $12.03 | 17.79 | % | $21,257 | 1.23 | % | 0.65 | % | 0.65 | % | 0.79 | % | 92 | % | |||||||||||||||||||||
| $10.31 | 12.64 | % | $13,792 | 1.90 | %16 | 0.64 | % | 0.64 | % | 1.27 | %18 | 179 | % | |||||||||||||||||||||
| $9.21 | (7.90 | )% | $1,702 | 5.66 | %16 | 0.65 | % | 0.65 | % | 0.77 | % | 98 | % | |||||||||||||||||||||
| $12.86 | 10.00 | % | $6,512 | 1.31 | % | 0.90 | % | 0.90 | % | 0.30 | % | 80 | % | |||||||||||||||||||||
| $11.98 | 17.44 | % | $5,478 | 1.47 | % | 0.90 | % | 0.90 | % | 0.48 | % | 92 | % | |||||||||||||||||||||
| $10.28 | 12.34 | % | $2,970 | 2.03 | %16 | 0.88 | % | 0.88 | % | 1.05 | %18 | 179 | % | |||||||||||||||||||||
| $9.20 | (8.00 | )% | $128 | 6.53 | %16 | 0.92 | % | 0.92 | % | 0.59 | % | 98 | % | |||||||||||||||||||||
| $12.94 | 10.30 | % | $2,568 | 0.96 | % | 0.55 | % | 0.55 | % | 0.66 | % | 80 | % | |||||||||||||||||||||
| $12.06 | 18.04 | % | $2,327 | 1.13 | % | 0.55 | % | 0.55 | % | 0.90 | % | 92 | % | |||||||||||||||||||||
| $10.32 | 12.63 | % | $1,973 | 2.29 | %16 | 0.55 | % | 0.55 | % | 1.26 | %18 | 179 | % | |||||||||||||||||||||
| $9.22 | (7.80 | )% | $1,660 | 6.28 | %16 | 0.57 | % | 0.57 | % | 0.96 | % | 98 | % | |||||||||||||||||||||
| The accompanying notes are an integral part of these financial statements. |
| AQR Funds | Annual Report | September 2018 | ||||||||||||||
253
Table of Contents
| Financial Highlights | September 30, 2018 |
| PER SHARE OPERATING PERFORMANCE | ||||||||||||||||||||||||||||
| Change in Net Assets Resulting from Operations1 | Less Dividends and Distributions | |||||||||||||||||||||||||||
| Net Asset Value, Beginning of Period | Net Investment Income (Loss) | Net Realized and Unrealized Gain (Loss) | Net Increase (Decrease) in Net Asset Value from Operations | Distributions from Net Investment Income | Distributions from Net Realized Gains | Total Distributions | ||||||||||||||||||||||
| AQR TM INTERNATIONAL MULTI-STYLE FUND CLASS I6 | ||||||||||||||||||||||||||||
| FOR THE YEAR ENDED SEPTEMBER 30, 2018 | $11.16 | 0.25 | (0.09 | ) | 0.16 | (0.27 | ) | — | (0.27 | ) | ||||||||||||||||||
| FOR THE YEAR ENDED SEPTEMBER 30, 2017 | $9.44 | 0.23 | 1.68 | 1.91 | (0.19 | ) | — | (0.19 | ) | |||||||||||||||||||
| FOR THE YEAR ENDED SEPTEMBER 30, 2016 | $9.40 | 0.24 | (0.08 | )11 | 0.16 | (0.12 | ) | — | (0.12 | ) | ||||||||||||||||||
| FOR THE PERIOD 2/11/1515—9/30/15 | $10.00 | 0.18 | (0.78 | ) | (0.60 | ) | — | — | — | |||||||||||||||||||
| AQR TM INTERNATIONAL MULTI-STYLE FUND CLASS N | ||||||||||||||||||||||||||||
| FOR THE YEAR ENDED SEPTEMBER 30, 2018 | $11.12 | 0.22 | (0.09 | ) | 0.13 | (0.24 | ) | — | (0.24 | ) | ||||||||||||||||||
| FOR THE YEAR ENDED SEPTEMBER 30, 2017 | $9.42 | 0.20 | 1.68 | 1.88 | (0.18 | ) | — | (0.18 | ) | |||||||||||||||||||
| FOR THE YEAR ENDED SEPTEMBER 30, 2016 | $9.39 | 0.22 | (0.08 | )11 | 0.14 | (0.11 | ) | — | (0.11 | ) | ||||||||||||||||||
| FOR THE PERIOD 2/11/1515—9/30/15 | $10.00 | 0.15 | (0.76 | ) | (0.61 | ) | — | — | — | |||||||||||||||||||
| AQR TM INTERNATIONAL MULTI-STYLE FUND CLASS R6 | ||||||||||||||||||||||||||||
| FOR THE YEAR ENDED SEPTEMBER 30, 2018 | $11.18 | 0.26 | (0.08 | ) | 0.18 | (0.28 | ) | — | (0.28 | ) | ||||||||||||||||||
| FOR THE YEAR ENDED SEPTEMBER 30, 2017 | $9.45 | 0.24 | 1.69 | 1.93 | (0.20 | ) | — | (0.20 | ) | |||||||||||||||||||
| FOR THE YEAR ENDED SEPTEMBER 30, 2016 | $9.41 | 0.25 | (0.09 | )11 | 0.16 | (0.12 | ) | — | (0.12 | ) | ||||||||||||||||||
| FOR THE PERIOD 2/11/1515—9/30/15 | $10.00 | 0.18 | (0.77 | ) | (0.59 | ) | — | — | — | |||||||||||||||||||
| AQR TM EMERGING MULTI-STYLE FUND CLASS I6 | ||||||||||||||||||||||||||||
| FOR THE YEAR ENDED SEPTEMBER 30, 2018 | $11.12 | 0.23 | 19 | (0.59 | ) | (0.36 | ) | (0.18 | ) | — | (0.18 | ) | ||||||||||||||||
| FOR THE YEAR ENDED SEPTEMBER 30, 2017 | $9.27 | 0.18 | 1.88 | 2.06 | (0.21 | ) | — | (0.21 | ) | |||||||||||||||||||
| FOR THE YEAR ENDED SEPTEMBER 30, 2016 | $ 8.31 | 0.17 | 0.82 | 0.99 | (0.03 | ) | — | (0.03 | ) | |||||||||||||||||||
| FOR THE PERIOD 2/11/1515—9/30/15 | $10.00 | 0.21 | (1.90 | ) | (1.69 | ) | — | — | — | |||||||||||||||||||
| AQR TM EMERGING MULTI-STYLE FUND CLASS N | ||||||||||||||||||||||||||||
| FOR THE YEAR ENDED SEPTEMBER 30, 2018 | $11.12 | 0.19 | 19 | (0.59 | ) | (0.40 | ) | (0.15 | ) | — | (0.15 | ) | ||||||||||||||||
| FOR THE YEAR ENDED SEPTEMBER 30, 2017 | $9.28 | 0.15 | 1.89 | 2.04 | (0.20 | ) | — | (0.20 | ) | |||||||||||||||||||
| FOR THE YEAR ENDED SEPTEMBER 30, 2016 | $8.30 | 0.17 | 0.81 | 0.98 | — | — | — | |||||||||||||||||||||
| FOR THE PERIOD 2/11/1515—9/30/15 | $10.00 | 0.19 | (1.89 | ) | (1.70 | ) | — | — | — | |||||||||||||||||||
| AQR TM EMERGING MULTI-STYLE FUND CLASS R6 | ||||||||||||||||||||||||||||
| FOR THE YEAR ENDED SEPTEMBER 30, 2018 | $11.13 | 0.24 | 19 | (0.59 | ) | (0.35 | ) | (0.19 | ) | — | (0.19 | ) | ||||||||||||||||
| FOR THE YEAR ENDED SEPTEMBER 30, 2017 | $9.28 | 0.19 | 1.88 | 2.07 | (0.22 | ) | — | (0.22 | ) | |||||||||||||||||||
| FOR THE YEAR ENDED SEPTEMBER 30, 2016 | $8.32 | 0.18 | 0.82 | 1.00 | (0.04 | ) | — | (0.04 | ) | |||||||||||||||||||
| FOR THE PERIOD 2/11/1515—9/30/15 | $10.00 | 0.22 | (1.90 | ) | (1.68 | ) | — | — | — | |||||||||||||||||||
| AQR LARGE CAP MOMENTUM STYLE FUND CLASS I6 | ||||||||||||||||||||||||||||
| FOR THE YEAR ENDED SEPTEMBER 30, 2018 | $22.00 | 0.19 | 4.77 | 4.96 | (0.21 | ) | (1.76 | ) | (1.97 | ) | ||||||||||||||||||
| FOR THE YEAR ENDED SEPTEMBER 30, 2017 | $20.44 | 0.24 | 2.88 | 3.12 | (0.32 | ) | (1.24 | ) | (1.56 | ) | ||||||||||||||||||
| FOR THE YEAR ENDED SEPTEMBER 30, 2016 | $19.96 | 0.27 | 1.87 | 2.14 | (0.21 | ) | (1.45 | ) | (1.66 | ) | ||||||||||||||||||
| FOR THE YEAR ENDED SEPTEMBER 30, 2015 | $21.89 | 0.23 | (0.10 | ) | 0.13 | (0.14 | ) | (1.92 | ) | (2.06 | ) | |||||||||||||||||
| FOR THE YEAR ENDED SEPTEMBER 30, 2014 | $19.65 | 0.12 | 3.12 | 3.24 | (0.13 | ) | (0.87 | ) | (1.00 | ) | ||||||||||||||||||
| AQR LARGE CAP MOMENTUM STYLE FUND CLASS N | ||||||||||||||||||||||||||||
| FOR THE YEAR ENDED SEPTEMBER 30, 2018 | $21.98 | 0.13 | 4.77 | 4.90 | (0.16 | ) | (1.76 | ) | (1.92 | ) | ||||||||||||||||||
| FOR THE YEAR ENDED SEPTEMBER 30, 2017 | $20.42 | 0.19 | 2.87 | 3.06 | (0.26 | ) | (1.24 | ) | (1.50 | ) | ||||||||||||||||||
| FOR THE YEAR ENDED SEPTEMBER 30, 2016 | $19.92 | 0.21 | 1.88 | 2.09 | (0.14 | ) | (1.45 | ) | (1.59 | ) | ||||||||||||||||||
| FOR THE YEAR ENDED SEPTEMBER 30, 2015 | $21.85 | 0.17 | (0.10 | ) | 0.07 | (0.08 | ) | (1.92 | ) | (2.00 | ) | |||||||||||||||||
| FOR THE YEAR ENDED SEPTEMBER 30, 2014 | $19.61 | 0.06 | 3.13 | 3.19 | (0.08 | ) | (0.87 | ) | (0.95 | ) | ||||||||||||||||||
| AQR LARGE CAP MOMENTUM STYLE FUND CLASS R6 | ||||||||||||||||||||||||||||
| FOR THE YEAR ENDED SEPTEMBER 30, 2018 | $21.96 | 0.22 | 4.75 | 4.97 | (0.23 | ) | (1.76 | ) | (1.99 | ) | ||||||||||||||||||
| FOR THE YEAR ENDED SEPTEMBER 30, 2017 | $20.41 | 0.26 | 2.87 | 3.13 | (0.34 | ) | (1.24 | ) | (1.58 | ) | ||||||||||||||||||
| FOR THE YEAR ENDED SEPTEMBER 30, 2016 | $19.94 | 0.29 | 1.86 | 2.15 | (0.23 | ) | (1.45 | ) | (1.68 | ) | ||||||||||||||||||
| FOR THE YEAR ENDED SEPTEMBER 30, 2015 | $21.89 | 0.23 | (0.08 | ) | 0.15 | (0.18 | ) | (1.92 | ) | (2.10 | ) | |||||||||||||||||
| FOR THE PERIOD 7/10/148—9/30/14 | $21.90 | 0.04 | (0.05 | )11 | (0.01 | ) | — | — | — | |||||||||||||||||||
| The accompanying notes are an integral part of these financial statements. |
| AQR Funds | Annual Report | September 2018 | ||||||||||||||
254
Table of Contents
| Financial Highlights | September 30, 2018 |
| RATIOS/SUPPLEMENTAL DATA | ||||||||||||||||||||||||||||||||||
| Ratios to Average Net Assets of:* | ||||||||||||||||||||||||||||||||||
| Net Asset Value, End of Period | Total Return2,3 | Net Assets, End of Period (000’s) | Expenses, Before Reimbursements and/or Waivers4 | Expenses, Net of Reimbursements and/or Waivers4 | Expenses, Net of Reimbursements and/or Waivers (Excluding Dividend Short Expense & Interest Expense)4 | Net Investment Income (Loss) | Portfolio Turnover Rate5 | |||||||||||||||||||||||||||
| $11.05 | 1.39 | % | $28,704 | 0.68 | % | 0.60 | % | 0.60 | % | 2.26 | % | 54 | % | |||||||||||||||||||||
| $11.16 | 20.71 | % | $25,736 | 0.71 | % | 0.60 | % | 0.60 | % | 2.31 | % | 52 | % | |||||||||||||||||||||
| $9.44 | 1.68 | % | $20,094 | 0.81 | %16 | 0.59 | % | 0.58 | % | 2.58 | % | 135 | % | |||||||||||||||||||||
| $9.40 | (6.00 | )% | $3,213 | 1.42 | %16 | 0.61 | % | 0.61 | % | 2.85 | % | 172 | % | |||||||||||||||||||||
| $11.01 | 1.17 | % | $1,546 | 0.94 | % | 0.85 | % | 0.85 | % | 1.99 | % | 54 | % | |||||||||||||||||||||
| $11.12 | 20.39 | % | $2,078 | 0.97 | % | 0.85 | % | 0.85 | % | 2.03 | % | 52 | % | |||||||||||||||||||||
| $9.42 | 1.43 | % | $1,592 | 1.07 | %16 | 0.82 | % | 0.82 | % | 2.41 | % | 135 | % | |||||||||||||||||||||
| $9.39 | (6.10 | )% | $143 | 2.65 | %16 | 0.81 | % | 0.81 | % | 2.28 | % | 172 | % | |||||||||||||||||||||
| $11.08 | 1.56 | % | $161,422 | 0.59 | % | 0.50 | % | 0.50 | % | 2.34 | % | 54 | % | |||||||||||||||||||||
| $11.18 | 20.89 | % | $151,455 | 0.62 | % | 0.50 | % | 0.50 | % | 2.42 | % | 52 | % | |||||||||||||||||||||
| $9.45 | 1.71 | % | $116,641 | 0.72 | %16 | 0.50 | % | 0.50 | % | 2.73 | % | 135 | % | |||||||||||||||||||||
| $9.41 | (5.90 | )% | $41,373 | 1.22 | %16 | 0.51 | % | 0.51 | % | 2.81 | % | 172 | % | |||||||||||||||||||||
| $10.58 | (3.35 | )% | $17,266 | 0.85 | % | 0.74 | % | 0.74 | % | 2.01 | %19 | 54 | % | |||||||||||||||||||||
| $11.12 | 22.99 | % | $17,013 | 0.86 | % | 0.74 | % | 0.74 | % | 1.89 | % | 51 | % | |||||||||||||||||||||
| $9.21 | 12.02 | % | $12,711 | 0.94 | %16 | 0.72 | % | 0.72 | % | 2.00 | % | 181 | % | |||||||||||||||||||||
| $8.31 | (16.90 | )% | $2,986 | 2.66 | %16 | 0.77 | % | 0.77 | % | 3.46 | % | 173 | % | |||||||||||||||||||||
| $10.57 | (3.70 | )% | $1,675 | 1.11 | % | 1.00 | % | 1.00 | % | 1.63 | %19 | 54 | % | |||||||||||||||||||||
| $11.12 | 22.64 | % | $2,301 | 1.12 | % | 1.00 | % | 1.00 | % | 1.58 | % | 51 | % | |||||||||||||||||||||
| $9.28 | 11.81 | % | $2,163 | 1.20 | %16 | 0.95 | % | 0.95 | % | 2.01 | % | 181 | % | |||||||||||||||||||||
| $8.30 | (17.00 | )% | $881 | 3.06 | %16 | 1.03 | % | 1.03 | % | 3.08 | % | 173 | % | |||||||||||||||||||||
| $10.59 | (3.27 | )% | $313,070 | 0.76 | % | 0.65 | % | 0.65 | % | 2.07 | %19 | 54 | % | |||||||||||||||||||||
| $11.13 | 23.05 | % | $333,540 | 0.77 | % | 0.65 | % | 0.65 | % | 1.94 | % | 51 | % | |||||||||||||||||||||
| $9.28 | 12.05 | % | $272,799 | 0.87 | %16 | 0.65 | % | 0.65 | % | 2.09 | % | 181 | % | |||||||||||||||||||||
| $8.32 | (16.80 | )% | $15,381 | 2.46 | %16 | 0.67 | % | 0.67 | % | 3.66 | % | 173 | % | |||||||||||||||||||||
| $24.99 | 23.94 | % | $986,458 | 0.40 | % | 0.39 | % | 0.39 | % | 0.84 | % | 66 | % | |||||||||||||||||||||
| $22.00 | 16.37 | % | $869,688 | 0.41 | % | 0.40 | % | 0.40 | % | 1.19 | % | 88 | % | |||||||||||||||||||||
| $20.44 | 11.12 | % | $820,914 | 0.42 | % | 0.40 | % | 0.40 | % | 1.34 | % | 77 | % | |||||||||||||||||||||
| $19.96 | 0.18 | % | $874,115 | 0.50 | % | 0.45 | % | 0.45 | % | 1.06 | % | 90 | % | |||||||||||||||||||||
| $21.89 | 16.86 | % | $953,235 | 0.55 | % | 0.49 | % | 0.49 | % | 0.55 | % | 83 | % | |||||||||||||||||||||
| $24.96 | 23.61 | % | $77,381 | 0.65 | % | 0.65 | % | 0.65 | % | 0.58 | % | 66 | % | |||||||||||||||||||||
| $21.98 | 16.07 | % | $59,044 | 0.66 | % | 0.65 | % | 0.65 | % | 0.94 | % | 88 | % | |||||||||||||||||||||
| $20.42 | 10.89 | % | $57,644 | 0.66 | % | 0.65 | % | 0.65 | % | 1.08 | % | 77 | % | |||||||||||||||||||||
| $19.92 | (0.10 | )% | $68,535 | 0.77 | % | 0.70 | % | 0.70 | % | 0.81 | % | 90 | % | |||||||||||||||||||||
| $21.85 | 16.59 | % | $79,272 | 0.83 | % | 0.74 | % | 0.74 | % | 0.30 | % | 83 | % | |||||||||||||||||||||
| $24.94 | 24.06 | % | $101,971 | 0.30 | % | 0.30 | % | 0.30 | % | 0.93 | % | 66 | % | |||||||||||||||||||||
| $21.96 | 16.47 | % | $65,920 | 0.31 | % | 0.30 | % | 0.30 | % | 1.28 | % | 88 | % | |||||||||||||||||||||
| $20.41 | 11.23 | % | $59,108 | 0.32 | % | 0.30 | % | 0.30 | % | 1.45 | % | 77 | % | |||||||||||||||||||||
| $19.94 | 0.28 | % | $62,973 | 0.36 | % | 0.31 | % | 0.31 | % | 1.09 | % | 90 | % | |||||||||||||||||||||
| $21.89 | (0.05 | )% | $131 | 0.48 | % | 0.39 | % | 0.39 | % | 0.75 | % | 83 | % | |||||||||||||||||||||
| The accompanying notes are an integral part of these financial statements. |
| AQR Funds | Annual Report | September 2018 | ||||||||||||||
255
Table of Contents
| Financial Highlights | September 30, 2018 |
| PER SHARE OPERATING PERFORMANCE | ||||||||||||||||||||||||||||
| Change in Net Assets Resulting from Operations1 | Less Dividends and Distributions | |||||||||||||||||||||||||||
| Net Asset Value, Beginning of Period | Net Investment Income (Loss) | Net Realized and Unrealized Gain (Loss) | Net Increase (Decrease) in Net Asset Value from Operations | Distributions from Net Investment Income | Distributions from Net Realized Gains | Total Distributions | ||||||||||||||||||||||
| AQR SMALL CAP MOMENTUM STYLE FUND CLASS I6 | ||||||||||||||||||||||||||||
| FOR THE YEAR ENDED SEPTEMBER 30, 2018 | $24.83 | 0.05 | 19 | 4.58 | 4.63 | (0.06 | ) | (2.26 | ) | (2.32 | ) | |||||||||||||||||
| FOR THE YEAR ENDED SEPTEMBER 30, 2017 | $20.80 | 0.10 | 9 | 4.10 | 4.20 | (0.17 | ) | — | (0.17 | ) | ||||||||||||||||||
| FOR THE YEAR ENDED SEPTEMBER 30, 2016 | $19.10 | 0.15 | 1.79 | 1.94 | (0.16 | ) | (0.08 | ) | (0.24 | ) | ||||||||||||||||||
| FOR THE YEAR ENDED SEPTEMBER 30, 2015 | $21.09 | 0.15 | 10 | 0.26 | 11 | 0.41 | (0.04 | ) | (2.36 | ) | (2.40 | ) | ||||||||||||||||
| FOR THE YEAR ENDED SEPTEMBER 30, 2014 | $21.77 | 0.00 | 7,12 | 0.73 | 0.73 | (0.06 | ) | (1.35 | ) | (1.41 | ) | |||||||||||||||||
| AQR SMALL CAP MOMENTUM STYLE FUND CLASS N | ||||||||||||||||||||||||||||
| FOR THE YEAR ENDED SEPTEMBER 30, 2018 | $24.82 | (0.00 | )7,19 | 4.58 | 4.58 | — | (2.26 | ) | (2.26 | ) | ||||||||||||||||||
| FOR THE YEAR ENDED SEPTEMBER 30, 2017 | $20.68 | 0.05 | 9 | 4.09 | 4.14 | — | — | — | ||||||||||||||||||||
| FOR THE YEAR ENDED SEPTEMBER 30, 2016 | $18.99 | 0.09 | 1.78 | 1.87 | (0.10 | ) | (0.08 | ) | (0.18 | ) | ||||||||||||||||||
| FOR THE YEAR ENDED SEPTEMBER 30, 2015 | $21.00 | 0.09 | 10 | 0.26 | 11 | 0.35 | — | (2.36 | ) | (2.36 | ) | |||||||||||||||||
| FOR THE YEAR ENDED SEPTEMBER 30, 2014 | $21.73 | (0.06 | )12 | 0.73 | 0.67 | (0.05 | ) | (1.35 | ) | (1.40 | ) | |||||||||||||||||
| AQR SMALL CAP MOMENTUM STYLE FUND CLASS R6 | ||||||||||||||||||||||||||||
| FOR THE YEAR ENDED SEPTEMBER 30, 2018 | $24.79 | 0.08 | 19 | 4.58 | 4.66 | (0.09 | ) | (2.26 | ) | (2.35 | ) | |||||||||||||||||
| FOR THE YEAR ENDED SEPTEMBER 30, 2017 | $20.77 | 0.12 | 9 | 4.09 | 4.21 | (0.19 | ) | — | (0.19 | ) | ||||||||||||||||||
| FOR THE YEAR ENDED SEPTEMBER 30, 2016 | $19.09 | 0.13 | 1.81 | 1.94 | (0.18 | ) | (0.08 | ) | (0.26 | ) | ||||||||||||||||||
| FOR THE YEAR ENDED SEPTEMBER 30, 2015 | $21.10 | 0.13 | 10 | 0.29 | 11 | 0.42 | (0.07 | ) | (2.36 | ) | (2.43 | ) | ||||||||||||||||
| FOR THE PERIOD 7/10/148—9/30/14 | $22.08 | 0.01 | 12 | (0.99 | )11 | (0.98 | ) | — | — | — | ||||||||||||||||||
| AQR INTERNATIONAL MOMENTUM STYLE FUND CLASS I6 | ||||||||||||||||||||||||||||
| FOR THE YEAR ENDED SEPTEMBER 30, 2018 | $15.50 | 0.29 | 0.37 | 0.66 | (0.34 | ) | — | (0.34 | ) | |||||||||||||||||||
| FOR THE YEAR ENDED SEPTEMBER 30, 2017 | $13.86 | 0.31 | 1.65 | 1.96 | (0.32 | ) | — | (0.32 | ) | |||||||||||||||||||
| FOR THE YEAR ENDED SEPTEMBER 30, 2016 | $13.24 | 0.25 | 0.59 | 0.84 | (0.22 | ) | — | (0.22 | ) | |||||||||||||||||||
| FOR THE YEAR ENDED SEPTEMBER 30, 2015 | $14.95 | 0.28 | (1.51 | ) | (1.23 | ) | (0.31 | ) | (0.17 | ) | (0.48 | ) | ||||||||||||||||
| FOR THE YEAR ENDED SEPTEMBER 30, 2014 | $15.29 | 0.27 | 12 | (0.36 | ) | (0.09 | ) | (0.25 | ) | — | (0.25 | ) | ||||||||||||||||
| AQR INTERNATIONAL MOMENTUM STYLE FUND CLASS N | ||||||||||||||||||||||||||||
| FOR THE YEAR ENDED SEPTEMBER 30, 2018 | $15.46 | 0.26 | 0.36 | 0.62 | (0.31 | ) | — | (0.31 | ) | |||||||||||||||||||
| FOR THE YEAR ENDED SEPTEMBER 30, 2017 | $13.82 | 0.28 | 1.65 | 1.93 | (0.29 | ) | — | (0.29 | ) | |||||||||||||||||||
| FOR THE YEAR ENDED SEPTEMBER 30, 2016 | $13.19 | 0.21 | 0.60 | 0.81 | (0.18 | ) | — | (0.18 | ) | |||||||||||||||||||
| FOR THE YEAR ENDED SEPTEMBER 30, 2015 | $14.89 | 0.25 | (1.51 | ) | (1.26 | ) | (0.27 | ) | (0.17 | ) | (0.44 | ) | ||||||||||||||||
| FOR THE YEAR ENDED SEPTEMBER 30, 2014 | $15.25 | 0.22 | 12 | (0.35 | ) | (0.13 | ) | (0.23 | ) | — | (0.23 | ) | ||||||||||||||||
| AQR INTERNATIONAL MOMENTUM STYLE FUND CLASS R6 | ||||||||||||||||||||||||||||
| FOR THE YEAR ENDED SEPTEMBER 30, 2018 | $15.49 | 0.32 | 0.35 | 0.67 | (0.36 | ) | — | (0.36 | ) | |||||||||||||||||||
| FOR THE YEAR ENDED SEPTEMBER 30, 2017 | $13.85 | 0.33 | 1.65 | 1.98 | (0.34 | ) | — | (0.34 | ) | |||||||||||||||||||
| FOR THE YEAR ENDED SEPTEMBER 30, 2016 | $13.23 | 0.27 | 0.59 | 0.86 | (0.24 | ) | — | (0.24 | ) | |||||||||||||||||||
| FOR THE YEAR ENDED SEPTEMBER 30, 2015 | $14.94 | 0.33 | (1.53 | ) | (1.20 | ) | (0.34 | ) | (0.17 | ) | (0.51 | ) | ||||||||||||||||
| FOR THE PERIOD 7/10/148—9/30/14 | $15.54 | 0.05 | 12 | (0.65 | ) | (0.60 | ) | — | — | — | ||||||||||||||||||
| AQR EMERGING MOMENTUM STYLE FUND CLASS I6 | ||||||||||||||||||||||||||||
| FOR THE YEAR ENDED SEPTEMBER 30, 2018 | $10.63 | 0.20 | (0.25 | ) | (0.05 | ) | (0.22 | ) | — | (0.22 | ) | |||||||||||||||||
| FOR THE YEAR ENDED SEPTEMBER 30, 2017 | $8.75 | 0.20 | 1.81 | 2.01 | (0.13 | ) | — | (0.13 | ) | |||||||||||||||||||
| FOR THE YEAR ENDED SEPTEMBER 30, 2016 | $8.29 | 0.10 | 0.59 | 0.69 | (0.23 | ) | — | (0.23 | ) | |||||||||||||||||||
| FOR THE YEAR ENDED SEPTEMBER 30, 2015 | $10.02 | 0.20 | (1.84 | ) | (1.64 | ) | (0.09 | ) | — | (0.09 | ) | |||||||||||||||||
| FOR THE PERIOD 5/13/1415—9/30/14 | $10.00 | 0.09 | (0.07 | ) | 0.02 | — | — | — | ||||||||||||||||||||
| AQR EMERGING MOMENTUM STYLE FUND CLASS N | ||||||||||||||||||||||||||||
| FOR THE YEAR ENDED SEPTEMBER 30, 2018 | $10.62 | 0.17 | (0.25 | ) | (0.08 | ) | (0.19 | ) | — | (0.19 | ) | |||||||||||||||||
| FOR THE YEAR ENDED SEPTEMBER 30, 2017 | $8.74 | 0.18 | 1.80 | 1.98 | (0.10 | ) | — | (0.10 | ) | |||||||||||||||||||
| FOR THE YEAR ENDED SEPTEMBER 30, 2016 | $ 8.27 | 0.09 | 0.59 | 0.68 | (0.21 | ) | — | (0.21 | ) | |||||||||||||||||||
| FOR THE YEAR ENDED SEPTEMBER 30, 2015 | $10.01 | 0.16 | (1.82 | ) | (1.66 | ) | (0.08 | ) | — | (0.08 | ) | |||||||||||||||||
| FOR THE PERIOD 5/13/1415—9/30/14 | $10.00 | 0.09 | (0.08 | ) | 0.01 | — | — | — | ||||||||||||||||||||
| AQR EMERGING MOMENTUM STYLE FUND CLASS R6 | ||||||||||||||||||||||||||||
| FOR THE YEAR ENDED SEPTEMBER 30, 2018 | $10.64 | 0.22 | (0.27 | ) | (0.05 | ) | (0.22 | ) | — | (0.22 | ) | |||||||||||||||||
| FOR THE YEAR ENDED SEPTEMBER 30, 2017 | $8.76 | 0.23 | 1.78 | 2.01 | (0.13 | ) | — | (0.13 | ) | |||||||||||||||||||
| FOR THE YEAR ENDED SEPTEMBER 30, 2016 | $8.30 | 0.14 | 0.56 | 0.70 | (0.24 | ) | — | (0.24 | ) | |||||||||||||||||||
| FOR THE YEAR ENDED SEPTEMBER 30, 2015 | $10.02 | 0.19 | (1.81 | ) | (1.62 | ) | (0.10 | ) | — | (0.10 | ) | |||||||||||||||||
| FOR THE PERIOD 7/10/148—9/30/14 | $10.63 | 0.05 | (0.66 | )11 | (0.61 | ) | — | — | — | |||||||||||||||||||
| The accompanying notes are an integral part of these financial statements. |
| AQR Funds | Annual Report | September 2018 | ||||||||||||||
256
Table of Contents
| Financial Highlights | September 30, 2018 |
| RATIOS/SUPPLEMENTAL DATA | ||||||||||||||||||||||||||||||||||
| Ratios to Average Net Assets of:* | ||||||||||||||||||||||||||||||||||
| Net Asset Value, End of Period | Total Return2,3 | Net Assets, End of Period (000’s) | Expenses, Before Reimbursements and/or Waivers4 | Expenses, Net of Reimbursements and/or Waivers4 | Expenses, Net of Reimbursements and/or Waivers (Excluding Dividend Short Expense & Interest Expense)4 | Net Investment Income (Loss) | Portfolio Turnover Rate5 | |||||||||||||||||||||||||||
| $27.14 | 20.11 | % | $346,665 | 0.63 | % | 0.60 | % | 0.60 | % | 0.21 | %19 | 73 | % | |||||||||||||||||||||
| $24.83 | 20.30 | % | $359,470 | 0.64 | % | 0.60 | % | 0.60 | % | 0.46 | %9 | 86 | % | |||||||||||||||||||||
| $20.80 | 10.24 | % | $317,154 | 0.65 | % | 0.60 | % | 0.60 | % | 0.77 | % | 85 | % | |||||||||||||||||||||
| $19.10 | 1.17 | % | $316,232 | 0.68 | % | 0.63 | % | 0.62 | % | 0.69 | %10 | 86 | % | |||||||||||||||||||||
| $21.09 | 3.07 | % | $301,173 | 0.68 | % | 0.65 | % | 0.65 | % | 0.01 | %12 | 83 | % | |||||||||||||||||||||
| $27.14 | 19.84 | % | $2,835 | 0.85 | % | 0.83 | % | 0.83 | % | (0.02 | )%19 | 73 | % | |||||||||||||||||||||
| $24.82 | 20.02 | % | $1,720 | 0.86 | % | 0.82 | % | 0.82 | % | 0.24 | %9 | 86 | % | |||||||||||||||||||||
| $20.68 | 9.96 | % | $1,574 | 0.91 | % | 0.84 | % | 0.84 | % | 0.47 | % | 85 | % | |||||||||||||||||||||
| $18.99 | 0.89 | % | $8,195 | 0.94 | % | 0.88 | % | 0.87 | % | 0.43 | %10 | 86 | % | |||||||||||||||||||||
| $21.00 | 2.83 | % | $7,189 | 1.04 | % | 0.90 | % | 0.90 | % | (0.26 | )%12 | 83 | % | |||||||||||||||||||||
| $27.10 | 20.26 | % | $21,162 | 0.53 | % | 0.50 | % | 0.50 | % | 0.31 | %19 | 73 | % | |||||||||||||||||||||
| $24.79 | 20.39 | % | $11,914 | 0.54 | % | 0.50 | % | 0.50 | % | 0.54 | %9 | 86 | % | |||||||||||||||||||||
| $20.77 | 10.30 | % | $8,490 | 0.56 | % | 0.50 | % | 0.50 | % | 0.69 | % | 85 | % | |||||||||||||||||||||
| $19.09 | 1.25 | % | $77,416 | 0.59 | % | 0.50 | % | 0.50 | % | 0.62 | %10 | 86 | % | |||||||||||||||||||||
| $21.10 | (4.44 | )% | $96 | 0.63 | % | 0.55 | % | 0.55 | % | 0.13 | %12 | 83 | % | |||||||||||||||||||||
| $15.82 | 4.31 | % | $348,643 | 0.60 | % | 0.55 | % | 0.55 | % | 1.84 | % | 65 | % | |||||||||||||||||||||
| $15.50 | 14.67 | % | $326,526 | 0.63 | % | 0.55 | %13 | 0.55 | %13 | 2.26 | %14 | 84 | % | |||||||||||||||||||||
| $13.86 | 6.40 | % | $272,002 | 0.63 | % | 0.55 | % | 0.55 | % | 1.89 | % | 85 | % | |||||||||||||||||||||
| $13.24 | (8.40 | )% | $257,299 | 0.68 | % | 0.60 | % | 0.60 | % | 1.95 | % | 112 | % | |||||||||||||||||||||
| $14.95 | (0.64 | )% | $279,838 | 0.71 | % | 0.65 | % | 0.65 | % | 1.73 | %12 | 98 | % | |||||||||||||||||||||
| $15.77 | 4.02 | % | $40,452 | 0.85 | % | 0.80 | % | 0.80 | % | 1.61 | % | 65 | % | |||||||||||||||||||||
| $15.46 | 14.38 | % | $34,030 | 0.88 | % | 0.80 | %13 | 0.80 | %13 | 1.99 | %14 | 84 | % | |||||||||||||||||||||
| $13.82 | 6.16 | % | $30,502 | 0.87 | % | 0.80 | % | 0.79 | % | 1.59 | % | 85 | % | |||||||||||||||||||||
| $13.19 | (8.62 | )% | $35,343 | 0.94 | % | 0.85 | % | 0.85 | % | 1.71 | % | 112 | % | |||||||||||||||||||||
| $14.89 | (0.91 | )% | $40,054 | 1.00 | % | 0.90 | % | 0.90 | % | 1.42 | %12 | 98 | % | |||||||||||||||||||||
| $15.80 | 4.34 | % | $63,978 | 0.50 | % | 0.45 | % | 0.45 | % | 1.99 | % | 65 | % | |||||||||||||||||||||
| $15.49 | 14.80 | % | $45,913 | 0.53 | % | 0.45 | %13 | 0.45 | %13 | 2.35 | %14 | 84 | % | |||||||||||||||||||||
| $13.85 | 6.53 | % | $35,382 | 0.53 | % | 0.45 | % | 0.45 | % | 1.98 | % | 85 | % | |||||||||||||||||||||
| $13.23 | (8.24 | )% | $31,058 | 0.55 | % | 0.46 | % | 0.46 | % | 2.31 | % | 112 | % | |||||||||||||||||||||
| $14.94 | (3.86 | )% | $96 | 0.64 | % | 0.55 | % | 0.55 | % | 1.38 | %12 | 98 | % | |||||||||||||||||||||
| $10.36 | (0.63 | )% | $8,935 | 2.19 | % | 0.68 | % | 0.68 | % | 1.76 | % | 110 | % | |||||||||||||||||||||
| $10.63 | 23.48 | % | $10,722 | 2.52 | % | 0.68 | % | 0.68 | % | 2.19 | % | 121 | % | |||||||||||||||||||||
| $8.75 | 8.53 | % | $8,784 | 2.75 | % | 0.65 | % | 0.65 | % | 1.26 | % | 155 | % | |||||||||||||||||||||
| $8.29 | (16.45 | )% | $6,612 | 2.92 | % | 0.75 | % | 0.75 | % | 2.06 | % | 159 | % | |||||||||||||||||||||
| $10.02 | 0.20 | % | $6,260 | 4.03 | %16,17 | 0.80 | % | 0.80 | % | 2.27 | % | 72 | % | |||||||||||||||||||||
| $10.35 | (0.84 | )% | $1,148 | 2.44 | % | 0.94 | % | 0.93 | % | 1.54 | % | 110 | % | |||||||||||||||||||||
| $10.62 | 23.06 | % | $1,198 | 2.73 | % | 0.89 | % | 0.89 | % | 1.99 | % | 121 | % | |||||||||||||||||||||
| $8.74 | 8.38 | % | $1,105 | 2.95 | % | 0.89 | % | 0.89 | % | 1.10 | % | 155 | % | |||||||||||||||||||||
| $8.27 | (16.72 | )% | $1,132 | 3.17 | % | 1.00 | % | 1.00 | % | 1.68 | % | 159 | % | |||||||||||||||||||||
| $10.01 | 0.10 | % | $1,034 | 4.18 | %16,17 | 1.05 | % | 1.05 | % | 2.13 | % | 72 | % | |||||||||||||||||||||
| $10.37 | (0.56 | )% | $2,310 | 2.11 | % | 0.60 | % | 0.60 | % | 2.01 | % | 110 | % | |||||||||||||||||||||
| $10.64 | 23.52 | % | $1,772 | 2.43 | % | 0.60 | % | 0.60 | % | 2.44 | % | 121 | % | |||||||||||||||||||||
| $8.76 | 8.63 | % | $938 | 2.69 | % | 0.60 | % | 0.60 | % | 1.69 | % | 155 | % | |||||||||||||||||||||
| $8.30 | (16.34 | )% | $80 | 3.02 | % | 0.66 | % | 0.66 | % | 1.93 | % | 159 | % | |||||||||||||||||||||
| $10.02 | (5.74 | )% | $94 | 3.73 | %16,17 | 0.70 | % | 0.70 | % | 2.01 | % | 72 | % | |||||||||||||||||||||
| The accompanying notes are an integral part of these financial statements. |
| AQR Funds | Annual Report | September 2018 | ||||||||||||||
257
Table of Contents
| Financial Highlights | September 30, 2018 |
| PER SHARE OPERATING PERFORMANCE | ||||||||||||||||||||||||||||
| Change in Net Assets Resulting from Operations1 | Less Dividends and Distributions | |||||||||||||||||||||||||||
| Net Asset Value, Beginning of Period | Net Investment Income (Loss) | Net Realized and Unrealized Gain (Loss) | Net Increase (Decrease) in Net Asset Value from Operations | Distributions from Net Investment Income | Distributions from Net Realized Gains | Total Distributions | ||||||||||||||||||||||
| AQR TM LARGE CAP MOMENTUM STYLE FUND CLASS I6 | ||||||||||||||||||||||||||||
| FOR THE YEAR ENDED SEPTEMBER 30, 2018 | $19.43 | 0.18 | 4.63 | 4.81 | (0.16 | ) | — | (0.16 | ) | |||||||||||||||||||
| FOR THE YEAR ENDED SEPTEMBER 30, 2017 | $16.97 | 0.20 | 2.51 | 2.71 | (0.25 | ) | — | (0.25 | ) | |||||||||||||||||||
| FOR THE YEAR ENDED SEPTEMBER 30, 2016 | $15.54 | 0.23 | 18 | 1.35 | 1.58 | (0.15 | ) | — | (0.15 | ) | ||||||||||||||||||
| FOR THE YEAR ENDED SEPTEMBER 30, 2015 | $15.90 | 0.18 | (0.19 | ) | (0.01 | ) | (0.08 | ) | (0.27 | ) | (0.35 | ) | ||||||||||||||||
| FOR THE YEAR ENDED SEPTEMBER 30, 2014 | $13.60 | 0.09 | 2.36 | 2.45 | (0.04 | ) | (0.11 | ) | (0.15 | ) | ||||||||||||||||||
| AQR TM LARGE CAP MOMENTUM STYLE FUND CLASS N | ||||||||||||||||||||||||||||
| FOR THE YEAR ENDED SEPTEMBER 30, 2018 | $19.36 | 0.12 | 4.61 | 4.73 | (0.15 | ) | — | (0.15 | ) | |||||||||||||||||||
| FOR THE YEAR ENDED SEPTEMBER 30, 2017 | $16.92 | 0.15 | 2.51 | 2.66 | (0.22 | ) | — | (0.22 | ) | |||||||||||||||||||
| FOR THE YEAR ENDED SEPTEMBER 30, 2016 | $15.50 | 0.20 | 18 | 1.36 | 1.56 | (0.14 | ) | — | (0.14 | ) | ||||||||||||||||||
| FOR THE YEAR ENDED SEPTEMBER 30, 2015 | $15.86 | 0.15 | (0.20 | ) | (0.05 | ) | (0.04 | ) | (0.27 | ) | (0.31 | ) | ||||||||||||||||
| FOR THE YEAR ENDED SEPTEMBER 30, 2014 | $13.57 | 0.04 | 2.37 | 2.41 | (0.01 | ) | (0.11 | ) | (0.12 | ) | ||||||||||||||||||
| AQR TM LARGE CAP MOMENTUM STYLE FUND CLASS R6 | ||||||||||||||||||||||||||||
| FOR THE YEAR ENDED SEPTEMBER 30, 2018 | $19.41 | 0.20 | 4.63 | 4.83 | (0.18 | ) | — | (0.18 | ) | |||||||||||||||||||
| FOR THE YEAR ENDED SEPTEMBER 30, 2017 | $16.95 | 0.22 | 2.51 | 2.73 | (0.27 | ) | — | (0.27 | ) | |||||||||||||||||||
| FOR THE YEAR ENDED SEPTEMBER 30, 2016 | $15.54 | 0.24 | 18 | 1.36 | 1.60 | (0.19 | ) | — | (0.19 | ) | ||||||||||||||||||
| FOR THE YEAR ENDED SEPTEMBER 30, 2015 | $15.90 | 0.19 | (0.19 | ) | 0.00 | 7 | (0.09 | ) | (0.27 | ) | (0.36 | ) | ||||||||||||||||
| FOR THE PERIOD 7/10/148—9/30/14 | $15.78 | 0.03 | 0.09 | 0.12 | — | — | — | |||||||||||||||||||||
| AQR TM SMALL CAP MOMENTUM STYLE FUND CLASS I6 | ||||||||||||||||||||||||||||
| FOR THE YEAR ENDED SEPTEMBER 30, 2018 | $19.06 | 0.04 | 3.52 | 3.56 | (0.05 | ) | (0.01 | ) | (0.06 | ) | ||||||||||||||||||
| FOR THE YEAR ENDED SEPTEMBER 30, 2017 | $15.86 | 0.08 | 3.24 | 3.32 | (0.12 | ) | — | (0.12 | ) | |||||||||||||||||||
| FOR THE YEAR ENDED SEPTEMBER 30, 2016 | $14.51 | 0.12 | 1.33 | 1.45 | (0.10 | ) | — | (0.10 | ) | |||||||||||||||||||
| FOR THE YEAR ENDED SEPTEMBER 30, 2015 | $14.72 | 0.11 | 10 | 0.23 | 11 | 0.34 | (0.01 | ) | (0.54 | ) | (0.55 | ) | ||||||||||||||||
| FOR THE YEAR ENDED SEPTEMBER 30, 2014 | $14.85 | 0.01 | 0.15 | 0.16 | (0.04 | ) | (0.25 | ) | (0.29 | ) | ||||||||||||||||||
| AQR TM SMALL CAP MOMENTUM STYLE FUND CLASS N | ||||||||||||||||||||||||||||
| FOR THE YEAR ENDED SEPTEMBER 30, 2018 | $18.96 | (0.01 | ) | 3.49 | 3.48 | (0.04 | ) | (0.01 | ) | (0.05 | ) | |||||||||||||||||
| FOR THE YEAR ENDED SEPTEMBER 30, 2017 | $15.79 | 0.03 | 3.23 | 3.26 | (0.09 | ) | — | (0.09 | ) | |||||||||||||||||||
| FOR THE YEAR ENDED SEPTEMBER 30, 2016 | $14.44 | 0.10 | 1.33 | 1.43 | (0.08 | ) | — | (0.08 | ) | |||||||||||||||||||
| FOR THE YEAR ENDED SEPTEMBER 30, 2015 | $14.67 | 0.07 | 10 | 0.24 | 11 | 0.31 | — | (0.54 | ) | (0.54 | ) | |||||||||||||||||
| FOR THE YEAR ENDED SEPTEMBER 30, 2014 | $14.81 | (0.03 | ) | 0.14 | 0.11 | (0.00 | )7 | (0.25 | ) | (0.25 | ) | |||||||||||||||||
| AQR TM SMALL CAP MOMENTUM STYLE FUND CLASS R6 | ||||||||||||||||||||||||||||
| FOR THE YEAR ENDED SEPTEMBER 30, 2018 | $19.06 | 0.07 | 3.51 | 3.58 | (0.07 | ) | (0.01 | ) | (0.08 | ) | ||||||||||||||||||
| FOR THE YEAR ENDED SEPTEMBER 30, 2017 | $15.86 | 0.10 | 3.23 | 3.33 | (0.13 | ) | — | (0.13 | ) | |||||||||||||||||||
| FOR THE YEAR ENDED SEPTEMBER 30, 2016 | $14.50 | 0.14 | 1.34 | 1.48 | (0.12 | ) | — | (0.12 | ) | |||||||||||||||||||
| FOR THE YEAR ENDED SEPTEMBER 30, 2015 | $14.72 | 0.12 | 10 | 0.24 | 11 | 0.36 | (0.04 | ) | (0.54 | ) | (0.58 | ) | ||||||||||||||||
| FOR THE PERIOD 7/10/148—9/30/14 | $15.45 | 0.01 | (0.74 | )11 | (0.73 | ) | — | — | — | |||||||||||||||||||
| The accompanying notes are an integral part of these financial statements. |
| AQR Funds | Annual Report | September 2018 | ||||||||||||||
258
Table of Contents
| Financial Highlights | September 30, 2018 |
| RATIOS/SUPPLEMENTAL DATA | ||||||||||||||||||||||||||||||||||
| Ratios to Average Net Assets of:* | ||||||||||||||||||||||||||||||||||
| Net Asset Value, End of Period | Total Return2,3 | Net Assets, End of Period (000’s) | Expenses, Before Reimbursements and/or Waivers4 | Expenses, Net of Reimbursements and/or Waivers4 | Expenses, Net of Reimbursements and/or Waivers (Excluding Dividend Short Expense & Interest Expense)4 | Net Investment Income (Loss) | Portfolio Turnover Rate5 | |||||||||||||||||||||||||||
| $24.08 | 24.87 | % | $112,851 | 0.45 | % | 0.40 | % | 0.40 | % | 0.82 | % | 50 | % | |||||||||||||||||||||
| $19.43 | 16.16 | % | $87,151 | 0.48 | % | 0.40 | % | 0.40 | % | 1.14 | % | 57 | % | |||||||||||||||||||||
| $16.97 | 10.22 | % | $67,397 | 0.49 | % | 0.40 | % | 0.40 | % | 1.39 | %18 | 49 | % | |||||||||||||||||||||
| $15.54 | (0.16 | )% | $56,141 | 0.65 | % | 0.48 | % | 0.48 | % | 1.08 | % | 62 | % | |||||||||||||||||||||
| $15.90 | 18.15 | % | $101,336 | 0.69 | % | 0.54 | % | 0.54 | % | 0.57 | % | 153 | % | |||||||||||||||||||||
| $23.94 | 24.53 | % | $13,548 | 0.70 | % | 0.65 | % | 0.65 | % | 0.57 | % | 50 | % | |||||||||||||||||||||
| $19.36 | 15.89 | % | $8,524 | 0.70 | % | 0.65 | % | 0.65 | % | 0.78 | % | 57 | % | |||||||||||||||||||||
| $16.92 | 10.11 | % | $161 | 0.65 | % | 0.56 | % | 0.56 | % | 1.22 | %18 | 49 | % | |||||||||||||||||||||
| $15.50 | (0.39 | )% | $147 | 0.75 | % | 0.64 | % | 0.64 | % | 0.89 | % | 62 | % | |||||||||||||||||||||
| $15.86 | 17.81 | % | $137 | 1.60 | % | 0.79 | % | 0.79 | % | 0.30 | % | 153 | % | |||||||||||||||||||||
| $24.06 | 25.00 | % | $102,013 | 0.35 | % | 0.30 | % | 0.30 | % | 0.92 | % | 50 | % | |||||||||||||||||||||
| $19.41 | 16.30 | % | $84,514 | 0.38 | % | 0.30 | % | 0.30 | % | 1.25 | % | 57 | % | |||||||||||||||||||||
| $16.95 | 10.32 | % | $80,190 | 0.39 | % | 0.30 | % | 0.30 | % | 1.48 | %18 | 49 | % | |||||||||||||||||||||
| $15.54 | (0.09 | )% | $70,197 | 0.43 | % | 0.31 | % | 0.31 | % | 1.15 | % | 62 | % | |||||||||||||||||||||
| $15.90 | 0.76 | % | $101 | 0.67 | % | 0.44 | % | 0.44 | % | 0.77 | % | 153 | % | |||||||||||||||||||||
| $22.56 | 18.75 | % | $62,800 | 0.81 | % | 0.60 | % | 0.60 | % | 0.22 | % | 67 | % | |||||||||||||||||||||
| $19.06 | 21.02 | % | $47,847 | 0.92 | % | 0.60 | % | 0.60 | % | 0.47 | % | 69 | % | |||||||||||||||||||||
| $15.86 | 10.07 | % | $33,229 | 1.10 | % | 0.60 | % | 0.60 | % | 0.83 | % | 92 | % | |||||||||||||||||||||
| $14.51 | 2.13 | % | $19,992 | 1.34 | % | 0.64 | % | 0.64 | % | 0.68 | %10 | 111 | % | |||||||||||||||||||||
| $14.72 | 0.98 | % | $14,690 | 1.61 | % | 0.70 | % | 0.70 | % | 0.04 | % | 154 | % | |||||||||||||||||||||
| $22.39 | 18.43 | % | $5,720 | 1.06 | % | 0.85 | % | 0.85 | % | (0.04 | )% | 67 | % | |||||||||||||||||||||
| $18.96 | 20.73 | % | $3,230 | 1.12 | % | 0.84 | % | 0.84 | % | 0.15 | % | 69 | % | |||||||||||||||||||||
| $15.79 | 9.95 | % | $154 | 1.26 | % | 0.76 | % | 0.76 | % | 0.65 | % | 92 | % | |||||||||||||||||||||
| $14.44 | 1.90 | % | $127 | 1.49 | % | 0.86 | % | 0.86 | % | 0.45 | %10 | 111 | % | |||||||||||||||||||||
| $14.67 | 0.69 | % | $125 | 2.44 | % | 0.95 | % | 0.95 | % | (0.21 | )% | 154 | % | |||||||||||||||||||||
| $22.56 | 18.85 | % | $228 | 0.71 | % | 0.50 | % | 0.50 | % | 0.32 | % | 67 | % | |||||||||||||||||||||
| $19.06 | 21.11 | % | $200 | 0.83 | % | 0.50 | % | 0.50 | % | 0.58 | % | 69 | % | |||||||||||||||||||||
| $15.86 | 10.24 | % | $166 | 1.00 | % | 0.50 | % | 0.50 | % | 0.92 | % | 92 | % | |||||||||||||||||||||
| $14.50 | 2.23 | % | $97 | 1.24 | % | 0.54 | % | 0.54 | % | 0.77 | %10 | 111 | % | |||||||||||||||||||||
| $14.72 | (4.72 | )% | $95 | 1.65 | % | 0.60 | % | 0.60 | % | 0.22 | % | 154 | % | |||||||||||||||||||||
| The accompanying notes are an integral part of these financial statements. |
| AQR Funds | Annual Report | September 2018 | ||||||||||||||
259
Table of Contents
| Financial Highlights | September 30, 2018 |
| PER SHARE OPERATING PERFORMANCE | ||||||||||||||||||||||||||||
| Change in Net Assets Resulting from Operations1 | Less Dividends and Distributions | |||||||||||||||||||||||||||
| Net Asset Value, Beginning of Period | Net Investment Income (Loss) | Net Realized and Unrealized Gain (Loss) | Net Increase (Decrease) in Net Asset Value from Operations | Distributions from Net Investment Income | Distributions from Net Realized Gains | Total Distributions | ||||||||||||||||||||||
| AQR TM INTERNATIONAL MOMENTUM STYLE FUND CLASS I6 | ||||||||||||||||||||||||||||
| FOR THE YEAR ENDED SEPTEMBER 30, 2018 | $13.70 | 0.27 | 0.13 | 0.40 | (0.24 | ) | — | (0.24 | ) | |||||||||||||||||||
| FOR THE YEAR ENDED SEPTEMBER 30, 2017 | $12.27 | 0.27 | 1.45 | 1.72 | (0.29 | ) | — | (0.29 | ) | |||||||||||||||||||
| FOR THE YEAR ENDED SEPTEMBER 30, 2016 | $11.70 | 0.23 | 0.49 | 0.72 | (0.15 | ) | — | (0.15 | ) | |||||||||||||||||||
| FOR THE YEAR ENDED SEPTEMBER 30, 2015 | $13.09 | 0.20 | (1.28 | ) | (1.08 | ) | (0.25 | ) | (0.06 | ) | (0.31 | ) | ||||||||||||||||
| FOR THE YEAR ENDED SEPTEMBER 30, 2014 | $13.18 | 0.23 | 12 | (0.10 | ) | 0.13 | (0.06 | ) | (0.16 | ) | (0.22 | ) | ||||||||||||||||
| AQR TM INTERNATIONAL MOMENTUM STYLE FUND CLASS N | ||||||||||||||||||||||||||||
| FOR THE YEAR ENDED SEPTEMBER 30, 2018 | $13.63 | 0.24 | 0.13 | 0.37 | (0.23 | ) | — | (0.23 | ) | |||||||||||||||||||
| FOR THE YEAR ENDED SEPTEMBER 30, 2017 | $12.22 | 0.27 | 1.41 | 1.68 | (0.27 | ) | — | (0.27 | ) | |||||||||||||||||||
| FOR THE YEAR ENDED SEPTEMBER 30, 2016 | $11.68 | 0.19 | 0.51 | 0.70 | (0.16 | ) | — | (0.16 | ) | |||||||||||||||||||
| FOR THE YEAR ENDED SEPTEMBER 30, 2015 | $13.06 | 0.21 | (1.30 | ) | (1.09 | ) | (0.23 | ) | (0.06 | ) | (0.29 | ) | ||||||||||||||||
| FOR THE YEAR ENDED SEPTEMBER 30, 2014 | $13.15 | 0.17 | 12 | (0.08 | ) | 0.09 | (0.02 | ) | (0.16 | ) | (0.18 | ) | ||||||||||||||||
| AQR TM INTERNATIONAL MOMENTUM STYLE FUND CLASS R6 | ||||||||||||||||||||||||||||
| FOR THE YEAR ENDED SEPTEMBER 30, 2018 | $13.67 | 0.27 | 0.14 | 0.41 | (0.25 | ) | — | (0.25 | ) | |||||||||||||||||||
| FOR THE YEAR ENDED SEPTEMBER 30, 2017 | $12.24 | 0.28 | 1.45 | 1.73 | (0.30 | ) | — | (0.30 | ) | |||||||||||||||||||
| FOR THE YEAR ENDED SEPTEMBER 30, 2016 | $11.70 | 0.23 | 0.50 | 0.73 | (0.19 | ) | — | (0.19 | ) | |||||||||||||||||||
| FOR THE YEAR ENDED SEPTEMBER 30, 2015 | $13.09 | 0.31 | (1.37 | ) | (1.06 | ) | (0.27 | ) | (0.06 | ) | (0.33 | ) | ||||||||||||||||
| FOR THE PERIOD 7/10/148—9/30/14 | $13.66 | 0.03 | 12 | (0.60 | ) | (0.57 | ) | — | — | — | ||||||||||||||||||
| AQR LARGE CAP DEFENSIVE STYLE FUND CLASS I | ||||||||||||||||||||||||||||
| FOR THE YEAR ENDED SEPTEMBER 30, 2018 | $18.23 | 0.30 | 3.10 | 3.40 | (0.27 | ) | (0.18 | ) | (0.45 | ) | ||||||||||||||||||
| FOR THE YEAR ENDED SEPTEMBER 30, 2017 | $15.71 | 0.29 | 2.55 | 2.84 | (0.23 | ) | (0.09 | ) | (0.32 | ) | ||||||||||||||||||
| FOR THE YEAR ENDED SEPTEMBER 30, 2016 | $14.64 | 0.27 | 1.70 | 1.97 | (0.14 | ) | (0.76 | ) | (0.90 | ) | ||||||||||||||||||
| FOR THE YEAR ENDED SEPTEMBER 30, 2015 | $14.07 | 0.24 | 1.04 | 1.28 | (0.29 | ) | (0.42 | ) | (0.71 | ) | ||||||||||||||||||
| FOR THE YEAR ENDED SEPTEMBER 30, 2014 | $12.20 | 0.20 | 1.79 | 1.99 | (0.08 | ) | (0.04 | ) | (0.12 | ) | ||||||||||||||||||
| AQR LARGE CAP DEFENSIVE STYLE FUND CLASS N | ||||||||||||||||||||||||||||
| FOR THE YEAR ENDED SEPTEMBER 30, 2018 | $18.18 | 0.25 | 3.09 | 3.34 | (0.23 | ) | (0.18 | ) | (0.41 | ) | ||||||||||||||||||
| FOR THE YEAR ENDED SEPTEMBER 30, 2017 | $15.68 | 0.25 | 2.54 | 2.79 | (0.20 | ) | (0.09 | ) | (0.29 | ) | ||||||||||||||||||
| FOR THE YEAR ENDED SEPTEMBER 30, 2016 | $14.64 | 0.23 | 1.70 | 1.93 | (0.13 | ) | (0.76 | ) | (0.89 | ) | ||||||||||||||||||
| FOR THE YEAR ENDED SEPTEMBER 30, 2015 | $14.04 | 0.20 | 1.05 | 1.25 | (0.23 | ) | (0.42 | ) | (0.65 | ) | ||||||||||||||||||
| FOR THE YEAR ENDED SEPTEMBER 30, 2014 | $12.19 | 0.17 | 1.79 | 1.96 | (0.07 | ) | (0.04 | ) | (0.11 | ) | ||||||||||||||||||
| AQR LARGE CAP DEFENSIVE STYLE FUND CLASS R6 | ||||||||||||||||||||||||||||
| FOR THE YEAR ENDED SEPTEMBER 30, 2018 | $18.21 | 0.32 | 3.09 | 3.41 | (0.29 | ) | (0.18 | ) | (0.47 | ) | ||||||||||||||||||
| FOR THE YEAR ENDED SEPTEMBER 30, 2017 | $15.69 | 0.30 | 2.55 | 2.85 | (0.24 | ) | (0.09 | ) | (0.33 | ) | ||||||||||||||||||
| FOR THE YEAR ENDED SEPTEMBER 30, 2016 | $14.62 | 0.29 | 1.69 | 1.98 | (0.15 | ) | (0.76 | ) | (0.91 | ) | ||||||||||||||||||
| FOR THE YEAR ENDED SEPTEMBER 30, 2015 | $14.07 | 0.26 | 1.03 | 1.29 | (0.32 | ) | (0.42 | ) | (0.74 | ) | ||||||||||||||||||
| FOR THE PERIOD 9/02/148—9/30/14 | $14.13 | 0.02 | (0.08 | )11 | (0.06 | ) | — | — | — | |||||||||||||||||||
| The accompanying notes are an integral part of these financial statements. |
| AQR Funds | Annual Report | September 2018 | ||||||||||||||
260
Table of Contents
| Financial Highlights | September 30, 2018 |
| RATIOS/SUPPLEMENTAL DATA | ||||||||||||||||||||||||||||||||||
| Ratios to Average Net Assets of:* | ||||||||||||||||||||||||||||||||||
| Net Asset Value, End of Period | Total Return2,3 | Net Assets, End of Period (000’s) | Expenses, Before Reimbursements and/or Waivers4 | Expenses, Net of Reimbursements and/or Waivers4 | Expenses, Net of Reimbursements and/or Waivers (Excluding Dividend Short Expense & Interest Expense)4 | Net Investment Income (Loss) | Portfolio Turnover Rate5 | |||||||||||||||||||||||||||
| |
|
| ||||||||||||||||||||||||||||||||
| $13.86 | 2.93 | % | $58,512 | 0.70 | % | 0.55 | % | 0.55 | % | 1.90 | % | 34 | % | |||||||||||||||||||||
| $13.70 | 14.49 | % | $44,119 | 0.74 | % | 0.55 | %13 | 0.55 | %13 | 2.22 | %14 | 62 | % | |||||||||||||||||||||
| $12.27 | 6.18 | % | $33,887 | 0.76 | % | 0.55 | % | 0.55 | % | 1.90 | % | 87 | % | |||||||||||||||||||||
| $11.70 | (8.36 | )% | $23,699 | 0.94 | % | 0.65 | % | 0.65 | % | 1.57 | % | 147 | % | |||||||||||||||||||||
| $13.09 | 0.97 | % | $81,624 | 0.91 | % | 0.70 | % | 0.70 | % | 1.73 | %12 | 185 | % | |||||||||||||||||||||
| |
|
| ||||||||||||||||||||||||||||||||
| $13.77 | 2.75 | % | $7,817 | 0.95 | % | 0.80 | % | 0.80 | % | 1.75 | % | 34 | % | |||||||||||||||||||||
| $13.63 | 14.23 | % | $4,800 | 0.95 | % | 0.80 | %13 | 0.80 | %13 | 2.08 | %14 | 62 | % | |||||||||||||||||||||
| $12.22 | 6.01 | % | $160 | 0.93 | % | 0.72 | % | 0.72 | % | 1.61 | % | 87 | % | |||||||||||||||||||||
| $11.68 | (8.51 | )% | $103 | 1.03 | % | 0.79 | % | 0.78 | % | 1.69 | % | 147 | % | |||||||||||||||||||||
| $13.06 | 0.69 | % | $112 | 1.92 | % | 0.95 | % | 0.95 | % | 1.26 | %12 | 185 | % | |||||||||||||||||||||
| |
|
| ||||||||||||||||||||||||||||||||
| $13.83 | 3.03 | % | $62,790 | 0.60 | % | 0.45 | % | 0.45 | % | 1.95 | % | 34 | % | |||||||||||||||||||||
| $13.67 | 14.66 | % | $56,847 | 0.65 | % | 0.45 | %13 | 0.45 | %13 | 2.27 | %14 | 62 | % | |||||||||||||||||||||
| $12.24 | 6.25 | % | $55,739 | 0.66 | % | 0.45 | % | 0.45 | % | 1.97 | % | 87 | % | |||||||||||||||||||||
| $11.70 | (8.25 | )% | $48,003 | 0.70 | % | 0.46 | % | 0.46 | % | 2.40 | % | 147 | % | |||||||||||||||||||||
| $13.09 | (4.17 | )% | $96 | 0.94 | % | 0.60 | % | 0.60 | % | 1.13 | %12 | 185 | % | |||||||||||||||||||||
| $21.18 | 18.92 | % | $1,502,430 | 0.39 | % | 0.39 | % | 0.39 | % | 1.52 | % | 18 | % | |||||||||||||||||||||
| $18.23 | 18.32 | % | $793,828 | 0.41 | % | 0.40 | % | 0.40 | % | 1.69 | % | 16 | % | |||||||||||||||||||||
| $15.71 | 14.00 | % | $519,984 | 0.42 | % | 0.39 | % | 0.39 | % | 1.79 | % | 8 | % | |||||||||||||||||||||
| $14.64 | 9.13 | % | $158,468 | 0.55 | % | 0.45 | % | 0.45 | % | 1.65 | % | 24 | % | |||||||||||||||||||||
| $14.07 | 16.44 | % | $224,826 | 0.62 | % | 0.49 | % | 0.49 | % | 1.51 | % | 16 | % | |||||||||||||||||||||
| $21.11 | 18.58 | % | $309,274 | 0.65 | % | 0.64 | % | 0.64 | % | 1.27 | % | 18 | % | |||||||||||||||||||||
| $18.18 | 17.99 | % | $239,074 | 0.67 | % | 0.65 | % | 0.65 | % | 1.46 | % | 16 | % | |||||||||||||||||||||
| $15.68 | 13.70 | % | $226,020 | 0.68 | % | 0.65 | % | 0.65 | % | 1.53 | % | 8 | % | |||||||||||||||||||||
| $14.64 | 8.97 | % | $30,629 | 0.81 | % | 0.70 | % | 0.70 | % | 1.38 | % | 24 | % | |||||||||||||||||||||
| $14.04 | 16.16 | % | $28,843 | 0.92 | % | 0.74 | % | 0.74 | % | 1.26 | % | 16 | % | |||||||||||||||||||||
| $21.15 | 18.99 | % | $309,211 | 0.30 | % | 0.30 | % | 0.30 | % | 1.61 | % | 18 | % | |||||||||||||||||||||
| $18.21 | 18.43 | % | $197,705 | 0.32 | % | 0.30 | % | 0.30 | % | 1.79 | % | 16 | % | |||||||||||||||||||||
| $15.69 | 14.13 | % | $127,311 | 0.33 | % | 0.30 | % | 0.30 | % | 1.87 | % | 8 | % | |||||||||||||||||||||
| $14.62 | 9.23 | % | $109 | 0.45 | % | 0.35 | % | 0.34 | % | 1.76 | % | 24 | % | |||||||||||||||||||||
| $14.07 | (0.42 | )% | $100 | 0.54 | % | 0.39 | % | 0.39 | % | 1.69 | % | 16 | % | |||||||||||||||||||||
| The accompanying notes are an integral part of these financial statements. |
| AQR Funds | Annual Report | September 2018 | ||||||||||||||
261
Table of Contents
| Financial Highlights | September 30, 2018 |
| PER SHARE OPERATING PERFORMANCE | ||||||||||||||||||||||||||||
| Change in Net Assets Resulting from Operations1 | Less Dividends and Distributions | |||||||||||||||||||||||||||
| Net Asset Value, Beginning of Period | Net Investment Income (Loss) | Net Realized and Unrealized Gain (Loss) | Net Increase (Decrease) in Net Asset Value from Operations | Distributions from Net Investment Income | Distributions from Net Realized Gains | Total Distributions | ||||||||||||||||||||||
| AQR INTERNATIONAL DEFENSIVE STYLE FUND CLASS I | ||||||||||||||||||||||||||||
| FOR THE YEAR ENDED SEPTEMBER 30, 2018 | $13.27 | 0.32 | 19 | 0.10 | 0.42 | (0.29 | ) | (0.02 | ) | (0.31 | ) | |||||||||||||||||
| FOR THE YEAR ENDED SEPTEMBER 30, 2017 | $12.10 | 0.30 | 9 | 1.04 | 1.34 | (0.17 | ) | — | (0.17 | ) | ||||||||||||||||||
| FOR THE YEAR ENDED SEPTEMBER 30, 2016 | $10.95 | 0.29 | 1.09 | 1.38 | (0.23 | ) | — | (0.23 | ) | |||||||||||||||||||
| FOR THE YEAR ENDED SEPTEMBER 30, 2015 | $12.37 | 0.28 | (1.10 | ) | (0.82 | ) | (0.32 | ) | (0.28 | ) | (0.60 | ) | ||||||||||||||||
| FOR THE YEAR ENDED SEPTEMBER 30, 2014 | $11.88 | 0.31 | 0.47 | 0.78 | (0.17 | ) | (0.12 | ) | (0.29 | ) | ||||||||||||||||||
| AQR INTERNATIONAL DEFENSIVE STYLE FUND CLASS N | ||||||||||||||||||||||||||||
| FOR THE YEAR ENDED SEPTEMBER 30, 2018 | $13.58 | 0.26 | 19 | 0.14 | 0.40 | (0.25 | ) | (0.02 | ) | (0.27 | ) | |||||||||||||||||
| FOR THE YEAR ENDED SEPTEMBER 30, 2017 | $12.40 | 0.28 | 9 | 1.06 | 1.34 | (0.16 | ) | — | (0.16 | ) | ||||||||||||||||||
| FOR THE YEAR ENDED SEPTEMBER 30, 2016 | $11.20 | 0.30 | 1.09 | 1.39 | (0.19 | ) | — | (0.19 | ) | |||||||||||||||||||
| FOR THE YEAR ENDED SEPTEMBER 30, 2015 | $12.35 | 0.23 | (1.10 | ) | (0.87 | ) | — | (0.28 | ) | (0.28 | ) | |||||||||||||||||
| FOR THE YEAR ENDED SEPTEMBER 30, 2014 | $11.88 | 0.27 | 0.47 | 0.74 | (0.15 | ) | (0.12 | ) | (0.27 | ) | ||||||||||||||||||
| AQR INTERNATIONAL DEFENSIVE STYLE FUND CLASS R6 | ||||||||||||||||||||||||||||
| FOR THE YEAR ENDED SEPTEMBER 30, 2018 | $13.26 | 0.34 | 19 | 0.10 | 0.44 | (0.30 | ) | (0.02 | ) | (0.32 | ) | |||||||||||||||||
| FOR THE YEAR ENDED SEPTEMBER 30, 2017 | $12.09 | 0.31 | 9 | 1.03 | 1.34 | (0.17 | ) | — | (0.17 | ) | ||||||||||||||||||
| FOR THE YEAR ENDED SEPTEMBER 30, 2016 | $10.94 | 0.36 | 1.03 | 1.39 | (0.24 | ) | — | (0.24 | ) | |||||||||||||||||||
| FOR THE YEAR ENDED SEPTEMBER 30, 2015 | $12.37 | 0.29 | (1.10 | ) | (0.81 | ) | (0.34 | ) | (0.28 | ) | (0.62 | ) | ||||||||||||||||
| FOR THE PERIOD 9/02/148—9/30/14 | $13.02 | 0.03 | (0.68 | )11 | (0.65 | ) | — | — | — | |||||||||||||||||||
| AQR EMERGING DEFENSIVE STYLE FUND CLASS I | ||||||||||||||||||||||||||||
| FOR THE YEAR ENDED SEPTEMBER 30, 2018 | $ 9.44 | 0.19 | 0.17 | 0.36 | (0.16 | ) | — | (0.16 | ) | |||||||||||||||||||
| FOR THE YEAR ENDED SEPTEMBER 30, 2017 | $8.80 | 0.17 | 0.61 | 0.78 | (0.14 | ) | — | (0.14 | ) | |||||||||||||||||||
| FOR THE YEAR ENDED SEPTEMBER 30, 2016 | $8.21 | 0.16 | 0.69 | 0.85 | (0.26 | ) | — | (0.26 | ) | |||||||||||||||||||
| FOR THE YEAR ENDED SEPTEMBER 30, 2015 | $10.46 | 0.19 | (2.26 | ) | (2.07 | ) | (0.18 | ) | — | (0.18 | ) | |||||||||||||||||
| FOR THE YEAR ENDED SEPTEMBER 30, 2014 | $10.27 | 0.25 | 12 | 0.03 | 11 | 0.28 | (0.09 | ) | (0.00 | )7 | (0.09 | ) | ||||||||||||||||
| AQR EMERGING DEFENSIVE STYLE FUND CLASS N | ||||||||||||||||||||||||||||
| FOR THE YEAR ENDED SEPTEMBER 30, 2018 | $9.67 | 0.19 | 0.14 | 0.33 | (0.14 | ) | — | (0.14 | ) | |||||||||||||||||||
| FOR THE YEAR ENDED SEPTEMBER 30, 2017 | $9.00 | 0.20 | 0.59 | 0.79 | (0.12 | ) | — | (0.12 | ) | |||||||||||||||||||
| FOR THE YEAR ENDED SEPTEMBER 30, 2016 | $8.34 | 0.15 | 0.70 | 0.85 | (0.19 | ) | — | (0.19 | ) | |||||||||||||||||||
| FOR THE YEAR ENDED SEPTEMBER 30, 2015 | $10.45 | 0.12 | (2.23 | ) | (2.11 | ) | — | — | — | |||||||||||||||||||
| FOR THE YEAR ENDED SEPTEMBER 30, 2014 | $10.26 | 0.18 | 12 | 0.08 | 11 | 0.26 | (0.07 | ) | (0.00 | )7 | (0.07 | ) | ||||||||||||||||
| AQR EMERGING DEFENSIVE STYLE FUND CLASS R6 | ||||||||||||||||||||||||||||
| FOR THE YEAR ENDED SEPTEMBER 30, 2018 | $9.42 | 0.19 | 0.17 | 0.36 | (0.17 | ) | — | (0.17 | ) | |||||||||||||||||||
| FOR THE YEAR ENDED SEPTEMBER 30, 2017 | $8.77 | 0.18 | 0.62 | 0.80 | (0.15 | ) | — | (0.15 | ) | |||||||||||||||||||
| FOR THE YEAR ENDED SEPTEMBER 30, 2016 | $8.21 | 0.17 | 0.67 | 0.84 | (0.28 | ) | — | (0.28 | ) | |||||||||||||||||||
| FOR THE YEAR ENDED SEPTEMBER 30, 2015 | $10.46 | 0.21 | (2.27 | ) | (2.06 | ) | (0.19 | ) | — | (0.19 | ) | |||||||||||||||||
| FOR THE PERIOD 9/02/148—9/30/14 | $11.15 | 0.03 | 12 | (0.72 | ) | (0.69 | ) | — | — | — | ||||||||||||||||||
| The accompanying notes are an integral part of these financial statements. |
| AQR Funds | Annual Report | September 2018 | ||||||||||||||
262
Table of Contents
| Financial Highlights | September 30, 2018 |
| RATIOS/SUPPLEMENTAL DATA | ||||||||||||||||||||||||||||||||||
| Ratios to Average Net Assets of:* | ||||||||||||||||||||||||||||||||||
| Net Asset Value, End of Period | Total Return2,3 | Net Assets, End of Period (000’s) | Expenses, Before Reimbursements and/or Waivers4 | Expenses, Net of Reimbursements and/or Waivers4 | Expenses, Net of Reimbursements and/or Waivers (Excluding Dividend Short Expense & Interest Expense)4 | Net Investment Income (Loss) | Portfolio Turnover Rate5 | |||||||||||||||||||||||||||
| $13.38 | 3.15 | % | $173,932 | 0.63 | % | 0.55 | % | 0.55 | % | 2.41 | %19 | 21 | % | |||||||||||||||||||||
| $13.27 | 11.29 | % | $145,091 | 0.67 | % | 0.55 | %13 | 0.55 | %13 | 2.43 | %9,14 | 3 | % | |||||||||||||||||||||
| $12.10 | 12.84 | % | $96,844 | 0.83 | % | 0.54 | % | 0.54 | % | 2.51 | % | 83 | % | |||||||||||||||||||||
| $10.95 | (6.89 | )% | $34,191 | 1.11 | % | 0.60 | % | 0.60 | % | 2.40 | % | 47 | % | |||||||||||||||||||||
| $12.37 | 6.68 | % | $27,316 | 1.24 | % | 0.65 | % | 0.65 | % | 2.53 | % | 57 | % | |||||||||||||||||||||
| $13.71 | 2.90 | % | $4,266 | 0.88 | % | 0.80 | % | 0.80 | % | 1.84 | %19 | 21 | % | |||||||||||||||||||||
| $13.58 | 11.01 | % | $30,102 | 0.92 | % | 0.80 | %13 | 0.80 | %13 | 2.21 | %9,14 | 3 | % | |||||||||||||||||||||
| $12.40 | 12.59 | % | $21,135 | 1.08 | % | 0.79 | % | 0.78 | % | 2.51 | % | 83 | % | |||||||||||||||||||||
| $11.20 | (7.15 | )% | $141 | 1.43 | % | 0.86 | % | 0.86 | % | 1.94 | % | 47 | % | |||||||||||||||||||||
| $12.35 | 6.32 | % | $462 | 1.85 | % | 0.90 | % | 0.90 | % | 2.18 | % | 57 | % | |||||||||||||||||||||
| $13.38 | 3.32 | % | $28,741 | 0.53 | % | 0.45 | % | 0.45 | % | 2.54 | %19 | 21 | % | |||||||||||||||||||||
| $13.26 | 11.38 | % | $19,716 | 0.57 | % | 0.45 | %13 | 0.45 | %13 | 2.57 | %9,14 | 3 | % | |||||||||||||||||||||
| $12.09 | 12.95 | % | $14,668 | 0.67 | % | 0.45 | % | 0.45 | % | 3.06 | % | 83 | % | |||||||||||||||||||||
| $10.94 | (6.78 | )% | $89 | 1.01 | % | 0.50 | % | 0.50 | % | 2.45 | % | 47 | % | |||||||||||||||||||||
| $12.37 | (4.99 | )% | $95 | 1.23 | % | 0.55 | % | 0.55 | % | 3.49 | % | 57 | % | |||||||||||||||||||||
| $9.64 | 3.77 | % | $76,491 | 0.97 | % | 0.70 | % | 0.70 | % | 1.94 | % | 16 | % | |||||||||||||||||||||
| $9.44 | 9.17 | % | $62,261 | 1.07 | % | 0.70 | % | 0.70 | % | 1.99 | % | 17 | % | |||||||||||||||||||||
| $8.80 | 10.73 | % | $49,612 | 1.15 | % | 0.68 | % | 0.68 | % | 1.90 | % | 23 | % | |||||||||||||||||||||
| $8.21 | (20.07 | )% | $27,221 | 1.12 | % | 0.76 | % | 0.76 | % | 1.92 | % | 117 | % | |||||||||||||||||||||
| $10.46 | 2.78 | % | $70,070 | 1.23 | % | 0.85 | % | 0.85 | % | 2.35 | %12 | 124 | % | |||||||||||||||||||||
| $9.86 | 3.39 | % | $9,977 | 1.22 | % | 0.95 | % | 0.95 | % | 1.95 | % | 16 | % | |||||||||||||||||||||
| $9.67 | 9.04 | % | $4,922 | 1.28 | % | 0.93 | % | 0.93 | % | 2.21 | % | 17 | % | |||||||||||||||||||||
| $9.00 | 10.42 | % | $207 | 1.38 | % | 0.91 | % | 0.91 | % | 1.79 | % | 23 | % | |||||||||||||||||||||
| $8.34 | (20.19 | )% | $54 | 1.40 | % | 1.03 | % | 1.03 | % | 1.22 | % | 117 | % | |||||||||||||||||||||
| $10.45 | 2.60 | % | $1,017 | 1.68 | % | 1.10 | % | 1.10 | % | 1.73 | %12 | 124 | % | |||||||||||||||||||||
| $9.61 | 3.76 | % | $198 | 0.87 | % | 0.60 | % | 0.60 | % | 1.94 | % | 16 | % | |||||||||||||||||||||
| $9.42 | 9.40 | % | $208 | 0.97 | % | 0.60 | % | 0.60 | % | 2.02 | % | 17 | % | |||||||||||||||||||||
| $8.77 | 10.67 | % | $190 | 1.05 | % | 0.60 | % | 0.60 | % | 2.06 | % | 23 | % | |||||||||||||||||||||
| $8.21 | (19.96 | )% | $75 | 1.08 | % | 0.66 | % | 0.65 | % | 2.16 | % | 117 | % | |||||||||||||||||||||
| $10.46 | (6.19 | )% | $94 | 1.36 | % | 0.70 | % | 0.70 | % | 4.04 | %12 | 124 | % | |||||||||||||||||||||
| The accompanying notes are an integral part of these financial statements. |
| AQR Funds | Annual Report | September 2018 | ||||||||||||||
263
Table of Contents
| Financial Highlights | September 30, 2018 |
| PER SHARE OPERATING PERFORMANCE | ||||||||||||||||||||||||||||
| Change in Net Assets Resulting from Operations1 | Less Dividends and Distributions | |||||||||||||||||||||||||||
| Net Asset Value, Beginning of Period | Net Investment Income (Loss) | Net Realized and Unrealized Gain (Loss) | Net Increase (Decrease) in Net Asset Value from Operations | Distributions from Net Investment Income | Distributions from Net Realized Gains | Total Distributions | ||||||||||||||||||||||
| AQR GLOBAL EQUITY FUND CLASS I | ||||||||||||||||||||||||||||
| FOR THE YEAR ENDED SEPTEMBER 30, 2018 | $8.89 | 0.13 | 0.54 | 0.67 | (0.08 | ) | (0.37 | ) | (0.45 | ) | ||||||||||||||||||
| FOR THE YEAR ENDED SEPTEMBER 30, 2017 | $8.12 | 0.11 | 1.43 | 1.54 | (0.18 | ) | (0.59 | ) | (0.77 | ) | ||||||||||||||||||
| FOR THE YEAR ENDED SEPTEMBER 30, 2016 | $7.80 | 0.10 | 0.76 | 0.86 | (0.12 | ) | (0.42 | ) | (0.54 | ) | ||||||||||||||||||
| FOR THE YEAR ENDED SEPTEMBER 30, 2015 | $8.91 | 0.12 | 10 | (0.23 | ) | (0.11 | ) | (0.15 | ) | (0.85 | ) | (1.00 | ) | |||||||||||||||
| FOR THE YEAR ENDED SEPTEMBER 30, 2014 | $13.33 | 0.15 | 12 | 1.13 | 1.28 | (0.39 | ) | (5.31 | ) | (5.70 | ) | |||||||||||||||||
| AQR GLOBAL EQUITY FUND CLASS N | ||||||||||||||||||||||||||||
| FOR THE YEAR ENDED SEPTEMBER 30, 2018 | $8.84 | 0.09 | 0.55 | 0.64 | (0.05 | ) | (0.37 | ) | (0.42 | ) | ||||||||||||||||||
| FOR THE YEAR ENDED SEPTEMBER 30, 2017 | $ 8.07 | 0.09 | 1.43 | 1.52 | (0.16 | ) | (0.59 | ) | (0.75 | ) | ||||||||||||||||||
| FOR THE YEAR ENDED SEPTEMBER 30, 2016 | $7.73 | 0.10 | 0.72 | 0.82 | (0.06 | ) | (0.42 | ) | (0.48 | ) | ||||||||||||||||||
| FOR THE YEAR ENDED SEPTEMBER 30, 2015 | $8.85 | 0.10 | 10 | (0.23 | ) | (0.13 | ) | (0.14 | ) | (0.85 | ) | (0.99 | ) | |||||||||||||||
| FOR THE YEAR ENDED SEPTEMBER 30, 2014 | $13.27 | 0.12 | 12 | 1.12 | 1.24 | (0.35 | ) | (5.31 | ) | (5.66 | ) | |||||||||||||||||
| AQR GLOBAL EQUITY FUND CLASS R6 | ||||||||||||||||||||||||||||
| FOR THE YEAR ENDED SEPTEMBER 30, 2018 | $8.96 | 0.13 | 0.55 | 0.68 | (0.08 | ) | (0.37 | ) | (0.45 | ) | ||||||||||||||||||
| FOR THE YEAR ENDED SEPTEMBER 30, 2017 | $8.18 | 0.12 | 1.45 | 1.57 | (0.20 | ) | (0.59 | ) | (0.79 | ) | ||||||||||||||||||
| FOR THE YEAR ENDED SEPTEMBER 30, 2016 | $7.85 | 0.12 | 0.75 | 0.87 | (0.12 | ) | (0.42 | ) | (0.54 | ) | ||||||||||||||||||
| FOR THE YEAR ENDED SEPTEMBER 30, 2015 | $8.96 | 0.14 | 10 | (0.24 | ) | (0.10 | ) | (0.16 | ) | (0.85 | ) | (1.01 | ) | |||||||||||||||
| FOR THE PERIOD 1/08/148—9/30/14 | $8.70 | 0.15 | 12 | 0.11 | 0.26 | — | — | — | ||||||||||||||||||||
| AQR INTERNATIONAL EQUITY FUND CLASS I | ||||||||||||||||||||||||||||
| FOR THE YEAR ENDED SEPTEMBER 30, 2018 | $11.66 | 0.22 | 19 | (0.32 | ) | (0.10 | ) | (0.25 | ) | (0.82 | ) | (1.07 | ) | |||||||||||||||
| FOR THE YEAR ENDED SEPTEMBER 30, 2017 | $10.17 | 0.20 | 1.73 | 1.93 | (0.30 | ) | (0.14 | ) | (0.44 | ) | ||||||||||||||||||
| FOR THE YEAR ENDED SEPTEMBER 30, 2016 | $9.61 | 0.21 | 0.67 | 0.88 | (0.20 | ) | (0.12 | ) | (0.32 | ) | ||||||||||||||||||
| FOR THE YEAR ENDED SEPTEMBER 30, 2015 | $10.99 | 0.21 | (0.71 | ) | (0.50 | ) | (0.33 | ) | (0.55 | ) | (0.88 | ) | ||||||||||||||||
| FOR THE YEAR ENDED SEPTEMBER 30, 2014 | $11.88 | 0.28 | 12 | (0.09 | ) | 0.19 | (0.22 | ) | (0.86 | ) | (1.08 | ) | ||||||||||||||||
| AQR INTERNATIONAL EQUITY FUND CLASS N | ||||||||||||||||||||||||||||
| FOR THE YEAR ENDED SEPTEMBER 30, 2018 | $11.88 | 0.21 | 19 | (0.33 | ) | (0.12 | ) | (0.20 | ) | (0.82 | ) | (1.02 | ) | |||||||||||||||
| FOR THE YEAR ENDED SEPTEMBER 30, 2017 | $10.35 | 0.18 | 1.77 | 1.95 | (0.28 | ) | (0.14 | ) | (0.42 | ) | ||||||||||||||||||
| FOR THE YEAR ENDED SEPTEMBER 30, 2016 | $9.77 | 0.19 | 0.68 | 0.87 | (0.17 | ) | (0.12 | ) | (0.29 | ) | ||||||||||||||||||
| FOR THE YEAR ENDED SEPTEMBER 30, 2015 | $11.15 | 0.17 | (0.70 | ) | (0.53 | ) | (0.30 | ) | (0.55 | ) | (0.85 | ) | ||||||||||||||||
| FOR THE YEAR ENDED SEPTEMBER 30, 2014 | $12.06 | 0.25 | 12 | (0.10 | ) | 0.15 | (0.20 | ) | (0.86 | ) | (1.06 | ) | ||||||||||||||||
| AQR INTERNATIONAL EQUITY FUND CLASS R6 | ||||||||||||||||||||||||||||
| FOR THE YEAR ENDED SEPTEMBER 30, 2018 | $12.39 | 0.24 | 19 | (0.35 | ) | (0.11 | ) | (0.26 | ) | (0.82 | ) | (1.08 | ) | |||||||||||||||
| FOR THE YEAR ENDED SEPTEMBER 30, 2017 | $10.77 | 0.27 | 1.81 | 2.08 | (0.32 | ) | (0.14 | ) | (0.46 | ) | ||||||||||||||||||
| FOR THE YEAR ENDED SEPTEMBER 30, 2016 | $10.16 | 0.16 | 0.77 | 0.93 | (0.20 | ) | (0.12 | ) | (0.32 | ) | ||||||||||||||||||
| FOR THE YEAR ENDED SEPTEMBER 30, 2015 | $11.56 | 0.18 | (0.68 | ) | (0.50 | ) | (0.35 | ) | (0.55 | ) | (0.90 | ) | ||||||||||||||||
| FOR THE PERIOD 1/08/148—9/30/14 | $12.08 | 0.34 | 12 | (0.86 | ) | (0.52 | ) | — | — | — | ||||||||||||||||||
| The accompanying notes are an integral part of these financial statements. |
| AQR Funds | Annual Report | September 2018 | ||||||||||||||
264
Table of Contents
| Financial Highlights | September 30, 2018 |
| RATIOS/SUPPLEMENTAL DATA | ||||||||||||||||||||||||||||||||||
| Ratios to Average Net Assets of:* | ||||||||||||||||||||||||||||||||||
| Net Asset Value, End of Period | Total Return2,3 | Net Assets, End of Period (000’s) | Expenses, Before Reimbursements and/or Waivers4 | Expenses, Net of Reimbursements and/or Waivers4 | Expenses, Net of Reimbursements and/or Waivers (Excluding Dividend Short Expense & Interest Expense)4 | Net Investment Income (Loss) | Portfolio Turnover Rate5 | |||||||||||||||||||||||||||
| $9.11 | 7.65 | % | $198,954 | 0.82 | % | 0.80 | % | 0.80 | % | 1.42 | % | 87 | % | |||||||||||||||||||||
| $8.89 | 20.70 | % | $41,551 | 0.89 | % | 0.82 | % | 0.82 | % | 1.37 | % | 88 | % | |||||||||||||||||||||
| $8.12 | 11.33 | % | $33,013 | 0.96 | % | 0.89 | % | 0.89 | % | 1.36 | % | 78 | % | |||||||||||||||||||||
| $7.80 | (1.64 | )% | $34,186 | 0.90 | % | 0.90 | % | 0.90 | % | 1.49 | %10 | 73 | % | |||||||||||||||||||||
| $8.91 | 11.55 | % | $2,492 | 1.14 | % | 0.91 | % | 0.91 | % | 1.62 | %12 | 90 | % | |||||||||||||||||||||
| $9.06 | 7.36 | % | $2,120 | 1.07 | % | 1.05 | % | 1.05 | % | 1.02 | % | 87 | % | |||||||||||||||||||||
| $8.84 | 20.57 | % | $2,254 | 1.14 | % | 1.07 | % | 1.07 | % | 1.09 | % | 88 | % | |||||||||||||||||||||
| $8.07 | 10.93 | % | $1,712 | 1.20 | % | 1.13 | % | 1.12 | % | 1.28 | % | 78 | % | |||||||||||||||||||||
| $7.73 | (1.86 | )% | $765 | 1.17 | % | 1.17 | % | 1.17 | % | 1.18 | %10 | 73 | % | |||||||||||||||||||||
| $8.85 | 11.17 | % | $1,128 | 1.60 | % | 1.21 | % | 1.21 | % | 1.28 | %12 | 90 | % | |||||||||||||||||||||
| $9.19 | 7.74 | % | $173,425 | 0.72 | % | 0.70 | % | 0.70 | % | 1.39 | % | 87 | % | |||||||||||||||||||||
| $8.96 | 20.98 | % | $146,167 | 0.77 | % | 0.70 | % | 0.70 | % | 1.48 | % | 88 | % | |||||||||||||||||||||
| $8.18 | 11.33 | % | $106,573 | 0.77 | % | 0.70 | % | 0.70 | % | 1.59 | % | 78 | % | |||||||||||||||||||||
| $7.85 | (1.47 | )% | $85,017 | 0.71 | % | 0.70 | % | 0.70 | % | 1.69 | %10 | 73 | % | |||||||||||||||||||||
| $8.96 | 2.99 | % | $76,031 | 0.73 | % | 0.70 | % | 0.70 | % | 2.23 | %12 | 90 | % | |||||||||||||||||||||
| $10.49 | (1.24 | )% | $391,509 | 0.88 | % | 0.86 | % | 0.86 | % | 1.97 | %19 | 87 | % | |||||||||||||||||||||
| $11.66 | 19.96 | % | $346,078 | 0.98 | % | 0.91 | %13 | 0.91 | %13 | 1.89 | %14 | 83 | % | |||||||||||||||||||||
| $10.17 | 9.34 | % | $370,530 | 0.97 | % | 0.95 | % | 0.95 | % | 2.14 | % | 62 | % | |||||||||||||||||||||
| $9.61 | (4.79 | )% | $320,807 | 0.92 | % | 0.92 | % | 0.92 | % | 1.98 | % | 84 | % | |||||||||||||||||||||
| $10.99 | 1.33 | % | $247,847 | 0.90 | % | 0.90 | % | 0.90 | % | 2.41 | %12 | 71 | % | |||||||||||||||||||||
| $10.74 | (1.41 | )% | $13,090 | 1.10 | % | 1.09 | % | 1.09 | % | 1.85 | %19 | 87 | % | |||||||||||||||||||||
| $11.88 | 19.68 | % | $14,873 | 1.24 | % | 1.16 | %13 | 1.16 | %13 | 1.71 | %14 | 83 | % | |||||||||||||||||||||
| $10.35 | 9.04 | % | $37,297 | 1.20 | % | 1.18 | % | 1.18 | % | 1.89 | % | 62 | % | |||||||||||||||||||||
| $9.77 | (4.99 | )% | $36,174 | 1.21 | % | 1.21 | % | 1.21 | % | 1.61 | % | 84 | % | |||||||||||||||||||||
| $11.15 | 0.96 | % | $39,336 | 1.25 | % | 1.25 | % | 1.25 | % | 2.11 | %12 | 71 | % | |||||||||||||||||||||
| $11.20 | (1.23 | )% | $44,742 | 0.79 | % | 0.77 | % | 0.77 | % | 2.04 | %19 | 87 | % | |||||||||||||||||||||
| $12.39 | 20.20 | % | $44,105 | 0.85 | % | 0.81 | %13 | 0.81 | %13 | 2.39 | %14 | 83 | % | |||||||||||||||||||||
| $10.77 | 9.40 | % | $14,387 | 0.77 | % | 0.77 | % | 0.77 | % | 1.57 | % | 62 | % | |||||||||||||||||||||
| $10.16 | (4.59 | )% | $32,648 | 0.75 | % | 0.75 | % | 0.75 | % | 1.61 | % | 84 | % | |||||||||||||||||||||
| $11.56 | (4.30 | )% | $103,882 | 0.74 | % | 0.74 | % | 0.74 | % | 3.90 | %12 | 71 | % | |||||||||||||||||||||
| The accompanying notes are an integral part of these financial statements. |
| AQR Funds | Annual Report | September 2018 | ||||||||||||||
265
Table of Contents
| Financial Highlights | September 30, 2018 |
| PER SHARE OPERATING PERFORMANCE | ||||||||||||||||||||||||||||||||
| Change in Net Assets Resulting from Operations1 | Less Dividends and Distributions | |||||||||||||||||||||||||||||||
| Net Asset Value, Beginning of Period | Net Investment Income (Loss) | Net Realized and Unrealized Gain (Loss) | Net Increase (Decrease) in Net Asset Value from Operations | Distributions from Net Investment Income | Distributions from Net Realized Gains | Return of Capital | Total Distributions | |||||||||||||||||||||||||
| AQR LARGE CAP RELAXED CONSTRAINT EQUITY FUND CLASS I | ||||||||||||||||||||||||||||||||
| FOR THE YEAR ENDED SEPTEMBER 30, 2018 | $11.30 | 0.11 | 1.24 | 1.35 | (0.11 | ) | — | — | (0.11 | ) | ||||||||||||||||||||||
| FOR THE PERIOD 12/14/1615—9/30/17 | $10.00 | 0.09 | 1.21 | 1.30 | — | — | — | — | ||||||||||||||||||||||||
| AQR LARGE CAP RELAXED CONSTRAINT EQUITY FUND CLASS N | ||||||||||||||||||||||||||||||||
| FOR THE YEAR ENDED SEPTEMBER 30, 2018 | $11.27 | 0.07 | 1.25 | 1.32 | (0.05 | ) | — | — | (0.05 | ) | ||||||||||||||||||||||
| FOR THE PERIOD 12/14/1615—9/30/17 | $10.00 | 0.06 | 1.21 | 1.27 | — | — | — | — | ||||||||||||||||||||||||
| AQR LARGE CAP RELAXED CONSTRAINT EQUITY FUND CLASS R6 | ||||||||||||||||||||||||||||||||
| FOR THE YEAR ENDED SEPTEMBER 30, 2018 | $11.30 | 0.12 | 1.24 | 1.36 | (0.11 | ) | — | — | (0.11 | ) | ||||||||||||||||||||||
| FOR THE PERIOD 12/14/1615—9/30/17 | $10.00 | 0.09 | 1.21 | 1.30 | — | — | — | — | ||||||||||||||||||||||||
| AQR SMALL CAP RELAXED CONSTRAINT EQUITY FUND CLASS I | ||||||||||||||||||||||||||||||||
| FOR THE YEAR ENDED SEPTEMBER 30, 2018 | $10.35 | (0.06 | ) | 0.36 | 0.30 | (0.10 | ) | — | (0.01 | ) | (0.11 | ) | ||||||||||||||||||||
| FOR THE PERIOD 12/14/1615—9/30/17 | $10.00 | (0.01 | ) | 0.36 | 0.35 | — | — | — | — | |||||||||||||||||||||||
| AQR SMALL CAP RELAXED CONSTRAINT EQUITY FUND CLASS N | ||||||||||||||||||||||||||||||||
| FOR THE YEAR ENDED SEPTEMBER 30, 2018 | $10.32 | (0.08 | ) | 0.36 | 0.28 | (0.07 | ) | — | (0.01 | ) | (0.08 | ) | ||||||||||||||||||||
| FOR THE PERIOD 12/14/1615—9/30/17 | $10.00 | (0.03 | ) | 0.35 | 0.32 | — | — | — | — | |||||||||||||||||||||||
| AQR SMALL CAP RELAXED CONSTRAINT EQUITY FUND CLASS R6 | ||||||||||||||||||||||||||||||||
| FOR THE YEAR ENDED SEPTEMBER 30, 2018 | $10.35 | (0.05 | ) | 0.36 | 0.31 | (0.10 | ) | — | (0.01 | ) | (0.11 | ) | ||||||||||||||||||||
| FOR THE PERIOD 12/14/1615—9/30/17 | $10.00 | (0.00 | )7 | 0.35 | 0.35 | — | — | — | — | |||||||||||||||||||||||
| AQR INTERNATIONAL RELAXED CONSTRAINT EQUITY FUND CLASS I | ||||||||||||||||||||||||||||||||
| FOR THE YEAR ENDED SEPTEMBER 30, 2018 | $12.76 | 0.31 | 19 | (0.75 | ) | (0.44 | ) | (0.09 | ) | (0.01 | ) | — | (0.10 | ) | ||||||||||||||||||
| FOR THE PERIOD 12/14/1615—9/30/17 | $10.00 | 0.21 | 2.55 | 2.76 | — | — | — | — | ||||||||||||||||||||||||
| AQR INTERNATIONAL RELAXED CONSTRAINT EQUITY FUND CLASS N | ||||||||||||||||||||||||||||||||
| FOR THE YEAR ENDED SEPTEMBER 30, 2018 | $12.73 | 0.26 | 19 | (0.73 | ) | (0.47 | ) | (0.08 | ) | (0.01 | ) | — | (0.09 | ) | ||||||||||||||||||
| FOR THE PERIOD 12/14/1615—9/30/17 | $10.00 | 0.18 | 2.55 | 2.73 | — | — | — | — | ||||||||||||||||||||||||
| AQR INTERNATIONAL RELAXED CONSTRAINT EQUITY FUND CLASS R6 | ||||||||||||||||||||||||||||||||
| FOR THE YEAR ENDED SEPTEMBER 30, 2018 | $12.77 | 0.22 | 19 | (0.66 | ) | (0.44 | ) | (0.09 | ) | (0.01 | ) | — | (0.10 | ) | ||||||||||||||||||
| FOR THE PERIOD 12/14/1615—9/30/17 | $10.00 | 0.21 | 2.56 | 2.77 | — | — | — | — | ||||||||||||||||||||||||
| AQR EMERGING RELAXED CONSTRAINT EQUITY FUND CLASS I | ||||||||||||||||||||||||||||||||
| FOR THE YEAR ENDED SEPTEMBER 30, 2018 | $12.69 | 0.17 | 19 | (0.32 | ) | (0.15 | ) | (0.11 | ) | (0.06 | ) | — | (0.17 | ) | ||||||||||||||||||
| FOR THE PERIOD 12/14/1615—9/30/17 | $10.00 | 0.08 | 2.61 | 2.69 | — | — | — | — | ||||||||||||||||||||||||
| AQR EMERGING RELAXED CONSTRAINT EQUITY FUND CLASS N | ||||||||||||||||||||||||||||||||
| FOR THE YEAR ENDED SEPTEMBER 30, 2018 | $12.66 | 0.15 | 19 | (0.34 | ) | (0.19 | ) | (0.08 | ) | (0.06 | ) | — | (0.14 | ) | ||||||||||||||||||
| FOR THE PERIOD 12/14/1615—9/30/17 | $10.00 | 0.07 | 2.59 | 2.66 | — | — | — | — | ||||||||||||||||||||||||
| AQR EMERGING RELAXED CONSTRAINT EQUITY FUND CLASS R6 | ||||||||||||||||||||||||||||||||
| FOR THE YEAR ENDED SEPTEMBER 30, 2018 | $12.70 | 0.09 | 19 | (0.23 | ) | (0.14 | ) | (0.12 | ) | (0.06 | ) | — | (0.18 | ) | ||||||||||||||||||
| FOR THE PERIOD 12/14/1615—9/30/17 | $10.00 | 0.07 | 2.63 | 2.70 | — | — | — | — | ||||||||||||||||||||||||
| The accompanying notes are an integral part of these financial statements. |
| AQR Funds | Annual Report | September 2018 | ||||||||||||||
266
Table of Contents
| Financial Highlights | September 30, 2018 |
| RATIOS/SUPPLEMENTAL DATA | ||||||||||||||||||||||||||||||||||
| Ratios to Average Net Assets of:* | ||||||||||||||||||||||||||||||||||
| Net Asset Value, End of Period | Total Return2,3 | Net Assets, End of Period (000’s) | Expenses, Before Reimbursements and/or Waivers4 | Expenses, Net of Reimbursements and/or Waivers4 | Expenses, Net of Reimbursements and/or Waivers (Excluding Dividend Short Expense & Interest Expense)4 | Net Investment Income (Loss) | Portfolio Turnover Rate5 | |||||||||||||||||||||||||||
| |
|
| ||||||||||||||||||||||||||||||||
| $12.54 | 11.95 | % | $16,556 | 2.06 | %16 | 1.33 | % | 0.80 | % | 0.88 | % | 119 | % | |||||||||||||||||||||
| $11.30 | 13.00 | % | $13,575 | 2.69 | %16 | 1.40 | % | 0.78 | % | 1.06 | % | 139 | % | |||||||||||||||||||||
| |
|
| ||||||||||||||||||||||||||||||||
| $12.54 | 11.72 | % | $773 | 2.30 | %16 | 1.56 | % | 1.03 | % | 0.60 | % | 119 | % | |||||||||||||||||||||
| $11.27 | 12.70 | % | $1,016 | 4.22 | %16 | 1.65 | % | 1.03 | % | 0.72 | % | 139 | % | |||||||||||||||||||||
| |
|
| ||||||||||||||||||||||||||||||||
| $12.55 | 12.09 | % | $1,815 | 1.98 | %16 | 1.23 | % | 0.70 | % | 0.97 | % | 119 | % | |||||||||||||||||||||
| $11.30 | 13.00 | % | $1,972 | 3.94 | %16 | 1.32 | % | 0.70 | % | 1.02 | % | 139 | % | |||||||||||||||||||||
| |
|
| ||||||||||||||||||||||||||||||||
| $10.54 | 2.86 | % | $1,376 | 5.29 | %16 | 1.70 | % | 0.98 | % | (0.57 | )% | 135 | % | |||||||||||||||||||||
| $10.35 | 3.50 | % | $1,353 | 6.62 | %16 | 1.41 | % | 0.98 | % | (0.10 | )% | 124 | % | |||||||||||||||||||||
| |
|
| ||||||||||||||||||||||||||||||||
| $10.52 | 2.70 | % | $584 | 5.58 | %16 | 1.94 | % | 1.22 | % | (0.81 | )% | 135 | % | |||||||||||||||||||||
| $10.32 | 3.20 | % | $576 | 6.82 | %16 | 1.64 | % | 1.22 | % | (0.34 | )% | 124 | % | |||||||||||||||||||||
| |
|
| ||||||||||||||||||||||||||||||||
| $10.55 | 3.04 | % | $1,336 | 5.27 | %16 | 1.62 | % | 0.90 | % | (0.48 | )% | 135 | % | |||||||||||||||||||||
| $10.35 | 3.50 | % | $1,336 | 6.53 | %16 | 1.33 | % | 0.90 | % | (0.02 | )% | 124 | % | |||||||||||||||||||||
| |
|
| ||||||||||||||||||||||||||||||||
| $12.22 | (3.45 | )% | $55,144 | 2.12 | %16 | 1.94 | % | 0.95 | % | 2.44 | %19 | 106 | % | |||||||||||||||||||||
| $12.76 | 27.60 | % | $7,136 | 3.81 | %16 | 1.88 | % | 0.94 | % | 2.28 | % | 162 | % | |||||||||||||||||||||
| |
|
| ||||||||||||||||||||||||||||||||
| $12.17 | (3.68 | )% | $13,444 | 2.38 | %16 | 2.19 | % | 1.20 | % | 2.00 | %19 | 106 | % | |||||||||||||||||||||
| $12.73 | 27.30 | % | $1,988 | 4.19 | %16 | 2.12 | % | 1.18 | % | 1.98 | % | 162 | % | |||||||||||||||||||||
| |
|
| ||||||||||||||||||||||||||||||||
| $12.23 | (3.42 | )% | $1,993 | 2.16 | %16 | 1.84 | % | 0.85 | % | 1.72 | %19 | 106 | % | |||||||||||||||||||||
| $12.77 | 27.70 | % | $2,654 | 4.18 | %16 | 1.79 | % | 0.85 | % | 2.36 | % | 162 | % | |||||||||||||||||||||
| |
|
| ||||||||||||||||||||||||||||||||
| $12.37 | (1.30 | )% | $21,063 | 1.57 | %16 | 1.15 | % | 1.15 | % | 1.24 | %19 | 168 | % | |||||||||||||||||||||
| $12.69 | 26.90 | % | $5,151 | 3.82 | %16 | 1.14 | % | 1.14 | % | 0.89 | % | 114 | % | |||||||||||||||||||||
| |
|
| ||||||||||||||||||||||||||||||||
| $12.33 | (1.60 | )% | $10,383 | 1.81 | %16 | 1.40 | % | 1.40 | % | 1.13 | %19 | 168 | % | |||||||||||||||||||||
| $12.66 | 26.60 | % | $1,953 | 4.16 | %16 | 1.38 | % | 1.38 | % | 0.77 | % | 114 | % | |||||||||||||||||||||
| |
|
| ||||||||||||||||||||||||||||||||
| $12.38 | (1.25 | )% | $5,923 | 1.49 | %16 | 1.05 | % | 1.05 | % | 0.67 | %19 | 168 | % | |||||||||||||||||||||
| $12.70 | 27.00 | % | $17,848 | 3.66 | %16 | 1.05 | % | 1.05 | % | 0.71 | % | 114 | % | |||||||||||||||||||||
| The accompanying notes are an integral part of these financial statements. |
| AQR Funds | Annual Report | September 2018 | ||||||||||||||
267
Table of Contents
| Financial Highlights | September 30, 2018 |
| * | Annualized for periods less than one year. |
| 1 | Per share net investment income (loss) and net realized and unrealized gain (loss) are based on average shares outstanding. |
| 2 | Total investment return is calculated assuming an initial investment made at the net asset value at the beginning of the period, reinvestment of all dividends and distributions at net asset value during the period and redemption on the last day of the period and is not annualized. |
| 3 | Includes adjustments in accordance with accounting principles generally accepted in the United States of America and as such, the net asset value for financial reporting purposes and the returns based upon those net asset values may differ from the net asset value and returns for shareholder transactions. |
| 4 | Ratios do not include the impact of the expenses of the underlying funds in which the Fund invests. |
| 5 | Portfolio turnover is not annualized. |
| 6 | Effective April 1, 2015, Class L Shares were renamed Class I Shares. |
| 7 | Amount is less than $.005 per share. |
| 8 | Commencement of offering of shares. |
| 9 | For the period ended September 30, 2017 certain Funds received special dividends which materially impacted the Net Investment Income Per Share and Net Investment Income Ratio. These dividends are not expected to continue in the future. Had these special dividends not been received the Net Investment Income Per Share and Net Investment Income Ratio would have been as follows: |
| FUND | NET INVESTMENT INCOME PER SHARE | NET INVESTMENT INCOME RATIO | ||||||
AQR Small Cap Multi-Style Fund—Class I | $0.10 | 0.63 | % | |||||
AQR Small Cap Multi-Style Fund—Class N | 0.06 | 0.37 | ||||||
AQR Small Cap Multi-Style Fund—Class R6 | 0.11 | 0.73 | ||||||
AQR Small Cap Momentum Style Fund—Class I | 0.08 | 0.35 | ||||||
AQR Small Cap Momentum Style Fund—Class N | 0.03 | 0.13 | ||||||
AQR Small Cap Momentum Style Fund—Class R6 | 0.10 | 0.43 | ||||||
AQR International Defensive Style Fund—Class I | 0.28 | 2.24 | ||||||
AQR International Defensive Style Fund—Class N | 0.26 | 2.02 | ||||||
AQR International Defensive Style Fund—Class R6 | 0.29 | 2.38 | ||||||
| 10 | For the period ended September 30, 2015 certain Funds received special dividends which materially impacted the Net Investment Income Per Share and Net Investment Income Ratio. These dividends are not expected to continue in the future. Had these special dividends not been received the Net Investment Income Per Share and Net Investment Income Ratio would have been as follows: |
| FUND | NET INVESTMENT INCOME PER SHARE | NET INVESTMENT INCOME RATIO | ||||||
AQR Small Cap Multi-Style Fund—Class I | $0.10 | 0.76 | % | |||||
AQR Small Cap Multi-Style Fund—Class N | 0.07 | 0.53 | ||||||
AQR Small Cap Multi-Style Fund—Class R6 | 0.13 | 1.05 | ||||||
AQR International Multi-Style Fund—Class I | 0.25 | 2.28 | ||||||
AQR International Multi-Style Fund—Class N | 0.22 | 2.02 | ||||||
AQR International Multi-Style Fund—Class R6 | 0.28 | 2.53 | ||||||
AQR Small Cap Momentum Style Fund—Class I | 0.13 | 0.58 | ||||||
AQR Small Cap Momentum Style Fund—Class N | 0.07 | 0.32 | ||||||
AQR Small Cap Momentum Style Fund—Class R6 | 0.11 | 0.51 | ||||||
AQR TM Small Cap Momentum Style Fund—Class I | 0.09 | 0.57 | ||||||
AQR TM Small Cap Momentum Style Fund—Class N | 0.05 | 0.34 | ||||||
AQR TM Small Cap Momentum Style Fund—Class R6 | 0.10 | 0.66 | ||||||
AQR Global Equity Fund—Class I | 0.10 | 1.26 | ||||||
AQR Global Equity Fund—Class N | 0.08 | 0.95 | ||||||
AQR Global Equity Fund—Class R6 | 0.12 | 1.46 | ||||||
| 11 | The amount shown for a share outstanding throughout the period is not indicative of the aggregate net realized and unrealized gain (loss) for that period because of the timing of sales and repurchases of the Fund shares in relation to fluctuating market value of the investments in the Fund. |
| The accompanying notes are an integral part of these financial statements. |
| AQR Funds | Annual Report | September 2018 | ||||||||||||||
268
Table of Contents
| Financial Highlights | September 30, 2018 |
| 12 | For the period ended September 30, 2014 certain Funds received special dividends which materially impacted the Net Investment Income Per Share and Net Investment Income Ratio. These dividends are not expected to continue in the future. Had these special dividends not been received the Net Investment Income Per Share and Net Investment Income Ratio would have been as follows: |
| FUND | NET INVESTMENT INCOME PER SHARE | NET INVESTMENT INCOME RATIO | ||||||
AQR Small Cap Multi-Style Fund—Class I | $0.04 | 0.28 | % | |||||
AQR Small Cap Multi-Style Fund—Class N | (0.00 | ) | 0.02 | |||||
AQR Small Cap Multi-Style Fund—Class R6 | (0.00 | ) | 0.36 | |||||
AQR Small Cap Momentum Style Fund—Class I | (0.02 | ) | (0.07 | ) | ||||
AQR Small Cap Momentum Style Fund—Class N | (0.08 | ) | (0.34 | ) | ||||
AQR Small Cap Momentum Style Fund—Class R6 | (0.01 | ) | 0.05 | |||||
AQR International Momentum Style Fund—Class I | 0.25 | 1.57 | ||||||
AQR International Momentum Style Fund—Class N | 0.20 | 1.26 | ||||||
AQR International Momentum Style Fund—Class R6 | 0.03 | 1.22 | ||||||
AQR TM International Momentum Style Fund—Class I | 0.22 | 1.63 | ||||||
AQR TM International Momentum Style Fund—Class N | 0.16 | 1.16 | ||||||
AQR TM International Momentum Style Fund—Class R6 | 0.02 | 1.03 | ||||||
AQR Emerging Defensive Style Fund—Class I | 0.23 | 2.13 | ||||||
AQR Emerging Defensive Style Fund—Class N | 0.16 | 1.51 | ||||||
AQR Emerging Defensive Style Fund—Class R6 | 0.01 | 3.82 | ||||||
AQR Global Equity Fund—Class I | 0.14 | 1.50 | ||||||
AQR Global Equity Fund—Class N | 0.11 | 1.16 | ||||||
AQR Global Equity Fund—Class R6 | 0.14 | 2.11 | ||||||
AQR International Equity Fund—Class I | 0.26 | 2.22 | ||||||
AQR International Equity Fund—Class N | 0.23 | 1.92 | ||||||
AQR International Equity Fund—Class R6 | 0.32 | 3.71 | ||||||
| 13 | Excludes impact of IRS closing agreement tax expense. |
| 14 | Includes impact of IRS closing agreement reimbursement. |
| 15 | Commencement of operations. |
| 16 | Certain expenses incurred by the Fund were not annualized for the period. |
| 17 | Ratios are disproportionate between classes due to size of net assets and fixed expenses. |
| 18 | For the period ended September 30, 2016 certain Funds received special dividends which materially impacted the Net Investment Income Per Share and Net Investment Income Ratio. These dividends are not expected to continue in the future. Had these special dividends not been received the Net Investment Income Per Share and Net Investment Income Ratio would have been as follows: |
| FUND | NET INVESTMENT INCOME PER SHARE | NET INVESTMENT INCOME RATIO | ||||||
AQR TM Small Cap Multi-Style Fund—Class I | $0.11 | 1.14 | % | |||||
AQR TM Small Cap Multi-Style Fund—Class N | 0.09 | 0.92 | ||||||
AQR TM Small Cap Multi-Style Fund—Class R6 | 0.11 | 1.13 | ||||||
AQR TM Large Cap Momentum Style Fund—Class I | 0.21 | 1.27 | ||||||
AQR TM Large Cap Momentum Style Fund—Class N | 0.18 | 1.10 | ||||||
AQR TM Large Cap Momentum Style Fund—Class R6 | 0.22 | 1.36 | ||||||
| The accompanying notes are an integral part of these financial statements. |
| AQR Funds | Annual Report | September 2018 | ||||||||||||||
269
Table of Contents
| Financial Highlights | September 30, 2018 |
| 19 | For the period ended September 30, 2018 certain Funds received special dividends which materially impacted the Net Investment Income Per Share and Net Investment Income Ratio. These dividends are not expected to continue in the future. Had these special dividends not been received the Net Investment Income Per Share and Net Investment Income Ratio would have been as follows: |
| FUND | NET INVESTMENT INCOME PER SHARE | NET INVESTMENT INCOME RATIO | ||||||
AQR TM Emerging Multi-Style Fund—Class I | $0.22 | 1.90 | % | |||||
AQR TM Emerging Multi-Style Fund—Class N | 0.18 | 1.52 | ||||||
AQR TM Emerging Multi-Style Fund—Class R6 | 0.23 | 1.96 | ||||||
AQR Small Cap Momentum Style Fund—Class I | 0.03 | 0.12 | ||||||
AQR Small Cap Momentum Style Fund—Class N | (0.02 | ) | (0.11 | ) | ||||
AQR Small Cap Momentum Style Fund—Class R6 | 0.06 | 0.22 | ||||||
AQR International Defensive Style Fund-Class I | 0.28 | 2.14 | ||||||
AQR International Defensive Style Fund-Class N | 0.22 | 1.57 | ||||||
AQR International Defensive Style Fund-Class R6 | 0.30 | 2.27 | ||||||
AQR International Equity Fund—Class I | 0.21 | 1.86 | ||||||
AQR International Equity Fund—Class N | 0.20 | 1.74 | ||||||
AQR International Equity Fund—Class R6 | 0.23 | 1.93 | ||||||
AQR International Relaxed Constraint Equity Fund—Class I | 0.29 | 2.28 | ||||||
AQR International Relaxed Constraint Equity Fund—Class N | 0.24 | 1.84 | ||||||
AQR International Relaxed Constraint Equity Fund—Class R6 | 0.20 | 1.56 | ||||||
AQR Emerging Relaxed Constraint Equity Fund—Class I | 0.14 | 1.04 | ||||||
AQR Emerging Relaxed Constraint Equity Fund—Class N | 0.12 | 0.93 | ||||||
AQR Emerging Relaxed Constraint Equity Fund—Class R6 | 0.06 | 0.47 | ||||||
| The accompanying notes are an integral part of these financial statements. |
| AQR Funds | Annual Report | September 2018 | ||||||||||||||
270
Table of Contents
| Notes to Financial Statements | September 30, 2018 |
1. Organization
AQR Funds (the “Trust”), was organized as a Delaware statutory trust on September 4, 2008. The Trust is an open-end management investment company, registered under the Investment Company Act of 1940, as amended (the “1940 Act”). As of September 30, 2018, the Trust consists of thirty-nine active series, twenty-four of which are presented in this book (collectively, the “Funds” and each individually a “Fund”): AQR Large Cap Multi-Style Fund, AQR Small Cap Multi-Style Fund, AQR International Multi-Style Fund, AQR Emerging Multi-Style Fund, AQR TM Large Cap Multi-Style Fund, AQR TM Small Cap Multi-Style Fund, AQR TM International Multi-Style Fund, AQR TM Emerging Multi-Style Fund, AQR Large Cap Momentum Style Fund, AQR Small Cap Momentum Style Fund, AQR International Momentum Style Fund, AQR Emerging Momentum Style Fund, AQR TM Large Cap Momentum Style Fund, AQR TM Small Cap Momentum Style Fund, AQR TM International Momentum Style Fund, AQR Large Cap Defensive Style Fund, AQR International Defensive Style Fund, AQR Emerging Defensive Style Fund, AQR Global Equity Fund, AQR International Equity Fund, AQR Large Cap Relaxed Constraint Equity Fund, AQR Small Cap Relaxed Constraint Equity Fund, AQR International Relaxed Constraint Equity Fund and AQR Emerging Relaxed Constraint Equity Fund. The remaining active series are reported in separate books. AQR Capital Management, LLC (the “Adviser”) serves as the investment adviser of each Fund.
The investment objective for AQR Large Cap Multi-Style Fund, AQR Small Cap Multi-Style Fund, AQR International Multi-Style Fund, AQR Emerging Multi-Style Fund, AQR Large Cap Momentum Style Fund, AQR Small Cap Momentum Style Fund, AQR International Momentum Style Fund, AQR Emerging Momentum Style Fund, AQR Global Equity Fund, AQR International Equity Fund, AQR Large Cap Relaxed Constraint Equity Fund, AQR Small Cap Relaxed Constraint Equity Fund, AQR International Relaxed Constraint Equity Fund and AQR Emerging Relaxed Constraint Equity Fund is to seek long-term capital appreciation. The investment objective for AQR Large Cap Defensive Style Fund, AQR International Defensive Style Fund and AQR Emerging Defensive Style Fund is to seek total return. The investment objective for AQR TM Large Cap Multi-Style Fund, AQR TM Small Cap Multi-Style Fund, AQR TM International Multi-Style Fund, AQR TM Emerging Multi-Style Fund, AQR TM Large Cap Momentum Style Fund, AQR TM Small Cap Momentum Style Fund and AQR TM International Momentum Style Fund is to seek long-term after-tax capital appreciation. Each Fund offers Class I, N and R6 shares.
2. Significant Accounting Policies
The Funds are investment companies and apply specialized accounting and reporting guidance of the Financial Accounting Standards Board Accounting Standard Codification Topic 946 Financial Services — Investment Companies. The accounting policies are in conformity with accounting principles generally accepted in the United States of America (“GAAP”). Certain prior period amounts have been reclassified to reflect current period presentation.
Use of Estimates: The preparation of the financial statements in conformity with GAAP requires the Adviser to make estimates and assumptions that affect the fair value of investments, the reported amounts of assets and liabilities and disclosure of contingent assets and liabilities, if any, at the date of the financial statements and the reported amounts of increases and decreases in net assets from operations during the reporting period. Actual results could differ from those estimates and such differences could be material.
Valuation of Investments: All securities and other investments are recorded at their estimated fair value, as described in Note 4.
Cash: Cash comprises U.S. Dollar and foreign currency deposits held at a custodian bank(s) which may exceed insured limits. The Funds are subject to risk to the extent that the institutions may be unable to fulfill their obligations.
Due to/from Brokers: Due to/from brokers represents cash balances on deposit with, or cash balances owed to, the Funds’ prime brokers and counterparties. The Funds are subject to credit risk should the prime brokers and counterparties be unable to meet their obligations to the Funds.
Foreign Currency Translation: The books and records of the Funds are maintained in U.S. Dollars. The Funds’ assets and liabilities in foreign currencies are translated into U.S. Dollars at the prevailing exchange rate at the valuation date. Transactions denominated in foreign currencies are translated into U.S. Dollars at the prevailing exchange rate on the date of the transaction. The Funds’ income earned and expense incurred in foreign denominated currencies are translated into U.S. Dollars at the prevailing exchange rate on the date of such activity.
The Funds do not isolate that portion of the results of operations arising from changes in the foreign exchange rates on investments and derivatives from the fluctuations that result from changes in the market prices of investments and derivatives held or sold during the period. Accordingly, such foreign currency gains (losses) are included in the reported net realized gain (loss) from transactions in investment securities and derivatives and net change in unrealized appreciation (depreciation) on investment securities and derivatives on the Statements of Operations.
Realized gains (losses) from settlement of foreign currency and foreign currency transactions reported on the Statements of Operations arise from the disposition of foreign currency and a change between the amounts of dividends, interest and foreign withholding taxes recorded on the Funds’ books on the transaction date and the U.S. Dollar equivalent of the amounts actually received or paid. Changes in unrealized appreciation (depreciation) on foreign currency and foreign currency translations reported on the Statements of Operations arise from changes (due to the changes in the exchange rate) in the value of foreign currency and assets and liabilities (other than investments) denominated in foreign currencies, which are held at period end.
| AQR Funds | Annual Report | September 2018 | ||||||||||||||
271
Table of Contents
| Notes to Financial Statements | September 30, 2018 |
Investment Transactions and Related Income: Investment transactions are accounted for on trade date (the date the order to buy or sell is executed). Realized gains and losses on investment transactions are calculated on a specifically identified cost basis. Interest income is determined on the basis of coupon interest accrued using the effective interest method adjusted for amortization of premiums and accretion of discounts using the effective yield method. Dividend income (expense) net of foreign taxes withheld, if any, is recorded on the ex-dividend date or when the Fund first learns of the ex-date dividend notification. Upon notification from issuers, some of the dividend income received from a real estate investment trust may be redesignated as a reduction of cost of the related investment and/or realized gain. Interest income, including amortization and accretion of premiums and discounts on debt securities, is recognized on the accrual basis. For inflation-linked bonds, interest income (expense) is earned on the principal amount and adjusted for the changes in the relevant consumer price index.
Multi-class Operations: Each class of shares offered by the Trust has equal rights as to earnings, assets and voting privileges, except that each class may bear different sub-transfer agency and distribution fees and shareholders of a class have exclusive voting rights regarding any matter relating solely to that class of shares. Income, non-class specific expenses, realized and unrealized gains and losses are allocated daily to each class of shares based upon the proportion of relative net assets at the beginning of each day. Each Fund is charged for those expenses that are directly attributable to each Fund. Trust level expenses are allocated among the Funds based on the ratio of average net assets or other reasonable methodology.
The Funds record distributions received in excess of income from underlying investments as a reduction of cost of investments and/or realized gain. Such amounts are based on estimates (if actual amounts are not available) and actual amounts of income, realized gain and return of capital may differ from the estimated amounts. The Funds adjust the estimated amounts of components of distributions (and consequently net investment income) as necessary once the issuers provide information about the actual composition of the distributions.
The Funds may be subject to foreign taxes on income, capital gains on investments or currency repatriation, a portion of which may be recoverable. The Funds will accrue such taxes and recoveries as applicable, based upon their current interpretation of tax rules and regulations that exist in the markets in which they invest.
Offering Cost: Offering costs, including professional fees, printing fees and initial registration, are amortized over a period not longer than twelve months from the date the Funds commenced operations.
Federal Income Taxes: Each Fund is treated as a separate taxable entity for federal income tax purposes. Each Fund intends to qualify as a “regulated investment company” under Subchapter M of the Internal Revenue Code of 1986, as amended (the “Code”). If so qualified, each Fund will not be subject to federal income tax to the extent it distributes substantially all of its taxable net investment income and capital gains, if applicable, to shareholders. Accordingly no provision for Federal income tax is necessary.
The Adviser evaluates tax positions taken or expected to be taken in the course of preparing the Funds’ tax returns to determine whether the tax positions are “more-likely-than-not” of being sustained by the applicable tax authority. Tax positions deemed to meet the more-likely-than-not threshold would be recorded as a tax benefit or expense in the current year. The Funds are required to analyze all open tax years. Open tax years are those years that are open for examination by the relevant income taxing authority. The Funds have concluded that there is no tax liability/benefit resulting from uncertain income tax positions taken or expected to be taken. The Funds are not aware of any tax positions for which it is reasonably possible that the total amounts of unrecognized tax expense will materially change in the next twelve months. The returns of the Funds for the prior three fiscal years as well as current year, or since inception if shorter, are open for examination. As of September 30, 2018, the Funds had no examinations in progress.
Distributions to Shareholders: Distributions to shareholders are recorded on the ex-dividend date. The Funds intend to declare and distribute substantially all of their net investment income and net realized capital gains, if any, at least annually. Income and capital gain distributions will be determined in accordance with federal income tax regulations which may differ from GAAP. Differences may be permanent or temporary. Permanent differences are reclassified among capital accounts in the financial statements to reflect their tax character. Temporary differences arise when certain items of income, expense, gain, or loss are recognized in different periods for financial statement and tax purposes. These differences will reverse at some time in the future. Differences in classification may also result from the treatment of short-term gains as ordinary income for tax purposes. As a result, income dividends and capital gain distributions declared during a fiscal period may differ significantly from the net investment income (loss) and realized gain (loss) reported on the Funds’ financial statements presented under GAAP.
Distributions classified as a tax basis return of capital, if any, are reflected on the accompanying Statements of Changes in Net Assets and have been recorded to paid in capital.
Indemnification: In the normal course of business, the Funds may enter into various agreements that provide for general indemnifications. The Funds’ maximum exposure under these arrangements is unknown as any potential exposure involves future claims that may be made against the Funds. However, based on experience, the Funds expect the risk of loss to be remote.
| AQR Funds | Annual Report | September 2018 | ||||||||||||||
272
Table of Contents
| Notes to Financial Statements | September 30, 2018 |
3. Securities and Other Investments
Limited Purpose Cash Investment Fund: Certain Funds may invest in the Limited Purpose Cash Investment Fund (the “LPCI Fund”), which is managed by UBS Asset Management (Americas) Inc. (“UBS AM”). The LPCI Fund is a registered investment company under the 1940 Act and is subject to the money market regulations as prescribed in Rule 2a-7 of the 1940 Act. Pursuant to the LPCI Fund’s eligibility requirements, shares of the LPCI Fund are only available for sale to the Adviser and funds advised by the Adviser. Those Funds investing in the LPCI Fund indirectly bear their share of the advisory and operating expenses borne by the LPCI Fund. Section 2a-3 of the 1940 Act defines an affiliated person as, among other things, a company in which a Fund owns at least 5% of the outstanding voting securities. The LPCI Fund may be considered an affiliated person of some of the Funds in the Trust. However, the Funds do not invest in the LPCI Fund for the purpose of exercising significant influence over its management, board or policies. A summary of transactions with each affiliated person is included in the Schedules of Investments, if applicable.
Securities Sold Short: Certain Funds may engage in short sales, which is when a Fund sells securities it does not own as a hedge against some of its long positions and/or in anticipation of a decline in the market value of that security. When one of the Funds makes a short sale, it must borrow the security sold short and deliver it to the broker through which it made the short sale. The Fund may have to pay a fee to borrow the particular security and may be obligated to remit any interest or dividends received on such borrowed securities. Dividends declared on short positions are recorded on the ex-date as an expense. A gain, limited to the price at which the Fund sold the security short, or a loss, which could be unlimited in magnitude, will be recognized upon the termination of a short sale if the market price at termination is less than or greater than, respectively, the proceeds originally received. The Fund is also subject to the risk that it may be unable to reacquire a security to terminate a short position except at a price substantially in excess of the last quoted price. The Fund is also subject to risk of loss if the broker were to fail to perform its obligations under the contractual terms. Liabilities for securities sold short are reported at market value on the Statements of Assets and Liabilities and the change in market value is recorded as unrealized gain or loss on the Statements of Operations.
The Funds are required to pledge cash or liquid securities to the broker as collateral for securities sold short. Collateral requirements are calculated daily based on the current market value of the short positions. Daily market fluctuations and trading activity could cause the value of securities sold short to be more or less than the value of the collateral segregated. Cash deposited with the broker for collateral for securities sold short is recorded as an asset on the Statements of Assets and Liabilities and securities segregated as collateral are denoted in the Schedules of Investments. The Funds may receive or pay the net of the following amounts: (i) a portion of the income from the investment of cash collateral; (ii) the broker’s fee on the borrowed securities; and (iii) a financing charge for the difference in the market value of the short position and cash collateral deposited with the broker. This income or fee is calculated daily based upon the market value of each borrowed security and a variable rate that is dependent on the availability of the security.
The net amount of fees incurred are included in the dividend and interest on securities sold short in the Statements of Operations and are as follows:
| FUND | ||||
AQR Large Cap Relaxed Constraint Equity Fund | $ | 23,233 | ||
AQR Small Cap Relaxed Constraint Equity Fund | 9,745 | |||
AQR International Relaxed Constraint Equity Fund | 112,426 | |||
Futures Contracts: Certain Funds invest in futures contracts as part of their primary investment strategy and to equitize its cash flows. Investments in futures may increase or decrease exposure to a particular market. In the event of a bankruptcy or insolvency of a futures commission merchant that holds margin on behalf of the Funds, the Funds may not receive the return of the entire margin owed to the Funds, potentially resulting in a loss. A change in market value of an open futures contract is recorded in the Statements of Operations as net change in unrealized appreciation (depreciation) on futures contracts. A realized gain (loss) represents the difference between the value of the contract at the time it was opened and the value at the time it was closed or expired, and is reported in the Statements of Operations. The use of long futures contracts subjects the Funds to risk of loss in excess of the variation margin on the Statements of Assets and Liabilities. The use of short futures contracts subjects the Funds to unlimited risk of loss. Futures contracts outstanding at period end, if any, are listed after each Fund’s Schedule of Investments.
Forward Foreign Currency Exchange Contracts: Certain Funds buy and sell forward foreign currency exchange contracts, which are agreements between two parties to buy and sell currencies at a set price on a future date. These contracts are used to protect against a decline in value relative to the U.S. Dollar of the currencies in which portfolio securities are denominated or quoted (or an increase in the value of a currency in which securities that a Fund intends to buy are denominated, when a Fund holds cash reserves and short term investments), or for other investment purposes. The market value of the contract will fluctuate with changes in currency exchange rates. The contract is marked to market daily and the change in market value is recorded as unrealized appreciation or depreciation. When the contract is closed, the Funds record a realized gain or loss equal to the difference between the value of the contract at the time it was opened and the value at the time it was closed. The Funds could be exposed to risk if the value of the currency changes unfavorably, if the counterparties to the contracts are unable to meet the terms of their contracts or if the Funds are unable to enter into a closing position. Non-deliverable forward foreign currency exchange contracts are settled with the counterparty in U.S. Dollars without the delivery of foreign currency. Forward foreign currency exchange contracts outstanding at period end, if any, are listed after each Fund’s Schedule of Investments.
| AQR Funds | Annual Report | September 2018 | ||||||||||||||
273
Table of Contents
| Notes to Financial Statements | September 30, 2018 |
Swap Contracts: Certain Funds engage in various swap transactions to manage risks within their portfolios or as alternatives to direct investments. Swap transactions may be privately negotiated in the over-the-counter (“OTC”) market where payments are settled through direct payments between a Fund and the counterparty. By contrast, certain swap transactions are subject to mandatory central clearing (“centrally cleared swaps”). These swaps are executed through a derivatives clearing member (“DCM”), acting in an agency capacity, and submitted to a central counterparty (“CCP”), in which case all payments are settled with the CCP through the DCM. For centrally cleared swaps, the Schedules of Investments includes the cumulative appreciation (depreciation), while only the current day’s variation margin is reported within the Statements of Assets and Liabilities. For credit default and interest rate contracts, an up-front payment received by a Fund is recorded as a liability and an up-front payment made by a Fund is recorded as an asset on the Fund’s Statement of Assets and Liabilities. Up-front payments are amortized over the term of the contract. If there is no up-front payment or receipt, market value will equal unrealized appreciation (depreciation). Periodic payments received (paid) by a Fund are recorded as realized gains (losses) from the expiration or closing of swap contracts in the Statements of Operations. The Funds’ use of swap contracts create additional risks beyond those that would exist if the Funds invested in the underlying positions directly.
Total Return Swap Contracts: Certain Funds invest in total return swaps to obtain exposure to the underlying referenced instruments, obtain leverage or attain the returns from ownership without actually owning the underlying position. Total return swaps are two-party contracts that generally obligate one party to pay the positive return and the other party to pay the negative return on a specified reference security, security index or index component during the period of the swap. Total return swap contracts are marked to market daily and the change, if any, is recorded as net change in appreciation (depreciation) on swap contracts in the Statements of Operations. Total return swaps normally do not involve the delivery of securities or other underlying assets. If the counterparty to a total return swap contract defaults, a Fund’s risk of loss consists of the net amount of payments the Fund is contractually entitled to receive, if any. The use of long total return swap contracts subject the Funds to risk of loss in excess of the amounts shown on the Schedule of Investments. The use of short total return swaps subject the Funds to potential unlimited loss. Periodic payments received (paid) by the Funds are recorded as realized gains (losses) from the expiration or closing of swap contracts in the Statements of Operations. Total return swap contracts outstanding at period end, if any, are listed after each Fund’s Schedule of Investments.
Total Return Basket Swaps: Certain Funds may enter into a total return basket swap agreement to obtain exposure to a portfolio of long and/or short securities. Under the terms of the agreement, the swap is designed to function as a portfolio of direct investments in long and short equity or fixed income positions. The absolute notional value of the total return basket swap represents the accumulated notional value of the underlying long components and absolute notional value of the short components held within the total return basket swap at period end. The notional value of each component represents the market value at period end. The Funds have the ability to trade in and out of long and short positions within the swap and will receive all of the economic benefits and risks equivalent to direct investments in these positions such as: capital appreciation (depreciation), corporate actions, and dividends and interest received and paid, all of which are reflected in the swap value. The swap value also includes financing charges and credits related to the notional values of the long and short positions and cash balances within the swap. Finance charges and credits are based on defined market rates plus or minus a specified spread. Positions within the swap are reset periodically, and financing costs are reset monthly. During a reset, any realized gains (losses) from positions, income, proceeds from corporate actions and accrued financing costs may become available for cash settlement between the Funds and the swap counterparty. Prior to the reset, these amounts are included as a component of the swap value in Net cash and other receivables (payables). Cash settlement in and out of the swap may occur at a reset date or any other date, at the discretion of the Funds and the counterparty, over the life of the agreement, and is generally determined based on limits and thresholds established as part of the Master Agreement between the Funds and the counterparty. The maturity dates are measured from the commencement of investment in each underlying portfolio swap positions. A change in the market value of a total return basket swap contract is recognized as net change in unrealized appreciation (depreciation) on swap contracts in the Statements of Operations. Cash settlements between a Fund and the counterparty are recognized as net realized gain (loss) from expiration or closing of swap contracts in the Statements of Operations. Total return basket swap contracts outstanding at period end, if any, are listed after each Fund’s Schedule of Investments.
Securities Lending: Certain Funds may lend securities to qualified borrowers approved by the Adviser in order to generate additional income. Securities loaned are collateralized by cash or securities issued by the U.S. Treasury valued at 102% to 105% of the market value of the securities on loan. The Funds may invest cash collateral in money market funds as indicated on the Schedule of Investments. The Funds bear the risk of loss associated with the collateral investments and are not entitled to additional collateral from the borrower to cover any such losses.
Daily market fluctuations could cause the value of loaned securities to be more or less than the value of the collateral received. When this occurs, the collateral is adjusted and settled on the next business day. Securities lending also involves counterparty risks, including the risk that the loaned securities may not be returned in a timely manner or at all. In the event of a default by a borrower with respect to any loan, the lending agent will exercise any and all remedies provided under the applicable borrower agreement to make the Funds whole. If, despite such efforts by the lending agent to exercise these remedies, the Funds sustain losses as a result of a borrower’s default, the lending agent indemnifies the Funds by purchasing replacement securities at its expense, or paying the Funds an amount equal to the market value of the replacement securities, subject to certain limitations which are set forth in the Securities Lending Agency Agreement between the Funds and the lending agent. Securities lending income, net on the Statement of Operations represents fees charged to borrowers plus income earned on invested cash collateral, less expenses associated with the loan. Certain of the securities on loan may have been sold prior to the close of the reporting period and are included in Receivables for Securities Sold on the Statements of Assets and Liabilities.
| AQR Funds | Annual Report | September 2018 | ||||||||||||||
274
Table of Contents
| Notes to Financial Statements | September 30, 2018 |
Security loans can be terminated at the discretion of either the lending agent or the Fund and the related securities must be returned within the earlier of the standard trade settlement period for such securities or within three business days. At period end, Funds with investment securities on loan disclose the balance of such securities on loan in the footnotes to the Schedule of Investment. The fair value of the Fund’s investment securities on loan and a related liability for collateral received on securities loaned are both presented gross on the Statement of Assets and Liabilities.
Master Agreements: Certain Funds are parties to master netting arrangements with counterparties (“Master Agreements”). Master Agreements govern the terms of certain like transactions, and reduce the counterparty risk associated with relevant transactions by specifying payment netting mechanisms across multiple transactions and providing standardization that improves legal certainty. Since different types of transactions have different mechanics and are sometimes traded by different legal entities of a particular counterparty organization, each type of transaction may be covered by a different Master Agreement, resulting in the need for multiple Master Agreements with a counterparty and its affiliates.
As the Master Agreements are specific to unique operations of different asset types, they allow the Funds to i.) close out and net their total exposure to a counterparty in the event of a default with respect to all the transactions governed under a single Master Agreement with a counterparty, ii.) exit transactions through means other than sale, such as through a negotiated agreement with the Funds’ counterparty, a transfer to another party, or close out of the position through execution of an offsetting transaction.
Prime Broker Arrangements may be entered into to facilitate execution and/or clearing of equities, bonds, equity options or short sales of securities between certain Funds and selected counterparties. These arrangements provide financing terms for such transactions and include guidelines surrounding the rights, obligations, and other events, including, but not limited to, margin, execution, and settlement. These agreements maintain provisions for payments, maintenance of collateral, events of default, and termination. Margin and other assets delivered as collateral are typically held by the prime broker and offset any obligations due to the prime broker.
Customer Account Agreements govern cleared derivatives transactions and exchange-traded futures and options transactions. Upon entering into an exchange-traded or centrally cleared derivative contract, the Funds are required to deposit with the relevant clearing organization cash or securities, which is referred to as the initial margin. Securities deposited as initial margin are designated on the Schedules of Investments and cash deposited is recorded as Deposits with brokers for centrally cleared swaps and Deposits with brokers for futures contracts on the Statements of Assets and Liabilities. For exchange-traded futures or centrally cleared swaps, initial margin is posted, and daily changes in fair value are recorded as a payable or receivable on the Statement of Assets and Liabilities as Variation margin on centrally cleared swaps and Variation margin on futures contracts. Variation margin is determined separately for exchange-traded futures and centrally cleared swaps and cannot be netted.
International Swaps and Derivatives Association, Inc. Master Agreements and Credit Support Annexes (“ISDA Master Agreements”) govern OTC derivative transactions entered into between certain Funds and a counterparty. ISDA Master Agreements maintain provisions for general obligations, representations, netting of settlement payments, agreements to deliver supporting documents, collateral transfer and events of default or termination. Events of termination include a decline in the Fund’s net assets below a specified threshold over a certain period of time or a decline in the counterparty’s long-term and short-term credit ratings below a specified level. In each case, upon occurrence, the other party may elect to terminate early and cause settlement of all OTC contracts outstanding, including the payment of any losses and costs resulting from such early termination, as reasonably determined by the terminating party. Any decision by a party to elect early termination could be material to the financial statements and impact a Fund’s future derivative activity. Collateral pledged by a Fund for OTC derivatives pursuant to a Master Agreement is segregated by the Fund’s custodian and identified as an asset in the Statements of Assets and Liabilities either as a component of Investments in securities, at value (securities) or in Due from brokers (cash).
Collateral and margin requirements differ according to the terms of each type of Master Agreement. Collateral is routinely transferred if the total net exposure net of existing collateral already in place governed under the relevant Master Agreement with a counterparty in a given account exceeds a specified threshold. Collateral can be in the form of cash, debt securities issued by the U.S. government, money market funds and other securities as agreed to by the Fund and the applicable counterparty, or as permitted by the clearing house or exchange.
Collateral posted for the benefit of a Fund pursuant to a Master Agreement is held by a custodian of the Fund. Amounts which can be invested or repledged, are presented in the Fund’s Schedule of Investments. Segregation of fund’s collateral in the custodian account helps mitigate counterparty risk. Collateral received is reflected as a liability within Due to brokers in the Statements of Assets and Liabilities.
For financial reporting purposes, the Funds do not offset derivative assets and derivative liabilities subject to master netting agreements on the Statements of Assets and Liabilities.
4. Investment Valuation and Fair Value Measurements
Investment Valuation Policies: The Net Asset Value (“NAV”) of the Funds’ shares are valued as of the close of regular trading on the New York Stock Exchange (“NYSE”) (normally 4:00 p.m. Eastern time) on each day that the NYSE is open (each a “Business Day”). The NAV per share of each class within each Fund is computed by dividing the total current value of the assets of such Fund attributable to a class, less class
| AQR Funds | Annual Report | September 2018 | ||||||||||||||
275
Table of Contents
| Notes to Financial Statements | September 30, 2018 |
liabilities, by the total number of shares of that class of the Fund outstanding at the time the computation is made. GAAP defines fair value as the price the Funds would receive to sell an asset or pay to transfer a liability in an orderly transaction between market participants at the measurement date. For purposes of calculating the NAV, portfolio securities and other financial derivative instruments are valued on each Business Day using valuation methods as adopted by the Funds’ Board of Trustees (the “Board”).
The Adviser has established a Valuation Committee (the “VC”) to assist the Board with oversight and monitoring of the valuation of the Funds’ investments. This includes administering, implementing and overseeing the continual appropriateness of valuation approaches applied and the determination of adjustments to the fair valuation of portfolio securities and other financial derivative instruments in good faith after consideration of market factor changes and events affecting issuers. The Adviser performs a series of activities to provide reasonable assurance of the accuracy of prices including: (i) periodic vendor due diligence meetings, review of approaches and techniques, new developments and processes at vendors, (ii) review of daily comparison of security valuation versus prior day for all securities that exceeded established thresholds, (iii) review of third party model prices against internal model prices, and (iv) review the results of back testing and reports for the Board on the results of fair value determinations.
Where market quotes are readily available, fair market value is generally determined on the basis of official closing prices or the last reported sales prices, or if no sales are reported, based on quotes obtained from pricing services or established market makers. Where market quotations are not readily available, or if an available market quotation is determined not to reflect fair value, securities or financial derivatives are valued at fair value, as determined in good faith by the VC in accordance with the valuation procedures approved by the Funds’ Board. Using fair value to price a security may require subjective determinations about the value of a security that could result in a value that is different from a security’s most recent closing price and from the prices used by other mutual funds to calculate their net assets. It is possible the estimated values may differ significantly from the values which would have been used had an active ready market for the investments existed. These differences could be material.
Fair Value Hierarchy: Various inputs are utilized in determining the value of each Fund’s investments. These inputs are summarized in the three broad levels as follows:
Level 1 — Inputs using unadjusted quoted prices in active markets or exchanges for identical assets and liabilities.
Level 2 — Other significant observable inputs, which may include, but are not limited to, quoted prices for similar assets or liabilities in markets that are active, quoted prices for identical or similar assets or liabilities in markets that are not active, inputs other than quoted prices that are observable for the assets or liabilities (such as interest rates, yield curves, volatilities, prepayment speeds, credit risks and default rates) or other market corroborated inputs.
Level 3 — Significant unobservable inputs based on the best information available in the circumstances, to the extent observable inputs are not available, which may include assumptions made by the Board or persons acting at their direction that are used in determining the fair value of investments.
An investment asset’s or liability’s level within the fair value hierarchy is based on the lowest level input, individually or in aggregate, that is significant to fair value measurement. The objective of fair value measurement remains the same even when there is a significant decrease in the volume and level of activity for an asset or liability and regardless of the valuation technique used. The valuation techniques used by the Funds to measure fair value maximize the use of observable inputs and minimize the use of unobservable inputs.
The inputs or methodology used for valuing securities are not necessarily an indication of the risk associated with investing in those securities.
Valuation Techniques: The following inputs and techniques may be used by the Funds to evaluate how to classify each major category of assets and liabilities into the appropriate fair value hierarchy in accordance with GAAP.
Equity securities, including securities sold short, rights, exchange options, warrants, Exchange-Traded Funds (“ETFs”) and closed-end investment companies, are valued at the last quoted sales prices or official closing prices taken from the primary market, in which each security trades and are therefore classified Level 1. Investments in mutual funds are valued daily at their NAVs which are also classified as Level 1.
An equity for which no sales are reported, as in the case of a security that is traded in the over the counter market or a less liquid listed equity, is valued at its last bid price (in the case of short sales, at the ask price) and is therefore classified Level 2. In addition, equities traded outside of the Western Hemisphere are classified Level 2 because they are fair valued daily based on the application of a fair value factor (unless the Adviser determines that use of another valuation methodology is appropriate). The Funds apply daily fair value factors, furnished by an independent pricing service, to account for the market movement between the close of the foreign market and the close of the NYSE. The pricing service uses statistical analysis and quantitative models to adjust local market prices using factors such as subsequent movement and changes in the prices of indices, American Depositary Receipts, futures contracts and exchange rates in other markets in determining fair value as of the time a Fund calculates its net asset value.
Fixed income securities (other than certain short-term investments maturing in 60 days or less) and other investments that trade in markets that are not considered to be active, are valued based on quoted market prices, dealer quotations or alternative pricing sources supported by
| AQR Funds | Annual Report | September 2018 | ||||||||||||||
276
Table of Contents
| Notes to Financial Statements | September 30, 2018 |
observable inputs and are also classified within Level 2. These include certain U.S. government and sovereign obligations, most government agency securities and investment-grade corporate bonds. Corporate and sovereign bonds and other fixed-income instruments are valued at estimated fair value using the latest bid prices or evaluated quotes furnished by independent pricing services, as well as quotations from counterparties and other market participants. Evaluated quotes are generally based on a matrix system, which may consider such factors as quoted prices for identical or similar assets, yields, maturities and ratings and are not necessarily reliant on quoted prices. Short-term debt investments of sufficient credit quality maturing in 60 days or less are generally valued at amortized cost, which approximates fair value. These investments are categorized as Level 2 within the fair value hierarchy.
Investments classified within Level 3 have significant unobservable inputs, as they trade infrequently or not at all. Level 3 instruments include illiquid securities. When observable prices are not available for these securities, the Funds may use one or more valuation approaches (e.g., the market approach, the income approach, or the cost approach), including proprietary models for which sufficient and reliable data is available. Within Level 3, the market approach generally is based on the technique of using comparable market transactions, while the use of the income approach includes the estimation of future cash flows discounted to calculate fair value. Discounts may also be applied due to the nature or durations of any restrictions on the disposition of the investment or adjusted as appropriate for credit, market and/or other risk factors.
The inputs used by the Funds in estimating the value of Level 3 investments include the original transaction price, recent transactions in the same or similar instruments, completed or pending third-party transactions in the underlying investment or comparable issuers, subsequent rounds of financing, recapitalizations and other transactions across the capital structure, offerings in the equity or debt capital markets, changes in financial ratios or cash flows, benchmark yield curves, credit spreads, estimated default rates, underlying collateral, and other unique security features. Level 3 investments may also be adjusted to reflect illiquidity and/or non-transferability, with the amount of such discount estimated by the Adviser in the absence of market information. Assumptions used by the Funds due to the lack of observable inputs may significantly impact the fair value of the investment.
Exchange-traded derivatives, such as futures contracts and exchange-traded option contracts, are typically classified within Level 1 or Level 2 of the fair value hierarchy depending on whether or not they are deemed to be actively traded. Futures and option contracts that are listed on national exchanges and are freely transferable are valued at fair value based on their last sales price on the date of determination on the exchange their constitutes the principal market or, if no sales occurred on such date, at the bid price on such exchange at the close of business on such date. Centrally cleared swaps listed or traded on a multilateral trade facility platform, such as a registered exchange, are valued on daily basis using quotations provided by an independent pricing service.
OTC derivatives, including forward contracts and swap contracts, are fair valued by the Funds on a daily basis using observable inputs, such as quotations provided by an independent pricing service, the counterparty, dealers or brokers, whenever available and considered reliable.
The value of each total return swap contract is derived from a combination of (i) the net value of the underlying positions, which are valued daily using the last sale or closing price on the principal exchange on which the securities are traded; (ii) financing costs; (iii) the value of dividends or accrued interest; (iv) cash balances within the swap; and (v) other factors, as applicable.
The U.S. Dollar value of forward foreign currency exchange contracts is determined using current forward currency exchange rates supplied by an independent pricing service.
Generally, a valuation model is used consistently for similar derivative types. In instances where models are used, the value of an OTC derivative depends upon the contractual terms of, and specific risks inherent in, the instrument as well as the availability and reliability of observable inputs. Such inputs typically may include market prices for reference securities, yield curves, credit spreads, measures of volatility, prepayment rates and implied correlations of such inputs which are obtained from outside brokers and/or pricing services when available. Certain OTC derivatives, such as generic forwards, swaps and options, have inputs which can generally be corroborated by market data and are therefore classified within Level 2. Those OTC derivatives that have less liquidity or for which inputs are unobservable are classified within Level 3. While the valuations of less liquid OTC derivatives may utilize some Level 1 and/or Level 2 inputs, they also may include other unobservable inputs which may be considered significant to the fair value determination.
Quantitative Information
The following tables represent each Fund’s valuation inputs as presented on the Schedule of Investments:
| AQR LARGE CAP MULTI-STYLE FUND | LEVEL 1 | LEVEL 2 | LEVEL 3 | TOTALS | ||||||||||||
ASSETS |
| |||||||||||||||
Common Stocks | $ | 1,886,798,655 | $ | — | $ | — | $ | 1,886,798,655 | ||||||||
Securities Lending Collateral | 11,270,160 | — | — | 11,270,160 | ||||||||||||
Short-Term Investments | 4,632,220 | — | — | 4,632,220 | ||||||||||||
Total Assets | $ | 1,902,701,035 | $ | — | $ | — | $ | 1,902,701,035 | ||||||||
| AQR Funds | Annual Report | September 2018 | ||||||||||||||
277
Table of Contents
| Notes to Financial Statements | September 30, 2018 |
| AQR LARGE CAP MULTI-STYLE FUND | LEVEL 1 | LEVEL 2 | LEVEL 3 | TOTALS | ||||||||||||
LIABILITIES | ||||||||||||||||
Futures Contracts* | $ | (124,860 | ) | $ | — | $ | — | $ | (124,860 | ) | ||||||
Total Liabilities | $ | (124,860 | ) | $ | — | $ | — | $ | (124,860 | ) | ||||||
| AQR SMALL CAP MULTI-STYLE FUND | LEVEL 1 | LEVEL 2 | LEVEL 3 | TOTALS | ||||||||||||
ASSETS |
| |||||||||||||||
Common Stocks | $ | 723,293,819 | $ | — | $ | — | $ | 723,293,819 | ||||||||
Preferred Stocks | 68,366 | — | — | 68,366 | ||||||||||||
Rights | — | — | 627 | 627 | ||||||||||||
Securities Lending Collateral | 48,526,097 | — | — | 48,526,097 | ||||||||||||
Short-Term Investments | 21,603,768 | — | — | 21,603,768 | ||||||||||||
Total Assets | $ | 793,492,050 | $ | — | $ | 627 | $ | 793,492,677 | ||||||||
LIABILITIES | ||||||||||||||||
Futures Contracts* | $ | (154,866 | ) | $ | — | $ | — | $ | (154,866 | ) | ||||||
Total Liabilities | $ | (154,866 | ) | $ | — | $ | — | $ | (154,866 | ) | ||||||
| AQR INTERNATIONAL MULTI-STYLE FUND | LEVEL 1 | LEVEL 2 | LEVEL 3 | TOTALS | ||||||||||||
ASSETS |
| |||||||||||||||
Common Stocks† | $ | 36,568,398 | $ | 370,937,277 | $ | — | $ | 407,505,675 | ||||||||
Short-Term Investments | 3,577,234 | — | — | 3,577,234 | ||||||||||||
Total Assets | $ | 40,145,632 | $ | 370,937,277 | $ | — | $ | 411,082,909 | ||||||||
LIABILITIES | ||||||||||||||||
Futures Contracts* | $ | (9,809 | ) | $ | — | $ | — | $ | (9,809 | ) | ||||||
Total Liabilities | $ | (9,809 | ) | $ | — | $ | — | $ | (9,809 | ) | ||||||
| AQR EMERGING MULTI-STYLE FUND | LEVEL 1 | LEVEL 2 | LEVEL 3 | TOTALS | ||||||||||||
ASSETS |
| |||||||||||||||
Common Stocks† | $ | 77,366,989 | $ | 222,747,435 | $ | — | $ | 300,114,424 | ||||||||
Securities Lending Collateral | 2,489,424 | — | — | 2,489,424 | ||||||||||||
Short-Term Investments | 7,035,561 | — | — | 7,035,561 | ||||||||||||
Futures Contracts* | 60,750 | — | — | 60,750 | ||||||||||||
Total Assets | $ | 86,952,724 | $ | 222,747,435 | $ | — | $ | 309,700,159 | ||||||||
| AQR TM LARGE CAP MULTI-STYLE FUND | LEVEL 1 | LEVEL 2 | LEVEL 3 | TOTALS | ||||||||||||
ASSETS |
| |||||||||||||||
Common Stocks | $ | 292,115,636 | $ | — | $ | — | $ | 292,115,636 | ||||||||
Securities Lending Collateral | 1,618,753 | — | — | 1,618,753 | ||||||||||||
Short-Term Investments | 9,949,723 | — | — | 9,949,723 | ||||||||||||
Futures Contracts* | 24,624 | — | — | 24,624 | ||||||||||||
Total Assets | $ | 303,708,736 | $ | — | $ | — | $ | 303,708,736 | ||||||||
| AQR TM SMALL CAP MULTI-STYLE FUND | LEVEL 1 | LEVEL 2 | LEVEL 3 | TOTALS | ||||||||||||
ASSETS |
| |||||||||||||||
Common Stocks | $ | 33,941,699 | $ | — | $ | — | $ | 33,941,699 | ||||||||
Preferred Stocks | 2,632 | — | — | 2,632 | ||||||||||||
Rights | — | — | 13 | 13 | ||||||||||||
Securities Lending Collateral | 2,102,658 | — | — | 2,102,658 | ||||||||||||
Short-Term Investments | 886,599 | — | — | 886,599 | ||||||||||||
Total Assets | $ | 36,933,588 | $ | — | $ | 13 | $ | 36,933,601 | ||||||||
| AQR Funds | Annual Report | September 2018 | ||||||||||||||
278
Table of Contents
| Notes to Financial Statements | September 30, 2018 |
| AQR TM SMALL CAP MULTI-STYLE FUND | LEVEL 1 | LEVEL 2 | LEVEL 3 | TOTALS | ||||||||||||
LIABILITIES | ||||||||||||||||
Futures Contracts* | $ | (4,102 | ) | $ | — | $ | — | $ | (4,102 | ) | ||||||
Total Liabilities | $ | (4,102 | ) | $ | — | $ | — | $ | (4,102 | ) | ||||||
| AQR TM INTERNATIONAL MULTI-STYLE FUND | LEVEL 1 | LEVEL 2 | LEVEL 3 | TOTALS | ||||||||||||
ASSETS |
| |||||||||||||||
Common Stocks† | $ | 15,957,658 | $ | 168,909,783 | $ | — | $ | 184,867,441 | ||||||||
Securities Lending Collateral | 52,330 | — | — | 52,330 | ||||||||||||
Short-Term Investments | 4,696,503 | — | — | 4,696,503 | ||||||||||||
Futures Contracts* | 26,906 | — | — | 26,906 | ||||||||||||
Total Assets | $ | 20,733,397 | $ | 168,909,783 | $ | — | $ | 189,643,180 | ||||||||
| AQR TM EMERGING MULTI-STYLE FUND | LEVEL 1 | LEVEL 2 | LEVEL 3 | TOTALS | ||||||||||||
ASSETS |
| |||||||||||||||
Common Stocks† | $ | 83,701,221 | $ | 237,469,232 | $ | — | $ | 321,170,453 | ||||||||
Securities Lending Collateral | 2,394,189 | — | — | 2,394,189 | ||||||||||||
Short-Term Investments | 9,203,520 | — | — | 9,203,520 | ||||||||||||
Futures Contracts* | 119,288 | — | — | 119,288 | ||||||||||||
Total Assets | $ | 95,418,218 | $ | 237,469,232 | $ | — | $ | 332,887,450 | ||||||||
| AQR LARGE CAP MOMENTUM STYLE FUND | LEVEL 1 | LEVEL 2 | LEVEL 3 | TOTALS | ||||||||||||
ASSETS |
| |||||||||||||||
Common Stocks | $ | 1,139,990,311 | $ | — | $ | — | $ | 1,139,990,311 | ||||||||
Securities Lending Collateral | 14,715,208 | — | — | 14,715,208 | ||||||||||||
Short-Term Investments | 29,736,678 | — | — | 29,736,678 | ||||||||||||
Futures Contracts* | 99,080 | — | — | 99,080 | ||||||||||||
Total Assets | $ | 1,184,541,277 | $ | — | $ | — | $ | 1,184,541,277 | ||||||||
| AQR SMALL CAP MOMENTUM STYLE FUND | LEVEL 1 | LEVEL 2 | LEVEL 3 | TOTALS | ||||||||||||
ASSETS |
| |||||||||||||||
Common Stocks | $ | 367,301,427 | $ | — | $ | — | (a) | $ | 367,301,427 | |||||||
Securities Lending Collateral | 22,908,891 | — | — | 22,908,891 | ||||||||||||
Short-Term Investments | 3,721,112 | — | — | 3,721,112 | ||||||||||||
Warrants | — | — | — | (a) | — | (a) | ||||||||||
Total Assets | $ | 393,931,430 | $ | — | $ | — | (a) | $ | 393,931,430 | |||||||
LIABILITIES | ||||||||||||||||
Futures Contracts* | $ | (2,170 | ) | $ | — | $ | — | $ | (2,170 | ) | ||||||
Total Liabilities | $ | (2,170 | ) | $ | — | $ | — | $ | (2,170 | ) | ||||||
| AQR INTERNATIONAL MOMENTUM STYLE FUND | LEVEL 1 | LEVEL 2 | LEVEL 3 | TOTALS | ||||||||||||
ASSETS |
| |||||||||||||||
Common Stocks† | $ | 45,001,820 | $ | 390,577,035 | $ | — | $ | 435,578,855 | ||||||||
Securities Lending Collateral | 2,426,324 | — | — | 2,426,324 | ||||||||||||
Short-Term Investments | 13,193,665 | — | — | 13,193,665 | ||||||||||||
Futures Contracts* | 86,250 | — | — | 86,250 | ||||||||||||
Total Assets | $ | 60,708,059 | $ | 390,577,035 | $ | — | $ | 451,285,094 | ||||||||
| AQR Funds | Annual Report | September 2018 | ||||||||||||||
279
Table of Contents
| Notes to Financial Statements | September 30, 2018 |
| AQR EMERGING MOMENTUM STYLE FUND | LEVEL 1 | LEVEL 2 | LEVEL 3 | TOTALS | ||||||||||||
ASSETS |
| |||||||||||||||
Common Stocks† | $ | 1,674,607 | $ | 10,060,754 | $ | — | (a) | $ | 11,735,361 | |||||||
Exchange-Traded Funds † | 478,172 | — | — | 478,172 | ||||||||||||
Securities Lending Collateral | 81,466 | — | — | 81,466 | ||||||||||||
Short-Term Investments | 174,016 | — | — | 174,016 | ||||||||||||
Total Assets | $ | 2,408,261 | $ | 10,060,754 | $ | — | (a) | $ | 12,469,015 | |||||||
| AQR TM LARGE CAP MOMENTUM STYLE FUND | LEVEL 1 | LEVEL 2 | LEVEL 3 | TOTALS | ||||||||||||
ASSETS |
| |||||||||||||||
Common Stocks | $ | 220,931,001 | $ | — | $ | — | $ | 220,931,001 | ||||||||
Securities Lending Collateral | 2,617,030 | — | — | 2,617,030 | ||||||||||||
Short-Term Investments | 7,353,171 | — | — | 7,353,171 | ||||||||||||
Futures Contracts* | 20,957 | — | — | 20,957 | ||||||||||||
Total Assets | $ | 230,922,159 | $ | — | $ | — | $ | 230,922,159 | ||||||||
| AQR TM SMALL CAP MOMENTUM STYLE FUND | LEVEL 1 | LEVEL 2 | LEVEL 3 | TOTALS | ||||||||||||
ASSETS |
| |||||||||||||||
Common Stocks | $ | 66,908,396 | $ | — | $ | — | $ | 66,908,396 | ||||||||
Securities Lending Collateral | 8,721,842 | — | — | 8,721,842 | ||||||||||||
Short-Term Investments | 1,834,124 | — | — | 1,834,124 | ||||||||||||
Total Assets | $ | 77,464,362 | $ | — | $ | — | $ | 77,464,362 | ||||||||
LIABILITIES | ||||||||||||||||
Futures Contracts* | $ | (12,493 | ) | $ | — | $ | — | $ | (12,493 | ) | ||||||
Total Liabilities | $ | (12,493 | ) | $ | — | $ | — | $ | (12,493 | ) | ||||||
| AQR TM INTERNATIONAL MOMENTUM STYLE FUND | LEVEL 1 | LEVEL 2 | LEVEL 3 | TOTALS | ||||||||||||
ASSETS |
| |||||||||||||||
Common Stocks† | $ | 12,972,790 | $ | 111,779,318 | $ | — | $ | 124,752,108 | ||||||||
Securities Lending Collateral | 1,478,496 | — | — | 1,478,496 | ||||||||||||
Short-Term Investments | 3,657,418 | — | — | 3,657,418 | ||||||||||||
Futures Contracts* | 20,679 | — | — | 20,679 | ||||||||||||
Total Assets | $ | 18,129,383 | $ | 111,779,318 | $ | — | $ | 129,908,701 | ||||||||
| AQR LARGE CAP DEFENSIVE STYLE FUND | LEVEL 1 | LEVEL 2 | LEVEL 3 | TOTALS | ||||||||||||
ASSETS |
| |||||||||||||||
Common Stocks | $ | 2,039,998,037 | $ | — | $ | — | $ | 2,039,998,037 | ||||||||
Securities Lending Collateral | 6,537,627 | — | — | 6,537,627 | ||||||||||||
Short-Term Investments | 75,586,336 | — | — | 75,586,336 | ||||||||||||
Futures Contracts* | 45,563 | — | — | 45,563 | ||||||||||||
Total Assets | $ | 2,122,167,563 | $ | — | $ | — | $ | 2,122,167,563 | ||||||||
| AQR INTERNATIONAL DEFENSIVE STYLE FUND | LEVEL 1 | LEVEL 2 | LEVEL 3 | TOTALS | ||||||||||||
ASSETS |
| |||||||||||||||
Common Stocks† | $ | 23,769,907 | $ | 173,198,797 | $ | — | $ | 196,968,704 | ||||||||
Securities Lending Collateral | 3,863,336 | — | — | 3,863,336 | ||||||||||||
Short-Term Investments | 7,933,286 | — | — | 7,933,286 | ||||||||||||
Futures Contracts* | 63,217 | — | — | 63,217 | ||||||||||||
Total Assets | $ | 35,629,746 | $ | 173,198,797 | $ | — | $ | 208,828,543 | ||||||||
| AQR Funds | Annual Report | September 2018 | ||||||||||||||
280
Table of Contents
| Notes to Financial Statements | September 30, 2018 |
| AQR EMERGING DEFENSIVE STYLE FUND | LEVEL 1 | LEVEL 2 | LEVEL 3 | TOTALS | ||||||||||||
ASSETS |
| |||||||||||||||
Common Stocks† | $ | 13,111,286 | $ | 68,653,105 | $ | 1 | $ | 81,764,392 | ||||||||
Securities Lending Collateral | 1,225,254 | — | — | 1,225,254 | ||||||||||||
Short-Term Investments | 4,054,121 | — | — | 4,054,121 | ||||||||||||
Warrants† | — | — | — | (a) | — | (a) | ||||||||||
Futures Contracts* | 52,103 | — | — | 52,103 | ||||||||||||
Total Assets | $ | 18,442,764 | $ | 68,653,105 | $ | 1 | $ | 87,095,870 | ||||||||
| AQR GLOBAL EQUITY FUND | LEVEL 1 | LEVEL 2 | LEVEL 3 | TOTALS | ||||||||||||
ASSETS |
| |||||||||||||||
Common Stocks† | $ | 212,086,353 | $ | 118,219,539 | $ | 140 | $ | 330,306,032 | ||||||||
Short-Term Investments | 36,630,939 | — | — | 36,630,939 | ||||||||||||
Futures Contracts* | 2,148,400 | — | — | 2,148,400 | ||||||||||||
Forward Foreign Currency Exchange Contracts* | — | 1,967,768 | — | 1,967,768 | ||||||||||||
Total Return Swaps Contracts* | — | 1,294,075 | — | 1,294,075 | ||||||||||||
Total Assets | $ | 250,865,692 | $ | 121,481,382 | $ | 140 | $ | 372,347,214 | ||||||||
LIABILITIES | ||||||||||||||||
Futures Contracts* | $ | (291,917 | ) | $ | — | $ | — | $ | (291,917 | ) | ||||||
Forward Foreign Currency Exchange Contracts* | — | (2,413,125 | ) | — | (2,413,125 | ) | ||||||||||
Total Return Swaps Contracts* | — | (196,937 | ) | — | (196,937 | ) | ||||||||||
Total Liabilities | $ | (291,917 | ) | $ | (2,610,062 | ) | $ | — | $ | (2,901,979 | ) | |||||
| AQR INTERNATIONAL EQUITY FUND | LEVEL 1 | LEVEL 2 | LEVEL 3 | TOTALS | ||||||||||||
ASSETS |
| |||||||||||||||
Common Stocks† | $ | — | $ | 392,592,721 | $ | 208 | $ | 392,592,929 | ||||||||
Securities Lending Collateral | 261,851 | — | — | 261,851 | ||||||||||||
Short-Term Investments | 44,579,126 | — | — | 44,579,126 | ||||||||||||
Futures Contracts* | 6,302,983 | — | — | 6,302,983 | ||||||||||||
Forward Foreign Currency Exchange Contracts* | — | 1,758,065 | — | 1,758,065 | ||||||||||||
Total Return Swaps Contracts* | — | 861,853 | — | 861,853 | ||||||||||||
Total Assets | $ | 51,143,960 | $ | 395,212,639 | $ | 208 | $ | 446,356,807 | ||||||||
LIABILITIES | ||||||||||||||||
Futures Contracts* | $ | (1,099,416 | ) | $ | — | $ | — | $ | (1,099,416 | ) | ||||||
Forward Foreign Currency Exchange Contracts* | — | (2,039,425 | ) | — | (2,039,425 | ) | ||||||||||
Total Return Swaps Contracts* | — | (696,937 | ) | — | (696,937 | ) | ||||||||||
Total Liabilities | $ | (1,099,416 | ) | $ | (2,736,362 | ) | $ | — | $ | (3,835,778 | ) | |||||
| AQR LARGE CAP RELAXED CONSTRAINT EQUITY FUND | LEVEL 1 | LEVEL 2 | LEVEL 3 | TOTALS | ||||||||||||
ASSETS |
| |||||||||||||||
Common Stocks | $ | 24,172,647 | $ | — | $ | — | $ | 24,172,647 | ||||||||
Exchange-Traded Funds | 445,092 | — | — | 445,092 | ||||||||||||
Short-Term Investments | 276,955 | — | — | 276,955 | ||||||||||||
Total Assets | $ | 24,894,694 | $ | — | $ | — | $ | 24,894,694 | ||||||||
LIABILITIES | ||||||||||||||||
Common Stocks (Sold Short) | $ | (5,654,211 | ) | $ | — | $ | — | $ | (5,654,211 | ) | ||||||
Total Liabilities | $ | (5,654,211 | ) | $ | — | $ | — | $ | (5,654,211 | ) | ||||||
| AQR Funds | Annual Report | September 2018 | ||||||||||||||
281
Table of Contents
| Notes to Financial Statements | September 30, 2018 |
| AQR SMALL CAP RELAXED CONSTRAINT EQUITY FUND | LEVEL 1 | LEVEL 2 | LEVEL 3 | TOTALS | ||||||||||||
ASSETS |
| |||||||||||||||
Common Stocks | $ | 4,239,223 | $ | — | $ | — | $ | 4,239,223 | ||||||||
Exchange-Traded Funds | 28,654 | — | — | 28,654 | ||||||||||||
Rights | — | — | 89 | 89 | ||||||||||||
Short-Term Investments | 76,892 | — | — | 76,892 | ||||||||||||
Total Assets | $ | 4,344,769 | $ | — | $ | 89 | $ | 4,344,858 | ||||||||
LIABILITIES | ||||||||||||||||
Common Stocks (Sold Short) | $ | (1,007,032 | ) | $ | — | $ | — | $ | (1,007,032 | ) | ||||||
Total Liabilities | $ | (1,007,032 | ) | $ | — | $ | — | $ | (1,007,032 | ) | ||||||
| AQR INTERNATIONAL RELAXED CONSTRAINT EQUITY FUND | LEVEL 1 | LEVEL 2 | LEVEL 3 | TOTALS | ||||||||||||
ASSETS |
| |||||||||||||||
Common Stocks† | $ | — | $ | 88,468,539 | $ | — | $ | 88,468,539 | ||||||||
Short-Term Investments | 1,767,202 | — | — | 1,767,202 | ||||||||||||
Futures Contracts* | 15,643 | — | — | 15,643 | ||||||||||||
Total Assets | $ | 1,782,845 | $ | 88,468,539 | $ | — | $ | 90,251,384 | ||||||||
LIABILITIES | ||||||||||||||||
Common Stocks (Sold Short)† | $ | — | $ | (20,640,421 | ) | $ | — | $ | (20,640,421 | ) | ||||||
Total Liabilities | $ | — | $ | (20,640,421 | ) | $ | — | $ | (20,640,421 | ) | ||||||
| AQR EMERGING RELAXED CONSTRAINT EQUITY FUND | LEVEL 1 | LEVEL 2 | LEVEL 3 | TOTALS | ||||||||||||
ASSETS |
| |||||||||||||||
Common Stocks† | $ | 10,249,501 | $ | 16,369,358 | $ | — | (a) | $ | 26,618,859 | |||||||
Short-Term Investments | 9,965,274 | — | — | 9,965,274 | ||||||||||||
Futures Contracts* | 14,479 | — | — | 14,479 | ||||||||||||
Total Return Basket Swaps Contracts* | — | 950,905 | — | 950,905 | ||||||||||||
Total Assets | $ | 20,229,254 | $ | 17,320,263 | $ | — | (a) | $ | 37,549,517 | |||||||
LIABILITIES | ||||||||||||||||
Total Return Basket Swaps Contracts* | $ | — | $ | (952,230 | ) | $ | — | $ | (952,230 | ) | ||||||
Total Liabilities | $ | — | $ | (952,230 | ) | $ | — | $ | (952,230 | ) | ||||||
| * | Derivative instruments, including futures, forward foreign currency exchange, total return swap and total return basket swap contracts, are reported at the cumulative unrealized appreciation/(depreciation) of the instrument within the Funds’ Schedule of Investments. Only current day’s variation margin is reported within the Statements of Assets and Liabilities for exchange-traded and cleared derivatives. |
| † | Please refer to the Schedule of Investments to view securities segregated by country. |
| (a) | Security has zero value. |
Transfers to Level 3 or from Level 3 are generally due to a decline or an increase in market activity (e.g., frequency of trades), which resulted in a lack of, or increase in, available market inputs to determine price.
During the period ended September 30, 2018, there were no transfers to or from level 3 for any of the Funds. There were no other Level 3 securities held at period end, except those securities classified as Level 3 in the Schedules of Investments that are considered quantitatively insignificant in the aggregate for the AQR Small Cap Multi-Style Fund, AQR TM Small Cap Multi-Style Fund, AQR Small Cap Momentum Style Fund, AQR Emerging Momentum Style Fund, AQR Emerging Defensive Style Fund, AQR Global Equity Fund, AQR International Equity Fund, AQR Small Cap Relaxed Constraint Equity Fund and AQR Emerging Relaxed Constraint Equity Fund.
The fair market values of Level 3 investments are based on significant unobservable inputs that reflect the Adviser’s determination of assumptions that market participants might reasonably use in valuing the securities. Changes in significant unobservable inputs could cause significant changes in valuation to individual securities and in aggregate. Fair value determinations and valuation of investments that are not actively trading involve judgment and may differ materially from valuations that would have been used had greater market activity occurred.
The significant unobservable inputs used in the fair value measurement of a Fund’s investments in common stocks, corporate bonds, convertible bonds, convertible preferred stocks and warrants potentially include credit spread, liquidity discount, earnings multiples and volatility. Significant increases in the credit spread or liquidity discount inputs in isolation would potentially result in a significantly lower fair value
| AQR Funds | Annual Report | September 2018 | ||||||||||||||
282
Table of Contents
| Notes to Financial Statements | September 30, 2018 |
measurement, whereas an increase in volatility generally results in a higher fair value measurement. Generally, a change in the assumption used for the credit spread would be accompanied by a directionally-similar change in the assumptions used for the volatility and liquidity discount. Investments in common stocks potentially include liquidity discounts, theoretical values, book to value analysis and/or broker quotes. Significant changes in any of these inputs would significantly change the fair value measurement of the position.
5. Federal Income Tax Matters
At September 30, 2018, the cost and aggregate gross unrealized appreciation (depreciation) of long security positions, short security positions and derivative instruments for federal income tax purposes were as follows:
| FUND | COST OF INVESTMENTS | GROSS UNREALIZED | GROSS UNREALIZED DEPRECIATION | NET (DEPRECIATION) | ||||||||||||
AQR Large Cap Multi-Style Fund | $ | 1,463,455,390 | $ | 456,155,695 | $ | (17,034,910 | ) | $ | 439,120,785 | |||||||
AQR Small Cap Multi-Style Fund | 655,682,804 | 160,449,803 | (22,794,796 | ) | 137,655,007 | |||||||||||
AQR International Multi-Style Fund | 370,961,679 | 51,907,361 | (11,795,940 | ) | 40,111,421 | |||||||||||
AQR Emerging Multi-Style Fund | 266,048,944 | 57,339,682 | (13,688,467 | ) | 43,651,215 | |||||||||||
AQR TM Large Cap Multi-Style Fund | 233,178,630 | 71,982,720 | (1,452,614 | ) | 70,530,106 | |||||||||||
AQR TM Small Cap Multi-Style Fund | 29,941,952 | 7,721,474 | (733,927 | ) | 6,987,547 | |||||||||||
AQR TM International Multi-Style Fund | 162,044,253 | 31,234,592 | (3,635,665 | ) | 27,598,927 | |||||||||||
AQR TM Emerging Multi-Style Fund | 260,619,545 | 79,360,758 | (7,092,853 | ) | 72,267,905 | |||||||||||
AQR Large Cap Momentum Style Fund | 849,181,732 | 343,741,475 | (8,381,930 | ) | 335,359,545 | |||||||||||
AQR Small Cap Momentum Style Fund | 301,190,791 | 104,212,296 | (11,473,827 | ) | 92,738,469 | |||||||||||
AQR International Momentum Style Fund | 392,388,118 | 68,615,419 | (9,718,443 | ) | 58,896,976 | |||||||||||
AQR Emerging Momentum Style Fund | 10,551,227 | 2,301,064 | (383,276 | ) | 1,917,788 | |||||||||||
AQR TM Large Cap Momentum Style Fund | 145,889,804 | 85,417,323 | (384,968 | ) | 85,032,355 | |||||||||||
AQR TM Small Cap Momentum Style Fund | 60,386,383 | 18,658,401 | (1,592,915 | ) | 17,065,486 | |||||||||||
AQR TM International Momentum Style Fund | 113,060,264 | 20,641,550 | (3,793,113 | ) | 16,848,437 | |||||||||||
AQR Large Cap Defensive Style Fund | 1,678,352,325 | 452,452,454 | (8,637,216 | ) | 443,815,238 | |||||||||||
AQR International Defensive Style Fund | 187,748,435 | 28,816,683 | (7,736,575 | ) | 21,080,108 | |||||||||||
AQR Emerging Defensive Style Fund | 79,279,056 | 12,782,876 | (4,966,062 | ) | 7,816,814 | |||||||||||
AQR Global Equity Fund | 326,078,892 | 54,883,955 | (11,517,612 | ) | 43,366,343 | |||||||||||
AQR International Equity Fund | 410,785,882 | 48,944,561 | (17,209,414 | ) | 31,735,147 | |||||||||||
AQR Large Cap Relaxed Constraint Equity Fund | 15,743,204 | 4,295,276 | (797,997 | ) | 3,497,279 | |||||||||||
AQR Small Cap Relaxed Constraint Equity Fund | 2,739,245 | 893,747 | (295,166 | ) | 598,581 | |||||||||||
AQR International Relaxed Constraint Equity Fund | 70,896,682 | 6,556,211 | (7,841,930 | ) | (1,285,719 | ) | ||||||||||
AQR Emerging Relaxed Constraint Equity Fund | 37,482,984 | 2,123,960 | (3,009,657 | ) | (885,697 | ) | ||||||||||
The differences between book basis and tax basis appreciation (depreciation) on investments is primarily attributable to wash sale loss deferrals, mark to market on passive foreign investment companies (“PFIC”) and non-taxable dividends from fund investments including Real Estate Investment Trusts (“REITs”).
As of September 30, 2018, the components of distributable earnings on a tax basis were as follows:
| FUND | CURRENT DISTRIBUTABLE ORDINARY INCOME | CURRENT DISTRIBUTABLE LONG TERM CAPITALGAIN OR TAX BASIS CAPITAL LOSS CARRYFORWARDS | NET UNREALIZED APPRECIATION (DEPRECIATION) | POST OCTOBER CAPITAL OR LATE YEAR ORDINARY LOSS DEFERRALS | OTHER TEMPORARY DIFFERENCES | TOTAL ACCUMULATED EARNINGS | ||||||||||||||||||
AQR Large Cap Multi-Style Fund | $ | 20,171,137 | $ | 76,078,305 | $ | 439,120,785 | $ | — | $ | — | $ | 535,370,227 | ||||||||||||
AQR Small Cap Multi-Style Fund | 10,050,029 | 54,992,179 | 137,655,007 | — | — | 202,697,215 | ||||||||||||||||||
AQR International Multi-Style Fund | 10,554,570 | (8,146,841 | ) | 40,153,210 | (9,414,416 | ) | — | 33,146,523 | ||||||||||||||||
AQR Emerging Multi-Style Fund | 5,945,685 | (22,624,168 | ) | 43,363,213 | (5,326,336 | ) | — | 21,358,394 | ||||||||||||||||
AQR TM Large Cap Multi-Style Fund | 2,685,102 | (70,709 | ) | 70,530,106 | — | — | 73,144,499 | |||||||||||||||||
AQR TM Small Cap Multi-Style Fund | 104,156 | 980,370 | 6,987,547 | — | — | 8,072,073 | ||||||||||||||||||
| AQR Funds | Annual Report | September 2018 | ||||||||||||||
283
Table of Contents
| Notes to Financial Statements | September 30, 2018 |
| FUND | CURRENT DISTRIBUTABLE ORDINARY INCOME | CURRENT DISTRIBUTABLE LONG TERM CAPITALGAIN OR TAX BASIS CAPITAL LOSS CARRYFORWARDS | NET UNREALIZED APPRECIATION (DEPRECIATION) | POST OCTOBER CAPITAL OR LATE YEAR ORDINARY LOSS DEFERRALS | OTHER TEMPORARY DIFFERENCES | TOTAL ACCUMULATED EARNINGS | ||||||||||||||||||
AQR TM International Multi-StyleFund | $ | 4,007,131 | $ | (3,352,343 | ) | $ | 27,597,514 | $ | (2,889,529 | ) | $ | — | $ | 25,362,773 | ||||||||||
AQR TM Emerging Multi-Style Fund | 7,059,380 | (5,179,137 | ) | 71,914,217 | (7,408,518 | ) | — | 66,385,942 | ||||||||||||||||
AQR Large Cap Momentum Style Fund | 20,582,919 | 62,812,281 | 335,359,526 | — | — | 418,754,726 | ||||||||||||||||||
AQR Small Cap Momentum Style Fund | 1,267,778 | 53,037,330 | 92,738,469 | (20,207 | ) | — | 147,023,370 | |||||||||||||||||
AQR International Momentum Style Fund | 7,486,219 | (7,011,474 | ) | 58,884,567 | (3,777,442 | ) | — | 55,581,870 | ||||||||||||||||
AQR Emerging Momentum Style Fund | 228,602 | (918,111 | ) | 1,915,632 | (230,108 | ) | — | 996,015 | ||||||||||||||||
AQR TM Large Cap Momentum Style Fund | 1,296,767 | (1,276,023 | ) | 85,032,355 | — | — | 85,053,099 | |||||||||||||||||
AQR TM Small Cap Momentum Style Fund | 63,451 | 4,182,026 | 17,065,486 | (1,314 | ) | — | 21,309,649 | |||||||||||||||||
AQR TM International Momentum Style Fund | 2,151,187 | (11,860,336 | ) | 16,848,006 | (834,249 | ) | — | 6,304,608 | ||||||||||||||||
AQR Large Cap Defensive Style Fund | 16,976,842 | 9,709,001 | 443,815,238 | — | — | 470,501,081 | ||||||||||||||||||
AQR International Defensive Style Fund | 4,067,556 | — | 21,077,028 | (82,321 | ) | — | 25,062,263 | |||||||||||||||||
AQR Emerging Defensive Style Fund | 1,423,301 | (11,124,405 | ) | 7,763,543 | (500,411 | ) | — | (2,437,972 | ) | |||||||||||||||
AQR Global Equity Fund | 4,193,164 | 6,114,849 | 42,874,977 | (6,619,171 | ) | (4,159 | ) | 46,559,660 | ||||||||||||||||
AQR International Equity Fund | 7,323,584 | 1,897,898 | 25,215,957 | (1,619,450 | ) | — | 32,817,989 | |||||||||||||||||
AQR Large Cap Relaxed Constraint Equity Fund | 103,032 | (21,901 | ) | 3,497,279 | (457,253 | ) | — | 3,121,157 | ||||||||||||||||
AQR Small Cap Relaxed Constraint Equity Fund | — | (135,003 | ) | 598,581 | (247,915 | ) | — | 215,663 | ||||||||||||||||
AQR International Relaxed Constraint Equity Fund | 1,291,288 | — | (1,296,009 | ) | (3,259,250 | ) | — | (3,263,971 | ) | |||||||||||||||
AQR Emerging Relaxed Constraint Equity Fund | 301,441 | — | (883,555 | ) | (3,159,420 | ) | — | (3,741,534 | ) | |||||||||||||||
The differences between book basis and tax basis components of distributable earnings are primarily attributable to wash sales loss deferrals, mark to market on forward foreign currency exchange contracts, mark to market on regulated futures contracts, mark to market on PFIC investments, mark to market on equity swaps, non-taxable dividends from fund investments including REITs, loss deferrals from tax straddles, and capital loss carry forwards.
As of September 30, 2018, the effect of permanent book/tax reclassifications resulted in increase (decrease) to the components of net assets as follows:
| FUND | TOTAL DISTRIBUTABLE EARNINGS (LOSS) | PAID-IN CAPITAL | ||||||
AQR Large Cap Multi-Style Fund | $ | (8,169,414 | ) | $ | 8,169,414 | |||
AQR Small Cap Multi-Style Fund | (4,245,287 | ) | 4,245,287 | |||||
AQR Large Cap Momentum Style Fund | (6,332,880 | ) | 6,332,880 | |||||
AQR Small Cap Momentum Style Fund | (5,271,854 | ) | 5,271,854 | |||||
AQR Global Equity Fund | 2,936 | (2,936 | ) | |||||
AQR Large Cap Relaxed Constraint Equity Fund | 5,813 | (5,813 | ) | |||||
AQR Small Cap Relaxed Constraint Equity Fund | 4,359 | (4,359 | ) | |||||
AQR International Relaxed Constraint Equity Fund | 4,337 | (4,337 | ) | |||||
AQR Emerging Relaxed Constraint Equity Fund | 4,553 | (4,553 | ) | |||||
| AQR Funds | Annual Report | September 2018 | ||||||||||||||
284
Table of Contents
| Notes to Financial Statements | September 30, 2018 |
For financial reporting purposes, capital accounts are adjusted to reflect the tax character of permanent book/tax differences. Reclassifications are primarily due to the difference in tax treatment of certain non deductible expenses and redemptions utilized as distributions. The result of operations and net assets were not affected by the reclassifications.
The tax character of distributions paid during the fiscal year-ends or periods September 30, 2018 and September 30, 2017 were as follows:
| SEPTEMBER 30, 2018 | SEPTEMBER 30, 2017 | |||||||||||||||||||
| FUND | ORDINARY INCOME | CAPITAL GAINS | RETURN OF CAPITAL | ORDINARY INCOME | CAPITAL GAINS | |||||||||||||||
AQR Large Cap Multi-Style Fund | $ | 24,214,628 | $ | 18,502,454 | $ | — | $ | 20,996,010 | $ | — | ||||||||||
AQR Small Cap Multi-Style Fund | 32,228,573 | 38,349,960 | — | 18,062,877 | 2,420,639 | |||||||||||||||
AQR International Multi-Style Fund | 11,688,075 | — | — | 9,797,796 | — | |||||||||||||||
AQR Emerging Multi-Style Fund | 5,511,423 | — | — | 5,242,559 | — | |||||||||||||||
AQR TM Large Cap Multi-Style Fund | 2,988,559 | — | — | 1,955,676 | — | |||||||||||||||
AQR TM Small Cap Multi-Style Fund | 229,172 | 575,538 | — | 202,577 | — | |||||||||||||||
AQR TM International Multi-Style Fund | 4,462,834 | — | — | 2,963,342 | — | |||||||||||||||
AQR TM Emerging Multi-Style Fund | 5,904,163 | — | — | 6,858,404 | — | |||||||||||||||
AQR Large Cap Momentum Style Fund | 9,582,619 | 77,695,110 | — | 13,921,995 | 54,817,139 | |||||||||||||||
AQR Small Cap Momentum Style Fund | 937,060 | 33,113,161 | — | 2,646,468 | — | |||||||||||||||
AQR International Momentum Style Fund | 8,815,825 | — | — | 7,689,908 | — | |||||||||||||||
AQR Emerging Momentum Style Fund | 258,398 | — | — | 151,578 | — | |||||||||||||||
AQR TM Large Cap Momentum Style Fund | 1,558,715 | — | — | 2,192,751 | — | |||||||||||||||
AQR TM Small Cap Momentum Style Fund | 132,400 | 48,880 | — | 257,257 | — | |||||||||||||||
AQR TM International Momentum Style Fund | 1,999,095 | — | — | 1,904,442 | — | |||||||||||||||
AQR Large Cap Defensive Style Fund | 22,563,901 | 7,907,632 | — | 13,808,066 | 3,564,795 | |||||||||||||||
AQR International Defensive Style Fund | 4,369,486 | — | — | 1,918,782 | — | |||||||||||||||
AQR Emerging Defensive Style Fund | 1,140,163 | — | — | 780,424 | — | |||||||||||||||
AQR Global Equity Fund | 9,041,338 | 5,464,443 | — | 3,231,984 | 10,063,105 | |||||||||||||||
AQR International Equity Fund | 26,222,287 | 11,174,436 | — | 12,304,977 | 5,622,942 | |||||||||||||||
AQR Large Cap Relaxed Constraint Equity Fund | 155,955 | — | — | — | — | |||||||||||||||
AQR Small Cap Relaxed Constraint Equity Fund | 30,280 | — | 2,926 | — | — | |||||||||||||||
AQR International Relaxed Constraint Equity Fund | 264,489 | — | — | — | — | |||||||||||||||
AQR Emerging Relaxed Constraint Equity Fund | 345,042 | — | — | — | — | |||||||||||||||
During the year ended September 30, 2018, the Funds utilized capital loss carryforwards in the amounts listed below:
| FUND | SHORT-TERM | LONG-TERM | ||||||
AQR Large Cap Multi-Style Fund | $ | 12,015,570 | $ | — | ||||
AQR International Multi-Style Fund | 26,410,701 | — | ||||||
AQR Emerging Multi-Style Fund | 12,922,849 | 1,082,589 | ||||||
AQR TM Large Cap Multi-Style Fund | 2,408,822 | — | ||||||
AQR TM International Multi-Style Fund | 2,876,241 | 1,301,700 | ||||||
AQR TM Emerging Multi-Style Fund | 6,222,847 | — | ||||||
AQR International Momentum Style Fund | 16,345,936 | — | ||||||
AQR Emerging Momentum Style Fund | 1,251,262 | 170,413 | ||||||
AQR TM International Momentum Style Fund | — | 1,226,647 | ||||||
AQR Emerging Defensive Style Fund | 348,005 | — | ||||||
AQR Large Cap Relaxed Constraint Equity Fund | 16,710 | 3 | ||||||
| AQR Funds | Annual Report | September 2018 | ||||||||||||||
285
Table of Contents
| Notes to Financial Statements | September 30, 2018 |
As of September 30, 2018, for federal income tax purposes, the following Funds have capital loss carryforwards, with no expiration, available to offset future capital gains, if any, to the extent provided by the U.S. Treasury regulations.
| FUND | SHORT-TERM | LONG-TERM | ||||||
AQR International Multi-Style Fund | $ | 8,146,841 | $ | — | ||||
AQR Emerging Multi-Style Fund | 22,624,168 | — | ||||||
AQR TM Large Cap Multi-Style Fund | 70,709 | — | ||||||
AQR TM International Multi-Style Fund | 3,352,343 | — | ||||||
AQR TM Emerging Multi-Style Fund | 5,179,137 | — | ||||||
AQR International Momentum Style Fund | 7,011,474 | — | ||||||
AQR Emerging Momentum Style Fund | 918,111 | — | ||||||
AQR TM Large Cap Momentum Style Fund | 1,276,023 | — | ||||||
AQR TM International Momentum Style Fund | 11,860,336 | — | ||||||
AQR Emerging Defensive Style Fund | 5,074,221 | 6,050,184 | ||||||
AQR Large Cap Relaxed Constraint Equity Fund | 10,773 | 11,128 | ||||||
AQR Small Cap Relaxed Constraint Equity Fund | 135,003 | — | ||||||
6. Investment Transactions
During the year ended September 30, 2018, the cost of purchases and the proceeds from sales of investments (excluding swap contracts, forward foreign currency exchange contracts, futures contracts and short-term investments) were as follows:
| FUND | PURCHASES | SALES | SECURITIES SOLD SHORT | COVERS ON SECURITIES SOLD SHORT | ||||||||||||
AQR Large Cap Multi-Style Fund | $ | 1,205,898,835 | $ | 1,257,802,813 | $ | — | $ | — | ||||||||
AQR Small Cap Multi-Style Fund | 459,720,054 | 565,450,250 | — | — | ||||||||||||
AQR International Multi-Style Fund | 279,929,296 | 322,344,322 | — | — | ||||||||||||
AQR Emerging Multi-Style Fund | 192,166,551 | 191,268,944 | — | — | ||||||||||||
AQR TM Large Cap Multi-Style Fund | 215,358,106 | 179,983,159 | — | — | ||||||||||||
AQR TM Small Cap Multi-Style Fund | 27,813,437 | 25,423,862 | — | — | ||||||||||||
AQR TM International Multi-Style Fund | 112,135,039 | 98,753,135 | — | — | ||||||||||||
AQR TM Emerging Multi-Style Fund | 188,173,222 | 192,797,368 | — | — | ||||||||||||
AQR Large Cap Momentum Style Fund | 689,052,197 | 734,704,389 | — | — | ||||||||||||
AQR Small Cap Momentum Style Fund | 271,426,982 | 338,743,276 | — | — | ||||||||||||
AQR International Momentum Style Fund | 303,631,741 | 270,194,524 | — | — | ||||||||||||
AQR Emerging Momentum Style Fund | 14,507,927 | 15,618,599 | — | — | ||||||||||||
AQR TM Large Cap Momentum Style Fund | 103,656,653 | 99,910,663 | — | — | ||||||||||||
AQR TM Small Cap Momentum Style Fund | 45,186,092 | 39,234,521 | — | — | ||||||||||||
AQR TM International Momentum Style Fund | 61,334,542 | 38,987,434 | — | — | ||||||||||||
AQR Large Cap Defensive Style Fund | 903,034,211 | 257,747,759 | — | — | ||||||||||||
AQR International Defensive Style Fund | 48,038,951 | 40,189,015 | — | — | ||||||||||||
AQR Emerging Defensive Style Fund | 28,833,888 | 12,084,420 | — | — | ||||||||||||
AQR Global Equity Fund | 395,844,173 | 248,264,246 | — | — | ||||||||||||
AQR International Equity Fund | 390,737,572 | 334,558,400 | — | — | ||||||||||||
AQR Large Cap Relaxed Constraint Equity Fund | 20,187,878 | 19,538,872 | 7,160,131 | 7,247,513 | ||||||||||||
AQR Small Cap Relaxed Constraint Equity Fund | 4,310,697 | 4,568,109 | 1,374,128 | 1,541,688 | ||||||||||||
AQR International Relaxed Constraint Equity Fund | 118,842,627 | 39,237,249 | 33,246,197 | 15,675,225 | ||||||||||||
AQR Emerging Relaxed Constraint Equity Fund | 62,682,228 | 52,708,908 | — | — | ||||||||||||
7. Derivative Instruments and Activities
Certain Funds use derivative instruments as part of their principal investment strategy to achieve their investment objectives. The Funds’ derivative contracts are not accounted for as hedging instruments under GAAP. For financial reporting purposes, the Funds do not offset financial assets and financial liabilities that are subject to master netting arrangements or similar agreements on the Statements of Assets and Liabilities. All derivative instruments held by the Funds were subject to a master netting agreement or similar arrangement.
| AQR Funds | Annual Report | September 2018 | ||||||||||||||
286
Table of Contents
| Notes to Financial Statements | September 30, 2018 |
The following table lists the fair value of derivatives instruments held by the Funds, by primary underlying risk and contract type, as included in the Statements of Assets and Liabilities at September 30, 2018:
| ASSETS | LIABILITIES | |||||||||||||||||||||||
| FUND | UNREALIZED APPRECIATION ON FUTURES CONTRACTS | SWAPS AT VALUE | UNREALIZED APPRECIATION ON FORWARD CURRENCY EXCHANGE CONTRACTS | UNREALIZED DEPRECIATION ON FUTURES CONTRACTS | SWAPS AT VALUE | UNREALIZED DEPRECIATION ON FORWARD CURRENCY EXCHANGE CONTRACTS | ||||||||||||||||||
| Equity Risk Exposure: | ||||||||||||||||||||||||
AQR Large Cap Multi-Style Fund | $ | — | $ | — | $ | — | $ | 124,860 | $ | — | $ | — | ||||||||||||
AQR Small Cap Multi-Style Fund | — | — | — | 154,866 | — | — | ||||||||||||||||||
AQR International Multi-Style Fund | — | — | — | 9,809 | — | — | ||||||||||||||||||
AQR Emerging Multi-Style Fund | 60,750 | — | — | — | — | — | ||||||||||||||||||
AQR TM Large Cap Multi-Style Fund | 24,624 | — | — | — | — | — | ||||||||||||||||||
AQR TM Small Cap Multi-Style Fund | — | — | — | 4,102 | — | — | ||||||||||||||||||
AQR TM International Multi-Style Fund | 26,906 | — | — | — | — | — | ||||||||||||||||||
AQR TM Emerging Multi-Style Fund | 119,288 | — | — | — | — | — | ||||||||||||||||||
AQR Large Cap Momentum Style Fund | 99,080 | — | — | — | — | — | ||||||||||||||||||
AQR Small Cap Momentum Style Fund | — | — | — | 2,170 | — | — | ||||||||||||||||||
AQR International Momentum Style Fund | 86,250 | — | — | — | — | — | ||||||||||||||||||
AQR TM Large Cap Momentum Style Fund | 20,957 | — | — | — | — | — | ||||||||||||||||||
AQR TM Small Cap Momentum Style Fund | — | — | — | 12,493 | — | — | ||||||||||||||||||
AQR TM International Momentum Style Fund | 20,679 | — | — | — | — | — | ||||||||||||||||||
AQR Large Cap Defensive Style Fund | 45,563 | — | — | — | — | — | ||||||||||||||||||
AQR International Defensive Style Fund | 63,217 | — | — | — | — | — | ||||||||||||||||||
AQR Emerging Defensive Style Fund | 52,103 | — | — | — | — | — | ||||||||||||||||||
AQR Global Equity Fund | 2,148,400 | 1,294,075 | — | 291,917 | 196,937 | — | ||||||||||||||||||
AQR International Equity Fund | 6,302,983 | 861,853 | — | 1,099,416 | 696,937 | — | ||||||||||||||||||
AQR International Relaxed Constraint Equity Fund | 15,643 | — | — | — | — | — | ||||||||||||||||||
AQR Emerging Relaxed Constraint Equity Fund | 14,479 | 950,905 | — | — | 952,230 | — | ||||||||||||||||||
| Foreign Exchange Rate Risk Exposure: | ||||||||||||||||||||||||
AQR Global Equity Fund | — | — | 1,967,768 | — | — | 2,413,125 | ||||||||||||||||||
AQR International Equity Fund | — | — | 1,758,065 | — | — | 2,039,425 | ||||||||||||||||||
| Net Value of Derivative Contracts: | ||||||||||||||||||||||||
AQR Large Cap Multi-Style Fund | — | — | — | 124,860 | — | — | ||||||||||||||||||
AQR Small Cap Multi-Style Fund | — | — | — | 154,866 | — | — | ||||||||||||||||||
AQR International Multi-Style Fund | — | — | — | 9,809 | — | — | ||||||||||||||||||
AQR Emerging Multi-Style Fund | 60,750 | — | — | — | — | — | ||||||||||||||||||
AQR TM Large Cap Multi-Style Fund | 24,624 | — | — | — | — | — | ||||||||||||||||||
AQR TM Small Cap Multi-Style Fund | — | — | — | 4,102 | — | — | ||||||||||||||||||
AQR TM International Multi-Style Fund | 26,906 | — | — | — | — | — | ||||||||||||||||||
AQR TM Emerging Multi-Style Fund | 119,288 | — | — | — | — | — | ||||||||||||||||||
AQR Large Cap Momentum Style Fund | 99,080 | — | — | — | — | — | ||||||||||||||||||
AQR Small Cap Momentum Style Fund | — | — | — | 2,170 | — | — | ||||||||||||||||||
AQR International Momentum Style Fund | 86,250 | — | — | — | — | — | ||||||||||||||||||
AQR TM Large Cap Momentum Style Fund | 20,957 | — | — | — | — | — | ||||||||||||||||||
AQR TM Small Cap Momentum Style Fund | — | — | — | 12,493 | — | — | ||||||||||||||||||
AQR TM International Momentum Style Fund | 20,679 | — | — | — | — | — | ||||||||||||||||||
AQR Large Cap Defensive Style Fund | 45,563 | — | — | — | — | — | ||||||||||||||||||
AQR International Defensive Style Fund | 63,217 | — | — | — | — | — | ||||||||||||||||||
AQR Emerging Defensive Style Fund | 52,103 | — | — | — | — | — | ||||||||||||||||||
AQR Global Equity Fund | 1,856,483 | 1,097,138 | — | — | — | 445,357 | ||||||||||||||||||
AQR International Equity Fund | 5,203,567 | 164,916 | — | — | — | 281,360 | ||||||||||||||||||
AQR International Relaxed Constraint Equity Fund | 15,643 | — | — | — | — | — | ||||||||||||||||||
AQR Emerging Relaxed Constraint Equity Fund | 14,479 | — | — | — | 1,325 | — | ||||||||||||||||||
| AQR Funds | Annual Report | September 2018 | ||||||||||||||
287
Table of Contents
| Notes to Financial Statements | September 30, 2018 |
The following table indicates the effect of derivative instruments, by primary underlying risk exposure and contract type, on the Statements of Operations for the year ended September 30, 2018:
| REALIZED GAIN (LOSS) ON DERIVATIVES RECOGNIZED AS A RESULT FROM OPERATIONS | NET CHANGE IN UNREALIZED APPRECIATION (DEPRECIATION) ON DERIVATIVES RECOGNIZED AS A RESULT FROM OPERATIONS | |||||||||||||||||||||||
| FUND | FUTURES CONTRACTS | SWAPS CONTRACTS | FORWARD CURRENCY EXCHANGE CONTRACTS | FUTURES CONTRACTS | SWAPS CONTRACTS | FORWARD CURRENCY EXCHANGE CONTRACTS | ||||||||||||||||||
| Equity Risk Exposure: | ||||||||||||||||||||||||
AQR Large Cap Multi-Style Fund | $ | 4,218,931 | $ | — | $ | — | $ | (589,811 | ) | $ | — | $ | — | |||||||||||
AQR Small Cap Multi-Style Fund | 2,608,205 | — | — | (870,445 | ) | — | — | |||||||||||||||||
AQR International Multi-Style Fund | 471,709 | — | — | (52,195 | ) | — | — | |||||||||||||||||
AQR Emerging Multi-Style Fund | (23,963 | ) | — | — | 83,728 | — | — | |||||||||||||||||
AQR TM Large Cap Multi-Style Fund | 680,338 | — | — | 24,624 | — | — | ||||||||||||||||||
AQR TM Small Cap Multi-Style Fund | 29,734 | — | — | (4,102 | ) | — | — | |||||||||||||||||
AQR TM International Multi-Style Fund | (461 | ) | — | — | 4,940 | — | — | |||||||||||||||||
AQR TM Emerging Multi-Style Fund | (186,085 | ) | — | — | 178,928 | — | — | |||||||||||||||||
AQR Large Cap Momentum Style Fund | 3,319,796 | — | — | (127,311 | ) | — | — | |||||||||||||||||
AQR Small Cap Momentum Style Fund | 1,023,109 | — | — | (190,261 | ) | — | — | |||||||||||||||||
AQR International Momentum Style Fund | 69,260 | — | — | 32,617 | — | — | ||||||||||||||||||
AQR TM Large Cap Momentum Style Fund | 764,572 | — | — | (9,928 | ) | — | — | |||||||||||||||||
AQR TM Small Cap Momentum Style Fund | 141,208 | — | — | (12,493 | ) | — | — | |||||||||||||||||
AQR TM International Momentum Style Fund | 205,715 | — | — | 7,236 | — | — | ||||||||||||||||||
AQR Large Cap Defensive Style Fund | 10,201,063 | — | — | (698,856 | ) | — | — | |||||||||||||||||
AQR International Defensive Style Fund | (390,308 | ) | — | — | 28,383 | — | — | |||||||||||||||||
AQR Emerging Defensive Style Fund | (179,149 | ) | — | — | 70,850 | — | — | |||||||||||||||||
AQR Global Equity Fund | (1,438,750 | ) | (1,810,064 | ) | — | 509,864 | 1,246,089 | — | ||||||||||||||||
AQR International Equity Fund | 2,375,390 | (2,342,017 | ) | — | 2,006,546 | 540,913 | — | |||||||||||||||||
AQR International Relaxed Constraint Equity Fund | 42,551 | — | — | 15,643 | — | — | ||||||||||||||||||
AQR Emerging Relaxed Constraint Equity Fund | (425,140 | ) | (333,737 | ) | — | 14,479 | (176,033 | ) | — | |||||||||||||||
| Foreign Exchange Rate Risk Exposure: | ||||||||||||||||||||||||
AQR Global Equity Fund | — | — | 1,198,349 | — | — | 886,830 | ||||||||||||||||||
AQR International Equity Fund | — | — | (2,684,483 | ) | — | — | 3,513,165 | |||||||||||||||||
| AQR Funds | Annual Report | September 2018 | ||||||||||||||
288
Table of Contents
| Notes to Financial Statements | September 30, 2018 |
The following tables present the Funds’ gross OTC derivative assets and liabilities by counterparty and contract type net of amounts available for offset under netting arrangements and any related collateral received or posted by the Funds’ as of September 30, 2018:
AQR GLOBAL EQUITY FUND
GROSS AMOUNTS NOT OFFSET IN THE STATEMENT OF ASSETS & LIABILITIES | ||||||||||||||||||||||||||
| COUNTERPARTY | INVESTMENT TYPE | GROSS AMOUNTS OF RECOGNIZED ASSETS PRESENTED IN THE STATEMENT OF ASSETS & LIABILITIES | GROSS AMOUNTS ELIGIBLE TO OFFSET | NET AMOUNTS OF ASSETS | FINANCIAL INSTRUMENTS | CASH COLLATERAL RECEIVED/ (PLEDGED) (a) | NET AMOUNT | |||||||||||||||||||
| CITG | Forward Foreign Currency Exchange Contracts | $ | 787,169 | $ | (787,169 | ) | $ | — | $ | — | $ | — | $ | — | ||||||||||||
| GSIN | Total Return Swaps Contracts | 48,960 | (48,960 | ) | — | — | — | — | ||||||||||||||||||
| JPMC | Forward Foreign Currency Exchange Contracts | 1,180,599 | (1,180,599 | ) | — | |||||||||||||||||||||
| Total Return Swaps Contracts | 1,245,115 | (78,259 | ) | 1,166,856 | ||||||||||||||||||||||
| Total JPMC | 2,425,714 | (1,258,858 | ) | 1,166,856 | — | — | 1,166,856 | |||||||||||||||||||
| Total financial instruments subject to a master netting arrangement or similar arrangement | 3,261,843 | (2,094,987 | ) | 1,166,856 | — | — | 1,166,856 | |||||||||||||||||||
GROSS AMOUNTS NOT OFFSET IN THE STATEMENT OF ASSETS & LIABILITIES | ||||||||||||||||||||||||||
| COUNTERPARTY | INVESTMENT TYPE | GROSS AMOUNTS OF RECOGNIZED LIABILITIES PRESENTED IN THE STATEMENT OF ASSETS & LIABILITIES | GROSS AMOUNTS ELIGIBLE TO OFFSET | NET AMOUNTS OF LIABILITIES | FINANCIAL INSTRUMENTS | CASH COLLATERAL RECEIVED/ (PLEDGED) (a) | NET AMOUNT | |||||||||||||||||||
| CITG | Forward Foreign Currency Exchange Contracts | $ | 966,352 | $ | (787,169 | ) | $ | 179,183 | $ | — | $ | (179,183 | ) | $ | — | |||||||||||
| GSIN | Total Return Swaps Contracts | 118,678 | (48,960 | ) | 69,718 | — | (69,718 | ) | — | |||||||||||||||||
| JPMC | Forward Foreign Currency Exchange Contracts | 1,446,773 | (1,180,599 | ) | 266,174 | |||||||||||||||||||||
| Total Return Swaps Contracts | 78,259 | (78,259 | ) | — | ||||||||||||||||||||||
| Total JPMC | 1,525,032 | (1,258,858 | ) | 266,174 | — | (266,174 | ) | — | ||||||||||||||||||
| Total financial instruments subject to a master netting arrangement or similar arrangement | 2,610,062 | (2,094,987 | ) | 515,075 | — | (515,075 | ) | — | ||||||||||||||||||
| (a) | In accordance with GAAP disclosure requirements, the table above does not include the additional collateral pledged to the counterparty. Total additional collateral pledged was $10,037,413. |
| AQR Funds | Annual Report | September 2018 | ||||||||||||||
289
Table of Contents
| Notes to Financial Statements | September 30, 2018 |
AQR INTERNATIONAL EQUITY FUND
GROSS AMOUNTS NOT OFFSET IN THE STATEMENT OF ASSETS & LIABILITIES | ||||||||||||||||||||||||||
| COUNTERPARTY | INVESTMENT TYPE | GROSS AMOUNTS OF RECOGNIZED ASSETS PRESENTED IN THE STATEMENT OF ASSETS & LIABILITIES | GROSS AMOUNTS ELIGIBLE TO OFFSET | NET AMOUNTS OF ASSETS | FINANCIAL INSTRUMENTS | CASH COLLATERAL RECEIVED/ (PLEDGED) (a) | NET AMOUNT | |||||||||||||||||||
| CITG | Forward Foreign Currency Exchange Contracts | $ | 703,285 | $ | (703,285 | ) | $ | — | $ | — | $ | — | $ | — | ||||||||||||
| GSIN | Total Return Swaps Contracts | 13,353 | (13,353 | ) | — | — | — | — | ||||||||||||||||||
| JPMC | Forward Foreign Currency Exchange Contracts | 1,054,780 | (1,054,780 | ) | — | |||||||||||||||||||||
| Total Return Swaps Contracts | 848,500 | (583,419 | ) | 265,081 | ||||||||||||||||||||||
| Total JPMC | 1,903,280 | (1,638,199 | ) | 265,081 | — | — | 265,081 | |||||||||||||||||||
| Total financial instruments subject to a master netting arrangement or similar arrangement | 2,619,918 | (2,354,837 | ) | 265,081 | — | — | 265,081 | |||||||||||||||||||
GROSS AMOUNTS NOT OFFSET IN THE STATEMENT OF ASSETS & LIABILITIES | ||||||||||||||||||||||||||
| COUNTERPARTY | INVESTMENT TYPE | GROSS AMOUNTS OF RECOGNIZED LIABILITIES PRESENTED IN THE STATEMENT OF ASSETS & LIABILITIES | GROSS AMOUNTS ELIGIBLE TO OFFSET | NET AMOUNTS OF LIABILITIES | FINANCIAL INSTRUMENTS | CASH COLLATERAL RECEIVED/ (PLEDGED) (a) | NET AMOUNT | |||||||||||||||||||
| CITG | Forward Foreign Currency Exchange Contracts | $ | 815,719 | $ | (703,285 | ) | $112,434 | $ | — | $ | (112,434 | ) | $ | — | ||||||||||||
| GSIN | Total Return Swaps Contracts | 113,518 | (13,353 | ) | 100,165 | — | (100,165 | ) | — | |||||||||||||||||
| JPMC | Forward Foreign Currency Exchange Contracts | 1,223,706 | (1,054,780 | ) | 168,926 | |||||||||||||||||||||
| Total Return Swaps Contracts | 583,419 | (583,419 | ) | — | ||||||||||||||||||||||
| Total JPMC | 1,807,125 | (1,638,199 | ) | 168,926 | — | (168,926 | ) | — | ||||||||||||||||||
| Total financial instruments subject to a master netting arrangement or similar arrangement | 2,736,362 | (2,354,837 | ) | 381,525 | — | (381,525 | ) | — | ||||||||||||||||||
| (a) | In accordance with GAAP disclosure requirements, the table above does not include the additional collateral pledged to the counterparty. Total additional collateral pledged was $15,054,948. |
AQR EMERGING RELAXED CONSTRAINT EQUITY FUND
GROSS AMOUNTS NOT OFFSET IN THE STATEMENT OF ASSETS & LIABILITIES | ||||||||||||||||||||||||||
| COUNTERPARTY | INVESTMENT TYPE | GROSS AMOUNTS OF RECOGNIZED ASSETS PRESENTED IN THE STATEMENT OF ASSETS & LIABILITIES | GROSS AMOUNTS ELIGIBLE TO OFFSET | NET AMOUNTS OF ASSETS | FINANCIAL INSTRUMENTS | CASH COLLATERAL RECEIVED/ (PLEDGED) (a) | NET AMOUNT | |||||||||||||||||||
| JPMC | Total Return Basket Swaps Contracts | $ | 950,905 | $ | (950,905 | ) | $ | — | $ | — | $ | — | $ | — | ||||||||||||
| Total financial instruments subject to a master netting arrangement or similar arrangement | 950,905 | (950,905 | ) | — | — | — | — | |||||||||||||||||||
| AQR Funds | Annual Report | September 2018 | ||||||||||||||
290
Table of Contents
| Notes to Financial Statements | September 30, 2018 |
AQR EMERGING RELAXED CONSTRAINT EQUITY FUND (continued)
GROSS AMOUNTS NOT OFFSET IN THE STATEMENT OF ASSETS & LIABILITIES | ||||||||||||||||||||||||||
| COUNTERPARTY | INVESTMENT TYPE | GROSS AMOUNTS OF RECOGNIZED LIABILITIES PRESENTED IN THE STATEMENT OF ASSETS & LIABILITIES | GROSS AMOUNTS ELIGIBLE TO OFFSET | NET AMOUNTS OF LIABILITIES | FINANCIAL INSTRUMENTS | CASH COLLATERAL RECEIVED/ (PLEDGED) (a) | NET AMOUNT | |||||||||||||||||||
| JPMC | Total Return Basket Swaps Contracts | $ | 952,230 | $ | (950,905 | ) | $ | 1,325 | $ | — | $ | (1,325 | ) | $ | — | |||||||||||
| Total financial instruments subject to a master netting arrangement or similar arrangement | 952,230 | (950,905 | ) | 1,325 | — | (1,325 | ) | — | ||||||||||||||||||
| (a) | In accordance with GAAP disclosure requirements, the table above does not include the additional collateral pledged to the counterparty. Total additional collateral pledged was $6,593,972. |
For the year September 30, 2018, the quarterly average notional values of the derivatives held by the Funds were as follows:
Derivatives Volume Disclosure*
| AQR LARGE CAP MULTI- STYLE FUND | AQR MULTI- | AQR INTERNATIONAL MULTI-STYLE FUND | AQR EMERGING MULTI- STYLE FUND | AQR TM LARGE CAP MULTI-STYLE FUND | AQR TM SMALL CAP MULTI- STYLE FUND | AQR TM INTERNATIONAL MULTI-STYLE FUND | ||||||||||||||||||||||
| Futures Contracts: | ||||||||||||||||||||||||||||
| Average Notional Balance—Long | 32,740,137 | 15,088,959 | 9,146,449 | 5,057,107 | 5,494,650 | 542,100 | 4,232,549 | |||||||||||||||||||||
| Average Notional Balance—Short | — | — | — | — | — | — | — | |||||||||||||||||||||
| Ending Notional Balance—Long | 38,822,700 | 14,201,680 | 7,902,000 | 3,568,980 | 5,546,100 | 425,200 | 4,741,200 | |||||||||||||||||||||
| Ending Notional Balance—Short | — | — | — | — | — | — | — | |||||||||||||||||||||
AQR TM EMERGING | AQR LARGE CAP MOMENTUM STYLE FUND | AQR SMALL CAP MOMENTUM STYLE FUND | AQR INTERNATIONAL MOMENTUM STYLE FUND | AQR TM LARGE CAP MOMENTUM STYLE FUND | AQR TM SMALL CAP MOMENTUM STYLE FUND | |||||||||||||||||||
| Futures Contracts: | ||||||||||||||||||||||||
| Average Notional Balance—Long | 5,758,809 | 16,732,557 | 4,909,396 | 8,413,716 | 4,747,860 | 1,295,468 | ||||||||||||||||||
| Average Notional Balance—Short | — | — | — | — | — | — | ||||||||||||||||||
| Ending Notional Balance—Long | 5,563,410 | 21,162,750 | 425,200 | 12,050,550 | 4,378,500 | 1,190,560 | ||||||||||||||||||
| Ending Notional Balance—Short | — | — | — | — | — | — | ||||||||||||||||||
| AQR Funds | Annual Report | September 2018 | ||||||||||||||
291
Table of Contents
| Notes to Financial Statements | September 30, 2018 |
| AQR TM INTERNATIONAL MOMENTUM STYLE FUND | AQR LARGE CAP DEFENSIVE STYLE FUND | AQR INTERNATIONAL DEFENSIVE STYLE FUND | AQR EMERGING | AQR GLOBAL EQUITY FUND | AQR INTERNATIONAL EQUITY FUND | |||||||||||||||||||
| Futures Contracts: | ||||||||||||||||||||||||
| Average Notional Balance—Long | 3,348,589 | 44,441,940 | 5,569,343 | 3,149,631 | 50,507,344 | 114,392,920 | ||||||||||||||||||
| Average Notional Balance—Short | — | — | — | — | 44,908,330 | 67,896,436 | ||||||||||||||||||
| Ending Notional Balance—Long | 3,457,125 | 57,066,450 | 7,902,000 | 3,568,980 | 44,491,168 | 98,554,415 | ||||||||||||||||||
| Ending Notional Balance—Short | — | — | — | — | 41,138,795 | 49,300,406 | ||||||||||||||||||
| Forward Foreign Currency Exchange Contracts: |
| |||||||||||||||||||||||
| Average Settlement Value—Purchased | — | — | — | — | 152,592,121 | 192,649,559 | ||||||||||||||||||
| Average Settlement Value—Sold | — | — | — | — | 154,532,335 | 172,170,918 | ||||||||||||||||||
| Ending Value—Purchased | — | — | — | — | 153,940,285 | 158,012,332 | ||||||||||||||||||
| Ending Value—Sold | — | — | — | — | 201,975,202 | 210,589,015 | ||||||||||||||||||
| Total Return Swaps: | ||||||||||||||||||||||||
| Average Notional Balance—Long | — | — | — | — | 33,581,527 | 28,914,609 | ||||||||||||||||||
| Average Notional Balance—Short | — | — | — | — | 5,158,451 | 21,613,448 | ||||||||||||||||||
| Ending Notional Balance—Long | — | — | — | — | 38,624,825 | 34,949,369 | ||||||||||||||||||
| Ending Notional Balance—Short | — | — | — | — | 3,597,592 | 22,636,788 | ||||||||||||||||||
| AQR INTERNATIONAL RELAXED CONSTRAINT EQUITY FUND | AQR EMERGING RELAXED CONSTRAINT EQUITY FUND | |||||||
| Futures Contracts: | ||||||||
| Average Notional Balance—Long | 1,446,810 | 880,655 | ||||||
| Average Notional Balance—Short | — | — | ||||||
| Ending Notional Balance—Long | 1,481,625 | 997,215 | ||||||
| Ending Notional Balance—Short | — | — | ||||||
| Total Return Basket Swaps: |
| |||||||
| Average Notional of Underlying Positions—Long | — | 20,854,331 | ||||||
| Average Notional of Underlying Positions—Short | — | 11,699,028 | ||||||
| Ending Notional Balance—Long | — | 20,593,286 | ||||||
| Ending Notional Balance—Short | — | 10,834,093 | ||||||
| * | Notional values as of each quarter end are used to calculate the average represented. |
8. Investment Advisory and Other Agreements
The Adviser serves as the investment adviser to each of the Funds, pursuant to the Third Amended and Restated Investment Management Agreement dated January 29, 2017, as amended (the “Investment Management Agreement”), or the Investment Management Agreement II, dated November 13, 2015, as amended (“Investment Management Agreement II”), each entered into by the Trust, on behalf of the Funds (the Investment Management Agreement and Investment Management Agreement II collectively referred to herein as the “Advisory Agreement”). Under the Advisory Agreement, the Adviser furnishes a continuous investment program for each Fund’s portfolio, makes day-to-day investment decisions for each Fund, and manages each Fund’s investments in accordance with the stated policies of each Fund. The Adviser is also responsible for selecting brokers and dealers to execute purchase and sale orders for the portfolio transactions of each Fund, subject to its obligation to seek best execution, and also provides certain other administrative services to each Fund. The Adviser provides persons satisfactory to the Funds’ Board to serve as officers of the Funds.
| AQR Funds | Annual Report | September 2018 | ||||||||||||||
292
Table of Contents
| Notes to Financial Statements | September 30, 2018 |
Pursuant to the Advisory Agreement, each Fund currently pays the Adviser a management fee calculated on the average daily net assets for each Fund, in the annual ratios below:
| FUND | Ratio | |||
AQR Large Cap Multi-Style Fund | 0.30 | % | ||
AQR Small Cap Multi-Style Fund | 0.50 | |||
AQR International Multi-Style Fund | 0.45 | |||
AQR Emerging Multi-Style Fund | 0.60 | |||
AQR TM Large Cap Multi-Style Fund | 0.30 | |||
AQR TM Small Cap Multi-Style Fund | 0.50 | |||
AQR TM International Multi-Style Fund | 0.45 | |||
AQR TM Emerging Multi-Style Fund | 0.60 | |||
AQR Large Cap Momentum Style Fund | 0.25 | |||
AQR Small Cap Momentum Style Fund | 0.45 | |||
AQR International Momentum Style Fund | 0.40 | |||
AQR Emerging Momentum Style Fund | 0.55 | |||
AQR TM Large Cap Momentum Style Fund | 0.25 | |||
AQR TM Small Cap Momentum Style Fund | 0.45 | |||
AQR TM International Momentum Style Fund | 0.40 | |||
AQR Large Cap Defensive Style Fund | 0.25 | |||
AQR International Defensive Style Fund | 0.40 | |||
AQR Emerging Defensive Style Fund | 0.55 | |||
AQR Global Equity Fund | 0.60 | |||
AQR International Equity Fund1 | 0.65 | |||
AQR Large Cap Relaxed Constraint Equity Fund | 0.60 | |||
AQR Small Cap Relaxed Constraint Equity Fund | 0.80 | |||
AQR International Relaxed Constraint Equity Fund | �� | 0.75 | ||
AQR Emerging Relaxed Constraint Equity Fund | 0.95 | |||
| 1 | Effective January 29, 2018, the AQR International Equity Fund’s management fee was reduced by 0.05% to 0.65%. |
The Trust and the Adviser have entered into a Fee Waiver and Expense Reimbursement Agreement (“Fee Waiver Agreement”) whereby the Adviser has agreed to waive its fee and/or reimburse expenses of each Fund at least through January 28, 2019 for Class I, N, and R6 shares, respectively, unless otherwise noted. Pursuant to the Fee Waiver Agreement, the Adviser has agreed to waive fees and/or reimburse expenses of each Fund to the extent that the total annual fund operating expense ratios, exclusive of interest, taxes, borrowing costs, acquired fund fees and expenses, dividend and interest expense related to short sales, expenses related to class action claims and extraordinary expenses exceed the following ratios:
| FUND | CLASS I | CLASS N | CLASS R6 | |||||||||
AQR Large Cap Multi-Style Fund | 0.45 | % | 0.70 | % | 0.35 | % | ||||||
AQR Small Cap Multi-Style Fund | 0.65 | 0.90 | 0.55 | |||||||||
AQR International Multi-Style Fund | 0.60 | 0.85 | 0.50 | |||||||||
AQR Emerging Multi-Style Fund | 0.75 | 1.00 | 0.65 | |||||||||
AQR TM Large Cap Multi-Style Fund | 0.45 | 0.70 | 0.35 | |||||||||
AQR TM Small Cap Multi-Style Fund | 0.65 | 0.90 | 0.55 | |||||||||
AQR TM International Multi-Style Fund | 0.60 | 0.85 | 0.50 | |||||||||
AQR TM Emerging Multi-Style Fund | 0.75 | 1.00 | 0.65 | |||||||||
AQR Large Cap Momentum Style Fund | 0.40 | 0.65 | 0.30 | |||||||||
AQR Small Cap Momentum Style Fund | 0.60 | 0.85 | 0.50 | |||||||||
AQR International Momentum Style Fund | 0.55 | 0.80 | 0.45 | |||||||||
AQR Emerging Momentum Style Fund | 0.70 | 0.95 | 0.60 | |||||||||
AQR TM Large Cap Momentum Style Fund | 0.40 | 0.65 | 0.30 | |||||||||
AQR TM Small Cap Momentum Style Fund | 0.60 | 0.85 | 0.50 | |||||||||
AQR TM International Momentum Style Fund | 0.55 | 0.80 | 0.45 | |||||||||
AQR Large Cap Defensive Style Fund | 0.40 | 0.65 | 0.30 | |||||||||
AQR International Defensive Style Fund | 0.55 | 0.80 | 0.45 | |||||||||
AQR Emerging Defensive Style Fund | 0.70 | 0.95 | 0.60 | |||||||||
AQR Global Equity Fund | 0.80 | 1.05 | 0.70 | |||||||||
AQR International Equity Fund | 0.85 | 1.10 | 0.75 | |||||||||
AQR Large Cap Relaxed Constraint Equity Fund | 0.80 | 1.05 | 0.70 | |||||||||
AQR Small Cap Relaxed Constraint Equity Fund | 1.00 | 1.25 | 0.90 | |||||||||
AQR International Relaxed Constraint Equity Fund | 0.95 | 1.20 | 0.85 | |||||||||
AQR Emerging Relaxed Constraint Equity Fund | 1.15 | 1.40 | 1.05 | |||||||||
| AQR Funds | Annual Report | September 2018 | ||||||||||||||
293
Table of Contents
| Notes to Financial Statements | September 30, 2018 |
Prior to January 29, 2018, the Fee Waiver and Expense Reimbursement Agreement for the AQR International Equity Fund to the extent that the total annual fund operating expense ratios, exclusive of interest, taxes, borrowing costs, acquired fund fees and expenses, dividend and interest expense related to short sales, expenses related to class action claims and extraordinary expenses, exceeded the following ratios:
| FUND | CLASS I | CLASS N | CLASS R6 | |||||||||
AQR International Equity Fund | 0.90 | % | 1.15 | % | 0.80 | % | ||||||
For the year ended September 30, 2018, the Adviser waived fees and/or reimbursed expenses for each of the Funds as follows:
| FUND | FEES WAIVED | EXPENSE REIMBURSEMENTS | TOTAL | |||||||||
AQR Small Cap Multi-Style Fund | $ | 114,621 | $ | — | $ | 114,621 | ||||||
AQR International Multi-Style Fund | 187,593 | — | 187,593 | |||||||||
AQR Emerging Multi-Style Fund | 386,444 | 14,919 | 401,363 | |||||||||
AQR TM Large Cap Multi-Style Fund | 89,070 | — | 89,070 | |||||||||
AQR TM Small Cap Multi-Style Fund | 133,622 | 321 | 133,943 | |||||||||
AQR TM International Multi-Style Fund | 163,415 | — | 163,415 | |||||||||
AQR TM Emerging Multi-Style Fund | 380,180 | 5,516 | 385,696 | |||||||||
AQR Large Cap Momentum Style Fund | 7,872 | — | 7,872 | |||||||||
AQR Small Cap Momentum Style Fund | 85,490 | 9,966 | 95,456 | |||||||||
AQR International Momentum Style Fund | 198,531 | — | 198,531 | |||||||||
AQR Emerging Momentum Style Fund | 73,371 | 127,480 | 200,851 | |||||||||
AQR TM Large Cap Momentum Style Fund | 101,166 | 1,135 | 102,301 | |||||||||
AQR TM Small Cap Momentum Style Fund | 126,899 | 1,727 | 128,626 | |||||||||
AQR TM International Momentum Style Fund | 179,101 | 917 | 180,018 | |||||||||
AQR Large Cap Defensive Style Fund | 29,563 | — | 29,563 | |||||||||
AQR International Defensive Style Fund | 154,024 | 335 | 154,359 | |||||||||
AQR Emerging Defensive Style Fund | 207,124 | — | 207,124 | |||||||||
AQR Global Equity Fund | 55,726 | 6,192 | 61,918 | |||||||||
AQR International Equity Fund | 69,762 | 16,821 | 86,583 | |||||||||
AQR Large Cap Relaxed Constraint Equity Fund | 104,816 | 22,396 | 127,212 | |||||||||
AQR Small Cap Relaxed Constraint Equity Fund | 27,263 | 96,325 | 123,588 | |||||||||
AQR International Relaxed Constraint Equity Fund | 100,098 | 4,785 | 104,883 | |||||||||
AQR Emerging Relaxed Constraint Equity Fund | 170,315 | 6,480 | 176,795 | |||||||||
The Trust, in turn, agreed that the Funds may be required to repay the fee waiver/expense reimbursement to the Adviser. A repayment shall be payable only to the extent it can be made during the thirty-six months following the applicable month during which the Adviser waived fees or reimbursed the applicable Fund for its operating expenses under the Fee Waiver Agreement. Such repayment shall be made only out of the class of the Fund for which the applicable fee waiver and expense reimbursement was made. Repayments with respect to a Fund must be limited to amounts that do not cause the aggregate operating expenses of the Fund attributable to a share class during a year in which such repayment is made to exceed the lesser of (i) the applicable limits in effect at the time of the waiver and/or reimbursement, or (ii) the applicable limits in effect at the time of recapture.
For the year ended September 30, 2018, the amounts waived and reimbursed by the Adviser, as well as the amounts available for potential future recoupment by the Adviser and the expiration schedule at September 30, 2018 are as follows:
FEES WAIVED/ REIMBURSED FOR THE PERIOD ENDED SEPTEMBER 30, | TOTAL POTENTIAL RECOUPMENT AMOUNT SEPTEMBER 30, | POTENTIAL RECOUPMENT AMOUNTS EXPIRING SEPTEMBER 30 | ||||||||||||||||||
| FUND | 2019 | 2020 | 2021 | |||||||||||||||||
| AQR LARGE CAP MULTI-STYLE FUND | ||||||||||||||||||||
Class I | $ | — | $ | 114,404 | $ | 76,856 | $ | 37,548 | $ | — | ||||||||||
Class N | — | 14,827 | 9,139 | 5,688 | — | |||||||||||||||
Class R6 | — | 201,723 | 98,770 | 102,953 | — | |||||||||||||||
| Totals | $ | — | $ | 330,954 | $ | 184,765 | $ | 146,189 | $ | — | ||||||||||
| AQR Funds | Annual Report | September 2018 | ||||||||||||||
294
Table of Contents
| Notes to Financial Statements | September 30, 2018 |
FEES WAIVED/ REIMBURSED FOR THE PERIOD ENDED SEPTEMBER 30, | TOTAL POTENTIAL RECOUPMENT AMOUNT SEPTEMBER 30, | POTENTIAL RECOUPMENT AMOUNTS EXPIRING SEPTEMBER 30 | ||||||||||||||||||
| FUND | 2019 | 2020 | 2021 | |||||||||||||||||
| AQR SMALL CAP MULTI-STYLE FUND | ||||||||||||||||||||
Class I | $ | 9,186 | $ | 58,340 | $ | 30,910 | $ | 18,244 | $ | 9,186 | ||||||||||
Class N | 1,176 | 12,506 | 7,778 | 3,552 | 1,176 | |||||||||||||||
Class R6 | 104,259 | 647,995 | 291,127 | 252,609 | 104,259 | |||||||||||||||
| Totals | $ | 114,621 | $ | 718,841 | $ | 329,815 | $ | 274,405 | $ | 114,621 | ||||||||||
| AQR INTERNATIONAL MULTI-STYLE FUND | ||||||||||||||||||||
Class I | $ | 31,932 | $ | 115,520 | $ | 47,320 | $ | 36,268 | $ | 31,932 | ||||||||||
Class N | 3,032 | 13,207 | 5,748 | 4,427 | 3,032 | |||||||||||||||
Class R6 | 152,629 | 554,586 | 223,200 | 178,757 | 152,629 | |||||||||||||||
| Totals | $ | 187,593 | $ | 683,313 | $ | 276,268 | $ | 219,452 | $ | 187,593 | ||||||||||
| AQR EMERGING MULTI-STYLE FUND | ||||||||||||||||||||
Class I | $ | 69,909 | $ | 298,025 | $ | 117,893 | $ | 110,223 | $ | 69,909 | ||||||||||
Class N | 7,960 | 29,821 | 12,126 | 9,735 | 7,960 | |||||||||||||||
Class R6 | 323,494 | 901,644 | 308,433 | 269,717 | 323,494 | |||||||||||||||
| Totals | $ | 401,363 | $ | 1,229,490 | $ | 438,452 | $ | 389,675 | $ | 401,363 | ||||||||||
| AQR TM LARGE CAP MULTI-STYLE FUND | ||||||||||||||||||||
Class I | $ | 25,615 | $ | 98,383 | $ | 33,748 | $ | 39,020 | $ | 25,615 | ||||||||||
Class N | 798 | 4,422 | 2,001 | 1,623 | 798 | |||||||||||||||
Class R6 | 62,657 | 282,314 | 123,264 | 96,393 | 62,657 | |||||||||||||||
| Totals | $ | 89,070 | $ | 385,119 | $ | 159,013 | $ | 137,036 | $ | 89,070 | ||||||||||
| AQR TM SMALL CAP MULTI-STYLE FUND | ||||||||||||||||||||
Class I | $ | 98,415 | $ | 301,110 | $ | 101,381 | $ | 101,314 | $ | 98,415 | ||||||||||
Class N | 25,482 | 71,646 | 18,924 | 27,240 | 25,482 | |||||||||||||||
Class R6 | 10,046 | 52,811 | 30,345 | 12,420 | 10,046 | |||||||||||||||
| Totals | $ | 133,943 | $ | 425,567 | $ | 150,650 | $ | 140,974 | $ | 133,943 | ||||||||||
| AQR TM INTERNATIONAL MULTI-STYLE FUND | ||||||||||||||||||||
Class I | $ | 23,942 | $ | 82,598 | $ | 32,691 | $ | 25,965 | $ | 23,942 | ||||||||||
Class N | 1,830 | 5,523 | 1,603 | 2,090 | 1,830 | |||||||||||||||
Class R6 | 137,643 | 464,185 | 174,115 | 152,427 | 137,643 | |||||||||||||||
| Totals | $ | 163,415 | $ | 552,306 | $ | 208,409 | $ | 180,482 | $ | 163,415 | ||||||||||
| AQR TM EMERGING MULTI-STYLE FUND | ||||||||||||||||||||
Class I | $ | 20,043 | $ | 58,186 | $ | 20,907 | $ | 17,236 | $ | 20,043 | ||||||||||
Class N | 2,392 | 8,319 | 3,045 | 2,882 | 2,392 | |||||||||||||||
Class R6 | 363,261 | 1,171,377 | 451,370 | 356,746 | 363,261 | |||||||||||||||
| Totals | $ | 385,696 | $ | 1,237,882 | $ | 475,322 | $ | 376,864 | $ | 385,696 | ||||||||||
| AQR LARGE CAP MOMENTUM STYLE FUND | ||||||||||||||||||||
Class I | $ | 6,875 | $ | 186,354 | $ | 128,280 | $ | 51,199 | $ | 6,875 | ||||||||||
Class N | 472 | 13,635 | 9,604 | 3,559 | 472 | |||||||||||||||
Class R6 | 525 | 14,138 | 9,755 | 3,858 | 525 | |||||||||||||||
| Totals | $ | 7,872 | $ | 214,127 | $ | 147,639 | $ | 58,616 | $ | 7,872 | ||||||||||
| AQR SMALL CAP MOMENTUM STYLE FUND | ||||||||||||||||||||
Class I | $ | 91,579 | $ | 387,104 | $ | 171,192 | $ | 124,333 | $ | 91,579 | ||||||||||
Class N | 392 | 4,977 | 4,003 | 582 | 392 | |||||||||||||||
Class R6 | 3,485 | 16,723 | 9,541 | 3,697 | 3,485 | |||||||||||||||
| Totals | $ | 95,456 | $ | 408,804 | $ | 184,736 | $ | 128,612 | $ | 95,456 | ||||||||||
| AQR Funds | Annual Report | September 2018 | ||||||||||||||
295
Table of Contents
| Notes to Financial Statements | September 30, 2018 |
FEES WAIVED/ REIMBURSED FOR THE PERIOD ENDED SEPTEMBER 30, | TOTAL POTENTIAL RECOUPMENT AMOUNT SEPTEMBER 30, | POTENTIAL RECOUPMENT AMOUNTS EXPIRING SEPTEMBER 30 | ||||||||||||||||||
| FUND | 2019 | 2020 | 2021 | |||||||||||||||||
| AQR INTERNATIONAL MOMENTUM STYLE FUND | ||||||||||||||||||||
Class I | $ | 157,165 | $ | 534,613 | $ | 205,356 | $ | 172,092 | $ | 157,165 | ||||||||||
Class N | 17,204 | 60,395 | 25,144 | 18,047 | 17,204 | |||||||||||||||
Class R6 | 24,162 | 72,310 | 25,321 | 22,827 | 24,162 | |||||||||||||||
| Totals | $ | 198,531 | $ | 667,318 | $ | 255,821 | $ | 212,966 | $ | 198,531 | ||||||||||
| AQR EMERGING MOMENTUM STYLE FUND | ||||||||||||||||||||
Class I | $ | 149,321 | $ | 477,179 | $ | 158,250 | $ | 169,608 | $ | 149,321 | ||||||||||
Class N | 19,016 | 67,282 | 27,182 | 21,084 | 19,016 | |||||||||||||||
Class R6 | 32,514 | 66,593 | 10,914 | 23,165 | 32,514 | |||||||||||||||
| Totals | $ | 200,851 | $ | 611,054 | $ | 196,346 | $ | 213,857 | $ | 200,851 | ||||||||||
| AQR TM LARGE CAP MOMENTUM STYLE FUND | ||||||||||||||||||||
Class I | $ | 50,023 | $ | 162,649 | $ | 55,980 | $ | 56,646 | $ | 50,023 | ||||||||||
Class N | 5,496 | 6,464 | 143 | 825 | 5,496 | |||||||||||||||
Class R6 | 46,782 | 177,393 | 69,392 | 61,219 | 46,782 | |||||||||||||||
| Totals | $ | 102,301 | $ | 346,506 | $ | 125,515 | $ | 118,690 | $ | 102,301 | ||||||||||
| AQR TM SMALL CAP MOMENTUM STYLE FUND | ||||||||||||||||||||
Class I | $ | 118,457 | $ | 380,407 | $ | 134,918 | $ | 127,032 | $ | 118,457 | ||||||||||
Class N | 9,721 | 11,721 | 710 | 1,290 | 9,721 | |||||||||||||||
Class R6 | 448 | 1,763 | 730 | 585 | 448 | |||||||||||||||
| Totals | $ | 128,626 | $ | 393,891 | $ | 136,358 | $ | 128,907 | $ | 128,626 | ||||||||||
| AQR TM INTERNATIONAL MOMENTUM STYLE FUND | ||||||||||||||||||||
Class I | $ | 77,493 | $ | 206,636 | $ | 60,845 | $ | 68,298 | $ | 77,493 | ||||||||||
Class N | 9,544 | 11,081 | 286 | 1,251 | 9,544 | |||||||||||||||
Class R6 | 92,981 | 306,814 | 117,481 | 96,352 | 92,981 | |||||||||||||||
| Totals | $ | 180,018 | $ | 524,531 | $ | 178,612 | $ | 165,901 | $ | 180,018 | ||||||||||
| AQR LARGE CAP DEFENSIVE STYLE FUND | ||||||||||||||||||||
Class I | $ | 19,257 | $ | 217,670 | $ | 93,642 | $ | 104,771 | $ | 19,257 | ||||||||||
Class N | 5,241 | 78,754 | 35,909 | 37,604 | 5,241 | |||||||||||||||
Class R6 | 5,065 | 52,186 | 20,864 | 26,257 | 5,065 | |||||||||||||||
| Totals | $ | 29,563 | $ | 348,610 | $ | 150,415 | $ | 168,632 | $ | 29,563 | ||||||||||
| AQR INTERNATIONAL DEFENSIVE STYLE FUND | ||||||||||||||||||||
Class I | $ | 121,661 | $ | 414,167 | $ | 161,919 | $ | 130,587 | $ | 121,661 | ||||||||||
Class N | 14,206 | 61,318 | 14,520 | 32,592 | 14,206 | |||||||||||||||
Class R6 | 18,492 | 55,894 | 17,532 | 19,870 | 18,492 | |||||||||||||||
| Totals | $ | 154,359 | $ | 531,379 | $ | 193,971 | $ | 183,049 | $ | 154,359 | ||||||||||
| AQR EMERGING DEFENSIVE STYLE FUND | ||||||||||||||||||||
Class I | $ | 188,174 | $ | 578,034 | $ | 192,290 | $ | 197,570 | $ | 188,174 | ||||||||||
Class N | 18,391 | 28,907 | 607 | 9,909 | 18,391 | |||||||||||||||
Class R6 | 559 | 1,940 | 678 | 703 | 559 | |||||||||||||||
| Totals | $ | 207,124 | $ | 608,881 | $ | 193,575 | $ | 208,182 | $ | 207,124 | ||||||||||
| AQR GLOBAL EQUITY FUND | ||||||||||||||||||||
Class I | $ | 26,377 | $ | 67,815 | $ | 17,776 | $ | 23,662 | $ | 26,377 | ||||||||||
Class N | 435 | 2,572 | 962 | 1,175 | 435 | |||||||||||||||
Class R6 | 35,106 | 178,046 | 61,896 | 81,044 | 35,106 | |||||||||||||||
| Totals | $ | 61,918 | $ | 248,433 | $ | 80,634 | $ | 105,881 | $ | 61,918 | ||||||||||
| AQR Funds | Annual Report | September 2018 | ||||||||||||||
296
Table of Contents
| Notes to Financial Statements | September 30, 2018 |
FEES WAIVED/ REIMBURSED FOR THE PERIOD ENDED SEPTEMBER 30, | TOTAL POTENTIAL RECOUPMENT AMOUNT SEPTEMBER 30, | POTENTIAL RECOUPMENT AMOUNTS EXPIRING SEPTEMBER 30 | ||||||||||||||||||
| FUND | 2019 | 2020 | 2021 | |||||||||||||||||
| AQR INTERNATIONAL EQUITY FUND | ||||||||||||||||||||
Class I | $ | 74,800 | $ | 167,453 | $ | 54,822 | $ | 37,831 | $ | 74,800 | ||||||||||
Class N | 2,747 | 12,740 | 6,563 | 3,430 | 2,747 | |||||||||||||||
Class R6 | 9,036 | 10,238 | — | 1,202 | 9,036 | |||||||||||||||
| Totals | $ | 86,583 | $ | 190,431 | $ | 61,385 | $ | 42,463 | $ | 86,583 | ||||||||||
| AQR LARGE CAP RELAXED CONSTRAINT EQUITY FUND | ||||||||||||||||||||
Class I | $ | 107,519 | $ | 175,164 | $ | — | $ | 67,645 | $ | 107,519 | ||||||||||
Class N | 5,053 | 28,675 | — | 23,622 | 5,053 | |||||||||||||||
Class R6 | 14,640 | 54,630 | — | 39,990 | 14,640 | |||||||||||||||
| Totals | $ | 127,212 | $ | 258,469 | $ | — | $ | 131,257 | $ | 127,212 | ||||||||||
| AQR SMALL CAP RELAXED CONSTRAINT EQUITY FUND | ||||||||||||||||||||
Class I | $ | 53,013 | $ | 102,405 | $ | — | $ | 49,392 | $ | 53,013 | ||||||||||
Class N | 21,214 | 48,555 | — | 27,341 | 21,214 | |||||||||||||||
Class R6 | 49,361 | 102,967 | — | 53,606 | 49,361 | |||||||||||||||
| Totals | $ | 123,588 | $ | 253,927 | $ | — | $ | 130,339 | $ | 123,588 | ||||||||||
| AQR INTERNATIONAL RELAXED CONSTRAINT EQUITY FUND | ||||||||||||||||||||
Class I | $ | 75,274 | $ | 133,081 | $ | — | $ | 57,807 | $ | 75,274 | ||||||||||
Class N | 20,896 | 43,915 | — | 23,019 | 20,896 | |||||||||||||||
Class R6 | 8,713 | 57,025 | — | 48,312 | 8,713 | |||||||||||||||
| Totals | $ | 104,883 | $ | 234,021 | $ | — | $ | 129,138 | $ | 104,883 | ||||||||||
| AQR EMERGING RELAXED CONSTRAINT EQUITY FUND | ||||||||||||||||||||
Class I | $ | 70,921 | $ | 123,988 | $ | — | $ | 53,067 | $ | 70,921 | ||||||||||
Class N | 30,449 | 61,649 | — | 31,200 | 30,449 | |||||||||||||||
Class R6 | 75,425 | 153,926 | — | 78,501 | 75,425 | |||||||||||||||
| Totals | $ | 176,795 | $ | 339,563 | $ | — | $ | 162,768 | $ | 176,795 | ||||||||||
During the period ended September 30, 2018, the Fund recouped amounts as follows:
| FUND | CLASS I | CLASS N | CLASS R6 | |||||||||
AQR Large Cap Multi-Style Fund | $ | 42,682 | $ | 6,299 | $ | 127,106 | ||||||
AQR Small Cap Multi-Style Fund | 220 | 28 | 2,431 | |||||||||
AQR Large Cap Momentum Style Fund | 25,311 | 1,819 | 2,025 | |||||||||
AQR Small Cap Momentum Style Fund | 1,439 | 12 | 89 | |||||||||
AQR Large Cap Defensive Style Fund | 8,058 | 2,622 | 2,672 | |||||||||
AQR Global Equity Fund | 4,420 | 50 | 4,340 | |||||||||
AQR International Equity Fund | 10,529 | 545 | 1,335 | |||||||||
9. Distribution Plan
The Trust has adopted a Plan of Distribution (the “Plan”) pursuant to Rule 12b-1 under the 1940 Act with respect to the Class N shares of the Funds. The Plan allows for the payment of services related to the distribution and servicing of these shares at a rate of up to 0.25% per annum of the average daily net asset value of the Class N shares of the Funds.
10. Principal Risks and Concentrations
The Funds are non-diversified. Because the Funds may invest in securities of a smaller number of issuers, the Funds may be more exposed to the risks associated with and developments affecting an individual issuer than a funds that invests more widely, which may, therefore, have a greater impact on the Funds’ performance.
The investment techniques and strategies utilized by the Funds, including investments made on a shorter-term basis or in derivative instruments or instruments with a maturity of one year or less at the time of acquisition, may result in frequent portfolio trading and high portfolio turnover.
| AQR Funds | Annual Report | September 2018 | ||||||||||||||
297
Table of Contents
| Notes to Financial Statements | September 30, 2018 |
High portfolio turnover rates will cause the Funds to incur higher levels of brokerage fees and commissions, which may reduce performance, and may cause higher levels of current tax liability to shareholders in the Funds.
In the normal course of business the Funds trade financial instruments and enter into financial transactions where risk of potential loss exists due to changes in the market (market risk). A Fund’s investments in financial derivatives and other financial instruments may expose the Fund to various elements of market risks which include interest rate, foreign currency, equity and commodity risks.
Interest rate risk is the risk that fixed income securities will decline in value because of changes in interest rates. Convertible securities and non-convertible income producing securities are subject to certain risks, including (i) if interest rates go up, the value of convertible securities and non-convertible income producing securities in the Funds’ portfolio generally will decline; (ii) during periods of declining interest rates, the issuer of a security may exercise its option to prepay principal earlier than scheduled, forcing the Funds to reinvest in lower yielding securities (call or prepayment risk); and (iii) during periods of rising interest rates, the average life of certain types of securities may be extended because of slower than expected principal payments (extension risk).
Investment in securities of foreign issuers may involve certain risks that are greater than those associated with investments in securities of U.S. issuers. These include risks of adverse changes in foreign economic, political, regulatory and other conditions; changes in currency exchange rates or exchange control regulations (including limitations on currency movements and exchanges); the imposition of economic sanctions or other government restrictions; differing accounting, auditing, financial reporting and legal standards and practices; differing securities market structures; and higher transaction costs. To the extent the funds’ investments in a single country or a limited number of countries represent a higher percentage of the funds’ assets, the funds assume the risk that economic, political and social conditions in those countries will have a significant impact on its investment performance and it may be subject to increased price volatility.
Emerging markets are riskier than more developed markets because they tend to develop unevenly and may never fully develop. Investments in emerging markets may be considered speculative. Emerging markets are more likely to experience hyperinflation and currency devaluations, which adversely affect returns to U.S. investors. In addition, many emerging securities markets have far lower trading volumes and less liquidity than developed markets.
Currency risk arises from the possibility that fluctuations in foreign exchange rates will affect the value of cash balances held in foreign currencies and non-U.S. denominated financial instruments. The liquidity and trading value of foreign currencies could be affected by global economic factors, such as inflation, interest rate levels, and trade balances among countries, as well as the actions of sovereign governments and central banks. Currency rates in foreign countries may fluctuate significantly over short periods of time for a number of reasons.
The market values of equities, such as common stocks and preferred securities or equity related investments such as futures and options, may decline due to general market conditions which are not specifically related to a particular company. They may also decline due to factors which affect a particular industry or industries. The Funds may invest in illiquid investments and may experience difficulty in selling those investments in a timely manner at the price that it believes the investments are worth. Prices may fluctuate widely over short or extended periods in response to company, market or economic news. Markets also tend to move in cycles, with periods of rising and falling prices. This volatility may cause the Fund’s net asset value to experience significant increases or decreases over short periods of time. If there is a general decline in the securities and other markets, the net asset value of a Fund may lose value, regardless of the individual results of the securities and other instruments in which the Fund invests.
In addition to market risk, the Funds may be exposed to the risk that one or more securities in the Funds’ portfolio will decline in price, or fail to pay interest or principal when due, because the issuer of the security experiences a decline in its financial status (credit risk). Credit risk is measured by the loss a Fund would record if the major financial institution or other counterparties failed to perform pursuant to terms of their obligations. Certain Funds may primarily maintain cash balances at one or several major financial institutions that may exceed federally insured limits and as such each of the Funds have credit risk associated with such financial institutions. In general, lower rated securities carry a greater degree of risk that the issuer will lose its ability to make interest and principal payments, which could have a negative impact on the Funds’ net asset value or dividends. The Funds minimize credit risk by monitoring credit exposure and collateral values, and by requiring additional collateral to be deposited with or returned to each of the Funds when deemed necessary.
Similar to credit risk, a Fund may be exposed to counterparty risk, or the risk that an institution or other entity with which the Fund has unsettled or open transactions will default. Financial assets, which potentially expose a Fund to counterparty risk, consist principally of cash due from counterparties and investments. By using derivative instruments, the Funds may be exposed to the risk that derivative counterparties may not perform in accordance with the contractual provisions offset by the value of any collateral received. The Funds’ exposure to credit risk associated with counterparty non-performance is limited to the unrealized gains inherent in such transactions that are recognized in the Statements of Assets and Liabilities. The counterparties to the Funds’ derivative investments may include affiliates of the Funds’ clearing brokers and other major financial institutions. While the Funds use multiple clearing brokers and counterparties, a concentration of credit risk may exist because of balances held and transactions with a limited number of clearing brokers and counterparties. The Funds minimize counterparty credit risk through credit limits and approvals, credit monitoring procedures, executing master netting arrangements and managing margin and collateral requirements, as appropriate.
In the normal course of business, the Funds may enter into agreements with certain counterparties for derivative transactions. A number of each Fund’s Master Agreements contain provisions that require each Fund to maintain a predetermined level of net assets, and/or provide limits
| AQR Funds | Annual Report | September 2018 | ||||||||||||||
298
Table of Contents
| Notes to Financial Statements | September 30, 2018 |
regarding the decline of a Fund’s net asset value over specified time periods. If a Fund was to violate such provisions, the counterparties to the derivative instruments could request immediate payment or demand immediate collateralization on derivative instruments in net liability positions. If such events are not cured by the Fund or waived by the counterparties, they may decide to curtail or limit extension of credit, and the Fund may be forced to unwind its derivative positions which may result in material losses.
The Funds, at times, utilize substantial leverage in their investment program. Such leverage may take the form of trading on margin, investing in derivative instruments that are inherently leveraged, entering into reverse repurchase transactions and entering into other forms of direct and indirect borrowings. There is no guarantee that the Funds’ borrowing arrangement or other arrangements for obtaining leverage will continue to be available, or if available, will be available on terms and conditions acceptable to the Funds. Unfavorable economic conditions also could increase funding costs, limit access to the capital markets or result in a decision by lenders not to extend credit to the Funds. In addition, a decline in market value of the Funds’ assets may have particular adverse consequences in instances where they have borrowed money based on the market value of those assets. A decrease in market value of those assets may result in the lender (including derivative counterparties) requiring the Funds to post additional collateral or otherwise sell assets at a time when it may not be in the Funds’ best interest to do so.
The Adviser relies heavily on quantitative models and information and data supplied by third parties. When models and data prove to be incorrect or incomplete, any decisions made in reliance thereon may expose the Fund to potential risks. Such models may produce unexpected results, which can result in losses for a Fund.
Periodically, the Funds may be a party to legal actions arising in the ordinary course of business. The Funds are currently not subject to any actions that either individually or in the aggregate are expected to have a material impact on their results of operations, cash flows or financial condition.
Please refer to the Funds’ prospectuses for a more complete description of the principal risks of investing in the funds.
11. Interfund Lending
Pursuant to an exemptive order issued by the Securities and Exchange Commission (the “SEC”), the Funds may participate in a joint lending and borrowing program (the “Interfund Lending Program”) to the extent such participation is consistent with each Fund’s investment objective and investment policies. This program allows the Funds to borrow and lend to other AQR Funds that permit such transactions. All loans under the Interfund Lending Program are for temporary cash management or emergency purposes. Interest earned or paid on an interfund lending transaction will be based on the average of certain current market rates, as calculated according to a formula established by the Board. No Fund may borrow or lend money through the program unless it receives a more favorable rate than is typically available for comparable borrowings from a bank or investments in U.S. Treasury bills, respectively.
A lending Fund may lend in aggregate up to 15% of its net assets, but may not lend more than 5% of its net assets to any one borrowing Fund through the Interfund Lending Program. A borrowing Fund may not borrow through the Interfund Lending Program or from any other source more than 33 1/3% of its total assets. If a borrowing Fund’s total outstanding borrowings exceed 10% of its total assets, the Fund must secure each of its outstanding borrowings through the Interfund Lending Program with collateral equal to 102% of the outstanding principal value of the loan.
The Funds are not required to borrow money under the Interfund Lending Program and may borrow under other arrangements, including their existing bank line of credit. This could result in a Fund borrowing money at a higher interest rate than it would have received under the Interfund Lending Program.
During the reporting period, the Funds did not utilize the Interfund Lending Program.
12. Line of Credit
Effective February 23, 2018 and terminating on February 23, 2019, the Trust renewed a $350,000,000 committed syndicated line of credit (the “Agreement”) with Bank of America, N.A., as the Administrative Agent. Prior to February 23, 2018 the line of credit commitment amount was $300,000,000 at substantially similar terms. Borrowing, if any, under this arrangement bears, as incurred, interest at the sum of (a) 1.0% per annum plus (b) the higher of (i) the Federal Funds Rate or (ii) the Eurodollar Rate, which is paid monthly. The maximum loan amount available to a Fund is the lesser of an amount which will not exceed the borrowing limits set forth in the Fund’s Prospectus and/or Registration Statement and will not cause the asset coverage ratio for any borrowings by a Fund to drop below the required amount under the Agreement (between 300-500% per Fund). The Agreement is subject to an annual commitment fee which is payable in arrears on a quarterly basis. In the event of a draw upon the line of credit, liquid assets of the borrowing Fund may be designated as collateral until its loan is repaid in full.
The unused amount available on the line of credit as of September 30, 2018 is $279,000,000.
| AQR Funds | Annual Report | September 2018 | ||||||||||||||
299
Table of Contents
| Notes to Financial Statements | September 30, 2018 |
The Funds had the following borrowings during the period.
| FUND | AVERAGE BORROWINGS | AVERAGE INTEREST RATE% | NUMBER OF DAYS | OUTSTANDING BALANCE | INTEREST PAID | |||||||||||||||
AQR Large Cap Multi-Style Fund | $ | 19,500,000 | 3.50 | % | 6 | $ | 24,000,000 | $ | 11,234 | |||||||||||
AQR Small Cap Multi-Style Fund | 12,300,000 | 2.41 | 8 | — | 6,501 | |||||||||||||||
AQR International Multi-Style Fund | 47,000,000 | 3.28 | 4 | 47,000,000 | 16,916 | |||||||||||||||
AQR TM Small Cap Multi-Style Fund | 300,000 | 2.56 | 5 | — | 105 | |||||||||||||||
AQR Emerging Momentum Style Fund | 325,000 | 2.54 | 16 | — | 361 | |||||||||||||||
AQR Large Cap Relaxed Constraint Equity Fund | 1,200,000 | 2.59 | 5 | — | 427 | |||||||||||||||
AQR International Relaxed Constraint Equity Fund | 300,000 | 1.25 | 2 | — | 21 | |||||||||||||||
Interest expense paid, if any, as a result of borrowing under this agreement is included in Interest expense in the Statements of Operations. The outstanding balance on the line of credit facility for the AQR Large Cap Multi-Style Fund and the AQR International Multi-Style Fund was repaid on or before October 3, 2018.
13. Principal Ownership
As of September 30, 2018, the Funds had individual shareholder and/or omnibus accounts owning more than 5% of the total shares outstanding of the Fund as follows:
| FUND | NUMBER OF INDIVIDUAL SHAREHOLDERS AND/OR OMNIBUS ACCOUNTS | TOTAL PERCENTAGE INTEREST HELD | ||||||
AQR Large Cap Multi-Style Fund . . . . . . . . . . | 4 | 93.26 | % | |||||
AQR Small Cap Multi-Style Fund . . . . . . . . . . . | 3 | 92.64 | % | |||||
AQR International Multi-Style Fund . . . . . . . . | 4 | 93.41 | % | |||||
AQR Emerging Multi-Style Fund . . . . . . . . . . . | 4 | 93.64 | % | |||||
AQR TM Large Cap Multi-Style Fund . . . . . . . | 4 | 93.82 | % | |||||
AQR TM Small Cap Multi-Style Fund* . . . . . . . | 4 | 96.59 | % | |||||
AQR TM International Multi-Style Fund . . . . . | 4 | 95.13 | % | |||||
AQR TM Emerging Multi-Style Fund . . . . . . . . | 3 | 93.98 | % | |||||
AQR Large Cap Momentum Style Fund . . . . . | 4 | 92.65 | % | |||||
AQR Small Cap Momentum Style Fund . . . . . | 3 | 88.15 | % | |||||
AQR International Momentum Style Fund . . . | 3 | 92.94 | % | |||||
AQR Emerging Momentum Style Fund* . . . . . | 4 | 87.56 | % | |||||
AQR TM Large Cap Momentum Style Fund | 4 | 99.23 | % | |||||
AQR TM Small Cap Momentum Style Fund | 3 | 97.27 | % | |||||
AQR TM International Momentum Style Fund | 4 | 99.48 | % | |||||
AQR Large Cap Defensive Style Fund . . . . . . | 6 | 89.21 | % | |||||
AQR International Defensive Style Fund . . . . | 3 | 96.81 | % | |||||
AQR Emerging Defensive Style Fund . . . . . . . | 3 | 94.29 | % | |||||
AQR Global Equity Fund . . . . . . . . . . . . . . . . . . | 4 | 94.09 | % | |||||
AQR International Equity Fund . . . . . . . . . . . . | 5 | 77.10 | % | |||||
AQR Large Cap Relaxed Constraint Equity Fund* | 3 | 87.72 | % | |||||
AQR Small Cap Relaxed Constraint Equity Fund* | 5 | 90.98 | % | |||||
AQR International Relaxed Constraint Equity Fund | 1 | 81.53 | % | |||||
AQR Emerging Relaxed Constraint Equity Fund* | 6 | 95.59 | % | |||||
| * | The percentage held by the Adviser and/or affiliates is 7.74%, 45.73%, 7.94%, 64.60% and 11.01% respectively. |
Significant shareholder transactions by these shareholders, if any, may impact the Funds’ performance.
14. New Accounting Pronouncements and Regulations
In October 2016, the Securities and Exchange Commission (the “SEC”) adopted Final Rule Release No. 33-10231, Investment Company Reporting Modernization in conjunction with Final Rule Release No. 33-10233, Investment Company Liquidity Risk Management Programs and Final Rule Release No. 33-10234, Investment Company Swing Pricing. Collectively, these rules modernize and enhance the reporting and disclosure of information by registered investment companies. The new rules will allow the SEC to more effectively collect and use data
| AQR Funds | Annual Report | September 2018 | ||||||||||||||
300
Table of Contents
| Notes to Financial Statements | September 30, 2018 |
reported by funds, enhance disclosure regarding fund liquidity and redemption practices, and permit open-end funds to offer swing pricing, subject to board approval and review. The amendments to Regulation S-X were applied to the Funds’ financial statements with a reporting period date after August 1, 2018. The adoption had no effect on the Funds’ net assets or results of operations.
In August 2018, the SEC adopted Final Rule Release No. 33-10532, Disclosure Update and Simplification. The new rule amends certain disclosure requirements that the SEC determined to be redundant, duplicative, overlapping, outdated, or superseded, in light of other SEC disclosure requirements, U.S. GAAP, or changes in the information environment. The amendments are intended to facilitate the disclosure of information to investors and simplify compliance without significantly altering the total mix of information provided to investors. The amendments to Regulation S-X were applied to the Funds’ financial statements in the current period. The adoption had no effect on the Funds’ net assets or results of operations.
In August 2018, the Financial Accounting Standards Board issued ASU No. 2018-13, Disclosure Framework-Changes to the Disclosure Requirements for Fair Value Measurements (“ASU 2018-13”). The amendments generally modified the disclosure requirements for fair value measurements such that it removes the following requirements: 1) the requirement to disclose the amount of and reasons for transfers between Level 1 and Level 2 of the fair value hierarchy; 2) the requirement to disclose the Fund’s policy for timing of transfers between levels; and, 3) the requirement to disclose the valuation processes for Level 3 fair value measurements. ASU 2018-13 also added the requirement to disclose how weighted average is calculated when the range and weighted average of significant unobservable inputs used to develop Level 3 fair value measurements is required to be disclosed, in addition to making various other clarifying amendments to the disclosure guidance. The amendments in ASU 2018-13 are effective for fiscal years, and interim periods within those fiscal years, beginning after December 15, 2019. The amendments related to the range and weighted average of significant unobservable inputs used to develop Level 3 fair value measurements should be applied prospectively for only the most recent interim or annual period presented in the initial fiscal year of adoption. All other amendments should be applied retrospectively to all periods presented upon their effective date. Early adoption is permitted. The Funds have elected to early adopt ASU 2018-13 and the amendments are reflected in the current year financial statements.
15. Subsequent Events
At a meeting held on November 15-16, 2018, the Board of Trustees of the AQR Funds approved a proposal to liquidate the AQR Emerging Momentum Style Fund. The Fund will declare a dividend to all holders of record on December 18, 2018 consisting of any undistributed income and capital gains (net of available capital loss carryovers). On or about December 21, 2018 (the “Liquidation Date”), the Fund will make a liquidating distribution of its remaining assets proportionately to any shareholders holding shares on the Liquidation Date.
The Funds have evaluated subsequent events through the date of issuance of this report and have determined that there are no material events other than those noted above.
| AQR Funds | Annual Report | September 2018 | ||||||||||||||
301
Table of Contents
| Report of Independent Registered Public Accounting Firm |
To the Board of Trustees of the AQR Funds and Shareholders of AQR Large Cap Multi-Style Fund, AQR Small Cap Multi-Style Fund, AQR International Multi-Style Fund, AQR Emerging Multi-Style Fund, AQR TM Large Cap Multi-Style Fund, AQR TM Small Cap Multi-Style Fund, AQR TM International Multi-Style Fund, AQR TM Emerging Multi-Style Fund, AQR Large Cap Momentum Style Fund, AQR Small Cap Momentum Style Fund, AQR International Momentum Style Fund, AQR Emerging Momentum Style Fund, AQR TM Large Cap Momentum Style Fund, AQR TM Small Cap Momentum Style Fund, AQR TM International Momentum Style Fund, AQR Large Cap Defensive Style Fund, AQR International Defensive Style Fund, AQR Emerging Defensive Style Fund, AQR Global Equity Fund, AQR International Equity Fund, AQR Large Cap Relaxed Constraint Equity Fund, AQR Small Cap Relaxed Constraint Equity Fund, AQR International Relaxed Constraint Equity Fund, and AQR Emerging Relaxed Constraint Equity Fund:
Opinions on the Financial Statements
We have audited the accompanying statements of assets and liabilities, including the schedules of investments, of each of the twenty-four funds listed in the table below (twenty-four of the funds constituting the AQR Funds, hereafter collectively referred to as the “Funds”) as of September 30, 2018, the related statements of operations, statements of changes in net assets, and for the three funds designated in the table below, the statements of cash flows for each of the periods indicated in the table below, including the related notes, and the financial highlights for each of the periods indicated therein (collectively referred to as the “financial statements”). In our opinion, the financial statements present fairly, in all material respects, the financial position of each of the Funds as of September 30, 2018, the results of each of their operations, the changes in each of their net assets, and for the three funds designated in the table below, each of their cash flows for the periods indicated in the table below and each of the financial highlights for each of the periods indicated therein in conformity with accounting principles generally accepted in the United States of America.
AQR Large Cap Multi-Style Fund (1) | AQR TM Large Cap Momentum Style Fund (1) | |
AQR Small Cap Multi-Style Fund (1) | AQR TM Small Cap Momentum Style Fund (1) | |
AQR International Multi-Style Fund (1) | AQR TM International Momentum Style Fund (1) | |
AQR Emerging Multi-Style Fund (1) | AQR Large Cap Defensive Style Fund (1) | |
AQR TM Large Cap Multi-Style Fund (1) | AQR International Defensive Style Fund (1) | |
AQR TM Small Cap Multi-Style Fund (1) | AQR Emerging Defensive Style Fund (1) | |
AQR TM International Multi-Style Fund (1) | AQR Global Equity Fund (1) | |
AQR TM Emerging Multi-Style Fund (1) | AQR International Equity Fund (1) | |
AQR Large Cap Momentum Style Fund (1) | AQR Large Cap Relaxed Constraint Equity Fund (2) | |
AQR Small Cap Momentum Style Fund (1) | AQR Small Cap Relaxed Constraint Equity Fund (2) | |
AQR International Momentum Style Fund (1) | AQR International Relaxed Constraint Equity Fund (2) | |
AQR Emerging Momentum Style Fund (1) | AQR Emerging Relaxed Constraint Equity Fund (3) |
| (1) | Statements of operations for the year ended September 30, 2018 and statements of changes in net assets for each of the two years ended September 30, 2018. |
| (2) | Statements of operations and cash flows for the year ended September 30, 2018 and statements of changes in net assets for the year ended September 30, 2018 and for the period December 14, 2016 (commencement of operations) through September 30, 2017. |
| (3) | Statement of operations for the year ended September 30, 2018 and statement of changes in net assets for the year ended September 30, 2018 and for the period December 14, 2016 (commencement of operations) through September 30, 2017. |
Basis for Opinions
These financial statements are the responsibility of the Funds’ management. Our responsibility is to express an opinion on the Funds’ financial statements based on our audits. We are a public accounting firm registered with the Public Company Accounting Oversight Board (United States) (“PCAOB”) and are required to be independent with respect to the Funds in accordance with the U.S. federal securities laws and the applicable rules and regulations of the Securities and Exchange Commission and the PCAOB.
We conducted our audits of these financial statements in accordance with the standards of the PCAOB. Those standards require that we plan and perform the audit to obtain reasonable assurance about whether the financial statements are free of material misstatement, whether due to error or fraud.
Our audits included performing procedures to assess the risks of material misstatement of the financial statements, whether due to error or fraud, and performing procedures that respond to those risks. Such procedures included examining, on a test basis, evidence regarding the amounts and disclosures in the financial statements. Our audits also included evaluating the accounting principles used and significant estimates made by management, as well as evaluating the overall presentation of the financial statements. Our procedures included confirmation of securities owned as of September 30, 2018 by correspondence with the custodians, transfer agents and brokers; when replies were not received from brokers, we performed other auditing procedures. We believe that our audits provide a reasonable basis for our opinions.
/s/ PricewaterhouseCoopers LLP
New York, New York
November 20, 2018
We have served as the auditor of one or more investment companies in AQR Funds since 2008.
| AQR Funds | Annual Report | September 2018 | ||||||||||||||
302
Table of Contents
| Other Federal Tax Information (Unaudited) |
For the fiscal year ended September 30, 2018, the Funds designate the following percentages of ordinary income dividends, or maximum amount allowable, as qualifying for the reduced tax rate under the Jobs and Growth Tax Relief Reconciliation Act of 2003:
| FUND | PERCENTAGE | |||
AQR Large Cap Multi-Style Fund | 100.00 | % | ||
AQR Small Cap Multi-Style Fund | 21.05 | % | ||
AQR International Multi-Style Fund | 96.33 | % | ||
AQR Emerging Multi-Style Fund | 84.14 | % | ||
AQR TM Large Cap Multi-Style Fund | 100.00 | % | ||
AQR TM Small Cap Multi-Style Fund | 100.00 | % | ||
AQR TM International Multi-Style Fund | 94.31 | % | ||
AQR TM Emerging Multi-Style Fund | 81.71 | % | ||
AQR Large Cap Momentum Style Fund | 100.00 | % | ||
AQR Small Cap Momentum Style Fund | 100.00 | % | ||
AQR International Momentum Style Fund | 94.57 | % | ||
AQR Emerging Momentum Style Fund | 85.93 | % | ||
AQR TM Large Cap Momentum Style Fund | 100.00 | % | ||
AQR TM Small Cap Momentum Style Fund | 100.00 | % | ||
AQR TM International Momentum Style Fund | 100.00 | % | ||
AQR Large Cap Defensive Style Fund | 97.44 | % | ||
AQR International Defensive Style Fund | 95.82 | % | ||
AQR Emerging Defensive Style Fund | 64.27 | % | ||
AQR Global Equity Fund | 35.60 | % | ||
AQR International Equity Fund | 34.91 | % | ||
AQR Large Cap Relaxed Constraint Equity Fund | 100.00 | % | ||
AQR Small Cap Relaxed Constraint Equity Fund | 98.41 | % | ||
AQR International Relaxed Constraint Equity Fund | 89.56 | % | ||
AQR Emerging Relaxed Constraint Equity Fund | 28.14 | % | ||
For the fiscal year ended September 30, 2018, the following percentages of income dividends paid by the Fund qualify for the dividends received deductions available to corporations:
| FUND | PERCENTAGE | |||
AQR Large Cap Multi-Style Fund | 100.00 | % | ||
AQR Small Cap Multi-Style Fund | 20.39 | % | ||
AQR TM Large Cap Multi-Style Fund | 100.00 | % | ||
AQR TM Small Cap Multi-Style Fund | 97.13 | % | ||
AQR Large Cap Momentum Style Fund | 100.00 | % | ||
AQR Small Cap Momentum Style Fund | 100.00 | % | ||
AQR TM Large Cap Momentum Style Fund | 100.00 | % | ||
AQR TM Small Cap Momentum Style Fund | 100.00 | % | ||
AQR Large Cap Defensive Style Fund | 93.76 | % | ||
AQR Global Equity Fund | 17.88 | % | ||
AQR Large Cap Relaxed Constraint Equity Fund | 100.00 | % | ||
AQR Small Cap Relaxed Constraint Equity Fund | 92.26 | % | ||
The Funds designate the following amounts, or the maximum allowable under Section 852 of the Internal Revenue Code, as long term capital gain dividends paid during the fiscal year ended September 30, 2018:
| FUND | TOTAL | |||
AQR Large Cap Multi-Style Fund | $ | 24,959,792 | ||
AQR Small Cap Multi-Style Fund | 41,939,283 | |||
AQR TM Small Cap Multi-Style Fund | 575,538 | |||
AQR Large Cap Momentum Style Fund | 82,464,961 | |||
AQR Small Cap Momentum Style Fund | 38,261,938 | |||
AQR TM Small Cap Momentum Style Fund | 48,880 | |||
AQR Large Cap Defensive Style Fund | 7,907,632 | |||
AQR Global Equity Fund | 5,464,443 | |||
AQR International Equity Fund | 11,174,436 | |||
| AQR Funds | Annual Report | September 2018 | ||||||||||||||
303
Table of Contents
| Other Federal Tax Information (Unaudited) |
Certain Funds have derived net income from sources within foreign countries. For the year ended September 30, 2018, the foreign source income for each Fund was as follows:
| FUND | TOTAL | PER SHARE | ||||||
AQR International Multi-Style Fund | $ | 15,339,096 | $ | 0.4297 | ||||
AQR Emerging Multi-Style Fund | 9,096,303 | 0.3003 | ||||||
AQR TM International Multi-Style Fund | 5,809,038 | 0.3356 | ||||||
AQR TM Emerging Multi-Style Fund | 10,492,517 | 0.3346 | ||||||
AQR International Momentum Style Fund | 11,290,722 | 0.3940 | ||||||
AQR Emerging Momentum Style Fund | 345,688 | 0.2889 | ||||||
AQR TM International Momentum Style Fund | 3,150,991 | 0.3378 | ||||||
AQR International Defensive Style Fund | 6,285,454 | 0.4067 | ||||||
AQR Emerging Defensive Style Fund | 2,276,010 | 0.2537 | ||||||
AQR International Equity Fund | 13,045,476 | 0.3068 | ||||||
AQR International Relaxed Constraint Equity Fund | 2,626,468 | 0.4544 | ||||||
AQR Emerging Relaxed Constraint Equity Fund | 1,552,712 | 0.5135 | ||||||
Certain Funds intend to elect to pass through to shareholders the credit for taxes paid to foreign countries. For the year ended September 30, 2018, the foreign taxes paid for each Fund was as follows:
| FUND | TOTAL | PER SHARE | ||||||
AQR International Multi-Style Fund | $ | 1,393,118 | $ | 0.0390 | ||||
AQR Emerging Multi-Style Fund | 793,834 | 0.0262 | ||||||
AQR TM International Multi-Style Fund | 505,305 | 0.0292 | ||||||
AQR TM Emerging Multi-Style Fund | 931,153 | 0.0297 | ||||||
AQR International Momentum Style Fund | 1,089,534 | 0.0380 | ||||||
AQR Emerging Momentum Style Fund | 30,115 | 0.0252 | ||||||
AQR TM International Momentum Style Fund | 290,301 | 0.0311 | ||||||
AQR International Defensive Style Fund | 560,017 | 0.0362 | ||||||
AQR Emerging Defensive Style Fund | 243,015 | 0.0271 | ||||||
AQR International Equity Fund | 1,164,931 | 0.0274 | ||||||
AQR International Relaxed Constraint Equity Fund | 245,742 | 0.0425 | ||||||
AQR Emerging Relaxed Constraint Equity Fund | 94,922 | 0.0314 | ||||||
| AQR Funds | Annual Report | September 2018 | ||||||||||||||
304
Table of Contents
| Fund Expense Examples (Unaudited) |
As a shareholder of the Trust, you incur two types of costs: (1) transaction costs and (2) ongoing costs, including management fees; and other Fund expenses. This example is intended to help you understand your ongoing costs (in dollars) of investing in the Fund and to compare these costs with the ongoing costs of investing in other mutual funds The Example is based on an investment of $1,000 invested at the beginning of the period and held for the entire period as indicated below.
Actual Expenses
The table below provides information about actual account values and actual expenses. You may use the information together with the amount you invested, to estimate the expenses that you paid over the period. Simply divide your account value by $1,000 (for example, an $8,600 account value divided by $1,000 = 8.6), then multiply the result by the number under the heading entitled “Expenses Paid for the Period Ending 09/30/18” to estimate the expenses you paid on your account during this period. Each Fund will indirectly bear its pro rata share of the expenses incurred by the underlying investments in which the Fund invests. These expenses are not included in the table.
Hypothetical Example for Comparison Purposes
The table below also provides information about hypothetical account values and hypothetical expenses based on each Fund’s actual expense ratio and an assumed annual rate of return of 5% before expenses, which is not the Fund’s actual return. The hypothetical account values and expenses may not be used to estimate the actual ending account balance or expenses you paid for the period. You may use this information to compare the ongoing costs of investing in a Fund and other funds by comparing this 5% hypothetical example with the 5% hypothetical examples that appear in the shareholder reports of other funds. The Fund will indirectly bear its pro rata share of the expenses incurred by the underlying investments in which the Fund invests. These expenses are not included in the table.
Please note that the expenses shown in the table are meant to highlight your ongoing costs only and do not reflect any transactional costs. Therefore, the hypothetical example is useful in comparing ongoing costs only, and will not help you determine the relative total costs of owning different funds. In addition, if these transactional costs were included, your costs would have been higher.
BEGINNING ACCOUNT DATE VALUE | ENDING ACCOUNT VALUE 9/30/18 | ANNUALIZED EXPENSE RATIO FOR THE PERIOD | EXPENSES PAID FOR THE PERIOD ENDING 9/30/18 | |||||||||||||
| AQR Large Cap Multi-Style Fund | ||||||||||||||||
| Class I | ||||||||||||||||
Actual Return | $1,000.00 | $1,069.30 | 0.43 | % | $2.23 | |||||||||||
Hypothetical Return | $1,000.00 | $1,022.91 | 0.43 | % | $2.18 | |||||||||||
| Class N | ||||||||||||||||
Actual Return | $1,000.00 | $1,068.40 | 0.70 | % | $3.63 | |||||||||||
Hypothetical Return | $1,000.00 | $1,021.56 | 0.70 | % | $3.55 | |||||||||||
| Class R6 | ||||||||||||||||
Actual Return | $1,000.00 | $1,069.90 | 0.35 | % | $1.82 | |||||||||||
Hypothetical Return | $1,000.00 | $1,023.31 | 0.35 | % | $1.78 | |||||||||||
| AQR Small Cap Multi-Style Fund | ||||||||||||||||
| Class I | ||||||||||||||||
Actual Return | $1,000.00 | $1,076.60 | 0.65 | % | $3.38 | |||||||||||
Hypothetical Return | $1,000.00 | $1,021.81 | 0.65 | % | $3.29 | |||||||||||
| Class N | ||||||||||||||||
Actual Return | $1,000.00 | $1,075.50 | 0.90 | % | $4.68 | |||||||||||
Hypothetical Return | $1,000.00 | $1,020.56 | 0.90 | % | $4.56 | |||||||||||
| Class R6 | ||||||||||||||||
Actual Return | $1,000.00 | $1,077.20 | 0.55 | % | $2.86 | |||||||||||
Hypothetical Return | $1,000.00 | $1,022.31 | 0.55 | % | $2.79 | |||||||||||
| AQR Funds | Annual Report | September 2018 | ||||||||||||||
305
Table of Contents
| Fund Expense Examples (Unaudited) |
BEGINNING ACCOUNT DATE VALUE | ENDING ACCOUNT VALUE 9/30/18 | ANNUALIZED EXPENSE RATIO FOR THE PERIOD | EXPENSES PAID FOR THE PERIOD ENDING 9/30/18 | |||||||||||||
| AQR International Multi-Style Fund | ||||||||||||||||
| Class I | ||||||||||||||||
Actual Return | $1,000.00 | $990.70 | 0.60 | % | $2.99 | |||||||||||
Hypothetical Return | $1,000.00 | $1,022.06 | 0.60 | % | $3.04 | |||||||||||
| Class N | ||||||||||||||||
Actual Return | $1,000.00 | $989.90 | 0.85 | % | $4.24 | |||||||||||
Hypothetical Return | $1,000.00 | $1,020.81 | 0.85 | % | $4.31 | |||||||||||
| Class R6 | ||||||||||||||||
Actual Return | $1,000.00 | $991.60 | 0.50 | % | $2.50 | |||||||||||
Hypothetical Return | $1,000.00 | $1,022.56 | 0.50 | % | $2.54 | |||||||||||
| AQR Emerging Multi-Style Fund | ||||||||||||||||
| Class I | ||||||||||||||||
Actual Return | $1,000.00 | $882.80 | 0.75 | % | $3.54 | |||||||||||
Hypothetical Return | $1,000.00 | $1,021.31 | 0.75 | % | $3.80 | |||||||||||
| Class N | ||||||||||||||||
Actual Return | $1,000.00 | $881.90 | 1.00 | % | $4.72 | |||||||||||
Hypothetical Return | $1,000.00 | $1,020.05 | 1.00 | % | $5.06 | |||||||||||
| Class R6 | ||||||||||||||||
Actual Return | $1,000.00 | $883.00 | 0.65 | % | $3.07 | |||||||||||
Hypothetical Return | $1,000.00 | $1,021.81 | 0.65 | % | $3.29 | |||||||||||
| AQR TM Large Cap Multi-Style Fund | ||||||||||||||||
| Class I | ||||||||||||||||
Actual Return | $1,000.00 | $1,078.60 | 0.45 | % | $2.34 | |||||||||||
Hypothetical Return | $1,000.00 | $1,022.81 | 0.45 | % | $2.28 | |||||||||||
| Class N | ||||||||||||||||
Actual Return | $1,000.00 | $1,076.30 | 0.70 | % | $3.64 | |||||||||||
Hypothetical Return | $1,000.00 | $1,021.56 | 0.70 | % | $3.55 | |||||||||||
| Class R6 | ||||||||||||||||
Actual Return | $1,000.00 | $1,078.40 | 0.35 | % | $1.82 | |||||||||||
Hypothetical Return | $1,000.00 | $1,023.31 | 0.35 | % | $1.78 | |||||||||||
| AQR TM Small Cap Multi-Style Fund | ||||||||||||||||
| Class I | ||||||||||||||||
Actual Return | $1,000.00 | $1,085.80 | 0.65 | % | $3.40 | |||||||||||
Hypothetical Return | $1,000.00 | $1,021.81 | 0.65 | % | $3.29 | |||||||||||
| Class N | ||||||||||||||||
Actual Return | $1,000.00 | $1,084.30 | 0.90 | % | $4.70 | |||||||||||
Hypothetical Return | $1,000.00 | $1,020.56 | 0.90 | % | $4.56 | |||||||||||
| Class R6 | ||||||||||||||||
Actual Return | $1,000.00 | $1,085.60 | 0.55 | % | $2.88 | |||||||||||
Hypothetical Return | $1,000.00 | $1,022.31 | 0.55 | % | $2.79 | |||||||||||
| AQR TM International Multi-Style Fund | ||||||||||||||||
| Class I | ||||||||||||||||
Actual Return | $1,000.00 | $992.80 | 0.60 | % | $3.00 | |||||||||||
Hypothetical Return | $1,000.00 | $1,022.06 | 0.60 | % | $3.04 | |||||||||||
| Class N | ||||||||||||||||
Actual Return | $1,000.00 | $991.90 | 0.85 | % | $4.24 | |||||||||||
Hypothetical Return | $1,000.00 | $1,020.81 | 0.85 | % | $4.31 | |||||||||||
| Class R6 | ||||||||||||||||
Actual Return | $1,000.00 | $993.70 | 0.50 | % | $2.50 | |||||||||||
Hypothetical Return | $1,000.00 | $1,022.56 | 0.50 | % | $2.54 | |||||||||||
| AQR Funds | Annual Report | September 2018 | ||||||||||||||
306
Table of Contents
| Fund Expense Examples (Unaudited) |
BEGINNING ACCOUNT DATE VALUE | ENDING ACCOUNT VALUE 9/30/18 | ANNUALIZED EXPENSE RATIO FOR THE PERIOD | EXPENSES PAID FOR THE PERIOD ENDING 9/30/18 | |||||||||||||
| AQR TM Emerging Multi-Style Fund | ||||||||||||||||
| Class I | ||||||||||||||||
Actual Return | $1,000.00 | $891.30 | 0.75 | % | $3.56 | |||||||||||
Hypothetical Return | $1,000.00 | $1,021.31 | 0.75 | % | $3.80 | |||||||||||
| Class N | ||||||||||||||||
Actual Return | $1,000.00 | $889.70 | 1.00 | % | $4.74 | |||||||||||
Hypothetical Return | $1,000.00 | $1,020.05 | 1.00 | % | $5.06 | |||||||||||
| Class R6 | ||||||||||||||||
Actual Return | $1,000.00 | $891.40 | 0.65 | % | $3.08 | |||||||||||
Hypothetical Return | $1,000.00 | $1,021.81 | 0.65 | % | $3.29 | |||||||||||
| AQR Large Cap Momentum Style Fund | ||||||||||||||||
| Class I | ||||||||||||||||
Actual Return | $1,000.00 | $1,132.30 | 0.39 | % | $2.08 | |||||||||||
Hypothetical Return | $1,000.00 | $1,023.11 | 0.39 | % | $1.98 | |||||||||||
| Class N | ||||||||||||||||
Actual Return | $1,000.00 | $1,130.90 | 0.65 | % | $3.47 | |||||||||||
Hypothetical Return | $1,000.00 | $1,021.81 | 0.65 | % | $3.29 | |||||||||||
| Class R6 | ||||||||||||||||
Actual Return | $1,000.00 | $1,132.60 | 0.30 | % | $1.60 | |||||||||||
Hypothetical Return | $1,000.00 | $1,023.56 | 0.30 | % | $1.52 | |||||||||||
| AQR Small Cap Momentum Style Fund | ||||||||||||||||
| Class I | ||||||||||||||||
Actual Return | $1,000.00 | $1,139.90 | 0.60 | % | $3.22 | |||||||||||
Hypothetical Return | $1,000.00 | $1,022.06 | 0.60 | % | $3.04 | |||||||||||
| Class N | ||||||||||||||||
Actual Return | $1,000.00 | $1,138.40 | 0.82 | % | $4.40 | |||||||||||
Hypothetical Return | $1,000.00 | $1,020.96 | 0.82 | % | $4.15 | |||||||||||
| Class R6 | ||||||||||||||||
Actual Return | $1,000.00 | $1,140.60 | 0.50 | % | $2.68 | |||||||||||
Hypothetical Return | $1,000.00 | $1,022.56 | 0.50 | % | $2.54 | |||||||||||
| AQR International Momentum Style Fund | ||||||||||||||||
| Class I | ||||||||||||||||
Actual Return | $1,000.00 | $996.20 | 0.55 | % | $2.75 | |||||||||||
Hypothetical Return | $1,000.00 | $1,022.31 | 0.55 | % | $2.79 | |||||||||||
| Class N | ||||||||||||||||
Actual Return | $1,000.00 | $994.30 | 0.80 | % | $4.00 | |||||||||||
Hypothetical Return | $1,000.00 | $1,021.06 | 0.80 | % | $4.05 | |||||||||||
| Class R6 | ||||||||||||||||
Actual Return | $1,000.00 | $996.20 | 0.45 | % | $2.25 | |||||||||||
Hypothetical Return | $1,000.00 | $1,022.81 | 0.45 | % | $2.28 | |||||||||||
| AQR Emerging Momentum Style Fund | ||||||||||||||||
| Class I | ||||||||||||||||
Actual Return | $1,000.00 | $882.50 | 0.66 | % | $3.11 | |||||||||||
Hypothetical Return | $1,000.00 | $1,021.76 | 0.66 | % | $3.35 | |||||||||||
| Class N | ||||||||||||||||
Actual Return | $1,000.00 | $880.90 | 0.92 | % | $4.34 | |||||||||||
Hypothetical Return | $1,000.00 | $1,020.46 | 0.92 | % | $4.66 | |||||||||||
| Class R6 | ||||||||||||||||
Actual Return | $1,000.00 | $882.60 | 0.60 | % | $2.83 | |||||||||||
Hypothetical Return | $1,000.00 | $1,022.06 | 0.60 | % | $3.04 | |||||||||||
| AQR Funds | Annual Report | September 2018 | ||||||||||||||
307
Table of Contents
| Fund Expense Examples (Unaudited) |
BEGINNING ACCOUNT DATE VALUE | ENDING ACCOUNT VALUE 9/30/18 | ANNUALIZED EXPENSE RATIO FOR THE PERIOD | EXPENSES PAID FOR THE PERIOD ENDING 9/30/18 | |||||||||||||
| AQR TM Large Cap Momentum Style Fund | ||||||||||||||||
| Class I | ||||||||||||||||
Actual Return | $1,000.00 | $1,128.40 | 0.40 | % | $2.13 | |||||||||||
Hypothetical Return | $1,000.00 | $1,023.06 | 0.40 | % | $2.03 | |||||||||||
| Class N | ||||||||||||||||
Actual Return | $1,000.00 | $1,127.10 | 0.65 | % | $3.47 | |||||||||||
Hypothetical Return | $1,000.00 | $1,021.81 | 0.65 | % | $3.29 | |||||||||||
| Class R6 | ||||||||||||||||
Actual Return | $1,000.00 | $1,129.00 | 0.30 | % | $1.60 | |||||||||||
Hypothetical Return | $1,000.00 | $1,023.56 | 0.30 | % | $1.52 | |||||||||||
| AQR TM Small Cap Momentum Style Fund | ||||||||||||||||
| Class I | ||||||||||||||||
Actual Return | $1,000.00 | $1,133.70 | 0.60 | % | $3.21 | |||||||||||
Hypothetical Return | $1,000.00 | $1,022.06 | 0.60 | % | $3.04 | |||||||||||
| Class N | ||||||||||||||||
Actual Return | $1,000.00 | $1,132.00 | 0.85 | % | $4.54 | |||||||||||
Hypothetical Return | $1,000.00 | $1,020.81 | 0.85 | % | $4.31 | |||||||||||
| Class R6 | ||||||||||||||||
Actual Return | $1,000.00 | $1,134.20 | 0.50 | % | $2.68 | |||||||||||
Hypothetical Return | $1,000.00 | $1,022.56 | 0.50 | % | $2.54 | |||||||||||
| AQR TM International Momentum Style Fund | ||||||||||||||||
| Class I | ||||||||||||||||
Actual Return | $1,000.00 | $989.30 | 0.55 | % | $2.74 | |||||||||||
Hypothetical Return | $1,000.00 | $1,022.31 | 0.55 | % | $2.79 | |||||||||||
| Class N | ||||||||||||||||
Actual Return | $1,000.00 | $988.50 | 0.80 | % | $3.99 | |||||||||||
Hypothetical Return | $1,000.00 | $1,021.06 | 0.80 | % | $4.05 | |||||||||||
| Class R6 | ||||||||||||||||
Actual Return | $1,000.00 | $990.00 | 0.45 | % | $2.24 | |||||||||||
Hypothetical Return | $1,000.00 | $1,022.81 | 0.45 | % | $2.28 | |||||||||||
| AQR Large Cap Defensive Style Fund | ||||||||||||||||
| Class I | ||||||||||||||||
Actual Return | $1,000.00 | $1,106.00 | 0.39 | % | $2.06 | |||||||||||
Hypothetical Return | $1,000.00 | $1,023.11 | 0.39 | % | $1.98 | |||||||||||
| Class N | ||||||||||||||||
Actual Return | $1,000.00 | $1,104.70 | 0.64 | % | $3.38 | |||||||||||
Hypothetical Return | $1,000.00 | $1,021.86 | 0.64 | % | $3.24 | |||||||||||
| Class R6 | ||||||||||||||||
Actual Return | $1,000.00 | $1,106.20 | 0.30 | % | $1.58 | |||||||||||
Hypothetical Return | $1,000.00 | $1,023.56 | 0.30 | % | $1.52 | |||||||||||
| AQR International Defensive Style Fund | ||||||||||||||||
| Class I | ||||||||||||||||
Actual Return | $1,000.00 | $997.00 | 0.55 | % | $2.75 | |||||||||||
Hypothetical Return | $1,000.00 | $1,022.31 | 0.55 | % | $2.79 | |||||||||||
| Class N | ||||||||||||||||
Actual Return | $1,000.00 | $995.60 | 0.80 | % | $4.00 | |||||||||||
Hypothetical Return | $1,000.00 | $1,021.06 | 0.80 | % | $4.05 | |||||||||||
| Class R6 | ||||||||||||||||
Actual Return | $1,000.00 | $997.80 | 0.45 | % | $2.25 | |||||||||||
Hypothetical Return | $1,000.00 | $1,022.81 | 0.45 | % | $2.28 | |||||||||||
| AQR Funds | Annual Report | September 2018 | ||||||||||||||
308
Table of Contents
| Fund Expense Examples (Unaudited) |
BEGINNING ACCOUNT DATE VALUE | ENDING ACCOUNT VALUE 9/30/18 | ANNUALIZED EXPENSE RATIO FOR THE PERIOD | EXPENSES PAID FOR THE PERIOD ENDING 9/30/18 | |||||||||||||
| AQR Emerging Defensive Style Fund | ||||||||||||||||
| Class I | ||||||||||||||||
Actual Return | $1,000.00 | $946.00 | 0.70 | % | $3.41 | |||||||||||
Hypothetical Return | $1,000.00 | $1,021.56 | 0.70 | % | $3.55 | |||||||||||
| Class N | ||||||||||||||||
Actual Return | $1,000.00 | $944.40 | 0.95 | % | $4.63 | |||||||||||
Hypothetical Return | $1,000.00 | $1,020.31 | 0.95 | % | $4.81 | |||||||||||
| Class R6 | ||||||||||||||||
Actual Return | $1,000.00 | $945.90 | 0.60 | % | $2.93 | |||||||||||
Hypothetical Return | $1,000.00 | $1,022.06 | 0.60 | % | $3.04 | |||||||||||
| AQR Global Equity Fund | ||||||||||||||||
| Class I | ||||||||||||||||
Actual Return | $1,000.00 | $1,027.10 | 0.80 | % | $4.07 | |||||||||||
Hypothetical Return | $1,000.00 | $1,021.06 | 0.80 | % | $4.05 | |||||||||||
| Class N | ||||||||||||||||
Actual Return | $1,000.00 | $1,026.00 | 1.05 | % | $5.33 | |||||||||||
Hypothetical Return | $1,000.00 | $1,019.80 | 1.05 | % | $5.32 | |||||||||||
| Class R6 | ||||||||||||||||
Actual Return | $1,000.00 | $1,026.80 | 0.70 | % | $3.56 | |||||||||||
Hypothetical Return | $1,000.00 | $1,021.56 | 0.70 | % | $3.55 | |||||||||||
| AQR International Equity Fund | ||||||||||||||||
| Class I | ||||||||||||||||
Actual Return | $1,000.00 | $957.10 | 0.84 | % | $4.12 | |||||||||||
Hypothetical Return | $1,000.00 | $1,020.86 | 0.84 | % | $4.26 | |||||||||||
| Class N | ||||||||||||||||
Actual Return | $1,000.00 | $957.20 | 1.06 | % | $5.20 | |||||||||||
Hypothetical Return | $1,000.00 | $1,019.75 | 1.06 | % | $5.37 | |||||||||||
| Class R6 | ||||||||||||||||
Actual Return | $1,000.00 | $957.30 | 0.75 | % | $3.68 | |||||||||||
Hypothetical Return | $1,000.00 | $1,021.31 | 0.75 | % | $3.80 | |||||||||||
| AQR Large Cap Relaxed Constraint Equity Fund | ||||||||||||||||
| Class I | ||||||||||||||||
Actual Return | $1,000.00 | $1,063.60 | 1.38 | % | $7.14 | |||||||||||
Hypothetical Return | $1,000.00 | $1,018.15 | 1.38 | % | $6.98 | |||||||||||
| Class N | ||||||||||||||||
Actual Return | $1,000.00 | $1,061.80 | 1.61 | % | $8.32 | |||||||||||
Hypothetical Return | $1,000.00 | $1,017.00 | 1.61 | % | $8.14 | |||||||||||
| Class R6 | ||||||||||||||||
Actual Return | $1,000.00 | $1,063.60 | 1.28 | % | $6.62 | |||||||||||
Hypothetical Return | $1,000.00 | $1,018.65 | 1.28 | % | $6.48 | |||||||||||
| AQR Small Cap Relaxed Constraint Equity Fund | ||||||||||||||||
| Class I | ||||||||||||||||
Actual Return | $1,000.00 | $1,063.60 | 1.79 | % | $9.26 | |||||||||||
Hypothetical Return | $1,000.00 | $1,016.09 | 1.79 | % | $9.05 | |||||||||||
| Class N | ||||||||||||||||
Actual Return | $1,000.00 | $1,062.60 | 2.04 | % | $10.55 | |||||||||||
Hypothetical Return | $1,000.00 | $1,014.84 | 2.04 | % | $10.30 | |||||||||||
| Class R6 | ||||||||||||||||
Actual Return | $1,000.00 | $1,064.60 | 1.73 | % | $8.95 | |||||||||||
Hypothetical Return | $1,000.00 | $1,016.39 | 1.73 | % | $8.74 | |||||||||||
| AQR Funds | Annual Report | September 2018 | ||||||||||||||
309
Table of Contents
| Fund Expense Examples (Unaudited) |
BEGINNING ACCOUNT DATE VALUE | ENDING ACCOUNT VALUE 9/30/18 | ANNUALIZED EXPENSE RATIO FOR THE PERIOD | EXPENSES PAID FOR THE PERIOD ENDING 9/30/18 | |||||||||||||
| AQR International Relaxed Constraint Equity Fund | ||||||||||||||||
| Class I | ||||||||||||||||
Actual Return | $1,000.00 | $945.80 | 2.09 | % | $10.19 | |||||||||||
Hypothetical Return | $1,000.00 | $1,014.59 | 2.09 | % | $10.56 | |||||||||||
| Class N | ||||||||||||||||
Actual Return | $1,000.00 | $944.90 | 2.37 | % | $11.56 | |||||||||||
Hypothetical Return | $1,000.00 | $1,013.19 | 2.37 | % | $11.96 | |||||||||||
| Class R6 | ||||||||||||||||
Actual Return | $1,000.00 | $945.90 | 2.10 | % | $10.24 | |||||||||||
Hypothetical Return | $1,000.00 | $1,014.54 | 2.10 | % | $10.61 | |||||||||||
| AQR Emerging Relaxed Constraint Equity Fund | ||||||||||||||||
| Class I | ||||||||||||||||
Actual Return | $1,000.00 | $871.70 | 1.15 | % | $5.40 | |||||||||||
Hypothetical Return | $1,000.00 | $1,019.30 | 1.15 | % | $5.82 | |||||||||||
| Class N | ||||||||||||||||
Actual Return | $1,000.00 | $870.10 | 1.40 | % | $6.56 | |||||||||||
Hypothetical Return | $1,000.00 | $1,018.05 | 1.40 | % | $7.08 | |||||||||||
| Class R6 | ||||||||||||||||
Actual Return | $1,000.00 | $871.80 | 1.05 | % | $4.93 | |||||||||||
Hypothetical Return | $1,000.00 | $1,019.80 | 1.05 | % | $5.32 | |||||||||||
Expenses are calculated using each Class’ annualized expense ratio, multiplied by the average account value for the period, multiplied by 183/365 (to reflect the one-half year period unless stated otherwise).
| AQR Funds | Annual Report | September 2018 | ||||||||||||||
310
Table of Contents
| Trustees and Officers (Unaudited) | September 30, 2018 |
Listed in the chart below is basic information regarding the Trustees and Officers of the Trust. The address of each Officer and Trustee is Two Greenwich Plaza, 4th Floor, Greenwich CT 06830.
| NAME AND YEAR OF BIRTH | CURRENT POSITION WITH THE TRUST, TERM OF OFFICE1 AND LENGTH OF TIME SERVED | PRINCIPAL OCCUPATION(S) DURING PAST 5 YEARS | NUMBER OF FUNDS IN FUND COMPLEX OVERSEEN BY TRUSTEE | OTHER PRESENT OR PAST DIRECTORSHIPS HELD BY TRUSTEE (DURING THE PAST 5 YEARS) | ||||||||||||
Disinterested Trustees2 | ||||||||||||||||
| Timothy K. Armour, M.B.A., 1948 | | Chairman of the Board, since 2010 and Trustee, since 2008 |
| | Interim Chief Executive Officer of Janus Capital Group (retired) (2009-2010) (financial services) | | 50 | | Janus Capital Group (2008- 2016); ETF Securities (2010- 2013) | | ||||||
| L. Joe Moravy, M.B.A., CPA, 1950 | | Trustee, since 2008 |
| | Independent Consultant (retired) (2014-2016); Managing Director, Finance Scholars Group (2010-2014) (consulting) | | 50 | | Nuveen Exchange Traded Commodities Funds (2012-2016) | | ||||||
| William L. Atwell, M.B.A., 1950 | | Trustee, since 2011 | | Managing Director, Atwell Partners LLC (since 2012) (consulting); President (CIGNA International), CIGNA (2008- 2012) (insurance) | | 50 | | Webster Financial Corporation (since 2014); Blucora, Inc. (since 2017) | | |||||||
| Gregg D. Behrens, M.M., 1952 | | Trustee, since 2011 | | Retired from Northern Trust Company (since 2009) (banking) | | 50 | None | |||||||||
| Brian Posner, M.B.A., 1961 | | Trustee, since 2011 | | President, Point Rider Group LLC (since 2008) (consulting) | | 50 | | Biogen Inc. (since 2008); Bioverativ Inc. (2017-2018); Arch Capital Group (since 2010); BG Medicine (2012- 2015) | | |||||||
Mark A. Zurack, M.B.A., CFA 1957 | | Trustee, since 2014 | | Senior Lecturer, Columbia Business School (since 2002); Visiting Senior Lecturer, Cornell University (2004-2013) | | 50 | | Exchange Traded Concepts Trust (since 2011); Source ETF Trust (2014-2015) | | |||||||
Interested Trustees3 | ||||||||||||||||
| David Kabiller, CFA, 1963 | Trustee, since 2010 | | Founding Principal, AQR Capital Management, LLC (since 1998) | | 50 | None | ||||||||||
| Marco Hanig, Ph.D., 1958 | | Trustee, since 2014; Chief Executive |
| | Principal, AQR Capital Management, LLC (since 2008) | | 50 | None | ||||||||
Officers | ||||||||||||||||
| H.J. Willcox, J.D., 1966 | | Chief Compliance Officer, since 2013 | | | Principal and Chief Compliance Officer, AQR Capital Management, LLC (since 2013); Global Head of Compliance and Counsel KKR & Co., L.P. (2008-2013) | | N/A | N/A | ||||||||
| Heather Bonner, CPA, 1977 | | Chief Financial Officer, since 2014; Treasurer, since 2018 | | | Vice President, AQR Capital Management, LLC (since 2013); Senior Manager, PricewaterhouseCoopers, LLP (2007- 2013) | | N/A | N/A | ||||||||
| AQR Funds | Annual Report | September 2018 | ||||||||||||||
311
Table of Contents
| Trustees and Officers (Unaudited) | September 30, 2018 |
| NAME AND YEAR OF BIRTH | CURRENT POSITION WITH THE TRUST, TERM OF OFFICE1 AND LENGTH OF TIME SERVED | PRINCIPAL OCCUPATION(S) DURING PAST 5 YEARS | NUMBER OF FUNDS IN FUND COMPLEX OVERSEEN BY TRUSTEE | OTHER PRESENT OR PAST DIRECTORSHIPS HELD BY TRUSTEE (DURING THE PAST 5 YEARS) | ||||
| Bradley Asness, J.D., M.B.A. 1969 | Vice President, since 2009 | Principal and Co-Chief Operating Officer, AQR Capital Management, LLC (since 1998) | N/A | N/A | ||||
| William J. Fenrich, J.D., 1969 | Vice President, since 2018 | Principal and Chief Legal Officer, AQR Capital Management, LLC (since 2017) | N/A | N/A | ||||
| Nicole DonVito, J.D., 1979 | Chief Legal Officer, since 2014; Vice President, since 2009 | Managing Director, Senior Counsel & Head of Registered Products, AQR Capital Management, LLC (since 2007) | N/A | N/A | ||||
| Tara Bongiorni, CPA 1977 | Assistant Treasurer, since 2017 | Vice President, AQR Capital Management, LLC (since 2015); Vice President, Goldman Sachs Asset Management (2002-2015) | N/A | N/A | ||||
| John Hadermayer, J.D., 1977 | Secretary, since 2018 | Vice President, AQR Capital Management, LLC (since 2013) | N/A | N/A | ||||
| (1) | Each Trustee serves until the election and qualification of a successor, or until death, resignation or removal as provided in the Trust’s Declaration of Trust. A Disinterested Trustee may not hold office beyond December 31 of the year in which he turns 72. |
| (2) | A Disinterested Trustee is any Trustee that is not an “interested person” of the Trust within the meaning of Section 2(a)(19) of the 1940 Act. |
| (3) | An Interested Trustee is a Trustee that is an “interested person” of the Trust within the meaning of Section 2(a)(19) of the 1940 Act. Mr. Kabiller and Dr. Hanig are interested persons of the Trust because of their positions with the Adviser. |
| AQR Funds | Annual Report | September 2018 | ||||||||||||||
312
Table of Contents
Investment Adviser
AQR Capital Management, LLC
Two Greenwich Plaza, 4th Floor
Greenwich, CT 06830
Transfer Agent
ALPS Fund Services, Inc.
1290 Broadway, Suite 1100
Denver, CO 80203
Custodian
JPMorgan Chase Bank, N.A.
4 Metro Tech Center
Brooklyn, NY 11245
State Street Bank and Trust Company
One Lincoln Street
Boston, MA 02111
Distributor
ALPS Distributors, Inc.
1290 Broadway, Suite 1100
Denver, CO 80203
Administrator
JPMorgan Chase Bank, N.A.
70 Fargo Street
Boston, MA 02210
Independent Registered Public Accounting Firm
PricewaterhouseCoopers, LLP
300 Madison Avenue
New York, NY 10017
You may obtain a description of the AQR Funds proxy voting, policies, procedures and information regarding how each Fund voted proxies relating to portfolio securities during the 12-month period ending June 30th of each year (available by August 31st of that year) without charge, upon request, by calling 1-866-290-2688 or visiting the funds website https://funds.aqr.com, or by accessing the SEC’s website at www.SEC.gov. Such reports may be reviewed and copied at the SEC’s Public Reference Room in Washington, DC. Information on the operation of the Public Reference Room may be obtained by calling 202-551-8090.
The Fund files complete schedules of the portfolio holdings with the SEC for the first and third quarters on Form N-Q. The Form N-Q is available without charge, upon request, by calling 1-800-SEC-0330, or by accessing the SEC’s website, at www.SEC.gov. It may also be reviewed and copied at the SEC’s Public Reference Room in Washington, DC.
This report has been prepared for shareholders and may be distributed to others only if preceded or accompanied by an effective prospectus, which includes information regarding the Funds’ objectives and policies, experienced of its management, marketability of shares and other information.
Table of Contents

AQR Funds
P.O. Box 2248, Denver, CO 80201-2248 | p: +1.866.290.2688 | w: https://funds.aqr.com
Table of Contents

Annual Report
September 30, 2018
AQR Core Plus Bond Fund
Table of Contents
| Shareholder Letter (Unaudited) | ||||
| 2 | ||||
| Schedule of Investments | ||||
| 4 | ||||
| Financial Statements and Notes | 13 | |||
| Report of Independent Registered Public Accounting Firm | 34 | |||
| Fund Expense Examples (Unaudited) | 35 | |||
| Board Approval of Investment Advisory Agreements | 36 | |||
| Trustees and Officers (Unaudited) | 38 | |||
Table of Contents
Shareholder Letter (Unaudited)
| AQR CORE PLUS BOND FUND |

Ronen Israel
Principal

Scott Richardson
Principal

Jordan Brooks
Managing Director
Dear Shareholder:
The AQR Core Plus Bond Fund (the “Fund”) is a U.S. Aggregate Bond-benchmarked fixed income offering that seeks total return, consisting of capital appreciation and income. Excess returns are pursued through a rules-based, systematic application of fundamental investment themes such as Value, Momentum, Carry Defensive, and other proprietary signals. By combining these investment themes, we aim to build a portfolio weighted to securities that are cheap, with improving price and fundamental trends, with attractive yields, and which have more defensive characteristics. Notably, out of benchmark sectors are strictly used to increase security selection breadth, while still targeting the credit and duration profile of the benchmark. Because of its systematic approach, the strategy targets excess returns that are both attractive, as well as uncorrelated to traditional market risk premiums (e.g. equities, interest-rates, etc.), and to traditional fixed income managers.
For the fiscal year ended September 30, 2018, the Fund’s Class I returned -0.02% while its benchmark, the Bloomberg Barclays US Aggregate Total Return Index, returned 0.20% over the period. The fund’s slight underperformance was driven primarily by the country selection strategy sleeve, while the maturity selection, corporate bond selection, and currency selection sleeves all had positive contributions to performance. The underperformance in the Country Selection sleeve was driven by our exposure to peripheral Europe, driven by high carry and improving fundamentals, but where spreads had widened earlier in the year over political concerns.
| AVERAGE ANNUAL TOTAL RETURNS AS OF 9/30/2018 AQR CORE PLUS BOND FUND | ||||||||
| Since Inception | Date of Inception | |||||||
| Fund - Class I: QCPIX | -0.02% | 4/5/2018 | ||||||
| Fund - Class N: QCPNX | -0.12% | 4/5/2018 | ||||||
| Fund - Class R6: QCPRX | 0.00% | 4/5/2018 | ||||||
| Bloomberg Barclays U.S. Aggregate Bond Index | 0.20% | |||||||
Past performance does not guarantee future results. Investment results and principal value of an investment will fluctuate so that an investor’s shares, when redeemed, may be worth more or less than their original cost. Current performance may be lower or higher than the performance data quoted. As of the latest prospectus, the gross expense ratio for the Fund’s Class I/N/R6 shares are 0.58%, 0.83% and 0.48%, respectively. Call 1-866-290-2688 or visit www.aqrfunds.com for current month-end performance.
| AQR Funds | Annual Report | September 2018 | ||||||||||||||
2
Table of Contents
Shareholder Letter (Unaudited)
| AQR CORE PLUS BOND FUND |
AQR CORE PLUS BOND FUND VS. BLOOMBERG BARCLAYS U.S. AGGREGATE BOND INDEX VALUE OF $10,000 INVESTED ON 4/5/2018 |
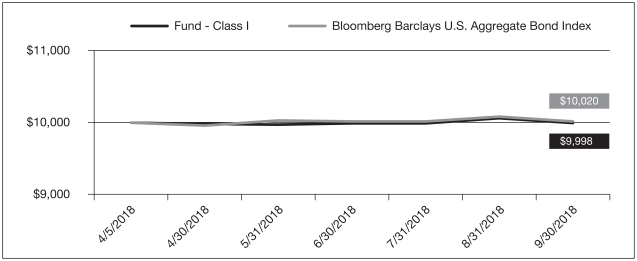
The chart above represents historical performance of a hypothetical investment of $10,000 in the Fund over the past ten years (or since inception if shorter). Performance data quoted represents past performance and does not guarantee future results. Returns shown are total returns, which assume the reinvestment of dividends and capital gains. The table and graph presented above do not reflect the deduction of taxes a shareholder would pay on fund distributions or the redemption of fund shares.
| AQR Funds | Annual Report | September 2018 | ||||||||||||||
3
Table of Contents
| Schedule of Investments | September 30, 2018 |
| AQR CORE PLUS BOND FUND |
| INVESTMENTS | PRINCIPAL AMOUNT | VALUE | ||||||
| LONG POSITIONS - 126.0% | ||||||||
| CORPORATE BONDS - 25.2% | ||||||||
| Aerospace & Defense - 0.7% | ||||||||
| Hexcel Corp. |
| |||||||
| 3.95%, 2/15/2027 | $ | 730,000 | $ | 709,112 | ||||
|
| |||||||
| Air Freight & Logistics - 0.1% | ||||||||
| CH Robinson Worldwide, Inc. |
| |||||||
| 4.20%, 4/15/2028 | 140,000 | 137,867 | ||||||
|
| |||||||
| Banks - 2.5% | ||||||||
| Huntington Bancshares, Inc. |
| |||||||
| 2.30%, 1/14/2022 | 810,000 | 775,755 | ||||||
| Regions Financial Corp. |
| |||||||
| 2.75%, 8/14/2022 | 890,000 | 858,245 | ||||||
| SunTrust Banks, Inc. |
| |||||||
| 2.70%, 1/27/2022 | 880,000 | 856,307 | ||||||
|
| |||||||
| 2,490,307 | ||||||||
|
| |||||||
| Beverages - 0.1% | ||||||||
| Constellation Brands, Inc. |
| |||||||
| 4.25%, 5/1/2023 | 150,000 | 152,000 | ||||||
|
| |||||||
| Capital Markets - 1.7% | ||||||||
| Ares Capital Corp. |
| |||||||
| 3.50%, 2/10/2023 | 700,000 | 668,899 | ||||||
| Jefferies Group LLC |
| |||||||
| 4.15%, 1/23/2030 | 330,000 | 296,475 | ||||||
| Nasdaq, Inc. |
| |||||||
| 4.25%, 6/1/2024 | 710,000 | 716,227 | ||||||
|
| |||||||
| 1,681,601 | ||||||||
|
| |||||||
| Chemicals - 0.7% | ||||||||
| Methanex Corp. (Canada) |
| |||||||
| 4.25%, 12/1/2024 | 730,000 | 713,662 | ||||||
|
| |||||||
| Communications Equipment - 0.7% | ||||||||
| Motorola Solutions, Inc. |
| |||||||
| 3.75%, 5/15/2022 | 720,000 | 713,886 | ||||||
|
| |||||||
| Consumer Finance - 0.8% | ||||||||
| American Express Co. |
| |||||||
| 2.50%, 8/1/2022 | 810,000 | 776,478 | ||||||
|
| |||||||
| Diversified Financial Services - 0.9% | ||||||||
| Petronas Capital Ltd. (Malaysia) |
| |||||||
| 7.88%, 5/22/2022 (a) | 240,000 | 272,614 | ||||||
| Voya Financial, Inc. |
| |||||||
| 4.80%, 6/15/2046 | 700,000 | 690,419 | ||||||
|
| |||||||
| 963,033 | ||||||||
|
| |||||||
| Electric Utilities - 2.4% | ||||||||
| Exelon Corp. |
| |||||||
| 3.50%, 6/1/2022 (b) | 860,000 | 844,991 | ||||||
| FirstEnergy Corp. |
| |||||||
| Series B, 3.90%, 7/15/2027 | 810,000 | 787,935 | ||||||
| NextEra Energy Capital Holdings, Inc. |
| |||||||
| 3.55%, 5/1/2027 | 830,000 | 798,558 | ||||||
|
| |||||||
| 2,431,484 | ||||||||
|
| |||||||
| INVESTMENTS | PRINCIPAL AMOUNT | VALUE | ||||||
| Equity Real Estate Investment Trusts (REITs) - 0.3% | ||||||||
| Crown Castle International Corp. |
| |||||||
| 3.65%, 9/1/2027 | $ | 320,000 | $ | 300,653 | ||||
|
| |||||||
| Food & Staples Retailing - 0.6% | ||||||||
| Sysco Corp. |
| |||||||
| 3.30%, 7/15/2026 | 650,000 | 621,222 | ||||||
|
| |||||||
| Health Care Providers & Services - 2.1% | ||||||||
| Aetna, Inc. |
| |||||||
| 2.80%, 6/15/2023 | 770,000 | 737,781 | ||||||
| Anthem, Inc. |
| |||||||
| 4.63%, 5/15/2042 | 660,000 | 644,937 | ||||||
| Humana, Inc. |
| |||||||
| 4.95%, 10/1/2044 | 680,000 | 706,138 | ||||||
|
| |||||||
| 2,088,856 | ||||||||
|
| |||||||
| Hotels, Restaurants & Leisure - 0.1% | ||||||||
| Darden Restaurants, Inc. |
| |||||||
| 4.55%, 2/15/2048 | 140,000 | 131,164 | ||||||
|
| |||||||
| Insurance - 0.6% | ||||||||
| Marsh & McLennan Cos., Inc. |
| |||||||
| 4.20%, 3/1/2048 | 100,000 | 94,339 | ||||||
| Progressive Corp. (The) |
| |||||||
| 4.13%, 4/15/2047 | 490,000 | 477,120 | ||||||
|
| |||||||
| 571,459 | ||||||||
|
| |||||||
| IT Services - 0.6% | ||||||||
| Total System Services, Inc. |
| |||||||
| 4.80%, 4/1/2026 | 590,000 | 607,101 | ||||||
|
| |||||||
| Multiline Retail - 2.4% | ||||||||
| Dollar General Corp. |
| |||||||
| 3.25%, 4/15/2023 | 690,000 | 673,660 | ||||||
| Kohl’s Corp. |
| |||||||
| 4.25%, 7/17/2025 | 720,000 | 719,216 | ||||||
| Macy’s Retail Holdings, Inc. |
| |||||||
| 2.88%, 2/15/2023 | 770,000 | 729,209 | ||||||
| Nordstrom, Inc. |
| |||||||
| 5.00%, 1/15/2044 | 336,000 | 309,855 | ||||||
|
| |||||||
| 2,431,940 | ||||||||
|
| |||||||
| Multi-Utilities - 0.1% | ||||||||
| DTE Energy Co. |
| |||||||
| 2.85%, 10/1/2026 | 100,000 | 91,681 | ||||||
|
| |||||||
| Oil, Gas & Consumable Fuels - 3.4% | ||||||||
| Continental Resources, Inc. |
| |||||||
| 5.00%, 9/15/2022 | 656,000 | 665,512 | ||||||
| Hess Corp. |
| |||||||
| 4.30%, 4/1/2027 | 790,000 | 766,047 | ||||||
| HollyFrontier Corp. |
| |||||||
| 5.88%, 4/1/2026 | 740,000 | 788,799 | ||||||
| KazTransGas JSC (Kazakhstan) |
| |||||||
| 4.38%, 9/26/2027 (a) | 200,000 | 190,310 | ||||||
| ONEOK, Inc. |
| |||||||
| 4.95%, 7/13/2047 | 470,000 | 467,001 | ||||||
| The accompanying notes are an integral part of these financial statements. | (Continued) |
| AQR Funds | Annual Report | September 2018 | ||||||||||||||
4
Table of Contents
| Schedule of Investments | September 30, 2018 |
| AQR CORE PLUS BOND FUND |
| INVESTMENTS | PRINCIPAL AMOUNT | VALUE | ||||||
| Oil, Gas & Consumable Fuels - 3.4% (continued) | ||||||||
| Petroleos Mexicanos (Mexico) |
| |||||||
| 4.50%, 1/23/2026 | $ | 20,000 | $ | 18,700 | ||||
| 6.50%, 3/13/2027 | 30,000 | 30,645 | ||||||
| 6.63%, 6/15/2035 | 20,000 | 19,870 | ||||||
| 6.75%, 9/21/2047 | 160,000 | 152,670 | ||||||
| 6.35%, 2/12/2048 (a) | 10,000 | 9,160 | ||||||
| Western Gas Partners LP |
| |||||||
| 5.30%, 3/1/2048 | 370,000 | 339,133 | ||||||
|
| |||||||
| 3,447,847 | ||||||||
|
| |||||||
| Professional Services - 1.4% | ||||||||
| IHS Markit Ltd. |
| |||||||
| 4.75%, 2/15/2025 (a) | 670,000 | 679,735 | ||||||
| Verisk Analytics, Inc. |
| |||||||
| 4.00%, 6/15/2025 | 730,000 | 721,058 | ||||||
|
| |||||||
| 1,400,793 | ||||||||
|
| |||||||
| Road & Rail - 0.2% | ||||||||
| CSX Corp. |
| |||||||
| 4.30%, 3/1/2048 | 190,000 | 185,998 | ||||||
|
| |||||||
| Software - 1.4% | ||||||||
| Citrix Systems, Inc. |
| |||||||
| 4.50%, 12/1/2027 | 720,000 | 693,831 | ||||||
| VMware, Inc. |
| |||||||
| 3.90%, 8/21/2027 | 770,000 | 728,483 | ||||||
|
| |||||||
| 1,422,314 | ||||||||
|
| |||||||
| Specialty Retail - 0.1% | ||||||||
| TJX Cos., Inc. (The) |
| |||||||
| 2.25%, 9/15/2026 | 150,000 | 135,839 | ||||||
|
| |||||||
| Technology Hardware, Storage & Peripherals - 0.6% | ||||||||
| NetApp, Inc. |
| |||||||
| 3.30%, 9/29/2024 | 660,000 | 630,248 | ||||||
|
| |||||||
| Textiles, Apparel & Luxury Goods - 0.7% | ||||||||
| Tapestry, Inc. |
| |||||||
| 4.13%, 7/15/2027 | 740,000 | 701,795 | ||||||
|
| |||||||
TOTAL CORPORATE BONDS | 25,538,340 | |||||||
|
| |||||||
| MORTGAGE-BACKED SECURITIES - 31.5% | ||||||||
| FNMA |
| |||||||
| TBA, 2.50%, 10/25/2033 | 1,550,000 | 1,495,408 | ||||||
| TBA, 3.00%, 10/25/2033 - 10/25/2048 | 8,650,000 | 8,316,174 | ||||||
| TBA, 3.50%, 10/25/2033 - 10/25/2048 | 10,450,000 | 10,295,708 | ||||||
| TBA, 4.00%, 10/25/2048 | 6,450,000 | 6,512,988 | ||||||
| TBA, 4.50%, 10/25/2048 | 3,700,000 | 3,816,659 | ||||||
| TBA, 5.00%, 10/25/2048 | 1,400,000 | 1,469,571 | ||||||
|
| |||||||
TOTAL MORTGAGE-BACKED SECURITIES |
| 31,906,508 | ||||||
|
| |||||||
| FOREIGN GOVERNMENT SECURITIES - 24.1% | ||||||||
| Arab Republic of Egypt |
| |||||||
| 8.50%, 1/31/2047 (c) | 200,000 | 200,432 | ||||||
| INVESTMENTS | PRINCIPAL AMOUNT | VALUE | ||||||
| FOREIGN GOVERNMENT SECURITIES - 24.1% (continued) | ||||||||
| Australia Government Bond |
| |||||||
| 2.75%, 11/21/2027 (c) | AUD | 1,280,000 | $ | 931,856 | ||||
| 2.50%, 5/21/2030 (c) | AUD | 1,200,000 | 847,445 | |||||
| Canada Government Bond |
| |||||||
| 1.50%, 6/1/2026 | CAD | 210,000 | 152,282 | |||||
| Deutsche Bundesrepublik Inflation Linked Bond |
| |||||||
| 0.50%, 2/15/2028 (c) | EUR | 1,270,000 | 1,485,578 | |||||
| Dominican Republic Government Bond |
| |||||||
| 7.45%, 4/30/2044 (a) | 100,000 | 106,500 | ||||||
| Export-Import Bank of India |
| |||||||
| 4.00%, 1/14/2023 (c) | 200,000 | 197,926 | ||||||
| Federal Republic of Nigeria |
| |||||||
| 7.88%, 2/16/2032 (a) | 200,000 | 204,300 | ||||||
| Federative Republic of Brazil |
| |||||||
| 8.25%, 1/20/2034 | 20,000 | 23,450 | ||||||
| France Government Bond OAT |
| |||||||
| 1.00%, 5/25/2027 (c) | EUR | 3,710,000 | 4,447,920 | |||||
| Hungary Government Bond |
| |||||||
| 6.38%, 3/29/2021 | 180,000 | 192,060 | ||||||
| 5.75%, 11/22/2023 | 90,000 | 97,470 | ||||||
| Instituto Costarricense de Electricidad |
| |||||||
| 6.95%, 11/10/2021 (a) | 200,000 | 201,500 | ||||||
| Kingdom of Belgium |
| |||||||
| 1.00%, 6/22/2026 (c) | EUR | 430,000 | 515,862 | |||||
| 0.80%, 6/22/2027 (c) | EUR | 850,000 | 994,689 | |||||
| Kingdom of Spain |
| |||||||
| 2.15%, 10/31/2025 (c) | EUR | 10,000 | 12,494 | |||||
| 5.90%, 7/30/2026 (c) | EUR | 1,720,000 | 2,701,949 | |||||
| 5.15%, 10/31/2028 (c) | EUR | 1,900,000 | 2,954,533 | |||||
| Kingdom of Sweden |
| |||||||
| 1.00%, 11/12/2026 | SEK | 20,660,000 | 2,424,831 | |||||
| Mexico Government Bond |
| |||||||
| 6.05%, 1/11/2040 | 250,000 | 277,627 | ||||||
| Oman Government International Bond |
| |||||||
| 6.75%, 1/17/2048 (c) | 200,000 | 194,524 | ||||||
| People’s Republic of China |
| |||||||
| 2.13%, 11/2/2022 (c) | 310,000 | 297,160 | ||||||
| Republic of Chile |
| |||||||
| 3.25%, 9/14/2021 | 100,000 | 100,072 | ||||||
| 3.13%, 3/27/2025 | 200,000 | 193,996 | ||||||
| Republic of Colombia |
| |||||||
| 8.13%, 5/21/2024 | 100,000 | 120,000 | ||||||
| 7.38%, 9/18/2037 | 150,000 | 189,000 | ||||||
| Republic of Ecuador |
| |||||||
| 10.75%, 3/28/2022 (a) | 200,000 | 212,500 | ||||||
| Republic of El Salvador |
| |||||||
| 7.65%, 6/15/2035 (a) | 70,000 | 67,926 | ||||||
| Republic of Indonesia |
| |||||||
| 2.95%, 1/11/2023 | 200,000 | 191,030 | ||||||
| 4.13%, 1/15/2025 (c) | 200,000 | 196,714 | ||||||
| Republic of Italy |
| |||||||
| 7.25%, 11/1/2026 | EUR | 180,000 | 274,271 | |||||
| 6.50%, 11/1/2027 | EUR | 1,160,000 | 1,713,341 | |||||
| 6.00%, 5/1/2031 | EUR | 200,000 | 296,182 | |||||
| 5.75%, 2/1/2033 | EUR | 20,000 | 29,509 | |||||
| Republic of Kenya |
| |||||||
| 7.25%, 2/28/2028 (c) | 200,000 | 194,500 | ||||||
| The accompanying notes are an integral part of these financial statements. | (Continued) |
| AQR Funds | Annual Report | September 2018 | ||||||||||||||
5
Table of Contents
| Schedule of Investments | September 30, 2018 |
| AQR CORE PLUS BOND FUND |
| INVESTMENTS | PRINCIPAL AMOUNT | VALUE | ||||||
| FOREIGN GOVERNMENT SECURITIES - 24.1% (continued) | ||||||||
| Republic of Panama |
| |||||||
| 6.70%, 1/26/2036 | $ | 50,000 | $ | 62,450 | ||||
| Republic of Peru |
| |||||||
| 8.75%, 11/21/2033 | 190,000 | 280,725 | ||||||
| Republic of South Africa |
| |||||||
| 4.67%, 1/17/2024 | 270,000 | 263,598 | ||||||
| Republic of Ukraine |
| |||||||
| 7.75%, 9/1/2025 (a) | 190,000 | 180,688 | ||||||
| 7.75%, 9/1/2025 (c) | 110,000 | 104,609 | ||||||
| Republic of Romania |
| |||||||
| 6.75%, 2/7/2022 (a) | 200,000 | 218,320 | ||||||
|
| |||||||
TOTAL FOREIGN GOVERNMENT SECURITIES |
| 24,351,819 | ||||||
|
| |||||||
| U.S. TREASURY OBLIGATIONS - 34.8% | ||||||||
| U.S. Treasury Bonds |
| |||||||
| 2.88%, 5/15/2043 | 10,130,000 | 9,576,807 | ||||||
| U.S. Treasury Notes |
| |||||||
| 2.00%, 1/31/2020 | 20,630,000 | 20,433,370 | ||||||
| 2.13%, 9/30/2021 | 5,320,000 | 5,203,625 | ||||||
|
| |||||||
TOTAL U.S. TREASURY OBLIGATIONS |
| 35,213,802 | ||||||
|
| |||||||
| SHARES | ||||||||
| SHORT-TERM INVESTMENTS - 10.4% | ||||||||
| INVESTMENT COMPANIES - 10.4% | ||||||||
| Limited Purpose Cash Investment Fund, 2.06% (1)(d) | ||||||||
(Cost $10,548,029) | 10,549,696 | 10,548,642 | ||||||
|
| |||||||
TOTAL INVESTMENTS BEFORE TBA SALE COMMITMENTS |
| 127,559,111 | ||||||
|
| |||||||
| PRINCIPAL AMOUNT | ||||||||
| TBA SALE COMMITMENTS - (1.8)% | ||||||||
| MORTGAGE-BACKED SECURITIES - (1.8)% | ||||||||
| FNMA |
| |||||||
| TBA, 2.50%, 10/25/2033 | $ | (50,000 | ) | (48,239 | ) | |||
| TBA, 3.00%, 10/25/2033 - 10/25/2048 | (650,000 | ) | (623,445 | ) | ||||
| TBA, 4.50%, 10/25/2048 | (1,150,000 | ) | (1,186,259 | ) | ||||
|
| |||||||
TOTAL TBA SALE COMMITMENTS |
| (1,857,943 | ) | |||||
|
| |||||||
TOTAL INVESTMENTS NET OF TBA SALE COMMITMENTS - 124.2% |
| 125,701,168 | ||||||
|
| |||||||
| LIABILITIES IN EXCESS OF OTHER ASSETS - (24.2)% (e) | (24,473,081) | |||||||
|
| |||||||
NET ASSETS - 100.0% | $ | 101,228,087 | ||||||
|
| |||||||
| SECTOR | VALUE | % OF NET ASSETS | ||||||
| Consumer Discretionary | $ | 3,400,738 | 3.3 | % | ||||
| Consumer Staples | 773,222 | 0.7 | ||||||
| Energy | 3,447,847 | 3.4 | ||||||
| Financials | 6,482,878 | 6.5 | ||||||
| Foreign Government Securities | 24,351,819 | 24.1 | ||||||
| Health Care | 2,088,856 | 2.1 | ||||||
| Industrials | 2,433,770 | 2.4 | ||||||
| Information Technology | 3,373,549 | 3.3 | ||||||
| Materials | 713,662 | 0.7 | ||||||
| Mortgage-Backed Securities | 30,048,565 | 29.7 | ||||||
| Real Estate | 300,653 | 0.3 | ||||||
| U.S. Treasury Obligations | 35,213,802 | 34.8 | ||||||
| Utilities | 2,523,165 | 2.5 | ||||||
| Short-Term Investments | 10,548,642 | 10.4 | ||||||
|
|
|
| |||||
Total Investments In Securities | 125,701,168 | 124.2 | ||||||
| Liabilities in Excess of Other Assets (e) | (24,473,081 | ) | (24.2 | ) | ||||
|
|
|
| |||||
Net Assets | $ | 101,228,087 | 100.0 | % | ||||
|
|
|
| |||||
| (a) | Securities exempt from registration under Rule 144A or section 4(2), of the Securities Act of 1933. Under procedures approved by the Board of Trustees, such securities have been determined to be liquid by the investment adviser and may be resold, normally to qualified institutional buyers in transactions exempt from registration. Total value of all such securities at September 30, 2018 amounted to $2,343,553, which represents approximately 2.32% of net assets of the fund. |
| (b) | Step bond. Coupon rate is a fixed rate for an initial period that either resets at a specific date or may reset in the future contingent upon a rating change made by a rating agency. The interest rate shown was the current rate as of September 30, 2018. |
| (c) | Security exempt from registration pursuant to Regulation S under the Securities Act of 1933. Regulation S applies to securities offerings that are made outside of the United States and do not involve direct selling efforts in the United States. At September 30, 2018, the value of these securities amounted to $16,278,191 or 16.08% of net assets. |
| (d) | Represents 7-day effective yield as of September 30, 2018. |
| (e) | Includes appreciation/(depreciation) on forward foreign currency exchange, futures and swap contracts. |
All securities are Level 2 with respect to ASC 820, unless otherwise noted in parentheses.
| (1) | Level 1 security (See Note 4). |
Abbreviations
AUD - Australian Dollar
CAD - Canadian Dollar
EUR - Euro
FNMA - Federal National Mortgage Association
SEK - Swedish Krona
TBA - To Be Announced; Security is subject to delayed delivery.
| The accompanying notes are an integral part of these financial statements. | (Continued) |
| AQR Funds | Annual Report | September 2018 | ||||||||||||||
6
Table of Contents
| Schedule of Investments | September 30, 2018 |
| AQR CORE PLUS BOND FUND |
Credit default swap contracts outstanding - buy protection as of September 30, 2018:
Exchange Cleared
| REFERENCE ENTITY | FINANCING RATE | PAYMENT FREQUENCY | MATURITY DATE | CREDIT SPREAD | NOTIONAL AMOUNT | UPFRONT PAYMENTS (RECEIPTS) | UNREALIZED APPRECIATION (DEPRECIATION) | VALUE | ||||||||||||||||||||||||
| Markit CDX Emerging Market Index Series 30.V1 | 1.00 | % | Quarterly | 12/20/2023 | 1.92 | % | USD | 6,440,000 | $279,785 | $(10,760 | ) | $269,025 | ||||||||||||||||||||
| Republic of South Africa, 5.50%, 3/9/2020 | 1.00 | Quarterly | 12/20/2023 | 2.02 | USD | 600,000 | 28,959 | (628 | ) | 28,331 | ||||||||||||||||||||||
| Republic of Turkey, 11.88%, 1/15/2030 | 1.00 | Quarterly | 12/20/2023 | 3.72 | USD | 800,000 | 98,468 | (3,859 | ) | 94,609 | ||||||||||||||||||||||
|
| |||||||||||||||||||||||||||||||
| 407,212 | (15,247 | ) | 391,965 | |||||||||||||||||||||||||||||
|
| |||||||||||||||||||||||||||||||
| Republic of Korea, 7.13%, 4/16/2019 | 1.00 | Quarterly | 12/20/2023 | 0.38 | USD | 2,900,000 | $(83,648 | ) | $(4,671 | ) | $(88,319 | ) | ||||||||||||||||||||
|
| |||||||||||||||||||||||||||||||
| (83,648 | ) | (4,671 | ) | (88,319 | ) | |||||||||||||||||||||||||||
|
| |||||||||||||||||||||||||||||||
| $323,564 | $(19,918 | ) | $303,646 | |||||||||||||||||||||||||||||
|
| |||||||||||||||||||||||||||||||
Credit default swap contracts outstanding - sell protection as of September 30, 2018:
Exchange Cleared
| REFERENCE ENTITY | FINANCING RATE RECEIVED | PAYMENT FREQUENCY | MATURITY DATE | CREDIT SPREAD | NOTIONAL AMOUNT | UPFRONT PAYMENTS (RECEIPTS) | UNREALIZED APPRECIATION (DEPRECIATION) | VALUE | ||||||||||||||||||||||||
| Markit CDX North America Investment Grade Index Series 31.V1 | 1.00 | % | Quarterly | 12/20/2023 | 0.60 | % | USD | 6,160,000 | $115,077 | $4,694 | $119,771 | |||||||||||||||||||||
| Penerbangan Malaysia Bhd., 1.00%, 6/20/2021 | 1.00 | Quarterly | 12/20/2023 | 0.93 | USD | 3,400,000 | 9,585 | 1,987 | 11,572 | |||||||||||||||||||||||
|
| |||||||||||||||||||||||||||||||
| 124,662 | 6,681 | 131,343 | ||||||||||||||||||||||||||||||
|
| |||||||||||||||||||||||||||||||
| Federative Republic of Brazil, 4.25%, 1/7/2025 | 1.00 | Quarterly | 12/20/2023 | 2.60 | USD | 1,000,000 | $(79,962 | ) | $7,187 | $(72,775 | ) | |||||||||||||||||||||
|
| |||||||||||||||||||||||||||||||
| (79,962 | ) | 7,187 | (72,775 | ) | ||||||||||||||||||||||||||||
|
| |||||||||||||||||||||||||||||||
| $44,700 | $13,868 | $58,568 | ||||||||||||||||||||||||||||||
|
| |||||||||||||||||||||||||||||||
Forward effective interest rate swap contracts outstanding as of September 30, 2018:
Exchange Cleared
| PAY/RECEIVE FLOATING RATE | FLOATING RATE INDEX (a) | FIXED RATE | MATURITY DATE | NOTIONAL AMOUNT | UPFRONT PREMIUM PAID (RECEIVED) | UNREALIZED APPRECIATION (DEPRECIATION) | VALUE | |||||||||||||||||||||
| Pay | 3 Month Australian Bank-Bill Reference Rate Quarterly | 2.50% Semi-Annually | 3/10/2021 | NZD | 9,500,000 | $54,512 | $(7,724 | ) | $46,788 | |||||||||||||||||||
| Pay | 3 Month Stockholm Interbank Offered Rate Quarterly | 1.50% Annually | 3/21/2029 | SEK | 50,800,000 | 118,607 | (55,701 | ) | 62,906 | |||||||||||||||||||
| Pay | 6 Month Australian Bank-Bill Reference Rate Semi-Annually | 3.00% Semi-Annually | 3/08/2029 | AUD | 2,200,000 | 16,776 | (1,816 | ) | 14,960 | |||||||||||||||||||
| The accompanying notes are an integral part of these financial statements. | (Continued) |
| AQR Funds | Annual Report | September 2018 | ||||||||||||||
7
Table of Contents
| Schedule of Investments | September 30, 2018 |
| AQR CORE PLUS BOND FUND |
| PAY/RECEIVE FLOATING RATE | FLOATING RATE INDEX (a) | FIXED RATE | MATURITY DATE | NOTIONAL AMOUNT | UPFRONT PREMIUM PAID (RECEIVED) | UNREALIZED APPRECIATION (DEPRECIATION) | VALUE | |||||||||||||||||||||
| Pay | 6 Month Euro Interbank Offered Rate Semi-Annually | 0.00% Annually | 12/21/2020 | EUR | 4,300,000 | $ 1,550 | $ 3,245 | $ 4,795 | ||||||||||||||||||||
| Pay | 6 Month London Interbank Offered Rate Semi-Annually | 0.25% Annually | 3/17/2021 | CHF | 6,300,000 | 20,509 | (5,603 | ) | 14,906 | |||||||||||||||||||
| Pay | 6 Month London Interbank Offered Rate Semi-Annually | 0.50% Semi-Annually | 3/21/2029 | JPY | 37,800,000 | 3,961 | (235 | ) | 3,726 | |||||||||||||||||||
| Pay | 6 Month Norwegian Interbank Offered Rate Semi-Annually | 2.00% Annually | 3/17/2021 | NOK | 284,400,000 | 232,097 | (30,815 | ) | 201,282 | |||||||||||||||||||
| Receive | 3 Month Australian Bank-Bill Reference Rate Quarterly | 2.00% Quarterly | 3/11/2021 | AUD | 9,700,000 | 13,684 | (1,563 | ) | 12,121 | |||||||||||||||||||
| Receive | 3 Month London Interbank Offered Rate Quarterly | 3.00% Semi-Annually | 12/19/2028 | USD | 200,000 | — | 2,275 | 2,275 | ||||||||||||||||||||
| Receive | 3 Month London Interbank Offered Rate Quarterly | 3.00% Semi-Annually | 3/20/2029 | USD | 1,800,000 | 25,851 | (3,266 | ) | 22,585 | |||||||||||||||||||
| Receive | 6 Month Euro Interbank Offered Rate Semi-Annually | 0.00% Annually | 3/22/2021 | EUR | 40,500,000 | (16,973 | ) | 46,330 | 29,357 | |||||||||||||||||||
| Receive | 6 Month London Interbank Offered Rate Semi-Annually | 1.50% Semi-Annually | 3/20/2029 | GBP | 8,200,000 | 95,670 | 110,206 | 205,876 | ||||||||||||||||||||
| Receive | 6 Month London Interbank Offered Rate Semi-Annually | 0.50% Annually | 3/21/2029 | CHF | 1,300,000 | 1,600 | 15,582 | 17,182 | ||||||||||||||||||||
|
|
|
|
|
| |||||||||||||||||||||||
| 567,844 | 70,915 | 638,759 | ||||||||||||||||||||||||||
|
|
|
|
|
| |||||||||||||||||||||||
| Pay | 3 Month Canadian Bankers’ Acceptance Rate Quarterly | 2.50% Semi-Annually | 3/15/2021 | CAD | 15,000,000 | (4,208 | ) | (36,502 | ) | (40,710 | ) | |||||||||||||||||
| Pay | 3 Month London Interbank Offered Rate Quarterly | 2.75% Semi-Annually | 12/21/2020 | USD | 1,100,000 | — | (6,814 | ) | (6,814 | ) | ||||||||||||||||||
| Pay | 3 Month London Interbank Offered Rate Quarterly | 2.75% Semi-Annually | 3/22/2021 | USD | 7,800,000 | (56,430 | ) | 289 | (56,141 | ) | ||||||||||||||||||
| Pay | 6 Month Euro Interbank Offered Rate Semi-Annually | 1.00% Annually | 3/20/2029 | EUR | 8,400,000 | (12,851 | ) | (74,627 | ) | (87,478 | ) | |||||||||||||||||
| Pay | 6 Month London Interbank Offered Rate Semi-Annually | 0.00% Semi-Annually | 3/17/2021 | JPY | 134,300,000 | (1,335 | ) | (542 | ) | (1,877 | ) | |||||||||||||||||
| Pay | 6 Month London Interbank Offered Rate Semi-Annually | 1.25% Semi-Annually | 3/22/2021 | GBP | 38,300,000 | 50,894 | (90,701 | ) | (39,807 | ) | ||||||||||||||||||
| Receive | 3 Month Australian Bank-Bill Reference Rate Quarterly | 3.00% Semi-Annually | 3/14/2029 | NZD | 2,000,000 | (11,479 | ) | 8,475 | (3,004 | ) | ||||||||||||||||||
| Receive | 3 Month Canadian Bankers’ Acceptance Rate Quarterly | 3.00% Semi-Annually | 3/19/2029 | CAD | 3,300,000 | (68,223 | ) | 34,950 | (33,273 | ) | ||||||||||||||||||
| Receive | 3 Month Stockholm Interbank Offered Rate Quarterly | 0.50% Annually | 3/17/2021 | SEK | 243,600,000 | (201,830 | ) | 40,578 | (161,252 | ) | ||||||||||||||||||
| Receive | 6 Month Euro Interbank Offered Rate Semi-Annually | 1.25% Annually | 12/19/2028 | EUR | 900,000 | (7,120 | ) | (14,593 | ) | (21,713 | ) | |||||||||||||||||
| Receive | 6 Month London Interbank Offered Rate Semi-Annually | 0.25% Semi-Annually | 3/17/2021 | JPY | 321,800,000 | (9,590 | ) | (20 | ) | (9,610 | ) | |||||||||||||||||
| Receive | 6 Month Norwegian Interbank Offered Rate Semi-Annually | 2.50% Annually | 3/21/2029 | NOK | 61,800,000 | (159,882 | ) | 71,627 | (88,255 | ) | ||||||||||||||||||
|
|
|
|
|
| |||||||||||||||||||||||
| (482,054 | ) | (67,880 | ) | (549,934 | ) | |||||||||||||||||||||||
|
|
|
|
|
| |||||||||||||||||||||||
| $85,790 | $3,035 | $88,825 | ||||||||||||||||||||||||||
|
|
|
|
|
| |||||||||||||||||||||||
| The accompanying notes are an integral part of these financial statements. | (Continued) |
| AQR Funds | Annual Report | September 2018 | ||||||||||||||
8
Table of Contents
| Schedule of Investments | September 30, 2018 |
| AQR CORE PLUS BOND FUND |
| (a) | Floating rate indices at September 30, 2018 were as follows: |
3 Month Australian Bank-Bill Reference Rate: 1.94% |
3 Month Canadian Bankers’ Acceptance Rate: 2.02% |
3 Month London Interbank Offered Rate: 2.40% |
3 Month Stockholm Interbank Offered Rate: (0.46)% |
6 Month Australian Bank-Bill Reference Rate: 2.14% |
6 Month Euro Interbank Offered Rate: (0.27)% |
6 Month London Interbank Offered Rate: 2.60% |
6 Month Norwegian Interbank Offered Rate: 1.22% |
Futures contracts outstanding as of September 30, 2018:
Exchange Traded
| DESCRIPTION | NUMBER OF CONTRACTS | EXPIRATION DATE | TRADING CURRENCY | NOTIONAL AMOUNT | VALUE AND UNREALIZED APPRECIATION (DEPRECIATION) | |||||||||||
| Long Contracts | ||||||||||||||||
| Euro-BTP | 20 | 12/2018 | EUR | $2,875,689 | $58,723 | |||||||||||
| Euro-Bund | 2 | 12/2018 | EUR | 368,726 | (4,233 | ) | ||||||||||
| U.S. Treasury 2 Year Note | 20 | 12/2018 | USD | 4,214,687 | (9,128 | ) | ||||||||||
|
| |||||||||||||||
| 45,362 | ||||||||||||||||
|
| |||||||||||||||
| Short Contracts |
| |||||||||||||||
| Japan 10 Year Bond | (11 | ) | 12/2018 | JPY | (14,530,804 | ) | 19,993 | |||||||||
| Long Gilt | (19 | ) | 12/2018 | GBP | (2,995,031 | ) | 28,349 | |||||||||
| U.S. Treasury 10 Year Note | (42 | ) | 12/2018 | USD | (4,988,812 | ) | 39,785 | |||||||||
|
| |||||||||||||||
| 88,127 | ||||||||||||||||
|
| |||||||||||||||
| $133,489 | ||||||||||||||||
|
| |||||||||||||||
Forward foreign currency contracts outstanding as of September 30, 2018:
Over the Counter
| CURRENCY PURCHASED | CURRENCY SOLD | COUNTERPARTY | SETTLEMENT DATE | UNREALIZED APPRECIATION (DEPRECIATION) | ||||||||||||||||
| AUD | 424,431 | USD | 304,371 | CITI | 12/19/2018 | $2,618 | ||||||||||||||
| AUD | 636,645 | USD | 456,556 | JPMC | 12/19/2018 | 3,926 | ||||||||||||||
| BRL | 523,200 | USD | 127,120 | CITI** | 12/19/2018 | 1,600 | ||||||||||||||
| BRL | 784,800 | USD | 190,680 | JPMC** | 12/19/2018 | 2,399 | ||||||||||||||
| CAD | 1,903,481 | USD | 1,456,781 | CITI | 12/19/2018 | 19,460 | ||||||||||||||
| CAD | 2,855,220 | USD | 2,185,174 | JPMC | 12/19/2018 | 29,186 | ||||||||||||||
| CLP | 12,000,000 | USD | 18,034 | CITI** | 12/19/2018 | 224 | ||||||||||||||
| CLP | 18,000,000 | USD | 27,051 | JPMC** | 12/19/2018 | 337 | ||||||||||||||
| COP | 100,000,000 | USD | 33,178 | CITI** | 12/19/2018 | 519 | ||||||||||||||
| COP | 150,000,000 | USD | 49,767 | JPMC** | 12/19/2018 | 778 | ||||||||||||||
| CZK | 680,000 | USD | 30,662 | CITI | 12/19/2018 | 128 | ||||||||||||||
| CZK | 1,020,000 | USD | 45,993 | JPMC | 12/19/2018 | 192 | ||||||||||||||
| EUR | 332,538 | USD | 387,405 | CITI | 12/19/2018 | 1,301 | ||||||||||||||
| EUR | 498,802 | USD | 581,103 | JPMC | 12/19/2018 | 1,950 | ||||||||||||||
| GBP | 104,866 | USD | 136,036 | CITI | 12/19/2018 | 1,178 | ||||||||||||||
| GBP | 157,301 | USD | 204,056 | JPMC | 12/19/2018 | 1,765 | ||||||||||||||
| HUF | 31,735,600 | USD | 114,154 | CITI | 12/19/2018 | 556 | ||||||||||||||
| HUF | 47,603,400 | USD | 171,231 | JPMC | 12/19/2018 | 834 | ||||||||||||||
| KRW | 93,453,200 | USD | 83,958 | CITI** | 12/19/2018 | 418 | ||||||||||||||
| The accompanying notes are an integral part of these financial statements. | (Continued) |
| AQR Funds | Annual Report | September 2018 | ||||||||||||||
9
Table of Contents
| Schedule of Investments | September 30, 2018 |
| AQR CORE PLUS BOND FUND |
| CURRENCY PURCHASED | CURRENCY SOLD | COUNTERPARTY | SETTLEMENT DATE | UNREALIZED APPRECIATION (DEPRECIATION) | ||||||||||||||||
| KRW | 140,179,800 | USD | 125,937 | JPMC** | 12/19/2018 | $ 627 | ||||||||||||||
| MXN | 9,283,592 | USD | 478,963 | CITI | 12/19/2018 | 11,022 | ||||||||||||||
| MXN | 13,925,408 | USD | 718,446 | JPMC | 12/19/2018 | 16,532 | ||||||||||||||
| NZD | 90,650 | USD | 59,533 | CITI | 12/19/2018 | 581 | ||||||||||||||
| NZD | 135,975 | USD | 89,300 | JPMC | 12/19/2018 | 873 | ||||||||||||||
| PLN | 304,000 | USD | 82,230 | CITI | 12/19/2018 | 394 | ||||||||||||||
| PLN | 456,000 | USD | 123,345 | JPMC | 12/19/2018 | 591 | ||||||||||||||
| RUB | 9,600,000 | USD | 141,945 | CITI** | 12/19/2018 | 3,365 | ||||||||||||||
| RUB | 14,400,000 | USD | 212,918 | JPMC** | 12/19/2018 | 5,047 | ||||||||||||||
| SEK | 1,106,337 | USD | 122,405 | CITI | 12/19/2018 | 2,960 | ||||||||||||||
| SEK | 1,659,505 | USD | 183,607 | JPMC | 12/19/2018 | 4,439 | ||||||||||||||
| USD | 287,787 | AUD | 394,353 | CITI | 12/19/2018 | 2,554 | ||||||||||||||
| USD | 431,679 | AUD | 591,528 | JPMC | 12/19/2018 | 3,830 | ||||||||||||||
| USD | 40,615 | CAD | 52,270 | CITI | 12/19/2018 | 78 | ||||||||||||||
| USD | 60,924 | CAD | 78,406 | JPMC | 12/19/2018 | 116 | ||||||||||||||
| USD | 1,454,643 | CHF | 1,402,182 | CITI | 12/19/2018 | 14,820 | ||||||||||||||
| USD | 2,181,967 | CHF | 2,103,278 | JPMC | 12/19/2018 | 22,227 | ||||||||||||||
| USD | 14,493 | CZK | 320,000 | CITI | 12/19/2018 | 4 | ||||||||||||||
| USD | 21,740 | CZK | 480,000 | JPMC | 12/19/2018 | 6 | ||||||||||||||
| USD | 6,361,556 | EUR | 5,414,075 | CITI | 12/19/2018 | 33,012 | ||||||||||||||
| USD | 9,542,315 | EUR | 8,121,106 | JPMC | 12/19/2018 | 49,507 | ||||||||||||||
| USD | 360,746 | GBP | 274,400 | CITI | 12/19/2018 | 1,705 | ||||||||||||||
| USD | 541,118 | GBP | 411,600 | JPMC | 12/19/2018 | 2,557 | ||||||||||||||
| USD | 146,984 | IDR | 2,190,000,000 | CITI** | 12/19/2018 | 1,936 | ||||||||||||||
| USD | 220,475 | IDR | 3,285,000,000 | JPMC** | 12/19/2018 | 2,903 | ||||||||||||||
| USD | 225,657 | ILS | 812,000 | CITI | 12/19/2018 | 1,026 | ||||||||||||||
| USD | 338,485 | ILS | 1,218,000 | JPMC | 12/19/2018 | 1,538 | ||||||||||||||
| USD | 179,906 | JPY | 19,920,000 | CITI | 12/19/2018 | 3,438 | ||||||||||||||
| USD | 269,858 | JPY | 29,880,000 | JPMC | 12/19/2018 | 5,156 | ||||||||||||||
| USD | 142,239 | KRW | 157,241,550 | CITI** | 12/19/2018 | 270 | ||||||||||||||
| USD | 213,358 | KRW | 235,862,325 | JPMC** | 12/19/2018 | 405 | ||||||||||||||
| USD | 96,771 | PHP | 5,200,000 | CITI** | 12/19/2018 | 1,198 | ||||||||||||||
| USD | 145,156 | PHP | 7,800,000 | JPMC** | 12/19/2018 | 1,797 | ||||||||||||||
| USD | 6,001 | PLN | 22,000 | CITI | 12/19/2018 | 22 | ||||||||||||||
| USD | 9,002 | PLN | 33,000 | JPMC | 12/19/2018 | 33 | ||||||||||||||
| ZAR | 265,200 | USD | 18,242 | CITI | 12/19/2018 | 314 | ||||||||||||||
| ZAR | 397,800 | USD | 27,364 | JPMC | 12/19/2018 | 471 | ||||||||||||||
|
| |||||||||||||||||||
| Total unrealized appreciation | 266,723 | |||||||||||||||||||
|
| |||||||||||||||||||
| AUD | 433,569 | USD | 316,925 | CITI | 12/19/2018 | (3,327 | ) | |||||||||||||
| AUD | 650,355 | USD | 475,389 | JPMC | 12/19/2018 | (4,991 | ) | |||||||||||||
| BRL | 135,200 | USD | 33,474 | CITI** | 12/19/2018 | (212 | ) | |||||||||||||
| BRL | 202,800 | USD | 50,212 | JPMC** | 12/19/2018 | (318 | ) | |||||||||||||
| CAD | 130,652 | USD | 101,534 | CITI | 12/19/2018 | (207 | ) | |||||||||||||
| CAD | 195,979 | USD | 152,301 | JPMC | 12/19/2018 | (310 | ) | |||||||||||||
| CHF | 507,200 | USD | 527,725 | CITI | 12/19/2018 | (6,909 | ) | |||||||||||||
| CHF | 760,800 | USD | 791,588 | JPMC | 12/19/2018 | (10,365 | ) | |||||||||||||
| CLP | 4,000,000 | USD | 6,103 | CITI** | 12/19/2018 | (17 | ) | |||||||||||||
| CLP | 6,000,000 | USD | 9,155 | JPMC** | 12/19/2018 | (26 | ) | |||||||||||||
| COP | 8,000,000 | USD | 2,712 | CITI** | 12/19/2018 | (16 | ) | |||||||||||||
| COP | 12,000,000 | USD | 4,067 | JPMC** | 12/19/2018 | (23 | ) | |||||||||||||
| EUR | 566,550 | USD | 665,749 | CITI | 12/19/2018 | (3,506 | ) | |||||||||||||
| EUR | 849,823 | USD | 998,623 | JPMC | 12/19/2018 | (5,260 | ) | |||||||||||||
| GBP | 9,534 | USD | 12,504 | CITI | 12/19/2018 | (30 | ) | |||||||||||||
| GBP | 14,301 | USD | 18,757 | JPMC | 12/19/2018 | (44 | ) | |||||||||||||
| ILS | 380,000 | USD | 106,435 | CITI | 12/19/2018 | (1,312 | ) | |||||||||||||
| ILS | 570,000 | USD | 159,652 | JPMC | 12/19/2018 | (1,968 | ) | |||||||||||||
| The accompanying notes are an integral part of these financial statements. | (Continued) |
| AQR Funds | Annual Report | September 2018 | ||||||||||||||
10
Table of Contents
| Schedule of Investments | September 30, 2018 |
| AQR CORE PLUS BOND FUND |
| CURRENCY PURCHASED | CURRENCY SOLD | COUNTERPARTY | SETTLEMENT DATE | UNREALIZED APPRECIATION (DEPRECIATION) | ||||||||||||||||
| INR | 4,194,800 | USD | 58,017 | CITI** | 12/19/2018 | $ (904 | ) | |||||||||||||
| INR | 6,292,200 | USD | 87,026 | JPMC** | 12/19/2018 | (1,356 | ) | |||||||||||||
| JPY | 63,759,200 | USD | 577,265 | CITI | 12/19/2018 | (12,432 | ) | |||||||||||||
| JPY | 95,638,800 | USD | 865,898 | JPMC | 12/19/2018 | (18,649 | ) | |||||||||||||
| KRW | 23,309,600 | USD | 21,088 | CITI** | 12/19/2018 | (42 | ) | |||||||||||||
| KRW | 34,964,400 | USD | 31,631 | JPMC** | 12/19/2018 | (63 | ) | |||||||||||||
| NZD | 212,550 | USD | 142,121 | CITI | 12/19/2018 | (1,166 | ) | |||||||||||||
| NZD | 318,825 | USD | 213,182 | JPMC | 12/19/2018 | (1,752 | ) | |||||||||||||
| PLN | 332,800 | USD | 90,948 | CITI | 12/19/2018 | (497 | ) | |||||||||||||
| PLN | 499,200 | USD | 136,423 | JPMC | 12/19/2018 | (745 | ) | |||||||||||||
| SGD | 456,000 | USD | 335,075 | CITI | 12/19/2018 | (931 | ) | |||||||||||||
| SGD | 684,000 | USD | 502,613 | JPMC | 12/19/2018 | (1,397 | ) | |||||||||||||
| USD | 513,108 | AUD | 711,960 | CITI | 12/19/2018 | (1,850 | ) | |||||||||||||
| USD | 769,661 | AUD | 1,067,940 | JPMC | 12/19/2018 | (2,775 | ) | |||||||||||||
| USD | 367,224 | BRL | 1,531,200 | CITI** | 12/19/2018 | (9,488 | ) | |||||||||||||
| USD | 550,835 | BRL | 2,296,800 | JPMC** | 12/19/2018 | (14,233 | ) | |||||||||||||
| USD | 325,917 | CAD | 425,779 | CITI | 12/19/2018 | (4,295 | ) | |||||||||||||
| USD | 488,884 | CAD | 638,681 | JPMC | 12/19/2018 | (6,443 | ) | |||||||||||||
| USD | 130,719 | CHF | 127,416 | CITI | 12/19/2018 | (118 | ) | |||||||||||||
| USD | 196,078 | CHF | 191,124 | JPMC | 12/19/2018 | (177 | ) | |||||||||||||
| USD | 83,811 | CLP | 56,000,000 | CITI** | 12/19/2018 | (1,397 | ) | |||||||||||||
| USD | 125,716 | CLP | 84,000,000 | JPMC** | 12/19/2018 | (2,096 | ) | |||||||||||||
| USD | 14,422 | CZK | 320,000 | CITI | 12/19/2018 | (67 | ) | |||||||||||||
| USD | 21,633 | CZK | 480,000 | JPMC | 12/19/2018 | (101 | ) | |||||||||||||
| USD | 2,414,084 | EUR | 2,070,160 | CITI | 12/19/2018 | (5,739 | ) | |||||||||||||
| USD | 3,621,120 | EUR | 3,105,238 | JPMC | 12/19/2018 | (8,612 | ) | |||||||||||||
| USD | 250,936 | GBP | 193,600 | CITI | 12/19/2018 | (2,381 | ) | |||||||||||||
| USD | 376,406 | GBP | 290,402 | JPMC | 12/19/2018 | (3,573 | ) | |||||||||||||
| USD | 1,446 | HUF | 400,000 | CITI | 12/19/2018 | — | ||||||||||||||
| USD | 2,168 | HUF | 600,000 | JPMC | 12/19/2018 | — | ||||||||||||||
| USD | 47,469 | IDR | 730,000,000 | CITI** | 12/19/2018 | (881 | ) | |||||||||||||
| USD | 71,203 | IDR | 1,095,000,000 | JPMC** | 12/19/2018 | (1,321 | ) | |||||||||||||
| USD | 300,398 | KRW | 334,555,250 | CITI** | 12/19/2018 | (1,661 | ) | |||||||||||||
| USD | 450,597 | KRW | 501,832,875 | JPMC** | 12/19/2018 | (2,492 | ) | |||||||||||||
| USD | 16,270 | MXN | 313,198 | CITI | 12/19/2018 | (260 | ) | |||||||||||||
| USD | 24,405 | MXN | 469,802 | JPMC | 12/19/2018 | (391 | ) | |||||||||||||
| USD | 445,783 | NOK | 3,708,000 | CITI | 12/19/2018 | (11,393 | ) | |||||||||||||
| USD | 668,674 | NOK | 5,562,000 | JPMC | 12/19/2018 | (17,091 | ) | |||||||||||||
| USD | 35,692 | PLN | 132,000 | CITI | 12/19/2018 | (184 | ) | |||||||||||||
| USD | 53,539 | PLN | 198,000 | JPMC | 12/19/2018 | (276 | ) | |||||||||||||
| USD | 69,993 | RUB | 4,800,000 | CITI** | 12/19/2018 | (2,662 | ) | |||||||||||||
| USD | 104,989 | RUB | 7,200,000 | JPMC** | 12/19/2018 | (3,994 | ) | |||||||||||||
| USD | 1,875,726 | SEK | 16,932,613 | CITI | 12/19/2018 | (42,988 | ) | |||||||||||||
| USD | 2,813,586 | SEK | 25,398,925 | JPMC | 12/19/2018 | (64,486 | ) | |||||||||||||
| USD | 110,081 | ZAR | 1,594,400 | CITI | 12/19/2018 | (1,482 | ) | |||||||||||||
| USD | 165,121 | ZAR | 2,391,600 | JPMC | 12/19/2018 | (2,223 | ) | |||||||||||||
|
| |||||||||||||||||||
| Total unrealized depreciation |
| (295,905 | ) | |||||||||||||||||
|
| |||||||||||||||||||
| Net unrealized depreciation |
| $(29,182 | ) | |||||||||||||||||
|
| |||||||||||||||||||
| ** | Non-deliverable forward. |
| The accompanying notes are an integral part of these financial statements. | (Continued) |
| AQR Funds | Annual Report | September 2018 | ||||||||||||||
11
Table of Contents
| Schedule of Investments | September 30, 2018 |
| AQR CORE PLUS BOND FUND |
AUD - Australian Dollar
BRL - Brazilian Real
CAD - Canadian Dollar
CHF - Swiss Franc
CLP - Chilean Peso
COP - Colombian Peso
CZK - Czech Republic Koruna
EUR - Euro
GBP - British Pound
HUF - Hungarian Forint
IDR - Indonesian Rupiah
ILS - Israeli Shekel
INR - Indian Rupee
JPY - Japanese Yen
KRW - Korean Won
MXN - Mexican Peso
NOK - Norwegian Krone
NZD - New Zealand Dollar
PHP - Philippine Peso
PLN - Poland Zloty
RUB - Russian Ruble
SEK - Swedish Krona
SGD - Singapore Dollar
USD - United States Dollar
ZAR - South African Rand
Collateral pledged to, or (received from), each counterparty at September 30, 2018 was as follows:
| COUNTERPARTY | OVER THE COUNTER | EXCHANGE TRADED/ EXCHANGE CLEARED | TOTAL | |||||||||
| CITG | ||||||||||||
| Cash | $— | $(171,278 | ) | $(171,278 | ) | |||||||
| ||||||||||||
| CITI | ||||||||||||
| Cash | 390,000 | — | 390,000 | |||||||||
| ||||||||||||
| CRSU | ||||||||||||
| Cash | — | 214,970 | 214,970 | |||||||||
| ||||||||||||
| JPMC | ||||||||||||
| Cash | 1,252,682 | — | 1,252,682 | |||||||||
| ||||||||||||
| JPMS | ||||||||||||
| Cash | — | 4,034,692 | 4,034,692 | |||||||||
| ||||||||||||
The following abbreviations are used for counterparty descriptions:
CITG - Citigroup Global Markets, Inc.
CITI - Citibank NA
CRSU - Credit Suisse Securities (USA) LLC
JPMC - J.P. Morgan Chase Bank NA
JPMS - J.P. Morgan Securities LLC
| The accompanying notes are an integral part of these financial statements. |
| AQR Funds | Annual Report | September 2018 | ||||||||||||||
12
Table of Contents
| Statement of Assets and Liabilities | September 30, 2018 |
| AQR CORE PLUS BOND FUND | ||||
| ASSETS: |
| |||
| Investments in securities of unaffiliated issuers, at cost | $ | 128,872,711 | ||
| Investments in securities of unaffiliated issuers, at value | $ | 127,559,111 | ||
| Cash | 133,502 | |||
| Cash denominated in foreign currencies‡ | 88,725 | |||
| Unrealized appreciation on forward foreign currency exchange contracts | 266,723 | |||
| Due from broker | 1,642,682 | |||
| Deposits with brokers for centrally cleared swaps (unamortized upfront payments, $454,054) | 4,458,969 | |||
| Deposits with brokers for futures contracts | 240,595 | |||
| Variation margin on centrally cleared swaps | 11,539 | |||
| Receivables: | ||||
Securities sold | 1,674,692 | |||
Securities sold—delayed delivery securities | 1,858,430 | |||
Foreign tax reclaims | 35,911 | |||
Dividends and interest | 765,549 | |||
Due from Investment Adviser | 1,396 | |||
| Prepaid expenses | 57,629 | |||
| Total Assets | 138,795,453 | |||
| LIABILITIES: |
| |||
| TBA sale commitments, at value (proceeds $1,858,430) | 1,857,943 | |||
| Unrealized depreciation on forward foreign currency exchange contracts | 295,905 | |||
| Variation margin on futures contracts | 48,191 | |||
| Payables: | ||||
Securities purchased | 3,157,547 | |||
Securities purchased—delayed delivery securities | 32,122,406 | |||
Accrued distribution fees—Class N | 115 | |||
| Other accrued expenses and liabilities | 85,259 | |||
| Total Liabilities | 37,567,366 | |||
| Net Assets | $ | 101,228,087 | ||
| NET ASSETS CONSIST OF: |
| |||
| Paid-in capital ($0.001 par value common stock, unlimited authorized shares) | $ | 102,377,653 | ||
| Total distributable earnings (loss) | (1,149,566 | ) | ||
| Net Assets | $ | 101,228,087 | ||
| NET ASSETS: | ||||
| Class I | $ | 3,707,037 | ||
| Class N | 559,830 | |||
| Class R6 | 96,961,220 | |||
| SHARES OUTSTANDING: | ||||
| Class I | 375,031 | |||
| Class N | 56,638 | |||
| Class R6 | 9,809,080 | |||
| NET ASSET VALUE: | ||||
| Class I | $ | 9.88 | ||
| Class N | $ | 9.88 | ||
| Class R6 | $ | 9.88 | ||
‡ Cash denominated in foreign currencies at cost | $ | 88,240 | ||
| The accompanying notes are an integral part of these financial statements. |
| AQR Funds | Annual Report | September 2018 | ||||||||||||||
13
Table of Contents
| Statement of Operations | September 30, 2018 |
| AQR CORE PLUS BOND FUND | ||||
| FOR THE PERIOD 04/05/18*-09/30/18 | ||||
| INVESTMENT INCOME: |
| |||
| Dividend income: | ||||
Unaffiliated issuers | $101,656 | |||
Interest income† | 1,210,387 | |||
| Total Income | 1,312,043 | |||
| EXPENSES: |
| |||
Investment advisory fees | 157,780 | |||
Custody fees | 12,093 | |||
Administration & accounting fees | 8,501 | |||
Legal fees | 4,813 | |||
Audit & tax fees | 47,155 | |||
Shareholder reporting fees | 11,014 | |||
Transfer agent fees | 9,827 | |||
Trustee fees | 2,136 | |||
Offering costs | 3,382 | |||
Distribution fees—Class N | 637 | |||
Registration fees | 39,887 | |||
Pricing fee | 1,544 | |||
Other expenses | 1,317 | |||
| Total Expenses | 300,086 | |||
| Less fee waivers and/or reimbursements | (115,612 | ) | ||
| Net Expenses | 184,474 | |||
| Net Investment Income (Loss) | 1,127,569 | |||
| REALIZED GAIN (LOSS) AND CHANGE IN UNREALIZED APPRECIATION (DEPRECIATION): | ||||
| Net realized gain (loss) from: | ||||
Transactions in investment securities of unaffiliated issuers | (1,513,323 | ) | ||
Settlement of foreign currency and foreign currency transactions | (95,863 | ) | ||
Settlement of forward foreign currency contracts | 1,465,896 | |||
Expiration or closing of futures contracts | (285,946 | ) | ||
TBA sale commitments | 9,545 | |||
Expiration or closing of swap contracts | 557,690 | |||
| Net realized gain (loss) | 137,999 | |||
| Net change in unrealized appreciation (depreciation) on: | ||||
Investment securities of unaffiliated issuers | (1,313,600 | ) | ||
Foreign currency and foreign currency transactions | 93 | |||
Forward foreign currency exchange contracts | (29,182 | ) | ||
Futures contracts | 133,489 | |||
TBA sale commitments | 487 | |||
Swap contracts | (3,015 | ) | ||
| Net change in unrealized appreciation (depreciation) | (1,211,728 | ) | ||
| Net realized gain (loss) and net change in unrealized appreciation (depreciation) | (1,073,729 | ) | ||
| Net increase (decrease) in net assets resulting from operations | $53,840 | |||
† Net of foreign taxes withheld of | $1,169 | |||
| * | Commencement of operations. |
| The accompanying notes are an integral part of these financial statements. |
| AQR Funds | Annual Report | September 2018 | ||||||||||||||
14
Table of Contents
| Statement of Changes in Net Assets | September 30, 2018 |
| AQR CORE PLUS BOND FUND | ||||
| FOR THE PERIOD 04/05/18*-09/30/18 | ||||
| OPERATIONS: |
| |||
Net investment income (loss) | $ | 1,127,569 | ||
Net realized gain (loss) | 137,999 | |||
Net change in unrealized appreciation (depreciation) | (1,211,728 | ) | ||
Net increase (decrease) in net assets resulting from operations | 53,840 | |||
| DISTRIBUTIONS TO SHAREHOLDERS(a): |
| |||
Class I | (38,811 | ) | ||
Class N | (5,803 | ) | ||
Class R6 | (1,176,077 | ) | ||
Total distributions | (1,220,691 | ) | ||
| CAPITAL TRANSACTIONS: |
| |||
| CLASS I | ||||
Proceeds from shares sold | 3,858,053 | |||
Reinvestment of distributions | 21,167 | |||
Cost of shares redeemed | (141,059 | ) | ||
Net increase (decrease) from capital transactions | 3,738,161 | |||
| CLASS N | ||||
Proceeds from shares sold | 565,506 | |||
Reinvestment of distributions | 411 | |||
Net increase (decrease) from capital transactions | 565,917 | |||
| CLASS R6 | ||||
Proceeds from shares sold | 98,089,999 | |||
Reinvestment of distributions | 861 | |||
Net increase (decrease) from capital transactions | 98,090,860 | |||
Net increase (decrease) in net assets resulting from capital transactions | 102,394,938 | |||
| Total increase (decrease) in net assets | 101,228,087 | |||
| NET ASSETS: |
| |||
Beginning of period | — | |||
End of period | $ | 101,228,087 | ||
| The accompanying notes are an integral part of these financial statements. | (continued on p. 14) |
| AQR Funds | Annual Report | September 2018 | ||||||||||||||
15
Table of Contents
| Statement of Changes in Net Assets | September 30, 2018 |
| AQR CORE PLUS BOND FUND | ||||
| FOR THE PERIOD 04/05/18*-09/30/18 | ||||
| CHANGES IN SHARES OUTSTANDING: |
| |||
| CLASS I |
| |||
Shares outstanding, beginning of period | — | |||
Shares sold | 387,044 | |||
Shares issued on reinvestment of distributions | 2,134 | |||
Shares redeemed | (14,147 | ) | ||
Shares outstanding, end of period | 375,031 | |||
| CLASS N |
| |||
Shares outstanding, beginning of period | — | |||
Shares sold | 56,597 | |||
Shares issued on reinvestment of distributions | 41 | |||
Shares outstanding, end of period | 56,638 | |||
| CLASS R6 |
| |||
Shares outstanding, beginning of period | — | |||
Shares sold | 9,808,993 | |||
Shares issued on reinvestment of distributions | 87 | |||
Shares outstanding, end of period | 9,809,080 | |||
| * | Commencement of operations. |
| The accompanying notes are an integral part of these financial statements. |
| AQR Funds | Annual Report | September 2018 | ||||||||||||||
16
Table of Contents
[Intentionally Left Blank]
Table of Contents
| Financial Highlights | September 30, 2018 |
| PER SHARE OPERATING PERFORMANCE | ||||||||||||||||||||||||||||
| Change in Net Assets Resulting from Operations1 | Less Dividends and Distributions | |||||||||||||||||||||||||||
| Net Asset Value, Beginning of Period | Net Investment Income (Loss) | Net Realized and Unrealized Gain (Loss) | Net Increase (Decrease) in Net Asset Value from Operations | Distributions from Net Investment Income | Distributions from Net Realized Gains | Total Distributions | ||||||||||||||||||||||
| AQR CORE PLUS BOND FUND CLASS I |
| |||||||||||||||||||||||||||
| FOR THE PERIOD 4/05/186-9/30/18 | $ | 10.00 | 0.11 | (0.11 | ) | — | (0.12 | ) | — | (0.12 | ) | |||||||||||||||||
| AQR CORE PLUS BOND FUND CLASS N |
| |||||||||||||||||||||||||||
| FOR THE PERIOD 4/05/186-9/30/18 | $ | 10.00 | 0.10 | (0.11 | ) | (0.01 | ) | (0.11 | ) | — | (0.11 | ) | ||||||||||||||||
| AQR CORE PLUS BOND FUND CLASS R6 |
| |||||||||||||||||||||||||||
| FOR THE PERIOD 4/05/186-9/30/18 | $ | 10.00 | 0.11 | (0.11 | ) | — | (0.12 | ) | — | (0.12 | ) | |||||||||||||||||
| * | Annualized for periods less than one year. |
| 1 | Per share net investment income (loss) and net realized and unrealized gain (loss) are based on average shares outstanding. |
| 2 | Total investment return is calculated assuming an initial investment made at the net asset value at the beginning of the period, reinvestment of all dividends and distributions at net asset value during the period and redemption on the last day of the period and is not annualized. |
| 3 | Includes adjustments in accordance with accounting principles generally accepted in the United States of America and as such, the net asset value for financial reporting purposes and the returns based upon those net asset values may differ from the net asset value and returns for shareholder transactions. |
| 4 | Ratios do not include the impact of the expenses of the underlying funds in which the Fund invests. |
| 5 | Portfolio turnover is not annualized. |
| 6 | Commencement of operations. |
| 7 | Certain expenses incurred by the Fund were not annualized for the period. |
| The accompanying notes are an integral part of these financial statements. |
| AQR Funds | Annual Report | September 2018 | ||||||||||||||
18
Table of Contents
| Financial Highlights | September 30, 2018 |
| RATIOS/SUPPLEMENTAL DATA | ||||||||||||||||||||||||||||||
| Ratios to Average Net Assets of:* | ||||||||||||||||||||||||||||||
| Net Asset Value, End of Period | Total Return2,3 | Net Assets, End of Period (000’s) | Expenses, Before Reimbursements and/or Waivers4 | Expenses, Net of Reimbursements and/or Waivers4 | Net Investment Income (Loss) | Portfolio Turnover Rate5 | ||||||||||||||||||||||||
| �� | ||||||||||||||||||||||||||||||
| $ | 9.88 | (0.02 | )% | $3,707 | 0.60 | %7 | 0.42 | % | 2.26 | % | 439 | % | ||||||||||||||||||
| $ | 9.88 | (0.12 | )% | $560 | 0.79 | %7 | 0.62 | % | 2.04 | % | 439 | % | ||||||||||||||||||
| $ | 9.88 | 0.00 | % | $ | 96,961 | 0.54 | %7 | 0.37 | % | 2.29 | % | 439 | % | |||||||||||||||||
| The accompanying notes are an integral part of these financial statements. |
| AQR Funds | Annual Report | September 2018 | ||||||||||||||
19
Table of Contents
| Notes to Financial Statements | September 30, 2018 |
1. Organization
AQR Funds (the “Trust”), was organized as a Delaware statutory trust on September 4, 2008. The Trust is an open-end management investment company, registered under the Investment Company Act of 1940, as amended (the “1940 Act”). As of September 30, 2018, the Trust consists of thirty-nine active series, AQR Core Plus Bond Fund (the “Fund”) is presented in this book. The remaining active series are reported in separate books. AQR Capital Management, LLC (the “Adviser”) serves as the investment adviser of each Fund.
The Fund commenced operations on April 5, 2018.
The investment objective of the Fund is to seek total return. The Fund offers Class I, N and R6 shares.
2. Significant Accounting Policies
The Fund is an investment company and applies specialized accounting and reporting guidance of the Financial Accounting Standards Board Accounting Standard Codification Topic 946 Financial Services — Investment Companies. The accounting policies are in conformity with accounting principles generally accepted in the United States of America (“GAAP”). Certain prior period amounts have been reclassified to reflect current period presentation.
Use of Estimates: The preparation of the financial statements in conformity with GAAP requires the Adviser to make estimates and assumptions that affect the fair value of investments, the reported amounts of assets and liabilities and disclosure of contingent assets and liabilities, if any, at the date of the financial statements and the reported amounts of increases and decreases in net assets from operations during the reporting period. Actual results could differ from those estimates and such differences could be material.
Valuation of Investments: All securities and other investments are recorded at their estimated fair value, as described in Note 4.
Cash: Cash comprises U.S. Dollar and foreign currency deposits held at a custodian bank(s) which may exceed insured limits. The Fund is subject to risk to the extent that the institutions may be unable to fulfill their obligations.
Due to/from Brokers: Due to/from brokers represents cash balances on deposit with, or cash balances owed to, the Fund’s prime brokers and counterparties. The Fund is subject to credit risk should the prime brokers and counterparties be unable to meet their obligations to the Fund.
Foreign Currency Translation: The books and records of the Fund are maintained in U.S. Dollars. The Fund’s assets and liabilities in foreign currencies are translated into U.S. Dollars at the prevailing exchange rate at the valuation date. Transactions denominated in foreign currencies are translated into U.S. Dollars at the prevailing exchange rate on the date of the transaction. The Fund’s income earned and expense incurred in foreign denominated currencies are translated into U.S. Dollars at the prevailing exchange rate on the date of such activity.
The Fund does not isolate that portion of the results of operations arising from changes in the foreign exchange rates on investments and derivatives from the fluctuations that result from changes in the market prices of investments and derivatives held or sold during the period. Accordingly, such foreign currency gains (losses) are included in the reported net realized gain (loss) from transactions in investment securities and derivatives and net change in unrealized appreciation (depreciation) on investment securities and derivatives on the Statement of Operations.
Realized gains (losses) from settlement of foreign currency and foreign currency transactions reported on the Statement of Operations arise from the disposition of foreign currency and a change between the amounts of dividends, interest and foreign withholding taxes recorded on the Fund’s books on the transaction date and the U.S. Dollar equivalent of the amounts actually received or paid. Changes in unrealized appreciation (depreciation) on foreign currency and foreign currency translations reported on the Statement of Operations arise from changes (due to the changes in the exchange rate) in the value of foreign currency and assets and liabilities (other than investments) denominated in foreign currencies, which are held at period end.
Investment Transactions and Related Income: Investment transactions are accounted for on trade date (the date the order to buy or sell is executed). Realized gains and losses on investment transactions are calculated on a specifically identified cost basis. Interest income is determined on the basis of coupon interest accrued using the effective interest method adjusted for amortization of premiums and accretion of discounts using the effective yield method. Interest income, including amortization and accretion of premiums and discounts on debt securities, is recognized on the accrual basis.
Multi-class Operations: Each class of shares offered by the Trust has equal rights as to earnings, assets and voting privileges, except that each class may bear different sub-transfer agency and distribution fees and shareholders of a class have exclusive voting rights regarding any matter relating solely to that class of shares. Income, non-class specific expenses, realized and unrealized gains and losses are allocated daily to each class of shares based upon the proportion of relative net assets at the beginning of each day. The Fund is charged for those expenses that are directly attributable to each Fund. Trust level expenses are allocated on the ratio of average net assets or other reasonable methodology.
| AQR Funds | Annual Report | September 2018 | ||||||||||||||
20
Table of Contents
| Notes to Financial Statements | September 30, 2018 |
The Fund records distributions received in excess of income from underlying investments as a reduction of cost of investments and/or realized gain. Such amounts are based on estimates (if actual amounts are not available) and actual amounts of income, realized gain and return of capital may differ from the estimated amounts. The Fund adjusts the estimated amounts of components of distributions (and consequently net investment income) as necessary once the issuers provide information about the actual composition of the distributions.
The Fund may be subject to foreign taxes on income, capital gains on investments or currency repatriation, a portion of which may be recoverable. The Fund will accrue such taxes and recoveries as applicable, based upon their current interpretation of tax rules and regulations that exist in the markets in which they invest.
Offering Cost: Offering costs, including professional fees, printing fees and initial registration, are amortized over a period not longer than twelve months from the date the Fund commenced operations.
Federal Income Taxes: The Fund is treated as a separate taxable entity for federal income tax purposes. The Fund intends to qualify as a “regulated investment company” under Subchapter M of the Internal Revenue Code of 1986, as amended (the “Code”). If so qualified, the Fund will not be subject to federal income tax to the extent it distributes substantially all of its taxable net investment income and capital gains, if applicable, to shareholders. Accordingly no provision for Federal income tax is necessary.
The Adviser evaluates tax positions taken or expected to be taken in the course of preparing the Fund tax returns to determine whether the tax positions are “more-likely-than-not” of being sustained by the applicable tax authority. Tax positions deemed to meet the more-likely-than-not threshold would be recorded as a tax benefit or expense in the current year. The Fund is required to analyze all open tax years. Open tax years are those years that are open for examination by the relevant income taxing authority. The Fund has concluded that there is no tax liability/benefit resulting from uncertain income tax positions taken or expected to be taken. The Fund is not aware of any tax positions for which it is reasonably possible that the total amounts of unrecognized tax expense will materially change in the next twelve months. As of September 30, 2018, the Fund had no examinations in progress.
Distributions to Shareholders: Distributions to shareholders are recorded on the ex-dividend date. Distribution from net investment income are generally declared and paid monthly. Net realized capital gains, if any, are distributed by the Fund at least annually. Income and capital gain distributions will be determined in accordance with federal income tax regulations which may differ from GAAP. Differences may be permanent or temporary. Permanent differences are reclassified among capital accounts in the financial statements to reflect their tax character. Temporary differences arise when certain items of income, expense, gain, or loss are recognized in different periods for financial statement and tax purposes. These differences will reverse at some time in the future. Differences in classification may also result from the treatment of short-term gains as ordinary income for tax purposes. As a result, income dividends and capital gain distributions declared during a fiscal period may differ significantly from the net investment income (loss) and realized gain (loss) reported on the Fund financial statements presented under GAAP.
Distributions classified as a tax basis return of capital, if any, are reflected on the Statement of Changes in Net Assets and has been recorded to paid in capital.
Indemnification: In the normal course of business, the Fund may enter into various agreements that provide for general indemnifications. The Fund’s maximum exposure under these arrangements is unknown as any potential exposure involves future claims that may be made against the Fund. However, based on experience, the Fund expects the risk of loss to be remote.
3. Securities and Other Investments
Limited Purpose Cash Investment Fund: The Fund may invest in the Limited Purpose Cash Investment Fund (the “LPCI Fund”), which is managed by UBS Asset Management (Americas) Inc. (“UBS AM”). The LPCI Fund is a registered investment company under the 1940 Act and is subject to the money market regulations as prescribed in Rule 2a-7 of the 1940 Act. Pursuant to the LPCI Fund’s eligibility requirements, shares of the LPCI Fund are only available for sale to the Adviser and funds advised by the Adviser. Those Funds investing in the LPCI Fund indirectly bear their share of the advisory and operating expenses borne by the LPCI Fund. Section 2a-3 of the 1940 Act defines an affiliated person as, among other things, a company in which a Fund owns at least 5% of the outstanding voting securities. The LPCI Fund may be considered an affiliated person of the Fund in the Trust. However, the Fund does not invest in the LPCI Fund for the purpose of exercising significant influence over its management, board or policies. A summary of transactions with each affiliated person is included in the Schedule of Investments, if applicable.
Futures Contracts: The Fund invests in futures contracts as part of their primary investment strategy and to equitize its cash flows. Investments in futures may increase or decrease exposure to a particular market. In the event of a bankruptcy or insolvency of a futures commission merchant that holds margin on behalf of the Fund, the Fund may not receive the return of the entire margin owed to the Fund, potentially resulting in a loss. A change in market value of an open futures contract is recorded in the Statement of Operations as net change in unrealized appreciation (depreciation) on futures contracts. A realized gain (loss) represents the difference between the value of the contract at the time it was opened and the value at the time it was closed or expired, and is reported in the Statement of Operations. The use of long futures contracts subjects the Fund to risk of loss in excess of the variation margin on the Statement of Assets and Liabilities. The use of short futures
| AQR Funds | Annual Report | September 2018 | ||||||||||||||
21
Table of Contents
| Notes to Financial Statements | September 30, 2018 |
contracts subjects the Fund to unlimited risk of loss. Futures contracts outstanding at period end, if any, are listed after Schedule of Investments.
Forward Foreign Currency Exchange Contracts: The Fund buys and sells forward foreign currency exchange contracts, which are agreements between two parties to buy and sell currencies at a set price on a future date. These contracts are used to protect against a decline in value relative to the U.S. Dollar of the currencies in which portfolio securities are denominated or quoted (or an increase in the value of a currency in which securities that a Fund intends to buy are denominated, when a Fund holds cash reserves and short term investments), or for other investment purposes. The market value of the contract will fluctuate with changes in currency exchange rates. The contract is marked to market daily and the change in market value is recorded as unrealized appreciation or depreciation. When the contract is closed, the Fund records a realized gain or loss equal to the difference between the value of the contract at the time it was opened and the value at the time it was closed. The Fund could be exposed to risk if the value of the currency changes unfavorably, if the counterparties to the contracts are unable to meet the terms of their contracts or if the Fund is unable to enter into a closing position. Non-deliverable forward foreign currency exchange contracts are settled with the counterparty in U.S. Dollars without the delivery of foreign currency. Forward foreign currency exchange contracts outstanding at period end, if any, are listed after Schedule of Investments.
Swap Contracts: The Fund engages in various swap transactions to manage risks within their portfolios or as alternatives to direct investments. Swap transactions may be privately negotiated in the over-the-counter (“OTC”) market where payments are settled through direct payments between a Fund and the counterparty. By contrast, certain swap transactions are subject to mandatory central clearing (“centrally cleared swaps”). These swaps are executed through a derivatives clearing member (“DCM”), acting in an agency capacity, and submitted to a central counterparty (“CCP”), in which case all payments are settled with the CCP through the DCM. For centrally cleared swaps, the Schedule of Investments include the cumulative appreciation (depreciation), while only the current day’s variation margin is reported within the Statement of Assets and Liabilities. For credit default and interest rate contracts, an up-front payment received by a Fund is recorded as a liability and an up-front payment made by a Fund is recorded as an asset on the Fund’s Statement of Assets and Liabilities. Up-front payments are amortized over the term of the contract. If there is no up-front payment or receipt, market value will equal unrealized appreciation (depreciation). Periodic payments received (paid) by a Fund are recorded as realized gain (loss) from the expiration or closing of swap contracts in the Statement of Operations. The Fund uses of swap contracts create additional risks beyond those that would exist if the Fund invested in the underlying positions directly.
Credit Default Swap Contracts: The Fund enters into credit default swap contracts to provide a measure of protection against risk of loss following a default, or other credit event in respect of issuers within an underlying index or a single issuer, or to gain credit exposure to an underlying index or issuer. In a credit default contract, the protection buyer typically makes an up-front payment and a periodic stream of payments to a counterparty, the protection seller, in exchange for the right to receive a contingent payment upon the occurrence of a credit event on the reference obligation or all other equally ranked obligations of the reference entity. Credit events are contract specific but may include bankruptcy, failure to pay, restructuring and obligation acceleration. The credit default contracts are marked to market daily and the change, if any, is recorded as an unrealized gain or loss. Variation margin is accounted for as unrealized appreciation or depreciation until the contract is closed, at which time the gains or losses are realized. Upon the occurrence of a credit event, the difference between the par value and market value of the reference obligation, net of any proportional amount of the up-front payment, is recorded as a realized gain or loss on swap contracts in the Statement of Operations.
Implied credit spreads are used to determine the value of credit default swap contracts and reflect the cost of buying/selling protection, which may include up-front payments made to enter into the contract. Therefore, higher spreads indicate a greater likelihood that a seller will be obligated to perform (i.e., make payment) under the swap contract. Implied credit spreads for credit default swaps on credit indexes are linked to the weighted average spread across the underlying reference obligations included in a particular index.
Risks of loss may exceed amounts recognized on the Statement of Assets and Liabilities. The Fund’s maximum risk of loss from counterparty risk, either as the protection seller or as the protection buyer, is the fair value of the contract. This risk may be mitigated by having a master netting arrangement between the Fund and the counterparty. The central clearing house acts as the counterparty to each centrally cleared swap transaction, therefore credit risk is limited to the failure of the clearing house. Where a Fund is a seller of protection, the maximum potential amount of future payments the Fund may be required to make is equal to the notional amount of the relevant credit default contract. The Fund’s risk of loss associated with these instruments may exceed their value, as recorded in the Statement of Assets and Liabilities. Credit default contracts outstanding, including their respective notional amounts at period end, if any, are listed after Schedule of Investments.
Interest Rate Swaps: The Fund enters into interest rate swaps as part of their investment strategy. Interest rate swaps generally involve agreements to exchange fixed and floating payment obligations, without the exchange of the underlying notional amounts. Interest rate swap agreements are privately negotiated in the OTC market or may be executed in a multilateral or other trade facility platform, such as a registered exchange (centrally cleared swaps). Periodic payments received (paid) by the Fund are recorded as realized gains (losses). Interest rate swaps are marked to market daily and the change is recorded as unrealized gain (loss) on swap contracts in the Statement of Operations. The Fund’s risk of loss associated with these instruments may exceed their value, as recorded in the Statement of Assets and Liabilities. Non-deliverable interest rate swap contracts are settled with the counterparty in U.S. Dollars without the delivery of foreign currency. Centrally cleared interest rate swaps may have forward effective dates. The amortization of the upfront premiums (if applicable) and payments related to these swap
| AQR Funds | Annual Report | September 2018 | ||||||||||||||
22
Table of Contents
| Notes to Financial Statements | September 30, 2018 |
contracts begin on the effective date of the contract. Interest rate contracts outstanding, including their respective notional amounts at period end, if any, are listed after Schedule of Investments.
Delayed Delivery Securities: During the period, the Fund transacted in securities on a delayed delivery basis. Payment and delivery may take place after the customary settlement period for that security. The price of the underlying securities and the date when the securities will be delivered and paid for are fixed at the time the transaction is negotiated. The securities purchased on a delayed delivery basis are identified as such in the Fund’s Schedule of Investments. The Funds may receive compensation for interest forgone in the purchase of a delayed delivery security. With respect to purchase commitments, the Fund identified securities as segregated in their records with a value at least equal to the amount of the commitment. Losses may arise due to changes in the value of the underlying securities or if the counterparty does not perform under the contract terms.
To-Be-Announced Commitments: The Fund may invest in To-Be-Announced (“TBA”) commitments. TBA commitments are forward agreements for the purchase or sale of mortgage-backed securities for a fixed price, with payment and delivery on an agreed upon future settlement date. The term TBA is derived from the fact that the actual mortgage-backed securities that will be delivered to fulfill a TBA commitment are not designated at the time the trade is made, however delivered securities must meet specified terms, including issuer, rate and mortgage terms. The actual pool of mortgage-backed securities to be delivered is announced 48 hours prior to the established trade settlement date. Settlement of TBA commitments can occur in two ways: i) taking or making delivery of mortgage pools/securities; or ii) pairing-off with an offsetting trade for cash settlement.
Investing in TBA commitments, which are accounted for as purchases and sales transactions, involve a risk of loss due to changes in the value of the security prior to the settlement date as well as the risk that the counterparty to the transaction will not perform its obligations. The Fund is subject to this risk whether or not the Fund takes delivery of the positions on the settlement date for a transaction. TBA commitments outstanding at period end, if any, are disclosed in the Fund’s Schedule of Investments.
Master Agreements: The Fund is party to master netting arrangements with counterparties (“Master Agreements”). Master Agreements govern the terms of certain like transactions, and reduce the counterparty risk associated with relevant transactions by specifying payment netting mechanisms across multiple transactions and providing standardization that improves legal certainty. Since different types of transactions have different mechanics and are sometimes traded by different legal entities of a particular counterparty organization, each type of transaction may be covered by a different Master Agreement, resulting in the need for multiple Master Agreements with a counterparty and its affiliates.
As the Master Agreements are specific to unique operations of different asset types, they allow the Fund to i.) close out and net their total exposure to a counterparty in the event of a default with respect to all the transactions governed under a single Master Agreement with a counterparty, ii.) exit transactions through means other than sale, such as through a negotiated agreement with the Fund counterparty, a transfer to another party, or close out of the position through execution of an offsetting transaction.
Prime Broker Arrangements may be entered into to facilitate execution and/or clearing of equities, bonds, equity options or short sales of securities between the Fund and selected counterparties. These arrangements provide financing terms for such transactions and include guidelines surrounding the rights, obligations, and other events, including, but not limited to, margin, execution, and settlement. These agreements maintain provisions for payments, maintenance of collateral, events of default, and termination. Margin and other assets delivered as collateral are typically held by the prime broker and offset any obligations due to the prime broker.
Customer Account Agreements govern cleared derivatives transactions and exchange-traded futures and options transactions. Upon entering into an exchange-traded or centrally cleared derivative contract, the Fund is required to deposit with the relevant clearing organization cash or securities, which are referred to as the initial margin. Securities deposited as initial margin are designated on the Schedule of Investments and cash deposited is recorded as Deposits with brokers for centrally cleared swaps and Deposits with brokers for futures contracts on the Statement of Assets and Liabilities. For exchange-traded futures or centrally cleared swaps, initial margin is posted, and daily changes in fair value are recorded as a payable or receivable on the Statement of Assets and Liabilities as Variation margin on centrally cleared swaps and Variation margin on futures contracts. Variation margin is determined separately for exchange-traded futures and centrally cleared swaps and cannot be netted.
International Swaps and Derivatives Association, Inc. Master Agreements and Credit Support Annexes (“ISDA Master Agreements”) govern OTC derivative transactions entered into between the Fund and a counterparty. ISDA Master Agreements maintain provisions for general obligations, representations, netting of settlement payments, agreements to deliver supporting documents, collateral transfer and events of default or termination. Events of termination include a decline in the Fund’s net assets below a specified threshold over a certain period of time or a decline in the counterparty’s long-term and short-term credit ratings below a specified level. In each case, upon occurrence, the other party may elect to terminate early and cause settlement of all OTC contracts outstanding, including the payment of any losses and costs resulting from such early termination, as reasonably determined by the terminating party. Any decision by a party to elect early termination could be material to the financial statements and impact a Fund’s future derivative activity.
| AQR Funds | Annual Report | September 2018 | ||||||||||||||
23
Table of Contents
| Notes to Financial Statements | September 30, 2018 |
Collateral pledged by the Fund for OTC derivatives pursuant to Master Agreements is segregated by the Fund’s custodian and identified as an asset in the Statement of Assets and Liabilities either as a component of Investments in securities, at value (securities) or in Due from brokers (cash). Segregation of fund’s collateral in the custodian account helps mitigate counterparty risk.
Master Securities Forward Transaction Agreements (each, an “MSFTA”) are entered into in order to govern TBA commitments. A MSFTA typically contains, among other things, collateral posting terms and netting provisions in the event of default and/or termination event.
Collateral and margin requirements differ according to the terms of each type of Master Agreement. Collateral is routinely transferred if the total net exposure net of existing collateral already in place governed under the relevant Master Agreement with a counterparty in a given account exceeds a specified threshold. Collateral can be in the form of cash, debt securities issued by the U.S. government, money market funds and other securities as agreed to by the Fund and the applicable counterparty, or as permitted by the clearing house or exchange.
Collateral posted for the benefit of the Fund pursuant to a Master Agreement is held by a custodian of the Fund. Amounts which can be invested or repledged, are presented in the Fund’s Schedule of Investments. Collateral received is reflected as a liability within Due to brokers in the Statement of Assets and Liabilities.
The collateral requirements for TBA commitments are typically calculated by netting the mark-to-market amount for each transaction under such agreement and comparing that amount to the value of the collateral currently pledged by the Fund and the counterparty. Typically, the Fund is permitted to sell, re-pledge or use the collateral it receives; however, the counterparty is not permitted to do so.
For financial reporting purposes, the Fund does not offset derivative assets and derivative liabilities subject to master netting agreements on the Statement of Assets and Liabilities.
4. Investment Valuation and Fair Value Measurements
Investment Valuation Policies: The Net Asset Value (“NAV”) of the Fund’s shares are valued as of the close of regular trading on the New York Stock Exchange (“NYSE”) (normally 4:00 p.m. Eastern time) on each day that the NYSE is open (each a “Business Day”). The NAV per share of each class within the Fund is computed by dividing the total current value of the assets of the Fund attributable to a class, less class liabilities, by the total number of shares of that class of the Fund outstanding at the time the computation is made. GAAP defines fair value as the price the Fund would receive to sell an asset or pay to transfer a liability in an orderly transaction between market participants at the measurement date. For purposes of calculating the NAV, portfolio securities and other financial derivative instruments are valued on each Business Day using valuation methods as adopted by the Fund’s Board of Trustees (the “Board”).
The Adviser has established a Valuation Committee (the “VC”) to assist the Board with oversight and monitoring of the valuation of the Fund’s investments. This includes administering, implementing and overseeing the continual appropriateness of valuation approaches applied and the determination of adjustments to the fair valuation of portfolio securities and other financial derivative instruments in good faith after consideration of market factor changes and events affecting issuers. The Adviser performs a series of activities to provide reasonable assurance of the accuracy of prices including: (i) periodic vendor due diligence meetings, review of approaches and techniques, new developments and processes at vendors, (ii) review of daily comparison of security valuation versus prior day for all securities that exceeded established thresholds, (iii) review of third party model prices against internal model prices, and (iv) review the results of back testing and reports for the Board on the results of fair value determinations.
Where market quotes are readily available, fair market value is generally determined on the basis of official closing prices or the last reported sales prices, or if no sales are reported, based on quotes obtained from pricing services or established market makers. Where market quotations are not readily available, or if an available market quotation is determined not to reflect fair value, securities or financial derivatives are valued at fair value, as determined in good faith by the VC in accordance with the valuation procedures approved by the Fund’s Board. Using fair value to price a security may require subjective determinations about the value of a security that could result in a value that is different from a security’s most recent closing price and from the prices used by other mutual funds to calculate their net assets. It is possible the estimated values may differ significantly from the values which would have been used had an active ready market for the investments existed. These differences could be material.
Fair Value Hierarchy: Various inputs are utilized in determining the value of Fund investments. These inputs are summarized in the three broad levels as follows:
Level 1 — Inputs using unadjusted quoted prices in active markets or exchanges for identical assets and liabilities.
Level 2 — Other significant observable inputs, which may include, but are not limited to, quoted prices for similar assets or liabilities in markets that are active, quoted prices for identical or similar assets or liabilities in markets that are not active, inputs other than quoted prices that are observable for the assets or liabilities (such as interest rates, yield curves, volatilities, prepayment speeds, credit risks and default rates) or other market corroborated inputs.
| AQR Funds | Annual Report | September 2018 | ||||||||||||||
24
Table of Contents
| Notes to Financial Statements | September 30, 2018 |
Level 3 — Significant unobservable inputs based on the best information available in the circumstances, to the extent observable inputs are not available, which may include assumptions made by the Board or persons acting at their direction that are used in determining the fair value of investments.
An investment asset’s or liability’s level within the fair value hierarchy is based on the lowest level input, individually or in aggregate, that is significant to fair value measurement. The objective of fair value measurement remains the same even when there is a significant decrease in the volume and level of activity for an asset or liability and regardless of the valuation technique used. The valuation techniques used by the Fund to measure fair value maximize the use of observable inputs and minimize the use of unobservable inputs.
The inputs or methodology used for valuing securities are not necessarily an indication of the risk associated with investing in those securities.
Valuation Techniques: The following inputs and techniques may be used by the Fund to evaluate how to classify each major category of assets and liabilities into the appropriate fair value hierarchy in accordance with GAAP.
Investments in mutual funds are valued daily at their NAVs which are also classified as Level 1.
Fixed income securities (other than certain short-term investments maturing in 60 days or less) and other investments that trade in markets that are not considered to be active, are valued based on quoted market prices, dealer quotations or alternative pricing sources supported by observable inputs and are also classified within Level 2. These include certain U.S. government and sovereign obligations, most government agency securities, and investment-grade corporate bonds. Corporate and sovereign bonds and other fixed-income instruments are valued at estimated fair value using the latest evaluated bid prices furnished by independent pricing services, as well as quotations from counterparties and other market participants. Evaluated quotes are generally based on a matrix system, which may consider such factors as quoted prices for identical or similar assets, yields, maturities and ratings and are not necessarily reliant on quoted prices. Short-term debt investments of sufficient credit quality maturing in 60 days or less are generally valued at amortized cost, which approximates fair value. These investments are categorized as Level 2 within the fair value hierarchy.
Investments classified within Level 3 have significant unobservable inputs, as they trade infrequently or not at all. Level 3 instruments include illiquid securities. When observable prices are not available for these securities, the Fund may use one or more valuation approaches (e.g., the market approach, the income approach, or the cost approach), including proprietary models for which sufficient and reliable data is available. Within Level 3, the market approach generally is based on the technique of using comparable market transactions, while the use of the income approach includes the estimation of future cash flows discounted to calculate fair value. Discounts may also be applied due to the nature or durations of any restrictions on the disposition of the investment or adjusted as appropriate for credit, market and/or other risk factors.
The inputs used by the Fund in estimating the value of Level 3 investments include the original transaction price, recent transactions in the same or similar instruments, completed or pending third-party transactions in the underlying investment or comparable issuers, subsequent rounds of financing, recapitalizations and other transactions across the capital structure, offerings in the equity or debt capital markets, changes in financial ratios or cash flows, benchmark yield curves, credit spreads, estimated default rates, underlying collateral, and other unique security features. Level 3 investments may also be adjusted to reflect illiquidity and/or non-transferability, with the amount of such discount estimated by the Adviser in the absence of market information. Assumptions used by the Fund due to the lack of observable inputs may significantly impact the fair value of the investment.
Exchange-traded derivatives, such as futures contracts and exchange-traded option contracts, are typically classified within Level 1 or Level 2 of the fair value hierarchy depending on whether or not they are deemed to be actively traded. Futures and option contracts that are listed on national exchanges and are freely transferable are valued at fair value based on their last sales price on the date of determination on the exchange their constitutes the principal market or, if no sales occurred on such date, at the bid price on such exchange at the close of business on such date. Centrally cleared swaps listed or traded on a multilateral trade facility platform, such as a registered exchange, are valued on daily basis using quotations provided by an independent pricing service.
OTC derivatives, including forward contracts and swap contracts, are fair valued by the Fund on a daily basis using observable inputs, such as quotations provided by an independent pricing service, the counterparty, dealers or brokers, whenever available and considered reliable.
The U.S. Dollar value of forward foreign currency exchange contracts is determined using current forward currency exchange rates supplied by an independent pricing service.
Credit default swap contracts and interest rate swap contracts are marked to market daily based on quotations as provided by an independent pricing service. The independent pricing services aggregate valuation information from various market participants to create a single reference value for each credit default swap contract and interest rate swap contract.
Generally, a valuation model is used consistently for similar derivative types. In instances where models are used, the value of an OTC derivative depends upon the contractual terms of, and specific risks inherent in, the instrument as well as the availability and reliability of
| AQR Funds | Annual Report | September 2018 | ||||||||||||||
25
Table of Contents
| Notes to Financial Statements | September 30, 2018 |
observable inputs. Such inputs typically may include market prices for reference securities, yield curves, credit spreads, measures of volatility, prepayment rates and implied correlations of such inputs which are obtained from outside brokers and/or pricing services when available. Certain OTC derivatives, such as generic forwards, swaps and options, have inputs which can generally be corroborated by market data and are therefore classified within Level 2. Those OTC derivatives that have less liquidity or for which inputs are unobservable are classified within Level 3. While the valuations of less liquid OTC derivatives may utilize some Level 1 and/or Level 2 inputs, they also may include other unobservable inputs which may be considered significant to the fair value determination.
Quantitative Information
The following table represents the Fund’s valuations inputs as presented on the Schedule of Investments:
| AQR CORE PLUS BOND FUND | LEVEL 1 | LEVEL 2 | LEVEL 3 | TOTALS | ||||||||||||
ASSETS |
| |||||||||||||||
Corporate Bonds | $ | — | $ | 25,538,340 | $ | — | $ | 25,538,340 | ||||||||
Foreign Government Securities | — | 24,351,819 | — | 24,351,819 | ||||||||||||
Mortgage-Backed Securities | — | 31,906,508 | — | 31,906,508 | ||||||||||||
U.S. Treasury Obligations | — | 35,213,802 | — | 35,213,802 | ||||||||||||
Short-Term Investments | 10,548,642 | — | — | 10,548,642 | ||||||||||||
Futures Contracts* | 146,850 | — | — | 146,850 | ||||||||||||
Forward Foreign Currency Exchange Contracts* | — | 266,723 | — | 266,723 | ||||||||||||
Interest Rate Swap Contracts* | — | 638,759 | — | 638,759 | ||||||||||||
Credit Default Swap Contracts* | — | 523,308 | — | 523,308 | ||||||||||||
Total Assets | $ | 10,695,492 | $ | 118,439,259 | $ | — | $ | 129,134,751 | ||||||||
LIABILITIES | ||||||||||||||||
TBA Sale Commitments | $ | — | $ | (1,857,943 | ) | $ | — | $ | (1,857,943 | ) | ||||||
Futures Contracts* | (13,361 | ) | — | — | (13,361 | ) | ||||||||||
Forward Foreign Currency Exchange Contracts* | — | (295,905 | ) | — | (295,905 | ) | ||||||||||
Interest Rate Swap Contracts* | — | (549,934 | ) | — | (549,934 | ) | ||||||||||
Credit Default Swap Contracts* | — | (161,094 | ) | — | (161,094 | ) | ||||||||||
Total Liabilities | $ | (13,361 | ) | $ | (2,864,876 | ) | $ | — | $ | (2,878,237 | ) | |||||
| * | Derivative instruments, including futures and forward foreign currency exchange, are reported at the cumulative unrealized appreciation/(depreciation) of the instrument within the Fund’s Schedule of Investments. Credit default swaps and interest rate swaps contracts are reported at market value. Only current day’s variation margin is reported within the Statement of Assets and Liabilities for exchange-traded and cleared derivatives. |
During the period ended September 30, 2018, there were no transfers of investments to or from Level 3. There were no other Level 3 securities held at period end.
5. Federal Income Tax Matters
At September 30, 2018, the cost and aggregate gross unrealized appreciation (depreciation) of long security positions and derivative instruments for federal income tax purposes were as follows:
| FUND | COST OF INVESTMENTS | GROSS UNREALIZED APPRECIATION | GROSS UNREALIZED DEPRECIATION | NET UNREALIZED APPRECIATION (DEPRECIATION) | ||||||||||||
AQR Core Plus Bond Fund | $ | 127,696,618 | $ | 750,590 | $ | (2,190,694 | ) | $ | (1,440,104 | ) | ||||||
The differences between book basis and tax basis appreciation (depreciation) on investments is primarily attributable to wash sale loss deferrals and differences in the tax treatment of contingent debt payment instruments (“CPDI”).
| AQR Funds | Annual Report | September 2018 | ||||||||||||||
26
Table of Contents
| Notes to Financial Statements | September 30, 2018 |
As of September 30, 2018, the components of distributable earnings on a tax basis were as follows:
| FUND | CURRENT DISTRIBUTABLE ORDINARY INCOME | CURRENT DISTRIBUTABLE LONG TERM CAPITAL GAIN OR TAX BASIS CAPITAL LOSS CARRYFORWARDS | NET UNREALIZED APPRECIATION (DEPRECIATION) | POST OCTOBER CAPITAL OR LATE YEAR ORDINARY LOSS DEFERRALS | OTHER TEMPORARY DIFFERENCES | TOTAL ACCUMULATED EARNINGS | ||||||||||||||||||
AQR Core Plus Bond Fund | $ | 1,014,675 | $ | (716,587 | ) | $ | (1,457,679 | ) | $ | — | $ | 10,025 | $ | (1,149,566 | ) | |||||||||
The differences between book basis and tax basis components of distributable earnings are primarily attributable to wash sale loss deferrals, and other book and tax differences including, mark to market on forward foreign exchange contracts, mark to market on regulated futures contracts, straddle loss deferrals, CPDI accrued income, income on certain swaps, and capital loss carryforwards.
As of September 30, 2018, the effect of permanent book/tax reclassifications resulted in increase (decrease) to the components of net assets as follows:
| FUND | TOTAL DISTRIBUTABLE EARNINGS (LOSS) | PAID-IN CAPITAL | ||||||
AQR Core Plus Bond Fund | $ | 17,285 | $ | (17,285 | ) | |||
For financial reporting purposes, capital accounts are adjusted to reflect the tax character of permanent book/tax differences. Reclassifications are primarily due to certain non deductible expenses. The result of operations and net assets were not affected by the reclassifications.
The tax character of distributions paid during the period ended September 30, 2018 were as follows:
| SEPTEMBER 30, 2018 | ||||||||
| FUND | ORDINARY INCOME | CAPITAL GAINS | ||||||
AQR Core Plus Bond Fund | $ | 1,220,691 | $ | — | ||||
As of September 30, 2018, for federal income tax purposes, the Fund has capital loss carryforwards, with no expiration, available to offset future capital gains, if any, to the extent provided by the U.S. Treasury regulations.
| FUND | SHORT-TERM | LONG-TERM | ||||||
AQR Core Plus Bond Fund | $ | 593,438 | $ | 123,149 | ||||
6. Investment Transactions
During the period ended September 30, 2018, the cost of purchases and the proceeds from sales of investments (excluding swap contracts, forward foreign currency exchange contracts, futures contracts and short-term investments) were as follows:
| FUND | PURCHASES | SALES | SECURITIES SOLD SHORT | COVERS ON SECURITIES SOLD SHORT | ||||||||||||
AQR Core Plus Bond Fund | $ | 393,097,828 | $ | 273,249,511 | $ | 179,737,822 | $ | 177,869,760 | ||||||||
During the period ended September 30, 2018, the Fund had purchases and sales of long-term U.S. Government obligations as follows:
| FUND | PURCHASES | SALES | ||||||
AQR Core Plus Bond Fund | $ | 93,460,359 | $ | 57,891,489 | ||||
7. Derivative Instruments and Activities
The Fund uses derivative instruments as part of their principal investment strategy to achieve their investment objectives. The Fund’s derivative contracts are not accounted for as hedging instruments under GAAP. For financial reporting purposes, the Fund does not offset financial assets and financial liabilities that are subject to master netting arrangements or similar agreements on the Statement of Assets and Liabilities. All derivative instruments held by the Fund were subject to a master netting agreement or similar arrangement.
| AQR Funds | Annual Report | September 2018 | ||||||||||||||
27
Table of Contents
| Notes to Financial Statements | September 30, 2018 |
The following table lists the fair value of derivative instruments held by the Fund, by primary underlying risk and contract type, as included in the Statement of Assets and Liabilities at September 30, 2018:
| ASSETS | LIABILITIES | |||||||||||||||||||||||
| FUND | UNREALIZED APPRECIATION ON FUTURES CONTRACTS | SWAPS AT VALUE | UNREALIZED APPRECIATION ON FORWARD CURRENCY EXCHANGE CONTRACTS | UNREALIZED DEPRECIATION ON FUTURES CONTRACTS | SWAPS AT VALUE | UNREALIZED DEPRECIATION ON FORWARD CURRENCY EXCHANGE CONTRACTS | ||||||||||||||||||
| Foreign Exchange Rate Risk Exposure: | ||||||||||||||||||||||||
AQR Core Plus Bond Fund | $ | — | $ | — | $ | 266,723 | $ | — | $ | — | $ | 295,905 | ||||||||||||
| Interest Rate Risk Exposure: | ||||||||||||||||||||||||
AQR Core Plus Bond Fund | 146,850 | 638,759 | — | 13,361 | 549,934 | — | ||||||||||||||||||
| Credit Risk Exposure: | ||||||||||||||||||||||||
AQR Core Plus Bond Fund | — | 523,308 | — | — | 161,094 | — | ||||||||||||||||||
| Net Value of Derivative Contracts: | ||||||||||||||||||||||||
AQR Core Plus Bond Fund | 133,489 | 451,039 | — | — | — | 29,182 | ||||||||||||||||||
The following table indicates the effect of derivative instruments, by primary underlying risk exposure and contract type, on the Statement of Operations for the period ended September 30, 2018:
| REALIZED GAIN (LOSS) ON DERIVATIVES RECOGNIZED AS A RESULT FROM OPERATIONS | NET CHANGE IN UNREALIZED APPRECIATION (DEPRECIATION) ON DERIVATIVES RECOGNIZED AS A RESULT FROM OPERATIONS | |||||||||||||||||||||||
| FUND | FUTURES CONTRACTS | SWAPS CONTRACTS | FORWARD CURRENCY EXCHANGE CONTRACTS | FUTURES CONTRACTS | SWAPS CONTRACTS | FORWARD CURRENCY EXCHANGE CONTRACTS | ||||||||||||||||||
| Foreign Exchange Rate Risk Exposure: | ||||||||||||||||||||||||
AQR Core Plus Bond Fund | $ | — | $ | — | $ | 1,465,896 | $ | — | $ | — | $ | (29,182 | ) | |||||||||||
| Interest Rate Risk Exposure: |
| |||||||||||||||||||||||
AQR Core Plus Bond Fund | (285,946 | ) | 165,509 | — | 133,489 | 3,035 | — | |||||||||||||||||
| Credit Risk Exposure: |
| |||||||||||||||||||||||
AQR Core Plus Bond Fund | — | 392,181 | — | — | (6,050 | ) | — | |||||||||||||||||
The following table presents the Fund’s gross OTC derivative assets and liabilities by counterparty and contract type net of amounts available for offset under netting arrangements and any related collateral received or posted by the Fund as of September 30, 2018:
AQR CORE PLUS BOND FUND
| GROSS AMOUNTS NOT OFFSET IN THE STATEMENT OF ASSETS & LIABILITIES | ||||||||||||||||||||||||||
| COUNTERPARTY | INVESTMENT TYPE | GROSS AMOUNTS OF RECOGNIZED ASSETS PRESENTED IN THE STATEMENT OF ASSETS & LIABILITIES | GROSS AMOUNTS ELIGIBLE TO OFFSET | NET AMOUNTS OF ASSETS | FINANCIAL INSTRUMENTS | CASH COLLATERAL RECEIVED/ (PLEDGED) (a) | NET AMOUNT | |||||||||||||||||||
| CITI | Forward Foreign Currency Exchange Contracts | $ | 106,701 | $ | (106,701 | ) | $ | — | $ | — | $ | — | $ | — | ||||||||||||
| JPMC | Forward Foreign Currency Exchange Contracts | 160,022 | (160,022 | ) | — | — | — | — | ||||||||||||||||||
| Total financial instruments subject to a master netting arrangement or similar arrangement | 266,723 | (266,723 | ) | — | — | — | — | |||||||||||||||||||
| AQR Funds | Annual Report | September 2018 | ||||||||||||||
28
Table of Contents
| Notes to Financial Statements | September 30, 2018 |
AQR CORE PLUS BOND FUND (continued)
| GROSS AMOUNTS NOT OFFSET IN THE STATEMENT OF ASSETS & LIABILITIES | ||||||||||||||||||||||||||
| COUNTERPARTY | INVESTMENT TYPE | GROSS AMOUNTS OF RECOGNIZED LIABILITIES PRESENTED IN THE STATEMENT OF ASSETS & LIABILITIES | GROSS | NET AMOUNTS OF LIABILITIES | FINANCIAL INSTRUMENTS | CASH | NET AMOUNT | |||||||||||||||||||
| CITI | Forward Foreign Currency Exchange Contracts | $ | 118,354 | $ | (106,701 | ) | $ | 11,653 | $ | — | $ | (11,653 | ) | $ | — | |||||||||||
| JPMC | Forward Foreign Currency Exchange Contracts | 177,551 | (160,022 | ) | 17,529 | — | (17,529 | ) | — | |||||||||||||||||
| Total financial instruments subject to a master netting arrangement or similar arrangement | 295,905 | (266,723 | ) | 29,182 | — | (29,182 | ) | — | ||||||||||||||||||
| (a) | In accordance with GAAP disclosure requirements, the table above does not include the additional collateral pledged to the counterparty. Total additional collateral pledged was $1,363,500. |
For the period ended September 30, 2018, the quarterly average notional values of the derivatives held by the Fund were as follows:
Derivatives Volume Disclosure*
| AQR CORE PLUS BOND FUND | ||||
| Futures Contracts: |
| |||
| Average Notional Balance—Long | 7,044,622 | |||
| Average Notional Balance—Short | 23,578,476 | |||
| Ending Notional Balance—Long | 7,459,102 | |||
| Ending Notional Balance—Short | 22,514,648 | |||
| Forward Foreign Currency Exchange Contracts: | ||||
| Average Settlement Value—Purchased | 22,095,041 | |||
| Average Settlement Value—Sold | 42,594,249 | |||
| Ending Value— Purchased | 16,481,737 | |||
| Ending Value—Sold | 40,801,169 | |||
| Credit Default Swaps: | ||||
| Average Notional Balance—Buy Protection | 14,500,000 | |||
| Average Notional Balance—Sell Protection | 8,480,000 | |||
| Ending Notional Balance—Buy Protection | 10,740,000 | |||
| Ending Notional Balance—Sell Protection | 10,560,000 | |||
| Interest Rate-Related Swaps (Interest Rate Swaps): | ||||
| Average Notional Balance—Pays Fixed rate | 94,955,479 | |||
| Average Notional Balance—Receives Fixed rate | 171,301,284 | |||
| Ending Notional Balance—Pays Fixed Rate | 69,286,230 | |||
| Ending Notional Balance—Receives Fixed Rate | 183,181,064 | |||
| * | Notional values as of each quarter end are used to calculate the average represented. |
8. Investment Advisory and Other Agreements
The Adviser serves as the investment adviser to the Fund, pursuant to the Investment Management Agreement II, dated November 13, 2015, as amended, entered into by the Trust, on behalf of the Fund (the “Advisory Agreement”). Under the Advisory Agreement, the Adviser furnishes a continuous investment program for the Fund’s portfolio, makes day-to-day investment decisions for the Fund, and manages the Fund’s investments in accordance with the Fund’s stated policies. The Adviser is also responsible for selecting brokers and dealers to execute purchase and sale orders for the portfolio transactions, subject to its obligation to seek best execution, and also provides certain other administrative services to the Fund. The Adviser provides persons satisfactory to the Fund’s Board to serve as officers of the Fund.
Pursuant to the Advisory Agreements, the Fund currently pays the Advisor a management fee at an annual rate of 0.32% calculated on the average daily net assets.
| AQR Funds | Annual Report | September 2018 | ||||||||||||||
29
Table of Contents
| Notes to Financial Statements | September 30, 2018 |
The Trust and the Adviser have entered into a Fee Waiver and Expense Reimbursement Agreement (“Fee Waiver Agreement”) whereby the Adviser has agreed to waive its fee and/or reimburse expenses of the Fund at least through January 28, 2019 for Class I, N, and R6 shares, respectively, unless otherwise noted. Pursuant to the Fee Waiver Agreement, the Adviser has agreed to waive fees and/or reimburse expenses for the Fund to the extent that the total annual fund operating expense ratios, exclusive of interest, taxes, borrowing costs, acquired fund fees and expenses, dividend and interest expense related to short sales, expenses related to class action claims and extraordinary expenses exceed the following ratios:
| FUND | CLASS I | CLASS N | CLASS R6 | |||||||||
AQR Core Plus Bond Fund | 0.47 | % | 0.72 | % | 0.37 | % | ||||||
For the period ended September 30, 2018, the Fund’s Adviser waived fees and/or reimbursed expenses for the Fund as follows:
| FUND | FEES WAIVED | EXPENSE REIMBURSEMENTS | TOTAL | |||||||||
AQR Core Plus Bond Fund | $ | 114,402 | $ | 1,210 | $ | 115,612 | ||||||
The Trust, in turn, agreed that the Fund may be required to repay the fee waiver/expense reimbursement to the Adviser. A repayment shall be payable only to the extent it can be made during the thirty-six months following the applicable month during which the Adviser waived fees or reimbursed the Fund for its operating expenses under the Fee Waiver Agreement. Such repayment shall be made only out of the class of the Fund for which the applicable fee waiver and expense reimbursement was made. Repayments with respect to the Fund must be limited to amounts that do not cause the aggregate operating expenses of the Fund attributable to a share class during a year in which such repayment is made to exceed the lesser of (i) the applicable limits in effect at the time of the waiver and/or reimbursement, or (ii) the applicable limits in effect at the time of recapture.
For the period ended September 30, 2018, the amounts waived and reimbursed by the Adviser, as well as the amounts available for potential future recoupment by the Adviser and the expiration schedule at September 30, 2018 are as follows:
FEES WAIVED/ REIMBURSED FOR THE PERIOD ENDED SEPTEMBER 30, | TOTAL POTENTIAL RECOUPMENT AMOUNT SEPTEMBER 30, | POTENTIAL RECOUPMENT AMOUNTS EXPIRING SEPTEMBER 30 | ||||||||||||||||||
| FUND | 2019 | 2020 | 2021 | |||||||||||||||||
| AQR CORE PLUS BOND FUND | ||||||||||||||||||||
Class I | $ | 3,626 | $ | 3,626 | $ | — | $ | — | $ | 3,626 | ||||||||||
Class N | 602 | 602 | — | — | 602 | |||||||||||||||
Class R6 | 111,384 | 111,384 | — | — | 111,384 | |||||||||||||||
| Totals | $ | 115,612 | $ | 115,612 | $ | — | $ | — | $ | 115,612 | ||||||||||
9. Distribution Plan
The Trust has adopted a Plan of Distribution (the “Plan”) pursuant to Rule 12b-1 under the 1940 Act with respect to the Class N shares of the Fund. The Plan allows for the payment of services related to the distribution and servicing of these shares at a rate of up to 0.25% per annum of the average daily net asset value of the Class N shares of the Fund.
10. Principal Risks and Concentrations
The Fund is non-diversified. Because the Fund may invest in securities of a smaller number of issuers, the Fund may be more exposed to the risks associated with and developments affecting an individual issuer than a fund that invests more widely, which may, therefore, have a greater impact on the Fund’s performance.
The investment techniques and strategies utilized by the Fund, including investments made on a shorter-term basis or in derivative instruments or instruments with a maturity of one year or less at the time of acquisition, may result in frequent portfolio trading and high portfolio turnover. High portfolio turnover rates will cause the Fund to incur higher levels of brokerage fees and commissions, which may reduce performance, and may cause higher levels of current tax liability to shareholders in the Fund.
In the normal course of business the Fund trades financial instruments and enter into financial transactions where risk of potential loss exists due to changes in the market (market risk). A Fund’s investments in financial derivatives and other financial instruments may expose the Fund to various elements of market risks which include interest rate and foreign currency risks.
| AQR Funds | Annual Report | September 2018 | ||||||||||||||
30
Table of Contents
| Notes to Financial Statements | September 30, 2018 |
Fixed income securities are subject to the risk that the securities could lose value because of interest rate changes. For example, bonds tend to decrease in value if interest rates rise. Fixed income securities with longer maturities sometimes offer higher yields, but are subject to greater price shifts as a result of interest rate changes than fixed income securities with shorter maturities. Fixed income securities are generally subject to the risk that the issuer may be unable to make principal and interest payments when they are due.
Interest rate risk is the risk that fixed income securities will decline in value because of changes in interest rates. The Fund may lose money if short-term or long-term interest rates rise sharply or otherwise change in a manner not anticipated. Convertible securities and non-convertible income producing securities are subject to certain risks, including (i) if interest rates go up, the value of convertible securities and non-convertible income producing securities in the Fund portfolio generally will decline; (ii) during periods of declining interest rates, the issuer of a security may exercise its option to prepay principal earlier than scheduled, forcing the Fund to reinvest in lower yielding securities (call or prepayment risk); and (iii) during periods of rising interest rates, the average life of certain types of securities may be extended because of slower than expected principal payments (extension risk).
Mortgage-related and other mortgage-backed securities are subject to certain risks, including “extension risk” (i.e., in periods of rising interest rates, issuers may pay principal later than expected) and “prepayment risk” (i.e., in periods of declining interest rates, issuers may pay principal more quickly than expected, causing the Fund to reinvest proceeds at lower prevailing interest rates). Exposure to mortgage-backed securities offered by non-governmental issuers are subject to other risks as well, including failures of private insurers to meet their obligations and unexpectedly high rates of default on the mortgages backing the securities.
Sovereign debt investments are subject to the risk that a governmental entity may delay or refuse to pay interest or repay principal on its sovereign debt, due, for example, to cash flow problems, insufficient foreign currency reserves, political considerations, the relative size of the governmental entity’s debt position in relation to the economy or the failure to put in place economic reforms required by the International Monetary Fund or other multilateral agencies. If a governmental entity defaults, it may ask for more time in which to pay or for further loans. There is no legal process for collecting sovereign debt that a government does not pay nor are there bankruptcy proceedings through which all or part of the sovereign debt that a governmental entity has not repaid may be collected.
Investment in securities of foreign issuers may involve certain risks that are greater than those associated with investments in securities of U.S. issuers. These include risks of adverse changes in foreign economic, political, regulatory and other conditions; changes in currency exchange rates or exchange control regulations (including limitations on currency movements and exchanges); the imposition of economic sanctions or other government restrictions; differing accounting, auditing, financial reporting and legal standards and practices; differing securities market structures; and higher transaction costs. To the extent a fund’s investments in a single country or a limited number of countries represent a higher percentage of the fund’s assets, the fund assumes the risk that economic, political and social conditions in those countries will have a significant impact on its investment performance and it may be subject to increased price volatility.
Emerging markets are riskier than more developed markets because they tend to develop unevenly and may never fully develop. Investments in emerging markets may be considered speculative. Emerging markets are more likely to experience hyperinflation and currency devaluations, which adversely affect returns to U.S. investors. In addition, many emerging securities markets have far lower trading volumes and less liquidity than developed markets.
Currency risk arises from the possibility that fluctuations in foreign exchange rates will affect the value of cash balances held in foreign currencies and non-U.S. denominated financial instruments. The liquidity and trading value of foreign currencies could be affected by global economic factors, such as inflation, interest rate levels, and trade balances among countries, as well as the actions of sovereign governments and central banks. Currency rates in foreign countries may fluctuate significantly over short periods of time for a number of reasons.
In addition, the Fund may be exposed to the risk that one or more securities in the Fund portfolio will decline in price, or fail to pay interest or principal when due, because the issuer of the security experiences a decline in its financial status (credit risk). Credit risk is measured by the loss a Fund would record if the major financial institution or other counterparties failed to perform pursuant to terms of their obligations. The Fund may primarily maintain cash balances at one or several major financial institutions that may exceed federally insured limits and as such the Fund has credit risk associated with such financial institutions. In general, lower rated securities carry a greater degree of risk that the issuer will lose its ability to make interest and principal payments, which could have a negative impact on the Fund’s net asset value or dividends. The Fund minimizes credit risk by monitoring credit exposure and collateral values, and by requiring additional collateral to be deposited with or returned to the Fund when deemed necessary.
Similar to credit risk, a Fund may be exposed to counterparty risk, or the risk that an institution or other entity with which the Fund has unsettled or open transactions will default. Financial assets, which potentially expose a Fund to counterparty risk, consist principally of cash due from counterparties and investments. By using derivative instruments, the Fund may be exposed to the risk that derivative counterparties may not perform in accordance with the contractual provisions offset by the value of any collateral received. The Fund’s exposure to credit risk associated with counterparty non-performance is limited to the unrealized gains inherent in such transactions that are recognized in the Statement of Assets and Liabilities. The counterparties to the Fund’s derivative investments may include affiliates of the Fund’s clearing brokers and other major financial institutions. While the Fund uses multiple clearing brokers and counterparties, a concentration of credit risk may exist because of balances held and transactions with a limited number of clearing brokers and counterparties. The Fund minimizes counterparty credit risk through credit limits and approvals, credit monitoring procedures, executing master netting arrangements and managing margin and collateral requirements, as appropriate.
| AQR Funds | Annual Report | September 2018 | ||||||||||||||
31
Table of Contents
| Notes to Financial Statements | September 30, 2018 |
In the normal course of business, the Fund may enter into agreements with the certain counterparties for derivative transactions. A Fund’s Master Agreements contain provisions that require Fund to maintain a predetermined level of net assets, and/or provide limits regarding the decline of a Fund’s net asset value over specified time periods. If a Fund was to violate such provisions, the counterparties to the derivative instruments could request immediate payment or demand immediate collateralization on derivative instruments in net liability positions. If such events are not cured by the Fund or waived by the counterparties, they may decide to curtail or limit extension of credit, and the Fund may be forced to unwind its derivative positions which may result in material losses.
The Fund, at times, utilizes substantial leverage in their investment program. Such leverage may take the form of trading on margin, investing in derivative instruments that are inherently leveraged, entering into reverse repurchase transactions and entering into other forms of direct and indirect borrowings. There is no guarantee that the Fund borrowing arrangement or other arrangements for obtaining leverage will continue to be available, or if available, will be available on terms and conditions acceptable to the Fund. Unfavorable economic conditions also could increase funding costs, limit access to the capital markets or result in a decision by lenders not to extend credit to the Fund. In addition, a decline in market value of the Fund’s assets may have particular adverse consequences in instances where they have borrowed money based on the market value of those assets. A decrease in market value of those assets may result in the lender (including derivative counterparties) requiring the Fund to post additional collateral or otherwise sell assets at a time when it may not be in the Fund’s best interest to do so.
The Adviser relies heavily on quantitative models and information and data supplied by third parties. When models and data prove to be incorrect or incomplete, any decisions made in reliance thereon may expose the Fund to potential risks. Such models may produce unexpected results, which can result in losses for the Fund.
Periodically, the Fund may be a party to legal actions arising in the ordinary course of business. The Fund is currently not subject to any actions that either individually or in the aggregate are expected to have a material impact on their results of operations, cash flows or financial condition.
Please refer to the Fund’s prospectuses for a more complete description of the principal risks of investing in the Fund.
11. Interfund Lending
Pursuant to an exemptive order issued by the Securities and Exchange Commission (the “SEC”), the Fund may participate in a joint lending and borrowing program (the “Interfund Lending Program”) to the extent such participation is consistent with Fund’s investment objective and investment policies. This program allows the Fund to borrow and lend to other AQR Funds that permit such transactions. All loans under the Interfund Lending Program are for temporary cash management or emergency purposes. Interest earned or paid on an interfund lending transaction will be based on the average of certain current market rates, as calculated according to a formula established by the Board. No Fund may borrow or lend money through the program unless it receives a more favorable rate than is typically available for comparable borrowings from a bank or investments in U.S. Treasury bills, respectively.
A lending Fund may lend in aggregate up to 15% of its net assets, but may not lend more than 5% of its net assets to any one borrowing Fund through the Interfund Lending Program. A borrowing Fund may not borrow through the Interfund Lending Program or from any other source more than 33 1/3% of its total assets. If a borrowing Fund’s total outstanding borrowings exceed 10% of its total assets, the Fund must secure each of its outstanding borrowings through the Interfund Lending Program with collateral equal to 102% of the outstanding principal value of the loan.
The Fund is not required to borrow money under the Interfund Lending Program and may borrow under other arrangements, including their existing bank line of credit. This could result in the Fund borrowing money at a higher interest rate than it would have received under the Interfund Lending Program.
During the reporting period, the Fund did not utilize the Interfund Lending Program.
12. Line of Credit
Effective February 23, 2018 and terminating on February 23, 2019, the Trust renewed a $350,000,000 committed syndicated line of credit (the “Agreement”) with Bank of America, N.A., as the Administrative Agent. Prior to February 23, 2018 the line of credit commitment amount was $300,000,000 at substantially similar terms. Borrowing, if any, under this arrangement bears, as incurred, interest at the sum of(a) 1.0% per annum plus (b) the higher of (i) the Federal Funds Rate or (ii) the Eurodollar Rate, which is paid monthly. The maximum loan amount available to a Fund is the lesser of an amount which will not exceed the borrowing limits set forth in the Fund’s Prospectus and/or Registration Statement and will not cause the asset coverage ratio for any borrowings by a Fund to drop below the required amount under the Agreement (between 300-500% per Fund). The Agreement is subject to an annual commitment fee which is payable in arrears on a quarterly basis. In the event of a draw upon the line of credit, liquid assets of the borrowing Fund may be designated as collateral until its loan is repaid in full.
The unused amount available on the line of credit as of September 30, 2018 is $279,000,000. The Fund did not have any borrowings for the period ended September 30, 2018.
| AQR Funds | Annual Report | September 2018 | ||||||||||||||
32
Table of Contents
| Notes to Financial Statements | September 30, 2018 |
13. Principal Ownership
As of September 30, 2018, the Fund had individual shareholder and/or omnibus accounts owning more than 5% of the total shares outstanding of the Fund as follows:
| FUND | NUMBER OF INDIVIDUAL SHAREHOLDERS AND/OR OMNIBUS ACCOUNTS | TOTAL PERCENTAGE INTEREST HELD | ||||||
AQR Core Plus Bond Fund* | 1 | 97.65 | % | |||||
| * | The percentage held by the Adviser and/or affiliates is 97.65%, |
Significant shareholder transactions by these shareholders, if any, may impact the Fund’s performance.
14. New Accounting Pronouncements and Regulations
In October 2016, the Securities and Exchange Commission (the “SEC”) adopted Final Rule Release No. 33-10231, Investment Company Reporting Modernization in conjunction with Final Rule Release No. 33-10233, Investment Company Liquidity Risk Management Programs and Final Rule Release No. 33-10234, Investment Company Swing Pricing. Collectively, these rules modernize and enhance the reporting and disclosure of information by registered investment companies. The new rules will allow the SEC to more effectively collect and use data reported by fund, enhance disclosure regarding fund liquidity and redemption practices, and permit open-end funds to offer swing pricing, subject to board approval and review. The amendments to Regulation S-X were applied to the Fund’s financial statements. The adoption had no effect on the Fund’s net assets or results of operations.
In August 2018, the SEC adopted Final Rule Release No. 33-10532, Disclosure Update and Simplification. The new rule amends certain disclosure requirements that the SEC determined to be redundant, duplicative, overlapping, outdated, or superseded, in light of other SEC disclosure requirements, U.S. GAAP, or changes in the information environment. The amendments are intended to facilitate the disclosure of information to investors and simplify compliance without significantly altering the total mix of information provided to investors. The amendments to Regulation S-X were applied to the Fund’s financial statements in the current period. The adoption had no effect on the Fund’s net assets or results of operations.
In August 2018, the Financial Accounting Standards Board issued ASU No. 2018-13, Disclosure Framework-Changes to the Disclosure Requirements for Fair Value Measurements (“ASU 2018-13”). The amendments generally modified the disclosure requirements for fair value measurements such that it removes the following requirements: 1) the requirement to disclose the amount of and reasons for transfers between Level 1 and Level 2 of the fair value hierarchy; 2) the requirement to disclose the Fund’s policy for timing of transfers between levels; and, 3) the requirement to disclose the valuation processes for Level 3 fair value measurements. ASU 2018-13 also added the requirement to disclose how weighted average is calculated when the range and weighted average of significant unobservable inputs used to develop Level 3 fair value measurements is required to be disclosed, in addition to making various other clarifying amendments to the disclosure guidance. The amendments in ASU 2018-13 are effective for fiscal years, and interim periods within those fiscal years, beginning after December 15, 2019. The amendments related to the range and weighted average of significant unobservable inputs used to develop Level 3 fair value measurements should be applied prospectively for only the most recent interim or annual period presented in the initial fiscal year of adoption. All other amendments should be applied retrospectively to all periods presented upon their effective date. Early adoption is permitted. The Fund has elected to early adopt ASU 2018-13 and the amendments are reflected in the current year financial statements.
15. Subsequent Events
The Fund has evaluated subsequent events through the date of issuance of this report and has determined that there is no material events other than those noted above.
| AQR Funds | Annual Report | September 2018 | ||||||||||||||
33
Table of Contents
| Report of Independent Registered Public Accounting Firm |
To the Board of Trustees of AQR Funds and Shareholders of AQR Core Plus Bond Fund:
Opinion on the Financial Statements
We have audited the accompanying statement of assets and liabilities, including the schedule of investments, of AQR Core Plus Bond Fund (the “Fund”) as of September 30, 2018, and the related statements of operations and changes in net assets, including the related notes, and the financial highlights for the period April 5, 2018 (commencement of operations) through September 30, 2018 (collectively referred to as the “financial statements”). In our opinion, the financial statements present fairly, in all material respects, the financial position of the Fund as of September 30, 2018, and the results of its operations, changes in its net assets, and the financial highlights for the period April 5, 2018 (commencement of operations) through September 30, 2018 in conformity with accounting principles generally accepted in the United States of America.
Basis for Opinion
These financial statements are the responsibility of the Fund’s management. Our responsibility is to express an opinion on the Fund’s financial statements based on our audit. We are a public accounting firm registered with the Public Company Accounting Oversight Board (United States) (“PCAOB”) and are required to be independent with respect to the Fund in accordance with the U.S. federal securities laws and the applicable rules and regulations of the Securities and Exchange Commission and the PCAOB.
We conducted our audit of these financial statements in accordance with the standards of the PCAOB. Those standards require that we plan and perform the audit to obtain reasonable assurance about whether the financial statements are free of material misstatement, whether due to error or fraud.
Our audit included performing procedures to assess the risks of material misstatement of the financial statements, whether due to error or fraud, and performing procedures that respond to those risks. Such procedures included examining, on a test basis, evidence regarding the amounts and disclosures in the financial statements. Our audit also included evaluating the accounting principles used and significant estimates made by management, as well as evaluating the overall presentation of the financial statements. Our procedures included confirmation of securities owned as of September 30, 2018 by correspondence with the custodian, transfer agent and brokers; when replies were not received from brokers, we performed other auditing procedures. We believe that our audit provides a reasonable basis for our opinion.
/s/ PricewaterhouseCoopers LLP
New York, New York
November 20, 2018
We have served as the auditor of one or more investment companies in AQR Funds since 2008.
| AQR Funds | Annual Report | September 2018 | ||||||||||||||
34
Table of Contents
| Fund Expense Examples (Unaudited) |
As a shareholder of the Trust, you incur two types of costs: (1) transaction costs and (2) ongoing costs, including management fees; and other Fund expenses. This example is intended to help you understand your ongoing costs (in dollars) of investing in the Fund and to compare these costs with the ongoing costs of investing in other mutual funds The Example is based on an investment of $1,000 invested at the beginning of the period and held for the entire period as indicated below.
Actual Expenses
The table below provides information about actual account values and actual expenses. You may use the information together with the amount you invested, to estimate the expenses that you paid over the period. Simply divide your account value by $1,000 (for example, an $8,600 account value divided by $1,000 = 8.6), then multiply the result by the number under the heading entitled “Expenses Paid for the Period Ending 09/30/18” to estimate the expenses you paid on your account during this period. The Fund will indirectly bear its pro rata share of the expenses incurred by the underlying investments in which the Fund invests. These expenses are not included in the table.
Hypothetical Example for Comparison Purposes
The table below also provides information about hypothetical account values and hypothetical expenses based on the Fund’s actual expense ratio and an assumed annual rate of return of 5% before expenses, which is not the Fund’s actual return. The hypothetical account values and expenses may not be used to estimate the actual ending account balance or expenses you paid for the period. You may use this information to compare the ongoing costs of investing in a Fund and other funds by comparing this 5% hypothetical example with the 5% hypothetical examples that appear in the shareholder reports of other funds. The Fund will indirectly bear its pro rata share of the expenses incurred by the underlying investments in which the Fund invests. These expenses are not included in the table.
Please note that the expenses shown in the table are meant to highlight your ongoing costs only and do not reflect any transactional costs. Therefore, the hypothetical example is useful in comparing ongoing costs only, and will not help you determine the relative total costs of owning different fund. In addition, if these transactional costs were included, your costs would have been higher.
| BEGINNING ACCOUNT DATE VALUE | ENDING ACCOUNT VALUE 9/30/18 | ANNUALIZED EXPENSE RATIO FOR THE PERIOD | EXPENSES PAID FOR THE PERIOD ENDING 9/30/18 | |||||||||||||
| AQR Core Plus Bond Fund (1) | ||||||||||||||||
| Class I | ||||||||||||||||
Actual Return | $1,000.00 | $999.80 | 0.42 | % | $2.05 | (a) | ||||||||||
Hypothetical Return | $1,000.00 | $1,022.96 | 0.42 | % | $2.13 | |||||||||||
| Class N | ||||||||||||||||
Actual Return | $1,000.00 | $998.80 | 0.62 | % | $3.02 | (a) | ||||||||||
Hypothetical Return | $1,000.00 | $1,021.96 | 0.62 | % | $3.14 | |||||||||||
| Class R6 | ||||||||||||||||
Actual Return | $1,000.00 | $1,000.00 | 0.37 | % | $1.80 | (a) | ||||||||||
Hypothetical Return | $1,000.00 | $1,023.21 | 0.37 | % | $1.88 | |||||||||||
| (1) | Commencement of operations was April 05, 2018 |
| Expenses are calculated using each Class’ annualized expense ratio, multiplied by the average account value for the period, multiplied by 183/365 (to reflect the one-half year period unless stated otherwise). |
| (a) | Expenses are calculated using each Class’ annualized expense ratio, multiplied by the average account value for the period, multiplied by 178/365 (to reflect the one-half year period unless stated otherwise). |
| AQR Funds | Annual Report | September 2018 | ||||||||||||||
35
Table of Contents
| Board Approval of Investment Advisory Agreements |
The Board of Trustees (the “Board,” and the members of which are referred to as “Board Members”) of the AQR Funds (the “Trust”) met in person on November 16-17, 2017 to consider the approval of the Investment Management Agreement II between the Trust, on behalf of the AQR Core Plus Bond Fund (the “New Fund”), and AQR Capital Management, LLC (“AQR” or the “Adviser”) (the “Investment Management Agreement”). In addition, the Board Members who are not “interested persons” as defined in the Investment Company Act of 1940, as amended (the “1940 Act”) (the “Independent Board Members”), held a separate telephonic meeting on November 11, 2017 with independent legal counsel and representatives of AQR to review the materials provided and the relevant legal considerations (together with the in-person meeting held on November 16-17, 2017, the “Meetings”). In accordance with Section 15(c) of the 1940 Act, the Board requested, reviewed and considered materials furnished by AQR relevant to the Board’s consideration of whether to approve the Investment Management Agreement. These materials included: (1) memoranda and materials provided by AQR describing the personnel and services to be provided to the New Fund; (2) information independently compiled and prepared by Morningstar Associates, LLC (“Morningstar”) relating to the New Fund’s proposed fees and expenses; (3) a discussion of the financial information of AQR; and (4) a discussion of the compliance program and the regulatory exam history of AQR.
At the in-person meeting held on November 16-17, 2017, the Board, including the Independent Board Members, unanimously approved the Investment Management Agreement for an initial two-year period for the New Fund. The Board considered all factors it believed to be relevant with respect to the New Fund, including, among other factors: (a) the nature, extent and quality of the services to be provided by the Adviser; (b) the investment performance of the Adviser and the Adviser’s portfolio management; (c) the management fee and the cost of the services and profits to be realized by the Adviser from the relationship with the New Fund; (d) economies of scale; and (e) other factors.
The Board also considered other matters it deemed important to the approval process, such as services related to the valuation and pricing of the New Fund’s portfolio holdings, direct and indirect benefits to the Adviser and its affiliates from their relationship with the New Fund and advice from independent legal counsel with respect to the review process and materials submitted for the Board’s review. The Board did not identify any particular information as controlling, and each Board Member may have attributed different weightings to the various items considered.
In considering the approval of the Investment Management Agreement for the New Fund, the Board did not view the Investment Management Agreement as creating third-party beneficiary rights in shareholders to enforce the terms of the Investment Management Agreement against the Adviser.
The following is a summary of the Board’s discussion and views regarding the factors it considered in evaluating the Investment Management Agreement:
The Nature, Extent and Quality of the Services to be Provided by the Adviser. The Board Members reviewed the services that the Adviser would provide to the New Fund under the Investment Management Agreement, including certain administrative services. The Board considered the size and experience of the Adviser’s staff, its use of technology, and the New Fund’s stated investment objectives, strategies and processes. The Board reviewed the overall qualifications of the Adviser as an investment adviser. In connection with the investment advisory services to be provided to the New Fund, the Board Members took into account discussions they had with representatives of the Adviser regarding the management of the New Fund’s investments in accordance with the New Fund’s stated investment objectives and policies and the types of transactions that would be entered into on behalf of the New Fund. During these discussions, the Board Members asked questions of, and received answers from, representatives of the Adviser regarding the formulation and proposed implementation of the New Fund’s investment strategies, their efficacy and potential risks.
In addition to the investment advisory services to be provided to the New Fund, the Board Members considered that AQR also will provide shareholder and administrative services, oversight of Fund accounting, marketing services, risk management, compliance oversight, and assistance in meeting legal and regulatory requirements and other services necessary for the operation of the New Fund. In particular, the Board Members reviewed the compliance, shareholder and administrative services to be provided to the New Fund by AQR under the Investment Management Agreement. The Board Members recognized the entrepreneurial risk that AQR would assume in connection with launching the New Fund and the enterprise risk involved in providing services to the New Fund over time.
Finally, the Independent Board Members had an opportunity to meet outside the presence of Fund management in executive session separately with independent legal counsel to discuss and consider the Investment Management Agreement. Based on the presentations and materials at the Meetings, the Board concluded that the services to be provided to the New Fund by AQR pursuant to the Investment Management Agreement were expected to be of a high quality and would benefit the New Fund.
Investment Performance and the Adviser’s Portfolio Management. Because the New Fund is newly formed, the Board did not consider the investment performance of the New Fund. The Board based its review of the Adviser’s performance primarily on the experience of the Adviser in managing other registered investment companies and private funds, noting that other funds the Adviser manages might have investment objectives, policies or restrictions different from those of the New Fund. The Board also considered the resources and strengths of the Adviser and the experience of the portfolio management team with respect to the investment strategies proposed for the New Fund. Based on these factors, the Board Members determined that AQR would be an appropriate investment adviser for the New Fund.
The Management Fee and the Cost of the Services and Profits to be Realized by the Adviser from the Relationship with the New Fund. The Board, including the Independent Board Members, received and reviewed information regarding the management fees to be paid by the New Fund to the Adviser pursuant to the Investment Management Agreement. The Board examined this information in order to determine the reasonableness of the fees in light of the nature and quality of services to be provided to the New Fund.
| AQR Funds | Annual Report | September 2018 | ||||||||||||||
36
Table of Contents
| Board Approval of Investment Advisory Agreements |
To assist in this analysis, the Board received a report independently prepared by Morningstar. The report showed comparative fee information for the New Fund’s prospective Morningstar category, including expense comparisons of contractual investment management fees and actual net expenses.
The Board also received and reviewed information regarding the expected profitability of the Adviser with respect to New Fund-related activities. The Board also reviewed the Adviser’s methodology of determining profitability. The Board recognized that profitability may be affected by numerous factors including, among other things, fee waivers and expense reimbursements by the Adviser, the types of funds managed, taxes, expense allocations and business mix.
The Board reviewed the Adviser’s unaudited financial information. The purpose of the review was to help the Independent Board Members determine whether the firm has the necessary resources to continue to provide high quality services to the New Fund and attract and retain high quality employees.
Based on their review of the materials presented at the Meeting and discussions of these materials, the Board concluded that the proposed management fees under the Investment Management Agreement are reasonable.
Economies of Scale. Because the New Fund is newly formed and had not commenced operations as of November 16-17, 2017, and the eventual aggregate amount of the New Fund’s assets was uncertain, the Adviser was not able to provide the Board with specific information concerning the extent to which economies of scale would be realized as the New Fund grows. The Adviser presented information to show that economies are being shared due to the management fees being set at a level that is competitive relative to comparable funds of an anticipated size and at higher asset levels. The Board recognized that economies would also be shared through the adoption of expense limitation agreements for the New Fund. The Board considered that the funds in the AQR fund complex share some common resources and, as a result, an increase in the overall size of the complex could permit the New Fund to incur lower expenses than they would otherwise as stand-alone entities. The Board also considered the Adviser’s overall operations and its efforts to expand the scale of, and further enhance the quality of, its operations.
Other Factors. The Board also took into account other ancillary or “fall-out” benefits that the Adviser or its affiliates may derive from its relationship with the New Fund, both tangible and intangible. The Board also received information regarding the Adviser’s brokerage and soft dollar practices. The Board considered that the Adviser is responsible for decisions to buy and sell securities for the New Fund, selection of broker-dealers and best execution, and aggregation and allocation of trade orders among the firm’s various advisory clients. The Board noted that the Adviser does not presently intend to make use of soft dollars to acquire third-party research.
Conclusion. Counsel advised the Board concerning the statutory and regulatory requirements for approval and disclosure of an investment management agreement. No single factor was determinative to the decision of the Board. Based on the foregoing and such other matters as were deemed relevant, all of the Board Members, including all of the Independent Board Members, concluded that the proposed management fee rates under the Investment Management Agreement are reasonable in relation to the services to be provided by the Adviser to the New Fund, as well as the costs expected to be incurred and benefits expected to be gained by the Adviser in providing such services, including the investment advisory and administrative components. The Board also found the proposed investment management fees to be reasonable in comparison to the fees charged by advisers to other comparable funds of an anticipated size. As a result, all of the Board Members, including the Independent Board Members voting separately, approved the Investment Management Agreement with respect to the Fund. The Independent Board Members were represented by independent legal counsel who assisted them in their deliberations.
| AQR Funds | Annual Report | September 2018 | ||||||||||||||
37
Table of Contents
| Trustees and Officers (Unaudited) | September 30, 2018 |
Listed in the chart below is basic information regarding the Trustees and Officers of the Trust. The address of each Officer and Trustee is Two Greenwich Plaza, 4th Floor, Greenwich CT 06830.
| NAME AND YEAR OF BIRTH | CURRENT POSITION WITH THE TRUST, TERM OF OFFICE1 AND LENGTH OF TIME SERVED | PRINCIPAL OCCUPATION(S) DURING PAST 5 YEARS | NUMBER OF FUNDS IN FUND COMPLEX OVERSEEN BY TRUSTEE | OTHER PRESENT OR PAST DIRECTORSHIPS HELD BY TRUSTEE (DURING THE PAST 5 YEARS) | ||||||||||||
Disinterested Trustees2 | ||||||||||||||||
| Timothy K. Armour, M.B.A., 1948 | | Chairman of the Board, since 2010 and Trustee, since 2008 |
| | Interim Chief Executive Officer of Janus Capital Group (retired) (2009-2010) (financial services) | | 50 | | Janus Capital Group (2008- 2016); ETF Securities (2010- 2013) | | ||||||
| L. Joe Moravy, M.B.A., CPA, 1950 | | Trustee, since 2008 |
| | Independent Consultant (retired) (2014-2016); Managing Director, Finance Scholars Group (2010-2014) (consulting) | | 50 | | Nuveen Exchange Traded Commodities Funds (2012-2016) | | ||||||
| William L. Atwell, M.B.A., 1950 | | Trustee, since 2011 | | Managing Director, Atwell Partners LLC (since 2012) (consulting); President (CIGNA International), CIGNA (2008- 2012) (insurance) | | 50 | | Webster Financial Corporation (since 2014); Blucora, Inc. (since 2017) | | |||||||
| Gregg D. Behrens, M.M., 1952 | | Trustee, since 2011 | | Retired from Northern Trust Company (since 2009) (banking) | | 50 | None | |||||||||
| Brian Posner, M.B.A., 1961 | | Trustee, since 2011 | | President, Point Rider Group LLC (since 2008) (consulting) | | 50 | | Biogen Inc. (since 2008); Bioverativ Inc. (2017-2018); Arch Capital Group (since 2010); BG Medicine (2012- 2015) | | |||||||
Mark A. Zurack, M.B.A., CFA 1957 | | Trustee, since 2014 | | Senior Lecturer, Columbia Business School (since 2002); Visiting Senior Lecturer, Cornell University (2004-2013) | | 50 | | Exchange Traded Concepts Trust (since 2011); Source ETF Trust (2014-2015) | | |||||||
Interested Trustees3 | ||||||||||||||||
| David Kabiller, CFA, 1963 | Trustee, since 2010 | | Founding Principal, AQR Capital Management, LLC (since 1998) | | 50 | None | ||||||||||
| Marco Hanig, Ph.D., 1958 | | Trustee, since 2014; Chief Executive |
| | Principal, AQR Capital Management, LLC (since 2008) | | 50 | None | ||||||||
Officers | ||||||||||||||||
| H.J. Willcox, J.D., 1966 | | Chief Compliance Officer, since 2013 | | | Principal and Chief Compliance Officer, AQR Capital Management, LLC (since 2013); Global Head of Compliance and Counsel KKR & Co., L.P. (2008-2013) | | N/A | N/A | ||||||||
| Heather Bonner, CPA, 1977 | | Chief Financial Officer, since 2014; Treasurer, since 2018 | | | Vice President, AQR Capital Management, LLC (since 2013); Senior Manager, PricewaterhouseCoopers, LLP (2007- 2013) | | N/A | N/A | ||||||||
| AQR Funds | Annual Report | September 2018 | ||||||||||||||
38
Table of Contents
| Trustees and Officers (Unaudited) | September 30, 2018 |
| NAME AND YEAR OF BIRTH | CURRENT POSITION WITH THE TRUST, TERM OF OFFICE1 AND LENGTH OF TIME SERVED | PRINCIPAL OCCUPATION(S) DURING PAST 5 YEARS | NUMBER OF FUNDS IN FUND COMPLEX OVERSEEN BY TRUSTEE | OTHER PRESENT OR PAST DIRECTORSHIPS HELD BY TRUSTEE (DURING THE PAST 5 YEARS) | ||||
| Bradley Asness, J.D., M.B.A. 1969 | Vice President, since 2009 | Principal and Co-Chief Operating Officer, AQR Capital Management, LLC (since 1998) | N/A | N/A | ||||
| William J. Fenrich, J.D., 1969 | Vice President, since 2018 | Principal and Chief Legal Officer, AQR Capital Management, LLC (since 2017) | N/A | N/A | ||||
| Nicole DonVito, J.D., 1979 | Chief Legal Officer, since 2014; Vice President, since 2009 | Managing Director, Senior Counsel & Head of Registered Products, AQR Capital Management, LLC (since 2007) | N/A | N/A | ||||
| Tara Bongiorni, CPA 1977 | Assistant Treasurer, since 2017 | Vice President, AQR Capital Management, LLC (since 2015); Vice President, Goldman Sachs Asset Management (2002-2015) | N/A | N/A | ||||
| John Hadermayer, J.D., 1977 | Secretary, since 2018 | Vice President, AQR Capital Management, LLC (since 2013) | N/A | N/A | ||||
| (1) | Each Trustee serves until the election and qualification of a successor, or until death, resignation or removal as provided in the Trust’s Declaration of Trust. A Disinterested Trustee may not hold office beyond December 31 of the year in which he turns 72. |
| (2) | A Disinterested Trustee is any Trustee that is not an “interested person” of the Trust within the meaning of Section 2(a)(19) of the 1940 Act. |
| (3) | An Interested Trustee is a Trustee that is an “interested person” of the Trust within the meaning of Section 2(a)(19) of the 1940 Act. Mr. Kabiller and Dr. Hanig are interested persons of the Trust because of their positions with the Adviser. |
| AQR Funds | Annual Report | September 2018 | ||||||||||||||
39
Table of Contents
Investment Adviser
AQR Capital Management, LLC
Two Greenwich Plaza, 4th Floor
Greenwich, CT 06830
Transfer Agent
ALPS Fund Services, Inc.
1290 Broadway, Suite 1100
Denver, CO 80203
Custodian
JPMorgan Chase Bank, N.A.
4 Metro Tech Center
Brooklyn, NY 11245
Distributor
ALPS Distributors, Inc.
1290 Broadway, Suite 1100
Denver, CO 80203
Administrator
JPMorgan Chase Bank, N.A.
70 Fargo Street
Boston, MA 02210
Independent Registered Public Accounting Firm
PricewaterhouseCoopers, LLP
300 Madison Avenue
New York, NY 10017
You may obtain a description of the AQR Funds proxy voting, policies, procedures and information regarding how each Fund voted proxies relating to portfolio securities during the 12-month period ending June 30th of each year (available by August 31st of that year) without charge, upon request, by calling 1-866-290-2688 or visiting the funds website https://funds.aqr.com, or by accessing the SEC’s website at www.SEC.gov. Such reports may be reviewed and copied at the SEC’s Public Reference Room in Washington, DC. Information on the operation of the Public Reference Room may be obtained by calling 202-551-8090.
The Fund files complete schedules of the portfolio holdings with the SEC for the first and third quarters on Form N-Q. The Form N-Q is available without charge, upon request, by calling 1-800-SEC-0330, or by accessing the SEC’s website, at www.SEC.gov. It may also be reviewed and copied at the SEC’s Public Reference Room in Washington, DC.
This report has been prepared for shareholders and may be distributed to others only if preceded or accompanied by an effective prospectus, which includes information regarding the Funds’ objectives and policies, experienced of its management, marketability of shares and other information.
Table of Contents

AQR Funds
P.O. Box 2248, Denver, CO 80201-2248 | p: +1.866.290.2688 | w: https://funds.aqr.com
Table of Contents
Item 2. Code of Ethics.
| a). | As of the end of the period, September 30, 2018, the Registrant has adopted a code of ethics, as defined in Item 2 of Form N-CSR, that applies to its principal executive officer, principal financial officer, principal accounting officer or controller, or persons performing similar functions. This code of ethics is included as Exhibit 13 (a)(1). |
| b). | Not Applicable. |
| c). | There has been no substantive amendments to the Registrant’s Code of Ethics during the fiscal year ended September 30, 2018 (“Reporting Period”). |
| d). | Registrant granted no waivers from the provisions of its Code of Ethics during the Reporting Period. |
| e). | Not Applicable. |
Table of Contents
| f). | Attached. |
Item 3. Audit Committee Financial Expert.
| a). | The Registrant’s Board of Trustees has determined that its Audit Committee has two “audit committee financial experts”, as that term is defined under Items 3(b) and 3(c), serving on its Audit Committee. Mr. L. Joe Moravy and Mr. Brian S. Posner, the Registrant’s audit committee financial experts, are “independent”, as that term is defined under Item 3(a)(2). |
Item 4. Principal Accountant Fees and Services.
Aggregate fees for professional services rendered for the AQR Funds by PricewaterhouseCoopers LLP for the fiscal years ended September 30, 2017 and September 30, 2018 were:
| 2017 | 2018 | |||
Audit Fees (a) | $858,575 | $900,111 | ||
Audit Related Fees (b) | $8,000 | $8,000 | ||
Tax Fees (c) | $470,788 | $452,479 | ||
All Other Fees (d) | $450 | $450 | ||
Total: | $1,337,813 | $1,361,040 |
| (a) | Audit Fees: These fees relate to professional services rendered by PricewaterhouseCoopers LLP for the audits of the Registrant’s annual financial statements or services normally provided by the independent registered public accounting firm in connection with statutory and regulatory filings or engagements. These services include the audits of the financial statements of the Registrant, issuance of consents and assistance with review of documents filed with the SEC. |
| (b) | Audit Related Fees: These fees relate to assurance and related services by PricewaterhouseCoopers LLP that are reasonably related to the performance of the audit of the Registrant’s September 30, 2017 and September 30, 2018 annual financial statements that are not reported under “Audit Fees” above. The audit related services provided by PricewaterhouseCoopers LLP for the year-ended September 30, 2017 and September 30, 2018 relate to procedures performed by PricewaterhouseCoopers LLP in connection with its review of the issuance of, and amendments to, the Registrant’s Registration Statement. |
| (c) | Tax Fees: These fees relate to professional services rendered by PricewaterhouseCoopers LLP for tax compliance, tax advice and tax planning. The tax services provided by PricewaterhouseCoopers LLP relate to the review of the Registrant’s federal and state income tax returns, excise tax calculations and the completion of an international taxation review. |
| (d) | All Other Fees: These fees relate to products and services provided by PricewaterhouseCoopers LLP other than those reported under “Audit Fees,” “Audit-Related Fees,” and “Tax Fees” above. |
| (e) | Audit Committee Pre-approval Policies and Procedures: |
| (i) | Per Rule 2-01(c)(7)(A) and the charter of the Registrant’s Audit Committee, the Audit Committee approves and recommends the principal accountant for the Registrant, pre-approves (i) the principal accountant’s provision of all audit and permissible non-audit services to the Registrant (including the fees and other compensation to be paid to the principal accountant), and (ii) the principal accountant’s provision of any permissible non-audit services to the Registrant’s investment adviser (the “Adviser”), sub-adviser or any entity controlling, controlled by, or under common control with any investment adviser or sub-adviser, if the engagement relates directly to the operations of the financial reporting of the Trust. |
| (ii) | 100% of services described in each of Items 4(b) through (d) were approved by the Audit Committee pursuant to paragraph (c)(7)(A) of Rule 2-01 of Regulation S-X. |
Table of Contents
| (f) | Less than 50% of the hours expended on the principal accountant’s engagement to audit Registrant’s financial statements were attributed to work performed by persons other than the accountant’s full-time, permanent employees. |
| (g) | Disclose the aggregate non-audit fees billed by the Registrant’s accountant for services rendered to the Registrant, and rendered to the Registrant’s investment adviser (not including any sub-adviser whose role is primarily portfolio management and is subcontracted with or overseen by another investment adviser), and any entity controlling, controlled by, or under common control with the adviser that provides ongoing services to the Registrant for the fiscal years ended September 30, 2017 and September 30, 2018: $900 and $4,700, respectively. |
| (h) | Not Applicable. |
Item 5. Audit Committee of Listed Registrants.
| (a) | The Registrant is an issuer as defined in Section 10A-3 of the Securities Exchange Act of 1934 and has a separately-designated standing Audit Committee in accordance with Section 3(a)(58)(A) of such Act. All of the Board’s independent Trustees, Timothy K. Armour, William L. Atwell, Gregg D. Behrens, L. Joe Moravy, Brian S. Posner and Mark Zurack, are members of Audit Committee. |
| (b) | Not Applicable. |
Item 6. Investments
| (a) | Schedule is included as part of the report to shareholders filed under Item 1 of this Form. |
| (b) | The Registrant made no divestments of securities in accordance with Section 13(c) of the Investment Company Act of 1940. |
Item 7. Disclosure of Proxy Voting Policies and Procedures for Closed-End Management Investment Companies.
Not applicable.
Item 8. Portfolio Managers of Closed-End Management Investment Companies.
Not applicable.
Item 9. Purchases of Equity Securities by Closed-End Management Investment Company & Affiliated Purchasers.
Not applicable.
Item 10. Submission of Matters to a Vote of Security Holders.
Not applicable.
Item 11. Controls and Procedures.
| (a) | The Registrant’s principal executive officer and principal financial officer have concluded, based on their evaluation of the Registrant’s disclosure controls and procedures as conducted within 90 days of the filing date of this report, that those disclosure controls and procedures provide reasonable assurance that the material information required to be disclosed by the Registrant on this report is recorded, processed, summarized and reported within the time periods specified in the Securities and Exchange Commission’s rules and forms. |
| (b) | There have not been any changes in registrant’s control over financial reporting (as defined in Rule 30a-3(d) under the Investment Company Act of 1940) that occurred during the last fiscal quarter of the period covered by this report that has materially affected, or is reasonably likely to materially affect, the registrant’s internal |
Table of Contents
control over financial reporting. |
Item 12. Disclosure of Securities Lending Activities for Closed-End Management Investment Companies.
Not applicable.
Item 13. Exhibits.
| (a)(1) | The code of ethics that is the subject of the disclosure required by Item 2 is attached hereto. |
| (a)(2) | Certifications pursuant to Rule 30a-2(a) under the 1940 Act and Section 302 of the Sarbanes-Oxley Act of 2002 are attached hereto. |
| (a)(3) | Any written solicitation to purchase securities under Rule 23c-1 under the 1940 Act – Not Applicable. |
| (b) | Certification required by Rule 30a-2(b) under the 1940 Act and Section 906 of the Sarbanes-Oxley Act of 2002 is attached hereto. |
Table of Contents
SIGNATURES
Pursuant to the requirements of the Securities Exchange Act of 1934 and the Investment Company Act of 1940, the Registrant has duly caused this report to be signed on its behalf by the undersigned, thereunto duly authorized.
AQR Funds
By: /s/ Marco Hanig
------------------------------------
Marco Hanig,
Principal Executive Officer
November 30, 2018
Pursuant to the requirements of the Securities Exchange Act of 1934 and the Investment Company Act of 1940, this report has been signed below by the following persons on behalf of the Registrant and in the capacities and on the dates indicated.
By: /s/ Marco Hanig
------------------------------------
Marco Hanig,
Principal Executive Officer
November 30, 2018
By: /s/ Heather Bonner
------------------------------------
Heather Bonner,
Principal Financial Officer
November 30, 2018