| UNITED STATES |
| SECURITIES AND EXCHANGE COMMISSION |
| Washington, D.C. 20549 |
| |
FORM N-CSR |
| |
CERTIFIED SHAREHOLDER REPORT OF REGISTERED |
MANAGEMENT INVESTMENT COMPANIES |
| |
| |
| |
| Investment Company Act File Number: 811-22243 |
|
| |
| T. Rowe Price Strategic Income Fund, Inc. |
|
| (Exact name of registrant as specified in charter) |
| |
| 100 East Pratt Street, Baltimore, MD 21202 |
|
| (Address of principal executive offices) |
| |
| David Oestreicher |
| 100 East Pratt Street, Baltimore, MD 21202 |
|
| (Name and address of agent for service) |
| |
| |
| Registrant’s telephone number, including area code: (410) 345-2000 |
| |
| |
| Date of fiscal year end: May 31 |
| |
| |
| Date of reporting period: November 30, 2009 |
Item 1: Report to Shareholders| Strategic Income Fund | November 30, 2009 |
The views and opinions in this report were current as of November 30, 2009. They are not guarantees of performance or investment results and should not be taken as investment advice. Investment decisions reflect a variety of factors, and the managers reserve the right to change their views about individual stocks, sectors, and the markets at any time. As a result, the views expressed should not be relied upon as a forecast of the fund’s future investment intent. The report is certified under the Sarbanes-Oxley Act, which requires mutual funds and other public companies to affirm that, to the best of their knowledge, the information in their financial reports is fairly and accurately stated in all material respects.
REPORTS ON THE WEB
Sign up for our E-mail Program, and you can begin to receive updated fund reports and prospectuses online rather than through the mail. Log in to your account at troweprice.com for more information.
Manager’s Letter
Fellow Shareholders
Since we began the fund’s operations on December 15, 2008, credit markets have experienced some of their best months in history. We are pleased to note that the fund’s design enabled it to take advantage of this opportunity not only in credit, but in a wide variety of bond sectors.
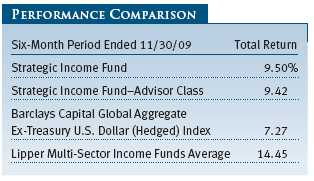
PERFORMANCE COMPARISON
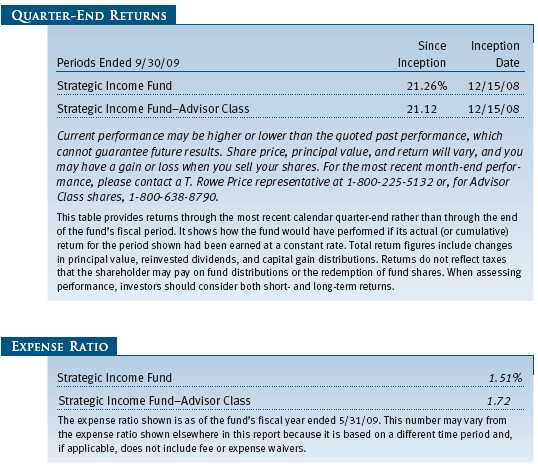
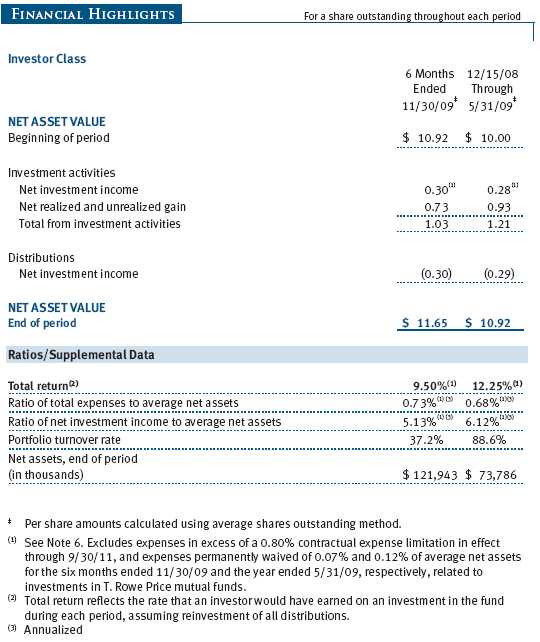
Your fund returned 9.50% for the six-month period ended November 30, 2009. (The performance of the Advisor Class was slightly lower, reflecting its different fee structure.) A healthy allocation to corporate credit—both investment grade and high yield—was the primary contributor to absolute and relative performance and helped us to outperform the Barclays Capital Global Aggregate Ex-Treasury U.S. Dollar (Hedged) Index by a healthy margin.
During the past six months, the lowest-quality credit sectors generally were the best performers. While our emphasis on credit sectors was timely, our holdings within credit—primarily in high yield—were oriented toward higher-rated bonds within the sector. With a focus on diversification and risk management, in periods of extreme risk appetite, such as the current environment, we would expect to deliver attractive returns but perhaps underperform Lipper peers that have more exposure to lower-quality sectors.
Our management approach seeks to diversify risk and add value from both active sector allocation and individual security selection. Within sector allocation, we look to add value across a wide range of fixed income sectors globally, including investment-grade and high yield corporate bonds issued in the U.S. and in foreign countries; dollar- and nondollar-denominated foreign debt securities; mortgage-, asset-, and commercial mortgage-backed securities; bank loans and loan participations; convertible bonds; and government securities. To capture currency valuation opportunities, we can position up to 20% of the portfolio in unhedged, foreign currency positions. The portfolio typically will include a large number of bonds from various market sectors to reduce the impact of any single holding on the fund’s performance. The fund typically has an intermediate average maturity, though we will target this based on our outlook for the direction of interest rates.
MARKET NEWS
The U.S. economy showed signs of life during our reporting period, though the economic data painted a mixed picture. Real gross domestic product rose in the third quarter at a 2.8% rate, while the unemployment rate climbed to more than 10%. Housing markets and consumer confidence are off their lows, but the recovery is still muted. Deflation remains an immediate concern, though large liquidity injections from the Federal Reserve and rising commodity prices place the market’s longer-term concern squarely on inflation.

The Federal Reserve and the U.S. Treasury Department support of markets continued in the form of “quantitative easing,” that is, purchasing mortgage-backed securities, agency securities, and Treasuries in order to add liquidity to the system. These increases in the Fed’s balance sheet have been offset to some extent by the unwinding of some liquidity support programs coinciding with the resumption of more normal functioning in previously distressed credit markets. At present, the Fed plans to continue its program of acquiring up to $1.25 trillion in agency-issued mortgage-backed securities (MBS) through the end of March 2010. Other programs, including the Fed’s Term Asset-Backed Securities Loan Facility (TALF), have improved conditions in the asset-backed and commercial mortgage-backed securities (CMBS) markets. The federal funds rate, the Fed’s traditional monetary driver, remained at historically low levels—between 0.00% and 0.25%—for the entire reporting period. The dollar fell against most major currencies.
PORTFOLIO HIGHLIGHTS
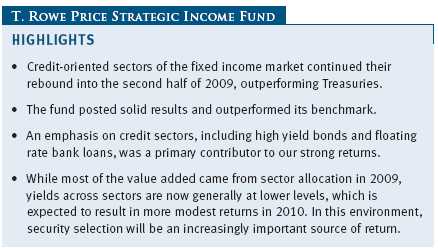
In the past six months, all fixed income sectors generated positive returns, with riskier assets outperforming U.S. Treasuries—a trend that began early in the year and continued through the end of the reporting period. This is in stark contrast to a year ago when fixed income investors shunned credit sectors and flocked to the safe haven of Treasuries.
An overweight to credit, specifically U.S. investment-grade and high yield debt, was the source of much of our return for the period. Throughout the past six months, we have maintained an exposure to high yield bonds and bank loans of around 20% of the fund’s assets. While our exposure was higher earlier in the year—roughly 30%—we reduced our high yield allocation as spreads and yields declined in the sector. In hindsight, we were premature in reducing our high yield exposure, as the rally showed remarkable strength. Spreads declined more rapidly and to a lower level than we expected, driven not only by companies restructuring their balance sheets but also by technical factors such as consistently strong flows into high yield. The resulting narrowing in high yield spreads has caused the sector to realize returns near 50% year-to-date.
Our high yield allocation was concentrated in the higher-rated, or more creditworthy, portion of the high yield universe. Our focus on high quality provided attractive returns but underperformed the lower-quality segment of the high yield market. Given the continued uncertain economic conditions, we remain comfortable from a risk-management standpoint maintaining a higher credit quality bias within the high yield sector.

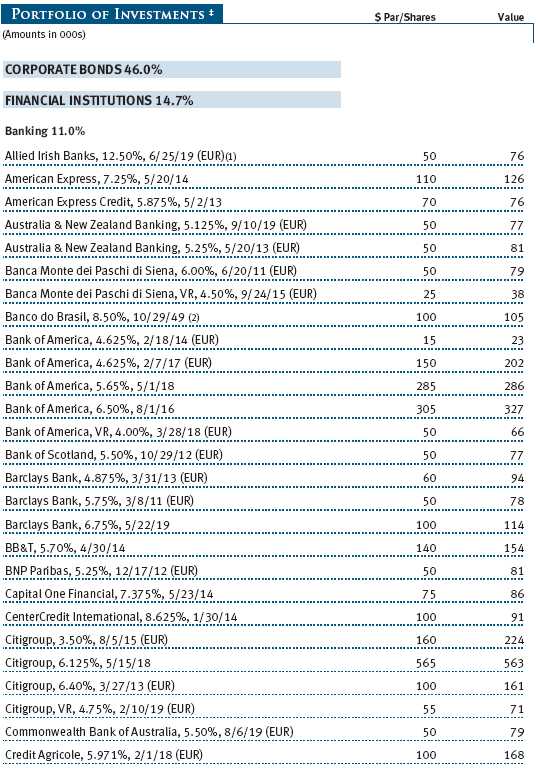
Our largest single sector exposure throughout the period was in U.S. investment-grade corporate bonds. This sector benefited from a robust new issue market, which has allowed companies to issue debt and repair their balance sheets. While the prospects for companies’ top-line—or revenue—growth are uncertain, this balance sheet repair, combined with cost-cutting initiatives, has improved fundamentals. Similar to high yield, investment-grade bonds also have benefited from strong technical flows due to their attractive yields versus Treasuries. In addition to U.S. credit exposure, we also have maintained an exposure to euro corporate bonds, though our allocation has been more modest than our U.S. corporate allocation. We continue to like credit here, despite lower yields, though we expect volatility given uncertain prospects for the economy.
While we remain positive on credit, we are concerned about MBS and have reduced our mortgage holdings accordingly. The concern stems from the expected end of Fed and Treasury MBS purchases, currently scheduled to conclude by the close of the first quarter of 2010. While we do not envision a dramatic sell-off, having a large buyer exit the market is likely to disrupt the supply/demand dynamics enough to have an impact on prices. We have increased our Treasury holdings as we have reduced mortgages, giving us liquid holdings that can be used to fund opportunities in other sectors as they arise.
Asset-backed securities also have benefited from government programs, specifically TALF. Spreads in this sector have narrowed, and, with the economic uncertainty, we see better value elsewhere. In contrast, some opportunities remain in CMBS. Stresses in the commercial property sector, including office buildings and shopping malls, are keeping yields high, providing ample opportunity for appreciation in selective higher-quality CMBS.
Global liquidity has been pressuring currencies around the world, but the dollar has been among the hardest hit. Some of the dollar’s decline reflects a reversal of the risk aversion trade into the dollar that we saw during the financial crisis, but it also reflects concerns over the high levels of liquidity pumped into the U.S. economy, large fiscal deficits, and future economic prospects. While we expect to see volatility and perhaps a temporary spike in the dollar, the longer-term prospects for the dollar appear weak.
With the uncertain prospects in the U.S., we are seeing more attractive relative value opportunities in global markets. Though valuations appear stretched in emerging markets, the development of corporate bond markets in emerging economies is providing attractive, longer-term opportunities. We also see opportunities in the local debt of select emerging markets, but we are cautious here as many countries appear to be entering a tightening cycle that could cause interest rates to rise globally. However, interest rates in many economies are already higher than in the U.S., which provides some level of cushion. Additionally, the expected further weakening of the dollar should provide some attractive currency opportunities going forward.
OUTLOOK
If the last two years of volatility in the markets were compared to navigating a ship in the ocean, we have lived through some very heavy seas in uncharted waters. The waves have calmed, but there are still many dangerous shoals.
For 2010, all eyes will be on the Fed and the timing and manner in which it begins its exit strategy. How this is done—whether through rate increases, balance sheet measures, or most likely a combination of tactics—will have implications for the direction of the economy and financial markets. While the fight is now against deflation, the massive liquidity injections have markets worried about eventual inflation, and the Fed will need to navigate the waters carefully to ensure the economy establishes proper footing without igniting unintended inflation.
While short rates are currently low and the yield curve is steep, we expect short rates could increase quickly and meaningfully when it becomes evident that the Fed will raise policy rates. We also expect long Treasury rates to experience upward pressure in the face of large supply to fund government deficits, perhaps in combination with inflation fears. We believe the yield curve will be flatter a year from now, with short rates increasing more than long rates. We are currently maintaining a short-duration (less sensitive to interest rate changes) stance versus our benchmark in anticipation of higher rates.
After two years of volatile returns in many sectors, we expect more stable results in 2010. Opportunities to add return through sector allocation are certainly less evident than they were a year ago, given lower yields across most sectors. In this context, we see 2010 as perhaps a coupon-clipping environment—one in which investors earn the bulk of their total return through dividends rather than price appreciation—that should provide reasonable returns. With opportunities to add value from sector allocation reduced, security selection is expected to be a more important contributor to performance. As always, we are confident that our global research capabilities will serve us well in this environment. We view fundamental credit research as key in identifying specific credit opportunities and managing risk.
Our active tactical sector allocation process continually assesses value across sectors. Given the uncertainties in the economy and Fed policy, we expect to experience volatility and changing valuations as events unfold. We view volatility as an opportunity, and we will diligently monitor markets, remaining prepared to act quickly as events transpire and opportunities appear.
Thank you for entrusting your money with T. Rowe Price.
Respectfully submitted,

Steven C. Huber
Chairman of the fund’s Investment Advisory Committee
December 18, 2009
The committee chairman has day-to-day responsibility for managing the portfolio and works with committee members in developing and executing the fund’s investment program.
RISKS OF FIXED INCOME INVESTING
Bonds are subject to interest rate risk (the decline in bond prices that usually accompanies a rise in interest rates) and credit risk (the chance that any fund holding could have its credit rating downgraded or that a bond issuer will default by failing to make timely payments of interest or principal), potentially reducing the fund’s income level and share price. Mortgage-backed securities are subject to prepayment risk, particularly if falling rates lead to heavy refinancing activity, and extension risk, which is an increase in interest rates that causes a fund’s average maturity to lengthen unexpectedly due to a drop in mortgage prepayments. This could increase the fund’s sensitivity to rising interest rates and its potential for price declines. High yield corporate bonds could have greater price declines than funds that invest primarily in high-quality bonds. Companies issuing high yield bonds are not as strong financially as those with higher credit ratings, so the bonds are usually considered speculative investments.
GLOSSARY
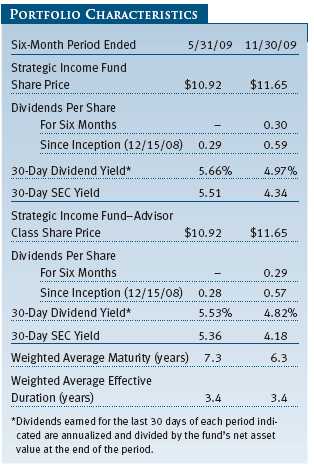
30-day SEC yield: A method of calculating a fund’s yield that assumes all portfolio securities are held until maturity. The Securities and Exchange Commission (SEC) requires all bond funds to calculate this yield. Yield will vary and is not guaranteed.
Average maturity: The average of the stated maturity dates of a bond or money market portfolio’s securities. The average maturity for a money market fund is measured in days, whereas a bond fund’s average maturity is measured in years. In general, the longer the average maturity, the greater the fund’s sensitivity to interest rate changes, which means greater price fluctuation.
Barclays Capital Global Aggregate Ex-Treasury U.S. Dollar (Hedged) Index: An index that provides a broad-based measure of the global investment-grade fixed rate debt markets that excludes U.S. Treasury securities and is hedged to the dollar.
Duration: A measure of a bond or bond fund’s sensitivity to changes in interest rates. For example, a fund with a four-year duration would fall about 4% in response to a one-percentage-point rise in interest rates, and vice versa.
Fed funds rate: The interest rate charged on overnight loans of reserves by one financial institution to another in the United States. The Federal Reserve sets a target federal funds rate to affect the direction of interest rates.
Lipper averages: The averages of available mutual fund performance returns for specified time periods in defined categories as tracked by Lipper Inc.
Weighted average maturity: The weighted average of the stated maturity dates of the portfolio’s securities. In general, the longer the average maturity, the greater the fund’s sensitivity to interest rate changes. A shorter average maturity usually means less interest rate sensitivity and therefore a less volatile portfolio.
Yield curve: A graphic depiction of the relationship between yields and maturity dates for a set of similar securities, such as Treasuries or municipal securities. Yield curves typically slope upward, indicating that longer maturities offer higher yields. When the yield curve is flat, there is little or no difference between the yields offered by shorter- and longer-term securities.
Performance and Expenses
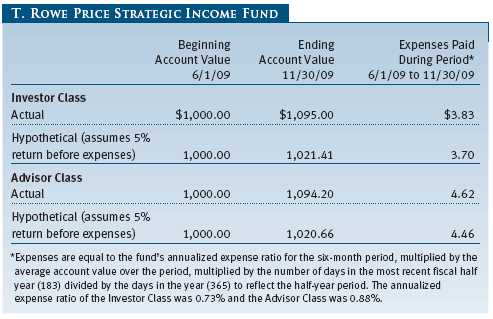
As a mutual fund shareholder, you may incur two types of costs: (1) transaction costs, such as redemption fees or sales loads, and (2) ongoing costs, including management fees, distribution and service (12b-1) fees, and other fund expenses. The following example is intended to help you understand your ongoing costs (in dollars) of investing in the fund and to compare these costs with the ongoing costs of investing in other mutual funds. The example is based on an investment of $1,000 invested at the beginning of the most recent six-month period and held for the entire period.
Please note that the fund has two share classes: The original share class (“investor class”) charges no distribution and service (12b-1) fee, and the Advisor Class shares are offered only through unaffiliated brokers and other financial intermediaries and charge a 0.25% 12b-1 fee. Each share class is presented separately in the table.
Actual Expenses
The first line of the following table (“Actual”) provides information about actual account values and expenses based on the fund’s actual returns. You may use the information in this line, together with your account balance, to estimate the expenses that you paid over the period. Simply divide your account value by $1,000 (for example, an $8,600 account value divided by $1,000 = 8.6), then multiply the result by the number in the first line under the heading “Expenses Paid During Period” to estimate the expenses you paid on your account during this period.
Hypothetical Example for Comparison Purposes
The information on the second line of the table (“Hypothetical”) is based on hypothetical account values and expenses derived from the fund’s actual expense ratio and an assumed 5% per year rate of return before expenses (not the fund’s actual return). You may compare the ongoing costs of investing in the fund with other funds by contrasting this 5% hypothetical example and the 5% hypothetical examples that appear in the shareholder reports of the other funds. The hypothetical account values and expenses may not be used to estimate the actual ending account balance or expenses you paid for the period.
Note: T. Rowe Price charges an annual small-account maintenance fee of $10, generally for accounts with less than $2,000 ($500 for UGMA/UTMA). The fee is waived for any investor whose T. Rowe Price mutual fund accounts total $25,000 or more, accounts employing automatic investing, and IRAs and other retirement plan accounts that utilize a prototype plan sponsored by T. Rowe Price (although a separate custodial or administrative fee may apply to such accounts). This fee is not included in the accompanying table. If you are subject to the fee, keep it in mind when you are estimating the ongoing expenses of investing in the fund and when comparing the expenses of this fund with other funds.
You should also be aware that the expenses shown in the table highlight only your ongoing costs and do not reflect any transaction costs, such as redemption fees or sales loads. Therefore, the second line of the table is useful in comparing ongoing costs only and will not help you determine the relative total costs of owning different funds. To the extent a fund charges transaction costs, however, the total cost of owning that fund is higher.
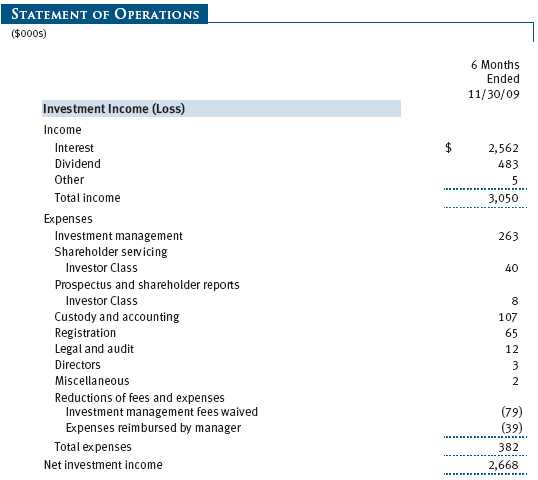
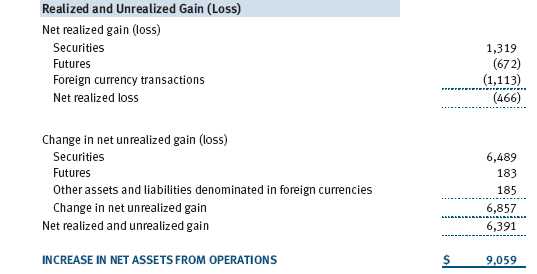
Unaudited
The accompanying notes are an integral part of these financial statements.
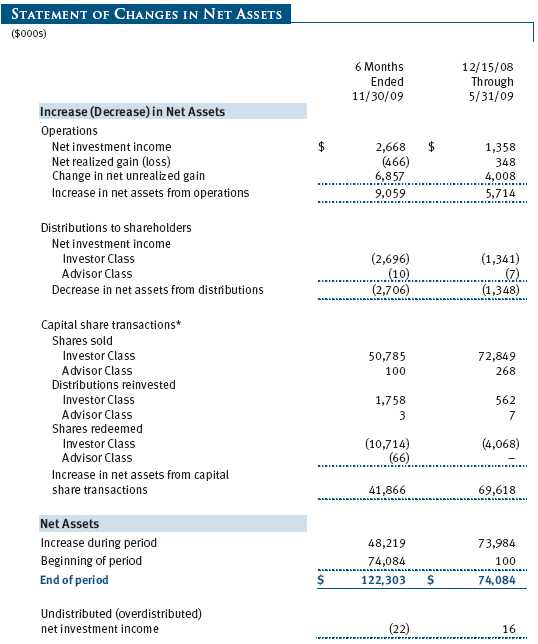
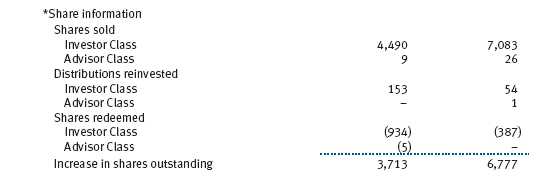
Unaudited

The accompanying notes are an integral part of these financial statements.
Unaudited


The accompanying notes are an integral part of these financial statements.
Unaudited
The accompanying notes are an integral part of these financial statements.
Unaudited
The accompanying notes are an integral part of these financial statements.
Unaudited
The accompanying notes are an integral part of these financial statements.
Unaudited
| NOTES TO FINANCIAL STATEMENTS |
T. Rowe Price Strategic Income Fund (the fund), is registered under the Investment Company Act of 1940 (the 1940 Act) as a diversified, open-end management investment company. The fund seeks to provide high income and some capital appreciation. The fund has two classes of shares: the Strategic Income Fund original share class, referred to in this report as the Investor Class, offered since December 15, 2008, and the Strategic Income Fund – Advisor Class (Advisor Class), offered since December 15, 2008. Advisor Class shares are sold only through unaffiliated brokers and other unaffiliated financial intermediaries that are compensated by the class for distribution, shareholder servicing, and/or certain administrative services under a Board-approved Rule 12b-1 plan. Each class has exclusive voting rights on matters related solely to that class; separate voting rights on matters that relate to both classes; and, in all other respects, the same rights and obligations as the other class.
NOTE 1 - SIGNIFICANT ACCOUNTING POLICIES
Basis of Preparation The accompanying financial statements were prepared in accordance with accounting principles generally accepted in the United States of America (GAAP), which require the use of estimates made by fund management. Fund management believes that estimates and security valuations are appropriate; however, actual results may differ from those estimates, and the security valuations reflected in the accompanying financial statements may differ from the value the fund ultimately realizes on the securities. Further, fund management believes that no events have occurred between November 30, 2009, the date of this report, and January 22, 2010, the date of issuance of the financial statements, that require adjustment of, or disclosure in, the accompanying financial statements.
Investment Transactions, Investment Income, and Distributions Income and expenses are recorded on the accrual basis. Premiums and discounts on debt securities are amortized for financial reporting purposes. Inflation adjustments to the principal amount of inflation-indexed bonds are reflected as interest income. Dividends received from mutual fund investments are reflected as dividend income; capital gain distributions are reflected as realized gain/loss. Earnings on investments recognized as partnerships for federal income tax purposes reflect the tax character of such earnings. Dividend income and capital gain distributions are recorded on the ex-dividend date. Income tax-related interest and penalties, if incurred, would be recorded as income tax expense. Investment transactions are accounted for on the trade date. Realized gains and losses are reported on the identified cost basis. Paydown gains and losses are recorded as an adjustment to interest income. Distributions to shareholders are recorded on the ex-dividend date. Income distributions are declared by each class daily and paid monthly. Capital gain distributions, if any, are generally declared and paid by the fund, annually.
Currency Translation Assets, including investments, and liabilities denominated in foreign currencies are translated into U.S. dollar values each day at the prevailing exchange rate, using the mean of the bid and asked prices of such currencies against U.S. dollars as quoted by a major bank. Purchases and sales of securities, income, and expenses are translated into U.S. dollars at the prevailing exchange rate on the date of the transaction. The effect of changes in foreign currency exchange rates on realized and unrealized security gains and losses is reflected as a component of security gains and losses.
Class Accounting The Advisor Class pays distribution, shareholder servicing, and/or certain administrative expenses in the form of Rule 12b-1 fees, in an amount not exceeding 0.25% of the class’s average daily net assets. Shareholder servicing, prospectus, and shareholder report expenses incurred by each class are charged directly to the class to which they relate. Expenses common to both classes and investment income are allocated to the classes based upon the relative daily net assets of each class’s settled shares; realized and unrealized gains and losses are allocated based upon the relative daily net assets of each class’s outstanding shares.
Credits The fund earns credits on temporarily uninvested cash balances held at the custodian, which reduce the fund’s custody charges. Custody expense in the accompanying financial statements is presented before reduction for credits.
NOTE 2 - VALUATION
The fund’s investments are reported at fair value as defined under GAAP. The fund determines the values of its assets and liabilities and computes its net asset value per share at the close of the New York Stock Exchange (NYSE), normally 4 p.m. ET, each day that the NYSE is open for business.
Valuation Methods Debt securities are generally traded in the over-the-counter (OTC) market. Securities with remaining maturities of one year or more at the time of acquisition are valued at prices furnished by dealers who make markets in such securities or by an independent pricing service, which considers the yield or price of bonds of comparable quality, coupon, maturity, and type, as well as prices quoted by dealers who make markets in such securities. Securities with remaining maturities of less than one year at the time of acquisition generally use amortized cost in local currency to approximate fair value. However, if amortized cost is deemed not to reflect fair value or the fund holds a significant amount of such securities with remaining maturities of more than 60 days, the securities are valued at prices furnished by dealers who make markets in such securities or by an independent pricing service.
Equity securities listed or regularly traded on a securities exchange or in the OTC market are valued at the last quoted sale price or, for certain markets, the official closing price at the time the valuations are made, except for OTC Bulletin Board securities, which are valued at the mean of the latest bid and asked prices. A security that is listed or traded on more than one exchange is valued at the quotation on the exchange determined to be the primary market for such security. Listed securities not traded on a particular day are valued at the mean of the latest bid and asked prices for domestic securities and the last quoted sale price for international securities.
Investments in mutual funds are valued at the mutual fund’s closing net asset value per share on the day of valuation. Investments in private investment companies are valued at the entity’s net asset value (or equivalent) as of the valuation date. Financial futures contracts are valued at closing settlement prices. Forward currency exchange contracts are valued using the prevailing forward exchange rate.
Other investments, including restricted securities, and those financial instruments for which the above valuation procedures are inappropriate or are deemed not to reflect fair value are stated at fair value as determined in good faith by the T. Rowe Price Valuation Committee, established by the fund’s Board of Directors.
Valuation Inputs Various inputs are used to determine the value of the fund’s financial instruments. These inputs are summarized in the three broad levels listed below:
Level 1 – quoted prices in active markets for identical securities
Level 2 – observable inputs other than Level 1 quoted prices (including, but not limited to, quoted prices for similar securities, interest rates, prepayment speeds, credit risk)
Level 3 – unobservable inputs
Observable inputs are those based on market data obtained from sources independent of the fund, and unobservable inputs reflect the fund’s own assumptions based on the best information available. The input levels are not necessarily an indication of the risk or liquidity associated with financial instruments at that level. The following table summarizes the financial instruments, based on the inputs used to determine their values on November 30, 2009:
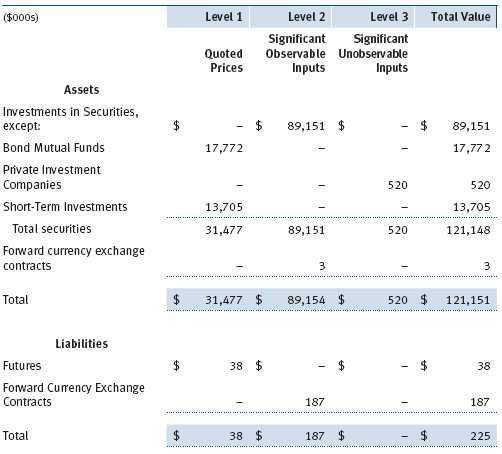
Following is a reconciliation of the fund’s Level 3 holdings for the six months ended November 30, 2009. Gain (loss) reflects both realized and change in unrealized gain (loss) on Level 3 holdings during the period, if any, and is included on the accompanying Statement of Operations. The change in unrealized gain/loss on Level 3 instruments held at November 30, 2009 totaled $16,000 for the six months ended November 30, 2009.

NOTE 3 - DERIVATIVE INSTRUMENTS
During the six months ended November 30, 2009, the fund invested in derivative instruments. As defined by GAAP, a derivative is a financial instrument whose value is derived from an underlying security price, foreign exchange rate, interest rate, index of prices or rates, or other variable; it requires little or no initial investment and permits or requires net settlement. The fund invests in derivatives only if the expected risks and rewards are consistent with its investment objectives, policies, and overall risk profile, as described in its prospectus and Statement of Additional Information. The fund may use derivatives for a variety of purposes, such as seeking to hedge against declines in principal value, increase yield, invest in an asset with greater efficiency and at a lower cost than is possible through direct investment, or to adjust portfolio duration and credit exposure. The risks associated with the use of derivatives are different from, and potentially much greater than, the risks associated with investing directly in the instruments on which the derivatives are based. Investments in derivatives can magnify returns positively or negatively; however, the fund at all times maintains sufficient cash reserves, liquid assets, or other SEC-permitted asset types to cover the settlement obligations under its open derivative contracts. During the six months ended November 30, 2009, the fund’s exposure to derivatives, based on underlying notional amounts, was generally between 38% and 53% of net assets.
The fund values its derivatives at fair value, as described below and in Note 2, and recognizes changes in fair value currently in its results of operations. Accordingly, the fund does not follow hedge accounting, even for derivatives employed as economic hedges. The following table summarizes the fair value of the fund’s derivative instruments held as of November 30, 2009 and the related location on the accompanying Statement of Assets and Liabilities, presented by primary underlying risk exposure:

Additionally, the amount of gains and losses on derivative instruments recognized in fund earnings during the six months ended November 30, 2009 and the related location on the accompanying Statement of Operations is summarized in the following table by primary underlying risk exposure:

Forward Currency Exchange Contracts The fund is subject to foreign currency exchange rate risk in the normal course of pursuing its investment objectives. It uses forward currency exchange contracts (forwards) primarily to protect its non-U.S. dollar-denominated securities from adverse currency movements relative to the U.S. dollar. A forward involves an obligation to purchase or sell a fixed amount of a specific currency on a future date at a price set at the time of the contract. Although certain forwards may be settled by exchanging only the net gain or loss on the contract, most forwards are settled with the exchange of the underlying currencies in accordance with the specified terms. Forwards are valued at the unrealized gain or loss on the contract, which reflects the net amount the fund either is entitled to receive or obligated to deliver, as measured by the difference between the forward exchange rates at the date of entry into the contract and the forward rates at the reporting date. Appreciated forwards are reflected as assets, and depreciated forwards are reflected as liabilities on the accompanying Statement of Assets and Liabilities. Risks related to the use of forwards include the possible failure of counterparties to meet the terms of the agreements; that anticipated currency movements will not occur, thereby reducing the fund’s total return; and the potential for losses in excess of the fund’s initial investment.
Futures Contracts The fund is subject to interest rate risk in the normal course of pursuing its investment objectives and uses futures contracts to help manage such risk. The fund may enter into futures contracts to manage exposure to interest rate and yield curve movements, security prices, foreign currencies, credit quality, and mortgage prepayments; as an efficient means of adjusting exposure to all or part of a target market; to enhance income; as a cash management tool; and/or to adjust portfolio duration and credit exposure. A futures contract provides for the future sale by one party and purchase by another of a specified amount of a particular underlying financial instrument at an agreed-upon price, date, time, and place. The fund currently invests only in exchange-traded futures, which generally are standardized as to maturity date, underlying financial instrument, and other contract terms. Upon entering into a futures contract, the fund is required to deposit with the broker cash or securities in an amount equal to a certain percentage of the contract value (initial margin deposit); the margin deposit must then be maintained at the established level over the life of the contract. Subsequent payments are made or received by the fund each day to settle daily fluctuations in the value of the contract (variation margin), which reflect changes in the value of the underlying financial instrument. Variation margin is recorded as unrealized gain or loss until the contract is closed. The value of a futures contract included in net assets is the amount of unsettled variation margin; net variation margin receivable is reflected as an asset, and net variation margin payable is reflected as a liability on the accompanying Statement of Assets and Liabilities. Risks related to the use of futures contracts include possible illiquidity of the futures markets, contract prices that can be highly volatile and imperfectly correlated to movements in hedged security values and/or interest rates, and potential losses in excess of the fund’s initial investment.
Counterparty Risk and Collateral The fund has entered into collateral agreements with certain counterparties to mitigate counterparty risk associated with over-the-counter (OTC) derivatives, including swaps and forward currency exchange contracts. Subject to certain minimum exposure requirements (which range from $100,000 to $500,000), collateral generally is determined based on the net aggregate unrealized gain or loss on all OTC derivative contracts with a particular counterparty. Collateral, both pledged by and for the benefit of the fund, is held in a segregated account by a third-party agent and can be in the form of cash or debt securities issued by the U.S. government or related agencies. Securities posted as collateral by the fund are so noted in the accompanying Portfolio of Investments and remain in the fund’s net assets. As of November 30, 2009, no collateral was pledged by either the fund or counterparties.
The fund’s maximum risk of loss from counterparty credit risk on OTC derivatives is the aggregate unrealized gain on appreciated contracts in excess of any collateral pledged by the counterparty for the benefit of the fund. Counterparty risk related to exchange-traded futures and options contracts is minimal because the exchange’s clearinghouse provides protection against defaults. In accordance with standard derivatives agreements, counterparties to OTC derivatives may be able to terminate derivative contracts prior to maturity in the event the fund fails to maintain sufficient asset coverage; its net assets decline by stated percentages; or it otherwise fails to meet the terms of its agreements, which would cause the fund to accelerate payment of any net liability owed to the counterparty under the contract. For exchange-traded derivatives such as futures and options, each broker in its sole discretion may change margin requirements applicable to the fund.
NOTE 4 - OTHER INVESTMENT TRANSACTIONS
Consistent with its investment objective, the fund engages in the following practices to manage exposure to certain risks or to enhance performance. The investment objective, policies, program, and risk factors of the fund are described more fully in the fund’s prospectus and Statement of Additional Information.
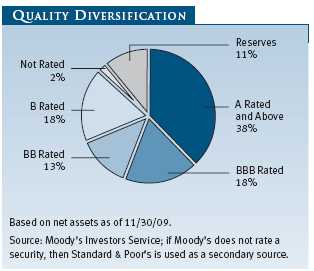
Noninvestment-Grade Debt Securities At November 30, 2009, approximately 18% of the fund’s net assets were invested, either directly or through its investment in T. Rowe Price institutional funds, in noninvestment-grade debt securities, commonly referred to as “high yield” or “junk” bonds. The noninvestment-grade bond market may experience sudden and sharp price swings due to a variety of factors, including changes in economic forecasts, stock market activity, large sustained sales by major investors, a high-profile default, or a change in the market’s psychology. These events may decrease the ability of issuers to make principal and interest payments and adversely affect the liquidity or value, or both, of such securities.
Restricted Securities The fund may invest in securities that are subject to legal or contractual restrictions on resale. Prompt sale of such securities at an acceptable price may be difficult and may involve substantial delays and additional costs.
T. Rowe Price Term Asset-Backed Opportunity Fund, L.L.C. During the six months ended November 30, 2009, the fund invested in the T. Rowe Price Term Asset-Backed Opportunity Fund, L.L.C. (private fund), a private investment company managed by Price Associates that participates in the Term Asset-Backed Securities Loan Facility (TALF) program created and administered by the Federal Reserve Bank of New York (FRBNY). The TALF program provides eligible borrowers with term loans secured by eligible asset-backed securities and/or commercial mortgage-backed securities, which are either owned by the borrower or purchased by the borrower and subsequently pledged as collateral for a TALF loan. TALF loans generally are nonrecourse in nature. The private fund is treated as a partnership for federal income tax purposes. It has a limited life extending five years from final termination of the TALF program, currently scheduled for June 30, 2010, with two possible one-year extensions. Invested capital generally will be returned to investors as underlying securities are liquidated and the TALF loans mature, with the balance paid at maturity of the private fund. Ownership interests in the private fund may not be redeemed, sold, or assigned. As of November 30, 2009, the fund had outstanding capital commitments in the amount of $1,226,000, which may be called at the discretion of the private fund’s manager.
Other Purchases and sales of portfolio securities other than short-term and U.S. government securities aggregated $44,142,000 and $15,262,000, respectively, for the six months ended November 30, 2009. Purchases and sales of U.S. government securities aggregated $17,996,000 and $19,515,000, respectively, for the six months ended November 30, 2009.
NOTE 5 - FEDERAL INCOME TAXES
No provision for federal income taxes is required since the fund intends to continue to qualify as a regulated investment company under Subchapter M of the Internal Revenue Code and distribute to shareholders all of its taxable income and gains. Distributions determined in accordance with federal income tax regulations may differ in amount or character from net investment income and realized gains for financial reporting purposes. Financial reporting records are adjusted for permanent book/tax differences to reflect tax character but are not adjusted for temporary differences. The amount and character of tax-basis distributions and composition of net assets are finalized at fiscal year-end; accordingly, tax-basis balances have not been determined as of November 30, 2009.
In accordance with federal tax regulations, the fund deferred recognition of certain capital loss amounts previously recognized in the prior fiscal year for financial reporting purposes until the current fiscal period for tax purposes. Such deferrals amounted to $421,000 and related to net capital losses realized between November 1 and the fund’s fiscal year-end date.
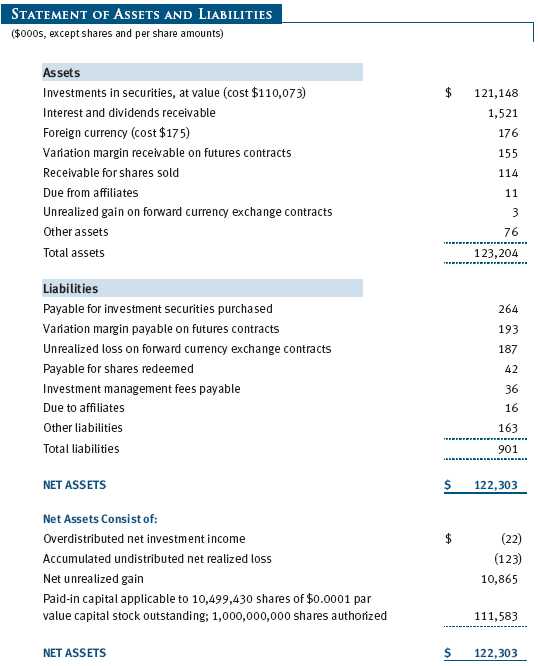
At November 30, 2009, the cost of investments for federal income tax purposes was $110,073,000. Net unrealized gain aggregated $10,865,000 at period-end, of which $11,276,000 related to appreciated investments and $411,000 related to depreciated investments.
NOTE 6 - RELATED PARTY TRANSACTIONS
The fund is managed by T. Rowe Price Associates, Inc. (the manager or Price Associates), a wholly owned subsidiary of T. Rowe Price Group, Inc. The investment management agreement between the fund and the manager provides for an annual investment management fee, which is computed daily and paid monthly. The fee consists of an individual fund fee, equal to 0.20% of the fund’s average daily net assets, and a group fee. The group fee rate is calculated based on the combined net assets of certain mutual funds sponsored by Price Associates (the group) applied to a graduated fee schedule, with rates ranging from 0.48% for the first $1 billion of assets to 0.285% for assets in excess of $220 billion. The fund’s group fee is determined by applying the group fee rate to the fund’s average daily net assets. At November 30, 2009, the effective annual group fee rate was 0.31%.
The Investor Class and Advisor Class are also subject to a contractual expense limitation through the limitation dates indicated in the table below. During the limitation period, the manager is required to waive its management fee and/or reimburse expenses, excluding interest, taxes, brokerage commissions, and extraordinary expenses, that would otherwise cause the class’s ratio of annualized total expenses to average net assets (expense ratio) to exceed its expense limitation. For a period of three years after the date of any reimbursement or waiver, each class is required to repay the manager for expenses previously reimbursed and management fees waived to the extent the class’s net assets have grown or expenses have declined sufficiently to allow repayment without causing the class’s expense ratio to exceed its expense limitation.
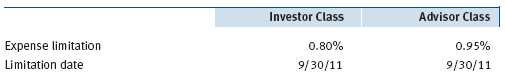
Pursuant to this agreement, management fees in the amount of $44,000 were waived and expenses in the amount of $39,000 were reimbursed by the manager during the six months ended November 30, 2009. Including these amounts, management fees waived and expenses previously reimbursed by the manager in the amount of $213,000 remain subject to repayment at November 30, 2009.
In addition, the fund has entered into service agreements with Price Associates and two wholly owned subsidiaries of Price Associates (collectively, Price). Price Associates computes the daily share prices and provides certain other administrative services to the fund. T. Rowe Price Services, Inc., provides shareholder and administrative services in its capacity as the fund’s transfer and dividend disbursing agent. T. Rowe Price Retirement Plan Services, Inc., provides subaccounting and recordkeeping services for certain retirement accounts invested in the Investor Class. For the six months ended November 30, 2009, expenses incurred pursuant to these service agreements were $85,000 for Price Associates; and $28,000 for T. Rowe Price Services, Inc. The total amount payable at period-end pursuant to these service agreements is reflected as Due to Affiliates in the accompanying financial statements.
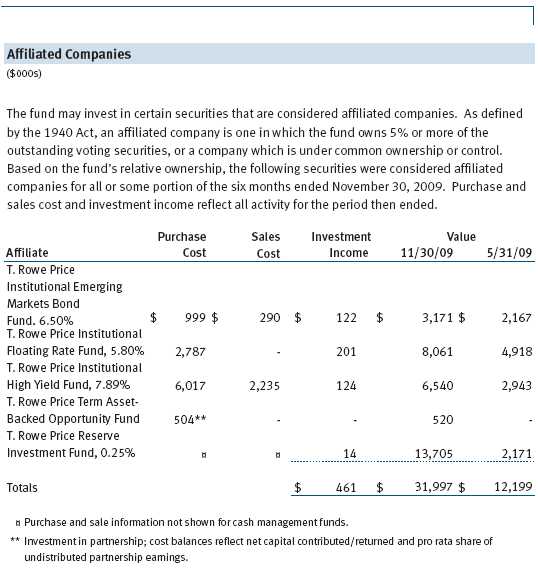
The fund may invest in the T. Rowe Price Reserve Investment Fund and the T. Rowe Price Government Reserve Investment Fund (collectively, the T. Rowe Price Reserve Investment Funds), open-end management investment companies managed by Price Associates and considered affiliates of the fund. The T. Rowe Price Reserve Investment Funds are offered as cash management options to mutual funds, trusts, and other accounts managed by Price Associates and/or its affiliates and are not available for direct purchase by members of the public. The T. Rowe Price Reserve Investment Funds pay no investment management fees.
The fund may also invest in certain T. Rowe Price institutional funds (underlying institutional funds) as a means of gaining efficient and cost-effective exposure to certain markets. The underlying institutional funds are open-end management investment companies managed by Price Associates and/or T. Rowe Price International, Inc. (collectively, the Price managers) and are considered affiliates of the fund. Each underlying institutional fund pays an all-inclusive management and administrative fee to its Price manager. To ensure that the fund does not incur duplicate fees, each Price manager has agreed to permanently waive a portion of its management fee charged to the fund in an amount sufficient to fully offset the fees paid by the underlying institutional funds related to fund assets invested therein. Accordingly, the accompanying Statement of Operations includes management fees permanently waived pursuant to this agreement. Annual fee rates and amounts waived within the accompanying Statement of Operations related to shares of the underlying institutional funds for the six months ended November 30, 2009, are as follows:

As of November 30, 2009, T. Rowe Price Group, Inc., and/or its wholly owned subsidiaries owned 2,475,000 shares of the Investor Class, and 25,799 shares of the Advisor Class, aggregating 24% of the fund’s net assets.
| INFORMATION ON PROXY VOTING POLICIES, PROCEDURES, AND RECORDS |
A description of the policies and procedures used by T. Rowe Price funds and portfolios to determine how to vote proxies relating to portfolio securities is available in each fund’s Statement of Additional Information, which you may request by calling 1-800-225-5132 or by accessing the SEC’s Web site, www.sec.gov. The description of our proxy voting policies and procedures is also available on our Web site, www.troweprice.com. To access it, click on the words “Our Company” at the top of our corporate homepage. Then, when the next page appears, click on the words “Proxy Voting Policies” on the left side of the page.
Each fund’s most recent annual proxy voting record is available on our Web site and through the SEC’s Web site. To access it through our Web site, follow the directions above, then click on the words “Proxy Voting Records” on the right side of the Proxy Voting Policies page.
| HOW TO OBTAIN QUARTERLY PORTFOLIO HOLDINGS |
The fund files a complete schedule of portfolio holdings with the Securities and Exchange Commission for the first and third quarters of each fiscal year on Form N-Q. The fund’s Form N-Q is available electronically on the SEC’s Web site (www.sec.gov); hard copies may be reviewed and copied at the SEC’s Public Reference Room, 450 Fifth St. N.W., Washington, DC 20549. For more information on the Public Reference Room, call 1-800-SEC-0330.
Item 2. Code of Ethics.
A code of ethics, as defined in Item 2 of Form N-CSR, applicable to its principal executive officer, principal financial officer, principal accounting officer or controller, or persons performing similar functions is filed as an exhibit to the registrant’s annual Form N-CSR. No substantive amendments were approved or waivers were granted to this code of ethics during the registrant’s most recent fiscal half-year.
Item 3. Audit Committee Financial Expert.
Disclosure required in registrant’s annual Form N-CSR.
Item 4. Principal Accountant Fees and Services.
Disclosure required in registrant’s annual Form N-CSR.
Item 5. Audit Committee of Listed Registrants.
Not applicable.
Item 6. Investments.
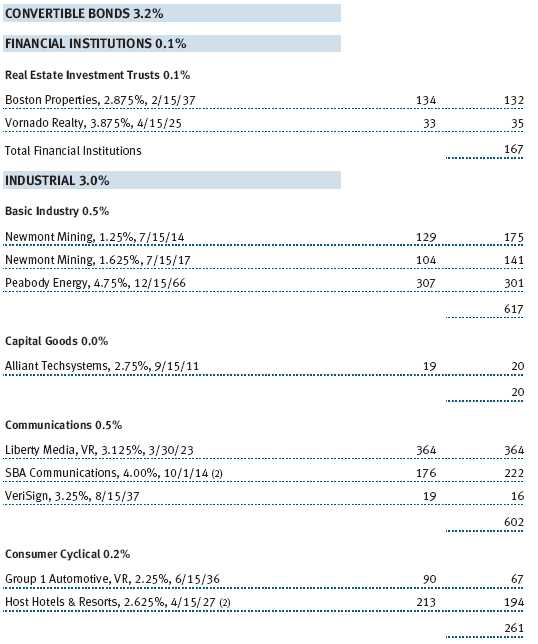
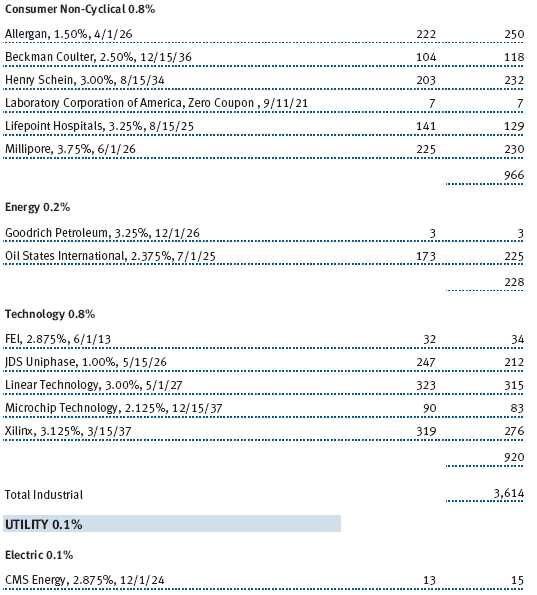
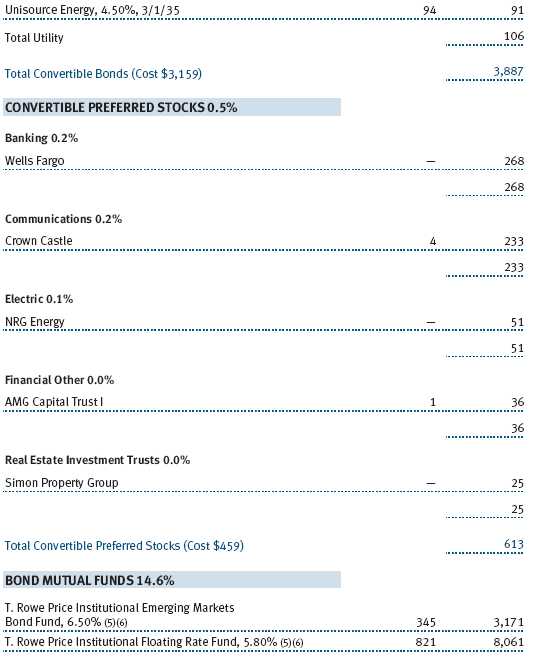
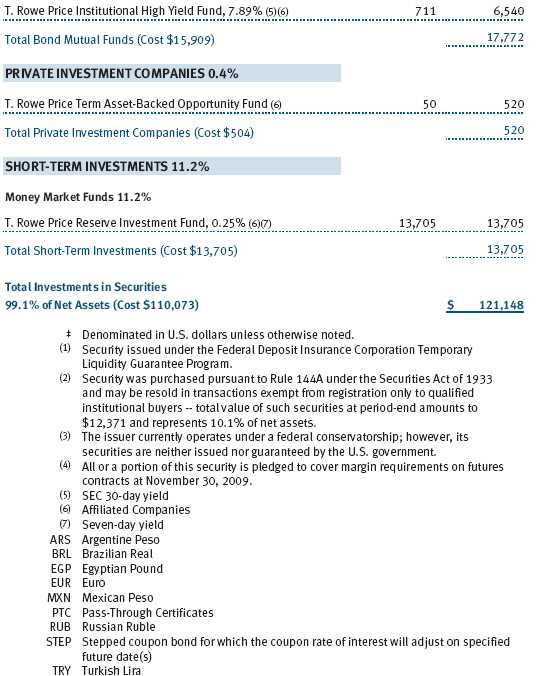
(a) Not applicable. The complete schedule of investments is included in Item 1 of this Form N-CSR.
(b) Not applicable.
Item 7. Disclosure of Proxy Voting Policies and Procedures for Closed-End Management Investment Companies.
Not applicable.
Item 8. Portfolio Managers of Closed-End Management Investment Companies.
Not applicable.
Item 9. Purchases of Equity Securities by Closed-End Management Investment Company and Affiliated Purchasers.
Not applicable.
Item 10. Submission of Matters to a Vote of Security Holders.
Not applicable.
Item 11. Controls and Procedures.
(a) The registrant’s principal executive officer and principal financial officer have evaluated the registrant’s disclosure controls and procedures within 90 days of this filing and have concluded that the registrant’s disclosure controls and procedures were effective, as of that date, in ensuring that information required to be disclosed by the registrant in this Form N-CSR was recorded, processed, summarized, and reported timely.
(b) The registrant’s principal executive officer and principal financial officer are aware of no change in the registrant’s internal control over financial reporting that occurred during the registrant’s second fiscal quarter covered by this report that has materially affected, or is reasonably likely to materially affect, the registrant’s internal control over financial reporting.
Item 12. Exhibits.
(a)(1) The registrant’s code of ethics pursuant to Item 2 of Form N-CSR is filed with the registrant’s annual Form N-CSR.
(2) Separate certifications by the registrant's principal executive officer and principal financial officer, pursuant to Section 302 of the Sarbanes-Oxley Act of 2002 and required by Rule 30a-2(a) under the Investment Company Act of 1940, are attached.
(3) Written solicitation to repurchase securities issued by closed-end companies: not applicable.
(b) A certification by the registrant's principal executive officer and principal financial officer, pursuant to Section 906 of the Sarbanes-Oxley Act of 2002 and required by Rule 30a-2(b) under the Investment Company Act of 1940, is attached.
| | |
SIGNATURES |
| |
| | Pursuant to the requirements of the Securities Exchange Act of 1934 and the Investment |
| Company Act of 1940, the registrant has duly caused this report to be signed on its behalf by the |
| undersigned, thereunto duly authorized. |
| |
| T. Rowe Price Strategic Income Fund, Inc. |
| |
| |
| |
| By | /s/ Edward C. Bernard |
| | Edward C. Bernard |
| | Principal Executive Officer |
| |
| Date | January 22, 2010 |
| |
| |
| |
| | Pursuant to the requirements of the Securities Exchange Act of 1934 and the Investment |
| Company Act of 1940, this report has been signed below by the following persons on behalf of |
| the registrant and in the capacities and on the dates indicated. |
| |
| |
| By | /s/ Edward C. Bernard |
| | Edward C. Bernard |
| | Principal Executive Officer |
| |
| Date | January 22, 2010 |
| |
| |
| |
| By | /s/ Gregory K. Hinkle |
| | Gregory K. Hinkle |
| | Principal Financial Officer |
| |
| Date | January 22, 2010 |