UNITED STATES
SECURITIES AND EXCHANGE COMMISSION
Washington, D.C. 20549
FORM N-CSR
CERTIFIED SHAREHOLDER REPORT OF REGISTERED
MANAGEMENT INVESTMENT COMPANIES
Investment Company Act File Number: 811-22243
| T. Rowe Price Strategic Income Fund, Inc. |
|
| (Exact name of registrant as specified in charter) |
| |
| 100 East Pratt Street, Baltimore, MD 21202 |
|
| (Address of principal executive offices) |
| |
| David Oestreicher |
| 100 East Pratt Street, Baltimore, MD 21202 |
|
| (Name and address of agent for service) |
Registrant’s telephone number, including area code: (410) 345-2000
Date of fiscal year end: May 31
Date of reporting period: November 30, 2011
Item 1. Report to Shareholders
| Strategic Income Fund | November 30, 2011 |
The views and opinions in this report were current as of November 30, 2011. They are not guarantees of performance or investment results and should not be taken as investment advice. Investment decisions reflect a variety of factors, and the managers reserve the right to change their views about individual stocks, sectors, and the markets at any time. As a result, the views expressed should not be relied upon as a forecast of the fund’s future investment intent. The report is certified under the Sarbanes-Oxley Act, which requires mutual funds and other public companies to affirm that, to the best of their knowledge, the information in their financial reports is fairly and accurately stated in all material respects.
REPORTS ON THE WEB
Sign up for our E-mail Program, and you can begin to receive updated fund reports and prospectuses online rather than through the mail. Log in to your account at troweprice.com for more information.
Manager’s Letter
Fellow Shareholders
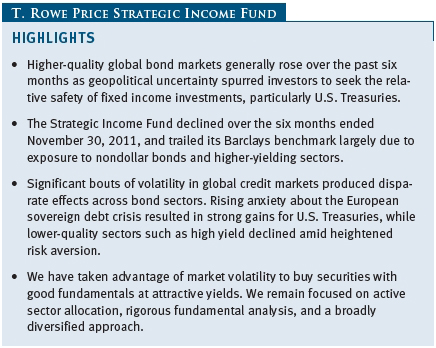
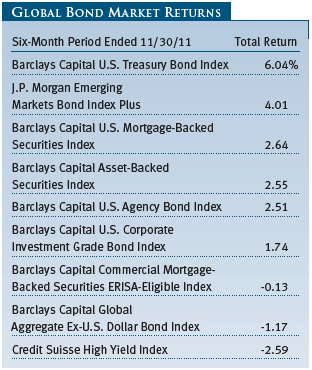
Global bond markets rose overall in the past six months due to growing unease about the world economy. More than in any other period in recent memory, politics played an outsized role in driving market activity as investors appeared to lose faith in the ability of policymakers to resolve deepening fiscal crises in the U.S. and Europe. Weak economic data in both emerging and developed markets sparked talk of another global downturn. Starting in July, volatility soared and liquidity dried up in credit markets, producing disparate effects across sectors. Long-term Treasuries posted their best performance since the start of the 2008 crisis as investors fled to the perceived safe haven of U.S. government debt. Conversely, high yield issues fell as investors retreated from riskier assets. The Strategic Income Fund declined and trailed its benchmark, chiefly due to holdings in so-called risk assets including high yield bonds and bank loans, which suffered as investor sentiment deteriorated.
PERFORMANCE COMPARISON
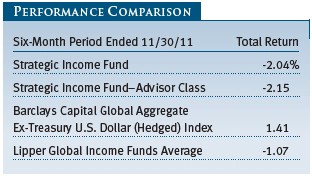
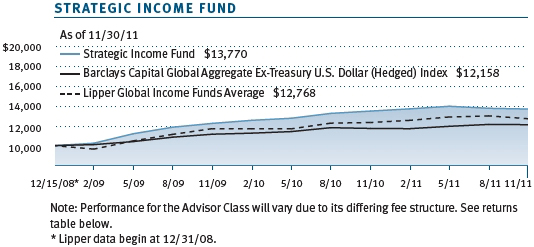
The Strategic Income Fund returned -2.04% over the six-month period ended November 30, 2011. The fund underperformed the Barclays Capital Global Aggregate Ex-Treasury U.S. Dollar (Hedged) Index and the Lipper Global Income Funds Average.
The fund aims to provide a highly diversified fixed income portfolio that invests in a broad range of securities: domestic and foreign, developed and emerging markets, higher risk and higher quality, government-issued and corporate bonds. The fund represents a more aggressive diversified bond fund than other T. Rowe Price offerings due to its substantial allocations to higher-risk sectors and foreign bonds and our willingness to deviate significantly from the benchmark when we perceive attractive opportunities. However, the fund is designed to be less volatile than bond funds concentrated on a single higher-risk sector, such as high yield.
MARKET ENVIRONMENT
Europe’s sovereign debt crisis dominated headlines over the period as investors grew more anxious about a Greek default and policymakers’ inability to prevent the financial contagion from spreading. The crisis seemed to improve in late July when officials agreed to strengthen the region’s bailout fund and provide a second aid package for Greece. But uncertainty soon returned as worries focused on European banks’ exposure to debt from struggling eurozone countries. Talk of a comprehensive plan ahead of an October 26 summit of eurozone leaders revived optimism for a resolution to the crisis. The summit produced a framework aimed at protecting the eurozone by getting private investors like banks to accept a steep loss on their Greek bonds, expanding the bailout fund, and raising banks’ capital requirements. Higher-risk fixed income sectors rallied on hopes that an end to the crisis was near, but gains were short lived as it became clear that the plan wasn’t enough to stem the contagion. Borrowing costs soared to euro-era record highs in Italy and Spain, and yields crept higher in European countries that were previously seen as safe from the turmoil. Liquidity in short-term lending markets for European banks began to dry up as foreign investors retreated, forcing lenders in need of financing to turn to the European Central Bank.
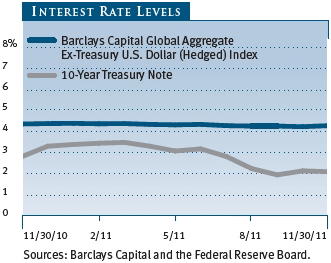
Worries about the ballooning U.S. deficit and partisan politics also rattled investor confidence. During the summer, Congress and the White House engaged in an acrimonious debate over raising the federal debt ceiling that took the country to the brink of default. Days after a last-ditch deal was reached to lift the debt ceiling in early August, Standard & Poor’s downgraded its U.S. long-term credit rating from AAA to AA+. As part of the debt ceiling deal, Congress charged a bipartisan group of lawmakers with finding at least $1.2 trillion of deficit reduction, but the so-called super committee failed to reach a compromise by the November deadline, setting the stage for automatic spending cuts starting in 2013. Treasuries rallied following the news—just as they did following the S&P downgrade—suggesting that investors continue to view Treasuries positively as the risk-averse investment of choice, rather than negatively due to concerns about the creditworthiness of the U.S. government. During the reporting period, the price of Treasuries soared—pushing much of the Treasury yield curve down to historic lows—as widespread uncertainty led investors to seek refuge in the relative safety of U.S. government debt. The yield on the U.S. 10-year Treasury fell to a record low of 1.67% on September 23. While Treasuries pared some of their gains by the end of November, ongoing uncertainty about the eurozone and global growth concerns have so far staved off a meaningful sell-off in Treasuries.
With fiscal policy effectively sidelined, investors focused on the Federal Reserve and its capacity to engage in further monetary stimulus. The Fed said on August 9 that it would likely keep its benchmark interest rate near 0% until at least mid-2013 due to slow economic growth and promised to explore additional policy options. On September 21, a divided Federal Reserve policymaking committee announced a new round of stimulus measures. Dubbed Operation Twist, the Fed’s plan involved moving $400 billion of its short-term Treasury holdings into longer-term issues in an effort to put downward pressure on long-term interest rates. The Fed also announced it would reinvest proceeds of mortgage-backed securities (MBS) back into the sector to support the moribund housing market. Still, many investors worried that lower borrowing costs would accomplish little in the face of high unemployment. The U.S. jobless rate hovered at roughly 9% over the reporting period, although it fell to 8.6% in November, its lowest level in 32 months. A series of weak economic data over the summer raised fears of a “double dip” recession, but more recent reports have shown that the U.S. recovery remains on track, albeit with modest growth expectations.
Emerging market debt produced disparate returns over the period. Dollar-denominated emerging market bonds advanced, while local currency emerging market bonds fell due to risk aversion and strength in the dollar. Despite their reputation for risk, emerging market economies appear to be in much better shape than the developed world, making us optimistic about their longer-term growth prospects. Rapid growth since the 2008 crisis has stoked inflation in many emerging markets, leading Brazil, China, and India to wage aggressive monetary tightening campaigns in the past year. Recently, growth has replaced inflation as the chief concern, and many countries have started reducing interest rates in an effort to support growth and safeguard their economies from the turmoil in developed markets. While the dollar could continue to do well near term, we have a positive long-term view for local currency emerging market debt. We also favor dollar-denominated emerging market corporate bonds, particularly once near-term growth concerns are resolved. We hold investments in many major emerging markets, including currency exposure to China, Mexico, and Brazil.
PERFORMANCE AND INVESTMENT REVIEW
Our positions in higher-risk credit sectors such as high yield and bank loans detracted from performance as the European debt crisis, slowing global growth, and political gridlock in the U.S. sapped investors’ risk appetite. High yield issues were particularly volatile as the protracted crisis in Europe took a heavy toll on confidence, with each setback in negotiations sparking a sell-off in the sector. Despite recent performance, we continue to have a favorable view of high yield valuations and have taken advantage of the volatility to increase our allocation to the sector. Starting in 2009, many high yield issuers took advantage of low interest rates to refinance debt, extend maturities, and shore up their balance sheets. While we have noted a decline in the quality of some recent issues, the risk of corporate defaults remains low, and companies’ balance sheets overall have markedly improved in recent years. Some lower-quality issuers may be at greater risk for default in the event of another downturn, but fundamentals are generally strong and the default risk is low for most higher-quality companies, where we have concentrated our purchases.
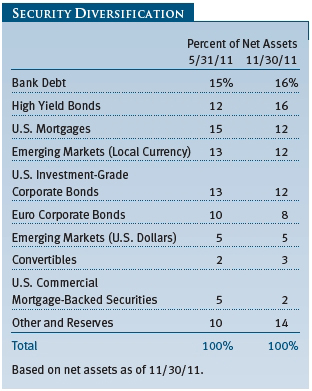
We maintained a meaningful exposure to bank loans, which sold off with high yield bonds as investors retreated from riskier assets. We continue to have a positive view of bank loans for many of the same reasons we favor high yield bonds. Bank loans, also known as leveraged loans, are made to below investment-grade companies and carry a floating interest rate. Such loans typically have less credit risk than high yield bonds and historically have had a better recovery rate in defaults because they are more senior in a firm’s capital structure. (See the Glossary for more on leveraged loans.)
To offset our increased holdings in higher-yielding sectors, we reduced exposure to less liquid, credit-sensitive investment-grade sectors. For example, we reduced our exposure to U.S. commercial mortgage-backed securities, which are tied to the health of the commercial property market and less liquid than agency MBS. We pared exposure to investment-grade corporate bonds, particularly in Europe, due to uncertainty about the near-term repercussions of the eurozone debt crisis. Since our last letter at the end of May, we have raised our holdings of U.S. Treasuries and maintain a meaningful allocation to agency MBS. Given the heightened volatility and drop in liquidity in credit markets, we believe it is important to have ample liquidity in the portfolio to maintain the flexibility to easily adjust our allocations and take advantage of new opportunities as they arise in a rapidly changing environment. Treasuries are currently expensive relative to their fundamentals due to their safe-haven status, and we believe they will decline over the long term. But in the near term, risk aversion driven by Europe’s financial crisis and the uncertain global growth outlook could keep yields low. Agency MBS also provide liquidity, and recent Federal Reserve initiatives have provided them with a favorable supply/demand outlook.
OUTLOOK
Global credit markets face numerous near-term risks that have intensified since the summer. These headwinds include the European debt crisis, a weak global growth outlook, and a loss of faith in policymakers to fix deep-rooted economic problems. Unfortunately, recent events have made it clear that the direction of global financial markets largely rests with governments in the U.S. and Europe, making outcomes hard to predict and risk management especially challenging. Until policymakers can decisively resolve Europe’s debt problems, we believe that risk aversion will remain high and credit markets volatile.
We expect U.S. interest rates to rise over the long term as the economy continues its recovery. In the near term, we believe Treasury yields and credit spreads will be range-bound and volatility will remain high. Unfortunately, much of the current risk aversion stems from issues that have no quick or easy solution. For more than two years, fiscal policymakers in the U.S. and Europe have been struggling without success to address the twin challenges of reducing debt and increasing growth. In this uncertain environment, we believe our barbell-like strategy—investing in Treasuries and MBS for liquidity, while holding high yield and bank loans for added yield—positions the fund to perform well over the long term. We have taken advantage of recent volatility to buy bonds with solid fundamentals at attractive yields, and we expect that rapidly changing valuations will provide plenty of attractive investment opportunities.
We believe that rigorous fundamental research is crucial for delivering good returns over the long run and that a global search for value will be more important as non-U.S. markets offer some of the best combinations of risk and return. T. Rowe Price has invested substantial resources in our credit research efforts globally, and we are privileged to work with a talented team of professionals around the world to uncover opportunities for our shareholders.
Thank you for investing with T. Rowe Price.
Respectfully submitted,

Steven C. Huber
Chairman of the fund’s Investment Advisory Committee
December 12, 2011
The committee chairman has day-to-day responsibility for managing the portfolio and works with committee members in developing and executing the fund’s investment program.
YIELD DATA CORRECTION
Due to a systems error, the 30-day SEC yields published in the May 31, 2011, annual report for the Strategic Income Fund were incorrect.
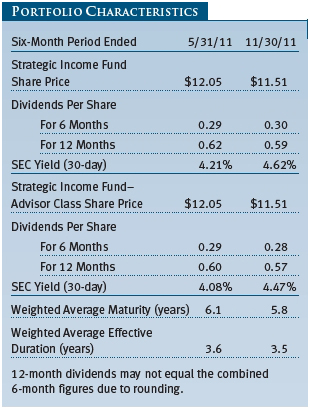
The correct 30-day yields as of May 31, 2011, were 4.21% for Investor Class shares and 4.08% for Advisor Class shares. We apologize for any inconvenience caused by these errors.
RISKS OF BOND INVESTING
Bonds are subject to interest rate risk, the decline in bond prices that usually accompanies a rise in interest rates, and credit risk, the chance that any fund holding could have its credit rating downgraded or that a bond issuer will default (fail to make timely payments of interest or principal), potentially reducing the fund’s income level and share price. Mortgage-backed securities are subject to prepayment risk, particularly if falling rates lead to heavy refinancing activity, and extension risk, which is an increase in interest rates that causes a fund’s average maturity to lengthen unexpectedly due to a drop in mortgage prepayments. This could increase the fund’s sensitivity to rising interest rates and its potential for price declines.
GLOSSARY
Barclays Capital Asset-Backed Securities Index: Tracks the performance of securities backed by assets including credit card, home equity, and auto loans.
Barclays Capital U.S. Commercial Mortgage-Backed Securities ERISA-Eligible Index: An unmanaged index that tracks the performance of commercial mortgage-backed securities.
Barclays Capital Global Aggregate Ex-Treasury U.S. Dollar (Hedged) Index: Tracks the global investment-grade fixed rate debt markets, excluding U.S. Treasury securities, and is hedged to the dollar.
Barclays Capital Global Aggregate Ex-U.S. Dollar Bond Index: Tracks the performance of government, corporate, agency, and mortgage-related bonds in Europe, the Asia-Pacific region, and Canada.
Barclays Capital U.S. Mortgage-Backed Securities Index: An index that tracks the performance of the mortgage-backed pass-through securities of Ginnie Mae (GNMA), Fannie Mae (FNMA), and Freddie Mac (FHLMC).
Barclays Capital U.S. Agency Bond Index: Tracks the performance of securities issued by U.S. agencies such as Fannie Mae, Freddie Mac, and the Federal Home Loan Bank.
Barclays Capital U.S. Corporate Investment Grade Bond Index: A measure of corporate and noncorporate fixed income securities that are primarily rated investment grade (Baa by Moody’s Investors Service and BBB by Standard & Poor’s).
Barclays Capital U.S. Treasury Bond Index: An unmanaged index of publicly traded obligations of the U.S. Treasury.
Basis point: One one-hundredth of a percentage point, or 0.01%.
Credit Suisse High Yield Index: An index that tracks the performance of domestic noninvestment-grade corporate bonds.
Duration: A measure of a bond fund’s sensitivity to changes in interest rates. For example, a fund with a four-year duration would fall about 4% in response to a one-percentage-point rise in interest rates, and vice versa.
J.P. Morgan Emerging Markets Bond Index Plus: Tracks the total return of U.S. dollar and external currency debt instruments traded in emerging markets.
LIBOR: The London Interbank Offered Rate, which is a benchmark for short-term taxable rates.
Leveraged Loans: Leveraged loans, also known as bank loans, are made to companies with below investment-grade credit ratings and carry a floating interest rate. Such loans typically have less credit risk than high yield bonds and historically have had a better recovery rate in defaults because they are more senior in a firm’s capital structure. The coupon on floating rate loans typically increases as the reference rate, usually LIBOR, increases. This provides investors with some protection against rising short-term interest rates.
Lipper averages: The averages of available mutual fund performance returns for specified time periods in categories defined by Lipper Inc.
SEC yield (30-day): A method of calculating a fund’s yield that assumes all portfolio securities are held until maturity. Yield will vary and is not guaranteed.
Weighted average maturity: A measure of a fund’s interest rate sensitivity. In general, the longer the average maturity, the greater the fund’s sensitivity to interest rate changes. The weighted average maturity may take into account the interest rate readjustment dates for certain securities. Money funds must maintain a weighted average maturity of less than 60 days.
Yield curve: A graph depicting the relationship between yields and maturity dates for a set of similar securities. These curves are in constant flux. One of the key activities in managing any fixed income portfolio is to study the trends reflected by yield curves.
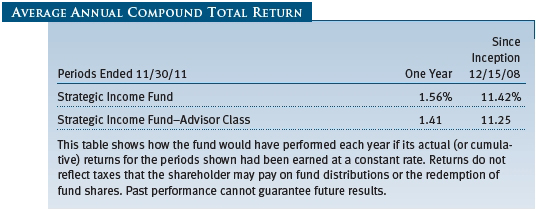
Performance and Expenses
This chart shows the value of a hypothetical $10,000 investment in the fund over the past 10 fiscal year periods or since inception (for funds lacking 10-year records). The result is compared with benchmarks, which may include a broad-based market index and a peer group average or index. Market indexes do not include expenses, which are deducted from fund returns as well as mutual fund averages and indexes.
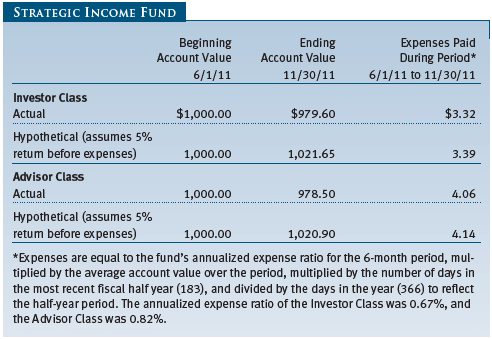
As a mutual fund shareholder, you may incur two types of costs: (1) transaction costs, such as redemption fees or sales loads, and (2) ongoing costs, including management fees, distribution and service (12b-1) fees, and other fund expenses. The following example is intended to help you understand your ongoing costs (in dollars) of investing in the fund and to compare these costs with the ongoing costs of investing in other mutual funds. The example is based on an investment of $1,000 invested at the beginning of the most recent six-month period and held for the entire period.
Actual Expenses
The first line of the following table (“Actual”) provides information about actual account values and expenses based on the fund’s actual returns. You may use the information on this line, together with your account balance, to estimate the expenses that you paid over the period. Simply divide your account value by $1,000 (for example, an $8,600 account value divided by $1,000 = 8.6), then multiply the result by the number on the first line under the heading “Expenses Paid During Period” to estimate the expenses you paid on your account during this period.
Hypothetical Example for Comparison Purposes
The information on the second line of the table (“Hypothetical”) is based on hypothetical account values and expenses derived from the fund’s actual expense ratio and an assumed 5% per year rate of return before expenses (not the fund’s actual return). You may compare the ongoing costs of investing in the fund with other funds by contrasting this 5% hypothetical example and the 5% hypothetical examples that appear in the shareholder reports of the other funds. The hypothetical account values and expenses may not be used to estimate the actual ending account balance or expenses you paid for the period.
Note: T. Rowe Price charges an annual account service fee of $20, generally for accounts with less than $10,000 ($1,000 for UGMA/UTMA). The fee is waived for any investor whose T. Rowe Price mutual fund accounts total $50,000 or more; accounts employing automatic investing; accounts electing to receive electronic delivery of account statements, transaction confirmations, prospectuses, and shareholder reports; accounts of an investor who is a T. Rowe Price Preferred Services, Personal Services, or Enhanced Personal Services client (enrollment in these programs generally requires T. Rowe Price assets of at least $100,000); and IRAs and other retirement plan accounts that utilize a prototype plan sponsored by T. Rowe Price (although a separate custodial or administrative fee may apply to such accounts). This fee is not included in the accompanying table. If you are subject to the fee, keep it in mind when you are estimating the ongoing expenses of investing in the fund and when comparing the expenses of this fund with other funds.
You should also be aware that the expenses shown in the table highlight only your ongoing costs and do not reflect any transaction costs, such as redemption fees or sales loads. Therefore, the second line of the table is useful in comparing ongoing costs only and will not help you determine the relative total costs of owning different funds. To the extent a fund charges transaction costs, however, the total cost of owning that fund is higher.
Unaudited
The accompanying notes are an integral part of these financial statements.
Unaudited

The accompanying notes are an integral part of these financial statements.
Unaudited


The accompanying notes are an integral part of these financial statements.
Unaudited
The accompanying notes are an integral part of these financial statements.
Unaudited

The accompanying notes are an integral part of these financial statements.
Unaudited
The accompanying notes are an integral part of these financial statements.
Unaudited
| Notes to Financial Statements |
T. Rowe Price Strategic Income Fund (the fund), is registered under the Investment Company Act of 1940 (the 1940 Act) as a diversified, open-end management investment company. The fund seeks to provide high income and some capital appreciation. The fund has two classes of shares: the Strategic Income Fund original share class, referred to in this report as the Investor Class, offered since December 15, 2008, and the Strategic Income Fund–Advisor Class (Advisor Class), offered since December 15, 2008. Advisor Class shares are sold only through unaffiliated brokers and other unaffiliated financial intermediaries that are compensated by the class for distribution, shareholder servicing, and/or certain administrative services under a Board-approved Rule 12b-1 plan. Each class has exclusive voting rights on matters related solely to that class; separate voting rights on matters that relate to both classes; and, in all other respects, the same rights and obligations as the other class.
NOTE 1 - SIGNIFICANT ACCOUNTING POLICIES
Basis of Preparation The accompanying financial statements were prepared in accordance with accounting principles generally accepted in the United States of America (GAAP), which require the use of estimates made by management. Management believes that estimates and valuations are appropriate; however, actual results may differ from those estimates, and the valuations reflected in the accompanying financial statements may differ from the value ultimately realized upon sale or maturity.
Investment Transactions, Investment Income, and Distributions Income and expenses are recorded on the accrual basis. Premiums and discounts on debt securities are amortized for financial reporting purposes. Paydown gains and losses are recorded as an adjustment to interest income. Inflation adjustments to the principal amount of inflation-indexed bonds are reflected as interest income. Dividends received from mutual fund investments are reflected as dividend income; capital gain distributions are reflected as realized gain/loss. Earnings on investments recognized as partnerships for federal income tax purposes reflect the tax character of such earnings. Dividend income and capital gain distributions are recorded on the ex-dividend date. Income tax-related interest and penalties, if incurred, would be recorded as income tax expense. Investment transactions are accounted for on the trade date. Realized gains and losses are reported on the identified cost basis. Distributions to shareholders are recorded on the ex-dividend date. Income distributions are declared by each class daily and paid monthly. Capital gain distributions, if any, are generally declared and paid by the fund annually.
Currency Translation Assets, including investments, and liabilities denominated in foreign currencies are translated into U.S. dollar values each day at the prevailing exchange rate, using the mean of the bid and asked prices of such currencies against U.S. dollars as quoted by a major bank. Purchases and sales of securities, income, and expenses are translated into U.S. dollars at the prevailing exchange rate on the date of the transaction. The effect of changes in foreign currency exchange rates on realized and unrealized security gains and losses is reflected as a component of security gains and losses.
Class Accounting The Advisor Class pays distribution, shareholder servicing, and/or certain administrative expenses in the form of Rule 12b-1 fees, in an amount not exceeding 0.25% of the class’s average daily net assets. Shareholder servicing, prospectus, and shareholder report expenses incurred by each class are charged directly to the class to which they relate. Expenses common to both classes and investment income are allocated to the classes based upon the relative daily net assets of each class’s settled shares; realized and unrealized gains and losses are allocated based upon the relative daily net assets of each class’s outstanding shares.
Credits The fund earns credits on temporarily uninvested cash balances held at the custodian, which reduce the fund’s custody charges. Custody expense in the accompanying financial statements is presented before reduction for credits.
NOTE 2 - VALUATION
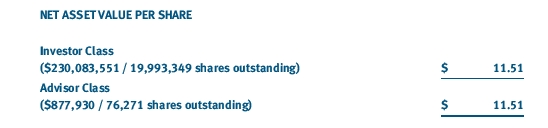
The fund’s financial instruments are reported at fair value as defined by GAAP. The fund determines the values of its assets and liabilities and computes each class’s net asset value per share at the close of the New York Stock Exchange (NYSE), normally 4 p.m. ET, each day that the NYSE is open for business.
Valuation Methods Debt securities are generally traded in the over-the-counter (OTC) market. Securities with remaining maturities of one year or more at the time of acquisition are valued at prices furnished by dealers who make markets in such securities or by an independent pricing service, which considers the yield or price of bonds of comparable quality, coupon, maturity, and type, as well as prices quoted by dealers who make markets in such securities. Securities with remaining maturities of less than one year at the time of acquisition generally use amortized cost in local currency to approximate fair value. However, if amortized cost is deemed not to reflect fair value or the fund holds a significant amount of such securities with remaining maturities of more than 60 days, the securities are valued at prices furnished by dealers who make markets in such securities or by an independent pricing service.
Equity securities listed or regularly traded on a securities exchange or in the OTC market are valued at the last quoted sale price or, for certain markets, the official closing price at the time the valuations are made, except for OTC Bulletin Board securities, which are valued at the mean of the latest bid and asked prices. A security that is listed or traded on more than one exchange is valued at the quotation on the exchange determined to be the primary market for such security. Listed securities not traded on a particular day are valued at the mean of the latest bid and asked prices for domestic securities and the last quoted sale price for international securities.
Investments in mutual funds are valued at the mutual fund’s closing net asset value per share on the day of valuation. Investments in private investment companies are valued at the entity’s net asset value (or equivalent) as of the valuation date. Financial futures contracts are valued at closing settlement prices. Forward currency exchange contracts are valued using the prevailing forward exchange rate.
Other investments, including restricted securities and private placements, and those financial instruments for which the above valuation procedures are inappropriate or are deemed not to reflect fair value, are stated at fair value as determined in good faith by the T. Rowe Price Valuation Committee, established by the fund’s Board of Directors (the Board). Subject to oversight by the Board, the Valuation Committee develops pricing-related policies and procedures and approves all fair-value determinations. The Valuation Committee regularly makes good faith judgments, using a wide variety of sources and information, to establish and adjust valuations of certain securities as events occur and circumstances warrant. For instance, in determining the fair value of private-equity instruments, the Valuation Committee considers a variety of factors, including the company’s business prospects, its financial performance, strategic events impacting the company, relevant valuations of similar companies, new rounds of financing, and any negotiated transactions of significant size between other investors in the company. Because any fair-value determination involves a significant amount of judgment, there is a degree of subjectivity inherent in such pricing decisions.
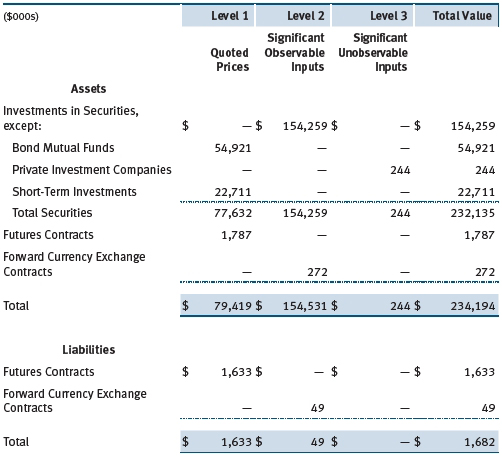
Valuation Inputs Various inputs are used to determine the value of the fund’s financial instruments. These inputs are summarized in the three broad levels listed below:
Level 1 – quoted prices in active markets for identical financial instruments
Level 2 – observable inputs other than Level 1 quoted prices (including, but not limited to, quoted prices for similar financial instruments, interest rates, prepayment speeds, and credit risk)
Level 3 – unobservable inputs
Observable inputs are those based on market data obtained from sources independent of the fund, and unobservable inputs reflect the fund’s own assumptions based on the best information available. The input levels are not necessarily an indication of the risk or liquidity associated with financial instruments at that level. The following table summarizes the fund’s financial instruments, based on the inputs used to determine their values on November 30, 2011:
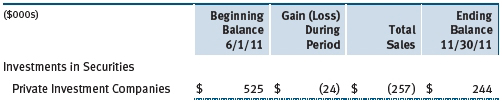
Following is a reconciliation of the fund’s Level 3 holdings for the six months ended November 30, 2011. Gain (loss) reflects both realized and change in unrealized gain (loss) on Level 3 holdings during the period, if any, and is included on the accompanying Statement of Operations. The change in unrealized gain (loss) on Level 3 instruments held at November 30, 2011, totaled $(24,000) for the six months ended November 30, 2011.
NOTE 3 - DERIVATIVE INSTRUMENTS
During the six months ended November 30, 2011, the fund invested in derivative instruments. As defined by GAAP, a derivative is a financial instrument whose value is derived from an underlying security price, foreign exchange rate, interest rate, index of prices or rates, or other variable; it requires little or no initial investment and permits or requires net settlement. The fund invests in derivatives only if the expected risks and rewards are consistent with its investment objectives, policies, and overall risk profile, as described in its prospectus and Statement of Additional Information. The fund may use derivatives for a variety of purposes, such as seeking to hedge against declines in principal value, increase yield, invest in an asset with greater efficiency and at a lower cost than is possible through direct investment, or to adjust portfolio duration and credit exposure. The risks associated with the use of derivatives are different from, and potentially much greater than, the risks associated with investing directly in the instruments on which the derivatives are based. Investments in derivatives can magnify returns positively or negatively; however, the fund at all times maintains sufficient cash reserves, liquid assets, or other SEC-permitted asset types to cover the settlement obligations under its open derivative contracts.
The fund values its derivatives at fair value, as described below and in Note 2, and recognizes changes in fair value currently in its results of operations. Accordingly, the fund does not follow hedge accounting, even for derivatives employed as economic hedges. The fund does not offset the fair value of derivative instruments against the right to reclaim or obligation to return collateral. The following table summarizes the fair value of the fund’s derivative instruments held as of November 30, 2011, and the related location on the accompanying Statement of Assets and Liabilities, presented by primary underlying risk exposure:
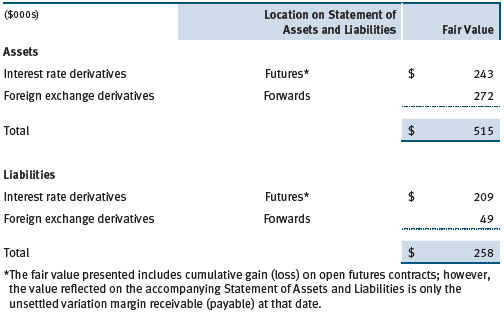
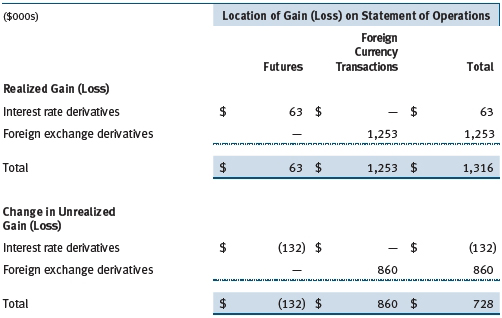
Additionally, the amount of gains and losses on derivative instruments recognized in fund earnings during the six months ended November 30, 2011, and the related location on the accompanying Statement of Operations is summarized in the following table by primary underlying risk exposure:
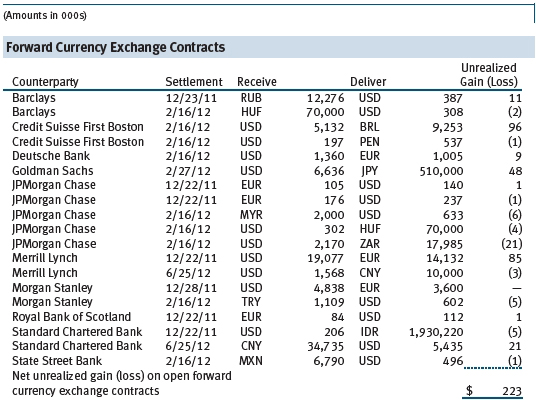
Forward Currency Exchange Contracts The fund is subject to foreign currency exchange rate risk in the normal course of pursuing its investment objectives. It uses forward currency exchange contracts (forwards) primarily to protect its non-U.S. dollar-denominated securities from adverse currency movements relative to the U.S. dollar. A forward involves an obligation to purchase or sell a fixed amount of a specific currency on a future date at a price set at the time of the contract. Although certain forwards may be settled by exchanging only the net gain or loss on the contract, most forwards are settled with the exchange of the underlying currencies in accordance with the specified terms. Forwards are valued at the unrealized gain or loss on the contract, which reflects the net amount the fund either is entitled to receive or obligated to deliver, as measured by the difference between the forward exchange rates at the date of entry into the contract and the forward rates at the reporting date. Appreciated forwards are reflected as assets, and depreciated forwards are reflected as liabilities on the accompanying Statement of Assets and Liabilities. Risks related to the use of forwards include the possible failure of counterparties to meet the terms of the agreements; that anticipated currency movements will not occur, thereby reducing the fund’s total return; and the potential for losses in excess of the fund’s initial investment. During the six months ended November 30, 2011, the fund’s exposure to forwards, based on underlying notional amounts, was generally between 17% and 22% of net assets.
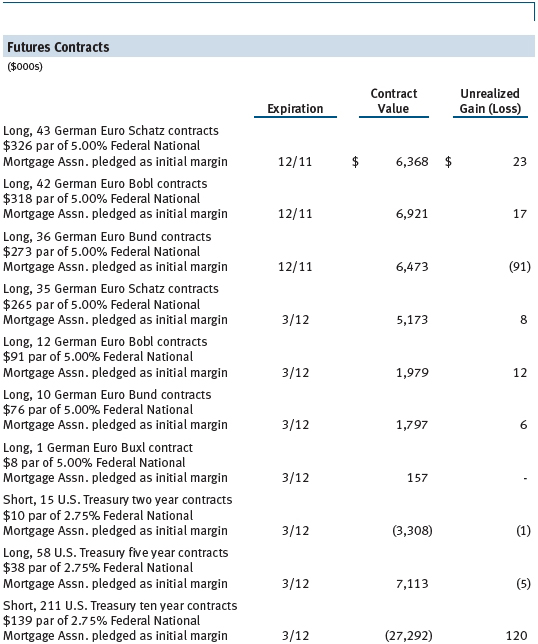
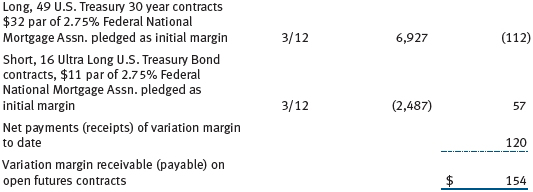
Futures Contracts The fund is subject to interest rate risk in the normal course of pursuing its investment objectives and uses futures contracts to help manage such risk. The fund may enter into futures contracts to manage exposure to interest rate and yield curve movements, security prices, foreign currencies, credit quality, and mortgage prepayments; as an efficient means of adjusting exposure to all or part of a target market; to enhance income; as a cash management tool; and/or to adjust portfolio duration and credit exposure. A futures contract provides for the future sale by one party and purchase by another of a specified amount of a particular underlying financial instrument at an agreed-upon price, date, time, and place. The fund currently invests only in exchange-traded futures, which generally are standardized as to maturity date, underlying financial instrument, and other contract terms. Upon entering into a futures contract, the fund is required to deposit with the broker cash or securities in an amount equal to a certain percentage of the contract value (initial margin deposit); the margin deposit must then be maintained at the established level over the life of the contract. Subsequent payments are made or received by the fund each day to settle daily fluctuations in the value of the contract (variation margin), which reflect changes in the value of the underlying financial instrument. Variation margin is recorded as unrealized gain or loss until the contract is closed. The value of a futures contract included in net assets is the amount of unsettled variation margin; net variation margin receivable is reflected as an asset, and net variation margin payable is reflected as a liability on the accompanying Statement of Assets and Liabilities. Risks related to the use of futures contracts include possible illiquidity of the futures markets, contract prices that can be highly volatile and imperfectly correlated to movements in hedged security values and/or interest rates, and potential losses in excess of the fund’s initial investment. During the six months ended November 30, 2011, the fund’s exposure to futures, based on underlying notional amounts, was generally between 19% and 27% of net assets.
NOTE 4 - OTHER INVESTMENT TRANSACTIONS
Consistent with its investment objective, the fund engages in the following practices to manage exposure to certain risks and/or to enhance performance. The investment objective, policies, program, and risk factors of the fund are described more fully in the fund’s prospectus and Statement of Additional Information.
Emerging Markets At November 30, 2011, approximately 17% of the fund’s net assets were invested, either directly or through investments in T. Rowe Price institutional funds, in securities of companies located in emerging markets, securities issued by governments of emerging market countries, and/or securities denominated in or linked to the currencies of emerging market countries. Emerging market securities are often subject to greater price volatility, less liquidity, and higher rates of inflation than U.S. securities. In addition, emerging markets may be subject to greater political, economic, and social uncertainty, and differing regulatory environments that may potentially impact the fund’s ability to buy or sell certain securities or repatriate proceeds to U.S. dollars.
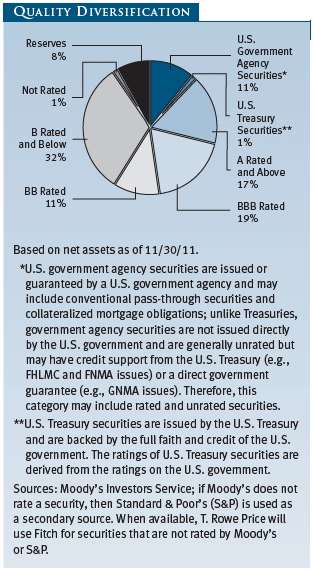
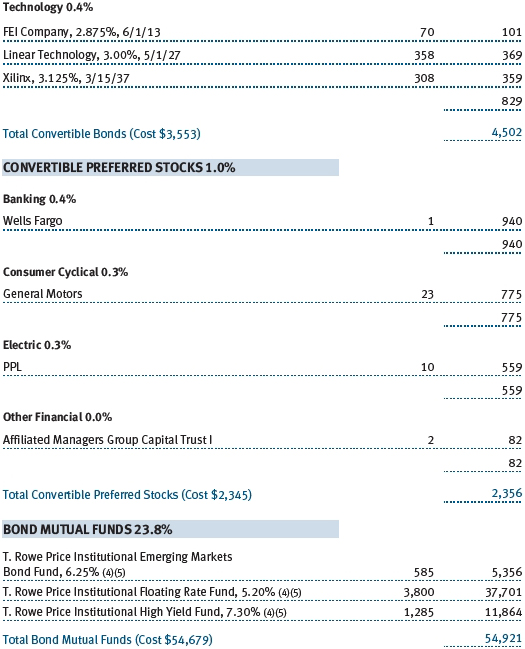
Noninvestment-Grade Debt Securities At November 30, 2011, approximately 43% of the fund’s net assets were invested, either directly or through its investment in T. Rowe Price institutional funds, in noninvestment-grade debt securities, commonly referred to as “high yield” or “junk” bonds. The noninvestment-grade bond market may experience sudden and sharp price swings due to a variety of factors, including changes in economic forecasts, stock market activity, large sustained sales by major investors, a high-profile default, or a change in the market’s psychology. These events may decrease the ability of issuers to make principal and interest payments and adversely affect the liquidity or value, or both, of such securities.
Restricted Securities The fund may invest in securities that are subject to legal or contractual restrictions on resale. Prompt sale of such securities at an acceptable price may be difficult and may involve substantial delays and additional costs.
TBA Purchase and Sale Commitments During the six months ended November 30, 2011, the fund entered into to be announced (TBA) purchase and/or sale commitments, pursuant to which it agrees to purchase or sell, respectively, mortgage-backed securities for a fixed unit price, with payment and delivery at a scheduled future date beyond the customary settlement period for such mortgage-backed securities. With TBA transactions, the particular securities to be delivered are not identified at the trade date; however, delivered securities must meet specified terms, including issuer, rate, and mortgage term, and be within industry-accepted “good delivery” standards. The fund generally enters into TBA purchase transactions with the intention of taking possession of the underlying mortgage securities; however, for either purchase or sale transactions, the fund also may extend the settlement by “rolling” the transaction. Until settlement, the fund maintains cash reserves and liquid assets sufficient to settle its TBA commitments.
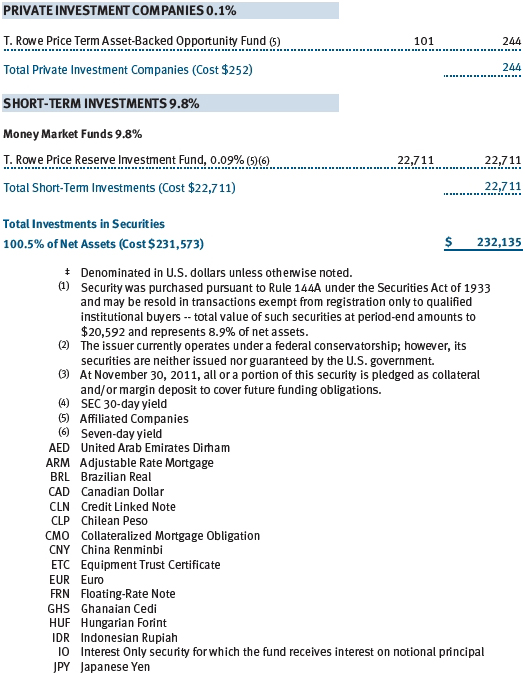
T. Rowe Price Term Asset-Backed Opportunity Fund, L.L.C. During the six months ended November 30, 2011, the fund was invested in the T. Rowe Price Term Asset-Backed Opportunity Fund, L.L.C. (private fund), a private investment company managed by T. Rowe Price Associates, Inc. that participates in the Term Asset-Backed Securities Loan Facility (TALF) program created and administered by the Federal Reserve Bank of New York (FRBNY). The TALF program provided eligible borrowers with term loans secured by eligible asset-backed securities and/or commercial mortgage-backed securities, which were either owned by the borrower or purchased by the borrower and subsequently pledged as collateral for a TALF loan. TALF loans generally are nonrecourse in nature. The private fund is treated as a partnership for federal income tax purposes. It has a limited life extending five years from the date on which the TALF program closed for any new loans, which was June 30, 2010. The private fund can have two possible extensions (one year each) with the consent of a majority of its investors. Invested capital generally will be returned to investors as underlying securities are liquidated and the TALF loans are repaid or mature, with the balance paid at maturity of the private fund. Ownership interests in the private fund may not be redeemed, sold, or assigned. As of November 30, 2011, outstanding capital commitments may no longer be called by the private fund.
Counterparty Risk and Collateral The fund has entered into collateral agreements with certain counterparties to mitigate counterparty risk associated with certain over-the-counter (OTC) financial instruments, including swaps, forward currency exchange contracts, TBA purchase commitments, and OTC options (collectively, covered OTC instruments). Subject to certain minimum exposure requirements (which typically range from $100,000 to $500,000), collateral requirements generally are determined and transfers made based on the net aggregate unrealized gain or loss on all OTC instruments covered by a particular collateral agreement with a specified counterparty. Collateral, both pledged by the fund to a counterparty and pledged by a counterparty to the fund, is held in a segregated account by a third-party agent and can be in the form of cash or debt securities issued by the U.S. government or related agencies. Securities posted as collateral by the fund to a counterparty are so noted in the accompanying Portfolio of Investments and remain in the fund’s net assets. In accordance with GAAP, cash pledged by counterparties to the fund is included in the fund’s net assets; however, securities pledged by counterparties to the fund are not recorded by the fund. As of November 30, 2011, no collateral was pledged by either the fund or counterparties.
At any point in time, the fund’s risk of loss from counterparty credit risk on covered OTC instruments is the aggregate unrealized gain on appreciated covered OTC instruments in excess of collateral, if any, pledged by the counterparty to the fund. Counterparty risk related to exchange-traded futures and options contracts is minimal because the exchange’s clearinghouse provides protection against counterparty defaults. Generally, for exchange-traded derivatives such as futures and options, each broker, in its sole discretion, may change margin requirements applicable to the fund. In accordance with the terms of the relevant derivatives agreements, counterparties to OTC derivatives may be able to terminate derivative contracts prior to maturity after the occurrence of certain stated events, such as a decline in net assets above a certain percentage or a failure by the fund to perform its obligations under the contract. Upon termination, all transactions would typically be liquidated and a net amount would be owed by or payable to the fund.
Other Purchases and sales of portfolio securities other than short-term and U.S. government securities aggregated $60,109,000 and $40,709,000, respectively, for the six months ended November 30, 2011. Purchases and sales of U.S. government securities aggregated $41,663,000 and $45,952,000, respectively, for the six months ended November 30, 2011.
NOTE 5 - FEDERAL INCOME TAXES
No provision for federal income taxes is required since the fund intends to continue to qualify as a regulated investment company under Subchapter M of the Internal Revenue Code and distribute to shareholders all of its taxable income and gains. Distributions determined in accordance with federal income tax regulations may differ in amount or character from net investment income and realized gains for financial reporting purposes. Financial reporting records are adjusted for permanent book/tax differences to reflect tax character but are not adjusted for temporary differences. The amount and character of tax-basis distributions and composition of net assets are finalized at fiscal year-end; accordingly, tax-basis balances have not been determined as of the date of this report.
In accordance with federal tax regulations, the fund recognized capital losses in the current period for tax purposes that had been recognized in the prior fiscal year for financial reporting purposes. Such deferrals relate to net capital losses realized between November 1, 2010, and May 31, 2011, and totaled $1,328,000.
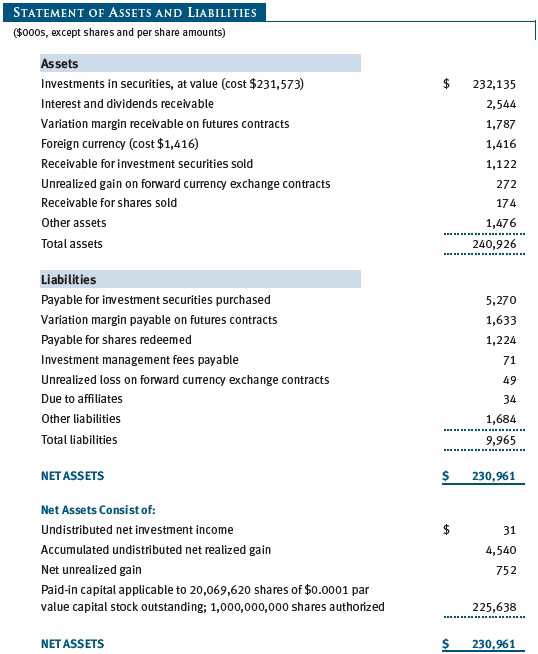
At November 30, 2011, the cost of investments for federal income tax purposes was $231,686,000. Net unrealized gain aggregated $639,000 at period-end, of which $6,858,000 related to appreciated investments and $6,219,000 related to depreciated investments.
NOTE 6 - RELATED PARTY TRANSACTIONS
The fund is managed by T. Rowe Price Associates, Inc. (Price Associates), a wholly owned subsidiary of T. Rowe Price Group, Inc. (Price Group). The investment management agreement between the fund and Price Associates provides for an annual investment management fee, which is computed daily and paid monthly. The fee consists of an individual fund fee, equal to 0.20% of the fund’s average daily net assets, and a group fee. The group fee rate is calculated based on the combined net assets of certain mutual funds sponsored by Price Associates (the group) applied to a graduated fee schedule, with rates ranging from 0.48% for the first $1 billion of assets to 0.28% for assets in excess of $300 billion. The fund’s group fee is determined by applying the group fee rate to the fund’s average daily net assets. At November 30, 2011, the effective annual group fee rate was 0.30%.
The Investor Class and Advisor Class are also subject to a contractual expense limitation through the limitation dates indicated in the table below. During the limitation period, Price Associates is required to waive its management fee and/or reimburse expenses, excluding interest, taxes, brokerage commissions, and extraordinary expenses that would otherwise cause the class’s ratio of annualized total expenses to average net assets (expense ratio) to exceed its expense limitation. For a period of three years after the date of any reimbursement or waiver, each class is required to repay Price Associates for expenses previously reimbursed and management fees waived to the extent the class’s net assets have grown or expenses have declined sufficiently to allow repayment without causing the class’s expense ratio to exceed its expense limitation.

Pursuant to this agreement, expenses in the amount of $20,000 were repaid to Price Associates during the six months ended November 30, 2011. Including these amounts, management fees waived and expenses previously reimbursed by Price Associates in the amount of $269,000 remain subject to repayment at November 30, 2011.
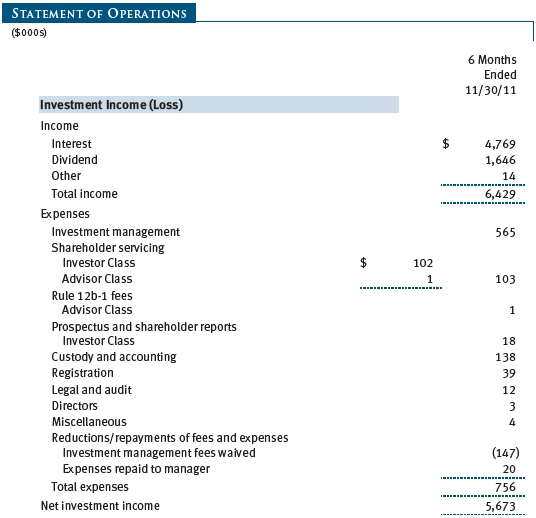
In addition, the fund has entered into service agreements with Price Associates and two wholly owned subsidiaries of Price Associates (collectively, Price). Price Associates computes the daily share prices and provides certain other administrative services to the fund. T. Rowe Price Services, Inc., provides shareholder and administrative services in its capacity as the fund’s transfer and dividend disbursing agent. T. Rowe Price Retirement Plan Services, Inc., provides subaccounting and recordkeeping services for certain retirement accounts invested in the Investor Class. For the six months ended November 30, 2011, expenses incurred pursuant to these service agreements were $102,000 for Price Associates; $66,000 for T. Rowe Price Services, Inc.; and $1,000 for T. Rowe Price Retirement Plan Services, Inc. The total amount payable at period-end pursuant to these service agreements is reflected as Due to Affiliates in the accompanying financial statements.
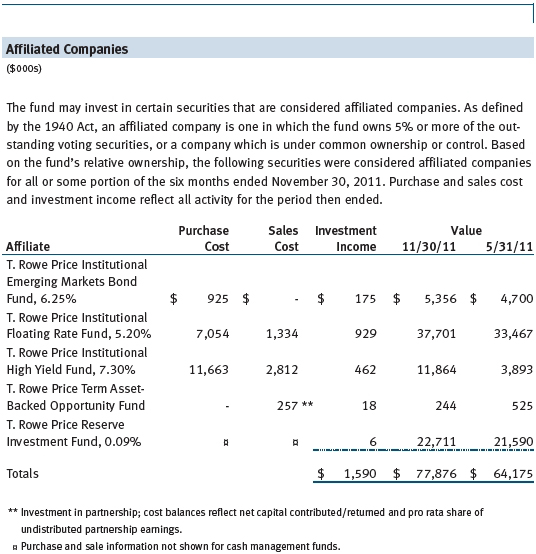
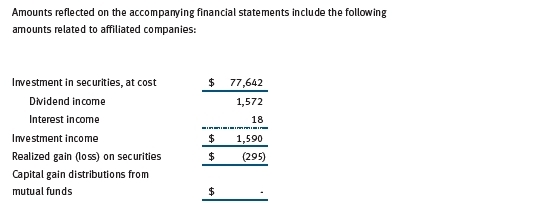
The fund may invest in the T. Rowe Price Reserve Investment Fund and the T. Rowe Price Government Reserve Investment Fund (collectively, the T. Rowe Price Reserve Investment Funds), open-end management investment companies managed by Price Associates and considered affiliates of the fund. The T. Rowe Price Reserve Investment Funds are offered as cash management options to mutual funds, trusts, and other accounts managed by Price Associates and/or its affiliates and are not available for direct purchase by members of the public. The T. Rowe Price Reserve Investment Funds pay no investment management fees.
The fund may also invest in certain T. Rowe Price institutional funds (underlying institutional funds) as a means of gaining efficient and cost-effective exposure to certain markets. The underlying institutional funds are open-end management investment companies managed by Price Associates and are considered affiliates of the fund. Each underlying institutional fund pays an all-inclusive management and administrative fee to Price Associates. To ensure that the fund does not incur duplicate fees, Price Associates has agreed to permanently waive a portion of its management fee charged to the fund in an amount sufficient to fully offset the management fees paid by the underlying institutional funds related to fund assets invested therein. Accordingly, the accompanying Statement of Operations includes management fees permanently waived pursuant to this agreement. Annual fee rates and amounts waived within the accompanying Statement of Operations related to shares of the underlying institutional funds for the six months ended November 30, 2011, are as follows:

As of November 30, 2011, T. Rowe Price Group, Inc., and/or its wholly owned subsidiaries owned 2,475,000 shares of the Investor Class and 25,799 shares of the Advisor Class, aggregating 12% of the fund’s net assets.
| Information on Proxy Voting Policies, Procedures, and Records |
A description of the policies and procedures used by T. Rowe Price funds and portfolios to determine how to vote proxies relating to portfolio securities is available in each fund’s Statement of Additional Information, which you may request by calling 1-800-225-5132 or by accessing the SEC’s website, sec.gov. The description of our proxy voting policies and procedures is also available on our website, troweprice.com. To access it, click on the words “Our Company” at the top of our corporate homepage. Then, when the next page appears, click on the words “Proxy Voting Policies” on the left side of the page.
Each fund’s most recent annual proxy voting record is available on our website and through the SEC’s website. To access it through our website, follow the directions above, then click on the words “Proxy Voting Records” on the right side of the Proxy Voting Policies page.
| How to Obtain Quarterly Portfolio Holdings |
The fund files a complete schedule of portfolio holdings with the Securities and Exchange Commission for the first and third quarters of each fiscal year on Form N-Q. The fund’s Form N-Q is available electronically on the SEC’s website (sec.gov); hard copies may be reviewed and copied at the SEC’s Public Reference Room, 450 Fifth St. N.W., Washington, DC 20549. For more information on the Public Reference Room, call 1-800-SEC-0330.
Item 2. Code of Ethics.
A code of ethics, as defined in Item 2 of Form N-CSR, applicable to its principal executive officer, principal financial officer, principal accounting officer or controller, or persons performing similar functions is filed as an exhibit to the registrant’s annual Form N-CSR. No substantive amendments were approved or waivers were granted to this code of ethics during the registrant’s most recent fiscal half-year.
Item 3. Audit Committee Financial Expert.
Disclosure required in registrant’s annual Form N-CSR.
Item 4. Principal Accountant Fees and Services.
Disclosure required in registrant’s annual Form N-CSR.
Item 5. Audit Committee of Listed Registrants.
Not applicable.
Item 6. Investments.
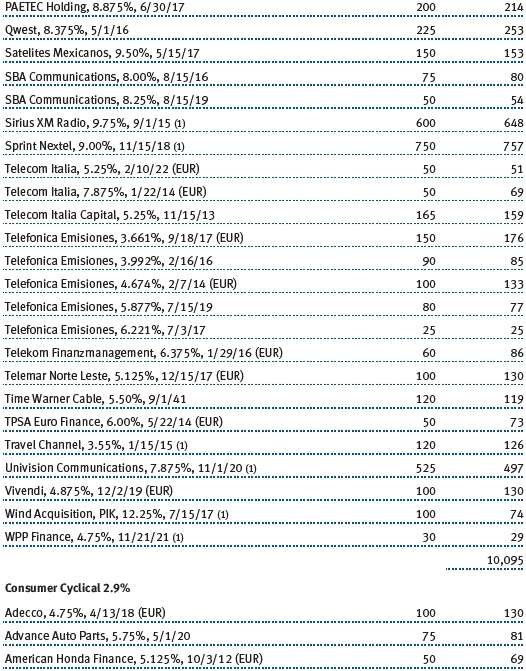
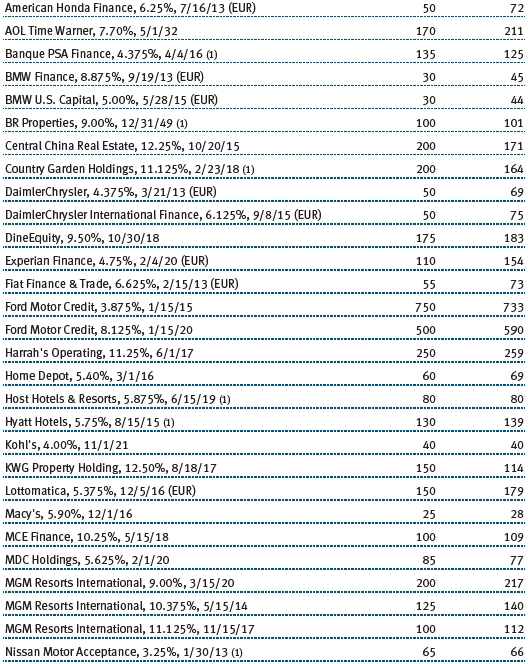
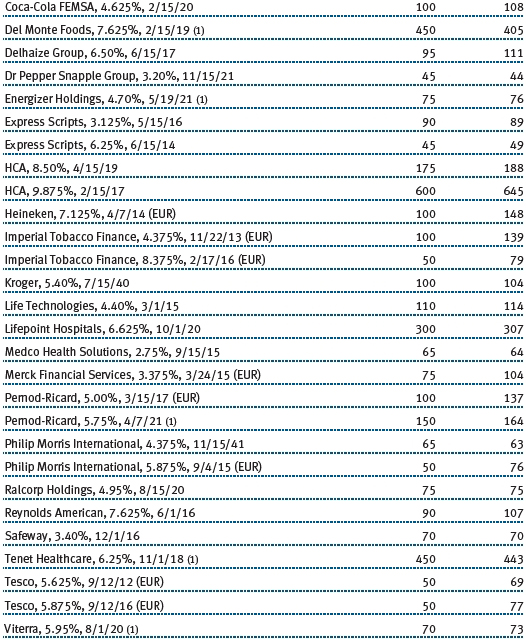
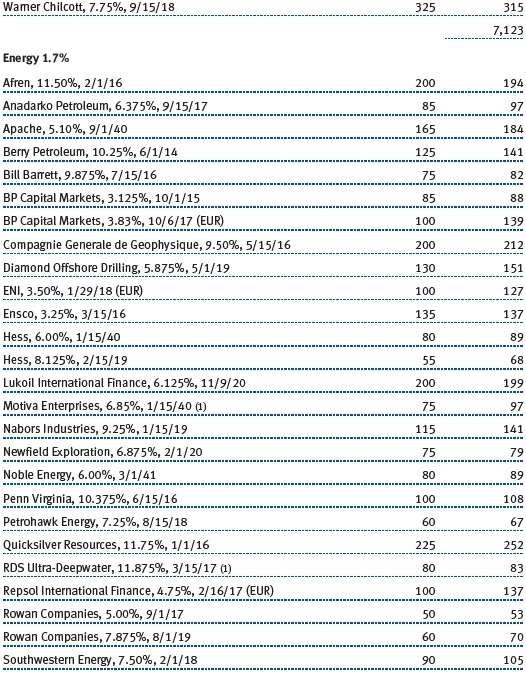
(a) Not applicable. The complete schedule of investments is included in Item 1 of this Form N-CSR.
(b) Not applicable.
Item 7. Disclosure of Proxy Voting Policies and Procedures for Closed-End Management Investment Companies.
Not applicable.
Item 8. Portfolio Managers of Closed-End Management Investment Companies.
Not applicable.
Item 9. Purchases of Equity Securities by Closed-End Management Investment Company and Affiliated Purchasers.
Not applicable.
Item 10. Submission of Matters to a Vote of Security Holders.
Not applicable.
Item 11. Controls and Procedures.
(a) The registrant’s principal executive officer and principal financial officer have evaluated the registrant’s disclosure controls and procedures within 90 days of this filing and have concluded that the registrant’s disclosure controls and procedures were effective, as of that date, in ensuring that information required to be disclosed by the registrant in this Form N-CSR was recorded, processed, summarized, and reported timely.
(b) The registrant’s principal executive officer and principal financial officer are aware of no change in the registrant’s internal control over financial reporting that occurred during the registrant’s second fiscal quarter covered by this report that has materially affected, or is reasonably likely to materially affect, the registrant’s internal control over financial reporting.
Item 12. Exhibits.
(a)(1) The registrant’s code of ethics pursuant to Item 2 of Form N-CSR is filed with the registrant’s annual Form N-CSR.
(2) Separate certifications by the registrant's principal executive officer and principal financial officer, pursuant to Section 302 of the Sarbanes-Oxley Act of 2002 and required by Rule 30a-2(a) under the Investment Company Act of 1940, are attached.
(3) Written solicitation to repurchase securities issued by closed-end companies: not applicable.
(b) A certification by the registrant's principal executive officer and principal financial officer, pursuant to Section 906 of the Sarbanes-Oxley Act of 2002 and required by Rule 30a-2(b) under the Investment Company Act of 1940, is attached.
SIGNATURES
Pursuant to the requirements of the Securities Exchange Act of 1934 and the Investment Company Act of 1940, the registrant has duly caused this report to be signed on its behalf by the undersigned, thereunto duly authorized.
T. Rowe Price Strategic Income Fund, Inc.
| By | /s/ Edward C. Bernard |
| Edward C. Bernard |
| Principal Executive Officer |
| |
| Date | January 23, 2012 |
Pursuant to the requirements of the Securities Exchange Act of 1934 and the Investment Company Act of 1940, this report has been signed below by the following persons on behalf of the registrant and in the capacities and on the dates indicated.
| By | /s/ Edward C. Bernard |
| Edward C. Bernard |
| Principal Executive Officer |
| |
| Date | January 23, 2012 |
| |
| |
| By | /s/ Gregory K. Hinkle |
| Gregory K. Hinkle |
| Principal Financial Officer |
| |
| Date | January 23, 2012 |