UNITED STATES
SECURITIES AND EXCHANGE COMMISSION
Washington, D.C. 20549
FORM N-CSR
CERTIFIED SHAREHOLDER REPORT OF REGISTERED
MANAGEMENT INVESTMENT COMPANIES
Investment Company Act File Number: 811-22243
| T. Rowe Price Strategic Income Fund, Inc. |
|
| (Exact name of registrant as specified in charter) |
| |
| 100 East Pratt Street, Baltimore, MD 21202 |
|
| (Address of principal executive offices) |
| |
| David Oestreicher |
| 100 East Pratt Street, Baltimore, MD 21202 |
|
| (Name and address of agent for service) |
Registrant’s telephone number, including area code: (410) 345-2000
Date of fiscal year end: May 31
Date of reporting period: November 30, 2012
Item 1. Report to Shareholders
| Strategic Income Fund | November 30, 2012 |
The views and opinions in this report were current as of November 30, 2012. They are not guarantees of performance or investment results and should not be taken as investment advice. Investment decisions reflect a variety of factors, and the managers reserve the right to change their views about individual stocks, sectors, and the markets at any time. As a result, the views expressed should not be relied upon as a forecast of the fund’s future investment intent. The report is certified under the Sarbanes-Oxley Act, which requires mutual funds and other public companies to affirm that, to the best of their knowledge, the information in their financial reports is fairly and accurately stated in all material respects.
REPORTS ON THE WEB
Sign up for our E-mail Program, and you can begin to receive updated fund reports and prospectuses online rather than through the mail. Log in to your account at troweprice.com for more information.
Manager’s Letter
Fellow Shareholders
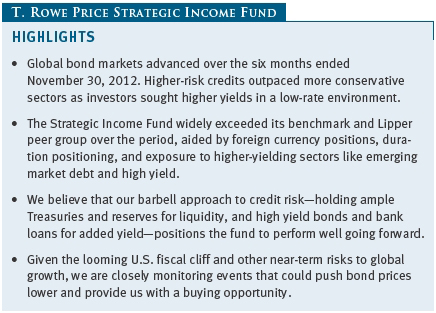
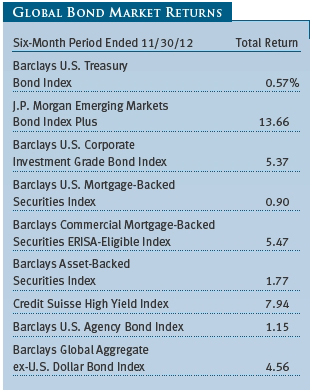
Global bond markets rose over the past six months, led by higher-yielding sectors, as accommodative central bank measures gave investors comfort going further out the risk spectrum. Higher-risk sectors rallied after the European Central Bank (ECB) and U.S. Federal Reserve separately announced highly accommodative monetary policies over the summer. These central bank announcements, combined with investors seeking added returns in a low interest rate environment, helped drive yields to record lows across most bond sectors. The Strategic Income Fund rose over the period and easily outpaced its benchmark due to foreign currency positions, duration posture, and exposure to higher-yielding, riskier sectors like emerging markets debt and bank loans that are not included in the benchmark.
PERFORMANCE COMPARISON
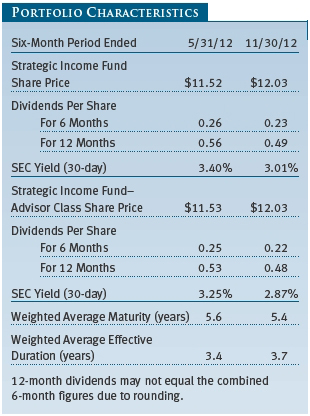
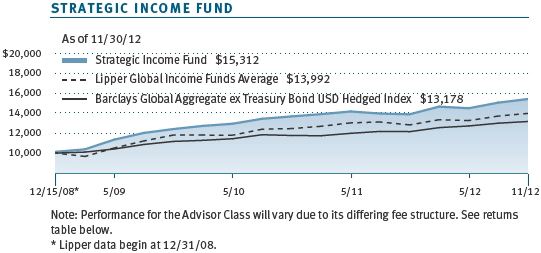
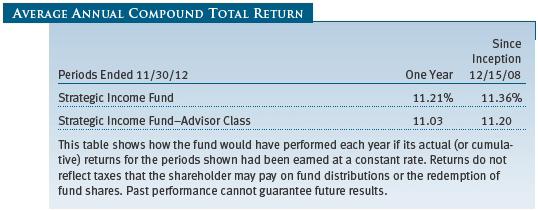
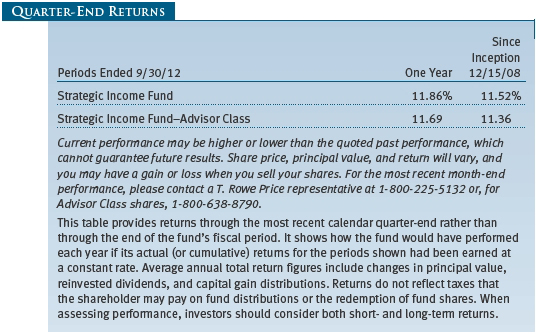
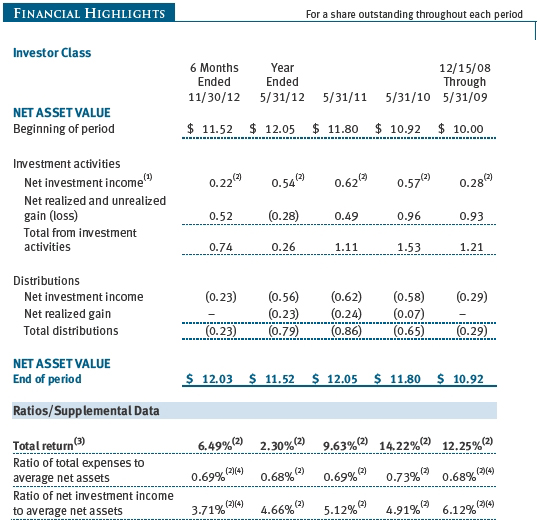
The Strategic Income Fund returned 6.49% for the six months ended November 30, 2012, outperforming the 3.53% return of its benchmark, the Barclays Global Aggregate ex Treasury Bond U.S. Dollar Hedged Index, and the Lipper Global Income Funds Average. Since the fund’s inception in December 2008, its performance has held up well against its peers. Based on cumulative total return, Lipper ranked the Strategic Income Fund 42 of 190 and 30 of 138 global income funds for the one- and three-year periods ended November 30, 2012, respectively, placing it in the top quartile of its peer group for both periods. (Past performance cannot guarantee future results.)

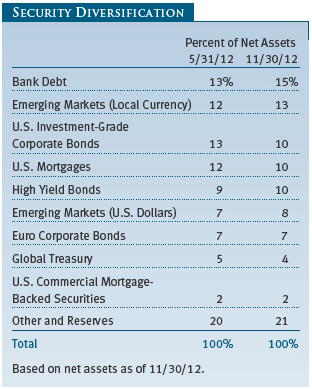
The fund aims to provide a highly diversified fixed income portfolio that invests in a broad range of securities: domestic and foreign, developed and emerging markets, higher-risk and higher-quality, government-issued and corporate bonds. The fund represents a more aggressive diversified bond fund than other T. Rowe Price offerings due to its substantial allocations to higher-risk sectors and foreign bonds, and our willingness to deviate significantly from the benchmark when we perceive attractive opportunities. However, the fund is designed to be less volatile than bond funds concentrated in a single higher-risk sector, such as high yield.
MARKET ENVIRONMENT
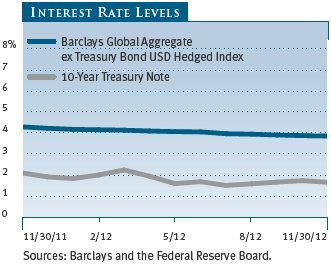
A healthy appetite for risk prevailed over the past six months. In contrast to our last report in June, when investors fretted about a possible eurozone collapse and a slowdown in China, risk sentiment improved after central banks in Europe and the U.S. announced unprecedented accommodative monetary policies. Yields across fixed income sectors fell to or near all-time lows, pushing valuations to lofty levels, as investors sought higher-yielding assets in an exceedingly low rate environment. At the same time, Europe’s unresolved debt crisis, a patchy U.S. recovery, and long-term fiscal concerns sustained demand for the relative safety of U.S. government debt. Long-term Treasury yields sank to record lows by late July, although they moved higher by the end of our reporting period in November.
Two events helped convince investors to pile into riskier assets. First, ECB President Mario Draghi pledged in July to do “whatever it takes” to save the euro, which was followed in September by a conditional plan allowing the ECB to make unlimited purchases of short-term bonds issued by troubled euro members. Second, the Federal Reserve announced in September a third round of quantitative easing, its latest monetary stimulus otherwise known as QE3. The ECB’s plan immediately caused interest rates to fall in Spain and Italy, where borrowing costs were approaching unsustainable levels. Similarly, the Fed’s QE3 announcement reassured investors that global central banks would act forcefully to shore up fragile economies.
Like the Fed’s previous bond-buying programs, QE3 aimed to drive down interest rates and borrowing costs by encouraging investors to buy higher-yielding credit-oriented securities. Under the open-ended plan, the Fed said it would buy $40 billion of agency mortgage-backed securities (MBS) each month until the labor markets improved. It also pledged to keep short-term interest rates near zero through at least mid-2015—longer than its previous commitment to keep rates low through at least 2014. Shortly after the Fed’s announcement, MBS yields tumbled, briefly driving prices to all-time highs. As was the case with previous periods of quantitative easing, investors were compelled to seek higher-yielding alternatives. The ensuing demand for yield drove bond prices sharply higher across most sectors, particularly credit-sensitive ones. By the end of our reporting period, yields across non-Treasury sectors—including investment-grade and high yield corporate bonds, MBS, and asset-backed securities—fell to record lows.
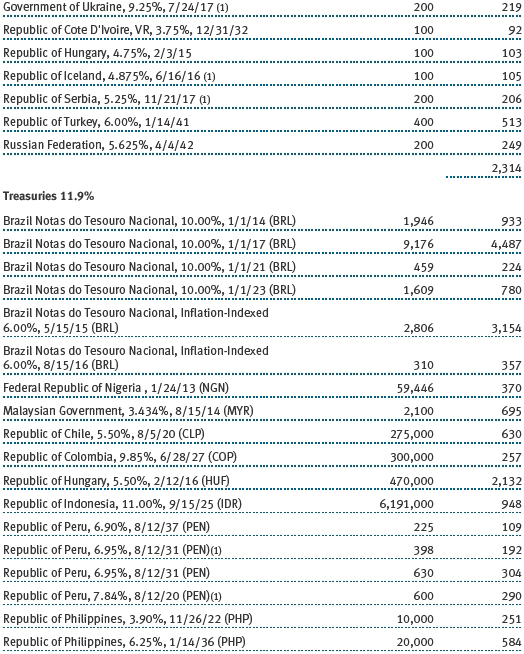
Investors’ heightened risk tolerance produced strong returns for emerging markets debt. Governments in many emerging markets cut interest rates to spur growth, which also lifted bond returns. Signs of a slowdown in China raised worries that the country was entering a downturn after decades of runaway growth, but we believe its government will manage a gradual deceleration. Brazil’s government repeatedly cut interest rates, reduced taxes, and offered other incentives to boost slowing economic growth over the past year. Despite these measures, Brazil’s third-quarter growth fell short of expectations, making it unlikely that it will meet its 4% growth target next year. Not all emerging markets displayed weaker growth or fundamentals, however. Turkey regained its investment-grade credit rating for the first time since 1994 after Fitch upgraded the country in November. The upgrade sent Turkish stocks and bonds to record levels and extended the local currency’s rally for the year-to-date period. Debt issuance across emerging markets rose significantly over the period as several new and existing sovereign and corporate borrowers came to the market, but strong demand from yield-seeking investors readily absorbed the increased supply.
PERFORMANCE AND INVESTMENT REVIEW
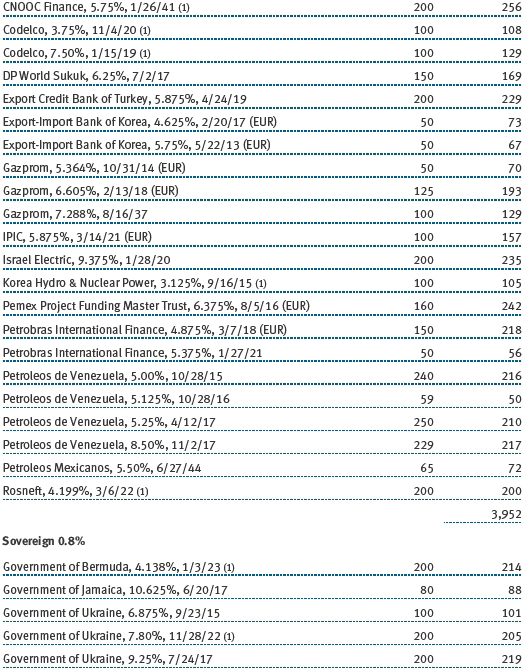
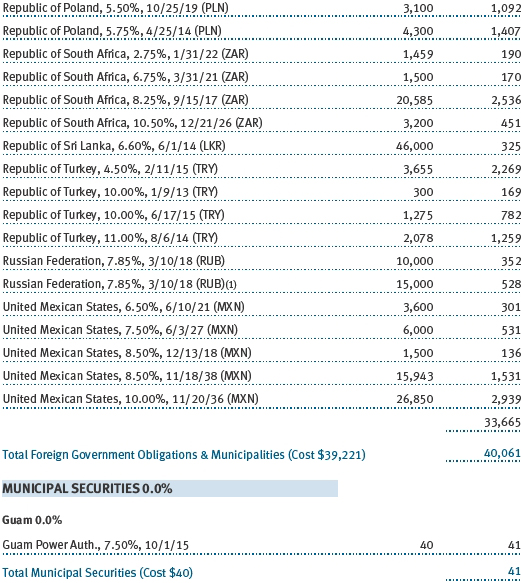
Our foreign currency positions contributed the most to the fund’s absolute and relative returns. In recent months, we have reduced exposure to select credit sectors while raising exposure to foreign currency. This positioning paid off as exposure to emerging market currencies including the Mexican peso, Polish zloty, Malaysian ringgit, Russian ruble, and Turkish lira lifted performance, driven by investors’ rising risk appetite over the period. We continue to have a positive outlook for emerging markets and maintain a meaningful exposure to both dollar-denominated and local currency debt in an effort to capture return and diversify the fund’s risk. Besides offering attractive yields and greater diversification, emerging market sovereign and corporate bonds provide exposure to countries that are experiencing faster private sector growth than many advanced economies. Despite recent slowdowns, many emerging markets offer higher real and nominal interest rates in local markets and are expected to enjoy faster economic growth rates, lower debt levels, and stronger fiscal balances than developed countries over the long run. We expect these solid fundamentals will result in emerging market currencies strengthening over time.
In addition to currency exposure, sector allocation decisions also contributed to absolute and relative returns. Allocations to credit-sensitive sectors including high yield, leveraged loans, and emerging markets debt—all of which are not in the benchmark—helped the fund’s outperformance as yield-hungry investors bid up prices. High yield bonds rallied sharply over the past year, driving yields to near record lows and raising worries that the high yield market is overheating. Most recent issuers of high yield debt have used proceeds to refinance existing debt at low rates and strengthen their balance sheets, keeping default expectations for the sector at relatively low levels. However, some recent high yield deals have offered investors fewer protections than usual, and a few have used proceeds to pay out larger than normal dividends, causing us to take note of what appear to be early warning signs for the sector. In light of these developments and stretched valuations, we have become more cautious in our outlook for high yield despite continued low expectations for defaults. For various reasons, we continue to prefer a larger exposure to leveraged loans than to high yield. These adjustable rate bank loans made to below investment-grade companies offer attractive valuations and potentially better recovery rates than high yield bonds given their collateralized nature and senior position in the capital structure. They also have less interest rate risk because of their floating rate nature.
Interest rate management was a third contributor to relative performance. We have consistently maintained a short-duration posture relative to the benchmark to protect shareholders from rising interest rates, which we believed were likely given the recovering U.S. economy and our expectations of an eventual end to the Fed’s accommodative policy. This short-duration posture aided relative returns as interest rates ticked higher over the past six months, particularly for longer-dated issues.
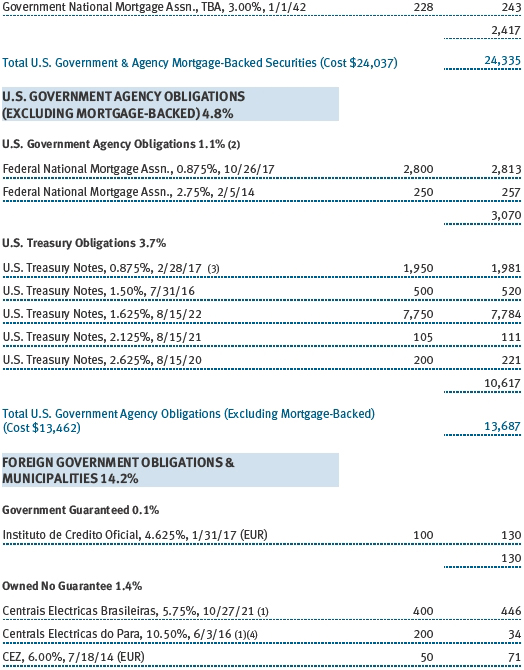
The fund’s overall sector positioning stayed broadly unchanged over the past six months. We continued to adhere to a barbell-like strategy encompassing both ends of the risk spectrum: on one end, investing in Treasuries and high-quality liquid assets; and on the other, holding emerging markets debt, leveraged loans, and to a lesser extent, high yield bonds. We reduced exposure to sectors in the middle of the barbell that had appreciated sharply and offered little relative value, including MBS and investment-grade corporate bonds, and redeployed proceeds into Treasuries for liquidity and leveraged loans for added yield. This reallocation resulted in an increase in our holdings of Treasuries and other liquid assets at period-end. However, this increase could prove temporary, as we would expect to take advantage of our added reserves to dip back into higher-risk sectors should events in global credit markets lead to more attractive valuations.
OUTLOOK
Following the recent rally, fixed income sectors broadly appear to be fully valued, making it difficult to find attractive opportunities for return. Despite full valuations, favorable supply and demand trends could drive further returns over the near term—particularly if, as we expect, global central banks continue to provide accommodative monetary policies. We believe that QE3 will not have a meaningful impact on the U.S. economy due to already low borrowing rates. However, it could provide support for higher-risk assets should the housing and labor markets continue to recover. Shortly after our reporting period closed, the Fed announced further Treasury bond purchases and set a specific target for the unemployment rate, 6.5%, for the end of its stimulative policies, indicating that liquidity will remain plentiful for the foreseeable future.
We have a cautiously positive bias toward risk, but are closely monitoring the investment horizon for events that could lead to a reversal in risk sentiment and cause credit spreads to widen. Our reallocation of assets into leveraged loans, described above, is expected to increase portfolio risk modestly but not change it materially. Our overall view is that the U.S. economy will slowly improve, China’s economy will avoid a hard landing and stabilize in the coming months, and the eurozone will struggle for several more years as it gets its fiscal house in order. Major risks next year include the U.S. fiscal cliff and debt ceiling negotiations, uncertainty in global growth, and Greece potentially leaving the eurozone, an event that many analysts are predicting. However, we would likely view volatility related to these events as an opportunity to add risk, given our base-case expectations for a recovery in global growth over the longer term.
Thank you for investing with T. Rowe Price.
Respectfully submitted,

Steven C. Huber
Chairman of the fund’s Investment Advisory Committee
December 14, 2012
The committee chairman has day-to-day responsibility for managing the portfolio and works with committee members in developing and executing the fund’s investment program.
RISKS OF BOND INVESTING
Bonds are subject to interest rate risk, the decline in bond prices that usually accompanies a rise in interest rates, and credit risk, the chance that any fund holding could have its credit rating downgraded or that a bond issuer will default (fail to make timely payments of interest or principal), potentially reducing the fund’s income level and share price. MBS are subject to prepayment risk, particularly if falling rates lead to heavy refinancing activity, and extension risk, which is an increase in interest rates that causes a fund’s average maturity to lengthen unexpectedly due to a drop in mortgage prepayments. This could increase the fund’s sensitivity to rising interest rates and its potential for price declines.
GLOSSARY
Barclays Asset-Backed Securities Index: Tracks the performance of securities backed by assets including credit card, home equity, and auto loans.
Barclays Commercial Mortgage-Backed Securities ERISA-Eligible Index: An unmanaged index that tracks the performance of commercial mortgage-backed securities.
Barclays Global Aggregate ex-Treasury Bond U.S. Dollar Hedged Index: Tracks the global investment-grade fixed rate debt markets, excluding U.S. Treasury securities, and is hedged to the dollar.
Barclays Global Aggregate ex-U.S. Dollar Bond Index: Tracks the performance of government, corporate, agency, and mortgage-related bonds in Europe, the Asia-Pacific region, and Canada.
Barclays U.S. Agency Bond Index: Tracks the performance of securities issued by U.S. agencies such as Fannie Mae (FNMA), Freddie Mac (FHLMC), and the Federal Home Loan Bank.
Barclays U.S. Corporate Investment Grade Bond Index: A measure of corporate and noncorporate fixed income securities that are primarily rated investment grade (Baa by Moody’s Investors Service and BBB by Standard & Poor’s).
Barclays U.S. Mortgage-Backed Securities Index: An index that tracks the performance of the mortgage-backed pass-through securities of Ginnie Mae (GNMA), Fannie Mae (FNMA), and Freddie Mac (FHLMC).
Barclays U.S. Treasury Bond Index: An unmanaged index of publicly traded obligations of the U.S. Treasury.
Credit Suisse High Yield Index: An index that tracks the performance of domestic noninvestment-grade corporate bonds.
Duration: A measure of a bond fund’s sensitivity to changes in interest rates. For example, a fund with a four-year duration would fall about 4% in response to a one-percentage-point rise in interest rates, and vice versa.
J.P. Morgan Emerging Markets Bond Index Plus: Tracks the total return of U.S. dollar and external currency debt instruments traded in emerging markets.
Lipper averages: The averages of available mutual fund performance returns for specified time periods in categories defined by Lipper Inc.
SEC yield (30-day): A method of calculating a fund’s yield that assumes all portfolio securities are held until maturity. Yield will vary and is not guaranteed.
Weighted average maturity: A measure of a fund’s interest rate sensitivity. In general, the longer the average maturity, the greater the fund’s sensitivity to interest rate changes. The weighted average maturity may take into account the interest rate readjustment dates for certain securities. Money funds must maintain a weighted average maturity of less than 60 days.
Yield curve: A graph depicting the relationship between yields and maturity dates for a set of similar securities. These curves are in constant flux. One of the key activities in managing any fixed income portfolio is to study the trends reflected by yield curves.
Performance and Expenses
This chart shows the value of a hypothetical $10,000 investment in the fund over the past 10 fiscal year periods or since inception (for funds lacking 10-year records). The result is compared with benchmarks, which may include a broad-based market index and a peer group average or index. Market indexes do not include expenses, which are deducted from fund returns as well as mutual fund averages and indexes.
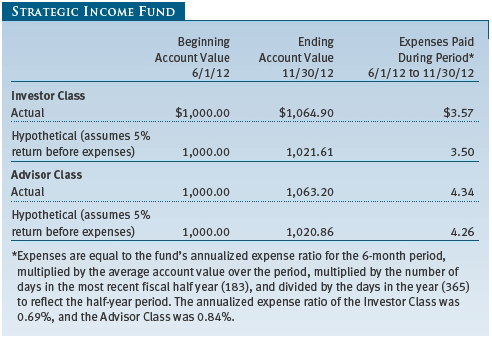
As a mutual fund shareholder, you may incur two types of costs: (1) transaction costs, such as redemption fees or sales loads, and (2) ongoing costs, including management fees, distribution and service (12b-1) fees, and other fund expenses. The following example is intended to help you understand your ongoing costs (in dollars) of investing in the fund and to compare these costs with the ongoing costs of investing in other mutual funds. The example is based on an investment of $1,000 invested at the beginning of the most recent six-month period and held for the entire period.
Please note that the fund has two share classes: The original share class (Investor Class) charges no distribution and service (12b-1) fee, and the Advisor Class shares are offered only through unaffiliated brokers and other financial intermediaries and charge a 0.25% 12b-1 fee. Each share class is presented separately in the table.
Actual Expenses
The first line of the following table (Actual) provides information about actual account values and expenses based on the fund’s actual returns. You may use the information on this line, together with your account balance, to estimate the expenses that you paid over the period. Simply divide your account value by $1,000 (for example, an $8,600 account value divided by $1,000 = 8.6), then multiply the result by the number on the first line under the heading “Expenses Paid During Period” to estimate the expenses you paid on your account during this period.
Hypothetical Example for Comparison Purposes
The information on the second line of the table (Hypothetical) is based on hypothetical account values and expenses derived from the fund’s actual expense ratio and an assumed 5% per year rate of return before expenses (not the fund’s actual return). You may compare the ongoing costs of investing in the fund with other funds by contrasting this 5% hypothetical example and the 5% hypothetical examples that appear in the shareholder reports of the other funds. The hypothetical account values and expenses may not be used to estimate the actual ending account balance or expenses you paid for the period.
Note: T. Rowe Price charges an annual account service fee of $20, generally for accounts with less than $10,000. The fee is waived for any investor whose T. Rowe Price mutual fund accounts total $50,000 or more; accounts electing to receive electronic delivery of account statements, transaction confirmations, prospectuses, and shareholder reports; or accounts of an investor who is a T. Rowe Price Preferred Services, Personal Services, or Enhanced Personal Services client (enrollment in these programs generally requires T. Rowe Price assets of at least $100,000). This fee is not included in the accompanying table. If you are subject to the fee, keep it in mind when you are estimating the ongoing expenses of investing in the fund and when comparing the expenses of this fund with other funds.
You should also be aware that the expenses shown in the table highlight only your ongoing costs and do not reflect any transaction costs, such as redemption fees or sales loads. Therefore, the second line of the table is useful in comparing ongoing costs only and will not help you determine the relative total costs of owning different funds. To the extent a fund charges transaction costs, however, the total cost of owning that fund is higher.
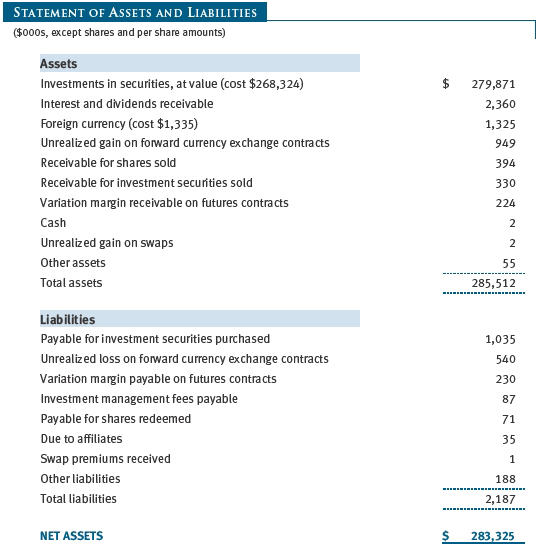
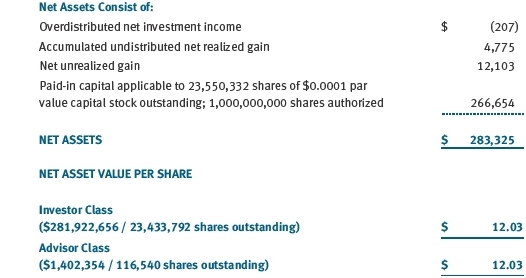
Unaudited

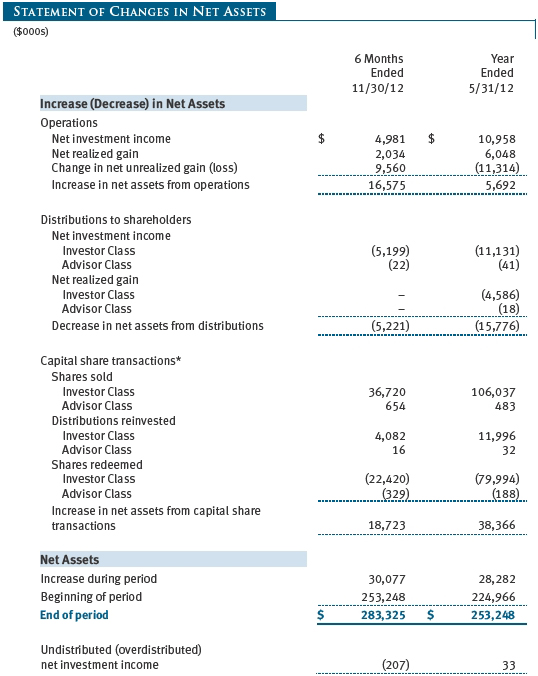
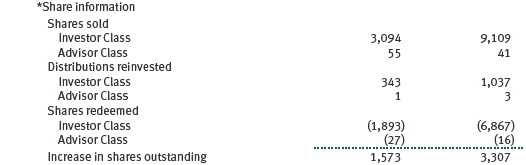
The accompanying notes are an integral part of these financial statements.
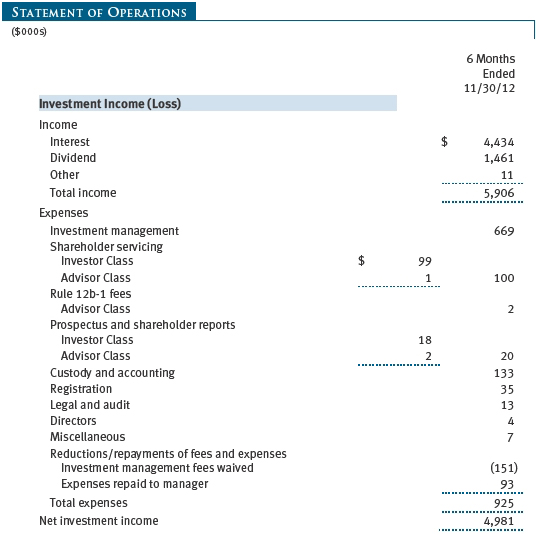
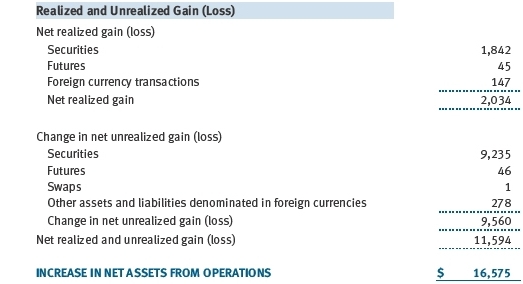
Unaudited
The accompanying notes are an integral part of these financial statements.
Unaudited


The accompanying notes are an integral part of these financial statements.
Unaudited
The accompanying notes are an integral part of these financial statements.
Unaudited
The accompanying notes are an integral part of these financial statements.
Unaudited
The accompanying notes are an integral part of these financial statements.
Unaudited
| Notes to Financial Statements |
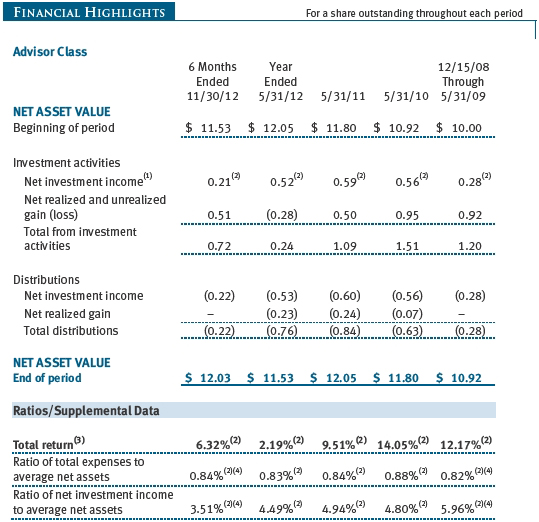
T. Rowe Price Strategic Income Fund (the fund), is registered under the Investment Company Act of 1940 (the 1940 Act) as a diversified, open-end management investment company. The fund seeks to provide high income and some capital appreciation. The fund has two classes of shares: the Strategic Income Fund original share class, referred to in this report as the Investor Class, offered since December 15, 2008, and the Strategic Income Fund–Advisor Class (Advisor Class), offered since December 15, 2008. Advisor Class shares are sold only through unaffiliated brokers and other unaffiliated financial intermediaries that are compensated by the class for distribution, shareholder servicing, and/or certain administrative services under a Board-approved Rule 12b-1 plan. Each class has exclusive voting rights on matters related solely to that class; separate voting rights on matters that relate to both classes; and, in all other respects, the same rights and obligations as the other class.
NOTE 1 - SIGNIFICANT ACCOUNTING POLICIES
Basis of Preparation The accompanying financial statements were prepared in accordance with accounting principles generally accepted in the United States of America (GAAP), which require the use of estimates made by management. Management believes that estimates and valuations are appropriate; however, actual results may differ from those estimates, and the valuations reflected in the accompanying financial statements may differ from the value ultimately realized upon sale or maturity.
Investment Transactions, Investment Income, and Distributions Income and expenses are recorded on the accrual basis. Premiums and discounts on debt securities are amortized for financial reporting purposes. Paydown gains and losses are recorded as an adjustment to interest income. Inflation adjustments to the principal amount of inflation-indexed bonds are reflected as interest income. Dividends received from mutual fund investments are reflected as dividend income; capital gain distributions are reflected as realized gain/loss. Earnings on investments recognized as partnerships for federal income tax purposes reflect the tax character of such earnings. Dividend income and capital gain distributions are recorded on the ex-dividend date. Income tax-related interest and penalties, if incurred, would be recorded as income tax expense. Investment transactions are accounted for on the trade date. Realized gains and losses are reported on the identified cost basis. Distributions to shareholders are recorded on the ex-dividend date. Income distributions are declared by each class daily and paid monthly. Capital gain distributions, if any, are generally declared and paid by the fund annually.
Currency Translation Assets, including investments, and liabilities denominated in foreign currencies are translated into U.S. dollar values each day at the prevailing exchange rate, using the mean of the bid and asked prices of such currencies against U.S. dollars as quoted by a major bank. Purchases and sales of securities, income, and expenses are translated into U.S. dollars at the prevailing exchange rate on the date of the transaction. The effect of changes in foreign currency exchange rates on realized and unrealized security gains and losses is reflected as a component of security gains and losses.
Class Accounting The Advisor Class pays distribution, shareholder servicing, and/or certain administrative expenses in the form of Rule 12b-1 fees, in an amount not exceeding 0.25% of the class’s average daily net assets. Shareholder servicing, prospectus, and shareholder report expenses incurred by each class are charged directly to the class to which they relate. Expenses common to both classes and investment income are allocated to the classes based upon the relative daily net assets of each class’s settled shares; realized and unrealized gains and losses are allocated based upon the relative daily net assets of each class’s outstanding shares.
Credits The fund earns credits on temporarily uninvested cash balances held at the custodian, which reduce the fund’s custody charges. Custody expense in the accompanying financial statements is presented before reduction for credits.
New Accounting Pronouncements In May 2011, the Financial Accounting Standards Board (FASB) issued amended guidance to align fair value measurement and disclosure requirements in U.S. GAAP with International Financial Reporting Standards. The guidance is effective for fiscal years and interim periods beginning on or after December 15, 2011. Adoption had no effect on net assets or results of operations.
In December 2011, the FASB issued amended guidance to enhance disclosure for offsetting assets and liabilities. The guidance is effective for fiscal years and interim periods beginning on or after January 1, 2013. Adoption will have no effect on the fund’s net assets or results of operations.
NOTE 2 - VALUATION
The fund’s financial instruments are reported at fair value as defined by GAAP. The fund determines the values of its assets and liabilities and computes each class’s net asset value per share at the close of the New York Stock Exchange (NYSE), normally 4 p.m. ET, each day that the NYSE is open for business.
Valuation Methods Debt securities are generally traded in the over-the-counter (OTC) market. Securities with remaining maturities of one year or more at the time of acquisition are valued at prices furnished by dealers who make markets in such securities or by an independent pricing service, which considers the yield or price of bonds of comparable quality, coupon, maturity, and type, as well as prices quoted by dealers who make markets in such securities. Securities with remaining maturities of less than one year at the time of acquisition generally use amortized cost in local currency to approximate fair value. However, if amortized cost is deemed not to reflect fair value or the fund holds a significant amount of such securities with remaining maturities of more than 60 days, the securities are valued at prices furnished by dealers who make markets in such securities or by an independent pricing service.
Equity securities listed or regularly traded on a securities exchange or in the OTC market are valued at the last quoted sale price or, for certain markets, the official closing price at the time the valuations are made, except for OTC Bulletin Board securities, which are valued at the mean of the latest bid and asked prices. A security that is listed or traded on more than one exchange is valued at the quotation on the exchange determined to be the primary market for such security. Listed securities not traded on a particular day are valued at the mean of the latest bid and asked prices for domestic securities and the last quoted sale price for international securities.
Investments in mutual funds are valued at the mutual fund’s closing net asset value per share on the day of valuation. Financial futures contracts are valued at closing settlement prices. Forward currency exchange contracts are valued using the prevailing forward exchange rate. Swaps are valued at prices furnished by independent swap dealers or by an independent pricing service.
Other investments, including restricted securities and private placements, and those financial instruments for which the above valuation procedures are inappropriate or are deemed not to reflect fair value, are stated at fair value as determined in good faith by the T. Rowe Price Valuation Committee, established by the fund’s Board of Directors (the Board). Subject to oversight by the Board, the Valuation Committee develops pricing-related policies and procedures and approves all fair-value determinations. The Valuation Committee regularly makes good faith judgments, using a wide variety of sources and information, to establish and adjust valuations of certain securities as events occur and circumstances warrant. For instance, in determining the fair value of private-equity instruments, the Valuation Committee considers a variety of factors, including the company’s business prospects, its financial performance, strategic events impacting the company, relevant valuations of similar companies, new rounds of financing, and any negotiated transactions of significant size between other investors in the company. Because any fair-value determination involves a significant amount of judgment, there is a degree of subjectivity inherent in such pricing decisions.
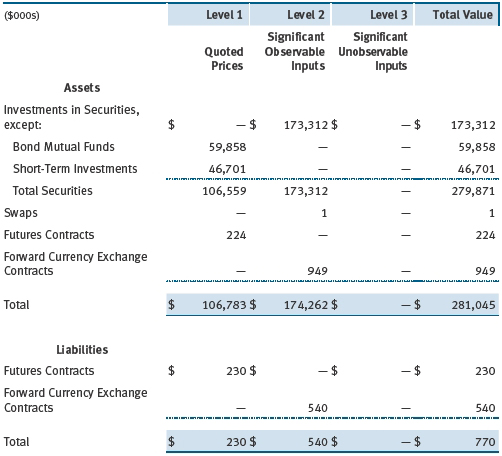
Valuation Inputs Various inputs are used to determine the value of the fund’s financial instruments. These inputs are summarized in the three broad levels listed below:
Level 1 – quoted prices in active markets for identical financial instruments
Level 2 – observable inputs other than Level 1 quoted prices (including, but not limited to, quoted prices for similar financial instruments, interest rates, prepayment speeds, and credit risk)
Level 3 – unobservable inputs
Observable inputs are those based on market data obtained from sources independent of the fund, and unobservable inputs reflect the fund’s own assumptions based on the best information available. The input levels are not necessarily an indication of the risk or liquidity associated with financial instruments at that level. The following table summarizes the fund's financial instruments, based on the inputs used to determine their values on November 30, 2012:
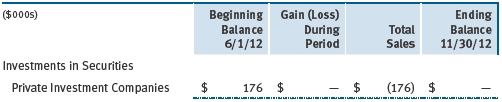
Following is a reconciliation of the fund’s Level 3 holdings for the six months ended November 30, 2012. Gain (loss) reflects both realized and change in unrealized gain (loss) on Level 3 holdings during the period, if any, and is included on the accompanying Statement of Operations. The change in unrealized gain (loss) on Level 3 instruments held at November 30, 2012, totaled $0 for the six months ended November 30, 2012.
NOTE 3 - DERIVATIVE INSTRUMENTS
During the six months ended November 30, 2012, the fund invested in derivative instruments. As defined by GAAP, a derivative is a financial instrument whose value is derived from an underlying security price, foreign exchange rate, interest rate, index of prices or rates, or other variable; it requires little or no initial investment and permits or requires net settlement. The fund invests in derivatives only if the expected risks and rewards are consistent with its investment objectives, policies, and overall risk profile, as described in its prospectus and Statement of Additional Information. The fund may use derivatives for a variety of purposes, such as seeking to hedge against declines in principal value, increase yield, invest in an asset with greater efficiency and at a lower cost than is possible through direct investment, or to adjust portfolio duration and credit exposure. The risks associated with the use of derivatives are different from, and potentially much greater than, the risks associated with investing directly in the instruments on which the derivatives are based. Investments in derivatives can magnify returns positively or negatively; however, the fund at all times maintains sufficient cash reserves, liquid assets, or other SEC-permitted asset types to cover the settlement obligations under its open derivative contracts.
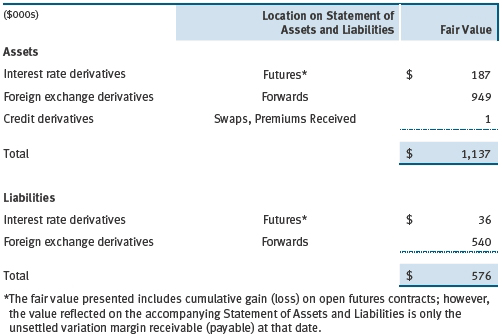
The fund values its derivatives at fair value, as described below and in Note 2, and recognizes changes in fair value currently in its results of operations. Accordingly, the fund does not follow hedge accounting, even for derivatives employed as economic hedges. The fund does not offset the fair value of derivative instruments against the right to reclaim or obligation to return collateral. The following table summarizes the fair value of the fund’s derivative instruments held as of November 30, 2012, and the related location on the accompanying Statement of Assets and Liabilities, presented by primary underlying risk exposure:
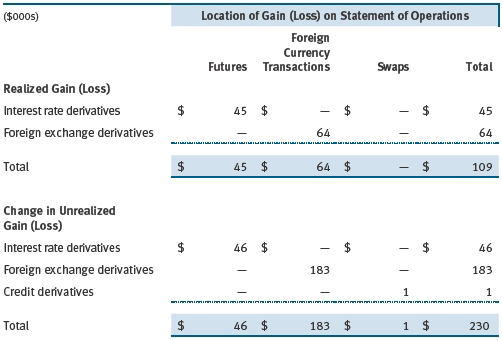
Additionally, the amount of gains and losses on derivative instruments recognized in fund earnings during the six months ended November 30, 2012, and the related location on the accompanying Statement of Operations is summarized in the following table by primary underlying risk exposure:
Forward Currency Exchange Contracts The fund is subject to foreign currency exchange rate risk in the normal course of pursuing its investment objectives. It uses forward currency exchange contracts (forwards) primarily to protect its non-U.S. dollar-denominated securities from adverse currency movements relative to the U.S. dollar. A forward involves an obligation to purchase or sell a fixed amount of a specific currency on a future date at a price set at the time of the contract. Although certain forwards may be settled by exchanging only the net gain or loss on the contract, most forwards are settled with the exchange of the underlying currencies in accordance with the specified terms. Forwards are valued at the unrealized gain or loss on the contract, which reflects the net amount the fund either is entitled to receive or obligated to deliver, as measured by the difference between the forward exchange rates at the date of entry into the contract and the forward rates at the reporting date. Appreciated forwards are reflected as assets, and depreciated forwards are reflected as liabilities on the accompanying Statement of Assets and Liabilities. Risks related to the use of forwards include the possible failure of counterparties to meet the terms of the agreements; that anticipated currency movements will not occur, thereby reducing the fund’s total return; and the potential for losses in excess of the fund’s initial investment. During the six months ended November 30, 2012, the fund’s exposure to forwards, based on underlying notional amounts, was generally between 16% and 18% of net assets.
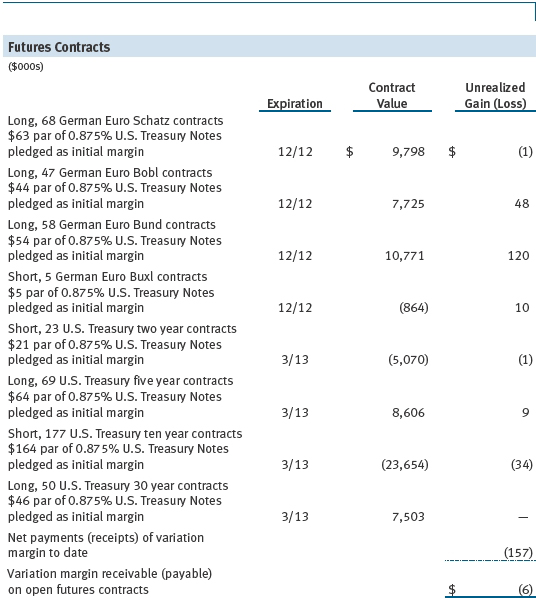
Futures Contracts The fund is subject to interest rate risk in the normal course of pursuing its investment objectives and uses futures contracts to help manage such risk. The fund may enter into futures contracts to manage exposure to interest rate and yield curve movements, security prices, foreign currencies, credit quality, and mortgage prepayments; as an efficient means of adjusting exposure to all or part of a target market; to enhance income; as a cash management tool; and/or to adjust portfolio duration and credit exposure. A futures contract provides for the future sale by one party and purchase by another of a specified amount of a particular underlying financial instrument at an agreed-upon price, date, time, and place. The fund currently invests only in exchange-traded futures, which generally are standardized as to maturity date, underlying financial instrument, and other contract terms. Upon entering into a futures contract, the fund is required to deposit collateral with the broker in the form of cash or securities in an amount equal to a certain percentage of the contract value (margin requirement); the margin requirement must then be maintained at the established level over the life of the contract. Subsequent payments are made or received by the fund each day to settle daily fluctuations in the value of the contract (variation margin), which reflect changes in the value of the underlying financial instrument. Variation margin is recorded as unrealized gain or loss until the contract is closed. The value of a futures contract included in net assets is the amount of unsettled variation margin; net variation margin receivable is reflected as an asset, and net variation margin payable is reflected as a liability on the accompanying Statement of Assets and Liabilities. Risks related to the use of futures contracts include possible illiquidity of the futures markets, contract prices that can be highly volatile and imperfectly correlated to movements in hedged security values and/or interest rates, and potential losses in excess of the fund’s initial investment. During the six months ended November 30, 2012, the fund’s exposure to futures, based on underlying notional amounts, was generally between 18% and 21% of net assets.
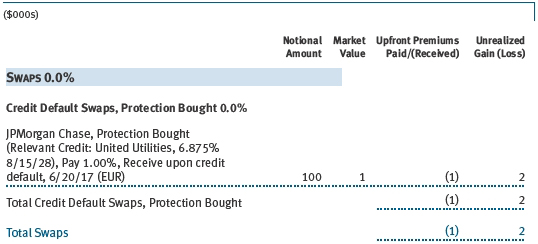
Credit Default Swaps The fund is subject to credit risk in the normal course of pursuing its investment objectives and uses swap contracts to help manage such risk. The fund may use swaps in an effort to manage exposure to changes in interest rates, inflation rates, and credit quality; to adjust overall exposure to certain markets; to enhance total return or protect the value of portfolio securities; to serve as a cash management tool; and/or to adjust portfolio duration or credit exposure. Credit default swaps are agreements where one party (the protection buyer) agrees to make periodic payments to another party (the protection seller) in exchange for protection against specified credit events, such as certain defaults and bankruptcies related to an underlying credit instrument, or issuer or index of such instruments. Upon occurrence of a specified credit event, the protection seller is required to pay the buyer the difference between the notional amount of the swap and the value of the underlying credit, either in the form of a net cash settlement or by paying the gross notional amount and accepting delivery of the relevant underlying credit. For credit default swaps where the underlying credit is an index, a specified credit event may affect all or individual underlying securities included in the index and will be settled based upon the relative weighting of the affected underlying security(s) within the index. The value of a swap included in net assets is the unrealized gain or loss on the contract plus or minus any unamortized premiums paid or received, respectively. Appreciated swaps and premiums paid are reflected as assets, and depreciated swaps and premiums received are reflected as liabilities on the accompanying Statement of Assets and Liabilities. Net periodic receipts or payments required by swaps are accrued daily and are recorded as realized gain or loss for financial reporting purposes when settled; fluctuations in the fair value of swaps are reflected in the change in net unrealized gain or loss and are reclassified to realized gain or loss upon termination prior to maturity or cash settlement. Risks related to the use of credit default swaps include the possible inability of the fund to accurately assess the current and future creditworthiness of underlying issuers, the possible failure of a counterparty to perform in accordance with the terms of the swap agreements, potential government regulation that could adversely affect the fund’s swap investments, and potential losses in excess of the fund’s initial investment. During the six months ended November 30, 2012, the fund’s exposure to swaps, based on underlying notional amounts, was generally less than 1% of net assets.
NOTE 4 - OTHER INVESTMENT TRANSACTIONS
Consistent with its investment objective, the fund engages in the following practices to manage exposure to certain risks and/or to enhance performance. The investment objective, policies, program, and risk factors of the fund are described more fully in the fund’s prospectus and Statement of Additional Information.
Emerging Markets At November 30, 2012, approximately 17% of the fund’s net assets were invested, either directly or through investments in T. Rowe Price institutional funds, in securities of companies located in emerging markets, securities issued by governments of emerging market countries, and/or securities denominated in or linked to the currencies of emerging market countries. Emerging market securities are often subject to greater price volatility, less liquidity, and higher rates of inflation than U.S. securities. In addition, emerging markets may be subject to greater political, economic, and social uncertainty, and differing regulatory environments that may potentially impact the fund’s ability to buy or sell certain securities or repatriate proceeds to U.S. dollars.
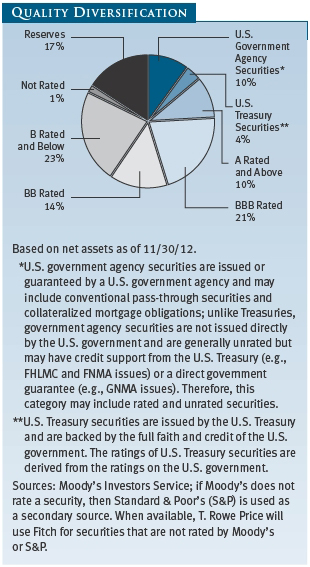
Noninvestment-Grade Debt Securities At November 30, 2012, approximately 32% of the fund’s net assets were invested, either directly or through its investment in T. Rowe Price institutional funds, in noninvestment-grade debt securities, commonly referred to as “high yield” or “junk” bonds. The noninvestment-grade bond market may experience sudden and sharp price swings due to a variety of factors, including changes in economic forecasts, stock market activity, large sustained sales by major investors, a high-profile default, or a change in market psychology. These events may decrease the ability of issuers to make principal and interest payments and adversely affect the liquidity or value, or both, of such securities.
Restricted Securities The fund may invest in securities that are subject to legal or contractual restrictions on resale. Prompt sale of such securities at an acceptable price may be difficult and may involve substantial delays and additional costs.
TBA Purchase and Sale Commitments During the six months ended November 30, 2012, the fund entered into to be announced (TBA) purchase and/or sale commitments, pursuant to which it agrees to purchase or sell, respectively, mortgage-backed securities for a fixed unit price, with payment and delivery at a scheduled future date beyond the customary settlement period for such mortgage-backed securities. With TBA transactions, the particular securities to be delivered are not identified at the trade date; however, delivered securities must meet specified terms, including issuer, rate, and mortgage term, and be within industry-accepted “good delivery” standards. The fund generally enters into TBA purchase transactions with the intention of taking possession of the underlying mortgage securities; however, for either purchase or sale transactions, the fund also may extend the settlement by “rolling” the transaction. Until settlement, the fund maintains cash reserves and liquid assets sufficient to settle its TBA commitments.
Counterparty Risk and Collateral The fund has entered into collateral agreements with certain counterparties to mitigate counterparty risk associated with certain over-the-counter (OTC) financial instruments, including swaps, forward currency exchange contracts, TBA purchase commitments, and OTC options (collectively, covered OTC instruments). Subject to certain minimum exposure requirements (which typically range from $100,000 to $500,000), collateral requirements generally are determined and transfers made based on the net aggregate unrealized gain or loss on all OTC instruments covered by a particular collateral agreement with a specified counterparty. At any point in time, the fund’s risk of loss from counterparty credit risk on covered OTC instruments is the aggregate unrealized gain on appreciated covered OTC instruments in excess of collateral, if any, pledged by the counterparty to the fund. Further, in accordance with the terms of the relevant agreements, counterparties to certain OTC instruments may be able to terminate the contracts prior to maturity upon the occurrence of certain stated events, such as a decline in net assets above a certain percentage or a failure by the fund to perform its obligations under the contract. Upon termination, all transactions would typically be liquidated and a net amount would be owed by or payable to the fund.
Counterparty risk related to exchange-traded futures and options contracts is minimal because the exchange’s clearinghouse provides protection against counterparty defaults. Generally, for exchange-traded derivatives such as futures and options, each broker, in its sole discretion, may change margin requirements applicable to the fund.
Collateral can be in the form of cash or debt securities issued by the U.S. government or related agencies. For OTC instruments, collateral both pledged by the fund to a counterparty and pledged by a counterparty to the fund, is held in a segregated account by a third-party agent. For exchange-traded instruments, margin posted by the fund is held by the broker. Cash posted by the fund as collateral or to meet margin requirements is reflected as restricted cash in the accompanying financial statements and securities posted by the fund are so noted in the accompanying Portfolio of Investments; both remain in the fund’s assets. Collateral pledged by counterparties is not included in the fund’s assets because the fund does not obtain effective control over those assets. As of November 30, 2012, no collateral had been posted by the fund to counterparties for covered OTC instruments. As of November 30, 2012, collateral pledged by counterparties to the fund for covered OTC instruments consisted of securities valued at $71,000. As of November 30, 2012, securities valued at $469,000 had been posted by the fund to the broker for exchange-traded derivatives.
Other Purchases and sales of portfolio securities other than short-term and U.S. government securities aggregated $54,836,000 and $51,499,000, respectively, for the six months ended November 30, 2012. Purchases and sales of U.S. government securities aggregated $43,079,000 and $34,402,000, respectively, for the six months ended November 30, 2012.
NOTE 5 - FEDERAL INCOME TAXES
No provision for federal income taxes is required since the fund intends to continue to qualify as a regulated investment company under Subchapter M of the Internal Revenue Code and distribute to shareholders all of its taxable income and gains. Distributions determined in accordance with federal income tax regulations may differ in amount or character from net investment income and realized gains for financial reporting purposes. Financial reporting records are adjusted for permanent book/tax differences to reflect tax character but are not adjusted for temporary differences. The amount and character of tax-basis distributions and composition of net assets are finalized at fiscal year-end; accordingly, tax-basis balances have not been determined as of the date of this report.
The fund intends to retain realized gains to the extent of available capital loss carryforwards. Net realized capital losses may be carried forward indefinitely to offset future realized capital gains.
At November 30, 2012, the cost of investments for federal income tax purposes was $268,414,000. Net unrealized gain aggregated $12,013,000 at period-end, of which $14,935,000 related to appreciated investments and $2,922,000 related to depreciated investments.
NOTE 6 - RELATED PARTY TRANSACTIONS
The fund is managed by T. Rowe Price Associates, Inc. (Price Associates), a wholly owned subsidiary of T. Rowe Price Group, Inc. (Price Group). The investment management agreement between the fund and Price Associates provides for an annual investment management fee, which is computed daily and paid monthly. The fee consists of an individual fund fee, equal to 0.20% of the fund’s average daily net assets, and a group fee. The group fee rate is calculated based on the combined net assets of certain mutual funds sponsored by Price Associates (the group) applied to a graduated fee schedule, with rates ranging from 0.48% for the first $1 billion of assets to 0.28% for assets in excess of $300 billion. The fund’s group fee is determined by applying the group fee rate to the fund’s average daily net assets. At November 30, 2012, the effective annual group fee rate was 0.30%.
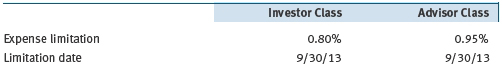
The Investor Class and Advisor Class are also subject to a contractual expense limitation through the limitation dates indicated in the table below. During the limitation period, Price Associates is required to waive its management fee and/or reimburse expenses, excluding interest, taxes, brokerage commissions, and extraordinary expenses that would otherwise cause the class’s ratio of annualized total expenses to average net assets (expense ratio) to exceed its expense limitation. For a period of three years after the date of any reimbursement or waiver, each class is required to repay Price Associates for expenses previously reimbursed and management fees waived to the extent the class’s net assets have grown or expenses have declined sufficiently to allow repayment without causing the class’s expense ratio to exceed its expense limitation.
Pursuant to this agreement, expenses in the amount of $93,000 were repaid to Price Associates during the six months ended November 30, 2012. Including these amounts, expenses previously reimbursed by Price Associates in the amount of $91,000 remain subject to repayment at November 30, 2012.
In addition, the fund has entered into service agreements with Price Associates and two wholly owned subsidiaries of Price Associates (collectively, Price). Price Associates computes the daily share prices and provides certain other administrative services to the fund. T. Rowe Price Services, Inc., provides shareholder and administrative services in its capacity as the fund’s transfer and dividend disbursing agent. T. Rowe Price Retirement Plan Services, Inc., provides subaccounting and recordkeeping services for certain retirement accounts invested in the Investor Class. For the six months ended November 30, 2012, expenses incurred pursuant to these service agreements were $103,000 for Price Associates; $63,000 for T. Rowe Price Services, Inc.; and $1,000 for T. Rowe Price Retirement Plan Services, Inc. The total amount payable at period-end pursuant to these service agreements is reflected as Due to Affiliates in the accompanying financial statements.
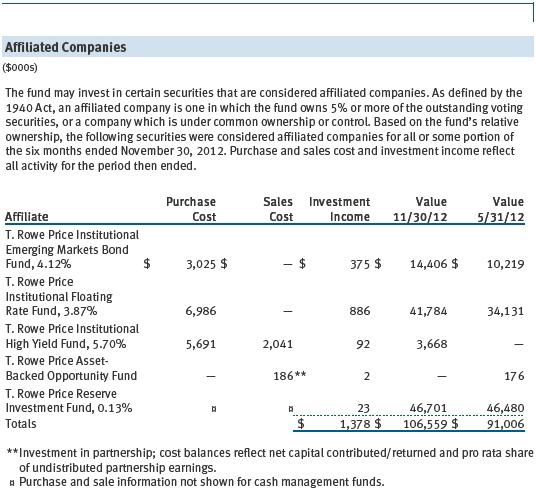
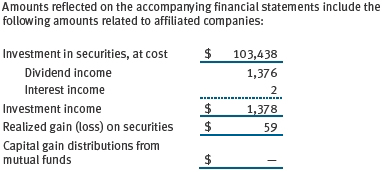
The fund may invest in the T. Rowe Price Reserve Investment Fund and the T. Rowe Price Government Reserve Investment Fund (collectively, the T. Rowe Price Reserve Investment Funds), open-end management investment companies managed by Price Associates and considered affiliates of the fund. The T. Rowe Price Reserve Investment Funds are offered as cash management options to mutual funds, trusts, and other accounts managed by Price Associates and/or its affiliates and are not available for direct purchase by members of the public. The T. Rowe Price Reserve Investment Funds pay no investment management fees.
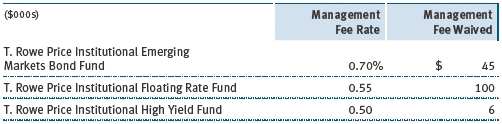
The fund may also invest in certain T. Rowe Price institutional funds (underlying institutional funds) as a means of gaining efficient and cost-effective exposure to certain markets. The underlying institutional funds are open-end management investment companies managed by Price Associates and are considered affiliates of the fund. Each underlying institutional fund pays an all-inclusive management and administrative fee to Price Associates. To ensure that the fund does not incur duplicate fees, Price Associates has agreed to permanently waive a portion of its management fee charged to the fund in an amount sufficient to fully offset the management fees paid by the underlying institutional funds related to fund assets invested therein. Accordingly, the accompanying Statement of Operations includes management fees permanently waived pursuant to this agreement. Annual fee rates and amounts waived within the accompanying Statement of Operations related to shares of the underlying institutional funds for the six months ended November 30, 2012, are as follows:
As of November 30, 2012, T. Rowe Price Group, Inc., and/or its wholly owned subsidiaries owned 2,475,000 shares of the Investor Class, representing 11% of the fund’s net assets.
| Information on Proxy Voting Policies, Procedures, and Records |
A description of the policies and procedures used by T. Rowe Price funds and portfolios to determine how to vote proxies relating to portfolio securities is available in each fund’s Statement of Additional Information, which you may request by calling 1-800-225-5132 or by accessing the SEC’s website, sec.gov. The description of our proxy voting policies and procedures is also available on our website, troweprice.com. To access it, click on the words “Our Company” at the top of our corporate homepage. Then, when the next page appears, click on the words “Proxy Voting Policies” on the left side of the page.
Each fund’s most recent annual proxy voting record is available on our website and through the SEC’s website. To access it through our website, follow the directions above, then click on the words “Proxy Voting Records” on the right side of the Proxy Voting Policies page.
| How to Obtain Quarterly Portfolio Holdings |
The fund files a complete schedule of portfolio holdings with the Securities and Exchange Commission for the first and third quarters of each fiscal year on Form N-Q. The fund’s Form N-Q is available electronically on the SEC’s website (sec.gov); hard copies may be reviewed and copied at the SEC’s Public Reference Room, 100 F St. N.E., Washington, DC 20549. For more information on the Public Reference Room, call 1-800-SEC-0330.
Item 2. Code of Ethics.
A code of ethics, as defined in Item 2 of Form N-CSR, applicable to its principal executive officer, principal financial officer, principal accounting officer or controller, or persons performing similar functions is filed as an exhibit to the registrant’s annual Form N-CSR. No substantive amendments were approved or waivers were granted to this code of ethics during the registrant’s most recent fiscal half-year.
Item 3. Audit Committee Financial Expert.
Disclosure required in registrant’s annual Form N-CSR.
Item 4. Principal Accountant Fees and Services.
Disclosure required in registrant’s annual Form N-CSR.
Item 5. Audit Committee of Listed Registrants.
Not applicable.
Item 6. Investments.
(a) Not applicable. The complete schedule of investments is included in Item 1 of this Form N-CSR.
(b) Not applicable.
Item 7. Disclosure of Proxy Voting Policies and Procedures for Closed-End Management Investment Companies.
Not applicable.
Item 8. Portfolio Managers of Closed-End Management Investment Companies.
Not applicable.
Item 9. Purchases of Equity Securities by Closed-End Management Investment Company and Affiliated Purchasers.
Not applicable.
Item 10. Submission of Matters to a Vote of Security Holders.
Not applicable.
Item 11. Controls and Procedures.
(a) The registrant’s principal executive officer and principal financial officer have evaluated the registrant’s disclosure controls and procedures within 90 days of this filing and have concluded that the registrant’s disclosure controls and procedures were effective, as of that date, in ensuring that information required to be disclosed by the registrant in this Form N-CSR was recorded, processed, summarized, and reported timely.
(b) The registrant’s principal executive officer and principal financial officer are aware of no change in the registrant’s internal control over financial reporting that occurred during the registrant’s second fiscal quarter covered by this report that has materially affected, or is reasonably likely to materially affect, the registrant’s internal control over financial reporting.
Item 12. Exhibits.
(a)(1) The registrant’s code of ethics pursuant to Item 2 of Form N-CSR is filed with the registrant’s annual Form N-CSR.
(2) Separate certifications by the registrant's principal executive officer and principal financial officer, pursuant to Section 302 of the Sarbanes-Oxley Act of 2002 and required by Rule 30a-2(a) under the Investment Company Act of 1940, are attached.
(3) Written solicitation to repurchase securities issued by closed-end companies: not applicable.
(b) A certification by the registrant's principal executive officer and principal financial officer, pursuant to Section 906 of the Sarbanes-Oxley Act of 2002 and required by Rule 30a-2(b) under the Investment Company Act of 1940, is attached.
SIGNATURES
Pursuant to the requirements of the Securities Exchange Act of 1934 and the Investment Company Act of 1940, the registrant has duly caused this report to be signed on its behalf by the undersigned, thereunto duly authorized.
T. Rowe Price Strategic Income Fund, Inc.
| | By | /s/ Edward C. Bernard |
| | Edward C. Bernard |
| | Principal Executive Officer |
| |
| Date January 23, 2013 | | |
Pursuant to the requirements of the Securities Exchange Act of 1934 and the Investment Company Act of 1940, this report has been signed below by the following persons on behalf of the registrant and in the capacities and on the dates indicated.
| | By | /s/ Edward C. Bernard |
| | Edward C. Bernard |
| | Principal Executive Officer |
| |
| Date January 23, 2013 | | |
| |
| |
| By | /s/ Gregory K. Hinkle |
| | Gregory K. Hinkle |
| | Principal Financial Officer |
| |
| Date January 23, 2013 | | |