UNITED STATES
SECURITIES AND EXCHANGE COMMISSION
Washington, D.C. 20549
FORM N-CSR
CERTIFIED SHAREHOLDER REPORT OF REGISTERED
MANAGEMENT INVESTMENT COMPANIES
Investment Company Act File Number: 811-22243
| T. Rowe Price Strategic Income Fund, Inc. |
|
| (Exact name of registrant as specified in charter) |
| |
| 100 East Pratt Street, Baltimore, MD 21202 |
|
| (Address of principal executive offices) |
| |
| David Oestreicher |
| 100 East Pratt Street, Baltimore, MD 21202 |
|
| (Name and address of agent for service) |
Registrant’s telephone number, including area code: (410) 345-2000
Date of fiscal year end: May 31
Date of reporting period: November 30, 2013
Item 1. Report to Shareholders
| Strategic Income Fund | November 30, 2013 |
The views and opinions in this report were current as of November 30, 2013. They are not guarantees of performance or investment results and should not be taken as investment advice. Investment decisions reflect a variety of factors, and the managers reserve the right to change their views about individual stocks, sectors, and the markets at any time. As a result, the views expressed should not be relied upon as a forecast of the fund’s future investment intent. The report is certified under the Sarbanes-Oxley Act, which requires mutual funds and other public companies to affirm that, to the best of their knowledge, the information in their financial reports is fairly and accurately stated in all material respects.
REPORTS ON THE WEB
Sign up for our E-mail Program, and you can begin to receive updated fund reports and prospectuses online rather than through the mail. Log in to your account at troweprice.com for more information.
Manager’s Letter
Fellow Shareholders
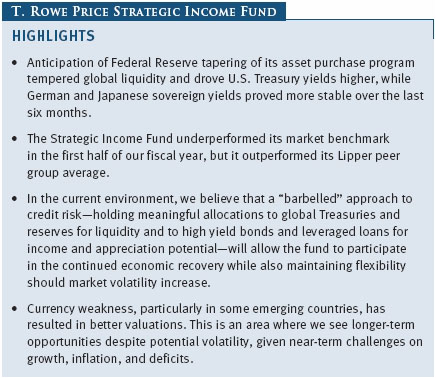
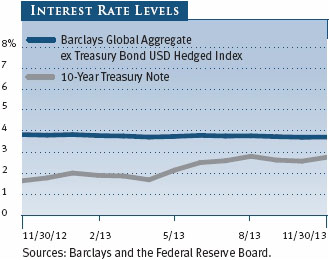
Investor concern, centered on Federal Reserve tapering of asset purchases, combined with continued economic progress across developed economies, drove interest rates higher over the six-month reporting period, hurting the prices of many fixed income securities. The yield on the benchmark 10-year U.S. Treasury note climbed from 2.16% at the end of May to nearly 3.00% in early September, before finishing November at 2.75%. In developed eurozone markets, the increase in government yields was not as dramatic, with the 10-year German bund yield moving from 1.51% to 1.69% over the reporting period. Anticipation of the start of Fed tapering and its accompanying reduction in global liquidity also triggered a sell-off in emerging markets currencies and bonds.
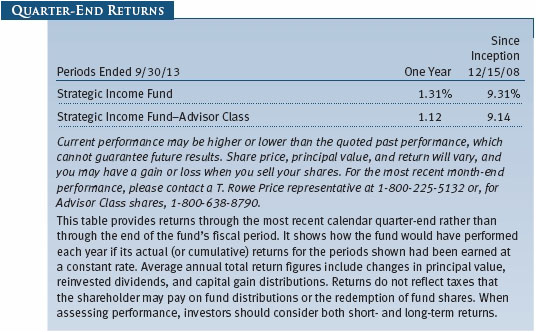
PERFORMANCE COMPARISON
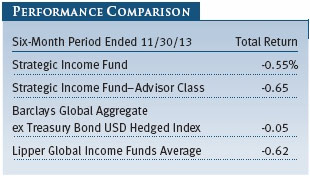
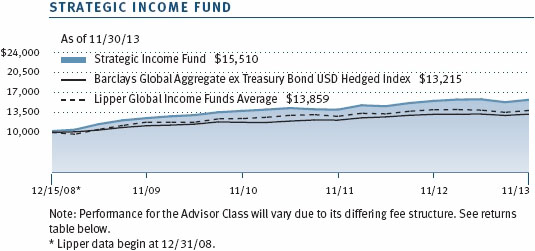
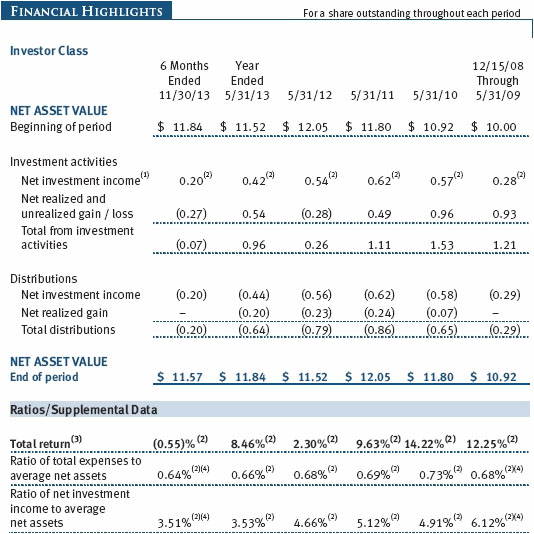
The Strategic Income Fund returned -0.55% for the six months ended November 30, 2013, underperforming the Barclays Global Aggregate ex Treasury Bond USD Hedged Index, which returned -0.05%. The sell-off in currencies was the primary reason for the underperformance versus the benchmark. However, the fund outperformed the Lipper Global Income Funds Average. As shown in the performance tables, the fund’s longer-term performance compares favorably with both the benchmark and peers since its inception in December 2008. Based on cumulative total return, Lipper ranked the Strategic Income Fund 35 of 205, 34 of 145, and 28 of 114 global income funds for the one-year, three-year, and since-inception periods ended November 30, 2013, respectively. These results place the fund in the top quartile for each time period. (Past performance cannot guarantee future results.)
The fund aims to provide a highly diversified fixed income portfolio that invests in a broad range of securities: domestic and foreign, developed and emerging markets, higher risk and higher quality, government-issued and corporate bonds. The fund represents a more aggressive diversified bond fund than other T. Rowe Price offerings due to its substantial allocation flexibility across higher-risk sectors and foreign bonds, and our willingness to deviate significantly from the benchmark when we perceive attractive opportunities. However, the fund is designed to typically be less volatile than bond funds concentrated in a single higher-risk sector, such as high yield.
MARKET ENVIRONMENT
The U.S. economy continued its recovery over the past six months despite political standoffs centered on fiscal policy and the government budget. In this environment, the Fed maintained its monthly purchases of $85 billion in Treasury and agency mortgage-backed securities (MBS) to try to keep long-term interest rates low and provide support for the housing market. However, following the Fed’s late spring statements that it would begin to taper its bond-buying program if economic conditions continued to improve, longer-term interest rates rose sharply. The Fed’s comments about tapering also triggered turmoil in credit sectors and emerging markets as the currencies of several countries lost value amid capital outflows.
The central banks of other developed economies largely maintained their accommodative monetary policies in an effort to shake off the lingering effects of the financial crisis. The eurozone continued to slowly recover, but many fiscal and structural challenges, including elevated levels of debt and high unemployment, remain. The European Central Bank cut its main lending rate by 25 basis points to 0.50% last spring and again in November to 0.25% in an effort to stimulate growth. The Bank of Japan has been particularly aggressive as the Japanese prime minister’s “Abenomics” policies include a massive quantitative easing effort that has contributed to a weaker yen and, importantly, may serve to stoke some inflation as insurance against lingering deflation fears.
In reaction to the Fed’s late spring statements, the yield on the benchmark 10-year U.S. Treasury note rose from less than 2% in May to nearly 3% in early September. The worries about Fed tapering also triggered outflows across many fixed income sectors, including credit sectors and emerging market bonds, amid concerns about rising rates and the resulting negative price impacts. Further weighing on emerging market bonds were concerns about deteriorating growth and accelerating inflation in their local economies, which fueled more outflows. With the September delay in Fed tapering, stability returned to emerging markets, though periodic bouts of volatility are expected going forward as the global economic recovery evolves.
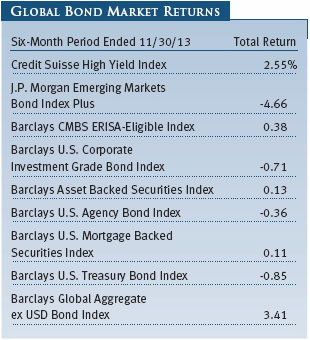
High yield corporate bonds were the best-performing segment of global fixed income over the reporting period, fueled by continued demand for yield in a low-rate environment. The Credit Suisse High Yield Index returned 2.55% for the period, while many other fixed income sectors posted losses. Default rates remain low and many high yield issuers have taken advantage of low rates over the past few years to refinance debt, thereby extending maturities and reducing financing costs. Additionally, high yield bonds are generally less adversely impacted by rising interest rates than investment-grade bonds, particularly if higher yields are due to an improving economy.
Bank loans, which also carry noninvestment-grade credit ratings but have floating interest rates, also benefited from steady investor demand, positive sentiment, and a decline in default expectations. The combination of the floating rate feature and above-average yield boosted demand for loans, resulting in consistent inflows throughout the reporting period. Their floating rates make loans more immune to rising interest rates, so the bank loan market suffered less from the increase in rates than most fixed income sectors.
Higher-quality credit markets in the U.S. did not fare as well, with investment-grade corporate bonds posting slightly negative returns for the reporting period amid rising Treasury rates. Credit markets in non-U.S. developed economies, particularly euro-corporates, generally performed better than investment-grade U.S. debt by posting modestly positive returns. Additionally, government bonds issued by many eurozone countries benefited as well from increased investor confidence in the region’s ability to rebound from the sovereign debt crisis in recent years. Japan’s rates remained low given the country’s large levels of quantitative easing.
Conversely, emerging market debt, both sovereign and corporate, was impacted by concerns on economic fundamentals as well as global liquidity concerns tied to potential Fed tapering. On the fundamental side, economic growth in many emerging countries slowed while inflation fears persisted, contributing to the outflows. Countries with large current account deficits such as the “fragile five”—India, Indonesia, Turkey, Brazil, and South Africa—suffered as a result of these outflows and were viewed as primary examples of the challenges facing emerging economies. All of these countries also have upcoming elections, making it politically difficult to implement the necessary policy and structural reforms.
PERFORMANCE AND INVESTMENT REVIEW
The fund’s underperformance relative to the benchmark stemmed largely from its exposure to emerging market currencies, which are not in the currency-hedged benchmark.
Currency exposure in developed countries was mixed, with short positions in the Japanese yen and Australian dollar helping performance as these currencies weakened versus the dollar, while unexpected strength in the euro negatively affected performance.
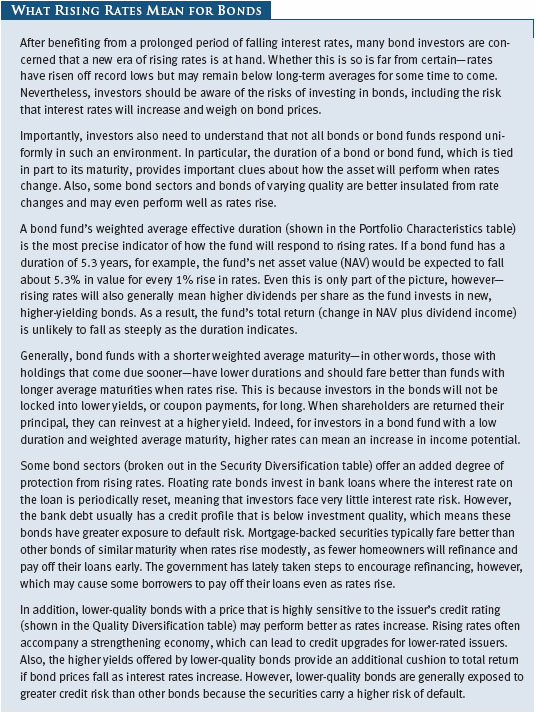
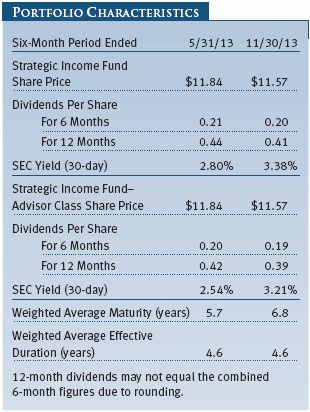
On the other hand, duration positioning was a positive contributor to the fund’s relative performance. Keeping the fund’s overall duration—a measure of its interest rate sensitivity—shorter than that of the benchmark served to limit losses as Treasury yields rose. At the beginning of the reporting period, the fund’s overall duration was 4.53 years while the duration of the benchmark was 5.31 years. In addition, the fund’s relative return benefited from holdings of high yield bonds as well as bank loans, both of which outperformed during the reporting period.

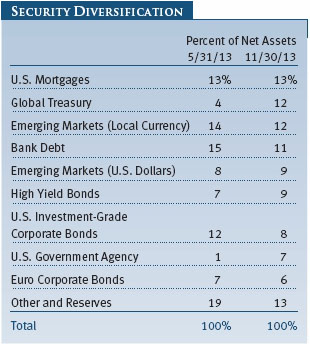
In terms of sector positioning, we continue to maintain a risk “barbell,” overweighting higher-quality liquid sectors such as global government bonds, combined with exposure to higher-risk sectors, including high yield and emerging market bonds. Our allocation to U.S. Treasuries and reserves provides us with tactical flexibility to take advantage of buying opportunities should we see market volatility and wider credit spreads. In addition, we maintain exposure to non-U.S. government bonds, including German and Canadian sovereign debt, to increase the fund’s diversification and potentially benefit from interest rate movements in those countries.
We maintain more modest exposure to moderate-risk sectors, including U.S. and European investment-grade corporate bonds and agency MBS. Current valuations in these sectors appear less attractive than other sectors, particularly if interest rates and volatility increase. In fact, we reduced our exposure to agency MBS after the Fed decision not to taper in September, which caused MBS valuations to move higher.
Despite historically low default expectations, we have grown more cautious on our view of high yield in light of less compelling valuations, as well as some recent deals that offered fewer investor protections. Diversifying globally in high yield continues to make sense, with European high yield bonds an area where we have found pockets of value.
Valuations have also become less compelling in bank loans. Unlike high yield bonds, bank loans typically have a floating rate based on LIBOR, which provides some insulation against rising interest rates since their coupon adjusts up or down as short-term rates change. Also, most bank loans are secured, which provides greater investor protection in the event of a default. Their floating interest rate feature helped loans perform well early in the reporting period as interest rate fears increased, and the sector was also helped by consistent inflows. Later in the period, valuations changed in favor of high yield bonds, and we decreased our allocation to loans.
Emerging market sovereign and corporate debt also was impacted by the increase in U.S. interest rates. The long duration of emerging market sovereigns, in particular, weighed on performance. With more attractive valuations, we selectively increased the fund’s exposure to U.S. dollar-denominated emerging market sovereign debt as well as corporates during the latter half of the year. Although many emerging economies continue to face economic challenges, we analyze markets on a country-by-country basis to identify attractive opportunities in individual markets.
With tighter spreads making it difficult to find value in credit sectors, we view local currency emerging market bonds as an area that could boost returns going forward. Despite near-term challenges, we have a positive long-term view of emerging economies and see the sector as not only a potential source of added return, but also as a way to add diversification to the fund. Compared with most major developed economies, emerging markets generally have higher interest rates and positive inflation-adjusted yields, lower debt levels, stronger fiscal balances, and a higher rate of economic growth expected over the long run. We believe that these solid fundamentals will lead their currencies to appreciate over time, though near-term volatility is likely given that short-term economic challenges remain.
One of the portfolio’s primary non-U.S. dollar currency exposures is in the Mexican peso, which has fared better than the currencies of countries with large current account deficits. Although many analysts have lowered their projections for Mexico’s near-term growth, the central bank has cut rates and the Mexican government has implemented structural changes that bode well for long-term economic health. In particular, the Mexican government plans to allow private sector investment in the country’s energy sector as well as to implement reforms that broaden Mexico’s tax base.
OUTLOOK
The U.S. economy appears to have gained traction in recent months and the Fed announced that it will begin scaling back its purchases of both Treasuries and MBS in January 2014 as it brings its monetary policy back to more normal levels of accommodation. In this environment, we are looking for more modest interest rate increases than we experienced in 2013 absent unexpected strength in the U.S. recovery or a surprise in inflationary pressures, which is not anticipated. Given our outlook for rates to drift modestly higher, we are currently keeping the fund’s overall duration shorter than that of the benchmark but expect to vary this through time as market conditions dictate.
While UK and Canadian rates could also move with U.S. rates, European and Japanese rates are likely to remain less tied to U.S. rates given differing central bank policies biased more toward continued easing of monetary policy.
Within sectors, the additional yield from taking credit risk is currently much less than in recent years. While postcrisis periods have seen some outsized returns from credit, return expectations going forward appear much more modest and dependent on the progress of the global economic recovery. We believe the return potential going forward, but also the risk, resides more with emerging economies than developed economies. In this uncertain environment, we believe that our strengths in identifying risks and return opportunities, tactically adjusting our portfolio allocations, and performing fundamental credit analysis will help us to continue to generate solid long-term performance for our shareholders.
Thank you for investing with T. Rowe Price.
Respectfully submitted,

Steven C. Huber
Chairman of the fund’s Investment Advisory Committee
December 20, 2013
The committee chairman has day-to-day responsibility for managing the portfolio and works with committee members in developing and executing the fund’s investment program.
RISKS OF BOND INVESTING
Bonds are subject to interest rate risk, the decline in bond prices that usually accompanies a rise in interest rates, and credit risk, the chance that any fund holding could have its credit rating downgraded or that a bond issuer will default (fail to make timely payments of interest or principal), potentially reducing the fund’s income level and share price. MBS are subject to prepayment risk, particularly if falling rates lead to heavy refinancing activity, and extension risk, which is an increase in interest rates that causes a fund’s average maturity to lengthen unexpectedly due to a drop in mortgage prepayments. This could increase the fund’s sensitivity to rising interest rates and its potential for price declines.
GLOSSARY
Barclays Asset Backed Securities Index: Tracks the performance of securities backed by assets including credit card, home equity, and auto loans.
Barclays CMBS ERISA-Eligible Index: An unmanaged index that tracks the performance of commercial mortgage-backed securities.
Barclays Global Aggregate ex Treasury Bond USD Hedged Index: Tracks the global investment-grade fixed rate debt markets, excluding U.S. Treasury securities, and is hedged to the dollar.
Barclays Global Aggregate ex USD Bond Index: Tracks the performance of government, corporate, agency, and mortgage-related bonds in Europe, the Asia-Pacific region, and Canada.
Barclays U.S. Agency Bond Index: Tracks the performance of securities issued by U.S. agencies such as Fannie Mae (FNMA), Freddie Mac (FHLMC), and the Federal Home Loan Bank.
Barclays U.S. Corporate Investment Grade Bond Index: A measure of corporate and noncorporate fixed income securities that are primarily rated investment grade (Baa by Moody’s Investors Service and BBB by Standard & Poor’s).
Barclays U.S. Mortgage Backed Securities Index: An index that tracks the performance of the mortgage-backed pass-through securities of Ginnie Mae (GNMA), Fannie Mae (FNMA), and Freddie Mac (FHLMC).
Barclays U.S. Treasury Bond Index: An unmanaged index of publicly traded obligations of the U.S. Treasury.
Basis point: Equivalent to 0.01 percentage points.
Credit spreads: The additional yield that investors demand to hold a bond with credit risk compared with a Treasury security with a comparable maturity date.
Credit Suisse High Yield Index: An index that tracks the performance of domestic noninvestment-grade corporate bonds.
Duration: A measure of a bond fund’s sensitivity to changes in interest rates. For example, a fund with a four-year duration would fall about 4% in response to a one-percentage-point rise in interest rates, and vice versa.
J.P. Morgan Emerging Markets Bond Index Plus: Tracks the total return of U.S. dollar and external currency debt instruments traded in emerging markets.
LIBOR: The London Interbank Offered Rate, which is a benchmark for short-term taxable rates.
Lipper averages: The averages of available mutual fund performance returns for specified time periods in categories defined by Lipper Inc.
SEC yield (30-day): A method of calculating a fund’s yield that assumes all portfolio securities are held until maturity. Yield will vary and is not guaranteed.
Weighted average maturity: A measure of a fund’s interest rate sensitivity. In general, the longer the average maturity, the greater the fund’s sensitivity to interest rate changes. The weighted average maturity may take into account the interest rate readjustment dates for certain securities. Money funds must maintain a weighted average maturity of less than 60 days.
Yield curve: A graph depicting the relationship between yields and maturity dates for a set of similar securities. These curves are in constant flux. One of the key activities in managing any fixed income portfolio is to study the trends reflected by yield curves.
Performance and Expenses
This chart shows the value of a hypothetical $10,000 investment in the fund over the past 10 fiscal year periods or since inception (for funds lacking 10-year records). The result is compared with benchmarks, which may include a broad-based market index and a peer group average or index. Market indexes do not include expenses, which are deducted from fund returns as well as mutual fund averages and indexes.

As a mutual fund shareholder, you may incur two types of costs: (1) transaction costs, such as redemption fees or sales loads, and (2) ongoing costs, including management fees, distribution and service (12b-1) fees, and other fund expenses. The following example is intended to help you understand your ongoing costs (in dollars) of investing in the fund and to compare these costs with the ongoing costs of investing in other mutual funds. The example is based on an investment of $1,000 invested at the beginning of the most recent six-month period and held for the entire period.
Please note that the fund has two share classes: The original share class (Investor Class) charges no distribution and service (12b-1) fee, and the Advisor Class shares are offered only through unaffiliated brokers and other financial intermediaries and charge a 0.25% 12b-1 fee. Each share class is presented separately in the table.
Actual Expenses
The first line of the following table (Actual) provides information about actual account values and expenses based on the fund’s actual returns. You may use the information on this line, together with your account balance, to estimate the expenses that you paid over the period. Simply divide your account value by $1,000 (for example, an $8,600 account value divided by $1,000 = 8.6), then multiply the result by the number on the first line under the heading “Expenses Paid During Period” to estimate the expenses you paid on your account during this period.
Hypothetical Example for Comparison Purposes
The information on the second line of the table (Hypothetical) is based on hypothetical account values and expenses derived from the fund’s actual expense ratio and an assumed 5% per year rate of return before expenses (not the fund’s actual return). You may compare the ongoing costs of investing in the fund with other funds by contrasting this 5% hypothetical example and the 5% hypothetical examples that appear in the shareholder reports of the other funds. The hypothetical account values and expenses may not be used to estimate the actual ending account balance or expenses you paid for the period.
Note: T. Rowe Price charges an annual account service fee of $20, generally for accounts with less than $10,000. The fee is waived for any investor whose T. Rowe Price mutual fund accounts total $50,000 or more; accounts electing to receive electronic delivery of account statements, transaction confirmations, prospectuses, and shareholder reports; or accounts of an investor who is a T. Rowe Price Preferred Services, Personal Services, or Enhanced Personal Services client (enrollment in these programs generally requires T. Rowe Price assets of at least $100,000). This fee is not included in the accompanying table. If you are subject to the fee, keep it in mind when you are estimating the ongoing expenses of investing in the fund and when comparing the expenses of this fund with other funds.
You should also be aware that the expenses shown in the table highlight only your ongoing costs and do not reflect any transaction costs, such as redemption fees or sales loads. Therefore, the second line of the table is useful in comparing ongoing costs only and will not help you determine the relative total costs of owning different funds. To the extent a fund charges transaction costs, however, the total cost of owning that fund is higher.

Unaudited
The accompanying notes are an integral part of these financial statements.
Unaudited


The accompanying notes are an integral part of these financial statements.
Unaudited


The accompanying notes are an integral part of these financial statements.
Unaudited

The accompanying notes are an integral part of these financial statements.
Unaudited

The accompanying notes are an integral part of these financial statements.
Unaudited
The accompanying notes are an integral part of these financial statements.
Unaudited
| Notes to Financial Statements |
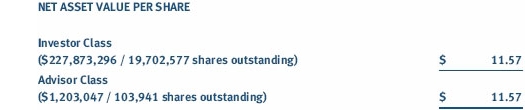
T. Rowe Price Strategic Income Fund, Inc. (the fund), is registered under the Investment Company Act of 1940 (the 1940 Act) as a diversified, open-end management investment company. The fund seeks to provide high income and some capital appreciation. The fund has two classes of shares: the Strategic Income Fund original share class, referred to in this report as the Investor Class, offered since December 15, 2008, and the Strategic Income Fund–Advisor Class (Advisor Class), offered since December 15, 2008. Advisor Class shares are sold only through unaffiliated brokers and other unaffiliated financial intermediaries that are compensated by the class for distribution, shareholder servicing, and/or certain administrative services under a Board-approved Rule 12b-1 plan. Each class has exclusive voting rights on matters related solely to that class; separate voting rights on matters that relate to both classes; and, in all other respects, the same rights and obligations as the other class.
NOTE 1 - SIGNIFICANT ACCOUNTING POLICIES
Basis of Preparation The fund is an investment company and follows accounting and reporting guidance in the Financial Accounting Standards Board Accounting Standards Codification Topic 946 (ASC 946). The accompanying financial statements were prepared in accordance with accounting principles generally accepted in the United States of America (GAAP), including but not limited to ASC 946. GAAP requires the use of estimates made by management. Management believes that estimates and valuations are appropriate; however, actual results may differ from those estimates, and the valuations reflected in the accompanying financial statements may differ from the value ultimately realized upon sale or maturity.
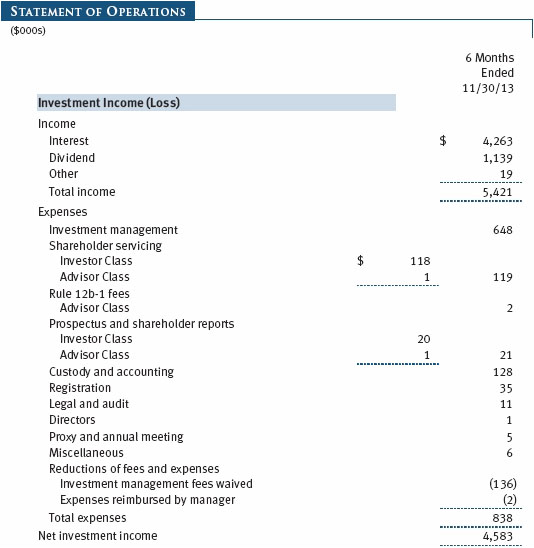
Investment Transactions, Investment Income, and Distributions Income and expenses are recorded on the accrual basis. Premiums and discounts on debt securities are amortized for financial reporting purposes. Paydown gains and losses are recorded as an adjustment to interest income. Inflation adjustments to the principal amount of inflation-indexed bonds are reflected as interest income. Dividends received from mutual fund investments are reflected as dividend income; capital gain distributions are reflected as realized gain/loss. Dividend income and capital gain distributions are recorded on the ex-dividend date. Income tax-related interest and penalties, if incurred, would be recorded as income tax expense. Investment transactions are accounted for on the trade date. Realized gains and losses are reported on the identified cost basis. Distributions to shareholders are recorded on the ex-dividend date. Income distributions are declared by each class daily and paid monthly. Capital gain distributions, if any, are generally declared and paid by the fund annually.
Currency Translation Assets, including investments, and liabilities denominated in foreign currencies are translated into U.S. dollar values each day at the prevailing exchange rate, using the mean of the bid and asked prices of such currencies against U.S. dollars as quoted by a major bank. Purchases and sales of securities, income, and expenses are translated into U.S. dollars at the prevailing exchange rate on the date of the transaction. The effect of changes in foreign currency exchange rates on realized and unrealized security gains and losses is reflected as a component of security gains and losses.
Class Accounting The Advisor Class pays distribution, shareholder servicing, and/or certain administrative expenses in the form of Rule 12b-1 fees, in an amount not exceeding 0.25% of the class’s average daily net assets. Shareholder servicing, prospectus, and shareholder report expenses incurred by each class are charged directly to the class to which they relate. Expenses common to both classes and investment income are allocated to the classes based upon the relative daily net assets of each class’s settled shares; realized and unrealized gains and losses are allocated based upon the relative daily net assets of each class’s outstanding shares.
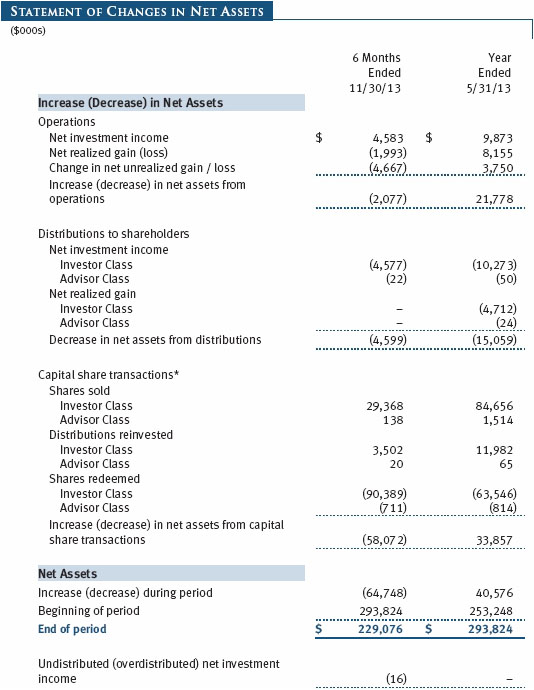
In-Kind Redemptions In accordance with guidelines described in the fund’s prospectus, the fund may distribute portfolio securities rather than cash as payment for a redemption of fund shares (in-kind redemption). For financial reporting purposes, the fund recognizes a gain on in-kind redemptions to the extent the value of the distributed securities on the date of redemption exceeds the cost of those securities. Gains and losses realized on in-kind redemptions are not recognized for tax purposes and are reclassified from undistributed realized gain (loss) to paid-in capital. During the six months ended November 30, 2013, the fund realized $1,527,000 of net gain on $21,260,000 of in-kind redemptions.
New Accounting Guidance On June 1, 2013, the fund adopted new accounting guidance, issued by the Financial Accounting Standards Board, that requires an entity to disclose information about offsetting and related arrangements to enable users of its financial statements to understand the effect of those arrangements on its financial position. Adoption had no effect on the fund’s net assets or results of operations.
NOTE 2 - VALUATION
The fund’s financial instruments are valued, and each class’s net asset value (NAV) per share is computed at the close of the New York Stock Exchange (NYSE), normally 4 p.m. ET, each day the NYSE is open for business.
Fair Value The fund’s financial instruments are reported at fair value, which GAAP defines as the price that would be received to sell an asset or paid to transfer a liability in an orderly transaction between market participants at the measurement date. The T. Rowe Price Valuation Committee (the Valuation Committee) has been established by the fund’s Board of Directors (the Board) to ensure that financial instruments are appropriately priced at fair value in accordance with GAAP and the 1940 Act. Subject to oversight by the Board, the Valuation Committee develops and oversees pricing-related policies and procedures and approves all fair value determinations. Specifically, the Valuation Committee establishes procedures to value securities; determines pricing techniques, sources, and persons eligible to effect fair value pricing actions; oversees the selection, services, and performance of pricing vendors; oversees valuation-related business continuity practices; and provides guidance on internal controls and valuation-related matters. The Valuation Committee reports to the fund’s Board; is chaired by the fund’s treasurer; and has representation from legal, portfolio management and trading, operations, and risk management.
Various valuation techniques and inputs are used to determine the fair value of financial instruments. GAAP establishes the following fair value hierarchy that categorizes the inputs used to measure fair value:
Level 1 – quoted prices (unadjusted) in active markets for identical financial instruments that the fund can access at the reporting date
Level 2 – inputs other than Level 1 quoted prices that are observable, either directly or indirectly (including, but not limited to, quoted prices for similar financial instruments in active markets, quoted prices for identical or similar financial instruments in inactive markets, interest rates and yield curves, implied volatilities, and credit spreads)
Level 3 – unobservable inputs
Observable inputs are developed using market data, such as publicly available information about actual events or transactions, and reflect the assumptions that market participants would use to price the financial instrument. Unobservable inputs are those for which market data are not available and are developed using the best information available about the assumptions that market participants would use to price the financial instrument. GAAP requires valuation techniques to maximize the use of relevant observable inputs and minimize the use of unobservable inputs. When multiple inputs are used to derive fair value, the financial instrument is assigned to the level within the fair value hierarchy based on the lowest-level input that is significant to the fair value of the financial instrument. Input levels are not necessarily an indication of the risk or liquidity associated with financial instruments at that level but rather the degree of judgment used in determining those values.
Valuation Techniques Debt securities generally are traded in the over-the-counter (OTC) market. Securities with remaining maturities of one year or more at the time of acquisition are valued at prices furnished by dealers who make markets in such securities or by an independent pricing service, which considers the yield or price of bonds of comparable quality, coupon, maturity, and type, as well as prices quoted by dealers who make markets in such securities. Securities with remaining maturities of less than one year at the time of acquisition generally use amortized cost in local currency to approximate fair value. However, if amortized cost is deemed not to reflect fair value or the fund holds a significant amount of such securities with remaining maturities of more than 60 days, the securities are valued at prices furnished by dealers who make markets in such securities or by an independent pricing service. Generally, debt securities are categorized in Level 2 of the fair value hierarchy; however, to the extent the valuations include significant unobservable inputs, the securities would be categorized in Level 3.
Equity securities listed or regularly traded on a securities exchange or in the over-the-counter (OTC) market are valued at the last quoted sale price or, for certain markets, the official closing price at the time the valuations are made. OTC Bulletin Board securities are valued at the mean of the closing bid and asked prices. A security that is listed or traded on more than one exchange is valued at the quotation on the exchange determined to be the primary market for such security. Listed securities not traded on a particular day are valued at the mean of the closing bid and asked prices. Actively traded domestic equity securities generally are categorized in Level 1 of the fair value hierarchy. OTC Bulletin Board securities and equity securities traded in inactive markets generally are categorized in Level 2 of the fair value hierarchy.
Investments in mutual funds are valued at the mutual fund’s closing NAV per share on the day of valuation and are categorized in Level 1 of the fair value hierarchy. Listed options, and bilateral options with a listed equivalent, are valued at the mean of the closing bid and asked prices and generally are categorized in Level 2 of the fair value hierarchy. Financial futures contracts are valued at closing settlement prices and are categorized in Level 1 of the fair value hierarchy. Forward currency exchange contracts are valued using the prevailing forward exchange rate and are categorized in Level 2 of the fair value hierarchy. Swaps are valued at prices furnished by independent swap dealers or by an independent pricing service and generally are categorized in Level 2 of the fair value hierarchy; however, if unobservable inputs are significant to the valuation, the swap would be categorized in Level 3. Assets and liabilities other than financial instruments, including short-term receivables and payables, are carried at cost, or estimated realizable value, if less, which approximates fair value.
Thinly traded financial instruments and those for which the above valuation procedures are inappropriate or are deemed not to reflect fair value are stated at fair value as determined in good faith by the Valuation Committee. The objective of any fair value pricing determination is to arrive at a price that could reasonably be expected from a current sale. Financial instruments fair valued by the Valuation Committee are primarily private placements, restricted securities, warrants, rights, and other securities that are not publicly traded.
Subject to oversight by the Board, the Valuation Committee regularly makes good faith judgments to establish and adjust the fair valuations of certain securities as events occur and circumstances warrant. For instance, in determining the fair value of troubled or thinly traded debt instruments, the Valuation Committee considers a variety of factors, which may include, but are not limited to, the issuer’s business prospects, its financial standing and performance, recent investment transactions in the issuer, strategic events affecting the company, market liquidity for the issuer, and general economic conditions and events. In consultation with the investment and pricing teams, the Valuation Committee will determine an appropriate valuation technique based on available information, which may include both observable and unobservable inputs. The Valuation Committee typically will afford greatest weight to actual prices in arm’s length transactions, to the extent they represent orderly transactions between market participants; transaction information can be reliably obtained; and prices are deemed representative of fair value. However, the Valuation Committee may also consider other valuation methods such as a discount or premium from market value of a similar, freely traded security of the same issuer; discounted cash flows; yield to maturity; or some combination. Fair value determinations are reviewed on a regular basis and updated as information becomes available, including actual purchase and sale transactions of the issue. Because any fair value determination involves a significant amount of judgment, there is a degree of subjectivity inherent in such pricing decisions, and fair value prices determined by the Valuation Committee could differ from those of other market participants. Depending on the relative significance of unobservable inputs, including the valuation technique(s) used, fair valued securities may be categorized in Level 2 or 3 of the fair value hierarchy.
Valuation Inputs The following table summarizes the fund’s financial instruments, based on the inputs used to determine their fair values on November 30, 2013:
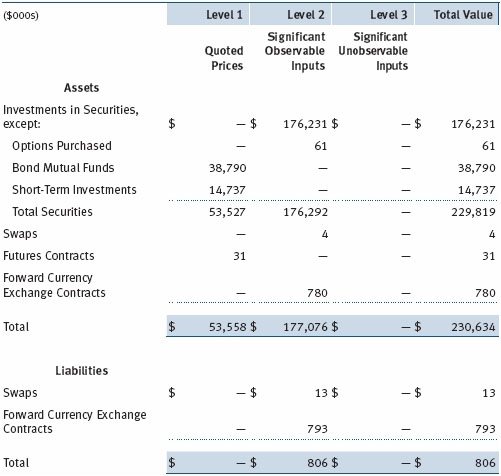
There were no material transfers between Levels 1 and 2 during the six months.
NOTE 3 - DERIVATIVE INSTRUMENTS
During the six months ended November 30, 2013, the fund invested in derivative instruments. As defined by GAAP, a derivative is a financial instrument whose value is derived from an underlying security price, foreign exchange rate, interest rate, index of prices or rates, or other variable; it requires little or no initial investment and permits or requires net settlement. The fund invests in derivatives only if the expected risks and rewards are consistent with its investment objectives, policies, and overall risk profile, as described in its prospectus and Statement of Additional Information. The fund may use derivatives for a variety of purposes, such as seeking to hedge against declines in principal value, increase yield, invest in an asset with greater efficiency and at a lower cost than is possible through direct investment, or to adjust portfolio duration and credit exposure. The risks associated with the use of derivatives are different from, and potentially much greater than, the risks associated with investing directly in the instruments on which the derivatives are based. The fund at all times maintains sufficient cash reserves, liquid assets, or other SEC-permitted asset types to cover its settlement obligations under open derivative contracts.
The fund values its derivatives at fair value, as described in Note 2, and recognizes changes in fair value currently in its results of operations. Accordingly, the fund does not follow hedge accounting, even for derivatives employed as economic hedges. Generally, the fund accounts for its derivatives on a gross basis. It does not offset the fair value of derivative liabilities against the fair value of derivative assets on its financial statements, nor does it offset the fair value of derivative instruments against the right to reclaim or obligation to return collateral.
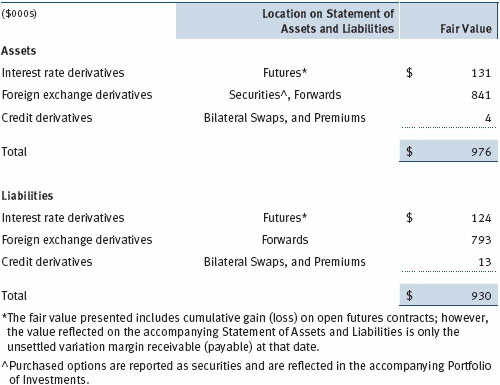
The following table summarizes the fair value of the fund’s derivative instruments held as of November 30, 2013, and the related location on the accompanying Statement of Assets and Liabilities, presented by primary underlying risk exposure:
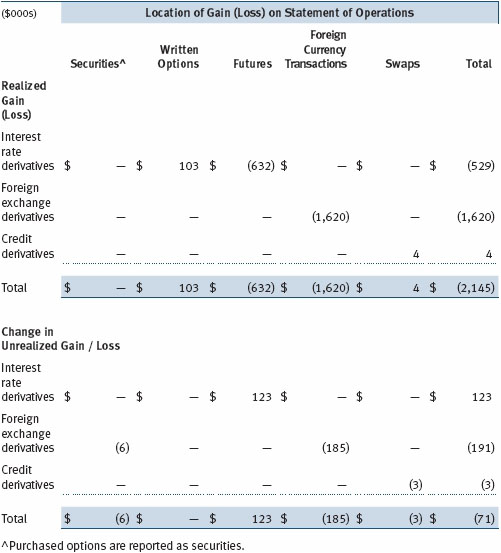
Additionally, the amount of gains and losses on derivative instruments recognized in fund earnings during the six months ended November 30, 2013, and the related location on the accompanying Statement of Operations is summarized in the following table by primary underlying risk exposure:
Counterparty Risk and Collateral The fund invests in derivatives in various markets, which expose it to differing levels of counterparty risk. Counterparty risk on exchange-traded and centrally cleared derivative contracts, such as futures, exchange-traded options, and centrally cleared swaps, is minimal because the clearinghouse provides protection against counterparty defaults. For futures and centrally cleared swaps, the fund is required to deposit collateral in an amount equal to a certain percentage of the contract value (margin requirement), and the margin requirement must be maintained over the life of the contract. Each clearing broker, in its sole discretion, may adjust the margin requirements applicable to the fund.
Derivatives, such as bilateral swaps, forward currency exchange contracts, and options, that are transacted and settle directly with a counterparty (bilateral derivatives) expose the fund to greater counterparty risk. To mitigate this risk, the fund has entered into master netting arrangements (MNAs) with certain counterparties that permit net settlement under specified conditions and, for certain counterparties, also provide collateral agreements. MNAs may be in the form of International Swaps and Derivatives Association master agreements (ISDAs) or foreign exchange letter agreements (FX letters).
MNAs govern the ability to offset amounts the fund owes a counterparty against amounts the counterparty owes the fund (net settlement). Both ISDAs and FX letters generally allow net settlement in the event of contract termination and permit termination by either party prior to maturity upon the occurrence of certain stated events, such as failure to pay or bankruptcy. In addition, ISDAs specify other events, the occurrence of which would allow one of the parties to terminate. For example, a downgrade in credit rating of a counterparty would allow the fund to terminate while a decline in the fund’s net assets of more than a certain percentage would allow the counterparty to terminate. Upon termination, all bilateral derivatives with that counterparty would be liquidated and a net amount settled. ISDAs typically include collateral agreements whereas FX letters do not. Collateral requirements are determined based on the net aggregate unrealized gain or loss on all bilateral derivatives with each counterparty, subject to minimum transfer amounts that typically range from $100,000 to $250,000. Any additional collateral required due to changes in security values is transferred the next business day.
Collateral may be in the form of cash or debt securities issued by the U.S. government or related agencies. Cash and currencies posted by the fund are reflected as cash deposits in the accompanying financial statements and generally are restricted from withdrawal by the fund; securities posted by the fund are so noted in the accompanying Portfolio of Investments; both remain in the fund’s assets. Collateral pledged by counterparties is not included in the fund’s assets because the fund does not obtain effective control over those assets. For bilateral derivatives, collateral posted or received by the fund is held in a segregated account by the fund’s custodian. As of November 30, 2013, securities valued at $269,000 had been posted by the fund to counterparties for bilateral derivatives. As of November 30, 2013, collateral pledged by counterparties to the fund for bilateral derivatives consisted of $260,000 cash. As of November 30, 2013, securities valued at $528,000 had been posted by the fund for exchange-traded and/or centrally cleared derivatives.
Forward Currency Exchange Contracts The fund is subject to foreign currency exchange rate risk in the normal course of pursuing its investment objectives. It uses forward currency exchange contracts (forwards) primarily to protect its non-U.S. dollar-denominated securities from adverse currency movements relative to the U.S. dollar. A forward involves an obligation to purchase or sell a fixed amount of a specific currency on a future date at a price set at the time of the contract. Although certain forwards may be settled by exchanging only the net gain or loss on the contract, most forwards are settled with the exchange of the underlying currencies in accordance with the specified terms. Forwards are valued at the unrealized gain or loss on the contract, which reflects the net amount the fund either is entitled to receive or obligated to deliver, as measured by the difference between the forward exchange rates at the date of entry into the contract and the forward rates at the reporting date. Appreciated forwards are reflected as assets, and depreciated forwards are reflected as liabilities on the accompanying Statement of Assets and Liabilities. Risks related to the use of forwards include the possible failure of counterparties to meet the terms of the agreements; that anticipated currency movements will not occur, thereby reducing the fund’s total return; and the potential for losses in excess of the fund’s initial investment. During the six months ended November 30, 2013, the fund’s exposure to forwards, based on underlying notional amounts, was generally between 18% and 28% of net assets.
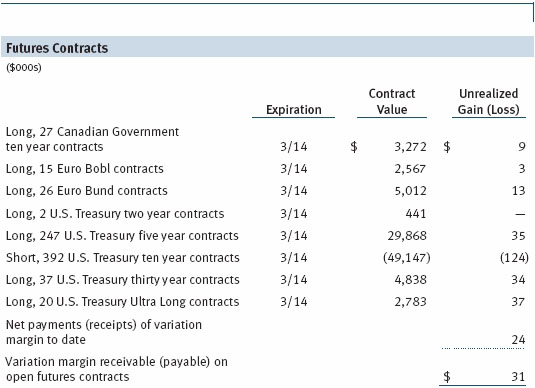
Futures Contracts The fund is subject to interest rate risk in the normal course of pursuing its investment objectives and uses futures contracts to help manage such risk. The fund may enter into futures contracts to manage exposure to interest rate and yield curve movements, security prices, foreign currencies, credit quality, and mortgage prepayments; as an efficient means of adjusting exposure to all or part of a target market; to enhance income; as a cash management tool; or to adjust portfolio duration and credit exposure. A futures contract provides for the future sale by one party and purchase by another of a specified amount of a particular underlying financial instrument at an agreed-upon price, date, time, and place. The fund currently invests only in exchange-traded futures, which generally are standardized as to maturity date, underlying financial instrument, and other contract terms. Payments are made or received by the fund each day to settle daily fluctuations in the value of the contract (variation margin), which reflect changes in the value of the underlying financial instrument. Variation margin is recorded as unrealized gain or loss until the contract is closed. The value of a futures contract included in net assets is the amount of unsettled variation margin; net variation margin receivable is reflected as an asset and net variation margin payable is reflected as a liability on the accompanying Statement of Assets and Liabilities. Risks related to the use of futures contracts include possible illiquidity of the futures markets, contract prices that can be highly volatile and imperfectly correlated to movements in hedged security values and/or interest rates, and potential losses in excess of the fund’s initial investment. During the six months ended November 30, 2013, the fund’s exposure to futures, based on underlying notional amounts, was generally between 23% and 35% of net assets.
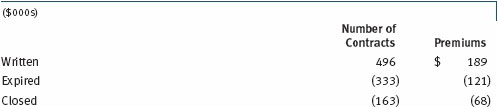
Options The fund is subject to interest rate risk and/or foreign currency exchange rate risk in the normal course of pursuing its investment objectives and uses options to help manage such risks. The fund may use call and put options to manage exposure to interest rates, security prices, foreign currencies, and credit quality; as an efficient means of adjusting exposure to all or a part of a target market; to enhance income; as a cash management tool; or to adjust portfolio duration and credit exposure. In return for a premium paid, call and put options give the holder the right, but not the obligation, to purchase or sell, respectively, a security currency at a specified exercise price. Options are included in net assets at fair value; purchased options are included in Investments in Securities; and written options are separately reflected as a liability on the accompanying Statement of Assets and Liabilities. Premiums on unexercised, expired options are recorded as realized gains or losses; premiums on exercised options are recorded as an adjustment to the proceeds from the sale or cost of the purchase. The difference between the premium and the amount received or paid in a closing transaction is also treated as realized gain or loss. Risks related to the use of options include possible illiquidity of the options markets; trading restrictions imposed by an exchange; movements in underlying security values and/or currency values; and, for written options, potential losses in excess of the fund’s initial investment. During the six months ended November 30, 2013, the fund’s exposure to options, based on underlying notional amounts, was generally between 0% and 5% of net assets. Transactions in written options and related premiums received during the six months ended November 30, 2013, were as follows:
Swaps The fund is subject to credit risk in the normal course of pursuing its investment objectives and uses swap contracts to help manage such risk. The fund may use swaps in an effort to manage exposure to changes in interest rates, inflation rates, and credit quality; to adjust overall exposure to certain markets; to enhance total return or protect the value of portfolio securities; to serve as a cash management tool; or to adjust portfolio duration and credit exposure. Swap agreements are executed in the OTC market and can be settled either directly with the counterparty (bilateral swap) or through a central clearinghouse (centrally cleared swap). Fluctuations in the fair value of a contract are reflected in unrealized gain or loss and are reclassified to realized gain or loss upon contract termination or cash settlement. Net periodic receipts or payments required by a contract increase or decrease, respectively, the value of the contract until the contractual payment date, at which time such amounts are reclassified from unrealized to realized gain or loss. For bilateral swaps, cash payments are made or received by the fund on a periodic basis in accordance with contract terms; unrealized gain on contracts and premiums paid are reflected as assets, and unrealized loss on contracts and premiums received are reflected as liabilities on the accompanying Statement of Assets and Liabilities. For centrally cleared swaps, payments are made or received by the fund each day to settle the daily fluctuation in the value of the contract (variation margin). Accordingly, the value of a centrally cleared swap included in net assets is the unsettled variation margin; net variation margin receivable is reflected as an asset and net variation margin payable is reflected as a liability on the accompanying Statement of Assets and Liabilities.
Credit default swaps are agreements where one party (the protection buyer) agrees to make periodic payments to another party (the protection seller) in exchange for protection against specified credit events, such as certain defaults and bankruptcies related to an underlying credit instrument, or issuer or index of such instruments. Upon occurrence of a specified credit event, the protection seller is required to pay the buyer the difference between the notional amount of the swap and the value of the underlying credit, either in the form of a net cash settlement or by paying the gross notional amount and accepting delivery of the relevant underlying credit. For credit default swaps where the underlying credit is an index, a specified credit event may affect all or individual underlying securities included in the index and will be settled based upon the relative weighting of the affected underlying security(s) within the index. Generally, the payment risk for the seller of protection is inversely related to the current market price or credit rating of the underlying credit, both of which are indicators of market valuations of credit quality. Therefore, payment risk increases as the price of the relevant underlying credit or credit rating declines. As of November 30, 2013, the notional amount of protection sold by the fund totaled $310,000 (0.1% of net assets), which reflects the maximum potential amount the fund could be required to pay under such contracts. Risks related to the use of credit default swaps include the possible inability of the fund to accurately assess the current and future creditworthiness of underlying issuers, the possible failure of a counterparty to perform in accordance with the terms of the swap agreements, potential government regulation that could adversely affect the fund’s swap investments, and potential losses in excess of the fund’s initial investment.
During the six months ended November 30, 2013, the fund’s exposure to swaps, based on underlying notional amounts, was generally less than 1% of net assets.
NOTE 4 - OTHER INVESTMENT TRANSACTIONS
Consistent with its investment objective, the fund engages in the following practices to manage exposure to certain risks and/or to enhance performance. The investment objective, policies, program, and risk factors of the fund are described more fully in the fund’s prospectus and Statement of Additional Information.
Emerging Markets At November 30, 2013, approximately 20% of the fund’s net assets were invested, either directly or through investments in T. Rowe Price institutional funds, in securities of companies located in emerging markets, securities issued by governments of emerging market countries, or securities denominated in or linked to the currencies of emerging market countries. Emerging market securities are often subject to greater price volatility, less liquidity, and higher rates of inflation than U.S. securities. In addition, emerging markets may be subject to greater political, economic, and social uncertainty, and differing regulatory environments that may potentially impact the fund’s ability to buy or sell certain securities or repatriate proceeds to U.S. dollars.
Noninvestment-Grade Debt Securities At November 30, 2013, approximately 30% of the fund’s net assets were invested, either directly or through its investment in T. Rowe Price institutional funds, in noninvestment-grade debt securities, commonly referred to as “high yield” or “junk” bonds. The noninvestment-grade bond market may experience sudden and sharp price swings due to a variety of factors, including changes in economic forecasts, stock market activity, large sustained sales by major investors, a high-profile default, or a change in market sentiment. These events may decrease the ability of issuers to make principal and interest payments and adversely affect the liquidity or value, or both, of such securities.
Restricted Securities The fund may invest in securities that are subject to legal or contractual restrictions on resale. Prompt sale of such securities at an acceptable price may be difficult and may involve substantial delays and additional costs.
TBA Purchase and Sale Commitments The fund may enter into to-be-announced (TBA) purchase or sale commitments, pursuant to which it agrees to purchase or sell, respectively, mortgage-backed securities for a fixed unit price, with payment and delivery at a scheduled future date beyond the customary settlement period for such securities. With TBA transactions, the particular securities to be delivered are not identified at the trade date; however, delivered securities must meet specified terms, including issuer, rate, and mortgage term, and be within industry-accepted “good delivery” standards. The fund generally enters into TBA purchase transactions with the intention of taking possession of the underlying securities; however, the fund may elect to extend the settlement by “rolling” the transaction. Until settlement, the fund maintains liquid assets sufficient to settle its TBA commitments.
To mitigate counterparty risk, the fund has entered into agreements with TBA counterparties that provide for collateral and the right to offset amounts due to or from those counterparties under specified conditions. Subject to minimum transfer amounts, collateral requirements are determined and transfers made based on the net aggregate unrealized gain or loss on all TBA commitments with a particular counterparty. At any time, the fund’s risk of loss from a particular counterparty related to its TBA commitments is the aggregate unrealized gain on appreciated TBAs in excess of unrealized loss on depreciated TBAs and collateral received, if any, from such counterparty. As of November 30, 2013, no collateral was pledged by the fund or counterparties for TBAs.
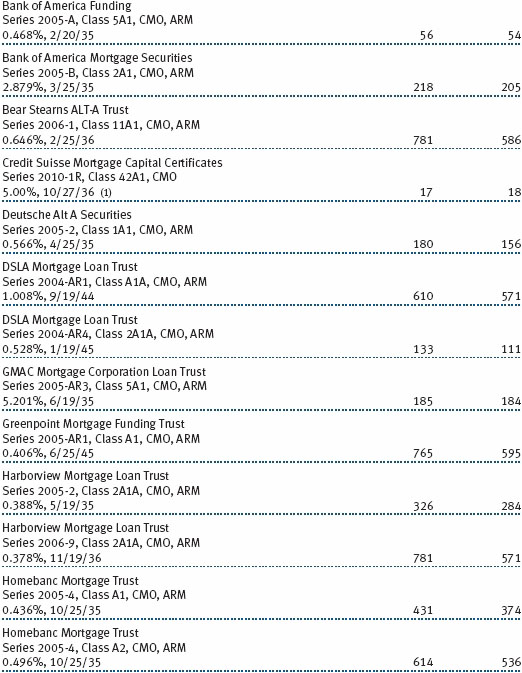
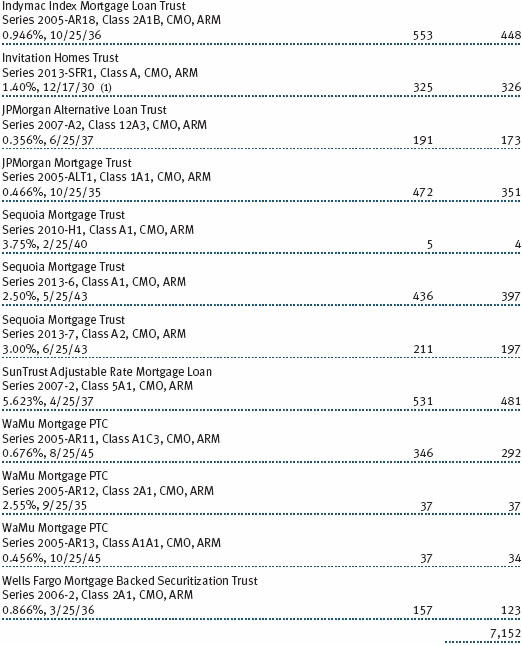
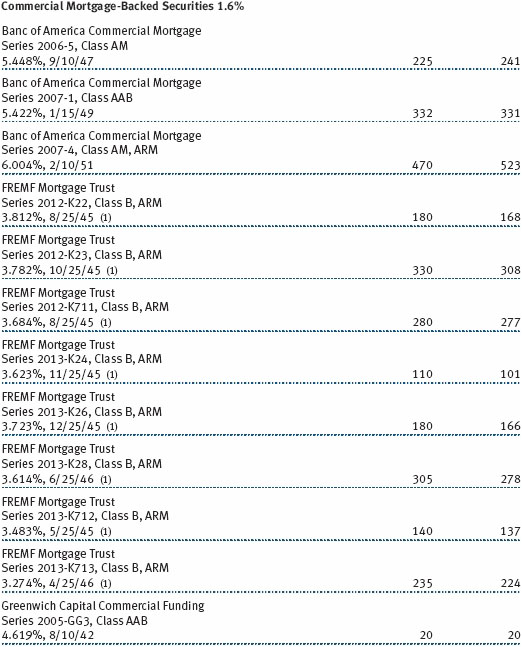
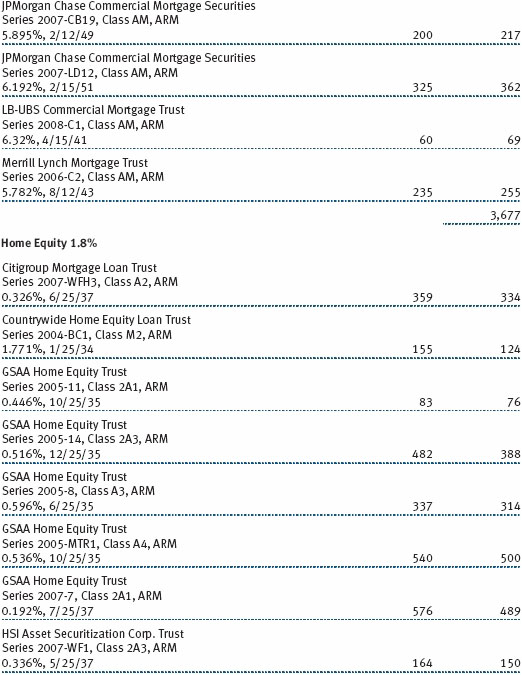
Mortgage-Backed Securities The fund may invest in mortgage-backed securities (MBS or pass-through certificates) that represent an interest in a pool of specific underlying mortgage loans and entitle the fund to the periodic payments of principal and interest from those mortgages. MBS may be issued by government agencies or corporations, or private issuers. Most MBS issued by government agencies are guaranteed; however, the degree of protection differs based on the issuer. The fund also may invest in stripped MBS, created when a traditional MBS is split into an interest-only (IO) and a principal-only (PO) strip. MBS, including IOs and POs, are sensitive to changes in economic conditions that affect the rate of prepayments and defaults on the underlying mortgages; accordingly, the value, income, and related cash flows from MBS may be more volatile than other debt instruments. IOs also risk loss of invested principal from faster-than-anticipated prepayments.
Other Purchases and sales of portfolio securities other than short-term and U.S. government securities aggregated $101,955,000 and $127,304,000, respectively, for the six months ended November 30, 2013. Purchases and sales of U.S. government securities aggregated $89,459,000 and $95,626,000, respectively, for the six months ended November 30, 2013.
NOTE 5 - FEDERAL INCOME TAXES
No provision for federal income taxes is required since the fund intends to continue to qualify as a regulated investment company under Subchapter M of the Internal Revenue Code and distribute to shareholders all of its taxable income and gains. Distributions determined in accordance with federal income tax regulations may differ in amount or character from net investment income and realized gains for financial reporting purposes. Financial reporting records are adjusted for permanent book/tax differences to reflect tax character but are not adjusted for temporary differences. The amount and character of tax-basis distributions and composition of net assets are finalized at fiscal year-end; accordingly, tax-basis balances have not been determined as of the date of this report.
The fund intends to retain realized gains to the extent of available capital loss carryforwards. Net realized capital losses may be carried forward indefinitely to offset future realized capital gains.
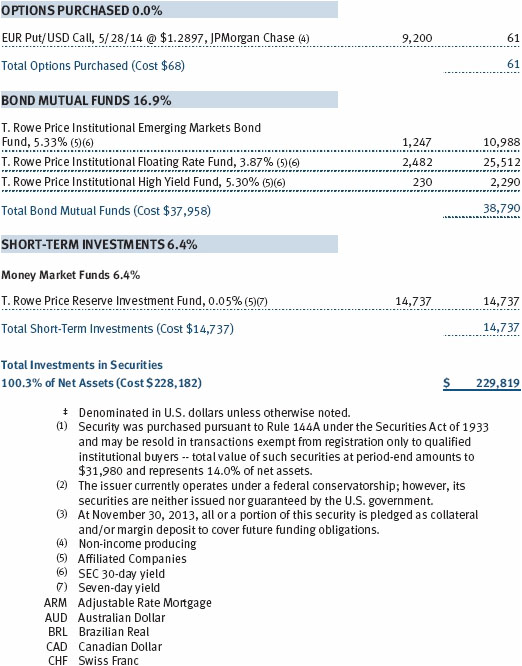
At November 30, 2013, the cost of investments for federal income tax purposes was $228,453,000. Net unrealized gain aggregated $1,355,000 at period-end, of which $7,912,000 related to appreciated investments and $6,557,000 related to depreciated investments.
NOTE 6 - RELATED PARTY TRANSACTIONS
The fund is managed by T. Rowe Price Associates, Inc. (Price Associates), a wholly owned subsidiary of T. Rowe Price Group, Inc. (Price Group). The investment management agreement between the fund and Price Associates provides for an annual investment management fee, which is computed daily and paid monthly. The fee consists of an individual fund fee, equal to 0.20% of the fund’s average daily net assets, and a group fee. The group fee rate is calculated based on the combined net assets of certain mutual funds sponsored by Price Associates (the group) applied to a graduated fee schedule, with rates ranging from 0.48% for the first $1 billion of assets to 0.275% for assets in excess of $400 billion. The fund’s group fee is determined by applying the group fee rate to the fund’s average daily net assets. At November 30, 2013, the effective annual group fee rate was 0.30%.
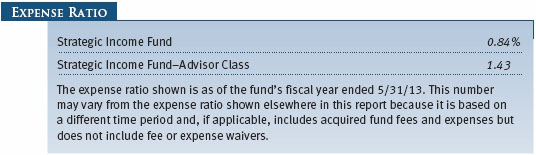
The Advisor Class is also subject to a contractual expense limitation through September 30, 2015. During the limitation period, Price Associates is required to waive its management fee or reimburse expenses, excluding interest, taxes, brokerage commissions, and extraordinary expenses, that would otherwise cause the class’s ratio of annualized total expenses to average net assets (expense ratio) to exceed its expense limitation of 0.95%. The class is required to repay Price Associates for expenses previously reimbursed and management fees waived to the extent the class’s net assets grow or expenses decline sufficiently to allow repayment without causing the class’s expense ratio to exceed its expense limitation. However, no repayment will be made more than three years after the date of a reimbursement or waiver.
Pursuant to this agreement, expenses in the amount of $2,000 were reimbursed by Price Associates during the six months ended November 30, 2013. Including these amounts, expenses previously reimbursed by Price Associates in the amount of $12,000 remain subject to repayment at November 30, 2013.
In addition, the fund has entered into service agreements with Price Associates and two wholly owned subsidiaries of Price Associates (collectively, Price). Price Associates computes the daily share prices and provides certain other administrative services to the fund. T. Rowe Price Services, Inc., provides shareholder and administrative services in its capacity as the fund’s transfer and dividend-disbursing agent. T. Rowe Price Retirement Plan Services, Inc., provides subaccounting and recordkeeping services for certain retirement accounts invested in the Investor Class. For the six months ended November 30, 2013, expenses incurred pursuant to these service agreements were $98,000 for Price Associates; $71,000 for T. Rowe Price Services, Inc.; and $1,000 for T. Rowe Price Retirement Plan Services, Inc. The total amount payable at period-end pursuant to these service agreements is reflected as Due to Affiliates in the accompanying financial statements.
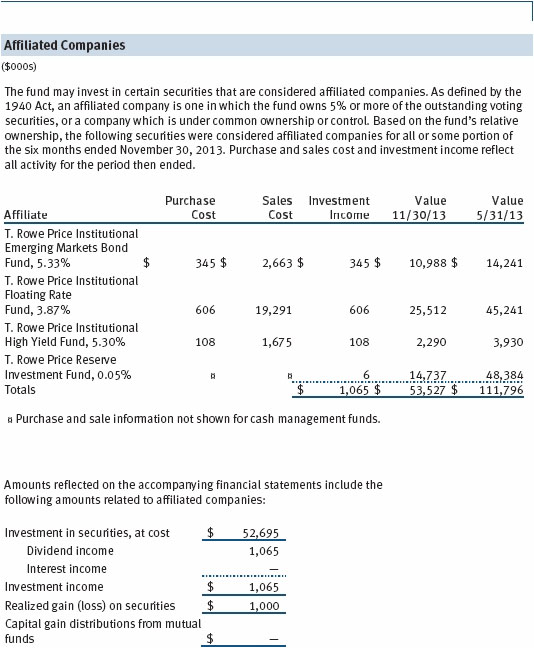
The fund may invest in the T. Rowe Price Reserve Investment Fund, the T. Rowe Price Government Reserve Investment Fund, or the T. Rowe Price Short-Term Reserve Fund (collectively, the Price Reserve Investment Funds), open-end management investment companies managed by Price Associates and considered affiliates of the fund. The Price Reserve Investment Funds are offered as short-term investment options to mutual funds, trusts, and other accounts managed by Price Associates or its affiliates and are not available for direct purchase by members of the public. The Price Reserve Investment Funds pay no investment management fees.
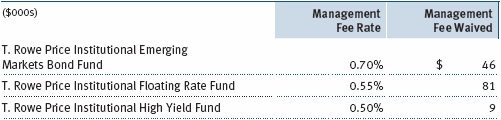
The fund may also invest in certain other T. Rowe Price fund(s) as a means of gaining efficient and cost-effective exposure to certain markets. The fund does not invest for the purpose of exercising management or control; however, investments by the fund may represent a significant portion of an underlying T. Rowe Price fund’s net assets. Each underlying T. Rowe Price fund is an open-end management investment company managed by Price Associates and is considered an affiliate of the fund. To ensure that the fund does not incur duplicate management fees (paid by the underlying T. Rowe Price fund(s) and the fund), Price Associates has agreed to permanently waive a portion of its management fee charged to the fund in an amount sufficient to fully offset that portion of management fees paid by each underlying T. Rowe Price fund related to the fund’s investment therein. The accompanying Statement of Operations reflects management fees permanently waived pursuant to this agreement. Annual fee rates and management fees waived related to investments in the underlying T. Rowe Price fund(s) for the six months ended November 30, 2013, are as follows:
As of November 30, 2013, T. Rowe Price Group, Inc., or its wholly owned subsidiaries owned 2,475,000 shares of the Investor Class, aggregating 12% of the fund’s net assets.
| Information on Proxy Voting Policies, Procedures, and Records |
A description of the policies and procedures used by T. Rowe Price funds and portfolios to determine how to vote proxies relating to portfolio securities is available in each fund’s Statement of Additional Information. You may request this document by calling 1-800-225-5132 or by accessing the SEC’s website, sec.gov.
The description of our proxy voting policies and procedures is also available on our website, troweprice.com. To access it, click on the words “Social Responsibility” at the top of our corporate homepage. Next, click on the words “Conducting Business Responsibly” on the left side of the page that appears. Finally, click on the words “Proxy Voting Policies” on the left side of the page that appears.
Each fund’s most recent annual proxy voting record is available on our website and through the SEC’s website. To access it through our website, follow the above directions to reach the “Conducting Business Responsibly” page. Click on the words “Proxy Voting Records” on the left side of that page, and then click on the “View Proxy Voting Records” link at the bottom of the page that appears.
| How to Obtain Quarterly Portfolio Holdings |
The fund files a complete schedule of portfolio holdings with the Securities and Exchange Commission for the first and third quarters of each fiscal year on Form N-Q. The fund’s Form N-Q is available electronically on the SEC’s website (sec.gov); hard copies may be reviewed and copied at the SEC’s Public Reference Room, 100 F St. N.E., Washington, DC 20549. For more information on the Public Reference Room, call 1-800-SEC-0330.
Item 2. Code of Ethics.
A code of ethics, as defined in Item 2 of Form N-CSR, applicable to its principal executive officer, principal financial officer, principal accounting officer or controller, or persons performing similar functions is filed as an exhibit to the registrant’s annual Form N-CSR. No substantive amendments were approved or waivers were granted to this code of ethics during the registrant’s most recent fiscal half-year.
Item 3. Audit Committee Financial Expert.
Disclosure required in registrant’s annual Form N-CSR.
Item 4. Principal Accountant Fees and Services.
Disclosure required in registrant’s annual Form N-CSR.
Item 5. Audit Committee of Listed Registrants.
Not applicable.
Item 6. Investments.
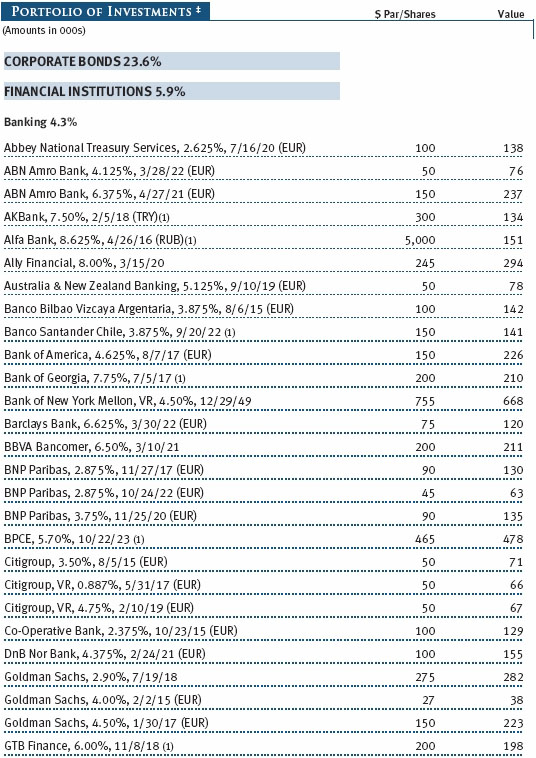
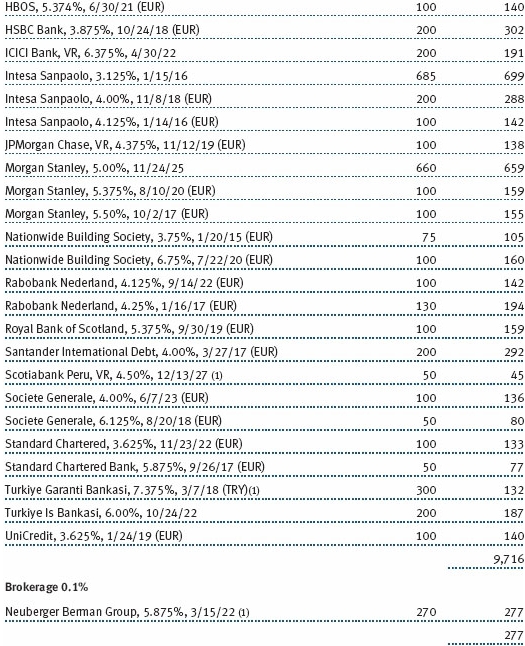
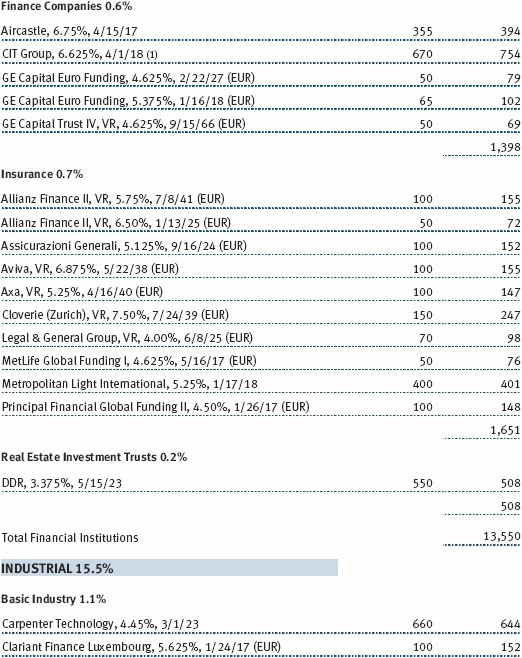
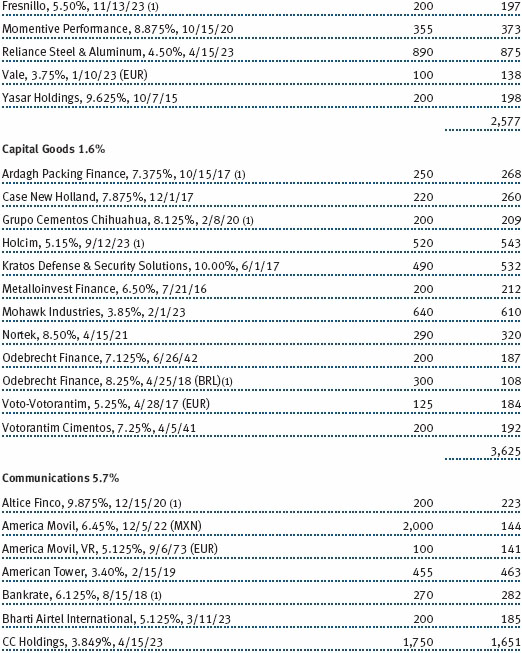
(a) Not applicable. The complete schedule of investments is included in Item 1 of this Form N-CSR.
(b) Not applicable.
Item 7. Disclosure of Proxy Voting Policies and Procedures for Closed-End Management Investment Companies.
Not applicable.
Item 8. Portfolio Managers of Closed-End Management Investment Companies.
Not applicable.
Item 9. Purchases of Equity Securities by Closed-End Management Investment Company and Affiliated Purchasers.
Not applicable.
Item 10. Submission of Matters to a Vote of Security Holders.
Not applicable.
Item 11. Controls and Procedures.
(a) The registrant’s principal executive officer and principal financial officer have evaluated the registrant’s disclosure controls and procedures within 90 days of this filing and have concluded that the registrant’s disclosure controls and procedures were effective, as of that date, in ensuring that information required to be disclosed by the registrant in this Form N-CSR was recorded, processed, summarized, and reported timely.
(b) The registrant’s principal executive officer and principal financial officer are aware of no change in the registrant’s internal control over financial reporting that occurred during the registrant’s second fiscal quarter covered by this report that has materially affected, or is reasonably likely to materially affect, the registrant’s internal control over financial reporting.
Item 12. Exhibits.
(a)(1) The registrant’s code of ethics pursuant to Item 2 of Form N-CSR is filed with the registrant’s annual Form N-CSR.
(2) Separate certifications by the registrant's principal executive officer and principal financial officer, pursuant to Section 302 of the Sarbanes-Oxley Act of 2002 and required by Rule 30a-2(a) under the Investment Company Act of 1940, are attached.
(3) Written solicitation to repurchase securities issued by closed-end companies: not applicable.
(b) A certification by the registrant's principal executive officer and principal financial officer, pursuant to Section 906 of the Sarbanes-Oxley Act of 2002 and required by Rule 30a-2(b) under the Investment Company Act of 1940, is attached.
SIGNATURES
Pursuant to the requirements of the Securities Exchange Act of 1934 and the Investment Company Act of 1940, the registrant has duly caused this report to be signed on its behalf by the undersigned, thereunto duly authorized.
T. Rowe Price Strategic Income Fund, Inc.
| | By | /s/ Edward C. Bernard |
| | Edward C. Bernard |
| | Principal Executive Officer |
| |
| Date January 21, 2014 | | |
Pursuant to the requirements of the Securities Exchange Act of 1934 and the Investment Company Act of 1940, this report has been signed below by the following persons on behalf of the registrant and in the capacities and on the dates indicated.
| | By | /s/ Edward C. Bernard |
| | Edward C. Bernard |
| | Principal Executive Officer |
| |
| Date January 21, 2014 | | |
| |
| |
| By | /s/ Gregory K. Hinkle |
| | Gregory K. Hinkle |
| | Principal Financial Officer |
| |
| Date January 21, 2014 | | |