UNITED STATES
SECURITIES AND EXCHANGE COMMISSION
Washington, D.C. 20549
FORM N-CSR
CERTIFIED SHAREHOLDER REPORT OF REGISTERED MANAGEMENT
INVESTMENT COMPANIES
Investment Company Act file number 811-22264
The Motley Fool Funds Trust
(Exact name of registrant as specified in charter)
Motley Fool Asset Management, LLC
2000 Duke Street, Suite 175
Alexandria, VA 22314
(Address of principal executive offices) (Zip code)
Denise Coursey
Motley Fool Asset Management, LLC
2000 Duke Street, Suite 175
Alexandria, VA 22314
(Name and address of agent for service)
Registrant’s telephone number, including area code: (703) 302-1100
Date of fiscal year end: October 31
Date of reporting period: April 30, 2016
Form N-CSR is to be used by management investment companies to file reports with the Commission not later than 10 days after the transmission to stockholders of any report that is required to be transmitted to stockholders under Rule 30e-1 under the Investment Company Act of 1940 (17 CFR 270.30e-1). The Commission may use the information provided on Form N-CSR in its regulatory, disclosure review, inspection, and policymaking roles.
A registrant is required to disclose the information specified by Form N-CSR, and the Commission will make this information public. A registrant is not required to respond to the collection of information contained in Form N-CSR unless the Form displays a currently valid Office of Management and Budget (“OMB”) control number. Please direct comments concerning the accuracy of the information collection burden estimate and any suggestions for reducing the burden to Secretary, Securities and Exchange Commission, 100 F Street, NE, Washington, DC 20549. The OMB has reviewed this collection of information under the clearance requirements of 44 U.S.C. § 3507.
Item 1. Reports to Stockholders.
The Report to Shareholders is attached herewith.

Look Again
Motley Fool Funds
Semiannual Report
A series of The Motley Fool Funds Trust
· 4/30/16 ·
MOTLEY FOOL INDEPENDENCE FUND
MOTLEY FOOL GREAT AMERICA FUND
MOTLEY FOOL EPIC VOYAGE FUND

MOTLEY FOOL INDEPENDENCE FUND (FOOLX) 
 | Our Top 11 holdings featured two new names compared to the list six months ago, Almarai and Loews. These were our 14th- and 24th-largest holdings as of October 31, so not exactly new ideas. Baidu and Natus Medical fell out our Top 11 holdings, plummeting all the way to positions 16 and 14. |
| The Fund has placed big bets in the Consumer Discretionary and Financials sectors, and shied away from Energy, Materials, and Utilities companies. This is a byproduct of our bottom-up strategy to invest in high-quality businesses with impressive business models and durable competitive advantages. |
| Remember how far the markets had fallen through the end of January? I guess we fixed all those concerns… |
MOTLEY FOOL GREAT AMERICA FUND (TMFGX) 
| Following two years of inferior returns, mid-cap stocks eked out a win over large-cap stocks over the past six months. This was the good news. The bad news is that small-cap stocks continue to underperform. |
| It turns out Americans still really like their vehicles, which means our outsized exposure to the Automobiles and Components industry group has been very effective for us. Among our current holdings, this includes not-quite- household names such as Drew Industries, Gentex, Horizon Global, and Thor Industries. But it does not include AutoZone or Tractor Supply Co., which are classified into the Retailing group. |
| Among our new holdings since the last report, we bought shares of a company called The Ultimate Software Group. I believe this moves atop the leaderboard as the Fund holding with the most awesome name; but I’m willing to listen to counter-arguments. |
MOTLEY FOOL EPIC VOYAGE FUND (TMFEX) 
| Emerging markets finally outperformed developed markets over the past six months, by a bit more than 1 percentage point. That performance brings the 5 year deficit between Emerging markets and Developed within 55 percentage points. |
| 55 percentage points over 5 years! That’s so remarkable I had to double-check the math on that one. No wonder we think some of our top Emerging Market-based holdings, like Nippon Indosari, Almarai, and HDFC Bank, look so attractively valued. |
| Take a look at the holdings in the Epic Voyage Fund. If you recognize 10 names, give yourself a pat on the back, because that’s quite a feat. If you’re familiar with 20 names, you’re probably a professional. |
This report has been prepared for shareholders of Motley Fool Independence Fund, Motley Fool Great America Fund and Motley Fool Epic Voyage Fund. It is not authorized for distribution to prospective investors unless accompanied or preceded by a current prospectus, which contains more complete information about the Funds. Investors are reminded to read the prospectus carefully before investing. Returns quoted represent past performance, which is no guarantee of future results. Current returns may be lower or higher and can be found at foolfunds.com. Share prices will fluctuate and there may be a gain or loss when shares are redeemed. Fund shares are distributed by Foreside Funds Distributors LLC, Berwyn, Pennsylvania.
Letter from the President
| | |

President Denise H. Coursey | | Dear Fellow Shareholders: There’s no accounting for taste. For example, I love buttered popcorn flavored jelly beans. And I’ve never met another person who did. What is wrong with the rest of you? In addition to having a taste for unnaturally flavored candies, I’m also a Harry Potter fan. So when Jelly Belly started manufacturing Bertie Bott’s Every Flavour Beans, I had to have a box. When they arrived, I marveled at the box. I studied the pictures, showing all the possible flavors — watermelon, green apple, tutti-frutti, earwax, vomit… And I never, ever opened that box of jelly beans. Why? What if I reached in and got a booger-flavored bean? Not worth the risk. |
| |
| |
| |
| |
I feel the same way about the S&P500 index fund that I, like every investor, hold in my portfolio. I know there’s good stuff in there — and I’m going to hold on to it because it’s full of variety. But I have no desire to look inside. And, really, one box is enough.
Over the past six years, though, investors seem to have decided that one isn’t enough. They’re loading up on passive, index-tracking vehicles, completely willing to take the good with the bad. In 2015, roughly $400 billion flowed in to passive vehicles, while active funds lost more than $200 billion in assets. I get it: Passive, index trackers are easy to understand and invest in, they’re inexpensive, and they provide instant diversification. In fact, we’re fans of index funds. They may serve an essential function in your overall portfolio.
But we’re also fans of rounding out your portfolio with high-quality businesses — those with proven management teams, impressive returns on invested capital, a strong competitive advantage, and perhaps most importantly, businesses that we believe will be stronger, better, larger 10 years from now. Hopefully, over the long term, these types of businesses will offset the duds that you’re going to get in your favorite index tracker — and these are the types of businesses we search for every day at Motley Fool Funds.
Do we always pick the good ones? No. Unfortunately, no one can. (The rotten
| | | | |
| Motley Fool Funds Trust | | | | 3 |
egg jelly bean is visually indistinguishable from buttered popcorn, by the way.) But the members of our portfolio management team have a rigorous process. They challenge each other daily — making sure their investing theses stand up to scrutiny and watching to make sure they’re playing out as expected, all so we can attempt to find the best businesses out there for your investment dollars.
So, I’m still holding on to my index fund, as well as that unopened box of Bertie Bott’s Every Flavour Beans. But I am also a proud Fool Funds shareholder — and whenever I’m in the vicinity of a Jelly Belly store, I load up on the good stuff — buttered popcorn, and maybe some toasted coconut and licorice for good measure.
As always, we thank you for the trust you place in us, and we’ll continue to work hard to earn and deserve that trust.
Foolish best,

Denise H. Coursey
President, Motley Fool Asset Management
| | | | |
| 4 | | | | Motley Fool Funds Trust |
Letter to Shareholders
| | |

Portfolio Manager Bill Mann | | Dear Fellow Fool Funds Shareholder: If you are a value-driven investor, it is a pretty decent probability that the past six months have not been kind to you. We have long noted that we don’t care about the short term, and we don’t. Still, in our domestic holdings (including all of the Great America and approximately half of the Independence Fund), we were hit in three primary places: our ownership in long-term winners Infinera and Chipotle Mexican Grill, and our lack of exposure to suddenly resurgent energy stocks. And on the flip side, our relatively low exposure to Japan and our outsize exposure to emerging-market stocks meant that our international holdings (including the Epic Voyage Fund and the other half of the Independence Fund) did very well. |
So which is it? Did we do terribly, or wonderfully? The best answer, I think, is to point to the horizon. Your portfolio team spends its days trying to find companies that fit our definition of high-quality businesses – companies with good management teams who have skin in the game, excellent economics and financials, and solid potential for reinvestment – and own them for the long term. There are segments of the market where these factors can be found in relative abundance, and others where there are few. We prefer, obviously, to fish where the fish are.
Over the past year, I have talked about the opportunities we’ve seen in companies that are domiciled in emerging markets. In the past few months, several companies that we believe to be best of breed but operate in deeply out-of-favor markets – holdings such as NMC Health (United Arab Emirates), Sberbank (Russia), and Multiplus (Brazil) – have enjoyed extremely strong share price moves, even as their home economies continue to see heightened fear and stress. We own those companies not because they give us exposure to these markets, but rather because the prices at which their shares were being offered discounted so much bad stuff that we believed we were getting the potential for good stuff for free.
To make this determination for any company, we require a reasonable level of predictability. We tend to be skeptical of industries or countries for which the mere basis of analysis is unpredictable. For example, our funds own few energy companies, because we find the variable of oil and gas prices to be too deeply unpredictable, and the tendency toward overinvestment and then underinvestment in the industry to be too great. Oil could rocket back to $120 per barrel and I’d still be comfortable with our assessment. We are cautioned against making bold
| | | | |
| The Motley Fool Funds Trust | | | | 5 |
forward-looking statements to our investors, but I will make one here: Because of certain economic realities in the oil and gas industry, it’s highly unlikely that we will ever have an outsize allocation to the sector. If oil prices are racing and animal spirits are running among the wildcatters, our funds will probably not be participating as much as others might be.
The reason is simple: There doesn’t seem to be as hopeless or useless a profession on this Earth as that of oil-price prognosticator. After all, in early 2014, almost no commodities expert had correctly called that oil prices would tank as hard as they did. How many – at the end of last year, with crude prices sitting below $30 – were calling for the big rebound that has taken place over the past few months? Please. It’s a ridiculous game to even try to play.
Our search for great long-term businesses leaves us susceptible to the short-term blips that affect, oh, every company in existence. Two such companies, Infinera and Chipotle have been long-term winners for us, and they come in very high on our scale of really, really great companies. Both have struggled a little as of late – Chipotle’s recent contamination problems are well known – but we continue to believe that these are seriously good companies that will continue to generate outsize returns on capital.
Our position as long-term investors means that we leave ourselves susceptible to the market’s perceptions of the value of a company, based on what’s happening right now. But that’s the perception business, and we seek to be in the reality business. In the end, reality doesn’t give a damn about perception.
I look at the companies we hold, and the process we have employed to identify these companies, and I am satisfied with the opportunities we have discovered. It is with great pride that I maintain a substantial percentage of my net worth in the Motley Fool Funds. We have a differentiated process and a differentiated view on the market, in which we always seek to determine the long-term potential for our holdings, with little to no consideration of what may happen in the short term. In an industry that is driven by statistical inferences and star ratings and a nearly irresistible tendency toward “what-have-you-done-for-me-lately-ism,” such a stance necessarily comes at a cost of having plenty of potential investors go elsewhere.
But I really wouldn’t have it any other way. I have great comfort in knowing that those who invest in Motley Fool Funds understand that we aren’t trying to beat the market on a daily, weekly, monthly or even annual basis, for focusing on those time periods comes at the expense of long-term results.
My team and I salute you for your decision to join us.
| | | | |
| 6 | | | | The Motley Fool Funds Trust |
Foolish Best,

William H. Mann, III
The Letter to Shareholders seeks to describe some of the Adviser’s current opinions and views of the financial markets. Although the Adviser believes it has a reasonable basis for any opinions or views expressed, actual results may differ, sometimes significantly so, from those expected or expressed. The securities held by the Funds that are discussed in the Letter to Shareholders were held during the period covered by the annual report. They do not comprise the entire investment portfolio of the Funds, may be sold at any time, and may no longer be held by the Funds. The opinions of the Adviser with respect to those securities may change at any time.
| | | | |
| |  New to investing? Reading your first mutual fund semi-annual report? New to investing? Reading your first mutual fund semi-annual report?
Welcome! Here are some important things you need to know. Mutual fund investing offers many potential benefits. But there also are risks. Financial gain is not guaranteed when it comes to investing in equity securities. It’s possible to lose money, including your principal — especially during the short term. We focus on stocks we have good reason to believe are undervalued by the market. We expect the price of these stocks eventually to rise as the market recognizes the true worth of the companies issuing them. But keep in mind that value stocks can remain undervalued by the market for a long time. And it’s possible that the intrinsic worth of any particular company may not match our valuation. Our funds may invest in foreign companies and in companies with small market capitalization. There are certain risks associated with these types of investments. The risks are described on pages 9, 26, and 42 of this report. Additional risk information is provided in section 3 of the Notes to Financial Statements, pp. 63-68. | | |
| | | | |
| The Motley Fool Funds Trust | | | | 7 |
Motley Fool Independence Fund Portfolio Characteristics (Unaudited)
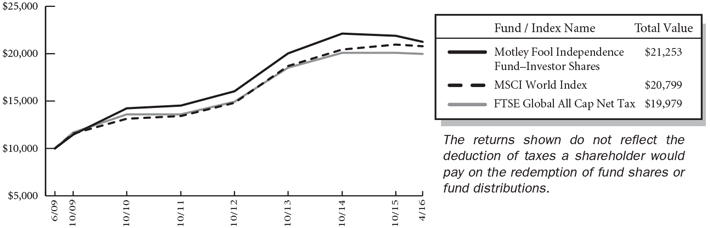
At April 30, 2016, the Motley Fool Independence Fund Investor Shares had an unaudited net asset value of $19.73 per share attributed to 18,264,621 shares outstanding and the Institutional Shares had an unaudited net asset value of $19.75 per share attributed to 367,861 shares outstanding. This compares with an unaudited net asset value as of June 16, 2009 for the Investor Shares of $10.00 per share attributed to 100,000 shares outstanding and as of June 17, 2014 for the Institutional Shares of $20.36 per share attributed to 1 share outstanding. From the Investor Shares launch on June 16, 2009 to April 30, 2016, the Shares had an average annual total return of 11.60% versus a return of 10.59% over the same period for its benchmark, FTSE Global All Cap Index, and a return of 11.25% for its previous benchmark the MSCI World Index. From June 17, 2014 to April 30, 2016, the Institutional Shares returned -0.32% versus a return of -0.69% over the same period for the FTSE Global All Cap Index, and a return of 0.58% for the MSCI World Index.
Please note that we are using a new benchmark for the Fund, the FTSE Global All Cap Index, as a replacement for the MSCI World Index. There are multiple reasons for this. In the past, the Independence Fund used a benchmark provided by MSCI while other funds managed by Motley Fool Asset Management (the “Adviser”) used Russell indexes. During 2015, FTSE Group and Russell Indexes began operating as one business known as FTSE Russell. This change allows the Adviser to utilize one globally recognized index provider across all its funds, by working with a leading provider of benchmarks which covers 98% of the world’s investable securities through a transparent, rules-based construction methodology. Additionally, the FTSE Global All Cap Index represents the performance of large-, mid-, and small-cap companies in Developed and Emerging markets. Meanwhile the MSCI World Index follows the performance of Developed markets only, and does not include small-cap companies. With this broader mandate, the FTSE index is more closely aligned to the Principal Investing Strategies of the adviser as explained in the prospectus. While we believe this index will provide a closer basis of comparison to the Fund, it is also worth noting that the Adviser does not make investment decisions in an attempt to match any benchmark allocations.
The graph below shows the performance of $10,000 invested in the Investor Shares at inception. The results shown below do not reflect the deduction of taxes that a shareholder would pay on fund distributions or the redemption of fund shares.
| | | | | | | | |
Average Annual Total Returns as of 04/30/2016 | | | | | | | | |
| | | One Year | | Five Year | | Since
Inception | | Inception
Date |
Investor Shares* | | -6.27% | | 5.79% | | 11.60% | | 6/16/2009 |
Institutional Shares* | | -6.10% | | — | | -0.32% | | 6/17/2014 |
MSCI World Index** | | -3.61% | | 6.57% | | — (1) | | — |
FTSE Global All Cap Net Tax Index*** | | -5.28% | | 4.99% | | — (2) | | — |
Fund Expense Ratios(3): Investor Shares: Gross 1.13% and Net 1.15%; Institutional Shares: Gross 2.14% and Net 0.95% |
| | | | |
| 8 | | | | Motley Fool Independence Fund |
The performance data quoted represents past performance and does not guarantee future results. Current performance may be lower or higher. Performance data current to the most recent month-end may be obtained at www.FoolFunds.com. The investment return and principal value of an investment will fluctuate so that shares, when redeemed, may be worth more or less than their original cost.
(1)The index returned 11.25% from the inception date of the Investor Shares and 0.58% from the inception date of the Institutional Shares.
(2)The index returned 10.59% from the inception date of the Investor Shares and -0.69% from the inception date of the Institutional Shares.
(3)The expense ratios of the Fund are set forth according to the 2/29/16 Prospectus for the Fund and may differ from the expense ratios disclosed in the Financial Highlights tables in this report. See the Financial Highlights for more current expense ratios.
*These returns reflect expense waivers by the Fund’s investment adviser. Without these waivers, returns would have been lower.
**The MSCI World Index is a free float-adjusted market capitalization weighted index that is designed to measure the equity market performance of developed markets. The Fund may invest in countries that are not included within the MSCI World Index (such as emerging market countries) and its investment portfolio is not weighted in terms of countries or issuers the same as the MSCI World Index. For this reason, the Fund’s investment performance should not be expected to track, and may exceed or trail, the MSCI World Index.
***The FTSE Global All Cap Index is a market-capitalization weighted index representing the performance of large, mid and small cap companies in Developed and Emerging markets. The index is comprised of approximately 7,600 securities from 47 countries and captures 98% of the world’s investable market capitalization. Fair value prices and foreign exchange as of 4 pm EST are used in the calculation of this index, and returns are adjusted for withholding taxes applicable to dividends received by a U.S. Regulated Investment Company domiciled in the United States.
The investment objective of the Independence Fund is to achieve long-term capital appreciation. The Fund pursues this objective by investing primarily in common stocks of companies located anywhere in the world. The Fund invests in areas of the market that, in the view of Motley Fool Asset Management, LLC (the “Adviser”), offer the greatest potential for long-term capital appreciation. The Fund may invest in other types of securities and in other asset classes when, in the judgment of the Adviser, such investments offer attractive potential returns. As such, the Fund’s performance will deviate significantly from its benchmark from time to time. It is the view of the Adviser that this deviation is less meaningful over shorter time frames and is more relevant over multi-year periods.
Because the Independence Fund is free to invest in companies of any size around the world, at times, the Fund may be heavily invested in small-cap stocks and foreign securities, each of which presents extra risk. Small-cap stocks tend to be more volatile and less liquid than their large-cap counterparts. Fluctuations in currency exchange rates can cause losses when investing in foreign securities, with emerging markets presenting additional risks of illiquidity, political instability, and lax regulation. You are strongly encouraged to read more about the Fund’s strategies and risks in the prospectus.
The Independence Fund invests in securities of companies the Adviser believes are undervalued. Unlike mutual funds that are constrained by a style-box, the Fund may invest in any company, country, market, industry or sector where the Adviser’s analysis suggests that there is opportunity for gains that outweigh risks. In identifying investments for the Fund, the Adviser looks for companies it believes the market has irrationally undervalued and looks for companies that have high-quality businesses with strong market positions, manageable leverage, and robust streams of free cash flow. The following tables show the top eleven holdings, sector allocation and top eleven countries in which the Fund was invested as of April 30, 2016. Portfolio holdings are subject to change without notice.
| | | | |
| Motley Fool Independence Fund | | | | 9 |
| | | | |
| |  Certain mutual fund ratings and review services have created style boxes, which look more or less like a tic-tac-toe board; arranging funds by the size of the companies they typically invest in (large-, mid-, and small-cap) along one axis, and along a “value” to “growth” basis on the other axis. This may be a helpful way – at times – to think about certain investment opportunities, but we don’t believe we’ll improve your returns by limiting ourselves to any one portion of that style box. Certain mutual fund ratings and review services have created style boxes, which look more or less like a tic-tac-toe board; arranging funds by the size of the companies they typically invest in (large-, mid-, and small-cap) along one axis, and along a “value” to “growth” basis on the other axis. This may be a helpful way – at times – to think about certain investment opportunities, but we don’t believe we’ll improve your returns by limiting ourselves to any one portion of that style box.
| | |
| | | | | |
Top Eleven Holdings* | | % of Net Assets |
| |
| | | | | | |
| |
Banco Latinoamericano de Comercio Exterior SA | | | | 3.61 | % |
HDFC Bank Ltd. | | | | 3.59 | |
Berkshire Hathaway, Inc. | | | | 3.10 | |
DuzonBizon Co., Ltd. | | | | 3.04 | |
Anthem. Inc. | | | | 3.01 | |
Infinera Corp. | | | | 2.72 | |
Loews Corp. | | | | 2.66 | |
Markel Corp. | | | | 2.49 | |
Almarai Co. | | | | 2.38 | |
Amazon.com, Inc. | | | | 2.24 | |
Bank of Georgia Holdings PLC | | | | 2.18 | |
| | | | | |
| | | | 31.02 | % |
| | | | | |
| | | | | |
* As of the date of the report, the fund had a holding of 1.00% in the BNY Mellon Cash Reserve.
The Motley Fool Independence Fund uses the Global Industry Classification StandardSM (“GICSSM”) as the basis for the classification of securities on the Schedule of Investments (“SOI”). We believe that this makes the SOI classifications more standard with the rest of the industry.
| | | | | |
Sector Allocation | | % of Net
Assets |
| |
| | | | | | |
| |
Financials | | | | 23.89 | % |
Consumer Discretionary | | | | 17.77 | |
Information Technology | | | | 17.62 | |
Health Care | | | | 12.31 | |
Industrials | | | | 9.73 | |
Consumer Staples | | | | 8.60 | |
Telecommunication Services | | | | 3.63 | |
Materials | | | | 3.27 | |
Energy | | | | 1.35 | |
| | | | | |
| | | | 98.17 | % |
| | | | | |
| | | | | |
| | | | |
| 10 | | | | Motley Fool Independence Fund |
| | | | | |
Top Eleven Countries | | % of Net
Assets |
| |
| | | | | | |
| |
United States* | | | | 51.38 | % |
Switzerland | | | | 4.80 | |
United Arab Emirates | | | | 4.60 | |
South Korea | | | | 4.42 | |
Panama | | | | 3.61 | |
India | | | | 3.59 | |
Japan | | | | 2.69 | |
Indonesia | | | | 2.41 | |
Saudi Arabia | | | | 2.38 | |
United Kingdom | | | | 2.30 | |
Georgia | | | | 2.18 | |
| | | | | |
| | | | 84.36 | % |
| | | | | |
| | | | | |
* As of the date of the report, the fund had a holding of 1.00% in the BNY Mellon Cash Reserve.
| | | | |
| Motley Fool Independence Fund | | | | 11 |
About Your Expenses
As a shareholder of the Independence Fund, you incur ongoing costs, including advisory fees and other Fund expenses. This example is intended to help you to understand your ongoing costs (in dollars) of investing in the Fund and to compare these costs with the ongoing costs of investing in other mutual funds. It is based on an investment of $1,000 invested at the beginning of the period and held for the entire period from November 1, 2015 to April 30, 2016.
Actual Expenses
The first section of the table below provides information about actual account values and actual expenses. You may use the information in this section, together with the amount you invested, to estimate the expenses that you incurred over the period. Simply divide your account value by $1,000 (for example, an $8,600 account value divided by $1,000 = 8.6), then multiply the result by the number in the first section under the heading entitled “Expenses Paid During Period” to estimate the expenses attributable to your investment during this period.
Hypothetical Example for Comparison Purposes
The second section of the table below provides information about hypothetical account values and hypothetical expenses based on the Independence Fund’s actual expense ratio and an assumed rate of return of 5% per year before expenses, which is not the Fund’s actual return. Thus, you should not use the hypothetical account values and expenses to estimate the actual ending account balance or your expenses for the period. Rather, these figures are provided to enable you to compare the ongoing costs of investing in the Fund as compared to the costs of investing in other funds. To do so, compare this 5% hypothetical example with the 5% hypothetical examples that appear in the shareholder reports of the other funds. Please note that the expenses shown in the table are meant to highlight your ongoing costs only. Therefore, the second section of the table is useful in comparing ongoing costs only and will not help you determine the relative total costs of owning different funds.
| | | | |
| |  Do you know how many times a fund, or the market, has returned a smooth 5% over a long period of time? Never. But we have to pick some example. In reality, the market’s returns are always far bumpier, with the market returning 20% one year, followed by a loss of 10% the next year, followed by a 3% gain, etc. These variations affect actual expenses as well. Happily, over almost all time periods of 20 years or longer, according to the research of University of Pennsylvania’s Jeremy Siegel and others, the domestic market’s returns have been at least 5% per year on average. Do you know how many times a fund, or the market, has returned a smooth 5% over a long period of time? Never. But we have to pick some example. In reality, the market’s returns are always far bumpier, with the market returning 20% one year, followed by a loss of 10% the next year, followed by a 3% gain, etc. These variations affect actual expenses as well. Happily, over almost all time periods of 20 years or longer, according to the research of University of Pennsylvania’s Jeremy Siegel and others, the domestic market’s returns have been at least 5% per year on average.
| | |
| | | | | | | | | | | | | | | | | | | | |
| | | Beginning
Account
Value
11/01/15 | | Ending
Account
Value
4/30/16 | | Annualized
Expense
Ratio(1) | | Expenses
Paid
During
Period(2) |
| | | | |
| | | | | | | | | | | | | | | | | | | | | |
| | | | |
Investor Shares | | | | | | | | | | | | | | | | | | | | |
Actual | | | $ | 1,000 | | | | $ | 971.47 | | | | | 1.15 | % | | | $ | 5.64 | |
Hypothetical | | | $ | 1,000 | | | | $ | 1,019.14 | | | | | 1.15 | % | | | $ | 5.77 | |
Institutional Shares | | | | | | | | | | | | | | | | | | | | |
Actual | | | $ | 1,000 | | | | $ | 972.67 | | | | | 0.95 | % | | | $ | 4.66 | |
Hypothetical | | | $ | 1,000 | | | | $ | 1,020.14 | | | | | 0.95 | % | | | $ | 4.77 | |
| (1) | These ratios reflect expenses waived by the Fund’s investment adviser. Without these Waivers, the Fund’s expenses would have been higher and the ending account values would have been lower. |
| (2) | Expenses are equal to the Fund’s annualized expense ratio for the period November 1, 2015 to April 30, 2016, multiplied by the average account value over the period, multiplied by the number of days (182) in the most recent fiscal half-year, then divided by 366. |
| | | | |
| 12 | | | | Motley Fool Independence Fund (Unaudited) |
The Motley Fool Funds Trust
Motley Fool Independence Fund
Schedule of Investments
April 30, 2016
(Unaudited)
| | | | | | | | | | |
Issues | | Shares | | Value (Note 2) |
| | |
| | | | | | | | | | | |
| | |
Equity Securities — 95.07% | | | | | | | | | | |
Airlines — 0.73% | | | | | | | | | | |
Air Arabia PJSC (United Arab Emirates) | | | | 8,000,000 | | | | $ | 2,695,814 | |
| | | | | | | | | | |
| | |
Auto Components — 1.89% | | | | | | | | | | |
Gentex Corp. (United States) | | | | 200,000 | | | | | 3,208,000 | |
Horizon Global Corp. (United States)* | | | | 304,933 | | | | | 3,741,530 | |
| | | | | | | | | | |
| | |
| | | | | | | | | 6,949,530 | |
| | | | | | | | | | |
| | |
Banks — 11.20% | | | | | | | | | | |
Banco Latinoamericano de Comercio Exterior SA (Panama) | | | | 513,235 | | | | | 13,272,257 | |
Bank of Georgia Holdings PLC (Georgia) | | | | 239,638 | | | | | 8,018,396 | |
HDFC Bank Ltd. (India)(a) | | | | 210,000 | | | | | 13,202,700 | |
Sberbank of Russia (Russia) | | | | 3,500,000 | | | | | 6,681,938 | |
| | | | | | | | | | |
| | |
| | | | | | | | | 41,175,291 | |
| | | | | | | | | | |
| | |
Beverages — 1.01% | | | | | | | | | | |
Boston Beer, Co., Inc. (The) Class A (United States)* | | | | 23,720 | | | | | 3,702,218 | |
| | | | | | | | | | |
| | |
Biotechnology — 1.00% | | | | | | | | | | |
Ionis Pharmaceuticals, Inc. (United States)* | | | | 90,000 | | | | | 3,687,300 | |
| | | | | | | | | | |
| | |
Building Products — 1.70% | | | | | | | | | | |
American Woodmark Corp. (United States)* | | | | 85,771 | | | | | 6,247,560 | |
| | | | | | | | | | |
| | |
Capital Markets — 1.09% | | | | | | | | | | |
Oaktree Capital Group LLC (United States) | | | | 82,562 | | | | | 3,988,570 | |
| | | | | | | | | | |
| | |
Chemicals — 2.86% | | | | | | | | | | |
Innophos Holdings, Inc. (United States) | | | | 116,164 | | | | | 4,293,421 | |
Syngenta AG (Switzerland)(a) | | | | 77,101 | | | | | 6,212,028 | |
| | | | | | | | | | |
| | |
| | | | | | | | | 10,505,449 | |
| | | | | | | | | | |
| | |
Commercial Services & Supplies — 1.80% | | | | | | | | | | |
Depa Ltd. (United Arab Emirates)* | | | | 5,815,390 | | | | | 2,174,956 | |
KAR Auction Services, Inc. (United States) | | | | 117,708 | | | | | 4,425,821 | |
| | | | | | | | | | |
| | |
| | | | | | | | | 6,600,777 | |
| | | | | | | | | | |
| | |
Communications Equipment — 2.72% | | | | | | | | | | |
Infinera Corp. (United States)* | | | | 841,100 | | | | | 10,000,679 | |
| | | | | | | | | | |
See Notes to Financial Statements.
| | | | |
| Motley Fool Independence Fund | | | | 13 |
| | | | | | | | | | |
Issues | | Shares | | Value (Note 2) |
| | |
| | | | | | | | | | | |
| | |
Equity Securities (continued) | | | | | | | | | | |
Construction & Engineering — 0.87% | | | | | | | | | | |
Chicago Bridge & Iron Co. NV (Netherlands) | | | | 79,000 | | | | $ | 3,179,750 | |
| | | | | | | | | | |
| | |
Diversified Financial Services — 3.10% | | | | | | | | | | |
Berkshire Hathaway, Inc. Class A (United States)* | | | | 52 | | | | | 11,388,000 | |
| | | | | | | | | | |
| | |
Diversified Telecommunication Services — 1.67% | | | | | | | | | | |
Level 3 Communications, Inc. (United States)* | | | | 117,500 | | | | | 6,140,550 | |
| | | | | | | | | | |
| | |
Food & Staples Retailing — 1.61% | | | | | | | | | | |
Costco Wholesale Corp. (United States) | | | | 40,000 | | | | | 5,925,200 | |
| | | | | | | | | | |
| | |
Food Products — 3.60% | | | | | | | | | | |
BRF - Brasil Foods SA (Brazil)(a) | | | | 223,704 | | | | | 3,181,071 | |
Nestle SA (Switzerland) | | | | 68,694 | | | | | 5,127,298 | |
PT Nippon Indosari Corpindo Tbk (Indonesia) | | | | 44,934,800 | | | | | 4,936,872 | |
| | | | | | | | | | |
| | |
| | | | | | | | | 13,245,241 | |
| | | | | | | | | | |
| | |
Health Care Equipment & Supplies — 4.64% | | | | | | | | | | |
Medtronic PLC (Ireland) | | | | 59,272 | | | | | 4,691,379 | |
Natus Medical, Inc. (United States)* | | | | 242,900 | | | | | 7,741,223 | |
Zimmer Biomet Holdings, Inc. (United States) | | | | 40,000 | | | | | 4,630,800 | |
| | | | | | | | | | |
| | |
| | | | | | | | | 17,063,402 | |
| | | | | | | | | | |
| | |
Health Care Providers & Services — 4.83% | | | | | | | | | | |
Anthem, Inc. (United States) | | | | 78,697 | | | | | 11,078,177 | |
NMC Health PLC (United Arab Emirates) | | | | 435,482 | | | | | 6,662,132 | |
| | | | | | | | | | |
| | |
| | | | | | | | | 17,740,309 | |
| | | | | | | | | | |
| | |
Hotels, Restaurants & Leisure — 1.46% | | | | | | | | | | |
Chipotle Mexican Grill, Inc. (United States)* | | | | 5,000 | | | | | 2,104,850 | |
Texas Roadhouse, Inc. (United States) | | | | 80,500 | | | | | 3,277,960 | |
| | | | | | | | | | |
| | |
| | | | | | | | | 5,382,810 | |
| | | | | | | | | | |
| | |
Insurance — 5.16% | | | | | | | | | | |
Loews Corp. (United States) | | | | 246,890 | | | | | 9,796,595 | |
Markel Corp. (United States)* | | | | 10,200 | | | | | 9,170,922 | |
| | | | | | | | | | |
| | |
| | | | | | | | | 18,967,517 | |
| | | | | | | | | | |
| | |
Internet — 1.38% | | | | | | | | | | |
COOKPAD, Inc. (Japan) | | | | 70,000 | | | | | 1,001,038 | |
Tencent Holdings Ltd. (Cayman Islands) | | | | 200,000 | | | | | 4,069,663 | |
| | | | | | | | | | |
| | |
| | | | | | | | | 5,070,701 | |
| | | | | | | | | | |
See Notes to Financial Statements.
| | | | |
| 14 | | | | Motley Fool Independence Fund |
| | | | | | | | | | |
Issues | | Shares | | Value (Note 2) |
| | |
| | | | | | | | | | | |
| | |
Equity Securities (continued) | | | | | | | | | | |
Internet & Catalog Retail — 6.12% | | | | | | | | | | |
Amazon.com, Inc. (United States)* | | | | 12,500 | | | | $ | 8,244,875 | |
CJ O Shopping Co., Ltd. (South Korea) | | | | 28,949 | | | | | 5,065,912 | |
TripAdvisor, Inc. (United States)* | | | | 50,000 | | | | | 3,229,500 | |
zooplus AG (Germany)* | | | | 42,499 | | | | | 5,972,250 | |
| | | | | | | | | | |
| | |
| | | | | | | | | 22,512,537 | |
| | | | | | | | | | |
| | |
Internet Software & Services — 4.40% | | | | | | | | | | |
Alphabet, Inc. Class A (United States)* | | | | 4,000 | | | | | 2,831,520 | |
Alphabet, Inc. Class C (United States)* | | | | 9,024 | | | | | 6,253,722 | |
Baidu, Inc. (China)*(a) | | | | 36,500 | | | | | 7,091,950 | |
| | | | | | | | | | |
| | |
| | | | | | | | | 16,177,192 | |
| | | | | | | | | | |
| | |
Leisure Products — 0.70% | | | | | | | | | | |
Shimano, Inc. (Japan) | | | | 18,000 | | | | | 2,582,486 | |
| | | | | | | | | | |
| | |
Life Sciences Tools & Services — 1.83% | | | | | | | | | | |
Horizon Discovery Group PLC (United Kingdom)* | | | | 1,800,000 | | | | | 4,865,647 | |
Siegfried Holding Ltd. (Switzerland) | | | | 10,000 | | | | | 1,876,368 | |
| | | | | | | | | | |
| | |
| | | | | | | | | 6,742,015 | |
| | | | | | | | | | |
| | |
Machinery — 2.46% | | | | | | | | | | |
FANUC Corp. (Japan) | | | | 42,600 | | | | | 6,292,959 | |
TriMas Corp. (United States)* | | | | 152,333 | | | | | 2,757,227 | |
| | | | | | | | | | |
| | |
| | | | | | | | | 9,050,186 | |
| | | | | | | | | | |
| | |
Media — 1.80% | | | | | | | | | | |
BrainJuicer Group PLC (United Kingdom) | | | | 700,000 | | | | | 3,579,830 | |
Multiplus SA (Brazil) | | | | 278,600 | | | | | 3,045,017 | |
| | | | | | | | | | |
| | |
| | | | | | | | | 6,624,847 | |
| | | | | | | | | | |
| | |
Metals & Mining — 0.41% | | | | | | | | | | |
Constellium NV, Class A (Netherlands)* | | | | 258,752 | | | | | 1,508,524 | |
| | | | | | | | | | |
| | |
Multiline Retail — 1.06% | | | | | | | | | | |
PT Mitra Adiperkasa Tbk (Indonesia)* | | | | 12,301,000 | | | | | 3,908,177 | |
| | | | | | | | | | |
| | |
Pharmaceuticals — 0.01% | | | | | | | | | | |
Perrigo Co., PLC (Ireland) | | | | 460 | | | | | 44,468 | |
| | | | | | | | | | |
| | |
Pipelines — 1.35% | | | | | | | | | | |
Kinder Morgan, Inc. (United States) | | | | 280,000 | | | | | 4,972,800 | |
| | | | | | | | | | |
See Notes to Financial Statements.
| | | | |
| Motley Fool Independence Fund | | | | 15 |
| | | | | | | | | | |
Issues | | Shares | | Value (Note 2) |
| | |
| | | | | | | | | | | |
| | |
Equity Securities (continued) | | | | | | | | | | |
Real Estate Investment Trusts — 1.83% | | | | | | | | | | |
American Tower Corp. (United States) | | | | 64,000 | | | | $ | 6,712,320 | |
| | | | | | | | | | |
| | |
Real Estate Management & Development — 1.52% | | | | | | | | | | |
Henderson Land Development Co., Ltd. (Hong Kong) | | | | 899,127 | | | | | 5,603,846 | |
| | | | | | | | | | |
| | |
Semiconductors & Semiconductor Equipment — 3.66% | | | | | | | | | | |
Intel Corp. (United States) | | | | 219,000 | | | | | 6,631,320 | |
Taiwan Semiconductor Manufacturing Co., Ltd. (Taiwan)(a) | | | | 290,000 | | | | | 6,841,100 | |
| | | | | | | | | | |
| | |
| | | | | | | | | 13,472,420 | |
| | | | | | | | | | |
| | |
Software — 4.01% | | | | | | | | | | |
DuzonBizon Co., Ltd. (South Korea) | | | | 513,180 | | | | | 11,193,782 | |
Ultimate Software Group, Inc. (The) (United States)* | | | | 18,000 | | | | | 3,538,620 | |
| | | | | | | | | | |
| | |
| | | | | | | | | 14,732,402 | |
| | | | | | | | | | |
| | |
Technology Hardware, Storage & Peripherals — 1.45% | | | | | | | | | | |
Apple, Inc. (United States) | | | | 57,000 | | | | | 5,343,180 | |
| | | | | | | | | | |
| | |
Textiles, Apparel & Luxury Goods — 4.73% | | | | | | | | | | |
Swatch Group SA (The) (Switzerland) | | | | 13,000 | | | | | 4,435,359 | |
Under Armour, Inc. Class A (United States)* | | | | 152,820 | | | | | 6,714,911 | |
Under Armour, Inc. Class C (United States)* | | | | 152,820 | | | | | 6,235,056 | |
| | | | | | | | | | |
| | |
| | | | | | | | | 17,385,326 | |
| | | | | | | | | | |
| | |
Transportation Infrastructure — 1.45% | | | | | | | | | | |
DP World Ltd. (United Arab Emirates) | | | | 145,000 | | | | | 2,705,258 | |
International Container Terminal Services, Inc. (Philippines) | | | | 1,900,000 | | | | | 2,630,468 | |
| | | | | | | | | | |
| | |
| | | | | | | | | 5,335,726 | |
| | | | | | | | | | |
| | |
Wireless Telecommunication Services — 1.96% | | | | | | | | | | |
SBA Communications Corp. Class A (United States)* | | | | 70,000 | | | | | 7,212,800 | |
| | | | | | | | | | |
| | |
Total Equity Securities (Cost $ 256,653,979) | | | | | | | | | 349,577,920 | |
| | | | | | | | | | |
| | |
Participatory Notes — 3.10% | | | | | | | | | | |
Air Freight & Logistics — 0.72% | | | | | | | | | | |
Aramex PJSC (United Arab Emirates)(b) | | | | 2,881,845 | | | | | 2,667,724 | |
| | | | | | | | | | |
| | |
Banks — 0.00% | | | | | | | | | | |
Al Rajhi Banking & Investment Co. (Saudi Arabia)(b)(c) | | | | — | | | | | 7 | |
| | | | | | | | | | |
| | |
Food Products — 2.38% | | | | | | | | | | |
Almarai Co. (Saudi Arabia)(b) | | | | 583,677 | | | | | 8,735,897 | |
| | | | | | | | | | |
| | |
Total Participatory Notes (Cost $ 8,382,287) | | | | | | | | | 11,403,628 | |
| | | | | | | | | | |
See Notes to Financial Statements.
| | | | |
| 16 | | | | Motley Fool Independence Fund |
| | | | | | | | | | | | | | |
Issues | | Shares | | Value (Note 2) |
| | | | |
| | | | | | | | | | | | | | | |
| | | | |
Other Investments — 1.00% | | | | | | | | | | | | | | |
Temporary Cash Investment — 1.00% | | | | | | | | | | | | | | |
BNY Mellon Cash Reserve | | | | 3,690,825 | | | | | | $ | 3,690,825 | | | |
| | | | | | | | | | | | | | |
| | | | |
Total Other Investments (Cost $ 3,690,825) | | | | | | | | | | | 3,690,825 | | | |
| | | | | | | | | | | | | | |
| | | | |
Total Investments Portfolio (Cost $ 268,727,091) — 99.17% | | | | | | | | | | | 364,672,373 | | | |
Liabilities in Excess of Other Assets — 0.83% | | | | | | | | | | | 3,037,746 | | | |
| | | | | | | | | | | | | | |
| | | | |
NET ASSETS — 100.00% | | | | | | | | | | | | | | |
(Applicable to 18,632,482 shares outstanding) | | | | | | | | | | $ | 367,710,119 | | | |
| | | | | | | | | | | | | | |
| | | | | | | | | | | | | | |
* Non-income producing security.
| (a) | ADR — American Depositary Receipts |
| (b) | Security exempt from registration under Rule 144A of the Securities Act of 1933. These securities may be resold in transactions exempt from registration, normally to qualified institutional buyers. Total market value of Rule 144A securities is $11,403,628 and represents 3.10% of net assets as of April 30, 2016. |
PLC — Public Limited Company
See Notes to Financial Statements.
| | | | |
| Motley Fool Independence Fund | | | | 17 |
Statement of Assets and Liabilities
| | | | | | | | | | |
| | | As of April 30, 2016 (Unaudited) | | |
| | |
| | | | | | | | | |
Assets: | | | | | | | |
| | |
Investments in securities of unaffiliated issuers, at value (at cost, $268,727,091) | | | $ | 364,672,373 | | | |
Cash | | | | 1,922,961 | | | |
| | |
Foreign currency, at value (at cost, $123,690) | | | | 123,491 | | | |
Receivables: | | | | | | | |
Dividends and tax reclaims | | | | 932,232 | | | |
Investment securities sold | | | | 3,101,586 | | | |
Shares of beneficial interest sold | | | | 57,416 | | | |
Prepaid expenses and other assets | | | | 45,844 | | | |
| | | | | | | | |
Total Assets | | | | 370,855,903 | | | |
| | | | | | | | |
| | |
Liabilities | | | | | | | |
Payables: | | | | | | | |
Investment securities purchased | | | | 1,951,607 | | | |
Foreign currency purchased | | | | 127,948 | | | |
Shares of beneficial interest redeemed | | | | 480,007 | | | |
Dividend withholding tax | | | | 59,756 | | | |
Accrued expenses: | | | | | | | |
Audit fees | | | | 9,667 | | | |
Accounting and administration fees | | | | 84,139 | | | |
Advisory fees | | | | 253,849 | | | |
Custodian fees | | | | 32,147 | | | |
Transfer agent fees | | | | 54,043 | | | |
Trustee fees | | | | 539 | | | |
Other expenses | | | | 92,082 | | | |
| | | | | | | | |
Total Liabilities | | | | 3,145,784 | | | |
| | | | | | | | |
Net Assets | | | $ | 367,710,119 | | | |
| | | | | | | | |
| | | | | | | | |
The accompanying notes are an integral part of these financial statements.
| | | | |
| 18 | | | | Motley Fool Independence Fund |
Statement of Assets and Liabilities
| | | | | | | | | | |
| | | As of April 30, 2016
(Unaudited) | | |
| | |
| | | | | | | | | |
| | |
Net Assets Consist of: | | | | | | | |
Paid-in-Capital | | | $ | 266,050,814 | | | |
Undistributed Net Investment Income | | | | 227,984 | | | |
Accumulated Net Realized Gain on Investments and Foreign Currency Transactions | | | | 5,485,159 | | | |
Net Unrealized Appreciation/(Depreciation) on Investments, Foreign Currencies, and Assets and Liabilities Denominated in Foreign Currencies | | | | 95,946,162 | | | |
| | | | | | | | |
Net Assets | | | $ | 367,710,119 | | | |
| | | | | | | | |
| | | | | | | | |
| | |
Net Asset Value: | | | | | | | |
$0.001 par value, unlimited shares authorized | | | | | | | |
Investor Shares: | | | | | | | |
Net assets applicable to capital shares outstanding | | | $ | 360,444,326 | | | |
Shares outstanding | | | | 18,264,621 | | | |
| | | | | | | | | | |
Net asset value, offering, and redemption price per share* | | | $ | 19.73 | | | |
| | | | | | | | |
| | | | | | | | |
| | |
Institutional Shares: | | | | | | | |
Net assets applicable to capital shares outstanding | | | $ | 7,265,793 | | | |
Shares outstanding | | | | 367,861 | | | |
| | | | | | | | |
Net asset value, offering, and redemption price per share* | | | $ | 19.75 | | | |
| | | | | | | | |
| | | | | | | | |
| * | A charge of 2% is imposed on the redemption proceeds of shares redeemed or exchanged within 90 days of purchase. |
The accompanying notes are an integral part of these financial statements.
| | | | |
| Motley Fool Independence Fund | | | | 19 |
Statement of Operations
| | | | | | | | | | |
| | | Six-Months Ended
April 30, 2016
(Unaudited) | | |
| | |
| | | | | | | | | |
Investment Income | | | | | | | |
Dividends | | | $ | 2,520,572 | | | |
Less foreign taxes withheld | | | | (112,712 | ) | | |
| | | | | | | | |
Total Investment Income | | | | 2,407,860 | | | |
| | | | | | | | |
Expenses | | | | | | | |
Accounting and administration fees | | | | 161,617 | | | |
Blue sky fees | | | | 12,181 | | | |
Shareholder account-related services - Investor Shares | | | | 127,050 | | | |
Shareholder account-related services - Institutional Shares | | | | 2,813 | | | |
Chief Compliance Officer fees | | | | 12,708 | | | |
Custodian fees | | | | 45,953 | | | |
Investment advisory fees | | | | 1,572,428 | | | |
Professional fees | | | | 22,003 | | | |
Shareholder reporting fees | | | | 22,051 | | | |
Transfer agent fees - Investor Shares | | | | 133,334 | | | |
Transfer agent fees - Institutional Shares | | | | 19,284 | | | |
Trustee fees | | | | 18,649 | | | |
Other expenses | | | | 13,685 | | | |
| | | | | | | | |
Total expenses | | | | 2,163,756 | | | |
| | | | | | | | |
Expenses waived/reimbursed net of amount recaptured - Investor Shares | | | | (5,152 | ) | | |
Expenses waived/reimbursed net of amount recaptured - Institutional Shares | | | | (38,445 | ) | | |
| | | | | | | | |
Net expenses | | | | 2,120,159 | | | |
| | | | | | | | |
Net Investment Income (Loss) | | | | 287,701 | | | |
| | | | | | | | |
| | |
Realized and Unrealized Gain (Loss) | | | | | | | |
Net realized gain (loss) from: | | | | | | | |
Investment securities | | | | 5,491,293 | | | |
Foreign currency transactions | | | | (26,424 | ) | | |
| | | | | | | | |
Net realized gain (loss) on investments and foreign currency transactions | | | | 5,464,869 | | | |
| | | | | | | | |
| | |
Change in net unrealized appreciation/(depreciation) on: | | | | | | | |
Investment securities | | | | (17,964,096 | ) | | |
Foreign currency translations | | | | 16,176 | | | |
| | | | | | | | |
Change in net unrealized appreciation/(depreciation) on investments, foreign currencies, and assets and liabilities denominated in foreign currencies | | | | (17,947,920 | ) | | |
| | | | | | | | |
Net realized and unrealized gain (loss) | | | | (12,483,051 | ) | | |
| | | | | | | | |
Net Increase (Decrease) in Net Assets Resulting from Operations | | | $ | (12,195,350 | ) | | |
| | | | | | | | |
| | | | | | | | |
The accompanying notes are an integral part of these financial statements.
| | | | |
| 20 | | | | Motley Fool Independence Fund |
Statements of Changes in Net Assets
| | | | | | | | | | |
| | | Six Months Ended April 30, 2016
(Unaudited) | | Year Ended October 31,
2015 |
| | |
| | | | | | | | | | | |
Operations: | | | | | | | | | | |
Net Investment Income (Loss) | | | $ | 287,701 | | | | $ | 963,521 | |
Net Realized Gain (Loss) on Investments and Foreign Currency Transactions | | | | 5,464,869 | | | | | (524,695 | ) |
Change in Net Unrealized Appreciation/(Depreciation) on Investments and Foreign Currency Translation | | | | (17,947,920 | ) | | | | (5,336,798 | ) |
| | | | | | | | | | |
| | |
Net increase (decrease) in net assets resulting from operations | | | | (12,195,350 | ) | | | | (4,897,972 | ) |
| | | | | | | | | | |
Dividends to Shareholders: | | | | | | | | | | |
Dividends from net investment income | | | | | | | | | | |
Investor Shares | | | | (34,910 | ) | | | | (2,188,018 | ) |
Institutional Shares | | | | (13,802 | ) | | | | (26,738 | ) |
Distributions from net realized capital gains | | | | | | | | | | |
Investor Shares | | | | (166,111 | ) | | | | (6,627,841 | ) |
Institutional Shares | | | | (3,300 | ) | | | | (72,605 | ) |
| | | | | | | | | | |
Total dividends and distributions | | | | (218,123 | ) | | | | (8,915,202 | ) |
| | | | | | | | | | |
Capital Share Transactions: | | | | | | | | | | |
Proceeds from shares sold | | | | | | | | | | |
Investor Shares (646,950 and 2,584,826 shares, respectively) | | | | 12,467,800 | | | | | 53,616,724 | |
Institutional Shares (21,170 and 222,884 shares, respectively) | | | | 408,275 | | | | | 4,626,757 | |
Reinvestment of dividends | | | | | | | | | | |
Investor Shares (9,795 and 424,462 shares, respectively) | | | | 197,667 | | | | | 8,654,772 | |
Institutional Shares (837 and 4,766 shares, respectively) | | | | 16,889 | | | | | 97,176 | |
Value of shares redeemed | | | | | | | | | | |
Investor Shares (1,764,581 and 3,334,905 shares, respectively) | | | | (33,698,140 | ) | | | | (68,761,591 | ) |
Institutional Shares (33,757 and 40,220 shares, respectively) | | | | (629,729 | ) | | | | (818,282 | ) |
Redemption and small-balance account fees | | | | | | | | | | |
Investor Shares | | | | 23,960 | | | | | 72,419 | |
Institutional Shares | | | | — | | | | | 5 | |
| | | | | | | | | | |
Net increase (decrease) from capital share transactions | | | | (21,213,278 | ) | | | | (2,512,020 | ) |
| | | | | | | | | | |
Total increase (decrease) in net assets | | | | (33,626,751 | ) | | | | (16,325,194 | ) |
| | | | | | | | | | |
Net Assets: | | | | | | | | | | |
Beginning of Period | | | | 401,336,870 | | | | | 417,662,064 | |
| | | | | | | | | | |
End of Period* | | | $ | 367,710,119 | | | | $ | 401,336,870 | |
| | | | | | | | | | |
| | | | | | | | | | |
*Including undistributed net investment income (loss) | | | $ | 227,984 | | | | $ | (11,005 | ) |
| | | | | | | | | | |
| | | | | | | | | | |
The accompanying notes are an integral part of these financial statements.
| | | | |
| Motley Fool Independence Fund | | | | 21 |
Financial Highlights
(for a share outstanding throughout each period)
| | | | | | | | | | | | | | | | | | | | | | | | | | | | |
| | |
| | | Six Months Ended April 30, 2016 | | | Years Ended October 31, | |
| | | | | | |
| Investor Shares | | (Unaudited)(1) | | | 2015 | | | | 2014 | | | | 2013 | | | | 2012 | | | | 2011 | |
| | | | | | | | |
Net Asset Value, Beginning of Period | | | | $ | 20.32 | | | | | $ | 21.00 | | | $ | 19.24 | | | $ | 15.48 | | | $ | 14.15 | | | $ | 14.14 | |
| | | | | | | | | | | | | | | | | | | | | | | | | | | | |
Income (Loss) From Investment Operations | | | | | | | | | | | | | | | | | | | | | | | | | | | | |
Net Investment Income (Loss)(2) | | | | | 0.01 | | | | | | 0.05 | | | | 0.11 | | | | 0.07 | | | | 0.14 | | | | 0.11 | |
Net Gain (Loss) on Securities (Realized and Unrealized) | | | | | (0.59 | ) | | | | | (0.29 | ) | | | 1.87 | | | | 3.79 | | | | 1.29 | | | | 0.15 | |
| | | | | | | | | | | | | | | | | | | | | | | | | | | | |
Total From Investment Operations | | | | | (0.58 | ) | | | | | (0.24 | ) | | | 1.98 | | | | 3.86 | | | | 1.43 | | | | 0.26 | |
| | | | | | | | | | | | | | | | | | | | | | | | | | | | |
Less Distributions | | | | | | | | | | | | | | | | | | | | | | | | | | | | |
Net Investment Income | | | | | —* | | | | | | (0.11 | ) | | | (0.04 | ) | | | (0.11 | ) | | | (0.10 | ) | | | (0.15 | ) |
Net Realized Capital Gains | | | | | (0.01 | ) | | | | | (0.33 | ) | | | (0.18 | ) | | | — | | | | — | | | | (0.11 | ) |
| | | | | | | | | | | | | | | | | | | | | | | | | | | | |
Total Distributions | | | | | (0.01 | ) | | | | | (0.44 | ) | | | (0.22 | ) | | | (0.11 | ) | | | (0.10 | ) | | | (0.26 | ) |
| | | | | | | | | | | | | | | | | | | | | | | | | | | | |
Redemption and Small-Balance Account Fees | | | | | —* | | | | | | —* | | | | —* | | | | 0.01 | | | | —* | | | | 0.01 | |
| | | | | | | | | | | | | | | | | | | | | | | | | | | | |
Net Asset Value, End of Period | | | | $ | 19.73 | | | | | $ | 20.32 | | | $ | 21.00 | | | $ | 19.24 | | | $ | 15.48 | | | $ | 14.15 | |
| | | | | | | | |
| | | | | | | | | | | | | | | | | | | | | | | |
Total Return(3)(4) | | | | | (2.85 | %) | | | | | (1.13 | %) | | | 10.43 | % | | | 25.14 | % | | | 10.21 | % | | | 1.91 | % |
Net Assets, End of Period (thousands) | | | | $ | 360,444 | | | | | $ | 393,611 | | | $ | 413,624 | | | $ | 354,081 | | | $ | 227,881 | | | $ | 198,232 | |
Ratios/Supplemental Data | | | | | | | | | | | | | | | | | | | | | | | | | | | | |
Ratio of Expenses to Average Net Assets | | | | | 1.15 | % | | | | | 1.15 | % | | | 1.26 | % | | | 1.36 | % | | | 1.47 | % | | | 1.43 | % |
Ratio of Expenses to Average Net Assets (Before Waivers and Reimbursement of Expenses and/or Recapture of Previously Waived Fees) | | | | | 1.15 | % | | | | | 1.13 | % | | | 1.23 | % | | | 1.37 | % | | | 1.54 | % | | | 1.58 | % |
The accompanying notes are an integral part of these financial statements.
| | | | |
| 22 | | | | Motley Fool Independence Fund |
Financial Highlights
| | | | | | | | | | | | | | | | | | | | | | |
| | |
| | | Six
Months Ended April 30, 2016 | | | Years Ended October 31, | |
| | | | | | |
| Investor Shares | | (Unaudited)(1) | | | 2015 | | | | 2014 | | | | 2013 | | | | 2012 | | | | 2011 | |
Ratio of Net Investment Income (Loss) to Average Net Assets | | 0.15% | | | 0.23 | % | | | 0.55 | % | | | 0.44 | % | | | 0.93 | % | | | 0.76% | |
Ratio of Net Investment Income (Loss) to Average Net Assets (Before Waivers and Reimbursement of Expenses and/or Recapture of Previously Waived Fees) | | 0.15% | | | 0.25 | % | | | 0.59 | % | | | 0.43 | % | | | 0.86 | % | | | 0.61% | |
Portfolio Turnover | | 16% | | | 21 | % | | | 24 | % | | | 22 | % | | | 37 | % | | | 37% | |
| * | Amount represents less than $0.005 per share. |
| (1) | For the six months ended April 30, 2016, all ratios for the period have been annualized. Total return and portfolio turnover for the period have not been annualized. |
| (2) | Per share data calculated using average shares outstanding method. |
| (3) | During the years ended October 31, 2013 and October 31, 2011, 0.06% and 0.07%, respectively, of the Fund’s total return was attributable to redemption and small-balance account fees received as referenced in Note 4. Excluding this item, the total return would have been 25.08% and 1.84%, respectively. For the six months ended April 30, 2016 and the years ended October 31, 2015, October 31, 2014 and October 31, 2012, redemption and small-balance account fees received had no effect on the Fund’s total return. |
| (4) | Total return reflects the rate an investor would have earned on an investment in the Fund during the period. |
The accompanying notes are an integral part of these financial statements.
| | | | |
| Motley Fool Independence Fund | | | | 23 |
Financial Highlights
| | | | | | | | | | | | | | | | | | | | | | |
| | | |
| | | Six Months Ended April 30, 2016 | | Year Ended October 31, | | Period Ended October 31, | |
| | | | | |
Institutional Shares | | (Unaudited)(1) | | | | | 2015 | | | | | 2014(2)(3) | |
| | | | | | | | |
Net Asset Value, Beginning of Period | | | | $ | 20.35 | | | | | | | $ | 21.01 | | | | | | | $ | 20.36 | |
Income (Loss) From Investment Operations | | | | | | | | | | | | | | | | | | | | | | |
Net Investment Income (Loss)(4) | | | | | 0.03 | | | | | | | | 0.10 | | | | | | | | 0.03 | |
Net Gain (Loss) on Securities (Realized and Unrealized) | | | | | (0.58 | ) | | | | | | | (0.31 | ) | | | | | | | 0.62 | |
Total From Investment Operations | | | | | (0.55 | ) | | | | | | | (0.21 | ) | | | | | | | 0.65 | |
Less Distributions | | | | | | | | | | | | | | | | | | | | | | |
Net Investment Income | | | | | (0.04 | ) | | | | | | | (0.12 | ) | | | | | | | — | |
Net Realized Capital Gains | | | | | (0.01 | ) | | | | | | | (0.33 | ) | | | | | | | — | |
Total Distributions | | | | | (0.05 | ) | | | | | | | (0.45 | ) | | | | | | | — | |
Redemption and Small-Balance Account Fees | | | | | —* | | | | | | | | —* | | | | | | | | — | |
Net Asset Value, End of Period | | | | $ | 19.75 | | | | | | | $ | 20.35 | | | | | | | $ | 21.01 | |
| | | | | | | | |
| | | | | | | | | | | | | | | | | | | | |
Total Return(5) | | | | | (2.73 | %) | | | | | | | (0.97 | %) | | | | | | | 3.19 | % |
Net Assets, End of Period (thousands) | | | | $ | 7,266 | | | | | | | $ | 7,726 | | | | | | | $ | 4,038 | |
| | | | | | | | |
Ratios/Supplemental Data | | | | | | | | | | | | | | | | | | | | | | |
| | | | | | | | |
Ratio of Expenses to Average Net Assets | | | | | 0.95 | % | | | | | | | 0.95 | % | | | | | | | 0.95 | % |
Ratio of Expenses to Average Net Assets (Before Waivers and Reimbursement of Expenses and/or Recapture of Previously Waived Fees) | | | | | 2.01 | % | | | | | | | 2.14 | % | | | | | | | 3.78 | % |
Ratio of Net Investment Income (Loss) to Average Net Assets | | | | | 0.35 | % | | | | | | | 0.46 | % | | | | | | | 0.39 | % |
Ratio of Net Investment Income (Loss) to Average Net Assets (Before Waivers and Reimbursement of Expenses and/or Recapture of Previously Waived Fees) | | | | | (0.71 | %) | | | | | | | (0.73 | %) | | | | | | | (2.43 | %) |
Portfolio Turnover | | | | | 16 | % | | | | | | | 21 | % | | | | | | | 24 | % |
| * | Amount represents less than $0.005 per share. |
| (1) | For the six months ended April 30, 2016, all ratios for the period have been annualized. Total return and portfolio turnover for the period have not been annualized. |
| (2) | Commenced operations on June 17, 2014. All ratios for the period have been annualized. Total return for the period has not been annualized. |
| (3) | Because of commencement of operations and related preliminary transaction costs, these ratios are not necessary indicative of future ratios. |
| (4) | Per share data calculated using average shares outstanding method. |
| (5) | Total return reflects the rate an investor would have earned on an investment in the Fund during the period. |
The accompanying notes are an integral part of these financial statements.
| | | | |
| 24 | | | | Motley Fool Independence Fund |
Motley Fool Great America Fund Portfolio Characteristics (Unaudited)
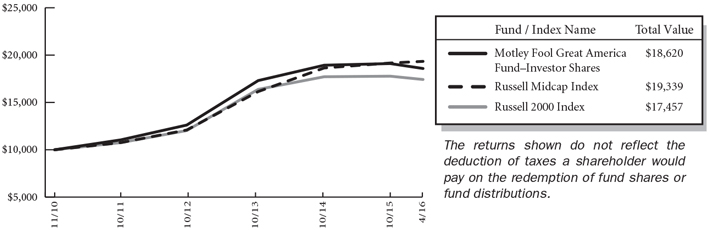
At April 30, 2016, the Motley Fool Great America Fund Investor Shares had an unaudited net asset value of $18.22 per share attributed to 12,134,363 shares outstanding and the Institutional Shares had an unaudited net asset value of $18.24 per share attributed to 330,303 shares outstanding. This compares with an unaudited net asset value as of November 1, 2010 for the Investor Shares of $10.00 per share attributed to 102,000 shares outstanding and as of June 17, 2014 for the Institutional Shares of $17.94 per share attributed to 1 share outstanding. From the Investor Shares launch on November 1, 2010 to April 30, 2016, the Shares had an average annual total return of 11.98% versus a return of 12.76% over the same period for its benchmark, Russell Midcap Index. Over the same period, the Russell 2000 Index returned 10.66%. From June 17, 2014 to April 30, 2016 the Institutional Shares returned 1.21%, versus a return of 3.39% over the same period for the Russell Midcap Index. Over the same period, the Russell 2000 Index returned -0.60%.
The graph below shows the performance of $10,000 invested in the Investor Shares at inception. The results shown below do not reflect the deduction of taxes that a shareholder would pay on fund distributions or the redemption of fund shares.
|
Average Annual Total Returns as of 04/30/2016 |
| | | | | | | | |
| | One Year | | Five Year | | Since
Inception | | Inception Date |
Investor Shares* | | -6.91% | | 9.18% | | 11.98% | | 11/1/2010 |
Institutional Shares* | | -6.75% | | — | | 1.21% | | 6/17/2014 |
Russell Midcap Index** | | -2.14% | | 9.88% | | — (1) | | — |
Russell 2000 Index*** | | -6.01% | | 6.99% | | — (2) | | — |
Fund Expense Ratios(3): Investor Shares: Gross 1.16% and Net 1.15%; Institutional Shares: Gross 2.45% and Net 0.95% |
The performance data quoted represents past performance and does not guarantee future results. Current performance may be lower or higher. Performance data current to the most recent month-end may be obtained at www.FoolFunds.com. The investment return and principal value of an investment will fluctuate so that shares, when redeemed, may be worth more or less than their original cost.
(1)The index returned 12.76% from the inception date of the Investor Shares and 3.39% from the inception date of the Institutional Shares.
(2)The index returned 10.66% from the inception date of the Investor Shares and -0.60% from the inception date of the Institutional Shares.
(3)The expense ratios of the Fund are set forth according to the 2/29/16 Prospectus for the Fund and may differ from the expense ratios disclosed in the Financial Highlights tables in this report. See the Financial Highlights for more current expense ratios.
*These returns reflect expense waivers by the Fund’s investment adviser. Without these waivers, returns would have been lower.
| | | | |
| Motley Fool Great America Fund | | | | 25 |
**The Russell Midcap Index is an unmanaged, free float-adjusted, market capitalization weighted index that is designed to measure the performance of the mid-cap segment of the U.S. equity universe. The Russell Midcap Index is a subset of the Russell 1000® Index. It includes approximately 800 of the smallest securities based on a combination of their market cap and current index membership. The Russell Midcap Index represents approximately 31% of the total market capitalization of the Russell 1000 companies. The Fund may invest in companies that are not included within the Russell Midcap Index and its investment portfolio is not weighted in terms of issuers the same as the Russell Midcap Index. For this reason, the Fund’s investment performance should not be expected to track, and may exceed or trail, the Russell Midcap Index.
***The Russell 2000 Index is an unmanaged, free float-adjusted, market capitalization weighted index that is designed to measure the performance of the small-cap segment of the U.S. equity universe. The Russell 2000 Index is a subset of the Russell 3000 Index. It includes approximately 2,000 of the smallest securities based on a combination of their market cap and current index membership. The Fund may invest in companies that are not included within the Russell 2000 Index and its investment portfolio is not weighted in terms of issuers the same as the Russell 2000 Index. For this reason, the Fund’s investment performance should not be expected to track, and may exceed or trail, the Russell 2000 Index.
The investment objective of the Great America Fund is to achieve long-term capital appreciation. The Fund pursues this objective by investing primarily in common stocks of companies organized in the United States. The Fund employs a value-based investment strategy and seeks long-term growth of capital by acquiring securities of companies at prices the investment adviser, Motley Fool Asset Management, LLC (the “Adviser”), believes to be significantly below their intrinsic value. The Fund may invest in other types of securities and in other asset classes when, in the judgment of the Adviser, such investments offer attractive potential returns. As such, the Fund’s performance will deviate significantly from its benchmark from time to time. It is the view of the Adviser that this deviation is less meaningful over shorter time frames and is more relevant over multi-year periods.
Although the Great America Fund may invest in companies with any market capitalization, the Adviser expects that investments in the securities of companies having smaller- and mid-market capitalizations will be important components of the Fund’s investment program. Investments in securities of these companies may involve greater risk than do investments in larger, more established companies. Small-and mid-cap stocks tend to be more volatile and less liquid than their large-cap counterparts. You are strongly encouraged to read more about the Fund’s strategies and risks in the prospectus.
The Great America Fund invests in securities of companies the Adviser believes are undervalued. Unlike mutual funds that hew to their benchmark, the Fund may invest in any company, industry or sector where the Adviser’s analysis suggests that there is opportunity for gains that outweigh risks. In identifying investments for the Fund, the Adviser looks for companies it believes the market has irrationally undervalued and looks for companies that have high-quality businesses with strong market positions, manageable leverage, and robust streams of free cash flow. The following tables show the top eleven holdings and sectors in which the Fund was invested as of April 30, 2016. Portfolio holdings are subject to change without notice.
|
 Certain mutual fund ratings and review services have created style boxes, which look more or less like a tic-tac-toe board; arranging funds by the size of the companies they typically invest in (large-, mid-, and small-cap) along one axis, and along a“value” to “growth” basis on the other axis. This may be a helpful way – at times – to think about certain investment opportunities, but we don’t believe we’ll improve your returns by limiting ourselves to any one portion of that style box. Certain mutual fund ratings and review services have created style boxes, which look more or less like a tic-tac-toe board; arranging funds by the size of the companies they typically invest in (large-, mid-, and small-cap) along one axis, and along a“value” to “growth” basis on the other axis. This may be a helpful way – at times – to think about certain investment opportunities, but we don’t believe we’ll improve your returns by limiting ourselves to any one portion of that style box.
|
| | | | |
Top Eleven Holdings* | | % of Net
Assets | |
| |
| | | | | |
Tractor Supply Co. | | | 3.58 | % |
Markel Corp. | | | 3.37 | |
| | | | |
| 26 | | | | Motley Fool Great America Fund |
| | | | | |
Top Eleven Holdings* | | % of Net
Assets |
| |
| | | | | | |
Texas Roadhouse, Inc. | | | | 3.32 | |
Thor Industries, Inc. | | | | 3.24 | |
Infinera Corp. | | | | 3.12 | |
Drew Industries, Inc. | | | | 3.04 | |
American Woodmark Corp. | | | | 2.91 | |
Oaktree Capital Group LLC | | | | 2.79 | |
XPO Logistics, Inc. | | | | 2.52 | |
SBA Communications Corp. Class A | | | | 2.50 | |
AutoZone, Inc. | | | | 2.46 | |
| | | | | |
| | | | 32.85 | % |
| | | | | |
| | | | | |
* As of the date of the report, the fund had a holding of 3.53% in the BNY Mellon Cash Reserve.
The Motley Fool Great America Fund uses the Global Industry Classification StandardSM (“GICSSM”) as the basis for the classification of securities on the Schedule of Investments (“SOI”). We believe that this makes the SOI classifications more standard with the rest of the industry.
| | | | | |
Sector Allocation | | % of Net
Assets |
| |
| | | | | | |
Consumer Discretionary | | | | 33.13 | % |
Health Care | | | | 16.97 | |
Financials | | | | 15.23 | |
Industrials | | | | 13.15 | |
Information Technology | | | | 6.88 | |
Telecommunication Services | | | | 3.70 | |
Consumer Staples | | | | 2.13 | |
Materials | | | | 1.69 | |
| | | | | |
| | | | 92.88 | % |
| | | | | |
| | | | | |
| | | | |
| Motley Fool Great America Fund | | | | 27 |
About Your Expenses
As a shareholder of the Great America Fund, you incur ongoing costs, including advisory fees and other Fund expenses. This example is intended to help you to understand your ongoing costs (in dollars) of investing in the Fund and to compare these costs with the ongoing costs of investing in other mutual funds. It is based on an investment of $1,000 invested at the beginning of the period and held for the entire period from November 1, 2015 to April 30, 2016.
Actual Expenses
The first section of the table below provides information about actual account values and actual expenses. You may use the information in this section, together with the amount you invested, to estimate the expenses that you incurred over the period. Simply divide your account value by $1,000 (for example, an $8,600 account value divided by $1,000 = 8.6), then multiply the result by the number in the first section under the heading entitled “Expenses Paid During Period” to estimate the expenses attributable to your investment during this period.
Hypothetical Example for Comparison Purposes
The second section of the table below provides information about hypothetical account values and hypothetical expenses based on the Fund’s actual expense ratio and an assumed rate of return of 5% per year before expenses, which is not the Fund’s actual return. Thus, you should not use the hypothetical account values and expenses to estimate the actual ending account balance or your expenses for the period. Rather, these figures are provided to enable you to compare the ongoing costs of investing in the Fund as compared to the costs of investing in other funds. To do so, compare this 5% hypothetical example with the 5% hypothetical examples that appear in the shareholder reports of the other funds. Please note that the expenses shown in the table are meant to highlight your ongoing costs only. Therefore, the second section of the table is useful in comparing ongoing costs only and will not help you determine the relative total costs of owning different funds.
| | |
 Do you know how many times a fund, or the market, has returned a smooth 5% over a long period of time? Never. But we have to pick some example. In reality, the market’s returns are always far bumpier, with the market returning 20% one year, followed by a loss of 10% the next year, followed by a 3% gain, etc. These variations affect actual expenses as well. Happily, over almost all time periods of 20 years or longer, according to the research of University of Pennsylvania’s Jeremy Siegel and others, the domestic market’s returns have been at least 5% per year on average. Do you know how many times a fund, or the market, has returned a smooth 5% over a long period of time? Never. But we have to pick some example. In reality, the market’s returns are always far bumpier, with the market returning 20% one year, followed by a loss of 10% the next year, followed by a 3% gain, etc. These variations affect actual expenses as well. Happily, over almost all time periods of 20 years or longer, according to the research of University of Pennsylvania’s Jeremy Siegel and others, the domestic market’s returns have been at least 5% per year on average.
| | |
| | | | | | | | | | | | | | | | | | | | |
| | | Beginning
Account
Value
11/01/15 | | Ending
Account
Value
4/30/16 | | Annualized
Expense
Ratio(1) | | Expenses
Paid
During
Period(2) |
| | | | |
| | | | | | | | | | | | | | | | | | | | | |
Investor Shares | | | | | | | | | | | | | | | | | | | | |
Actual | | | $ | 1,000 | | | | $ | 974.73 | | | | | 1.15 | % | | | $ | 5.65 | |
Hypothetical | | | $ | 1,000 | | | | $ | 1,019.14 | | | | | 1.15 | % | | | $ | 5.77 | |
Institutional Shares | | | | | | | | | | | | | | | | | | | | |
Actual | | | $ | 1,000 | | | | $ | 975.73 | | | | | 0.95 | % | | | $ | 4.67 | |
Hypothetical | | | $ | 1,000 | | | | $ | 1,020.14 | | | | | 0.95 | % | | | $ | 4.77 | |
| (1) | These ratios reflect expenses waived by the Fund’s investment adviser. Without these Waivers, the Fund’s expenses would have been higher and the ending account values would have been lower. |
| (2) | Expenses are equal to the Fund’s annualized expense ratio for the period November 1, 2015 to April 30, 2016, multiplied by the average account value over the period, multiplied by the number of days (182) in the most recent fiscal half-year, then divided by 366. |
| | | | |
| 28 | | | | Motley Fool Great America Fund (Unaudited) |
The Motley Fool Funds Trust
Motley Fool Great America Fund
Schedule of Investments
April 30, 2016
(Unaudited)
| | | | | | | | | | |
Issues | | Shares | | Value (Note 2) |
| | |
| | | | | | | | | | | |
Equity Securities — 92.87% | | | | | | | | | | |
Air Freight & Logistics — 3.96% | | | | | | | | | | |
CH Robinson Worldwide, Inc. (United States) | | | | 46,000 | | | | $ | 3,264,620 | |
XPO Logistics, Inc. (United States)* | | | | 190,000 | | | | | 5,726,600 | |
| | | | | | | | | | |
| | | | | | | | | 8,991,220 | |
| | | | | | | | | | |
| | |
Airlines — 0.70% | | | | | | | | | | |
Spirit Airlines, Inc. (United States)* | | | | 36,000 | | | | | 1,581,480 | |
| | | | | | | | | | |
| | |
Auto Components — 7.00% | | | | | | | | | | |
Drew Industries, Inc. (United States) | | | | 106,370 | | | | | 6,895,967 | |
Gentex Corp. (United States) | | | | 340,000 | | | | | 5,453,600 | |
Horizon Global Corp. (United States)* | | | | 289,918 | | | | | 3,557,289 | |
| | | | | | | | | | |
| | | | | | | | | 15,906,856 | |
| | | | | | | | | | |
| | |
Automobiles — 3.24% | | | | | | | | | | |
Thor Industries, Inc. (United States) | | | | 115,000 | | | | | 7,362,300 | |
| | | | | | | | | | |
| | |
Banks — 3.21% | | | | | | | | | | |
Access National Corp. (United States) | | | | 90,529 | | | | | 1,779,800 | |
Monarch Financial Holdings, Inc. (United States) | | | | 300,190 | | | | | 5,520,494 | |
| | | | | | | | | | |
| | | | | | | | | 7,300,294 | |
| | | | | | | | | | |
| | |
Beverages — 2.11% | | | | | | | | | | |
Boston Beer, Co., Inc. (The) Class A (United States)* | | | | 16,120 | | | | | 2,516,010 | |
Crimson Wine Group Ltd. (United States)* | | | | 269,023 | | | | | 2,286,668 | |
| | | | | | | | | | |
| | | | | | | | | 4,802,678 | |
| | | | | | | | | | |
| | |
Biotechnology — 3.65% | | | | | | | | | | |
Genomic Health, Inc. (United States)* | | | | 131,935 | | | | | 3,467,252 | |
Ionis Pharmaceuticals, Inc. (United States)* | | | | 50,000 | | | | | 2,048,500 | |
Myriad Genetics, Inc. (United States)* | | | | 77,000 | | | | | 2,772,000 | |
| | | | | | | | | | |
| | | | | | | | | 8,287,752 | |
| | | | | | | | | | |
| | |
Building Products — 2.91% | | | | | | | | | | |
American Woodmark Corp. (United States)* | | | | 90,636 | | | | | 6,601,926 | |
| | | | | | | | | | |
| | |
Capital Markets — 5.03% | | | | | | | | | | |
Diamond Hill Investment Group, Inc. (United States) | | | | 29,023 | | | | | 5,086,571 | |
Oaktree Capital Group LLC (United States) | | | | 131,072 | | | | | 6,332,088 | |
| | | | | | | | | | |
| | | | | | | | | 11,418,659 | |
| | | | | | | | | | |
See Notes to Financial Statements.
| | | | |
| Motley Fool Great America Fund | | | | 29 |
| | | | | | | | | | |
Issues | | Shares | | Value (Note 2) |
| | |
| | | | | | | | | | | |
Equity Securities (continued) | | | | | | | | | | |
Chemicals — 0.92% | | | | | | | | | | |
Innophos Holdings, Inc. (United States) | | | | 56,437 | | | | $ | 2,085,912 | |
| | | | | | | | | | |
| | |
Commercial Services & Supplies — 1.41% | | | | | | | | | | |
KAR Auction Services, Inc. (United States) | | | | 85,000 | | | | | 3,196,000 | |
| | | | | | | | | | |
| | |
Communications Equipment — 3.11% | | | | | | | | | | |
Infinera Corp. (United States)* | | | | 595,000 | | | | | 7,074,550 | |
| | | | | | | | | | |
| | |
Diversified Financial Services — 0.38% | | | | | | | | | | |
Leucadia National Corp. (United States) | | | | 51,995 | | | | | 867,277 | |
| | | | | | | | | | |
| | |
Diversified Telecommunication Services — 1.21% | | | | | | | | | | |
Level 3 Communications, Inc. (United States)* | | | | 52,418 | | | | | 2,739,365 | |
| | | | | | | | | | |
| | |
Electronic Equipment, Instruments & Components — 2.37% | | | | | | | | | | |
IPG Photonics Corp. (United States)* | | | | 62,000 | | | | | 5,373,540 | |
| | | | | | | | | | |
| | |
Health Care Equipment & Supplies — 11.29% | | | | | | | | | | |
Align Technology, Inc. (United States)* | | | | 49,500 | | | | | 3,573,405 | |
Cooper Companies, Inc. (The) (United States) | | | | 26,000 | | | | | 3,980,080 | |
Natus Medical, Inc. (United States)* | | | | 162,841 | | | | | 5,189,743 | |
Tandem Diabetes Care, Inc. (United States)* | | | | 390,000 | | | | | 4,340,700 | |
Varian Medical Systems, Inc. (United States)* | | | | 67,000 | | | | | 5,439,060 | |
Zimmer Biomet Holdings, Inc. (United States) | | | | 27,000 | | | | | 3,125,790 | |
| | | | | | | | | | |
| | | | | | | | | 25,648,778 | |
| | | | | | | | | | |
| | |
Hotels, Restaurants & Leisure — 7.48% | | | | | | | | | | |
Chipotle Mexican Grill, Inc. (United States)* | | | | 7,000 | | | | | 2,946,790 | |
Panera Bread Co. Class A (United States)* | | | | 18,000 | | | | | 3,860,820 | |
Texas Roadhouse, Inc. (United States) | | | | 184,929 | | | | | 7,530,309 | |
Wynn Resorts Ltd. (United States) | | | | 30,000 | | | | | 2,649,000 | |
| | | | | | | | | | |
| | | | | | | | | 16,986,919 | |
| | | | | | | | | | |
| | |
Household Durables — 1.02% | | | | | | | | | | |
TRI Pointe Group, Inc. (United States)* | | | | 200,000 | | | | | 2,320,000 | |
| | | | | | | | | | |
| | |
Household Products — 0.01% | | | | | | | | | | |
Church & Dwight, Co., Inc. (United States) | | | | 300 | | | | | 27,810 | |
| | | | | | | | | | |
| | |
Industrials - Machinery — 1.05% | | | | | | | | | | |
Proto Labs, Inc. (United States)* | | | | 40,000 | | | | | 2,393,200 | |
| | | | | | | | | | |
| | |
Insurance — 5.16% | | | | | | | | | | |
Loews Corp. (United States) | | | | 102,500 | | | | | 4,067,200 | |
Markel Corp. (United States)* | | | | 8,500 | | | | | 7,642,435 | |
| | | | | | | | | | |
| | | | | | | | | 11,709,635 | |
| | | | | | | | | | |
See Notes to Financial Statements.
| | | | |
| 30 | | | | Motley Fool Great America Fund |
| | | | | | | | | | |
Issues | | Shares | | Value (Note 2) |
| | |
| | | | | | | | | | | |
Equity Securities (continued) | | | | | | | | | | |
Internet & Catalog Retail — 2.51% | | | | | | | | | | |
Liberty Interactive Corp. QVC Group Class A (United States)* | | | | 89,000 | | | | $ | 2,331,800 | |
TripAdvisor, Inc. (United States)* | | | | 52,000 | | | | | 3,358,680 | |
| | | | | | | | | | |
| | | | | | | | | 5,690,480 | |
| | | | | | | | | | |
| | |
Leisure Products — 1.72% | | | | | | | | | | |
Polaris Industries, Inc. (United States) | | | | 40,000 | | | | | 3,915,200 | |
| | | | | | | | | | |
| | |
Machinery — 1.04% | | | | | | | | | | |
TriMas Corp. (United States)* | | | | 130,094 | | | | | 2,354,701 | |
| | | | | | | | | | |
| | |
Paper & Forest Products — 0.77% | | | | | | | | | | |
KapStone Paper and Packaging Corp. (United States) | | | | 110,400 | | | | | 1,754,256 | |
| | | | | | | | | | |
| | |
Real Estate Investment Trusts — 1.45% | | | | | | | | | | |
STAG Industrial, Inc. (United States) | | | | 165,000 | | | | | 3,293,400 | |
| | | | | | | | | | |
| | |
Road & Rail — 1.43% | | | | | | | | | | |
Genesee & Wyoming, Inc. Class A (United States)* | | | | 50,000 | | | | | 3,255,500 | |
| | | | | | | | | | |
| | |
Software — 1.39% | | | | | | | | | | |
Ansys, Inc. (United States)* | | | | 250 | | | | | 22,693 | |
Ultimate Software Group, Inc. (The) (United States)* | | | | 16,000 | | | | | 3,145,440 | |
| | | | | | | | | | |
| | | | | | | | | 3,168,133 | |
| | | | | | | | | | |
| | |
Specialty Retail — 7.77% | | | | | | | | | | |
AutoZone, Inc. (United States)* | | | | 7,300 | | | | | 5,586,179 | |
Cabela’s, Inc. (United States)* | | | | 75,000 | | | | | 3,911,250 | |
Tractor Supply Co. (United States) | | | | 86,000 | | | | | 8,140,760 | |
| | | | | | | | | | |
| | | | | | | | | 17,638,189 | |
| | | | | | | | | | |
| | |
Textiles, Apparel & Luxury Goods — 2.39% | | | | | | | | | | |
Under Armour, Inc. Class A (United States)* | | | | 64,000 | | | | | 2,812,160 | |
Under Armour, Inc. Class C (United States)* | | | | 64,000 | | | | | 2,611,200 | |
| | | | | | | | | | |
| | | | | | | | | 5,423,360 | |
| | | | | | | | | | |
| | |
Trading Companies & Distributors — 2.68% | | | | | | | | | | |
Aceto Corp. (United States) | | | | 205,000 | | | | | 4,598,150 | |
Fastenal Co. (United States) | | | | 31,750 | | | | | 1,485,582 | |
| | | | | | | | | | |
| | | | | | | | | 6,083,732 | |
| | | | | | | | | | |
| | |
Wireless Telecommunication Services — 2.50% | | | | | | | | | | |
SBA Communications Corp. Class A (United States)* | | | | 55,000 | | | | | 5,667,200 | |
| | | | | | | | | | |
Total Equity Securities (Cost $ 163,988,013) | | | | | | | | | 210,920,302 | |
| | | | | | | | | | |
See Notes to Financial Statements.
| | | | |
| Motley Fool Great America Fund | | | | 31 |
| | | | | | | | |
Issues | | Shares | | | Value (Note 2) | |
| | |
| | | | | | | | | |
Other Investments — 3.53% | | | | | | | | |
Temporary Cash Investment — 3.53% | | | | | | | | |
BNY Mellon Cash Reserve | | | 8,016,619 | | | $ | 8,016,619 | |
| | | | | | | | |
Total Other Investments (Cost $ 8,016,619) | | | | | | | 8,016,619 | |
| | | | | | | | |
Total Investment Portfolio (Cost $ 172,004,632) — 96.40% | | | | | | | 218,936,921 | |
Assets in Excess of Other Liabilities — 3.60% | | | | | | | 8,165,077 | |
| | | | | | | | |
NET ASSETS — 100.00% | | | | | | | | |
(Applicable to 12,464,666 shares outstanding) | | | | | | $ | 227,101,998 | |
| | | | | | | | |
| | | | | | | | |
| * | Non-income producing security. |
See Notes to Financial Statements.
| | | | |
| 32 | | | | Motley Fool Great America Fund |
Statement of Assets and Liabilities
| | | | | | | | | | |
| | | As of April 30, 2016
(Unaudited) | | |
| | |
| | | | | | | | | |
Assets: | | | | | | | |
| | |
Investments in securities of unaffiliated issuers, at value (at cost, $172,004,632) | | | $ | 218,936,921 | | | |
Receivables: | | | | | | | |
Dividends | | | | 65,822 | | | |
Investment securities sold | | | | 8,828,849 | | | |
Shares of beneficial interest sold | | | | 69,709 | | | |
Prepaid expenses and other assets | | | | 51,446 | | | |
| | | | | | | | |
Total Assets | | | | 227,952,747 | | | |
| | | | | | | | |
| | |
Liabilities | | | | | | | |
Payables: | | | | | | | |
Shares of beneficial interest redeemed | | | | 521,181 | | | |
Accrued expenses: | | | | | | | |
Audit fees | | | | 9,667 | | | |
Accounting and administration fees | | | | 69,952 | | | |
Advisory fees | | | | 149,569 | | | |
Custodian fees | | | | 5,244 | | | |
Transfer agent fees | | | | 33,336 | | | |
Trustee fees | | | | 539 | | | |
Other expenses | | | | 61,261 | | | |
| | | | | | | | |
Total Liabilities | | | | 850,749 | | | |
| | | | | | | | |
Net Assets | | | $ | 227,101,998 | | | |
| | | | | | | | |
| | | | | | | | |
The accompanying notes are an integral part of these financial statements.
| | | | |
| Motley Fool Great America Fund | | | | 33 |
Statement of Assets and Liabilities
| | | | | | | | | | |
| | | As of April 30, 2016
(Unaudited) | | |
| | |
| | | | | | | | | |
| | |
Net Assets Consist of: | | | | | | | |
Paid-in-Capital | | | $ | 177,828,829 | | | |
Accumulated Net Investment Income | | | | (212,584 | ) | | |
Accumulated Net Realized Gain on Investments | | | | 2,553,464 | | | |
Net Unrealized Appreciation/(Depreciation) on Investments | | | | 46,932,289 | | | |
| | | | | | | | |
Net Assets | | | $ | 227,101,998 | | | |
| | | | | | | | |
| | | | | | | | |
| | |
Net Asset Value: | | | | | | | |
$0.001 par value, unlimited shares authorized | | | | | | | |
Investor Shares: | | | | | | | |
Net assets applicable to capital shares outstanding | | | $ | 221,076,074 | | | |
Shares outstanding | | | | 12,134,363 | | | |
| | | | | | | | |
Net asset value, offering, and redemption price per share* | | | $ | 18.22 | | | |
| | | | | | | | |
| | | | | | | | |
| | |
Institutional Shares: | | | | | | | |
Net assets applicable to capital shares outstanding | | | $ | 6,025,924 | | | |
Shares outstanding | | | | 330,303 | | | |
| | | | | | | | |
Net asset value, offering, and redemption price per share* | | | $ | 18.24 | | | |
| | | | | | | | |
| | | | | | | | |
| * | A charge of 2% is imposed on the redemption proceeds of shares redeemed or exchanged within 90 days of purchase. |
The accompanying notes are an integral part of these financial statements.
| | | | |
| 34 | | | | Motley Fool Great America Fund |
Statement of Operations
| | | | | | | | | | |
| | | Six-Months Ended
April 30, 2016
(Unaudited) | | |
| | |
| | | | | | | | | |
| | |
Investment Income | | | | | | | |
Dividends | | | $ | 1,179,497 | | | |
Interest | | | | 519 | | | |
| | | | | | | | |
Total Investment Income | | | | 1,180,016 | | | |
| | | | | | | | |
| | |
Expenses | | | | | | | |
Accounting and administration fees | | | | 118,343 | | | |
Blue sky fees | | | | 11,679 | | | |
Shareholder account-related services - Investor Shares | | | | 91,671 | | | |
Shareholder account-related services - Institutional Shares | | | | 3,309 | | | |
Chief Compliance Officer fees | | | | 12,708 | | | |
Custodian fees | | | | 10,561 | | | |
Investment advisory fees | | | | 974,450 | | | |
Professional fees | | | | 22,003 | | | |
Shareholder reporting fees | | | | 14,369 | | | |
Transfer agent fees - Investor Shares | | | | 74,081 | | | |
Transfer agent fees - Institutional Shares | | | | 19,254 | | | |
Trustee fees | | | | 18,649 | | | |
Other expenses | | | | 9,788 | | | |
| | | | | | | | |
Total expenses | | | | 1,380,865 | | | |
| | | | | | | | |
Expenses waived/reimbursed net of amount recaptured - Investor Shares | | | | (29,779 | ) | | |
Expenses waived/reimbursed net of amount recaptured - Institutional Shares | | | | (39,018 | ) | | |
| | | | | | | | |
Net expenses | | | | 1,312,068 | | | |
| | | | | | | | |
Net Investment Income (Loss) | | | | (132,052 | ) | | |
| | | | | | | | |
| | |
Realized and Unrealized Gain (Loss) | | | | | | | |
Net realized gain (loss) from: | | | | | | | |
Investment securities | | | | 3,063,035 | | | |
| | | | | | | | |
Net realized gain (loss) on investments | | | | 3,063,035 | | | |
| | | | | | | | |
| | |
Change in net unrealized appreciation/(depreciation) on: | | | | | | | |
Investment securities | | | | (9,420,154 | ) | | |
| | | | | | | | |
Change in net unrealized appreciation/(depreciation) on investments | | | | (9,420,154 | ) | | |
| | | | | | | | |
Net realized and unrealized gain (loss) | | | | (6,357,119 | ) | | |
| | | | | | | | |
| | |
Net Increase (Decrease) in Net Assets Resulting from Operations | | | $ | (6,489,171 | ) | | |
| | | | | | | | |
| | | | | | | | |
The accompanying notes are an integral part of these financial statements.
| | | | |
| Motley Fool Great America Fund | | | | 35 |
Statements of Changes in Net Assets
| | | | | | | | | | | | |
| | | Six-Months Ended April 30, 2016 (Unaudited) | | | | | Year Ended October 31, 2015 | | | |
| | | | |
| | | | | | | | | | | | | |
| | | | |
Operations: | | | | | | | | | | | | |
Net Investment Income (Loss) | | $ | (132,052 | ) | | | | $ | 454,793 | | | |
Net Realized Gain (Loss) on Investments | | | 3,063,035 | | | | | | 953,108 | | | |
Change in Net Unrealized Appreciation/(Depreciation) on Investments | | | (9,420,154 | ) | | | | | (108,297 | ) | | |
| | | | | | | | | | | | |
Net increase (decrease) in net assets resulting from operations | | | (6,489,171 | ) | | | | | 1,299,604 | | | |
| | | | | | | | | | | | |
| | | | |
Dividends to Shareholders: | | | | | | | | | | | | |
Dividends from net investment income | | | | | | | | | | | | |
Investor Shares | | | (349,750 | ) | | | | | (510,810 | ) | | |
Institutional Shares | | | (20,359 | ) | | | | | (11,463 | ) | | |
Distributions from net realized capital gains | | | | | | | | | | | | |
Investor Shares | | | — | | | | | | — | | | |
Institutional Shares | | | — | | | | | | — | | | |
| | | | | | | | | | | | |
Total dividends and distributions | | | (370,109 | ) | | | | | (522,273 | ) | | |
| | | | | | | | | | | | |
| | | | |
Capital Share Transactions: | | | | | | | | | | | | |
Proceeds from shares sold | | | | | | | | | | | | |
Investor Shares (821,732 and 2,746,354 shares, respectively) | | | 14,737,311 | | | | | | 53,268,650 | | | |
Institutional Shares (54,292 and 243,608 shares, respectively) | | | 949,682 | | | | | | 4,716,283 | | | |
Reinvestment of dividends | | | | | | | | | | | | |
Investor Shares (18,293 and 25,996 shares, respectively) | | | 343,728 | | | | | | 501,729 | | | |
Institutional Shares (1,083 and 593 shares, respectively) | | | 20,359 | | | | | | 11,463 | | | |
Value of shares redeemed | | | | | | | | | | | | |
Investor Shares (1,447,630 and 2,487,924 shares, respectively) | | | (25,828,561 | ) | | | | | (47,840,341 | ) | | |
Institutional Shares (98,859 and 20,753 shares, respectively) | | | (1,770,649 | ) | | | | | (391,356 | ) | | |
Redemption and small-balance account fees | | | | | | | | | | | | |
Investor Shares | | | 17,677 | | | | | | 50,331 | | | |
Institutional Shares | | | 175 | | | | | | 2 | | | |
| | | | | | | | | | | | |
Net increase (decrease) from capital share transactions | | | (11,530,278 | ) | | | | | 10,316,761 | | | |
| | | | | | | | | | | | |
Total increase (decrease) in net assets | | | (18,389,558 | ) | | | | | 11,094,092 | | | |
| | | | | | | | | | | | |
| | | | |
Net Assets: | | | | | | | | | | | | |
Beginning of Period | | | 245,491,556 | | | | | | 234,397,464 | | | |
| | | | | | | | | | | | |
End of Period* | | $ | 227,101,998 | | | | | $ | 245,491,556 | | | |
| | | | | | | | | | | | |
| | | | | | | | | | | | |
* Including accumulated net investment income | | $ | (212,584 | ) | | | | $ | 289,577 | | | |
| | | | | | | | | | | | |
| | | | | | | | | | | | |
The accompanying notes are an integral part of these financial statements.
| | | | |
| 36 | | | | Motley Fool Great America Fund |
Financial Highlights
(for a share outstanding throughout each period)
| | | | | | | | | | | | | | | | | | | | | | | | | | | | | | | | | | | | | | | | | | | | | | | | |
| | | Six Months Ended April 30, 2016 | | | | Years Ended October 31, | | Period Ended
October 31, |
Investor Shares | | (Unaudited)(1) | | 2015 | | 2014 | | 2013 | | 2012 | | 2011(2)(3) |
| | | | | | | | | | | | | | | | | | |
Net Asset Value, Beginning of Period | | | | $ | 18.72 | | | | | | | $ | 18.59 | | | | | | | $ | 17.25 | | | | | | | $ | 12.58 | | | | | | | $ | 11.04 | | | | | | | $ | 10.00 | | | |
Income (Loss) From Investment Operations | | | | | | | | | | | | | | | | | | | | | | | | | | | | | | | | | | | | | | | | | | | | | | | | |
Net Investment Income (Loss)(4) | | | | | (0.01 | ) | | | | | | | 0.03 | | | | | | | | 0.07 | | | | | | | | —* | | | | | | | | (0.06 | ) | | | | | | | (0.05 | ) | | |
Net Gain (Loss) on Securities (Realized and Unrealized) | | | | | (0.46 | ) | | | | | | | 0.14 | | | | | | | | 1.51 | | | | | | | | 4.69 | | | | | | | | 1.60 | | | | | | | | 1.09 | | | |
Total From Investment Operations | | | | | (0.47 | ) | | | | | | | 0.17 | | | | | | | | 1.58 | | | | | | | | 4.69 | | | | | | | | 1.54 | | | | | | | | 1.04 | | | |
Less Distributions | | | | | | | | | | | | | | | | | | | | | | | | | | | | | | | | | | | | | | | | | | | | | | | | |
Net Investment Income | | | | | (0.03 | ) | | | | | | | (0.04 | ) | | | | | | | (0.03 | ) | | | | | | | (0.03 | ) | | | | | | | —* | | | | | | | | (0.01 | ) | | |
Net Realized Capital Gains | | | | | — | | | | | | | | — | | | | | | | | (0.22 | ) | | | | | | | — | | | | | | | | — | | | | | | | | — | | | |
Total Distributions | | | | | (0.03 | ) | | | | | | | (0.04 | ) | | | | | | | (0.25 | ) | | | | | | | (0.03 | ) | | | | | | | —* | | | | | | | | (0.01 | ) | | |
Redemption and Small-Balance Account Fees | | | | | —* | | | | | | | | —* | | | | | | | | 0.01 | | | | | | | | 0.01 | | | | | | | | —* | | | | | | | | 0.01 | | | |
Net Asset Value, End of Period | | | | $ | 18.22 | | | | | | | $ | 18.72 | | | | | | | $ | 18.59 | | | | | | | $ | 17.25 | | | | | | | $ | 12.58 | | | | | | | $ | 11.04 | | | |
| | | | | | | | | | | | | | | | | | |
| | | | | | | | | | | | | | | | | | | | | | | | | | | | | | | | | | | | | | | | | | | |
Total Return(5)(6) | | | | | (2.53 | %) | | | | | | | 0.91 | % | | | | | | | 9.35 | % | | | | | | | 37.44 | % | | | | | | | 13.96 | % | | | | | | | 10.54 | % | | |
Net Assets, End of Period (thousands) | | | | $ | 221,076 | | | | | | | $ | 238,482 | | | | | | | $ | 231,600 | | | | | | | $ | 162,336 | | | | | | | $ | 67,337 | | | | | | | $ | 55,691 | | | |
Ratios/Supplemental Data | | | | | | | | | | | | | | | | | | | | | | | | | | | | | | | | | | | | | | | | | | | | | | | | |
Ratio of Expenses to Average Net Assets | | | | | 1.15 | % | | | | | | | 1.15 | % | | | | | | | 1.27 | % | | | | | | | 1.38 | % | | | | | | | 1.37 | % | | | | | | | 1.35 | % | | |
The accompanying notes are an integral part of these financial statements.
| | | | |
| Motley Fool Great America Fund | | | | 37 |
Financial Highlights
| | | | | | | | | | | | | | | | | | | | | | | | | | | | | | |
| | | Six Months Ended April 30, 2016 | | Years Ended October 31, | | Period Ended
October 31, |
Investor Shares | | (Unaudited)(1) | | 2015 | | 2014 | | 2013 | | 2012 | | 2011(2)(3) |
Ratio of Expenses to Average Net Assets (Before Waivers and Reimbursement of Expenses and/or Recapture of Previously Waived Fees) | | | | 1.18 | % | | | | 1.16 | % | | | | 1.30 | % | | | | 1.54 | % | | | | 1.74 | % | | | | 2.16 | % |
Ratio of Net Investment Income (Loss) to Average Net Assets | | | | (0.12 | %) | | | | 0.17 | % | | | | 0.38 | % | | | | 0.03 | % | | | | (0.51 | %) | | | | (0.48 | %) |
Ratio of Net Investment Income (Loss) to Average Net Assets (Before Waivers and Reimbursement of Expenses and/or Recapture of Previously Waived Fees) | | | | (0.15 | %) | | | | 0.17 | % | | | | 0.36 | % | | | | (0.13 | %) | | | | (0.88 | %) | | | | (1.29 | %) |
Portfolio Turnover | | | | 14 | % | | | | 30 | % | | | | 18 | % | | | | 24 | % | | | | 30 | % | | | | 18 | % |
| * | Amount represents less than $0.005 per share. |
| (1) | For the six months ended April 30, 2016, all ratios for the period have been annualized. Total return and portfolio turnover for the period have not been annualized. |
| (2) | Because of commencement of operations and related preliminary transaction costs, these ratios are not necessarily indicative of future ratios. |
| (3) | Inception date of the Great America Fund was November 1, 2010. All ratios for the period have been annualized. Total return and portfolio turnover for the period have not been annualized. |
| (4) | Per share data calculated using average shares outstanding method. |
| (5) | During the years ended October 31, 2014, October 31, 2013 and the period ended October 31, 2011, 0.06%, 0.08% and 0.10%, respectively, of the Fund’s total return was attributable to redemption and small-balance account fees received as referenced in Note 4. Excluding this item, the total return would have been 9.29%, 37.36% and 10.44%, respectively. For the six months ended April 30, 2016 and the years ended October 31, 2015 and October 31, 2012, redemption and small-balance account fees received had no effect on the Fund’s total return. |
| (6) | Total return reflects the rate an investor would have earned on an investment in the Fund during the period. |
The accompanying notes are an integral part of these financial statements.
| | | | |
| 38 | | | | Motley Fool Great America Fund |
Financial Highlights
| | | | | | | | | | | | | | | | | | | | | | | | |
| | | Six Months Ended April 30,
2016 | | Year Ended
October 31, | | Period Ended
October 31, |
Institutional Shares | | (Unaudited)(1) | | 2015 | | 2014(2)(3) |
| | | | | | | | | |
Net Asset Value, Beginning of Period | | | | $ | 18.75 | | | | | | | $ | 18.61 | | | | | | | $ | 17.94 | | | |
Income (Loss) From Investment Operations | | | | | | | | | | | | | | | | | | | | | | | | |
Net Investment Income (Loss)(4) | | | | | 0.01 | | | | | | | | 0.07 | | | | | | | | 0.02 | | | |
Net Gain (Loss) on Securities (Realized and Unrealized) | | | | | (0.46 | ) | | | | | | | 0.13 | | | | | | | | 0.65 | | | |
Total From Investment Operations | | | | | (0.45 | ) | | | | | | | 0.20 | | | | | | | | 0.67 | | | |
Less Distributions | | | | | | | | | | | | | | | | | | | | | | | | |
Net Investment Income | | | | | (0.06 | ) | | | | | | | (0.06 | ) | | | | | | | — | | | |
Net Realized Capital Gains | | | | | — | | | | | | | | — | | | | | | | | — | | | |
Total Distributions | | | | | (0.06 | ) | | | | | | | (0.06 | ) | | | | | | | — | | | |
Redemption and Small-Balance Account Fees | | | | | —* | | | | | | | | —* | | | | | | | | — | | | |
Net Asset Value, End of Period | | | | $ | 18.24 | | | | | | | $ | 18.75 | | | | | | | $ | 18.61 | | | |
| | | | | | | | | |
| | | | | | | | | | | | | | | | | | | | | | |
Total Return(5) | | | | | (2.43 | %) | | | | | | | 1.04 | % | | | | | | | 3.73 | % | | |
Net Assets, End of Period (thousands) | | | | $ | 6,026 | | | | | | | $ | 7,010 | | | | | | | $ | 2,798 | | | |
Ratios/Supplemental Data | | | | | | | | | | | | | | | | | | | | | | | | |
Ratio of Expenses to Average Net Assets | | | | | 0.95 | % | | | | | | | 0.95 | % | | | | | | | 0.95 | % | | |
Ratio of Expenses to Average Net Assets (Before Waivers and Reimbursement of Expenses and/or Recapture of Previously Waived Fees) | | | | | 2.19 | % | | | | | | | 2.45 | % | | | | | | | 4.93 | % | | |
Ratio of Net Investment Income (Loss) to Average Net Assets | | | | | 0.09 | % | | | | | | | 0.35 | % | | | | | | | 0.27 | % | | |
Ratio of Net Investment Income (Loss) to Average Net Assets (Before Waivers and Reimbursement of Expenses and/or Recapture of Previously Waived Fees) | | | | | (1.15 | %) | | | | | | | (1.15 | %) | | | | | | | (3.71 | %) | | |
Portfolio Turnover | | | | | 14 | % | | | | | | | 30 | % | | | | | | | 18 | % | | |
| * | Amount represents less than $0.005 per share. |
| (1) | For the six months ended April 30, 2016, all ratios for the period have been annualized. Total return and portfolio turnover for the period have not been annualized. |
| (2) | Commenced operations on June 17, 2014. All ratios for the period have been annualized. Total return for the period has not been annualized. |
| (3) | Because of commencement of operations and related preliminary transaction costs, these ratios are not necessary indicative of future ratios. |
| (4) | Per share data calculated using average shares outstanding method. |
| (5) | Total return reflects the rate an investor would have earned on an investment in the Fund during the period. |
The accompanying notes are an integral part of these financial statements.
| | | | |
| Motley Fool Great America Fund | | | | 39 |
Motley Fool Epic Voyage Fund Portfolio Characteristics (Unaudited)
At April 30, 2016, the Motley Fool Epic Voyage Fund Investor Shares had an unaudited net asset value of $11.09 per share attributed to 2,629,436 shares outstanding and the Institutional Shares had an unaudited net asset value of $11.12 per share attributed to 172,531 shares outstanding. This compares with an unaudited net asset value as of November 1, 2011 for the Investor Shares of $10.00 per share attributed to 106,350 shares outstanding and as of June 17, 2014 for the Institutional Shares of $13.06 per share attributed to 1 share outstanding. From the Investor Shares launch on November 1, 2011 to April 30, 2016, the Shares had an average annual total return of 3.46% versus a return of 5.06% over the same period for its benchmark, the FTSE Global All Cap ex-US Index, and a return of 5.61% for its previous benchmark, the Russell Global ex-U.S. Index. Over the same period, the FTSE Emerging Markets All Cap China A Inclusion Index returned 0.27%. From June 17, 2014 to April 30, 2016, the Institutional Shares returned -6.95%, versus a return of -5.88% over the same period for the FTSE Global All Cap ex-US Index, and a return of -5.16% for the Russell Global ex-U.S. Index. Over the same period, the FTSE Emerging Markets All Cap China A Inclusion Index returned -7.15%.
Please note that we are using a new benchmark for the Fund, the FTSE Global All Cap ex-US Index, as a replacement for the Russell Global ex-U.S. Index. There are multiple reasons for this. During 2015, FTSE Group and Russell Indexes began operating as one business known as FTSE Russell. This change allows the Adviser to utilize one globally recognized index provider across all its funds, by working with a leading provider of benchmarks which covers 98% of the world’s investable securities through a transparent, rules-based construction methodology. While the Adviser was previously using a Russell Index for this Fund, the FTSE Global All Cap ex-US Index is more comparable to the Motley Fool Independence Fund’s selected benchmark, the FTSE Global All Cap Index, with the ex-US version of the index being derived from the full opportunity set provided by the FTSE Global All Cap Index. In addition, the FTSE Global All Cap ex-US Index includes small-capitalization companies, which more closely aligns it with the Principal Investment Strategies of the Fund. While we believe this index will provide a closer basis of comparison to the Fund, it is also worth noting that the Adviser does not make investment decisions in an attempt to match any benchmark allocations. Also note that we have added a secondary index for the Fund, the FTSE Emerging Markets All Cap China A Inclusion Index. The Principal Investment Strategies of the Fund emphasize investments in companies headquartered in both Developed and Emerging markets. While the FTSE Global All Cap ex-US Index includes both, its weighting to Developed markets in excess of 80% of total capitalization under-represents the exposure that the Fund has historically had to Emerging Markets. As such, we believe we are providing additional information which is relevant to the Fund’s current and prospective investors.
The graph below shows the performance of $10,000 invested in the Investor Shares at inception. The results shown below do not reflect the deduction of taxes that a shareholder would pay on fund distributions or the redemption of fund shares.
|
Average Annual Total Returns as of 04/30/2016 |
| | | | | | | | | | |
| | | | | | Since | | | | Inception |
| | One Year | | | | Inception | | | | Date |
Investor Shares* | | -5.63% | | | | 3.46% | | | | 11/1/2011 |
Institutional Shares* | | -5.53% | | | | -6.95% | | | | 6/17/2014 |
Russell Global ex-US Index** | | -9.67% | | | | — (1) | | | | — |
FTSE Global All Cap ex-US Net Tax Index*** | | -10.59% | | | | — (2) | | | | — |
FTSE Emerging Markets All Cap China A Inclusion Net Tax Index**** | | -18.81% | | | | — (3) | | | | — |
Fund Expense Ratios(4): Investor Shares: Gross 1.84% and Net 1.13%; Institutional Shares: Gross 5.91% and Net 0.93% |
| | | | |
| 40 | | | | Motley Fool Epic Voyage Fund |
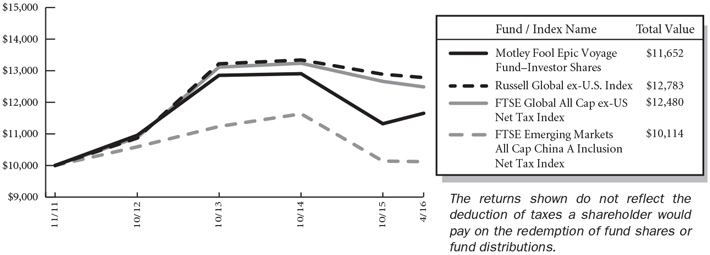
The performance data quoted represents past performance and does not guarantee future results. Current performance may be lower or higher. Performance data current to the most recent month-end may be obtained at www.FoolFunds.com. The investment return and principal value of an investment will fluctuate so that shares, when redeemed, may be worth more or less than their original cost.
(1)The index returned 5.61% from the inception date of the Investor Shares and -5.16% from the inception date of the Institutional Shares.
(2)The index returned 5.06% from the inception date of the Investor Shares and -5.88% from the inception date of the Institutional Shares.
(3)The index returned 0.27% from the inception date of the Investor Shares and -7.15% from the inception date of the Institutional Shares.
(4)The expense ratios of the Fund are set forth according to the 2/29/16 Prospectus for the Fund may differ from the expense ratios disclosed in the Financial Highlights tables in this report. See the Financial Highlights for more current expense ratios.
*These returns reflect expense waivers by the Fund’s investment adviser. Without these waivers, returns would have been lower.
**The Russell Global ex-U.S. Index measures the performance of the global equity market based on all investable equity securities, excluding companies assigned to the United States. The Russell Global ex-U.S. Index is constructed to provide a comprehensive and unbiased barometer for the global segment and is completely reconstituted annually to accurately reflect the changes in the market over time, and it is widely recognized by investors in international markets as a benchmark for portfolios of foreign securities. However, the Epic Voyage Fund may invest in countries that are not included within the Russell Global ex-U.S. Index, and its investment portfolio is not weighted in terms of countries or issuers in correlation with the Russell Global ex-U.S. Index. For this reason, the Epic Voyage Fund’s investment performance should not be expected to track, and may exceed or trail, the Russell Global ex-U.S. Index. In addition, the performance of the Russell Global ex-U.S. Index may not correlate with the performance of U.S. markets. Under normal circumstances, the Epic Voyage Fund seeks to stay fully invested, primarily in common stocks, and does not attempt to time the market. Although current income in not an objective of the Epic Voyage Fund, the Adviser considers current income in assessing the intrinsic value of securities being considered for purchase by the Epic Voyage Fund.
***The FTSE Global All Cap ex-US Index is a market-capitalization weighted index representing the performance of large, mid and small cap companies in Developed and Emerging markets, excluding the USA. The index is comprised of approximately 6,600 securities from 47 countries. Fair value prices and foreign exchange as of 4 pm EST are used in the calculation of this index, and returns are adjusted for withholding taxes applicable to dividends received by a U.S. Regulated Investment Company domiciled in the United States.
****The FTSE Emerging Markets All Cap China A Inclusion Index is a market-capitalization weighted index representing the performance of large, mid and small cap companies in Emerging markets. The index is comprised of approximately 3,350 securities from 22 countries, and is part of the FTSE China A Inclusion Indexes which contain FTSE China A All Cap Index securities adjusted for the aggregate approved QFII and RQFII quotas available to international investors. Fair value prices and foreign exchange as of 4 pm EST are used in the calculation of this index, and returns are adjusted
| | | | |
| Motley Fool Epic Voyage Fund | | | | 41 |
for withholding taxes applicable to dividends received by a U.S. Regulated Investment Company domiciled in the United States.
The investment objective of the Epic Voyage Fund is to achieve long-term capital appreciation. The Fund pursues this objective by investing primarily in common stocks of foreign companies. The Fund employs a value-based investment strategy and seeks long-term growth of capital by acquiring securities of companies at prices the investment adviser, Motley Fool Asset Management, LLC (the “Adviser”), believes to be significantly below their intrinsic value. The Fund may invest in other types of securities and in other asset classes when, in the judgment of the Adviser, such investments offer attractive potential returns. As such, the Fund’s performance will deviate significantly from its benchmark from time to time. It is the view of the Adviser that this deviation is less meaningful over shorter time frames and is more relevant over multi-year periods.
Because the Epic Voyage Fund is free to invest in companies of any size around the world, investments in the securities of foreign companies, including depositary receipts, companies with smaller market capitalizations (less than $2 billion), and companies in emerging market countries, will be important components of the Epic Voyage Fund’s investment program, although the Epic Voyage Fund may invest in issuers of all capitalization sizes. Small-cap stocks tend to be more volatile and less liquid than their large-cap counterparts. Fluctuations in currency exchange rates can cause losses when investing in foreign securities, with emerging markets presenting additional risks of illiquidity, political instability, and lax regulation. You are strongly encouraged to read more about the Fund’s strategies and risks in the prospectus.
The Epic Voyage Fund invests in securities of companies the Adviser believes are undervalued. Unlike mutual funds that are constrained by a style box, the Fund may invest in any company, industry or sector where the Adviser’s analysis suggests that there is opportunity for gains that outweigh risks. In identifying investments for the Fund, the Adviser looks for companies it believes the market has irrationally undervalued and companies that have high-quality businesses with strong market positions, manageable leverage, and robust streams of free cash flow. The following tables show the top eleven holdings, sector allocation, and top eleven countries in which the Fund was invested as of April 30, 2016. Portfolio holdings are subject to change without notice.
| | | | |
| |  Certain mutual fund ratings and review services have created style boxes, which look more or less like a tic-tac-toe board; arranging funds by the size of the companies they typically invest in (large-, mid-, and small-cap) along one axis, and along a “value” to “growth” basis on the other axis. This may be a helpful way – at times – to think about certain investment opportunities, but we don’t believe we’ll improve your returns by limiting ourselves to any one portion of that style box. Certain mutual fund ratings and review services have created style boxes, which look more or less like a tic-tac-toe board; arranging funds by the size of the companies they typically invest in (large-, mid-, and small-cap) along one axis, and along a “value” to “growth” basis on the other axis. This may be a helpful way – at times – to think about certain investment opportunities, but we don’t believe we’ll improve your returns by limiting ourselves to any one portion of that style box.
| | |
| | | | |
| 42 | | | | Motley Fool Epic Voyage Fund |
| | | | | | | |
Top Eleven Holdings* | | % of Net
Assets | | |
| | |
| | | | | | | | |
Duzonbizon Co., Ltd. | | | | 4.84 | % | | |
PT Nippon Indosari Corpindo Tbk | | | | 4.60 | | | |
Banco Latinoamericano de Comercio Exterior SA | | | | 4.25 | | | |
Taiwan Semiconductor Manufacturing Co., Ltd. | | | | 4.06 | | | |
Almarai Co. | | | | 4.05 | | | |
HDFC Bank Ltd. | | | | 4.05 | | | |
BrainJuicer Group PLC | | | | 3.81 | | | |
Kobayashi Pharmaceutical Co., Ltd. | | | | 3.20 | | | |
Tencent Holdings Ltd. | | | | 2.99 | | | |
Tessenderlo Chemie NV | | | | 2.95 | | | |
PT Mitra Adiperkasa TBK | | | | 2.91 | | | |
| | | | | | | |
| | | | 41.71 | % | | |
| | | | | | | |
| | | | | | | |
* As of the date of the report, the fund had a holding of 4.60% in the BNY Mellon Cash Reserve.
The Motley Fool Epic Voyage Fund uses the Global Industry Classification StandardSM (“GICS SM”) as the basis for the classification of securities on the Schedule of Investments (“SOI”). We believe that this makes the SOI classifications more standard with the rest of the industry.
| | | | | | | |
Sector Allocation | | % of Net
Assets | | |
| | |
| | | | | | | | |
Consumer Discretionary | | | | 20.00 | % | | |
Information Technology | | | | 17.06 | | | |
Financials | | | | 16.50 | | | |
Consumer Staples | | | | 14.43 | | | |
Health Care | | | | 11.32 | | | |
Industrials | | | | 8.08 | | | |
Materials | | | | 6.48 | | | |
Energy | | | | 1.28 | | | |
| | | | | | | |
| | | | 95.15 | % | | |
| | | | | | | |
| | | | | | | |
| | | | |
| Motley Fool Epic Voyage Fund | | | | 43 |
| | | | | |
Top Eleven Countries | | % of Net
Assets |
| |
| | | | | | |
Japan | | | | 9.00 | % |
United Kingdom | | | | 8.58 | |
Brazil | | | | 8.00 | |
Indonesia | | | | 7.51 | |
South Korea | | | | 7.09 | |
India | | | | 6.05 | |
Switzerland | | | | 5.95 | |
United States* | | | | 5.89 | |
United Arab Emirates | | | | 5.10 | |
Panama | | | | 4.25 | |
Taiwan | | | | 4.06 | |
| | | | | |
| | | | 71.48 | % |
| | | | | |
| | | | | |
* As of the date of the report, the fund had a holding of 4.60% in the BNY Mellon Cash Reserve.
| | | | |
| 44 | | | | Motley Fool Epic Voyage Fund |
About Your Expenses
As a shareholder of the Epic Voyage Fund, you incur ongoing costs, including advisory fees and other Fund expenses. This example is intended to help you to understand your ongoing costs (in dollars) of investing in the Fund and to compare these costs with the ongoing costs of investing in other mutual funds. It is based on an investment of $1,000 invested at the beginning of the period and held for the entire period from November 1, 2015 to April 30, 2016.
Actual Expenses
The first section of the table below provides information about actual account values and actual expenses. You may use the information in this section, together with the amount you invested, to estimate the expenses that you incurred over the period. Simply divide your account value by $1,000 (for example, an $8,600 account value divided by $1,000 = 8.6), then multiply the result by the number in the first section under the heading entitled “Expenses Paid During Period” to estimate the expenses attributable to your investment during this period.
Hypothetical Example for Comparison Purposes
The second section of the table below provides information about hypothetical account values and hypothetical expenses based on the Fund’s actual expense ratio and an assumed rate of return of 5% per year before expenses, which is not the Fund’s actual return. Thus, you should not use the hypothetical account values and expenses to estimate the actual ending account balance or your expenses for the period. Rather, these figures are provided to enable you to compare the ongoing costs of investing in the Fund as compared to the costs of investing in other funds. To do so, compare this 5% hypothetical example with the 5% hypothetical examples that appear in the shareholder reports of the other funds. Please note that the expenses shown in the table are meant to highlight your ongoing costs only. Therefore, the second section of the table is useful in comparing ongoing costs only and will not help you determine the relative total costs of owning different funds.
| | | | | | |
| |  Do you know how many times a fund, or the market, has returned a smooth 5% over a long period of time? Never. But we have to pick some example. In reality, the market’s returns are always far bumpier, with the market returning 20% one year, followed by a loss of 10% the next year, followed by a 3% gain, etc. These variations affect actual expenses as well. Happily, over almost all time periods of 20 years or longer, according to the research of University of Pennsylvania’s Jeremy Siegel and others, the domestic market’s returns have been at least 5% per year on average. Do you know how many times a fund, or the market, has returned a smooth 5% over a long period of time? Never. But we have to pick some example. In reality, the market’s returns are always far bumpier, with the market returning 20% one year, followed by a loss of 10% the next year, followed by a 3% gain, etc. These variations affect actual expenses as well. Happily, over almost all time periods of 20 years or longer, according to the research of University of Pennsylvania’s Jeremy Siegel and others, the domestic market’s returns have been at least 5% per year on average.
| | | | |
| | | | | | | | |
| | | Beginning
Account
Value
11/01/15 | | Ending
Account
Value
4/30/16 | | Annualized
Expense
Ratio(1) | | Expenses
Paid
During
Period(2) |
| | | | |
| | | | | | | | | |
| | | | |
Investor Shares | | | | | | | | |
Actual | | $1,000 | | $1,029.62 | | 1.15% | | $5.80 |
Hypothetical | | $1,000 | | $1,019.14 | | 1.15% | | $5.77 |
Institutional Shares | | | | | | | | |
Actual | | $1,000 | | $1,030.48 | | 0.95% | | $4.80 |
Hypothetical | | $1,000 | | $1,020.14 | | 0.95% | | $4.77 |
| (1) | These ratios reflect expenses waived by the Fund’s investment adviser. Without these Waivers, the Fund’s expenses would have been higher and the ending account values would have been lower. |
| (2) | Expenses are equal to the Fund’s annualized expense ratio for the period November 1, 2015 to April 30, 2016, multiplied by the average account value over the period, multiplied by the number of days (182) in the most recent fiscal half-year, then divided by 366. |
| | | | |
| Motley Fool Epic Voyage Fund (Unaudited) | | | | 45 |
The Motley Fool Funds Trust
Motley Fool Epic Voyage Fund
Schedule of Investments
April 30, 2016
(Unaudited)
| | | | | | | | |
Issues | | Shares | | | Value (Note 2) | |
| | |
| | | | | | | | | |
Equity Securities — 90.16% | | | | | | | | |
Airlines — 1.08% | | | | | | | | |
Air Arabia PJSC (United Arab Emirates) | | | 1,000,000 | | | $ | 336,977 | |
| | | | | | | | |
Banks — 11.05% | | | | | | | | |
Banco Latinoamericano de Comercio Exterior SA (Panama) | | | 51,100 | | | | 1,321,446 | |
Gronlandsbanken AB (Denmark) | | | 9,287 | | | | 854,443 | |
HDFC Bank Ltd. (India)(a) | | | 20,000 | | | | 1,257,400 | |
| | | | | | | | |
| | |
| | | | | | | 3,433,289 | |
| | | | | | | | |
| | |
Capital Markets — 2.10% | | | | | | | | |
Tarpon Investimentos SA (Brazil) | | | 303,500 | | | | 652,138 | |
| | | | | | | | |
| | |
Chemicals — 4.51% | | | | | | | | |
Syngenta AG (Switzerland)(a) | | | 6,000 | | | | 483,420 | |
Tessenderlo Chemie NV (Belgium)* | | | 26,666 | | | | 917,763 | |
| | | | | | | | |
| | |
| | | | | | | 1,401,183 | |
| | | | | | | | |
Commercial Services & Supplies — 0.83% | | | | | | | | |
Depa Ltd. (United Arab Emirates)* | | | 691,600 | | | | 258,658 | |
| | | | | | | | |
| | |
Electronics — 2.08% | | | | | | | | |
Renishaw PLC (United Kingdom) | | | 23,300 | | | | 645,440 | |
| | | | | | | | |
| | |
Food Products — 7.17% | | | | | | | | |
BRF - Brasil Foods SA (Brazil)(a) | | | 20,000 | | | | 284,400 | |
Nestle SA (Switzerland) | | | 6,885 | | | | 513,894 | |
PT Nippon Indosari Corpindo Tbk (Indonesia) | | | 13,022,700 | | | | 1,430,771 | |
| | | | | | | | |
| | |
| | | | | | | 2,229,065 | |
| | | | | | | | |
| | |
Health Care Equipment & Supplies — 1.86% | | | | | | | | |
Medtronic PLC (Ireland) | | | 7,292 | | | | 577,162 | |
| | | | | | | | |
| | |
Health Care Providers & Services — 4.81% | | | | | | | | |
NMC Health PLC (United Arab Emirates) | | | 50,000 | | | | 764,915 | |
Odontoprev SA (Brazil) | | | 237,000 | | | | 729,761 | |
| | | | | | | | |
| | |
| | | | | | | 1,494,676 | |
| | | | | | | | |
| | |
Internet — 3.33% | | | | | | | | |
COOKPAD, Inc. (Japan) | | | 7,500 | | | | 107,254 | |
See Notes to Financial Statements.
| | | | |
| 46 | | | | Motley Fool Epic Voyage Fund |
| | | | | | | | |
Issues | | Shares | | | Value (Note 2) | |
| | |
| | | | | | | | | |
Equity Securities (continued) | | | | | | | | |
Internet (continued) | | | | | | | | |
Tencent Holdings Ltd. (Cayman Islands) | | | 45,600 | | | $ | 927,883 | |
| | | | | | | | |
| | |
| | | | | | | 1,035,137 | |
| | | | | | | | |
| | |
Internet & Catalog Retail — 4.97% | | | | | | | | |
CJ O Shopping Co., Ltd. (South Korea) | | | 4,002 | | | | 700,327 | |
zooplus AG (Germany)* | | | 6,001 | | | | 843,302 | |
| | | | | | | | |
| | |
| | | | | | | 1,543,629 | |
| | | | | | | | |
| | |
Internet Software & Services — 2.75% | | | | | | | | |
Baidu, Inc. (China)*(a) | | | 4,400 | | | | 854,920 | |
| | | | | | | | |
| | |
Leisure Products — 2.89% | | | | | | | | |
Shimano, Inc. (Japan) | | | 6,250 | | | | 896,696 | |
| | | | | | | | |
| | |
Life Sciences Tools & Services — 2.64% | | | | | | | | |
Horizon Discovery Group PLC (United Kingdom)* | | | 164,999 | | | | 446,015 | |
Siegfried Holding Ltd. (Switzerland) | | | 2,000 | | | | 375,274 | |
| | | | | | | | |
| | |
| | | | | | | 821,289 | |
| | | | | | | | |
| | |
Machinery — 2.57% | | | | | | | | |
FANUC Corp. (Japan) | | | 5,400 | | | | 797,699 | |
| | | | | | | | |
| | |
Media — 6.44% | | | | | | | | |
BrainJuicer Group PLC (United Kingdom) | | | 231,336 | | | | 1,183,062 | |
Multiplus SA (Brazil) | | | 75,000 | | | | 819,728 | |
| | | | | | | | |
| | |
| | | | | | | 2,002,790 | |
| | | | | | | | |
| | |
Metals & Mining — 1.03% | | | | | | | | |
Constellium NV, Class A (Netherlands)* | | | 55,000 | | | | 320,650 | |
| | | | | | | | |
| | |
Multiline Retail — 2.91% | | | | | | | | |
PT Mitra Adiperkasa Tbk (Indonesia)* | | | 2,842,000 | | | | 902,938 | |
| | | | | | | | |
| | |
Oil & Gas Services — 1.29% | | | | | | | | |
Schlumberger Ltd. (United States) | | | 5,000 | | | | 401,700 | |
| | | | | | | | |
| | |
Personal Products — 3.20% | | | | | | | | |
Kobayashi Pharmaceutical Co., Ltd. (Japan) | | | 12,500 | | | | 995,658 | |
| | | | | | | | |
| | |
Pharmaceuticals — 2.01% | | | | | | | | |
Dr. Reddy’s Laboratories Ltd. (India)(a) | | | 13,679 | | | | 623,762 | |
| | | | | | | | |
| | |
Real Estate Investment Trusts — 1.50% | | | | | | | | |
Lippo Malls Indonesia Retail Trust (Singapore) | | | 1,925,000 | | | | 465,201 | |
| | | | | | | | |
See Notes to Financial Statements.
| | | | |
| Motley Fool Epic Voyage Fund | | | | 47 |
| | | | | | | | |
Issues | | Shares | | | Value (Note 2) | |
| | |
| | | | | | | | | |
Equity Securities (continued) | | | | | | | | |
Real Estate Management & Development — 1.85% | | | | | | | | |
Henderson Land Development Co., Ltd. (Hong Kong) | | | 92,475 | | | $ | 576,353 | |
| | | | | | | | |
| | |
Semiconductors & Semiconductor Equipment — 4.06% | | | | | | | | |
Taiwan Semiconductor Manufacturing Co., Ltd. (Taiwan)(a) | | | 53,500 | | | | 1,262,065 | |
| | | | | | | | |
| | |
Software — 4.84% | | | | | | | | |
DuzonBizon Co., Ltd. (South Korea) | | | 68,900 | | | | 1,502,887 | |
| | | | | | | | |
| | |
Specialty Retail — 1.26% | | | | | | | | |
Halfords Group PLC (United Kingdom) | | | 63,400 | | | | 391,237 | |
| | | | | | | | |
| | |
Textiles, Apparel & Luxury Goods — 1.54% | | | | | | | | |
Swatch Group SA (The) (Switzerland) | | | 1,400 | | | | 477,654 | |
| | | | | | | | |
| | |
Transportation Infrastructure — 3.59% | | | | | | | | |
DP World Ltd. (United Arab Emirates) | | | 12,000 | | | | 223,883 | |
International Container Terminal Services, Inc. (Philippines) | | | 645,000 | | | | 892,975 | |
| | | | | | | | |
| | |
| | | | | | | 1,116,858 | |
| | | | | | | | |
| | |
Total Equity Securities (Cost $ 26,000,094) | | | | | | | 28,017,711 | |
| | | | | | | | |
| | |
Participatory Notes — 4.99% | | | | | | | | |
Banks — 0.00% | | | | | | | | |
Al Rajhi Banking & Investment Co. (Saudi Arabia)(b)(c) | | | — | | | | 3 | |
| | | | | | | | |
| | |
Food Products — 4.05% | | | | | | | | |
Almarai Co. (Saudi Arabia)(b) | | | 84,114 | | | | 1,258,941 | |
| | | | | | | | |
| | |
Metals & Mining — 0.94% | | | | | | | | |
Aluminium Bahrain BSC (Germany)(b) | | | 396,998 | | | | 290,758 | |
| | | | | | | | |
| | |
Total Participatory Notes (Cost $ 1,299,382) | | | | | | | 1,549,702 | |
| | | | | | | | |
| | |
Other Investments — 4.60% | | | | | | | | |
Temporary Cash Investment — 4.60% | | | | | | | | |
BNY Mellon Cash Reserve | | | 1,429,037 | | | | 1,429,037 | |
| | | | | | | | |
| | |
Total Other Investments (Cost $ 1,429,036) | | | | | | | 1,429,037 | |
| | | | | | | | |
| | |
Total Investment Portfolio (Cost $ 28,728,512) — 99.75% | | | | | | | 30,996,450 | |
Assets in Excess of Other Liabilities — 0.25% | | | | | | | 77,689 | |
| | | | | | | | |
| | |
NET ASSETS — 100.00% | | | | | | | | |
(Applicable to 2,801,967 shares outstanding) | | | | | | $ | 31,074,139 | |
| | | | | | | | |
| | | | | | | | |
| * | Non-income producing security. |
| (a) | ADR — American Depositary Receipts |
See Notes to Financial Statements.
| | | | |
| 48 | | | | Motley Fool Epic Voyage Fund |
| (b) | Security exempt from registration under Rule 144A of the Securities Act of 1933. These securities may be resold in transactions exempt from registration, normally to qualified institutional buyers. Total market value of Rule 144A securities is $1,549,702 and represents 4.99% of net assets as of April 30, 2016. |
PLC — Public Limited Company
See Notes to Financial Statements.
| | | | |
| Motley Fool Epic Voyage Fund | | | | 49 |
Statement of Assets and Liabilities
| | | | | | | | | | |
| | | As of April 30, 2016
(Unaudited) | | |
| | |
| | | | | | | | | |
Assets: | | | | | | | |
| | |
Investments in securities of unaffiliated issuers, at value (at cost, $28,728,512) | | | $ | 30,996,450 | | | |
Cash | | | | 133 | | | |
Foreign currency, at value (at cost, $24,623) | | | | 25,214 | | | |
Receivables: | | | | | | | |
Dividends and tax reclaims | | | | 128,227 | | | |
Shares of beneficial interest sold | | | | 3,884 | | | |
Reimbursement due from adviser | | | | 7,703 | | | |
Prepaid expenses and other assets | | | | 46,788 | | | |
| | | | | | | | |
| | |
Total Assets | | | | 31,208,399 | | | |
| | | | | | | | |
| | |
Liabilities | | | | | | | |
Payables: | | | | | | | |
Foreign currency purchased | | | | 17,085 | | | |
Shares of beneficial interest redeemed | | | | 10,374 | | | |
Dividend withholding tax | | | | 7,388 | | | |
Accrued expenses: | | | | | | | |
Audit fees | | | | 9,667 | | | |
Accounting and administration fees | | | | 46,628 | | | |
Custodian fees | | | | 11,807 | | | |
Transfer agent fees | | | | 11,981 | | | |
Trustee fees | | | | 539 | | | |
Other expenses | | | | 18,791 | | | |
| | | | | | | | |
| | |
Total Liabilities | | | | 134,260 | | | |
| | | | | | | | |
| | |
Net Assets | | | $ | 31,074,139 | | | |
| | | | | | | | |
| | | | | | | | |
The accompanying notes are an integral part of these financial statements.
| | | | |
| 50 | | | | Motley Fool Epic Voyage Fund |
Statement of Assets and Liabilities
| | | | | | | | | | |
| | | As of April 30, 2016
(Unaudited) | | |
| | |
| | | | | | | | | |
| | |
Net Assets Consist of: | | | | | | | |
Paid-in-Capital | | | $ | 31,042,824 | | | |
Undistributed Net Investment Income | | | | 130,755 | | | |
Accumulated Net Realized Loss on Investments | | | | (2,368,878 | ) | | |
Net Unrealized Appreciation/(Depreciation) on Investments, Foreign Currencies, and Assets and Liabilities Denominated in Foreign Currencies | | | | 2,269,438 | | | |
| | | | | | | | |
| | |
Net Assets | | | $ | 31,074,139 | | | |
| | | | | | | | |
| | | | | | | | |
| | |
Net Asset Value: | | | | | | | |
$0.001 par value, unlimited shares authorized | | | | | | | |
Investor Shares: | | | | | | | |
Net assets applicable to capital shares outstanding | | | $ | 29,155,643 | | | |
Shares outstanding | | | | 2,629,436 | | | |
| | | | | | | | |
| | |
Net asset value, offering, and redemption price per share* | | | $ | 11.09 | | | |
| | | | | | | | |
| | | | | | | | |
| | |
Institutional Shares: Net assets applicable to capital shares outstanding | | | $ | 1,918,496 | | | |
Shares outstanding | | | | 172,531 | | | |
| | | | | | | | |
Net asset value, offering, and redemption price per share* | | | $ | 11.12 | | | |
| | | | | | | | |
| | | | | | | | |
| * | A charge of 2% is imposed on the redemption proceeds of shares redeemed or exchanged within 90 days of purchase. |
The accompanying notes are an integral part of these financial statements.
| | | | |
| Motley Fool Epic Voyage Fund | | | | 51 |
Statement of Operations
| | | | | | | | | | |
| | | Six-Months Ended April 30, 2016 (Unaudited) | | |
| | |
| | | | | | | | | |
| | |
Investment Income | | | | | | | |
Dividends | | | $ | 352,260 | | | |
Less foreign taxes withheld | | | | (47,521 | ) | | |
| | | | | | | | |
| | |
Total Investment Income | | | | 304,739 | | | |
| | | | | | | | |
| | |
Expenses | | | | | | | |
Accounting and administration fees | | | | 48,720 | | | |
Blue sky fees | | | | 9,371 | | | |
Shareholder account-related services - Investor Shares | | | | 18,303 | | | |
Chief Compliance Officer fees | | | | 12,708 | | | |
Custodian fees | | | | 18,275 | | | |
Investment advisory fees | | | | 129,910 | | | |
Professional fees | | | | 22,003 | | | |
Shareholder reporting fees | | | | 5,347 | | | |
Transfer agent fees - Investor Shares | | | | 31,427 | | | |
Transfer agent fees - Institutional Shares | | | | 19,221 | | | |
Trustee fees | | | | 18,649 | | | |
Other expenses | | | | 14,819 | | | |
| | | | | | | | |
| | |
Total expenses | | | | 348,753 | | | |
| | | | | | | | |
| | |
Expenses waived/reimbursed net of amount recaptured - Investor Shares | | | | (134,772 | ) | | |
Expenses waived/reimbursed net of amount recaptured - Institutional Shares | | | | (40,014 | ) | | |
| | | | | | | | |
| | |
Net expenses | | | | 173,967 | | | |
| | | | | | | | |
| | |
Net Investment Income (Loss) | | | | 130,772 | | | |
| | | | | | | | |
| | |
Realized and Unrealized Gain (Loss) | | | | | | | |
Net realized gain (loss) from: | | | | | | | |
Investment securities | | | | (1,311,797 | ) | | |
Foreign currency transactions | | | | (6,105 | ) | | |
| | | | | | | | |
| | |
Net realized gain (loss) on investments and foreign currency transactions | | | | (1,317,902 | ) | | |
| | | | | | | | |
| | |
Change in net unrealized appreciation/(depreciation) on: | | | | | | | |
Investment securities | | | | 1,998,055 | | | |
Foreign currency translations | | | | 2,799 | | | |
| | | | | | | | |
| | |
Change in net unrealized appreciation/(depreciation) on investments, foreign currencies, and assets and liabilities denominated in foreign currencies | | | | 2,000,854 | | | |
| | | | | | | | |
| | |
Net realized and unrealized gain (loss) | | | | 682,952 | | | |
| | | | | | | | |
| | |
Net Increase (Decrease) in Net Assets Resulting from Operations | | | $ | 813,724 | | | |
| | | | | | | | |
| | | | | | | | |
The accompanying notes are an integral part of these financial statements.
| | | | |
| 52 | | | | Motley Fool Epic Voyage Fund |
Statement of Changes in Net Assets
| | | | | | | | | | |
| | | Six-Months
Ended April 30, 2016
(Unaudited) | | | Year Ended
October 31,
2015 | | | |
| | | |
| | | | | | | | | | | |
Operations: | | | | | | | | | | |
Net Investment Income (Loss) | | $ | 130,772 | | | $ | 320,996 | | | |
Net Realized Gain (Loss) on Investments and Foreign Currency Transactions | | | (1,317,902 | ) | | | (415,250 | ) | | |
Change in Net Unrealized Appreciation (Depreciation) on Investments and Foreign Currency Translation | | | 2,000,854 | | | | (5,225,391 | ) | | |
| | | | | | | | | | |
Net increase (decrease) in net assets resulting from operations | | | 813,724 | | | | (5,319,645 | ) | | |
| | | | | | | | | | |
Dividends to Shareholders: | | | | | | | | | | |
Dividends from net investment income | | | | | | | | | | |
Investor Shares | | | (300,972 | ) | | | (677,612 | ) | | |
Institutional Shares | | | (18,444 | ) | | | (24,330 | ) | | |
| | | | | | | | | | |
Total dividends and distributions | | | (319,416 | ) | | | (701,942 | ) | | |
| | | | | | | | | | |
Capital Share Transactions: | | | | | | | | | | |
Proceeds from shares sold | | | | | | | | | | |
Investor Shares (119,692 and 426,373 shares, respectively) | | | 1,262,120 | | | | 5,009,661 | | | |
Institutional Shares (11,296 and 33,099 shares, respectively) | | | 121,351 | | | | 388,538 | | | |
Reinvestment of dividends | | | | | | | | | | |
Investor Shares (27,787 and 57,128 shares, respectively) | | | 300,095 | | | | 670,684 | | | |
Institutional Shares (1,705 and 2,071 shares, respectively) | | | 18,444 | | | | 24,330 | | | |
Value of shares redeemed | | | | | | | | | | |
Investor Shares (382,714 and 1,392,043 shares, respectively) | | | (4,021,917 | ) | | | (16,320,233 | ) | | |
Institutional Shares (143 and 3,508 shares, respectively) | | | (1,456 | ) | | | (41,366 | ) | | |
Redemption fees and small-balance account fees | | | | | | | | | | |
Investor Shares | | | 1,288 | | | | 8,692 | | | |
Institutional Shares | | | — | | | | 1 | | | |
| | | | | | | | | | |
Net increase (decrease) from capital share transactions | | | (2,320,075 | ) | | | (10,259,693 | ) | | |
| | | | | | | | | | |
Total increase (decrease) in net assets | | | (1,825,767 | ) | | | (16,281,280 | ) | | |
| | | | | | | | | | |
Net Assets: | | | | | | | | | | |
Beginning of Period | | | 32,899,906 | | | | 49,181,186 | | | |
| | | | | | | | | | |
End of Period* | | $ | 31,074,139 | | | $ | 32,899,906 | | | |
| | | | | | | | | | |
| | | | | | | | | | |
*Including undistributed net investment income | | $ | 130,755 | | | $ | 319,399 | | | |
| | | | | | | | | | |
| | | | | | | | | | |
The accompanying notes are an integral part of these financial statements.
| | | | |
| Motley Fool Epic Voyage Fund | | | | 53 |
Financial Highlights
(for a share outstanding throughout each period)
| | | | | | | | | | | | | | | | | | | | | | | | | | | | |
| | | |
| | | Six
Months Ended April 30, 2016 | |
| Years Ended
October 31, |
| | Period Ended
October 31, |
| Investor Shares | | (Unaudited)(1) | | | 2015 | | | | 2014 | | | | 2013 | | | 2012(2)(3) |
| | | | | | | | | |
Net Asset Value, Beginning of Period | | | | | $ 10.88 | | | | | | $ 12.61 | | | | $ 12.66 | | | | $ 10.94 | | | | | | $ 10.00 | | | |
| | | | | | | | | |
Income (Loss) From Investment Operations | | | | | | | | | | | | | | | | | | | | | | | | | | | | |
Net Investment Income (Loss)(4) | | | | | 0.04 | | | | | | 0.09 | | | | 0.16 | | | | 0.13 | | | | | | 0.18 | | | |
Net Gain (Loss) on Securities (Realized and Unrealized) | | | | | 0.28 | | | | | | (1.63 | ) | | | (0.12 | ) | | | 1.73 | | | | | | 0.77 | | | |
Total From Investment Operations | | | | | 0.32 | | | | | | (1.54 | ) | | | 0.04 | | | | 1.86 | | | | | | 0.95 | | | |
Less Distributions | | | | | | | | | | | | | | | | | | | | | | | | | | | | |
Net Investment Income | | | | | (0.11 | ) | | | | | (0.19 | ) | | | (0.08 | ) | | | (0.15 | ) | | | | | (0.01 | ) | | |
Net Realized Capital Gains | | | | | — | | | | | | ��� | | | | (0.02 | ) | | | — | | | | | | — | | | |
Total Distributions | | | | | (0.11 | ) | | | | | (0.19 | ) | | | (0.10 | ) | | | (0.15 | ) | | | | | (0.01 | ) | | |
Redemption and Small-Balance Account Fees | | | | | —* | | | | | | —* | | | | 0.01 | | | | 0.01 | | | | | | —* | | | |
Net Asset Value, End of Period | | | | | $ 11.09 | | | | | | $ 10.88 | | | | $ 12.61 | | | | $ 12.66 | | | | | | $ 10.94 | | | |
| | | | | | | | | |
| | | | | | | | | | | | | | | | | | | | | | | | |
Total Return(5)(6) | | | | | 2.96 | % | | | | | (12.33 | %) | | | 0.47 | % | | | 17.32 | % | | | | | 9.52 | % | | |
Net Assets, End of Period (thousands) | | | | | $29,156 | | | | | | $31,160 | | | | $47,566 | | | | $40,119 | | | | | | $19,272 | | | |
| | | | | | | | | |
Ratios/Supplemental Data | | | | | | | | | | | | | | | | | | | | | | | | | | | | |
| | | | | | | | | |
Ratio of Expenses to Average Net Assets | | | | | 1.15 | % | | | | | 1.13 | % | | | 1.24 | % | | | 1.35 | % | | | | | 1.35 | % | | |
Ratio of Expenses to Average Net Assets (Before Waivers and Reimbursement of Expenses and/or Recapture of Previously Waived Fees) | | | | | 2.09 | % | | | | | 1.84 | % | | | 1.88 | % | | | 2.60 | % | | | | | 4.13 | % | | |
Ratio of Net Investment Income (Loss) to Average Net Assets | | | | | 0.84 | % | | | | | 0.80 | % | | | 1.29 | % | | | 1.15 | % | | | | | 1.75 | % | | |
Ratio of Net Investment Income (Loss) to Average Net Assets (Before Waivers and Reimbursement of Expenses and/or Recapture of Previously Waived Fees) | | | | | (0.10 | %) | | | | | 0.09 | % | | | 0.66 | % | | | (0.10 | %) | | | | | (1.03 | %) | | |
Portfolio Turnover | | | | | 14 | % | | | | | 20 | % | | | 25 | % | | | 26 | % | | | | | 17 | % | | |
| * | Amount represents less than $0.005 per share. |
| (1) | For the six months ended April 30, 2016, all ratios for the period have been annualized. Total return and portfolio turnover for the period have not been annualized. |
The accompanying notes are an integral part of these financial statements.
| | | | |
| 54 | | | | Motley Fool Epic Voyage Fund |
Financial Highlights
| (2) | Inception date of the Epic Voyage Fund was November 1, 2011. All ratios for the period have been annualized. Total return and portfolio turnover for the period have not been annualized. |
| (3) | Because of commencement of operations and related preliminary transaction costs, these ratios are not necessarily indicative of future ratios. |
| (4) | Per share data calculated using average shares outstanding method. |
| (5) | During the years ended October 31, 2014 and October 31, 2013, 0.08% and 0.09%, respectively of the Fund’s total return was attributable to redemption and small-balance account fees received as referenced in Note 4. Excluding this item, the total return would have been 0.39% and 17.23%, respectively. For the six months ended April 30, 2016, the year ended October 31, 2015 and the period ended October 31, 2012, redemption and small-balance account fees received had no effect on the Fund’s total return. |
| (6) | Total return reflects the rate an investor would have earned on an investment in the Fund during the period. |
The accompanying notes are an integral part of these financial statements.
| | | | |
| Motley Fool Epic Voyage Fund | | | | 55 |
Financial Highlights
| | | | | | | | | | | | | | | | | | | | | | | | |
| | | Six Months Ended April 30, 2016 | | Year Ended October 31, | | Period Ended October 31, |
Institutional Shares | | (Unaudited)(1) | | 2015 | | 2014(2)(3) |
Net Asset Value, Beginning of Period | | | | $ | 10.90 | | | | | | | $ | 12.62 | | | | | | | $ | 13.06 | | | |
Income (Loss) From Investment Operations | | | | | | | | | | | | | | | | | | | | | | | | |
Net Investment Income (Loss)(4) | | | | | 0.06 | | | | | | | | 0.12 | | | | | | | | 0.04 | | | |
Net Gain (Loss) on Securities (Realized and Unrealized) | | | | | 0.27 | | | | | | | | (1.65 | ) | | | | | | | (0.48 | ) | | |
Total From Investment Operations | | | | | 0.33 | | | | | | | | (1.53 | ) | | | | | | | (0.44 | ) | | |
Less Distributions | | | | | | | | | | | | | | | | | | | | | | | | |
Net Investment Income | | | | | (0.11 | ) | | | | | | | (0.19 | ) | | | | | | | — | | | |
Net Realized Capital Gains | | | | | — | | | | | | | | — | | | | | | | | — | | | |
Total Distributions | | | | | (0.11 | ) | | | | | | | (0.19 | ) | | | | | | | — | | | |
Redemption and Small-Balance Account Fees | | | | | — | | | | | | | | —* | | | | | | | | — | | | |
Net Asset Value, End of Period | | | | $ | 11.12 | | | | | | | $ | 10.90 | | | | | | | $ | 12.62 | | | |
| | | | | | | | | |
| | | | | | | | | | | | | | | | | | | | | | |
Total Return(5) | | | | | 3.05 | % | | | | | | | (12.23 | %) | | | | | | | (3.37 | %) | | |
Net Assets, End of Period (thousands) | | | | $ | 1,918 | | | | | | | $ | 1,740 | | | | | | | $ | 1,615 | | | |
| | | | | | | | | |
Ratios/Supplemental Data | | | | | | | | | | | | | | | | | | | | | | | | |
Ratio of Expenses to Average Net Assets | | | | | 0.95 | % | | | | | | | 0.93 | % | | | | | | | 0.95 | % | | |
Ratio of Expenses to Average Net Assets (Before Waivers and Reimbursement of Expenses and/or Recapture of Previously Waived Fees) | | | | | 5.41 | % | | | | | | | 5.91 | % | | | | | | | 6.35 | % | | |
Ratio of Net Investment Income (Loss) to Average Net Assets | | | | | 1.09 | % | | | | | | | 1.06 | % | | | | | | | 0.78 | % | | |
Ratio of Net Investment Income (Loss) to Average Net Assets (Before Waivers and Reimbursement of Expenses and/or Recapture of Previously Waived Fees) | | | | | (3.37 | %) | | | | | | | (3.92 | %) | | | | | | | (4.62 | %) | | |
Portfolio Turnover | | | | | 14 | % | | | | | | | 20 | % | | | | | | | 25 | % | | |
| * | Amount represents less than $0.005 per share. |
| (1) | For the six months ended April 30, 2016, all ratios for the period have been annualized. Total return and portfolio turnover for the period have not been annualized. |
| (2) | Commenced operations on June 17, 2014. All ratios for the period have been annualized. Total return for the period has not been annualized. |
| (3) | Because of commencement of operations and related preliminary transaction costs, these ratios are not necessary indicative of future ratios. |
| (4) | Per share data calculated using average shares outstanding method. |
| (5) | Total return reflects the rate an investor would have earned on an investment in the Fund during the period. |
The accompanying notes are an integral part of these financial statements.
| | | | |
| 56 | | | | Motley Fool Epic Voyage Fund |
Notes to Financial Statements (Unaudited)
1. Organization:
Motley Fool Independence Fund (“Independence Fund”), Motley Fool Great America Fund (“Great America Fund”), and Motley Fool Epic Voyage Fund (“Epic Voyage Fund”) (each a “Fund” and together the “Funds”) are diversified series of The Motley Fool Funds Trust (the “Trust”), an open-end management investment company (or mutual fund) organized on November 7, 2008, as a statutory trust under the laws of the State of Delaware. The investment objective of each Fund is to achieve long-term capital appreciation. The Independence Fund pursues its objective by investing primarily in common stocks of U.S. companies and of companies that are organized under the laws of other countries around the world. The Great America Fund pursues its objective by investing primarily in common stocks of companies that are organized in the United States and that are engaged in a broad range of industries. The Epic Voyage Fund pursues its objective by investing primarily in common stocks of foreign companies.
Under the Trust’s organizational documents, its Trustees and officers are indemnified against certain liabilities arising out of the performance of their duties for the Trust by the Trust. In addition, in the normal course of business, the Trust enters into contracts with vendors and others that provide for general indemnifications. The Trust’s maximum exposure under these arrangements is unknown as this would involve future claims that may be made against the Trust. However, the Trust believes the risk of loss to be remote.
2. Significant Accounting Policies:
Basis of Preparation
The policies described below are followed consistently by the Funds in the preparation of their financial statements in conformity with accounting principles generally accepted in the United States of America (“U.S. GAAP”) for U.S. mutual funds.
The preparation of financial statements in accordance with U.S. GAAP requires management to make estimates and assumptions that affect the reported amounts and disclosures. Actual results could differ from those estimates.
Security Valuation
Securities held by the Trust are generally valued at market value as of the close of regular trading on each business day (generally 4 pm Eastern time) that the New York Stock Exchange (“NYSE”) is open. Securities, other than stock options, listed on the NYSE or other exchanges are valued on the basis of the last quoted sale price on the exchange on which they are primarily traded. However, if the last sale price on the NYSE is different from the last sale price on any other exchange, the NYSE price will be used. If there are no sales on that day, then the securities are valued at the bid price on the NYSE or other primary exchange for that day. Securities traded in the OTC market are valued on the basis of the last sales price as reported by NASDAQ. If there are no
| | | | |
| The Motley Fool Funds Trust | | | | 57 |
sales on that day, then the securities are valued at the mean between the closing bid and asked prices as reported by NASDAQ. Stock options and stock index options traded on national securities exchanges or on NASDAQ are valued at the mean between the latest bid and asked prices for such options. Securities for which market quotations are not readily available or whose values have been affected by events occurring before the Funds’ pricing time but after the close of the securities markets, and other assets are valued at fair value as determined pursuant to procedures adopted in good faith by the Board of Trustees (the “Board”). Debt securities that mature in fewer than 60 days are valued at amortized cost, which approximates market value (unless the Board determines that this method does not represent fair value), if their original maturity was 60 days or less or by amortizing the value as of the 61st day before maturity, if their original term to maturity exceeded 60 days.
When fair value pricing is employed, the prices of securities used by a fund to calculate its net asset value (the “NAV”) may differ from quoted or published prices for the same securities.
| | | | | | |
| |  You’d think that it would be easy to determine what a share of the Fund is worth – just add up the value of everything it holds, and then divide by the number of shares. It’s not that simple, though. Some foreign markets have different operating hours (when it’s daytime in Chicago, for example, it is night in Shanghai). That means that when we calculate a Fund’s value at the end of the day, the market quotations for some of the securities held by the Fund could be several hours old, and intervening events may have affected what the stocks are worth. In addition, characteristics of the relevant markets and stocks might, in some cases, cast doubt on a particular valuation. For these reasons, we may rely on a pricing service to determine the value of particular securities. It is possible that when a Fund buys or sells the securities, the price on the real market will be different from the value used for the fair-value pricing. You’d think that it would be easy to determine what a share of the Fund is worth – just add up the value of everything it holds, and then divide by the number of shares. It’s not that simple, though. Some foreign markets have different operating hours (when it’s daytime in Chicago, for example, it is night in Shanghai). That means that when we calculate a Fund’s value at the end of the day, the market quotations for some of the securities held by the Fund could be several hours old, and intervening events may have affected what the stocks are worth. In addition, characteristics of the relevant markets and stocks might, in some cases, cast doubt on a particular valuation. For these reasons, we may rely on a pricing service to determine the value of particular securities. It is possible that when a Fund buys or sells the securities, the price on the real market will be different from the value used for the fair-value pricing.
| | | | |
The values of securities held by the Funds and other assets used in computing NAV are generally determined as of the time trading in such securities is completed each day, which, in the case of foreign securities, generally occurs at various times before the close of the NYSE. Trading in securities listed on foreign securities exchanges are valued at the last sale or, if no sales are reported, at the bid price as of the close of the exchange, subject to possible adjustment as described in the Prospectus. Foreign currency exchange rates are also generally determined before the close of the NYSE. On occasion, the values of such securities and exchange rates may be affected by events occurring between the time as of which determinations of such values or exchange rates are made and the close of the NYSE. When such events materially affect the value of securities held by the Funds or their liabilities, such securities and liabilities will be valued at fair value in accordance with procedures adopted in good faith by the Board. In this regard, the Trust has retained a third-party fair-value pricing service to quantitatively analyze the price movement of the Funds’ holdings on foreign exchanges and to automatically determine fair value if the variation from the prior day’s closing price exceeds specified
| | | | |
| 58 | | | | The Motley Fool Funds Trust |
parameters. As of April 30, 2016, such price movements for certain securities had exceeded specified parameters and the third-party fair-value service quantitatively fair valued the affected securities. The Board will review and monitor the methods used by the service to assure itself that securities are valued at their fair values. The values of any assets and liabilities initially expressed in foreign currencies will be converted to U.S. dollars based on exchange rates supplied by a quotation service.
Fair Value Measurements
The Financial Accounting Standards Board (“FASB”) “Fair Value Measurements and Disclosures” defines fair value as the price that a Fund would receive upon selling an investment in an orderly transaction to an independent buyer in the principal market, or in the absence of a principal market, the most advantageous market for the investment. Valuation techniques should maximize the use of observable market data and minimize the use of unobservable inputs. Inputs refer broadly to the assumptions that market participants would use in pricing an asset. Inputs may be observable or unobservable. Observable inputs are inputs that reflect the assumptions market participants would use in pricing the asset or liability developed based on market data obtained from sources independent of the reporting entity. Unobservable inputs are inputs that reflect the reporting entity’s own assumptions about the assumptions market participants would use in pricing the asset or liability developed based on the best information available in the circumstances.
Fair value measurements utilize a hierarchy based on the observability of inputs used to establish fair value.
Investment assets reported at fair value are classified based on the lowest level input that is significant to fair value:
Level 1 — quoted prices in active markets for identical securities
Investments whose values are based on quoted market prices in active markets, and whose values are therefore classified as Level 1 prices, include active listed domestic and foreign equity securities.
Level 2 — observable inputs other than Level 1 (including quoted prices for similar securities, interest rates, prepayment speeds, credit risk, etc.)
Investments that trade in markets that are not considered to be active, but whose values are based on quoted market prices, dealer quotations or valuations provided by alternative pricing sources supported by observable inputs are classified as Level 2 prices. These generally include investment grade corporate bonds and less liquid listed domestic and foreign equity securities.
Level 3 — significant unobservable inputs (including the Fund’s own assumptions in determining the fair value of investments)
| | | | |
| The Motley Fool Funds Trust | | | | 59 |
Investments whose values are classified as Level 3 prices have significant unobservable inputs, as they may trade infrequently or not at all.
The Independence Fund had significant transfers between Level 2 and Level 1 of $7,378,130 during the six months ended April 30, 2016 due to fair value pricing.
The Great America Fund and the Epic Voyage Fund did not have any transfers between Level 1 and Level 2 during the six months ended April 30, 2016.
The following is a summary of the inputs used in valuing the assets and liabilities carried at fair value as of April 30, 2016:
| | |
| | | Independence Fund |
| | | |
Valuation Inputs | | Value |
| | | |
Level 1 — Quoted Prices | | |
U.S. Common Stocks | | $185,227,227 |
Foreign Common Stocks | | |
Banks | | 34,493,353 |
Chemicals | | 6,212,028 |
Commercial Services & Supplies | | 2,174,956 |
Construction & Engineering | | 3,179,750 |
Food Products | | 3,181,071 |
Health Care Equipment & Supplies | | 4,691,379 |
Health Care Providers & Services | | 6,662,132 |
Internet Software & Services | | 7,091,950 |
Life Sciences Tools & Services | | 6,742,015 |
Media | | 6,624,847 |
Metals & Mining | | 1,508,524 |
Pharmaceuticals | | 44,468 |
Semiconductors & Semiconductor Equipment | | 6,841,100 |
Temporary Cash Investment | | 3,690,825 |
Total Level 1 | | 278,365,625 |
Level 2 — Other Significant Observable Inputs | | |
Foreign Common Stocks | | |
Airlines | | 2,695,814 |
Banks | | 6,681,937 |
Food Products | | 10,064,171 |
Internet | | 5,070,701 |
Internet & Catalog Retail | | 11,038,162 |
Leisure Products | | 2,582,486 |
| | | | |
| 60 | | | | The Motley Fool Funds Trust |
| | |
| | | Independence
Fund |
| | | |
Valuation Inputs | | Value |
| | | |
Machinery | | 6,292,959 |
Multiline Retail | | 3,908,177 |
Real Estate Management & Development | | 5,603,846 |
Software | | $ 11,193,782 |
Textiles, Apparel & Luxury Goods | | 4,435,359 |
Transportation Infrastructure | | 5,335,726 |
Participatory Notes | | 11,403,628 |
Total Level 2 | | 86,306,748 |
| Level 3 — Significant Unobservable Inputs | | — |
| Total Value of Investments | | $364,672,373 |
| | | Great America
Fund |
| | | |
Valuation Inputs | | Value |
| | | |
Level 1 — Quoted Prices | | |
U.S. Common Stocks | | $210,920,302 |
Temporary Cash Investment | | 8,016,619 |
| Level 2 — Other Significant Observable Inputs | | — |
| Level 3 — Significant Unobservable Inputs | | — |
| Total Value of Investments | | $218,936,921 |
| | | Epic Voyage
Fund |
| | | |
Valuation Inputs | | Value |
| | | |
Level 1 — Quoted Prices | | |
U.S. Common Stocks | | $ 401,700 |
Foreign Common Stocks | | |
Banks | | 3,433,289 |
Capital Markets | | 652,138 |
Chemicals | | 483,420 |
Commercial Services & Supplies | | 258,658 |
Food Products | | 284,400 |
Health Care Equipment & Supplies | | 577,162 |
| | | | |
| The Motley Fool Funds Trust | | | | 61 |
| | |
| | | Epic Voyage
Fund |
| |
| | | |
Valuation Inputs | | Value |
| |
| | | |
Health Care Providers & Services | | 1,494,676 |
Internet Software & Services | | 854,920 |
Life Sciences Tools & Services | | 821,289 |
Media | | $ 2,002,790 |
Metals & Mining | | 320,650 |
Pharmaceuticals | | 623,762 |
Real Estate Investment Trusts | | 465,201 |
Semiconductors & Semiconductor Equipment | | 1,262,065 |
Temporary Cash Investment | | 1,429,037 |
Total Level 1 | | 15,365,157 |
Level 2 — Other Significant Observable Inputs | | |
Foreign Common Stocks | | |
Airlines | | 336,977 |
Chemicals | | 917,763 |
Electronics | | 645,440 |
Food Products | | 1,944,665 |
Internet | | 1,035,137 |
Internet & Catalog Retail | | 1,543,629 |
Leisure Products | | 896,696 |
Machinery | | 797,699 |
Multiline Retail | | 902,938 |
Personal Products | | 995,658 |
Real Estate Management & Development | | 576,353 |
Software | | 1,502,887 |
Specialty Retail | | 391,237 |
Textiles, Apparel & Luxury Goods | | 477,654 |
Transportation Infrastructure | | 1,116,858 |
Participatory Notes | | 1,549,702 |
Total Level 2 | | 15,631,293 |
Level 3 — Significant Unobservable Inputs | | — |
Total Value of Investments | | $30,996,450 |
The inputs or methodology used for valuing securities are not necessarily an indication of the risk associated with investing in those securities.
| | | | |
| 62 | | | | The Motley Fool Funds Trust |
Dividends and Distributions
| | | | | | | | |
| | | |  When a Fund pays a dividend or other distribution, its net asset value (NAV) per share will decline by the per-share amount of the distribution. Investors are no poorer for this “distribution drop,” however. As this section explains, investors may elect to reinvest their dividend and distribution payments. Doing so would allow them to acquire additional shares at the post-distribution NAV per share. They may also choose to receive a check in the amount of their portion of the dividend or distribution. When a Fund pays a dividend or other distribution, its net asset value (NAV) per share will decline by the per-share amount of the distribution. Investors are no poorer for this “distribution drop,” however. As this section explains, investors may elect to reinvest their dividend and distribution payments. Doing so would allow them to acquire additional shares at the post-distribution NAV per share. They may also choose to receive a check in the amount of their portion of the dividend or distribution.
| | | | |
Each Fund pays dividends from its net investment income and distributes any net capital gains that it realizes. Dividends and capital gains distributions are generally paid once a year. All dividends and other distributions will be reinvested in Fund shares unless a shareholder chooses either to (1) receive dividends in cash, while reinvesting capital gains distributions in additional Fund shares; or (2) receive all distributions in cash. Additionally, each Fund reports details of distribution-related transactions on quarterly account statements. You may not receive a separate confirmation statement for these transactions.
Securities Transactions, Investment Income and Expenses
Securities transactions are accounted for as of the trade date. Costs used in determining realized gains and losses on the sales of investment securities are on the basis of identified cost. Dividend income is recorded on the ex-dividend date. Interest income is recorded on an accrual basis. Discount and premium are amortized using the effective interest method. Expenses directly attributable to a Fund are directly charged to that Fund. Common expenses of the Trust are allocated using methods approved by the Board.
Foreign Currency Translation
The books and records of the Funds are maintained in U.S. dollars as follows: (1) the values of investment securities and other assets and liabilities stated in foreign currencies are translated at the exchange rates prevailing at the end of the period; and
(2) purchases, sales and income are translated at the rates of exchange prevailing on the respective dates of such transactions. Transaction gains or losses resulting from changes in exchange rates during the reporting period or upon settlement from foreign currency transactions are reported in the Statements of Operations for the current period. The Funds do not isolate the portion of gains and losses on investments.
3. Investment Policies and Practices:
The sections below describe some of the different types of investments that may be made by the Funds and the investment practices in which the Funds may engage.
| | | | |
| The Motley Fool Funds Trust | | | | 63 |
| | | | | | | | |
| | | |  When we say that the Funds may invest in other types of securities and in other asset classes, the “may” is well worth emphasizing, as the Fund’s primary focus is the common stock companies that the Adviser believes are both promising and undervalued. When we say that the Funds may invest in other types of securities and in other asset classes, the “may” is well worth emphasizing, as the Fund’s primary focus is the common stock companies that the Adviser believes are both promising and undervalued.
| | | | |
Foreign Securities
The Independence Fund and Epic Voyage Fund invest, and the Great America Fund may invest, in equity and fixed-income securities of foreign companies, including companies located in both developed and emerging-market countries. Investment in foreign securities may include the purchase of American Depositary Receipts (“ADRs”) and other depositary receipts (European Depositary Receipts (“EDRs”) and Global Depositary Receipts (“GDRs”)) that represent indirect interests in securities of foreign issuers. A significant portion of a Fund’s exposure to foreign investments may be composed of such investments. Investments in foreign securities are affected by risk factors generally not associated with investments in the securities of U.S. companies in the U.S. With respect to such securities, there may be more limited information publicly available concerning the issuer than would be the case with respect to domestic securities, foreign issuers may use different accounting standards, and foreign trading markets may not be as liquid as are U.S. markets. Foreign securities also involve such risks as currency risks, possible imposition of withholding or confiscatory taxes, possible currency transfer restrictions, expropriation or other adverse political or economic developments, and the difficulty of enforcing obligations in other countries. These risks may be greater in emerging-market countries and in less-developed countries.
| | | | | | | | |
| | | | If a Fund holds a foreign stock, and the stock is traded on a foreign exchange, with its price denominated in that foreign currency, the value of the stock will change, for the Fund, whenever the relative value of the U.S. dollar and that foreign currency change. To take an imaginary example, if the Fund holds shares in Ruritania Telecom, traded on the Ruritanian Stock Exchange, those shares will be worth more to the Fund if the value of the Ruritanian ploof increases against the U.S. dollar, and vice versa, all other things being equal. | | | | |
The purchase of securities denominated in foreign currencies will subject the value of the Funds’ investments in those securities to fluctuations caused by changes in foreign exchange rates. To hedge against the effects of changes in foreign exchange rates, the Funds may enter into forward foreign currency exchange contracts (“forward contracts”). These contracts represent agreements to exchange an amount of currency at an agreed-upon future date and rate. The Funds will generally use forward contracts only to “lock in” the price in U.S. dollars of a foreign security that a Fund plans to purchase or to sell. In certain limited cases, it may use such contracts to hedge against an anticipated substantial decline in the price of a foreign currency against the U.S. dollar that would adversely affect the U.S. dollar value of foreign securities held by the
| | | | |
| 64 | | | | The Motley Fool Funds Trust |
Fund. Forward contracts will not be used in all cases and, in any event, cannot completely protect the Funds against all changes in the values of foreign securities resulting from fluctuations in foreign exchange rates. The Funds will not enter into a forward contract if, as a result, forward contracts would represent more than 20% of a Fund’s total assets. For hedging purposes, the Funds may also use options on foreign currencies, which expose the Funds to certain risks.
Some foreign securities are traded in the U.S. in the form of ADRs. ADRs are receipts typically issued by a U.S. bank or trust company evidencing ownership of the underlying securities of foreign issuers. EDRs and GDRs are receipts typically issued by foreign banks or trust companies, evidencing ownership of underlying securities issued by either a foreign or U.S. issuer. Generally, depositary receipts in registered form are designed for use in the U.S. and depositary receipts in bearer form are designed for use in securities markets outside the U.S. Depositary receipts may not necessarily be denominated in the same currency as the underlying securities into which they may be converted. Depositary receipts generally involve the same risks as other investments in foreign securities. However, holders of ADRs and other depositary receipts may not have all the legal rights of shareholders and may experience difficulty in receiving shareholder communications.
Types of Fixed-Income Securities
A Fund may invest in bonds and other types of debt obligations of U.S. and foreign issuers. Fixed income securities purchased by a Fund may include, among others, bonds, notes, and debentures issued by corporations; debt securities issued or guaranteed by the U.S. government or one of its agencies or instrumentalities (“U.S. Government Securities”); municipal securities; mortgage-backed and asset-backed securities; and debt securities issued or guaranteed by foreign governments, their agencies, instrumentalities, or political subdivisions, or by government-owned, -controlled, or -sponsored entities, including central banks. These investments also include money market instruments and other types of obligations. Investors should recognize that, although securities ratings issued by Standard & Poor’s® Ratings Services (“S&P”), a division of The McGraw-Hill Companies, Inc., and Moody’s Investors Services©, Inc. (“Moody’s”), provide a generally useful guide as to credit risks, they do not offer any criteria to evaluate interest rate risk. Changes in interest rate levels generally cause fluctuations in the prices of fixed-income securities and will, therefore, cause fluctuations in the NAV per share of a Fund. Subsequent to the purchase of a fixed-income security by a Fund, the ratings or credit quality of such security may deteriorate. Any such subsequent adverse changes in the rating or quality of a security held by a Fund would not require a Fund to sell the security.
Participatory Notes
A participatory note, as used by a Fund, is an instrument used by investors to obtain exposure to an equity investment, including common stocks and warrants, in a local market where direct ownership is not permitted (or is impractical.) In countries where
| | | | |
| The Motley Fool Funds Trust | | | | 65 |
direct ownership by a foreign investor, such as a Fund, is not allowed by local law, such as Saudi Arabia, an investor may gain exposure to the market through a participatory note, which derives its value from a group of underlying equity securities. A participatory note is intended (disregarding the effect of any fees and expenses) to reflect the performance of the underlying equity securities on a one-to-one basis so that investors will not normally gain more in absolute terms than they would have made had they invested in the underlying securities directly, and will not normally lose more than they would have lost had they invested in the underlying securities directly.
In addition to providing access to otherwise closed markets, participatory notes can also provide a less expensive option to direct investment (where ownership by foreign investors is permitted) by reducing registration and transaction costs in acquiring and selling local registered shares. The Funds’ investment manager also believes that participatory notes can offer greater liquidity in markets that restrict the ability of the Funds to dispose of an investment by either restricting transactions by size or requiring registration and/or regulatory approvals.
The purchase of participatory notes involves risks that are in addition to the risks normally associated with a direct investment in the underlying securities. The Fund is subject to the risk that the issuer of the participatory note (i.e., the issuing bank or broker-dealer), which is the only responsible party under the note, is unable or refuses to perform under the terms of the participatory note, also known as counterparty risk.
While the holder of a participatory note is entitled to receive from the bank or broker-dealer any dividends or other distributions paid on the underlying securities, the holder is not entitled to the same rights as an owner of the underlying securities, such as voting rights.
Participatory notes may not be traded on exchanges, are privately issued, and may be illiquid. To the extent a participatory note is determined to be illiquid, it would be subject to the Fund’s limitation on investments in illiquid securities. There can be no assurance that the trading price or value of participatory notes will equal the value of the underlying value of the equity securities they seek to replicate.
Real Estate Investment Trusts
Real estate investment trusts (“REITs”) are pooled investment vehicles that manage a portfolio of real estate or real estate-related loans to earn profits for their shareholders. REITs are generally classified as equity REITs, mortgage REITs, or a combination of equity and mortgage REITs. Investing in REITs involves certain unique risks in addition to those risks associated with investing in the real estate industry in general. Equity REITs may be affected by changes in the value of the underlying property owned by the REITs, while mortgage REITs may be affected by the quality of the borrower on any credit extended. REITs are dependent upon management skills, may not be diversified geographically or by property type, and are subject to heavy cash-flow dependency, default by borrowers, and self-liquidation. REITs must also meet certain requirements
| | | | |
| 66 | | | | The Motley Fool Funds Trust |
under the Internal Revenue Code of 1986, as amended (the “Code”), to avoid entity level tax and be eligible to pass through certain tax attributes of their income to shareholders. REITs are consequently subject to the risk of failing to meet these requirements for favorable tax treatment and of failing to maintain their exemptions from registration under the 1940 Act. REITs are also subject to the risks of changes in the Code, affecting their tax status.
REITs (especially mortgage REITs) are also subject to interest rate risks. When interest rates decline, the value of a REIT’s investment in fixed-rate obligations can be expected to rise. Conversely, when interest rates rise, the value of a REIT’s investment in fixed-rate obligations can be expected to decline. In contrast, as interest rates on adjustable-rate mortgage loans are reset periodically, yields on a REIT’s investments in such loans will gradually align themselves to reflect changes in market interest rates, causing the value of such investments to fluctuate less dramatically in response to interest rate fluctuations than would investments in fixed-rate obligations.
The management of a REIT may be subject to conflicts of interest with respect to the operation of the business of the REIT and may be involved in real estate activities competitive with the REIT. REITs may own properties through joint ventures or in other circumstances in which a REIT may not have control over its investments. REITs may use significant amounts of leverage.
REITs often do not provide complete tax information until after the end of the calendar year. Consequently, because of the delay, it may be necessary for a Fund, if invested in REITs, to request permission to extend the deadline for issuance of Forms 1099-DIV beyond January 31. Alternatively, amended Forms 1099-DIV may be sent. During the six months ended April 30, 2016, the Independence, Great America, and Epic Voyage Funds invested in REITs.
Temporary Investments
During periods of adverse market or economic conditions, a Fund may temporarily invest all or a substantial portion of its assets in high-quality, fixed-income securities, money market instruments, and shares of money market mutual funds, or it may hold cash. At such times, a Fund would not be pursuing its stated investment objective with its usual investment strategies. A Fund may also hold these investments for liquidity purposes. Fixed-income securities will be deemed to be of high quality if they are rated “A” or better by S&P or Moody’s or, if unrated, are determined to be of comparable quality by the Adviser. Money market instruments are high-quality, short-term fixed income obligations (which generally have remaining maturities of one year or less), and may include U.S. Government Securities, commercial paper, certificates of deposit and banker’s acceptances issued by domestic branches of United States banks that are members of the Federal Deposit Insurance Corporation, and repurchase agreements for US. Government Securities. In lieu of purchasing money market instruments, a Fund may purchase shares of money market mutual funds that invest primarily in U.S. Government Securities and repurchase agreements involving those securities, subject to
| | | | |
| The Motley Fool Funds Trust | | | | 67 |
certain limitations imposed by the 1940 Act. A Fund, as an investor in a money market fund, will indirectly bear the fees and expenses of the money market fund. These indirect fees and expenses will be in addition to the fees and expenses of the Funds. Repurchase Agreements involve certain risks not associated with direct investments in debt securities.
Securities Lending
Each Fund may lend its portfolio securities pursuant to a securities lending agreement with the Bank of New York Mellon. The Funds may lend its securities to brokers, dealers, and financial institutions in an amount not exceeding 33 1/3% of the value of the Funds total assets. These loans will be secured by collateral (consisting of cash, U.S. Government Securities, or irrevocable letters of credit) maintained in an amount equal to at least 100% of the market value, determined daily, of the loaned securities. The Funds may, subject to certain notice requirements, at any time call the loan and obtain the return of the securities loaned. The Funds will be entitled to payments equal to the interest and dividends on the loaned securities and may receive a premium for lending the securities. The Funds did not lend any portfolio securities during the six months ended April 30, 2016.
4. Fees and Transactions with Related Parties:
Fund Expenses
Each Fund pays all of its expenses other than those expressly assumed by Motley Fool Asset Management (the “Adviser”). Expenses of each Fund are deducted from the Funds’ total income before dividends are paid.
Investment Adviser
Subject to the supervision of the Board, the Adviser manages the overall investment operations of the Funds in accordance with the Funds’ investment objective and policies and formulates a continuing investment strategy for the Funds pursuant to the terms of the Investment Advisory Agreement between the Adviser and the Trust on behalf of the Funds. The Adviser is a wholly owned subsidiary of The Motley Fool Holdings Inc. (“TMF Holdings”), a multimedia financial-services holding company that also owns The Motley Fool, LLC, which publishes investment information and analysis across a wide range of media, including investment newsletter services, websites, and books. TMF Holdings is controlled by David Gardner and Tom Gardner, along with other private shareholders.
Each Fund pays the Adviser a fee that is computed daily and paid monthly at an annual rate of 0.85% of each Fund’s average daily net assets.
The Adviser has contractually agreed to pay, waive or absorb a portion of the operating expenses of the Investor and Institutional Shares of each Fund through the end of February 2017, to the extent necessary to limit the annual operating expenses of the
| | | | |
| 68 | | | | The Motley Fool Funds Trust |
Investor and Institutional Shares of each Fund (excluding brokerage commissions, taxes, interest expense, acquired fund fees and expenses, and any other extraordinary expenses) to an amount not exceeding the rates listed below annually of each Fund’s average daily net assets.
| | |
Expense Limits |
| |
| | | |
Independence Fund - Investor Shares | | 1.15% |
Independence Fund - Institutional Shares | | 0.95% |
Great America Fund - Investor Shares | | 1.15% |
Great America Fund - Institutional Shares | | 0.95% |
Epic Voyage Fund - Investor Shares | | 1.15% |
Epic Voyage Fund - Institutional Shares | | 0.95% |
The Adviser may recover from the Investor and Institutional Shares of each Fund fees and expenses previously paid, waived, or absorbed for a period of three years after such fees or expenses were incurred, provided that the repayments do not cause the Funds’ operating expenses (excluding brokerage commissions, taxes, interest expense, acquired fund fees and expenses, and any extraordinary expenses) to exceed the expense limits of the Investor and Institutional Class, respectively, of each Fund that were in effect at the time the fees and expenses were paid, waived, or absorbed by the Adviser, as well as the expense limits that are currently in effect, if different. Previously waived fees subject to future recovery by the Adviser are as follows:
| | | | |
Independence Fund | | | | |
| | |
| | | | | |
| | | Recovery Available |
| | |
| | | | | |
Year End | | Investor Shares | | Institutional Shares |
| | |
| | | | | |
2016 | | $ — | | $ — |
2017 | | $ — | | $ 31,638 |
2018 | | $ — | | $ 80,208 |
2019 | | $5,419 | | $ 38,445 |
Total | | $5,419 | | $150,291 |
| | | | |
| The Motley Fool Funds Trust | | | | 69 |
| | | | |
Great America Fund | | | | |
| | |
| | | | | |
| | | Recovery Available |
| | |
| | | | | |
Year End | | Investor Shares | | Institutional Shares |
| | |
| | | | | |
2016 | | $ 77,947 | | $ — |
2017 | | $ 50,490 | | $ 29,553 |
2018 | | $ 55,441 | | $ 85,273 |
2019 | | $ 29,779 | | $ 39,018 |
Total | | $213,657 | | $153,844 |
| | | | |
Epic Voyage Fund | | | | |
| | |
| | | | | |
| | | Recovery Available |
| | |
| | | | | |
Year End | | Investor Shares | | Institutional Shares |
| | |
| | | | | |
2016 | | $179,828 | | $ — |
2017 | | $294,155 | | $ 32,000 |
2018 | | $269,503 | | $ 86,768 |
2019 | | $134,772 | | $ 40,014 |
Total | | $878,258 | | $158,782 |
Trustees Fees
Each Trustee who is not an “interested person,” as defined by the 1940 Act, of the Trust is paid an annual retainer of $40,000. Officers of the Trust, all of whom are members, officers, or employees of the Adviser, or their affiliates, receive no compensation from the Trust.
| | | | |
| 70 | | | | The Motley Fool Funds Trust |
Other Service Providers
Administration and Accounting Services
The Trust has entered into an Administration and Accounting Services Agreement with BNY Mellon. Pursuant to the Administration and Accounting Services Agreement, BNY Mellon provides various administrative and accounting services necessary for the operations of the Trust and the Funds. Services provided by BNY Mellon include facilitating general Fund management; monitoring the Funds’ compliance with federal and state regulations; supervising the maintenance of the Funds’ general ledger, the preparation of the Funds’ financial statements, the determination of the Funds’ daily NAVs, and the payment of dividends and other distributions to shareholders; and preparing specified financial, tax, and other reports. The Funds pay the Administrator an annual fee calculated based upon the Funds’ average net assets. The fee is paid monthly. The Funds also reimburse the Administrator for certain out-of-pocket expenses.
Transfer Agent
BNY Mellon serves as the Funds’ transfer agent and dividend disbursing agent. BNY Mellon receives a fee based mainly upon the number of accounts serviced. Certain minimum fees and transaction charges may apply.
For the six months ended April 30, 2016, BNY Mellon received $605,553 aggregate fees and expenses for services rendered under the various agreements described above.
Custodian
BNY Mellon serves as custodian of the Trust’s assets and is responsible for maintaining custody of the Funds’ cash and investments and retaining subcustodians, including in connection with the custody of foreign securities.
Custodian fees for the Funds are calculated based on the average daily gross assets of the Funds. BNY Mellon also receives other transaction based charges and is reimbursed for out-of-pocket expenses.
For the six months ended April 30, 2016, BNY Mellon received $71,308 in aggregate fees and expenses for services rendered under the custody agreements described above.
Distribution
Foreside Funds Distributors LLC serves as the principal underwriter of the Funds pursuant to an Underwriting Agreement for the limited purpose of acting as statutory underwriter to facilitate the distribution of shares of the Funds. The Funds do not pay any fees to the Distributor in its capacity as Underwriter. The fees are paid by the Adviser.
| | | | |
| The Motley Fool Funds Trust | | | | 71 |
Shareholder Account-Related Services
The Trust’s board has authorized it to pay fees to financial intermediaries, including securities dealers, that provide shareholder account-related services to their customers who own shares of the Trust’s Funds, or to reimburse the Adviser for such expenses it paid on the Trust’s behalf. These financial intermediaries generally have omnibus accounts with the Trust’s Transfer Agent and provide shareholder services or sub-transfer agent services to the shareholders who are their customers. The fees paid by the Funds for these services will not exceed the fees they would have incurred if customers of the financial intermediaries maintained their accounts directly with the Trust. For the six months ended April 30, 2016, Motley Fool Independence Fund paid $80,455 Motley Fool Great America Fund paid $59,235 and Motley Fool Epic Voyage Fund paid $10,854 for such third-party shareholder account-related services.
Redemption Fee
The Funds charge a redemption fee of 2.00% on proceeds from Shares redeemed or exchanged within 90 days following their acquisition. The redemption fee is calculated as a percentage of the net asset value of the total redemption proceeds and is retained by the Funds and accounted for as additional paid-in capital. Certain exceptions to the imposition of the redemption fee exist. Please see the Funds’ prospectus for more information.
Small-Balance Account Fee
The Funds charge a small-balance account fee of $24 annually if the value of an account is less than $10,000. The fee is assessed by redeeming shares from that account. Certain exceptions to the imposition of the small-balance account fee exist. Please see the Funds’ prospectus for more information.
5. Control Persons and Principal Holders:
Any person beneficially owning, directly or indirectly, more than 25% of the outstanding shares of a Fund is presumed to control the Fund. Through the exercise of voting rights with respect to shares of the Fund, such a person may be able to determine the outcome of shareholders voting on matters as to which the approval of shareholders of the Fund is required. Principal holders are persons who own of record or are known by the Fund to own beneficially 5% or more of the outstanding shares of the Fund. As of April 30, 2016, the Trust was not aware of any shareholders who beneficially owned 5% or more of each Fund’s outstanding shares.
| | | | |
| 72 | | | | The Motley Fool Funds Trust |
6. Investment Transactions:
For the six months ended April 30, 2016, the cost of purchases and proceeds from sales and maturities of investment securities for the Funds were as follows:
| | | | |
Cost of Purchases and Proceeds from Sales and Maturities of Long-Term Securities (other than Temporary Cash Investments) |
| | |
| | | | | |
Fund | | Purchases | | Sales and Maturity Proceeds |
| | |
| | | | | |
Independence Fund | | $102,803,480 | | $126,789,718 |
Great America Fund | | 70,872,392 | | 95,243,949 |
Epic Voyage Fund | | 9,339,634 | | 11,833,700 |
7. Shares of Beneficial Interest:
The Trust is authorized to issue an unlimited number of shares of beneficial interest, $.001 par value. The Trust consists of three series, the Independence Fund, the Great America Fund, and the Epic Voyage Fund. All shares of each series represent two classes: Investor Shares and Institutional Shares. The Board has the authority to establish additional series of shares (representing interests in separate investment portfolios of the Trust in addition to these three series) and, subject to applicable rules, may establish two or more classes of shares of any series, with the differences in classes representing differences as to certain expenses and share distribution arrangements. Shares are fully paid and non-assessable and have no pre-emptive or conversion rights.
8. Federal Income Taxes:
Each Fund intends to qualify as a regulated investment company (“RIC”) under Subchapter M of the Code. If so qualified, a Fund will not be subject to federal income tax on that part of its net investment income and net capital gains that it distributes to its shareholders. Certain federal income and excise taxes would be imposed on a Fund if it fails to make certain required distributions of its income to shareholders. The Funds intend, however, to make distributions in a manner that will avoid the imposition of any such taxes. For this reason, no provision for excise or income taxes is required. Each Fund is treated as a separate entity for federal income tax purposes.
The Funds may be subject to taxes imposed by countries in which they invest in issuers existing or operating in such countries. Such taxes are generally based on income earned. The Funds accrue such taxes when the related income is earned. Dividend and interest income is recorded net of non-U.S. taxes paid.
Net investment income (loss) and net realized gains (losses) may differ for financial statements and tax purposes primarily due to differing treatments for foreign currency
| | | | |
| The Motley Fool Funds Trust | | | | 73 |
transactions and investments in partnerships and Passive Foreign Investment Companies (“PFICs”).
Distributions during the years ended October 31, 2015 and October 31, 2014, were characterized as follows for tax purposes:
| | | | | | | | |
Independence Fund | | | | |
| | | | |
| | | | | | | | | |
Tax Year End | | Ordinary
Income | | | | Long-Term
Capital Gain | | |
| | | | |
| | | | | | | | | |
| | | | |
2015 | | $1,957,567 | | | | $6,957,635 | | |
2014 | | $ 835,870 | | | | $3,348,906 | | |
| | | | |
| | | | | | | | | |
Great America Fund | | | | |
| | | | |
| | | | | | | | | |
Tax Year End | | Ordinary
Income | | | | Long-Term
Capital Gain | | |
| | | | |
| | | | | | | | | |
| | | | |
2015 | | $522,273 | | | | $ — | | |
2014 | | $420,625 | | | | $2,142,026 | | |
| | | | |
| | | | | | | | | |
Epic Voyage Fund | | | | |
| | | | |
| | | | | | | | | |
Tax Year End | | Ordinary
Income | | | | Long-Term
Capital Gain | | |
| | | | |
| | | | | | | | | |
| | | | |
2015 | | $701,942 | | | | $ — | | |
2014 | | $277,395 | | | | $74,370 | | |
At October 31, 2015, the components of distributable earnings for the Funds, on a tax basis were as follows:
| | | | | | |
Independence Fund |
| | | |
| | | | | | | |
Undistributed
Ordinary
Income | | Undistributed
Long-Term
Capital Gain | | Capital
Loss
Carryover | | Net Unrealized
Appreciation
(Depreciation)
on Investments |
| | | |
| | | | | | | |
| | | |
$-- | | $169,352 | | $— | | $113,903,426 |
| | | | |
| 74 | | | | The Motley Fool Funds Trust |
| | | | | | | | | | | | | | | |
Great America Fund |
| | | |
| | | | | | | | | | | | | | | | |
Undistributed Ordinary Income | | Undistributed
Long-Term
Capital Gain | | Capital Loss
Carryover | | Net Unrealized
Appreciation
(Depreciation)
on Investments |
| | | |
| | | | | | | | | | | | | | | | |
| | | |
$289,577 | | | | $— | | | | | $ | (569,006) | | | | $56,411,878 | |
| | | |
| | | | | | | | | | | | | | | | |
Epic Voyage Fund |
| | | |
| | | | | | | | | | | | | | | | |
Undistributed
Ordinary
Income | | Undistributed
Long-Term
Capital Gain | | Capital
Loss
Carryover | | Net Unrealized
Appreciation
(Depreciation)
on Investments |
| | | |
| | | | | | | | | | | | | | | | |
| | | |
$319,399 | | | | $— | | | | | $ | (1,050,976) | | | | $268,584 | |
During the year ended October 31, 2015 the Great America Fund utilized capital loss carryovers to offset realized capital gains for Federal income tax purposes in the amount of $953,952.
For federal income tax purposes, the Funds measure capital loss carryovers annually at October 31, their fiscal year end. Capital loss carryovers may be carried forward and applied against future capital gains. Under the Regulated Investment Company Modernization Act of 2010, capital losses incurred by these funds after October 31, 2012 will not be subject to expiration and will retain their character as either short-term or long-term capital losses. In addition, such losses must be utilized prior to the losses incurred in the years preceding enactment. As of October 31, 2015, Great America Fund and Epic Voyage Fund had unexpiring short-term losses of $569,006 and $1,050,976, respectively.
At April 30, 2016, the aggregate cost of investment securities for federal income tax purposes (excluding foreign currency, securities sold short, and derivative related items) and the net unrealized appreciation from investments for those securities having an excess of value over cost and net unrealized depreciation from investments for those securities having an excess of cost over value (based on cost for federal income tax purposes) were as follows:
| | | | |
| The Motley Fool Funds Trust | | | | 75 |
| | | | | | | | |
Independence Fund | |
| | | |
| | | | | | | | | |
Federal Tax Cost | | Net Unrealized Appreciation
(Depreciation) | | Appreciated Securities | | Depreciated Securities | |
| | | |
| | | | | | | | | |
$268,884,955 | | $95,787,418 | | $114,098,955 | | | $(18,311,537 | ) |
| | | |
| | | | | | | | | |
Great America Fund | |
| | | |
| | | | | | | | | |
Federal Tax Cost | | Net Unrealized Appreciation
(Depreciation) | | Appreciated Securities | | Depreciated Securities | |
| | | |
| | | | | | | | | |
$172,004,632 | | $46,932,289 | | $51,665,169 | | | $(4,732,880 | ) |
| | | |
| | | | | | | | | |
Epic Voyage Fund | |
| | | |
| | | | | | | | | |
Federal Tax Cost | | Net Unrealized Appreciation
(Depreciation) | | Appreciated Securities | | Depreciated Securities | |
| | | |
| | | | | | | | | |
$28,728,512 | | $2,267,938 | | $6,710,622 | | | $(4,442,684 | ) |
The differences between book basis and tax basis unrealized appreciation is attributable primarily to the deferral of losses on wash sales and cumulative basis adjustments for partnerships and PFICs.
At October 31, 2015, capital contributions, accumulated undistributed net investment income, and accumulated net realized gain (loss) from investments have been adjusted for current period permanent book/tax differences which arose principally from differing book/tax treatments due to redesignation of dividends paid, foreign currency transactions, and investments in partnerships and PFICs. The following amounts were reclassified within the capital accounts of the Funds:
| | | | |
Independence Fund |
| | |
| | | | | |
| | |
| Paid in Capital | | Accumulated
Undistributed Income | | Accumulated
Net Realized Gain (Loss) on Investments |
| | |
| | | | | |
$-- | | $(652,980) | | $652,980 |
| | | | |
| 76 | | | | The Motley Fool Funds Trust |
| | | | |
Great America Fund | | | | |
| | |
| | | | | |
| | |
| Paid in Capital | | Accumulated
Undistributed Income | | Accumulated
Net Realized Gain (Loss) on Investments |
| | |
| | | | | |
| | |
| $-- | | $(60,279) | | $60,279 |
| | |
| | | | | |
Epic Voyage Fund | | | | |
| | |
| | | | | |
| | |
| Paid in Capital | | Accumulated
Undistributed Income | | Accumulated
Net Realized Gain (Loss) on Investments |
| | |
| | | | | |
| | |
| $-- | | $136,170 | | $(136,170) |
Management has analyzed the Funds’ tax positions and has concluded that no provision for income tax is required in the financial statements. The Funds are not aware of any tax positions for which it is reasonably possible that the total amounts of unrecognized tax benefits will significantly change in the next twelve months. However, management’s conclusions may be subject to review and adjustment at a later date based on certain factors including, but not limited to, further implementation guidance from the FASB, new tax laws, regulations, and administrative interpretations (including court decisions).
9. Subsequent Events:
Subsequent events have been evaluated through the date that the financial statements were issued. All subsequent events determined to be relevant and material to the financial statements have been appropriately recorded or disclosed.
| | | | |
| The Motley Fool Funds Trust | | | | 77 |
Notice to Shareholders (Unaudited)
Information on Proxy Voting
The Trust’s proxy voting guidelines used to determine how to vote proxies relating to portfolio securities and information regarding how the Trust voted proxies relating to portfolio securities of the Funds during the most recent 12-month period ended June 30 are available (i) without charge, upon request, by calling (888) 863-8803; (ii) on the U.S. Securities and Exchange Commission’s (“SEC”) website at http://www.sec.gov; and (iii) on the Funds website at http://www.FoolFunds.com.
Quarterly Schedule of Investments
The Trust provides a complete list of the Funds holdings four times in each fiscal year, at the quarter-ends. For the second and fourth quarters, the Portfolio of Investments appears in the semi-annual and annual reports to shareholders. For the first and third quarters, the Trust files the Portfolio of Investments with the SEC on Form N-Q. Shareholders can obtain the Form N-Q (i) without charge, upon request, by calling (888) 863-8803; (ii) on the SEC’s website at http://www.sec.gov; and (iii) on the Funds website at http://www.FoolFunds.com. The Form N-Q may be reviewed or copied at the SEC Public Reference Room in Washington, D.C. Information on the operation of the Public Reference Room may be obtained by calling (800) SEC-0330.
| | | | |
| 78 | | | | The Motley Fool Funds Trust |
The Motley Fool Funds Trust Privacy Policy
What Does Motley Fool Funds Trust Do With Your Personal Information?
Why?: Financial companies choose how they share your personal information. Federal law gives consumers the right to limit some but not all sharing. Federal law also requires us to tell you how we collect, share, and protect your personal information. Please read this notice carefully to understand what we do.
What?: The type of personal information we collect and share, depends on the product or service you have with us. This information can include:
• Social Security number and transaction history
• Account balances and checking account information
• Account transactions and wire transfer instructions
When you are no longer a customer, we continue to share your information as described in this notice.
How?: All financial companies need to share customers’ personal information to run their everyday business. In the section below, we list the reasons financial companies can share their customers’ personal information; the reasons The Motley Fool Funds Trust chooses to share; and whether you can limit this sharing.
| | | | |
| | | |
Reasons we share your personal information | | Does the Motley Fool Funds Trust share? | | Can you limit this sharing? |
| | | |
| | | | | |
For our everyday business purposes —
such as to process your transaction, maintain your account(s), provide you with necessary information, respond to court orders and legal investigation, or report to credit bureaus | | Yes | | No |
For our marketing purposes —
to offer our products and services to you | | Yes | | Yes |
For joint marketing with other financial companies | | No | | We don’t share |
For our affiliates’ everyday business purposes —
information about your transactions and experiences | | Yes | | No |
For our affiliates’ everyday business purposes —
information about your creditworthiness | | No | | We don’t share |
For our affiliates to market to you | | Yes | | Yes |
For nonaffiliates to market to you | | No | | We don’t share |
To limit our sharing:
• Visit us online: http://www.FoolFunds.com/marketing/EmailRestriction.aspx
| | | | |
| The Motley Fool Funds Trust | | | | 79 |
Please note:
If you are a new customer, we can begin sharing your information 30 days from the days from the date we sent this notice. When you are no longer our customer, we continue to share your information as described in this notice.
However, you can contact us at any time to limit our sharing.
Questions: Call 1-888-863-8803 or go to www.FoolFunds.com
What we do:
How does The Motley Fool Funds Trust protect my personal information?
To protect your personal information from unauthorized access and use, we use security measures that comply with federal law. These measures include physical, electronic, and procedural safeguards, including encryption, authentication, and secured buildings and files.
How does The Motley Fool Funds Trust collect my personal information?
We collect your personal information, for example, when you
• open an account or provide account information
• make deposits or withdrawals from your account
• make a wire transfer or tell us where to send the money
We also collect your personal information from other companies.
Why can’t I limit all sharing?
Federal law gives you the right to limit only
• sharing for affiliates’ everyday business purposes — information about your creditworthiness
• deposits or withdrawals from your account
• sharing for nonaffiliates to market to you
State laws and individual companies may give you additional rights to limit sharing.
What happens when I limit sharing for an account I hold jointly with someone else?
Your choices will apply to everyone on your account.
Definitions:
Affiliates - Companies related by common ownership or control. They can be financial and nonfinancial companies.
Our affiliates include companies with a Motley Fool name; financial companies such as Motley Fool Asset Management, LLC; and nonfinancial companies such as The Motley Fool, LLC and The Motley Fool Holdings, Inc.
Nonaffiliates - Companies not related by common ownership or control. They can be financial and nonfinancial companies.
The Motley Fool Funds Trust does not share with nonaffiliates so they can market to you.
Joint marketing - A formal agreement between nonaffiliated financial companies that together market financial products or services to you.
The Motley Fool Funds Trust doesn’t jointly market.
| | | | |
| 80 | | | | The Motley Fool Funds Trust |
Trustees and Officers
| | | | | | | | | | |
NAME AND AGE (1) | | POSITION(S) HELD WITH THE TRUST | | TERM OF OFFICE AND LENGTH OF TIME SERVED (2) | | PRINCIPAL OCCUPATIONS DURING PAST FIVE YEARS | | NUMBER OF PORTFOLIOS IN FUND COMPLEX
OVERSEEN BY TRUSTEE | | OTHER
DIRECTORSHIPS
HELD BY
TRUSTEE |
| | | | | |
| | | | | | | | | | | |
| | | | | | | INDEPENDENT TRUSTEES | | | | |
Kathleen A. O’Neil 64 | | Trustee | | Indefinite/Since March 2009 | | President/CEO, Liberty Street Advisors (consultancy); Director, BMC Software, Guidance Software, MetLife Bank, N.A., John Carroll University (1999 to 2008). | | 3 | | None |
Carl G. Verboncoeur 63 | | Trustee | | Indefinite/Since July 2012 | | Self-employed consultant since 2009; Chief Executive Officer, Rydex Investments (2003-2009). | | 3 | | SPDR Series Trust (89)(Trustee); SPDR Index Shares Funds (53)(Trustee); SSgA Active ETF Trust (22)(Trustee); SSgA Master Trust (10)(Trustee) |
| | | | | | | INTERESTED TRUSTEE | | | | |
Randy Coon(3) 49 | | Trustee | | Indefinite/Since June 2015 | | Chief Commercial Officer of the Motley Fool, LLC, since 2004. | | 3 | | None |
| | | | | | | OFFICERS | | | | |
Denise Coursey 43 | | President | | One Year/Since June 2015 | | Chief System Officer and Director of IT Project Management, The Motley Fool, Inc. | | N/A | | N/A |
Greg Haygood 37 | | Treasurer | | One Year/Since March 2015 | | Accounting Manager & Assistant Controller, Motley Fool Asset Management. | | N/A | | N/A |
Lawrence T. Greenberg 53 | | Vice President and Secretary | | One Year/Since March 2009 | | SVP and Chief Legal Officer, The Motley Fool Holdings, Inc. (and its predecessor, The Motley Fool, Inc.) (financial publishing). Adjunct professor, Washington College of Law, American University, 2006-present; George Mason University School of Law, 2014-present. Director, The Motley Fool Australia Pty Ltd. (financial publishing) (2010-present). Director, The Motley Fool Canada, ULC (2012-present). Director, The Motley Fool Singapore PTE LTD (2012-present). Director, The Motley Fool Global, Ltd. (2013). Manager, Motley Fool Wealth Management, LLC (January 2013-present). | | N/A | | N/A |
Salvatore Faia 53 | | Chief Compliance Officer | | One Year/Since March 2009 | | President, Vigilant Compliance LLC since 2004; and Director of EIP Growth and Income Fund since 2005. | | N/A | | N/A |
(1) Each Trustee can be contacted by writing to The Motley Fool Funds Trust, 2000 Duke Street, Suite 175, Alexandria, VA 22314.
(2) Each Trustee holds office until the next meeting of shareholders at which Trustees are elected (or otherwise appointed) and serve until his or her successor has been elected or qualified.
(3) Mr. Coon is an“interested person” (as defined by the 1940 Act) of the Trust. Mr Coon is employed by the parent company of the Advisor.
For more information regarding the trustees and officers, please refer to the Statement of Additional Information, which is available, without charge, upon request by calling (888) 863-8803 or visiting www.FoolFunds.com.
| | | | |
| The Motley Fool Funds Trust | | | | 81 |
Board Approval of Advisory Agreement (Unaudited)
At a meeting held in person on March 9, 2016, the Board, including the Trustees who are not “interested persons,” as defined by the Investment Company Act of 1940, as amended, of the Trust or the Adviser (the “Independent Trustees”), approved the continuation of the Advisory Agreement between the Trust and the Adviser pursuant to which the Adviser provides investment advisory services to the Independence Fund, Great America Fund, and Epic Voyage Fund.
In determining whether to approve the Advisory Agreement, the Board exercised its business judgment and considered various pieces of information regarding the Adviser and the Independence Fund, Great America Fund, and Epic Voyage Fund, as well as various factors including those described below that the Board deemed to be relevant. In its deliberations, the Board did not rank the importance of any particular piece of information or factor considered, and it is assumed that each Trustee attributed different weights to the various factors. The following summarizes the materials and principal factors that the Board considered, and the conclusions the Board reached, in approving the Advisory Agreement for the Independence Fund, Great America Fund, and Epic Voyage Fund.
Nature, Extent, and Quality of Services. In its deliberations, the Board considered many factors, including the nature, extent and quality of services provided by the Adviser; particularly, the qualifications and capabilities of the personnel responsible for providing services to the Independence Fund, Great America Fund, and Epic Voyage Fund. The Board was provided with information regarding the Adviser and its personnel, including information regarding the Adviser’s financial condition and the compensation structure for its key investment personnel. The Board reviewed the financial condition of the Adviser to determine that adequate resources were available to continue to provide the level of service expected to be provided to the Independence Fund, Great America, Fund and Epic Voyage Fund. The Board also reviewed the Adviser’s employee compensation structure to determine whether salaries adequately incentivize key investment personnel and encourage retention. With respect to the key investment personnel, the Board also considered the allocation of their time between managing the Funds and other types of clients.
On the basis of its evaluation, the Board determined that the Adviser and its personnel were well-qualified to provide all required, high-quality services to the Independence Fund, Great America Fund, and Epic Voyage Fund. In addition, the Board determined that the Adviser had the appropriate resources to provide such services, and that such resources were suitably allocated between the Funds and the Adviser’s (or its affiliates’) other business segments.
Performance. The Board recognized that a fund’s investment performance is an important factor for a mutual fund board to consider in connection with the approval of an investment advisory agreement. The Board reviewed the performance of the Independence Fund, the Great America Fund, and Epic Voyage Fund over various
| | | | |
| 82 | | | | The Motley Fool Funds Trust |
periods of time as compared to relevant indices and peer group funds. As part of its review, the Board considered a report by an independent third party (the “Report”), which provided an analysis of each Fund’s’ total return performance in comparison to comparable funds.
The Board recognized that the Independence Fund and the Great America Fund underperformed their respective benchmarks over various periods of time, but took into consideration that the Adviser does not manage the Funds to their respective benchmarks. The Board also considered that, relative to their respective peer groups, the Independence Fund and the Great America Fund’s performance compared favorably over various periods of time. The Board also considered that the performance of the Epic Voyage Fund trailed its index and peer group over various periods of time, but took into account the more recent, positive short-term results generated by the Fund. The Board determined that the Independence Fund, and Great America Fund, and Epic Voyage Fund were each delivering reasonable performance results, consistent with the investment strategies of each of these Funds, and that the performance of the Epic Voyage Fund would continue to be closely monitored.
Cost of Services Provided and Profits Realized. The Board also considered the costs of services to be provided by the Adviser and the profits to be realized by the Adviser and its affiliates under the Advisory Agreement, as well as comparative fees and expenses of other mutual funds. The Report presented to and considered by the Board also provided an objective analysis of the Funds’ relative position regarding their level of fees and expenses in comparison to comparable funds. The Board evaluated the advisory fee arrangements of each Fund in light of this information and, in this regard, considered various factors that judicial decisions have specified as pertinent generally.
The Board acknowledged that the fees paid by each of the Independence Fund, Great America Fund and Epic Voyage Fund are within the range of fees paid by a peer group of funds, and that the overall expense ratio for each of the Independence Fund, Great America Fund and Epic Voyage Fund, after giving effect to the Adviser’s expense limitation as currently in effect, is within the range of expense ratios of the peer group funds. It was also noted that the Adviser continues to provide a cap on each Fund’s total expenses and has committed to maintain those caps. Based on the foregoing considerations, the Board determined that it was satisfied that the current advisory fees for the Independence Fund, Great America Fund and Epic Voyage Fund are consistent with applicable standards and are reasonable and fair.
Economies of Scale. The Board recognized the importance of considering economies of scale when evaluating a proposed advisory fee, including the extent to which any such economies of scale would be shared with the Independence Fund, Great America Fund, and Epic Voyage Fund for the benefit of shareholders. It noted that the Funds had not accumulated sufficient assets to benefit to any significant degree from economies of scale and that the Adviser continues to subsidize the Funds to maintain their expense caps.
| | | | |
| The Motley Fool Funds Trust | | | | 83 |
Ancillary Benefits. The Board further considered the potential benefits that might be received by the Adviser due to its relationship with the Independence Fund, Great America Fund, and Epic Voyage Fund. It concluded that the Adviser does receive limited research through soft dollar trading. It was noted that the Adviser receives no other benefits beyond the advisory fee and the soft dollar research, as a result of serving as Adviser to the Independence Fund, Great America Fund, and Epic Voyage Fund.
Conclusion. Based on its review of the information and factors described above, and other considerations deemed pertinent, the Board, including all of the Independent Trustees, unanimously approved the continuation of the Advisory Agreement for an additional one-year period ending February 28, 2017.
| | | | |
| 84 | | | | The Motley Fool Funds Trust |
Investment Adviser
Motley Fool Asset Management, LLC
2000 Duke Street
Suite 175
Alexandria, VA 22314
Administrator and Transfer Agent
BNY Mellon Investment Servicing (US) Inc.
P.O. Box 9780
Providence, RI 02940-9780
Custodian
The Bank of New York Mellon
One Wall Street
New York, NY 10286
Independent Registered Public Accounting Firm
Tait, Weller & Baker, LLP
1818 Market Street, Suite 2400
Philadelphia, PA 19103
Distributor
Foreside Funds Distributors LLC
899 Cassatt Road
400 Berwyn Park, Suite 110
Berwyn, PA 19312
Legal Counsel
Morgan, Lewis & Bockius, LLP
1111 Pennsylvania Avenue NW
Washington, DC 20004
| | | | |
| The Motley Fool Funds Trust | | | | 85 |
Left Blank for Foolish Use
(Not a Part of the Semiannual
Report)
Motley Fool Funds Guiding Principles
At Motley Fool Funds, we aim to get right what we believe much of the fund industry gets wrong. Our approach all begins with a shareholder-centric philosophy that we think is unique.
| | | | |
1 We are — and will remain — significant investors with you in Motley Fool Funds. | | 2 We will manage your investment in Motley Fool Funds as if it were our own. | | 3 We will keep our financial incentives aligned with those of our shareholders. |
| | |
4 We will invest for the long term. We seek to maximize returns while we minimize business, regulatory, financial, and sovereign risks. 7 We will be advocates on your behalf with company managers and boards, in the interest of enhancing the value of your shares. | | 5 We will not impose loads or 12b-1 charges, and we will apply redemption fees only to discourage the short-term trading that can hurt all of a Fund’s investors. 8 We will communicate with our shareholders as clearly and candidly as possible. | | 6 We will recognize that one of our most powerful analytical weapons is the phrase “I don’t know.” In that spirit, we will constantly review our successes and mistakes and remain passionate about learning. 
To stay up-to-date with your Motley Fool Fund, please be sure to join Bill Mann’s Declarations newsletter at: www.FoolFunds.com. |
| | |

Item 2. Code of Ethics.
Not applicable.
Item 3. Audit Committee Financial Expert.
Not applicable.
Item 4. Principal Accountant Fees and Services.
Not applicable.
Item 5. Audit Committee of Listed Registrants.
Not applicable.
Item 6. Investments.
| (a) | Schedule of Investments in securities of unaffiliated issuers as of the close of the reporting period is included as part of the report to shareholders filed under Item 1 of this form. |
Item 7. Disclosure of Proxy Voting Policies and Procedures for Closed-End Management
Investment Companies.
Not applicable.
Item 8. Portfolio Managers of Closed-End Management Investment Companies.
Not applicable.
Item 9. Purchases of Equity Securities by Closed-End Management Investment Company and
Affiliated Purchasers.
Not applicable.
Item 10. Submission of Matters to a Vote of Security Holders.
There have been no material changes to the procedures by which members may recommend nominees to the Registrant’s board of directors, where those changes were implemented after the Registrant last provided disclosure in response to the requirements of Item 407(c)(2)(iv) of Regulation S-K (17 CFR 229.407) (as required by Item 22(b)(15) of Schedule 14A (17 CFR 240.14a-101)), or this Item.
Item 11. Controls and Procedures.
| | (a) | The registrant’s principal executive and principal financial officers, or persons performing similar functions, have concluded that the registrant’s disclosure controls and procedures (as defined in Rule 30a-3(c) under the Investment Company Act of 1940, as amended (the “1940 Act”) (17 CFR 270.30a-3(c))) are effective, as of a date within 90 days of the filing date of the report that includes the disclosure required by this paragraph, based on their evaluation of these controls and procedures required by Rule 30a-3(b) under the 1940 Act (17 CFR 270.30a-3(b)) and Rules 13a-15(b) or 15d-15(b) under the Securities Exchange Act of 1934, as amended (17 CFR 240.13a-15(b) or 240.15d-15(b)). |
| | (b) | There were no changes in the registrant’s internal control over financial reporting (as defined in Rule 30a-3(d) under the 1940 Act (17 CFR 270.30a-3(d))) that occurred during the registrant’s second fiscal quarter of the period covered by this report that has materially affected, or is reasonably likely to materially affect, the registrant’s internal control over financial reporting. |
Item 12. Exhibits.
| | (a)(2) | Certifications pursuant to Rule 30a-2(a) under the 1940 Act and Section 302 of the Sarbanes-Oxley Act of 2002 are attached hereto. |
| | (b) | Certifications pursuant to Rule 30a-2(b) under the 1940 Act and Section 906 of the Sarbanes-Oxley Act of 2002 are attached hereto. |
SIGNATURES
Pursuant to the requirements of the Securities Exchange Act of 1934 and the Investment Company Act of 1940, the registrant has duly caused this report to be signed on its behalf by the undersigned, thereunto duly authorized.
| | | | |
(Registrant) The Motley Fool Funds Trust |
|
By (Signature and Title)* /s/ Denise Coursey |
Denise Coursey, President |
(principal executive officer) |
|
| Date 7/6/2016 |
Pursuant to the requirements of the Securities Exchange Act of 1934 and the Investment Company Act of 1940, this report has been signed below by the following persons on behalf of the registrant and in the capacities and on the dates indicated.
| | | | |
By (Signature and Title)* /s/ Denise Coursey |
Denise Coursey, President |
(principal executive officer) |
|
| Date 7/6/2016 |
|
By (Signature and Title)* /s/ Gregory N. Haygood |
Gregory N. Haygood, Treasurer |
(principal financial officer) |
|
| Date 7/6/2016 |
| * | Print the name and title of each signing officer under his or her signature. |