UNITED STATES
SECURITIES AND EXCHANGE COMMISSION
Washington, D.C. 20549
FORM 20-F
ANNUAL REPORT
PURSUANT TO SECTION 13
OF THE SECURITIES EXCHANGE ACT OF 1934
For the fiscal year ended: December 31, 2014
Commission file number 333-155319
PETROBRAS ARGENTINA S.A.
(Exact name of Registrant as specified in its charter)
N/A
(Translation of Registrant’s name into English)
REPUBLIC OF ARGENTINA
(Jurisdiction of incorporation or organization)
Maipú 1, 22 S.S. Floor
(C1084ABA) Ciudad Autónoma de Buenos Aires
República Argentina
(Address of principal executive offices)
Luis Sas
Maipú 1, 22th Floor
(C1084ABA) Ciudad Autónoma de Buenos Aires
República Argentina
Tel: 54-11-4344-6694
Fax: 54-11-4344-6398
E-mail: luis.sas@petrobras.com
(Name, Telephone, E-mail and/or Facsimile number and Address of Company Contact Person)
Securities registered or to be registered pursuant to Section 12(b) of the Act:
| | |
Title of each Class | | Name of each Exchange on which Registered |
| American Depositary Shares, each representing 10 Class B shares of Petrobras Argentina S.A. | | New York Stock Exchange |
| |
| Class B shares of Petrobras Argentina S.A. | | New York Stock Exchange* |
| * | Not for trading, but only in connection with the registration of American Depositary Shares pursuant to the requirements of the New York Stock Exchange. |
Securities registered or to be registered pursuant to Section 12(g) of the Act: None
Securities for which there is a reporting obligation pursuant to Section 15(d) of the Act: None
The number of outstanding shares of each of the issuer’s classes of capital or common stock as of December 31, 2014 was:
Petrobras Argentina S.A. Class B ordinary shares, nominal value Ps.1.00 per share 2,019,236,820
Indicate by check mark if the registrant is a well-known seasoned issuer, as defined in Rule 405 of the Securities Act.
Yes ¨ No x
If this report is an annual or transitional report, indicate by check mark if the registrant is not required to file reports pursuant to section 13 or 15(d) of the Securities Exchange Act of 1934.
Yes ¨ No x
Indicate by check mark whether the registrant (1) has filed all reports required to be filed by Section 13 or 15(d) of the Securities Exchange Act of 1934 during the preceding 12 months (or for such shorter period that the registrant was required to file such reports) and (2) has been subject to such filing requirements for the past 90 days:
Yes x No ¨
Indicate by check mark whether the registrant has submitted electronically and posted on its Web site, if any, every Interactive Data File required to be submitted and posted pursuant to Rule 405 of Regulation S-T (§232.405 of this chapter) during the preceding 12 months (or for such shorter period that the registrant was required to submit and post such files).
Not applicable.
Indicate by check mark whether the registrant is a large accelerated filer, an accelerated filer, or a non-accelerated filer. See definitions of “accelerated filer” and “large accelerated filer” in Rule 12b-2 of the Exchange Act. (Check one):
Large accelerated filer ¨ Accelerated filer x Non-Accelerated filer ¨
Indicate by check mark which basis of accounting the registrant has used to prepare the financial statements included in this filing:
U.S. GAAP ¨ IFRS x Other ¨
If “Other” has been checked in response to the previous question, indicate by check mark which financial statement item the registrant has elected to follow:
Item 17 ¨ Item 18 ¨
If this is an Annual Report, indicate by check mark whether the registrant is a shell company (as defined in Rule 12b-2 of the Exchange Act).
Yes ¨ No x
TABLE OF CONTENTS
REFERENCES
This annual report on Form 20-F (this “Annual Report”) has been filed by Petrobras Argentina S.A. (“PESA”) (formerly Petrobras Energía S.A.).
All references in this Annual Report to:
“Petrobras Argentina,” “Petrobras Energía,” “PESA,” “the Company,” “we,” “us,” “our,” and similar terms, refer to Petrobras Argentina S.A. and its subsidiaries, but exclude associates and joint ventures. See “Item 4. Information on the Company—History and Development.”
“Petrobras Energía Participaciones” and “PEPSA” refer to Petrobras Energía Participaciones S.A. Prior to July 2003, the corporate name of PEPSA was Pérez Companc S.A.
“Petrobras” refers to Petróleo Brasileiro S.A – PETROBRAS.
“Argentine pesos,” “pesos” and “Ps.” refer to the currency of the Republic of Argentina.
“U.S. dollars” and “U.S.$” refer to the currency of the United States of America.
“Argentina” refers to the Republic of Argentina, and “Argentine government” refers to the federal government of Argentina.
“Tons” refers to metric tons.
FORWARD LOOKING STATEMENTS
Some of the information included in this Annual Report contains information that is forward-looking, including statements regarding capital expenditures, competition and sales, oil and gas reserves and prospects, and trends in the oil and gas, refining, distribution, petrochemicals and electricity industries.
Certain statements contained in this Annual Report are forward-looking statements and are not based on historical facts, such as statements containing the words “believe,” “may,” “will,” “estimate,” “continue,” “anticipate,” “intend,” “expect” and similar words. These forward-looking statements are subject to risks, uncertainties and assumptions, including those discussed in “Item 3. Key Information—Risk Factors” and elsewhere in this Annual Report. Factors that could cause actual results to differ materially and adversely include, but are not limited to:
| | • | | Changes in general economic, business, political or other conditions in Argentina or changes in general economic or business conditions in other Latin American countries; |
| | • | | The availability of financing at reasonable terms to Argentine companies, such as us; |
| | • | | The failure of governmental authorities to approve proposed measures or transactions described in this Annual Report; |
| | • | | The volume of crude oil, oil products and natural gas we produce and sell; |
| | • | | Changes in the price of hydrocarbons and oil products; |
| | • | | Changes to our capital expenditure plans; |
| | • | | Changes in domestic and international laws, regulations or policies affecting our operations,including with respect to tax and environmental matters; |
| | • | | Fluctuations in the Argentine peso/U.S. dollar exchange rate; |
| | • | | Our ability to renew certain concessions; |
| | • | | The ability to develop and monetize non-conventional reserves; |
| | • | | Changes to our reserves estimates; |
| | • | | Other factors discussed under “Risk Factors” in Item 3 of this Annual Report. |
1
Forward-looking statements speak only as of the date they were made. We undertake no obligation to update any forward-looking statement or statements to reflect events or circumstances after the date on which the statement is made or to reflect the occurrence of unanticipated events. New factors emerge from time to time, and it is not possible for us to predict all of these factors. In light of these limitations, you should not place undue reliance on forward-looking statements contained in this Annual Report.
PART I
| Item 1. | IDENTITY OF DIRECTORS, SENIOR MANAGEMENT AND ADVISORS |
Not applicable.
| Item 2. | OFFER STATISTICS AND EXPECTED TIMETABLE |
Not applicable.
SELECTED FINANCIAL DATA
The financial information set forth below may not contain all of the financial information that you should consider when making an investment decision. This information should be read in conjunction with, and is qualified in its entirety by reference to, the “Risk Factors” included in this Annual Report. See “Item 3. Key Information—Risk Factors.” You should also carefully read our audited consolidated financial statements and “Item 5. Operating and Financial Review and Prospects” included in this Annual Report for additional financial information about us.
Our audited consolidated financial statements included in this Annual Report (“Audited Consolidated Financial Statements”) are prepared in accordance with International Financial Reporting Standards (“IFRS”) as issued by the International Accounting Standards Board ( “IASB”).
Presentation of Financial Information in accordance with IFRS
Since January 1, 2012, in compliance with adopted accounting standards applicable to public companies in Argentina and regulations introduced by theComisión Nacional de Valores (the Argentine Securities Commission, or “CNV”), PESA has been required to prepare its statutory financial statements in accordance with IFRS as issued by the IASB.
Consistent with Item 18 of Form 20-F, we continue to provide the disclosure required under Accounting Standards Codification (“ASC”) 932 of the Financial Accounting Standards Board (the “FASB”) relating to extractive activities—Oil and Gas (formerly, FASB Statement of Financial Accounting Standards No. 69—Disclosures about Oil and Gas Producing Activities) (“ASC Topic 932”), as is required regardless of the basis of accounting on which we prepare our financial statements.
Consideration of the effects of inflation
According to inflation data published by theInstituto Nacional de Estadística y Censos (the Argentine national statistics and census institute, or the “INDEC”), for the years from 2010 to 2014, the Argentine consumer price index increased 10.9%, 9.5%, 10.8%, 10.9% and 23.9% in each of those years, respectively, and the wholesale price index increased 14.6%, 12.7%, 13.1%, 14.8% and 28.3% in each of those years, respectively. However, since 2007, the INDEC has experienced a process of institutional and methodological reforms that have given rise to controversy with respect to the reliability of the information that it produces. Reports published by the International Monetary Fund (the “IMF”) state that their staff also uses alternative measures of inflation for Argentine macroeconomic surveillance, including data produced by private sources, which have shown inflation rates considerably higher than those published by the INDEC since 2007. The IMF has also censured Argentina for failing to make sufficient progress, as required under the Articles of Agreement of the IMF, in adopting remedial measures to address the quality of official data, including inflation and gross domestic product (“GDP”) data. In February 2014, the INDEC released a new inflation index that measures prices on goods across the country and replaces the previous index that only measured inflation in the urban sprawl of the City of Buenos Aires. Even though the new methodology brought inflation statistics closer to those estimated by private sources, there are still differences between official inflation data and private estimates. See “Item 3. Key Information—Risk Factors—Factors Relating to Argentina—Economic and political instability in Argentina has affected and may continue to adversely affect our financial condition and results of operations.”
In accordance with IFRS, the financial information set forth in this Annual Report has not been adjusted to reflect inflation. Inflation could therefore affect the comparability among the different periods presented herein.
2
The following tables set forth selected consolidated financial data of the Company presented in Argentine pesos and prepared in accordance with IFRS as issued by the IASB, as of and for each of the years ended December 31, 2014, 2013, 2012, 2011 and 2010. The selected consolidated financial data as of and for the years ended December 31, 2014, 2013 and 2012, has been derived from our Audited Consolidated Financial Statements, which were audited by Price Waterhouse & Co. S.R.L., an independent registered public accounting firm in Buenos Aires, Argentina, member firm of PricewaterhouseCoopers International Limited network, (“PwC”), which are included elsewhere herein. The selected consolidated financial data as of and for the years ended December 31, 2011 and 2010 has been derived from our audited financial statements, which were audited by KPMG and are not included herein.
The financial data as of and for the years ended December 31, 2012 and December 31, 2011 were modified at the time we issued our Audited Consolidated Financial Statements as of and for the year ended December 31, 2013 to retrospectively apply the change in accounting for employee benefit plans reflected in IAS 19 Employee Benefits as issued by the IASB. Selected financial data for the fiscal year ended December 31, 2010 set forth below do not reflect the same changes in IFRS, as the effects were not material.
Petrobras Argentina S.A.—Consolidated Statement of Income and Comprehensive Income Data
| | | | | | | | | | | | | | | | | | | | |
| | | Year Ended December 31, | |
| | | 2014 | | | 2013 | | | 2012 | | | 2011 | | | 2010 | |
| | | (in millions of pesos, except for per share amounts and number of shares or as otherwise indicated) | |
| | | | | |
Sales | | | 20,738 | | | | 15,340 | | | | 12,765 | | | | 11,104 | | | | 10,310 | |
Cost of sales | | | (14,490 | ) | | | (11,260 | ) | | | (9,619 | ) | | | (8,462 | ) | | | (7,474 | ) |
| | | | | | | | | | | | | | | | | | | | |
Gross profit | | | 6,248 | | | | 4,080 | | | | 3,146 | | | | 2,642 | | | | 2,836 | |
Administrative and selling expenses | | | (2,416 | ) | | | (1,797 | ) | | | (1,430 | ) | | | (1,222 | ) | | | (1,329 | ) |
Exploration expenses | | | (70 | ) | | | (82 | ) | | | (212 | ) | | | (391 | ) | | | (190 | ) |
Other operating expenses, net | | | (779 | ) | | | (571 | ) | | | (121 | ) | | | (831 | ) | | | (454 | ) |
Share of net loss of equity accounted investments | | | (1,735 | ) | | | (279 | ) | | | (148 | ) | | | (36 | ) | | | (97 | ) |
| | | | | | | | | | | | | | | | | | | | |
Operating income | | | 1,248 | | | | 1,351 | | | | 1,235 | | | | 162 | | | | 766 | |
Financial income | | | 828 | | | | 700 | | | | 442 | | | | 289 | | | | 291 | |
Financial costs | | | (756 | ) | | | (647 | ) | | | (512 | ) | | | (465 | ) | | | (547 | ) |
| | | | | | | | | | | | | | | | | | | | |
Income (loss) before income tax | | | 1,320 | | | | 1,404 | | | | 1,165 | | | | (14 | ) | | | 510 | |
Income tax | | | (742 | ) | | | (552 | ) | | | (492 | ) | | | (15 | ) | | | (154 | ) |
| | | | | | | | | | | | | | | | | | | | |
Income (loss) from continuing operations | | | 578 | | | | 852 | | | | 673 | | | | (29 | ) | | | 356 | |
Income from discontinued operations | | | — | | | | — | | | | — | | | | 706 | | | | 275 | |
| | | | | | | | | | | | | | | | | | | | |
Net income | | | 578 | | | | 852 | | | | 673 | | | | 677 | | | | 631 | |
| | | | | | | | | | | | | | | | | | | | |
Actuarial profits and losses | | | 1 | | | | 10 | | | | (7 | ) | | | 15 | | | | — | |
Foreign currency translation | | | 518 | | | | 278 | | | | 45 | | | | (133 | ) | | | 29 | |
Other comprehensive income related to our equity accounted investments | | | — | | | | — | | | | 7 | | | | 12 | | | | 6 | |
| | | | | | | | | | | | | | | | | | | | |
Total other comprehensive income | | | 1,097 | | | | 1,140 | | | | 718 | | | | 571 | | | | 666 | |
| | | | | | | | | | | | | | | | | | | | |
Earnings (losses) per share basic/diluted (in pesos): | | | | | | | | | | | | | | | | | | | | |
From continuing operations | | | 0.227 | | | | 0.386 | | | | 0.306 | | | | (0.012 | ) | | | 0.173 | |
From discontinued operations | | | — | | | | — | | | | — | | | | 0.350 | | | | 0.136 | |
| | | | | | | | | | | | | | | | | | | | |
Total | | | 0.227 | | | | 0.386 | | | | 0.306 | | | | 0.337 | | | | 0.309 | |
| | | | | | | | | | | | | | | | | | | | |
Net income attributable to: | | | | | | | | | | | | | | | | | | | | |
Shareholders of the Company | | | 458 | | | | 779 | | | | 618 | | | | 681 | | | | 625 | |
Non-controlling interest | | | 120 | | | | 73 | | | | 55 | | | | (4 | ) | | | 6 | |
| | | | | | | | | | | | | | | | | | | | |
Total | | | 578 | | | | 852 | | | | 673 | | | | 677 | | | | 631 | |
| | | | | | | | | | | | | | | | | | | | |
Total comprehensive income for the year: | | | | | | | | | | | | | | | | | | | | |
From continuing operations | | | 1,097 | | | | 1,140 | | | | 718 | | | | (1 | ) | | | 362 | |
From discontinued operations | | | — | | | | — | | | | — | | | | 572 | | | | 304 | |
| | | | | | | | | | | | | | | | | | | | |
Total | | | 1,097 | | | | 1,140 | | | | 718 | | | | 571 | | | | 666 | |
| | | | | | | | | | | | | | | | | | | | |
3
| | | | | | | | | | | | | | | | | | | | |
| | | Year Ended December 31, | |
| | | 2014 | | | 2013 | | | 2012 | | | 2011 | | | 2010 | |
| | | (in millions of pesos, except for per share amounts and number of shares or as otherwise indicated) | |
Total comprehensive income attributable to: | | | | | | | | | | | | | | | | | | | | |
Shareholders of the Company | | | 741 | | | | 896 | | | | 624 | | | | 575 | | | | 660 | |
Non-controlling interest | | | 356 | | | | 244 | | | | 94 | | | | (4 | ) | | | 6 | |
| | | | | | | | | | | | | | | | | | | | |
Total | | | 1,097 | | | | 1,140 | | | | 718 | | | | 571 | | | | 666 | |
| | | | | | | | | | | | | | | | | | | | |
4
Petrobras Argentina S.A.—Consolidated Statement of Financial Position Data
| | | | | | | | | | | | | | | | | | | | |
| | | Year Ended December 31, | |
| | | 2014 | | | 2013 | | | 2012 | | | 2011 | | | 2010 | |
| | | (in millions of pesos, except for per share amounts and number of shares or as otherwise indicated) | |
Statements of Financial Position | | | | |
Assets | | | | |
Current assets | | | | |
Cash and cash equivalents | | | 2,278 | | | | 1,193 | | | | 1,260 | | | | 1,192 | | | | 2,113 | |
Other investments | | | 33 | | | | 23 | | | | 20 | | | | 21 | | | | 42 | |
Trade receivables | | | 2,945 | | | | 2,519 | | | | 2,168 | | | | 1,871 | | | | 1,468 | |
Other receivables | | | 1,676 | | | | 1,551 | | | | 1,553 | | | | 1,070 | | | | 1,761 | |
Inventories | | | 1,951 | | | | 1,310 | | | | 1,023 | | | | 970 | | | | 1,052 | |
Assets classified as held for sale | | | — | | | | — | | | | — | | | | — | | | | 142 | |
| | | | | | | | | | | | | | | | | | | | |
Total current assets | | | 8,883 | | | | 6,596 | | | | 6,024 | | | | 5,124 | | | | 6,578 | |
Non-current assets | | | | | | | | | | | | | | | | | | | | |
Trade receivables | | | 60 | | | | 73 | | | | 86 | | | | 211 | | | | 223 | |
Other receivables | | | 163 | | | | 245 | | | | 238 | | | | 896 | | | | 283 | |
Deferred income tax assets | | | 47 | | | | — | | | | — | | | | — | | | | — | |
Inventories | | | 67 | | | | 58 | | | | 45 | | | | 39 | | | | 35 | |
Other investments | | | 153 | | | | 301 | | | | 279 | | | | 348 | | | | 271 | |
Investments in associates | | | 2,979 | | | | 3,568 | | | | 3,006 | | | | 2,943 | | | | 2,969 | |
Investments in joint ventures | | | 491 | | | | 497 | | | | 689 | | | | 724 | | | | 691 | |
Property, plant and equipment | | | 11,589 | | | | 9,524 | | | | 8,480 | | | | 7,056 | | | | 7,295 | |
| | | | | | | | | | | | | | | | | | | | |
Total non-current assets | | | 15,549 | | | | 14,266 | | | | 12,823 | | | | 12,217 | | | | 11,767 | |
| | | | | | | | | | | | | | | | | | | | |
Total assets | | | 24,432 | | | | 20,862 | | | | 18,847 | | | | 17,341 | | | | 18,345 | |
| | | | | | | | | | | | | | | | | | | | |
Liabilities | | | | | | | | | | | | | | | | | | | | |
Current liabilities | | | | | | | | | | | | | | | | | | | | |
Accounts payable | | | 3,045 | | | | 2,553 | | | | 1,863 | | | | 1,572 | | | | 1,568 | |
Short-term loans | | | 92 | | | | 208 | | | | 1,108 | | | | 40 | | | | 584 | |
Payroll and social security taxes | | | 371 | | | | 304 | | | | 258 | | | | 194 | | | | 184 | |
Taxes payable | | | 1,134 | | | | 578 | | | | 470 | | | | 310 | | | | 442 | |
Provisions | | | 1,253 | | | | 385 | | | | 643 | | | | 516 | | | | 505 | |
| | | | | | | | | | | | | | | | | | | | |
Total current liabilities | | | 5,895 | | | | 4,028 | | | | 4,342 | | | | 2,632 | | | | 3,283 | |
Non-current liabilities | | | | | | | | | | | | | | | | | | | | |
Accounts payable | | | 4 | | | | 7 | | | | 172 | | | | 184 | | | | 166 | |
Long-term loans | | | 2,587 | | | | 2,024 | | | | 1,558 | | | | 2,182 | | | | 3,403 | |
Employment benefit obligations | | | 438 | | | | 336 | | | | 269 | | | | 195 | | | | 157 | |
Deferred income tax liabilities | | | 499 | | | | 548 | | | | 354 | | | | 247 | | | | 398 | |
Provisions | | | 2,394 | | | | 2,224 | | | | 1,581 | | | | 1,553 | | | | 985 | |
| | | | | | | | | | | | | | | | | | | | |
Total non-current liabilities | | | 5,922 | | | | 5,139 | | | | 3,934 | | | | 4,361 | | | | 5,109 | |
| | | | | | | | | | | | | | | | | | | | |
Total liabilities | | | 11,817 | | | | 9,167 | | | | 8,276 | | | | 6,993 | | | | 8,392 | |
| | | | | | | | | | | | | | | | | | | | |
Equity | | | | | | | | | | | | | | | | | | | | |
Capital Stock | | | 2,019 | | | | 2,019 | | | | 2,019 | | | | 1,010 | | | | 1,010 | |
Other items in Capital | | | 2,186 | | | | 2,186 | | | | 2,186 | | | | 2,186 | | | | 2,186 | |
Reserves income | | | 7,144 | | | | 6,508 | | | | 5,953 | | | | 448 | | | | 448 | |
Other | | | (693 | ) | | | (693 | ) | | | (693 | ) | | | — | | | | — | |
Unappropriated retained earnings | | | 458 | | | | 752 | | | | 528 | | | | 6,635 | | | | 6,150 | |
Other comprehensive income | | | 472 | | | | 189 | | | | 72 | | | | 66 | | | | 152 | |
| | | | | | | | | | | | | | | | | | | | |
Total equity attributable to: | | | | | | | | | | | | | | | | | | | | |
Shareholders of the Company | | | 11,586 | | | | 10,961 | | | | 10,065 | | | | 10,345 | | | | 9,946 | |
Non-controlling interest | | | 1,029 | | | | 734 | | | | 506 | | | | 3 | | | | 7 | |
| | | | | | | | | | | | | | | | | | | | |
Total equity | | | 12,615 | | | | 11,695 | | | | 10,571 | | | | 10,348 | | | | 9,953 | |
| | | | | | | | | | | | | | | | | | | | |
5
| | | | | | | | | | | | | | | | | | | | |
| | | Year Ended December 31, | |
| | | 2014 | | | 2013 | | | 2012 | | | 2011 | | | 2010 | |
| | | (in millions of pesos, except for per share amounts and number of shares or as otherwise indicated) | |
Number of shares outstanding (in millions) | | | | | | | | | | | | | | | | | | | | |
Class B | | | 2,019 | | | | 2,019 | | | | 2,019 | | | | 1,010 | | | | 1,010 | |
Dividends per share (in pesos)(1) | | | 0.057 | | | | — | | | | 0.105 | | | | 0.091 | | | | 0.136 | |
Dividends per share (in U.S.$. dollars)(1)(2) | | | 0.007 | | | | — | | | | 0.022 | | | | 0.022 | | | | 0.035 | |
| (1) | Amounts calculated on outstanding capital stock of 2,019 million shares. |
| (2) | Amounts translated into U.S. dollars at the exchange rate at the date of payment. |
EXCHANGE RATES
From April 1, 1991 until the end of 2001, Law No. 23,928 and Decree No. 529/91 (together, the “Convertibility Law”) established a fixed exchange rate under which theBanco Central de la República Argentina(the Central Bank of Argentina, or the “Central Bank”) was obliged to sell U.S. dollars at a fixed rate of one peso per U.S. dollar. On January 6, 2002, the Argentine Congress enacted the Public Emergency and Foreign Exchange System Reform Law No. 25,561 (the “Public Emergency Law”), which suspended certain provisions of the Convertibility Law, including the fixed exchange rate of Ps.1.00 to U.S.$1.00, and granted the Argentine government the power to set the exchange rate between the peso and foreign currencies and to issue regulations related to the foreign exchange market. Following a brief period during which the Argentine government established a temporary dual exchange rate system, pursuant to the Public Emergency Law, the peso has been allowed to float freely against other currencies since February 2002, although the Central Bank has the power to intervene by buying and selling foreign currency for its own account, a practice in which it engages on a regular basis.
After several years of moderate variations in the nominal exchange rate, in 2012 the peso lost approximately 14% of its value with respect to the U.S. dollar. This was followed in 2013 and 2014 by a devaluation of the peso with respect to the U.S. dollar that exceeded 30%, including a loss of approximately 24% in January 2014. There can be no assurance that the Argentine peso will not depreciate or appreciate again in the future.
The following table sets forth the annual high, low, average and period-end exchange rates for the periods indicated, expressed in Argentine pesos per U.S. dollar and not adjusted for inflation, based on rates quoted by the Central Bank. The Federal Reserve Bank of New York does not report a buying rate for pesos.
| | | | | | | | | | | | | | | | |
| | | Argentine peso per U.S. dollar | |
| | | High | | | Low | | | Average (1) | | | Period-end | |
Year ended December 31, | | | | | | | | | | | | | | | | |
| | | | |
2014 | | | 8.56 | | | | 6.52 | | | | 8.12 | | | | 8.55 | |
2013 | | | 6.49 | | | | 4.92 | | | | 5.47 | | | | 6.49 | |
2012 | | | 4.91 | | | | 4.30 | | | | 4.55 | | | | 4.91 | |
2011 | | | 4.30 | | | | 3.97 | | | | 4.13 | | | | 4.30 | |
2010 | | | 3.99 | | | | 3.79 | | | | 3.91 | | | | 3.98 | |
| | | | |
Month: | | | | | | | | | | | | | | | | |
| | | | |
April 2015(2) | | | 8.86 | | | | 8.82 | | | | 8.84 | | | | 8.86 | |
March 2015 | | | 8.82 | | | | 8.73 | | | | 8.78 | | | | 8.82 | |
February 2015 | | | 8.72 | | | | 8.64 | | | | 8.68 | | | | 8.72 | |
January 2015 | | | 8.63 | | | | 8.55 | | | | 8.60 | | | | 8.63 | |
December 2014 | | | 8.56 | | | | 8.52 | | | | 8.55 | | | | 8.55 | |
November 2014 | | | 8.53 | | | | 8.50 | | | | 8.51 | | | | 8.53 | |
| (1) | The figures provided represent the average of the exchange rates at the close of trading on each business day during the relevant period. |
| (2) | Through April 15, 2015. |
6
EXCHANGE CONTROLS
Prior to December 1989, the Argentine foreign exchange market was subject to exchange controls. From December 1989 until April 1991, Argentina had a freely floating exchange rate for all foreign currency transactions, and the transfer of dividend payments in foreign currency abroad and the repatriation of capital were permitted without prior approval of the Central Bank. From April 1, 1991, when the Convertibility Law became effective, until December 21, 2001, when the Central Bank decided to close the foreign exchange market, the Argentine currency was freely convertible into U.S. dollars.
On December 3, 2001, the Argentine government imposed a number of monetary and currency exchange control measures through Decree No. 1,570/01, which included restrictions on the free disposition of funds deposited with banks and tight restrictions on transferring funds abroad without the Central Bank’s prior authorization subject to specific exceptions for transfers related to foreign trade. Between 2002 and the first half of 2011, the Central Bank gradually eased these restrictions.
In June 2003, the Argentine government set restrictions on capital flows into Argentina, which mainly consisted of a prohibition against the transfer abroad of any funds until 180 days after their entry into the country. Furthermore, in June 2005, through Decree No. 616/05, the Argentine government established further restrictions on capital flows into Argentina, including increasing the period that certain incoming funds must remain in Argentina to 365 calendar days and requiring that 30% of such incoming funds be deposited with a bank in Argentina in a non-transferable, non-interest-bearing account for 365 calendar days. Export and import financing operations, as well as primary public offerings of corporate bonds listed on self-regulated markets, among others, are exempt from the foregoing provision.
On October 25, 2011, the Argentine government issued Decree No. 1,722/11, providing that all foreign currency revenues obtained from exports made by mining and oil and gas companies must be repatriated and sold within the local foreign exchange market, which is the general regime applicable to revenues generated by Argentine exports. Prior to the issuance of this decree, companies engaged in exploration and development of hydrocarbons benefited from a special regime that allowed them to retain overseas up to 70% of the proceeds of certain exports.
Since October 2011, the Argentine government has expanded the restrictions on access to the foreign exchange market and transfers of foreign currency abroad. Through a combination of foreign exchange and tax regulations, the Argentine authorities have significantly curtailed access to foreign exchange by individuals and private sector entities. Current foreign exchange regulations include, among others, the obligation to obtain prior approval by the Central Bank of certain foreign exchange transactions such as payments relating to royalties, services or fees payable to related parties of Argentine companies outside Argentina (pursuant to section 3.4 of Central Bank Communication “A” 5377, issued December 14, 2012), the suspension as from July 2012 of section 4.2 of Central Bank Communication “A” 5236, issued October 27, 2011, which previously permitted purchases of foreign exchange in an amount of up to U.S.$2 million per month to create or increase portfolio investments outside of Argentina, and limits to the net position in foreign exchange holdings of financial institutions (pursuant to Central Bank Communication “A” 5536, issued on February 4, 2014). See “—Risk Factors—Factors Relating to Argentina—Economic and political instability in Argentina has affected and may continue to adversely affect our financial condition and results of operations.”
7
RISK FACTORS
Factors Relating to Argentina
Economic and political instability in Argentina has affected and may continue to adversely affect our financial condition and results of operations.
We are exposed to economic and political conditions in Argentina, considering that as of December 31, 2014, approximately 84% of our total assets, 99% of our sales, 91% of our combined crude oil and gas production and 89% of our proved oil and gas reserves were located in Argentina.
The Argentine economy has experienced significant volatility in recent decades, characterized by periods of low or negative growth, high and variable levels of inflation and currency devaluation. As a consequence, our business and operations have been, and could in the future be, affected from time to time to varying degrees by economic and political developments and other material events affecting the Argentine economy, such as: inflation; price controls; fluctuations in foreign currency exchange rates and interest rates; currency devaluation; governmental policies regarding spending and investment, and other initiatives increasing government involvement with economic activity; civil unrest and local security concerns. You should make your own investigation into Argentina’s economy and its prevailing conditions before making an investment in us.
During 2001 and 2002, Argentina went through a period of severe political, economic and social crisis. Among other consequences, the crisis resulted in Argentina defaulting on its foreign debt obligations, introducing emergency measures and numerous changes in economic policies that affected utilities and many other sectors of the economy. Argentina also suffered a significant real devaluation of the peso, which in turn caused numerous Argentine private sector debtors with foreign currency exposure to default on their outstanding debt. Following that crisis, Argentina substantially increased its real GDP. During 2008 and 2009, however, the Argentine economy suffered a slowdown attributed to local and external factors, including an extended drought affecting agricultural activities, and the effects of the global economic crisis. Real GDP growth recovered in 2010 and 2011, with GDP increasing to 9.5% and 8.4%, respectively. However, GDP growth slowed to 0.8% in 2012, recovering again to 2.9% in 2013. For 2014, the INDEC, which is the only institution in Argentina with the statutory power to produce official nationwide statistics, has reported a 0.5% growth in real GDP.
Argentina has confronted inflationary pressures since 2007, evidenced by significantly higher fuel, energy and food prices, among other indicators. According to inflation data published by the INDEC, from 2010 to 2014, the Argentine consumer price index increased 10.9%, 9.5%, 10.8%, 10.9% and 23.9% in each of those years, respectively; and the wholesale price index increased 14.6%, 12.7%, 13.1%, 14.8% and 28.3% in each of those years, respectively.
However, since 2007, the INDEC has experienced a process of institutional and methodological reforms that have given rise to controversy with respect to the reliability of the information that it produces. Reports published by the IMF state that their staff uses alternative measures of inflation for macroeconomic surveillance, including data produced by private sources, which have shown inflation rates considerably higher than those published by the INDEC since 2007. The IMF has also censured Argentina for failing to make sufficient progress, as required under the Articles of Agreement of the IMF, in adopting remedial measures to address the quality of official data, including inflation and GDP data. In February 2014, the INDEC released a new inflation index that measures prices on goods across the country and replaces the previous index that only measured inflation in the urban sprawl of the City of Buenos Aires. Even though the new methodology brought inflation statistics closer to those estimated by private sources, there are still differences between official inflation data and private estimates.
While controversy remains as to the reliability of the official data, since 2007 inflation in Argentina has contributed to a material increase in our costs of operation, in particular labor costs, and negatively impacted our results of operations and financial condition.
There can be no assurance that inflation rates will not escalate in the future, or of what effects the measures adopted, or that may be adopted in the future, by the Argentine government to control inflation may have. See “—Government intervention in the Argentine economy could adversely affect our results of operations or financial condition.”
Presidential elections are scheduled for October 2015 and primary elections for presidential candidates are scheduled to take place in August 2015. Political uncertainty may adversely affect the economy and, thus, our financial condition or results of operations.
We cannot provide any assurance that inflation, and/or other future economic, social and political developments in Argentina, over which we have no control, will not adversely affect our financial condition or results of operations, including our ability to pay our debts at maturity or dividends.
8
Fluctuations in the value of the peso could adversely affect the Argentine economy, our results of operations or financial condition.
Fluctuations in the value of the peso may also adversely affect the Argentine economy, our financial condition and results of operations. Since January 2002, the peso has fluctuated significantly in value. If the peso devalues significantly, all of the negative effects on the Argentine economy related to such devaluation could also have adverse consequences for our business. A substantial increase in the value of the peso against the U.S. dollar also represents risks for the Argentine economy since it may lead to a deterioration of the country’s current account balance and the balance of payments. After several years of moderate variations in the nominal exchange rate, in 2012 the peso lost approximately 14% of its value with respect to the U.S. dollar. This was followed in 2013 and 2014 by a devaluation of the peso with respect to the U.S. dollar that exceeded 30%, including a loss of approximately 24% in January 2014. We are unable to predict the future value of the peso against the U.S. dollar and how any fluctuations may affect the demand for our products and services or the costs that we incur in conducting our operations. See “Item 3. Key Information—Exchange Rates.” In addition, the Argentine government has also adopted numerous measures to control directly or indirectly foreign trade and the foreign exchange market. Since 2011, the Argentine government has adopted increasingly stringent exchange controls such as requiring an authorization of tax authorities to access the foreign currency exchange market. Exchange control regulations may prevent or limit us from offsetting the risk derived from our exposure to the U.S. dollar and, accordingly, we cannot predict the impact of these changes on our financial condition and results of operations.
Government intervention in the Argentine economy could adversely affect our results of operations or financial condition.
In addition to the political and economic factors described above, our business and operations have been, and could in the future be, affected by actions taken by the Argentine government through the implementation of new or changed laws and regulations, such as: nationalizations, expropriations or forced divestiture of assets; restrictions on production, imports and exports; exchange and/or transfer restrictions; direct and indirect price controls; tax increases, changes in the interpretation or application of tax laws and other retroactive tax claims or challenges; cancellation of contract rights; and delays or denials of governmental approvals.
During recent years, the Argentine government has increased its direct intervention in the economy, including through the implementation of expropriation and nationalization measures, price controls and exchange controls.
In 2008, the Argentine government absorbed and replaced the former private pension system for a public “pay as you go” pension system. As a result, all resources administered by the private pension funds, including significant equity interests in a wide range of listed companies, were transferred to a separate fund (Fondo de Garantía de Sustentabilidad, or the “FGS”) to be administered by the National Social Security Administration (Administración Nacional de la Seguridad Social, or the “ANSES”). The dissolution of the private pension funds and the transfer of their financial assets to the FGS have had important repercussions on the financing of private sector companies. Debt and equity instruments which previously could be placed with pension fund administrators are now entirely subject to the discretion of the ANSES. Since acquiring equity interests in privately owned companies through the process of replacing the pension system, the ANSES is entitled to designate government representatives to the boards of directors of those entities. Pursuant to Decree No. 1,278/12, issued by the Executive Branch on July 25, 2012, the ANSES’s representatives must report directly to the Ministry of Economy and are subject to a mandatory information-sharing regime, under which, among other obligations, they must immediately inform the Ministry of Economy of the agenda for each board of directors meeting and provide related documentation.
In April 2012, the Argentine government decreed the removal of directors and senior officers of YPF S.A. (“YPF”), the country’s largest oil and gas company, which was controlled by the Spanish group Repsol, and submitted a bill to the Argentine Congress to expropriate shares held by Repsol representing 51% of the shares of YPF. The Argentine Congress approved the bill in May 2012 through the passage of Law No. 26,741, which declared the production, industrialization, transportation and marketing of hydrocarbons to be activities of public interest and fundamental policies of Argentina, and empowered the Argentine government to adopt any measures necessary to achieve self-sufficiency in hydrocarbon supply. In February 2014, the Argentine government and Repsol announced that they had reached an agreement on the terms of the compensation payable to Repsol for the expropriation of the YPF shares. Such compensation totaled U.S.$5 billion payable by delivery of Argentine sovereign bonds with various maturities. The agreement, which was ratified by Law No. 26,932, settled the claim filed by Repsol with the International Centre for Settlement of Investment Disputes (the “ICSID”). See “—Factors Relating to Our Business—The Argentine government and provincial governments have intervened in the oil and gas industry in the past, and are likely to continue to intervene.”
Our business and operations in Argentina may also be adversely affected by measures adopted by the Argentine government to address inflation. For example, increases in the costs of services and labor could negatively affect our results of operations if the government enacts measures that do not permit us to pass those costs along to customers. See “—Factors Relating to Our Business—Limitations on local pricing in Argentina may adversely affect our results of operations.”
9
In addition, on October 26, 2011, the Argentine government issued Decree No. 1,722/11, providing that all foreign currency revenues obtained from exports made by mining and oil and gas companies must be repatriated and sold within the local foreign exchange market, which is the general regime applicable to revenues generated by Argentine exports. Prior to the issuance of this decree, we were allowed to retain overseas up to 70% of the proceeds of certain exports. See “Item 3. Key Information—Exchange Controls” and “Item 5. Operating and Financial Review and Prospects—Description of Indebtedness.”
It is widely reported by private economists that expropriations, price controls, exchange controls and other direct involvement by the Argentine government in the economy have had an adverse impact on the level of investment in Argentina, the access of Argentine companies to the international capital markets and Argentina’s commercial and diplomatic relations with other countries. The level of government intervention in the economy may continue or increase, which may adversely affect Argentina’s economy and, in turn, our business, results of operations and financial condition.
The Argentine economy can be adversely affected by economic developments in other markets and by more general “contagion” effects, which could have a material adverse effect on Argentina’s economic growth.
Argentina’s economy is vulnerable to external shocks that could be caused by adverse developments affecting its principal trading partners. A significant decline in the economic growth of any of Argentina’s major trading partners (including Brazil, the European Union, China and the United States) could have a material adverse impact on Argentina’s balance of trade and adversely affect Argentina’s economic growth. Declining demand for Argentine exports, or a decline in the international market prices for those products, could have a material adverse effect on Argentina’s economic growth.
In addition, financial and securities markets in Argentina have been influenced by economic and market conditions in other markets worldwide. Although economic conditions vary from country to country, investors’ perceptions of events occurring in other countries have in the past substantially affected, and may continue to substantially affect, capital flows into, and investments in securities from issuers in, other countries, including Argentina. International investors’ reactions to events occurring in one market sometimes demonstrate a “contagion” effect in which an entire region or class of investment is disfavored by international investors, Argentina could be adversely affected by negative economic or financial developments in other countries, which in turn may have an adverse effect on our financial condition and results of operations.
There can be no assurance that the Argentine financial system and securities markets will not be adversely affected by events in developed countries’ economies or events in other emerging markets. A slowdown in economic activity in Argentina would adversely affect our business, financial condition and results of operations.
A lack of financing for Argentine companies, whether due to market forces or government regulation, may negatively impact our financial condition or cash flows.
The prospects for Argentine companies of accessing financial markets might be limited in terms of the amount of financing available, and the conditions and cost of such financing.
Following the default on its external debt in 2001, the Argentine government sought to restructure its outstanding debt by offering holders of the defaulted bonds two opportunities to exchange them for newly issued debt securities, in 2005 and again in 2010. Holders of approximately 93% of Argentina’s defaulted debt participated in the exchanges. Nonetheless, a number of bondholders that chose not to participate in the exchange offers initiated legal actions against the Argentine government. Since late 2012, rulings favorable to those bondholders have deepened doubts about Argentina’s ability to service its restructured debt under the terms of foreign judgments, and exacerbated investors’ uncertainties. In 2013, the Argentine Congress approved a law that enables the government to take the necessary measures to complete the debt restructuring process, on terms that cannot exceed those of the previous debt exchanges. On August 23, 2013, the United States Second Circuit Court of Appeals ruled in favor of the bondholders. On November 18, 2013, the Second Circuit Court of Appeals denied Argentina’s petition for a rehearing. On June 16, 2014, the United States Supreme Court denied Argentina’s certiorari petition and affirmed the Court of Appeals decision. Consequently, on June 18, 2014, the Court of Appeals lifted the stay of enforcement on the award granted by the United States District Court for the Southern District of New York, requiring Argentina to pay all amounts owed to holdout bondholders on the next payment to holders of restructured debt.
Argentina has not yet reached an agreement with its holdout bondholders. In addition, as a result of the orders issued by the District Court affecting third parties involved in the payment process, holders of certain restructured debt have not received payments on their bonds. The ongoing dispute with the holdout bondholders may prevent Argentina from accessing the capital markets and limit the sources of funding and investment capital that are available to Argentina, and, therefore, the Argentine government’s ability to promote economic growth.
In addition, the foreign shareholders of several Argentine companies, including public utilities and certain bondholders that did not participate in the exchange offers described above, have filed claims with the ICSID and the United Nations Commission on International Trade Law (the “UNCITRAL”), alleging that the emergency measures adopted by the Argentine government in 2002 do not meet the just and equal treatment requirements of several bilateral investment treaties to which Argentina is a party. While certain
10
plaintiffs have prevailed against Argentina in their ICSID proceedings, Argentina has not yet honored such awards. However, in October 2013, Argentina settled certain of such claims by offering Argentine sovereign bonds in exchange for a waiver from such plaintiffs of any rights to further litigation.
The developments described above, the global economic crisis that started in the fourth quarter of 2008, the resulting international stock market crash and the insolvency of major financial institutions toward the end of 2008, have generally limited the ability of Argentine companies to access international financial markets as they had in the past or made such access significantly more costly for Argentine issuers. Between June 2009 and 2011, a greater number of Argentine companies gained access to the international capital markets, albeit on more onerous terms than other competitors in the region, but since 2012, with few exceptions, Argentine companies have had little access to such markets. See “—Government intervention in the Argentine economy could adversely affect our results of operations or financial condition.”
Argentina’s default and its ongoing litigation with holdout creditors, and economic policy measures adopted by the Argentine government, may continue to prevent Argentine companies such as us from accessing the international capital markets readily or make the terms of any such transactions less favorable than those provided to companies in other countries in the region, and may therefore negatively impact our financial condition or cash flows.
Argentine judicial reform has generated uncertainty with respect to future administrative and judicial proceedings involving the Argentine government.
Law No. 26,854, which regulates injunctions in cases in which the Argentine government is a party or has intervened, was promulgated on April 30, 2013 as part of a judicial reform bill approved by the Argentine Congress. Among the principal changes introduced by the judicial reform bill are a time limitation on injunctions imposed in proceedings brought against the Argentine government and the creation of three new chambers ofCasación (appeals courts) prior to the intervention of the Supreme Court of Justice. In addition, Law No. 26,855, which became effective on May 27, 2013, modified the structure and functions of the ArgentineConsejo de la Magistratura (judicial council), which is in charge of appointing judges, of presenting charges against them, and of suspending or deposing them. However, several aspects of the legislation have been struck down by the Supreme Court as unconstitutional and the long-term impact of the recently adopted legislation on Argentina’s legal system and future administrative and/or judicial proceedings, including potential future claims by us against the Argentine government, cannot be predicted.
Factors Relating to Our Business
Substantial or extended declines and volatility in the prices of crude oil, oil products and natural gas may have an adverse effect on our results of operations and financial condition.
A significant amount of our revenue is derived from sales of crude oil, oil products and natural gas. Factors affecting international prices for crude oil and related oil products include: political developments in crude oil producing regions, particularly the Middle East; the ability of the Organization of Petroleum Exporting Countries (“OPEC”) and other crude oil producing nations to set and maintain crude oil production levels and prices; global and regional supply and demand for crude oil; competition from other energy sources; domestic and foreign government regulations; weather conditions; and global conflicts or acts of terrorism. We have no control over these factors. Changes in crude oil prices generally result in changes in prices for related products. International oil prices have fluctuated widely in recent years, declining significantly during the second half of 2014.
Substantial or extended declines in international prices of crude oil and related oil products may have a material adverse effect on our business, results of operations and financial condition and the value of our proved reserves. In addition, significant decreases in the prices of crude oil and related oil products may require us to incur impairment charges in the future or cause us to reduce or alter the timing of our capital expenditures, and this could adversely affect our production forecasts in the medium term and our reserves estimates in the future.
Argentine oil and gas production concessions and exploration permits are subject to certain conditions and may not be renewed or could be revoked.
Law No. 17,319 (the “Hydrocarbons Law”), as amended by Law No. 27,007, provides that conventional (oil and gas) concessions will remain in effect for 25 years, non-conventional concessions for 35 years and offshore concessions for 30 years., from the date of their award, and further provides for the concession term to be extended for up to 10 additional years, subject to terms and conditions approved by the grantor at the time of the extension. The authority to extend the terms of current and new permits, concessions and contracts has been vested with the government of the province in which the relevant area is located (and the Argentine government in respect of offshore areas beyond 12 nautical miles). In order to be eligible for an extension, under the amended Hydrocarbons Law, concessionaires must (i) have complied with their obligations under the law and their concession, (ii) be producing hydrocarbons in the concession under consideration, and (iii) submit an investment plan for the development of such areas as requested by the competent authorities at least one year prior to the termination of the concession term. Further, concessionaires
11
applying for extensions under Law No. 27,007 must make additional royalty payments ranging from 3% up to a maximum of 18%. Non-compliance with the obligations and standards set out in the Hydrocarbons Law may also result in the imposition of fines and, in the case of material breaches following the expiration of applicable cure periods, revocation of the concession or permit. We cannot provide assurances that concessions will be extended as a result of the review by the relevant authorities of investment plans we submit for such purposes in the future, or that other requirements will not be imposed on us in order to obtain extensions. See “Item 4. Information on the Company—Business Overview—Oil and Gas Exploration and Production—Statistical Information Relating to Oil and Gas Production.”
Our crude oil and natural gas reserves estimates involve some degree of uncertainty that could adversely affect our ability to generate income.
Our oil and gas proved reserves are estimated using geological and engineering data to determine with reasonable certainty whether the crude oil or natural gas in known reservoirs is recoverable under existing economic and operating conditions. The accuracy of proved reserves estimates depends on a number of factors, assumptions and variables, some of which are beyond our control. Factors susceptible to our control include drilling, testing and production after the date of the estimates, which may require substantial revisions to reserves estimates; the quality of available geological, technical and economic data used by us and our interpretation thereof; the production performance of our reservoirs and our recovery rates, both of which depend in significant part on available technologies as well as our ability to implement such technologies and the relevant know-how; the selection of third parties with which we enter into business; and the accuracy of our estimates of initial hydrocarbons in place, which may prove to be incorrect or require substantial revisions. Factors mainly beyond our control include changes in prevailing oil and natural gas prices, which could have an effect on the quantities of our proved reserves (since the estimates of reserves are calculated under economic conditions existing when such estimates are made); changes in the prevailing tax rules, other government regulations and contractual conditions after the date estimates are made (which could make reserves no longer economically viable to exploit); and certain actions of third parties, including the operators of fields in which we have an interest. See “Item 4. Information on the Company—Oil and Gas Exploration and Production—Reserves.”
As a result of the foregoing, measures of reserves are subject to revision. Any downward revision in our estimated quantities of proved reserves could adversely impact our financial results by leading to increased depreciation, depletion and amortization charges and/or impairment charges, which would reduce earnings and shareholders’ equity.
Oil and gas activities are subject to significant economic, environmental and operational risks.
Oil and gas exploration and production activities are subject to particular economic and industry-specific operational risks, some of which are beyond our control, such as production, equipment and transportation risks, as well as natural hazards and other uncertainties, including those relating to the physical characteristics of onshore and offshore oil or natural gas fields. Our operations may be curtailed, delayed or cancelled due to bad weather conditions, mechanical difficulties, shortages or delays in the delivery of equipment, compliance with governmental requirements, fire, explosions, blow-outs, pipe failure, abnormally pressured formations, and environmental hazards, such as oil spills, gas leaks, ruptures or discharges of toxic gases. If these risks materialize, we may suffer substantial operational losses or disruptions in our operations. Drilling may be unprofitable, not only with respect to dry wells, but also with respect to wells that are productive but do not produce sufficient net revenues to return a profit after drilling, operating and other costs are taken into account.
We may not be able to replace our oil and gas reserves and this may have an adverse impact on our future results of operations and financial condition.
In recent years, we have experienced a decline in reserves and production (see “Item 4. Information on the Company—Business Overview—Reserves—Internal Control over Proved Reserves”). The possibility of replacing our crude oil and gas reserves in the future is dependent on our ability to access new reserves, both through successful exploration and reserve acquisitions. We consider exploration, which carries inherent risks and uncertainties, to be our main vehicle for future growth and reserves replacement.
Without successful exploration activities or reserves acquisitions, our proved reserves would decline as our oil and gas production would be forced to rely on our current portfolio of assets.
We cannot guarantee that our exploration, development and acquisition activities will allow us to offset the decline of our reserves. If we are not able to successfully find, develop or acquire sufficient additional reserves, our reserves and therefore our production may continue to decline and, consequently, this may adversely affect our future results of operations and financial condition.
12
The Argentine government and provincial governments have intervened in the oil and gas industry in the past, and are likely to continue to intervene.
The Argentine government has historically exercised significant influence over the economy, including the energy sector, and companies such as us which operate in that sector have done so in a heavily regulated environment, aimed primarily at ensuring the satisfaction of domestic demand.
To address the Argentine crisis of 2001 and 2002, the Argentine Congress enacted the Public Emergency Law and other emergency regulations, some of which remain in effect to date. Some of these regulations introduced a number of material changes to the regulatory framework applicable to the oil and gas industry in Argentina.
As of the date of this Annual Report, the Public Emergency Law is still in effect. In addition, the Argentine government continues to introduce material changes to the regulatory regime applicable to the oil and gas industry, such as modifications to thePetróleo Plus (“Oil Plus”) program, the revocation of theRefinación Plus (“Refining Plus”) program, and the obligation to repatriate and sell in the local market 100% of the foreign currency revenues obtained from oil and gas exports.
On April 17, 2012, the Argentine government submitted a bill to the Argentine Congress calling for the expropriation of 51% of the shares of YPF owned by Repsol YPF S.A. (Spain). Effective May 7, 2012, the Argentine Congress enacted Law No. 26,741, sanctioning the expropriation of 51% of YPF’s Class D shares, out of the shares then held by Repsol YPF S.A. (Spain), and 51% of Repsol YPF GAS S.A., represented by 60% of its Class A shares then held by Repsol Butano S.A. (Spain).
Law No. 26,741 also defines the hydrocarbon activities (including the exploitation, industrialization, transportation and commercialization thereof) in the territory of Argentina as a “national public interest.” On July 27, 2012, Decree No. 1,277/12 regulated various aspects of Law No. 26,741, specifically it (a) abrogated the sections of Decree Nos. 1,055/89, 1,212/89 and 1,589/89 (the “Deregulation Decrees”) that established the right to freely market hydrocarbon products in the domestic and external market, and the exemption from export withholdings; (b) created theComisión de Planificación y Coordinación Estratégica del Plan Nacional de Inversiones Hidrocarburíferas(Commission of Planning and Strategic Coordination of the National Hydrocarbon Investments Plan, or the “Commission”), in charge of executing a “National Hydrocarbon Investments Plan”; (c) established the obligation for hydrocarbon companies to submit their technical, production and economic data to the Commission, as well as their investment plans; and (d) granted broad powers to the Commission with the aim of monitoring the investment plans and ensuring reasonable commercial prices in the domestic market. See “Item 4. Information on the Company—Regulation of Our Business.” Similarly, in 2012 the governors of ten hydrocarbon-producing Argentine provinces signed theAcuerdo Federal de Hidrocarburos (Federal Hydrocarbons Accord), including among its principal objectives the establishment of self-sufficiency in oil and gas supplies as a state policy.
We cannot assure that these or other measures that may be adopted by the Argentine government or provincial governments with respect to the oil and gas industry will not have a material adverse effect on our business, financial condition or results of operations.
Limits on exports of hydrocarbons and related oil products have affected and may continue to affect our results of operations.
In recent periods, the Argentine government has introduced a series of measures limiting exports of hydrocarbons and related oil products, which have prevented us from profiting from higher prices on these commodities in the international markets, and materially affected our competitiveness and results of operations.
In April 2004, to facilitate the recovery of natural gas prices, the Secretariat of Energy (“SE”) entered into an agreement with natural gas producers, requiring them to sell a specified amount of gas in the local regulated market. During 2006, the SE required producers to redirect gas earmarked for export to supply local thermal power plants and gas distribution companies. In January 2007, the SE confirmed that the ability to export hydrocarbons would be subject to the satisfaction of domestic demand and that exports would have to be authorized on a case-by-case basis by the SE. These measures prevented us from benefiting from higher margins in the international markets. In 2007, upon the expiration of the aforementioned agreement, the Argentine government and producers signed a new agreement effective until 2011 aimed at securing the domestic supply of gas. On January 5, 2012, the SE decided to extend the temporary allocation rules and other criteria established by Resolution No. 599/2007 to set obligations for the timely supply of natural gas, as established under the agreement with natural gas producers in effect from 2007 through 2011.
Under these agreements, temporary limits on certain natural gas exports have been imposed to avoid a crisis in the local supply of natural gas, depriving us of higher margins in the international markets.
Pursuant to SE Resolution No. 1,679/04, since December 2004, producers must obtain the approval of the Argentine government prior to exporting crude oil or diesel. To obtain this approval, exporters must demonstrate that they have either satisfied local demand requirements or have granted the domestic market the opportunity to acquire oil or diesel under terms similar to current domestic market prices and, in the case of diesel, they must also demonstrate, if applicable, that commercial terms offered to the domestic market are at least equal to those offered to their own gas station network. Furthermore, in December 2006, pursuant to SE Resolution No. 1,338/06, the SE extended these regulations to the export of gasoline, fuel oil and fuel oil mixtures, aero kerosene, jet fuel, lubricants, asphalts, coke and by-products for use in the petrochemical industry. In January 2008, the Argentine government temporarily prohibited the exports of gasoline and diesel until the domestic market was fully supplied at the prices in force on October 31, 2007.
13
These restrictions may significantly and adversely affect the profitability of our operations, preventing us from capturing the upside of export prices, and negatively impacting the total volume of refined products sold in the domestic market, due to our need to manage crude oil volumes processed in accordance with our storage capacity.
We cannot assure that the Argentine government will not increase export restrictions on hydrocarbons and related oil products, adversely affecting our financial condition and results of operations.
Export taxes and import regulations on our products have negatively affected, and may continue to negatively affect, the profitability of our operations.
On March 1, 2002, the Argentine government imposed a withholding tax on exports of hydrocarbons, initially lasting five years. The export tax was extended in 2006 by Law No. 26,217 and in 2011 by Law No. 26,732 and is in effect through 2015. This tax framework has prevented us from benefiting from significant increases in international prices for oil, oil related products and natural gas, hindered us from offsetting sustained increases in costs related to the energy industry, and materially affected our competitiveness and results of operations. Effective November 2007, the Ministry of Economy adopted a more onerous method for calculating withholding taxes on exports of crude oil and certain oil by-products. On January 3, 2013, withholding taxes on exports of crude oil were reduced, enabling a reduction of the gap between local and export net prices. In October 2014, the withholding tax on hydrocarbon exports was modified, linking the rate (ranging from 10% to 13%) to a specific price schedule. Additionally, Resolution No. 1077/14 of the Ministry of Economy and Public Finance became effective on January 1, 2015 providing that for so long as the international price of crude oil is less than U.S.$71 per barrel, the applicable withholding tax rate will be 1% and incremental tax rates will apply for so long as the international price of crude oil is equal to or higher than U.S.$71 per barrel. See “Item 5. Operating and Financial Review and Prospects—Factors Affecting Our Consolidated Results of Operations—Regulations of the Energy Industry in Argentina—Withholding Taxes on Exports.”
In addition, in 2012, the Argentine government adopted an import procedure pursuant to which local authorities must pre-approve any import of products and services to Argentina as a precondition to allow importers access to the foreign exchange market for the payment of such imported products and services. During 2012, the European Union, the United States of America and Japan have filed claims with the World Trade Organization (WTO) against certain import-related requirements maintained by Argentina. Recently, the WTO found that those measures are not consistent with Argentina’s obligations under the WTO and requested removal.
We cannot assure that the Argentine government will modify or maintain current export tax rates and import regulations. We cannot predict the impact that any changes may have on our results of operations and financial condition.
Limitations on local pricing in Argentina may adversely affect our results of operations.
In recent years, due to regulatory, economic and government policy factors, our domestic crude oil, gasoline, diesel and other fuel prices have frequently lagged substantially behind prevailing international and regional market prices for such products, and our ability to increase prices has been limited. Likewise, the prices at which we sell natural gas in Argentina (particularly to the residential sector) are subject to government regulations and currently are substantially below regional market prices for natural gas.
On April 10, 2013, Resolution No. 35/13 of the Secretary of Domestic Commerce set maximum sales prices for liquid fuels for a period of six months, later extended for 45 additional days (Resolution No. 108/13).
In January 2014, following the depreciation of the peso against the U.S. dollar, domestic oil and fuel prices temporarily decreased. International crude oil and related oil product prices declined significantly during the second half of 2014. As a result, in October 2014, the Ministry of Economy issued Resolution No. 803/14, which was later superseded by Resolution No. 1077/14, setting forth a reduced withholding tax schedule to ensure the hydrocarbon industry’s profitability and investment level in order to achieve self-sufficiency. Furthermore, the Argentine government issued Decree No. 2579/2014, reducing fuel transport taxes on certain diesel and unleaded gasoline products, and water infrastructure fund taxes that apply to transfers of certain unleaded gasoline products. In January 2015, retail prices in pesos on diesel and gasoline were reduced by 5%. As of the date of this Annual Report, domestic crude oil prices exceed import parity prices.
Domestic oil prices dropped by U.S.$7 per barrel in the first quarter of 2015 compared to the price in effect as of December 31, 2014. In addition, in February, 2015 the Commission issued Resolution 14/2015 creating the Crude Oil Production Stimulus Program (Programa de Estímulo a la Producción de Petróleo Crudo) providing for export and/or production stimulus payments for registered companies subject to certain requirements. Furthermore, in March 2015, the Ministry of Economy issued Resolution No. 35/2015 revoking the tax exemption on imported diesel and gasolines as from January 2015.
14
For additional information on domestic pricing for our products, see “Item 5. Operating and Financial Review and Prospects—Factors Affecting our Consolidated Results of Operations—Regulation of the Energy Industry in Argentina” and “Item 4. Information on the Company—Regulation of Our Business—Argentine Regulatory Framework.”
We cannot assure that we will be able to increase the domestic prices of our products, and limitations on our ability to do so will continue to adversely affect our financial condition and results of operations. Similarly, we cannot assure that hydrocarbon prices in Argentina will track increases or decreases in hydrocarbon prices in the international or regional markets. Discrepancies between domestic and international prices may adversely affect our financial condition and results of operations.
Oil and gas prices could affect our level of capital expenditures.
The prices that we are able to obtain for our hydrocarbon products affect the viability of investments in new exploration, development and refining activities, and as a result, the timing and amount of our projected capital expenditures for such purposes. We budget capital expenditures by taking into account, among other things, market prices for our hydrocarbon products. In the event that current domestic prices decrease, our ability to improve our hydrocarbon recovery rates, identify new reserves and carry out certain of our other capital expenditure plans is likely to be affected, which, in turn, could have an adverse effect on our results of operations.
The Argentine government and our associated utility company are in the process of renegotiating utility contracts, and the recoverability of our investments in such associate depends on the successful completion of these negotiations.
The macroeconomic situation of the country after the enactment of the Public Emergency Law in 2002 impacted the economic and financial condition of utility companies in Argentina. The combined effect of (i) the devaluation of the peso in 2002, (ii) the government decision to freeze rates in pesos without reflecting the impact of the devaluation, and (iii) financial debts primarily denominated in foreign currency, adversely affected utility companies’ financial condition, results of operations and their ability to satisfy financial obligations and pay dividends. Although some of these utility companies have been successful in restructuring their indebtedness, their return to financial stability and profitability on a long-term basis depends on a successful negotiation of tariff increases with the Argentine government. Transportadora de Gas del Sur S.A. (“TGS”) has engaged in negotiations with the Utilities Contract Renegotiation and Analysis Committee (Unidad de Renegociación y Análisis de Contratos de Servicios Públicos, or the “UNIREN”). However, as of the date of this Annual Report, these discussions have not resulted in tariff increases sufficient for our associated utility company’s regulated segment to return to financial stability and profitability. See “Item 4. Information on the Company—Gas and Energy—Gas Transportation—TGS—Tariff Renegotiation Process,” and “Item 4—Regulation of Our Business—Argentine Regulatory Framework—Natural Gas” and “—Electricity.”
Developments affecting our controlling shareholder may have an adverse effect on our operations.
Our controlling shareholder, Petrobras, is involved in an ongoing investigation of corruption. In response to this investigation, Petrobras has departed from its typical schedule of issuing its financial statements. It has also announced that it is considering changes to its business structure and operations. Recently, on April 22, 2015, Petrobras issued its financial statements.
We cannot predict the overall effects of the ongoing investigation or Petrobras’s responses in connection with it, which could have an adverse effect on our business, financial condition or results of operations.
Our activities may be adversely affected by events in other countries in which we do business.
Our operations are concentrated in Latin America, a region that has experienced significant economic, social, political and regulatory volatility. In recent periods, many governments in Latin America have taken steps to assert greater control or increase their share of revenues from the energy sector, spurred by soaring oil and gas prices and nationalist politics. See “Item 4. Information on the Company—Regulation of Our Businesses—Venezuelan Regulatory Framework” and “—Bolivian Regulatory Framework.”
These risks are evidenced by changes in business conditions that we have experienced in Venezuela, Bolivia and Ecuador. See “Item 5. Operating and Financial Review and Prospects—Factors Affecting our Consolidated Results of Operations” and “Item 4. Information on the Company—Oil and Gas Exploration and Production—Production—Production Outside Argentina.”
We could be subject to organized labor action.
Many of our operations are highly labor-intensive and require a significant number of workers. The sectors in which we operate are largely unionized. We have experienced organized work disruptions and stoppages in the past, frequently due to strikes by employees of contractors we employ. We cannot assure that we will not experience such disruptions or work stoppages in the future, and any such action could adversely affect our business and revenues.
15
During 2010 and, to a lesser extent, 2011 and 2012, gas production in the Austral Basin was affected by labor strikes. Between March and June 2013, we experienced trade union conflicts at the Zárate Plant. During 2014, trade union conflicts did not significantly affect our operations and were mostly related to industry-wide actions.
We do not maintain insurance coverage for business interruptions, including business interruptions caused by labor actions. Strikes or other types of conflict with the unionized personnel may adversely affect our results of operations and financial condition.
Our operations could cause environmental damage, and any changes in environmental laws or regulations may increase our operational costs.
Some of our operations are subject to environmental risks that may arise unexpectedly and result in material adverse effects on our results of operations and financial condition. In addition, the occurrence of any of these risks could result in personal injuries, loss of life, environmental damage, clean-up and repair expenses, equipment damage and liability in civil and administrative proceedings. We cannot assure that we will not incur additional costs related to the environment in the future, which could negatively impact our results of operations and financial condition. In addition, we cannot assure that the insurance coverage that we maintain is adequate to cover the losses that may potentially arise from these environmental risks.
Furthermore, we are subject to extensive environmental laws and regulations both in Argentina and in the other countries in which we operate. Local, provincial and national authorities in Argentina and other countries where we operate may implement new environmental laws and regulations, and are moving towards more stringent enforcement of existing environmental laws and regulations, both of which may require us to incur higher compliance costs. For example, various initiatives in regions outside of Argentina have been made or proposed to regulate hydraulic fracturing processes (which involve injecting water, sand and small volumes of chemicals into a wellbore to fracture hydrocarbon-bearing rock thousands of feet below the surface to facilitate higher flow of hydrocarbons into the wellbore), and drilling activities for non-conventional oil and gas reserves. The imposition of stringent regulatory and permitting requirements related to these practices in Argentina could significantly increase our cost of doing business.
We cannot predict the overall effects of implementing new environmental laws and regulations and/or the more stringent enforcement of existing environmental laws and regulations on our financial condition and results of operations.
Risks Relating to Our Shares, ADSs and Series S Notes
Our principal shareholders can exercise control over the Company.
As of the date of this Annual Report, Petrobras holds 67.2% of our capital stock and voting rights and the ANSES holds approximately 11.8% of our shares and voting rights. Petrobras will be able to determine or exercise significant influence on substantially all matters requiring approval by a majority of our shareholders, including the election of a majority of our directors. Petrobras will also direct our operations and may be able to cause or prevent a change in our control. We cannot assure that the interests of our principal shareholders will not diverge from interests of our other investors. See “Item 7. Major Shareholders and Related Party Transactions”
Restrictions on capital outflows imposed by Argentina may impair your ability to receive dividends and distributions on, and the proceeds of any sale of, the shares underlying the ADSs.
The government may impose temporary restrictions on capital movements in circumstances where a serious imbalance develops in Argentina’s balance of payments or where there are reasons to foresee such an imbalance. Additionally, commencing in October 2011, new regulations have been introduced by the Argentine government regarding the transfer of foreign currency abroad. See “Item 3. Key Information—Exchange Controls.” We cannot assure that Argentina will not impose restrictions on capital outflows and/or foreign exchange which could impair or prevent the conversion of dividends, distributions, or the proceeds from any sale of shares, as the case may be, from pesos into U.S. dollars and the remittance of the U.S. dollars abroad.
Under the terms of our Deposit Agreement with the depositary for the ADSs, the depositary will convert any cash dividend or other cash distribution we pay on the shares underlying the ADSs into U.S. dollars if, in the judgment of the depositary, that conversion can be made on a practicable basis, and shall distribute such U.S. dollars in accordance with the Deposit Agreement, subject, in each case, to any restrictions under Argentine laws or regulations or applicable permits issued by an Argentine governmental body. If the exchange rate fluctuates significantly during a time when the depositary cannot convert the foreign currency, you may lose some or all of the value of the dividend distribution.
Under Argentine law, shareholder rights may be different from those in other jurisdictions.
Our corporate affairs are governed by our bylaws and Law No. 19,550 (the “Argentine Companies Law”), which differ from the legal principles that would apply if we were incorporated in a jurisdiction in the United States or in other jurisdictions outside Argentina. In addition, rules governing the Argentine securities markets are different and may be subject to different enforcement in Argentina than in other jurisdictions.
16
Sales of a substantial number of shares could decrease the market prices of our shares and the ADSs.
Petrobras owns shares representing a significant majority of our capital stock. Sales of a substantial number of shares or ADSs by Petrobras, the ANSES, or any other future significant shareholder, or the anticipation of such sales, could decrease the trading price of our shares and ADSs.
You may be unable to exercise preemptive, accretion or other rights with respect to the shares underlying your ADSs.
You may not be able to exercise the preemptive or accretion rights relating to the shares underlying your ADSs (see “Item 10. Additional Information—Preemptive Rights”) unless a registration statement under the U.S. Securities Act of 1933 (the “Securities Act”) is made effective with respect to those rights or an exemption from the registration requirements of the Securities Act is available. We are not obligated to file a registration statement with respect to the shares relating to these preemptive rights, and we cannot assure that we will file any such registration statement. Unless we file a registration statement or an exemption from registration is available, you may receive only the net proceeds from the sale of your preemptive rights by the depositary or, if the preemptive rights cannot be sold, they will be allowed to lapse. As a result, U.S. holders of our shares or ADSs may suffer dilution of their interest in our company upon future capital increases.
In addition, under the Argentine Companies Law, foreign companies that own shares in an Argentine corporation are required to register with theInspección General de Justicia (Superintendency of Legal Entities, or the “IGJ”) in order to exercise certain shareholder rights, including voting rights. If you own our shares directly (rather than in the form of ADSs) and you are a non-Argentine company and you fail to register with the IGJ, your ability to exercise your rights as a holder of our shares may be limited.
You may be unable to exercise voting rights with respect to the shares underlying your ADSs at our shareholders’ meetings.
The depositary will be treated by us for all purposes as the shareholder with respect to the shares underlying your ADSs. As a holder of American Depositary Receipts (“ADRs”) representing the ADSs being held by the depositary in your name, you will not have direct shareholder rights and may exercise voting rights with respect to the shares represented by the ADSs only in accordance with the Deposit Agreement relating to the ADSs. There are no provisions under Argentine law or under our bylaws that limit the exercise by ADS holders of their voting rights through the depositary with respect to the underlying shares. However, there are practical limitations on the ability of ADS holders to exercise their voting rights due to the additional procedural steps involved in communicating with these holders. ADS holders may be unable to exercise voting rights with respect to the shares underlying the ADSs as a result of these practical limitations.
Shareholders outside Argentina may face additional investment risk from currency exchange rate fluctuations in connection with their holding of our shares or ADSs.
We are an Argentine company and any future payments of dividends on our shares will be denominated in pesos. The peso has historically fluctuated significantly against many major world currencies, including the U.S. dollar. A depreciation of the peso would likely adversely affect the U.S. dollar or other currency equivalent of any dividends paid on our shares and could result in a decline in the value of our shares and ADSs as measured in U.S. dollars.
Developments related to our controlling shareholder may have an effect on the rating of our Series S Notes.
Our Series S Notes are subject to a standby purchase agreement with our controlling shareholder, Petrobras, whereby Petrobras would be obligated to purchase noteholders’ rights to receive payments if we were to default on the payment of any amounts owed under those Notes. Moody’s Investors Service downgraded Petrobras’s global foreign currency debt rating and, consequently,Moody’s Latin America Agente de Calificación de Riesgo (Moody’s Agent for Risk Ratings in Latin America) downgraded the global scale rating on our Series S Notes from Baa3 to Ba2. The ratings for Petrobras’s global debt, and our Series S Notes, are on review for further downgrade. A decrease in access to financing sources or access to the capital markets may have an adverse impact on our financial condition. See “—Developments affecting our controlling shareholder may have an adverse effect on our operations.”
| Item 4. | INFORMATION ON THE COMPANY |
HISTORY AND DEVELOPMENT
History
Petrobras Argentina S.A.
PESA is a corporation (sociedad anónima) organized and existing under the laws of Argentina and registered on November 17, 1947 with the Public Registry of Commerce, under No. 759, page 569, Book 47, Volume A, with a term of duration expiring June 18, 2046. Our principal place of business is located at Maipú 1, (C1084ABA), Buenos Aires, Argentina. Telephone: 54-11-4344-6000, fax 54-11-4344-6315 and our web site iswww.petrobras.com.ar. Our process agent in the United States for certain contracts is CT Corporation System, located at 111 Eighth Avenue, New York, New York 10011. Our authorized representative in the United States for our registration statement with the SEC is Puglisi Associates, located at 850 Library Avenue, Suite 204, Newark, Delaware 19711.
17
We are an integrated energy company,engaged in oil and gas exploration and production, refining, petrochemicals, electricity generation and transmission, and hydrocarbon marketing and transportation. As of December 31, 2014, we maintained operations primarily in Argentina, and to a lesser extent in Bolivia, Ecuador and Venezuela. Our operations are currently divided into four business segments that are in turn supported by corporate functions. The four business segments are: (1) Oil and Gas Exploration and Production, (2) Gas and Energy, (3) Refining and Distribution, and (4) Petrochemicals.
PESA was founded in 1946 under the name “Compañía Naviera Pérez Companc” as a shipping company by the Pérez Companc family. In the mid-1950s, the Company began its forestry operations when it acquired an important forestry area in northeastern Argentina. In the 1960s, it began servicing oil wells; over time, its maritime operations were gradually discontinued and replaced by oil-related activities.
The development of our oil and gas business is marked by two significant events. The first occurred in 1991 when we were awarded concessions to operate Puesto Hernández, one of the most important oil fields in Argentina in terms of reserves and production, located in the provinces of Neuquén and Mendoza, and the Faro Vírgenes and Santa Cruz areas in the Austral Basin, located in the province of Santa Cruz. As a result of these concessions, we have become one of the largest oil and gas producers in Argentina.
The second event that was a key factor in our oil and gas operations growth occurred in March 1994, when PESA was awarded the Oritupano-Leona area in Venezuela. This was the first step towards a significant regional expansion of our businesses.
Between 1990 and 1994, many state-owned enterprises were privatized in Argentina. As a result, PESA acquired interests in companies operating in the natural gas transportation and distribution, electricity generation, transmission and distribution, oil transportation, storage and shipment and refining sectors. These activities have since that time formed our core business.
PESA has in the past conducted operations in other industries, including construction, real estate, telecommunications, mining and agriculture. Beginning in 1997, and through successive divestments, PESA restructured its business strategy with a focus on the energy sector in Argentina. As a result of these divestitures and the development of our energy businesses, PESA has become a vertically-integrated energy company whose operations are mainly located in Argentina.
Corporate reorganization of PESA and PEPSA
On September 2, 2008, the respective boards of directors of PESA and PEPSA each approved a preliminary agreement for the merger of the companies through the absorption of PEPSA by PESA. The effective merger date was set as January 1, 2009. As of that date, all assets, liabilities, rights and obligations of the absorbed company were incorporated into Petrobras Energía. Immediately following the merger, Petrobras continued holding 67.2% of the outstanding shares of Petrobras Energía.
On January 30, 2009, the respective special shareholders’ meetings of PESA and PEPSA approved the merger of the companies, pursuant to which PEPSA was merged and absorbed into PESA, as surviving company. The respective boards of directors of PESA and PEPSA each approved the merger agreement between the two companies on April 14, 2009. This reorganization was authorized by Resolution No. 16,131 and subsequently registered with the IGJ.
As a result of such corporate reorganization, shareholders of PEPSA received shares of PESA (in the United States, in the form of ADSs), and the ADSs of PEPSA were removed from listing on the NYSE and from registration with the SEC. Immediately subsequent to this exchange of shares, our ADSs, each representing 10 Class B shares of PESA, were listed and began trading on the NYSE.
Change of corporate name
On March 27, 2009, the general regular and special shareholders’ meeting of PESA approved the change of the Company’s corporate name to Petrobras Argentina S.A., which became effective on July 19, 2010, at which time the CNV notified PESA of the registration of the change of its corporate name with the IGJ.
Capital Expenditures and Divestitures
For a description of our capital expenditures see “Item 5. Operating and Financial Review and Prospects—Liquidity and Capital Resources.”
18
For a description of our most significant recent divestitures, see “Item 4. Information on the Company—Oil and Gas Exploration and Production—Production—Production Outside Argentina—Ecuador,” “Item 5. Operating and Financial Review and Prospects—Factors Affecting Our Consolidated Results of Operations—Divestment of Distrilec.”
BUSINESS OVERVIEW
Our Strategy
We are a leading energy company in Argentina focused on maintaining profitability and meeting our social and environmental responsibility goals.
In furtherance of these objectives, we:
| | • | | Set our focus on our Argentine operations. |
| | • | | Seek to develop profitable oil and gas reserves. |
| | • | | Seek profitability in the downstream business in Argentina, through a balanced crude oil refining, logistics and commercial chain. |
| | • | | Increase profitability in the Gas and Energy segment. |
| | • | | Maintain our position in styrenics markets. |
| | • | | Maintain financial solvency, while pursuing operating and management efficiency and the development of human resources. |
In order to fulfill this strategy, we consider the following to be essential:
| | • | | A commitment to protecting the quality of our goods and services, the environment and the health and safety of our employees, contractors and neighboring communities. |
| | • | | Adoption of, and compliance with, corporate governance practices consistent with recognized best practices. |
| | • | | Maintenance of a management style that favors communication and teamwork, fostered by the value of the people that work in our organization. |
| | • | | Developing new business opportunities in order to maximize potential synergies and capitalize on complementary business opportunities with Petrobras. |
We currently manage our activities, with the support of a corporate center, in four business segments: (1) Oil and Gas Exploration and Production, (2) Gas and Energy, (3) Refining and Distribution, and (4) Petrochemicals.
Our Principal Market
PESA is an Argentinesociedad anónima. As of December 31, 2014, approximately 84% of our total assets, 99% of our sales, 91% of our combined crude oil and gas production and 89% of our proved oil and gas reserves were located in Argentina. Fluctuations in the Argentine economy and actions adopted by the Argentine government have had and may continue to have a significant effect on Argentine private sector entities, including us. Specifically, we have been affected and may in the future be affected by inflation, interest rates, fluctuations in the value of the peso against foreign currencies, price and export controls on oil and oil by-products, business regulations, changes in tax regulations and in general by the political, social and economic environment affecting Argentina and other countries. See “Item 3. Key Information—Risk Factors—Factors Relating to Argentina.”
Historically, the Argentine economy has been characterized by its macroeconomic instability and by periods of low or negative growth and high and variable levels of inflation and currency devaluation. In 1988, 1989 and 1990, the annual inflation rates were approximately 388%, 4,924% and 1,344%, respectively, based on the Argentine consumer price index, and approximately 422%, 5,386% and 798%, respectively, based on the Argentine wholesale price index. As a result of inflationary pressures, the Argentine currency was devalued repeatedly during the 1960s, 1970s and 1980s. Macroeconomic instability led to broad changes in the real exchange rate of the Argentine currency relative to the U.S. dollar. To address these pressures, the Argentine government implemented various plans and utilized a number of exchange rate systems and controls.
In the 1990s, deep and drastic economic reforms were implemented in terms of state reform, the privatization of public companies and utilities, and the opening of the economy. The pillar of the economic reform was the Convertibility Law enacted in 1991. The Convertibility Law fixed the exchange rate at one Argentine peso per U.S. dollar and required that the Central Bank maintain reserves in gold and foreign currency at least equivalent to the monetary base. Between 1991 and 1997, the economy experienced growth, with exchange stability and low inflation rates.
Partly due to the convertibility model, in 1998 the Argentine economy entered a recession period, hitting its lowest point in December 2001, which resulted in a massive withdrawal of deposits and capital outflow. In light of the situation, following a strong contraction of GDP, the Argentine government implemented a number of monetary, banking and exchange control measures, which proved to be insufficient and caused a sharp rise in social discontent. This triggered a political, social and economic crisis.
19
On January 1, 2002 Argentina suspended the payment of a portion of its sovereign debt. Later that month, the Argentine Congress enacted the Public Emergency Law, whereby monetary, financial and exchange measures were implemented to overcome the economic crisis in the short term. These events resulted in dramatic changes in the economic model and put an end to the U.S. dollar-peso parity, leading to a significant devaluation of the Argentine peso.
The Argentine government then implemented a number of far-reaching initiatives, which included:
| | • | | Pesification of certain assets and liabilities denominated in foreign currency held in Argentina; |
| | • | | Amendment of the charter of the Central Bank, authorizing it to issue money in excess of the foreign currency reserves, grant short-term loans to the Argentine government and provide financial assistance to financial institutions with liquidity or solvency problems; |
| | • | | Pesification of, and elimination of indexing clauses for, utility rates, fixing those rates in pesos at the Ps.1.00=U.S.$1.00 exchange rate; and |
| | • | | Implementation of taxes on hydrocarbon exports and certain related oil products, among others. |
In 2002, commercial and financial activities were virtually paralyzed, further aggravating the economic recession, which resulted in a 10.9% decline in GDP. Within this context, the peso devalued 238% against the U.S. dollar and wholesale inflation grew 118.2%. Towards the end of 2002, the Argentine government implemented different measures aimed at stimulating the economy and eliminating certain restrictions to gradually normalize the foreign exchange market and the commercial and financial flow of foreign currency.
During the years that followed the 2001 crisis, the activity level exhibited an accelerated recovery, taking advantage of existing idle capacity, a high real exchange rate and increased international prices for commodities. During this period, inflation remained stable and there was an excess supply of U.S. dollars, supported by a significant trade surplus. The Central Bank sought to prevent the nominal appreciation of the Argentine peso by purchasing foreign currency, increasing its international reserves.
During that same period, the Argentine government maintained a surplus in its public accounts. In 2005, the Argentine government was able to restructure the debt in default with 76% of creditors accepting the government’s exchange offer proposal, which included reductions in principal amount, term extensions and reductions in interest rates. Early in 2006, Argentina prepaid its debt outstanding with the IMF (around U.S.$10 billion) using freely available Central Bank reserves. Between 2004 and 2008, Argentina recorded primary budget surpluses in excess of 2% of GDP at national levels. According to the Ministry of Economy, the primary surplus fell to 1.2% in 2009, 1.4% in 2010 and 0.2% in 2011, and primary budget deficits of 0.2%, 0.7% and approximately 0.8% of GDP were recorded in 2012, 2013 and 2014, respectively.
According to inflation data published by the INDEC, from 2009 to 2014, the Argentine consumer price index increased 7.7%, 10.9%, 9.5%, 10.8%, 10.9% and 23.9%, respectively; and the wholesale price index increased 10.3%, 14.6%, 12.7%, 13.1%, 14.8% and 28.3%, respectively. However, the INDEC has since 2007 experienced a process of institutional and methodological reforms that have given rise to controversy with respect to the reliability of the information that it produces. Reports published by the IMF use alternative measures of inflation for macroeconomic surveillance, including data produced by private sources, which have shown inflation rates considerably higher than those published by the INDEC since 2007. The IMF has also censured Argentina for failing to make sufficient progress, as required under the Articles of Agreement of the IMF, in adopting remedial measures to address the quality of official data, including inflation and GDP data. On February 13, 2014, the INDEC released a new inflation index that measures prices on goods across the country and replaces the previous index that only measured inflation in the urban sprawl of the City of Buenos Aires. Even though the new methodology brought inflation statistics closer to those estimated by private sources, there are still differences between official inflation data and private estimates. See “Item 3. Key Information—Risk Factors—Factors Relating to Argentina—Economic and political instability in Argentina has affected and may continue to adversely affect our financial condition and results of operations.”
In 2008, unlike previous years and despite the benefit of record commodity prices, the foreign currency supply did not show a surplus, reserves at the Central Bank stagnated and the nominal exchange rate showed a depreciation, triggered by capital outflows. Within this context, and with the combined effect of an international environment affected by the financial crisis and reduced domestic growth, the Argentine government was unable to raise sufficient voluntary funds to make its foreign debt payments and had to resort mostly to intra-public sector financing. Consequently, Argentine country-risk exhibited a clear upward trend, ultimately reaching approximately 1,800 basis points. In November 2008, the Argentine Congress passed a bill that eliminated the private pension system and provided for a transfer of all assets and liabilities managed by the private pension system to the public pension regime. This allowed the Argentine government access to additional funds in the short term.
20
In 2009, the Argentine economy was affected by a serious drought that negatively impacted harvests, together with lower commodity prices and reduced external demand resulting from the global crisis. In this context, industrial production suffered a deeper impact than non-industrial activities. The Argentine economy recovered in the second half of the year, resulting in a slight GDP increase of 0.1%, according to the INDEC. The Argentine trade balance surplus increased to over U.S.$16 billion in 2009, compared to U.S.$12 billion in 2008 and U.S.$11 billion in 2007, as a result of imports contracting more rapidly than exports. Exports were mainly affected by fewer sales of commodities due to the drought. In spite of this significant trade surplus, the reserves at the Central Bank ended the year at levels similar to those recorded at the end of 2008. Private foreign currency demand grew during the first part of the year, but then dropped progressively as a result of more favorable domestic and overseas macroeconomic trends. The peso-dollar exchange rate tracked this evolution, reflecting a higher depreciation rate at the beginning of the year and greater stability in the last months of the period. The exchange rate closed the year at Ps.3.80 per U.S.$1.00 (a 10% depreciation), with an average rate of Ps.3.73 per U.S.$1.00 in the twelve-month period.
In 2010, the Argentine economy registered an increase in real GDP of 9.5%. The increased economic activity during 2010 boosted imports by more than 40%, resulting in the trade balance surplus dropping to U.S.$12 billion, as the increase in imports was only partially offset by an increase of approximately 20% in exports as a consequence of the good harvest and strong international prices. Central Bank reserves increased by over U.S.$4.0 billion in 2010 to approximately U.S.$52.1 billion at the end of the year, in spite of withdrawal of reserves to support payments to sovereign multilateral lenders and bondholders. In May 2010, the Argentine government made a new exchange offer to holders of its pre-2001 bonds that did not participate in the 2005 restructuring, representing an amount of U.S.$18.7 billion. The acceptance rate for the exchange was above 60% of the overall amount. The exchange rate in 2010 averaged Ps.3.91 per U.S.$1.00, and closed 2010 at Ps.3.98 per U.S.$1.00.
In 2011, the Argentine economy continued growing, with a further increase in GDP of 8.4%. A large increase in public expenditures and extension of credit facilities, as well as a good harvest and high international prices, positively impacted internal demand. Financial intermediation, trade and investment in construction were some of the most dynamic sectors. This increase in activity levels resulted in another large increase in imports (approximately 30%), which was partially offset by a 25% increase in exports; thus, the trade balance recorded a U.S.$10.3 billion surplus for the year. Energy imports grew substantially during 2011, resulting in a negative energy trade balance of U.S.$2.9 billion. Despite the trade surplus, the foreign exchange supply was reduced due to lower inflow of funds from loans and direct foreign investment and, primarily, increasing capital outflows as a consequence of portfolio dollarization. The Argentine government continued using free available reserves to pay for its foreign debt maturities and the Central Bank’s reserves dropped by U.S.$5.8 billion, to approximately U.S.$46.3 billion. The exchange rate averaged Ps.4.13 per U.S.$1.00 in 2011, and closed the year at Ps.4.30 per U.S.$1.00, 8% higher compared to the previous year-end. Interest rates showed a significant increase, especially during the last quarter. Finally, Argentine country risk reached an annual average of 676 basis points, growing substantially from August 2011 onward, reaching 927 basis points as of December 31, 2011.
In 2012, growth in the Argentine economy diminished as compared to 2011, registering a GDP increase of 0.8% according to the INDEC, as a result of domestic and global factors including the European debt crisis, the slowdown of emerging economies, and the effects of a short drought period and a subsequent flood period. Domestic demand was the main factor contributing to the positive variation in GDP. Exports fell 3% compared to the previous year, mainly due to the above-mentioned global factors, while imports declined 7%, resulting in a trade surplus of over U.S.$12 billion. Despite such trade surplus, the Central Bank’s reserves closed the year at U.S.$43.1 billion, a decrease of approximately U.S.$3 million compared to 2011, as a consequence of the use by the Argentine government of the Central Bank’s reserves to honor sovereign foreign debt commitments.
During 2012, the Central Bank continued implementing an expansive monetary policy. The exchange rate closed at Ps.4.91 per U.S.$1.00 by the end of the year, representing a 14% year-on-year depreciation of the peso.
The Argentine country risk premium located slightly below 1,000 basis points as of the end of the year. On March 22, 2012, the Argentine Congress enacted Law No. 26,739, which amended the charter of the Central Bank and the Convertibility Law. This new law amended the objectives of the Central Bank (established in its charter) and removed certain provisions previously in force. Pursuant to the terms of the new law, the Central Bank will focus on promoting monetary and financial stability as well as development with social equity. In addition, the concept of “freely available reserves” was eliminated, granting the Argentine government access to additional reserves to pay debt. In addition, since late 2011, the Argentine government has also adopted numerous measures to control directly or indirectly foreign trade and foreign exchange markets.
In 2013, real GDP economy registered an increase of 2.9% according to the INDEC, mainly as a result of the favorable performance of the agricultural sector. Industrial activity, on the other hand, slightly decreased compared to 2012, with the automotive industry being one of few sectors with positive variations. The trade balance resulted in a surplus of U.S.$9 billion, a decrease of approximately U.S.$3 billion compared to 2012. The Central Bank’s reserves closed 2013 at U.S.$30.6 billion, accounting for a cumulative decline of U.S.$12.5 billion from December 31, 2012. The Peso/U.S. dollar exchange rate closed at Ps.6.49 per U.S.$1.00.
21
In 2014, the Argentine economy recorded a substantial slowdown, reporting a 0.5% growth in real GDP according to the INDEC. Industrial activity decreased by 2.5% compared to 2013. The trade balance resulted in a surplus of U.S.$7 billion, representing a 16% decrease compared to 2013, with decreasing imports and exports and a negative energy trade balance. The Central Bank’s reserves increased by approximately U.S.$1 billion, reversing a three-year decline trend. Despite efforts of the Central Bank, interest rates that had increased in the early months of 2014, stood at approximately 20% at the end of the year. The Peso/U.S. dollar exchange rate rose 31% in 2014 compared to 2013, including a depreciation of approximately 24% in January 2014, closing at $8.55 per U.S.$1.00 at December 31, 2014. Argentine country risk reached an annual average of 780 basis points. See “Item 3. Key Information—Risk Factors—Factors Relating to Argentina—Economic and political instability in Argentina has affected and may continue to adversely affect our financial condition and results of operations.”
Presidential elections are scheduled for October 2015 and President Fernandez de Kirchner will complete her term in December 2015. Primary elections for presidential candidates are scheduled to take place in August 2015.
22
OIL AND GAS EXPLORATION AND PRODUCTION
Overview
The core of our operations is the Oil and Gas Exploration and Production business segment, as this is a key link in our business chain. This business segment’s strategy is to develop profitable oil and gas reserves with a commitment to social and environmental responsibility. This strategy is focused on three main initiatives:
| | • | | Exploration for reserve replacement; |
| | • | | Optimization of operations and existing infrastructure as leverage for new projects; and |
| | • | | Development and monetization of non-conventional gas reserves. |
As of December 31, 2014, we participated in oil and gas exploration and production activities in Argentina and in other Latin American countries, including Venezuela (through our equity interest in mixed companies (empresas mixtas)) and Bolivia.
As of December 31, 2014, our combined crude oil and natural gas proved reserves, including our share of the reserves of our unconsolidated investees, were estimated at 210.6 million barrels of oil equivalent (“MMboe”) (compared to 205.1 MMboe as of December 31, 2013), approximately 59% of which were proved developed reserves and approximately 41% of which were proved undeveloped reserves. Crude oil accounted for approximately 40% of our combined proved reserves, while natural gas accounted for approximately 60%. As of December 31, 2014, 89% of our total combined proved reserves were located in Argentina and 11% were located abroad.
During 2014, our combined oil and gas production in Argentina averaged 79,300 barrels of oil equivalent per day, including unconsolidated investees. Our total oil and gas production for this period, including our share in the production of unconsolidated investees, averaged 87,200 barrels of oil equivalent per day (compared to 97,100 barrels of oil equivalent per day in 2013). Crude oil accounted for approximately 43,597 barrels per day, while natural gas accounted for approximately 261.3 million cubic feet per day (“MMcf/d”), or 43,556 barrels of oil equivalent per day based on a measure of conversion of 6,000 cubic feet of gas per barrel of oil equivalent. Approximately 88% of our oil production and 94% of our gas production during 2014 was derived from our operations in Argentina.
On May 31, 2012, we agreed to acquire an additional 39.671% equity interest in Petrolera Entre Lomas S.A. (“PELSA”) from our controlling company Petrobras Participaciones S.L. (“PPSL”) for U.S.$249.4 million, increasing our share in PELSA to 58.881%. See “Item 7. Major Shareholders and Related Party Transactions—Related Party Transactions—Sale of Companies.” PELSA performs oil and gas exploration and production activities in Argentina, and the remaining shares of PELSA are owned by APCO Oil and Gas International Inc. Sucursal Argentina (“APCO”). As of December 31, 2014, PELSA owned three concessions in oil and gas production areas in Argentina, of which the Entre Lomas field (in the Provinces of Neuquén and Río Negro) is the most important. PELSA holds a 73.15% interest in the Entre Lomas field, in which APCO holds 23% and we hold a 3.85% stake.
On January 31, 2014, our board of directors (the “Board of Directors”) approved the sale to YPF S.A. of our entire interest in the Puesto Hernández Joint Operation (UTE) agreement, for a total price of U.S.$40.7 million. This transaction represented for us an early termination of the agreement entered into with YPF S.A. in 1991 to operate Puesto Hernández, which is an area covering 147 km2, located in the Provinces of Neuquén and Mendoza. Prior to transferring our interest in the Joint Operation (UTE) agreement to YPF S.A., our share of Puesto Hernandez’s daily production was approximately 4,000 barrels of oil per day.
On December 30, 2014, the legislature of the Province of Rio Negro ratified the agreement entered into with the government of the Province of Rio Negro to extend for an additional 10-year term our concessions in the 25 de Mayo-Medanito S.E., Jagüel de los Machos and Río Neuquén fields. We operate those three areas and hold a 100% stake in the 25 de Mayo-Medanito S.E. and Jagüel de los Machos production fields in the Province of Rio Negro. Additionally, as part of our agreement to extend our concessions, we agreed to transfer 5% of the rights and obligations arising from our concession in the Rio Neuquén field to Empresa de Desarrollo Hidrocarburífero Provincial S.A. (EDHIPSA). As of the date of this Annual Report the transfer is still to be implemented.
On December 30, 2014, the legislature of the Province of Rio Negro also ratified its agreement with PELSA (as operator of the relevant area), to extend our concession in the Entre Lomas field for an additional 10 years.
Recent Sales
On March 4, 2015, the Secretary of Energy of the Province of Salta granted us by Resolution 07/2015 an extension of the second exploration period of the Chirete concession area for a period of two years from the current expiration date. On March 19, 2015, the Board of Directors approved the transfer of a 50% stake in the Chirete area to the High Luck Group. The agreement is subject to approval by the authorities of the Province of Salta before it becomes effective.
23
On March 30, 2015, our Board of Directors approved the sale to Compañía General de Combustibles S.A. (“CGC”) of our entire interest in the Austral Basin in Argentina, which includes our interest in the UTEs in Santa Cruz I, Santa Cruz I Oeste, Glencross and Estancia Chiripá, our assets associated with Santa Cruz II, Punta Loyola Pier and oil and gas pipelines operated in the basin, for a total price of U.S.$101 million. The relevant concessions cover an area of 11,500 km2 and are located in the Province of Santa Cruz. Prior to transferring our interest in the concessions, our share of the Austral Basin’s daily combined oil and gas production was approximately 15,000 barrels of oil equivalent per day.
Integration with our Refining and Distribution business segment enables us to process a large part of our crude oil production in Argentina. In addition, in Argentina our Oil and Gas Exploration and Production business segment supplies gas to our Petrochemical, Refining and Energy operations.
Our Oil and Gas Exploration and Production Interests
As is common in the Oil and Gas Exploration and Production business, we generally participate in exploration and production activities in conjunction with joint operation partners. Contractual arrangements among participants in a joint operation are usually governed by an operating agreement, which provides that costs, entitlements to production and liabilities are to be shared according to each party’s percentage interest in the joint operations. One party of the joint operation is usually appointed as operator and is responsible for conducting the operations under the overall supervision and control of an operating committee that consists of representatives of each party to the joint operations. While operating agreements generally provide for liabilities to be borne by the participants according to their respective percentage interest, licenses issued by the relevant governmental authority generally provide that participants in joint operations are jointly and severally liable for their obligations to that governmental authority pursuant to the applicable license. In addition to their interest in field production, contractual operators are generally paid their indirect administrative expenses on a monthly basis by their partners in proportion to their participation in the relevant field.
As of December 31, 2014, we had interests in 37 blocks: 23 oil and gas production blocks (18 in Argentina and five outside Argentina) and 14 exploration blocks located within exploration areas or pending authorization for production (all of them located in Argentina). As of December 31, 2014, we were directly or indirectly the contractual operator of 25 of the 37 blocks in which we had an interest.
As of December 31, 2014, our total gross and net productive wells were as follows:
| | | | | | | | | | | | |
| | | Oil | | | Gas | | | Total * | |
Gross productive wells(1) | | | 2,490 | | | | 401 | | | | 2,891 | |
Net productive wells(2) | | | 1,771 | | | | 299 | | | | 2,070 | |
| (1) | Refers to number of wells completed. |
| (2) | Refers to fractional ownership working interest in gross productive wells. |
| * | See “—Overview—Recent Sales.” |
As of December 31, 2014, our total production and exploration acreage, both gross and net, was as follows:
| | | | | | | | | | | | | | | | |
| | | Acreage* | |
| | | Production(1) | | | Exploration(2) | |
| | | Gross | | | Net(3) | | | Gross | | | Net(3) | |
| | | (in thousands of acres) | |
Argentina | | | 4,118 | | | | 2,691 | | | | 15,873 | (4) | | | 5,212 | (5) |
Venezuela | | | 485 | | | | 126 | | | | — | | | | — | |
Bolivia | | | 56 | | | | 56 | | | | — | | | | — | |
| | | | | | | | | | | | | | | | |
Total | | | 4,659 | | | | 2,873 | | | | 15,873 | | | | 5,212 | |
| | | | | | | | | | | | | | | | |
| (1) | Includes all areas in which we produce commercial quantities of oil and gas or areas in the development stage. |
| (2) | Includes all areas in which we are allowed to perform exploration activities but where commercial quantities of oil and gas are not produced, plus areas that are not in the development stage. |
| (3) | Represents our fractional ownership working interest in the gross acreage. |
| (4) | Includes 14,300 thousand exploration acres in offshore areas. |
| (5) | Includes 4,139 thousand exploration acres in offshore areas. |
| * | See “—Overview—Recent Sales.” |
24
The following table sets forth the number of total wells we drilled in Argentina and outside Argentina and the results for the relevant periods. A development well, for purposes of the following table, is one that justifies the installation of permanent equipment for the production of oil or gas. A well is deemed to be a dry well if it is determined to be incapable of commercial production. “Gross wells drilled” in the table below refers to the number of wells completed during each fiscal year, regardless of the spud date, and “net wells drilled” relates to our fractional ownership working interest in wells drilled. This table includes wells drilled by our subsidiaries, joint operations and associates.
| | | | | | | | | | | | | | | | | | | | | | | | | | | | | | | | | | | | |
| | | Year ended December 31, | |
| | | 2014 | | | 2013 | | | 2012 | |
| | | Argentina | | | Venezuela | | | Rest of
Latin
America | | | Argentina | | | Venezuela | | | Rest of
Latin
America | | | Argentina | | | Venezuela | | | Rest of
Latin
America | |
Gross wells drilled: | | | | | | | | | | | | | | | | | | | | | | | | | | | | | | | | | | | | |
Production: | | | | | | | | | | | | | | | | | | | | | | | | | | | | | | | | | | | | |
Development wells: | | | | | | | | | | | | | | | | | | | | | | | | | | | | | | | | | | | | |
Oil | | | 79 | | | | 2 | | | | — | | | | 81 | | | | 6 | | | | — | | | | 86 | | | | 8 | | | | — | |
Gas | | | 12 | | | | — | | | | — | | | | 10 | | | | — | | | | — | | | | 11 | | | | — | | | | 2 | |
Dry wells | | | — | | | | — | | | | — | | | | 1 | | | | — | | | | — | | | | — | | | | 1 | | | | — | |
| | | | | | | | | | | | | | | | | | | | | | | | | | | | | | | | | | | | |
Total | | | 91 | | | | 2 | | | | — | | | | 92 | | | | 6 | | | | — | | | | 97 | | | | 9 | | | | 2 | |
| | | | | | | | | | | | | | | | | | | | | | | | | | | | | | | | | | | | |
Exploration: | | | | | | | | | | | | | | | | | | | | | | | | | | | | | | | | | | | | |
Exploratory wells: | | | | | | | | | | | | | | | | | | | | | | | | | | | | | | | | | | | | |
Oil | | | 2 | | | | — | | | | — | | | | 3 | | | | — | | | | — | | | | — | | | | 1 | | | | — | |
Gas | | | 4 | | | | — | | | | — | | | | 2 | | | | — | | | | — | | | | 2 | | | | — | | | | — | |
Dry wells | | | 2 | | | | — | | | | — | | | | — | | | | — | | | | — | | | | 3 | | | | — | | | | — | |
| | | | | | | | | | | | | | | | | | | | | | | | | | | | | | | | | | | | |
Total | | | 8 | | | | — | | | | — | | | | 5 | | | | — | | | | — | | | | 5 | | | | 1 | | | | — | |
| | | | | | | | | | | | | | | | | | | | | | | | | | | | | | | | | | | | |
Net wells drilled: | | | | | | | | | | | | | | | | | | | | | | | | | | | | | | | | | | | | |
Production: | | | | | | | | | | | | | | | | | | | | | | | | | | | | | | | | | | | | |
Productive wells: | | | | | | | | | | | | | | | | | | | | | | | | | | | | | | | | | | | | |
Oil | | | 53 | | | | — | | | | — | | | | 60 | | | | 1 | | | | — | | | | 69 | | | | 2 | | | | — | |
Gas | | | 9 | | | | — | | | | — | | | | 6 | | | | — | | | | — | | | | 9 | | | | — | | | | 2 | |
Dry wells | | | — | | | | — | | | | — | | | | — | | | | — | | | | — | | | | — | | | | — | | | | — | |
| | | | | | | | | | | | | �� | | | | | | | | | | | | | | | | | | | | | | | |
Total | | | 62 | | | | — | | | | — | | | | 66 | | | | 1 | | | | — | | | | 78 | | | | 2 | | | | 2 | |
| | | | | | | | | | | | | | | | | | | | | | | | | | | | | | | | | | | | |
Exploration: | | | | | | | | | | | | | | | | | | | | | | | | | | | | | | | | | | | | |
Discovery wells: | | | | | | | | | | | | | | | | | | | | | | | | | | | | | | | | | | | | |
Oil | | | 1 | | | | — | | | | — | | | | 2 | | | | — | | | | — | | | | — | | | | — | | | | — | |
Gas | | | 4 | | | | — | | | | — | | | | 1 | | | | — | | | | — | | | | 1 | | | | — | | | | — | |
Dry wells | | | 1 | | | | — | | | | — | | | | — | | | | — | | | | — | | | | 3 | | | | — | | | | — | |
| | | | | | | | | | | | | | | | | | | | | | | | | | | | | | | | | | | | |
Total | | | 6 | | | | — | | | | — | | | | 3 | | | | — | | | | — | | | | 4 | | | | — | | | | — | |
| | | | | | | | | | | | | | | | | | | | | | | | | | | | | | | | | | | | |
Veta Escondida Exploitation Concession
On April 4, 2012, we were notified of a decision of the government of the Province of Neuquén to terminate our production concession in the Veta Escondida area. We have sought judicial relief, alleging that we have complied with all requirements under the concession and that we did not commit any breach which would support the decision adopted by the government of Neuquén. On June 28, 2012, the Company was served with an order rendered by the Argentine Supreme Court, upholding the provisional remedy obtained by the Company from the lower courts and instructing the Province of Neuquén to refrain from executing the termination of the concession until a ruling on the merits of the case is delivered.
On December 19, 2013, we (as operators) and Total Austral, having an interest of 55% and 45% in the Veta Escondida exploitation concession, respectively, reached an out-of-court agreement with the Province of Neuquén and Gas y Petróleo del Neuquén (“GyP”), to settle the dispute arising from the enactment of Provincial Decree No. 563/12, which declared the expiration of the concessionaires’ rights under this exploitation concession and led us to bring a complaint against the Province of Neuquén. During 2014, the term for the agreement approval by the Provincial Executive Branch expired.
On March 17, 2015, Provincial Decree No. 565/15 approved an agreement model including similar terms and conditions to those reached in the above mentioned one. The subscription by the parties to this new agreement model would finally settle the dispute. As of the date of this Annual Report, this agreement is still pending subscription.
Production
Argentine Oil and Gas Production
Rights to develop oil and gas fields in Argentina are currently awarded by the provincial governments through concessions and exploration permits. Under the amended Hydrocarbons Law, conventional (oil and gas) concessions will remain in effect for 25 years, non-conventional concessions for 35 years and offshore concessions for 30 years, and are typically renewable for a maximum term of ten years, and permits are generally granted for initial periods of four years. Concessionaires in Argentina are entitled to gross proceeds from production sales. All permanent fixtures, materials and equipment are under the control of the concessionaire, although they revert to the Argentine government at the end of the concession. Royalties based on production are paid to the respective Argentine provinces. Pursuant to the amended Hydrocarbons Law, concessionaires must pay royalties equivalent to 12% of the
25
wellhead price of crude oil and natural gas, and are required to make additional royalty payments ranging from 3% up to a maximum of 18% when applying for extensions. The wellhead price is calculated by deducting freight and other sales related expenses from the sale prices obtained from transactions with third parties.
We transport our oil and gas production in several ways depending on the infrastructure available and the cost efficiency of the transportation system in a given location. We use the oil pipeline system and oil tankers to transport oil to our customers. Oil is customarily sold through contracts whereby producers are responsible for transporting produced oil from the field to a port for shipping, with all costs and risks associated with transportation borne by the producer. Gas, however, is sold at the delivery point of the gas pipeline system near the field and, therefore, the customer bears all transportation costs and risks associated therewith. Oil and gas transportation in Argentina operates in an “open access” non-discriminatory environment under which producers have equal and open access to the transportation infrastructure. We maintain limited storage capacity at each oil site and at the terminals from which oil is shipped. In the past, these capacities have been sufficient to store oil without reducing current production during temporary unavailability of the pipeline systems, due, for example, to maintenance requirements or temporary emergencies.
As of December 31, 2014, we owned 18 concessions in oil and gas production areas in Argentina. Our production is concentrated in four basins: the Neuquén, Austral, San Jorge and Noroeste Basins. In the Neuquén Basin—the most important basin in Argentina in terms of oil and gas production—we own approximately 667,000 net acres. Our most important fields in the Neuquén Basin are 25 de Mayo-Medanito S.E., El Mangrullo and Sierra Chata. In the Austral Basin, we owned approximately 1,910,000 net acres as of December 31, 2014, with Santa Cruz I and Santa Cruz II being our main concessions. On March 30, 2015 we agreed to sell certain of these assets to CGC. See “—Overview—Recent Sales.” As of December 31, 2014, we had 2,683 productive wells in Argentina.
For the year 2014, our average daily production was 38,258 barrels of crude oil and 246.2 million cubic feet of natural gas, representing a decrease of 16.3% in our production of oil (mainly as a result of the sale of the Puesto Hernandez block) and of 2.5% in our production of gas, compared to 2013.
During 2014, according to the SE, oil production in Argentina declined to an average of 532,927 barrels per day, a decrease of 1% compared to 2013. Gas production decreased by 1% and stood at 4.0 billion cubic feet per day. In 2014, our oil production and our gas production accounted for approximately 4% and 8% of total oil production and gas production in Argentina, respectively, and positioned us as the fourth producer of oil and gas in the country.
In 2014, we carried out investment plans aligned with our reserves replacement and production goals, as a means to achieve sustainable growth. Our capital expenditures included the drilling of 36 producing wells, repairing 30 producing wells, mainly in the Neuquén Basin, and expanding secondary recovery projects and surface facilities in several areas in which we operate.
Production Outside Argentina
As of December 31, 2014, 11% of our combined proved reserves were located outside Argentina. In addition, as of December 31, 2014, approximately 12% of our oil production and 6% of our gas production came from outside Argentina. As of that date, we had working interests in five oil and gas production blocks outside Argentina: Oritupano Leona, La Concepción, Acema and Mata (through direct and indirect equity interests in mixed companies, including Petroritupano S.A., Petroven-Bras S.A., Petrowayú S.A. and Petrokariña S.A.) in Venezuela, and Colpa Caranda in Bolivia.
Venezuela
During 2014, oil and gas production attributable to our operations in Venezuela averaged 4,903 barrels of oil equivalent per day, representing 5.6% of our daily production and a decrease of 15.5% compared to 2013. Our four areas in Venezuela, operated by mixed companies, had an aggregate of 147 productive wells.
Mixed companies are required to sell all liquid hydrocarbons and the associated natural gas they produce to Petróleos de Venezuela S.A. (“PDVSA”) by reference to a price formula that uses international benchmarks such as the price of WTI crude.
Mixed companies are subject to royalty payments of 33.33% based on production. In addition, they are required to pay to the Venezuelan government an amount equivalent to any difference between (1) 50% of the value of oil and gas sales during each calendar year and (2) the sum of total royalty payments made during such year plus income tax and any other tax or duty calculated on the basis of the sales revenues paid during such year.
In 2008, the Venezuelan government enacted the “Law of Special Contribution to Extraordinary Prices in the International Hydrocarbons Market”, introducing a special tax payable by companies exporting or transporting liquid hydrocarbons and oil by-products outside Venezuela, to be applied when the average price of the basket of Venezuelan liquid hydrocarbons exceeded U.S.$70 per barrel.
In 2011, the special tax payable under the above mentioned law was replaced with two special contributions, one for “extraordinary” prices and another for “exorbitant” prices, to be applied to the difference between the price set forth by the Venezuelan national budget and the monthly average of international prices of the basket of Venezuelan liquid hydrocarbons. In 2013,
26
the Venezuelan government reformed the Decree No. 8,807/12, introducing modifications and updates the rates of these specials contributions. For the purposes of the law are considered exorbitant prices those whose monthly average of international prices of the basket of Venezuelan liquid hydrocarbons exceed U.S.$80 per barrel. These special contributions are recorded by mixed companies as selling expenses in their financial statements and negatively impact the earnings of such mixed companies.
Bolivia
In 2014, our net daily production in Bolivia under the economic interest method was 2,961 barrels of oil equivalent, or 3.4% of our total production. Of this amount, 13.5 MMcf/d corresponded to gas production and 706 barrels of oil per day corresponded to liquid hydrocarbons, including liquified petroleum gas (“LPG”).
As of December 31, 2014, we held a 100% interest in the Colpa Caranda Block in Bolivia. The Colpa Caranda Block covers approximately 56,000 net acres located in the Sub Andina Central Basin and has 61 producing wells. These fields, which originally exported gas to Argentina, currently deliver gas primarily to the Santa Cruz-São Paulo pipeline that transports gas to Brazil.
As of December 31, 2008, estimated proved oil and gas reserves attributable to our operations in Bolivia amounted to 23 MMboe. However, on January 25, 2009, Bolivia adopted a new constitution that prohibits private ownership of the country’s oil and gas resources. In light of the new constitution, we were required to write off all of our proved reserves in Bolivia at the end of 2009.
We have operated the Colpa Caranda Block in Bolivia since 1989. Under a contract signed in October 2006 with the Bolivian national oil company, Yacimientos Petroliferos Fiscales Bolivianos (“YPFB”), we currently perform exploration and production activities at our own risk and for our own account in the Colpa Caranda Block, but on behalf and in the name of YPFB. The agreement was approved on April 23, 2007 and became effective on May 2, 2007. Under this agreement, YPFB owns the hydrocarbons and pays royalties, direct interest and direct tax on hydrocarbons, which in the aggregate amount to 50% of the production valued on the basis of sales prices net of transport costs charged for use of pipelines from the Colpa fields to Brazil. Of the remaining amounts, 80% is used to pay for operating services provided by us, including depreciation. The balance is shared between YPFB and us on the basis of an index calculated based on production volumes, depreciation rates, prices and taxes paid, among other items.
Ecuador
On October 31, 2008, EcuadorTLC S.A., Teikoku Oil Ecuador and Petroecuador, among others, executed a series of amendatory agreements regulating the operation of Block 18 and Palo Azul Unified Field (the “Amendatory Agreements”), while the parties negotiated the migration to a new contract modality.
On July 26, 2010, the Hydrocarbon Law in force in Ecuador was amended to provide for, among other things, the obligation to migrate to a new contract modality before November 24, 2010.
The Company decided not to accept the final proposal received from the Ecuadorian government to migrate from the original arrangements to service agreements in Block 18 and the Palo Azul Unified Field. Consequently, through a Resolution dated November 25, 2010, the Hydrocarbon Secretary notified EcuadorTLC S.A. of the termination of the participation agreements and instructed Petroamazonas EP to undertake the operational transition process. Until November 25, 2010, our oil production in Ecuador averaged 2,300 barrels per day, accounting for 2.3% of our total average daily production in barrels of oil equivalent.
Section 9 of the Amendatory Agreements provides that the Ecuadorian government must compensate the terminated parties in an amount equivalent to unamortized investments adjusted by reference to a variable rate, and provides for a period of time for the Ecuadorian government and the terminated parties to work out the details of the termination payment.
On March 18, 2011, the Hydrocarbon Secretary issued Official Notice No. 626 to inform the Company that it was analyzing and structuring a new regulatory framework to determine a settlement price for the termination, to be applied instead of the provisions of the Amendatory Agreements. On April 11, 2011, the Company filed an answer to Official Notice No. 626 rejecting the terms thereof and claiming that the same did not comply with the conditions set forth in the Amendatory Agreements. In this respect, the Company informed the Hydrocarbon Secretary that it would continue to seek compliance with the terms of the Amendatory Agreements.
In the absence of further action by the Ecuadorian government, on December 9, 2011, we served a notice on the Ecuadorian government informing it of the existence of a dispute under the terms of the Treaty for the Promotion and Reciprocal Protection of Investments previously entered into between Argentina and Ecuador. Under the treaty, this implies the opening of a negotiation period prior to possible arbitration to seek enforcement of the provisions of the Amendatory Agreements.
On June 21, 2013, not having reached an agreement with the Ecuadorian government, EcuadorTLC SA, Cayman International Exploration Company and Teikoku Oil Ecuador, members of the Consortium, submitted to the Ecuadorian State a letter of notification of a dispute under the terms of the Amendatory Agreements, stating their decision to submit the dispute to international arbitration under the arbitration Rules of the UNCITRAL, which was instituted on February 26, 2014.
27
At December 31, 2014 we recorded Ps.458 million to be recovered from the Ecuadorian State in accordance with the provisions of the Amendatory Agreements, excluding any interest accrued, as we believe that it is not possible to determine with certainty the interest rate to be applied.
As of the date of this Annual Report, the Company has taken all the necessary procedural steps to preserve its rights to receive from the Ecuadorian government the compensation provided for in the Amendatory Agreements.
Crude Oil Transportation Agreement with OCP
Starting November 10, 2003, the Company entered into a “Ship or Pay” agreement with Oleoducto de Crudos Pesados S.A. (“OCP”), whereby it secured an oil transportation capacity of 80,000 barrels per day for a 15-year term.
Under this agreement, the Company must comply with its contractual obligations for the aggregate committed capacity, regardless of the amount of crude oil actually transported, and pay a rate that covers OCP’s operating costs and financial services, among other items.
While the Amendatory Agreements remained in force, transportation capacity costs invoiced by OCP were charged on a monthly basis. Costs related to the crude oil volume actually transported were charged to “Administrative and selling expenses,” while the portion of costs related to the unused committed transportation capacity was shown under “Other operating expenses.”
The Company is entitled to sell transportation capacity through OCP’s pipeline to mitigate the negative effect of excess contracted capacity. In this respect, the Company periodically negotiates the sale of committed transportation capacity. On December 31, 2008, the Company and Petroecuador entered into an agreement under which, as from January 1, 2009, transportation of crude oil through OCP’s pipeline will be charged by Petroecuador to the transportation capacity committed to under the agreement entered into between the Company and OCP, up to a maximum of 70,000 barrels per day. In addition, the Company sold transportation capacity for approximately 8,000 oil barrels per day to third parties for the July 2004-January 2012 period. In October 2008, 40% of the net contractual commitment was assumed by Teikoku Oil Ecuador, as consideration for the assignment to the Company of a 40% interest in Block 18 and Palo Azul.
Upon termination of the operations in Block 18, EcuadorTLC recognized liabilities amounting to Ps.342 million as of December 31, 2010 for contract termination costs that will continue to be incurred under the Ship or Pay contract with OCP for the expected loss on the net committed transportation capacity. As of December 31, 2014, related current and non-current liabilities amounted to Ps.130 million and Ps.299 million, respectively. The obligations associated with the Ship or Pay contract expire in 2018.
During 2013, several inconsistent court rulings were issued in connection with certain interpretative divergences between OCP and the Ecuadorian tax authorities. In 2014, however, the Ecuadorian tax authorities’ position was confirmed by the Ecuadorian National Court of Justice. OCP filed certain extraordinary protection petitions with the Ecuadorian Constitutional Court, which were dismissed at the end of 2014.
As of December 31, 2014, OCP had negative shareholders’ equity. We have not committed to make capital contributions or provide financial assistance to OCP; therefore our equity interest in OCP was valued at zero and we recorded a net loss of Ps.464 million for 2014 after giving effect to the capitalization during 2014 of a credit we held against OCP. See “Item 7. Major Shareholders and Related Party Transactions—Related Party Transactions—Commercial Operations.”
Statistical Information Relating to Oil and Gas Production
The following table sets forth our oil and gas production during 2014. Production figures represent our working interest in production (and are therefore net to us). In addition, the table includes our working interest in each field, the number of producing wells and the expiration date of the concessions, in each case as of December 31, 2014. Although some of these concessions may be extended at their expiration, the expiration dates set forth below do not include any extensions.
| | | | | | | | | | | | | | | | | | | | | | | | | | | | |
| | | | | | | 2014 Production | | | Oil and
Gas
Wells | | | | | | | |
Production Areas | | Location | | Basin | | Oil(1) | | | Gas(2) | | | Oil
Equivalent (3) | | | | Interest | | | Expiration | |
Argentina: | | | | | | | | | | | | | | | | | | | | | | | | | | | | |
25 de Mayo – Medanito S.E. | | La Pampa and Río Negro | | Neuquén | | | 3,302 | | | | 2,873 | | | | 3,781 | | | | 657 | | | | 100.00 | % | | | 2016/2026 | |
El Mangrullo | | Neuquén | | Neuquén | | | 42 | | | | 21,273 | | | | 3,588 | | | | 25 | | | | 100.00 | % | | | 2025 | |
Jagüel de los Machos | | La Pampa and Río Negro | | Neuquén | | | 2,224 | | | | 3,832 | | | | 2,863 | | | | 231 | | | | 100.00 | % | | | 2015/2025 | |
Bajada del Palo | | Neuquén | | Neuquén | | | 1,228 | | | | 2,673 | | | | 1,674 | | | | 110 | | | | 46.92 | % | | | 2025 | |
Santa Cruz II | | Santa Cruz | | Austral | | | 367 | | | | 1,618 | | | | 637 | | | | 56 | | | | 100.00 | % | | | 2017/2028 | |
Río Neuquén | | Río Negro and Neuquén | | Neuquén | | | 323 | | | | 11,527 | | | | 2,244 | | | | 130 | | | | 100.00 | % | | | 2027 | |
Entre Lomas | | Río Negro and Neuquén | | Neuquén | | | 2,344 | | | | 3,583 | | | | 2,941 | | | | 494 | | | | 46.92 | % | | | 2026 | |
28
| | | | | | | | | | | | | | | | | | | | | | | | | | | | |
| | | | | | | 2014 Production | | | Oil and
Gas
Wells | | | | | | | |
Production Areas | | Location | | Basin | | Oil(1) | | | Gas(2) | | | Oil
Equivalent (3) | | | | Interest | | | Expiration | |
Aguada de la Arena | | Neuquén | | Neuquén | | | 50 | | | | 6,079 | | | | 1,063 | | | | 14 | | | | 80.00 | % | | | 2036 | |
Santa Cruz I | | Santa Cruz | | Austral | | | 913 | | | | 20,296 | | | | 4,296 | | | | 102 | | | | 71.00 | % | | | 2017/2035 | |
Sierra Chata | | Neuquén | | Neuquén | | | 42 | | | | 7,872 | | | | 1,354 | | | | 68 | | | | 45.56 | % | | | 2023 | |
Atuel Norte | | Mendoza | | Neuquén | | | 3 | | | | — | | | | 3 | | | | 4 | | | | 33.33 | %(6) | | | 2015 | |
La Tapera – Puesto Quiroga | | Chubut | | San Jorge | | | 41 | | | | — | | | | 41 | | | | 12 | | | | 35.67 | %(6) | | | 2027 | |
El Tordillo | | Chubut | | San Jorge | | | 1,994 | | | | — | | | | 1,994 | | | | 648 | | | | 35.67 | %(6) | | | 2027 | |
Aguaragüe | | Salta | | Noroeste | | | 80 | | | | 3,160 | | | | 607 | | | | 33 | | | | 15.00 | %(6) | | | 2023/2027 | |
Estancia Agua Fresca | | Santa Cruz | | Austral | | | 555 | | | | 2,184 | | | | 919 | | | | 25 | | | | 50.00 | % | | | 2034 | |
Puesto Oliverio | | Santa Cruz | | Austral | | | 28 | | | | 1 | | | | 28 | | | | 1 | | | | 50.00 | % | | | 2037 | |
Gobernador Ayala | | Mendoza | | Neuquén | | | 169 | | | | — | | | | 169 | | | | 41 | | | | 22.51 | %(6) | | | 2036 | |
Charco del Palenque | | Río Negro | | Neuquén | | | 351 | | | | 2,887 | | | | 832 | | | | 32 | | | | 46.92 | % | | | 2034 | |
| | | | | | | | | | | | | | | | | | | | | | | | | | | | |
Total Argentina | | | | | | | 14,056 | | | | 89,858 | | | | 29,034 | | | | 2,683 | | | | | | | | | |
| | | | | | | | | | | | | | | | | | | | | | | | | | | | |
Outside Argentina: | | | | | | | | | | | | | | | | | | | | | | | | | | | | |
Colpa Caranda(4) | | Bolivia | | Sub Andina | | | 258 | | | | 4,939 | | | | 1,081 | | | | 61 | | | | 100.00 | % | | | 2029 | |
Oritupano Leona(5) | | Venezuela | | Oriental | | | 866 | | | | — | | | | 866 | | | | 72 | | | | 22.00 | %(6) | | | 2025 | |
Acema(5) | | Venezuela | | Oriental | | | 25 | | | | — | | | | 25 | | | | 18 | | | | 34.49 | %(6) | | | 2025 | |
La Concepción(5) | | Venezuela | | Lago Maracaibo | | | 683 | | | | 591 | | | | 782 | | | | 51 | | | | 36.00 | %(6) | | | 2025 | |
Mata(5) | | Venezuela | | Oriental | | | 117 | | | | — | | | | 117 | | | | 6 | | | | 34.49 | %(6) | | | 2025 | |
| | | | | | | | | | | | | | | | | | | | | | | | | | | | |
Total Outside Argentina | | | | | | | 1,949 | | | | 5,530 | | | | 2,871 | | | | 208 | | | | | | | | | |
| | | | | | | | | | | | | | | | | | | | | | | | | | | | |
Total | | | | | | | 16,005 | | | | 95,388 | | | | 31,905 | | | | 2,891 | | | | | | | | | |
| | | | | | | | | | | | | | | | | | | | | | | | | | | | |
| (1) | In thousands of barrels. |
| (2) | In millions of cubic feet. |
| (3) | In thousands of barrels of oil equivalent. Gas is converted to oil equivalent using a factor of 6,000 cubic feet of gas per barrel of oil equivalent. |
| (4) | Production from Colpa Caranda block was calculated using the economic interest method. |
| (5) | Indirect interests through mixed companies. |
| (6) | Areas operated by third parties. |
The following table sets forth our average daily production of oil, including other liquid hydrocarbons, for the fiscal years ended December 31, 2014, 2013 and 2012. This table includes our net share of production of subsidiaries, joint operations and associates.
| | | | | | | | | | | | |
| | | Year ended December 31, | |
| | | 2014 | | | 2013 | | | 2012 | |
| | | (average barrels per day) | |
Argentina | | | 38,258 | | | | 45,688 | | | | 44,769 | |
Venezuela | | | 4,633 | | | | 5,518 | | | | 6,387 | |
Rest of Latin America | | | 706 | | | | 781 | | | | 885 | |
| | | | | | | | | | | | |
Total | | | 43,597 | | | | 51,987 | | | | 52,040 | |
| | | | | | | | | | | | |
The following table sets forth our average daily gas production for the fiscal years ended December 31, 2014, 2013 and 2012. This table includes our net share of production of subsidiaries, joint control operations and associates.
| | | | | | | | | | | | |
| | | Year ended December 31, | |
| | | 2014 | | | 2013 | | | 2012 | |
| | | (average thousands of cubic feet per day) | |
Argentina | | | 246,186 | | | | 252,636 | | | | 276,191 | |
Venezuela | | | 1,619 | | | | 1,696 | | | | 2,420 | |
Rest of Latin America | | | 13,532 | | | | 16,159 | | | | 18,605 | |
| | | | | | | | | | | | |
Total | | | 261,338 | | | | 270,491 | | | | 297,216 | |
| | | | | | | | | | | | |
29
The following table sets forth the average sales price per barrel of oil and per million cubic feet of gas for each geographic area for the fiscal years ended December 31, 2014, 2013 and 2012, of our subsidiaries, joint operations and associates.
| | | | | | | | | | | | |
| | | Year ended December 31, | |
| | | 2014 | | | 2013 | | | 2012 | |
Argentina: | | | | | | | | | | | | |
Oil (in pesos per barrel of oil) | | | 615.7 | | | | 399.0 | | | | 320.5 | |
Gas (in pesos per thousand cubic feet) | | | 22.5 | | | | 12.6 | | | | 8.8 | |
| | | |
Venezuela(1): | | | | | | | | | | | | |
Oil (in pesos per barrel of oil) | | | 589.4 | | | | 610.3 | | | | 408.3 | |
| | | |
Rest of Latin America(2): | | | | | | | | | | | | |
Oil (in pesos per barrel of oil) | | | 400.2 | | | | 157.2 | | | | 90.4 | |
Gas (in pesos per thousand cubic feet) | | | 53.2 | | | | 44.9 | | | | 37.4 | |
| (1) | Figures are translated into Argentine pesos at historic exchange rates, using an annual average exchange rate. |
| (2) | Figures are translated into Argentine pesos at historic exchange rates, using a monthly average exchange rate. |
The following table sets forth our average production cost, royalties and depreciation cost of oil and gas fields in each geographic area for the fiscal years ended December 31, 2014, 2013 and 2012. This table includes our net share of production of our subsidiaries, joint operations and associates.
| | | | | | | | | | | | |
| | | Year ended December 31, | |
| | | 2014 | | | 2013 | | | 2012 | |
| | | (in pesos per barrel of oil equivalent) | |
Argentina: | | | | | | | | | | | | |
Production cost | | | 109.23 | | | | 80.82 | | | | 60.08 | |
Royalties | | | 52.17 | | | | 34.27 | | | | 24.85 | |
Depreciation | | | 80.05 | | | | 58.73 | | | | 45.12 | |
| | | | | | | | | | | | |
Total | | | 241.15 | | | | 173.82 | | | | 130.05 | |
| | | |
Venezuela(1): | | | | | | | | | | | | |
Production cost | | | 314.03 | | | | 172.85 | | | | 103.74 | |
Royalties | | | 228.26 | | | | 127.61 | | | | 102.19 | |
Depreciation | | | 126.46 | | | | 64.49 | | | | 46.38 | |
| | | | | | | | | | | | |
Total | | | 668.75 | | | | 364.95 | | | | 252.31 | |
| | | |
Rest of Latin America(2): | | | | | | | | | | | | |
Production cost | | | 70.80 | | | | 34.62 | | | | 27.44 | |
Royalties | | | — | | | | — | | | | — | |
Depreciation | | | 36.19 | | | | 17.90 | | | | 15.46 | |
| | | | | | | | | | | | |
Total | | | 106.99 | | | | 52.52 | | | | 42.91 | |
| | | | | | | | | | | | |
| (1) | Figures are translated into Argentine pesos at historic exchange rates, using an annual average exchange rate. |
| (2) | Figures are translated into Argentine pesos at historic exchange rates, using a monthly average exchange rate. |
Exploration
Our strategy is focused on constantly searching for new exploration opportunities aligned with our growth targets. In Argentina, we own substantial acreage containing undeveloped reservoirs of non-conventional energy sources, including both shale oil and shale gas in the Neuquén Basin, and shale oil in the Austral Basin. In the coming years, we expect to focus on these areas as well as conventional reservoirs that are located close to infrastructure.
30
The following table lists our exploration areas in Argentina as of December 31, 2014, the location and basin of each area, our net working interest and the expiration date for the exploration authorization.
| | | | | | | | | | | | |
| | | Location | | Basin | | Interest | | | Expiration | |
Argentina: | | | | | | | | | | | | |
Glencross | | Santa Cruz | | Austral | | | 87.00 | % | | | 2033 | |
Estancia Chiripá | | Santa Cruz | | Austral | | | 87.00 | % | | | 2033 | |
Agua Amarga | | Río Negro | | Neuquén | | | 46.92 | % | | | (1 | ) |
Parva Negra Este | | Neuquén | | Neuquén | | | 85.00 | % | | | 2018 | |
Cerro Hamaca Norte | | Mendoza | | Neuquén | | | 39.64 | %(3) | | | (2 | ) |
El Campamento | | Santa Cruz | | Austral | | | 50.00 | % | | | 2037 | |
El Cerrito Oeste | | Santa Cruz | | Austral | | | 50.00 | % | | | 2037 | |
Chirete* | | Salta | | Noroeste | | | 100.00 | % | | | 2014 | |
Enarsa 1 | | Continental Shelf | | Offshore Argentina | | | 25.00 | %(3) | | | 2020 | |
Enarsa 3 | | Continental Shelf | | Offshore Argentina | | | 35.00 | % | | | 2020 | |
Río Atuel | | Mendoza | | Neuquén | | | 33.33 | %(3) | | | 2015 | |
Borde del Limay | | Neuquén | | Neuquén | | | 85.00 | % | | | 2015 | |
Los Vértices | | Neuquén | | Neuquén | | | 85.00 | % | | | 2015 | |
Veta Escondida and Rincón de Aranda | | Neuquén | | Neuquén | | | 55.00 | % | | | 2027 | |
| (1) | We have filed an application for permission to annex this area to our concession covering the Charco del Palenque field, which is pending approval as of the date of this Annual Report. |
| (2) | We have filed an application for a production concession with respect to this field, which is pending approval as of the date of this Annual Report. |
| (3) | Areas operated by third parties. |
| * | See “Item 4. Information on the Company—Oil and Gas Exploration and Production Overview—Recent Sales.” |
Exploration in Argentina
As of December 31, 2014, we held interests in approximately 15,873,000 gross exploration acres in Argentina, of which approximately 1,198,000 were located in shale oil/shale gas areas.
In 2014, we drilled five onshore wells: three in the Neuquén Basin, two of which—Mangrullo a-1022 and Rio Neuquen e-1052—were productive. We finished drilling the third well, Mangrullo a-1049, in December 2014, and it was completed, fractured and tested during first quarter of 2015 and is now a productive well. The two other wells drilled in 2014 are located in the Austral Basin. The Estancia La Nueva x-1 was a discovery well, and Estancia Campos a-6 was an appraisal well.
The Rio Neuquén e-1052 well’s objective was to investigate the extension of the tight gas reservoirs of the Punta Rosada and Lajas formations at a depth of 4,300 meters and outside of the area currently under development. After drilling, the well was hydraulically stimulated and tested, with very successful results.
The two wells in the El Mangrullo production area were discovered in 2013 while drilling the El Mangrullo x-1015 well as part of appraising the Agrio Formation.
In November 2014, we began drilling the shale gas Parva Negra x-1004 well, which is scheduled for completion during 2015. This well’s main objective is to evaluate the productivity of the Vaca Muerta Formation at a depth of 2,500 meters.
The two remaining wells, Estancia La Nueva x-1 and Estancia Campos a-6, were drilled in the Austral Basin. The first was a discovery of a gas and condensate accumulation in the La Paz field and the second well was drilled during delimitation of the Estancia Campos discovery in 2012.
In January 2014, we completed the drilling and fracturing operations of the Sierra Chata x-97 well, which became the second non-conventional (shale) exploratory well in the Petrobras system (and the first gas well). In 2014, we also initiated early production in the Rincón de Aranda shale oil field as a result of discovering oil there in 2013.
New Area for the Exploration of Non-Conventionals Hydrocarbon Reserves
On December 6, 2013, we acquired an 85% participation in a joint operation (UTE) agreement in association with GyP, who has the remaining 15%, for the exploration and potential exploitation of the area of Parva Negra Este, located in the Neuquén Basin.
The exploration permit is valid for four years plus a one-year extension with the right to request the exploitation concession for 25 years, which can also be extended for an additional 10 years. This agreement was approved by the Executive Branch of the province of Neuquén through Decree No. 575/14, published on April 4, 2014.
31
We own concessions in the Neuquén Basin with both shale oil and shale gas potential, and in the Austral Basin with shale oil potential. The development of non-conventional resources will demand major capital investments. See “Item 5. Operating and Financial Review and Prospects—Future Capital Requirements—Oil and Gas exploration and Production.”
Reserves
We believe our estimates of remaining proved recoverable oil and gas reserve volumes to be reasonable. Pursuant to Rule 4-10 of Regulation S-X, promulgated by the SEC, proved oil and natural gas reserves are those estimated quantities of crude oil, natural gas and natural gas liquids that geological and engineering data demonstrate with reasonable certainty to be recoverable in future years from known reservoirs, under existing economic and operating conditions,i.e., prices and cost at the date of estimation. DeGolyer and MacNaughton performed an independent evaluation of approximately 80% of our estimated reserves as of December 31, 2014. The reserves not evaluated by DeGolyer and MacNaughton are in areas where we do not act as operator. The evaluation covered 100% of the estimated reserves located in areas operated by us. DeGolyer and MacNaughton evaluated the proved oil and natural gas reserve estimates in accordance with Rule 4-10 of Regulation S-X and in accordance with the oil and gas reserves disclosure provisions of ASC Topic 932. We provided all information required during the course of the evaluation process to DeGolyer and MacNaughton’s satisfaction. See the reserves evaluation report by DeGolyer and MacNaughton, dated January 30, 2015, included as Exhibit 5.1 to this Annual Report.
As of December 31, 2014, 2013 and 2012, 80%, 73% and 76%, respectively, of our estimated reserves were evaluated by DeGolyer and MacNaughton.
Internal Control over Proved Reserves
The reserves estimation process begins with an initial evaluation of our assets by geophysicists, geologists and engineers. A Reserves Coordinator (Coordinador de Reservas, or “RC”) safeguards the integrity and objectivity of our reserves estimates by supervising and providing technical support to technical teams who are responsible for preparing the reserves estimates. Our technical teams have degrees in geophysics, geology, petroleum engineering and accounting, and are trained internally in reserves estimates seminars. The RC is responsible for consolidating and auditing the reserves estimation process in compliance with the SEC reserves guidelines. The technical officer primarily responsible for overseeing the preparation of our reserves is a member of the Society of Petroleum Engineers (the “SPE”), with 25 years of experience in exploration and production activities, and has been with PESA for 25 years. Our reserves estimates are approved by the Oil and Gas Exploration and Production Director and submitted to our Executive Committee.
Most of the reserves estimates related to areas in which we do not act as operator were prepared by the operators and subsequently reviewed by our petroleum engineers before making the assessment of our proved reserves. The reported hydrocarbon reserves were estimated based on professional, geological and engineering judgment and on information supplied by us prior to January 30, 2015. Thus they are subject to revisions, upward or downward, as a result of future operations or as additional information becomes available. The estimation of reserves is imprecise due to many unknown geologic and reservoir factors that can only be estimated through sampling techniques. Since reserves are therefore only estimates, they cannot be appraised for the purpose of verifying exactness.
As of December 31, 2014, our liquid hydrocarbon and natural gas proved developed and undeveloped reserves totaled 210.6 MMboe (84.6 MMboe of liquid hydrocarbons and 756.3 billion cubic feet, or 126.1 MMboe, of natural gas), representing a 2.7% increase compared to proved reserves as of December 31, 2013 (an increase of 2.8% and 2.7% for liquid hydrocarbons and natural gas, respectively). During 2014, our fields located in Argentina accounted for revisions of previous estimates amounting to 0.9 MMboe. In addition, a downward revision of 4.0 MMboe was attributable to a greater-than-expected decline in our reserves held through mixed companies in Venezuela.
Liquid hydrocarbons and natural gas accounted for 40% and 60%, respectively, of our total proved reserves as of December 31, 2014. Approximately 11% of our total proved reserves as of such date were located outside Argentina.
As of December 31, 2014, proved developed reserves of crude oil equivalent represented 58.6% of our total proved reserves of crude oil equivalent.
As of December 31, 2014, we had proved reserves equal to seven years of production at 2014 volumes.
32
The following table sets forth our estimated net proved developed and undeveloped reserves of crude oil and natural gas by country as of December 31, 2014, including our subsidiaries, joint operations and associates.
| | | | | | | | | | | | |
| | | Reserves as of
December 31, 2014 | |
| Reserves category | | Oil
(millions of
barrels) | | | Natural
Gas
(billion cubic
feet) | | | Oil
Equivalent
(MMboe)(1) | |
PROVED | | | | | | | | | | | | |
Developed | | | 61 | | | | 372 | | | | 123 | |
Argentina | | | 52 | | | | 356 | | | | 111 | |
Venezuela | | | 9 | | | | 16 | | | | 12 | |
| | | |
PROVED | | | | | | | | | | | | |
Undeveloped | | | 24 | | | | 384 | | | | 88 | |
Argentina | | | 15 | | | | 372 | | | | 77 | |
Venezuela | | | 9 | | | | 12 | | | | 11 | |
| | | | | | | | | | | | |
Total proved reserves (developed and undeveloped) | | | 85 | | | | 756 | | | | 211 | |
| | | | | | | | | | | | |
| (1) | Gas is converted to oil equivalent using a factor of 6,000 cubic feet of gas per barrel of oil equivalent. |
Reserves calculations are based on forecasts of field production, which depend on a number of technical parameters, such as seismic interpretation, geological maps, well tests, reservoir engineering studies and economic data. All reserves estimates involve some degree of uncertainty. The relative degree of uncertainty depends primarily on the amount of reliable geological and engineering data available at the time of the estimate and the interpretation of those data. Our estimates are thus made using the most reliable data at the time of the estimate, in accordance with the best practices in the oil and gas industry.
The statements contained in this Item 4 regarding exploration and development projects and production estimates are forward-looking and subject to significant risks and uncertainties. Although we believe that these expectations reflected in these forward-looking statements are reasonable, we cannot guarantee that our actual levels of activity, production or performance will meet these expectations. See “Item 3. Key Information—Risk Factors.”
The table below sets forth, by geographic area, our total proved reserves and proved developed reserves of crude oil, condensate and natural gas liquids, and reserves of natural gas, at the indicated dates. This table includes our net share of the proved reserves of our subsidiaries, joint operations and associates. Our net share of the proved reserves of our unconsolidated investees represented 11% of our total proved reserves as of December 31, 2014.
| | | | | | | | | | | | | | | | | | | | | | | | | | | | |
| | | Crude oil, condensate and natural gas
liquids | | | Natural gas | | | | |
| | | Argentina | | | Venezuela | | | Total | | | Argentina | | | Venezuela | | | Total | | | Combined | |
| | | (in thousands of barrels) | | | (in millions of cubic feet) | | | (in MMboe) (1) | |
Total proved developed and undeveloped reserves as of December 31, 2012 | | | 64,245 | | | | 24,530 | | | | 88,775 | | | | 712,466 | | | | 46,455 | | | | 758,921 | | | | 215.3 | |
Proved developed reserves as of December 31, 2012 | | | 48,936 | | | | 12,670 | | | | 61,606 | | | | 358,319 | | | | 14,582 | | | | 372,901 | | | | 123.8 | |
Increase (decrease) originated in: | | | | | | | | | | | | | | | | | | | | | | | | | | | | |
Revisions of previous estimates | | | 67 | | | | (1,086 | ) | | | (1,019 | ) | | | 65,774 | | | | (4,362 | ) | | | 61,412 | | | | 9.3 | |
| | | | | | | |
Purchase of proved reserves in place | | | 13,204 | | | | — | | | | 13,204 | | | | 9,260 | | | | — | | | | 9,260 | | | | 14.7 | |
Year’s production | | | (16,675 | ) | | | (2,020 | ) | | | (18,695 | ) | | | (92,213 | ) | | | (620 | ) | | | (92,833 | ) | | | (34.2 | ) |
Total proved developed and undeveloped reserves as of December 31, 2013 | | | 60,841 | | | | 21,424 | | | | 82,265 | | | | 695,287 | | | | 41,473 | | | | 736,760 | | | | 205.1 | |
33
| | | | | | | | | | | | | | | | | | | | | | | | | | | | |
| | | Crude oil, condensate and natural gas
liquids | | | Natural gas | | | | |
| | | Argentina | | | Venezuela | | | Total | | | Argentina | | | Venezuela | | | Total | | | Combined | |
| | | (in thousands of barrels) | | | (in millions of cubic feet) | | | (in MMboe) (1) | |
Proved developed reserves as of December 31, 2013 | | | 43,802 | | | | 12,448 | | | | 56,250 | | | | 320,642 | | | | 14,848 | | | | 335,510 | | | | 112.2 | |
Increase (decrease) originated in: | | | | | | | | | | | | | | | | | | | | | | | | | | | | |
Revisions of previous estimates | | | (3,053 | ) | | | (1,766 | ) | | | (4,819 | ) | | | 23,424 | | | | (13,277 | ) | | | 10,147 | | | | (3.2 | ) |
Improved recovery | | | 520 | | | | — | | | | 520 | | | | 10,817 | | | | — | | | | 10,817 | | | | 2.3 | |
Extensions and discoveries | | | 2,955 | | | | — | | | | 2,955 | | | | 42,076 | | | | — | | | | 42,076 | | | | 10.0 | |
Purchase of proved reserves in place | | | 22,713 | | | | — | | | | 22,713 | | | | 46,975 | | | | — | | | | 46,975 | | | | 30.5 | |
Sale of proved reserves in place | | | (3,404 | ) | | | — | | | | 3,404 | | | | — | | | | — | | | | — | | | | (3.4 | ) |
Year’s production | | | (13,957 | ) | | | (1,691 | ) | | | (15,648 | ) | | | (89,858 | ) | | | (591 | ) | | | (90,449 | ) | | | (30.7 | ) |
Total proved developed and undeveloped reserves as of December 31, 2014 | | | 66,615 | | | | 17,967 | | | | 84,582 | | | | 728,721 | | | | 27,605 | | | | 756,326 | | | | 210.6 | |
Proved developed reserves as of December 31, 2014 | | | 51,986 | | | | 9,407 | | | | 61,393 | | | | 356,228 | | | | 15,738 | | | | 371,966 | | | | 123.4 | |
| (1) | Gas is converted to oil equivalent using a factor of 6,000 cubic feet of gas per barrel of oil equivalent. |
The following table sets forth the breakdown of our total proved reserves of liquid hydrocarbons and natural gas into proved developed and proved undeveloped reserves as of December 31, 2014, 2013 and 2012.
| | | | | | | | | | | | | | | | | | | | | | | | |
| | | 2014 | | | 2013 | | | 2012 | |
| | | Millions of
barrels of oil
equivalent | | | % of total
proved
reserves | | | Millions of
barrels of oil
equivalent | | | % of total
proved
reserves | | | Millions of
barrels of oil
equivalent | | | % of total
proved
reserves | |
Proved developed reserves | | | 123.4 | | | | 58.58 | % | | | 112.2 | | | | 54.70 | % | | | 123.8 | | | | 57.49 | % |
Proved undeveloped reserves | | | 87.2 | | | | 41.42 | % | | | 92.9 | | | | 45.30 | % | | | 91.5 | | | | 42.51 | % |
| | | | | | | | | | | | | | | | | | | | | | | | |
Total Proved Reserves | | | 210.6 | | | | 100 | % | | | 205.1 | | | | 100 | % | | | 215.3 | | | | 100 | % |
Estimated reserves were subject to economic evaluation to determine their economic limits. Estimated reserves in Argentina are stated before royalties since royalties have the same impact as taxes on production and are not paid in kind, and therefore are treated as operating costs. Estimated reserves in Venezuela are also stated before royalties and are computed by multiplying our ownership in each mixed company by the proved reserves volumes of the relevant mixed company.
As of December 31, 2014, 59% of our proved reserves were developed, while 41% were undeveloped. Proved developed reserves were 123.4 million of barrels of oil equivalent. During 2014, we invested U.S.$161 million to convert approximately 8.6 million barrels of oil equivalent of proved undeveloped reserves to proved developed reserves.
The 6% decrease in our proved undeveloped reserves in 2014 compared to 2013 is mainly attributable to:
| | (1) | the conversion of approximately 8.6 MMboe of proved undeveloped reserves to proved developed reserves, mainly through drilling activities in our production areas in the Neuquén Basin; |
| | (2) | a ten-year extension of our concession in the 25 de Mayo-Medanito S.E., Jagüel de los Machos, Río Neuquén and Entre Lomas production areas, all located in the Neuquén Basin (See “Item 5. Operating and Financial Review and Prospects—Factors Affecting Our Consolidated Results of Operations—Changes in Our Oil and Gas Exploration and Production Portfolio”), which resulted in the addition of 6.7 MMboe of proved undeveloped reserves; |
| | (3) | the sale to YPF S.A. of our entire interest in the Puesto Hernández Joint Operation (UTE), which resulted in decrease of 0.3 MMboe; and |
34
| | (4) | a decrease of 3.3 MMboe of proved undeveloped reserves, based on negative revisions to previous estimates of reserves. |
The activities described in items (1), (2), (3) and (4) above resulted in a net decrease of 5.6 MMboe in our proved undeveloped reserves in 2014 compared to 2013.
As of December 31, 2014, proved undeveloped reserves were 87.2 MMboe, all of which correspond to wells located within one offset of proved developed reserves and gas fields where the activity has been scheduled to maintain production levels in accordance with contracts and installed facilities. The Company plans to put 91% of these proved undeveloped reserves into production through activities to be implemented over the next five years. The 9% of these reserves that will be developed over periods exceeding five years are mainly located in gas fields where the activity has been scheduled to maintain production levels in accordance with contracts and installed facilities.
We have a total of 7.7 million barrels of oil equivalent of proved undeveloped reserves, all located in Argentina, that have been booked for more than five years. This is because such reserves are mainly located in gas fields where the activity has been scheduled to maintain production levels in accordance with contracts and installed facilities.
We prioritize the development of new business opportunities associated with non-conventional gas reserves in Argentina. During 2014, we drilled two wells in the Rio Neuquén area, three wells in the El Mangrullo area and three wells in the Sierra Chata area aimed at developing non-conventional gas reserves in the Punta Rosada and Mulichinco Reservoirs. We expect to sell the non-conventional gas produced in these areas under the Gas Plus program as approved by the SE.
There are many uncertainties in estimating quantities of proved reserves and in projecting future rates of production and the timing of development expenditures, including certain factors that are beyond our control. The reserves data set forth in this Annual Report solely represents estimates of our proved oil and gas reserves. Reserves engineering is a subjective process of estimating underground accumulations of crude oil and natural gas that cannot be precisely measured. The accuracy of a reserves estimate stems from available data, engineering and geological interpretation and judgment of reserves and reservoir engineering. As a result, different engineers often obtain different estimates. In addition, results of drilling, testing and production subsequent to the date of an estimate may justify revision of such estimate, so the reserves estimates at a specific time are often different from the quantities of oil and gas that are ultimately recovered. Furthermore, estimates of future net revenues from our proved reserves and the present value thereof are based upon assumptions about future production levels, prices and costs that may prove to be incorrect over time. Estimates of future prices, costs and production volumes are subject to uncertainties and may prove to be incorrect over time. The meaningfulness of such estimates is highly dependent upon the accuracy of the assumptions upon which they are based. Accordingly, we cannot provide assurances that any specified production levels will be reached or that any cash flow arising therefrom will be produced. The actual quantity of our reserves and future net cash flows therefrom may be materially different from the estimates set forth in this Annual Report.
We replace our reserves through the acquisition of producing fields, exploration and by “proving up” reserves in existing fields. “Proving up” is the process by which additional reserves classified as “probable and possible reserves” in a producing field are accessed and reclassified as “proved reserves.” We prove up reserves with reservoir management techniques, such as waterflooding and enhanced oil recovery projects. The reservoir management techniques currently used are water injection and the drilling of horizontal producing and injection wells. Technologies such as 3D seismic process, horizontal and step out wells, underbalance drilling and reservoir numerical stimulation are also used.
Sales
The following table sets forth sales for the Oil and Gas Exploration and Production business segment, by geographical area for the fiscal years ended December 31, 2014, 2013 and 2012:
| | | | | | | | | | | | |
| | | Year ended December 31, | |
| | | 2014 | | | 2013 | | | 2012 | |
| | | (in millions of pesos ) | |
Argentina | | | 10,361 | | | | 7,649 | | | | 5,945 | |
Outside Argentina | | | 192 | | | | 189 | | | | 168 | |
| | | | | | | | | | | | |
Total | | | 10,553 | | | | 7,838 | | | | 6,113 | |
| | | | | | | | | | | | |
The increase in sales during 2014 was mainly due to higher prices during 2014. See “Item 5. Operating and Financial Review and Prospects—Discussion of Results—Year ended December 31, 2014 compared to year ended December 31, 2013—Analysis of Operating Income by Business Segment.”
35
OCP
In 2001, the Ecuadorian government awarded OCP the rights to construction and operation for a 20-year term of the 503 km-long pipeline that runs from the northeastern region of Ecuador to the Balao distribution terminal on the Pacific Ocean coast. As of December 31, 2014, we held an 11.42% interest in OCP. OCP’s other shareholders are Andes Petroleum, Ecuador Ltd., Perenco Ecuador Limited, Occidental del Ecuador Inc., Repsol Ecuador S.A. and AGIP Oleoducto de Crudos Pesados B.V.
The oil pipeline has a transportation capacity of approximately 450,000 barrels per day, of which at least 350,000 barrels per day are committed under transportation agreements that include a Ship or Pay clause. Because the oil pipeline runs across ecologically sensitive areas, the pipeline was constructed following stringent environmental and technical standards. The construction of the oil pipeline was completed and it began operations in 2003.
We entered into a transportation agreement with OCP that includes a Ship or Pay clause whereby OCP has committed to transport 80,000 barrels per day of our oil for a 15-year term, from November 2003.
For a more detailed discussion see “—Oil and Gas Exploration and Production—Production—Production Outside Argentina—Ecuador.”
Oleoductos del Valle S.A. (“Oldelval”)
As of December 31, 2014, we held a 23.1% interest in Oldelval, which is the concessionaire of the transportation of crude oil through a 888 km-long oil pipeline between the Neuquén Basin and Puerto Rosales (located in the Province of Buenos Aires). Oldelval operates trunk oil pipelines, providing access to the Allen-Puerto Rosales pipeline, with 1,706 km of installed piping. The concession has a 35-year term, which began in 1993, with an option to extend the term for ten additional years. Oldelval’s other shareholders are YPF, Chevron Argentina S.R.L., Pluspetrol S.A., Pan American Energy Ibérica S.L. and Tecpetrol S.A.
The Allen-Puerto Rosales pipeline has a transportation capacity of approximately 220,000 barrels per day, with one million barrels of storage capacity.
During 2014, oil volumes transported by Oldelval from Allen to Puerto Rosales totaled 53.1 million barrels, a 3.5% decrease compared to 2013, mainly due to a decrease in production in the Neuquén Basin.
The applicable laws governing the transportation of hydrocarbons through oil pipelines, which are based on the notion of free access, assign loading preference quotas to pipeline owners based on their shareholdings. Oil transportation rates are set by the SE.
Competition
Our oil- and gas-related businesses are subject to oil price fluctuations determined by international market conditions and internal price controls, export restrictions and other regulations. In our oil and gas operations in and outside of Argentina, we face competition from oil and gas producers throughout the world.
36
REFINING AND DISTRIBUTION
Our presence in the Refining and Distribution business segment enables us to capitalize on our hydrocarbon reserves. Refining and distribution operations are a necessary link in the business value chain, starting with crude oil and gas exploration and production and ending with customer service at the gas station network and the supply of petrochemical products.
As of December 31, 2014, our Refining and Distribution operations were based in Argentina, where we operate a refinery and a network of 262 gas stations. OurRicardo Eliçabe refinery (the “Refinery”) is located in Bahía Blanca (Province of Buenos Aires). In addition, we have a 28.5% interest in Refinería del Norte S.A. (“Refinor”).
Our main strategy in the Refining and Distribution segment is to seek profitability through a balanced crude oil refining, logistics and commercial chain.
On May 2, 2011, we sold our San Lorenzo refinery, its loading and unloading facilities and the associated fuel sales network to Oil Combustibles S.A. (“Oil Combustibles”), following an agreement for the sale of such assets approved by the Board of Directors on May 4, 2010. This transaction was consistent with our strategy of assessing our business and asset portfolio structure on an ongoing basis with a view to identifying opportunities to maximize value for our shareholders. As of the date of this Annual Report, the transaction remains subject to approval by theComisión Nacional de Defensa de la Competencia(the Argentine Antitrust Commission or “CNDC”).
Between August 20 and September 30, 2014, our Refinery successfully completed its scheduled plant shutdown involving the Refinery’s processing units, utilities and offsites, to perform general maintenance on the catalytic reformer, hydro-treatment unit, atmospheric distillation unit (topping) and vacuum distillation unit.
The Refining and Distribution Business in Argentina
In 2014, gasoline and diesel sales volumes in the Argentine fuel market totaled 21.1 million cubic meters, a 2% decrease compared to 2013. According to the SE, diesel sales volumes in the domestic market decreased 2.8% to 12.9 million cubic meters as a consequence of a decrease in demand from the agricultural and industrial sectors.
According to the SE, the gasoline market contracted by 0.8% during 2014, with sales volumes totaling 8.1 million cubic meters. This decrease is attributable to the slump in economic activity in 2014.
The compressed natural gas (“CNG”) market totaled 2.8 million cubic meters, a 2% increase compared to 2013.
Refining Division
Ricardo Eliçabe Refinery
As of December 31, 2014, our Refinery had a total refining capacity of 30,200 barrels of oil per day. The Refinery is located in the city of Bahía Blanca, in the Province of Buenos Aires, a strategic location for the reception of crude oil coming through an oil pipeline from the Neuquén Basin, for other Argentine crude oil coming by sea from the Golfo San Jorge or Santa Cruz Sur Basins, and for imports from international markets. With a crude oil processing capacity of approximately 30,200 barrels per day, the Refinery produces a wide variety of products: regular gasoline, premium gasoline and ultra-high octane gasoline (Podium), diesel, fuel oil, asphalts and liquefied gases (propane and butane).
The Refinery also produces intermediate fuel oil (“IFO”) mixes used as fuel in vessels, raw materials for solvents and virgin naphtha for the petrochemical industry. The Refinery has a storage capacity of 480,000 barrels of heavy products and 690,000 barrels of light products.
During 2014, the Refinery processed an average of 27,068 barrels of oil per day. In 2013, the Refinery processed an average of 28,730 barrels per day.
Dock Sud Plant
The Dock Sud distribution plant, located in the province of Buenos Aires, close to the city of Buenos Aires, has a total storage capacity of approximately 1,230,000 barrels of heavy and light products. This plant is connected to the Oiltanking Ebytem terminal in the city of Bahía Blanca through a pipeline.
Caleta Paula Plant
The Caleta Paula plant is our newest distribution plant. It is located in the Province of Santa Cruz, close to the city of Comodoro Rivadavia, in southern Argentina. The strategic location of this plant significantly improves our logistical capacity in an area distant from refineries. In addition, it allows us to maintain significant stocks of products to satisfy demand in the southern area of the country for gasoline, diesel and lubricants. The plant is located on the Atlantic coast, and is supplied by vessels and supplemented by truck loading facilities. It has a storage capacity of 82,000 barrels of light products.
37
Refining Investment Plans
In 2015, we expect to continue making necessary investments to comply with legal standards for maintaining our equipment, to improve the reliability of operations, to install a removable Steamship Unit on the truck loading area and to upgrade the duct system.
At the Bahía Blanca port, we expect these changes to include the evaluation of a new diesel hydrotreatment unit project and the expansion of topping and vacuum capacity at the Refinery.
In Dock Sud, we expect to make investments in the fire system and also in fuel tanks.
In Caleta Paula, we expect investments to focus on fuel tanks, among other improvements.
Distribution Division
As of December 31, 2014, our commercial network of gas stations and wholesale customers allowed us to deliver products and services to a number of regions in Argentina. In recent years, our strategy has been to optimize our customer portfolio, adapt its size to our production capacity, and streamline distribution processes.
As of December 31, 2014, we had a network of 262 gas stations located throughout Argentina, of which 259 bear the “Petrobras” brand name and 33 are “Spacio 1” convenience stores.
During 2014, we continued with the implementation of the Controlled Quality Program to ensure product quality standards.
TÜV Rheinland, an inspection and quality certification consultant, recertified our Distribution Division as an ISO 9001-2008 Management System in September 2014 without any non-conformity observation.
We also continued with the Challenge Program, providing training at gas stations through the Mobile Classroom modality and including two vehicles identified and equipped to develop and increase brand value through standardizing of the customer service model at our gas stations. Additionally, we continued our maintenance program for GNC compressors.
On December 13, 2013 we received the “Annual Safety Award – Distribution segment” from the IAPG for our assessment of accident statistics and safety management, involving gas station operations, engineering, gas station maintenance and fuel transportation activities.
PESA’s points of sale (gas stations) in Argentina as of December 31, 2014 were as follows:
| | | | |
| | | As of December 31,
2014 | |
Owned(1) | | | 79 | |
Franchised(2) | | | 183 | |
| | | | |
Total | | | 262 | |
| | | | |
| (1) | Owned or controlled by PESA under long-term commercial contracts or other types of contractual relationships that secure long-term direct influence over such points of sale. |
| (2) | The term “franchised” is used to refer to gas stations owned by third parties with whom PESA has signed a franchise agreement that provides PESA with the right (i) to become the gas station’s exclusive supplier and (ii) to brand the gas station with its corporate image. Current laws establish that the term of such contracts should be five years for existing stations and eight years for newly constructed stations. |
PESA sells fuels in Argentina under the Petrobras and other brand names. Distribution as of December 31, 2014 was broken down as follows:
Gas Stations
| | | | |
| | | As of December 31,
2014 | |
Petrobras-branded | | | 259 | |
Other brands | | | 3 | |
| | | | |
Total | | | 262 | |
| | | | |
38
Our liquid fuels domestic sales totaled 1.20 million cubic meters during 2014. As a result, our market share in 2014 stood at 5.6%, ranking us fourth in the Argentine market.
Out of 1.20 million cubic meters of total liquid fuels sold in 2014, 0.78 million cubic meters were diesel, a 5.4% increase compared to 2013, and gasoline sales, in turn, totaled 0.49 million cubic meters, a 2% decrease compared to 2013. Our sales of liquid fuels and gasoline represented 5.5% and 5.4%, respectively, of all sales of these products in the Argentine market in 2014. In addition, annual sales of premium gasoline totaled 81 thousand cubic meters, which resulted in a 4.3% market share.
Our distribution business is also focused on lubricants. We aim to promote the Lubrax brand in Argentina through the development of exclusive lubricant customers, the leveraging of combined sales with liquid fuels and promotions at retail outlets.
In 2014, Lubrax sales in the Argentine market totaled 16,100 cubic meters, a 6.9% decrease compared to 2013. Our share in the lubricants market in 2014 was 5.4% compared to 5.7% in 2013. This decrease was mainly attributable to the aggressive pricing policies of our competitors.
We also sell oil products to the industrial, construction and marine markets. Products sold in these markets include marine fuels and lubricants, asphalts and other products. In 2014, we sold 215,000 cubic meters of IFO bunker, used in ships. In addition, we sold 28,000 cubic meters of marine diesel, representing a 10.8% market share in 2014.
In 2014, we sold 79,200 tons of asphalt, representing an 18% market share. The higher-quality asphalt product, developed since 2011, represented 64% of the supply of asphalt from our Refinery.
The following table shows production and sales for our consolidated Refining and Distribution segment for the fiscal years ended December 31, 2014, 2013 and 2012:
| | | | | | | | | | | | |
| | | Year Ended December 31, | |
| | | 2014 | | | 2013 | | | 2012 | |
Average crude oil processed per day (barrels) | | | 27,068 | | | | 28,730 | | | | 28,700 | |
| | | |
Production (thousands of tons): | | | | | | | | | | | | |
Virgin naphtha | | | 37 | | | | 34 | | | | 58 | |
Diesel | | | 456 | | | | 485 | | | | 494 | |
Other products | | | 807 | | | | 863 | | | | 846 | |
| | | |
Sales (in thousands of m3): | | | | | | | | | | | | |
Crude oil | | | 220 | | | | 284 | | | | 482 | |
Gasoline | | | 491 | | | | 554 | | | | 547 | |
Diesel | | | 784 | | | | 782 | | | | 791 | |
Fuel oil/IFO | | | 315 | | | | 395 | | | | 391 | |
Paraffins | | | 27 | | | | 20 | | | | 46 | |
Others | | | 240 | | | | 211 | | | | 218 | |
| | | |
Sales (in millions of pesos): | | | | | | | | | | | | |
Argentina | | | 10,294 | | | | 7,174 | | | | 6,097 | |
Outside Argentina | | | 1,182 | | | | 972 | | | | 859 | |
| | | | | | | | | | | | |
Total sales (in millions of pesos) | | | 11,476 | | | | 8,146 | | | | 6,957 | |
| | | | | | | | | | | | |
Refinor
We have a 28.5% interest in Refinor, whose other shareholders are YPF (50%) and Pluspetrol S.A. (21.5%). Refinor is engaged in crude oil refining, natural gas processing, product transportation, marketing and sales.
Refinor owns the only refinery in the northern region of Argentina, which is located in Campo Durán, in the Province of Salta. Refinor’s refining capacity is approximately 26,400 barrels of oil per day and its natural gas processing capacity is 20.4 million cubic meters of gas per day (“MMm3/d”).
39
Refinor owns and operates the following processing plants: an atmospheric distillation unit (topping), a vacuum distillation unit, a gasoline hydro-treatment unit, a catalytic reformer plant, an Isopentane plant using fractional distillation of gasoline turbex (operating since April 2013), two turboexpander and fractioning plants for LPG production, as well as a plant for the production of auxiliary services (industrial water, steam, electricity, compressed air) used in the different processing plants.
The Campo Durán refinery receives crude oil/condensate and natural gas from the Northwestern Basin and from Bolivia. These operations are conducted through two oil pipelines and three gas pipelines.
In addition, Refinor operates a 1,100 km-long pipeline running from Campo Durán (in the Province of Salta) to Montecristo (in the Province of Córdoba) for the distribution of its products. Along the pipeline, the Banda Río Salí (in the Province of Tucumán), Güemes (in the Province of Salta) and Leales (in the Province of Tucumán) dispatch plants are supplied. This pipeline is the most important distribution channel for liquids generated in the Northwestern Basin in Argentina and transports diesel, virgin naphtha, motor gasoline, butane and propane.
As of December 31, 2014, Refinor had a commercial network of 66 gas stations located in the Provinces of Salta, Tucumán, Jujuy, Santiago del Estero, La Rioja, Catamarca and Chaco. Through these gas stations, Refinor sells a high performance fuel line: Refinor 97 (97 octane), High grade (95 octane) and Eco Diesel.
In 2014, daily average volumes of crude oil processed totaled 14,721 barrels per day, a 7% decrease compared to 2013. This decrease is explained by the lower importation of “Bolivian Blend” oil condensate from the neighboring country of Bolivia.
Sales volumes totaled 938,000 cubic meters per year, a 6% decrease compared to 2013, 443,000 cubic meters of which were directed to the domestic market and 495,000 cubic meters of which were directed to export markets. During 2014, Refinor had a market share of approximately 26.1% and 17.9% in the motor gasoline and diesel markets, respectively, in the Northwestern region of Argentina. Considering the size of its gas station network, Refinor remains the company with the second highest number of retail outlets and sales volumes in the Northwestern region of Argentina.
In 2014, Refinor processed an average of 14.1 MMm3/d, a 3.4% decrease compared to 2013. However, during 2014, Refinor produced 317,600 tons of LPG, only a 0.6% decrease compared to its LPG production during 2013.
Sales of LPG totaled approximately 302,603 tons during the year, a 1.5% increase compared to 2013.
The following table sets forth Refinor’s production and sales for the fiscal years ended December 31, 2014, 2013 and 2012:
| | | | | | | | | | | | |
| | | Year ended December 31, | |
| | | 2014 | | | 2013 | | | 2012 | |
Production (in thousands of m3): | | | | | | | | | | | | |
Gasoline | | | 160 | | | | 173 | | | | 131 | |
Virgin naphtha | | | 285 | | | | 290 | | | | 222 | |
Diesel | | | 319 | | | | 330 | | | | 317 | |
Natural gasoline | | | 89 | | | | 89 | | | | 100 | |
Propane / butane | | | 318 | | | | 320 | | | | 330 | |
Other products | | | 78 | | | | 81 | | | | 98 | |
| | | |
Sales (in thousands of m3): | | | | | | | | | | | | |
Gasoline | | | 161 | | | | 172 | | | | 130 | |
Virgin naphtha | | | 380 | | | | 385 | | | | 279 | |
Diesel | | | 320 | | | | 338 | | | | 309 | |
Propane/butane | | | 303 | | | | 298 | | | | 313 | |
Other products | | | 76 | | | | 102 | | | | 119 | |
| | | |
Sales (in millions of pesos): | | | | | | | | | | | | |
Argentina | | | 3,207 | | | | 2,212 | | | | 1,906 | |
Outside Argentina | | | 2,582 | | | | 1,856 | | | | 947 | |
| | | | | | | | | | | | |
Total sales (in millions of pesos) | | | 5,789 | | | | 4,068 | | | | 2,853 | |
| | | | | | | | | | | | |
Competition
Our principal competitors in the Argentine gasoline and diesel markets are YPF, Shell C.A.P.S.A, Axion Energy Argentina S.A. and Oil Combustibles, which in 2014 had market shares of approximately 59.1%, 15%, 13.6%, and 4.3% respectively, according to the SE.
40
PETROCHEMICALS
The Petrochemicals business segment is an important component of our business strategy. Our goal in the Petrochemicals business segment is to maintain our position in the styrenics market by capitalizing on current conditions and maximizing the use of our own petrochemicals raw materials.
As of December 31, 2014, our Petrochemical operations were entirely based in Argentina. We produce a wide array of products, such as intermediate gasoline, aromatic solvents, hexane and other hydrogenated paraffinic solvents, propellants for the cosmetic industry, monomer styrene, as well as rubber and polymers for the domestic and foreign markets from natural gas, virgin naphtha, propane and other supplies.
Argentine Operations
In Argentina, we are the only producer of styrene, polystyrene and elastomers, and the only integrated producer of plastics derived from oil production. As part of our efforts to integrate our operations, we use a substantial amount of styrene for the production of polystyrene and synthetic rubber.
The petrochemicals division has the following plants:
| | • | | An integrated petrochemicals complex at Puerto General San Martín, in the Province of Santa Fé, with an annual production capacity of 50,000 tons of gases (LPG and propellants), 155,000 tons of aromatics, 290,000 tons of gasoline and raffinate, 160,000 tons of styrene, 58,500 tons of synthetic rubber, 180,000 tons of ethylbenzene and 31,000 tons of ethylene. |
| | • | | A polystyrene plant located in the city of Zárate, in the Province of Buenos Aires, with a production capacity of 65,000 tons of polystyrene and 14,000 tons of bioriented polystyrene (“BOPS”) per year. This state-of-the-art BOPS plant is the only one of its type in South America. |
| | • | | An ethylene plant located in San Lorenzo, Province of Santa Fé, with a production capacity of 19,000 tons per year. It is located along the Paraná river coast, near the Puerto General San Martín petrochemicals complex, which uses ethylene as raw material for the production of ethylbenzene and styrene. |
Styrenics Division
Monomer styrene sales volumes during 2014 totaled 56 thousand tons, a decrease of 18% compared to 2013. This decrease in sales volumes was mainly attributable to lower demand. Sales volumes in the domestic market decreased 9% compared to 2013 (a year of record sales), and export sales decreased by 33% compared to 2013 due to lower demand in Brazil.
In 2014, polystyrene sales volumes totaled 49.4 thousand tons, 1.6% less than in 2013, due to decreased domestic sales, which were partially offset by an increase in export sales.
In 2014, sales volumes of BOPS totaled 9.1 thousand tons, 6% more than in 2013. The increase was driven by a 15% increase in our sales exports, which was partially offset by a 13% decrease domestic sales.
In 2014, sales of synthetic rubber totaled 39.6 thousand tons, approximately 20% less than in 2013. Out of this volume, 22.1 thousand tons were sold in the domestic market, accounting for an 8% decrease compared to 2013, and 17.5 thousand tons were sold as exports, which accounts for a 32% decrease compared to 2013, mainly attributable to economic conditions in Brazil.
Also in 2014, we continued producing polymers with low aromatic content meeting European regulation standards, in response to our clients’ demands. Additionally, we developed a new polystyrene product with a potential demand of 6 thousand tons per year in the domestic market.
Reforming Gasoline Division
In 2014, improvements were made to optimize energy consumption and light gas recovery.
Sales of intermediate gasoline and naptha during 2014 totaled 256 thousand tons, of which 42 thousand tons were directed to the export market. Sales of aromatics and other products during 2014 totaled 60 thousand tons, 71% of which were directed to the domestic market, an increase of 10% compared to 2013.
Propellant gas sales totaled 15.4 thousand tons in 2014, accounting for a 29% increase compared to 2013, attributable to improvements at Puerto General San Martín plant.
41
As of December 31, 2014, our estimated market shares of the following products in Argentina were:
| | • | | Styrene butadiene rubber (“SBR”) – 81%. |
The following table sets forth production and sales by major product for the Petrochemicals division in Argentina for the fiscal years ended December 31, 2014, 2013 and 2012:
| | | | | | | | | | | | |
| | | Year ended December 31, | |
| | | 2014 | | | 2013 | | | 2012 | |
Production (thousands of tons): | | | | | | | | | | | | |
Styrene(1) | | | 121 | | | | 122 | | | | 143 | |
Synthetic rubber(2) | | | 40 | | | | 49 | | | | 47 | |
Polystyrene | | | 57 | | | | 44 | | | | 64 | |
BOPS | | | 10 | | | | 9 | | | | 11 | |
Naphtha | | | 256 | | | | 281 | | | | 324 | |
Aromatics and other products | | | 217 | | | | 183 | | | | 71 | |
| | | |
Sales (thousands of tons): | | | | | | | | | | | | |
Styrene(1) | | | 56 | | | | 68 | | | | 69 | |
Synthetic rubber(2) | | | 40 | | | | 50 | | | | 46 | |
Polystyrene and BOPS | | | 58 | | | | 59 | | | | 67 | |
Propylene(3) | | | 15 | | | | 19 | | | | 25 | |
Naphtha | | | 255 | | | | 289 | | | | 324 | |
Aromatics and other products | | | 76 | | | | 55 | | | | 69 | |
| | | |
Sales (in millions of pesos): | | | | | | | | | | | | |
Argentina | | | 3,587 | | | | 2,334 | | | | 1,861 | |
Outside Argentina | | | 849 | | | | 1,014 | | | | 1,046 | |
| | | | | | | | | | | | |
Total sales (in millions of pesos) | | | 4,436 | | | | 3,348 | | | | 2,907 | |
| | | | | | | | | | | | |
| (1) | Including ethylbenzene. |
| (2) | Including SBR, NBR and butadiene. |
In 2013, sales for this business segment increased by Ps.441 million, or 15.2%, to Ps.3,348 million from Ps.2,907 million in 2012, primarily as a consequence of a 26% rise in average sales prices, which more than offset a 10.1% decline in volumes sold.
In 2014, sales for this business segment increased by Ps.1,088 million, or 32.5%, to Ps.4,436 million from Ps.3,348 million in 2013, primarily as a consequence of a 45% rise in average sales prices, which more than offset an 8.7% decline in volumes sold.
Competition
The petrochemicals market in which we compete is highly cyclical, and world market conditions have a strong impact on our results of operations. We are the only producer of styrene, polystyrene and elastomers in Argentina, but compete with other foreign producers, especially those located in Brazil.
42
GAS AND ENERGY
The Gas and Energy business segment sells gas produced by our Oil and Gas Exploration and Production business segment. We also provide gas and LPG brokerage and trading services. In addition, through our stake in TGS, we are engaged in the transportation of gas in southern Argentina and in the processing and marketing of NGL. We are a major player in the Argentine electricity market, where we operate in the generation segment.
In the Gas and Energy segment, our main business objective is to increase profitability in each of our gas marketing and transportation business, our LPG business and our electricity generation operations.
Gas Marketing and Transportation
We sell gas produced by our Oil and Gas Exploration and Production segment, and purchase gas to supply internal consumption needs. In addition, we provide gas and LPG brokerage and trading services. We also assist clients in sales, logistics, foreign trade and marketing of gas and LPG.
In 2014, Argentine sales of gas produced by us totaled 7.0 MMm3/d. We sold 1.9 MMm3/d under the brokerage modality and purchased 1.0 MMm3/d from third parties to cover our commitments to supply internal consumption. Distribution was implemented through the Company’s own and third parties’ transport fleets in order to supply clients and secure compliance with commitments undertaken. Our total sales of LPG were 86,900 tons.
We entered into agreements with theCompañía Administradora del Mercado Mayorista Eléctrico S.A.(the wholesale electric market administration company, or “CAMMESA”) for the sale of non-conventional gas from the El Mangrullo area in 2011 and the Río Neuquén area in 2012 under the Gas Plus modality. We renewed each of these agreements in July 2014. See “—Regulation of Our Business—Argentine Regulatory Framework—Adjustment of Natural Gas Price at Wellhead.”
In 2014, we continued to sell butane in trucks to the domestic market. In 2014, we sold approximately 44,000 tons. Our Bahía Blanca Refinery has complied with the requirements imposed by the SE as to butane supply to the domestic market. Despite these additional requirements, in 2013 and 2014, we improved margins on our butane sales as a result of higher sales prices.
In February 2013, the Strategic Planning and Coordination Commission for the National Hydrocarbons Investment Plan issued Resolution No. 1/2013 establishing the Stimulus Program for Surplus Injection of Natural Gas (“Gas Program I”). Under such program, producers were required to submit projects to increase natural gas injection for a maximum period of five years, with a view to increasing production and achieving higher activity and employment levels in the sector. A price of U.S.$7.50/MMBTU was established for natural gas excess injection, with penalties involving LNG imports in the case of non-compliance with committed volumes. PESA submitted its project but ultimately did not participate in the program.
In turn, in November 2013, through Resolution No. 60/2013 (modified in March 2014 by Resolution No. 22/2014), the Commission created the Natural Gas Injection Incentive Program for Companies with Reduced Injection (“Gas Program II”). Producers were required to submit projects to increase natural gas production levels no later than April 30, 2014. Such program was directed to companies without previous production or with a maximum production of 4 MMm3/d, with price incentives in the case of production increases and penalties involving LNG imports in the case of non-compliance with committed volumes. Moreover, companies eligible for the Gas Program I and meeting the relevant requirements were entitled to request withdrawal from Gas Program I and admission to Gas Program II.
In August 2014, the Ministry of Economy and Public Finance, through Resolution No. 139/2014, introduced additional changes to Resolution No. 60/2013, including, among others, the elimination of the previous injection limit and the introduction of two annual registration periods. We requested to participate in this program and were registered through Resolution No. 13/2015 issued by the Secretary of Economic Policy and Development Planning of the Ministry of Economy and Public Finance. See “—Regulation of Our Business—Argentine Regulatory Framework—Adjustment of Natural Gas Price at Wellhead.”
Gas Transportation – TGS
Our Interest in TGS and Corporate Developments
We indirectly hold a 25.5% interest in TGS. TGS’s controlling shareholder isCompañía de Inversiones de Energía S.A.(“CIESA”), which as of the date of this Annual Report holds 51% of TGS’s capital stock. The ANSES holds 23.11% and the remaining 25.89% of TGS’s capital stock is publicly held. TGS’s shares are listed on the Buenos Aires Stock Exchange and on the
43
NYSE, in the form of ADSs. PESA has an interest of 50% in CIESA (directly and indirectly through our subsidiary Petrobras Hispano Argentina S.A. (“Petrobras Hispano”)), 40% is held by a trust whose trustee is The Royal Bank of Scotland N.V. Sucursal Argentina (the “Trust”) and the remaining 10% is held by Enron Pipeline Company Argentina S.A. (“EPCA”), which was acquired by Pampa Inversiones S.A. (together with Pampa Energía S.A., the “Pampa Group”) on April 8, 2011.
CIESA’s and TGS’s current equity ownership reflects the implementation of the first stage of the master settlement agreement and the mutual release agreement, signed by PESA and certain subsidiaries of Enron Creditors Recovery Corp. (“Enron,” formerly Enron Corp.) on April 16, 2004 (the “Master Settlement Agreement”), in connection with the restructuring of CIESA’s indebtedness. CIESA’s board of directors includes three members nominated by us, two by the Trust and one by EPCA. TGS’s board of directors is composed of nine members, six nominated by CIESA and three independent members. Pursuant to a shareholders’ agreement entered into on August 29, 2005 (the “Shareholders’ Agreement”) among EPCA, the Trust and us, we have the right to appoint the chairmen of the boards of directors of both TGS and CIESA and the chief executive officer of TGS.
Following the enactment of the Public Emergency Law in Argentina, CIESA and TGS both defaulted on their debt during 2002. CIESA failed to repay corporate bonds (Obligaciones Negociables) having a principal amount of U.S.$220 million and derivative instruments in an amount of approximately U.S.$2 million. In 2004, TGS successfully restructured substantially all of its debt.
In April 2004, CIESA’s shareholders entered into an agreement that, among other things, provided for certain stock transfers in order to create the necessary flexibility to restructure CIESA’s financial debt.
Subsequently, on September 1, 2005 CIESA’s shareholders and financial creditors entered into the “CIESA Restructuring Agreement”. Since January 2009, while approval of the CIESA Restructuring Agreement by the authorities has been pending, several legal claims involving AEI, CIESA and others have been filed before the courts of the State of New York in the United States of America.
On May 10, 2011, CIESA entered into a Memorandum of Understanding with the Pampa Group, the holder of the 1997 CIESA Notes as successor to Ashmore Energy International Limited (“AIE”). The replacement of AEI with the Pampa Group as a party to the CIESA Restructuring Agreement on May 17, 2011 resulted in a new shareholding structure of CIESA, in which PESA and its subsidiaries would have a 50% equity interest and the Pampa Group would have the remaining 50% equity interest. On October 5, 2011, by note No. 11,362, theEnte Nacional Regulador del Gas (Argentine Gas Regulatory Agency, or “ENARGAS”) expressed no regulatory objections to the CIESA Restructuring Agreement, which would become effective after obtained approval from the CNDC. As of the date of issuance of this Annual Report, the CIESA Restructuring Agreement remains subject to approval by the CNDC.
On July 13, 2012, CIESA, Pampa Group and PESA entered into a settlement agreement whereby all parties involved waived all claims, title and interest in the lawsuit before the New York State Courts and terminated the same. As a result of the agreement, CIESA paid off all of its financial debt by means of (i) the transfer to Pampa Group of 4.3% of TGS’s shares; (ii) a cash payment of approximately U.S.$130 million; (iii) the release of the remaining financial debt; and (iv) execution on July 13, 2012 of a fifth amendment to the CIESA Restructuring Agreement whereby, upon obtaining governmental approval, Pampa Group will receive additional shares representing 40% of CIESA’s capital stock which are currently held in trust by The Royal Bank of Scotland N.V. Sucursal, Argentina.
As a result of the full settlement of CIESA’s financial debt, in the third quarter of 2012, we recorded a gain of Ps.291 million attributable to our equity interest in CIESA.
Pursuant to the settlement agreement described above, and to decisions taken by CIESA’s board of directors meeting held on October 23, 2012, on January 2, 2013, CIESA notified the CNV of the formal cancellation of the 1997 CIESA Notes, initiating the steps necessary for CIESA’s withdrawal from public offering and listing. On May 30, 2013, the CNV ordered CIESA’s withdrawal from public offering and listing through Resolution No. 17,904.
In order to improve the maturity profile of TGS’s financial debt, in January 2014, TGS launched an offer for a voluntary exchange of the 2007 Notes (maturing between 2014 and 2017). To this end, on January 3, 2014, the CNV issued Resolution No. 17,262. TGS’s offer was taken up by holders of approximately 67% of the 2007 Notes, who received new TGS notes maturing between 2014 and 2020.
TGS Business
TGS began operations in late 1992 as a part of the privatization of the Argentine energy sector. Currently, TGS is the leading gas transportation company in Argentina, delivering about 62% of total gas transported in Argentina during 2014. TGS is also one of the leading NGL producers and traders, in both the domestic and international markets, and an important provider of midstream services, including business structuring, turnkey construction and operation and maintenance of facilities used for gas storage, conditioning and transportation.
44
PESA provides services to TGS for the operation and maintenance of the gas transportation system and related facilities and equipment, to ensure that the system performance is in conformity with international standards and in compliance with certain environmental standards.
The following chart shows statistical information relating to TGS’s business segments for the fiscal years ended December 31, 2014, 2013 and 2012.
| | | | | | | | | | | | |
| | | 2014 | | | 2013 | | | 2012 | |
Regulated Segment: | | | | | | | | | | | | |
Average firm committed capacity(1) | | | 80.4 | | | | 82.5 | | | | 82.6 | |
Average daily deliveries(1) | | | 65.4 | | | | 65.9 | | | | 65.5 | |
Annual load factor(2) | | | 81 | % | | | 80 | % | | | 79 | % |
Unregulated Segment: | | | | | | | | | | | | |
Liquids total production(3) | | | 969.9 | | | | 910.4 | | | | 905.3 | |
Processing capacity at year end(1) | | | 46.0 | | | | 46.0 | | | | 46.0 | |
| (2) | Corresponds to the quotient of the average daily deliveries and the average firm contracted capacity. |
Regulated Energy Segment of TGS
TGS has a gas transportation license in southern Argentina, and is the largest transporter of natural gas in Argentina and all of Latin America. TGS’s pipeline system connects Argentina’s southern and western gas reserves with the main consumption centers in those regions, including greater Buenos Aires. TGS has an exclusive license for the use of the southern gas transportation system, which expires in 2027, with an option to extend it for ten additional years if certain conditions are met.
TGS transports gas through more than 9,133 km of pipelines, of which almost 7,636 km belong to TGS, with a firm contracted capacity as of December 31, 2014 of 80.4 MMm3/d. Pursuant to these contracts, the capacity is reserved and paid for irrespective of the actual use by customers. Almost all capacity of the gas transportation pipelines in Argentina is currently apportioned among gas distribution companies, large industrial customers and gas-fired power plants under firm long-term transportation contracts. The total average life of TGS’s firm transportation contracts is approximately nine years. In addition, TGS provides interruptible transportation services under which gas transportation is dependent on the availability of excess capacity.
Transportation services begin with the receipt of gas owned by a shipper (e.g., distribution companies, producers, traders or large users) at one or more reception points. It is then transported and delivered to designated delivery points along the system. The total service area includes approximately 5.8 million end users, approximately 3.9 million of which are in greater Buenos Aires. Direct services to residential, commercial and industrial users, and electric power plants, are mainly provided by four gas distribution companies, which are connected to the TGS gas pipeline system: Metrogas S.A., Gas Natural Ban S.A., Camuzzi Gas Pampeana S.A. and Camuzzi Gas del Sur S.A. Some important industries and electric power plants are also located within TGS’s operational area and are provided with direct gas transport services by TGS.
TGS has made significant investments in its business since the privatization. As a result, compression power has been increased from 429,030 horsepower (“HP”) in 1992 to 759,010 HP in 2014, and contracted firm transportation capacity has been increased from 42.9 MMm3/d in 1992 to 80.4 MMm3/d by the end of 2014.
Tariff Renegotiation Process
As a consequence of the Public Emergency Law that pesified and prohibited the increase of tariffs, revenues from the regulated energy segment declined considerably. The gas transportation segment represented 17%, 23% and 23% of the total revenues of TGS in 2014, 2013 and 2012, respectively, while from the time of TGS’s privatization through 2001, revenues for this segment represented approximately 80% of TGS’s total annual revenues. TGS is still engaged in discussions with UNIREN regarding the renegotiation of its tariffs. As a result, and despite contracted capacity increases, the profitability of the regulated business has not yet been restored.
After UNIREN had submitted to TGS several proposals for tariff adjustment as provided for in the concession contract, which proposals TGS had deemed insufficient, in October 2008 TGS executed a provisional agreement with UNIREN, which provides for a 20% tariff increase to be retroactively applied as from September 1, 2008 and for the application of the proceeds from such increase to an investment plan in the gas transportation system provided under the same agreement. On December 3, 2009, the Argentine government issued Decree No. 1,918/09 ratifying the provisional agreement. As a result, TGS was to invoice the tariff increase to its customers once ENARGAS had published the new tariff schedule and defined the billing method for the retroactive effect. In light of ENARGAS’s delay in completing this administrative step, in August 2010, TGS sent a letter to ENARGAS requesting authorization
45
to publish the new tariff schedule including the 20% provisional tariff increase, and the method for collection of the retroactive increase, the application of an interest rate in accordance with the payment terms to be defined. ENARGAS replied to TGS that it had forwarded the background information and the tariff project to theSecretaría de Coordinación y Control de Gestión(the “SCyCG”), within the scope of the Ministry of Federal Planning, in compliance with Resolution No. 2,000/05 issued by the Ministry of Federal Planning.
On September 30, 2010, TGS filed a summary action for the protection of its constitutional rights (acción de amparo) against ENARGAS and the SCyCG seeking the implementation of the new tariff schedule. On November 8, 2010, notice was served on TGS of the judgment granting the requested protection and thus ordering the SCyCG to immediately return to ENARGAS the documents relating to the new tariff schedule applicable to TGS in compliance with Decree No. 1,918/09, and instructing ENARGAS to define the tariff schedule and the method for collection of the retroactive increase within two days following receipt of the referred to documents. ENARGAS and the SCyCG appealed this judgment.
Moreover, on November 16, 2010, TGS received a proposal from UNIREN, which required all claims, appeals, administrative and judicial actions filed against the government in connection with or arising from the renegotiation process to be suspended before moving forward with the renegotiation of the license agreement within the scope and according to the terms of the Public Emergency Law. In response, on November 18, 2010, TGS agreed to a 20 business day suspension of theacción de amparo automatically renewable at maturity (except if TGS’s board of directors were to decide not to renew the same before or at the end of each period) to move forward with the renegotiation of the license agreement. On December 28, 2010, TGS requested ENARGAS and the Ministry of Planning to jointly request the suspension of theacción de amparo and, as of the date of this Annual Report, TGS has not received any favorable response on this matter.
On April 5, 2011, the Second Chamber of the Court of Appeals in administrative federal matters of the Autonomous City of Buenos Aires set a 60 business day term for the SCyCG to act in accordance with the provisions of the Ministry of Federal Planning Resolution No. 2,000/05, and deliver to ENARGAS the documents related to the tariff increase schedule, and for ENARGAS to determine, within a 60 business day term following receipt of said documents and verification of compliance with the provisions set forth in the October 2008 transitional agreement, the tariff adjustment and the transitional tariff schedule stipulated therein. ENARGAS filed an extraordinary appeal before the Court of Appeals, which was dismissed by the Court of Appeals on May 27, 2011. On June 14, 2011, ENARGAS filed before the Supreme Court of Justice a complaint against the refusal to grant such appeal. On November 28, 2013, the Supreme Court rejected the complaint filed by the ENARGAS and thus affirmed the substance of the judgment delivered by the Judge of First Instance upholding theamparo filed by the Company.
Since more than one year had elapsed since publication of Decree No. 1,918/09, and given the authorization of suspension of the action for the protection of constitutional rights, which means a material change in the conditions determining the original recording of the tariff increase, TGS’s management resolved to: (i) discontinue recording the revenues attributable to the tariff increase, and (ii) reverse the account receivable previously recorded in the fiscal years ended December 31, 2010 and 2009.
In October 2011, TGS received another proposal from UNIREN including similar terms and conditions to those included in the 2008 provisional agreement. In August 2011, TGS’s board of directors approved the new proposal, allowing UNIREN to initiate the relevant administrative procedure to finalize the renegotiation agreement. However, as of the date of this Annual Report, the renegotiation agreement is not yet effective. The renegotiation agreement is expected to be finalized and executed by UNIREN after approval by the relevant regulatory agencies, including, among others, the SE, the Ministry of Planning, the Ministry of Economy, the Argentine Congress and the Excecutive Branch of the Argentine government.
On April 7, 2014, the ENARGAS issued Resolution No. 2,852/14 defining the new tariff schedules that include an increase in the rate applicable to the natural gas firm and interruptible transportation rates. The increase in the rate is set forth in three stages, as follows: 8% from April 1, 2014, 5.5% from June 1, 2014 and 5.3% from August 1, 2014, reaching a cumulative increase of 20%.
Additionally, Resolution No. 2,852/14, established that at least 5% of the funds generated by this tariff increase must be temporarily deposited in a trust fund for the payment of maintenance works according to an investment plan submitted by TGS and previously approved by the ENARGAS, with the balance to be managed by TGS for the fulfillment of that investment plan.
However, these measures only implement the 2008 provisional agreement in part. The 2008 provisional agreement is expected to remain in effect until a comprehensive renegotiation of the license with the Argentine government is completed. TGS will continue performing all the legal actions to obtain the complete enforcement of the 2008 provisional agreement.
TGS Non-Regulated Businesses
In addition to the regulated segment of natural gas transportation, TGS is one of the leading processors of natural gas and one of the largest traders of NGL in Argentina. NGL production and distribution involves the extraction of ethane, propane, butane, and natural gasoline from the gas flow that arrives to the General Cerri complex, located near Bahía Blanca, in the Province of Buenos
46
Aires, which is connected to TGS’s main pipelines. TGS has two gas processing plants at the General Cerri complex: (1) an ethane, propane, butane and natural gasoline turbo expander separating plant and (2) an absorption plant which extracts propane, butane and gasoline from the gas transported through TGS’s pipeline system, with a gas processing capacity of 46 MMm3/d and a storage capacity of 54,840 tons. After extraction, TGS sells these products in the domestic and international markets. TGS also stores and ships the products at facilities located in Puerto Galván. These activities are not regulated by ENARGAS.
NGL production and distribution net revenues accounted for approximately 75%, 72% and 71% of TGS’s net revenues in 2014, 2013 and 2012, respectively. TGS’s operations have benefited from rises in the international price of NGL and natural gasoline experienced during recent years, which permitted higher revenues principally from exports until the decline in international prices during the second half of 2014. NGL production in 2014, 2013 and 2012 totaled 969,920 tons, 909,706 tons and 905,300 tons, respectively.
TGS sells its NGL exports to Petredec Limited under an export agreement entered into on September 24, 2014, following a private bidding process which provided for a lower price per ton for products sold compared to the prior sales contract. The contract provided for sales of approximately 135,583 short tons (a unit of weight equal to 2,000 pounds or 907.2 kilograms) of propane and 77,752 short tons of butane at the price quoted in Mont Belvieu, Texas, plus a fixed charge per ton. The contract expired on March 31, 2015. TGS will submit new bids to various customers for new agreements for the period from September 2015 through March 2016 to replace the existing seasonal contract.
Ethane is sold to PBB-Polisur S.A. (“PBB”), an Argentine polyethylene producer, under a ten-year agreement that will expire on December 31, 2015. The minimum volume of ethane that TGS has committed to sell to PBB is 370,373 short tons per year. The price was initially fixed through December 31, 2007. Since then, at the beginning of each year the price has been subject to an annual adjustment based on various factors, including the producer price index (which variation cannot be higher than 1% per year), the natural gas price, the quality of the ethane shipped by TGS and the transportation tariffs and charges. In 2008, the price was approximately 20% higher than the initial price and in 2009 the price increased 10% over the 2008 price. The prices for 2011 and 2010 each increased 8% per annum over the prior year’s price. In 2012, the price increased approximately 9% with respect to 2011. In 2013, the price increased approximately 11% with respect to 2012. In 2014, the price increased 4.3% compared to 2013. As of the date of this Annual Report TGS is currently negotiating with PBB the price applicable for 2015.
Competition
TGS’s gas transportation business, which provides an essential service in Argentina, faces only limited direct competition. In view of the characteristics of the market in which TGS operates, it would be very difficult for a new entrant in the transportation market to pose a significant competitive threat to TGS, at least in the short to medium term. In the longer term, the ability of new entrants to successfully enter TGS’s market would depend on a favorable regulatory environment, an increasing and unsatisfied demand for gas by end users, and sufficient investment in gas transportation to accommodate delivery capacity from the transportation systems.
On a day-to-day basis, TGS competes, to a limited extent, with Transportadora de Gas del Norte S.A. for interruptible transportation services and for new firm transportation services made available as a result of expansion projects from the Neuquén Basin to the greater Buenos Aires area. Interruptible transportation services accounted for 11% of TGS’s regulated business net revenues for 2014. The relative volumes of such services will depend mainly upon the specific arrangements between buyers and sellers of gas in such areas, the perceived quality of services offered by the competing companies, and the applicable rate for each company.
With respect to NGL processing activities, TGS competes with Compañía MEGA S.A., which owns a gas processing plant in the Neuquén Basin and has a processing capacity of approximately 36 MMm3/d. Our controlling shareholder, Petrobras, has a 34% interest in Compañía MEGA S.A.
Electricity
In the electricity business, we are active in generation and, to a lesser extent, in transmission activities, and are positioned as a major player in the Argentine electricity market.
We conduct electricity generation activities through the Genelba thermal power plant and the open cycle gas-fired turbine (“Genelba Plus”) in the Province of Buenos Aires, the Pichi Picún Leufú Hydroelectric Complex (“HPPL”) in the Comahue region, on the Limay River, in the Province of Neuquén and the Ecoenergía thermal power plant (“Ecoenergía”) located in Bahía Blanca in the Province of Buenos Aires. In addition, in the transmission business segment, we hold an equity interest in Enecor S.A. (“Enecor”).
On January 30, 2013, we agreed to sell our direct and indirect interest in Distrilec to Hidroeléctrica Piedra del Águila S.A. and La Plata Cogeneración S.A. for U.S.$35 million, thereby withdrawing from the electricity distribution business.
47
The Argentine Electricity Market
In the early 1990s, as part of a general state reform and privatization plan, the Argentine government carried out an overall restructuring of the electricity sector and allowed for greater private sector participation. The Argentine electricity system had previously been characterized by the inability to meet short- and long-term demand and low service quality, with limited capacity on the part of the state to make necessary investments.
The regulatory framework and business environment changed in 2002, shifting to a greater role for the government in the economy, including the electricity market.
For the ten years prior to 2009, electricity demand in Argentina increased at an average rate of 4.6% per annum, exceeding the growth in GDP for the same period. However, during 2009, demand decreased mainly as a consequence of the drop in industrial activity levels and moderate temperatures during the year that resulted in reduced consumption by the residential sector. In 2009, demand decreased 1.3%, but recovered in 2010 growing 5.9%. During 2011, electricity demand increased at a rate of 5.2%. This positive variation was mainly driven by industrial consumption throughout the year, accounting for 6.5% growth. Residential demand, in turn, also showed an increase of 5.2%. In 2012, demand continued to increase at a rate of 4.1%, thanks to the good performance shown by residential demand. In 2013, demand grew 3.3%, reaching 125,166 gigawatt hours (“GWh”), as a result of 5.3% growth in residential consumption and 0.4% growth in the industrial sector. In 2014, electricity demand grew by 1.0% compared to 2013, mainly as a result of an increase of approximately 2.0% in residential demand while industrial consumption remained stable. In 2014, a new energy consumption record was reached. Supply to the system came from increased thermal generation derived from the addition of new generation facilities, larger hydroelectric resources and the consumption of the system reserves. During this period, in the Comahue Basin, volumes of water remained below historical average values, which triggered an increase in the use of natural gas and liquid fuels.
Total electricity generation in Argentina during 2014, including imports and exports, totaled 131,137 GWh, out of which 63.4% was attributable to thermoelectric plants, 31.0% to hydroelectric plants, 4.0% to nuclear plants and 0.5% other sources.
Electricity Generation: Genelba, HPPL and Ecoenergía
Genelba is a 674 MW combined cycle gas-fired generating unit located at the central node of the Argentine electricity network, in Marcos Paz, about 50 km away from the City of Buenos Aires.
Genelba, which commenced commercial operations in February 1999, has two gas-fired turbines that receive gas through an 8 km duct connected to the transportation system operated by TGS. The electricity produced at Genelba is distributed via the national grid through a connection to the Ezeiza transforming station located only 1 km away from Genelba.
The allocation of electricity dispatched to the wholesale electricity market (the “MEM”), even though such electricity is produced for the spot market, it is subject to market rules based on the lowest variable cost of electricity generation. See “—Regulation of Our Business—Argentine Regulatory Framework—Electricity.” Since Genelba uses combined cycle technology for a natural gas-fired power plant, our short-run variable cost is expected to be lower than the cost of most other thermoelectric power plants, granting significant competitive advantages to Genelba. Therefore, CAMMESA is expected to dispatch Genelba’s generating capacity before that of most other thermoelectric plants. Genelba stands out in the Argentine electricity market for its high reliability and efficiency. The plant is recognized as one of the combined cycle electric power plants with the highest availability in Argentina.
During 2007, our Board of Directors approved the construction of the new Genelba Plus open cycle gas-fired turbine. In 2009, we completed construction works in connection with the new plant, which added 165 MW to the system. This thermoelectric plant is close to the existing Genelba plant and started its commercial operations in August 2009. We use this unit to meet increased demand for electricity from our clients under supply agreements for large users in the MEM under the Energy Plus (Energía Plus) program (SE Resolution No. 1,281/06).
During 2011, we completed the construction of Ecoenergía’s 14MW power plant, located at TGS’s General Cerri complex and obtained authorization for commercial operations. Thereafter, in 2012, we obtained authorization to operate the plant under the Energy Plus program.
We were awarded a 30-year concession for hydroelectric power generation at HPPL beginning in August 1999. The complex has three electricity generating units with an installed capacity of 285 MW. Pursuant to our concession contract and applicable laws, as from August 2002 we paid 1% in hydroelectric royalties, with scheduled annual increases of 1% per year until royalties reached a cap of 12%, based upon the tariff rate applied to block sales of the electricity sold. As of December 31, 2014, we paid the maximum rate of hydroelectric royalties at a rate of 12%. In addition, we pay the Argentine government a monthly fee for the use of the water source amounting to 0.5% of the same amount used for the calculation of hydroelectric royalties.
48
During 2014, the Genelba thermoelectric plant generated 4,854 GWh of electricity, of which 4,525 GWh were generated in combined cycle and 329 GWh were generated by the new Genelba Plus power plant. The combined generation by Genelba and Genelba Plus represented 5% of total power generation and 7% of thermal generation in Argentina during 2014.
The Genelba combined cycle and Genelba Plus gas turbine operated with an 89% and a 98.5% availability factor, respectively, during 2014. The reliability factor was 99.6% for the combined cycle and 100% for the new Genelba Plus gas turbine.
In addition, HPPL generated 828 GWh of electricity, with a 95.3% availability factor and a 100% reliability factor. HPPL generated approximately 1% of total power generation in Argentina and 2% of total hydraulic generation in Argentina for 2014. The 828 GWh of electricity generated represented a decrease of 10.6% in comparison to 2013 due to lower incoming water flow from the Rio Limay and Collón Cura rivers.
During 2014, Genelba and HPPL together accounted for approximately 5% of the power generated in Argentina. The operation of both generating units minimizes income volatility, capitalizing on the natural barriers existing among the different resources used for power generation.
During 2014, Ecoenergía had its second full year of operation under the Energy Plus regulatory framework. Ecoenergía’s annual generation was 94 GWh, its availability factor of 89.3% and reliability factor of 95.1%.
The following chart details energy generation and sales figures for Genelba and HPPL for the fiscal years ended December 31, 2014, 2013 and 2012:
| | | | | | | | | | | | |
| | | Year ended December 31, | |
| | | 2014 | | | 2013 | | | 2012 | |
Power Generated (in GWh) | | | 5,776 | | | | 6,414 | | | | 6,178 | |
| | | |
Power Sold (in GWh): | | | | | | | | | | | | |
Forward market | | | 1,054 | | | | 2,023 | | | | 3,025 | |
Spot market | | | 5,583 | | | | 5,725 | | | | 4,756 | |
| | | | | | | | | | | | |
Total sales | | | 6,637 | | | | 7,748 | | | | 7,781 | |
| | | | | | | | | | | | |
Sales (in millions of pesos) | | | 1,412 | | | | 1,366 | | | | 1,618 | |
| | | | | | | | | | | | |
Electricity Transmission: Enecor
Enecor is an independent electricity transmission company. We own 69.99% of Enecor, and Impregilo International Infrastructures N.V. owns the remaining interest. Enecor has a 95-year concession, expiring in 2088, to construct, operate and maintain approximately 22 km of electricity lines and a 500 Kilovolt (“Kv”)/132 Kv transforming station in the Province of Corrientes. Under the concession contract, 700,000 Class “A” shares of Enecor are pledged in favor of the Province of Corrientes.
Competition
We compete in both the spot and futures markets, with competitors such as Endesa Costanera, Central Puerto, AES and the Pampa Group, among others. In addition, in the Gas Plus market, where most of our energy is sold under term contracts, we compete with the Pampa Group, Grupo Albanesi and AES, among others.
INSURANCE
Our insurance policy principally focuses on the concentration of risks and the importance and replacement value of assets. Under our risk management policy, our principal assets, such as oil and gas facilities, refineries, petrochemical plants and power generation plants are insured for their replacement value.
We insure against material damages, control of wells (especially where we have gas production), and third-party liability, including marine liabilities. Our reinsurers have ratings equal to or above “A-” from Standard & Poor’s, “A3” from Moody’s and/or “B+” from A.M.Best. Insurance companies provide coverage in each and every country where we have controlled interests, following terms and conditions given by our reinsurers. We maintain coverage for operational third-party liability with respect to our onshore and marine activities, including sudden environmental risks such as oil spills (see “Item 3. Key Information—Risk Factors—Our operations could cause environmental damage, and any changes in environmental laws may increase our operational costs”). We carry third-party liability insurance coverage of up to U.S.$125 million for each and every ocean marine and non-ocean marine incident of loss. We maintain control of wells coverage in many gas and oil fields located in Argentina and Bolivia. We also carry marine cargo inland transit insurance and directors and officers insurance coverage. We also carry environmental guarantee insurance policies in
49
accordance with Law No. 25,675 (the “General Environmental Policy”) for the following assets: the Bahía Blanca refinery, the Galván port storage plant, the Dock Sud distribution plant, the Avellaneda blending plant, the Genelba power generation plant, the Zárate petrochemicals plant and twenty gas stations located in the Province of Buenos Aires. All projects and installations under construction are required to be insured in compliance with the respective construction contract for any damage and liability risk. We also carry insurance for workmen’s compensation and automobile liabilities.
Our main areas of coverage are subject to the following deductibles:
| | • | | U.S.$10,000,000 for each and every loss for property damage for all our businesses; |
| | • | | U.S.$5,000,000 for control of wells; and |
| | • | | U.S.$5,000,000 in ocean and non-ocean marine third-party liability. |
Our insurance decisions are based on our requirements and available commercial and market opportunities. Our facilities are regularly subject to risk surveys undertaken by international risk consultants.
PATENTS AND TRADEMARKS
Minor portions of our commercial activities are conducted under licenses granted by third parties. Royalties related to sales associated with such commercial activities are paid under the relevant licenses. We use the name “Petrobras” with the permission of Petrobras.
50
QUALITY, SAFETY, ENVIRONMENT AND HEALTH
PESA is a socially and environmentally responsible corporation that promotes continuous improvement of its health, safety and environmental practices and policies. This commitment lies at the core of our corporate mission. We believe that caring for the environment in which we operate and for the safety and health of individuals is an essential condition for the activities we develop.
Our Quality, Safety, Environment and Health (“QSEH”) policies incorporate state-of-the-art concepts, including: eco-efficiency, life cycle, continuous improvement and leadership. This is implemented through the use of 15 guidelines and international standards for practical and customary action, each aimed at responsible behavior-based development, in accordance with management system requirements.
We have complied with international audits and certifications with respect to environmental management, quality, safety and occupational health.
Excellence in Management
We continued to improve our management procedures by adopting an Excellence in Management Program, which focuses on the principles of our corporate management manual based on the “Brazilian National Quality Award,” and the management evaluation program for safety, environment and health (the “PAG-SMS Program”).
The Excellence in Management Program provides a framework for the development of best practices and business management measures, and identifies strengths and opportunities for the implementation of improvement plans focusing on excellence. Since 2008, we have been implementing pilot benchmark evaluations of management indicators to contribute to the creation of a culture of excellence that integrates comparative information.
The PAG-SMS Program, started in 2004, verifies site adherence to the safety, environmental and occupational health policy (and its 15 corporate guidelines). This verification involves triennial evaluations conducted by specialized assistants from Petrobras system locations, selected by our head office.
We also promoted transparent and integrated management processes, while improving the efficiency of operations. PESA has implemented its standardization process, based on the “SINPEP” (Petrobras’ Electronic Integrated Standardization System) application software developed by Petrobras for all of its units to facilitate the creation, implementation and improvement of standards for organizational process management. With the purpose of improving teamwork activities that contribute to efficient operations and improved results, we continued with the “Equipment Improvement” initiative aimed at obtaining efficient operations and improved results. In this respect, in 2014 we organized 14 teams with participants from all of our business units to assess improvement initiatives considering efficiency, productivity, costs, quality, safety and the environment.
The Genelba Thermoelectric Power Plant received the Silver Iberoamerican Quality Award granted by Fundación Iberoamericana de la Calidad (the Iberoamercian Quality Foundation), in which winners of the National Quality Award from 22 Iberoamerican countries participate. Pre-award actions included an assessment of our management, including leadership and management style, strategy, people development, resources, processes and clients and results.
During 2014, we improved our Management System through the successful completion of the Certifications Program under the ISO 9001, ISO 14001, OHSAS 18001 and ISO 50001 standards. The Annual Certifications Program includes internal and external audits on maintenance and re-certification of the management system as well as implementation of new certificates. It is a preventive activity that allows us to continue with management development according to established strategic guidelines.
Safety
To continue with our policies to reduce the risk of accidents, a series of preventive measures have been developed. During 2014, we met all planned targets. In addition, we achieved a 14% reduction in the rate of recordable personal accidents, our best performance during the last 10 years.
During 2014, we established an HES Risk Management Matrix in order to measure the degree of our management’s implementation of Health, Environmental and Safety processes at all of our production fields and plants, with a focus on permits and authorizations, integrity, reliability, operational discipline, environmental liabilities, contingencies and occupational health and industrial hygiene. This system has improved our ability to systematically assess our HES Risk Management focusing primarily on the most critical areas. In connection with process safety initiatives, we continued developing qualitative and quantitative assessments of our facilities and training, operational discipline and risk management practices.
51
Petrobras’s corporate program “Company’s Accident Reduction Plan” (PRAC) was implemented in 2014 with a focus on risk management in land transportation. In addition, several safety awareness and training activities were developed such as the “Drilling and Service Rigs Training Day”, “Safety as a Value in Petrochemical Activities”, “Terminal Observer Program”, “Day for Presentation of Good Safety Practices” and periodic meetings relating to in-house communication on safety through quarterly video conferences with operational managers and safety heads.
We received the “IAPG 2014 Annual Safety Award” granted by IAPG (Argentine Oil and Gas Association) among a group of companies in the “Producers” category for the safety management of exploration and production operations. This recognition considers the safety performance achieved between the second semester of 2013 and the first semester of 2014.
Environment
Our operations are carried out prioritizing QSEH-related matters within a “sustainable development” context. We are committed to minimizing our impact on the environment, and are developing a framework to assess and report on the eco-efficiency of all of our business units. Eco-efficiency is based on the concept of creating more goods and services while using fewer resources and creating less waste and pollution.
We are continuously working on and developing actions aimed at permanently reducing accidental spill risks mainly under programs for the integrity of aerial and underground ducts and tanks. In addition, monitoring and environmental studies are performed in order to become acquainted with different situations in target sectors. Thus, we continued implementing theVazamento Zero(Zero Spill) program within the Petrobras System. In 2014, we strengthened the Zero Spill program by developing a plan with a strong commitment at the organizational level and with the purpose of preventing spills in all operations with a focus on three fundamental pillars: Management System, Facility Integrity and Contingencies.
In 2014, the Puerto General San Martin plant was awarded the “Ecomagination Leadership Award” from General Electric for the implementation of its project on water consumption reduction by 60 million liters per year, with the consequent benefits of protection of assets against corrosion, improvement in operating reliability and reduction in total operation costs.
We continued with systematic environmental care awareness and promotion campaigns such as those performed for the Environment Day, the Water Day and the Biodiversity Day.
Emergency Response
We are engaged in preventing, preparing for, and responding to emergency situations, with an emphasis on minimizing damage and rapidly restoring previous conditions in the event of an accident. To that end, we carry out a plan of standardization and revision of contingency processes in our units.
We conduct land and nautical drills to develop the skills and competency needed to carry out our emergency plans in different sectors involving the coordination of the activities of various parties to be called in an emergency. More than 1,450 individuals from the emergency-response community, including civil defense forces and firemen, have been trained in techniques for reducing leaks and firefighting related to land transportation.
Health
In 2014, we continued our health promotion programs with a focus on primary and secondary prevention and the generation of a healthy workplace.
Within this context, we continued our Health Promotion and Protection Program (PPS) aimed at generating healthy life habits and behaviors through healthy diets and food safety actions according to IRAM 14.201, physical activity, preventive dental healthcare, smoking cessation and addiction prevention.
We provide an annual health exam to all employees, which contemplates occupational and epidemiological risks, thus facilitating the implementation of a specific health program tailored to the needs of the risk groups surveyed.
Concerning prevention, in 2014, we also continued providing Cardiopulmonary Resuscitation and First Aid training courses, our physical activities plan and flu and tetanus vaccination campaigns.
During 2014, we maintained our Heart Safe program under the American Heart Association’s international standards and maintained our certification as a smoke-free company through the Ministry of Health of the Republic of Argentina. In addition, we were recognized by the Ministry of Health as a Healthy Workplace and a blood donation-friendly company on account of implementing campaigns for voluntary blood donations in different plants.
52
Within the framework of the Occupational Hygiene Program, we completed the relevant work environment measurements and specific risk maps and rectified any deviations that were found. We also continued performing ergonomic surveys of specific workplaces.
53
REGULATION OF OUR BUSINESS
Argentine Regulatory Framework
Petroleum
Overview
The Argentine oil and gas industry is regulated by Law No. 17,319 (the “Hydrocarbons Law”), enacted in 1967, as amended by Law No. 26,197 and Law No. 27,007, and natural gas is regulated by Law No. 24,076 (the “Natural Gas Law”), enacted in 1992. The Hydrocarbons Law, which sets forth the general legal framework for the exploration and production of oil and gas, allows the Argentine government to establish a national policy for the development of Argentina’s hydrocarbon reserves, with the principal purpose of satisfying domestic demand.
Originally, the Hydrocarbons Law provided that all oil and gas reserves located within the Argentine territory were owned by the Argentine government, but in 1992 a new regulatory framework was implemented in response to several changes in the Argentine oil and gas industry after the privatization of Yacimientos Petrolíferos Fiscales Sociedad del Estado (now YPF) and Gas del Estado (“GdE”). In order to respond to these changes, Law No. 24,145 (the “Privatization Law”) was enacted. Pursuant to the Privatization Law, the Argentine government transferred ownership of oil and gas reserves to the governments of the provinces where those reserves were located, upon satisfaction of certain conditions. Furthermore, pursuant to section 124 of the Argentine Constitution, as amended in 1994, provinces were also granted primary control over natural resources existing in their respective territories. In 2007, Law No. 26,197 (the “Federalization Law”) amended the Hydrocarbons Law to also provide that oil and gas areas belong either to (and should be administrated by) the Argentine government or the provinces, depending on the territory where the relevant areas are located.
Fields located in the area lying between 12 nautical miles from the coastline and the outer boundary of the continental shelf belong to the Argentine government. All the fields lying within the various provinces or in offshore areas within 12 nautical miles of the coastline belong to the provinces or the City of Buenos Aires, as applicable. The Federalization Law also divides authority over hydrocarbon transportation concessions between the Argentine government and the provinces, as discussed in detail below under “—Federalization Law.”
As a result of the Federalization Law, all oil and gas exploration permits and production concessions, as well as other types of exploration and/or production contracts with respect to the fields located in provincial territories, where originally granted by the Argentine government, were transferred to the relevant provinces by operation of law without affecting the rights or obligations of permit or concession holders. Transportation concessions within provincial territories were also transferred to the relevant provinces.
The Hydrocarbons Law allows the Argentine government to establish national policies for the development of Argentine reserves and to set out the federal energy policy. Provinces have the right to (i) control and conduct surveillance of permits, concessions and exploration and production agreements; (ii) enforce compliance with the terms and conditions of permits, concessions and exploration and production agreements; (iii) approve the extension of the terms of permits, concessions and exploration and production agreements; and (iv) impose fees.
Following the enactment of the Federalization Law, several provinces (i.e., Chubut, Río Negro, La Pampa and Mendoza) conducted public bidding processes for the granting of new exploration permits and, eventually, production concessions.
While privatized, the oil and gas industry still remains heavily regulated, particularly with respect to: the granting of exploration and production rights, strict control on exports, taxes and fees on gross production; specific investment obligations relating to drilling activities, and other environmental controls and works.
On April 16, 2012, the Argentine government, through Decree No. 530/12, removed YPF’s senior officers and empowered a government intervenor to take a position with YPF for a period of 30 days with immediate effect. On May 3, 2012 the Argentine Congress enacted Law No. 26,741 for the expropriation of 51% of YPF’s Class D shares, out of the shares then held by Repsol YPF S.A. (Spain), and 51% of Repsol YPF GAS S.A., represented by 60% of its Class A shares then held by Repsol Butano S.A. (Spain). Additionally, Law No. 26,741 declares the self-sufficiency, production, industrialization, transportation and marketing of hydrocarbons to be activities of public interest and primary goals of Argentina, empowering the Argentine government to take the measures necessary to achieve such goals.
On July 27, 2012, Decree No. 1,277/12 repealed certain articles of Decree Nos. 1,055/89, 1,212/89 and 1,589/89, as well as any other regulation that had previously provided for free disposal of hydrocarbons.
Decree No. 1,277/12 also created the Commission under the supervision of theSecretaría de Política Económica y Planificación del Desarrollo del Ministerio de Economía y Finanzas Públicas, as well as theRegistro Nacional de Inversiones Hidrocarburíferas (the “Registry”).
54
Decree No. 1,277/12 set forth an obligation by the companies in the Argentine oil and gas industry to submit to the Commission an annual plan on exploration and exploitation investments. The Commission is in turn mandated to design a National Hydrocarbon Investment Plan each year.
On October 31, 2014, Law No. 27,007 amended the Hydrocarbons Law by, among other changes, distinguishing between concessions granted for exploration of conventional resources, as compared to non-conventional resources, and concessions granted for offshore exploration and production, modifying the fee and royalty payment schedule, and modifying certain regulations with the goal of promoting investment and the efficient use of resources.
See “Item 3. Key Information—Risk Factors—The Argentine government and provincial governments have intervened in the oil and gas industry in the past, and are likely to continue to intervene” “—Limits on exports of hydrocarbons and related oil products have affected and may continue to affect our results of operations” and “—Argentine oil and gas production concessions and exploration permits are subject to certain conditions and may not be renewed or could be revoked.”
Exploration and Production
Pursuant to the Hydrocarbons Law, exploration and production of oil and gas are carried out though exploration permits, production concessions, production contracts or partnership agreements. Nevertheless, the Hydrocarbons Law permits surface reconnaissance of territories not covered by exploration permits or production concessions, with the authorization of the SE and the permission of the owner of the land. Information obtained through surface reconnaissance must be provided to the office of the SE, which is prohibited from disclosing such information for a period of two years without the prior authorization of the party that conducted the exploration, except in connection with the granting of exploration permits or production concessions.
The Hydrocarbons Law originally granted exploration permits and production concessions at the federal level through a competitive bidding process. Since the enactment of the Federalization Law, this power is exercised by both the federal and provincial governments, as applicable. Companies and individuals seeking to obtain oil and gas permits and to participate in concession bidding processes need to satisfy certain registration requirements with the SE. Permits granted to third parties in connection with the deregulation and de-monopolization process were granted in accordance with procedures specified in certain decrees, known as the “Oil Deregulation Decrees,” issued by the Argentine government. In 1991, the Argentine government established a program under the Hydrocarbons Law, known as the “Argentina Exploration Plan,” which remains in effect and pursuant to which exploration permits may be auctioned. The holder of an exploration permit has the exclusive right to perform the operations necessary or appropriate for the exploration of oil and gas within the area specified by the permit. Each exploration permit may cover only unexplored areas up to 10,000 square kilometers in size (or 15,000 square kilometers for offshore exploration), and may have a term of up to 14 years (or 17 years for offshore exploration).
In the event that holders of an exploration permit discover commercially exploitable quantities of oil or gas, such holders will be entitled to obtain an exclusive concession for the production and exploitation of the relevant reserves. The production concession provides its holder the exclusive right to produce oil and gas from the area covered by the concession for a term of 25 years (plus, in certain cases, a part of the unexpired portion of the underlying exploration permit), which may be extended by the relevant authority for an additional ten-year term. A production concession also entitles the holder to obtain a transportation concession for transporting of the oil and gas produced.
Under the Hydrocarbons Law, holders of exploration permits and production concessions are required to carry out all necessary works to find or extract hydrocarbons, using appropriate techniques, and to make the investments specified in their respective permits or concessions. In addition, holders must avoid damage to oil and gas fields and hydrocarbon waste, must undertake adequate measures to prevent accidents and damage to agricultural activities, the fishing industry, communications networks and ground water, and must comply with all applicable federal, provincial and local laws and regulations. Failure by the holder of permits or concessions to make the relevant investments or take the measures required to avoid damages entitles the federal or provincial government who granted such permits or concessions to revoke or terminate them early, as applicable. Recently, provincial governments have revoked concessions, including one of our concessions, arguing that concessionaires had failed to make the required investment. See “Item 3. Key Information—Risk Factors—Argentine oil and gas production concessions and exploration permits are subject to certain conditions and may not be renewed or could be revoked.”
Holders of production concessions are required to pay for such concessions, and to make certain royalty payments to the Argentine government. Please see “—Royalties” below for more detail.
Exploration permits and production or transportation concessions are subject to termination upon breach or violation of applicable laws, regulations, or permit or concession terms, or upon the bankruptcy of the permit holder or concessionaire. In the event of the expiration of exploration permits or production concessions, all oil and gas wells, operating and maintenance equipment and ancillary facilities automatically revert to the federal or provincial government, without compensation to the permit holder or concessionaire.
55
Exploration permits and production concessions can be partially or totally assigned with the prior authorization of the Argentine government.
The Hydrocarbons Law does not automatically provide for termination due to a change of control in a company’s equity, although change of control clauses may be included under the relevant exploration permits or production concessions.
The Hydrocarbons Law, as amended by Law No. 27,007, provides that conventional (oil and gas) concessions will remain in effect for 25 years, non-conventional concessions for 35 years and offshore concessions for 30 years. In order to be eligible for an extension of a concession, under the amended Hydrocarbons Law, concessionaires must (i) have complied with their obligations under the law and their concessions, (ii) be producing hydrocarbons in the concession under consideration, and (iii) submit an investment plan for the development of such areas as requested by the competent authorities at least one year prior to the termination of the concession term. Further, concessionaires applying for extensions under Law No. 27,007 must make additional royalty payments ranging from 3% up to a maximum of 18%. Non-compliance with the obligations and standards set out in the Hydrocarbons Law may also result in the imposition of fines and, in the case of material breaches following the expiration of applicable cure periods, revocation of the relevant concession or permit. See “Item 3. Key Information—Risk Factors—Argentine oil and gas production concessions and exploration permits are subject to certain conditions and may not be renewed or could be revoked.”
Authorized Governmental Agency
The SE is the federal governmental agency in charge of enforcing the Hydrocarbons Law. However, the executive branch of Argentine government is in charge of determining areas in which hydrocarbons activities are to be encouraged and, together with provincial governments, the granting of permits and concessions. Pursuant to the Federalization Law, each province has the authority to enforce the Hydrocarbons Law within its own territory.
Pursuant to Decree No. 1,277/12, companies holding hydrocarbon concessions must submit to the Commission an annual investment plan. The Commission shall then evaluate the annual investment plan, verifying its suitability with respect to the National Hydrocarbon Investment Plan for that year. If it is deemed not to correspond with the national plan, the Commission may request the submission of a new annual investment plan that more suitably conforms to the requirements of the National Hydrocarbon Investment Plan.
State-Owned Energy Company
In October 2004, the Argentine Congress enacted Law No. 25,943 creating a new state-owned energy company called Energía Argentina S.A. (“ENARSA”). The corporate purpose of ENARSA is to carry out, through third parties or through joint ventures with third parties, (i) studies, exploration and exploitation of natural hydrocarbon reserves; (ii) the transportation, processing and sale of hydrocarbons and their direct and indirect by-products; (iii) the transportation and distribution of natural gas and (iv) the generation, transportation, distribution and sale of electricity. Moreover, Law No. 25,943 granted ENARSA all exploration concessions in respect of all national offshore areas located more than 12 nautical miles from the coastline, up to the outer boundary of the continental shelf, that were vacant at the time of the entry into force of the law on November 3, 2004. Therefore, any future exploration of offshore areas must be performed jointly with ENARSA.
Net Worth Requirements
The Hydrocarbons Law requires that, to engage in any exploration, production or transportation activity in respect of oil and gas, companies must comply with certain capital requirements and financial solvency standards.
SE Resolution No. 193/03 states that, in order to receive and maintain permits or concessions, the permit holder or concessionaire must have a minimum net worth of Ps.2 million, in the case of land areas, and Ps.20 million, in the case of offshore areas, and that such minimum net worth must be maintained for the entire term of the permit or concession. Non-compliance with this requirement may result in penalties, including fines or even removal from the register of oil companies of the SE. Up to 70% of these net worth requirements may be satisfied by means of financial or other guarantees.
Federalization Law
The Federalization Law was published in the Official Gazette on January 3, 2007, and amended the Hydrocarbons Law to clarify the federal and provincial governments’ ownership rights over liquid and gaseous hydrocarbon fields, based upon their location. As noted above, the Federalization Law transferred ownership of all hydrocarbon reservoirs that are onshore or within 12 nautical miles offshore to the provinces and the City of Buenos Aires, as applicable, and provided for Argentine government ownership of reservoirs more than 12 nautical miles offshore, until the outer limit of the continental shelf. Pursuant to the
56
Federalization Law, the Argentine Congress shall continue to enact laws and regulations to develop oil and gas resources existing within all of the Argentine territory (including marine resources), but the governments of the provinces where the hydrocarbon reservoirs are located shall be responsible for the enforcement of these laws and regulations, and the administration of the hydrocarbon fields, and shall act as granting authorities for the exploration permits and production concessions. However, the administrative powers granted to the provinces shall be exercised within the framework of the Hydrocarbons Law and the regulations complementing this law. Consequently, even though the Federalization Law established that the provinces shall be responsible for administering the hydrocarbon fields, the Argentine Congress retained its power to issue rules and regulations regarding the oil and gas legal framework. Additionally, the Argentine government retained the power to determine national energy policies. It was expressly stated that the transfer would not affect the rights and obligations of exploration permit and production concessionaires, or the basis for the calculation of royalties, which shall be calculated in accordance with the concession title and paid to the province where the reservoirs are located. The Federalization Law provides that the Argentine government shall retain the authority to grant transportation concessions: (i) involving the territory of two or more provinces; and (ii) directly connected to export pipelines for export purposes. Consequently, transportation concessions which are located within the territory of one province and which are not connected to export facilities have been transferred to the provinces.
Finally, the Federalization Law grants powers to the provinces to: (i) exercise in a complete and independent manner all activities related to the supervision and control of the exploration permits and production concessions transferred by Law No. 26,197; (ii) enforce all applicable legal and/or contractual obligations regarding investments, rational production and information and surface fee and royalties payment; (iii) establish the legal and contractual terms of any permits or concessions it grants; (iv) apply the sanctions provided for in the Hydrocarbons Law; and (v) exercise all other authority as set forth by the Hydrocarbons Law.
Since the enactment of the Federalization Law on January 3, 2007, both the SE and the applicable province have been counterparties to the different permits and concessions granted, with all the powers set forth in the Hydrocarbons Law, as amended and supplemented, and the rights derived therefrom.
On May 3, 2012, the Argentine Congress enacted Law No. 26,741, which declares the self-sufficiency, production, industrialization, transport and marketing of hydrocarbons to be activities of public interest and primary goals of Argentina, and empowers the Argentine government to take the measures necessary to achieve such goals.
On July 15, 2013, the Argentine Government created the System of Investment Promotion Regime for the Exploitation of Hydrocarbons by Decree No. 929/13 (“Promotion Regime”). Under the Promotion Regime, holders of exploration permits and/or concession rights registered in the Registry may apply to be included in the Promotion Regime, provided that they submit to the Commission an investment project, with a direct investment of at least U.S.$1 billion to be invested in the first five (5) years of such project. The beneficiaries of the Promotion Regime will be entitled to certain benefits, including, beginning the fifth year after their project’s commencement, the right to freely trade in the foreign market 20% of the production of oil and gas produced in their project without being subject to export tax withholdings. Additionally, the Promotion Regime provides that any exploitation concession confers the exclusive right to exploit deposits of conventional and unconventional hydrocarbons that exist in the areas covered by the respective concession during the corresponding periods.
Resolution No. 9/13 of the Commission approved the regulatory requirements and conditions for the submission and subsequent incorporation of investment projects for the exploitation of hydrocarbons under the Promotion Regime. Law No. 27,007 also permits holders of concessions to alsosubmit investment projects for inclusion in the Promotion Regime as long as they involve a direct investment in foreign currency of at least U.S.$250 million within the first three years of such project. Law No. 27,007 maintains the export tax benefit on the first 20% of oil and gas produced in conventional, unconventional and offshore concessions at depths less than or equal to 90 meters and provides for an export tax benefit on the first 60% of oil and gas produced in offshore concessions at depths greater than 90 meters.
Transportation
The Hydrocarbons Law grants hydrocarbon producers the right to obtain from the Argentine government a 35-year concession for the transportation of oil, gas and their by-products through a public tender process. Producers remain subject to the provisions of the Natural Gas Law and in order to transport their hydrocarbons do not need to participate in public tenders. The term of a transportation concession may be extended for an additional ten years upon application to the Argentine government.
Transporters of hydrocarbons must comply with the provisions established by Decree No. 44/91, which implements and regulates the Hydrocarbons Law as it relates to the transportation of hydrocarbons through oil pipelines, gas pipelines, multiple purpose pipelines and/or any other services provided by means of permanent and fixed installations for transportation, loading, dispatching, tapping, compression, conditioning infrastructure and hydrocarbon processing. This decree is applicable to oil pipelines and not to gas pipelines. See “—Regulation of Our Business—Argentine Regulatory Framework—Natural Gas—ENARGAS.”
57
The transportation concessionaire has the right to transport oil, gas and petroleum products and to construct and operate oil pipelines and gas pipelines, storage facilities, pumping stations, compressor plants, roads, railways and other facilities and equipment necessary for the efficient operation of a pipeline system. While the transportation concessionaire is obligated to transport hydrocarbons on a non-discriminatory basis on behalf of third parties for a fee, this obligation applies only if such producer has surplus capacity available and after such producer’s own transportation requirements are satisfied.
Depending on whether gas or crude oil is transported, tariffs are subject to approval by ENARGAS or the SE. SE Resolution No. 5/04 sets forth maximum amounts:
| | • | | for tariffs on hydrocarbon transportation through oil pipelines and multiple purpose pipelines, as well as for tariffs on storage, the use of buoys and the handling of liquid hydrocarbons; and |
| | • | | that may be deducted in connection with crude oil transportation by producers that, as of the date of the regulation, transport their production through their own unregulated pipelines, for the purpose of assessing royalties. |
Upon expiration of a transportation concession, ownership of the pipelines and related facilities is transferred to the Argentine government with no compensation to the concessionaire.
Refining and Marketing
Decree No. 1,212/89, issued pursuant to the Hydrocarbons Law, regulates hydrocarbon-refining activities by oil producers and other third parties. This decree, as well as rules and regulations issued by the SE, regulates the commercial, environmental, quality and safety aspects of refineries and gas stations. This decree authorized imports, abolished oil assignments by the SE and deregulated the installation of refineries and gas stations. Certain supervisory and control powers of the SE have also been delegated to provincial and municipal authorities, and therefore the refining and sale of refined products must also comply with provincial and municipal technical, health, safety and environmental regulations.
In order to refine hydrocarbons, companies must register with the SE. Registration is granted on the basis of financial, technical and other standards. As described below, liquid fuel retail outlets, points of sale for fuel fractioning, the resale to large users and supply contracts between gas stations and oil companies are also subject to registration with the SE.
Also, gas stations and other fuel retailers and distributors are required to register with the SE to participate in the liquid fuel market. Severe sanctions are imposed on those who execute transactions with unregistered parties. Additional requirements are also imposed on all fuel market participants, and brand owners are jointly liable for any breaches by companies operating under their brand name (pursuant to SE Resolution No. 1,102/04). Also, gas stations in border areas must sell fuels to vehicles bearing foreign license plates at mandatory differential prices (pursuant to SE Resolutions Nos. 938/06 and 959/06).
The Argentine government has also imposed restrictions on exports, requiring producers to obtain authorization before performing export operations (pursuant to Decree No. 645/02 and SE Resolutions Nos. 1,679/04 and 1,338/06). Prior to obtaining the SE’s approval to export crude oil or diesel oil, producers must generally demonstrate that they have either satisfied local demand requirements or granted the domestic market the opportunity to purchase oil on similar terms. Potential exporters of diesel oil must also register in advance with the government (pursuant to SE Resolution No. 1,679/04).
In 2005, the Argentine government imposed additional requirements to guarantee the domestic supply of diesel oil to gas stations by refiners (pursuant to SE Resolution Nos. 1,834/05 and 1,879/05). Initially, these regulations allowed gas stations to obtain diesel oil from third parties if refiners were unable to meet demand, with refiners bearing any additional costs incurred in procurement. In 2006, regulations were introduced to require refining companies, wholesalers and retailers to meet total reasonable diesel oil demand on a continuous basis in every region in Argentina at the same level demanded for the corresponding month in the previous year, plus an adjustment to account for growth in domestic product (pursuant to Secretary of Domestic Commerce Resolution No. 25/06).
Provision No. 157/06 of the Argentine Undersecretary of Fuels provides that fuel sellers who are parties to contracts creating any degree of exclusivity between the refining company and the fuel seller, which for any reason are seeking to terminate such contract, shall report the termination in advance to the Argentine Undersecretary of Fuels in order to inform the Secretary of Domestic Commerce. In that case, the Secretary of Domestic Commerce must: (i) issue a statement regarding the validity of the termination of the contract and (ii) use all necessary means to allow the fuel seller terminating the contract to execute another agreement with a refining company and/or fuel broker in order to guarantee its fuel supply.
The SE also regulates the quality content of fuels, through SE Resolution No. 1,283/06. This Resolution has been modified by SE Resolution No. 478/09, postponing the enforcement of some quality specifications for certain kinds of fuels.
58
Any new fuels sold in Argentina must be authorized by the Undersecretary of Fuels (pursuant to SE Resolution No. 1,334/06). In 2008, the SE exempted fuel oils sold to power plants from marketing quality requirements under SE Resolution No. 1,283/06 (pursuant to SE Resolution No. 150/08).
SE Resolution No. 1,103/04 provides, pursuant to Section 17 of Decree No. 1,212/89, that in the case of gas stations operating under a brand, the brand owner under which fuels are sold shall be responsible for the specification, quality and quantity of products sold and for compliance thereof with reported requirements, and in the case of gas stations operating under no brand, the operator shall be the responsible party and fuel suppliers may also be jointly and severally liable when identified.
The Ministry of Federal Planning created theEnergía Total (“Total Energy”) program in 2007 to help guarantee the supply of liquid and gas fuels to producers and to the Argentine population during 2008 (pursuant to Resolution No. 459/07). The program is designed to encourage the substitution of alternative fuels for natural gas and electricity consumption used in various production activities, and for electricity generation. The program has since been extended. ENARSA is in charge of coordinating the Total Energy program, under which two separate plans call for the provision of liquid and gas fuels. One goal of the program is to guarantee the supply of liquid fuels derived from oil (LPG, diesel, fuel oil, gasoline and octane enhancers) and to meet overall demand, based on economic growth and industrial development. The beneficiaries of this plan are primarily fuel refining and importing companies in Argentina that qualify pursuant to regulations governing the Total Energy program and that have reached an agreement with ENARSA.
From January 1, 2010, as established by Law No. 26,093, Decree No. 109/07 and other regulations, all gas and diesel sold in Argentina must contain 5% of biodiesel and all petroleum naphtha sold in Argentina must contain 5% bioethanol.
On January 17, 2014, Resolution 1/14 of the Commission approved the “Procedure for Light Crude Oil Imports”, fixing the maximum quantities of light crude oil that may be imported by each market participant on the basis of idle refining capacity, refinery complexity and domestic market share of gasoline and diesel. Resolution 1/14 further provides that the Commission will evaluate each import proposal submitted to it and determine actual import volumes to be assigned to each importer, in accordance with the referenced maximum quantities.
Market Regulation
Under the Hydrocarbons Law and certain decrees issued in connection with the deregulation and de-monopolization process that took place in the early 1990s (the “Oil Deregulation Decrees”), holders of production concessions had the right, with a few limited exceptions, to freely dispose of their production either through sales in the domestic market or through exports. However, since 2002, the Argentine government has imposed restrictions on the export of hydrocarbons under the Hydrocarbons Law. See “—Refining and Marketing” above and “Item 3. Key Information—Risk Factors— Factors Relating to Argentina—Limits on exports of hydrocarbons and related oil products have affected and may continue to affect our results of operations.”
In this context, Decree No. 1,277/12 repealed certain articles of Decree Nos. 1,055/89, 1,212/89 and 1,589/89, as well as any other regulation that had previously provided for free disposal of hydrocarbons.
Decree No. 1,277/12 also requires refining, marketing and transportation companies to submit to the Commission an annual investment plan. The Commission shall then evaluate the annual investment plan, verifying its suitability with respect to the National Hydrocarbon Investment Plan for that year, and shall audit the relevant company’s ongoing fulfillment of its plan every three months.
Furthermore, Decree No. 1,277/12 prohibits primary and secondary refineries from discontinuing their supply to the domestic market due to programmed or unprogrammed shutdowns, scheduled maintenance programs or changes or improvements in the refining processes, and empowers the Commission to apply the sanctions provided in Law No. 20,680, including, fines, forced temporary shutdowns, requisition of goods and products, and imprisonment, among others.
The Hydrocarbons Law authorizes the Argentine government to regulate the Argentine oil and gas markets and prohibits the export of crude oil during any period in which the Argentine government finds domestic production to be insufficient to satisfy domestic demand. In the event that the Argentine government restricts the export of oil and petroleum products or the free disposal of natural gas, the Oil Deregulation Decrees provide that producers, refiners and exporters shall receive a payment at a price, in the case of crude oil and petroleum products, not lower than that of similar imported crude oil and petroleum products, and, in the case of natural gas, not less than 35% of the international price per cubic meter of Arabian light oil, at 34 degrees. See “—Refining and Marketing” above.
Oil Plus and Refining Plus Programs
On November 25, 2008, the Argentine government issued Decree No. 2,014/08, which created two programs, known as Oil Plus and Refining Plus. The principal purpose of these programs is to stimulate the exploration, production and exploitation of oil reserves, in order to increase refining capability and production of different types of fuels. According to the decree, companies that fulfill requirements established by these programs will be awarded tax credits that are transferable and that can be applied against export taxes levied on exports of crude oil, natural gas and derivatives.
59
Also, pursuant to Decree No. 2,014/08, construction of infrastructure by oil companies to (i) enable the exploration and production of new hydrocarbons reservoirs, (ii) increase production capacity or (iii) incorporate new technology for the operation of existing and new hydrocarbons reservoirs, may qualify asObra de Insfraestructura Crítica(Critical Infrastructure Construction) under Law No. 26,360, and the company may seek reimbursement of the value-added tax (“VAT”) corresponding to the assets involved in the infrastructure construction, or accelerate the amortization of the same assets for the purpose of determining their income tax. Decree No. 2,014/08 is regulated by SE Resolution No. 1,312/08, which defines and quantifies the incentives to be awarded under these programs. These incentives are awarded according to variables such as the international price of oil, the production volumes and the ratios of recovery of hydrocarbons reserves. Fiscal credits awarded under the Oil Plus program are subject to verification of an increase in the production of oil and the incorporation of new reserves of hydrocarbons. Fiscal credits awarded under the Refining Plus program are contingent upon the existence of projects to install new refining units or the expansion of existing units.
In 2012, the Argentine government announced the suspension of its Oil Plus and Refining Plus programs, based on changes in the market conditions under which these programs were established in 2008.
SE Resolution No. 1/13 repealed certain benefits recognized by Resolution No. 1,312/08, in particular those which had been granted to exporting companies that satisfied certain requirements a tax credit of 12% of the difference between the domestic price and the value of the international price applicable to such export.
Royalties
Pursuant to sections 57 and 58 of the Hydrocarbons Law, holders of exploration permits and production concessions must pay an annual surface fee that is based on the acreage of each block and which varies depending on the phase of operation (i.e., exploration or production), and in the case of exploration, depending on the relevant period of the exploration permit. On October 17, 2007, Decree No. 1,454/07 significantly increased the amount of exploration and production surface fees expressed in Argentine pesos that are payable to the different jurisdictions where hydrocarbon fields are located.
According to the Hydrocarbons Law, royalties equivalent to 12% of the wellhead price of crude oil and natural gas are paid in Argentina, though a province may require the payment of a higher royalty rate upon renewal of a concession, up to a maximum of 18%. The wellhead price is calculated by deducting freight and other sales-related expenses from the sale prices obtained from transactions with third parties. The Hydrocarbons Law authorizes the government to reduce royalties by 5% based on the productivity and location of a well and other special conditions. Any oil and gas produced by the holder of an exploration permit prior to the granting of a production concession is subject to the payment of a 15% royalty.
SE Resolution No. 435/04, which updated SE Resolution No. 155/92, (i) imposes additional reporting requirements with respect to royalties, (ii) introduces certain changes with respect to the powers of provinces, (iii) amends certain parts of the royalty determination system, including applicable deductions and exchange rates, and (iv) establishes penalties upon default of a reporting duty. This resolution has been applicable to permit holders and concessionaires since June 2004.
Concessionaires are required to file monthly affidavits with the SE and the relevant provincial authorities, reporting:
| | • | | the quantity and quality of extracted hydrocarbons, including the computable production levels of liquid hydrocarbons and a breakdown of the crude oil (by type), condensate and total natural gas recovered (with a 0.1% maximum error tolerance); |
| | • | | sales to domestic and foreign markets; |
| | • | | reference values for transfers made at no cost for purposes of further industrialization; |
| | • | | freight costs from the location where marketable condition of a product is attained to the location where commercial transfer of the product takes place; and |
| | • | | a description of sales executed during each month. |
In addition to the affidavits, concessionaires must file receipts evidencing the payment of royalties. Upon breach of any reporting duty, provincial authorities are entitled to make their own assessment of royalties.
SE Resolution No. 435/04 also provides that if a concessionaire allots crude oil production for further industrialization processes at its own or affiliated plants, the concessionaire is required to agree with provincial authorities and the SE, as applicable, on the reference price to be used for the purpose of calculating royalties and payments. Upon failure by the concessionaire to agree to a price, provincial authorities may fix this reference price. The concessionaire is eligible for certain deductions, including (i) inter-jurisdictional freight costs, which can be deducted from the selling price, as long as transportation is made by means other than a pipeline, and monthly invoices and any relevant agreements are provided, and (ii) internal treatment costs (not exceeding 1% of the payment) incurred by authorized permit holders or concessionaires.
60
Undersecretary of Fuels Provision No. 1/08 established that the cutoff value for crude oil obtained from bituminous minerals as established by Ministry of Economy Resolution No. 394/07, equivalent to U.S.$42.00 per barrel, should be considered as the effective floor price on which to apply the positive quality adjustments for purposes of calculating the settlement of hydrocarbon royalties payable to the provinces.
By Decree No. 2,240/08, the Province of Neuquén approved the agreement signed with PESA for the extension of its concessions, other than Sierra Chata, for an additional ten years, subject to the Company’s agreement to pay to the Province an additional royalty fee of 3% on its production of oil and gas in addition to the 12% annual royalty payment previously described.
SE Resolution No. 813/10 ratified Undersecretary of Fuels Provision No. 1/08 for purposes of the settlement of hydrocarbon royalties as from January 9, 2008.
Exchange Rates Applicable to Royalties.Under Ministry of Economy Resolution No. 76/02, royalties on oil exports must be fixed taking into account the offer exchange rate quoted by the Banco de la Nación Argentina on the day before the royalty is paid.
However, from December 2001 until May 2002, producers and refiners agreed to negotiate a reduced exchange rate in order to moderate the impact of the Argentine peso devaluation on the price of the products. Producers calculated and paid royalties according to this reduced exchange rate. These calculations have been rejected by the Province of Neuquén, which has presented a claim for any shortfall in royalty payments resulting from this agreement. This claim is still pending judgment by the Argentine Supreme Court.
Regulations to Secure the Supply of Diesel
Over the past several years, the Argentine government has passed various laws and adopted various initiatives aimed at guaranteeing the supply of diesel fuel to the domestic market.
One government initiative aimed at securing local supply exempts diesel fuel imports intended for domestic consumption from the fuel liquids and natural gas tax, as well as the diesel oil tax. The following laws exempted diesel fuel imports in the following amounts from such taxes: Law No. 26,022 (2005) – 500,000 m3; Law No. 26,074 (2006) – 800,000 m3 (subject to an additional exemption of 20% in 2007); Law No. 26,337 (2007) – 1,800,000 m3 (applicable in 2008, subject to an additional exemption of 20%). Exemptions under Law No. 26,337 are valid when the average monthly parity of diesel oil imports is not lower than the ex-refinery price of diesel oil (excluding all taxes except VAT). SE Resolution No. 151/08 has also applied these exemptions to the first 500,000 m3of diesel fuel imported each year.
The Argentine government has also undertaken initiatives aimed at securing the supply of diesel fuel at subsidized, differential prices for regulated-rate public transportation service providers. Following Decree No. 675/03 (as amended by Decrees Nos. 159/04, 945/04, 280/05 and 564/05), several agreements were subsequently signed whereby refining companies agreed to supply diesel oil at lower than market prices, depending on the kind of services provided by the transportation companies. Decree No. 449/08 empowered theJefe de Gabinete(Cabinet Chief) to sign annual agreements extending the diesel fuel subsidy to transportation companies for the fiscal year 2008. As of the date of this Annual Report, such an agreement signed between the Company and the Cabinet Chief pursuant to Decree No. 449/08 is still in effect.
In exchange for providing diesel fuel at below market prices, refining companies that entered into agreements under Decree No. 449/08 had received direct compensation in the form of a credit on export duties, equivalent to the difference between the net revenues from the sale of diesel oil at the subsidized price and the net revenues that would have been obtained from the sale of the same diesel oil volumes at market prices. Refining companies that process the crude oil they produce are entitled to direct compensation, calculated by deducting such compensation from any amount payable for export duties. The applicable rate is determined by the Cabinet Chief and the right to compensation is determined by the SE.
Stability of Fuel Prices
In the early 2000s, in an effort to mitigate the impact of the significant increase in international prices for oil and petroleum by-products on domestic prices and to ensure price stability for crude oil, gasoline and diesel oil, at the request of the Argentine government, hydrocarbon producers and refineries entered into a series of temporary agreements, which contained price limits with respect to crude oil deliveries. By the end of 2004, in light of increases in the WTI, the Argentine government established a series of measures to ensure the supply of crude oil to local refiners at price levels consistent with the local retail price of refined products.
Producers and refiners currently freely negotiate purchase and sale prices for oil.
61
Natural Gas
In 1992, the Natural Gas Act was passed, providing for the privatization of GdE and the deregulation of the price for natural gas. To carry out the privatization, the assets of GdE were divided among two new transportation companies and eight new regional distribution companies. The transportation assets were divided into two systems on a geographical basis, the Northern and Southern pipeline systems, designed to give both systems access to gas sources and to main centers of demand, including the “Greater Buenos Aires” region. A majority of the shares of each of the transportation and distribution companies was sold to private bidders.
The Natural Gas Act established a regulatory framework for the privatized industry and created ENARGAS, an autonomous entity under the Ministry of Economy that is responsible for the regulation of the transportation, distribution, marketing and storage of natural gas.
Regulatory framework Natural gas transportation and distribution companies operate in an “open access,” non-discriminatory environment under which producers, large users and certain third parties, including distributors, are entitled to equal and open access to the transportation pipelines and distribution systems. In addition, concessionaires may transport their own gas production pursuant to certain concessions granted under the Hydrocarbons Law.
The Natural Gas Act forbids gas transportation companies from buying and selling natural gas. Additionally, gas producers, storage companies, distributors and consumers who contract directly with producers may not own a controlling interest (as defined in the Natural Gas Act) in a transportation company. Furthermore, gas producers, storage companies and transporters may not own a controlling interest in a distribution company, and no seller of natural gas may own a controlling interest in a distribution or transportation company (unless such seller neither receives nor supplies more than 20% of the gas received or transported, on a monthly basis, by the relevant distribution or transportation company).
Contracts between affiliated companies engaged in different stages of the natural gas industry must be reported to ENARGAS, which may only decline to authorize such contracts if it determines that they were not entered into on an arm’s length basis.
ENARGASENARGAS is an autonomous entity which functions under the Ministry of Economy and is responsible for a wide variety of regulatory matters regarding the natural gas industry, including the approval and adjustment of rates and transfers of controlling interests in distribution and transportation companies. ENARGAS is governed by a board of directors composed of five full-time directors appointed by the Argentine government subject to confirmation by the Argentine Congress.
On May 21, 2007 the Argentine government announced that it was temporarily intervening in the operations of ENARGAS. Though the board of directors of ENARGAS continues to perform functions, as of the time of filing of this Annual Report, officials from the Argentine government currently exercise control over ENARGAS in consultation with the board of directors. The Argentine government has not indicated the intended duration of this arrangement.
ENARGAS has its own budget, which must be included in the Argentine national budget and submitted to Congress for approval. ENARGAS is funded principally by annual control and inspection fees levied on regulated entities in an amount equal to the approved budget, net of collected penalties, and allocated proportionately to each regulated entity.
Conflicts between regulated entities or between a regulated entity and a third party arising from the distribution, storage, transportation or marketing of natural gas must first be submitted to ENARGAS for review. ENARGAS’s decisions may be appealed to the Ministry of Economy or to federal courts.
Rate Regulation
Summary
Since the enactment of the Public Emergency Law and other emergency measures in early 2002, the regulatory framework of public utility tariffs has been radically modified, including the regulation of gas transportation and distribution services. A patchwork of conflicting regulations is currently in effect. Although the general rules on tariffs described in this section remain in effect, in practice they have been supplemented by other laws described throughout this “Regulation of Our Business” section. We cannot predict which rules and regulations will remain in place if and when conflicting regulations are revised.
Regulation of Natural Gas Distributors Prior to the Public Emergency Law
Prior to the enactment of the Public Emergency Law, provisions of the Natural Gas Act regulated the rates for gas transportation and distribution services, including those of TGS. Tariffs to end-users consisted of the sum of three components: (i) the price of the gas purchased; (ii) a tariff for transporting gas from the production area through the distribution system; and (iii) a distribution tariff. Under the Natural Gas Act and TGS license, TGS was permitted to adjust rates (i) semi-annually to reflect changes in the U.S. producer price index, and (ii) every five years in accordance with efficiency and investment factors to be determined by ENARGAS.
62
In addition, subject to ENARGAS’s approval, rates were subject to adjustment from time to time to reflect cost variations resulting from changes in the tax regulations (other than income tax) applicable to TGS, and for objective, justifiable and non-recurring circumstances. The ratemaking methodology contemplated by the Natural Gas Act and the TGS license is the “price-cap with periodic review” methodology, a type of incentive regulation designed to allow regulated companies to retain a portion of the economic benefits arising from efficiency gains. This legal framework remains in effect, though it has been modified by the regulations described below.
UNIREN
The Public Emergency Law pesified tariffs for public utility services at a Ps.1.00 = U.S. $1.00 parity and prohibited tariff indexation. Additionally, it authorized the Argentine government to renegotiate public utility services contracts. This authority was later delegated by the Argentine government to the Ministry of Economy, which created, in July 2003, the UNIREN, for the purpose of assisting in the renegotiation process. The renegotiation of service contracts (several of which are still ongoing) must take into account the following criteria, among others:
| | • | | impact of tariffs on economic competitiveness and on income distribution; |
| | • | | quality of services to be provided and/or the capital expenditure programs provided for in the contracts; |
| | • | | interest of customers and accessibility to services; |
| | • | | the safety of the systems; and |
| | • | | the company’s profitability. |
On October 1, 2003, the Argentine Congress enacted a bill allowing the Argentine government to set public utility rates until the completion of the renegotiation process. TGS is in the process of renegotiating a tariff structure with the UNIREN. See “—Gas and Energy—Gas and Transportation—TGS—Tariff Renegotiation Process.”
Modifications to the regulatory framework
On February 16, 2004, the Argentine government, through Decree No. 180/04, modified the regulatory framework for the Argentine gas industry. The decree authorized the SE to take any necessary measures to maintain an adequate level of services in the event of a supply crisis. In addition, Decree No. 180/04 provided for:
| | • | | the creation of a trust fund (to be funded by tariffs payable by users of the service, special credit programs and contributions from direct beneficiaries) to finance the expansion of the industry and the creation of an electronic market; |
| | • | | the creation of an electronic wholesale market to coordinate “spot” transactions for the sale of natural gas and secondary market transactions for transportation and distribution of natural gas; and |
| | • | | a prohibition on distributors or their shareholders from having a controlling participation in more than one gas dealer. |
On December 3, 2008, Decree No. 2,067/08 created the trust fund to ensure the availability of natural gas imports as required to meet domestic supply needs.
On October 4, 2010, ENARGAS Resolution No. 1,410/10 incorporated modifications to the mechanism for release of natural gas, mainly prioritizing demand corresponding to residential consumers and CNG. Accordingly, each distributor may apply daily volumes above the commitments set by Ministry of Federal Planning Resolution No. 599/07. ENARGAS Resolution No. 1,410/10 also enables carriers to reallocate volumes injected into the transportation system.
On November 14, 2011, ENARGAS Resolution No. 1,982/11 increased the amount to be received by the trust fund created by Decree No. 2,067/08 beginning in December 2011, and expanded the customer base reached.
On April 26, 2013, the Commission approved the general rules applicable to the Gas Program I by Resolution 3/13, establishing a price of 7.50 U.S.$/MMBTU for natural gas excess injection. Furthermore, on November 29, 2013, the Commission enacted Resolution 60/13 (later modified in March 2014, through Resolution No. 22/2014), which created the Gas Program II.
Adjustment of Natural Gas Price at the Wellhead
Decree No. 181/04 instructed the SE to design a framework for the normalization of prices of natural gas at wellhead. The decree authorized the SE to negotiate a price framework for the adjustment of prices in sales to distributors. Natural gas prices for residential consumers were excluded from this process. It also authorized the SE to create a new category of users who must buy gas directly from producers.
Prices resulting from this framework are used as a reference for calculating royalties and are used by ENARGAS in calculating any necessary adjustments in tariffs that result from variations in the price of gas. In addition, Decree No. 181/04 required that all agreements for the sale of natural gas be filed with the electronic gas market, and granted authority to the SE to regulate the sale of gas (i) between producers and (ii) between producers and their associates.
63
Pursuant to Decree No. 181/04, in April 2004 the SE entered into an agreement with natural gas producers—approved by SE Resolution No. 208/04—that regulated the price of natural gas by sector, and that called for the complete deregulation of the wellhead price of natural gas by January 1, 2007. Under the April 2004 agreement, natural gas producers were required to provide minimum supply volumes to the local market, including (i) distributors for industrial users, (ii) clients of distributors, or new direct consumers, and (iii) local electric power generators. Additionally, this agreement called for producers to report all supply agreements to the SE.
In 2007, upon expiration of the 2004 agreement, the SE and the producers signed a new “Natural Gas Producers Agreement.” This agreement modified the proposed scope of gas price deregulation, and established set prices, under which the 2005 price was maintained for the residential segment, and an annual average increase was to be established at approximately 6.5% for the compressed natural gas, generation and industrial segments (though the price for gas in the industrial segment remained freely negotiable). The implementation of this agreement was staggered by segment and the last supply commitment to expire was that for residential supply, on December 31, 2011.
In 2008, the Argentine government introduced the “Gas Plus” program to create an incentive for producers participating in the aforementioned supply agreements to increase production in unexploited areas, areas under exploitation with particular geologic characteristics (e.g., “tight gas”), areas that had not been in production since 2004, or new fields in areas otherwise under production (pursuant to SE Resolution No. 24/08). Gas produced in these new areas is not subject to the same conditions imposed by the aforementioned natural gas producers’ agreement, thus permitting more favorable pricing.
On May 23, 2005, pursuant to SE Resolution No. 752/05, the SE established a mechanism by which new direct consumers were entitled to buy natural gas directly from producers as from August 1, 2005. SE Resolution No. 1,886/06 subsequently extended this mechanism through December 31, 2016. New direct consumers were allowed to buy natural gas in the electronic gas market, which was originally created for “spot” transactions but now permits long-term operations. In order to purchase gas in the electronic market, new direct customers were required to post irrevocable purchase orders that provided for: (i) terms of at least 36 months, (ii) prices of at least export parity, and (iii) volume of at least 1,000 m3 per day.
If the irrevocable offer is not accepted, the SE may require export producers to provide natural gas for a period of six months pursuant to the prices approved by Resolution No. 599/07 of the Ministry of Federal Planning. Transportation companies are prohibited from transporting natural gas for export purposes as long as the domestic supply of natural gas is not satisfied.
Resolution No. 1/13 of the Commission created the Gas Program I, pursuant to which beneficiary companies commit to increase the total volumes of natural gas injected into the domestic market during the proposed period, according to the values calculated in their respective projects and approved by the Commission. Once the project is in effect, Resolution No. 1/13 provides for compensation for injection surplus and a penalty in the event that the applicable company, in any given period, has not increased production consistent with its commitment.
Companies registered in the Registry created by Decree No. 1,277/12 may submit applications for the Gas Program I, subject to the terms and conditions for access established in the annex of Resolution No. 1/13 of the Commission. Companies that apply must indicate:
| | (i) | the calculation of base injection (natural gas volume proposed in connection with the project that the relevant starting point for calculation be the surplus injection duties assumed by the company); |
| | (ii) | the duration of the project, which shall not exceed five years, renewable at the request of the company, upon a decision by the Commission; |
| | (iii) | the calculation of adjusted basis injection (according to a rate of decline that will be calculated for each company in MMm3/d), for the proposed period; |
| | (iv) | the calculation of base price (weighted average price for the year 2012 from natural gas prices set for each consumer segment of the domestic market); |
| | (v) | the calculation of the weighted average for each month of validity of “Encouragement Program Injection Natural Gas Surplus” of prices of natural gas sold by the company, established for each consumer segment of the domestic market, which will be used to determine compensation. |
The Commission may require applying companies to provide additional clarifications as deemed necessary, as well as to adjust or modify all or part of the proposal submitted. The Commission will then evaluate the project in question, considering the particular situation of each company, and whether the project meets the project objectives.
64
Commission Resolution 3/13 approved the general rules applicable to the Gas Program I. Under such program, producers were required to submit their projects for an increase in total natural gas injection for a maximum period of five years, with a view to increasing production and achieving higher activity and employment levels in the sector. A price of U.S.$7.50/MMBTU was established for natural gas excess injection, with penalties involving LNG imports in the case of non-compliance with committed volumes. PESA submitted its project on a timely basis and is currently discussing the terms of the project with the Commission.
Furthermore, the Commission enacted Resolution 60/13 (later modified through Resolution No. 22/2014), which created the Gas Program II. Under this program, producers were required to submit projects to increase natural gas production levels no later than April 30, 2014. Such program is directed to companies without previous production or with a maximum production of 4 MMm3/d, with price incentives in the case of production increases and penalties involving LNG imports in the case of non-compliance with committed volumes. Moreover, companies eligible for the Gas Program I and meeting the relevant requirements were entitled to request withdrawal from Gas Program I and admission to Gas Program II.
In August 2014, the Ministry of Economy and Public Finance, through Resolution No. 139/2014, introduced additional changes to Resolution No. 60/2013, including, among other amendments, the elimination of the previous injection limit and setting of two annual registration periods. We requested to participate in this program and were registered through Resolution No. 13/2015 issued by the Secretary of Economic Policy and Development Planning of the Ministry of Economy and Public Finance.
On April 7, 2014, the SE issued Resolution No. 226/2014 to implement a Program for the Rational Use of Natural Gas, whereby subsidies to producers who participate in the plan adopted under Commission Resolution No. 1/2013 are reduced through the implementation of a new price schedule for the residential and CNG segments. The program encourages a reduction in consumption by residential users by maintaining the current tariff if users reduce consumption by more than 20% compared to the previous year, or by applying a partial increase (50% with respect to the increase applied to users who do not reduce consumption at all) if users reduce between 5% and 20%. If there is no reduction in consumption, the new price schedule for the residential segment will be rolled out in stages, with a first stage beginning in April 1, 2014, a second stage beginning in June 1, 2014 and a third stage beginning in August 1, 2014, with average increases of 150%, 300% and 500%, respectively. Users located within the distribution area covered by Camuzzi Gas del Sur or any sub-distribution company in the South of Argentina were not made subject to the price increases because their distribution area is subject to colder temperatures year-round. As regards the CNG sector, the schedule provides for increases of 24%, 36% and 48% for each partial increase.
On October 31, 2014, Commission Resolution No. 231/2014 established that the price for natural gas intended for CNG consumption will be adjusted on a monthly basis tracking increases in the average price for high grade gasoline above 93 RON or any other product that replaces it in the future, as provided in the Resolution. Prices of CNG will be published on the website of the SE.
Restrictions on Gas Exports
The Public Emergency Law created a withholding tax on exports of hydrocarbons for five years from March 1, 2002, which was subsequently extended for five years from January 2007 pursuant to Law No. 26,217. The taxes withheld are deducted from the sales price of the exported hydrocarbons. In May 2004, a 20% withholding rate was imposed on gas exports. In July 2006, the Ministry of Economy increased the rate to 45% and instructed the customs administration to apply the price fixed by the framework agreement between Argentina and Bolivia (approximately U.S.$6 per million British thermal units (“MMBtu”) in December 2007) as the reference price to calculate this tax, irrespective of the actual transaction price. In addition, on October 10, 2006, the Ministry of Economy imposed prevalent export duties on exports from the Tierra del Fuego province, which were previously exempted from taxes. Moreover, in May 2007, the Ministry of Economy increased to 25% the export duty on butane, propane and LPG.
Resolution No. 127/08 of the Ministry of Economy, effective July 11, 2008, increased export duties on natural gas exports from 45% to 100%, establishing a valuation basis for the calculation of the duty as the highest price established in any contract of any Argentine importer for the import of gas (including the reference price set by the framework agreement between Argentina and Bolivia). Resolution No. 127/08 provides with respect to LPG products that if the international price, as notified daily by the SE, is below the reference price, the applicable export duty for such product will be 45%. If the international price exceeds the reference price, the producer shall be allowed to collect the maximum amount established for the relevant product, the balance being withheld by the Argentine government as an export tax.
Compressed Natural Gas for Vehicles
Effective April 1, 2006, distributors cannot supply gas stations with CNG. Instead, gas stations are required to purchase CNG in the electronic wholesale market pursuant to a mechanism of irrevocable purchase orders designed to conceal the identity of buyers and sellers, where buyers are able to make joint offers. If any purchase orders are not satisfied through this system, exports of natural gas will be diverted to cover unsatisfied demand. This mechanism remains in force as of the date of this Annual Report and is expected to continue until the SE determines that it is no longer necessary, in light of the status of the domestic supply of natural gas.
65
Liquefied Petroleum Gas
Prior to the enactment of Law No. 26,020 on April 8, 2005, the Argentine LPG market was regulated by the Hydrocarbons Law and regulations issued by the Undersecretary of Fuels. Under SE Resolution No. 52/01, the SE was responsible for enforcing the rules and regulations applicable to the LPG industry and an LPG board, which reported to the “National Refining and Marketing Board,” which, in turn, reported to the Undersecretary of Fuels, was in charge of supervising and auditing the industry.
Law No. 26,020 established a new regulatory framework for the LPG industry. This new regime regulates the production, fractioning, transportation, storage, distribution and sale of LPG. The SE is responsible for enforcement of Law No. 26,020, and may delegate supervision and control tasks to ENARGAS. The relevant portions of this law are summarized below:
| | • | | Prices: The SE determines reference prices (which must be below export parity prices) for the domestic market (by region, on a seasonal basis every six months), with the goal of securing regular supply in that market, and may establish price stabilization mechanisms to avoid domestic price fluctuations. |
| | • | | Market limitations: The SE and the CNDC are authorized to analyze the sector, for the purpose of fixing limits at each stage of vertical integration of the industry. |
| | • | | Open Access: An open access regime is established in connection with the storage of LPG and the SE establishes terms and conditions for the determination of maximum storage tariffs. |
| | • | | Imports/Exports: No restrictions are imposed and no prior authorization is required for the import of LPG, and the SE may authorize the export of LPG without restriction, so long as domestic market demand is satisfied. |
| | • | | Trust Fund: A trust fund was established to subsidize the consumption of LPG by the low-income residential sector and expanding the distribution network to areas without service. The trust is to be funded from the proceeds of sanctions collected under this law and contributions from the national budget. |
Resolution No. 168/05 of the Undersecretary of Fuels extends the domestic supply and export restrictions applicable to other hydrocarbons under SE Resolution No. 1,679/04 to LPG producers. However, as of the date of this Annual Report, domestic supply mandates and export restrictions have not been extended to the LPG market due to adequate domestic supply.
SE Resolution No. 792/05 set forth two seasonal periods (winter and summer), fixing reference prices for each period. Additionally, it divided the country into three geographical areas—North, Center and South—in which these prices are applied, as discussed above. It also approved a mechanism for the determination of the export parity price and an exclusive price that applies to retailers only, calculated from an average of its purchases for the last 24-month period.
On October 1, 2008, SE Resolution No. 1,070/08 ratified the supplementary agreement between the SE and LPG producers for contributions to the trust fund created by Law No. 26,020.
On January 5, 2012, SE Resolution No. 112/11 approved the agreement setting the price of LPG.
Electricity
Until 1990, virtually all of the electricity supply in Argentina was controlled by the public sector. In 1991, the Argentine government undertook the privatization of state-owned electricity generation, transmission and distribution companies. In January 1992, the Argentine Congress enacted Law No. 24,065 (the “Regulatory Framework Law”), which established guidelines for the restructuring and privatization of the electricity sector. The Regulatory Framework Law, which continues to provide the framework for regulation of the electricity sector, distinguished between the generation, transmission and distribution of electricity as separate businesses and made each subject to its own regulatory framework.
The ultimate objective of the privatization process was to reduce rates paid by users and improve the quality of the electricity supply service through competition. The privatization process commenced in February 1992 with the sale of several large thermal generation facilities, and continued with the sale of transmission and distribution facilities (some of which we now own) and additional thermoelectric and hydroelectric generation facilities.
The Public Emergency Law, combined with the devaluation of the peso and high rates of inflation, had a severe effect on public utilities in Argentina. Because public utilities were no longer able to increase tariffs, inflation led to decreases in their revenues in real terms and a deterioration of their operating performance and financial condition. Most public utilities had also incurred large amounts of foreign currency indebtedness under the Convertibility Law regime and, following the devaluation of the peso, the debt service burden of these companies increased sharply, which led many of them to suspend payments on their foreign currency debt in 2002. This situation caused many Argentine electricity generators, transmission companies and distributors to defer making further investments in their networks. As a result, Argentine electricity market participants, particularly generators, are currently operating at near full capacity, which could lead to insufficient supply to meet a growing national energy demand.
66
To address the electricity crisis, the Argentine government has repeatedly intervened in and modified the rules of the MEM since 2002. These modifications include the imposition of caps on the prices paid by distributors for electricity power purchases (pursuant to SE Resolution No. 8/02) and the requirement that all prices charged by generators be calculated based on the price of natural gas (which are also regulated by the Argentine government), regardless of the fuel actually used in generation activities (pursuant to SE Resolution No. 240/03), which together have created a huge structural deficit in the operation of the MEM.
In December 2004, the Argentine government adopted new rules for the electricity market (pursuant to SE Resolutions Nos. 826/04 and 712/04), to come into effect once the construction of two new 800 MW combined cycle generators had been completed. These two generators commenced commercial operations in open cycle during 2008 and in combined cycle during the first quarter of 2010. Construction was partially financed with credit balances of generators resulting from the spread between the sales price of energy and generation variable cost, which are transferred to theFondo Para Inversiones Necesarias que Permitan Incrementar la Oferta de Energía Eléctrica en el Mercado Eléctrico Mayorista (the fund for investments required to increase the electricity supply in the MEM, or “FONINVEMEM”).
Electricity generators accepted the opportunity under SE Resolution No. 1,427/04 to participate in the FONINVEMEM projects. PESA contributed 35% of its credits accrued in the MEM during the 2004-2006 period for the construction of the combined cycle generators mentioned above, and earned the right to be a shareholder in the companies in charge of these projects.
The construction of these new generators evidences a decision by the Argentine government to take a more active role in promoting energy investments in Argentina. In addition to these projects, in April 2006 the Argentine congress enacted a law that authorized the Argentine government to create a special fund to finance infrastructure improvements in the Argentine energy sector through the expansion of generation, distribution and transmission infrastructure relating to natural gas, propane and electricity. Contributions to this fund are made throughcargos específicos(specific charges) passed on to customers as an itemization on their energy bills.
In 2006 the SE implemented the Energy Plus Program (pursuant to SE Resolution No. 1,281/06) to create an incentive for increased electricity generation. Projects implemented under the Energy Plus Program are not subject to market regulations regarding prices. Instead, prices can be freely negotiated between generators and users.
The Energy Plus Program seeks to increase electricity generation and satisfy domestic demand. For that purpose, CAMMESA requires that all large users (those consuming more than 300 kW) purchase their incremental demand (any volumes exceeding their 2005 consumption) from new generators under the Energy Plus Program.
In addition, the Argentine government has issued certain further regulations in this area. Through Decree No. 140/07, it created the Rational and Efficient Electric Power Usage Program (“PRONUREE”), which consists of several measures to promote and raise public awareness about the need to make rational and efficient use of electric power. And through Law No. 26,350, it modified the official time zone for the summer period from December 30 to March 16, in order to promote a decrease in the use of electric power.
In order to increase the electric power supply, the Argentine Government has also established a program called Delivered Electric Energy, through the supply of small transportable thermal plants and/or embarked power plants.
The Argentine Government has additionally continued to implement various measures in order to regulate the operation of the MEM and of the intervening agents. The most recent of these measures is SE Resolution No. 95/13, whereby new values for the remuneration of fixed and variable costs to be paid to generators, co-generators and self-generators for energy sales are set, and an additional remuneration is added. These values will not be applicable to bi-national hydroelectric power plants, to nuclear generation or to generation committed to in contracts regulated by the SE, such as those under the Energy Plus Program. This resolution has temporarily suspended new contracts under the MEM Term Market, other than those regulated by the SE, and it provides that upon the termination of existing contracts in the Term Market, large users must purchase their energy demand from CAMMESA. In addition, the resolution provides that commercial management and fuel delivery to the MEM plants will be centralized in CAMMESA.
Regulatory authorities
The principal regulatory authorities responsible for the Argentine electricity market are:
(1) the SE of the Ministry of Federal Planning;
(2) the ENRE; and
(3) CAMMESA.
The SE advises the Argentine government on matters related to the electricity sector and is responsible for the application of the policies concerning the Argentine electricity industry.
67
The ENRE is an autonomous agency created by the Regulatory Framework Law. The ENRE has a variety of regulatory and jurisdictional powers, including, among others:
| | • | | enforcement of the Regulatory Framework Law and related regulations; |
| | • | | control of the delivery of electric services and enforcement of the terms of concessions; |
| | • | | adoption of rules applicable to generators, transmitters, distributors, electricity users and other related parties concerning safety, technical procedures, measurement and billing of electricity consumption, interruption and reconnection of supplies, third-party access to real estate used in the electricity industry and quality of services offered; |
| | • | | prevention of anticompetitive, monopolistic and discriminatory conduct between participants in the electricity industry; |
| | • | | imposition of penalties for violations of concessions or other related regulations; and |
| | • | | arbitration of conflicts between electricity sector participants. |
The ENRE is managed by a five-member board of directors appointed by the Argentine government. Two of these members are nominated by theConsejo Federal de la Energía Eléctrica(Federal Council on Electricity, or the “CFEE”). The CFEE is funded with a percentage of revenues collected by CAMMESA for each MWh sold in the market. Sixty percent of the funds received by the CFEE are reserved for theFondo Subsidiario para Compensaciones Regionales de Tarifas a Usuarios Finales(regional tariff subsidy fund for end users), from which the CFEE makes distributions to provinces that have met certain specified tariff provisions. The remaining forty percent are used for investments related to the development of electrical services in the interior of Argentina.
CAMMESA oversees the operation of the MEM. CAMMESA was created in July 1992 by the Argentine government, which currently owns 20% of its capital stock. Various associations that represent MEM participants, including generators, transmitters, distributors, large users and electricity brokers, own the remaining 80%.
The Wholesale Electricity Market
Overview
The SE established the MEM in August 1991 to allow electricity generators, distributors and other agents to buy and sell electricity in spot transactions or under long-term supply contracts at prices determined by the forces of supply and demand.
The MEM consists of:
| | • | | a term market in which generators, distributors and large users enter into long-term agreements on quantities, prices and conditions; |
| | • | | a spot market, in which prices are established on an hourly basis as a function of economic production costs, represented by the short-term marginal cost of production measured at the Ezeiza 500 kV substation, the system’s load center; and |
| | • | | a stabilization system for spot market prices applicable to purchases by distributors, which operates on a quarterly basis. |
Operation of the MEM
In addition to having the responsibility of coordinating the dispatch operations in the MEM, CAMMESA is in charge of:
| | • | | managing the SIN (as defined below) pursuant to the Regulatory Framework Law and related regulations, which includes: |
| | • | | determining technical and economic dispatch of electricity in the National Interconnection System (the “SIN”); |
| | • | | maximizing the system’s security and the quality of electricity supplied; |
| | • | | minimizing wholesale prices in the spot market; |
| | • | | planning energy capacity needs and optimizing energy use pursuant to the rules set out from time to time by the SE; and |
| | • | | monitoring the operation of the term market and administering the technical dispatch of electricity pursuant to any agreements entered into in such market; |
| | • | | acting as agent of the various MEM participants; |
| | • | | purchasing or selling electricity from or to other countries by performing the relevant import/export operations; and |
| | • | | providing consulting and other services related to these activities. |
CAMMESA’s operating costs are covered by mandatory contributions made by MEM participants. CAMMESA’s annual budget is subject to a mandatory cap equivalent to 0.85% of the aggregate amount of transactions in the MEM projected for that year.
68
MEM Participants
The main participants in the MEM are generation, transmission and distribution companies. Large users and traders also participate in the MEM, but to a lesser extent. Transmitters, Distributors and Large Users may each participate in CAMESSA by appointing two acting and two alternate directors through theAsociación de Transportistas de Energía Eléctrica de la República Argentina(Argentine Association of Electric Power Transmitters).
Generators
Total electricity generation in Argentina during 2014, including imports and exports, totaled 131,137 GWh, out of which 63.4% was attributable to thermoelectric plants, 31.0% to hydroelectric plants, 4.0% to nuclear plants and 0.5% other sources.
Transmitters
Electricity is transmitted from power generation facilities to distributors through high voltage power transmission systems. Transmitters do not purchase or sell electricity. Transmission services are governed by the Regulatory Framework Law and regulations issued by the SE.
In Argentina, transmission is carried at 500 kV, 220 kV and 132 kV through the SIN. The SIN consists primarily of overhead lines and sub-stations and covers approximately 90% of the country. The majority of the SIN, including almost all of the 500 kV transmission lines, has been privatized and is owned by Transener. Regional transmission companies, most of which have been privatized, own the remaining portion of the SIN. Supply points link the SIN to distribution systems, and there are interconnections between the transmission systems of Argentina, Brazil, Uruguay and Paraguay allowing for the import or export of electricity from one system to another.
Distributors
The largest distribution companies are EDESUR and Empresa Distribuidora y Comercializadora Norte S.A.
Each distributor supplies electricity to consumers and operates the related distribution network in a specified geographic area pursuant to a concession. Each concession establishes, among other things, the area, quality of service required, rates paid by consumers for service and an obligation to satisfy demand. ENRE monitors compliance by federal distributors with the provisions of their respective concessions and with the Regulatory Framework Law, and provides a mechanism for public hearings at which complaints against distributors can be heard and resolved. In turn, provincial regulatory agencies monitor compliance by local distributors with their respective concessions and with local regulatory frameworks.
Distributors participate in CAMMESA by appointing two acting and two alternate directors Argentine Association of Electric Power Distributors.
Large users
The MEM classifies large users of energy into three categories:Grandes Usuarios Mayores(Major Large Users, or “GUMAs”),Grandes Usuarios Menores (Minor Large Users, or “GUMEs”) andGrandes Usuarios Particulares(Particular Large Users, or “GUPAs”).
GUMAs are required to purchase 50% of their demand through supply contracts and the remainder in the spot market, while GUMEs and GUPAs are required to purchase all of their demand through supply contracts.
Large users participate in CAMMESA by appointing two acting and two alternate directors through Argentine Association of Electric Power Large Users.
Traders
Since 1997, traders are authorized to participate in the MEM by intermediating block sales of energy. Currently, there are eight authorized traders in the MEM, several of which conduct transactions withComercializadora de Energía del Mercosur S.A. (“CEMSA”) in the export market.
Spot Market
Spot prices
The emergency regulations enacted after the Argentine crisis in 2001 had a significant impact on energy prices. Among the measures implemented were the pesification of prices in the MEM, known as the spot market, and the requirement that all spot prices be calculated based on the price of natural gas, even in circumstances where alternative fuel such as diesel is purchased to meet demand due to the lack of supply of natural gas. Despite these modifications, the basic framework for the spot market that was established prior to the economic crisis remains in place.
69
Under this system, energy prices in the spot market are set by CAMMESA, which determines the price charged by generators for energy sold in the spot market of the MEM on an hourly basis. The spot price reflects supply and demand in the MEM at any given time, which CAMMESA determines using different supply and demand scenarios that dispatch the optimum amount of available supply, taking into account the restrictions of the transmission grid, in such a way as to meet demand requirements while seeking to minimize the production cost and the cost associated with reducing the risk of system failure.
The spot price set by CAMMESA compensates generators according to the cost of the last unit to be dispatched for the next unit as measured at the Ezeiza 500 Kv substation, which is the system’s load center and is in close proximity to the City of Buenos Aires. Dispatch order is determined by plant efficiency and the marginal cost of supply. In determining the spot price, CAMMESA also considers the different costs incurred by generators not in the vicinity of the City of Buenos Aires.
In addition to energy payments for actual output at the prevailing spot market prices, generators receive compensation for capacity placed at the disposal of the spot market, including stand-by capacity, additional stand-by capacity (for system capacity shortages) and ancillary services (such as frequency regulation and voltage control).
Seasonal Prices
The regulations implemented in the wake of the Argentine economic crisis of 2001 also made significant changes to the seasonal prices charged to distributors in the MEM, including the implementation of a cap (which varies depending on the category of customer) on the cost of electricity charged by CAMMESA to distributors at a price significantly below the spot price charged by generators.
Prior to implementation of the emergency regulations, seasonal prices were regulated by CAMMESA as follows:
| | • | | prices charged by CAMMESA to distributors and large users changed only twice a year (in summer and winter), with interim quarterly revisions in case of significant changes in the spot price of energy, despite prices charged by generators in the MEM fluctuating constantly; |
| | • | | prices were determined by CAMMESA based on the average cost of providing one MW of additional energy (its marginal cost) and several other factors; and |
| | • | | CAMMESA would use seasonal database and optimization models in determining the seasonal prices and would consider both anticipated energy supplies and demand as follows: |
| | • | | in determining supply, CAMMESA would consider energy supplies provided by generators based on their expected availability, committed imports of electricity and the availability declared by generators; |
| | • | | in determining demand, CAMMESA included the requirements of distributors and large users purchasing in the MEM as well as committed exports. |
Stabilization Fund
The stabilization fund, managed by CAMMESA, absorbs the difference between purchases by distributors and large users at seasonal prices and payments to generators for energy sales at spot prices. When the spot price is lower than the seasonal price, the stabilization fund increases, and when the spot price is higher than the seasonal price, the stabilization fund decreases. The outstanding balance of this fund at any given time reflects the accumulation of differences between the seasonal price and the hourly energy price in the spot market. The stabilization fund is required to maintain a minimum amount to cover payments to generators if prices in the spot market during the quarter exceed the seasonal price.
Billing of all MEM transactions is performed monthly through CAMMESA, which acts as the clearing agent for all purchases between participants in the market. Generally, payments to generators are made approximately 40 days after the end of each month by CAMMESA.
The stabilization fund was adversely affected as a result of the modifications to the spot price and the seasonal price made by the emergency regulations, pursuant to which seasonal prices were set below spot prices, resulting in large deficits in the stabilization fund. This deficit has been financed by the Argentine government through loans to CAMMESA and by generators through contributions to the FONINVEMEM.
Term market
Historically, generators were able to enter into agreements in the term market to supply energy and capacity to distributors and large users. Distributors were able to purchase energy through agreements in the term market instead of purchasing energy in the spot market. Term agreements typically stipulated a price based on the spot price plus a margin. Prices in the term market were at times lower than the seasonal price that distributors were required to pay in the spot market. However, as a result of the emergency regulations, spot prices are currently higher than seasonal prices, particularly with respect to residential tariffs, making it unattractive to distributors to purchase energy under term contracts while prices remain at their current levels.
70
Argentine Taxation
General Overview
Holders of exploration permits and production concessions are subject to federal, provincial, and municipal taxes and regular customs duties on imports. The Hydrocarbons Law grants such holders a legal guarantee against new taxes and certain tax increases at the provincial and municipal levels. Permit holders and concessionaires must pay an annual surface tax based on the area held. Attempts by the Province of Neuquén to change the reference price used for calculating royalties are currently being challenged through litigation. For more detail on concession fees and royalties, see “—Royalties” above.
Oil and gas exploration and production activities in Argentina are subject to the following taxes:
| | • | | An annual surface tax based on the area held, which varies depending on the permit and concession terms. |
| | • | | An income tax of 35% of net income. |
| | • | | A VAT of 21% for the domestic sale of oil and gas, which is passed on to purchasers (exports have a zero percent VAT). |
| | • | | A provincial tax, usually of 2% of gross domestic sales (exports are excluded). |
| | • | | A national minimum income tax of 1% of the value of the assets that the company owns as of December 31 of each year. Certain assets, such as shares and interests in other companies subject to the same tax, are exempt. Assets located in the jurisdiction of the Province of Tierra del Fuego are also exempt. The income tax paid as determined for the same economic year is considered to be payment against this tax. |
| | • | | A provincial stamp tax applied to written agreements entered into within the provincial jurisdiction, at rates varying between 0.3% and 2.5% of the economic value of the relevant agreement. |
| | • | | A withholding tax on crude exports, as described under “—Export Taxes” below. |
| | • | | A tax on debits and credits applicable to bank account transactions and other banking transactions used as a replacement for current accounts. The generally applicable rate is 0.6% on each debit or credit transaction (although, in some cases, it increases to 1.2% or decreases to 0.075%). |
| | • | | A tax on personal property that applies to the shares or other stakes of Argentine companies held by foreign companies or individuals, at a rate of 0.5% of the value of such assets. |
| | • | | A surveillance fee applicable to downstream activities and transportation of liquid hydrocarbons and their derivatives through pipelines, as described under “—Surveillance Fee” below. |
In addition, the “net profit” (as defined in the Hydrocarbons Law) of holders of permits or concessions accruing from activity of such holders might be subject to the application of a special 55% income tax. This tax has never been applied, although each permit or concession granted after this tax came into place provided that the holder thereof is subject to it. Although a decree of the Argentine government provides that we are subject to the general Argentine tax regime, our permits and concessions were granted prior to the entry in force of this tax and this has never been enforced.
Following the introduction of market prices for downstream petroleum products in connection with the deregulation of the petroleum industry, Law No. 23,966 established a volume-based tax on transfers of certain types of fuel, replacing the prior regime, which was based on the regulated price. Law No. 25,745 modified, effective as of August 2003, the mechanism for calculating this tax, replacing the old fixed value per liter according to the type of fuel with a percentage to apply to the sales price, maintaining the old fixed value as the minimum tax. Decree No. 2579/2014 reduced fuel transport taxes on certain diesel and unleaded gasoline products, and water infrastructure fund taxes that applied to transfers of certain unleaded gasoline products.
Dividends distributed by us to our shareholders, in excess of the Company’s taxable accumulated income for the previous fiscal year, whether in cash, property or other equity securities, and any other payment in kind, are subject to income tax withholding at the rate of 35% in respect of such excess (“Equalization Tax”). This is a final tax and it is not applicable if dividends are paid in shares (acciones liberadas).
In addition, dividends paid by us to our Argentine individual shareholders and undivided estates as well as to our foreign shareholders are subject to tax at a 10% rate. The 10% tax rate is calculated over the net dividend after giving effect to the Equalization Tax.
Holding of our shares by individuals resident in Argentina or abroad and corporations, any type of legal entity, enterprise, permanent establishment, estate or resident abroad shall be subject to a personal assets tax on those holdings by December 31 every year. The tax basis shall be the percentage net equity of each shareholder, and the tax rate is 0.5%. We act as a substitute obligor and pay the tax. The Argentine government is entitled to recover the amount paid through withholding or by foreclosing on the assets that generated the tax liability.
71
Export Taxes
In 2002, the Argentine government imposed customs duties on the export of hydrocarbons. Export tax rates on crude oil were increased to 20%, on butane, methane and LPG, and to 5% on gasoline and diesel fuel. In May 2004, Resolution No. 337/04 of the Ministry of Economy increased export duties on crude oil to 25%. These export tax rates were increased again in 2004, when the Ministry of Economy issued Resolution No. 532/04, establishing a progressive scheme of export duties for crude oil, with rates ranging from 25% to 45%, depending on the quotation of the WTI reference price at the time of the exportation. In addition, in May 2004, pursuant to Resolution No. 645/04 of the Ministry of Economy, an export duty on natural gas and natural gas liquids was established at a rate of 20%. In July 2006, the Ministry of Economy increased the rate to 45% and instructed the customs administration to apply the price fixed by the framework agreement between Argentina and Bolivia (approximately U.S.$6/MMBTU in December 2007) as the reference price to calculate this tax, irrespective of the actual transaction price. In addition, on October 10, 2006, the Ministry of Economy imposed prevalent export duties on exports from the Tierra del Fuego province, which were previously exempted from taxes. Moreover, in May 2007 the Ministry of Economy increased to 25% the export duty on butane, propane and LPG. There can be no assurance as to future levels of export taxes.
Resolution No. 394/07 of the Ministry of Economy, effective as of November 16, 2007, increased export duties on Argentine exports of crude oil and other crude derivatives. This regime provided that when the international price exceeded the reference price, which was fixed at U.S.$60.90 per barrel, the producer would be allowed to collect U.S.$42 per barrel, the remainder being withheld by the Argentine government as an export tax. If the international price of Argentine oil exports (as defined by the regulator) was under the reference price but over U.S.$45 per barrel, a 45% withholding rate applied to all amounts over U.S.$45. If such price was under U.S.$45 per barrel, the applicable export tax was to be determined within 90 business days. A similar withholding regime applied to exports of oil by-products such as gasoline, fuel oil and lube oils, with different cut-off and reference prices.
Resolution No. 127/08 of the Ministry of Economy, effective July 11, 2008, increased export duties on natural gas exports from 45% to 100%, establishing a valuation basis for the calculation of the duty as the highest price established in any contract of any Argentine importer for the import of gas (including the reference price set by the framework agreement between Argentina and Bolivia mentioned above). Resolution No. 127/08 of the Ministry of Economy provides with respect to LPG products (including butane, propane and blends thereof) that if the international price of the relevant LPG product, as notified daily by the SE, is under the reference price established for such product in the resolution (U.S.$338/m3 for propane, U.S.$393/m3 for butane and U.S.$363/m3 for blends of the two), the applicable export duty for such product will be 45%. If the international price exceeds the reference price, the producer shall be allowed to collect the maximum amount established by the resolution for the relevant product (U.S.$223/m3 for propane, U.S.$271/m3 for butane and U.S.$250/m3 for blends of the two), the balance being withheld by the Argentine government as an export tax.
On January 7, 2013, Resolution No. 1/13 of the Ministry of Economy modified Resolution No. 394/07. According to Resolution No. 1/13, the after-tax revenues which the producer is allowed to collect were increased to U.S.$70 per exported barrel, as long as the international price of crude oil and other crude oil derivatives is greater than or equal to U.S.$80 per barrel. If that price is lower, the applicable withholding rate will be 45%.
In October 2014, through Resolution No. 803/14, the Ministry of Economy and Finance amended Resolution No. 394/07 and modified the withholding tax on hydrocarbon exports linking the rate (ranging from 10% to 13%) to a specific price schedule.
Resolution No. 1077/14 of the Ministry of Economy and Public Finance became effective on January 1, 2015, superseding Resolution Nos. 394/07 and 803/14 and providing that for so long as the international price of crude oil is less than U.S.$71 per barrel, the applicable withholding tax rate will be 1% and incremental tax rates will apply for so long as the international price of crude oil is equal to or higher than U.S.$71 per barrel.
Surveillance Fee
Law No. 25,565 imposed a surveillance fee payable to the SE for downstream activities, equal to Ps.0.0003 for each commercialized transaction in the domestic market, and for the transportation of liquid hydrocarbons and their derivatives through pipelines, at a rate of 0.35% of the estimated income for the provision of transportation service.
Argentine Environmental Regulations
The environmental legal framework comprises Sections 41 and 43 of the Argentine Constitution, as well as federal, provincial and municipal laws. According to Section 41 of the Argentine Constitution, the Argentine government legislates the minimum standards for protection of the environment, while the provinces and municipalities are responsible for establishing specific standards and implementing regulations. Please note that, in addition to the regulations described below, certain other regulations may also apply depending on the location of the oil and gas reserves.
72
International Treaties
Argentina is a member state to several international treaties concerning environmental matters that may impact our business. Argentina has undertaken several obligations in connection with the protection of the environment, the preservation of biological diversity and the implementation of sustainable development.
Such treaties include: (i) the Basel Convention on the Control of Transboundary Movements of Hazardous Waste and its Disposal (1989); (ii) the United Nations Framework Convention on Climate Change adopted in Rio de Janeiro (1992); (iii) the Montreal Protocol of Substances that Deplete the Ozone Layer (1989); (iv) the Kyoto Protocol (a protocol to the United Nations Framework Convention on Climate Change) (1997); and (v) the Stockholm Agreement on Persistent Organic Polluting Agents (2001).
Federal Environmental Laws
In accordance with Section 41 of the Argentine Constitution, federal laws establishing minimum standards for environmental protection have been enacted. These laws provide a general framework for the legislation to be enacted by local jurisdictions, which must satisfy the minimum standards contained therein.
General Environmental Policy
The General Environmental Policy, enacted in November 2002, established minimum standards for the protection of the environment, the preservation of biological diversity and sustainable development.
The main purpose of the General Environmental Policy is the promotion of the rational and sustainable use of natural resources and the establishment of procedures and mechanisms to minimize environmental risks, prevent and mitigate environmental emergencies and redress damages caused by environmental pollution.
The General Environmental Policy requires that any work or activity capable of significantly degrading the environment or its components or which may adversely affect the quality of life, shall be subject to a prior environmental impact evaluation. All entities must provide information related to the environmental impact of their activities and this information shall be publicly available, unless declared classified.
Entities carrying out activities dangerous to the environment and ecosystems must take out insurance policies for the damages such activities may cause. Any person liable for environmental damages must take the actions necessary to restore thestatus quo ante,and where such restoration is not possible, the indemnification determined by the courts shall be transferred to an environmental restoration fund for the execution of remedial action.
Specific Environmental Regulations of Oil and Gas Industries
SE Resolution No. 105/92 contains specific regulations and procedures for the protection of the environment during oil and gas exploration and exploitation.
During exploration, companies must prepare an environmental impact report to be filed with the SE, and no drilling activity may be carried out before filing such environmental impact report. Once oil and gas fields are discovered, companies must prepare an environmental assessment report also to be filed with the SE. Thereafter, environmental reports are to be filed with the SE on an annual basis.
Integral Management of Industrial and Services Activities Wastes
Law No. 25,612 establishes minimum standards for environmental protection with respect to the integral management of waste originated in industrial or service activities. It sets forth minimum environmental protection requirements for generation, handling, storage, transport, treatment and final disposal of the aforementioned wastes. It also maintains the Argentine Constitution’s prohibition on the importation, introduction, or transportation into the country, its airspace and seas, of any types of wastes from other countries.
In general terms, Law No. 25,612 sets a system of tort liability equivalent to that of Law No. 24,051 described under“Hazardous Waste”below. Infringements of this law may be subject to warnings, fines, closure, suspension of activities for up to one year and definitive withdrawal of authorizations and registrations in the applicable registers. In the case of legal entities, board members and managers may be held severally liable for such penalties.
73
Hazardous Waste
Law No. 24,051 regulates the generation, manipulation, transport, treatment and final disposition of hazardous wastes generated or located under federal jurisdiction or, if located in the territory of a province, that could affect individuals or the environment in other provinces other than the one where they were generated, or when the adoption of sanitary measures to handle such waste becomes necessary and it is advisable to unify those measures throughout the country due to their economic impact.
With respect to hazardous waste liability, hazardous waste is considered to have inherent risk (as contemplated by article 1,113 of the Argentine Civil Code), which means that the generator or handler of hazardous waste will only be exonerated from its liability to the extent it proves the victim’s or third parties’ negligence or willful misconduct. The law establishes severe civil and criminal sanctions for any infringement of Law No. 24,051.
Air Pollution
Law No. 20,284 applies in federal jurisdictions and in those provinces which have adopted the provisions of this law. It sets general principles for the treatment of potential sources of pollution. Enforcement of this law is vested in the respective national, provincial or local health authorities.
Water Environmental Management
Law No. 25,688 sets minimum standards for the preservation of water, its exploitation and rational use. It defines the different uses of waters and requires users to obtain permits from local authorities.
Additionally, it provides that a federal enforcement agency shall determine: (i) maximum limits for contamination and protection of aquifers, (ii) instructions for the refilling and protection of aquifers, and (iii) the fixing of parameters and environmental standards for the quality of waters.
PCB Elimination and Management
Law No. 25,670, enacted in October 2002, regulates the management and elimination of polychlorinated biphenyls (“PCBs”). It forbids the entry of PCBs and machines containing PCBs into Argentina as well as the installation of machines containing PCBs. According to Law No. 25,670, the Argentine government is empowered to take all measures necessary to guarantee the prohibition of the production, commercialization and the entry of PCBs into Argentina, as well as the elimination of used PCBs and the decontamination and elimination of PCBs and machines containing PCBs within the terms provided therein.
Concealment and Money Laundering
Law No. 25,246 categorizes money laundering as a crime, which is defined as the exchange, transfer, management, sale or any other use of money or other assets obtained through a crime, by a person who did not take part in such original crime, with the potential result that such original assets (or new assets resulting from such original assets) appear as if they have been obtained through legitimate means, provided that the aggregate value of the assets involved exceeds in the aggregate (through one or more related transactions) Ps.50,000.
Law No. 25,246 assigns information and control duties to certain private sector entities, such as banks, agents, stock exchanges and insurance companies, according to the regulations of the Financial Information Unit, and for financial entities, the Central Bank. These regulations apply to many Argentine companies, including us. These obligations consist mainly of maintaining internal policies and procedures aimed at preventing money laundering and the financing of terrorism, especially through the application of “know your customer” policies.
Among other duties, each financial entity is required to establish a “control and money laundering prevention committee” and to appoint a senior official responsible for money laundering prevention policies, who shall be in charge of centralizing and processing any information that the Central Bank and/or the Financial Information Unit may require.
Furthermore, financial entities are required to report to the Financial Information Unit any transaction that may be considered suspicious or unusual, which lacks economic or legal justification, or involves unjustified complexity. Financial entities must pay special attention to transactions arising from or relating to jurisdictions included in the Central Bank’s list of “non-cooperating” jurisdictions. As of the date of this Annual Report, Myanmar is the only jurisdiction included in such list.
Law No. 25,246 has been amended by Law Nos. 26,087 and 26,119.
Venezuelan Regulatory Framework
The Venezuelan state owns all hydrocarbon fields and has established methods for regulating the exploitation of hydrocarbons in Venezuelan fields that are different from those in Argentina.
74
The “Gas Hydrocarbons Organic Law” published on September 23, 1999 regulates the exploitation of free or non-associated gas and the transport, distribution, collection, storage, industrialization, handling and internal and external sale of associated gas (gaseous hydrocarbon that is extracted jointly with crude oil) and free or non-associated gas (hydrocarbon that is extracted from a field which does not contain crude oil), allowing private sector participation in these activities.
The Venezuelan Constitution, in force since December 1999, contains provisions related to petroleum activity, including Article 12, which states that oil fields are property of the Venezuelan state, and Article 302, which reserves petroleum activity to the Venezuelan state. The Constitution gives PDVSA, a state-owned entity, responsibility for managing petroleum activity.
The “Hydrocarbons Organic Law” published on November 13, 2001 effectively reversed most prior related legislation, except for the Gas Hydrocarbons Organic Law, and purported to grant ample opportunity for the private sector to participate in the industry, limiting the activities reserved to the Venezuelan state to primary activities (which include exploration, extraction and initial transport and storage) and to the sale of crude oil and specific products.
The Hydrocarbons Organic Law regulates the exploration, exploitation, refining, industrialization, transport, storage, sale and conservation of hydrocarbons and refined products. The law sets forth the following principles: (i) hydrocarbon fields are public property; (ii) hydrocarbon activities entail public utility and are of social interest; and (iii) activities described in the law are subject to decisions of the Venezuelan state adopted in connection with international treaties.
The Performance of Hydrocarbon Related Activities
Primary activities expressly reserved by law for the Venezuelan state can only be performed by (i) the government of Venezuela; (ii) wholly-owned state entities; or (iii) companies in which the Venezuelan state maintains direct control by owning at least fifty percent of the shares or quotas of capital stock. The sale of natural hydrocarbons and certain specified by-products can only be performed by wholly-owned state entities. Installations and existing facilities dedicated to the refining of natural hydrocarbons in the country and to the transportation of products and gas are owned by the Venezuelan state.
The National Assembly must grant approval to mixed companies before they can operate. These entities must meet the following minimum conditions: (i) they must have a maximum duration of 25 years; (ii) they must provide information regarding location, orientation and the extent of the area under operation; (iii) all of their assets must be reserved and turned over to the Venezuelan state once the activity ends; and (iv) any dispute among their shareholders must be resolved through private negotiations or arbitration and shall be subject to the laws of Venezuela.
Prior to April 2006, our interest in Venezuelan oil and gas fields was through operating service agreements with PDVSA, which established the terms of our compensation for production activities and investments. These contracts were awarded during bidding rounds in 1994 and 1997. In 2005, the Venezuelan government announced that these operating service agreements did not comply with the Hydrocarbons Organic Law and instructed the Ministry of Energy and Petroleum to commence negotiations with private operators to convert all operating agreements into mixed companies where more than 50% of each field is state-owned. These negotiations were completed in March 2006, and as a result, all our operating service agreements were converted to mixed companies in which the Venezuelan government, through theComisión Venezolana del Petróleo (the “CVP”), holds at least 60% of the share capital and private companies hold the remaining. The interests allocated to private companies were determined on the basis of the value attributed to the different operating service agreements during the negotiations.
The National Assembly has approved (i) the principal terms of the conversion agreements and the form of organizational documents for the mixed companies; (ii) amendments to the Hydrocarbons Organic Law and certain tax laws to allow the mixed companies to sell their production of crude oil to PDVSA and its associates and to qualify as exporters for VAT purposes; and (iii) the Law for Regulating the Participation of Private Entities in Primary Activities, which limits private company participation in primary activities in Venezuela, including the exploration and production of hydrocarbons, to participation through mixed companies.
Licenses and permits
A license from the Venezuelan Ministry of Energy and Oil is required to refine natural hydrocarbons, and permits from this ministry are required for activities related to the processing or domestic sale of refined hydrocarbons.
Relevant Tax Features
Income tax
Venezuelan income tax law imposes tax at a rate of 50% on the net taxable income of persons involved in hydrocarbon-related activities, or activities related to the purchase or acquisition of hydrocarbons and by-products for export. Accelerated amortization and depreciation of fixed assets and direct or indirect expenses necessary for the drilling of oil wells is permitted.
75
Contractors dedicated to exploration and production activities under operating agreements with state companies are also subject to a 50% rate.
Value-Added Tax
Subject to certain exceptions, in particular for exporting companies, imports and local purchases of goods and services are subject to VAT at a rate of 12%, with a limited number of goods and services subject to VAT at a rate of 8%.
Municipal taxes
Hydrocarbon activities are not subject to municipal taxes, as these taxes are exclusively reserved for the national government.
Income from contractors that have entered into operating contracts with state companies for the rehabilitation of marginal fields is generally subject to a municipal tax on gross income.
Royalties
Since January 2002, royalties on oil and gas production have been set at a rate of 30%.
Special Contributions from Mixed Companies
Mixed companies are subject to the following special taxes: (i) 3.33% additional royalty on the hydrocarbons volume extracted under the concession and delivered to PDVSA; and (ii) an amount equivalent to the difference, if any, between (a) 50% of the value of the hydrocarbons extracted under the concession and delivered to PDVSA each year, and (b) the aggregate of payments made by the mixed company to Venezuela in connection with activities conducted by the company during such calendar year, as royalties applicable on extracted hydrocarbons (including the additional royalty indicated in the preceding item (i), income tax and any other tax or contribution calculated on income (either gross or net income), and investments in domestic development projects amounting to one percent (1%) of profit before taxes).
In 2011, the Venezuelan government enacted Decree No. 8,807/12, amending a previous law that had introduced a special tax payable by companies exporting or transporting liquid hydrocarbons and oil by-products outside Venezuela, to be applied when the average price of the basket of Venezuelan liquid hydrocarbons exceeded a set price. Decree 8,807/12 modified the special tax by creating two special contributions, one for “extraordinary” prices and another for “exorbitant” prices, to be applied to the difference between the price set forth by the Venezuelan national budget and the monthly average of international prices of the basket of Venezuelan liquid hydrocarbons. In 2013, the Venezuelan government reformed the Decree No. 8,807/12, introducing modifications and updates the rates of these specials contributions. Under the Decree, when the monthly average of international prices of the basket of Venezuelan liquid hydrocarbons exceed U.S.$80 per barrel, they are considered “exorbitant prices”. These special contributions are recorded by mixed companies as selling expenses in their financial statements and negatively impact such mixed companies’ earnings.
OPEC
Venezuela is a founding member of OPEC. In the past, PDVSA, under instructions from the Ministry of Energy and Oil, has adjusted its own production to ensure that Venezuela complies with production quotas set by OPEC.
The Venezuelan government has created a policy of strict compliance with the production quotas established by OPEC. Article 6 of the Hydrocarbons Organic Law requires all persons who perform activities regulated by the Hydrocarbons Organic Law to comply with production cuts, such as those that may be set by OPEC. Hence any production cuts may directly affect private producers, contractors, PDVSA and mixed companies.
Exchange Controls
On February 5, 2003, the Venezuelan government introduced exchange controls. These regulations state that companies established for the purpose of developing any of the activities described in the Hydrocarbons Organic Law may maintain accounts in currencies other than the currency of Venezuela in banking or similar institutions outside of Venezuela only for purposes of meeting their obligations outside Venezuela. The Central Bank of Venezuela must approve these accounts. Any other foreign currency generated by these companies must be sold to the Central Bank of Venezuela. These companies cannot acquire foreign currency from the Central Bank of Venezuela to make foreign currency payments. These same exchange controls are applicable to mixed companies.
Additional Matters
Companies operating in the hydrocarbons sector in Venezuela that meet certain income thresholds are also required to contribute a percentage of gross income to scientific, technological and research programs. Hydrocarbon companies operating as mixed companies are also required to contribute to social programs. Additionally, employers of more than 50 employees are required to contribute to social programs aimed at reducing drug trafficking and substance abuse.
76
Bolivian Regulatory Framework
In Bolivia, the petroleum and gas industry is regulated by the System of Regulation by Sectors (the “SIRESE”), which regulates, controls and supervises telecommunications, electricity, hydrocarbons, transportation and water activities, to ensure that they operate efficiently and protect the interests of users, service providers and the Bolivian state by contributing to the development of the country. In May 2005, a new hydrocarbons law, Law No. 3,058, was enacted, which, among other things, significantly increased taxes for companies in the industry. The law imposed an 18% royalty and a 32% direct tax on hydrocarbons applicable on 100% of production. These new taxes were imposed in addition to applicable taxes under existing Law No. 843.
In May 2006, the Bolivian government enacted Supreme Decree No. 28,701, which provided, among other things, for the nationalization of hydrocarbon resources in Bolivia. This decree mandated that as of May 1, 2006, oil companies had to deliver all property related to hydrocarbon production for sale to the national operator, YPFB. In addition, this decree provided that the Bolivian state would recover full participation in the entire oil and gas production chain and to that end provided for the nationalization of the shares of stock necessary for YPFB to have at least 50% plus one of the shares in a number of companies.
77
ORGANIZATIONAL STRUCTURE
The following diagram illustrates the corporate organizational structure of PESA and its subsidiaries, as of the date of this Annual Report:
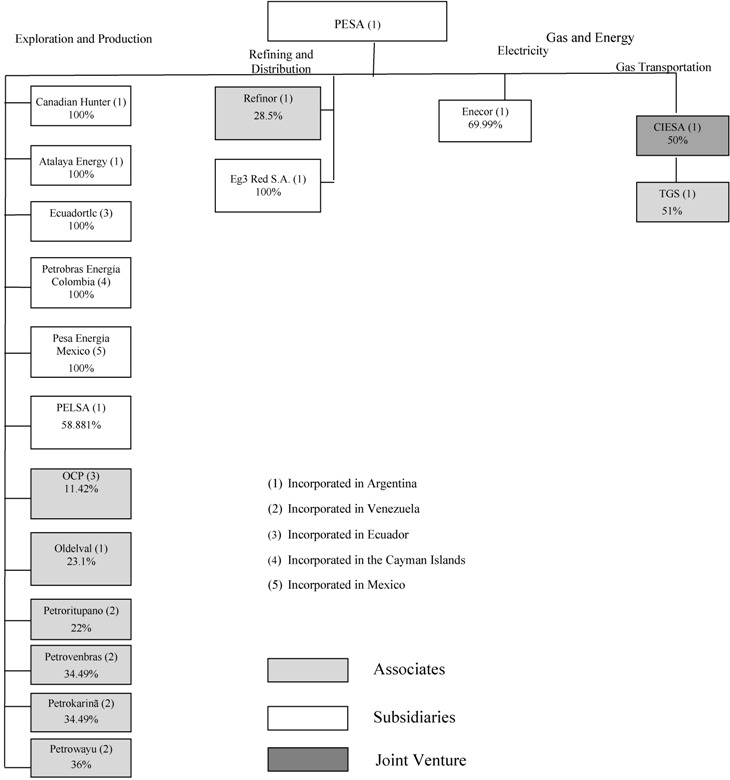
In addition to the companies included in this chart, we have holding companies in Spain, Bolivia, the Cayman Islands, Bermuda and Argentina, which are not reflected in the chart. Some of our material subsidiaries and associates are held through such holding companies.
78
The following diagram illustrates the ownership structure of PESA as of the date of this Annual Report:
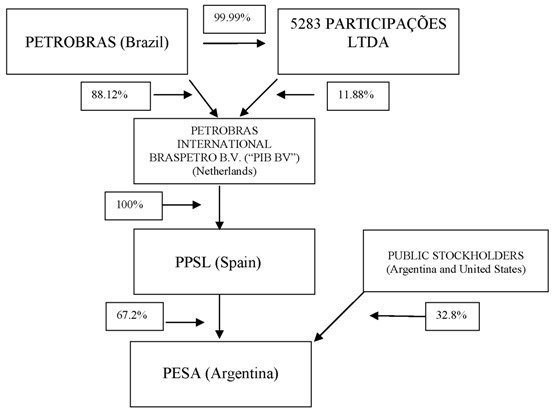
PROPERTY, PLANT AND EQUIPMENT
PESA has freehold and leasehold interests in various countries in South America, but there is no specific interest that is individually material to the Company. The majority of our property, consisting of oil and gas reserves, service stations, a refinery, petrochemicals plants, power plants, manufacturing facilities, power distribution systems, stock storage facilities, pipelines, oil and gas wells, and corporate office buildings, is located in Argentina. As of the date of this Annual Report, we also have interests in crude oil and natural gas operations outside Argentina, in Venezuela and Bolivia.
| Item 4A. | UNRESOLVED STAFF COMMENTS |
None.
| Item 5. | OPERATING AND FINANCIAL REVIEW AND PROSPECTS |
The following discussion should be read in conjunction with, and is entirely qualified by reference to, our Audited Consolidated Financial Statements and the notes thereto. Our Audited Consolidated Financial Statements were prepared in accordance with IFRS as issued by the IASB. See “Item 3. Key Information—Selected Financial Data—Presentation of Financial Information in accordance with IFRS.”
79
ANALYSIS OF CONSOLIDATED RESULTS OF OPERATIONS
OVERVIEW
We are a leading energy company in Argentina focused on maintaining profitability and meeting our social and environmental responsibility goals. We are engaged in:
| | • | | oil and gas exploration and production; |
| | • | | refining and distribution; |
Our principal place of business has historically been Argentina, but as of December 31, 2014 we also had operations in Venezuela, Bolivia and Ecuador. Approximately 84% of our total assets, 99% of our sales, 91% of our combined crude oil and gas production and 89% of our proved oil and gas reserves were located in Argentina as of December 31, 2014. Fluctuations in the Argentine economy and actions adopted by the Argentine government have had and will continue to have a significant effect on Argentine private sector entities, including us. See “Item 3. Key Information—Risk Factors.”
Year to year fluctuations in our income are a result of a combination of factors, principally including:
| | • | | The volumes of crude oil, oil products and natural gas we produce and sell; |
| | • | | Changes in international prices of crude oil and oil by-products, which are denominated in U.S. dollars; |
| | • | | Fluctuations in the Argentine peso/U.S. dollar exchange rate; |
| | • | | Changes to our capital expenditures plan and the related depreciation expense; |
| | • | | Price and export controls on crude oil and oil by-products imposed by the Argentine government; and |
| | • | | Changes in other laws or regulations affecting our operations, including with respect to tax and environmental matters. |
80
FACTORS AFFECTING OUR CONSOLIDATED RESULTS OF OPERATIONS
(1) Argentine Economic Situation
Fluctuations in the Argentine economy have had and will continue to have a significant effect on Argentine private sector entities, including us. Specifically, we have been affected and might continue to be affected by Argentine tax regulations, the value of the peso against foreign currencies, inflation, interest rates, and the general political, social and economic environment in and affecting Argentina.
(a) Value of the Peso Against Foreign Currencies
As of December 31, 2014, the peso-U.S. dollar rate of exchange was Ps.8.55 per U.S. dollar, compared to Ps.6.49 and Ps.4.91 per U.S. dollar as of December 31, 2013 and 2012, respectively.
As of December 31, 2014, 2013 and 2012, a significant portion of our financial debt was denominated in U.S. dollars. This situation exposes us to risks associated with the exchange rate. However, the impact on our results of operations derived from variations in the exchange rate related to our financial debt over such periods was partially mitigated by gains recorded on certain financial assets maintained in U.S. dollars and on net investments in foreign operations denominated in foreign currency, which are disclosed in Shareholders’ Equity under “Other Comprehensive Income” in the Consolidated Statement of Comprehensive Income.
Accordingly, the exchange differences for fiscal years 2014, 2013 and 2012 accounted for net gains of Ps.307 million, Ps.171 million and Ps.138 million, respectively.
After several years of moderate variations in the nominal exchange rate, in 2012 the peso lost approximately 14% of its value with respect to the U.S. dollar. This was followed in 2013 and 2014 by a devaluation of the peso with respect to the U.S. dollar that exceeded 30% over the course of those two years, including a loss of approximately 24% in January 2014. During the first quarter of 2015, the peso lost 3% of its value with respect to the U.S dollar (based on the official foreign exchange rate).
See “Item 3. Key Information—Risk Factors—Factors Relating to Argentina—Economic and political instability in Argentina has affected and may continue to adversely affect our financial condition and results of operations.” and “—Fluctuations in the value of the peso could adversely affect the Argentine economy, our results of operations or financial condition.”
(b) Inflation
Historically, the Argentine economy has exhibited significant volatility, characterized by periods of high inflation.
In accordance with IFRS, our financial information has not been adjusted to reflect inflation.
In 2014, 2013 and 2012, the Argentine consumer price index, according to statistics prepared by the INDEC, reflected inflation of 23.9%, 10.9% and 10.8%, respectively, and the Argentine wholesale price index rose 28.3%, 14.7% and 13.1%, respectively, during such years, also according to the INDEC.
In February 2014, the INDEC released a new inflation index that measures prices on goods across the country and replaces the previous index that only measured inflation in the urban sprawl of the City of Buenos Aires. Even though the new methodology brought inflation statistics closer to those estimated by private sources, there are still differences between official inflation data and private estimates.
Sustained inflation in Argentina, without a corresponding increase in the price of products sold by us in the domestic market, would have an adverse effect on our results of operations and financial position. Inflation could also adversely affect comparability among the different periods presented herein and our productivity and profitability. See “Item 3. Key Information—Selected Financial Data—Consideration of the effects of inflation” and “Item 3. Key Information—Risk Factors—Factors Relating to Argentina—Economic and political instability in Argentina has affected and may continue to adversely affect our financial condition and results of operations.”
(2) Regulation of the Energy Industry in Argentina
Over the past several years, except for the period that followed the global financial crisis in the third quarter of 2008 and recently, following the decrease in international oil prices, commodity prices of hydrocarbon products experienced an extended period of sustained increases. The Argentine government imposed a series of regulations, particularly focused on the energy sector, aimed at reducing the impact of inflationary pressures from such high prices and seeking to ensure energy supplies to the domestic market. Recently, the Argentine government has adopted other regulations intended to mitigate the impact of lower international prices on domestic oil and gas companies.
81
The level of government intervention in the economy may continue or increase, which may affect Argentina’s economy and, in turn, our business, results of operations and financial condition. See “Item 3. Key Information—Risk Factors—Factors Relating to Argentina—Government intervention in the Argentine economy could adversely affect our results of operations or financial condition.”
(a) Natural Gas
In 2007, the Argentine government and producers signed a new Natural Gas Producers Agreement, the main goals of which were to ensure sufficient supply to meet the domestic demand for gas, and to aid the gradual recovery in prices in all market segments.
As regards the first goal, the agreement established domestic market supply commitments for each producer. The agreement was approved by SE Resolution No. 599/07 and provided for successive maturities for each segment, with the residential supply commitment expiring last, in 2011. As a result, each segment’s market share was uniformly distributed among producers and regulated prices remained low for the above-mentioned segments. The SE issued Resolution No. 172/11 on December 29, 2011, which provides for a provisional extension until substitute measures are adopted. Accordingly, PESA continues, as of the date of this Annual Report, to be subject to the same supply commitments with respect to the various Argentine market segments.
In addition, the above resolution established that natural gas producers’ commitments to supply the CNG and power plant market segments would terminate on December 31, 2009. However, the SE unilaterally extended such supply commitments, which remain in force.
As regards the gradual recovery in prices, the power plant segment experienced the highest increase. In the case of the residential segment, however, prices did not increase significantly. With respect to the CNG segment, in August 2012 the SE, through Resolution No. 1,445/12, set a new price relating to natural gas for CNG services of Ps.0.4945 per cubic meter, representing an increase of approximately 300%, and provided for the investment of the additional resources obtained in the development of conventional gas resources.
In January 2007, through SE Resolution No. 1,886/07, the SE confirmed that hydrocarbon exports are contingent upon adequate satisfaction of domestic demand and export sales have to be authorized on a case-by-case basis by the Argentine government. See “Item 3. Key Information—Risk Factors—Factors Relating to Our Business—Limits on exports of hydrocarbons and related oil products have affected and may continue to affect our results of operations.”
Within the scope of the long-term gas supply agreements entered into between the governments of Argentina and Bolivia whereby a gas price of U.S. $5/MMBtu was initially established, subject to adjustment pursuant to a formula based on international reference prices for gas and its by-products, gas imports were placed under the responsibility of ENARSA. In order to avoid the impact of the price increase on domestic consumers, the Argentine government required that the increase in import gas prices be passed through to exports, through an increase in withholding taxes.
In September 2008, through SE Resolution No. 1,070/08, the Argentine government approved an agreement with natural gas producers for a reduction in the price of 10 kg butane cylinders. This agreement resulted in an increase in natural gas prices of 15% for residential users, 8% for CNG and 13% for electricity generation. The reduction in the LPG sales price is financed with contributions by producers, originally equivalent to 65% of the price increase resulting from the above resolution, and subsequently equivalent to 100% of such price increase as from December 2008. Under SE Resolution No. 1,417/08, an 80% increase was imposed on the price applicable to a sector of the R3 residential segment beginning in November 2008. The Natural Gas Producers Supplementary Agreement approved by SE Resolution No. 1,070/08 was renewed for 2010, 2011, 2012, 2013 and 2014. As of the date of this Annual Report, a Sixth Addendum to this Agreement has been signed, extending its validity through 2015.
In addition, a trust fund was created (pursuant to Decree No. 2,067/08) to cover natural gas imports required to secure supply to the domestic market. The resulting expenses are borne by users of the regulated transportation and/or distribution services, by natural gas processing companies and by gas consumers receiving gas directly from producers without using natural gas transportation or distribution systems.
In August 2009, the Argentine government and natural gas producers signed a “social peace” agreement, which provided that such companies should maintain production activity levels in exchange for an increase in the wellhead price of natural gas for the power plant segment, which would result in a 30% increase in such price.
In October 2010, through ENARGAS Resolution I-1,410, the natural gas delivery method was modified, placing a priority on supply to meet the residential and CNG segments’ demand. As a result, each distribution company was able to request volumes on a daily basis above committed volumes under the Natural Gas Producers Agreement (pursuant to SE Resolution No. 599/07). This resolution implied delivering a higher volume to meet the prioritized demand.
82
In November 2011, through ENARGAS Resolution No. 1,982, the amount to be received by the trust fund created under Decree No. 2,067/08 was increased according to consumption levels, and the consumer base falling within the scope of the resolution was broadened. Subsequently, ENARGAS Resolution No. 1,991 addressed large consumers falling within the scope of such resolution and provided a method to request exclusion, if applicable. Consumption of natural gas at the Bahía Blanca refinery in connection with oil refining activities, and at the Cóndor and Barda Las Vegas plants, in Santa Cruz, in connection with natural gas processing, fell within the scope of the above resolution.
Law No. 26,741, which was passed in May 2012, declared the achievement of self-sufficiency in hydrocarbons supply and the activities of exploration, exploitation, industrialization, transportation and marketing of hydrocarbons to be of public interest. In addition, YPF S.A.’s and Repsol YPF Gas S.A.’s net assets were declared to be of public interest and Repsol’s interests in those entities became subject to expropriation in an amount equal to up to fifty one per cent (51%) of total equity.
By means of Decree No. 1,277/12, which was passed in July 2012, the Argentine government approved the regulations for the implementation of Law No. 26,741 and issued the Rules of the Argentine Hydrocarbons Sovereignty regime. These rules provide for the development of a National Hydrocarbons Investment Plan with the stated goals of maximizing investment and ensuring sustainability of related activities in the short, medium and long term. In addition, Decree No. 1,277/12 abrogated certain sections of Decree Nos.1,055/89, 1,212/89 and 1,589/89 that had provided for the free availability of hydrocarbons produced in granted concession areas, free commercialization of hydrocarbons products in the domestic and foreign markets, and the freedom to set prices. As of the date of this Annual Report, the Company has complied with all applicable reporting requirements set forth in Decree No. 1,277/12.
In February 2013, the Commission issued Resolution No. 1/2013 establishing the Gas Program I. Under such program, producers were required to submit their projects for an increase in total natural gas injection for a maximum period of five years, with a view to increasing production and achieving higher activity and employment levels in the sector. A price of U.S. $7.50/MMBTU was established for natural gas excess injection, with penalties involving LNG imports in the case of non-compliance with committed volumes. PESA submitted its project but ultimately did not participate in the program.
In November 2013, through Resolution No. 60/2013 (modified in March 2014 by Resolution No. 22/2014), the Commission created the Gas Program II. Producers were required to submit projects to increase natural gas production levels no later than April 30, 2014. Such program was directed to companies without previous production or with a maximum production of 4 MMm3/d, with price incentives in the case of production increases and penalties involving LNG imports in the case of non-compliance with committed volumes. Moreover, companies eligible for the Gas Program I and meeting the relevant requirements were entitled to request withdrawal from Gas Program I and admission to Gas Program II
In August 2014, the Ministry of Economy and Public Finance, through Resolution No. 139/2014, introduced additional changes to Resolution No. 60/2013, including, among other amendments, the elimination of the previous injection limit and setting of two annual registration periods. We requested to participate in this program and were registered through Resolution No. 13/2015 issued by the Secretary of Economic Policy and Development Planning of the Ministry of Economy and Public Finance.
On April 7, 2014, the SE issued Resolution No. 226/2014 to implement a Program for the Rational Use of Natural Gas, whereby subsidies to producers who participate in the plan adopted under Commission Resolution No. 1/2013 are reduced through the implementation of a new price schedule for the residential and CNG segments. The program encourages a reduction in consumption by residential users by maintaining the current tariff if users reduce consumption by more than 20% compared to the previous year, or by applying a partial increase (50% with respect to the increase applied to users who do not reduce consumption at all) if users reduce between 5% and 20%. If there is no reduction in consumption, the new price schedule for the residential segment will be rolled out in stages, with a first stage beginning in April 1, 2014, a second stage beginning in June 1, 2014 and a third stage beginning in August 1, 2014, with average increases of 150%, 300% and 500%, respectively. Users located within the distribution area covered by Camuzzi Gas del Sur or any sub-distribution company in the South of Argentina were not made subject to the price increases recognizing different weather conditions in the area. As regards the CNG sector, the schedule provides for increases of 24%, 36% and 48% for each partial increase.
On October 31, 2014, Commission Resolution No. 231/2014 established that the price for natural gas intended for CNG consumption will be adjusted on a monthly basis tracking increases in the average price for high grade gasoline above 93 RON or any other product that replaces it in the future, as provided in the Resolution. Prices of CNG will be published on the website of the SE.
(b) Withholding Taxes on Exports
Taxes withheld are deducted from the sales price of exported hydrocarbons. The Public Emergency Law established withholding taxes on exports of hydrocarbons to last for five years from March 1, 2002, which period was subsequently extended for five further years beginning in January 2007 pursuant to Law No. 26,217.
83
This tax regime was modified by Resolution No. 394/07 issued by the Ministry of Economy in November 2007, which provided a new method for calculating withholding taxes on exports of petroleum oils, oils obtained from bituminous minerals and certain oil by-products. Under this new method, when the international price for crude oil exceeded U.S.$60.90 per barrel, an incremental withholding tax rate was applied to crude oil exports, capping the price the producer received at U.S.$42 per barrel. While the international price for crude oil was between U.S.$45 and U.S.$60.90 per barrel, a 45% withholding tax was applied. If the international price for crude oil decreased below U.S.$45 per barrel, the authorities were required to set new rates within 90 days. A similar withholding regime applied to exports of oil by-products such as gasoline, fuel oil and lubrication oils, with different cut-off and reference prices. This new tax regime had a negative impact on our Refining and Distribution business unit, particularly on exports of fuel oil, Vacuum Gas Oil (“VGO”) and gasoline. On January 3, 2013, the Ministry of Economy, through Resolution No. 01/13, modified the methodology for the calculation of taxes on exports of crude oil and other crude derivatives by increasing the reference value to U.S.$80 per barrel and the cutoff value to U.S.$70 per barrel. If the international price for crude oil is lower than the reference price, the applicable withholding rate will be 45%.
In October 2014, through Resolution No. 803/14, the Ministry of Economy and Public Finance amended Resolution No. 394/07, modifying the withholding tax on hydrocarbon exports to link the rate (ranging from 10% to 13%) to a specific price schedule.
Resolution No. 1077/14 of the Ministry of Economy and Public Finance became effective on January 1, 2015, superseding Resolution Nos. 394/07 and 803/14 and providing that for so long as the international price of crude oil is less than U.S.$71 per barrel, the applicable withholding tax rate will be 1% and incremental tax rates will apply for so long as the international price of crude oil is equal to or higher than U.S.$71 per barrel.
Natural gas exports are taxed under Resolution No. 127/08 of the Ministry of Economy (which amended Resolution No. 534/06). Natural gas exports are subject to a withholding tax levied at 100% of the highest price set for natural gas under any applicable agreement for natural gas imports into Argentina. Under Resolution No. 127/08, the method for calculating withholding taxes on exports of crude oil, under Resolution Nos. 394/07 and 1/13, is also applicable to LPG. Resolution No. 60/2015 of the Ministry of Economy reduced withholding tax on LPG exports from 45% to 1% and SE Resolution No. 36/2015 modified the price calculation method for LPG products.
See “Item 3. Key Information—Risk Factors—Factors Relating to Our Business—Export taxes on our products have negatively affected, and may continue to negatively affect, the profitability of our operations.”
(c) Downstream Margins
Downstream margins declined significantly after the enactment of the Public Emergency Law in January 2002. Since that time, the Argentine government has actively intervened in the fuel market to secure domestic supply and limit increases in the price of gasoline and diesel at the retail level in the domestic market. See “Item 3. Key Information—Risk Factors—Factors Relating to Our Business—Limitations on local pricing in Argentina may adversely affect our results of operations.”
In order to secure domestic supply, in the face of growing demand and the inability of Argentine refineries to significantly increase production levels, in 2006 the Secretary of Domestic Commerce promulgated Resolution No. 25/06, which required refining companies to supply all diesel market demand with a baseline equal to the demand for the same month of the prior year, plus an estimated market variation.
Under Law No. 26,022, diesel imports and sales in the domestic market of volumes imported during 2006 and 2007 were exempt from taxes on liquid fuels, natural gas and diesel, and from other taxes. During subsequent years, this exemption was incorporated into the Argentine Budget Law and the SE has since issued several resolutions proposing that hydrocarbon market operators participate in this regime. PESA relied on this tax exemption to import 162,563 cubic meters of diesel in 2013 and 170,733 cubic meters of liquid fuel in 2014.
Commencing in 2007, the Argentine government allowed gradual increases in fuel prices, which facilitated a partial recovery in our margins. On April 10, 2013, Resolution No. 35/13 of the Secretary of Domestic Commerce set maximum sales prices for liquid fuels for a period of six months, later extended for 45 additional days (Resolution No. 108/13). Resolution No. 108/13 has not been extended.
In January 2014, following the depreciation of the peso against the U.S. dollar, domestic oil and fuel prices temporarily decreased. International crude oil and related oil product prices declined significantly during the second half of 2014. As a result, in October 2014, the Ministry of Economy issued Resolution No. 803/14, which was later superseded by Resolution No. 1,077/14, setting forth a reduced withholding tax schedule to ensure the hydrocarbon industry’s profitability and investment level in order to achieve self-sufficiency. Furthermore, the Argentine government issued Decree No. 2579/2014, reducing fuel transport taxes on certain diesel and unleaded gasoline products, and water infrastructure fund taxes that apply to transfers of certain unleaded gasoline products. In January 2015, retail prices in pesos on diesel and gasoline were reduced by 5%. As of the date of this Annual Report, domestic crude oil prices exceed import parity prices.
84
Domestic oil prices dropped by U.S.$7 per barrel in the first quarter of 2015 compared to the price in effect as of December 31, 2014. In addition, on February 4, 2015 the Commission issued Resolution 14/2015 creating the Crude Oil Production Stimulus Program (Programa de Estímulo a la Producción de Petróleo Crudo), to be in effect from January 1, 2015 to December 31, 2015 providing for export and/or production stimulus payments for registered companies subject to certain requirements.Furthermore, in March 2015, the Ministry of Economy issued Resolution No. 35/2015 revoking the tax exemption on imported diesel and gasolines as from January 2015.
We cannot assure you that the Argentine government will not make further regulatory changes that could adversely affect our downstream margins.
(d) Electricity Generation
With the enactment of the Public Emergency Law, the Argentine government implemented the pesification of dollar-denominated prices in the MEM, and set a cap on prices that could be charged for gas used in electric power generation. As a result of this regulation, electricity prices failed to reflect total generation costs. This discrepancy led to the gradual depletion of the Stabilization Fund (Fondo de Estabilización), causing an increasing deficit, which in turn prevented CAMMESA from settling accounts normally with market agents.
In an effort to reduce the Stabilization Fund deficit, the Argentine government initially made contributions to the fund and reinstated seasonal adjustments, recognizing some of the increased costs resulting from the recovery of natural gas prices pursuant to applicable regulations in the determination of wholesale spot prices. Subsequently, the SE encouraged MEM creditors to participate in investments in electric power generation in order to increase the available supply of electric power generation in Argentina. For this purpose, two investment funds were organized, FONINVEMEM I and II. The financing of FONINVEMEM I and II was made through the contribution of 35% and 50% of the credit balances recorded in the 2004-2006 period and in the year 2007, respectively, resulting from the spread between the selling price of energy and the variable generation cost in the spot market. The total contribution by all wholesale electric market private creditors is estimated at U.S.$530 million for all periods, of which PESA contributed U.S.$55 million, dedicating U.S.$39 million to FONINVEMEM I and U.S.$16 million to FONINVEMEM II.
On October 17, 2005, under the terms of SE Resolution No. 1,193, PESA and other MEM creditors formally announced their decision to manage the construction, operation and maintenance of two power plants of at least 800 MW each, the Termoeléctrica Manuel Belgrano and Termoeléctrica José de San Martín plants. Combined construction costs of the plants was approximately U.S.$1.3 billion and was funded with contributions to FONINVEMEM I and II, with an additional charge imposed on consumers, and with contributions from the Argentine government.
The gas turbines of the Termoeléctrica Manuel Belgrano and Termoeléctrica José de San Martín power plants were operating in open cycle mode as of December 31, 2009 and in combined cycle as from the first quarter of 2010.
By December 31, 2009 the funds contributed by the Company to FONINVEMEM II had been fully recovered through investment in additional electricity generation projects under Resolution No. 564/2007 issued by the SE, whereby the Company built Genelba Plus, a 165 MW thermoelectric plant close to the existing Genelba Power Plant.
The Company began recovering amounts contributed to the FONINVEMEM I in 120 monthly installments in March 2010, upon authorization of commercial operations of both power plants in the combined cycle mode referred to above.
In 2008, as a consequence of the increasing deficit in the Stabilization Fund, CAMMESA’s debt with generation agents, including us, gradually increased. Therefore, generation companies only received payment from CAMMESA for variable production costs and for power and services such as the primary frequency response system, but not for the margin (between the spot price and the variable production cost) on sales to the spot market. For the purpose of remedying this situation and securing generation supply, the SE issued Resolution No. 724/08 aimed at improving the collection priority of generation companies. Under this resolution, generation companies were able to submit projects for the expansion of the lifespan and/or generation capacity of their units for the purpose of ensuring priority in the collection of credit balances owed by CAMMESA.
During 2010, several resolutions were approved to improve the operating margins of electricity generators. Under SE Notes No. 6,169 and No. 6,866, CAMMESA was instructed to accept assignment beginning May 1, 2010 of gas and transportation agreements by electric power generators, to centralize and optimize delivery of natural gas to the electricity generation sector. In exchange, a gross margin is accrued to electricity generators as if generation were performed with natural gas, regardless of the fuel used. SE Resolution No. 7,548, applicable to energy sold pursuant to the Energy Plus Program, was subsequently published and pursues the same objective. As of the date of this Annual Report, the above mentioned resolutions have been renewed and remain in effect.
85
On November 25, 2010, an agreement was entered into between generators and the SE to start readjustment of the MEM and comply with SE Resolution No. 1,427/04. Pursuant to this agreement, generators expected to start receiving a higher fee for monthly generation capacity availability, regardless of the actual dispatches to the SIN. In addition, higher operation and maintenance costs were to be recognized according to fuel used for generation. Generators, in turn, undertook to continue with their maintenance investment plans and to make investments with the proceeds from sales which generated the credit with CAMMESA described above. This agreement was terminated in 2012.
In November 2011, a new seasonal price was approved for the November 2011 to April 2012 period, reflecting values close to actual market costs. In subsequent resolutions, regulatory entities jointly started to reduce subsidies previously granted to certain industrial, commercial and residential sectors. These measures are aimed principally at providing greater predictability to market agents and supporting an economic and financial readjustment of economic transactions in the MEM.
In March 2013, the SE issued Resolution No. 95/2013 involving changes in the compensation scheme for MEM generators, co-generators and self-generators except for Plus generators, binational hydroelectric generators and nuclear generators, among others. The following changes are applicable to generators adhering to this new scheme:
| | 1. | changes in the compensation of generation companies according to their production scale and technology. Non-fuel fixed and variable costs and additional compensation are paid; payment of the latter two items is subject to the generation of each power plant, with a portion of the additional compensation being applied to a trust to finance works in the electricity sector; and |
| | 2. | temporary suspension of private agreements between generators and larger users in the MEM, in connection with both energy and fuels and related products, which are now managed by CAMMESA. |
In May 2014, the SE issued Resolution No. 529/2014 adjusting the prices applicable under Resolution No. 95/2013 and introducing the following changes:
| | 1. | an incentive for thermal generation in the most critical months for demand, improving the compensation of generation companies with high availability; and |
| | 2. | a new compensation item called “Compensation for Non-Recurring Maintenance.” Such compensation is accrued by, and only paid to, the generation companies that perform maintenance works on current equipment to support or increase availability. |
Resolution No. 95/2013, as amended by Resolution No. 529/2014, provided for regulatory changes in the MEM’s method of compensation of generation companies according to their production scale and technology affecting the Genelba Combined Cycle and Pichi Picún Leufú Hidroelectric Complex operations.
(e) Regulation of Utilities
The Public Emergency Law pesified tariffs for public utility services at a Ps.1.00 = U.S.$1.00 parity and prohibited the increase of these tariffs based on indexation factors. In addition, the Argentine government was authorized to renegotiate the terms of contracts relating to the provision of public utility services, taking into account the following criteria: (i) the impact of tariffs on economic competitiveness and on income distribution; (ii) the quality of services to be provided and/or the capital expenditure programs provided for in the contracts; (iii) the interest of customers and accessibility to services; (iv) the safety of the system; and (v) the companies’ profitability.
In July 2003, UNIREN was created under the joint jurisdiction of the Ministry of Economy and the Ministry of Federal Planning. UNIREN’s mission is, among other purposes, to provide assistance in the renegotiation of contracts with utilities, execute comprehensive or partial agreements with utility companies and submit regulatory projects related to transitional price and rate adjustments. Pursuant to Law No. 26,896, enacted in December 2013, the term to renegotiate contracts for public works and utility services was extended through December 31, 2015.
On April 7, 2014, the ENARGAS passed Resolution No. 2,852/14 defining the new tariff schedules that include an increase in the rate applicable to natural gas firm and interruptible transportation rates. The increase in the rate is staggered as follows: 8% from April 1, 2014, 5.5% from June 1, 2014 and 5.3% from August 1, 2014, or a cumulative increase of 20%.
TGS expects to allocate the additional revenue derived from such increases to an investment plan to be implemented by TGS in connection with works in its transportation system to secure quality levels that meet the requirements of the regulatory framework.
Publication of the new tariff schedules constitutes a partial implementation of the provisional agreement entered into between TGS and UNIREN on October 9, 2008, and ratified by the Argentine government pursuant to Decree 1,918/09. In this respect, TGS will continue to seek the full implementation of the provisional agreement (see Note 17.1.5 to the Audited Consolidated Financial Statements). See “Item 4. Information on the Company—Gas and Energy—Gas Transportation—TGS—Tariff Renegotiation Process.”
86
(f) CIESA’s Debt Restructuring
On July 13, 2012, CIESA, Grupo Pampa and PESA entered into a settlement agreement whereby all parties involved waived all claims, title and interest under the lawsuit before the New York State courts and terminated the same. As a result of the agreement, CIESA paid off all of its financial debt by means of (i) the transfer to Grupo Pampa of 4.3% of TGS’s shares; (ii) a cash payment of approximately U.S.$130 million; (iii) the release of the remaining financial debt; and (iv) execution on July 13, 2012 of a fifth amendment to the CIESA Restructuring Agreement whereby, upon obtaining governmental approval, Grupo Pampa will receive shares representing 40% of CIESA’s capital stock which are currently held in trust by The Royal Bank of Scotland N.V. Sucursal, Argentina.
As a result of full payment of CIESA’s financial debt, in the third quarter of 2012 we recorded a net gain of Ps.291 million attributable to our equity interest in CIESA, of which Ps.221 million and Ps.165 million are shown under “Other Operating Income” and “Share of Net Loss of Equity Accounted Investments,” respectively, with a Ps.95 million charge recorded in the “Income Tax” line item.
Pursuant to the settlement agreement and the decisions taken by CIESA’s board of directors’ meeting held on October 23, 2012, on January 2, 2013 CIESA notified the CNV of the formal cancellation of its corporate bonds, initiating formal steps for CIESA’s withdrawal from public offering and listing. On May 30, 2013, the CNV ordered CIESA’s withdrawal from public offering and listing, through Resolution No. 17,904. See “—Gas Transportation—TGS—Our Interest in TGS and Corporate Developments.”
(3) Migration of Operating Agreements in Venezuela
In April 2005, the Venezuelan Energy and Oil Ministry instructed the Venezuelan national oil company, PDVSA, to review all operating agreements signed with other oil companies between 1992 and 1997. The Ministry further instructed PDVSA to take all necessary action to convert those operating agreements into mixed companies whereby the Venezuelan government, through PDVSA, would be entitled to majority ownership.
In March 2006, we, through our related companies in Venezuela, signed memoranda of understanding with PDVSA and the CVP in order to effect the migration of our four pre-existing operating agreements. As a result, all of our operating service agreements were converted into mixed companies in which the Venezuelan government, through the CVP, holds at least 60% of the share capital and private companies hold the remaining.
In view of the new contractual framework, as of December 31, 2005, we recognized impairment charges of Ps.424 million to adjust the book value of our assets in Venezuela to their estimated recoverable value.
Additionally, the CVP recognized a divisible and transferable credit in favor of PESA in the amount of U.S.$88.5 million, which does not accrue interest, but could be applied toward acquisition bonds for any new mixed company project for oil exploration and production activities, or licenses for gas exploration and production operations in Venezuela. Once the milestones required for recognition of the credit by PDVSA were reached, as of December 31, 2006, we recorded the credit at its estimated recoverable value of Ps.180 million. As of December 31, 2007, since no projects for which the aforementioned credit was eligible for investment had materialized, our efforts to transfer the credit to third parties had been unsuccessful, and alternative uses of the credit could not be anticipated, we recorded a writedown to reflect the carrying value of such credit at zero.
As of December 31, 2014, the book value of our direct and indirect interest in Venezuelan mixed companies, net of impairment charges, was Ps.2.7 billion. The recoverability of these investments is highly sensitive to crude oil price volatility, to economic, social and regulatory changes in Venezuela and, particularly, to decisions made by the management of the mixed companies. Decreases in crude oil prices, fluctuations in economic conditions, the adoption of more restrictive measures by the Venezuelan government, and decisions by mixed companies to limit the development of reserves could adversely affect the valuation of the recoverability of our investment in these companies and, consequently, our income. As a result of the aforementioned variables, in the years ended December 31, 2014, 2013 and 2012, we recorded writedowns of Ps.1.3 billion, Ps.520 million and Ps.285 million, respectively, related to our assets in Venezuela.
See “Item 4. Information on the Company—Oil and Gas Exploration and Production—Production—Production Outside Argentina—Venezuela” and “Item 3. Key Information—Risk Factors—Factors Relating to Our Business—Our activities may be adversely affected by events in countries in which we do business.”
(4) Commodities Prices
Our results of operations and cash flows are exposed to risks related to the volatility of international prices, mainly crude oil and oil-related product prices.
International prices for crude oil have fluctuated widely in recent years, declining significantly during the second half of 2014. Changes in crude oil prices usually entail changes in the price for oil-related products.
87
During 2014, the annual average price of WTI reference crude oil was U.S.$93 per barrel, accounting for a 5% decrease compared to 2013. The annual average price of (UK) Brent oil was U.S.$99 per barrel, representing a premium over the WTI price of approximately U.S.$6, the lowest spread since 2010. Average prices during the first quarter of 2015 were U.S.$48.5 per barrel and U.S.$53.9 per barrel of WTI reference crude oil and (UK) Brent oil, respectively, remaining at relatively stable prices compared to December 31, 2014.
See “Item 3. Key Information—Risk Factors—Factors Relating to Our Business—Substantial or extended declines and volatility in the prices of crude oil, oil products and natural gas may have an adverse effect on our results of operations and financial condition and Limitation on local pricing in Argentina may adversely affect our result of operations.”
(5) Oil and Gas Production in Argentina
Oil and gas reserves in Argentina have followed a downward trend in recent years. According to official data from the SE, proved oil and gas reserves dropped by 12% in the 2008-2013 period. In 2014, oil production averaged 532 thousand barrels per day, accounting for a 1.4% decrease compared to 2013. Gas production declined 0.5% in the same period to an average of 113.7 million cubic meters per day.
Within this context, our oil and gas reserves in Argentina increased by 6% in 2014. Our equivalent production dropped by 10% in 2014, mainly due to the sale of our interest in the Puesto Hernández area and the natural decline of mature fields in Argentina.
The Company’s business plan provides for exploration investments in Argentina.
Due to risks inherent in exploration activities, our management cannot assure you that this downward trend in our Argentine reserves will be reversed.
(6) Operations in Ecuador
As from 2006, the Ecuadorian government introduced sweeping tax and regulatory reforms in the hydrocarbon sector which resulted in significant changes to the terms and conditions set forth at the time of execution of the participation agreements.
See “Item 4. Information on the Company—Oil and Gas Exploration and Production—Production—Production Outside Argentina—Ecuador” and “Item 3. Key Information—Risk Factors—Factors Relating to Our Business—Our activities may be adversely affected by events in countries in which we do business.”
(7) Changes in Our Oil and Gas Exploration and Production Portfolio
On December 2011, the Company relinquished 100% of the CAA-40 block and also relinquished its interests in the CAA-46 block, in the offshore Malvinas Basin.
On May 31, 2012, we purchased a 39.671% interest in PELSA from our controlling company, PPSL, for a price of U.S.$249.4 million. As from such date, PESA has exercised control over PELSA with a 58.88% total equity interest. See “Item 7. Major Shareholders and Related Party Transactions—Related Party Transactions—Acquisition of Companies.”
In 2013, the Province of Chubut approved a ten-year extension of the concession agreement for the El Tordillo and La Tapera-Puesto Quiroga areas.
On January 31, 2014, our Board of Directors approved the sale to YPF S.A. of our entire interest in the Puesto Hernández Joint Operation (UTE) agreement, for a total price of U.S.$40.7 million. This transaction represented for us an early termination of the agreement entered into with YPF S.A. in 1991 to operate Puesto Hernández, which is an area covering 147 km2and located in the Provinces of Neuquén and Mendoza.
On December 30, 2014, the legislature of the Province of Rio Negro ratified the agreement entered into with the government of the Province of Rio Negro to extend for an additional 10-year term our concessions in 25 de Mayo-Medanito S.E., Jagüel de los Machos and Río Neuquén production fields. We operate those three areas and hold a 100% stake in the 25 de Mayo-Medanito S.E. and Jagüel de los Machos production fields. As part of our agreement to extend our concessions, we agreed to transfer 5% of the rights and obligations arising from our concession in Rio Neuquén field to Empresa de Desarrollo Hidrocarburífero Provincial S.A. (EDHIPSA). As of the date of this Annual Report the transfer is still to be implemented.
On December 30, 2014, the legislature of the Province of Rio Negro also ratified its agreement with PELSA (as operator of the relevant area), to extend our concession in the Entre Lomas field for an additional 10 years.
88
On March 4, 2015, the Secretary of Energy of the Province of Salta granted us by Resolution 07/2015 an extension of the second exploration period of the Chirete concession area for a period of two years from the current expiration date. On March 19, 2015, the Board of Directors approved the transfer of a 50% stake in the Chirete area to the High Luck Group. The agreement is subject to approval by the authorities of the Province of Salta before it becomes effective.
On March 30, 2015, our Board of Directors approved the sale to CGC of our entire interest in the Austral Basin in Argentina, which includes our interest in the UTEs in Santa Cruz I, Santa Cruz I Oeste, Glencross and Estancia Chiripá, our assets associated with Santa Cruz II, Punta Loyola Pier and oil and gas pipelines operated in the basin, for a total price of U.S.$101 million and recognized income before income tax of Ps.674 million. The relevant concessions cover an area of 11,500 km2 and are located in the Province of Santa Cruz. Prior to transferring our interest in the concessions, our share of the Austral Basin’s daily combined oil and gas production was approximately 15,000 barrels of oil equivalent per day.
(8) Divestment of Distrilec
On January 30, 2013, we sold our 48.5% indirect interest in Distrilec, Edesur’s parent company, for U.S.$35 million and recorded a loss of P$34 million on that investment (see Note 17.1.1 to the Audited Consolidated Financial Statement).
89
DISCUSSION OF RESULTS
The table below presents our selected consolidated financial data for the fiscal years indicated.
| | | | | | | | | | | | |
| | | For the year Ended December 31, | |
| | | 2014 | | | 2013 | | | 2012 | |
| | | (in millions of pesos) | |
IFRS Summary Financial Data: | | | | | | | | | | | | |
Sales | | | 20,738 | | | | 15,340 | | | | 12,765 | |
Cost of sales | | | (14,490 | ) | | | (11,260 | ) | | | (9,619 | ) |
| | | | | | | | | | | | |
Gross profit | | | 6,248 | | | | 4,080 | | | | 3,146 | |
Administrative and selling expenses | | | (2,416 | ) | | | (1,797 | ) | | | (1,430 | ) |
Exploration expenses | | | (70 | ) | | | (82 | ) | | | (212 | ) |
Other operating expenses, net | | | (779 | ) | | | (571 | ) | | | (121 | ) |
Share of net loss of equity accounted investments | | | (1,735 | ) | | | (279 | ) | | | (148 | ) |
| | | | | | | | | | | | |
Operating income | | | 1,248 | | | | 1,351 | | | | 1,235 | |
Financial results | | | 72 | | | | 53 | | | | (70 | ) |
| | | | | | | | | | | | |
Income before income tax | | | 1,320 | | | | 1,404 | | | | 1,165 | |
Income tax | | | (742 | ) | | | (552 | ) | | | (492 | ) |
| | | | | | | | | | | | |
Net income | | | 578 | | | | 852 | | | | 673 | |
| | | | | | | | | | | | |
Net income attributable to: | | | | | | | | | | | | |
Shareholders of the Company | | | 458 | | | | 779 | | | | 618 | |
Non-controlling interest | | | 120 | | | | 73 | | | | 55 | |
| | | | | | | | | | | | |
Total | | | 578 | | | | 852 | | | | 673 | |
| | | | | | | | | | | | |
The following tables set out sales, gross profit (loss) and operating income for each of our business segments for the years ended December 31, 2014, 2013 and 2012. Sales eliminations relate to intersegment sales. Gross profit eliminations relate to adjustments to intersegment sales and costs associated with such sales. Intersegment transactions are made at market prices.
The business segment year-to-year comparisons that follow include intersegment sales.
| | | | | | | | | | | | |
| | | For the year ended December 31, | |
| | | 2014 | | | 2013 | | | 2012 | |
| | | (in millions of pesos) | |
Sales(1) | | | | | | | | | | | | |
Oil and Gas Exploration and Production | | | 10,553 | | | | 7,838 | | | | 6,113 | |
Refining and Distribution | | | 11,476 | | | | 8,146 | | | | 6,957 | |
Petrochemicals | | | 4,436 | | | | 3,348 | | | | 2,907 | |
Gas and Energy(2) | | | 3,487 | | | | 2,704 | | | | 2,522 | |
Corporate, Other and Eliminations | | | (9,214 | ) | | | (6,696 | ) | | | (5,734 | ) |
| | | | | | | | | | | | |
Total | | | 20,738 | | | | 15,340 | | | | 12,765 | |
| | | | | | | | | | | | |
Gross Profit (loss)(3) | | | | | | | | | | | | |
Oil and Gas Exploration and Production | | | 3,534 | | | | 2,337 | | | | 1,867 | |
Refining and Distribution | | | 1,308 | | | | 794 | | | | 573 | |
Petrochemicals | | | 810 | | | | 521 | | | | 224 | |
Gas and Energy(2) | | | 691 | | | | 486 | | | | 433 | |
Corporate, Other and Eliminations | | | (95 | ) | | | (58 | ) | | | 49 | |
| | | | | | | | | | | | |
Total | | | 6,248 | | | | 4,080 | | | | 3,146 | |
| | | | | | | | | | | | |
90
| | | | | | | | | | | | |
| | | For the year ended December 31, | |
| | | 2014 | | | 2013 | | | 2012 | |
| | | (in millions of pesos) | |
Operating Income | | | | | | | | | | | | |
Oil and Gas Exploration and Production | | | 735 | | | | 1,342 | | | | 1,072 | |
Refining and Distribution | | | 412 | | | | 216 | | | | 12 | |
Petrochemicals | | | 505 | | | | 306 | | | | 152 | |
Gas and Energy(2) | | | 557 | | | | 398 | | | | 548 | |
Corporate, Other and Eliminations | | | (961 | ) | | | (911 | ) | | | (549 | ) |
| | | | | | | | | | | | |
Total | | | 1,248 | | | | 1,351 | | | | 1,235 | |
| | | | | | | | | | | | |
| (1) | Royalties with respect to the oil and gas business in Argentina are accounted for as a cost of production and are not deducted in determining sales. |
| (2) | This segment includes Electricity and Gas Transportation. |
| (3) | Sales less cost of sales. |
91
YEAR ENDED DECEMBER 31, 2014 COMPARED TO YEAR ENDED DECEMBER 31, 2013
Net income attributable to shareholders of the Company: Net income attributable to our shareholders decreased by Ps.321 million, or 41%, to Ps.458 million in 2014 from Ps.779 million in 2013. This decrease was primarily the result of losses resulting from our share of net loss of equity accounted investments, partially offset by an increase in gross profit.
Sales: Sales increased by Ps.5.4 billion, or 35.2%, to Ps.20.7 billion from Ps.15.3 billion in 2013. We recorded increases of Ps.2.7 billion, Ps.3.3 billion, Ps.1.1 billion and Ps.0.8 billion in sales in our Oil and Gas Exploration and Production, Refining and Distribution, Petrochemicals, and Gas and Energy business segments, respectively. Inter-segment sales totaled Ps.9.2 billion in 2014 and Ps.6.7 billion in 2013. Most of these inter-segment sales were attributable to the Oil and Gas Exploration and Production, Refining and Distribution and Gas and Energy business segments.
Gross profit: Gross profit for 2014 increased by Ps.2.2 billion, or 53.1%, to Ps.6.2 billion from Ps.4.1 billion in 2013. We recorded increases of Ps.1,197 million, Ps.514 million and Ps.289 million in the gross profit of our Oil and Gas Exploration and Production, Refining and Distribution and Petrochemicals business segments, respectively.
Administrative and selling expenses: Administrative and selling expenses increased by Ps.619 million, or 34.4%, to Ps.2.4 billion from Ps.1.8 billion in 2013. We recorded increases of Ps.236 million, Ps.170 million and Ps.61 million in the administrative and selling expenses of our Refining and Distribution, Oil and Gas Exploration and Production and Petrochemicals business segments, respectively.
Exploration expenses:Exploration expenses totaled Ps.70 million in 2014 and Ps.82 million in 2013, representing a decrease of Ps.12 million, or 14.6%. The decrease is attributable to the incurrence of lower expenses for unsuccessful wells. See “—Analysis of Operating Income by Business Segment—Oil and Gas Exploration and Production.”
Other operating expenses, net: Other operating expenses, net increased by Ps.208 million, or 36.4%, and totaled Ps.779 million and Ps.571 million in 2014 and 2013, respectively. Other operating expenses, net of the Oil and Gas Exploration and Production segment, accounted for Ps.152 million of the increase.
Share of net loss of equity accounted investments: Our share of net losses of equity accounted investments increased by Ps.1.5 billion, to Ps.1.7 billion from Ps.0.3 billion in 2013, mainly attributable to an increased loss of Ps.1.5 billion in the Oil and Gas Exploration and Production business segment, caused by higher losses attributable to impairment charges (Ps.1.0 billion) and only partially offset by an improvement of Ps.53 million in the Refining and Distribution business segment. See “—Analysis of Share of Net Loss of Equity Accounted Investments.”
Operating income:Operating income decreased by Ps.103 million, or 7.6%, to Ps.1.2 billion from Ps.1.3 billion in 2013. This variation is mainly attributable to a decrease in the operating income of our Oil and Gas Exploration and Production business segment of Ps.0.6 billion in 2014, which was partially offset by increases of Ps.0.2 billion, Ps.0.2 billion and Ps.0.1 billion in the operating income of our Refining and Distribution, Petrochemicals and Gas and Energy business segments, respectively. See “—Analysis of Operating Income by Business Segment—Oil and Gas Exploration and Production.”
Financial results: Financial income accounted for a gain of Ps.72 million in 2014 compared to Ps.53 million in 2013. This 35.8% increase was mainly the result of the effect of the depreciation of the Argentine peso against the U.S. dollar on our net monetary asset position in foreign currency.
Income tax: Income tax charges for 2014 and 2013 totaled Ps.742 million and Ps.552 million, respectively. The 34.4% increase in tax charges was mainly due to the impairment of our investment in OCP, which was not deductible for tax purposes. This accounted for an increase in the effective income tax rate.
92
PESA’s business is mainly focused on the energy sector, through activities relating to oil and gas exploration and production, refining and distribution, petrochemicals and gas and energy. Assets and operating losses grouped under Corporate, Other and Eliminations, expenses not attributable to any other operating segment and intercompany eliminations are collectively shown. Corporate, Other and Eliminations includes expenses such as management fees, taxes on financial transactions, financial liability interests and income taxes, which are incurred by us in the ordinary course of operations.
ANALYSIS OF OPERATING INCOME BY BUSINESS SEGMENT
Oil and Gas Exploration and Production
Operating income: Operating income for the Oil and Gas Exploration and Production business segment decreased by Ps.607 million, or 45%, to Ps.0.7 billion from Ps.1.3 billion in 2013, mainly as a result of losses resulting from our share of net loss of equity accounted investments.
Sales: Sales for this business segment increased by Ps.2.7 billion, or 34.6%, to Ps.10.6 billion from Ps.7.8 billion in 2013.
Argentina
Sales in Argentina grew by Ps.2.7 billion, or 35.5%, to Ps.10.4 billion in 2014 from Ps.7.6 billion in 2013, primarily as a result of a 50% improvement in average sales prices, partially offset by a 9.7% decrease in total combined daily sales volumes of oil and gas, which averaged 77.7 thousand barrels of oil equivalent per day in 2014, compared to 86.1 thousand barrels per day in 2013.
Our total combined daily sales volumes decreased because of lower crude oil production, which was mainly attributable to the sale of our interest in the Puesto Hernández Joint Venture (UTE) in January 2014, the natural decline of mature fields and weather conditions that adversely affected production in 2014. These effects were partially offset by the start of production of new wells in the Medanito, Jagüel de los Machos and Estancia Agua Fresca fields.
Crude oil sales rose Ps.1.8 billion, or 28.5%, to Ps.8.3 billion from Ps.6.4 billion in 2013, mainly due to a 54.4% increase in average sales price to Ps.616 per barrel from Ps.399 per barrel in 2013, based on the increase in domestic prices permitted by Resolution No. 35/13. Sales volumes, however, totaled 36.7 thousand barrels per day in 2014 compared to 44.1 thousand barrels per day in 2013.
Gas sales rose Ps.861 million, or 74.2%, to Ps.2.0 billion from Ps.1.2 billion in 2013, primarily due to a 78.1% increase in average sales price to Ps.22.5 per thousand cubic feet from Ps.12.6 per thousand cubic feet in 2013, mainly attributable to greater production of non-conventional gas, sold at higher prices under applicable regulations in the Neuquén Basin. Average daily gas sales volumes were 246.1 million cubic feet and 251.7 million cubic feet in 2014 and 2013, respectively. Commencing production at our non-conventional gas wells in the Neuquén Basin allowed us to offset, in part, the natural decline of mature fields and the negative effects caused by weather conditions.
Outside of Argentina
Total sales for operations outside of Argentina increased by Ps.3 million, or 1.6%, to Ps.192 million from Ps.189 million, mainly attributable to operations in Bolivia.
Gross profit: Gross profit for this business segment increased by Ps.1.2 billion, or 51.2%, to Ps.3.5 billion in 2014 from Ps.2.3 billion in 2013. Our margin on sales was 33.9% and 29.8% in 2014 and 2013, respectively, mainly derived from operations in Argentina.
In 2014, gross profit attributable to operations in Argentina increased by Ps.1.2 billion, or 53.4%, to Ps.3.5 billion from Ps.2.3 billion, and margin on sales increased to 33.3% in 2014 compared to 29.4% in 2013, mainly due to the increase in sales prices, partially offset by increased production costs and lower sales volumes.
Gross profit for operations outside of Argentina decreased by Ps.5 million, or 5.9%, to Ps.80 million in 2014 from Ps.85 million in 2013, with a gross margin on sales of 41.7% and 45% in 2014 and 2013, respectively.
93
Administrative and selling expenses: Administrative and selling expenses increased by Ps.170 million, or 48.6%, to Ps.520 million in 2014 from Ps.350 million in 2013. This increase is mainly attributable to higher sales tax charges and transportation expenses derived from increased sales in 2014.
Exploration expenses: Exploration expenses decreased by Ps.12 million, or 14%, to Ps.70 million in 2014 from Ps.82 million in 2013. In 2014, these expenses were related to geological and geophysical survey expenses and the abandonment of on-shore exploration wells and the decrease was primarily a result of lower expenses for unsuccessful wells of Ps.11 million in 2014 compared to Ps.27 million in 2013.
Other operating expenses, net: Other operating expenses, net accounted for losses of Ps.379 million in 2014 compared to Ps.227 million in 2013. This increase was mainly attributable to higher environmental remediation expenses of Ps.166 million primarily as a consequence of the extension of concessions in Río Negro and impairment charges on fields in Bolivia of Ps.94 million, which were partially offset by a Ps.181 million gain derived from the sale of the Puesto Hernández Joint Venture (UTE).
Share of net loss of equity accounted investments: Our share of net loss of equity accounted investments was Ps.1.8 billion in 2014 compared to Ps.0.3 billion in 2013, mainly as a result of higher losses from impairment charges in mixed companies in Venezuela totaling Ps.1.4 billion in 2014 compared to Ps.0.4 billion in 2013.
Refining and Distribution
Operating income: Operating income for this business segment increased by Ps.196 million, or 90.7%, to Ps.412 million in 2014 from Ps.216 million in 2013, mainly as a result of an improvement in sales prices which more than offset the rise in production costs.
Sales: Sales for this business segment increased by Ps.3.3 billion, or 40.9%, to Ps.11.5 billion in 2014 from Ps.8.1 billion in 2013, mainly as a result of the increase in average sales prices for refined products and crude oil.
Sales volumes of crude oil totaled 220 thousand cubic meters in 2014 compared to 284 thousand cubic meters in 2013.
In 2014, Bahía Blanca Refinery processed an average of 27,068 oil barrels per day, accounting for 88.7% of its installed capacity. Processed volumes were 5.8% lower than in 2013, mainly due to the scheduled shutdowns for maintenance works performed during 2014. Our inventory management policy allowed us to meet demand in spite of the lower volumes processed.
Total sales volumes of refined products decreased by 105 thousand cubic meters, or 5.3%, to 1,857 thousand cubic meters in 2014 from 1,962 thousand cubic meters in 2013, in line with lower demand in 2014.
In 2014, sales volumes of diesel oil, gasoline, fuel oil, and IFO and other oil-related products totaled 784 thousand cubic meters, 491 thousand cubic meters, 394 thousand cubic meters and 188 thousand cubic meters, respectively.
In comparison, in 2013, sales volumes of diesel oil, gasoline, fuel oil, and IFO and other oil-related products totaled 782 thousand cubic meters, 554 thousand cubic meters, 480 thousand cubic meters and 146 thousand cubic meters, respectively.
Gross profit: Gross profit for this business segment increased by Ps.0.5 billion, or 64.7%, to Ps.1.3 billion in 2014 from Ps.0.8 billion in 2013, primarily due to an improvement in sales prices which more than offset the rise in production costs. As a result, margin on sales rose to 11.4% in 2014 from 9.7% in 2013.
Administrative and selling expenses: Administrative and selling expenses increased by Ps.236 million, or 32.4%, to Ps.964 million in 2014 from Ps.728 million in 2013, mainly as a consequence of higher selling expenses, such as maintenance expenses related to our own network of gas stations and taxes, associated with increased sales in 2014.
Other operating income (expenses), net: We incurred other operating expenses, net of Ps.29 million in 2014 compared to other operating income, net of Ps.106 million in 2013.
Share of net loss of equity accounted investments: Our share of profit of equity accounted investments in this business segment is attributable to our equity interest in Refinor, which accounted for a gain of Ps.97 million in 2014 as compared to a gain of Ps.44 million in 2013. This increase was mainly due to increases in fuel and LPG sales prices. See “—Analysis of Share of Net Loss of Equity Accounted Investments.”
94
Petrochemicals
Operating income: Operating income for this business segment increased by Ps.199 million, or 65%, to Ps.505 million in 2014 from Ps.306 million in 2013, primarily as a result of an increase in our sales margins.
Sales: Sales for this business segment increased by Ps.1.1 billion, or 32.5%, to Ps.4.4 billion in 2014 from Ps.3.3 billion in 2013, primarily as a consequence of a 45% rise in average sales prices, partially offset by an 8.7% decline in sales volumes.
Styrenic products sales increased by Ps.650 million to Ps.2.9 billion in 2014 from Ps.2.2 billion in 2013, mainly as a consequence of a 49.7% improvement in average sales prices, partially offset by a 13.8% decrease in sales volumes to 169 thousand tons in 2014 from 196.1 thousand tons in 2013.
In 2014, average sales prices in pesos in the styrene, polystyrene and synthetic rubber lines increased approximately 48.3%, 49.6% and 48.1%, compared to 2013, respectively.
Performance of the main styrenic products in 2014 was as follows:
Styrene sales volumes decreased by 18.9% to 71 thousand tons in 2014, mainly due to a decline in exports directed to Chile and Brazil and in domestic market sales.
Polystyrene and Bops (bi-oriented polystyrene) sales volumes totaled 58.4 thousand tons, a volume similar to that recorded in 2013, with 58.8 thousand tons, but with improved margins. The 10% drop in domestic sales was offset by a 51% increase in export sales, with higher margins.
Synthetic rubber sales volumes totaled 39.6 thousand tons, accounting for a 20.3% decline compared to 2013, mainly attributable to a 32% decrease in exports directed to Brazil and an 8% decline in domestic market sales.
Revenues from the catalytic reformer plant operations rose Ps.438 million, or 39.5%, to Ps.1.5 billion in 2014 from Ps.1.1 billion in 2013, mainly as a consequence of a 48.1% improvement in average sales prices, partially offset by a 5.8% decrease in sales volumes to 331.3 thousand tons in 2014 from 352 thousand tons in 2013. This decrease is mainly attributable to lower processed virgin naphtha volumes and reduced consumption of catalytic gasoline.
Gross profit: Gross profit for this business segment increased by Ps.289 million, or 55.5%, to Ps.810 million in 2014 from Ps.521 million in 2013, with a rise in margin on sales from 15.6% to 18.3% in 2014. This improvement is due to the combined effect of a higher average sales prices and an upgrade at Puerto General San Martín Reforming Plant that allowed us to manufacture higher added-value products. During 2014, we set an all-time high in sales volumes of propellant in the domestic market.
Administrative and selling expenses: Administrative and selling expenses for this business segment increased by Ps.61 million, or 39.4%, to Ps.216 million in 2014 from Ps.155 million in 2013, mainly as a consequence of higher selling expenses due to transport costs and taxes associated with increased sales in 2014.
Other operating expenses, net: Other operating expenses, net accounted for losses of Ps.89 million in 2014 and Ps.60 million in 2013. The Ps.29 million increase was mainly due to higher environmental remediation expenses.
Gas and Energy
Operating income: Operating income for this business segment increased by Ps.159 million, or 39.9%, to Ps.557 million in 2014 from Ps.398 million in 2013.
Gross profit: Gross profit for this business segment rose Ps.205 million, or 42.2%, to Ps.691 million in 2014 from Ps.486 million in 2013, mainly due to our electricity generation operations.
95
Administrative and selling expenses: Administrative and selling expenses increased by Ps.54 million, or 55.1%, to Ps.152 million in 2014 from Ps.98 million in 2013, mainly as a consequence of hydrocarbon marketing and transportation operations, which recorded increased selling expenses due primarily to taxes associated with higher sales in 2014.
Other operating income (expenses), net: We recorded other operating income, net of Ps.20 million in 2014 compared to other operating expenses, net of Ps.3 million in 2013. Our operating expenses in 2013 were mainly due to the adverse effect of a loss of Ps.34 million attributable to the sale of our equity interest in Distrilec.
Share of net loss of equity accounted investments: Share of net loss of equity accounted investments accounted for a loss of Ps.2 million in 2014 compared to a gain of Ps.13 million in 2013. Gains in 2013 were mainly attributable to the impact of the restructuring on the equity interest in CIESA. See “—Analysis of Share of Net Loss of EquityAccounted Investments.”
Electricity Generation
Operating income:Operating income for this business segment increased by Ps.180 million, or 60%, to Ps.480 million in 2014 from Ps.300 million in 2013.
The SE issued Resolution No. 95 in May 2013, which provided for regulatory changes retroactive to February 2013 in the MEM’s method of compensation of generation companies according to their production scale and technology, as well as centralization of contracts in CAMMESA, both of electric power and fuels and related supplies, resulting in lower sales and costs. This change affected the Genelba Combined Cycle and Pichi Picún Leufú Hidroelectric Complex. In May 2014, the SE, through Resolution No. 529, established tariff increases and additional compensation for generation companies, including Genelba, which were applied retroactively to February 2014, resulting in increased operating income.
Sales: Sales for electricity generation increased by Ps.46 million, or 3.4%, to Ps.1.4 billion in 2014, mainly as a result of an improvement in average sales prices (mainly attributable to the implementation of Resolution No. 529), which were partially offset by lower sales volumes. In this respect, sales volumes attributable to the Genelba, Pichi Picún Leufú, Genelba Plus and Ecoenergía power plants were 4,561 Gwh, 832 Gwh, 1,140 Gwh and 104 Gwh, respectively, totaling 6,637 Gwh in 2014 as compared to 7,748 Gwh in 2013. Lower sales volumes in 2014 were due to scheduled shutdowns for major maintenance works at the Genelba and Genelba Plus power plants and lower water supply at the Pichi Picún Leufú Hydroelectric Complex.
The availability factor and the reliability factor of Genelba, Genelba Plus, Pichi Picún Leufú and EcoEnergía power plants reached 99.6%, 99.9%, 100% and 95.2%, respectively. These levels are similar to those recorded in 2013.
Gross profit: In 2014, gross profit for this business segment increased by Ps.193 million, or 57.1%, to Ps.531 million in 2014 from Ps.338 million in 2013 and margin on sales attributable to all power plants rose to 37.6% in 2014 from 24.7% in 2013. The improvement in gross profit for this segment in 2014 was mainly attributable to the above-mentioned regulatory changes in the MEM and, to a lesser extent, to improved delivery by Pichi Picún Leufú power plant and sales under the Energía Plus regulatory framework.
Marketing and Transportation of Gas
Operating income: Operating income for this business segment decreased by Ps.15 million, or 16%, to Ps.79 million in 2014 from Ps.94 million in 2013.
Sales: Sales for this business segment increased by Ps.668 million, or 38.4%, to Ps.2.4 billion in 2014 from Ps.1.7 billion in 2013, mainly as a result of increased revenues from gas sales.
Revenues from gas sales increased by Ps.952 million, or 65.6%, to Ps.2.4 billion in 2014 from Ps.1.5 billion in 2013, mainly due to a 69.9% increase in average sales prices, which results from our sales of increased volumes from the Punta Rosada and El Mangrullo fields encompassed by the Gas Plus program and to an increased share of sales to industries with higher average sales prices. Sales volumes totaled 253.7 million cubic feet in 2014 and 260.3 million cubic feet in 2013. Liquid fuel sales to third parties that totaled Ps. 262 million in 2013, were recorded in 2014 under the Petrochemicals and Refining and Distribution segment due to changes in the allocation of liquid fuel sales.
Gross profit: Gross profit totaled Ps.160 million in 2014 as compared to Ps.148 million in 2013 and margin on sales decreased to 6.6% in 2014 from 8.5% in 2013.
96
ANALYSIS OF SHARE OF NET LOSS OF EQUITY ACCOUNTED INVESTMENTS
The table below shows our share of profit (loss) of equity accounted investments for 2014 and 2013.
| | | | | | | | |
| | | For the year ended December 31, | |
| | | 2014 | | | 2013 | |
| | | (in millions of pesos) | |
CIESA (Gas and Energy) | | | (6 | ) | | | 10 | |
Mixed companies in Venezuela (Oil and Gas E&P) | | | (1,385 | ) | | | (357 | ) |
Refinería del Norte S.A. (Refining and Distribution) | | | 97 | | | | 44 | |
OCP (Oil and Gas E&P) | | | (464 | ) | | | 19 | |
Others | | | 23 | | | | 5 | |
| | | | | | | | |
Total | | | (1,735 | ) | | | (279 | ) |
| | | | | | | | |
Our share of net loss of equity accounted investments increased by Ps.1.5 billion to Ps.1.8 billion in 2014 from Ps.279 million in 2013, mainly due to an increased loss of Ps.1.5 billion in the Oil and Gas Exploration and Production business segment, which was partially offset by an improvement of Ps.53 million in the Refining and Distribution business segment.
CIESA / TGS: In 2014, we recorded our share of net loss of equity in CIESA as a loss of Ps.6 million. In 2013, we recorded a gain of Ps.10 million for our share of profit of equity in CIESA. This change was mainly attributable to the impact of the restructuring on the equity interest in CIESA in 2013.
Mixed companies in Venezuela: Our share of net losses in mixed companies in Venezuela increased by approximately Ps.1.0 billion to Ps.1.4 billion from Ps.357 million in 2013. This increase is primarily the result of impairment charges of Ps.1.3 billion in 2014 compared to Ps.520 million in 2013.
Refinería del Norte S.A.: Our share of profit of equity in Refinor accounted for a gain of Ps.53 million, to Ps.97 million in 2014 compared to a gain of Ps.44 million in 2013, mainly as a result of an improvement in Refinor’s operating results, principally derived from the increase in average sales prices for refined products.
OCP: As of December 31, 2014, OCP had negative shareholders’ equity. PESA has not committed to make capital contributions or provide financial assistance to OCP; therefore, our equity interest in OCP was valued at zero and we recorded a net loss of Ps.464 million for 2014 after giving effect to the capitalization during 2014 of a credit we held against OCP.
97
YEAR ENDED DECEMBER 31, 2013 COMPARED TO YEAR ENDED DECEMBER 31, 2012
Net income attributable to shareholders of the Company: Net income attributable to the shareholders of the Company increased by Ps.161 million, or 26.1%, to Ps.779 million in 2013 from Ps.618 million in 2012.
Sales: Sales increased by Ps.2.6 billion, or 20.2%, to Ps.15.3 billion in 2013 from Ps.12.8 billion in 2012. Sales increased by Ps.1.7 billion, Ps.1.2 billion, Ps.441 million and Ps.182 million in the Oil and Gas Exploration and Production, Refining and Distribution, Petrochemicals, and Gas and Energy business segments, respectively. Intercompany sales totaled Ps.6.7 billion in 2013 and Ps.5.7 billion in 2012.
Gross profit: Gross profit for 2013 increased by Ps.934 million, or 29.7%, to Ps.4.1 billion from Ps.3.1 billion in 2012. Gross profit increased by Ps.470 million, Ps.297 million, Ps.221 million and Ps.53 million in the Oil and Gas Exploration and Production, Petrochemicals, Refining and Distribution, and Gas and Energy business segments, respectively.
Administrative and selling expenses: Administrative and selling expenses increased by Ps.367 million, or 25.7%, to Ps.1.8 billion in 2013 from Ps.1.4 billion in 2012, mainly as a consequence of increases of Ps.143 million, Ps.87 million and Ps.45 million in the Refining and Distribution, Oil and Gas Exploration and Production and Petrochemicals business segments, respectively.
Exploration expenses:Exploration expenses totaled Ps.82 million in 2013 and Ps.212 million in 2012 and are attributable to operations in Argentina. Expenses for both fiscal years are attributable to abandonment of on-shore wells. See “—Analysis of Operating Income by Business Segment—Oil and Gas Exploration and Production.”
Other operating expenses, net: Other operating expenses, net, totaled Ps.571 million and Ps.121 million in 2013 and 2012, respectively.
Other operating expenses for 2013 included losses of Ps.118 million attributable to the plant shutdown in 2013 and a loss of Ps.34 million as a result of the sale of Edesur’s shares in the first quarter of 2013. Other operating expenses for 2012 included a gain of Ps.221 million attributable to CIESA’s debt restructuring.
Share of net loss of equity accounted investments: Our share of net loss of equity accounted investments increased by Ps.131 million in 2013, to Ps.279 million in 2013 from Ps.148 million in 2012, mainly attributable to an increased loss of 210 in the Oil and Gas Exploration and Production business segment, only partially offset by improvements of Ps.46 million and Ps.33 million in the Gas and Energy and Refining and Distribution business segments, respectively. See “—Analysis of Share of Net Loss of Equity Accounted Investments.”
Operating income: Operating income increased by Ps.116 million in 2013 to Ps.1.4 billion, from Ps.1.2 billion in 2012. Operating income increased by Ps.270 million, Ps.204 million and Ps.154 million in the Oil and Gas Exploration and Production, Refining and Distribution and Petrochemicals business segments, respectively, and declined by Ps.150 million in 2013 for the Gas and Energy business segment.
Financial results: Financial results accounted for a gain of Ps.53 million in 2013 compared to a loss of Ps.70 million in 2012. This improvement is basically attributable to improved performance of financial assets, with a net monetary asset position in foreign currency, and, to a lesser extent, a lower financial debt burden as a consequence of the Company’s debt reduction policy.
Income tax:Income tax charges totaled Ps.552 million and Ps.492 million in 2013 and 2012, respectively, consistent with an improvement in our results of operations in 2013.
98
PESA’s business is mainly focused on the energy sector, through activities relating to oil and gas exploration and production, refining and distribution, petrochemicals and gas and energy. Assets and operating losses related to the Corporate segment, expenses not attributable to any other operating segment and intercompany eliminations are collectively shown. The Corporate segment includes expenses such us management fees, taxes on financial transactions, financial liabilities interests and income taxes, which are incurred by us in the ordinary course of operations.
ANALYSIS OF OPERATING INCOME BY BUSINESS SEGMENT
Oil and Gas Exploration and Production
Operating income:Operating income for the Oil and Gas Exploration and Production business segment increased by Ps.270 million, or 25.2%, to Ps.1.3 billion from Ps.1.1 billion in 2012.
Sales: Sales increased by Ps.1.7 billion, or 28.2%, to Ps.7.8 billion in 2013 from Ps.6.1 billion in 2012, mainly due to the improvement recorded in our results of operations in Argentina for 2013.
Argentina
Sales attributable to our operations in Argentina increased by Ps.1.7 billion, or 28.7%, to Ps.7.6 billion in 2013 from Ps.5.9 billion in 2012.
Consolidation of PELSA’s operations as from June 1, 2012 resulted in the recognition of sales of Ps.1.7 billion in 2013 and Ps.869 million in 2012. Excluding these effects, oil and gas sales increased by Ps.867 million to Ps.6 billion from Ps.5.1 billion, mainly as a result of a 29.5% rise in average sales prices. The combined daily sales volumes of oil and gas, however, decreased by 8.9%, averaging 86.1 thousand boes per day.
Lower production of both oil and gas is primarily attributable to the natural decline of mature fields. This effect was partially offset by an increase in production volumes derived from new wells in Medanito and Jagüel de los Machos.
Crude oil sales rose Ps.681 million, or 16.1%, to Ps.4.9 billion from Ps.4.2 billion in 2012, mainly due to a 24% increase in the average sales price (driven by increases in domestic prices) to Ps.392 per barrel from Ps.316 per barrel. Sales volumes totaled 34.2 thousand barrels per day in 2013, compared to 36.4 thousand barrels per day in 2012.
Gas sales rose Ps.209 million, or 25.1%, to Ps.1 billion from Ps.832 million, primarily due to a 41.5% increase in the sales price to Ps.12.2 per thousand cubic feet from Ps.8.6 per thousand cubic feet, mainly due to recognition of a higher price (under the Gas Plus program) sold from the Neuquén Basin to industries and trading companies. Daily gas sales volumes totaled 234.1 million cubic feet and 264.1 million cubic feet in 2013 and 2012, respectively.
Outside of Argentina
Total sales volumes for operations outside of Argentina increased by Ps.17 million, or 9.9%, to Ps.189 million in 2013 from Ps.172 million in 2012, mainly attributable to operations in Bolivia and Mexico.
Gross profit: Gross profit increased by Ps.470 million, or 25.2%, to Ps.2.3 billion in 2013 from Ps.1.9 billion in 2012. Our margin on sales was 29.8% and 30.5% in 2013 and 2012, respectively.
Consolidation of PELSA’s operations accounted for a gross profit of Ps.642 million in 2013 and Ps.355 million in 2012. Excluding these effects, gross profit rose Ps.183 million to Ps.1.7 billion from Ps.1.5 billion and margin on sales decreased to 27.6% in 2013 from 28.8% in 2012, mainly due to operations in Argentina.
In 2013, gross profit attributable to operations in Argentina increased Ps.173 million, or 12%, to Ps.1.6 billion from Ps.1.4 billion, although margin on sales declined to 27% in 2013 from 28.3% in 2012, mainly due to increased production costs and lower sales volumes, which were mitigated by the partial recovery of sales prices.
Gross profit for operations outside of Argentina rose Ps.17 million, or 9.9%, to Ps.85 million from Ps.75 million, with a gross margin on sales of 45% and 43.6%, respectively.
Administrative and selling expenses: Administrative and selling expenses increased by Ps.87 million, or 33% to Ps.350 million in 2013 from Ps.263 million in 2012, mainly as a consequence of consolidation of PELSA’s operations, which accounted for Ps.128 million and Ps.61 million in 2013 and 2012, respectively.
99
Exploration expenses:Exploration expenses decreased Ps.130 million, or 61%, to Ps.82 million in 2013 from Ps.212 million in 2012, as a result of higher expenses for abandonment of on-shore exploration wells in 2012. Expenses for unsuccessful wells totaled Ps.27 million in 2013 compared to Ps.168 million in 2012.
Other operating expenses, net: Other operating expenses, net, totaled Ps.227 million and Ps.194 million in 2013 and 2012, respectively.
Share of net loss of equity accounted investments: Our share of net loss of equity accounted investments totaled Ps.336 million in 2013 and Ps.126 million in 2012, mainly derived from investments in Mixed Companies in Venezuela. See “—Analysis of Share of Net Loss of Equity Accounted Investments.”
As from June 1, 2012 we acquired the control of PELSA. Until May 31, 2012 we recognized equity in the earnings of PELSA by applying the equity method of accounting, with a gain of Ps.26 million in the five-month period ended May 31, 2012.
Refining and Distribution
Operating income:Operating income increased by Ps.204 million, to Ps.216 million in 2013 from Ps.12 million in 2012.
Sales: Sales increased by Ps.1.2 billion, or 17.1%, to Ps.8.1 billion in 2013 from Ps.7.0 billion in 2012, mainly as a consequence of an increase in average sales prices of about 26% in refined products, partially offset by lower sales volumes of crude oil.
In 2013, the Bahía Blanca Refinery processed 28,730 oil barrels per day, accounting for a 94.2% of its installed capacity, in line with the 28,722 barrel-per-day volume processed in 2012.
Crude oil sales to third parties dropped by Ps.224 million, or 25.8%, to Ps.702 million in 2013 from Ps.946 million in 2012, mainly due to a decline in volumes sold.
Volumes of refined products sold totaled 1,962 thousand cubic meters in 2013 and 1,992 thousand cubic meters in 2012.
In 2013, sales volumes of diesel, gasoline, fuel oil, and IFO and other oil-related products totaled 782 thousand cubic meters, 554 thousand cubic meters, 480 thousand cubic meters and 146 thousand cubic meters, respectively, compared to 791 thousand cubic meters, 547 thousand cubic meters, 461 thousand cubic meters and 194 thousand cubic meters, respectively, in 2012.
Gross profit: Gross profit increased by Ps.221 million, or 38.6%, to Ps.794 million in 2013 from Ps.573 million in 2012, primarily due to an improvement in sales prices which more than offset the rise in production costs. As a result, margin on sales rose to 9.7% in 2013 from 8.2% in 2012.
Administrative and selling expenses: Administrative and selling expenses increased by Ps.143 million, or 24%, to Ps.728 million in 2013 from Ps.585 million in 2012, mainly as a consequence of higher selling expenses, basically freights and gross revenue taxes, associated with increased sales in 2013.
Other operating expenses, net: Other operating expenses, net, accounted for gains of Ps.106 million in 2013 and Ps.13 million in 2012.
Share of net loss of equity accounted investments: Earnings resulting from our share of profit of equity accounted investments is attributable to equity interest in Refinor, which accounted for gains of Ps.44 million in 2013 and Ps.11 million in 2012. Volumes of crude oil processed, mainly directed to export markets, rose 12.5%. See “—Analysis of Share of Net Loss of Equity Accounted Investments.”
Petrochemicals
Operating income:Operating income increased by Ps.154 million, to Ps.306 million in 2013 from Ps.152 million in 2012.
Sales: Sales increased by Ps.441 million, or 15.2%, to Ps.3.3 billion in 2013 from Ps.2.9 billion in 2012, primarily as a consequence of a 26% rise in average sales prices, which was partially offset by a decline in sales volumes.
Styrene product sales increased by Ps.345 million to Ps.2.2 billion in 2013 from Ps.1,9 billion in 2012, mainly as a consequence of a 25% improvement in average sales prices. The increase was partially offset by a 5.5% decrease in sales volumes to 196.1 thousand tons in 2013 from 207,6 thousand tons in 2012.
In 2013, average sales prices in pesos in the styrene and polystyrene lines increased approximately 38% compared to 2012. As regards synthetic rubber, while butadiene international prices sharply dropped, prices in pesos declined only 1.5%.
100
Performance of the main styrenic products in 2013 was as follows:
a) Styrene sales volumes decreased 1% to 68.4 thousand tons in 2013 due to lower production as a consequence of a plant scheduled shutdown in March and an unscheduled shutdown in July for polymerization of the recycle tower. Placing priority on the domestic market, the Company increased sales in the domestic market by 7%, directed to EPS (Expanded PolyStyrene) and Polyester Resin, partially offsetting a 12% drop in exports.
b) Propane, propylene and ethylene sales volumes totaled 19.1 thousand tons, accounting for a 25% decrease. This decline is attributable to lower styrene production and consumption of our own propane instead of acquired raw material.
c) Polystyrene and Bops (bi-oriented polystyrene) sales volumes totaled 58.8 thousand tons, accounting for an 11.6% decline attributable to lower production as a consequence of trade union conflicts at the Zárate Plant between March and June 2013. Sales in the domestic market increased 1% as a consequence of the substitution of the Company’s own production with imported products. Imports of polystyrene totaled 12.5 thousand tons and 0.4 thousand tons in 2013 and 2012, respectively.
d) Synthetic rubber sales volumes totaled 49.7 thousand tons, accounting for a 7.1% rise compared to 2012.
Revenues from the catalytic reformer plant operations rose Ps.96 million, or 9.5%, to Ps.1,110 million from Ps.1,014 million in 2012, mainly as a consequence of a 22.1% improvement in the average sales prices, partially offset by a 10.3% decrease in sales volumes to 352 thousand tons in 2013 from 392 thousand tons in 2012. This decline is attributable to reduced raw material availability.
Gross profit: Gross profit increased by Ps.297 million to Ps.521 million in 2013 from Ps.224 million in 2012, with a rise in margin on sales from 7.7% to 15.6% in 2013. This improvement is due to the combined effect of a recovery of average sales prices, an improvement in styrene international spreads and an upgrade at the PGSM Plant that allowed to boost production with increased added value by replacing imported aromatics with the Company’s own production.
Administrative and selling expenses: Administrative and selling expenses increased by Ps.45 million, to Ps.155 million in 2013 from Ps.110 million in 2012, mainly as a consequence of higher selling expenses, basically freights and gross revenue taxes, the latter associated with increased sales in 2013.
Other operating expenses, net: Other operating expenses, net, accounted for a loss of Ps.60 million in 2013 compared to a gain of Ps.38 million in 2012, as a consequence of expenses for plant shutdowns in 2013.
Gas and Energy
Operating income:Operating income for the Gas and Energy business segment (which is comprised of Electricity Generation and Marketing and Transportation of Gas, as discussed below) decreased by Ps.150 million, or 27.4%, to Ps.398 million from Ps.548 million in 2012. Eliminations relating to sales between the Electricity Generation and Marketing and Transportation of Gas segments accounted for Ps.4 million and Ps.(60) million, in 2013 and 2012, respectively.
Gross profit: Gross profit in 2013 increased by Ps.53 million, or 12.2%, to Ps.486 million from Ps.433 million in 2012, mainly in Electricity Generation operations.
Administrative and selling expenses: Administrative and selling expenses increased by Ps.22 million, to Ps.98 million in 2013 from Ps.76 million in 2012, mainly as a consequence of hydrocarbon marketing and transportation operations with increased selling expenses, basically gross revenue taxes, associated with higher sales in 2013.
Other operating expenses, net: Other operating expenses, net, totaled Ps.3 million in 2013 compared to a gain of Ps.224 million in 2012, attributable to a gain of Ps.221 million derived from the restructuring of CIESA’s debt. In 2013, the Company recorded a loss of Ps.34 million from the sale of Edesur’s shares in the first quarter of 2013.
Share of net loss of equity accounted investments: Share of profit of equity accounted investments totaled a gain of Ps.13 million in 2013 compared to a loss of Ps.33 million in 2012. Gains in 2013 are mainly attributable to the impact of the restructuring on the equity interest in CIESA /TGS. See “—Analysis of Share of Net Loss of Equity Accounted Investments.”
During 2012, we recorded a loss of Ps.253 million attributable to a deterioration of Edesur’s operating results, which were adversely affected by an increase in costs. These effects were partially offset by gains attributable to the impact of the restructuring on equity interest in CIESA, resulting in a gain of Ps.165 million deriving from its debt restructuring in July 2012.
Electricity Generation
Operating income:Operating income increased by Ps.42 million, or 16.3%, to Ps.300 million in 2013 from Ps.258 million in 2012.
101
As from May 2013, retroactive to February 2013, Resolution No. 95 issued by the SE provided for regulatory changes in the MEM’s method of compensation of generation companies according to their production scale and technology. This change affected the Genelba Combined Cycle and Pichi Picún Leufú Hidroelectric Complex.
These regulatory changes generated: (i) an equivalent lower level of sales and costs, and (ii) an improvement in gross profit, derived from the new compensation scheme based on the generator’s production scale, technology and availability.
Sales: Sales decreased by Ps.252 million, or 37%, to Ps.1.3 billion in 2013 from Ps.1.6 billion in 2012, mainly due to the implementation of the above mentioned regulatory changes in the MEM, retroactive to February 2013, which were only partially offset by an increased generation level in Pichi Picún Leufú and Ecoenergía Power Plants.
Genelba Plus sales increased by Ps.61 million, or 13.8%, to Ps.504 million in 2013 from Ps.443 million in 2012, as a consequence of an improvement in average sales prices. Sales volumes were similar in both fiscal years, nearing 1,300 GWh.
Genelba power plant sales decreased by Ps.292 million, or 37%, to Ps.495 million in 2013 from Ps.787 million in 2012. Electricity sales for 2013 dropped 4.8% to 5,258GWh from 5,520 GWh in 2012, principally due to scheduled maintenance works performed in 2013. Within this context, the Genelba power plant’s availability factor and the plant factor were 93% and 95% in 2013 and 99.1% and 95.7% in 2012, respectively.
Sales attributable to HPPL increased by Ps.20 million, or 16.4%, to Ps.142 million in 2013 from Ps.122 million in 2012. Sales volumes rose 22.6% to 1,092 GWh in 2013 from 891 GWh in 2012, partly due to higher water supply in the Comahue Basin in 2013.
Sales attributable to Ecoenergía increased Ps.28 million to Ps.39 million from Ps.11 million in 2012 since the Power Plant operated under the Energía Plus regulatory framework throughout 2013. Sales volumes rose 29 GWh to 97 GWh from 68 GWh in 2012.
Gross profit: In 2013, gross profit increased by Ps.53 million, or 18.6%, to Ps.338 million from Ps.285 million in 2012and margin on sales attributable to all power plants rose to 24.7% in 2013 from 17.6% in 2012. The improvement in 2013 is mainly attributable to the above mentioned regulatory changes in the MEM and, improved delivery by the Pichi Picún Leufú Power Plant and sales under the Energía Plus regulatory framework.
Marketing and Transportation of Gas
Operating income: Operating income decreased Ps.256 million, or 73.1%, to Ps.94 million in 2013 from Ps.350 million in 2012.
Sales:Sales revenues rose Ps.284 million, or 19.5%, to Ps.1.7 billion in 2013 from Ps.1.4 billion in 2012, mainly as a result of increased revenues from gas sales, partially offset by a decline in liquid fuel sales. Gas and LPG brokerage services totaled Ps.27 million in 2013 and Ps.28 million in 2012.
Revenues from gas sales increased by Ps.314 million, or 27.6%, to Ps.1.4 billion from Ps.1.1 billion in 2012, mainly due to a 41.9% increase in average sales prices, partially offset by a decline in sales volumes to 260 thousand cubic feet in 2013 from 289 thousand cubic feet in 2012. The improvement in average sales prices was mainly attributable to increased volumes from Punta Rosada and El Mangrullo field operations performed under the Gas Plus program and to an increased share of sales to industries with higher average sales prices.
Revenues from liquid fuel sales dropped Ps.29 million, or 10%, to Ps.262 million in 2013 from Ps.291 million in 2012, mainly due to a 29.9% decline in sales volumes to 96 thousand tons in 2013 from 137 thousand tons in 2012, as a result of: (i) failure to obtain permits for exports from El Cóndor Plant; (ii) use of part of the Company’s own propane production as input to replace purchases from third parties; (iii) discontinuance of propane sales to industries due to the lack of product availability and (iv) shutdowns for maintenance works at PGSM Plant. These effects were partially offset by an improvement in average sales prices.
Gross profit: Gross profit totaled Ps.148 million in 2013 and gross margin on sales decreased to 8.5% in 2013 from 10.2% in 2012.
102
ANALYSIS OF SHARE OF NET LOSS OF EQUITY ACCOUNTED INVESTMENTS
The table below shows the Company’s share of profit (loss) of equity accounted investments for 2013 and 2012.
| | | | | | | | |
| | | For the year ended December 31, | |
| | | 2013 | | | 2012 | |
| | | (in millions of pesos) | |
CIESA (Gas and Energy) | | | 10 | | | | 219 | |
Distrilec S.A. (Gas and Energy) | | | — | | | | (253 | ) |
Mixed companies in Venezuela (Oil and Gas E&P) | | | (357 | ) | | | (162 | ) |
Petrolera Entre Lomas S.A. (Oil and Gas E&P) | | | — | | | | 26 | |
Refinería del Norte S.A. (Refining and Distribution) | | | 44 | | | | 11 | |
Others | | | 24 | | | | 11 | |
| | | | | | | | |
Total | | | (279 | ) | | | (148 | ) |
| | | | | | | | |
Our share of net loss of equity accounted investments increased by Ps.131 million in 2013, from Ps.148 million in 2012 to Ps.279 million in 2013, mainly as a result of a reduced gain derived from CIESA and greater losses from mixed companies inVenezuela. These effects were partially offset by losses resulting from Distrilec in 2012.
CIESA / TGS: In 2013 and 2012, our share of profit of equity in CIESA accounted for gains of Ps.10 million and Ps.219 million, respectively. The improvement in 2012 was mainly attributable to the positive effects of the restructuring of CIESA’s debt in July 2012, resulting in the recognition of a gain of Ps.165 million.
Distrilec / EDESUR: Our share of net loss of equity in Distrilec accounted for losses of Ps.253 million in 2012, mainly attributable to the deterioration of EDESUR’s operating results, which were adversely affected by an increase in operating costs without a corresponding recognition and passing through of such increased costs to tariffs. In January 30, 2013, we sold our interest in Distrilec.
Mixed companies in Venezuela: Our share of net loss of equity in mixed companies in Venezuela accounted for losses of Ps.357 million and Ps.162 million in 2013 and 2012, respectively, which included writedowns of Ps.520 million and Ps.285 million in 2013 and 2012, respectively.
Refinería del Norte S.A.: Our share of profit of equity in Refinor accounted for a increase in gains of Ps.33 million in 2013, to a gain of Ps.44 million in 2013 from a gain of Ps.11 million in 2012, mainly as a result of an improvement in Refinor’s operating results, principally derived from a 12.5% increase in volumes of crude oil processed, mainly directed to export markets.
PELSA: As of June 1, 2012 the Company acquired control of PELSA. Until May 31, 2012, the Company recognized share of profit of equity in PELSA by applying the equity method of accounting, with gains of Ps.26 million in the five-month period ended May 31, 2012.
103
CRITICAL ACCOUNTING POLICIES
The preparation of financial statements in conformity with IFRS requires management to make judgments, estimates and assumptions that affect the application of accounting policies and the reported amounts of assets, liabilities, income and expenses. Changes in facts and circumstances or discovery of new information may result in revised estimates and actual results may differ from these estimates.
Estimates and underlying assumptions are reviewed on an ongoing basis. Revisions to accounting estimates are recognized in the period in which the estimates are revised and in any future periods affected.
The following summary provides more information about the critical accounting policies that could have a significant impact on our results and should be read in conjunction with the Notes to our Audited Consolidated Financial Statements. Our accounting policies are more fully described in Notes 2 and 3 to our Audited Consolidated Financial Statements.
Estimates of Oil and Gas Reserves
Evaluations of oil and gas reserves are important for the effective management of upstream assets. They are used to make investment decisions about oil and gas properties. Oil and gas reserves quantities are also used as the basis for calculation of unit-of-production rates for depreciation of the related oil and gas assets and evaluation for impairment of our investments in upstream assets.
Estimates of oil and gas reserves have been prepared in accordance with Rule 4-10 of Regulation S-X, promulgated by the SEC.
“Reserves” means oil and gas volumes (in cubic meters of oil equivalent) that are economically producible, in the areas where we operate or have a (direct or indirect) interest and over which we have exploitation rights, including oil and gas volumes related to those service agreements under which we have no ownership rights on the reserves or the hydrocarbons obtained, and those estimated to be produced for the contracting company under service contracts.
There are numerous uncertainties in estimating proved reserves and future production profiles, development costs and prices, including several factors beyond the producer’s control. Reserves engineering is a subjective process of estimating underground accumulations involving a certain degree of uncertainty. Reserves estimates depend on the quality of the available engineering and geological data as of the estimation date and on the interpretation and judgment thereof.
Reserves estimates are adjusted when so justified by changes in the evaluation criteria, or at least once a year. These reserves estimates have considered the estimations of oil and gas consulting professionals.
Downward revision in our reserves estimates may result in: (a) higher depreciation and depletion charges in future periods, and/or (b) an immediate write-down of an asset’s book value. If, on the other hand, the oil and gas reserves quantities were to be revised upward, our per barrel depreciation and depletion expense would be lower. Changes in proved oil and gas reserves will also affect the standardized measure of discounted cash flows presented under Item 18 of Form 20-F.
Impairment of Assets
Property, plant and equipment
As of December 31, 2014, our property, plant and equipment, net of accumulated depletion, amounted to Ps.11.6 billion.
Our management assesses the recoverability of property, plant and equipment items whenever events or changes in circumstances (including significant decreases in the market value of assets, in the prices of the main products we sell or in oil and gas reserves, as well as changes in the regulatory framework for our activities, significant increases in operating expenses, or evidence of obsolescence or physical damage) indicate that the carrying amount may not be recoverable. The book value of property, plant and equipment asset is adjusted down to its recoverable value if its carrying amount exceeds the latter.
From a regulatory standpoint, recoverable value is defined as the higher of (i) fair value less costs of disposal and (ii) value in use, the latter being defined as the addition of the discounted expected net cash flows that arise as a direct result of the use and eventual final disposition of the assets. To such end, among other elements, the assumptions that represent the best estimate made by management of the economic conditions that will prevail throughout the useful life of the assets are considered.
For the purpose of assessing recoverability of non-financial assets, assets are grouped at the lowest levels for which there are individually identifiable cash flows (cash generating units). For this purpose, each associate and joint venture is considered a cash generating unit.
The methodology used for estimating the recoverable amount of assets mainly consists of determining the value in use.
104
Discount rates used to calculate the value in use are the respective weighted average cost of capital (“WACC”). For each asset or cash generating unit, a specific WACC is determined that considers the business segment and the country conditions where the operations are performed.
In subsequent periods, reversal of an impairment charge is evaluated if there are changes in the assumptions used to determine the asset recoverable value. In such a case, the book value of the asset or cash generating unit is written up to the lower of: (a) the book value that the asset or cash generating unit would have had if the impairment had never been recognized; and (b) its recoverable value.
As of December 31, 2014 and 2013, we recognized impairment charges of Ps. 97 million and Ps.11 million, respectively, on property, plant and equipment.
As of December 31, 2012, we did not recognize any impairment charge on property, plant and equipment.
Equity accounted investments
The recoverability of investments is highly sensitive to crude oil price volatility, to economic, social and regulatory changes and, particularly, to resulting business plans. In determining the recoverable value of our investments, we use our management’s best assumptions regarding prices based on business plans, production curves, transaction costs at market value and investment needs to develop reserves for equity accounted investments. Discount rates used to measure recoverable value consider the type of asset involved, the business segment and the country where operations are conducted. Our estimates are inherently imprecise because they reflect our management’s expectation of future conditions that are often outside our management’s control.
In 2014, 2013 and 2012, we recognized impairment charges for our equity accounted investments in mixed companies in Venezuela totaling Ps.1,342 million, Ps.520 million and Ps.285 million, respectively. Additionally, in 2014, we recognized impairment charges of Ps.464 million for our equity accounted investment in OCP.
Successful Efforts Method of Accounting and Well Abandonment Liabilities
We use the successful efforts method of accounting for our oil and gas exploration and production activities. This method involves the capitalization of: (i) the cost of acquiring properties in oil and gas exploration and production areas: (ii) the cost of drilling and equipping exploratory wells that result in the discovery of commercially recoverable reserves; (iii) the cost of drilling and equipping development wells; and (iv) the estimated future costs of well abandonment and restoration.
According to the successful efforts method of accounting, exploration costs, excluding exploratory well costs, are expensed during the period in which they are incurred. Drilling costs of exploratory wells are capitalized until a determination is made on whether the drilling resulted in proved reserves that justify the commercial development. If reserves are not found, such drilling costs are expensed. Occasionally, we may determine the existence of oil and gas reserves in an exploratory well, but the reserves cannot be classified as proved because drilling is complete. In those cases, such costs continue to be capitalized insofar as it is determined that sufficient reserves exist to warrant the well’s completion as a production well and we are making sufficient progress in evaluating the economic and operating feasibility of the project. Expenses for unsuccessful wells totaled Ps.11 million, Ps.27 million and Ps.168 million in 2014, 2013 and 2012, respectively. As of December 31, 2014, we maintained capitalized exploratory well costs amounting to Ps.617 million.
Estimated future well abandonment and restoration costs in hydrocarbons areas, discounted at a current rate, are capitalized in the cost of the assets and depreciated using the units of production method. Additionally, a liability at the estimated value of the discounted amounts payable is recognized. Well abandonment liabilities when operations cease give rise to the estimation of quantity of wells, time and amount of abandonment costs by our management. Technology costs and political, environmental and safety considerations constantly change and may result in differences between actual future costs and estimates.
Contingencies
We are subject to various claims, lawsuits and other legal proceedings that arise during the ordinary course of our business. Our liabilities with respect to such claims, lawsuits and other legal proceedings cannot be estimated with certainty. Periodically, our management reviews the status of each contingency and assesses the potential financial liabilities, for which it develops estimates with the assistance of legal advisors.
Contingencies include outstanding lawsuits or claims for possible damages caused to third parties in the ordinary course of our business, as well as third party claims arising from disputes concerning the interpretation of legislation.
105
We evaluate whether there would be additional expenses directly associated with the ultimate resolution of each contingency, which are to be included in a provision if they are reasonably estimable. If the assessment indicates that a potential loss contingency is not probable but is reasonably possible, or is probable but cannot be estimated, then the nature of the contingent liability, together with an estimate of the possibility of occurrence, is disclosed in a note to the financial statements. Loss contingencies considered remote are not disclosed unless they involve guarantees, in which case the nature of the guarantee is disclosed.
Changes in the facts or circumstances related to these types of contingencies, as well as the future outcome of these disputes, can have a significant effect on the amount of provisions for contingencies recorded. As of December 31, 2014, contingent liabilities in our financial statements (including current and non-current) amounted to Ps.321 million.
Environmental costs
The costs incurred to limit, neutralize or prevent environmental pollution are only capitalized if at least one of the following conditions is met: (a) such costs relate to improvements in safety; (b) the risk of environmental pollution is prevented or limited; or (c) the costs are incurred to prepare the assets for sale and the book value (which considers those costs) of such assets does not exceed their respective recoverable value.
Liabilities related to future remediation costs are recorded when, on the basis of environmental assessments, it is probable that such liabilities will materialize, and costs can be reasonably estimated. The actual recognition and amount of these provisions are generally based on our commitment to an action plan, such as an approved remediation plan or the sale or disposal of an asset. The provision is recognized on the basis that a future remediation commitment will be required.
We measure liabilities based on our best estimation of the present value of future costs, using currently available technology and applying current environmental laws and regulations as well as our own internal environmental policies.
Changes in the facts or circumstances related to these types of liabilities may give rise to differences between actual future costs and estimates. As of December 31, 2014, reserves for environmental remediation (including current and non-current) amounted to Ps.343 million.
Employee defined benefits
Actuarial commitments to employee benefit plans are recognized as liabilities in the statement of financial position based on actuarial estimates revised annually by an independent actuary, using the projected unit credit method. The present value of pension plan obligations depends on multiple factors that are determined according to actuarial estimates which are revised annually by an independent actuary, net of the fair value of the plan assets, when applicable. To such effect, certain assumptions are used including the discount rate and wage growth rate assumptions.
Changes in assumptions related to these types of liabilities may give rise to differences between actual future costs and estimates. As of December 31, 2014, related benefit liabilities amounted to Ps.438 million.
106
LIQUIDITY AND CAPITAL RESOURCES
The default on Argentine sovereign debt at the end of 2001, the global financial crisis and related decline in global stock markets as well as the insolvency of major financial institutions toward the end of 2008, and the current global economic slowdown, among other factors, have all significantly limited the ability of Argentine companies to access international financial markets at reasonable cost and conditions. See “Item 3. Key Information—Risk Factors.”
In previous years, we had regularly obtained financing from the private pension fund system in Argentina, which had been a significant participant in the domestic capital market and a subscriber of issuances of our debt. However, in November 2008 the Argentine Congress enacted a law eliminating the private pension system, mandating that funds administered by the AFJP, be transferred to a new administrator, the ANSES. The nationalization of private pension funds and the transfer of their assets to a state-run administrator led to a decline in liquidity in the local capital markets, and further limited the sources of financing for Argentine companies, including us.
In response to the limited availability of financing for Argentine companies, we closely monitor our liquidity levels in order to ensure compliance with our financial obligations and achieve our profitability objectives.
Our ability to execute and carry out our strategic business plan depends upon our ability to obtain financing at a reasonable cost and on reasonable terms. Along these lines, and as a guiding principle, financial solvency is the foundation on which sustainable development of our businesses is built.
Pursuant to these strategic guidelines, we seek to:
| | • | | Design a capital structure consistent with industry standards adaptable to the financial markets in which we operate; |
| | • | | Maintain a liquidity level—invested in financial assets with high credit quality—that allows us to meet our obligations; |
| | • | | Maintain a debt maturity profile consistent with projected cash generation; and |
| | • | | Efficiently manage borrowing costs. |
Adhering to these guidelines enables us to treat financial management as a key element in the value-creation process.
Financial management highlights for the 2014 fiscal year include:
| | • | | Full compliance with all financial liabilities, maintaining our level of indebtedness at approximately U.S.$300 million; and |
| | • | | Continued implementation of our capital expenditures plan. |
The most significant factors generally affecting our cash flow from operating activities are: fluctuations in prices for crude oil and oil related products; fluctuations in production levels and demand for our products; fluctuations in margins in the Refining and Distribution and Petrochemicals business segments; changes in regulations, such as taxes, taxes on exports, changes in royalty payments and price controls; fluctuations in exchange and interest rates; and our oil and gas reserves replacement capacity.
Analysis of Liquidity and Capital Resources
The table below reflects our statements of cash flow for the fiscal years ended December 31, 2014, 2013 and 2012 under IFRS. Amounts are stated in millions of pesos.
| | | | | | | | | | | | |
| | | For the year ended December 31, | |
| | | 2014 | | | 2013 | | | 2012 | |
Cash and cash equivalents at the beginning of the year | | | 1,193 | | | | 1,260 | | | | 1,192 | |
Net cash provided by operations | | | 4,646 | | | | 2,778 | | | | 2,902 | |
Net cash used in investing activities | | | (3,430 | ) | | | (1,850 | ) | | | (2,579 | ) |
Net cash used in financing activities | | | (412 | ) | | | (1,173 | ) | | | (312 | ) |
Effect of exchange rate changes on cash | | | 281 | | | | 178 | | | | 57 | |
| | | | | | | | | | | | |
Cash and cash equivalents at the end of the year | | | 2,278 | | | | 1,193 | | | | 1,260 | |
| | | | | | | | | | | | |
Cash
As of December 31, 2014, 2013 and 2012, cash and cash equivalents were Ps.2.3 billion, Ps.1.2 billion and Ps.1.3 billion, respectively.
107
Our goal is to maintain excess cash primarily in short-term investments to ensure adequate liquidity levels. We primarily invest in money market mutual funds, overnight deposits and term deposits.
On October 25, 2011, the Argentine government issued Decree No. 1,722/11 providing that all foreign currency revenues obtained from exports made by mining and oil and gas companies must be repatriated and sold within the local foreign exchange market, which is the general regime applicable to revenues generated by Argentine exports. This decree requires PESA to repatriate and sell in the local foreign exchange market all of its export proceeds.
Subsequently, during April and May 2012, Resolution Nos. 142/12 and 231/12 issued by the Ministry of Economy, and Communication “A” 5300 issued by the Central Bank provided for a reduction in the period of time during which the exchange into local currency of all foreign exchange proceeds from exports must be performed. See “Item 3. Key Information—Risk Factors—Factors Relating to Argentina—Government intervention in the Argentine economy could adversely affect our results of operations or financial condition,” “Item 3. Key Information—Exchange Rates,” “Item 3. Key Information—Exchange Controls” and “Item 5. Operating and Financial Review and Prospects—Description of Indebtedness.”
Operating Activities
Net cash provided by operations totaled Ps.4.7 billion in 2014, Ps.2.8 billion in 2013 and Ps.2.9 billion in 2012.
Net cash provided by operations increased by Ps.1.9 billion, or 67.2%, to Ps.4.6 billion in 2014 from Ps.2.8 billion in 2013, mainly as a result of improved gross profit in 2014, partially offset by increased selling expenses in line with the rise in sales.
Net cash provided by operations decreased by Ps.124 million, or 4.3%, to Ps.2.8 billion in 2013, from Ps.2.9 billion in 2012, mainly as a result of increased plant shutdowns and environmental remediation expenses.
Investing Activities
Net cash used in investing activities totaled Ps.3.4 billion in 2014, Ps.1.8 billion in 2013 and Ps.2.6 billion in 2012, as detailed in the table below. Amounts are stated in million of pesos:
| | | | | | | | | | | | |
| | | 2014 | | | 2013 | | | 2012 | |
Divestments | | | 373 | | | | 605 | | | | 108 | |
Capital expenditures | | | (3,853 | ) | | | (2,524 | ) | | | (2,999 | ) |
CIESA’s debt restructuring | | | — | | | | — | | | | 195 | |
Other | | | 50 | | | | 69 | | | | 117 | |
| | | | | | | | | | | | |
Net cash used in investing activities | | | (3,430 | ) | | | (1,850 | ) | | | (2,579 | ) |
| | | | | | | | | | | | |
The Ps.1,280 million increase in cash used in investing activities in 2014 was mainly due to higher capital expenditures and decreased cash from divestments.
The Ps.729 million decrease in cash used in investing activities in 2013 was mainly due to reduced capital expenditures and increased cash from divestments.
In 2012, CIESA’s financial debt restructuring process was successfully completed and generated Ps.195 million of cash.
The table below reflects total capital expenditures, net of divestments, in millions of pesos:
| | | | | | | | | | | | |
| | | 2014 | | | 2013 | | | 2012 | |
– Oil and Gas Exploration and Production | | | 3,460 | | | | 2,237 | | | | 2,725 | |
– Refining and Distribution | | | 188 | | | | 166 | | | | 192 | |
– Petrochemicals | | | 73 | | | | 101 | | | | 60 | |
– Gas and Energy | | | 97 | | | | 6 | | | | 14 | |
– Corporate, Other and Eliminations | | | 35 | | | | 14 | | | | 8 | |
| | | | | | | | | | | | |
Total capital expenditures | | | 3,853 | | | | 2,524 | | | | 2,999 | |
– Divestments | | | (373 | ) | | | (605 | ) | | | (108 | ) |
| | | | | | | | | | | | |
Total net capital expenditures | | | 3,480 | | | | 1,919 | | | | 2,891 | |
| | | | | | | | | | | | |
108
Oil and Gas Exploration and Production
Capital expenditures in the Oil and Gas Exploration and Production business segment totaled Ps.3.5 billion, Ps.2.2 billion and Ps.2.7 billion in 2014, 2013 and 2012, respectively.
During 2014, 2013 and 2012, capital expenditures were mainly focused on improving the basic production curve, on exploration activities and on development of non-conventional gas reserves for shale oil and shale gas. Main expenditures included well drilling, expansion of secondary recovery projects and expansion of surface facilities and compression systems. Capital expenditures were focused on Argentina, primarily in seismic surveys and drilling.
In 2014, our investment plan involved the drilling of 36 producing and injection wells and the repair of 30 wells in the Neuquén and Austral Basins. This included drilling 30 wells and repairing 22 wells in the Neuquén Basin and drilling 6 wells and repairing 8 wells in the Austral Basin. Additionally in December 2014, the legislature of the Province of Rio Negro ratified the agreement entered into with the government of the Province of Rio Negro to extend for an additional 10-year term our concessions in the 25 de Mayo Medanito S.E., Jagüel de los Machos, Río Neuquén and Entre Lomas fields, which involves the payment of a fixed bond.
In 2013, our investment plan involved drilling 51 producing and injection wells and repairing 87 wells, mainly in the Neuquén Basin, in Puesto Hernández, Medanito, El Mangrullo, Sierra Chata, Aguada de la Arena and Río Neuquén areas. In the Austral Basin, investments were mainly focused on Estancia Agua Fresca and La Paz areas.
In 2012, our investment plan involved drilling 54 producing and injection wells and repairing 90 wells, mainly in the Neuquén Basin, in the Puesto Hernández, Medanito, El Mangrullo, Sierra Chata, Aguada de la Arena and Río Neuquén areas. In 2012, US$249.4 million of our capital expenditures were attributable to the acquisition of an additional 39.671% equity interest in PELSA. As a result of this transaction, a cash payment of Ps.1,005 million was recognized and is shown net of cash available in PELSA at the time of the acquisition. In addition, capital expenditures in 2012 included Ps.253 million, attributable to the consolidation of PELSA’s operations as from June 1, 2012.
Refining and Distribution
Capital expenditures in the Refining and Distribution business segment totaled Ps.188 million, Ps.166 million and Ps.192 million during 2014, 2013 and 2012, respectively.
During 2014, investments in the Bahía Blanca Refinery were focused mainly on a scheduled maintenance shutdown, and, to a lesser extent, logistics improvements and safety and environmental matters. In addition, investments at Dock Sud and Caleta Paula Plants were associated with operational improvements in logistics and tank revamping works.
During 2013, the Company’s investments were made principally in the Bahía Blanca Refinery to improve loading and unloading facilities for vessels, the dispatch plant and to introduce new safety and environment-related technologies. In addition, at the Dock Sud Plant, Caleta Paula and the Heavy Products Plant, investments were made to improve logistics and tank upgrading.
During 2012, we continued to undertake comprehensive maintenance projects at our Ricardo Eliçabe Refinery with a view to maintaining the mechanical integrity of its units, reliability and efficiency. We also continued with the implementation of the Refining Quality Adjustment Project in Bahía Blanca in order to meet sulphur content specifications set by Argentine law. In addition, investments were made at the Dock Sud Plant to improve logistics.
Petrochemicals
In the Petrochemicals business segment, capital expenditures totaled Ps.73 million, Ps.101 million and Ps.60 million in 2014, 2013 and 2012, respectively.
During 2014, our investments were mainly focused on maintenance works at the styrene, polystyrene and rubber plants. In addition, completion of investments allowed for an increase in propellant gas production. Also, in 2014, a scheduled shutdown for maintenance works at the ethylene unit in San Lorenzo was completed and preventive maintenance works in the turbo boiler were carried out.
The most significant investments made in 2013 include, among others, investments to increase energy efficiency at the reforming unit, increase recovery of propellant gas and diversify raw materials for crackers. In addition, the project for installation of a new monomer styrene storage tank and the fourth silo at Zárate Plant was completed, increasing our flexibility to make bulk deliveries.
109
During 2012, the Company made investments at the Puerto General San Martín plant, mainly directed toward upgrading its operating efficiency and improving storage and delivery facilities.
Gas and Energy
In the Gas and Energy business segment, capital expenditures totaled Ps.97 million, Ps.6 million and Ps.14 million in 2014, 2013 and 2012, respectively.
The investments made in 2014, were mainly attributable to major maintenance and the extension of the useful life of gas and steam turbines in the Genelba combined cycle.
Financing Activities
Net cash used in financing activities totaled Ps.412 million, Ps.1,173 million and Ps.312 million, in 2014, 2013 and 2012, respectively, as detailed in the table below in millions of pesos:
| | | | | | | | | | | | |
| | | 2014 | | | 2013 | | | 2012 | |
– Long-term debt payments | | | (111 | ) | | | (1,302 | ) | | | (85 | ) |
– Short-term debt financing, net | | | (124 | ) | | | 96 | | | | 2 | |
– Dividends paid1 | | | (177 | ) | | | (16 | ) | | | (229 | ) |
– Long-term debt financing, net | | | — | | | | 49 | | | | — | |
| | | | | | | | | | | | |
| | | (412 | ) | | | (1,173 | ) | | | (312 | ) |
| | | | | | | | | | | | |
| (1) | Includes dividends paid by PELSA. |
We paid long-term debt in the amount of Ps.111 million, Ps.1,302 billion and Ps.85 million in 2014, 2013 and 2012, respectively.
Increased cash applications in 2013 were mainly attributable to the payment of our Class R Notes in an amount of Ps.1.2 billion.
We paid cash dividends in the amount of Ps.116 million and Ps.211 million in 2014 and 2012, respectively. In addition, PELSA paid Ps.61 million, Ps.16 million and Ps.18 million attributable to non-controlling interest in 2014, 2013 and 2012, respectively.
Our shareholders’ meeting held on March 29, 2012 resolved to capitalize retained earnings in an amount of Ps.1,009 million through the issuance of 1,009,618,410 common shares each with a nominal value of Ps.1 and entitled to one vote per share. On September 4, 2012, the CNV and the Buenos Aires Stock Exchange authorized the issuance and registration of such shares. This partial capitalization of retained earnings of the Company had the effect of doubling the number of our Class B shares outstanding.
110
DESCRIPTION OF INDEBTEDNESS
Substantially all of our financial debt and the debt of our principal subsidiaries is denominated in U.S. dollars. The description that follows describes the indebtedness of PESA and its consolidated subsidiaries.
As of December 31, 2014, 2013 and 2012, total indebtedness totaled Ps.2.7 billion, Ps.2.2 billion and Ps.2.7 billion, respectively, as detailed in the table below:
| | | | | | | | | | | | |
| | | 2014 | | | 2013 | | | 2012 | |
Short-term debt: | | | | | | | | | | | | |
– Bonds | | | 19 | | | | 15 | | | | 1,008 | |
– Financial institutions | | | 73 | | | | 193 | | | | 100 | |
| | | | | | | | | | | | |
| | | 92 | | | | 208 | | | | 1,108 | |
| | | | | | | | | | | | |
Long-term debt: | | | | | | | | | | | | |
– Bonds | | | 2,562 | | | | 1,943 | | | | 1,469 | |
– Financial Institutions | | | 25 | | | | 81 | | | | 89 | |
| | | | | | | | | | | | |
| | | 2,587 | | | | 2,024 | | | | 1,558 | |
| | | | | | | | | | | | |
Total indebtedness | | | 2,679 | | | | 2,232 | | | | 2,666 | |
| | | | | | | | | | | | |
As of December 31, 2014, an aggregate principal amount of U.S.$300 million of our Series S Notes, issued under our U.S.$2.5 billion global note program that expired in May 2008, remained outstanding.
Our Series S Notes accrue interest at a 5.875% annual rate and mature in May 2017. Under the documentation governing the Series S Notes, if a change of control (as defined therein) occurs, we must make an offer to repurchase from the holders any and all outstanding Series S Notes at a purchase price equal to 101% of the aggregate principal amount of such notes outstanding, plus any accrued and unpaid interest thereon, through the purchase date. Our Series S Notes have the benefit of a credit enhancement pursuant to a standby purchase agreement entered into by Petrobras, pursuant to which, in the case of a default by us in the payment of principal, interest or any other amounts owed under the Series S Notes, Petrobras would be obligated to purchase from the holders of such notes, at their face value, all rights to receive payments arising thereunder.
The proceeds from the issuances of these notes were used to refinance liabilities, increase working capital, make capital expenditures in Argentina or make capital contributions to subsidiaries and associates.
In addition, in August 2013, the CNV authorized a new corporate notes program for an outstanding principal amount not to exceed U.S.$500 million or its equivalent in other currencies, maturing within a 5-year term or the maximum term that may be established by any applicable regulation in the future.
The following table represents our debt maturity profile as of December 31, 2014:
| | | | | | | | | | | | | | | | |
| | | 1 year | | | 2 years | | | 3 years | | | Total | |
Millions of pesos | | | 92 | | | | 24 | | | | 2,563 | | | | 2,679 | |
On June 9, 2005, the Argentine government issued Decree No. 616/05, requiring that any cash inflow to the domestic market derived from foreign loans to the Argentine private sector shall have a maturity for repayment of at least 365 days from the date of the cash inflow. In addition, at least 30% of the amount must be deposited with domestic financial institutions. This deposit (1) must be registered, (2) must be non-transferable, (3) must be non-interest bearing, (4) must be made in U.S. dollars, (5) must have a term of 365 days, and (6) cannot be used as security or collateral in connection with other credit transactions. Export and import financing and primary public offerings of corporate bonds listed on self-regulated markets are exempt from the foregoing provisions, among others. This decree may limit our ability to finance our operations through new loans (whether granted by Petrobras, any Petrobras related entity, our subsidiaries outside Argentina or any other foreign financial institution).
Under Central Bank Communication “A” 4860, issued on October 30, 2008, export collections required to be transferred and settled in the local exchange market must be transferred within a ten working day term to foreign offices of local financial institutions, except for export collections applied to the payment of export pre-financings granted by financial institutions outside Argentina. Under this requirement, the time frame to bring foreign currency into Argentina from certain export collections is reduced, resulting in a restriction on the term and amount of some of our sources of financing.
111
On October 25, 2011, the Argentine government issued Decree No. 1,722/11, providing that all foreign currency revenues obtained from exports made by mining and oil and gas companies must be repatriated and sold within the local foreign exchange market, which is the general regime applicable to export revenues generated by Argentine exports. Prior to the issuance of Decree No. 1,722/11, companies engaged in exploration and development of hydrocarbons benefited from a special regime that allowed them to retain overseas up to 70% of the proceeds of certain exports. Therefore, we now have the obligation to repatriate all of our exports proceeds.
Under Central Bank Communication “A” 5300, issued on April 26, 2012, export collections must be sold in the Argentine foreign currency market within 15 days from receipt of such funds abroad.
These and other measures issued from time to time by the Argentine government may curtail our ability to finance our operations through new loans granted by our controlling shareholder, its subsidiaries outside Argentina or any other kind of lender. Our ability to execute and carry out our strategic business plan depends upon our ability to obtain financing at a reasonable cost and on reasonable terms. See “Item 3. Key Information—Risk Factors—Factors Relating to Argentina—Government intervention in the Argentine economy could adversely affect our results of operations or financial condition” and “Item 3. Key Information—Exchange Rates” and “Item 3. Key Information—Exchange Controls.”
Cross-Default Provisions
Our notes and other bank financings outstanding as of December 31, 2014 included cross-default provisions whereby, in the case of the notes, the trustee under the relevant notes may be instructed by the noteholders representing at least 25% of the related outstanding capital to declare, or in the cases of the bank financings, the relevant lender may declare, as the case may be, all the amounts owed thereunder to be due and payable if any of our or our significant subsidiaries’ debt is accelerated or not paid when due, provided that those due and unpaid amounts exceed the higher of U.S.$25 million or 1% of PESA’s shareholders’ equity at the time such debt is due, and provided further that the default has not been eliminated or cured within the applicable legal and/or contractual terms, after we have been served notice of the default.
In addition, our Series S Notes contain cross-default provisions that are triggered if the maturity of any indebtedness of Petrobras or of any of its material subsidiaries in a total aggregate principal amount of Ps.100 million or more is accelerated. The Series S Notes also contain other customary event of default provisions relating to Petrobras. “—Description of Indebtedness” and “—Liquidity and Capital Resources—Financing Activities.”
As of the date of this Annual Report, we have complied with all covenants and other terms and conditions under our loan agreements, corporate bonds and other financial indebtedness.
112
FUTURE CAPITAL REQUIREMENTS
PESA’s shareholders’ meeting held on March 19, 2015: (a) approved (i) in accordance with legal requirements, an increase of Ps.435 million in the reserve for future investments, and the transfer to the legal reserve of Ps.23 million based on our results in 2014, and (ii) a net decrease of Ps.137 million in the reserve for future investments (consisting of an increase in the amount of Ps.3,716 million and a decrease in the amount of Ps.3,853 million), and an increase of Ps.137 million in the reserve for future dividends; and (b) delegated to the Board of Directors the determination of the actual dividend distribution date and amount. As a result of the foregoing, as of the date of this Annual Report, the reserve for future dividends amounts to Ps.1,296 million and the reserve for future investments amounts to Ps.5,731 million.
We estimate that our capital expenditure requirements, debt payment obligations, dividends payments and working capital will be financed by cash from operations and, to a lesser extent, by new debt financings and possible divestments.
Our level of investments will depend on a variety of factors, many of which are beyond our control. These include the future price evolution of the commodities we sell, the behavior of energy demand in Argentina and in regional markets, the existence and competitive impact of alternative projects, the enforcement of regulations and changes in applicable regulations, taxes and royalties, and the political, economic and social situation prevailing in the countries where we operate.
Oil and Gas Exploration and Production
Our 2015 investment plan is consistent with reserves replacement and production goals, mainly in the Neuquén Basin in Argentina, and is primarily aimed at ensuring PESA’s sustainable growth.
Efforts will continue to develop oil and gas reserves through well drilling, delimitation of reserves, and expansion of secondary recovery projects and of relevant surface facilities.
Along these lines, and by using technology in the country, we will continue with exploration study and investment programs aimed at making new discoveries at conventional and non-conventional oil and gas reservoirs. As of December 31, 2014, we maintained investment commitments for approximately U.S.$16 million, including the perforation of exploratory wells in the Río Colorado, Río Atuel, Borde del Limay, Chirete and Parva Negra Este blocks, all located in Argentina. PELSA has investment commitments totaling U.S.$26 million related to the perforation of exploratory wells in the Entre Lomas area.
Refining and Distribution
In 2015, investments will focus on operational efficiency and reliability improvements for refining facilities as a whole and maintenance of PESA’s gas stations network.
Petrochemicals
In 2015, investments will be focused on reliability and maintenance activities, in order to pursue increased yield and safety in operating processes.
Gas & Energy
In the Gas and Energy business segment, we will continue to seek to secure self-supply and, at the same time, develop profitable marketing alternatives.
113
OFF-BALANCE SHEET TRANSACTIONS
Other than as described below, we do not have any off-balance sheet arrangements required to be disclosed by Item 5 of Form 20-F.
OCP Investment’s Letters of Credit
In order to guarantee compliance with our financial commitments under the Ship or Pay transportation agreement executed with OCP and a portion of OCP’s contractual obligations, we are required to procure letters of credit. These letters of credit are required to remain in effect until December 2018. As of December 31, 2014, we had procured letters of credit for a total amount of approximately U.S.$49.5 million, mainly related to the Ship or Pay transportation agreement. As the letters of credit expire, we must renew or replace them. Otherwise, we would have to deposit cash in amounts equal to our guarantee obligations, which would have a material adverse effect on our cash flows.
Other Guarantees
In certain business operations in which PESA and its counterparties act as customers and suppliers, both sides have obtained guarantees (promissory bonds) in equivalent values, which as of December 31, 2014 amounted to Ps.428 million.
Our warranty bonds, sureties and guarantees as of December 31, 2014, which are not disclosed individually in the notes to our Audited Consolidated Financial Statements, amounted to Ps.1,461 million and are mainly related to environmental, operating and legal obligations.
CONTRACTUAL OBLIGATIONS
The following table summarizes certain contractual obligations as of December 31, 2014. The table does not include accounts payable.
For further information on our contractual commitments, please see Note 32 to our Audited Consolidated Financial Statements.
| | | | | | | | | | | | | | | | | | | | |
| | | Payments due by period | |
| | | Total | | | Less than
1 year | | | 1-3 years | | | 3-5 years | | | More than
5 years | |
| | | (in millions of pesos) | |
Debt Obligations | | | 2,968 | | | | 154 | | | | 2,814 | | | | — | | | | — | |
Purchase Obligations | | | | | | | | | | | | |
Long-term service agreement(1) | | | 2,719 | | | | 1,425 | | | | 1,018 | | | | 114 | | | | 162 | |
Petroleum services and materials(1) | | | 9,793 | | | | 6,804 | | | | 2,797 | | | | 192 | | | | — | |
Transportation capacity(2) | | | 1,312 | | | | 223 | | | | 349 | | | | 341 | | | | 399 | |
Gas purchase agreements for Genelba, PGSM & Bahía Blanca(1) | | | 130 | | | | 130 | | | | — | | | | — | | | | — | |
Gasolines | | | 15,367 | | | | 2,512 | | | | 2,486 | | | | 2,486 | | | | 7,883 | |
Crude oil transportation agreement with OCP | | | 380 | | | | 92 | | | | 164 | | | | 124 | | | | — | |
Pension Plan | | | 443 | | | | 5 | | | | 97 | | | | 80 | | | | 261 | |
| | | | | | | | | | | | | | | | | | | | |
Total | | | 33,112 | | | | 11,345 | | | | 9,725 | | | | 3,213 | | | | 8,705 | |
| | | | | | | | | | | | | | | | | | | | |
Sales Obligations | | | | | | | | | | | | |
Natural gas | | | 1,803 | | | | 1,113 | | | | 547 | | | | 143 | | | | — | |
Electric power | | | 6,169 | | | | 1,025 | | | | 1,729 | | | | 1,641 | | | | 1,774 | |
LPG | | | 2,045 | | | | 293 | | | | 586 | | | | 586 | | | | 580 | |
Gasolines | | | 9,563 | | | | 2,168 | | | | 1,430 | | | | 1,430 | | | | 4,535 | |
Diesel | | | 404 | | | | 308 | | | | 96 | | | | — | | | | — | |
| | | | | | | | | | | | | | | | | | | | |
Total | | | 19,984 | | | | 4,907 | | | | 4,388 | | | | 3,801 | | | | 6,888 | |
| | | | | | | | | | | | | | | | | | | | |
| (1) | Prices are generally determined by formulas based on future market prices. Estimated prices used to calculate the monetary equivalent of these purchase obligations for purposes of the table are based on current market prices as of December 31, 2014 and may not reflect actual future prices. Accordingly, the peso amounts provided in this table with respect to these obligations are provided for illustrative purpose only. |
114
| (2) | Estimated price of Ps.0.24 million per million cubic meters. |
Debt Obligations. A description of our contractual obligations with respect to our debt obligations is set forth under “—Liquidity and Capital Resources—Description of Indebtedness.”
Long-Term Service Agreement. We have entered into a long-term service agreement with different service providers in the ordinary course of our business. The aforementioned contracts provide for the supply of services such as the maintenance and repair of Genelba, transportation between facilities and technical support.
Petroleum services and materials.We have entered into several agreements with different oil and gas petroleum service providers in order to ensure the usual supply of services and materials in countries where we conduct oil and gas activities. The aforementioned contracts provide for the supply of services such as pulling, work-over, perforation works, the provision of materials and others.
Transportation capacity. We have entered into firm gas transportation agreements with Metrogas and TGS to provide gas transportation services to our thermal power plant, Genelba. These contracts include firm commitments, which require us to meet our contractual obligations for the entire volume hired, even if no gas is transported. These contracts expire in 2019.
Gas Purchase Agreement for Genelba. Complementing the gas transportation agreements mentioned above, we have entered into natural gas supply agreements with TGS. Under these agreements, TGS has committed to supply Genelba Plus and Genelba’s natural gas requirements in the event that such supply is not met internally to ensure that both thermal power plants are able to meet their own contractual energy delivery commitments.
Crude Oil Transportation Agreement with OCP.We are party to an agreement with OCP related to oil transportation capacity of 80,000 barrels per day for a 15-year term starting November 10, 2003. This is a “Ship or Pay” transportation agreement. Therefore, we must comply with our contractual obligations for the aggregate committed capacity, regardless of the amount of crude oil actually transported, and pay, like the other producers, a rate that covers OCP operating costs and financial services, among others. As of December 31, 2014, related current and non-current liabilities relating to the outstanding Ship or Pay contract amount to Ps.92 million and Ps.288 million, respectively.
Pension Plans.A description of our contractual obligations with respect to our pension plans appears in Note 23 to our Audited Consolidated Financial Statements.
Natural Gas Sales.These agreements correspond primarily to long-term sales commitments in order to ensure the sale of natural gas in Argentina.
LPG and Electric Power Sales.These agreements correspond primarily to sale commitments in order to ensure the sale of LPG and electric power in Argentina.
Gasolines.We have entered into agreements with Oil Combustibles that extend until 2026 in order to ensure the supply of virgin naptha to our Refining and Distribution business segment. These contracts require us to purchase virgin naptha from Oil Combustibles for our Refining and Distribution business segment and for us to sell intermediate gasoline to them.
Diesel.We have entered into volume contracts with Minera Alumbrera Limited in order to ensure the sale of diesel. This contract extends to 2016.
| Item 6. | DIRECTORS, SENIOR MANAGEMENT AND EMPLOYEES |
DIRECTORS AND SENIOR MANAGEMENT
Board of Directors
In accordance with the bylaws of PESA, the Board of Directors is required to meet at least once every three months, and is composed of nine regular members who are elected for a three-year term. One-third of PESA’s directors are elected each year. The shareholders’ meeting may appoint a number of alternate members that may be equal to or lower than the number of regular members to fill any vacancy, in the order of their appointment.
115
The table below sets forth the current composition of the Board of Directors, as approved by PESA’s general ordinary and special shareholders’ meeting held on March 19, 2015.
| | | | | | | | | | |
Name | | Year of
Appointment | | | Position | | Term
Expires | |
| Luiz Gustavo Primo de Siqueira | | | 2014 | | | Chairman | | | 2015 | |
| Jorge José Nahas Neto | | | 2013 | | | Vice Chairman | | | 2017 | |
| Guilherme Pontes Galvão França | | | 2015 | | | Director | | | 2017 | |
| Carlos Alberto Pereira de Oliveira | | | 2015 | | | Director | | | 2017 | |
| Cedric Bridger | | | 2004 | | | Director | | | 2016 | |
| Roberto Luis Monti | | | 2003 | | | Director | | | 2016 | |
| Carlos Ariel Lieutier | | | 2014 | | | Director | | | 2016 | |
| Ronaldo Batista Assunção | | | 2013 | | | Director | | | 2015 | |
| Luis Miguel Sas | | | 2003 | | | Director | | | 2015 | |
| José Jorge De Moraes Júnior | | | 2014 | | | Alternate Director | | | 2015 | |
| Gustavo Tardin Barbosa | | | 2011 | | | Alternate Director | | | 2017 | |
| Cláudio Rogério Linassi Mastella | | | 2015 | | | Alternate Director | | | 2017 | |
| Mauro Roberto da Costa Mendes | | | 2015 | | | Alternate Director | | | 2017 | |
| Benicio Schettini Frazão | | | 2013 | | | Alternate Director | | | 2015 | |
| Daniel Casal | | | 2003 | | | Alternate Director | | | 2015 | |
| Alejandro Poletto | | | 2008 | | | Alternate Director | | | 2016 | |
| María Valeria Dallera | | | 2015 | | | Alternate Director | | | 2016 | |
As approved by PESA’s general ordinary and special shareholders’ meeting held on March 19, 2015, alternate directors will fill any vacancy in the following order: José Jorge De Moraes to Júnior to Luiz Gustavo Primo de Siqueira, Gustavo Tardin Barbosa to Jorge José Nahas Neto, Cláudio Rogerio Linassi Mastella to Guilherme Pontes Galvão França, Mauro Roberto da Costa Mendes to Carlos Alberto Pereira de Oliveira, Benicio Schettini Frazão to Ronaldo Batista Assunção, Daniel Casal to Luis Miguel Sas, Alejandro Poletto to Cedric Bridger or Roberto Luis Monti, and María Valeria Dallera to Carlos Ariel Lieutier.
For the purpose of CNV Resolution No. 622, Cedric Bridger, Roberto Luis Monti, Carlos Ariel Lieutier, Alejandro Poletto and María Valeria Callera qualify as independent directors. CNV Resolution No. 622 provides that a member of a corporate body shall not be considered independent if that member:
| | 1. | is also a member of management or an employee of shareholders who hold significant interests in the issuer, or of other entities in which these shareholders hold either directly or indirectly significant interests or over which these shareholders exercise a significant influence, |
| | 2. | is an employee of the issuer or has been an employee during the last three years, |
| | 3. | has professional relations or is part of a company or professional association that maintains professional relations with, or that receives remunerations or fees (other than directors’ fees) from, the issuer or from its shareholders that hold either directly or indirectly significant interests in or exercise a significant influence over the issuer, or from which such shareholders hold either directly or indirectly significant interests or exercise a significant influence, |
| | 4. | is either directly or indirectly a holder of significant interests in the issuer or in an entity that has significant interests in or exercises a significant influence over the issuer, |
| | 5. | sells or provides either directly or indirectly goods or services to the issuer or to shareholders that hold either directly or indirectly significant interests in or exercise a significant influence over the issuer and receives compensation for such services that is substantially higher than that received as a director, or |
| | 6. | is married or is a family member, up to fourth degree by blood or up to second degree by affinity, to an individual who would not qualify as independent. |
“Significant interests” mean shareholdings that represent at least 15% of the capital stock of the relevant entity, or a smaller percentage when the person has the right to elect one or more directors by class of shares or by having entered into agreements with other shareholders relating to the governance and the management of the relevant entity or of its controlling shareholders.
The following is a brief summary of the principal business and academic experience of each of our directors:
Luiz Gustavo Primo de Siqueira (57) has served as an alternate member of the Board of Directors since 2013. In 1980 he graduated with a degree in Mechanical Engineering from the Instituto Militar de Ingeniería (Engineering Military Institute),
specializing in Oil Engineering in 1992, obtaining a master’s degree in Production Engineering from the Universidade Federal do Rio de Janeiro (“UFRJ”) in 1998 and an MBA in International Business Management. He worked in the Southwestern Drilling Section between 1983 and 1987, and then worked as Chief of the Wells Coating Department of the Drilling Department until 1990. Between 1991 and 1995, he served as Quality Coordinator of the Drilling Department, and from 2000 to 2005 he was Quality and SMS Manager in Petrobras Colombia Ltd. Then, from 2006 to 2011, he was the Organization, Management and Process Manager in the International Business Area. During 2012, he served as Corporate Director in Petrobras Colombia Ltd. He currently serves as International Executive Manager for Latin America.
116
Jorge José Nahas Neto (55) has served as a member of and Vice Chairman of the Board of Directors since 2013. He graduated in 1981 with a degree in Economy from the University Candido Mendes, specializing in Economy Engineering in 1993 from the same university. Since 1980, he has worked in different national and multinational companies. He joined Petrobras in 1993, where he served in the financial and planning areas in Brazil and in the international area. He was the Finance Manager of Petrobras Internacional Braspetro B.V. and Finance and Administrative Manager of Petrobras América Inc. in Houston, Texas. Since 2004, he has served as Financial and Risk Management Executive Manager, and since 2008 as Petros Deliberative Counselor.
Guilherme Pontes Galvão França (56) has served as a member of the Board of Directors since 2015. He graduated with a degree in Chemical Engineering from the Universidad Federal de Río de Janeiro (UFRJ) in 1981, obtaining a specialization in Marketing from the COPPEAD in 1996 and a certification from the Senior Executive – Executive Managers Development Programme from the IBMEC in 2000. He joined Petrobras in 1982, where he was Chief of the Internal Market of Lubricants and Paraffins Section and Chief of the Internal Market of Gas, Propane, Asphalt and Solvents Section. He also served in several management positions such as GLP Sales Manager, Oil and Industrial Materials Exports Sales Manager, and Maketing Manager. He currently works in the Sales and Logistics Area in Petrobras.
Carlos Alberto Pereira de Oliveira (57) has served as a member of the Board of Directors since 2015. He graduated with a degree in Mechanical Engineering from Río de Janeiro´s Engineering Institute and a degree in Management from Universidad Federal de Río de Janeiro (UFRJ), both in 1980. He specialized in Oil Engineering in 1981, and obtained a Master’s Degree in Finance from Rio de Janeiro’s Catholic University in 1990. He joined Petrobras in 1981, where he served in several areas of the Company, including various management positions such as Reserves General Manager, Executive Director of Exploration and Production of PESA, CEO of Petrobras Energía Perú S.A, Director of Technical Support for International Business Executive Manager, and as a member of the boards of directors of Petrolera Entre Lomas S.A, Petrobras Venezuela Investments y Services B.V. and PESA. He is currently General Manager of Implementation of Production Projects at Petrobras Brasil.
Cedric Bridger (79) has served as a member of the Board of Directors since 2004, and is currently a member of the Audit Committee. He graduated with a degree in Public Accounting in London from the Association of Certified and Corporate Accountants, where he initiated his professional activities. He joined FADIP S.A. (later Hughes Tool Co. S.A.) in Buenos Aires in 1964, where he was Financial Manager. Subsequently, he became General Manager of the company in Brazil and was ultimately appointed its Vice President of Operations for Latin America. From 1992 to 1998, he was Chief Financial Officer of YPF S.A. In April 1998, he retired from YPF S.A. and took a position as Director of Banco Hipotecario S.A. and since 2003 he has been a member of the board of directors of IRSA Inversiones y Representaciones S.A.
Roberto Luis Monti (76) has served as a member of the Board of Directors since 2003, and is currently a member of the Audit Committee and of the Compensation Committee. He graduated with a degree in Electromechanical Engineering. He received a Master of Electronic Engineering from the Universidad de Buenos Aires (“UBA”), and an MBA from the American Management Association, New York. For 32 years he worked for Schlumberger, where he was Vice-Chairman of Wireline Operations, Chairman of Anadrill, Chairman of Wireline & Testing for Europe, Africa, Middle and Far East and Latin America, and Chairman of Dowell at a worldwide level during the period from 1981 to 1995. From 1995 to 1997 he served as Chairman and CEO of Maxus Energy Corporation. From 1997 to 1999 he served as Chairman and CEO of YPF S.A. In 2000, he served as Vice Chairman of Exploration and Production and Vice Chairman of the board of directors of YPF S.A. In addition, he currently serves as member of the board of directors of Tenaris S.A.
Carlos Ariel Lieutier (37) has served as a member of the Board of Directors since 2014. He graduated with a degree in Economy in 2002 at the UBA. In 2005 he obtained a Postgraduate degree in Public Management for Social Development from the Alcalá de Henares University and the Spanish Public Administration Institute. He is currently enrolled in a Masters Degree in Political Economy at the Facultad Latinoamericana de Ciencias Sociales. Since 2001, he has held several positions within the City of Buenos Aires and National Governments, serving as Financial Manager of the Pensioners National Social Services Institute and General Manager of the Health Superintendence. Since 2013, he serves as General Institutional Coordinator of the Polical Economy Secretary within the National Ministry of Economy.
Ronaldo Batista Assunção (59) has served as a member of the Board of Directors and as Chief Executive Officer since 2013. He is also member of the Compensation Committee. He graduated with a degree in Civil Engineering from the Brasilia University in 1978, specializing in Oil Engineering and obtained a Posgraduate degree in Economic Engineering and Industrial Administration from the UFRJ. He held different managing positions within Petrobras, including: General Executive Manager of Operations and Participations in Energy and Chairman of Brasil PCH S.A. and Breitener Energética S.A. In addition, he is currently Chairman of Petrobras Energía Internacional S.A. and member of the board of directors of Petrobras Energía Ecuador Ltd., Petrobras Energía Colombia Ltd., Petrolera Entre Lomas S.A, Petrobras Hispano Argentina S.A., Petrobras Energía de México S.A. de C.V., Atalaya Energy S.A. and Canadian Hunter S.A.
117
Luis Miguel Sas (52) has served as a member of the Board of Directors since 2003, and as Chief Financial Officer since May 2004. He graduated with a degree in Public Accounting from the UBA and holds an MBA from the Instituto de Altos Estudios Empresariales—Universidad Austral. He joined PESA in 1984. In 1990 he was appointed Head of the Financial Operations Department for Telecom. He worked as head of Petrobras Argentina’s money desk and in 1997 he was appointed Corporate Finance Manager, in charge of capital markets and project financing. In January 2000, he was appointed Chief Financial Officer of EDESUR. He served as Financial Manager at PESA between May 2001 and May 2004. In addition, he currently serves as Chairman of Petrobras Hispano Argentina S.A. and is member of the board of directors of PELSA and Petrobras Energía Internacional S.A. He is also a member of the Executive Boards of the Foundation for Latin American Economic Research (FIEL) and the Argentine Institute of Financial Executives (IAEF).
The following is a brief summary of the principal business and academic experience of each of our alternate directors:
José Jorge de Moraes Júnior(59) has served as an alternate member of the Board of Directors since 2014. He graduated with a degree in Geology from São Paulo University in 1979 and obtained a Masters Degree in Sedimentology and Stratigraphy from Ouro Preto University in 1988. He joined Petrobras in 1980 where he has held several managing positions such as Petrobras Colombia Exploration Manager, Exploration Activity Manager at Campos Basin, New Business General Manager Corporate E&P Executive Manager. He currently serves as International Corporate Executive Manager.
Gustavo Tardin Barbosa (54) has served as an alternate member of the Board of Directors since 2011. He graduated with a degree in Civil Engineering from Pontificia Universidade Católica do Rio de Janeiro in 1985. He also holds an MBA from Fundação Getulio Vargas (1992), post graduate studies in Corporate Finance from London Business School (1996) and Advanced Management from Wharton School (2002). He joined Petrobras in 1986 where he has held several senior financial positions including Controller of Petrobras International (1993-1994), Chief Financial Officer of Petrobras UK (1994-1999), Executive Manager of Financial Planning and Risk Management of Petrobras (1999-2003) and Chief Financial Officer of Petrobras America (2003-2011). In 2011, he was appointed by Petrobras to serve as Executive Manager of Corporate Finance.
Cláudio Rogério Linassi Mastella (62) has served as an alternate member of the Board of Directors since 2015. He graduated with a degree in Chemical Engineering from the Federal University of Rio Grande do Sul (UFRGS) and with a degree in Processing Engineering from the CENPRO in 1987. He joined Petrobras that same year, where he served in several management positions in the Refining, Logistics, Sales and Provision sectors. In 2006, he completed a specialization in General Competences at Petrobras University. He currently serves as Provision and Logistics Executive Manager.
Mauro Roberto da Costa Mendez (52) has served as an alternate member of the Board of Directors since 2015. He graduated with a degree in Civil Engineering from Pará Federal University, and obtained a Masters Degree in Production Engineering from the PUC-RJ. He joined Petrobras in 1987, where he developed several managing positions such as Production Manager of Urucu (Amazonas), Treatment and Processing of Fluids Manager in the Rio Grande do Norte and Ceara Business Unit and General Manager of Cretarion and Implementation of Production Proyect Development in PRESAL – Santos Unit. He is currently the Nort-Northeast Exploration and Production General Manager.
118
Benicio Schettini Frazao (59) has served as Director of Oil and Gas Exploration and Production since November 2011. He graduated with a degree in Civil Enginering and in 1979 joined Petrobras, where he specialized in Oil Engineering. Since 1980, and for over 20 years, he worked at the Campos Basin. First, his duties were at an off-shore platform, and then at the Operations Management and the Supply Area. He also served at the E&P Service Material Division at Petrobras, at Rio de Janeiro. Subsequently, Mr. Schettini Frazao took on responsibility within the E&P area, for the installation, engineering, construction, training, and initiation of production of the P50 Platform for over seven years. From 2008 through November 2011, he was General Manager of E&P’s New Business in Petrobras. He is currently a member of the board of PELSA and of Petrobras Bolivia Internacional S.A.
Daniel Casal (58) has served as an alternate member of the Board of Directors and as Executive Director of Legal Affairs of PESA since 2003. He graduated with a degree in Law from the Universidad Católica Argentina in 1980. He joined PESA in 1991. He also serves as member of the boards of directors of TGS, Compañía de Inversiones de Energía S.A., Petrobras Energía Colombia Ltd., Petrobras Energía Internacional S.A. and PELSA.
Alejandro Poletto (42) has served as an alternate member of the Board of Directors since 2008. He graduated with a degree in Law from the Universidad Católica Argentina in 1998 and received a Master Degree in Law (LL.M.) from Cornell University Law School, Ithaca, New York. He has previous experience as an associate lawyer for the law firms Marval, O’Farrell & Mairal, and Cárdenas, Cassagne & Asociados in Buenos Aires. He also worked as a foreign associate at Skadden, Arps, Slate, Meagher & Flom LLP’s New York Office. He is a partner at Beccar Varela Law Firm.
María Valeria Dallera (44) has served as a member of the Board of Directors since 2015. She graduated with a degree in Business Administration from the Universidad de Buenos Aires in 2005. Since 2000, she has held several positions within the City of Buenos Aires and the Argentine government, serving as Administration, Budget and Human Resources Coordinator at the Secretariat of Labor, Employment and Professional Training Coordinator of the Ministry of Economic Development of the City of Buenos Aires, Planning and Management Control Coordinator at the National Ministry of Economy and Public Finance and Head of the Coordination, Planning and Monitoring Unit of the National Institute of Social Services for Pensioners. Since 2013, she has served as Staff Coordinator at the Undersecretariat of Economic Planning of the Secretariat of Economic Policy of the National Ministry of Economy and Public Finance.
Administration and Organization
PESA’s operations are divided into four business segments that are in turn supported by corporate functions. The four business segments are: Oil and Gas Exploration and Production; Refining and Distribution; Petrochemicals and Gas and Energy.
PESA is managed by a committee made up of five members: the Chief Executive Officer, the Chief Financial Officer, the Director of Oil and Gas Exploration and Production, the Downstream Director and the Corporate and Services Director. Operations are managed through standardized processes that facilitate and secure coordination between the different units and groups. Delegation of authority is encouraged for the purpose of promoting efficiency. In addition, the scope of the delegation of authority is clearly and expressly determined through systemized approval limits for risk minimization purposes. Our internal control system is supported by coordination among the areas responsible for managing businesses and administering them on a centralized basis, always within the framework of the policies established by the executive committee. Operating and administrative processes are jointly supported by administrative procedures, highly reliable information systems, production of periodic management control reports, performance appraisals and fluid communication.
Executive Officers
The table below sets out the names and positions of PESA’s executive officers:
| | |
| Name | | Position |
| Ronaldo Bastista Assunção | | Chief Executive Officer |
| Luis Miguel Sas | | Chief Financial Officer |
| Benicio Schettini Frazao | | Director of Oil and Gas Exploration and Production Segment |
| Adelson Antonio da Silva | | Corporative and Services Director |
| Maucir de Almeida | | Downstream Director |
| Daniel Casal | | Executive Manager of Legal Affairs |
| Allan Leslie Blumenthal | | Executive Manager of Gas and Energy Segment |
| Alfredo Guía y Díaz | | Executive Manager of Strategy, Planning and Performance |
The following is a brief summary of the principal business and academic experience of PESA’s executive directors and executive officers of the Company (for the summary regarding those who are directors, see above).
119
Maucir de Almeida (60) serves as Downstream Director of PESA. He obtained a Senior Executive MBA from IBMEC (Instituto Brasilero de Mercado de Capitales) in 2001. He also holds an MBA in Supply from Fundação Dom Cabral in 2007 and received an Advanced Program Management (APM) certfication from Amana-Key in 2014. He joined Petrobras 34 years ago and has held several positions, such as Product Engineering Manager Supply / Refining / GETEP from 1999-2000, Manager of New Processes and Products Supply / Refining / TR from 2000-2002, Optimization Manager Supply / Refining / TR from 2002-2008, Manager of Refining and Petrochemical INTER - TEC / Supply from 2008, 2012 and Refining General Manager, Midstream and Gas and Energy of INTER-TEC from 2012-2014.
Adelson Antonio da Silva (58) served as Executive Manager of Human Resources from 2010 to 2013, when he was appointed as Corporate and Services Director. He graduated as a Certified Public Accountant from Nilton Paiva Ferreira University, in Belo Horizonte, and as a Lawyer from Candido Mendes University, in Río de Janeiro. He obtained a specialization degree in tax law from Sá University and holds an Executive/Marketing MBA degree from COPPEAD-UFRJ in Rio de Janeiro. He joined Petrobras over 30 years ago and held several positions, mainly in the Human Resources, Accounting, Finance, Commercial and Business Development areas. He served as Executive Manager of Planning and Management Control at PESA and as Director of some companies related to the Company during 2003, 2004 and 2005. He served as General Manager of Strategy, Planning, Portfolio Management and Project Management in the Internacional Area.
Alfredo Sergio Guía y Díaz (58) has served as Executive Manager of Strategy, Planning and Performance since 2008. He graduated in Economic Sciences with a specialization in Business Administration at Universidad Nacional de La Plata. He joined PESA in 1997, when he took responsibility for the Planning and Management Control Department of the Refining and Petrochemicals business segment and the Management Control Department of Oil and Gas Exploration and Production and Gas and Energy segments. He has also has served as Performance Appraisal Manager for the Southern Cone region within Petrobras’ International Area from 2005 through 2007. He is also currently a member of the board of directors of Petrolera Entre Lomas S.A. and of Petrobras Energía Internacional S.A.
Leslie Allan Blumenthal (46) has served as Executive Manager of Gas and Energy since 2013. He graduated in Business Administration at the Universidad de Belgrano in 1997 and attended a Postgraduate course in Oil and Gas at the Instituto Teconológico Buenos Aires in 2001. Mr. Blumenthal joined PESA in 1993, where he has held several managing positions such as Logistic Manager, Sales of Oil and Gas Manager, Relations with the Government and Partners in E&P Manager and Commercialization of Natural Gas Manager. He is also the current chairman of the board of directors of World Energy Business S.A. and of Enecor S.A and alternate director of the board of directors of TGS and of CIESA.
COMPENSATION
Compensation of the members of the Board of Directors is determined at the Ordinary Shareholders’ Meeting in compliance with the Argentine Companies Law. The maximum amount of compensation that the members of the Board of Directors may receive, including salaries and any other form of compensation for the performance of technical, administrative, or permanent functions, may not exceed 25% of our profits. Such amount is 5% in the event that no dividends are distributed to the shareholders and is increasedpro rata on the basis of the dividend distribution, up to the 25% cap. In the event that one or more directors serve as members of a special committee or perform technical or administrative functions, and profits are reduced or non-existent, and, consequently, the preset limits are exceeded, compensation in excess of the limit may only be paid with the prior express approval by shareholders at an ordinary shareholders’ meeting.
In PESA, the compensation policy for executive officers includes annual cash compensation and a benefits program. The annual cash compensation is determined based on the characteristics and responsibilities of the relevant position and the executive officer’s qualifications and experience and benchmark information. Such compensation consists of a monthly fixed compensation and annual variable cash bonus dependent upon PESA’s results of operations and the achievement of individual goals and objectives. Benefits granted to executive officers are similar to those granted to employees generally, such as life insurance, a health care plan, meal allowances and a defined benefits pension plan, which are described in the Audited Consolidated Financial Statements.
No contracts for services were entered into between the directors and the Company or any of our subsidiaries that provide for benefits after termination of their office, other than as provided by law.
In 2014, PESA paid an aggregate of approximately Ps.26 million to its directors and executive officers. The members of the Board of Directors and our executives do not receive compensation in the form of stock or equity. For information related to amounts set aside for pension and retirement benefits, see Note 23 to our Audited Consolidated Financial Statements.
120
BOARD PRACTICES
Audit Committee
Pursuant to the Regime concerning transparency in public offerings approved by Capital Market Law No. 26,831, Argentine public companies must have an audit committee composed of three or more members of the board of directors.
On May 21, 2003, the Board of Directors approved the implementation process required under CNV General Resolution No. 400/02 for audit committees. In compliance with these resolutions, at the shareholders’ ordinary meeting held on March 19, 2004, PESA amended its bylaws by adding a provision related to the structure and operation of the Audit Committee.
On May 7, 2004, the Board of Directors created the Audit Committee and, in compliance with its duties, the Audit Committee approved its charter. At the Board of Directors meeting held on March 19, 2015, Cedric Bridger, Roberto Luis Monti and Carlos Ariel Lieutier continue as regular members of our Audit Committee, Alejandro Poletto continues as an alternate member and María Valeria Dallera was appointed as an alternate member. Each of the members of the Audit Committee satisfies the independence requirements of Rule 10A-3 of the Exchange Act.
Audit Committee Terms of Reference
The purpose of the Audit Committee is to assist the Board of Directors in fulfilling its responsibilities relating to (1) the company’s financial statements, (2) compliance with applicable legal, regulatory and behavioral requirements, (3) qualification and independence of the independent external auditor that delivers an audit report on the company’s financial statements (the “Independent Auditor”), and (4) the conduct of the internal audit and the Independent Auditor’s performance.
The Audit Committee is composed of three regular members and an equal or lower number of alternate members that are appointed by the Board of Directors from among its members. Directors having sufficient experience and ability in financial, accounting or business matters are eligible to become members of their Audit Committee. All members of the Audit Committee must be independent in accordance with applicable SEC standards and a majority must be independent in accordance with the standards of the CNV. See “—Directors and Senior Management—Board of Directors.” The audit committees may adopt its own internal regulations.
Once every year our Audit Committee prepares a working plan with respect to its goals and work schedule for the fiscal year to be reported to the Board of Directors. The remaining directors, members of the Statutory Supervisory Committee, managers and external auditors may, at the Audit Committee’s request, attend the Audit Committee’s meetings, assist the Audit Committee and provide it with any information available to them. For a better performance of its duties, the Audit Committee may retain, on the Company’s account, advisory services of counsel and other independent professionals. The Audit Committee shall have access to the information and documentation deemed necessary for the fulfillment of its functions.
Our Audit Committee has the following principal powers and responsibilities:
| | 1. | To supervise the performance of the internal control systems, the performance and reliability of the administrative and accounting system, the reliability of the financial statements and all the financial information and the disclosure of relevant events. |
| | 2. | To establish and supervise the implementation of procedures for the reception, documentation and treatment of claims or reports on irregularities in connection with accounting, internal control or auditing matters, on a confidential and anonymous basis. |
| | 3. | To issue founded opinions with respect to transactions with related parties as required by applicable law. To issue founded opinions whenever a conflict of interest exists or may arise for us and to communicate this opinion to self-regulated entities as required by the CNV. |
| | 4. | To provide the market with complete information with respect to transactions where members of the corporate bodies and / or controlling shareholders of ours have conflicts of interests. |
| | 5. | To opine with respect to the reasonableness of the compensation and stock option plans proposed by the Board of Director at the shareholders meetings. |
| | 6. | To opine with respect to the compliance of legal requirements and on the reasonableness of proposals to issue shares or securities convertible into shares, in the case of capital increases that exclude or limit preemptive rights. |
| | 7. | To issue at least once, at the time of submittal of the annual financial statements, a report on the treatment given during the year to the matters under its responsibility. |
| | 8. | To issue an opinion on the proposal submitted by the Board of Directors for the appointment (or revocation) of the independent auditor and communicate it to the shareholders’ meeting. |
121
| | 9. | To evaluate the qualifications and independence of the independent auditors. |
| | 10. | To issue and maintain pre-approval procedures in connection with any service (whether audit-related or not) to be provided by the independent auditor, under which the Committee will be exclusively authorized to pre-approve any service provided by the said Auditor. |
| | 11. | To evaluate the quality of our accounting standards and the main changes to such accounting standards. |
Compensation Committee
In order to better supervise salary and compensation matters, the Board of Directors created a compensation committee at its October 6, 2006 meeting. The main purpose of this committee is to assure the compliance with, and revise whenever necessary, policies relating to compensation that aim to provide the company with greater flexibility to make more effective decisions. The compensation committee meets monthly to approve matters relating to compensation policy, including compensation subject to our and the employee’s performance. The compensation committee, composed of Directors Roberto Luis Monti, Luiz Gustavo Primo de Siqueira and Ronaldo Batista Assunção, must report to the Board of Directors at least semiannually.
Statutory Supervisory Committee
PESA has aSindicatura(the “Statutory Supervisory Committee”) that is comprised of three members and three alternate members.
The table below sets out the name, year of appointment and position of each person on the PESA Statutory Supervisory Committee, approved by the ordinary and special shareholders’ meeting held on March 19, 2015:
| | | | | | | | | | |
Name | | First year of
appointment | | | Position | | Term
Expires | |
| Juan Carlos Cincotta | | | 2004 | | | Member | | | 2015 | |
| Justo Federico Norman | | | 2003 | | | Member | | | 2015 | |
| Rogelio Norberto Maciel | | | 2003 | | | Member | | | 2015 | |
| Olga M. Morrone de Quintana | | | 2004 | | | Alternate | | | 2015 | |
| Mariana P. Ardizzone | | | 2004 | | | Alternate | | | 2015 | |
| María Laura Maciel | | | 2004 | | | Alternate | | | 2015 | |
The members and alternate members of the Statutory Supervisory Committee are elected by the shareholders at the annual shareholders’ meeting to serve for a renewable term of one year. The primary responsibilities of the Statutory Supervisory Committee are to monitor the board of directors’ and management’s compliance with the Argentine Companies Law, our bylaws and shareholders’ resolutions. The Statutory Supervisory Committee also performs other functions, including: (1) attending meetings of the Board of Directors and shareholders, (2) calling special shareholders’ meetings when deemed necessary or when required by shareholders, in accordance with the Argentine Companies Law, (3) presenting a report on the reports of the Board of Directors and the annual financial statements at ordinary shareholders’ meetings, and (4) investigating written complaints of shareholders representing not less than 2% of the capital stock. The Statutory Supervisory Committee may not engage in any management control and, accordingly, may not evaluate business judgment and decisions on issues of administration, financing, sales and production, as these issues fall within the exclusive responsibility of the Board of Directors.
Justo Federico Norman, Rogelio Norberto Maciel, Mariana P. Ardizzone and María Laura Maciel are lawyers and work at Maciel, Norman & Asociados Law Firm, which has professional relations with and charges fees to us, our controlling companies and our associates.
Olga M. Morrone de Quintana is a public accountant and works at Estudio Morrone de Quintana, Seoane & Quintana, which has professional relations with and charges fees to us and certain of our associates.
The following is a brief summary of the principal business and academic experience of the members of the Statutory Supervisory Committee listed in the table above:
Juan Carlos Cincotta (70) graduated in public accounting from UBA. He is currently head of Cincotta Asesores, Auditores y Consultores, and formerly a partner at Pistrelli, Henry Martin y Asociados (Ernst & Young). He specializes in external audits of major public and private entities, and consulting in accounting, social and corporate governance issues. He was a member of the Special Commission on Accounting and Auditing Regulations (CENCyA) of the Argentine Federation of Professional Councils in Economic Science and of the Nominating Committee of the International Federation of Accountants (“IFAC”). He lectures on topics within his special field of work in specialized entities in Argentina and abroad. He published several works on accounting, corporate and audit matters in different technical magazines and co-authored of the Treaty of Auditors Responsibility, Thomson Reuters-La ley Editorial, Buenos Aires, 2014.
122
Justo Federico Norman (70) earned his law degree from the Universidad Cátolica Argentina, and is a partner of Maciel, Norman & Asociados Law Firm in Buenos Aires. He has extensive experience in the general practice of law and in the fields of energy, natural resources, oil and gas regulations and environmental issues, and is renowned in the litigation and international arbitration fields. He is a member of the Association of International Petroleum Negotiators where he has served as Regional Secretary (2001-2004), the International Bar Association, and Rocky Mountain Mineral Law Foundation. He has represented and currently represents companies such as Anadarko Petroleum Corporation, ANR Pipeline Company (Coastal), Apache Corporation, BHP Petroleum (Americas) Inc., British Gas, Devon Energy Corporation, Parker Drilling, and Petroliam National Berhad (Petronas). He is a Regular Director of Petronas Argentina S.A. and Apache Petrolera Argentina S.A., among others.
Rogelio Norberto Maciel (78) earned his law degree from the Universidad de Córdoba, and is a founding partner of Maciel, Norman & Asociados Law Firm. He is a renowned lawyer in the litigation and international arbitration fields. He was one of the members of the Argentine Aeronautical Code Drafting Committee and was a member of the Argentine delegation to the International Civil Aviation Association. He is a member of the Buenos Aires Oil Club, the international Bar Association (IBA), the Association of International Petroleum Negotiators, and the Rocky Mountain Mineral Law Foundation. He is Vice Chairman of Petronas Argentina S.A., a Regular Director of BHP Petroleum (Argentina) S.A. and an Alternate Director of Petrolera Rio Alto S.A., among others.
Olga M. Morrone de Quintana (79) is a partner of Morrone de Quintana, Seoane & Quintana. She graduated in public accounting from UBA in 1965. She is currently a member of the statutory supervisory committee of PELSA, Petrobras Energía Internacional S.A., World Energy Business S.A. and Propyme SGR. She is also President of the Commission for the Study of the Difficulties of Disabled Professionals of the Professional Counsel of Economical Sciences and Treasurer of an accountant’s professional organization.
Mariana P. Ardizzone (43) earned her law degree from the UBA. She holds a Master of Laws degree from the University of Michigan a post-graduate degree in Business Administration and Electric Energy and Natural Gas Markets at the Instituto Tecnológico de Buenos Aires. She is a member of the Association of International Petroleum Negotiators and the Rocky Mountain Mineral Law Foundation. Since July 2001, she has been an associate with Maciel, Norman & Asociados in Buenos Aires.
María Laura Maciel (52) earned her law degree from the Universidad Católica Argentina. She is currently an associate with Maciel, Norman & Asociados in Buenos Aires, specializing in the general aviation law, and aircraft leasing and financing contracts, air transport, regulatory issues, air freight, and cargo matters in particular. She completed postgraduate courses in private international law and in aviation law at American University in Washington D.C. (1986), and postgraduate courses with the International Association of Air Transportation, Montreal, Canada (2004-2005).
Total compensation for the members of the Statutory Supervisory Committee of PESA in 2014 was Ps. 104 million.
EMPLOYEES
The following table sets forth the number of PESA employees by business segment for the fiscal years ended December 31, 2014, 2013 and 2012.
| | | | | | | | | | | | |
| | | As of December 31, | |
| | | 2014 | | | 2013 | | | 2012 | |
Oil and Gas Exploration and Production | | | 394 | | | | 492 | | | | 499 | |
Refining and Distribution | | | 1,193 | | | | 1,217 | | | | 1,320 | |
Petrochemicals | | | 645 | | | | 642 | | | | 635 | |
Gas and Energy | | | 100 | | | | 21 | | | | 23 | |
Corporate | | | 540 | | | | 555 | | | | 671 | |
| | | | | | | | | | | | |
Total | | | 2,872 | | | | 2,927 | | | | 3,148 | |
| | | | | | | | | | | | |
As of December 31, 2014, approximately 52% of our workforce consisted of members of labor unions that had entered into collective bargaining agreements with the Company and our subsidiaries. We have historically maintained good relations with our employees and labor unions. Between March and June 2013 we experienced trade union conflicts at the Zárate Plant. During 2014 trade union conflicts did not significantly affect our operations and were mostly related to industry-wide actions. During 2012, 2013 and 2014, we conducted different negotiations with unionized employees engaged in upstream and downstream operations in Argentina. See “Item 3. Key Information—Risk Factors—Factors Relating to Our Business—We could be subject to organized labor action.”
123
Argentine labor law currently obligates private sector businesses to maintain certain wage levels and provide certain benefits to their employees. We cannot assure that the Argentine government will not in the future adopt measures requiring employers to offer increased wages or benefits, or that the employees of contractors we employ and/or unions to which they belong will not directly solicit such increases from us.
PESA maintains an employee defined contribution plan and two defined benefit pension plans. See Note 23 to our Audited Consolidated Financial Statements.
SHARE OWNERSHIP
To our knowledge, none of our directors or members of our senior management owns more than 1% of PESA’s outstanding shares.
| Item 7. | MAJOR SHAREHOLDERS AND RELATED PARTY TRANSACTIONS |
MAJOR SHAREHOLDERS
Our share capital consists of 2,019,236,820 Class B shares, which have a nominal value of Ps.1.00, and are each entitled to one vote per share.
Petrobras, through its subsidiary PPSL, holds 67.2% of the outstanding shares of PESA.
The table below sets forth certain information as of March 31, 2015 with respect to the ownership of PESA’s capital stock by each shareholder who is known to us to be the owner of more than 5% of such shares.
| | | | | | | | |
| | | Class B Shares as of March 31, 2015 | |
Shareholder | | Number of Shares | | | % of the Total
Outstanding Shares | |
PPSL | | | 1,356,791,556 | | | | 67.2 | % |
ANSES | | | 239,277,004 | | | | 11.8 | % (1) |
| (1) | Corresponds to holdings identified in information provided by Caja de Valores as of March 31, 2015. With respect to possible holdings in the form of ADSs on the NYSE, such information is not available. |
On November 20, 2008, the Argentine Congress enacted Law No. 26,425, unifying the Argentine pension and retirement system into a system publicly administered by the ANSES and eliminating the retirement savings system previously administered by private pension funds under the supervision of a governmental agency. In accordance with the new law, private pension funds transferred all of the assets administered by them under the retirement savings system to the ANSES. As of October 31, 2008, these funds held 13% of the outstanding shares of one of our predecessor companies, PEPSA. Based on Law No. 26,425 , the ANSES was subject to the same investment rules, prohibitions and restrictions that were applicable to the Argentine private pension funds under the retirement savings system, including Sections 75 and 76 of Law No. 24,241, which limited the voting rights of private pension funds in shareholders’ meetings to 5% of the relevant company’s shares. On April 13, 2011, paragraph f) of Section 76 of Law No. 24,421 was repealed by Decree No. 441/11, which provides that the ANSES may fully exercise its voting rights in the companies in which it has an interest without the 5% limitation described above. Under such decree, the ANSES may be able to appoint representatives to the boards of directors of companies according to the ANSES’ holding of shares. Pursuant to Decree No. 1,278/12, issued by the Executive Branch on July 25, 2012, these representatives are to report directly to the Ministry of Economy and are subject to a mandatory information-sharing regime, under which, among other obligations, they must immediately inform the Ministry of Economy of the agenda for each board of directors meeting and provide related documentation.
As of April 15, 2015, there were 19 registered holders of our ADSs in the United States and 27,194,774 of our ADSs were outstanding. Since certain of our ADSs are held by brokers or other nominees, the number of direct record holders in the United States may not be fully indicative of the number of direct beneficial owners in the United States of our ADSs, or of where the direct beneficial owners of such ADSs are resident. We have no information concerning holders with registered addresses in the United States that hold our shares which are not represented by ADSs.
RELATED PARTY TRANSACTIONS
General conditions
Related party transactions are carried out in the ordinary course of our operations at market conditions. We believe that the terms of these transactions are comparable to those offered by or that could be obtained from non-related third parties.
124
Acquisition of companies
On May 31, 2012, we agreed to acquire an additional 39.671% equity interest in PELSA from our shared controlling company PPSL for an amount of U.S.$249.4 million. As from such date, we have exercised control over PELSA with a total shareholding of 58.881%.
The price agreed between the parties further includes a contingent obligation in favor of the seller for a period of ten years from the acquisition to reflect the value of any identification of non-conventional resources in the commercially exploitable areas of Entre Lomas, Bajada del Palo, Agua Amarga and Charco del Palenque. The amount of such compensation would be determined considering the market value of those resources to the valuation date, and the related valuation study would be conducted by an internationally recognized independent evaluator hired by agreement between the parties. At the date of issuance of this Annual Report, non-conventional commercially exploitable resources have not been identified, for which reason the Company has not recognized liabilities related to this part of the transaction. See Note 17.5 to our Audited Consolidated Financial Statements and Exhibit 5.0 to this Annual Report.
Sales of companies
On March 31, 2011, through our subsidiary Petrobras Energía Internacional S.A., we agreed to sell our indirect interest in Innova to Petrobras for a total price of U.S.$332 million, which sale implied the discontinuation of our operations in Brazil and resulted in a gain of Ps.723 million before considering the effects of income taxes and the reclassification of deferred results of Ps.134 million for IFRS purposes. In April 2011, we received U.S.$228 million of the sale price, and in October 2013, the remaining U.S.$104 million.
Financing
We have entered into a number of financing arrangements with subsidiaries of Petrobras, as detailed below. In 2007, we issued U.S.$300 million principal amount of Series S corporate bonds, secured by a Standby Purchase Agreement provided by Petrobras. This bond matures in May 2017 and accrues interest at a 5.87% annual rate. See “ “Item 5. Operating and Financial Review and Prospects—Description of Indebtedness.”
In February 2008, we approved the placement of a short-term financial surplus in PIB BV, in an amount of up to U.S.$300 million, at a nominal annual interest rate (payable monthly) equivalent to 30-day LIBOR plus 0.15%, due July 2008. The loan was partially renewed at maturity for U.S.$200 million. In December 2008, the outstanding balance was refinanced in part by two new loans totaling U.S.$120 million: (i) a U.S.$107 million loan between PIB BV and PESA and (ii) a U.S.$13 million loan between PIB BV and Petrobras Holding Austria GMBH, a subsidiary of PESA, both pre-payable and maturing in December 2009. U.S.$30 million was paid on these loans before maturity and U.S.$90 million was renewed for subsequent periods until ultimately being cancelled in May 2012.
Commercial operations
In the ordinary course of business, we enter into transactions with Petrobras associates to import and export crude oil and related oil products, at determinable market prices and terms, particularly with Braskem and Petrobras Global Trading BV.
These sales are undertaken in the ordinary course of business and at determinable market terms and prices.
The outstanding balances from our transactions with related companies (including companies under joint control) as of December 31, 2014, 2013 and 2012 are as follows (in millions of pesos):
| | | | | | | | | | | | | | | | | | | | |
| | | 2014 | |
| | | Current | | | Non-current | |
Company | | Trade
Receivables | | | Other
Receivables | | | Accounts
Payable | | | Provisions | | | Provisions | |
Associates | | | | | | | | | | | | | | | | | | | | |
OCP | | | — | | | | — | | | | — | | | | 130 | | | | 299 | |
Refinor | | | 13 | | | | 10 | | | | 8 | | | | — | | | | — | |
Other | | | — | | | | 84 | | | | 7 | | | | 2 | | | | — | |
| | | | | | | | | | | | | | | | | | | | |
| | | 13 | | | | 94 | | | | 15 | | | | 132 | | | | 299 | |
| | | | | | | | | | | | | | | | | | | | |
Entities under joint control | | | | | | | | | | | | | | | | | | | | |
TGS | | | 39 | | | | — | | | | 22 | | | | — | | | | — | |
| | | | | | | | | | | | | | | | | | | | |
| | | 39 | | | | — | | | | 22 | | | | — | | | | — | |
| | | | | | | | | | | | | | | | | | | | |
125
| | | | | | | | | | | | | | | | | | | | |
| | | 2014 | |
| | | Current | | | Non-current | |
Company | | Trade
Receivables | | | Other
Receivables | | | Accounts
Payable | | | Provisions | | | Provisions | |
Petroleo Brasileiro Group Companies | | | | | | | | | | | | | | | | | | | | |
Petrobras Internacional - Braspetro B.V. | | | — | | | | .240 | | | | — | | | | — | | | | — | |
Petrobras Venezuela Inversiones y Servicios S.A. | | | — | | | | — | | | | — | | | | 36 | | | | — | |
Petrobras Global Trading B.V. | | | 8 | | | | — | | | | — | | | | — | | | | — | |
Petroleo Brasileiro | | | 4 | | | | 15 | | | | 162 | | | | 12 | | | | — | |
Other | | | 3 | | | | 91 | | | | 8 | | | | 7 | | | | — | |
| | | | | | | | | | | | | | | | | | | | |
| | | 15 | | | | 346 | | | | 170 | | | | 55 | | | | — | |
| | | | | | | | | | | | | | | | | | | | |
Total | | | 67 | | | | 440 | | | | 207 | | | | 187 | | | | 299 | |
| | | | | | | | | | | | | | | | | | | | |
| | | | | | | | | | | | | | | | | | | | | | | | |
| | | 2013 | |
| | | Current | | | Non-current | |
Company | | Trade
Receivables | | | Other
Receivables | | | Accounts
Payable | | | Provisions | | | Other
Investments | | | Provisions | |
Associates | | | | | | | | | | | | | | | | |
OCP | | | — | | | | — | | | | — | | | | 92 | | | | 127 | | | | 288 | |
Refinor | | | 4 | | | | 13 | | | | 7 | | | | — | | | | — | | | | — | |
Other | | | 6 | | | | 109 | | | | 6 | | | | 7 | | | | 1 | | | | — | |
| | | | | | | | | | | | | | | | | | | | | | | | |
| | | 10 | | | | 122 | | | | 13 | | | | 99 | | | | 128 | | | | 288 | |
| | | | | | | | | | | | | | | | | | | | | | | | |
Entities under joint control | | | | | | | | | | | | | | | | |
TGS | | | 21 | | | | 8 | | | | 12 | | | | — | | | | — | | | | — | |
| | | | | | | | | | | | | | | | | | | | | | | | |
| | | 21 | | | | 8 | | | | 12 | | | | — | | | | — | | | | — | |
| | | | | | | | | | | | | | | | | | | | | | | | |
Petroleo Brasileiro Group Companies | | | | | | | | | | | | | | | | |
Braskem S.A. | | | — | | | | — | | | | 60 | | | | — | | | | — | | | | — | |
Petrobras Internacional - Braspetro B.V. | | | — | | | | 237 | | | | — | | | | — | | | | — | | | | — | |
Petrobras Venezuela Inversiones y Servicios S.A. | | | — | | | | — | | | | — | | | | 16 | | | | — | | | | — | |
Petroleo Brasileiro | | | 1 | | | | 3 | | | | 144 | | | | — | | | | — | | | | — | |
Other | | | 11 | | | | 39 | | | | 10 | | | | — | | | | — | | | | — | |
| | | | | | | | | | | | | | | | | | | | | | | | |
| | | 12 | | | | 279 | | | | 214 | | | | 16 | | | | — | | | | — | |
| | | | | | | | | | | | | | | | | | | | | | | | |
Total | | | 43 | | | | 409 | | | | 239 | | | | 115 | | | | 128 | | | | 288 | |
| | | | | | | | | | | | | | | | | | | | | | | | |
| | | | | | | | | | | | | | | | | | | | | | | | |
| | | 2012 | |
| | | Current | | | Non-current | |
Company | | Trade
Receivables | | | Other
Receivables | | | Accounts
Payable | | | Provisions | | | Other
Investments | | | Provisions | |
Associates | | | | | | | | | | | | | | | | | | | | | | | | |
OCP | | | — | | | | — | | | | — | | | | 97 | | | | 97 | | | | 283 | |
Refinor | | | 9 | | | | 14 | | | | 22 | | | | — | | | | — | | | | — | |
Other | | | 1 | | | | 8 | | | | 10 | | | | 9 | | | | 1 | | | | — | |
| | | | | | | | | | | | | | | | | | | | | | | | |
| | | 10 | | | | 22 | | | | 32 | | | | 106 | | | | 98 | | | | 283 | |
| | | | | | | | | | | | | | | | | | | | | | | | |
Entities under joint control | | | | | | | | | | | | | | | | | | | | | | | | |
TGS | | | 49 | | | | 6 | | | | 39 | | | | — | | | | — | | | | — | |
| | | | | | | | | | | | | | | | | | | | | | | | |
| | | 49 | | | | 6 | | | | 39 | | | | — | | | | — | | | | — | |
| | | | | | | | | | | | | | | | | | | | | | | | |
Petroleo Brasileiro Group Companies | | | | | | | | | | | | | | | | | | | | | | | | |
Braskem S.A. | | | — | | | | — | | | | 16 | | | | — | | | | — | | | | — | |
Petrobras Internacional - Braspetro B.V. | | | — | | | | 152 | | | | — | | | | — | | | | — | | | | — | |
Petrobras Venezuela Inversiones y Servicios S.A. | | | — | | | | — | | | | — | | | | 31 | | | | — | | | | — | |
| | | | | | |
Petroleo Brasileiro | | | — | | | | 425 | | | | 85 | | | | — | | | | — | | | | — | |
Other | | | 33 | | | | 58 | | | | — | | | | — | | | | — | | | | — | |
| | | | | | | | | | | | | | | | | | | | | | | | |
| | | 33 | | | | 635 | | | | 101 | | | | 31 | | | | — | | | | — | |
| | | | | | | | | | | | | | | | | | | | | | | | |
Total | | | 92 | | | | 663 | | | | 172 | | | | 137 | | | | 98 | | | | 283 | |
| | | | | | | | | | | | | | | | | | | | | | | | |
126
The main transactions with related companies (including entities under joint control) for the fiscal years ended December 31, 2014, 2013 and 2012 are as follows (in millions of pesos):
| | | | | | | | | | | | | | | | | | | | | | | | |
| | | 2014 | | | 2013 | | | 2012 | |
Company | | Purchases | | | Sales | | | Purchases | | | Sales | | | Purchases | | | Sales | |
Associates | | | | | | | | | | | | | | | | | | | | | | | | |
Oldelval | | | 77 | | | | 4 | | | | 46 | | | | 3 | | | | 37 | | | | 3 | |
PELSA(1) | | | — | | | | — | | | | — | | | | — | | | | 5 | | | | 2 | |
Refinor | | | 151 | | | | 67 | | | | 86 | | | | 42 | | | | 124 | | | | 35 | |
| | | | | | | | | | | | | | | | | | | | | | | | |
| | | 228 | | | | 71 | | | | 132 | | | | 45 | | | | 166 | | | | 40 | |
| | | | | | | | | | | | | | | | | | | | | | | | |
Entities under joint control | | | | | | | | | | | | | | | | | | | | | | | | |
TGS | | | 88 | | | | 221 | | | | 68 | | | | 202 | | | | 82 | | | | 91 | |
| | | | | | | | | | | | | | | | | | | | | | | | |
| | | 88 | | | | 221 | | | | 68 | | | | 202 | | | | 82 | | | | 91 | |
| | | | | | | | | | | | | | | | | | | | | | | | |
Petroleo Brasileiro Group Companies | | | | | | | | | | | | | | | | | | | | | | | | |
Braskem (Copesul) | | | 416 | | | | — | | | | 471 | | | | — | | | | 646 | | | | — | |
Petroleo Brasileiro | | | 40 | | | | 5 | | | | 122 | | | | 17 | | | | 66 | | | | 28 | |
Compañía Mega S.A. | | | — | | | | 18 | | | | — | | | | 7 | | | | — | | | | 7 | |
Petrobras Internacional - Braspetro B.V. | | | — | | | | — | | | | — | | | | — | | | | 80 | | | | — | |
Petrobras Paraguay Operaciones y Logística S.R.L | | | — | | | | 86 | | | | — | | | | 47 | | | | — | | | | 46 | |
Petrobras Global Trading B.V. | | | 65 | | | | 35 | | | | 41 | | | | — | | | | 192 | | | | 27 | |
Petrobras Chile Distribución Limitada | | | — | | | | 77 | | | | — | | | | 27 | | | | — | | | | — | |
Other | | | 4 | | | | 2 | | | | 3 | | | | 173 | | | | 4 | | | | 161 | |
| | | | | | | | | | | | | | | | | | | | | | | | |
| | | 525 | | | | 223 | | | | 637 | | | | 271 | | | | 988 | | | | 269 | |
| | | | | | | | | | | | | | | | | | | | | | | | |
Total | | | 841 | | | | 515 | | | | 837 | | | | 518 | | | | 1,236 | | | | 400 | |
| | | | | | | | | | | | | | | | | | | | | | | | |
| (1) | Through May 31, 2012, due to the acquisition of a controlling interest in PELSA as of such date. |
We have not entered into any other material related party transactions.
127
| Item 8. | FINANCIAL INFORMATION |
CONSOLIDATED FINANCIAL STATEMENTS
See “Item 18. Financial Statements.”
LEGAL PROCEEDINGS
We are involved in various litigation and regulatory proceedings arising in the ordinary course of our business. We do not believe that any of these proceedings is material to our operations or financial condition.
DIVIDENDS
We may only pay dividends from our retained earnings that are reflected in our annual audited consolidated financial statements as approved at our respective annual general regular shareholders’ meetings. Payment of cash dividends depends upon our financial position, results of operations, cash requirements (including capital expenditures and payments of debt service), retained earnings minimum requirements and other requirements imposed by Argentine law, and upon any other factors deemed relevant by our Board of Directors for the purpose of resolving upon the declaration of dividends.
While our Board of Directors may declare interim dividends pursuant to an audited interim-period financial statement, our Board of Directors or our Statutory Audit Committee would be jointly and severally liable for any payments made in excess of retained earnings at fiscal year closing. The declaration, amount and payment of dividends to shareholders are subject to approval by a regular shareholders’ meeting.
Under our bylaws, our net income shall be allocated as follows: (a) 5% to a legal reserve, until that reserve equals 20% of outstanding capital; (b) to compensation of the members of the Board of Directors and Statutory Supervisory Committee; (c) to dividends on preferred stock, if any; and then (d) to dividends on common stock or to a voluntary reserve, or to a new account, or as otherwise determined by the shareholders’ meeting. Dividends shall be paid within the year of their declaration and distributed pro rata to the number of common shares held by each shareholder.
Holders of ADSs will be entitled to receive any dividends payable in respect of our underlying Class B shares. We will pay cash dividends to the depositary in pesos, although we reserve the right to pay cash dividends in any other currency, including U.S. dollars. The deposit agreement provides that the depositary will convert cash dividends received by the depositary in pesos into U.S. dollars and, after a deduction or upon payment of fees and expenses of the depositary and any applicable taxes, will make payment to holders of the applicable ADSs in U.S. dollars.
Under Law No. 25,063, any dividends distributed, in cash or in kind, in excess of the taxable income accumulated as of the year-end immediately prior to the respective payment or distribution date, will be subject to a 35% (thirty-five percent) income tax withholding, as single and definitive payment. For this purpose, taxable income is deemed to be that resulting from adding the income as determined under the general provisions of the income tax law and the dividends or income obtained from other corporations not taken into account in determining the former for the same tax period or periods.
Under the amendment introduced by Law No. 26,893 (regulated by Regulatory Decree No. 2,334/13), any dividend payments to our Argentine individual shareholders and undivided estates as well to our foreign shareholders are subject to income tax at a 10% (ten percent) rate, as one-time and definitive payment, without prejudice to the 35% (thirty-five percent) withholding as may be applicable under Law No. 25,063. See “Item 10. Additional Information—Taxation—Argentine Taxes.”
Pursuant to the resolutions adopted at a shareholders’ meeting held on March 29, 2012, in 2012 we paid cash dividends in the amount of Ps.211 million.
PESA’s shareholders’ meeting held on March 21, 2013: (a) approved (i) in accordance with legal requirements an increase of Ps.524 million in the reserve for future investments and the transfer to the legal reserve of Ps.31 million based on our results in 2012, and (ii) a net decrease of Ps.361 million in the reserve for future investments (consisting of an increase in the amount of Ps.2,638 million and a decrease in the amount of Ps.2,999 million) and an increase of Ps.361 million in the reserve for future dividends; and (b) delegated with the Board of Directors the determination of the actual dividend distribution date and amount.
PESA’s shareholders’ meeting held on March 27, 2014: (a) approved (i) in accordance with legal requirements, an increase of Ps.714 million in the reserve for future investments and the transfer to the legal reserve of Ps.38 million based on our results in 2013, and (ii) a net decrease of Ps.225 million in the reserve for future investments (consisting of an increase in the amount of Ps.2,299 million and a decrease in the amount of Ps.2,524 million), and an increase of Ps.225 million in the reserve for future dividends; and (b) delegated with the Board of Directors the determination of the actual dividend distribution date and amount.
PESA’s shareholders’ meeting held on March 19, 2015: (a) approved (i) in accordance with legal requirements, an increase of Ps.435 million in the reserve for future investments and the transfer to the legal reserve of Ps.23 million based on our results in 2014,
128
and (ii) a net decrease of Ps.137 million in the reserve for future investments (consisting of an increase in the amount of Ps.3,716 million and a decrease in the amount of Ps.3,853 million), and an increase of Ps.137 million in the reserve for future dividends;and (b) delegated with the Board of Directors the determination of the actual dividend distribution date and amount. As a result of the foregoing, as of the date of this Annual Report, the reserve for future dividends amounts to Ps.1,296 million and the reserve for future investments amounts to Ps.5,731 million.
Our ADSs, each representing ten Class B shares, are listed on the NYSE under the trading symbol “PZE.” The ADSs began trading on the NYSE on September 30, 2009 following the completion of the merger and exchange of shares between PESA and PEPSA, and were issued by Citibank, N.A. as depositary.
Our Class B shares have been listed on the Buenos Aires Stock Market since 1956. Currently the trading symbol thereof is “PESA.”
The following table sets forth, for the periods indicated, the high and low closing sales price of the ADSs on the NYSE and the Class B shares of PESA on the Buenos Aires Stock Market:
| | | | | | | | | | | | | | | | |
| | | ADS(1) (3) | | | Class B share (2) | |
| Full Year | | High | | | Low | | | High | | | Low | |
2009 | | | 19.40 | (3) | | | 15.54 | (3) | | | 7.55 | | | | 5.20 | |
2010 | | | 26.38 | | | | 12.91 | | | | 10.65 | | | | 5.20 | |
2011 | | | 28.20 | | | | 12.16 | | | | 11.35 | | | | 5.78 | |
2012(4) | | | 17.13 | | | | 3.89 | | | | 7.90 | | | | 2.51 | |
2013 | | | 7.24 | | | | 3.47 | | | | 6.39 | | | | 2.79 | |
2014 | | | 7.20 | | | | 4.34 | | | | 9.93 | | | | 4.77 | |
2013: | | | | | | | | | | | | | | | | |
First Quarter | | | 5.98 | | | | 4.64 | | | | 4.49 | | | | 3.40 | |
Second Quarter | | | 4.94 | | | | 3.47 | | | | 4.57 | | | | 2.86 | |
Third Quarter | | | 5.64 | | | | 3.55 | | | | 5.05 | | | | 2.79 | |
Fourth Quarter | | | 7.24 | | | | 5.34 | | | | 6.39 | | | | 4.94 | |
2014: | | | | | | | | | | | | | | | | |
First Quarter | | | 5.58 | | | | 4.34 | | | | 5.50 | | | | 4.77 | |
Second Quarter | | | 6.83 | | | | 5.10 | | | | 7.08 | | | | 5.05 | |
Third Quarter | | | 7.20 | | | | 6.04 | | | | 9.93 | | | | 6.36 | |
Fourth Quarter | | | 6.78 | | | | 4.55 | | | | 9.10 | | | | 5.10 | |
November 2014 | | | 6.78 | | | | 5.99 | | | | 8.90 | | | | 7.20 | |
December 2014 | | | 6.00 | | | | 4.55 | | | | 6.95 | | | | 5.10 | |
2015: | | | | | | | | | | | | | | | | |
First Quarter | | | 7.32 | | | | 4.44 | | | | 8.62 | | | | 5.24 | |
January 2015 | | | 4.96 | | | | 4.44 | | | | 6.02 | | | | 5.24 | |
February 2015 | | | 5.93 | | | | 4.92 | | | | 7.15 | | | | 5.85 | |
March 2015 | | | 7.32 | | | | 5.76 | | | | 8.62 | | | | 6.73 | |
April 2015(5) | | | 7.74 | | | | 6.86 | | | | 9.28 | | | | 8.17 | |
| (3) | Since September 30, 2009. |
| (4) | The price since September 2012 reflects the effects of a capital increase approved on March 29, 2012 by the shareholders of the Company and carried out starting September 26, 2012. This increase represented the partial capitalization of retained earnings of the Company, and had the effect of doubling the number of our Class B shares outstanding. |
| (5) | Through April 15, 2015. |
129
MARKETS
Buenos Aires Stock Market
The Buenos Aires Stock Market, which is affiliated with the Buenos Aires Stock Exchange, is the largest stock market in Argentina. The Buenos Aires Stock Market is a corporation whose shareholder members are the only individuals and entities authorized to trade in the securities listed on the Buenos Aires Stock Exchange. Trading on the Buenos Aires Stock Exchange floor is conducted by continuous open outcry and a computer-based trading system called SINAC from 11:00 a.m. to 5:00 p.m. each business day. The Buenos Aires Stock Exchange also operates an electronic trading market system from 11:00 a.m. to 5:00 p.m. each business day.
To control price volatility, the Buenos Aires Stock Market operates a system by which trading of a security is suspended for 15 minutes whenever the price of such security changes 10% from its last closing price. Once the 15 minutes have elapsed, trading is resumed. From that point on during a trading day, trading will be suspended for ten minutes whenever the trading price changes 5% from the last suspended price.
Capital Markets Law — Law No. 26,831
On December 28, 2012, the Capital Markets Law (Law No. 26,831) (the “Capital Markets Law”) was published in the Official Gazette. This law eliminates self-regulation of the capital markets and grants powers to the CNV, to request reports and documents, to conduct investigations and inspections of natural and legal persons under its control, to call such persons to testify and take informational and testimonial declarations, among others. Likewise, if as a result of investigations performed, it is determined that non-controlling interests or the interests of holders of securities subject to public offering have been harmed, the CNV, according to the severity of the harm determined to have been caused, may appoint overseers with the power to veto resolutions adopted by the boards of directors and/or suspend the boards of directors of relevant companies for a maximum period of 180 days until the deficiencies found are determined to have been remedied.
Certain information regarding the Buenos Aires Stock Market is set forth in the table below:
| | | | | | | | | | | | | | | | | | | | |
| | | 2014 | | | 2013 | | | 2012 | | | 2011 | | | 2010 | |
Market capitalization (billions of pesos) | | | 3,893 | | | | 3,356 | | | | 2,314 | | | | 1,610 | | | | 1,900 | |
As a percentage of GDP(1) | | | 89 | % | | | 99 | % | | | 84 | % | | | 70 | % | | | 105 | % |
Volume (in millions of pesos) | | | 39,813 | | | | 18,945 | | | | 9,954 | | | | 13,579 | | | | 14,955 | |
Average daily trading volume (in millions of pesos) | | | 165.20 | | | | 78.60 | | | | 41.30 | | | | 55.40 | | | | 60.79 | |
Number of listed companies(1) | | | 101 | | | | 105 | | | | 104 | | | | 105 | | | | 107 | |
| (1) | End-of-year figures for trading on the Buenos Aires Stock Exchange. |
Sources: The Bolsa de Comercio de Buenos Aires, the CNV and the Instituto Argentino de Mercado de Capitales.
130
| Item 10. | ADDITIONAL INFORMATION |
MEMORANDUM AND ARTICLES OF ASSOCIATION
Registration and Merger
Our bylaws (estatutos sociales) were authorized by Decree No. 17105 dated June 18, 1947, and registered with the IGJ on November 17, 1947 under No. 759, Page 569, Book 47, Volume A of Argentine Bylaws. Amendments to the bylaws were authorized as indicated below, and registered as amended with the Public Registry of Commerce as follows: (1) as amended and authorized by Decree No. 29,460 dated September 24, 1948, and registered on May 27, 1949, under No. 369, Page 332, Book 48, Volume A, of Argentine Bylaws; (2) as amended and authorized by Decree No. 10,460 dated June 24, 1954, and registered on October 4, 1954, under No. 1,323, Page 508, Book 49, Volume A, of Argentine Bylaws; (3) as amended and authorized by Decree No. 3,789 dated February 28, 1956, and registered on September 5, 1956, under No. 1,686, Page 238, Book 50, Volume A, of Argentine Bylaws; (4) as amended and authorized by Decree No. 3,773 dated August 11, 1958, and registered on March 2, 1959, under No. 289, Page 391, Book 51, Volume A of Argentine Bylaws; (5) as amended and authorized by Decree No. 5,405 of the Argentine government dated June 12, 1962, and registered on September 28, 1962, under No. 2,161, Page 347, Book 55, Volume A of Argentine Bylaws; (6) as amended and authorized by Resolution issued by PJ (Board of Legal Entities) No. 001129, Ministry of Education and Justice, dated June 19, 1963, and registered on September 24, 1963, under No. 1,656, Page 109, Book 58, Volume A of Argentine Bylaws; (7) as amended and authorized by IGJ Resolution No. 6,307, Ministry of Justice, dated March 13, 1970, and registered on May 14, 1970, under No. 1,782, Page 56, Book 72, Volume A of Argentine Stock Corporations Bylaws; (8) as amended and authorized by I.G.P.J. (Board of Legal Entities) Resolution No. 2,116, Superintendent of Legal Entities, dated April 29, 1971, and registered on July 7, 1971, under No. 2,286, Page 287, Book 74, Volume A of Argentine Stock Corporations Bylaws; (9) as amended and authorized by I.G.P.J. (Board of Legal Entities) Resolution No. 2,687, Superintendent of Legal Entities, dated August 28, 1972, and registered on December 28, 1972, under No. 4,555, Page 479, Book 77, Volume A of Argentine Stock Corporations Bylaws; (10) as amended and registered on November 16, 1976, under No. 3,917, Book 84, Volume A of Argentine Stock Corporations Bylaws; (11) as amended and registered on July 8, 1977, under No. 2,237, Book 87, Volume A of Argentine Stock Corporations Bylaws; (12) as amended and registered on December 21, 1978, under No. 4,912, Book 88, Volume A of Argentine Stock Corporations Bylaws; (13) as amended and registered on December 6, 1979, under No. 4,401, Book 90, Volume A of Argentine Stock Corporations Bylaws; (14) as amended and registered on March 25, 1981, under No. 1,105, Book 97, Volume A of Stock Corporations; (15) as amended and registered on February 21, 1983, under No. 545, Book 98, Volume A of Argentine Argentine Stock Corporations; (16) as amended and registered on March 21, 1984, under No. 1,551, Book 99, Volume A of Argentine Stock Corporations; (17) as amended and registered on March 31, 1986, under No. 1,739, Book 101, Volume A of Argentine Stock Corporations; (18) as amended and registered on January 22, 1992, under No. 372, Book 110, Volume A of Argentine Stock Corporations; (19) as amended and registered on October 3, 1995, under No. 9223, Book 117, Volume A of Argentine Stock Corporations; (20) as amended registered on November 11, 1996, under No. 11,209, Book 120, Volume A of Argentine Stock Corporations; (21) as amended and registered on May 15, 1997, under No. 4894, Book 121, Volume A of Argentine Stock Corporations; (22) as amended and registered on June 11, 1998 under No. 3812, Book 1, Volume of Corporations; (23) as amended and registered on July 14, 2000 under No. 10116, Book 11, Volume of Corporations; (24) as amended and registered on October 26, 2000 under No. 16073, Book 13, Volume of Corporations; (25) as amended and registered on September 3, 2002, under No. 9737, Book 18, Volume of Corporations; (26) as amended and registered on February 12, 2003, under No. 2042, Book 19, Volume of Corporations; (27) as amended and registered on July 4, 2003, under No. 9191, Book 22, Volume of Corporations; (28) as amended and registered on August 22, 2003, under No. 11892, Book 22, Volume of Corporations; (29) as amended and registered on May 3, 2004, under No. 5377, Book 24, Volume of Corporations; (30) as amended and registered on November 29, 2004 under No. 15158, Book 26, Volume of Corporations; (31) as amended and registered on June 30, 2005 under No. 7618, Book 28, Volume of Corporations; (32) as amended and registered on January 26, 2009 under No. 1537, Book 43, Volume of Corporations; (33) as amended and registered on August 4, 2009 under No. 12887, Book 45, Volume of Corporations; (34) as adopted by the extraordinary and regular shareholders’ meeting held on January 30, 2009, and to be registered in the Volume of Corporations; and (35) as adopted by the extraordinary and regular shareholders’ meeting held on March 27, 2009, and to be registered in the Volume of Corporations.
Objects and Purposes
Section 3 of our bylaws states that the object and purposes of the company is to do and engage in the following:
(a) perform the following operations:
| | (1) | explore, exploit, prospect for, detect, bore and drill hydrocarbons and any other kind of wells, as well as carry out activities related to mining extraction in general; |
| | (2) | purchase, sell, lease and operate drilling equipment, its spare parts and accessories and enter into any contract, to perform any act and carry out any operation related to mining extraction; |
| | (3) | manufacture, process, industrialize, purchase, sell, import, export and transport its own or third parties’ hydrocarbons and their by-products, whether they be liquid, solid or gaseous; and |
131
| | (4) | enter into any kind of contracts for work and/or of service related to the aforementioned activities; |
(b) commercial transactions through the import, export, purchase and sale, transportation and distribution of products and goods related to electric power and mining, including the exercise or performance of representations, commissions, consignments and agencies;
(c) financial transactions in general, including: loans and/or capital contributions to individuals or companies for present or future businesses; granting of bonds, guaranties and suretyships in favor of third parties; purchase and sale and management of shares, public bonds, debentures and other securities, except for the transactions stipulated in the limitations provided for in the Financial Entities Law and those transactions requiring public bidding;
(d) real estate transactions through the acquisition, sale, barter, construction, fractionation, exploitation and lease of urban and rural real estate, including cooperative property transactions and the creation of rights in rem;
(e) operation of navigation and maritime fluvial trade companies;
(f) power generation, transformation, transmission and distribution operations; and
(g) to render services or act as agent for itself or in favor of third parties.
In carrying out the aforementioned purposes and object, PESA has full capacity to perform any act, enter into any contract and carry out any transaction directly or indirectly related thereto.
Provisions of the Bylaws Relating to Directors
Section 9 of the bylaws states that the Board of Directors shall hold a meeting with the majority of its members present at the meeting, whether in person or remotely as long as they can each communicate among themselves through other means of simultaneous sound, image or word transmission, and shall adopt resolutions by the majority of the votes present thereat, including remote participants. The Board of Directors meets formally at least once every three months, and is composed of nine members. All members of the Board of Directors have one vote for any matter decided upon. For more information on the election of PESA’s Board of Directors, see “Item 6. Directors, Senior Management, and Employees—Directors and Senior Management—Petrobras Argentina S.A. Board of Directors.”
In accordance with our bylaws, in the event any members of the Board of Directors refrain from voting on account of having a conflict of interest or material interest in the matter at hand, the Board of Directors shall adopt resolutions by a majority of the members who did not refrain from voting for such reason. Participation and vote of remote participants as well as all transmission of data shall be registered in the minutes of the meetings. The Argentine Companies Law requires that directors refrain from voting on matters in which such director may have a conflict of interest.
Capital Stock
The description that follows provides a summary of the material provisions of our capital stock, in accordance with our bylaws and Argentine law and regulations.
Voting Rights
Each PESA Class B share entitles the holder to one vote.
All existing PESA Class A shares were converted into PESA Class B shares on March 11, 2009. There are no PESA Class A shares currently outstanding.
Cumulative Voting
Under the Argentine Companies Law, a shareholder is entitled to cumulative voting procedures for the election of up to one-third of the directors being elected. If any shareholder notifies us of its decision to exercise its cumulative voting rights no later than three business days prior to the date of a meeting, all shareholders are entitled, but not required, to exercise their cumulative voting rights. Under cumulative voting, the aggregate number of votes that a shareholder may cast is multiplied by the number of vacancies to be filled in the election, and each shareholder may allocate the total number of its votes among a number of candidates not to exceed one-third of the number of vacancies to be filled. Shareholders not exercising cumulative voting rights are entitled to cast the number of votes corresponding to their shares for each candidate. The implementation of a staggered board does not impede or prohibit the exercise of cumulative voting in any manner.
Preemptive Rights
In the event of a capital increase, a holder of existing common shares of a given class has a preemptive right to subscribe for a number of shares of the same class sufficient to maintain the holder’s existing proportionate holdings of shares of that class.
132
Preemptive rights also apply to the issuance of certain convertible securities (obligaciones negociables) but do not apply upon conversion of these securities. Holders of ADSs may be restricted in their ability to exercise preemptive rights if a prospectus under the Securities Act relating to those securities has not been filed or is not effective or an exemption from registration is not available. You should note that we are not obligated to file a registration statement with respect to the shares relating to preemptive or accretion rights. Preemptive rights are exercisable during the 30 days following the last publication of notice to the shareholders in the Official Gazette and an Argentine newspaper of wide circulation. Pursuant to the Argentine Companies Law, the 30-day period may be reduced to ten days by a decision of our shareholders adopted at an extraordinary shareholders’ meeting. Preemptive rights may be suspended or limited in extraordinary circumstances with the favorable vote of more than 50% of all outstanding voting shares at an extraordinary shareholders’ meeting at which all shares will be entitled to exercise one vote, regardless of whether there are shares with multiple votes where the purpose of the capital increases is to issue shares as consideration for a contribution of assets to the company or to repay outstanding obligations.
Shareholders who have exercised their preemptive rights and indicated their intention to exercise additional preemptive rights are entitled to accretion rights, pro rata to their respective subscriptions, with respect to any unsubscribed shares by other shareholders during the preemptive rights period, in accordance with the terms of Article 194 et seq. of the Argentine Companies Law. Shares not subscribed by the shareholders by virtue of their exercise of preemptive rights or accretion rights may be offered to third parties.
Appraisal Rights
Whenever our shareholders approve (1) a spinoff or merger in which we are not the surviving corporation, (2) a change in our corporate legal status, (3) a fundamental change in our corporate purpose, (4) a change of our domicile to a location outside Argentina, (5) a voluntary withdrawal from a public offering or delisting, (6) the continuation of our company in the case of a mandatory delisting or cancellation of the authorization for a public offering, (7) a capital increase approved by an extraordinary shareholders’ meeting which would require a disbursement by shareholders or (8) a total or partial recapitalization following a mandatory reduction of capital or liquidation, any shareholder that voted against this action may withdraw from our company and receive the book value of its shares, determined on the basis of our latest balance sheet prepared or that should have been prepared in accordance with Argentine laws and regulations, provided that this shareholder exercises its appraisal rights within the period set forth below. However, because of the absence of legal precedent directly on point, there is doubt as to whether holders of our ADSs will be able to exercise appraisal rights either directly or through the depositary with respect to Class B shares represented by our ADSs. Appraisal rights must be exercised within five days following the adjournment of the meeting at which the resolution was adopted, in the event that the dissenting shareholder voted against such resolution, or within 15 days following such adjournment if the dissenting shareholder did not attend such meeting and can prove that it was a shareholder on the date of such meeting. In the case of a merger or spinoff, appraisal rights may not be exercised if the shares to be received as a result of such transaction are authorized for public offering or listed. Appraisal rights are extinguished if the resolution giving rise to such rights is revoked at another shareholders’ meeting held within 60 days of the meeting at which the resolution was adopted.
Payment on the appraisal rights must be made within one year of the date of the shareholders’ meeting at which the resolution was adopted, except when the resolution was to delist our stock or to continue our company following our mandatory delisting, in which case the payment period is reduced to 60 days from the date of the related resolution.
Acquisition of Class B Shares by Class B Shareholders
Argentine law provides that if any person or group of persons acquires shares or securities convertible into shares representing at least three percent of a public company’s capital stock, then these persons must, within three days following the acquisition, give the company notice of the acquisition, irrespective of any additional notice requirements under applicable rules of any stock exchange or regulatory agency. The notice must state the acquisition dates and prices, the voting power acquired, the purpose of the acquisition and the intention of the acquiror (including, without limitation, whether it intends to increase its holding or to obtain control). This provision also applies to subsequent acquisitions involving a number of shares or securities convertible into shares representing at least three percent of the company’s capital stock.
Capital Increases and Reductions
Our capital stock may be increased by resolution of an ordinary shareholders’ meeting. Capital increases do not require an amendment of our bylaws, but must be approved by the CNV, published in the Official Gazette and registered with the Public Registry of Commerce. Capital reductions may be voluntary or mandatory. Voluntary reductions of capital must be approved by an extraordinary shareholders’ meeting and may take place only after notice is published and creditors are given an opportunity to obtain payment or collateralization of their claims or attachment. Reductions of capital are mandatory when losses have exceeded reserves or more than 50% of our stated capital.
Shares issued in connection with any increase in capital must be divided among the various classes in proportion to the number of shares of each class outstanding at the date of the issuance, provided that the number of shares of each class actually issued may vary based on the exercise of preemptive rights and additional preemptive rights in accordance with the procedure described in the preceding section.
133
Redemption and Repurchase
Our shares are subject to redemption in connection with a reduction in capital by the vote of a majority of shareholders at an extraordinary shareholders’ meeting. Any shares so redeemed must be cancelled by us.
We may repurchase fully paid shares of our capital stock with retained earnings or freely available reserves, upon a determination of the Board of Directors that this repurchase is necessary in order to avoid a material adverse effect to us. The Board of Directors’ determination must be explained to shareholders at the next annual shareholders’ meeting. We may also repurchase shares of our capital stock held by a company acquired by or merged with us. In either case, we are required to resell the shares purchased within one year and must give shareholders a preemptive right to purchase these shares. Any shares repurchased by us will not be considered in the determination of a quorum or a majority.
Preferred Shares
We may issue non-voting preferred shares or preferred shares with one vote per share. The economic preferences and rights of our preferred shares will be determined at the shareholders’ meeting authorizing the issue of the preferred shares. Non-voting preferred shares may vote one vote per share in the following circumstances: (1) if we are in default with respect to the payment of preferred share dividends, (2) if the events described under “—Meetings of Shareholders—Quorum and Voting Requirements” occur, or (3) if the preferred shares have been listed on a stock exchange and that listing is cancelled or suspended.
Liquidation
The liquidation of our Company may be carried out by our Board of Directors or by one or more liquidators appointed by the shareholders to wind up its affairs. In the event of liquidation, our assets will be applied to satisfy our debts and liabilities including liquidation expenses. Any remaining amounts will be distributed as follows: (1) the amount of the preferred shares issued shall be reimbursed at their paid-in, nominal value; (2) the amount of common shares shall be reimbursed at their paid-in, nominal value; (3) cumulative dividends in arrears on preferred shares shall be paid; and (4) the remaining balance shall be distributed pro rata among all holders of common shares.
Changes in Shareholder Rights
See “—Meetings of Shareholders” below.
Audit Committee
The bylaws of PESA state that the Company shall have an audit committee composed of three regular directors and an equal or smaller number of alternate members. For more details on our Audit Committee, see “Item 6. Directors, Senior Management and Employees—Board Practices—Audit Committee.”
Meetings of Shareholders
General
Shareholders’ meetings may be ordinary or extraordinary. We are required to hold an ordinary shareholders’ meeting within four months of the close of each fiscal year to consider the approval of our annual financial statements, the allocation of net income for the fiscal year, the approval of the reports of the Board of Directors and the Statutory Supervisory Committee and the election and remuneration of directors and members of the Statutory Supervisory Committee. Other matters that may be considered at an ordinary meeting include the responsibility of directors and members of the Statutory Supervisory Committee, capital increases and the issuance of certain corporate bonds. Extraordinary shareholders’ meetings may be called at any time to consider matters outside the scope of authority of an ordinary meeting, including amendment of the bylaws, issuance of debentures, early dissolution, merger, spinoff, reduction of capital stock and redemption of shares, changing our company from one type of legal entity to another and limitation of shareholders’ preemptive rights.
Notices
Notice of shareholders’ meetings must be published for five days in theBoletín Oficial (the official gazette of the Republic of Argentina), in an Argentine newspaper of wide circulation and in the publications of Argentine exchanges or securities markets in which our shares are traded, at least ten days prior to the date on which the meeting is to be held as per the Argentine Companies Law, and at least 20 days prior to the meeting as per Decree No. 677/01. The notice must include information regarding the type of meeting to be held, the date, time and place of the meeting and the agenda. If there is no quorum at the meeting, notice for a meeting on second call must be published for three days, at least eight days before the date of the second meeting, and such second meeting must be held
134
within 30 days of the date for which the first meeting was called. The first call and second call notices may be effected simultaneously in order for the meeting on second call to be held on the same day as the meeting on first call, but only in the case of ordinary shareholders’ meetings. Shareholders’ meetings may be validly held without notice if all shares of our outstanding capital stock are present and resolutions are adopted by unanimous vote.
The Board of Directors will determine appropriate publications for notice outside Argentina in accordance with requirements of jurisdictions and exchanges where our shares and ADSs are traded.
Quorum and Voting Requirements
The quorum for ordinary shareholder’s meetings on first call is a majority of the shares entitled to vote, and action may be taken by the affirmative vote of an absolute majority of the shares present that are entitled to vote on such action. If a quorum is not available, a second call meeting may be held at which action may be taken by the holders of an absolute majority of the shares present, regardless of the number of such shares. The quorum for extraordinary shareholders’ meetings on first call is 60% of the shares entitled to vote, and if such quorum is not available, a second call meeting may be held, for which there is no quorum requirement.
Action may be taken at extraordinary shareholders’ meetings by the affirmative vote of an absolute majority of shares present that are entitled to vote on such action, except that the approval of a majority of shares with voting rights is required in both first and second call for: (1) the transfer of our domicile outside Argentina, (2) a fundamental change of the corporate object set forth in the bylaws, (3) our anticipated dissolution, (4) the total or partial repayment of capital, (5) a merger of our company, if we are not the surviving entity, (6) a spinoff of our company, or (7) changing our corporate legal status.
Shareholders’ meetings may be called by the Board of Directors or the members of the Statutory Supervisory Committee whenever required by law or whenever they deem it necessary. Also, the Board of Directors or the members of the Statutory Supervisory Committee are required to call shareholders’ meetings upon the request of shareholders representing an aggregate of at least five percent of our outstanding capital stock. If the board or the Statutory Supervisory Committee fail to call a meeting following this request, a meeting may be ordered by the CNV or by the courts. In order to attend a meeting, a shareholder must deposit with us a certificate of book-entry shares registered in its name and issued by Caja de Valores at least three business days prior to the date on which the meeting is to be held. Shareholders may be represented by proxy. Proxies may not be granted to directors, members of the Statutory Supervisory Committee or officers or employees of our company.
Conflict of Interest
A shareholder who votes on a matter involving our company in which its interest conflicts with ours may, under Argentine law, be liable for damages to us resulting from its decision, but only if the transaction would not have been approved without its vote.
Limitations on Foreign Investment in Argentina
Under the Argentine Foreign Investment Law, as amended (the “FIL”), the purchase of stock by an individual or legal entity domiciled abroad or by a local company of foreign capital (as defined in the FIL) constitutes a foreign investment subject to the FIL. Foreign investments are generally unrestricted. However, foreign investments in certain industries are restricted to a certain percentage. No approval is necessary to purchase our Class B shares. The FIL does not limit the right of non-resident or foreign owners to hold or vote our Class B shares, and there are no restrictions in our bylaws limiting the rights of non-residents or non-Argentines to hold or vote our Class B shares.
However, General Resolution No. 7 passed in September 2003 by the IGJ and other related regulations set forth certain requirements for foreign entities registered with the IGJ. These regulations require, among other things, disclosure of information related to proprietary interests in assets located outside Argentina to be at least equivalent in value to those located inside Argentina. The entities must comply with these requirements in order to (1) perform activities on a regular basis through their Argentine branches (Section 118, Argentine Companies Law), or (2) exercise their ownership rights in Argentine Companies (Section 123, Argentine Companies Law). In cases where: (a) do not have assets outside Argentina; (b) the IGJ has concluded that the entities have non-current assets that are not materially significant compared to those non-current assets which are owned by them and located in Argentina; or (c) the entity’s address in Argentina becomes the place where this entity makes a majority of its decisions, corporate or otherwise, the entities may be required to amend and register their bylaws to comply with Argentine law, thereby becoming an Argentine entity subject to Argentine law according to Section 124 of the Argentine Companies Law. In addition, Argentine companies with shareholders consisting of such entities that fail to comply with these requirements may be subject to the following sanctions: (1) the IGJ may not register corporate decisions adopted by the Argentine company when its offshore shareholder votes as a shareholder and when that vote is essential in attaining a majority and any decisions made pursuant to such vote related to the approval of its annual balance sheet may be declared null and void for administrative purposes; (2) whether or not the vote of the offshore entity is necessary for purposes of determining quorum or majority, the IGJ may register the decision without considering that vote; and (3) the directors of the Argentine company may be held personally liable for actions taken by the Argentine company.
135
Change of Control
In 2001, the Argentine government issued Decree No. 677/01 (“Decree 677”) which, among other things, allowed listed companies to “opt out” of the rules mandating tender offers upon the occurrence of a change of control of a public company. According to Decree 677, any person or entity that directly or indirectly acquired a certain percentage of the voting shares of a public company with the intention of obtaining control was required to publicly offer to purchase all of the target’s outstanding shares. However, under Decree 677 listed companies were allowed to “opt out” of the mandatory tender offer requirement, provided that they did so expressly in their bylaws. We, with the approval of our shareholders, “opted out” of the mandatory tender offer requirement. Prospective acquirors could, nevertheless, voluntarily launch an offer for all of our shares.
In 2012, the Argentine government enacted the Capital Markets Law, which was regulated in 2013 by Resolution No. 622/2013 of the CNV. The new rules establish a general mandatory tender offer system applicable to all listed companies, with no possibility to opt out. To the extent that the application of this new rule to companies that had opted out of the tender offer requirement under the previous regime is not clear as of the filing date of this Annual Report, PESA cannot assess the outcome of potential future claims by any of our shareholders arising out of a change of control consummated in accordance with rights acquired under the previous regime.
MATERIAL CONTRACTS
We are party to a number of material financing agreements, including the underlying agreements for the company’s Global Bond Program, and letters of credit entered into to backstop certain financial commitments under the Ship or Pay contract with OCP. These agreements and other financing agreements are briefly described under “Item 5. Operating and Financial Review and Prospects—Off-Balance Sheet Transactions,” “Item 5. Operating and Financial Review and Prospects—Liquidity and Capital Resources—Financing activities” and “Item 5. Operating and Financial Review and Prospects—Liquidity and Capital Resources—Description of Indebtedness.”
On September 12, 2012, PESA appointed J.P. Morgan Chase Bank N.A. as depositary for the Company’s ADR program. The program was transferred from Citibank, N.A. to J.P. Morgan Chase Bank N.A. on September 13, 2012 and the contract has a duration of five years.
On July 13, 2012, in connection with the restructuring of CIESA’s indebtedness, CIESA, Grupo Pampa and PESA entered into (i) a settlement agreement and (ii) a fifth amendment to the CIESA Restructuring Agreement. See “Item 4. Information on the Company—Gas and Energy—Gas Transportation—TGS—Our Interest in TGS and Corporate Developments,” “Item 5. Operating and Financial Review and Prospects—Factors Affecting Our Consolidated Results of Operations—Regulation of the Energy Industry in Argentina—CIESA’s Debt Restructuring” and Exhibits 4.3 and 4.4 to this Annual Report.
Our agreements with related parties are described in “Related Party Transactions” under Item 7.
EXCHANGE CONTROLS
For more information on exchange controls imposed by the Argentine government, see “Item 3. Key Information—Exchange Rates,” “Item 3. Key Information—Exchange Controls” and “Item 5. Operating and Financial Review and Prospects—Description of Indebtedness.”
TAXATION
The discussion in this section, “Taxation,” describes tax matters relating to the acquisition, ownership and disposition of our Class B shares and ADSs, pursuant to the Deposit Agreement entered into with JPMorgan Chase Bank, N.A. (previously Citibank, N.A.) as depositary.
There is at present no income tax treaty between Argentina and the United States.
Argentine Taxes
General
This discussion describes the principal Argentine tax consequences of the acquisition, ownership and disposition of our Class B shares or ADSs, but it does not purport to be a comprehensive description of all of the Argentine tax considerations that may be relevant to your decision to acquire our Class B shares or ADSs.
The discussion is based upon Argentine tax laws, regulations and administrative and judicial interpretations in effect as of the date of this Annual Report and subject to change with possible retroactive effect. In addition, this summary is based in part on representations of the depositary and assumes that each obligation provided for in, or otherwise contemplated by, the Deposit
136
Agreement for our ADSs or any related document will be performed in accordance with its terms. Prospective purchasers of Class B shares or ADSs should consult their own tax advisors as to the Argentine or other tax consequences of the acquisition, ownership and disposition of our Class B shares or ADSs in their particular circumstances.
Income Tax
Recent modifications to the Income Tax Law
On September 23, 2013, the Argentine government enacted Law No. 26,893 (regulated by Regulatory Decree 2,334/2013) introducing modifications to the income tax regime, specifically related to the taxability of the income originating from the purchase and sale of shares and the collection of dividends.
Capital gains
Sales or other dispositions of shares, quotas, equity interests, certificates, bonds and other securities of Argentine issuers by non-residents of Argentina will be subject to income tax at a rate of 15% of the net gain derived from such transactions. The net gain is presumed to be 90% of the gross sale price, which equates to an effective tax rate of 13,5% of the gross sale price. Alternatively, Argentine law allows non-residents of Argentina to calculate the net gain by deducting from the sale price certain costs allowed under Argentine tax regulations, however, procedures for exercising this alternative option have not yet been determined. In the event both the seller and the buyer are non-residents of Argentina, Argentine law requires that the buyer pay the income tax resulting from such sale to the Argentine tax authorities, however, there are no regulations providing for procedures with respect to the payment of the capital gains tax under these circumstances.
Capital gains of legal entities domiciled in Argentina resulting from the sale or other disposition of our Class B shares or ADSs will be subject to income tax at a 35% rate. Certain investment funds and foundations are not subject to income tax.
Sales or other dispositions of shares, quotas, equity interests, certificates, bonds and other securities by Argentine individuals residents or undivided estates located in Argentina that are executed through exchange markets duly authorized by the Argentine Securities and Exchange Commission (CNV) are exempt from income tax.
With respect to income tax applicable to sales abroad by foreign residents, the tax rate may be reduced under the provisions of tax treaties between Argentina and the country of residence.
As noted above, several aspects of Law No. 26,893 are unclear and there is currently no administrative or judicial interpretation of the law. Holders are encouraged to consult a tax advisor as to the particular Argentine income tax consequences of holding and disposing of ADSs or Class B shares.
Dividends
Dividends paid on our Class B shares or ADSs in excess of the Company’s taxable accumulated income for the previous fiscal period, whether in cash, property or other equity securities, and any other payment in kind, are subject to income tax withholding at the rate of 35% in respect of such excess (“Equalization Tax”). This is a final tax and it is not applicable if dividends are paid in shares (acciones liberadas).
In addition, dividends paid by us to our Argentine individual shareholders and undivided estates as well as to our foreign shareholders are subject to withholding tax at a 10% rate. The 10% withholding tax rate is calculated over the net dividend after giving effect to the Equalization Tax.
With respect to dividends paid to shareholders residing abroad, such withholding may be reduced by a tax treaty between Argentina and their country of residence.
JPMorgan Chase Bank, N.A. is our paying agent in the United States. See “Item 8. Financial Information—Dividends” and “Item 9. Offering and Listing.”
Capital reductions and other distributions
Capital reductions and redemptions of our Class B shares and ADSs are not subject to income tax up to an amount equivalent to the contributed capital corresponding to the Class B shares and ADSs to be redeemed. Any distribution exceeding this amount, however, will be considered as a dividend for tax purposes and subject to withholding tax at the rate of 35% (plus an additional 10%, if applicable, as described above).
137
Personal property tax
Corporations, partnerships, establishments, financial trusts and other legal entities domiciled or located in Argentina are not subject to the personal property tax.
Shareholdings or interests in corporations incorporated in Argentina that are held by individuals or undivided estates domiciled or located in Argentina or abroad, or by companies or other legal persons located abroad, are subject to the personal property tax. A company is liable for the personal property tax payable on behalf of its shareholders in respect of their share ownership, except for shareholders residing in countries which have signed a tax treaty with Argentina including an applicable exemption. A company liable for this tax payment will be entitled to seek reimbursement of the amount paid from the shareholders, by way of withholding or by foreclosing directly on the assets that gave rise to such payment. Consequently, we are liable to pay personal property tax in respect of our Class B shares and ADSs and we are entitled to seek reimbursement of the amount paid from shareholders. We usually seek these reimbursements through a withholding on dividend payments. The applicable tax rate is 0.50% on the equity value of the shares, calculated as of December 31 of the year under consideration.
For purposes of the above paragraph, shareholdings or interests in companies governed by the Argentine Companies Law held by companies or any other kinds of corporations incorporated in other countries are presumed to indirectly belong to individuals domiciled abroad or to undivided estates located abroad. Contrary evidence is not accepted to rebut this presumption.
Tax treaties
There is currently no income tax treaty or convention between Argentina and the United States.
Other taxes
There is no inheritance, gift, succession or VAT applicable to the ownership, transfer, exchange or disposition of our Class B shares or ADSs, except for the inheritance tax applicable only to corporations or individuals with tax domicile in the Province of Buenos Aires and the Province of Entre Ríos (the tax rate ranges between 4% and 22% depending on the relationship and the amount of inheritance).
There is neither VAT nor gross revenue tax applicable to the ownership, transfer, exchange or disposition of our Class B shares or ADSs.
Our Class B shares or ADSs owned by legal entities (corporations, partnerships, certain associations and trusts organized in Argentina and permanent establishments owned by foreign beneficiaries) are exempt from tax on minimum presumed income.
Commissions paid on brokerage transactions for the sale of our Class B shares on the Buenos Aires Stock Exchange are subject to a VAT at a rate of 21%.
United States Federal Income Taxes
General
The following discussion summarizes the United States federal income tax considerations relevant to the acquisition, ownership and disposition of Class B shares or ADSs by U.S. holders (as defined below). This discussion is based on the United States Internal Revenue Code of 1986, as amended (the “Code”), Treasury regulations promulgated or proposed under the Code, published rulings, and administrative and judicial interpretations of the Code and the Treasury regulations, all as of the date hereof, and all of which are subject to change (possibly with retroactive effect) and to differing interpretations. This summary is based in part on representations of the depositary and assumes that each obligation provided for in or otherwise contemplated by the Deposit Agreement for our ADSs or any related document will be performed in accordance with its terms. This discussion is addressed only to U.S. holders and does not address any United States federal income tax considerations that might be relevant to persons other than U.S. holders. Further, this discussion deals only with U.S. holders that hold ADSs as capital assets (generally, property held for investment) within the meaning of Section 1221 of the Code, and does not address the tax treatment of holders that may be subject to special tax rules, such as banks, insurance companies, tax-exempt organizations, financial institutions, brokers or dealers in securities or currencies, traders in securities or currencies that elect mark-to-market treatment, persons that hold the ADSs as part of a hedge, “straddle,” “conversion transaction” or other integrated investment, persons that hold Class B shares or ADSs through a partnership or other pass-through entity, U.S. holders who have a “functional currency” other than the U.S. dollar or U.S. holders that own or are treated as owning 10% or more of the voting power of our shares.
This discussion does not describe all aspects of United States federal income taxation that may be relevant to a particular investor in light of such investor’s particular circumstances. U.S. holders should consult their own tax advisors as to the specific tax consequences of the acquisition, ownership and disposition of our Class B shares or ADSs, including the application and effect of United States federal, state, local, foreign and other tax laws and the possible effects of changes in United States federal or other tax laws.
138
In general, for United States federal income tax purposes, if you hold our ADSs, you will be treated as the beneficial owner of our Class B shares represented by those ADSs. For purposes of this discussion, you are a U.S. holder if you are a beneficial owner of our Class B shares and you are, for United States federal income tax purposes, (a) an individual who is a citizen or resident of the United States, (b) a corporation (or other business entity treated as a corporation) created or organized in or under the laws of the United States or of any state or the District of Columbia, or (c) otherwise subject to United States federal income taxation on a net income basis with respect to the ADSs or the Class B shares.
The U.S. federal income tax consequences of a partner in a partnership holding our Class B shares or ADSs generally will depend on the status of the partner and the activities of the partnership. Partners in such a partnership should consult with their own tax advisors.
Taxation of our ADSs
Distributions
Distributions we make on our Class B shares or ADSs will be treated as taxable dividends to you to the extent of our current and accumulated earnings and profits as determined under United States federal income tax principles. A dividend, generally, will be included in the gross income of a U.S. holder when the dividend is actually or constructively received by the depositary. Such dividends will not be eligible for the dividends-received deduction generally allowed to U.S. corporations in respect of dividends received from other U.S. corporations.
Subject to certain exceptions for short-term and hedged positions, the U.S. dollar amount of dividends received by an individual U.S. holder with respect to the ADSs will generally be subject to taxation at preferential rates if the dividends are “qualified dividends.” Dividends paid on the ADSs will be treated as qualified dividends if (1) the ADSs are readily tradable on an established securities market in the United States and (2) we were not, in the year prior to the year in which the dividend was paid, and are not, in the year in which the dividend is paid, a passive foreign investment company (a “PFIC”). The ADSs are listed on the New York Stock Exchange, and will qualify as readily tradable on an established securities market in the United States so long as they are so listed. Based on our audited consolidated financial statements and relevant market and shareholder data, we believe that we were not treated as a PFIC for United States federal income tax purposes with respect to our 2013 or 2014 taxable year. In addition, based on our audited consolidated financial statements and our current expectations regarding the value and nature of our assets, the sources and nature of our income, and relevant market and shareholder data, we do not anticipate becoming a PFIC for our 2015 taxable year.
Based on existing guidance, it is not entirely clear whether dividends received with respect to the Class B shares will be treated as qualified dividends, because the Class B shares are not themselves listed on a U.S. exchange. In addition, the U.S. Treasury has announced its intention to promulgate rules pursuant to which U.S. holders of ADSs or common stock and intermediaries through whom such securities are held will be permitted to rely on certifications from issuers to establish that dividends are treated as qualified dividends. Because such procedures have not yet been issued, it is not clear whether we will be able to comply with them. U.S. holders of Class B shares or ADSs should consult their own tax advisors regarding the availability of the reduced dividend tax rate in the light of their own particular circumstances.
The amount of dividend income taxable to you generally will include the amount of Argentine taxes, if any, that we withhold (as described under “—Argentine Taxes”). Thus, in the event such withholding taxes are imposed, you most likely will be required to report income in an amount greater than the cash you receive in respect of payments made in respect of the ADSs. Subject to various limitations, you may be eligible to claim the Argentine income tax withheld in connection with any distribution on ADSs as a credit or deduction for purposes of computing your United States federal income tax liability. Foreign tax credits will not be allowed for withholding taxes imposed with regard to certain short-term or hedged positions in securities and may not be allowed with regard to arrangements in which a U.S. holder’s expected economic profit is insubstantial. Dividends we pay in respect of our ADSs generally will be treated as foreign source income and generally will constitute “passive” income for foreign tax credit purposes. Special rules will apply to the calculation of foreign tax credits in respect of dividend income that is subject to preferential rates of United States federal income tax. U.S. holders should consult with their own tax advisors with regard to the availability of foreign tax credits and the application of the foreign tax credit limitations in light of their particular situation.
If a dividend is paid in pesos, the amount you must include in gross income will be the U.S. dollar value of the distributed pesos, as determined on the date of receipt by the depositary, regardless of whether the payment is in fact converted into U.S. dollars at that time. You will have a tax basis in such pesos for United States federal income tax purposes equal to the U.S. dollar value on the date of such receipt. Any subsequent gain or loss in respect of such pesos arising from exchange rate fluctuations will be ordinary income or loss and will be treated as income from U.S. sources for foreign tax credit purposes.
139
It is unlikely that you will be able to claim a foreign tax credit for any Argentine personal property tax (as described in “Argentine Taxes”), but you may be able to deduct such tax in computing your United States federal income tax liability, subject to applicable limitations.
Sale, exchange or other disposition
Deposits and withdrawals of our Class B shares by U.S. holders in exchange for our Class B shares or ADSs will not result in the realization of gain or loss for United States federal income tax purposes.
Upon a sale, exchange or other disposition of our Class B shares or ADSs, a U.S. holder generally will recognize capital gain or loss equal to the difference between the amount realized on such disposition (which, in the event of a redemption, will include any amount withheld by us in respect of Argentine taxes imposed on such redemption) and the U.S. holder’s adjusted tax basis in our Class B shares or ADSs (which, generally, is the U.S. dollar cost thereof). Any gain that you recognize generally will be treated as U.S. source income for United States foreign tax credit purposes. Consequently, if foreign income or withholding tax is imposed on such gain, you will not be able to use any corresponding tax credit unless you have other foreign source income of the appropriate type in respect of which the credit may be used. Long-term capital gains recognized by an individual holder are generally taxable at preferential rates. Capital losses may be deducted from the U.S. holder’s taxable income, subject to limitations.
Backup withholding
The information reporting requirements of the Code generally will apply to distributions on, as well as to proceeds from the sale or exchange of our Class B shares or ADSs. Subject to certain exceptions, “backup withholding” may apply to payments of dividends on our Class B shares or ADSs and to payments of the proceeds of a sale or exchange of the Class B shares or ADSs that are made to a non-corporate U.S. holder if such holder fails to provide a correct taxpayer identification number or otherwise comply with applicable requirements of the backup withholding rules. The backup withholding tax is not an additional tax and may be credited against a U.S. holder’s United States federal income tax liability, provided that correct information is provided to the Internal Revenue Service. U.S. holders should consult their own tax advisors regarding their qualification for exemption from backup withholding and the procedure for obtaining such exemption, if applicable.
DOCUMENTS ON DISPLAY
We file reports, including annual reports on Form 20-F, and other information with the SEC pursuant to the rules and regulations of the SEC that apply to foreign private issuers. You may read and copy any materials filed with the SEC at its public reference rooms in Washington, D.C., at 100 F Street, N.E., Washington, D.C. 20549. Please call the SEC at 1-800-SEC-0330 for further information on the public reference room. Foreign private issuers, like PESA, have been required to make filings with the SEC by electronic means since November 4, 2002. Any filings we make electronically are available to the public over the Internet at the SEC’s web site at http://www.sec.gov.
| Item 11. | QUANTITATIVE AND QUALITATIVE DISCLOSURES ABOUT MARKET RISK |
Our results of operations and financial condition are exposed to market risk from three principal areas: (1) commodity price risk, (2) foreign currency exchange rate risk and (3) interest rate risk. We periodically review the risks associated with our businesses at a senior management level, based on an approach that has evolved from an independent analysis of each business unit to a risk management strategy that focuses on measuring and monitoring the risks that affect our overall portfolio of assets. We believe our risk management strategy, which is consistent with our business strategy, allows for efficiency while balancing market risks in the business value chain.
For further information on our market risks, please see Note 4 to our Audited Consolidated Financial Statements.
| Item 12. | DESCRIPTION OF SECURITIES OTHER THAN EQUITY SECURITIES |
A- Not applicable.
B- Not applicable.
C- Not applicable.
140
12.D – American Depositary Shares
Fees and Charges Applicable to ADS Holders
Effective September 13, 2012, JPMorgan Chase Bank, N.A. succeed Citibank, N.A, as the depositary for our ADR program.
The depositary collects its fees for delivery and surrender of ADSs directly from investors depositing shares or surrendering ADSs for the purpose of withdrawal or from intermediaries acting for them. The depositary also collects fees for making distributions to investors, by deducting those fees from amounts being distributed or by selling a portion of the distributable property to pay the fees. The depositary may generally refuse to provide fee-attracting services until its fees for those services are paid.
Holders of ADSs and persons depositing or withdrawing shares or ADSs, or persons to whom distributions are made, must pay:
| | |
| Rate: | | For: |
| |
| Up to U.S.$5.00 per 100 ADSs (or portion thereof) | | Issuance of ADSs, including issuances against deposit of shares, issuances in respect of share distributions, rights and other distributions, issuances pursuant to a stock dividend or stock split declared by the Company, or issuances pursuant to a merger, exchange of securities or any other transaction or event affecting the ADSs or the deposited securities. Surrender of ADSs for the purpose of withdrawal of deposited securities or cancellation or reduction of ADSs for any other reason. |
| |
| U.S.$0.05 or less per ADS | | Any cash distribution. |
| |
| U.S.$1.50 per ADR or ADRs | | Transfers. |
| |
| U.S.$0.05 or less per ADS per calendar year (or portion thereof) | | Services performed by the depositary in administering the ADRs. |
| |
| Registration fees | | Registration of transfer of deposited securities on any applicable register in connection with the deposit or withdrawal of deposited securities. |
| |
| Expenses of the depositary | | Cable, telex and facsimile transmission and delivery charges incurred at the request of persons depositing, or holders delivering shares, ADRs or deposited securities. Conversion of foreign currency into U.S. dollars. |
| |
| Taxes and other governmental charges | | As necessary. |
Fees and Direct and Indirect Payments Made by the Depositary to the Company
Past Fees and Payments
During 2014, the Company received from the depositary a reimbursement of U.S.$263,219.
Future Fees and Payments
The depositary may reimburse the Company for certain expenses incurred by the Company in respect of the ADR program established pursuant to the Deposit Agreement upon such terms and conditions as the Company and the depositary have agreed and as may be further agreed upon from time to time. The Company shall pay to the depositary such fees and charges and reimburse the depositary for such reasonable out-of-pocket expenses as the depositary and the Company may agree from time to time.
141
| Item 13. | DEFAULTS, DIVIDEND ARREARAGES AND DELINQUENCIES |
Not applicable.
| Item 14. | MATERIAL MODIFICATIONS TO THE RIGHTS OF SECURITY HOLDERS AND USE OF PROCEEDS |
Not applicable.
| Item 15. | CONTROLS AND PROCEDURES |
(a) Disclosure Controls and Procedures
We carried out an evaluation under the supervision and with the participation of our management, including our chief executive officer and chief financial officer, of the effectiveness of the design and operation of our disclosure controls and procedures, as defined under Rules 13a-15(e) and 15d-15(e) under the Securities Exchange Act of 1934, as amended (the “Exchange Act”), as of December 31, 2014. There are inherent limitations to the effectiveness of any system of disclosure controls and procedures, including the possibility of human error and the circumvention or overriding of the controls and procedures. Accordingly, even effective disclosure controls and procedures can only provide reasonable assurance of achieving their control objectives. Based upon this evaluation, our chief executive officer and chief financial officer concluded that our disclosure controls and procedures were effective to provide reasonable assurance that information required to be disclosed by us in the reports that they file or submit under the Exchange Act is recorded, processed, summarized and reported within the time periods specified in the applicable rules and forms, and that it is accumulated and communicated to our management, including our chief executive officer and chief financial officer, as appropriate, to allow timely decisions regarding required disclosure.
(b) Management’s Annual Report on Internal Control over Financial Reporting
The Company’s management is responsible for establishing and maintaining adequate internal control over financial reporting as defined in Rules 13a-15(f) and 15d-15(f) under the Exchange Act. The Company’s internal controls is a process designed to provide reasonable assurance regarding the reliability of financial reporting and the preparation of financial statements for external purposes in accordance with generally accepted accounting principles.
All internal control systems, no matter how well designed, have inherent limitations. Therefore, even those systems determined to be effective may not prevent or detect misstatements. Also, projections of any evaluation of effectiveness to future periods are subject to the risk that controls may become inadequate because of changes in conditions, or that the degree of compliance with the policies or procedures may deteriorate.
The Company’s management assessed the effectiveness of the Company’s internal controls over financial reporting as of December 31, 2014. In making this assessment, management used the criteria established in “Internal Control—Integrated Framework (2013)” issued by the Committee of Sponsoring Organizations of the Treadway Commission (“COSO”). Based on its evaluations and those criteria, management has concluded that the Company’s internal control over financial reporting was effective as of December 31, 2014.
(c) Attestation Report of the Registered Public Accounting Firm
Price Waterhouse & Co. S.R.L., an independent registered public accounting firm in Buenos Aires, Argentina, member firm of PricewaterhouseCoopers International Limited network, has audited our effectiveness of internal controls over financial reporting as of December 31, 2014. The report on the audit of our internal controls over financial reporting is included in our audited consolidated financial statements, together with PwC’s report on the consolidated financial statements as of December 31, 2014, on pages F-2 through F-3.
(d) Changes in Internal Control over Financial Reporting
There have been no changes in our internal control over financial reporting as defined in Rule 13a-15(f) under the Exchange Act during the period covered by this Annual Report on Form 20-F that have materially affected or are reasonable likely to materially affect our internal control over financial reporting. Additionally, there have been no changes in our internal controls over financial reporting or other factors that have occurred subsequent to the balance sheet date and through the date of this Annual Report that might materially and adversely affect our internal controls over financial reporting as of December 31, 2014.
| Item 16A. | AUDIT COMMITTEE FINANCIAL EXPERT |
Our Board of Directors has determined that Cedric Bridger is an “audit committee financial expert,” and that Mr. Bridger is independent, within the meaning of this Item 16A. See “Item 6. Directors, Senior Management and Employees – Audit Committee.”
142
We have adopted a code of ethics, as defined in Item 16B of Form 20-F. Our code of ethics applies to our chief executive officer and our chief financial officer, as well as to other executive officers and employees. Our code of ethics is available on our web site at http://www.petrobras.com.ar, in the section “Corporate Governance,” inside the section entitled “Investor Center.”
| Item 16C. | PRINCIPAL ACCOUNTANT FEES AND SERVICES |
Audit and Non-Audit Fees
Fees for professional services provided to us by our independent auditors during the fiscal years ended December 31, 2014 and 2013 in each of the following categories are discussed below:
The following table summarizes the fees for professional services provided to PESA, on a consolidated basis:
| | | | | | | | |
| | | Year ended December 31, | |
| | | 2014 | | | 2013 | |
| | | (in millions of pesos) | |
Audit fees | | | 11.1 | | | | 9.4 | |
Audit-related fees | | | — | | | | — | |
Tax fees | | | — | | | | — | |
| | | | | | | | |
Total fees | | | 11.1 | | | | 9.4 | |
| | | | | | | | |
Audit fees. Audit fees in the above table are mainly for professional services rendered in connection with the audit of our consolidated annual financial statements and the review of our quarterly reports and statutory audits of the financial statements of certain of our subsidiaries.
Independent Auditors. For the year ended December 31, 2014 and 2013, Price Waterhouse & Co. S.R.L., an independent public accounting firm in Buenos Aires, Argentina, member firm of PricewaterhouseCoopers International Limited network, served as our independent auditors and audited our financial statements.
The shareholders’ meeting of PESA held on March 19, 2015 designated Price Waterhouse & Co. S.R.L., an independent public accounting firm in Buenos Aires, Argentina, member firm of PricewaterhouseCoopers International Limited network, as PESA’s independent auditors for the year ending December 31, 2015.
Audit Committee Pre-Approval Policies and Procedures
Our Audit Committee must pre-approve all services provided by the external auditors to ensure the auditors’ independence and compliance with all applicable legal restrictions. Pre-approval is either general or specific in nature. All services that are predictable and recurrent in nature and can be performed in a reasonably foreseeable time frame and at a cost that can be reasonably estimated may be approved by the Audit Committee in a general fashion on an annual basis. Services to be pre-approved on a general basis must be described in sufficient detail so that their scope is readily apparent. This description must also include an estimate of the fees payable for such services. Specific pre-approval is required for any services not subject to general pre-approval and/or exceeding the estimated cost of those services. Detailed, written descriptions of any proposed services must be delivered to the administrative manager, who will determine whether such services have already been pre-approved and bring to the Audit Committee’s attention those services that have not been pre-approved. Any doubts as to the scope of a pre-approved service must be resolved exclusively by the Audit Committee. Prior to Audit Committee meetings and at least three times a year, the administrative manager must provide a report on all services provided by the external auditor and related fees to the Audit Committee. The Audit Committee is also required to periodically discuss with the external auditors the services they provide to us and our associates and subsidiaries and the compensation they receive for those services.
All services performed by the independent auditor during 2014 were approved by the Audit Committee in accordance with this policy and the aforementioned procedures. This approval applied to the audit of all of our subsidiaries.
| Item 16D. | EXEMPTION FROM THE LISTING STANDARDS FOR AUDIT COMMITTEES |
Not applicable.
| Item 16E. | PURCHASES OF EQUITY SECURITIES BY THE ISSUER AND AFFILIATED PURCHASERS |
From January 1, 2014 to December 31, 2014, no purchases of our ordinary shares or ADSs were made by us or on our behalf or by any affiliated purchaser.
143
The Company, in its capacity as trustor, entered into a trust agreement with BNP Paribas Argentina Investment Partners S.A., in its capacity as trustee. The trust assets consist of shares of the Company which as of December 31, 2014 numbered 5,744,303. The sole purpose of the trust is to make periodical contributions of shares and/or funds resulting from the sale of the shares for the Company to comply with the funding obligations under its Compensatory Fund and the Employees’ Supplementary Pension Plan.
| Item 16F. | CHANGE IN REGISTRANT’S CERTIFYING ACCOUNTANT |
Not applicable.
| Item 16G. | CORPORATE GOVERNANCE |
Companies listed on the NYSE must comply with certain standards regarding corporate governance as codified in Section 303A of the NYSE’s Listed Company Manual, as amended. Nevertheless, the Company, while a listed company, also qualifies as a foreign private issuer and, as such, is permitted to follow its home country corporate governance practices, governed by the Argentine Companies Law, Capital Market Law No. 26,381 and the Standards of the CNV, in lieu of the provisions of Section 303A, except that it is required to comply with Sections 303A.06, 303A.11 and 303A.12(b) and (c).
Accordingly:
(i) we must satisfy the audit committee requirements of Rule 10A-3 under the Exchange Act (“Rule 10A-3”) (Section 303A.06);
(ii) we must provide a brief description of any significant differences between our corporate governance practices and those followed by U.S. companies under NYSE listing standards (Section 303A.11); and
(iii) (a) our chief executive officer (as of the date hereof, Mr. Ronaldo Batista Assunção) must promptly notify the NYSE in writing after any executive officer of the Company becomes aware of any non-compliance with the applicable NYSE corporate governance rules (Section 303A.12(b)); and (b) we must submit an executed written affirmation (in relation to the members of our audit committee) annually, or interim written affirmations, if required, to the NYSE (Section 303A.12(c)).
As required by the NYSE and Item 16G of Form 20-F, the table below discloses the significant differences between our corporate governance practices and the NYSE rules. Our corporate governance practices are described in further detail elsewhere in this Annual Report. See “Item 6. Directors, Senior Management and Employees” and “Item 10. Additional Information—Memorandum and Articles of Association.”
| | | | |
Section of the NYSE Listed Company Manual | | New York Stock Exchange Corporate Governance Rules for Domestic Issuers | | Our Practices |
| | |
| 303A.01 | | Independent Directors | | |
| | |
| | Listed companies must have a majority of independent directors on their board of directors. “Controlled companies,” which would include our company if it were a U.S. issuer, need not comply with this requirement. A controlled company is one in which more than 50% of the voting power is held by an individual, a group or another company, rather than the public. | | Argentine law does not require us to have a majority of independent board members. Only the majority of the directors on the Audit Committee must be independent. |
| | |
| 303A.02 | | Independence Tests | | |
| | |
| | This section establishes general standards to determine directors’ independence. (a) No director qualifies as “independent” unless the board of directors affirmatively determines that the director has no material relationship with the listed company (either directly or as a partner, shareholder or officer of an organization that has a relationship with the company). The board of directors is also required to identify which directors are independent and disclose the basis for that determination. | | At our annual shareholders’ meeting, our shareholders determine in accordance with Resolution No. 622/13 of the CNV and Capital Market Law No. 26,381 whether or not each of our directors is independent based on the following criteria. Pursuant to the above mentioned resolution, a director is not independent if such director is: (1) a member of management or an employee of shareholders who hold significant interests in the issuer, or of other entities in which these shareholders hold either directly or indirectly significant interests, or over which these shareholders exercise a significant influence; |
144
| | | | |
Section of the NYSE Listed Company Manual | | New York Stock Exchange Corporate Governance Rules for Domestic Issuers | | Our Practices |
| | |
| | (b) In addition, a director is not independent if: | | |
| | (i) the director is, or has been within the last three years, an employee, or an immediate family member is, or has been within the last three years, an executive officer, of the listed company, its parent or a consolidated subsidiary, other than employment as interim chairman or chief executive officer or other executive officer; | | (2) an employee of the issuer or was an employee of the issuer in the last three years; |
| | (ii) the director has received, or has an immediate family member who has received, during any 12-month period within the last three years, more than U.S.$120,000 in direct compensation from the listed company, its parent or a consolidated subsidiary, other than director and committee fees and pension or other forms of deferred compensation for prior services (provided such compensation is not contingent in any way on continued service); | | (3) a person who has professional relations with or is part of a company or professional association that maintains professional relations with, or that receives remunerations or fees (other than directors’ fees) from, the issuers or from its shareholders that hold either directly or indirectly significant interests in or exercise a significant influence over the issuer, or in which such shareholders hold either directly or indirectly significant interests or over which they exercise a significant influence; |
| | (iii) (A) the director is a current partner or employee of a firm that is the listed company’s internal or external auditor; (B) the director has an immediate family member who is a current partner of such firm; (C) the director has an immediate family member who is a current employee of such firm and personally works on the company’s audit; or (D) the Director or an immediate family member was within the last three years a partner or employee of such firm and personally worked on the company’s audit within that time; | | (4) a person who is either directly or indirectly a holder of significant interests in the issuer or in an entity that has significant interests in or exercises a significant influence over the issuer; |
| | (iv) the director or an immediate family member is, or has been with the last three years, employed as an executive officer of another company where any of the listed company’s present executive officers at the same time serves or served on that company’s compensation committee; | | (5) the member is married or is a family member, up to fourth degree by blood or up to second degree by affinity, to an individual who would not qualify as independent; and |
| | (v) the director is a current employee, or an immediate family member is a current executive officer, of a company that has made payments to, or received payments from, the listed company, its parent or a consolidated subsidiary for property or services in an amount which, in any of the last three fiscal years, exceeds the greater of U.S.$1 million or 2% of such other company’s consolidated gross revenues. | | (6) a person who sells or provides either directly or indirectly goods or services to the issuer or to shareholders that hold either directly or indirectly significant interests in or exercise a significant influence over the issuer, and receives compensation for such services that is substantially higher than that payable to a director. |
| | | | “Significant interests” shall mean shareholdings that represent at least 15% of the capital stock of the relevant entity, or a smaller percentage when the person has the right to elect one or more directors by class of shares or by having entered into shareholders, agreements relating to the governance and management of the relevant entity or of its controlling shareholders. |
145
| | | | |
Section of the NYSE Listed Company Manual | | New York Stock Exchange Corporate Governance Rules for Domestic Issuers | | Our Practices |
| | |
| | There is a three-year “look-back” period before non-independent directors can be considered independent. “Immediate family member” includes a person’s spouse, parents, children, siblings, mothers and fathers-in-law, sons and daughters-in-law, and anyone (other than domestic employees) who share such person’s home. | | Cedric Bridger, Roberto Luis Monti, Carlos Ariel Lieutier, Alejandro Poletto and María Valeria Dallero are currently members of our Board of Directors who qualify as independent directors pursuant to the factors listed above. |
303A.03 | | Executive Sessions | | |
| | The non-management directors of each listed company must meet at regularly scheduled executive sessions without management. | | Under Argentine Law, a board of directors must meet at least once every three months. Ronaldo Batista Assunção and Luis Miguel Sas, in addition to serving on the Board of Directors, have management positions. Our other seven directors are non-managing directors. The non-managing directors do not meet at regularly scheduled executive sessions without the presence of the managerial directors. See “Item 6. Directors, Senior Management and Employees—Directors and Senior Management—Board of Directors.” |
303A.04 | | Nominating/Corporate Governance Committee | | |
| | Listed companies must have a nominating/corporate governance committee composed entirely of independent directors, with a written charter that covers the committee’s purpose and responsibilities and an annual performance evaluation of the committee. | | Argentine law does not require the establishment of a nominating committee or a corporate governance committee. We do not have either of these committees. Instead, their functions are carried out by the Compensation Committee or by the Board of Directors, with the assistance of the Executive Management of Legal Affairs, the Management of Human Resources and the General Secretary. |
303A.05 | | Compensation Committee | | |
| | Listed companies must have a compensation committee composed entirely of independent directors, with a written charter that covers the committee’s purpose and responsibilities and an annual performance evaluation. | | Argentine regulations do not require the establishment of a compensation committee. However, at its October 6, 2006 meeting, in order to better supervise salary and compensation matters, our Board of Directors created a Compensation Committee, whose purpose is to assure the compliance with and revise, whenever necessary, policies relating to compensation that aim to provide the Company with greater flexibility to make more effective decisions. The Committee meets to approve matters relating to compensation policy, including variable compensation practices. The Committee, composed by Roberto Luis Monti, Luiz Gustavo Primo de Siqueira and Ronaldo Batista Assunção, must report to the Board of Directors at least semiannually. |
146
| | | | |
Section of the NYSE Listed Company Manual | | New York Stock Exchange Corporate Governance Rules for Domestic Issuers | | Our Practices |
| | |
303A.06 303A.07 | | Audit Committee | | |
| | Listed companies must have an Audit Committee with a minimum of three independent, financially literate members (at least one member must have accounting or related financial management expertise) that satisfy the independence requirements of Rule 10A-3. The Committee must have a written charter that addresses its purpose, annual performance evaluation and duties and responsibilities. Listed companies must have an internal audit function. | | The Audit Committee is an advisory committee to the Board of Directors. Argentine law requires that the audit committee be composed of three members from the Board of Directors (with a majority of independent directors), all of whom are well-versed in business, financial or accounting matters. The Audit Committee is composed of three directors, who each satisfy the independence requirements of Rule 10A-3. One member of our Audit Committee, Mr. Cedric Bridger, qualifies as a “financial expert” within the meaning of Item 16A of Form 20-F. See “Item 16A. Audit Committee Financial Expert.” Our Audit Committee is responsible for, among other things: (1) monitoring and evaluating the activities of the internal and external auditors, (2) supervising the process for preparation of our financial statements, (3) ensuring that our financial statements comply with applicable legal requirements, (4) providing the market with complete information with respect to transactions where members of corporate bodies or controlling shareholders of ours have conflicts of interest, and (5) opining on the reasonableness of compensatory plans for directors and managers. See “Item 6. Directors, Senior Management and Employees—Board Practices—Audit Committee.” Under Argentine law, the shareholders must appoint the external auditor. The Board of Directors may present a proposal regarding the appointment of the external auditor to the shareholders’ meeting. The Audit Committee must issue an opinion on any such proposal presented to the shareholders. We also have an internal audit department. |
| | | | In accordance with Argentine law, we also have established a Statutory Supervisory Committee that is comprised of three members and three alternate members, approved by our shareholders. Members of the Statutory Supervisory Committee are not members of our Board of Directors. The primary responsibilities of the Statutory Supervisory Committee are to monitor the Board of Directors’ and management’s compliance with the Argentine Companies Law, our bylaws and our shareholders’ resolutions. The Statutory Supervisory Committee also performs other functions, including: (1) attending meetings of the Board of Directors and shareholders, (2) calling extraordinary shareholders’ meetings when deemed necessary or when required by shareholders, in accordance with the Argentine Companies Law, (3) presenting a report on the reports of the Board of Directors and the annual financial statements at ordinary shareholders’ meetings, |
147
| | | | |
Section of the NYSE Listed Company Manual | | New York Stock Exchange Corporate Governance Rules for Domestic Issuers | | Our Practices |
| | | | and (4) investigating written complaints of shareholders representing not less than 2% of the capital stock. See “Item 6. Directors, Senior Management and Employees—Board Practices—Statutory Supervisory Committee.” |
303A.08 | | Shareholder Approval of Equity Compensation Plans | | |
| | Shareholders must be given the opportunity to vote on equity compensation plans and material revisions thereto, except for employment inducement awards, certain grants, plans and amendments in the context of mergers and acquisitions, and certain specific types of plans as set forth in the NYSE rules. | | Our Board of Directors approves equity compensation plans for our executive officers and senior management. For a description of our stock option programs for our executive officers and senior management see “Item 6. Directors, Senior Management and Employees—Compensation.” |
| | | | The Audit Committee issues an opinion on the reasonableness of the Board of Directors’ proposals regarding fees and executive equity compensation plans. |
303A.09 | | Corporate Governance Guidelines | | |
| | Listed companies must adopt and disclose corporate governance guidelines. | | Adoption of corporate governance guidelines is not required by Argentine law, but the CNV requires companies to publicly report annually on their adoption of certain recommended corporate governance practices. We have nonetheless adopted the practice of issuing corporate governance policies, and public reports on these policies, on an annual basis, as required by the CNV. |
| 303A.10 | | Code of Business Conduct and Ethics | | |
| | Listed companies must adopt and disclose a code of business conduct and ethics for directors, officers and employees, and promptly disclose any waivers of the code for directors or executive officers. | | We have adopted a Code of Conduct and Business Ethics applicable to all employees. See “Item 16B. Code of Ethics.” Any amendment to the code will be disclosed on our web site at www.petrobras.com.ar. |
303A.12 | | Certification Requirements | | |
| | (a) Each listed company chief executive officer must certify to the NYSE each year that he or she is not aware of any violation by the company of NYSE corporate governance listing standards, qualifying the certification to the extent necessary. (b) Each listed company CEO must promptly notify the NYSE in writing after any executive officer of the listed company becomes aware of any non-compliance with any applicable provisions of Section 303A of the NYSE Listed Company Manual. (c) Each listed company must submit an executed Written Affirmation annually to the NYSE. In addition, each listed company must submit an interim written affirmation as and when required by the interim written affirmation form specified by the NYSE. | | Our CEO will promptly notify the NYSE in writing if an executive officer becomes aware of any material non-compliance with any applicable provision of the NYSE corporate governance rules. |
148
| Item 16H. | MINE SAFETY DISCLOSURE |
Not applicable.
| Item 17. | FINANCIAL STATEMENTS |
Not applicable.
| Item 18. | FINANCIAL STATEMENTS |
Pages F-1 to F-128 and S-1 to S-12 of this Annual Report are incorporated herein by reference. We have included in this Annual Report, in addition to our Audited Consolidated Financial Statements: (i) the consolidated financial statements of CIESA for the years ended December 31, 2014, 2013 and 2012, together with the notes thereto (the “CIESA Financial Statements”), beginning on page F-80 of this Annual Report, because for the year ended December 31, 2012 CIESA was, in reference to PESA, a significant 50 percent or less owned person pursuant to Rule 3-09 of Regulation S-X; and (ii) unaudited oil and gas supplementary disclosures under ASC Topic 932, beginning on page S-1 of this Annual Report. The CIESA Financial Statements have been prepared in accordance with Argentine GAAP and, with respect to the financial information of CIESA as of and for the year ended December 31, 2012 only, were audited by PwC, as described in its audit report on the CIESA Financial Statements included on page F-81 of this Annual Report. The financial information of CIESA as of and for the years ended December 31, 2014 and 2013 in the CIESA Financial Statements has not been audited.
Pursuant to the rules and regulations of the SEC, we have filed certain agreements as exhibits to this Annual Report on Form 20-F. These agreements may contain representations and warranties by the parties. These representations and warranties have been made solely for the benefit of the other party or parties to such agreements and (1) may be intended not as statements of fact, but rather as a way of allocating the risk to one of the parties to such agreements if those statements turn out to be inaccurate, (2) may have been qualified by disclosures that were made to such other party or parties and that either have been reflected in the company’s filings or are not required to be disclosed in those filings, (3) may apply materiality standards different from what may be viewed as material to investors and (4) were made only as of the date of such agreements or such other date(s) as may be specified in such agreements and are subject to more recent developments. Accordingly, these representations and warranties may not describe our actual state of affairs at the date hereof.
| | | | | | | | | | | | | | | | | | | | |
| Exhibit | | | | Incorporated by Reference | | | Filed |
Number | | Description | | Filer | | | Form | | | Date | | | No. | | | Herewith |
| | | | | | |
| 1.1 | | English translation of bylaws (estatutos sociales) of Petrobras Energía S.A. | | | PESA | | | | 20-F | | | | 6/30/09 | | | | 1.2 | | | |
| | | | | | |
| 2.1 | | Form of Deposit Agreement among Petrobras Energía S.A., Citibank, N.A., as depositary, and the Holders and Beneficial Owners of American Depositary Shares evidenced by American Depositary Receipts issued thereunder, including the form of American Depositary Receipt. | | | PESA | | | | 20-F | | | | 6/24/10 | | | | 2.1 | | | |
| | | | | | |
| 2.2 | | Form of Amended and Restated Deposit Agreement among Petrobras Argentina S.A., JPMorgan Chase Bank, N.A., as depositary, and all holders from time to time of ADRs issued thereunder, including the Form of American Depositary Receipt. | | | PESA | | | | F-6 | | | | 9/5/12 | | | | (a | ) | | |
| | | | | | |
| 2.3 | | Amended and Restated Indenture, dated August 1, 2002, amending and restating the Indenture dated May 1, 1998, between Petrobras Energía S.A. and Citibank, N.A. | | | PEPSA | | | | 20-F | | | | 6/30/03 | | | | 2.11 | | | |
| | | | | | |
| 4.1 | | Restructuring Agreement dated as of September 1, 2005 among Compañía de Inversiones de Energía S.A., Petrobras Energía S.A., Petrobras Hispano Argentina S.A., Enron Pipeline Company Argentina S.A., ABN AMRO BANK N.V. Sucursal Argentina, and the Creditors named therein. | | | PEPSA | | | | 20-F | | | | 6/29/06 | | | | 4.4 | | | |
| | | | | | |
| 4.2 | | Third Amendment to the Restructuring Agreement dated as of March 25, 2008 among Compañía de Inversiones de Energía S.A., Petrobras Energía S.A., Petrobras Hispano Argentina S.A., Enron Pipeline Company Argentina S.A., ABN AMRO BANK N.V. Sucursal Argentina, and AEI. | | | PEPSA | | | | 20-F | | | | 6/27/08 | | | | 4.2 | | | |
149
| | | | | | | | | | | | | | | | | | | | | | |
| Exhibit | | | | Incorporated by Reference | | | Filed | |
Number | | Description | | Filer | | | Form | | | Date | | | No. | | | Herewith | |
| | | | | | |
| 4.3 | | Fifth Amendment to the Restructuring Agreement dated as of July 13, 2012 among Compañía de Inversiones de Energía S.A., Petrobras Argentina S.A., Petrobras Hispano Argentina S.A., Pampa Energía S.A., Pampa Inversiones S.A., Inversiones Argentina I, EPCA S.A. and The Royal Bank of Scotland N.V., Sucursal Argentina. | | | PESA | | | | 20-F | | | | 4/29/13 | | | | 4.3 | | | | | |
| | | | | | |
| 4.4 | | Settlement Agreement dated July 13, 2012 among Compañía de Inversiones de Energía S.A., Petrobras Argentina S.A., Petrobras Hispano Argentina S.A., Pampa Energía S.A., Pampa Inversiones S.A. and Inversiones Argentina I. | | | PESA | | | | 20-F | | | | 4/29/13 | | | | 4.4 | | | | | |
| | | | | | |
| 4.5 | | Loan Agreement Number 0088/2005, dated February 21, 2005, between Petrobras Energía S.A., as borrower, and Petrobras International Braspetro B.V., as lender (English translation). | | | PEPSA | | | | 20-F | | | | 6/30/05 | | | | 2.16 | | | | | |
| | | | | | |
| 4.6 | | Loan Agreement, dated December 15, 2008, between Petrobras International Braspetro B.V., as borrower, and Petrobras Energía S.A., as lender (English translation). | | | PEPSA | | | | 20-F | | | | 6/30/09 | | | | 4.4 | | | | | |
| | | | | | |
| 4.7 | | Loan Agreement, dated December 15, 2008, between Petrobras International Braspetro B.V., as borrower, and Petrobras Holding Austria AG, as lender (English translation). | | | PEPSA | | | | 20-F | | | | 6/30/09 | | | | 4.5 | | | | | |
| | | | | | |
| 4.8 | | Stock Purchase Agreement, dated December 21, 2007, between Petrobras Energía, S.A., as seller, and Petrobras International Braspetro B.V., as purchaser. | | | PEPSA | | | | 20-F | | | | 6/27/08 | | | | 4.7 | | | | | |
| | | | | | |
| 4.9 | | Stock Purchase Agreement, dated April 27, 2009, between Petrobras Energía S.A., as seller, and Petrobras International Braspetro B.V., as purchaser. | | | PEPSA | | | | 20-F | | | | 6/30/09 | | | | 4.7 | | | | | |
| | | | | | |
| 5.0 | | Share Purchase Agreement, dated May 31, 2012, between Petrobras Participaciones S.L., as Vendor, and Petrobras Argentina S.A., as Purchaser. | | | PESA | | | | 20-F | | | | 4/29/13 | | | | 5.0 | | | | | |
| | | | | | |
| 5.1 | | DeGolyer and MacNaughton reserves report, dated January 30, 2015. | | | | | | | | | | | | | | | | | | | X | |
| | | | | | |
| 8.1 | | List of Subsidiaries of Petrobras Argentina S.A. | | | | | | | | | | | | | | | | | | | X | |
| | | | | | |
| 12.1 | | Petrobras Argentina S.A. CEO Certification pursuant to Section 302 of the Sarbanes-Oxley Act of 2002, dated April 29, 2014. | | | | | | | | | | | | | | | | | | | X | |
| | | | | | |
| 12.2 | | Petrobras Argentina S.A. CFO Certification pursuant to Section 302 of the Sarbanes-Oxley Act of 2002, dated April 29, 2014. | | | | | | | | | | | | | | | | | | | X | |
| | | | | | |
| 13.1 | | Petrobras Argentina S.A. CEO Certification furnished pursuant to Section 906 of the Sarbanes-Oxley Act of 2002, dated April 29, 2014. | | | | | | | | | | | | | | | | | | | X | |
| | | | | | |
| 13.2 | | Petrobras Argentina S.A. CFO Certification furnished pursuant to Section 906 of the Sarbanes-Oxley Act of 2002, dated April 29, 2014. | | | | | | | | | | | | | | | | | | | X | |
Omitted from exhibits with this Annual Report are certain instruments and agreements with respect to PESA’s long-term debt, none of which authorizes securities in a total amount exceeding 10% of our total assets. We hereby agree to furnish to the SEC a copy of any such omitted instruments or agreements as the SEC requests.
150
SIGNATURES
The registrant hereby certifies that it meets all of the requirements for filing on Form 20-F and that it has duly caused and authorized the undersigned to sign this Annual Report on its behalf.
| | |
| PETROBRAS ARGENTINA S.A. |
| |
| By: | | /s/ Ronaldo Batista Assunção |
| Name: | | Ronaldo Batista Assunção |
| Title: | | Chief Executive Officer |
| |
| By: | | /s/ Luis Miguel Sas |
Name: Title: | | Luis Miguel Sas Chief Financial Officer |
Date: April 29, 2015
151
INDEX TO FINANCIAL STATEMENTS
PETROBRAS ARGENTINA S.A.
| | | | |
| |
Report of independent registered public accounting firm on the Consolidated Financial Statements and on Internal Control over Financial Reporting of Petrobras Argentina S.A. as of December 31, 2014, 2013 and 2012 | | | F-2 | |
| |
Consolidated statements of income of Petrobras Argentina S.A. for the years ended December 31, 2014, 2013 and 2012 | | | F-4 | |
| |
Consolidated statements of comprehensive income of Petrobras Argentina S.A. for the years ended December 31, 2014, 2013 and 2012 | | | F-5 | |
| |
Consolidated statements of financial position of Petrobras Argentina S.A. as of December 31, 2014, 2013 and 2012 | | | F-6 | |
| |
Consolidated statements of changes in equity of Petrobras Argentina S.A. for the years ended December 31, 2014, 2013 and 2012 | | | F-7 | |
| |
Consolidated statements of cash flows of Petrobras Argentina S.A. for the years ended December 31, 2014, 2013 and 2012 | | | F-8 | |
| |
Notes to the consolidated financial statements of Petrobras Argentina S.A. as of the years ended December 31, 2014 and 2013 and 2012 | | | F-9 | |
F-1
Report of Independent Registered Public Accounting Firm
To the Board of Directors and Shareholders of Petrobras Argentina S.A.
In our opinion, the accompanying consolidated statements of financial position at December 31, 2014, 2013 and 2012 and the related consolidated statements of income, comprehensive income, changes in equity, and cash flows present fairly, in all material respects, the financial position of Petrobras Argentina S.A. and its subsidiaries at December 31, 2014, 2013 and 2012, and the results of its operations and its cash flows for each of the three years in the period ended December 31, 2014 in conformity with International Financial Reporting Standards as issued by the International Accounting Standards Board. Also in our opinion, the Company maintained, in all material respects, effective internal control over financial reporting as of December 31, 2014, based on criteria established inInternal Control - Integrated Framework (2013) issued by the Committee of Sponsoring Organizations of the Treadway Commission (COSO). The Company’s management is responsible for these financial statements, for maintaining effective internal control over financial reporting and for its assessment of the effectiveness of internal control over financial reporting, included in Management’s Annual Report on Internal Control Over Financial Reporting. Our responsibility is to express opinions on these financial statements and on the Company’s internal control over financial reporting based on our integrated audits. We conducted our audits in accordance with the standards of the Public Company Accounting Oversight Board (United States). Those standards require that we plan and perform the audits to obtain reasonable assurance about whether the financial statements are free of material misstatement and whether effective internal control over financial reporting was maintained in all material respects. Our audits of the financial statements included examining, on a test basis, evidence supporting the amounts and disclosures in the financial statements, assessing the accounting principles used and significant estimates made by management, and evaluating the overall financial statement presentation. Our audit of internal control over financial reporting included obtaining an understanding of internal control over financial reporting, assessing the risk that a material weakness exists, and testing and evaluating the design and operating effectiveness of internal control based on the assessed risk. Our audits also included performing such other procedures as we considered necessary in the circumstances. We believe that our audits provide a reasonable basis for our opinions.
A company’s internal control over financial reporting is a process designed to provide reasonable assurance regarding the reliability of financial reporting and the preparation of financial statements for external purposes in accordance with generally accepted accounting principles. A company’s internal control over financial reporting includes those policies and procedures that (i) pertain to the maintenance of records that, in reasonable detail, accurately and fairly reflect the transactions and dispositions of the assets of the company; (ii) provide reasonable assurance that transactions are recorded as necessary to permit preparation of financial statements in accordance with generally accepted accounting principles, and that receipts and expenditures of the company are being made only in accordance with authorizations of management and directors of the company; and (iii) provide reasonable assurance regarding prevention or timely detection of unauthorized acquisition, use, or disposition of the company’s assets that could have a material effect on the financial statements.
F-2
Because of its inherent limitations, internal control over financial reporting may not prevent or detect misstatements. Also, projections of any evaluation of effectiveness to future periods are subject to the risk that controls may become inadequate because of changes in conditions, or that the degree of compliance with the policies or procedures may deteriorate.
Autonomous City of Buenos Aires, April 29, 2015
PRICE WATERHOUSE & CO. S.R.L.
By:/s/ Miguel A. Urus (Partner)
F-3
CONSOLIDATED STATEMENTS OF INCOME
FOR THE YEARS ended DECEMBER 31, 2014, 2013 AND 2012
(Stated in millions of Argentine pesos)
| | | | | | | | | | | | | | | | |
| | | Notes | | | 2014 | | | 2013 | | | 2012 | |
Sales | | | | | | | 20,738 | | | | 15,340 | | | | 12,765 | |
Cost of sales | | | 6 | | | | (14,490 | ) | | | (11,260 | ) | | | (9,619 | ) |
| | | | | | | | | | | | | | | | |
Gross profit | | | | | | | 6,248 | | | | 4,080 | | | | 3,146 | |
| | | | | | | | | | | | | | | | |
Administrative and selling expenses | | | 7 | | | | (2,416 | ) | | | (1,797 | ) | | | (1,430 | ) |
Exploration expenses | | | 8 | | | | (70 | ) | | | (82 | ) | | | (212 | ) |
Other operating expenses, net | | | 9 | | | | (779 | ) | | | (571 | ) | | | (121 | ) |
Share of net loss of equity accounted investments | | | 17.3 | | | | (1,735 | ) | | | (279 | ) | | | (148 | ) |
| | | | | | | | | | | | | | | | |
Operating income | | | | | | | 1,248 | | | | 1,351 | | | | 1,235 | |
| | | | | | | | | | | | | | | | |
Financial results | | | | | | | | | | | | | | | | |
Financial income | | | 10 | | | | 828 | | | | 700 | | | | 442 | |
Financial costs | | | 10 | | | | (756 | ) | | | (647 | ) | | | (512 | ) |
| | | | | | | | | | | | | | | | |
Income (loss) before income tax | | | | | | | 1,320 | | | | 1,404 | | | | 1,165 | |
| | | | | | | | | | | | | | | | |
Income tax | | | 11 | | | | (742 | ) | | | (552 | ) | | | (492 | ) |
| | | | | | | | | | | | | | | | |
Net income | | | | | | | 578 | | | | 852 | | | | 673 | |
| | | | | | | | | | | | | | | | |
Earnings per share basic / diluted (in pesos) | | | 12 | | | | 0.227 | | | | 0.386 | | | | 0.306 | |
| | | | | | | | | | | | | | | | |
Attributable to: | | | | | | | | | | | | | | | | |
Shareholders of the Company | | | | | | | 458 | | | | 779 | | | | 618 | |
Non-controlling interest | | | | | | | 120 | | | | 73 | | | | 55 | |
| | | | | | | | | | | | | | | | |
Total | | | | | | | 578 | | | | 852 | | | | 673 | |
| | | | | | | | | | | | | | | | |
The accompanying Notes 1 to 36 are an integral part of these consolidated financial statements.
F-4
CONSOLIDATED STATEMENTS OF COMPREHENSIVE INCOME
FOR THE YEARS ended DECEMBER 31, 2014, 2013 AND 2012
(Stated in millions of Argentine pesos)
| | | | | | | | | | | | |
| | | 2014 | | | 2013 | | | 2012 | |
Net income for the year | | | 578 | | | | 852 | | | | 673 | |
Other comprehensive income (net of taxes) | | | | | | | | | | | | |
Items that will not be reclassified to profit or loss: | | | | | | | | | | | | |
Actuarial profits and loss | | | | | | | | | | | | |
Recognized in equity | | | 6 | | | | 10 | | | | (7 | ) |
Recognized to non-controlling interest | | | (5 | ) | | | — | | | | — | |
Items that may be subsequently reclassified to profit or loss: | | | | | | | | | | | | |
Foreign currency translation | | | | | | | | | | | | |
Recognized in equity | | | 277 | | | | 107 | | | | 6 | |
Recognized to non-controlling interest | | | 241 | | | | 171 | | | | 39 | |
Other comprehensive income related to our equity accounted investments | | | | | | | | | | | | |
Translation adjustment | | | — | | | | — | | | | 7 | |
| | | | | | | | | | | | |
Other comprehensive income for the year | | | 519 | | | | 288 | | | | 45 | |
| | | | | | | | | | | | |
Total other comprehensive income | | | 1,097 | | | | 1,140 | | | | 718 | |
| | | | | | | | | | | | |
Attributable to: | | | | | | | | | | | | |
Shareholders of the Company | | | 741 | | | | 896 | | | | 624 | |
Non-controlling interest | | | 356 | | | | 244 | | | | 94 | |
| | | | | | | | | | | | |
Total | | | 1,097 | | | | 1,140 | | | | 718 | |
| | | | | | | | | | | | |
The accompanying Notes 1 to 36 are an integral part of these consolidated financial statements.
F-5
CONSOLIDATED STATEMENTS OF FINANCIAL POSITION
AS OF DECEMBER 31, 2014, 2013 AND 2012
(Stated in millions of Argentine pesos)
| | | | | | | | | | | | | | | | |
| | | Notes | | | 2014 | | | 2013 | | | 2012 | |
CURRENT ASSETS | | | | | | | | | | | | | | | | |
Cash and cash equivalents | | | 13 | | | | 2,278 | | | | 1,193 | | | | 1,260 | |
Other investments | | | 18 | | | | 33 | | | | 23 | | | | 20 | |
Trade receivables | | | 14 | | | | 2,945 | | | | 2,519 | | | | 2,168 | |
Other receivables | | | 15 | | | | 1,676 | | | | 1,551 | | | | 1,553 | |
Inventories | | | 16 | | | | 1,951 | | | | 1,310 | | | | 1,023 | |
| | | | | | | | | | | | | | | | |
Total current assets | | | | | | | 8,883 | | | | 6,596 | | | | 6,024 | |
| | | | | | | | | | | | | | | | |
NON-CURRENT ASSETS | | | | | | | | | | | | | | | | |
Trade receivables | | | 14 | | | | 60 | | | | 73 | | | | 86 | |
Other receivables | | | 15 | | | | 163 | | | | 245 | | | | 238 | |
Deferred income tax asset | | | 11 | | | | 47 | | | | — | | | | — | |
Inventories | | | 16 | | | | 67 | | | | 58 | | | | 45 | |
Other investments | | | 18 | | | | 153 | | | | 301 | | | | 279 | |
Investments in associates | | | 17.2 | | | | 2,979 | | | | 3,568 | | | | 3,006 | |
Investments in joint ventures | | | 17.1 | | | | 491 | | | | 497 | | | | 689 | |
Property, plant and equipment | | | 19 | | | | 11,589 | | | | 9,524 | | | | 8,480 | |
| | | | | | | | | | | | | | | | |
Total non-current assets | | | | | | | 15,549 | | | | 14,266 | | | | 12,823 | |
| | | | | | | | | | | | | | | | |
Total assets | | | | | | | 24,432 | | | | 20,862 | | | | 18,847 | |
| | | | | | | | | | | | | | | | |
CURRENT LIABILITIES | | | | | | | | | | | | | | | | |
Accounts payable | | | | | | | 3,045 | | | | 2,553 | | | | 1,863 | |
Short-term loans | | | 20.3 | | | | 92 | | | | 208 | | | | 1,108 | |
Payroll and social security taxes | | | | | | | 371 | | | | 304 | | | | 258 | |
Taxes payable | | | 21 | | | | 1,134 | | | | 578 | | | | 470 | |
Provisions | | | 22 | | | | 1,253 | | | | 385 | | | | 643 | |
| | | | | | | | | | | | | | | | |
Total current liabilities | | | | | | | 5,895 | | | | 4,028 | | | | 4,342 | |
| | | | | | | | | | | | | | | | |
NON-CURRENT LIABILITIES | | | | | | | | | | | | | | | | |
Accounts payable | | | | | | | 4 | | | | 7 | | | | 172 | |
Long-term loans | | | 20.3 | | | | 2,587 | | | | 2,024 | | | | 1,558 | |
Employment benefit obligations | | | 23 | | | | 438 | | | | 336 | | | | 269 | |
Deferred income tax liabilities | | | 11 | | | | 499 | | | | 548 | | | | 354 | |
Provisions | | | 22 | | | | 2,394 | | | | 2,224 | | | | 1,581 | |
| | | | | | | | | | | | | | | | |
Total non-current liabilities | | | | | | | 5,922 | | | | 5,139 | | | | 3,934 | |
| | | | | | | | | | | | | | | | |
Total liabilities | | | | | | | 11,817 | | | | 9,167 | | | | 8,276 | |
| | | | | | | | | | | | | | | | |
EQUITY | | | | | | | | | | | | | | | | |
Capital Stock | | | 24 | | | | 2,019 | | | | 2,019 | | | | 2,019 | |
Other items in Capital | | | | | | | 2,186 | | | | 2,186 | | | | 2,186 | |
Reserves income | | | 25 | | | | 7,144 | | | | 6,508 | | | | 5,953 | |
Other | | | | | | | (693 | ) | | | (693 | ) | | | (693 | ) |
Unappropiated retained earnings | | | 26 | | | | 458 | | | | 752 | | | | 528 | |
Other comprehensive income | | | 27 | | | | 472 | | | | 189 | | | | 72 | |
| | | | | | | | | | | | | | | | |
Total shareholders’ equity attributable to Shareholders of the Company | | | | | | | 11,586 | | | | 10,961 | | | | 10,065 | |
Non-controlling interest | | | | | | | 1,029 | | | | 734 | | | | 506 | |
| | | | | | | | | | | | | | | | |
Total equity | | | | | | | 12,615 | | | | 11,695 | | | | 10,571 | |
| | | | | | | | | | | | | | | | |
TOTAL LIABILITIES AND EQUITY | | | | | | | 24,432 | | | | 20,862 | | | | 18,847 | |
| | | | | | | | | | | | | | | | |
The accompanying Notes 1 to 36 are an integral part of these consolidated financial statements.
F-6
CONSOLIDATED STATEMENTS OF CHANGES IN EQUITY
FOR THE YEARS ended DECEMBER 31, 2014, 2013 AND 2012
(Stated in millions of Argentine pesos)
| | | | | | | | | | | | | | | | | | | | | | | | | | | | | | | | | | | | | | | | | | | | | | | | | | | | | | | | |
| | | | | | Attributable to shareholders of the company | | | Non-controlling
interest (c) | | | Total
equity | |
| | | | | | Capital stock | | | Rertained earnings | | | OCI
(b) | | | Total | | | |
| | | | | | | | | Other items in Capital | | | Reserves income | | | Other
(a) | | | Unappropriated
retained
earnings | | | | | |
| | | Notes | | | Capital
stock | | | Adjustment
to capital
stock | | | Additional
paid-in
capital
from
meger | | | Additional
paid-in
capital on
sales of
stock of
parent | | | Legal
reserve | | | Future
investment
reserves | | | Future
dividends
reserve | | | | | | | |
Balances as of December 31, 2011 | | | | | | | 1,010 | | | | 1,230 | | | | 912 | | | | 44 | | | | 448 | | | | — | | | | — | | | | — | | | | 6,635 | | | | 66 | | | | 10,345 | | | | 3 | | | | 10,348 | |
| | | | | | | | | | | | | | | | | | | | | | | | | | | | | | | | | | | | | | | | | | | | | | | | | | | | | | | | |
Other comprehensive income for the period | | | | | | | — | | | | — | | | | — | | | | — | | | | — | | | | — | | | | — | | | | — | | | | — | | | | 6 | | | | 6 | | | | 39 | | | | 45 | |
Societal resolution | | | (d | ) | | | | | | | | | | | | | | | | | | | | | | | | | | | | | | | | | | | | | | | | | | | | | | | | | | | | |
- Capitalization | | | | | | | 1,009 | | | | — | | | | — | | | | — | | | | — | | | | — | | | | — | | | | — | | | | (1,009 | ) | | | — | | | | — | | | | — | | | | — | |
- Legal reserve | | | | | | | — | | | | — | | | | — | | | | — | | | | 35 | | | | — | | | | — | | | | — | | | | (35 | ) | | | — | | | | — | | | | — | | | | — | |
- Future investments reserve | | | | | | | — | | | | — | | | | — | | | | — | | | | — | | | | 4,781 | | | | — | | | | — | | | | (4,781 | ) | | | — | | | | — | | | | — | | | | — | |
- Future dividends reserve | | | | | | | — | | | | — | | | | — | | | | — | | | | — | | | | — | | | | 900 | | | | — | | | | (900 | ) | | | — | | | | — | | | | — | | | | — | |
Acquisition of PELSA | | | 17.5 | | | | — | | | | — | | | | — | | | | — | | | | — | | | | — | | | | — | | | | (693 | ) | | | — | | | | — | | | | (693 | ) | | | 427 | | | | (266 | ) |
Dividends in cash | | | | | | | — | | | | — | | | | — | | | | — | | | | — | | | | — | | | | (211 | ) | | | — | | | | — | | | | — | | | | (211 | ) | | | (18 | ) | | | (229 | ) |
Net income | | | | | | | — | | | | — | | | | — | | | | — | | | | — | | | | — | | | | — | | | | — | | | | 618 | | | | — | | | | 618 | | | | 55 | | | | 673 | |
| | | | | | | | | | | | | | | | | | | | | | | | | | | | | | | | | | | | | | | | | | | | | | | | | | | | | | | | |
Balances as of December 31, 2012 | | | | | | | 2,019 | | | | 1,230 | | | | 912 | | | | 44 | | | | 483 | | | | 4,781 | | | | 689 | | | | (693 | ) | | | 528 | | | | 72 | | | | 10,065 | | | | 506 | | | | 10,571 | |
| | | | | | | | | | | | | | | | | | | | | | | | | | | | | | | | | | | | | | | | | | | | | | | | | | | | | | | | |
Other comprehensive income for the period | | | | | | | — | | | | — | | | | — | | | | — | | | | — | | | | — | | | | — | | | | — | | | | — | | | | 117 | | | | 117 | | | | 171 | | | | 288 | |
Societal resolution | | | (e | ) | | | | | | | | | | | | | | | | | | | | | | | | | | | | | | | | | | | | | | | | | | | | | | | | | | | | |
- Legal reserve | | | | | | | — | | | | — | | | | — | | | | — | | | | 32 | | | | — | | | | — | | | | — | | | | (32 | ) | | | — | | | | — | | | | — | | | | — | |
- Future investments reserve | | | | | | | — | | | | — | | | | — | | | | — | | | | — | | | | 523 | | | | — | | | | — | | | | (523 | ) | | | — | | | | — | | | | — | | | | — | |
- Reversal by investments | | | | | | | — | | | | — | | | | — | | | | — | | | | — | | | | (2,999 | ) | | | — | | | | — | | | | 2,999 | | | | — | | | | — | | | | — | | | | — | |
- Constitution for new investments | | | | | | | — | | | | — | | | | — | | | | — | | | | — | | | | 2,638 | | | | — | | | | — | | | | (2,638 | ) | | | — | | | | — | | | | — | | | | — | |
- Future dividends reserve | | | | | | | — | | | | — | | | | — | | | | — | | | | — | | | | — | | | | 361 | | | | — | | | | (361 | ) | | | — | | | | — | | | | — | | | | — | |
Dividends in cash | | | | | | | — | | | | — | | | | — | | | | — | | | | — | | | | — | | | | — | | | | — | | | | — | | | | — | | | | — | | | | (16 | ) | | | (16 | ) |
Net income | | | | | | | — | | | | — | | | | — | | | | — | | | | — | | | | — | | | | — | | | | — | | | | 779 | | | | — | | | | 779 | | | | 73 | | | | 852 | |
| | | | | | | | | | | | | | | | | | | | | | | | | | | | | | | | | | | | | | | | | | | | | | | | | | | | | | | | |
Balances as of December 31, 2013 | | | | | | | 2,019 | | | | 1,230 | | | | 912 | | | | 44 | | | | 515 | | | | 4,943 | | | | 1,050 | | | | (693 | ) | | | 752 | | | | 189 | | | | 10,961 | | | | 734 | | | | 11,695 | |
| | | | | | | | | | | | | | | | | | | | | | | | | | | | | | | | | | | | | | | | | | | | | | | | | | | | | | | | |
Other comprehensive income for the period | | | | | | | — | | | | — | | | | — | | | | — | | | | — | | | | — | | | | — | | | | — | | | | — | | | | 283 | | | | 283 | | | | 236 | | | | 519 | |
Societal resolution | | | (f | ) | | | | | | | | | | | | | | | | | | | | | | | | | | | | | | | | | | | | | | | | | | | | | | | | | | | | |
- Legal reserve | | | | | | | — | | | | — | | | | — | | | | — | | | | 38 | | | | — | | | | — | | | | — | | | | (38 | ) | | | — | | | | — | | | | — | | | | — | |
- Future investments reserve | | | | | | | — | | | | — | | | | — | | | | — | | | | — | | | | 714 | | | | — | | | | — | | | | (714 | ) | | | — | | | | — | | | | — | | | | — | |
- Reversal by investments | | | | | | | — | | | | — | | | | — | | | | — | | | | — | | | | (2,524 | ) | | | — | | | | — | | | | 2,524 | | | | — | | | | — | | | | — | | | | — | |
- Constitution for new investments | | | | | | | — | | | | — | | | | — | | | | — | | | | — | | | | 2,299 | | | | — | | | | — | | | | (2,299 | ) | | | — | | | | — | | | | — | | | | — | |
- Future dividends reserve | | | | | | | — | | | | — | | | | — | | | | — | | | | — | | | | — | | | | 225 | | | | — | | | | (225 | ) | | | — | | | | — | | | | — | | | | — | |
Dividends in cash | | | | | | | — | | | | — | | | | — | | | | — | | | | — | | | | — | | | | (116 | ) | | | — | | | | — | | | | — | | | | (116 | ) | | | (61 | ) | | | (177 | ) |
Net income | | | | | | | — | | | | — | | | | — | | | | — | | | | — | | | | — | | | | — | | | | — | | | | 458 | | | | — | | | | 458 | | | | 120 | | | | 578 | |
| | | | | | | | | | | | | | | | | | | | | | | | | | | | | | | | | | | | | | | | | | | | | | | | | | | | | | | | |
Balances as of December 31, 2014 | | | | | | | 2,019 | | | | 1,230 | | | | 912 | | | | 44 | | | | 553 | | | | 5,432 | | | | 1,159 | | | | (693 | ) | | | 458 | | | | 472 | | | | 11,586 | | | | 1,029 | | | | 12,615 | |
| | | | | | | | | | | | | | | | | | | | | | | | | | | | | | | | | | | | | | | | | | | | | | | | | | | | | | | | |
| (a) | Balances due to business combination of companies under common control (Notes 2.6.8 and 17.5) |
| (d) | As required by the Shareholders’ Meeting of March 29, 2012. |
| (e) | As required by the Shareholders’ Meeting of March 21, 2013. |
| (f) | As required by the Shareholders’ Meeting of March 27, 2014. |
The accompanying Notes 1 to 36 are an integral part of these consolidated financial statements.
F-7
CONSOLIDATED STATEMENTS OF CASH FLOWS
FOR THE YEARS ended DECEMBER 31, 2014, 2013 AND 2012
(Stated in millions of Argentine pesos)
| | | | | | | | | | | | | | | | |
| | | Notes | | | 2014 | | | 2013 | | | 2012 | |
Cash provided by (used in) operations: | | | | | | | | | | | | | | | | |
Net income | | | | | | | 578 | | | | 852 | | | | 673 | |
Reconciliation to net cash provided by (used in) operating activities: | | | | | | | | | | | | | | | | |
Share of net loss of equity accounted investees | | | 17.3 | | | | 1,735 | | | | 279 | | | | 148 | |
Financial results, net | | | | | | | (572 | ) | | | (419 | ) | | | (289 | ) |
Depreciation of property, plant and equipment | | | 19 | | | | 2,632 | | | | 2,194 | | | | 1,738 | |
Abandoned and non-productive well write-downs | | | 8 | | | | 11 | | | | 27 | | | | 168 | |
Contingencies | | | 9 | | | | 109 | | | | 103 | | | | 30 | |
Enviromental costs | | | 9 | | | | 193 | | | | 27 | | | | — | |
CIESA Debt Restructuring | | | 9 | | | | — | | | | — | | | | (221 | ) |
Gain from the sales of Puesto Hernández | | | 9 | | | | (181 | ) | | | — | | | | — | |
Gain from the sales of property, plant and equipment | | | | | | | (2 | ) | | | (3 | ) | | | (23 | ) |
Gain from the sales of Distrilec S.A. | | | 9 | | | | — | | | | 34 | | | | — | |
Writedown of contractual credit in Ecuador | | | 9 | | | | — | | | | — | | | | 61 | |
Impairment Colpa y Caranda | | | 9 | | | | 94 | | | | — | | | | — | |
Impairment Santa Cruz II | | | 9 | | | | — | | | | 11 | | | | — | |
Income tax | | | 11 | | | | 742 | | | | 552 | | | | 492 | |
Accrued interest | | | 20.3 | | | | 192 | | | | 212 | | | | 199 | |
Other | | | | | | | 112 | | | | 38 | | | | 75 | |
Changes in assets and liabilities: | | | | | | | | | | | | | | | | |
Trade receivables | | | | | | | (318 | ) | | | (271 | ) | | | 8 | |
Other receivables | | | | | | | (3 | ) | | | (298 | ) | | | 148 | |
Inventories | | | | | | | (644 | ) | | | (294 | ) | | | (48 | ) |
Accounts payable | | | | | | | 346 | | | | 241 | | | | 333 | |
Payroll and social security taxes | | | | | | | 150 | | | | 118 | | | | 122 | |
Taxes payable | | | | | | | (18 | ) | | | 161 | | | | (81 | ) |
Provisions | | | | | | | (61 | ) | | | (158 | ) | | | (122 | ) |
Dividends collected | | | 17.4 | | | | 55 | | | | 23 | | | | 14 | |
Interest paid | | | 20.3 | | | | (181 | ) | | | (216 | ) | | | (178 | ) |
Income tax paid | | | | | | | (323 | ) | | | (435 | ) | | | (345 | ) |
| | | | | | | | | | | | | | | | |
Net cash provided by operations | | | | | | | 4,646 | | | | 2,778 | | | | 2,902 | |
| | | | | | | | | | | | | | | | |
Cash provided by (used in) investing activities: | | | | | | | | | | | | | | | | |
Acquisition of property, plant and equipment | | | | | | | (3,853 | ) | | | (2,524 | ) | | | (1,994 | ) |
Acquisition of interests in companies and oil and gas areas | | | | | | | — | | | | — | | | | (1,005 | ) |
Debt restructuring charge for CIESA | | | | | | | — | | | | — | | | | 195 | |
Sale of interests in companies and oil and gas areas | | | | | | | 373 | | | | 605 | | | | 108 | |
Net variation in investments other than cash and cash equivalents | | | | | | | 11 | | | | 35 | | | | 81 | |
Fideicomiso Financiero de Obra Gasoducto Sur | | | | | | | 39 | | | | 34 | | | | 36 | |
| | | | | | | | | | | | | | | | |
Net cash used in investing activities | | | | | | | (3,430 | ) | | | (1,850 | ) | | | (2,579 | ) |
| | | | | | | | | | | | | | | | |
Cash provided by (used in) financing activities: | | | | | | | | | | | | | | | | |
Net increase (decrease) in short term loans | | | 20.3 | | | | (124 | ) | | | 96 | | | | 2 | |
Increase in long term loans | | | 20.3 | | | | — | | | | 49 | | | | — | |
Payment of loans with original long-term maturity | | | 20.3 | | | | (111 | ) | | | (1,302 | ) | | | (85 | ) |
Cash dividends paid | | | | | | | (177 | ) | | | (16 | ) | | | (229 | ) |
| | | | | | | | | | | | | | | | |
Net cash used in financing activities | | | | | | | (412 | ) | | | (1,173 | ) | | | (312 | ) |
| | | | | | | | | | | | | | | | |
Increase (decrease) in cash and cash equivalents | | | | | | | 804 | | | | (245 | ) | | | 11 | |
Cash and cash equivalents at the beginning of the year | | | | | | | 1,193 | | | | 1,260 | | | | 1,192 | |
Effect of exchange rate change on cash and cash equivalents | | | | | | | 281 | | | | 178 | | | | 57 | |
| | | | | | | | | | | | | | | | |
Cash and cash equivalents at the end of the year | | | 13 | | | | 2,278 | | | | 1,193 | | | | 1,260 | |
| | | | | | | | | | | | | | | | |
The accompanying Notes 1 to 36 are an integral part of these consolidated financial statements.
F-8
NOTES TO THE CONSOLIDATED FINANCIAL STATEMENTS
AS OF THE YEARS ENDED DECEMBER 31, 2014, 2013 AND 2012
(Stated in millions of Argentine pesos, except as otherwise indicated)
1. General information
1.1. The Company
Petrobras Argentina is a corporation (sociedad anónima) with its main office located in the Autonomous City of Buenos Aires, Argentina.
Petrobras Argentina’s shares are listed on the Buenos Aires Stock Exchange. Its ADS, each of them representing 10 Class B common shares of Petrobras Argentina, are listed on the NYSE.
The Company is not subject to the Optional Statutory System for Binding Public Offering.
1.2. Business of the Company
Petrobras Argentina’s business is mainly focused on the energy sector, specifically in oil and gas exploration and production, refining and distribution, petrochemical activities, electricity and sale and distribution of hydrocarbons. Petrobras Argentina S.A. holds operations in Argentina, Bolivia, Ecuador and Venezuela. The Company’s fiscal year ends on December 31 of each year.
In these consolidated financial statements, Petrobras Argentina and its subsidiaries are jointly referred to as “the Company” or “PESA”.
The Board of Directors approved the issuance of these consolidated financial statements (hereinafter “financial statements”) on February 4, 2015.
1.3. Controlling Group
Petrobras Participaciones S.L. is the immediate parent company of Petrobras Argentina, with an ownership interest of 67.2%.
Petrobras Participaciones S.L. is a subsidiary of Petróleo Brasileiro, a Brazilian company whose business is focused on exploration, production, refining, sale and transportation of oil and its byproducts in Brazil and abroad.
2. Basis of presentation
2.1. Statement of compliance
These financial statements have been prepared in accordance with IFRS as issued by the IASB.
2.2. Summary of the significant accounting policies
Significant accounting policies adopted in the preparation of these financial statements are described below, which have been consistently applied in these financial statements.
These accounting policies have been applied consistently by all Group companies.
2.2.1. New accounting standards and interpretations issued by the IASB effective as of December 31, 2014 and adopted by the Company
F-9
IAS 32 “Financial Instruments – Presentation”
The IAS 32 modifies the application guidance in matters relating to the offsetting of financial assets and liabilities.
Application of such amendment did not have an impact on the results of operations or the financial position of the Company and did not imply new disclosures.
IAS 36 “Impairment of assets”
The IAS 36 amends disclosure requirements regarding the determination of the value of impaired assets, in case the recoverable value is calculated on the basis of the fair value less costs of disposal.
Application of such amendment did not imply new disclosures.
IAS 39 “Financial Instruments – Recognition and Measurement”
The IAS 39 establishes the continuation of hedge accounting (fair value and cash flow) in a circumstance in which a derivative that has been designated as a hedging instrument is novated to a central counterparty following the introduction of a new law or regulation.
Application of such amendment did not have an impact on the results of operations or the financial position of the Company and did not imply new disclosures.
IFRIC 21 “Levies”
The IFRIC 21 addresses the accounting for liabilities for a levy imposed by the government, according to the rules and regulations.
Application of such an interpretation did not have a significant impact on the financial position of the Company.
2.2.2. New accounting standards and interpretations issued by the IASB that are not effective as of December 31, 2014, and have not been early adopted by the Company
IAS 1 “Presentation of Financial Statements”
In December 2014, the IASB amended IAS 1 “Presentation of Financial Statements” providing a new guidance for the presentation of Financial Statements. The amendments are effective for annual periods beginning on or after January 1, 2016. Earlier application is permitted.
The Company is currently analyzing the impact on disclosures arising from the application of such amendments.
IAS 27 “Separate Financial Statements”
In August 2014, the IASB amended IAS 27 “Separate Financial Statements”. The amendments allow the use of the equity method to account for investments in subsidiaries, joint ventures and associates and are effective for annual periods beginning on or after January 1, 2017. Earlier application is permitted.
The Company uses the equity method to account for investments in subsidiaries, joint ventures and associates in the preparation of the separate financial statements according to Technical Resolution No. 26 issued by the FACPCE. Therefore, the application of the amendment will not impact the results of operations or the financial position of the Company.
F-10
IFRS 9 “Financial Instruments”
In July 2014, the IASB issued a new version of IFRS 9 “Financial Instruments” which supersedes previous versions and sets out new requirements for the classification and measurement of financial assets and liabilities, effective for annual periods beginning on or after January 1, 2018. Earlier application is permitted.
The Company is currently analyzing the impact of the application of IFRS 9. However, it is estimated that its application will not have a significant impact on the results of operations or the financial position of the Company.
IFRS 15 “Revenues from contracts with Customers”
In May 2014, the IASB issued IFRS 15 “Revenues from contracts with Customers”, effective for annual periods beginning on or after January 1, 2017. Earlier application is permitted.
It addresses the principles for recognizing revenue and establishes the requirements for reporting about the nature, amount, timing and uncertainty of revenue and cash flows arising from a contract with a customer.
The basic principle implies the recognition of revenue that represent the transfer of goods or services to customers at an amount that reflects the consideration the entity expects to be entitled in exchange for those goods or services.
The Company is currently analyzing the impact of IFRS 15. However, it is estimated that this standard will not significantly impact the results of operations or the financial position of the Company.
Improvements to the IFRSs
In September 2014, the IASB published amendments to the IFRSs that are applicable for periods beginning on or after January 1, 2016. Earlier application is permitted.
The Company is currently analyzing the impact of the implementation of the amendments. However, it is estimated that this amendments will not have an impact on the results of operations or the financial position of the Company.
2.3. Consolidation and interests in other companies
2.3.1. Investments in related companies
2.3.1.1. Subsidiaries
Subsidiaries are entities over which the Company exercises control as a consequence of their exposure or rights to variable returns and their ability to influence them through its power to direct the relevant activities, including generally a shareholding of more than half of the voting rights.
Subsidiaries are fully consolidated as from the date on which control is transferred to the Company. They are deconsolidated from the date that control ceases.
The Company applies the acquisition method to account for business combinations. The acquisition cost is determined as the fair value of the assets transferred, equity instruments issued and debt assumed at acquisition date. Costs directly attributable to acquisition are charged to income as incurred. A non-controlling interest in the acquired company is measured at fair value at acquisition date or on the basis of the proportional value of net assets acquired. The excess of acquisition cost and the non-controlling interest amount in the acquired company over net identifiable assets is recorded as goodwill. If this amount is lower than fair value of net assets acquired, the difference is recognized in the Consolidated Statement of Income.
Acquisitions of subsidiaries qualifying as companies under common control are recorded following the guidelines described in Note 2.3.1.4.
Since the functional currency of some subsidiaries is different from the functional currency of the Company, exchange gains or losses arise from intercompany operations. Those exchange results are included in “Financial results” in the Consolidated Statement of Income.
F-11
The accounting policies of subsidiaries have been changed as deemed necessary for consistency with the accounting policies adopted by the Company.
Petrobras Argentina has consolidated line by line its financial statements with those of companies over which it exercises control.
In the consolidation of subsidiaries, the amount of the investment in such subsidiaries and the share in their profit or loss and cash flows are replaced by the aggregate assets, liabilities, income (loss) and cash flows of such subsidiaries, while the non-controlling interest is reflected separately. The intercompany receivables, payables and transactions within the consolidated group are eliminated in the consolidation. The unrealized intercompany gains or losses from transactions within the consolidated group have been completely eliminated.
2.3.1.2. Interest in joint arrangements
A joint arrangement is a contractual agreement whereby two or more parties engage joint control. Joint control exists only when decisions relating to the relevant activities require the unanimous consent of the parties sharing control.
A joint operation is a joint arrangement whereby the parties that have joint control of the arrangement have rights to the assets and obligations for the liabilities, relating to the arrangement.
A joint venture is a joint arrangement whereby the parties that have joint control of the arrangement have rights to the net assets of the arrangement.
2.3.1.2.1. Joint ventures
Investments in joint ventures are initially recognized at cost and are subsequently measured under the equity method.
As of December 31, 2014, 2013 and 2012, the Company exercises joint control over CIESA. As of December 31, 2012 the Company had joint control over Distrilec whose sale was effective on January 30, 2013 (Note 17.1.1).
The intercompany gains or losses from transactions between the Company and entities under joint control are eliminated proportionally to the Company’s interest in such companies.
The accounting policies of entities under joint control were changed as deemed necessary for consistency with the accounting policies adopted by the Company.
The carrying value of investments in joint ventures, each of which is considered a cash-generating unit, is assessed for impairment when facts or changes in circumstances indicate that the book value could not be recoverable and, if applicable, an impairment loss is recorded.
2.3.1.2.2. Joint operations
The Company recognizes its proportionate interest in the joint operations assets, liabilities, revenues, costs and expenses related to its participation in joint operations in different consortia and joint ventures for exploration and production of hydrocarbons.
2.3.1.3. Associates
Associates are entities over which the Company has significant influence but not control, generally representing a shareholding of between 20% and 50% of the voting rights. Investments in associates are initially recognized at cost, including goodwill recognized at the acquisition date and subsequently measured under the equity method.
The intercompany gains or losses from transactions between the Company and associates are eliminated proportionally to the Company’s interest in such companies.
The accounting policies of associates have been changed as deemed necessary for consistency with the accounting policies adopted by the Company.
F-12
The carrying value of investments in associates, each of which is considered a cash-generating unit, is assessed for impairment when facts or changes in circumstances indicate that the book value could not be recoverable and, if applicable, an impairment loss is recorded.
2.3.1.4. Business combination under common control
As of May 31, 2012, PELSA was a company controlled by Petrobras Holdings Ltd., with a direct holding of 39.671% and 19.21% indirect holding through Petrobras Argentina, so it qualifies as a company under common control (Note 17.5).
Business combinations between companies under common control are accounted for by considering the book value of the acquired company in the holding company ultimately in this case, Petrobras Participaciones SL. The difference between the price paid and the carrying amount mentioned before is recorded in equity (“Other” Note 2.6.8). The transaction costs are expensed in the period in which they accrue.
2.3.2. Financial information
In preparing these financial statements, the financial information of companies over which the Company exercises control, joint control and associates as of December 31, 2014, 2013 and 2012 was used, or the best available financial information as of those dates, adapted to an equal period of time. Adjustments have also been considered.
2.4 Translation of foreign operations
The main considerations of translation into presentation currency are shown below.
2.4.1. Functional and presentation currency
The financial information of PESA’s entities was prepared in their functional currency, that is, the currency of the primary economic environment in which the entity operates.
The functional and the presentation currency of Petrobras Argentina’s financial statements is the Argentine peso. These financial statements have been prepared under the historical cost convention in nominal currency as established by the IFRSs, a standard applicable to non-hyperinflationary economies.
According to this, the financial statements have been prepared according to IAS 29.
2.4.2. Outstanding balances and transactions
Foreign currency transactions are remeasured into the functional currency using the exchange rates prevailing at the date of the transaction.
Foreign exchange gains and losses resulting from settlement of such operations or from remeasurement at year-end of monetary assets and liabilities denominated in foreign currency are recognized in the Consolidated Statements of Income, except for cash flow or net investment hedges that qualify for exposure as “Other comprehensive income”.
F-13
2.4.3. Subsidiaries and associates
The results and financial position of subsidiaries and associates that have a different functional currency from PESA’s presentation currency are translated into the presentation currency as follows:
| | • | | the assets and liabilities are translated using the closing exchange rate; |
| | • | | the gains or losses are translated using the exchange rates prevailing at the date of the transactions. |
The results from the remeasurement process into the functional currency are recorded in line “Financial results” of the Consolidated Statement of Income.
The results from the remeasurement process into the functional currency to presentation currency transactions are recognized in “Other Comprehensive Income”. When an investment is sold or disposed of, in whole or in part, the related exchange differences are recognized in the Consolidated Statement of Income as part of the gain/loss on the sale or disposal.
2.5. Operating Segments Reporting
The Company has adopted IFRS 8—Segment Reporting, which states that those business segments are identified on the basis of internal reports about components of the Company reviewed regularly by the Board Committee, chief operating decision maker in order to allocate resources and evaluate their performance.
In segmentation the Company considers transactions with third parties and intercompany operations, which are valued as defined by internal transfer prices between segments, with verification methodologies based on market parameters.
The Company’s business is mainly focused on the energy sector, basically through its activities relating to oil and gas exploration and production, refining and distribution, petrochemicals and gas and energy. Accordingly, the identified operating segments are as follows:
(a) Oil and Gas Exploration and Production, composed of the Company’s participation in oil and gas blocks and its interest in Oleoductos del Valle S.A., OCP, direct and indirect interest in mixed companies in Venezuela and PELSA, consolidate company as of Jun 1, 2012 (Note 17.5).
(b) Refining and Distribution, including the Company’s own operations in the refinery of Bahía Blanca and the gas station network, the Company’s equity interest in Refinería del Norte S.A. and the commercialization of the oil produced in Argentina, which is transferred at market prices from the Oil and Gas Exploration and Production operating segment.
(c) Petrochemicals, styrenics operations and the catalytic reformer plant operations developed in Argentina.
(d) Gas and Energy, comprising the Company’s own operations relating to the sale of gas produced in Argentina and liquefied petroleum gas brokerage activities, its interest in TGS, the electricity generation activities of Genelba Power Plant and of Pichi Picún Leufú Hydroelectric Complex, and its interest in Enecor. The 2012 year include Edesur shareholding, through its parent company Distrilec, the sale became effective January 31, 2013 (Note 17.1.1).
The liquids obtained from the processing of oil and gas are produced in the business segments of Exploration and Production of Oil and Gas, Refining and Distribution and Petrochemicals. Until the year ended December 31, 2013, the sales of these products was on the segment Gas and Energy, and from 1 January 2014, such sales were decentralized in each of the segments where they are produced.
(e) Assets and operating income related to the Central Service Structure, those not attributable to any given operating segment and intercompany eliminations are collectively shown.
In the Central Service Structure includes common costs to individual business segments, among others, management fees, tax on financial transactions, financial liabilities and interest income tax, which are incurred by the Company in the ordinary course of its operations and control economy that are managed from the central structure and not reappropriate between operating segments.
F-14
2.6. Basis of measurement
The main measurement criteria used in the preparation of these financial statements are as follows:
2.6.1. Financial assets
2.6.1.1. Classification of financial assets
The Company classifies its financial assets as follows:
Financial assets at fair value through profit or loss
This category includes financial assets acquired or held for trading or sale in the short term or those so designated by Management. Gains and losses derived from changes in fair value are recognized in the Consolidated Statement of Income.
Within this category, the Company has mutual funds which are measured at the fair value of those funds at each reporting date.
Loans and Receivables
Loans and receivables are non-derivatives financial instruments with fixed or determinable payments that are not quoted in an active market. They are initially recognized at fair value plus any directly attributable transaction cost. After initial recognition, loans and receivables are measured at amortized cost using the effective interest method, less impairment loss, if applicable.
Within this category, the Company has time deposits, loans to several associate’s companies, other investments, trade receivables, other receivables, accounts payable and loans.
2.6.1.2. Impairment of financial assets
The Company assesses at each reporting date whether there is objective evidence that a financial asset or group of financial assets is impaired and if so, an impairment charge is recorded under Other operating income (expense).
In the years ended December 31, 2014, 2013 and 2012, impairment charge of financial assets relate to the allowance for doubtful are indicated in Note 14.
2.6.1.3. Cash and cash equivalents
Cash and cash equivalents include cash on hand, term deposits and other short-term highly liquid investments with original maturities of three months or less.
Bank overdrafts are accounted for within “Loans” in current liabilities in the Consolidated Statement of Financial Position. For purposes of the cash flow statement, bank overdrafts are part of the cash equivalents.
2.6.1.4. Trade receivables and accounts payable
Trade receivables are recognized initially at fair value and subsequently measured at amortized cost using the effective interest method, net of an allowance for bad debts, if applicable.
The amortized cost of trade receivables, other receivables, other long-term investments, accounts payable and other payables approximates to its fair value. Also, the fair value of current bank and financial debt does not differ significantly from their carrying amount at 31 December 2014, 2013 and 2012.
F-15
An allowance for bad debts is recognized when there is objective evidence that the Company will not be able to collect its receivables at their original maturities or for the full amount. In recognizing such allowance, the Company evaluates different factors, including the customers’ credit risk, historical trends and other relevant information. Such evaluation may require future adjustments if economic conditions substantially differ from the assumptions made. The amount of the allowance is the difference between the book value of the asset and the present value of the estimated future cash inflow, discounted at the effective interest rate. The asset is presented net of the allowance for bad debts, if applicable. The loss from bad debts is recognized in the Consolidated Statement of Income under “Administrative and selling expenses”.
Accounts payable are initially recognized at fair value and subsequently measured at amortized cost using the effective interest method.
2.6.1.5. Accounting for derivative financial instruments
Derivative financial instruments are measured at fair value, determined as the amount of cash to be collected or paid to settle the instrument as of the measurement date, net of any collected or paid monies.
Changes in the measurement of derivative financial instruments designated as effective cash flow hedges are recognized under “Other comprehensive income” in “Equity”. Changes in the measurement of derivative financial instruments that do not qualify for hedge accounting or are not designated as hedges are recognized in the Consolidated Statement of Income under “Financial results”.
A hedge is considered effective when originally, as in the rest of life, its changes offset from eighty and a hundred twenty five percent change in the opposite direction of the hedged item. In this regard, the Company excludes the specific component attributable to time value of an option in the measurement of the effectiveness of the instruments that qualify for hedge accounting.
Hedge accounting must cease upon occurrence of any of the following events: (a) the hedge instrument has matured or has been settled; (b) the hedging transaction is no longer effective; or (c) the forecast transaction does not have a high likelihood of occurrence. Income or loss arising from the hedging instrument that would have been allocated to “Other comprehensive income” should remain there until the committed or forecast transaction occurs, in the case of (a) and (b), and are charged to the Consolidated Statement of Income in the case of (c).
As of December 31, 2014, 2013 and 2012, the Company did not maintain relevant derivative financial instruments, and no significant charges were recorded in results for this kind of operations in the fiscal years ended on such dates.
2.6.1.6. Loans
Loans are initially recognized at fair value net of incurred transaction costs. Subsequently, they are carried at amortized cost. Any difference between the proceeds (net of transaction costs) and redemption value is recognized in the Consolidated Statement of Income throughout the life of the loans using the effective interest method.
The loans are classified as current liabilities unless the Company has the right to defer settlement of the liability by at least 12 months following the reporting date.
2.6.2. Other receivables and payables
Other receivables and payables have been initially recognized at fair value and subsequently measured at their amortized cost using the effective interest method. In addition, “Other receivables” include, among others, advances to suppliers measured on the basis of the amounts actually disbursed.
2.6.3. Inventories
This line item includes crude oil stock, raw materials, work in progress and finished products relating to the Refining and Distribution, Petrochemicals and Gas and Energy business segments.
F-16
Inventories are stated at the lower of cost or net realizable value. Cost is determined using the weighted average price method. The cost of inventories includes expenditure incurred in purchases and production and other necessary costs to bring them to their existing location and condition. In case of manufactured products and production in process, the cost includes a portion of indirect production costs, excluding any idle capacity (slack).
The net realizable value is the estimated selling price in the ordinary course of business less the estimated cost of completion and the estimated costs to make the sale.
The assessment of the recoverable value of these assets is made at each reporting date, and the resulting loss is recognized in the Consolidated Statement of Income when the inventories are overstated.
2.6.4. Property, plant and equipment
2.6.4.1. General principles
Property, plant and equipment, except as indicated below, is measured following the cost model. Any expenditure subsequent to the original recognition of the asset is added as a component of the asset only when the expenditure improves its condition and it is probable that future economic benefits, in excess of the originally assessed ones, will be generated by such asset or when the expenditure relates to recognize a major repair or overhaul of the asset which is conducted to allow the continued use of the asset provided (i) such expenditure is allocated to the replacement of the component parts of the asset, (ii) the useful life of such component parts has been calculated based on their own wear and tear or depletion and (iii) it is probable that future economic benefits will flow as a result of the expenditure.
The cost of work in progress whose construction will extend over time includes, if applicable, the computation of financial costs accrued on loans granted by third parties and other pre-production costs, net of any income obtained from the sale of commercially valuable production during the launching period. In 2014, 2013 and 2012 no borrowing costs were capitalized.
Property, plant and equipment related to foreign operations have been translated into the functional currency at historical exchange rates, and they have been translated into pesos at the closing exchange rates.
2.6.4.2. Oil and gas exploration and production activities
The Company uses the successful efforts method of accounting for its oil and gas exploration and production activities. This method involves the capitalization of: (i) the cost of acquiring properties in oil and gas exploration and production areas; (ii) the cost of drilling and equipping exploratory wells that result in the discovery of commercially recoverable reserves; (iii) the cost of drilling and equipping development wells, and (iv) the estimated future costs of well abandonment and restoration.
According to the successful efforts method of accounting, exploration costs, excluding exploratory well costs, are expensed during the period in which they are incurred. Drilling costs of exploratory wells are capitalized until it is determined that proved reserves exists and they justify the commercial development. If reserves are not found, such drilling costs are expensed. Occasionally, an exploratory well may determine the existence of oil and gas reserves but they cannot be classified as proved when drilling is complete. In those cases, such costs continue to be capitalized insofar as the well has allowed to determine the existence of sufficient reserves to warrant its completion as a production well and the Company is making sufficient progress in evaluating the economic and operating feasibility of the project.
Estimated future well abandonment and restoration costs in hydrocarbons areas, discounted at a current rate, are capitalized in the cost of the assets and depreciated using the units of production method. Additionally, a liability at the estimated value of the discounted amounts payable is recognized.
F-17
2.6.4.3. Depreciation
The Company depreciates productive wells, machinery and camps in the oil and gas production areas according to the units of production method, by applying the ratio of oil and gas produced to estimated proved developed oil and gas reserves. The acquisition cost of property with proved reserves is depreciated by applying the ratio of oil and gas produced to estimated proved oil and gas reserves. Acquisition costs related to properties with unproved reserves is valued at cost with recoverability periodically assessed on the basis of geological and engineering estimates of possible and probable reserves that are expected to be proved over the life of each concession.
The Company’s remaining items of property, plant and equipment are depreciated by the straight-line method based on estimated useful lives, as detailed below:
| | | | |
Property, plant and equipment | | Years of useful life | | Depreciation rate |
Machinery, tools and equipments | | 5 - 20 | | 5% - 20% |
Electricity generation plants | | 25 - 33 | | 3% - 4% |
Industrial complex | | 25 | | 4% |
Others | | 3 - 50 | | 2% - 33% |
The depreciation method is reviewed at each year-end. If expectations differ from previous estimates, adjustments are made prospectively at closing of each year, if applicable.
Petrobras Argentina depreciates, using the straight-line method, each significant component of the assets not related to oil and gas production areas that: (i) is identifiable as an independent component with a significant cost in relation to the total value of the asset, and (ii) has an operating useful life that differs from another significant part of the same asset.
2.6.4.4. Impairment of non–financial assets
The carrying value of property, plant and equipment does not exceed their recoverable value. The Company’s Management assesses the recoverability of property, plant and equipment items whenever events or changes in circumstances (including significant decreases in the market value of assets, in the prices of the main products sold by the Company or in oil and gas reserves, as well as changes in the regulatory framework for the Company’s activities, significant increases in operating expenses, or evidence of obsolescence or physical damage) indicate that the carrying amount may not be recoverable. The book value of an asset is adjusted down to its recoverable value if its carrying amount exceeds the latter.
From a regulatory standpoint, recoverable amount is defined as the higher of fair value less costs of disposal and value in use, the latter is defined as the addition of the discounted expected net cash flows that arise as a direct result of the use and eventual final disposition of the assets. To such end, among other elements, the assumptions that represent the best estimate made by Management of the economic conditions that will prevail throughout the useful life of the assets are considered.
Discount rates used to calculate the value in use are the respective WACC. For each asset or cash generating unit a specific WACC was determined which considered the business segment and the country conditions where the operations are performed.
In subsequent periods, the reversal of the impairment charge is evaluated if there are changes in the assumptions used to determine the asset recoverable value. In such a case, the book value of the asset or cash generating unit is written up to the lower of: a) the book value that the asset or cash generating unit would have had if the impairment had never been recognized; and b) its recoverable value.
As of December 31, 2014 the Company recognized an impairment charge of 94 on property, plant and equipment (Note 19).
As of December 31, 2013 the Company recognized an impairment charge of 11 on property, plant and equipment (Note 19).
As of December 31, 2012, the Company did not recognize any impairment charge on property, plant and equipment.
F-18
2.6.5. Labor costs liabilities
Labor costs liabilities are accrued in the periods in which the employees provide the services that trigger the consideration.
The cost of defined contribution plans is periodically recognized in accordance with the contributions made by Petrobras Argentina.
For purposes of determining the estimated cost of post-retirement benefits granted to employees, the Company has used actuarial calculation methods, making estimates with respect to applicable demographic and financial variables. The amount recognized as liability attributable to such benefits represents the addition of the present value of the obligation, net of the present value of the assets of the plan, with which the obligations will be settled.
Actuarial gains and losses are recognized on “Other comprehensive income” and costs of services provided in the past in the consolidated statement of income.
2.6.6. Taxes payable
2.6.6.1. Income tax
Income tax expense for the year comprises current and deferred tax and is recognized in the Consolidated Statement of Income, except to the extent it relates to items recognized in the Consolidated Statement of Comprehensive Income. In this case, the corresponding tax effect is also recognized in such statement.
The current income tax expense is calculated on the basis of the tax laws in force or in process of enactment at the reporting date in the countries where the Company’s subsidiaries operate and generate taxable income. The Company’s management periodically evaluates criteria adopted in tax returns as regards situations in which applicable tax regulation is subject to interpretation and sets up provisions where appropriate.
The Company accounts for the deferred tax balance using the liability method, which establishes the determination of net deferred tax assets and liabilities on the basis of temporary differences between the accounting and tax measurement of assets and liabilities. Temporary differences result in the recognition of tax assets and liabilities when their future reversal decreases or increases the taxes to be determined, without affecting the compensation of the pertinent amounts. The Company recognizes deferred tax assets if, and only if, it is considered probable that there will be sufficient future taxable profit against which the tax loss could be used.
Deferred assets and liabilities are measured at the tax rate that is expected to be applicable in the period when the asset will be realized or the liability settled, on the basis of the tax rates in force or in process of enactment at the reporting date.
Deferred tax assets and liabilities are offset by company if there is a legally enforceable right to set off tax assets and liabilities and if the deferred income tax is related to the same tax authority.
The deferred tax assets and liabilities are stated at their nominal value.
Income tax rates prevailing at year-end in Argentina, Venezuela, Ecuador, Bolivia and Spain are 35%, 50%, 22%, 25% and 30%, respectively. Additionally, payment of Bolivian-source income to beneficiaries outside Bolivia is levied with a 12.5% withholding income tax.
2.6.6.2. Minimum presumed income tax
In Argentina, the minimum presumed income tax is supplementary to income tax, since while the latter is levied on the taxable income for the year, the minimum presumed income tax is a minimum tax levied on the potential income of certain productive assets at the rate of 1%, so that the Company’s final liability will be equal to the higher of both taxes. However, if the minimum presumed income tax exceed the calculated income tax in any given year, such excess may be applied to reduce any excess of income tax over the minimum presumed income tax in any of the ten succeeding years.
In the years ended December 31, 2014, 2013 and 2012, income tax expenses were higher than minimum presumed income tax. Therefore, the Company only recorded income tax expense.
F-19
2.6.6.3. Hydroelectric royalties
For the operation of Pichi Picún Leufú Hydroelectric Complex, the Company pays, since 2002, hydroelectric royalties of 1%, increasing at a rate of 1% per year up to the maximum percentage of 12% of the amount resulting from applying the rate for the bulk sale to the power sold under the terms of Section No. 43 of Law No. 15,336, as amended by Law No. 23,164. In addition, the Company is subject to a monthly license fee payable to the Federal Government for the use of the power source equivalent to 0.5% of the same basis used for the calculation of the hydroelectric royalty.
2.6.6.4. Withholdings on exports of hydrocarbons
The Public Emergency and Exchange System Reform Law No. 25,561 established the creation of a system of withholdings on exports of hydrocarbons for five years from March 1, 2002, which was subsequently extended for five years by Law No. 26,217. The effect of such withholdings is deducted from the respective selling prices.
Crude Oil
Effective since November 2007, Resolution No. 394/07 issued by the Ministry of the Economy and Production established a new method for calculating withholdings on exports of crude oil, and gave equivalent treatment to certain oil related products as that of crude oil. This amendment results in the application of a variable export withholding based on a formula that considers the international price of crude oil and a cut-off price by product. Under this method, when the international (quoted) price of crude oil exceeds US$ 60.90 per barrel, an increasing withholding rate is set for crude oil exports that results in a price cap of US$ 42 per barrel of standard-quality crude oil. When the international price of crude oil dips below US$ 45 per barrel, the regulations call for the authorities to determine a new applicable withholding rate within 90 days. The same rules apply to exports of refined products such as gasoline, fuel oil and lube oils, for which different cut-off and reference prices were defined. On January 3, 2013 the Ministry of Economy and Public Finance, by Resolution No. 01/13, proceeded to modify the methodology for the calculation of taxes on exports of crude oil by increasing the reference value at USD 80 per barrel and cutoff value to $ 70 per barrel.
In October 2014, through Resolution No. 803/14, the Ministry of Finance amended Resolution No. 394/07 and modified the withholding tax on hydrocarbon exports linking the rate (ranging from 10% to 13%) to a specific price schedule.
On January 1, 2015 Resolution No. 1077/14 of the Ministry of Economy and Public Finance came into effect. This resolution supersedes Resolution No. 394/2007 as amended by Resolution No. 803/14 and provides that for so long as the International price of crude oil is less than USD 71 per barrel the withholding tax rate shall be 1%, and incremental tax rates will apply for so long as the international price of crude oil is equal or higher than USD 71 per barrel.
Natural gas
In March 2008, the Ministry of Economy and Production issued Resolution No.127/08 which, in connection with natural gas, amended Resolution No. 534/2006, whereby a 45% withholding rate was established on the price of the gas imported from Bolivia, and imposed a 100% withholding on natural gas exports, considering for valuation purposes the highest price set for natural gas under the applicable agreements for natural gas imports into Argentina. In addition, pursuant to such resolution, the methodology for calculating withholdings on exports of crude oil, under Resolutions No. 394/07 and No. 1/13, was also applied to LPG. During 2015, the Argentine government issued some measures for the LPG market. Resolution 60/2015 reduced withholding tax on LPG exports from 45% to 1% and Resolution 36/2015 modified the price calculation method of LPG products.
2.6.6.5. Foreign Exchange Regime – Obligation to exchange into local currency 100% of foreign currency proceeds from exports of crude oil and oil related products
Decree N° 1,722/2010 dated October 25, 2011 reestablished the obligation that all foreign currency proceeds from exports of crude oil and oil related products, natural gas and liquefied gas must be negotiated in the local exchange market regulated by BCRA.
The decree therefore makes it mandatory for Petrobras Argentina to exchange into local currency 100% of the proceeds of its exports of goods and services in Argentine.
F-20
2.6.6.6. New regulations for hydrocarbon activities in Argentina.
Law Nº 26,741 passed in May 2012 declared of public interest and a state priority in the Republic of Argentina the achievement of self-sufficiency in hydrocarbons supply and the activities of hydrocarbon exploration, exploitation, industrialization, transportation and marketing. In addition, YPF S.A.’s and Repsol YPF Gas S.A.’s assets were declared of public interest and subject to expropriation in a fifty one per cent (51%).
By means of Decree Nº 1,277 passed in July 2012, the Argentine Executive Branch approved the regulations for the implementation of Law Nº 26,741 and issued the Rules of the Argentine Hydrocarbon Sovereignty regime, which established the creation of the Commission of Planning and Strategic Coordination of the National Hydrocarbon Investments Plan (the “Commission”) under the Ministry of Economic Development Policy and Planning of the Ministry of Economy and Finance, as well as the National Hydrocarbon Investment Register (the “Register”) . Decree No. 1,277/12 established the obligation of the companies in the oil and gas industries from Argentina to present to the Commission an annual investment plan of exploration and exploitation. The Commission is required to design a Hydrocarbon National Investment Plan, which seek to maximize investment and sustainability of the industry in the short, medium and long term. In addition, Decree Nº 1,277 also derogated certain sections of Decrees Nº 1,055/89, Nº 1,212/89 and Nº 1,589/89 that provided for the free availability of hydrocarbons produced in concession areas granted, the free commercialization in the domestic and foreign markets and the freedom to set prices.
The Company has complied with all applicable reporting requirements.
In February 2013, by Resolution No. 1/2013, the Commission created the “Incentive Program Injection Natural Gas Surplus,” companies can participate enrolling in the Register and submiting projects to increase the total volume of natural gas to be injected into the domestic market during the proposed period. Once the project is implemented, it provides: a) compensation for injection based on surplus at a price of 7.5 USD / MBTU and b) a fine in the case of the company during a specified period, has not managed to increase production volumes committed. In order to develop gas fields in Argentina, the Company formalized presentations required for the qualification of Resolution No. 1/2013 and so far the Commission has not issued.
Additionally, in November 2013, by Resolution No. 60/2013, the Commission created the “Stimulus Program Injection Natural Gas for Business with Reduced injection”. Producers have until March 31, 2014 to present their project to contribute to increase levels of natural gas production. The same is aimed at companies without previous production, or capped at 3.5 MMm3/day, with price incentives before increases production, and LNG import penalties if the companies do not comply with the committed volumes. Also, those companies that were program beneficiaries mentioned in the preceding paragraph and meet the conditions thereof, can request the termination of its participation in that program and its incorporation into the present.
In October 2014, Law No. 27,007, was passed, amending Hydrocarborn Law No. 17,319, which defined and regulated the exploration and exploitation or unconventional hydrocarbons; introduced changes to the extension of concession terms, established a special royalty system and a system to promote hydrocarbon investments, and; prohibited the creation of reserved areas in favor of state-owned corporations or corporations with private controlling interest. In addition, among its temporary provisions, the law granted a 90-day term to complete the negotiation process to extend existing concessions.
In February, 2015 the Commission issued Resolution 14/2015 creating the Crude Oil Production Stimulus Program (Programa de Estímulo a la Producción de Petróleo Crudo) providing for export and/or production stimulus payment for registered companies subject to certain requirements.
2.6.7. Provisions
Accounting provisions are recognized when: a) the Company has a present obligation (legal or assumed) as a result of a past event, b) it is probable that an outflow of resources will be required to settle that obligation, and c) can get a reliable estimate of the amount of the obligation.
Provisions are measured at the present value of the expenditures expected to be required to settle the obligation, taking into account the best available information at the time of preparation of the financial statements based on assumptions and methods considered appropriate. As additional information becomes available to the Company, estimates are revised and adjusted periodically. The discount rate used to determine the present value reflects current market assessments at the balance sheet date, the time value of money and the specific risks associated with the particular person.
F-21
2.6.8. Equity accounts
Except as noted in “Retained earnings”, the activity in the Equity accounts reflects resolutions adopted by Shareholders in their meetings, or the effects of the laws or regulations in force.
Capital Stock
The capital stock consists of contributions made by shareholders represented by shares and capitalization of retained earnings, and comprises outstanding shares at their nominal value issued under Argentine law.
Adjustment to capital stock
Capital stock accounts were restated in constant currency. The capital stock account was kept at nominal value and the adjustment arising from such restatement is shown under “Adjustment to capital stock”.
Capital stock adjustment is not distributable in cash or in kind but may be capitalized through issuance of shares. In addition, this balance may be used to compensate accumulated losses in accordance with the compensation method specified under “Retained earnings”.
Additional paid in capital from merger
This account was generated in January 2005 as a result of the merger of Eg3, PAR and Petrolera Santa Fe, whereby all assets, liabilities, rights and obligations of the absorbed companies were included in the Company’s equity and shares of the Company were issued based on the approved share exchange ratio.
Additional paid-in capital on sales of stock of parent
The account additional paid-in capital on sales of stock of parent generated until 2010, as a result of the sale of shares of the Company, with sales values greater than their acquisition costs.
During the third quarter of 2010 and in compliance with the terms and conditions in section 220 of the LSC, the Company sold these treasury shares under the preemptive right provisions set forth in Sections 221 and 194 of the LSC, and subsequently transferred to Optimum Petrobras Trust the remaining shares of the Company (Note 23.4).
Legal reserve
Pursuant to the provisions of the LSC, the Company is required to set up a legal reserve by providing at least 5% of the aggregate amount of net income for the year, prior year adjustments, transfers of other comprehensive income to retained earnings and accumulated losses of prior years, when this aggregate amount exceeds zero until the legal reserve equals 20% of the sum of “Capital stock” and “Adjustment to capital stock” balances.
Reserve for future investments
The Company’s Shareholders’ Meeting allocates a specific amount to establish a special Reserve to develop the Company’s investment activities, which are focused on the oil and gas exploration and production business.
Future dividends reserve
It relates to the amount allocated by the Shareholders to set up a reserve for future dividends. In addition, the Shareholders delegated on the Company’s Board of Directors the determination of the date and amount of the dividend distribution until the following Shareholders’ Regular Meeting.
Other comprehensive income
It includes the gain and loss from the remeasurement of foreign operations, net of foreign exchange differences arising from the indebtedness of the Company denominated in foreign currency designated as hedge of the net foreign investment, actuarial gains and losses for defined benefit plans and the related tax effect (Note 27).
F-22
Unappropriated retained earnings
Until December 2012, the outstanding balance of retained earnings includes accumulated gains or losses which were not allocated to a specific purpose reserve and, when positive, may be distributed pursuant to the decision of the Shareholders provided these retained earnings are not subject to legal restrictions, as mentioned under “Legal reserve”.
This account therefore includes retained earnings carried forward from prior years, amounts transferred from other comprehensive income and prior year adjustments resulting from the application of IFRS.
General Resolution N° 593/2011 issued by the CNV provided that Shareholders in the Meetings at which they should decide upon the approval of financial statements in which the Retained earnings account has a positive balance, should adopt an express resolution as to the allocation of such balance, whether to dividend distribution, capitalization, setting up of reserves or a combination of these. The Company’s Shareholders complied with these requirements at their meeting held on March 29, 2012 (Note 26).
Distribution of dividends
The cash dividend is recognized as a liability in PESA’s financial statements in the year in which they are approved by the shareholders of the Company.
Other items in Equity
The “Other” financial statement line corresponds to the amount generated by the acquisition of PELSA (note 17.5), operation defined as a business combination of companies under common control, which affected retained earnings in (693), determined as the difference between the carrying amount of assets and liabilities at the date of the transaction and the amount paid. Total distributable retained earnings are reduced by the balance of this item.
2.6.9. Basic and diluted earnings per share
Basic earnings per share are calculated by dividing the amount of income or loss attributable to Shareholders of the Company by the weighted average number of ordinary shares outstanding during the year.
Since the Company does not have preferred shares or debt convertible into shares, basic and diluted earnings per share are the same.
2.6.10. Revenue recognition
Revenues from the sale of crude oil, natural gas, petrochemical and refined products are recognized when the products are delivered. Revenue is measured at the fair value of the consideration received or receivable taking into account the amount of any trade discounts and volume rebates allowed by the entity.
Revenue from the sale of goods is recognized when all the following conditions have been satisfied:
| | (a) | the entity has transferred to the buyer the significant risks and rewards of ownership of the goods; |
| | (b) | the entity retains neither continuing managerial involvement to the degree usually associated with ownership nor effective control over the goods sold; |
| | (c) | the amount of revenue can be measured reliably; |
| | (d) | it is probable that the economic benefits associated with the transaction will flow to the entity; and |
| | (e) | the costs incurred or to be incurred in respect of the transaction can be measured reliably. |
Revenues from oil and natural gas production in which the Company has a joint interest with other producers are recognized on the basis of the net working interest, regardless of actual assignment. Any imbalance between actual and contractual assignment will result in the recognition of an amount payable or receivable according to the actual share in production, whether above or below the production resulting from the Company’s contractual interest in the consortium. As of December 31, 2013, 2012 and January 1, 2012 gas imbalance liabilities were 3, 3 and 4, respectively, attributable to 47, 47 and 57 million cubic meters, respectively.
The Company performs diesel oil and gasoline sale transactions with other refining companies in different geographical areas to optimize the logistics chain. These transactions are disclosed on a net basis in the Statement of Income.
F-23
Revenues arising from the rendering of services are measured at the fair value of the consideration received or receivable, taking into account the estimated amount of any discount, thus determining the net amounts. Revenues are recognized when all of the following conditions are satisfied:
| | (a) | the amount of revenue can be measured reliably; |
| | (b) | it is probable that the economic benefits associated with the transaction will flow to the entity; |
| | (c) | the stage of completion of the transaction at the end of the reporting period can be measured reliably; and |
| | (d) | the costs incurred for the transaction and the costs to complete the transaction can be measured reliably. |
3. Critical accounting judgments and estimates
The preparation of the financial statements in conformity with IFRS requires management to make judgements, estimates and assumptions that affect the application of accounting policies and the reported amount of assets, liabilities, income and expenses. Actual results may differ from these estimates.
Estimates and underlying assumptions are reviewed on an ongoing basis. Revisions to accounting estimates are recognized in the period in which the estimates are revised and in any future periods affected.
The most significant estimates and assumptions are described below:
3.1. Oil and gas reserves
Reserves mean oil and gas volumes (in m3 of oil equivalent) that are economically producible, in the areas where the Company operates or has a (direct or indirect) interest and over which the Company has exploitation rights, including oil and gas volumes related to those service agreements under which the Company has no ownership rights on the reserves or the hydrocarbons obtained and those estimated to be produced for the contracting company under service contracts.
There are numerous uncertainties in estimating proved reserves and future production profiles, development costs and prices, including several factors beyond the producer’s control. Reserve engineering is a subjective process of estimating underground accumulations involving a certain degree of uncertainty. Reserves estimates depend on the quality of the available engineering and geological data as of the estimation date and on its interpretation and judgment.
Reserve estimates are adjusted when so justified by changes in the evaluation criteria or at least once a year. These reserve estimates are based on the reports of oil and gas consulting professionals.
The Company uses the information obtained from the calculation of reserves in the determination of depreciation of assets used in the areas of oil and gas, as well as assessing the recoverability of these assets (Notes 2.6.4.3., 2.6.4.4. and 17.2).
3.2. Provision for well abandonment
Well abandonment liabilities after completion of operations require the Company’s Management to estimate the number of wells, long-term well abandonment costs and the time remaining until abandonment. It is worth a mention that technology, costs and political, environmental and safety considerations constantly change and may result in differences between actual future costs and estimates.
3.3. Impairment of assets
For the purpose of assessing recoverability of non-financial assets, assets are grouped at the lower levels for which there are individually identifiable cash flows (cash generating units). For this purpose, each associated company and each jointly controlled company is considered a cash generating unit.
The methodology used for estimating the recoverable amount of assets mainly consists in determining the value in use.
F-24
3.4. Contingencies
The Company is subject to various claims, lawsuits and other legal proceedings that arise during the ordinary course of its business. The Company’s liabilities with respect to such claims, lawsuits and other legal proceedings cannot be estimated with certainty. Periodically, the Company’s Management reviews the status of each contingency and assesses potential financial, applying the criteria indicated in note 2.6.9, for which elaborates the estimates mainly with the assistance of legal advisors.
Contingencies include outstanding lawsuits or claims for possible damages to third parties in the ordinary course of the Company’s business, as well as third party claims arising from disputes concerning the interpretation of legislation.
The Company evaluates whether there would be additional expenses directly associated to the ultimate resolution of each contingency, which will be included in the provision if they may be reasonably estimable. If the assessment indicates that a potential loss contingency is not probable but is not remote, is possible, or is probable but cannot be estimated, then the nature of the contingent liability, together with an estimate of the possibility of occurrence, is disclosed in a note to the financial statements. Loss contingencies considered remote are not disclosed unless they involve guarantees, in which case the nature of the guarantee is disclosed.
3.5. Environmental costs
The costs incurred to limit, neutralize or prevent environmental pollution are only capitalized if at least one of the following conditions is met: (a) such costs relate to improvements in safety; (b) the risk of environmental pollution is prevented or limited; or (c) the costs are incurred to prepare the assets for sale and the book value (which considers those costs) of such assets does not exceed their respective recoverable value.
Liabilities related to future remediation costs are recorded when, on the basis of environmental assessments, such liabilities are probable to materialize, and costs can be reasonably estimated. The actual recognition and amount of these provisions are generally based on the Company’s commitment to an action plan, such as an approved remediation plan or the sale or disposal of an asset. The provision is recognized on the basis that a future remediation commitment will be required.
The Company measures liabilities based on its best estimation of present value of future costs, using currently available technology and applying current environmental laws and regulations as well as the Company’s own internal environmental policies.
3.6. Employment benefit
Actuarial commitments with employee benefit plans are recognized as liabilities in the statement of financial position based on actuarial estimates revised annually by an independent actuary, using the projected unit credit method.
The present value of pension plan obligations depends on multiple factors that are determined according to actuarial estimates which are revised annually by an independent actuary, net of the fair value of the plan assets, when applicable. To such effect, certain assumptions are used including the discount rate and wage growth rate assumptions.
4. Financial and non-financial equity risk management
4.1. Risk management objectives and policies
In performing its operations, the Company is exposed to a series of risks associated to the markets in which it operates.
The Company adopts an integrated risk management methodology, which is not focused on the individual risks of the operations of its business units but on a wider monitoring of risks affecting its entire portfolio.
The Company’s risk management strategy, in line with its business strategy, seeks to achieve a balance between profitability goals and its exposure to risk.
The Company and its subsidiaries are not engaged in or trade in derivative financial instruments for speculative purposes.
F-25
The Board of Directors establishes the policies for managing each of the risks set out below, which have been applied consistently in the years included in these financial statements:
4.1.1. Financial risks management
4.1.1.1 Exchange rate risks
The Company’s results of operations and financial position are sensitive to changes in the exchange rates between the currencies in which transactions are carried out and the functional currency of each subsidiary.
The Company is mainly exposed to changes in the peso exchange rate against the U.S. dollar. Petrobras Argentina’s exposure to currencies other than the US dollar is not significant.
The Company has a net asset position in foreign currency because a significant portion of its debt is designated as hedges of investment in foreign currency, so the exchange differences generated by this debt are recognized in “Other comprehensive income”.
F-26
The carrying amounts of assets and liabilities denominated in foreign currencies at the end of each fiscal year under report, including designated debt coverage indicated above, are as follows:
| | | | | | | | | | | | | | | | | | | | | | | | | | | | | | |
| | | Foreign
currency and
amount | | | Exchange
rate | | | Book
value in
local
currency | | | | | Foreign
currency and
amount | | | Exchange
rate | | | Book
value in
local
currency | |
CURRENT ASSETS | | | | | | | | | | | | | | | | CURRENT LIABILITIES | | | | | | | | | | | | | | |
Cash and cash equivalents | | USD | | | 89.6 | | | | 8.55 | | | | 766 | | | Accounts payable | | USD | | | 153.8 | | | | 8.55 | | | | 1315 | |
| | EU | | | 0.1 | | | | 10.42 | | | | 1 | | | | | EU | | | 0.2 | | | | 10.42 | | | | 2 | |
| | | | | | | | | | | | | | | | | | | | | | | | | | | | | | |
| | Bol | | | 3.6 | | | | 1.37 | | | | 5 | | | | | | | | | | | | | | | | 1,317 | |
| | | | | | | | | | | | | | | | | | | | | | | | | | | | | | |
| | | | | | | | | | | | | 772 | | | | | | | | | | | | | | | | | |
| | | | | | | | | | | | | | | | | | | | | | | | | | | | | | |
| | | | | | | | | | | | | | | | Short-term debt | | USD | | | 7.8 | | | | 8.55 | | | | 67 | |
| | | | | | | | | | | | | | | | | | | | | | | | | | | | | | |
Trade receivables | | USD | | | 53.9 | | | | 8.55 | | | | 461 | | | | | | | | | | | | | | | | | |
| | | | | | | | | | | | | | | | | | | | | | | | | | | | | | |
| | | | | | | | | | | | | | | | Payroll and social security taxes | | USD | | | 0.1 | | | | 8.55 | | | | 1 | |
Other receivables | | USD | | | 109.6 | | | | 8.55 | | | | 937 | | | | | $Bol | | | 15.4 | | | | 1.23 | | | | 19 | |
| | | | | | | | | | | | | | | | | | | | | | | | | | | | | | |
| | $Bol | | | 20.3 | | | | 1.23 | | | | 25 | | | | | | | | | | | | | | | | 20 | |
| | | | | | | | | | | | | | | | | | | | | | | | | | | | | | |
| | Bol | | | 28.5 | | | | 1.37 | | | | 39 | | | | | | | | | | | | | | | | | |
| | | | | | | | | | | | | | | | | | | | | | | | | | | | | | |
| | | | | | | | | | | | | 1,001 | | | Taxes payable | | USD | | | 2.5 | | | | 8.55 | | | | 21 | |
| | | | | | | | | | | | | | | | | | | | | | | | | | | | | | |
| | | | | | | | | | | | | | | | | | EU | | | 0.2 | | | | 10.42 | | | | 2 | |
| | | | | | | | | | | | | | | | | | | | | | | | | | | | | | |
| | | | | | | | | | | | | | | | | | | | | | | | | | | | | 23 | |
| | | | | | | | | | | | | | | | | | | | | | | | | | | | | | |
| | | | | | | | | | | | | | | | Provisions | | USD | | | 128.2 | | | | 8.55 | | | | 1096 | |
| | | | | | | | | | | | | | | | | | $Bol | | | 1.6 | | | | 1.23 | | | | 2 | |
| | | | | | | | | | | | | | | | | | | | | | | | | | | | | | |
| | | | | | | | | | | | | | | | | | | | | | | | | | | | | 1,098 | |
| | | | | | | | | | | | | | | | | | | | | | | | | | | | | | |
| | TOTAL 12/31/2014 | | | | | | | | 2,234 | | | | | TOTAL 12/31/2014 | | | | | | | | 2,525 | |
| | | | | | | | | | | | | | | | | | | | | | | | | | | | | | |
| | TOTAL 12/31/2013 | | | | | | | | 1,996 | | | | | TOTAL 12/31/2013 | | | | | | | | 1,762 | |
| | | | | | | | | | | | | | | | | | | | | | | | | | | | | | |
| | TOTAL 12/31/2012 | | | | | | | | 1,775 | | | | | TOTAL 12/31/2012 | | | | | | | | 2,280 | |
| | | | | | | | | | | | | | | | | | | | | | | | | | | | | | |
NON-CURRENT ASSETS | | | | | | | | | | | | | | | | NON CURRENT LIABILITIES | | | | | | | | | | | | | | |
Other receivables | | USD | | | 5.7 | | | | 8.55 | | | | 49 | | | Long-term debt | | USD | | | 299.6 | | | | 8.55 | | | | 2,562 | |
| | | | | | | | | | | | | | | | | | | | | | | | | | | | | | |
| | $Bol | | | 20.3 | | | | 1.23 | | | | 25 | | | | | | | | | | | | | | | | | |
| | | | | | | | | | | | | | | | | | | | | | | | | | | | | | |
| | | | | | | | | | | | | 74 | | | Provisions | | USD | | | 243.9 | | | | 8.55 | | | | 2,085 | |
| | | | | | | | | | | | | | | | | | | | | | | | | | | | | | |
Other investments | | USD | | | 12.4 | | | | 8.55 | | | | 106 | | | | | | | | | | | | | | | | | |
| | | | | | | | | | | | | | | | | | | | | | | | | | | | | | |
| | TOTAL 12/31/2014 | | | | | | | | 180 | | | | | TOTAL 12/31/2014 | | | | | | | | 4,647 | |
| | | | | | | | | | | | | | | | | | | | | | | | | | | | | | |
| | TOTAL 12/31/2013 | | | | | | | | 295 | | | | | TOTAL 12/31/2013 | | | | | | | | 3,906 | |
| | | | | | | | | | | | | | | | | | | | | | | | | | | | | | |
| | TOTAL 12/31/2012 | | | | | | | | 225 | | | | | TOTAL 12/31/2012 | | | | | | | | 3,067 | |
| | | | | | | | | | | | | | | | | | | | | | | | | | | | | | |
TOTAL ASSETS | | TOTAL 12/31/2014 | | | | | | | | 2,414 | | | TOTAL LIABILITIES | | TOTAL 12/31/2014 | | | | | | | | 7,172 | |
| | | | | | | | | | | | | | | | | | | | | | | | | | | | | | |
| | TOTAL 12/31/2013 | | | | | | | | 2,291 | | | | | TOTAL 12/31/2013 | | | | | | | | 5,668 | |
| | | | | | | | | | | | | | | | | | | | | | | | | | | | | | |
| | TOTAL 12/31/2012 | | | | | | | | 2,000 | | | | | TOTAL 12/31/2012 | | | | | | | | 5,347 | |
| | | | | | | | | | | | | | | | | | | | | | | | | | | | | | |
| USD | Millons United States Dollars |
| $Bol | Millons Bolivian Pesos |
During the year 2014, between March and November, the Company used derivative financial instruments, which did not produce significant results.
During the year 2013, between July and October, the Company used derivative financial instruments, which did not produce significant results.
As of December 31, 2012, the Company was not engaged in any derivative financial instruments to mitigate risks associated with exchange rate fluctuations.
F-27
Exchange rate sensitivity analysis
Considering the financial position as of December 31, 2014, Management estimates that each P$0.10 increase or decrease in the exchange rate against the U.S. dollar would result in a profit or loss before tax of 7 and no significant charges would result in line “Other comprehensive income” for the conversion of foreign operations, net of debt designated as a hedge. This sensitivity analysis is not inherent foreign exchange risk.
Management estimated, based on the financial position as of December 31, 2013 that for every increase or decrease in the exchange rate of 20% against the U.S. dollar would result in a profit or loss before taxes of 160 and an increase or decrease of 130 in line “Other comprehensive income”.
Management estimated, based on the financial position as of December 31, 2012 that each P$0.10 increase in the exchange rate against the U.S. dollar would result in a gain or loss before taxes of 7 and a reduction in equity of 68.
4.1.1.2 Interest rate risks
Management of interest rate risk aims at reducing financial costs and the Company’s exposure to interest rate increases.
As of December 31, 2014, 2013 and 2012 approximately 98%, 90% and 93%, respectively, of our total financial debt was subject to fixed interest rates while the remaining portion was subject to variable interest rates. Information regarding the financing of the Company and related interest rates is included in Note 20.
During the years ended December 31, 2014, 2013 and 2012, Petrobras Argentina was not engaged in any derivative financial instruments to mitigate the risks of interest rate fluctuations.
Interest rate sensitivity analysis
As of December 31, 2014, 2013 and 2012 the Company’s debt subject to variable interest rates was 48, 220 and 189, respectively. Considering the low amount of debt in 2014, 2013 and 2012, the Company is not currently exposed to a significant cash flow risk as a consequence of interest rate fluctuations.
4.1.1.3 Liquidity risk
The liquidity risk relates to the Company’s lack of sufficient funds to comply with all its economic, labor or business commitments.
The liquidity risk is associated with the Company’s ability to finance its commitments and carry out its business plans with stable sources of financing, as well as with the indebtedness level and the maturity profile of the financial debt.
The Company has a Liquidity Policy approved by the Board, the main principles are to preserve capital and maintain immediate liquidity. As part of this policy, maintains availability of cash resources, other liquid financial instruments and uncommitted credit lines in sufficient volume to meet the maturities of financial and commercial obligations, plus a balance between short and long debt term.
The Company has a funding policy that provides guidelines to avoid concentration in funding sources and credit counterparties.
It also uses a methodology for the analysis and setting of credit limits when placing investments in different financial institutions and mutual funds in order to minimize any associated credit risk.
F-28
Liquidity rate
The Company’s liquidity ratio as of December 31, 2014, 2013 and 2012 is shown below:
| | | | | | | | | | | | |
| | | 2014 | | | 2013 | | | 2012 | |
Current assets | | | 8,883 | | | | 6,596 | | | | 6,024 | |
Current liabilities | | | 5,895 | | | | 4,028 | | | | 4,342 | |
| | | | | | | | | | | | |
Liquidity rate | | | 1.51 | | | | 1.64 | | | | 1.39 | |
| | | | | | | | | | | | |
Aging of financial liabilities
The tables below analyzes the Company’s non-derivative financial liabilities and derivative financial liabilities into relevant maturity groupings based on the remaining period at the statement of financial position to the contractual maturity date. The amounts disclosed in the table are the contractual undiscounted cash flows and as a result they do not reconcile to the amounts disclosed on the statement of financial position except for short-term payables when discounting is not applied.
| | | | | | | | | | | | | | | | | | | | |
| | | | | | 2014 | |
| | | Note | | | Accounts
payable | | | Others
contractual
commitments | | | Loans | | | Total | |
Liabilities | | | | | | | | | | | | | | | | | | | | |
Without any established term | | | | | | | — | | | | — | | | | — | | | | — | |
With established term: | | | | | | | | | | | | | | | | | | | | |
- Due | | | (a | ) | | | 159 | | | | — | | | | — | | | | 159 | |
To become due | | | | | | | | | | | | | | | | | | | | |
- Up to one year | | | | | | | 2,890 | | | | 11,093 | | | | 154 | | | | 14,137 | |
- From one to three years | | | | | | | — | | | | 6,650 | | | | 2,814 | | | | 9,464 | |
- From three to five years | | | | | | | — | | | | 3,134 | | | | — | | | | 3,134 | |
- Over five years | | | | | | | — | | | | 8,444 | | | | — | | | | 8,444 | |
| | | | | | | | | | | | | | | | | | | | |
Total amount to become due | | | | | | | 2,890 | | | | 29,321 | | | | 2,968 | | | | 35,179 | |
| | | | | | | | | | | | | | | | | | | | |
Total amount with established term | | | | | | | 3,049 | | | | 29,321 | | | | 2,968 | | | | 35,338 | |
| | | | | | | | | | | | | | | | | | | | |
Total | | | | | | | 3,049 | | | | 29,321 | | | | 2,968 | | | | 35,338 | |
| | | | | | | | | | | | | | | | | | | | |
| | |
| | | | | | 2013 | |
| | | Note | | | Accounts
payable | | | Others
contractual
commitments | | | Loans | | | Total | |
Liabilities | | | | | | | | | | | | | | | | | | | | |
Without any established term | | | | | | | — | | | | — | | | | — | | | | — | |
With established term: | | | | | | | | | | | | | | | | | | | | |
- Due | | | (a | ) | | | 198 | | | | — | | | | — | | | | 198 | |
To become due | | | | | | | | | | | | | | | | | | | | |
- Up to one year | | | | | | | 2,355 | | | | 10,057 | | | | 308 | | | | 12,720 | |
- From one to three years | | | | | | | 7 | | | | 2,478 | | | | 310 | | | | 2,795 | |
- From three to five years | | | | | | | — | | | | 1,099 | | | | 2,000 | | | | 3,099 | |
- Over five years | | | | | | | — | | | | 8,085 | | | | — | | | | 8,085 | |
| | | | | | | | | | | | | | | | | | | | |
Total amount to become due | | | | | | | 2,362 | | | | 21,719 | | | | 2,618 | | | | 26,699 | |
| | | | | | | | | | | | | | | | | | | | |
Total amount with established term | | | | | | | 2,560 | | | | 21,719 | | | | 2,618 | | | | 26,897 | |
| | | | | | | | | | | | | | | | | | | | |
Total | | | | | | | 2,560 | | | | 21,719 | | | | 2,618 | | | | 26,897 | |
| | | | | | | | | | | | | | | | | | | | |
F-29
| | | | | | | | | | | | | | | | | | | | |
| | | | | | 2012 | |
| | | Note | | | Accounts
payable | | | Others
contractual
commitments | | | Loans | | | Total | |
Liabilities | | | | | | | | | | | | | | | | | | | | |
Without any established term | | | | | | | 165 | | | | — | | | | — | | | | 165 | |
With established term: | | | | | | | | | | | | | | | | | | | | |
- Due | | | (a | ) | | | 155 | | | | — | | | | — | | | | 155 | |
To become due | | | | | | | | | | | | | | | | | | | | |
- Up to one year | | | | | | | 1,708 | | | | 3,696 | | | | 1,183 | | | | 6,587 | |
- From one to three years | | | | | | | 7 | | | | 2,108 | | | | 262 | | | | 2,377 | |
- From three to five years | | | | | | | — | | | | 1,409 | | | | 1,599 | | | | 3,008 | |
- Over five years | | | | | | | — | | | | 5,033 | | | | — | | | | 5,033 | |
| | | | | | | | | | | | | | | | | | | | |
Total amount to become due | | | | | | | 1,715 | | | | 12,246 | | | | 3,044 | | | | 17,005 | |
| | | | | | | | | | | | | | | | | | | | |
Total amount with established term | | | | | | | 1,870 | | | | 12,246 | | | | 3,044 | | | | 17,160 | |
| | | | | | | | | | | | | | | | | | | | |
Total | | | | | | | 2,035 | | | | 12,246 | | | | 3,044 | | | | 17,325 | |
| | | | | | | | | | | | | | | | | | | | |
| (a) | Corresponds to less than three months. |
4.1.1.4 Credit risk
The Company has a Credit Policy approved by its Board of Directors that establishes guidelines and criteria for granting loans to customers. The Company constantly performs credit evaluations of the financial ability of its clients to minimize the potential risk of bad debt losses.
Credit risk represents the exposure to possible losses derived from the lack of compliance by commercial or financial counterparties with the obligations assumed with the Company. This risk mainly results from economic and financial factors or from a possible default of counterparty.
Credit risk is associated with trade receivables as well as with cash equivalents and cash in banks and financial institutions.
The Company, in the normal course of business and according to its credit policy, provides credit lines to a large client portfolio, in several industry sectors, including gas station operators, refiners, exporting companies, petrochemical companies, natural gas distribution companies, large electricity users and distribution companies, among others.
The allowance for bad debt recognized by the Company represents its best estimate of probable losses in relation to trade receivables.
As of December 31, 2014 the Company’s trade receivables amounted to 3,005, of which 98% was due within one year and 4% was classified as non-current, and related to CAMMESA (an Argentine company engaged in buying electricity from power generation companies and selling it to distribution companies). Except for CAMMESA (which represents approximately 37% of total trade receivables), the Company does not have a significant credit risk concentration, such exposure being fragmented into a large number of customers and other counterparties. No other customer concentrates a significant percentage of total trade receivables.
Credit risk associated with cash and cash equivalents and other financial investments is limited by the policy to operate only with counterparties (bank institutions) with adequate credit ratings. The Company also has a liquidity policy in place.
4.1.1.5 Capital management
The main purpose of the Company’s capital management is to maintain a good credit rating and safe debt-to-equity ratios in order to sustain the Company’s business and maximize shareholders’ value.
In addition, Petrobras Argentina seeks to maintain a cash generation level by its operating activities to fund its investment plan and fulfill all its financial commitments. In the years ended December 31, 2014, 2013 and 2012, cash provided by operating activities amounted to 4,646, 2,778 and 2,902, respectively.
F-30
The Board of Directors of the companies over which Petrobras exercises significant influence or joint control establishes its own risk management policies.
Debt-to-equity ratio:
The Company’s debt-to-equity ratio as of December 31, 2014, 2013 and 2012 is as follows:
| | | | | | | | | | | | |
| | | 2014 | | | 2013 | | | 2012 | |
Total liabilities | | | 11,817 | | | | 9,167 | | | | 8,276 | |
Equity | | | 12,615 | | | | 11,695 | | | | 10,571 | |
| | | | | | | | | | | | |
Debt-to-equity ratio | | | 0.94 | | | | 0.78 | | | | 0.78 | |
| | | | | | | | | | | | |
4.1.2 Non-Financial risks management
Commodity price risks
Petrobras Argentina’s operations are affected by a number of factors which are beyond the Company’s control, including the changes in the market price of its products, governmental regulations on prices, taxes and other charges, royalties and other factors.
In Argentina, the prices of energy products sector are mainly determined by local regulations. Fluctuations in international prices only partially affect the domestic market.
As of December 31, 2013, 2012 and 2011, Petrobras Argentina did not use derivative financial instruments to mitigate the risks associated with commodity price fluctuations.
F-31
4.2. Financial instruments by category
As of December 31, 2014, 2013 and 2012, the categories of financial instruments were as follows:
| | | | | | | | | | | | |
| | | 2014 | |
| | | Financial assets at fair
value through results | | | Loans and
receivables | | | Total | |
CURRENT ASSETS | | | | | | | | | | | | |
Cash and cash equivalents | | | 1,266 | | | | 1,012 | | | | 2,278 | |
Other investments | | | — | | | | 33 | | | | 33 | |
Trade receivables | | | — | | | | 2,945 | | | | 2,945 | |
Other receivables | | | — | | | | 1,408 | | | | 1,408 | |
| | | | | | | | | | | | |
Total current assets | | | 1,266 | | | | 5,398 | | | | 6,664 | |
| | | | | | | | | | | | |
NON-CURRENT ASSETS | | | | | | | | | | | | |
Trade receivables | | | — | | | | 60 | | | | 60 | |
Other receivables | | | — | | | | 96 | | | | 96 | |
Other investments | | | — | | | | 153 | | | | 153 | |
| | | | | | | | | | | | |
Total non-current assets | | | — | | | | 309 | | | | 309 | |
| | | | | | | | | | | | |
Total assets | | | 1,266 | | | | 5,707 | | | | 6,973 | |
| | | | | | | | | | | | |
CURRENT LIABILITIES | | | | | | | | | | | | |
Accounts payable | | | — | | | | 3,045 | | | | 3,045 | |
Short-term loans | | | — | | | | 92 | | | | 92 | |
| | | | | | | | | | | | |
Total current liabilities | | | — | | | | 3,137 | | | | 3,137 | |
| | | | | | | | | | | | |
NON-CURRENT LIABILITIES | | | | | | | | | | | | |
Accounts payable | | | — | | | | 4 | | | | 4 | |
Long-term loans | | | — | | | | 2,587 | | | | 2,587 | |
| | | | | | | | | | | | |
Total non-current liabilities | | | — | | | | 2,591 | | | | 2,591 | |
| | | | | | | | | | | | |
Total liabilities | | | — | | | | 5,728 | | | | 5,728 | |
| | | | | | | | | | | | |
F-32
| | | | | | | | | | | | |
| | | 2013 | |
| | | Financial assets at fair
value through results | | | Loans and
receivables | | | Total | |
CURRENT ASSETS | | | | | | | | | | | | |
Cash and cash equivalents | | | 846 | | | | 347 | | | | 1,193 | |
Other investments | | | — | | | | 23 | | | | 23 | |
Trade receivables | | | — | | | | 2,519 | | | | 2,519 | |
Other receivables | | | — | | | | 1,187 | | | | 1,187 | |
| | | | | | | | | | | | |
Total current assets | | | 846 | | | | 4,076 | | | | 4,922 | |
| | | | | | | | | | | | |
NON-CURRENT ASSETS | | | | | | | | | | | | |
Trade receivables | | | — | | | | 73 | | | | 73 | |
Other receivables | | | — | | | | 166 | | | | 166 | |
Other investments | | | — | | | | 301 | | | | 301 | |
| | | | | | | | | | | | |
Total non-current assets | | | — | | | | 540 | | | | 540 | |
| | | | | | | | | | | | |
Total assets | | | 846 | | | | 4,616 | | | | 5,462 | |
| | | | | | | | | | | | |
CURRENT LIABILITIES | | | | | | | | | | | | |
Accounts payable | | | — | | | | 2,553 | | | | 2,553 | |
Short-term loans | | | — | | | | 208 | | | | 208 | |
Payroll and social security taxes | | | — | | | | — | | | | — | |
Taxes payable | | | | | | | | | | | | |
Provisions | | | | | | | | | | | — | |
| | | | | | | | | | | | |
Total current liabilities | | | — | | | | 2,761 | | | | 2,761 | |
| | | | | | | | | | | | |
NON-CURRENT LIABILITIES | | | | | | | | | | | | |
Accounts payable | | | — | | | | 7 | | | | 7 | |
Long-term loans | | | — | | | | 2,024 | | | | 2,024 | |
| | | | | | | | | | | | |
Total non-current liabilities | | | — | | | | 2,031 | | | | 2,031 | |
| | | | | | | | | | | | |
Total liabilities | | | — | | | | 4,792 | | | | 4,792 | |
| | | | | | | | | | | | |
| |
| | | 2012 | |
| | | Financial assets at fair
value through results | | | Loans and
receivables | | | Total | |
CURRENT ASSETS | | | | | | | | | | | | |
Cash and cash equivalents | | | 331 | | | | 929 | | | | 1,260 | |
Other investments | | | — | | | | 20 | | | | 20 | |
Trade receivables | | | — | | | | 2,168 | | | | 2,168 | |
Other receivables | | | — | | | | 1,432 | | | | 1,432 | |
| | | | | | | | | | | | |
Total current assets | | | 331 | | | | 4,549 | | | | 4,880 | |
| | | | | | | | | | | | |
NON-CURRENT ASSETS | | | | | | | | | | | | |
Trade receivables | | | — | | | | 86 | | | | 86 | |
Other receivables | | | — | | | | 158 | | | | 158 | |
Other investments | | | — | | | | 279 | | | | 279 | |
| | | | | | | | | | | | |
Total non-current assets | | | — | | | | 523 | | | | 523 | |
| | | | | | | | | | | | |
Total assets | | | 331 | | | | 5,072 | | | | 5,403 | |
| | | | | | | | | | | | |
CURRENT LIABILITIES | | | | | | | | | | | | |
Accounts payable | | | — | | | | 1,863 | | | | 1,863 | |
Short-term loans | | | — | | | | 1,108 | | | | 1,108 | |
| | | | | | | | | | | | |
Total current liabilities | | | — | | | | 2,971 | | | | 2,971 | |
| | | | | | | | | | | | |
NON-CURRENT LIABILITIES | | | | | | | | | | | | |
Accounts payable | | | — | | | | 172 | | | | 172 | |
Long-term loans | | | — | | | | 1,558 | | | | 1,558 | |
| | | | | | | | | | | | |
Total non-current liabilities | | | — | | | | 1,730 | | | | 1,730 | |
| | | | | | | | | | | | |
Total liabilities | | | — | | | | 4,701 | | | | 4,701 | |
| | | | | | | | | | | | |
F-33
4.3. Fair value of financial instruments
The methods and assumptions used to determine the estimated fair value of each class of financial instrument are as follows:
• The carrying amount of cash, cash equivalents, accounts receivable and short-term debt are similar to their fair value because of the short-term maturity of these items.
• The fair value of investments in mutual funds was estimated on the basis of quoted market prices as of the reporting dates for identical assets in active markets and accordingly this fair value estimate was categorized as Level 1.
• The fair value of publicly offered long-term debt obligations was estimated on the basis of quoted market prices for such debt obligations as of the reporting dates while for the rest of the long-term debt obligations, fair value was estimated on the basis of interest rates currently available to the Company for debt obligations with similar maturities.
The estimated fair value of long-term loans as of December 31, 2014, 2013 and 2012, valued at amortized cost, except for financial instruments whose book values above approximate fair values, are as follows:
| | | | | | | | | | | | |
| Long-term loans | | 2014 | | | 2013 | | | 2012 | |
Book value | | | 2,587 | | | | 2,024 | | | | 1,558 | |
Fair value | | | 2,558 | | | | 2,281 | | | | 1,630 | |
4.4. Fair Value by hierarchy levels
Fair value is a market-based measurement based on assumptions that market participants would use in pricing the asset or liability. The Company uses the following three-tier fair value hierarchy which prioritizes the inputs observables used to measure fair value:
| | • | | Level 1: Observable inputs such as quoted prices in active markets; |
| | • | | Level 2: Inputs other than quoted prices in active markets that are observable either directly or indirectly; and |
| | • | | Level 3: Unobservable inputs in which there is little or no market data, which require the reporting entity to develop its own assumptions. |
F-34
If one or more significant inputs were not based on observable market data, related financial instruments are included in Level 3.
| | | | | | | | | | | | | | | | |
| | | 2014 | |
| | | Level 1 | | | Level 2 | | | level 3 | | | Total | |
CURRENT ASSETS | | | | | | | | | | | | | | | | |
Cash and cash equivalents | | | 1,266 | | | | — | | | | — | | | | 1,266 | |
Total current assets | | | 1,266 | | | | — | | | | — | | | | 1,266 | |
| | | | | | | | | | | | | | | | |
Total assets | | | 1,266 | | | | — | | | | — | | | | 1,266 | |
| | | | | | | | | | | | | | | | |
Total liabilities | | | — | | | | — | | | | — | | | | — | |
| | | | | | | | | | | | | | | | |
| |
| | | 2013 | |
| | | Level 1 | | | Level 2 | | | level 3 | | | Total | |
CURRENT ASSETS | | | | | | | | | | | | | | | | |
Cash and cash equivalents | | | 846 | | | | — | | | | — | | | | 846 | |
Total current assets | | | 846 | | | | — | | | | — | | | | 846 | |
| | | | | | | | | | | | | | | | |
Total assets | | | 846 | | | | — | | | | — | | | | 846 | |
| | | | | | | | | | | | | | | | |
Total liabilities | | | — | | | | — | | | | — | | | | — | |
| | | | | | | | | | | | | | | | |
| |
| | | 2012 | |
| | | Level 1 | | | Level 2 | | | level 3 | | | Total | |
CURRENT ASSETS | | | | | | | | | | | | | | | | |
Cash and cash equivalents | | | 331 | | | | — | | | | — | | | | 331 | |
Total current assets | | | 331 | | | | — | | | | — | | | | 331 | |
| | | | | | | | | | | | | | | | |
Total assets | | | 331 | | | | — | | | | — | | | | 331 | |
| | | | | | | | | | | | | | | | |
Total liabilities | | | — | | | | — | | | | — | | | | — | |
| | | | | | | | | | | | | | | | |
5. Information by segments
The Company prepares this information based on business segment criteria and also prepares relevant information by geographical area.
5.1. Business segments:
The business segments were defined according to the regular way in which management analyzes information in decision making applying IFRS’s accounting policies. Transactions between business segments are conducted during the ordinary course of business at market terms and prices. The terms and conditions of these transactions are comparable to those offered by or obtained from non-related parties.
F-35
Below is detailed information on each business segment identified by the Company’s Management:
| | | | | | | | | | | | | | | | | | | | | | | | |
| | | 2014 | |
| | | Oil and Gas | | | | | | | | | | | | | | | | |
| | | Exploration | | | Refining | | | | | | Gas | | | Corporate | | | | |
| | | and | | | and | | | | | | and | | | Other and | | | | |
| | | Production | | | Distribution | | | Petrochemicals | | | Energy | | | Eliminations | | | Total | |
Current assets | | | 3,324 | | | | 2,100 | | | | 1,177 | | | | 1,724 | | | | 558 | | | | 8,883 | |
Investment in companies under joint ventures | | | — | | | | — | | | | — | | | | 491 | | | | — | | | | 491 | |
Investments in associates | | | 2,733 | | | | 246 | | | | — | | | | — | | | | — | | | | 2,979 | |
Other Investments | | | 106 | | | | — | | | | — | | | | 51 | | | | (4 | ) | | | 153 | |
Property, plant and equipment | | | 8,985 | | | | 1,264 | | | | 496 | | | | 737 | | | | 107 | | | | 11,589 | |
Non-current other assets | | | 140 | | | | 50 | | | | 59 | | | | 72 | | | | 16 | | | | 337 | |
| | | | | | | | | | | | | | | | | | | | | | | | |
Total assets | | | 15,288 | | | | 3,660 | | | | 1,732 | | | | 3,075 | | | | 677 | | | | 24,432 | |
| | | | | | | | | | | | | | | | | | | | | | | | |
Total liabilities | | | 6,072 | | | | 2,443 | | | | 514 | | | | 647 | | | | 2,141 | | | | 11,817 | |
| | | | | | | | | | | | | | | | | | | | | | | | |
| | | | | | | | | | | | | | | | | | | | | | | | |
| | | 2013 | |
| | | Oil and Gas | | | | | | | | | | | | | | | | |
| | | Exploration | | | Refining | | | | | | Gas | | | Corporate | | | | |
| | | and | | | and | | | | | | and | | | Other and | | | | |
| | | Production | | | Distribution | | | Petrochemicals | | | Energy | | | Eliminations | | | Total | |
Current assets | | | 2,468 | | | | 1,784 | | | | 991 | | | | 1,382 | | | | (29 | ) | | | 6,596 | |
Investment in companies under joint ventures | | | — | | | | — | | | | — | | | | 497 | | | | — | | | | 497 | |
Investments in associates | | | 3,376 | | | | 192 | | | | — | | | | — | | | | — | | | | 3,568 | |
Other Investments | | | 109 | | | | — | | | | — | | | | 64 | | | | 128 | | | | 301 | |
Property, plant and equipment | | | 7,105 | | | | 1,213 | | | | 458 | | | | 641 | | | | 107 | | | | 9,524 | |
Non-current other assets | | | 92 | | | | 51 | | | | 41 | | | | 159 | | | | 33 | | | | 376 | |
| | | | | | | | | | | | | | | | | | | | | | | | |
Total assets | | | 13,150 | | | | 3,240 | | | | 1,490 | | | | 2,743 | | | | 239 | | | | 20,862 | |
| | | | | | | | | | | | | | | | | | | | | | | | |
Total liabilities | | | 4,889 | | | | 2,233 | | | | 574 | | | | 603 | | | | 868 | | | | 9,167 | |
| | | | | | | | | | | | | | | | | | | | | | | | |
| | | | | | | | | | | | | | | | | | | | | | | | |
| | | 2012 | |
| | | Oil and Gas | | | | | | | | | | | | | | | | |
| | | Exploration | | | Refining | | | | | | Gas | | | Corporate | | | | |
| | | and | | | and | | | | | | and | | | Other and | | | | |
| | | Production | | | Distribution | | | Petrochemicals | | | Energy | | | Eliminations | | | Total | |
Current assets | | | 1,925 | | | | 1,252 | | | | 786 | | | | 1,251 | | | | 810 | | | | 6,024 | |
Investment in companies under joint ventures | | | — | | | | — | | | | — | | | | 689 | | | | — | | | | 689 | |
Investments in associates | | | 2,847 | | | | 159 | | | | — | | | | — | | | | — | | | | 3,006 | |
Other Investments | | | 99 | | | | — | | | | — | | | | 82 | | | | 98 | | | | 279 | |
Property, plant and equipment | | | 6,067 | | | | 1,196 | | | | 389 | | | | 732 | | | | 96 | | | | 8,480 | |
Non-current other assets | | | 110 | | | | 51 | | | | 42 | | | | 140 | | | | 26 | | | | 369 | |
| | | | | | | | | | | | | | | | | | | | | | | | |
Total assets | | | 11,048 | | | | 2,658 | | | | 1,217 | | | | 2,894 | | | | 1,030 | | | | 18,847 | |
| | | | | | | | | | | | | | | | | | | | | | | | |
Total liabilities | | | 3,867 | | | | 1,563 | | | | 344 | | | | 578 | | | | 1,924 | | | | 8,276 | |
| | | | | | | | | | | | | | | | | | | | | | | | |
F-36
| | | | | | | | | | | | | | | | | | | | | | | | |
| | | 2014 | |
| | | Oil and
Gas
Exploration
and
Production | | | Refining
and
Distribution | | | Petrochemicals | | | Gas
and
Energy | | | Corporate
Other and
Eliminations | | | Total | |
| | | | | | |
Consolidated Statement of Income | | | | | | | | | | | | | | | | | | | | | | | | |
Sales | | | | | | | | | | | | | | | | | | | | | | | | |
To third parties | | | 4,453 | | | | 11,280 | | | | 4,333 | | | | 3,279 | | | | — | | | | 23,345 | |
Inter-segment | | | 6,100 | | | | 196 | | | | 103 | | | | 208 | | | | (9,214 | ) | | | (2,607 | ) |
| | | | | | | | | | | | | | | | | | | | | | | | |
| | | 10,553 | | | | 11,476 | | | | 4,436 | | | | 3,487 | | | | (9,214 | ) | | | 20,738 | |
| | | | | | | | | | | | | | | | | | | | | | | | |
Cost of sales | | | (7,019 | ) | | | (10,168 | ) | | | (3,626 | ) | | | (2,796 | ) | | | 9,119 | | | | (14,490 | ) |
| | | | | | | | | | | | | | | | | | | | | | | | |
Gross profit | | | 3,534 | | | | 1,308 | | | | 810 | | | | 691 | | | | (95 | ) | | | 6,248 | |
| | | | | | | | | | | | | | | | | | | | | | | | |
Administrative and selling expenses | | | (520 | ) | | | (964 | ) | | | (216 | ) | | | (152 | ) | | | (564 | ) | | | (2,416 | ) |
Exploration expenses | | | (70 | ) | | | — | | | | — | | | | — | | | | — | | | | (70 | ) |
Other operating income (expenses), net | | | (379 | ) | | | (29 | ) | | | (89 | ) | | | 20 | | | | (302 | ) | | | (779 | ) |
Share of net loss of equity accounted investments | | | (1,830 | ) | | | 97 | | | | — | | | | (2 | ) | | | — | | | | (1,735 | ) |
| | | | | | | | | | | | | | | | | | | | | | | | |
Operating income (loss) | | | 735 | | | | 412 | | | | 505 | | | | 557 | | | | (961 | ) | | | 1,248 | |
| | | | | | | | | | | | | | | | | | | | | | | | |
Interest income | | | (27 | ) | | | 34 | | | | 87 | | | | 99 | | | | 635 | | | | 828 | |
Interest expense | | | (251 | ) | | | (161 | ) | | | (63 | ) | | | (19 | ) | | | (262 | ) | | | (756 | ) |
Income tax | | | (325 | ) | | | (39 | ) | | | — | | | | (2 | ) | | | (376 | ) | | | (742 | ) |
| | | | | | | | | | | | | | | | | | | | | | | | |
Net income (loss) | | | 132 | | | | 246 | | | | 529 | | | | 635 | | | | (964 | ) | | | 578 | |
| | | | | | | | | | | | | | | | | | | | | | | | |
| | | | | | | | | | | | | | | | | | | | | | | | |
| | | 2013 | |
| | | Oil and
Gas
Exploration
and
Production | | | Refining
and
Distribution | | | Petrochemicals | | | Gas
and
Energy | | | Corporate
Other and
Eliminations | | | Total | |
| | | | | | |
Consolidated Statement of Income | | | | | | | | | | | | | | | | | | | | | | | | |
Sales | | | | | | | | | | | | | | | | | | | | | | | | |
To third parties | | | 1,814 | | | | 7,845 | | | | 3,177 | | | | 2,504 | | | | — | | | | 15,340 | |
Inter-segment | | | 6,024 | | | | 301 | | | | 171 | | | | 200 | | | | (6,696 | ) | | | — | |
| | | | | | | | | | | | | | | | | | | | | | | | |
| | | 7,838 | | | | 8,146 | | | | 3,348 | | | | 2,704 | | | | (6,696 | ) | | | 15,340 | |
| | | | | | | | | | | | | | | | | | | | | | | | |
Cost of sales | | | (5,501 | ) | | | (7,352 | ) | | | (2,827 | ) | | | (2,218 | ) | | | 6,638 | | | | (11,260 | ) |
| | | | | | | | | | | | | | | | | | | | | | | | |
Gross profit | | | 2,337 | | | | 794 | | | | 521 | | | | 486 | | | | (58 | ) | | �� | 4,080 | |
| | | | | | | | | | | | | | | | | | | | | | | | |
Administrative and selling expenses | | | (350 | ) | | | (728 | ) | | | (155 | ) | | | (98 | ) | | | (466 | ) | | | (1,797 | ) |
Exploration expenses | | | (82 | ) | | | — | | | | — | | | | — | | | | — | | | | (82 | ) |
Other operating (expenses) income, net | | | (227 | ) | | | 106 | | | | (60 | ) | | | (3 | ) | | | (387 | ) | | | (571 | ) |
Share of net loss of equity accounted investments | | | (336 | ) | | | 44 | | | | — | | | | 13 | | | | — | | | | (279 | ) |
| | | | | | | | | | | | | | | | | | | | | | | | |
Operating income (loss) | | | 1,342 | | | | 216 | | | | 306 | | | | 398 | | | | (911 | ) | | | 1,351 | |
| | | | | | | | | | | | | | | | | | | | | | | | |
Interest income | | | (29 | ) | | | 30 | | | | 41 | | | | 58 | | | | 600 | | | | 700 | |
Interest expense | | | (200 | ) | | | (140 | ) | | | (52 | ) | | | (23 | ) | | | (232 | ) | | | (647 | ) |
Income tax | | | (270 | ) | | | (17 | ) | | | — | | | | — | | | | (265 | ) | | | (552 | ) |
| | | | | | | | | | | | | | | | | | | | | | | | |
Net income (loss) | | | 843 | | | | 89 | | | | 295 | | | | 433 | | | | (808 | ) | | | 852 | |
| | | | | | | | | | | | | | | | | | | | | | | | |
F-37
| | | | | | | | | | | | | | | | | | | | | | | | |
| | | 2012 | |
| | | Oil and
Gas
Exploration
and
Production | | | Refining
and
Distribution | | | Petrochemicals | | | Gas
and
Energy | | | Corporate
Other and
Eliminations | | | Total | |
| | | | | | |
Consolidated Statement of Income | | | | | | | | | | | | | | | | | | | | | | | | |
Sales | | | | | | | | | | | | | | | | | | | | | | | | |
To third parties | | | 1,042 | | | | 6,654 | | | | 2,713 | | | | 2,356 | | | | — | | | | 12,765 | |
Inter-segment | | | 5,071 | | | | 303 | | | | 194 | | | | 166 | | | | (5,734 | ) | | | — | |
| | | | | | | | | | | | | | | | | | | | | | | | |
| | | 6,113 | | | | 6,957 | | | | 2,907 | | | | 2,522 | | | | (5,734 | ) | | | 12,765 | |
Cost of sales | | | (4,246 | ) | | | (6,384 | ) | | | (2,683 | ) | | | (2,089 | ) | | | 5,783 | | | | (9,619 | ) |
| | | | | | | | | | | | | | | | | | | | | | | | |
Gross profit | | | 1,867 | | | | 573 | | | | 224 | | | | 433 | | | | 49 | | | | 3,146 | |
| | | | | | | | | | | | | | | | | | | | | | | | |
Administrative and selling expenses | | | (263 | ) | | | (585 | ) | | | (110 | ) | | | (76 | ) | | | (396 | ) | | | (1,430 | ) |
Exploration expenses | | | (212 | ) | | | — | | | | — | | | | — | | | | — | | | | (212 | ) |
Other operating (expenses) income, net | | | (194 | ) | | | 13 | | | | 38 | | | | 224 | | | | (202 | ) | | | (121 | ) |
Share of net loss of equity accounted investments | | | (126 | ) | | | 11 | | | | — | | | | (33 | ) | | | — | | | | (148 | ) |
| | | | | | | | | | | | | | | | | | | | | | | | |
Operating income (loss) | | | 1,072 | | | | 12 | | | | 152 | | | | 548 | | | | (549 | ) | | | 1,235 | |
| | | | | | | | | | | | | | | | | | | | | | | | |
Interest income | | | 25 | | | | 28 | | | | 20 | | | | 58 | | | | 311 | | | | 442 | |
Interest expense | | | (228 | ) | | | (74 | ) | | | (31 | ) | | | (11 | ) | | | (168 | ) | | | (512 | ) |
Income tax | | | (120 | ) | | | (19 | ) | | | — | | | | (3 | ) | | | (350 | ) | | | (492 | ) |
| | | | | | | | | | | | | | | | | | | | | | | | |
Net income (loss) | | | 749 | | | | (53 | ) | | | 141 | | | | 592 | | | | (756 | ) | | | 673 | |
| | | | | | | | | | | | | | | | | | | | | | | | |
Other relevant information
| | | | | | | | | | | | | | | | | | | | | | | | |
| | | 2014 | |
| | | Oil and
Gas
Exploration
and
Production | | | Refining
and
Distribution | | | Petrochemicals | | | Gas
and
Energy | | | Corporate
Other and
Eliminations | | | Total | |
Additions of property, plant and equipment | | | 4,189 | | | | 171 | | | | 78 | | | | 195 | | | | 22 | | | | 4,655 | |
| | | | | | | | | | | | | | | | | | | | | | | | |
Depreciation of property, plant and equipment uncluded in: | | | | | | | | | | | | | | | | | | | | | | | | |
Cost of sales | | | 2,367 | | | | 53 | | | | 40 | | | | 98 | | | | — | | | | 2,558 | |
Administrative and selling expenses | | | 30 | | | | 23 | | | | — | | | | — | | | | 21 | | | | 74 | |
| | | | | | | | | | | | | | | | | | | | | | | | |
Total | | | 2,397 | | | | 76 | | | | 40 | | | | 98 | | | | 21 | | | | 2,632 | |
| | | | | | | | | | | | | | | | | | | | | | | | |
| | | | | | | | | | | | | | | | | | | | | | | | |
| | | 2013 | |
| | | Oil and
Gas
Exploration
and
Production | | | Refining
and
Distribution | | | Petrochemicals | | | Gas
and
Energy | | | Corporate
Other and
Eliminations | | | Total | |
Additions of property, plant and equipment | | | 2,437 | | | | 164 | | | | 102 | | | | 9 | | | | 29 | | | | 2,741 | |
| | | | | | | | | | | | | | | | | | | | | | | | |
Depreciation of property, plant and equipment uncluded in: | | | | | | | | | | | | | | | | | | | | | | | | |
Cost of sales | | | 1,943 | | | | 60 | | | | 32 | | | | 96 | | | | — | | | | 2,131 | |
Administrative and selling expenses | | | 19 | | | | 26 | | | | — | | | | — | | | | 18 | | | | 63 | |
| | | | | | | | | | | | | | | | | | | | | | | | |
Total | | | 1,962 | | | | 86 | | | | 32 | | | | 96 | | | | 18 | | | | 2,194 | |
| | | | | | | | | | | | | | | | | | | | | | | | |
F-38
| | | | | | | | | | | | | | | | | | | | | | | | |
| | | 2012 | |
| | | Oil and Gas
Exploration
and
Production | | | Refining
and
Distribution | | | Petrochemicals | | | Gas
and
Energy | | | Corporate
Other and
Eliminations | | | Total | |
Additions of property, plant and equipment | | | 1,696 | | | | 207 | | | | 65 | | | | 13 | | | | 13 | | | | 1,994 | |
| | | | | | | | | | | | | | | | | | | | | | | | |
Depreciation of property, plant and equipment uncluded in: | | | | | | | | | | | | | | | | | | | | | | | | |
Cost of sales | | | 1,494 | | | | 60 | | | | 36 | | | | 94 | | | | — | | | | 1,684 | |
Administrative and selling expenses | | | 14 | | | | 25 | | | | — | | | | — | | | | 15 | | | | 54 | |
| | | | | | | | | | | | | | | | | | | | | | | | |
Total | | | 1,508 | | | | 85 | | | | 36 | | | | 94 | | | | 15 | | | | 1,738 | |
| | | | | | | | | | | | | | | | | | | | | | | | |
| | | | | | | | | | | | | | |
Products | | Business Segment | | 2014 | | | 2013 | | | 2012 | |
Crude oil | | Oil and Gas Exploration and Production / Refining and Distribution | | | 9,163 | | | | 7,146 | | | | 5,944 | |
Gas Oil | | Refining and Distribution | | | 4,910 | | | | 3,229 | | | | 2,579 | |
Gasoline | | Refining and Distribution | | | 3,101 | | | | 2,260 | | | | 1,699 | |
Electricity | | Gas and Energy | | | 1,412 | | | | 1,366 | | | | 1,598 | |
Gas | | Oil and Gas Exploration and Production | | | 4,555 | | | | 2,730 | | | | 2,117 | |
Styrene | | Petrochemicals | | | 974 | | | | 810 | | | | 627 | |
Polystyrene | | Petrochemicals | | | 1,112 | | | | 749 | | | | 607 | |
Others | | - | | | (4,488 | ) | | | (2,950 | ) | | | (2,406 | ) |
| | | | | | | | | | | | | | |
| | | | | 20,738 | | | | 15,340 | | | | 12,765 | |
| | | | | | | | | | | | | | |
F-39
5.2. Relevant information by geographical area
Below is information on assets, sales, operating income and equity in earnings of affiliates aggregated by geographical area:
| | | | | | | | | | | | | | | | | | | | | | | | |
| | | 2014 | |
| | | Argentina | | | Venezuela | | | Bolivia | | | Ecuador | | | Other and
eliminations | | | Total | |
Current assets | | | 8,005 | | | | 108 | | | | 168 | | | | 593 | | | | 9 | | | | 8,883 | |
Investment in joint ventures | | | 491 | | | | — | | | | — | | | | — | | | | — | | | | 491 | |
Investments in associates | | | 312 | | | | 2,667 | | | | — | | | | — | | | | — | | | | 2,979 | |
Other receivables | | | 67 | | | | 86 | | | | — | | | | — | | | | — | | | | 153 | |
Property, plant and equipment | | | 11,262 | | | | — | | | | 325 | | | | 2 | | | | — | | | | 11,589 | |
Non-current other assets | | | 289 | | | | — | | | | 4 | | | | 44 | | | | — | | | | 337 | |
| | | | | | | | | | | | | | | | | | | | | | | | |
Total assets | | | 20,426 | | | | 2,861 | | | | 497 | | | | 639 | | | | 9 | | | | 24,432 | |
| | | | | | | | | | | | | | | | | | | | | | | | |
| | | | | | | | | | | | | | | | | | | | | | | | |
| | | 2013 | |
| | | Argentina | | | Venezuela | | | Bolivia | | | Ecuador | | | Other and
eliminations | | | Total | |
Current assets | | | 5,931 | | | | 39 | | | | 151 | | | | 465 | | | | 10 | | | | 6,596 | |
Investment in joint ventures | | | 497 | | | | — | | | | — | | | | — | | | | — | | | | 497 | |
Investments in associates | | | 237 | | | | 3,078 | | | | — | | | | 253 | | | | — | | | | 3,568 | |
Other receivables | | | 80 | | | | 93 | | | | — | | | | 128 | | | | — | | | | 301 | |
Property, plant and equipment | | | 9,020 | | | | — | | | | 501 | | | | 3 | | | | — | | | | 9,524 | |
Non-current other assets | | | 340 | | | | — | | | | 3 | | | | 31 | | | | 2 | | | | 376 | |
| | | | | | | | | | | | | | | | | | | | | | | | |
Total assets | | | 16,105 | | | | 3,210 | | | | 655 | | | | 880 | | | | 12 | | | | 20,862 | |
| | | | | | | | | | | | | | | | | | | | | | | | |
| | | | | | | | | | | | | | | | | | | | | | | | |
| | | 2012 | |
| | | Argentina | | | Venezuela | | | Bolivia | | | Ecuador | | | Other and
eliminations | | | Total | |
Current assets | | | 5,537 | | | | 46 | | | | 92 | | | | 336 | | | | 13 | | | | 6,024 | |
Investment in joint ventures | | | 689 | | | | — | | | | — | | | | — | | | | — | | | | 689 | |
Investments in associates | | | 203 | | | | 2,634 | | | | — | | | | 169 | | | | — | | | | 3,006 | |
Other receivables | | | 95 | | | | 86 | | | | — | | | | 98 | | | | — | | | | 279 | |
Property, plant and equipment | | | 8,244 | | | | — | | | | 233 | | | | 2 | | | | 1 | | | | 8,480 | |
Non-current other assets | | | 347 | | | | — | | | | 2 | | | | 17 | | | | 3 | | | | 369 | |
| | | | | | | | | | | | | | | | | | | | | | | | |
Total assets | | | 15,115 | | | | 2,766 | | | | 327 | | | | 622 | | | | 17 | | | | 18,847 | |
| | | | | | | | | | | | | | | | | | | | | | | | |
| | | | | | | | | | | | | | | | | | | | | | | | |
| | | 2014 | |
| | | Argentina | | | Venezuela | | | Bolivia | | | Ecuador | | | Other and
eliminations | | | Total | |
Sales (a) | | | 20,546 | | | | — | | | | 192 | | | | — | | | | — | | | | 20,738 | |
Operating income (loss) | | | 3,223 | | | | (1,425 | ) | | | (58 | ) | | | (487 | ) | | | (5 | ) | | | 1,248 | |
| |
| | | 2013 | |
| | | Argentina | | | Venezuela | | | Bolivia | | | Ecuador | | | Other and
eliminations | | | Total | |
Sales (a) | | | 15,151 | | | | — | | | | 152 | | | | — | | | | 37 | | | | 15,340 | |
Operating income (loss) | | | 1,661 | | | | (376 | ) | | | 60 | | | | 5 | | | | 1 | | | | 1,351 | |
| |
| | | 2012 | |
| | | Argentina | | | Venezuela | | | Bolivia | | | Ecuador | | | Other and
eliminations | | | Total | |
Sales (a) | | | 12,597 | | | | — | | | | 129 | | | | — | | | | 39 | | | | 12,765 | |
Operating income (loss) | | | 1,431 | | | | (158 | ) | | | 86 | | | | (104 | ) | | | (20 | ) | | | 1,235 | |
| (a) | Entirely related to sales to third parties. |
F-40
6. Cost of sales
The Company’s cost of sales and the relevant expenses charged to cost of sales are broken down as follows:
| | | | | | | | | | | | | | | | |
| | | Notes | | | 2014 | | | 2013 | | | 2012 | |
Inventories at the beginning of the year | | | | | | | 1,368 | | | | 1,068 | | | | 1,009 | |
Purchases, consumptions and other | | | | | | | 6,681 | | | | 4,762 | | | | 4,358 | |
Expenses attributable to cost of sales | | | 6.1 | | | | 8,459 | | | | 6,798 | | | | 5,320 | |
| | | | | | | | | | | | | | | | |
| | | | | | | 16,508 | | | | 12,628 | | | | 10,687 | |
Inventories at the end of the year | | | | | | | (2,018 | ) | | | (1,368 | ) | | | (1,068 | ) |
| | | | | | | | | | | | | | | | |
Cost of sales | | | | | | | 14,490 | | | | 11,260 | | | | 9,619 | |
| | | | | | | | | | | | | | | | |
6.1. Expenses attributable to cost of sales
| | | | | | | | | | | | |
| | | 2014 | | | 2013 | | | 2012 | |
Salaries and wages | | | 755 | | | | 604 | | | | 485 | |
Other benefits to personnel | | | 165 | | | | 132 | | | | 87 | |
Taxes, charges and contributions | | | 39 | | | | 25 | | | | 16 | |
Fees and professional advisory | | | 4 | | | | 4 | | | | 4 | |
Depreciation of property, plant and equipment | | | 2,558 | | | | 2,131 | | | | 1,684 | |
Oil and gas royalties | | | 1,560 | | | | 1,128 | | | | 823 | |
Spare parts and repairs | | | 619 | | | | 580 | | | | 485 | |
Transportation and freights | | | 228 | | | | 179 | | | | 184 | |
Procurement of works and services | | | 2,325 | | | | 1,812 | | | | 1,397 | |
Fuel, gas, energy and other | | | 130 | | | | 119 | | | | 83 | |
Other operating costs and consumptions | | | 193 | | | | 150 | | | | 115 | |
Expense reimbursements | | | (117 | ) | | | (66 | ) | | | (43 | ) |
| | | | | | | | | | | | |
| | | 8,459 | | | | 6,798 | | | | 5,320 | |
| | | | | | | | | | | | |
7. Administrative and selling expenses
| | | | | | | | | | | | |
| | | 2014 | | | 2013 | | | 2012 | |
Salaries and wages | | | 779 | | | | 665 | | | | 584 | |
Other benefits to personnel | | | 183 | | | | 160 | | | | 112 | |
Taxes, charges and contributions | | | 477 | | | | 340 | | | | 244 | |
Fees and professional advisory | | | 142 | | | | 100 | | | | 82 | |
Depreciation of property, plant and equipment | | | 74 | | | | 63 | | | | 54 | |
Spare parts and repairs | | | 108 | | | | 60 | | | | 51 | |
Transportation and freights | | | 441 | | | | 343 | | | | 254 | |
Procurement of works and services | | | 213 | | | | 133 | | | | 121 | |
Fuel, gas, energy and other | | | 13 | | | | 10 | | | | 8 | |
Other operating costs and consumptions | | | 104 | | | | 57 | | | | 62 | |
Expense reimbursements | | | (118 | ) | | | (134 | ) | | | (142 | ) |
| | | | | | | | | | | | |
| | | 2,416 | | | | 1,797 | | | | 1,430 | |
| | | | | | | | | | | | |
8. Exploration expenses
| | | | | | | | | | | | |
| | | 2014 | | | 2013 | | | 2012 | |
Geological and geophysical expenses | | | 59 | | | | 55 | | | | 44 | |
Abandoned and non-productive well write-downs | | | 11 | | | | 27 | | | | 168 | |
| | | | | | | | | | | | |
| | | 70 | | | | 82 | | | | 212 | |
| | | | | | | | | | | | |
F-41
9. Other operating expenses, net
| | | | | | | | | | | | | | | | |
| | | Notes | | | 2014 | | | 2013 | | | 2012 | |
Advisory services rendered to other companies | | | | | | | 42 | | | | 39 | | | | 37 | |
Taxes on bank transactions | | | | | | | (262 | ) | | | (197 | ) | | | (147 | ) |
Contingencies | | | | | | | (109 | ) | | | (103 | ) | | | (30 | ) |
Enviromental costs | | | | | | | (193 | ) | | | (27 | ) | | | — | |
Result from sale of Puesto Hernández | | | 29.6 | | | | 181 | | | | — | | | | — | |
Result from sale of Distrilec S.A. | | | 17.1.1 | | | | — | | | | (34 | ) | | | — | |
Impairment Cola y Caranda | | | 19 | | | | (94 | ) | | | — | | | | — | |
Impairment Santa Cruz II | | | 19 | | | | — | | | | (11 | ) | | | — | |
Disposal of property, plant and equipment | | | | | | | (10 | ) | | | (30 | ) | | | 23 | |
Writedown of contractual credit in Ecuador | | | 30 | | | | — | | | | — | | | | (61 | ) |
CIESA debt restructuring | | | 17.1.4 | | | | — | | | | — | | | | 221 | |
Other | | | | | | | (334 | ) | | | (208 | ) | | | (164 | ) |
| | | | | | | | | | | | | | | | |
| | | | | | | (779 | ) | | | (571 | ) | | | (121 | ) |
| | | | | | | | | | | | | | | | |
10. Financial results
| | | | | | | | | | | | | | | | |
| | | Note | | | 2014 | | | 2013 | | | 2012 | |
Financial income | | | | | | | | | | | | | | | | |
Interest and other | | | | | | | 274 | | | | 268 | | | | 148 | |
Foreign exchange gains | | | 4.1.1.1 | | | | 554 | | | | 432 | | | | 294 | |
| | | | | | | | | | | | | | | | |
| | | | | | | 828 | | | | 700 | | | | 442 | |
| | | | | | | | | | | | | | | | |
Financial costs | | | | | | | | | | | | | | | | |
Interest and other | | | | | | | (509 | ) | | | (386 | ) | | | (356 | ) |
Foreign exchange losses | | | 4.1.1.1 | | | | (247 | ) | | | (261 | ) | | | (156 | ) |
| | | | | | | | | | | | | | | | |
| | | | | | | (756 | ) | | | (647 | ) | | | (512 | ) |
| | | | | | | | | | | | | | | | |
11. Current and deferred income tax
The Company’s tax expense and deferred tax balances are as follows:
| | | | | | | | | | | | | | | | | | | | | | | | | | | | | | | | | | | | |
| | | 2014 | | | 2013 | | | 2012 | |
| | | Recorded in | | | Recorded in | | | Recorded in | |
| | | Statement
of
income | | | OCI
(a) | | | Total | | | Statement
of
income | | | OCI
(a) | | | Total | | | Statement
of
income | | | OCI
(a) | | | Total | |
Income tax for the year | | | | | | | | | | | | | | | | | | | | | | | | | | | | | | | | | | | | |
Current | | | (1,246 | ) | | | 334 | | | | (912 | ) | | | (703 | ) | | | 330 | | | | (373 | ) | | | (579 | ) | | | 121 | | | | (458 | ) |
Deferred | | | 504 | | | | (408 | ) | | | 96 | | | | 151 | | | | (345 | ) | | | (194 | ) | | | 87 | | | | (124 | ) | | | (37 | ) |
| | | | | | | | | | | | | | | | | | | | | | | | | | | | | | | | | | | | |
Total income tax | | | (742 | ) | | | (74 | ) | | | (816 | ) | | | (552 | ) | | | (15 | ) | | | (567 | ) | | | (492 | ) | | | (3 | ) | | | (495 | ) |
| | | | | | | | | | | | | | | | | | | | | | | | | | | | | | | | | | | | |
| (a) | It relates to the tax effect of exchange differences resulting from: (i) revaluation of net investments in foreign operations (with effect on deferred tax), and (ii) revaluation of indebtedness denominated in foreign currency designated as hedge for that investment (with effect on current tax). |
F-42
| | | | | | | | | | | | | | | | | | | | | | | | | | | | | | | | | | | | |
| Deferred tax assets | | Carryforward
tax losses | | | Reserves
and
provisions | | | Pension
plan
obligations | | | Equity
interest
in
affiliates | | | Property,
plant and
equipment | | | Other
Credits | | | Other | | | Valuation
allowance | | | Total
assets | |
12/31/2011 | | | 11 | | | | 156 | | | | 62 | | | | 28 | | | | — | | | | 132 | | | | 67 | | | | (149 | ) | | | 307 | |
| | | | | | | | | | | | | | | | | | | | | | | | | | | | | | | | | | | | |
Recorder in | | | | | | | | | | | | | | | | | | | | | | | | | | | | | | | | | | | | |
Statement of income | | | (9 | ) | | | (54 | ) | | | 21 | | | | (25 | ) | | | (2 | ) | | | 19 | | | | 23 | | | | (13 | ) | | | (40 | ) |
Equity | | | — | | | | — | | | | 3 | | | | — | | | | — | | | | — | | | | 2 | | | | — | | | | 5 | |
Acquisition of PELSA | | | — | | | | 3 | | | | 10 | | | | — | | | | 5 | | | | — | | | | — | | | | — | | | | 18 | |
| | | | | | | | | | | | | | | | | | | | | | | | | | | | | | | | | | | | |
12/31/2012 | | | 2 | | | | 105 | | | | 96 | | | | 3 | | | | 3 | | | | 151 | | | | 92 | | | | (162 | ) | | | 290 | |
| | | | | | | | | | | | | | | | | | | | | | | | | | | | | | | | | | | | |
Recorder in | | | | | | | | | | | | | | | | | | | | | | | | | | | | | | | | | | | | |
Statement of income | | | 121 | | | | (56 | ) | | | 32 | | | | 6 | | | | 3 | | | | 49 | | | | (25 | ) | | | (174 | ) | | | (44 | ) |
Equity | | | — | | | | — | | | | (5 | ) | | | — | | | | — | | | | — | | | | — | | | | — | | | | (5 | ) |
| | | | | | | | | | | | | | | | | | | | | | | | | | | | | | | | | | | | |
12/31/2013 | | | 123 | | | | 49 | | | | 123 | | | | 9 | | | | 6 | | | | 200 | | | | 67 | | | | (336 | ) | | | 241 | |
| | | | | | | | | | | | | | | | | | | | | | | | | | | | | | | | | | | | |
Recorder in | | | | | | | | | | | | | | | | | | | | | | | | | | | | | | | | | | | | |
Statement of income | | | (2 | ) | | | (14 | ) | | | 49 | | | | (4 | ) | | | 26 | | | | 63 | | | | 83 | | | | (61 | )�� | | | 140 | |
Equity | | | — | | | | — | | | | (1 | ) | | | — | | | | — | | | | — | | | | — | | | | — | | | | (1 | ) |
| | | | | | | | | | | | | | | | | | | | | | | | | | | | | | | | | | | | |
12/31/2014 | | | 121 | | | | 35 | | | | 171 | | | | 5 | | | | 32 | | | | 263 | | | | 150 | | | | (397 | ) | | | 380 | |
| | | | | | | | | | | | | | | | | | | | | | | | | | | | | | | | | | | | |
| | | | | | | | | | | | | | | | | | | | |
| Deferred tax liabilities | | Property,
plant and
equipment
and other
assets | | | Prepaid
expenses | | | Equity
interest
in
affiliates | | | Other | | | Total
liabilities | |
12/31/2011 | | | (227 | ) | | | (4 | ) | | | (278 | ) | | | (45 | ) | | | (554 | ) |
| | | | | | | | | | | | | | | | | | | | |
Recorder in | | | | | | | | | | | | | | | | | | | | |
Statement of income | | | 119 | | | | 2 | | | | 36 | | | | (30 | ) | | | 127 | |
Equity | | | — | | | | — | | | | (121 | ) | | | (8 | ) | | | (129 | ) |
Acquisition of PELSA | | | (14 | ) | | | — | | | | — | | | | (74 | ) | | | (88 | ) |
| | | | | | | | | | | | | | | | | | | | |
12/31/2012 | | | (122 | ) | | | (2 | ) | | | (363 | ) | | | (157 | ) | | | (644 | ) |
| | | | | | | | | | | | | | | | | | | | |
Recorder in | | | | | | | | | | | | | | | | | | | | |
Statement of income | | | 151 | | | | 1 | | | | 194 | | | | (151 | ) | | | 195 | |
Equity | | | — | | | | — | | | | (340 | ) | | | — | | | | (340 | ) |
| | | | | | | | | | | | | | | | | | | | |
12/31/2013 | | | 29 | | | | (1 | ) | | | (509 | ) | | | (308 | ) | | | (789 | ) |
| | | | | | | | | | | | | | | | | | | | |
Recorder in | | | | | | | | | | | | | | | | | | | | |
Statement of income | | | (348 | ) | | | — | | | | 532 | | | | 180 | | | | 364 | |
Equity | | | — | | | | — | | | | (407 | ) | | | — | | | | (407 | ) |
| | | | | | | | | | | | | | | | | | | | |
12/31/2014 | | | (319 | ) | | | (1 | ) | | | (384 | ) | | | (128 | ) | | | (832 | ) |
| | | | | | | | | | | | | | | | | | | | |
| | | | | | | | | | | | |
| | | Deferred
tax
assets | | | Deferred
tax
liabilities | | | Total | |
12/31/2011 | | | 307 | | | | (554 | ) | | | (247 | ) |
| | | | | | | | | | | | |
Recorder in | | | | | | | | | | | | |
Statement of income | | | (40 | ) | | | 127 | | | | 87 | |
Equity | | | 5 | | | | (129 | ) | | | (124 | ) |
Acquisition of PELSA | | | 18 | | | | (88 | ) | | | (70 | ) |
| | | | | | | | | | | | |
12/31/2012 | | | 290 | | | | (644 | ) | | | (354 | ) |
| | | | | | | | | | | | |
Recorder in | | | | | | | | | | | | |
Statement of income | | | (44 | ) | | | 195 | | | | 151 | |
Equity | | | (5 | ) | | | (340 | ) | | | (345 | ) |
| | | | | | | | | | | | |
12/31/2013 | | | 241 | | | | (789 | ) | | | (548 | ) |
| | | | | | | | | | | | |
Recorder in | | | | | | | | | | | | |
Statement of income | | | 140 | | | | 364 | | | | 504 | |
Equity | | | (1 | ) | | | (407 | ) | | | (408 | ) |
| | | | | | | | | | | | |
12/31/2014 | | | 380 | | | | (832 | ) | | | (452 | )(b) |
| | | | | | | | | | | | |
| (a) | Management evaluates the recoverability of carryforward tax losses and the remaining temporary differences taking into consideration, among other elements, the projected net income, tax planning strategies, timeliness of future taxable income, the date of expiration of the carryforward tax losses, the future reversals of the existing temporary differences and the recent year tax history. All the evidence available, both positive and negative, is duly weighted and considered in the analysis. |
| (b) | 47 shown in “Deferred Tax Assets” and (499) in “Deferred Tax Liabilities.” |
F-43
The reconciliation of the income tax expense in the statements of income and the one that would result from the application of the prevailing income tax rate of the 35% to the income before taxes and the non-controlling interest is as follow:
| | | | | | | | | | | | | | | | |
| | | Note | | | 2014 | | | 2013 | | | 2012 | |
Income before income tax | | | | | | | 1,320 | | | | 1,404 | | | | 1,165 | |
Blended income tax rate | | | | | | | 35 | % | | | 35 | % | | | 35 | % |
| | | | | | | | | | | | | | | | |
Income for the period at statutory tax rate | | | | | | | (462 | ) | | | (491 | ) | | | (408 | ) |
- Items on translation of financial statements | | | | | | | (154 | ) | | | (121 | ) | | | — | |
- Share of net loss of equity accounted investees | | | | | | | (164 | ) | | | 8 | | | | 16 | |
- Sales in equity interest | | | | | | | — | | | | 121 | | | | — | |
- Permanent differences in foreign subsidiaries | | | | | | | 3 | | | | 6 | | | | (1 | ) |
- Cash dividends and other investments items | | | | | | | 16 | | | | 20 | | | | 1 | |
- Others | | | | | | | 13 | | | | 35 | | | | (96 | ) |
| | | | | | | | | | | | | | | | |
Subtotal | | | | | | | (748 | ) | | | (422 | ) | | | (488 | ) |
- Change allowance for active differences | | | (a | ) | | | 6 | | | | (130 | ) | | | (4 | ) |
| | | | | | | | | | | | | | | | |
| | | | | | | (742 | ) | | | (552 | ) | | | (492 | ) |
| | | | | | | | | | | | | | | | |
| (a) | It corresponds mainly to the sale of equity investments. |
Carryforward tax losses may be used through the dates indicated below:
| | | | | | | | | | | | |
| | | 2014 | | | 2013 | | | 2012 | |
2015 | | | 2 | | | | 2 | | | | 2 | |
2017 onwards | | | 119 | | | | 121 | | | | — | |
| | | | | | | | | | | | |
| | | 121 | | | | 123 | | | | 2 | |
| | | | | | | | | | | | |
Income tax assets and liabilities:
| | | | | | | | | | | | |
| | | 2014 | | | 2013 | | | 2012 | |
Included in current other receivables | | | 27 | | | | 226 | | | | 24 | |
Included in taxes payable | | | 485 | | | | 86 | | | | 136 | |
12. Earnings per share
The Company’s Shareholders Meeting held on March 29, 2012 resolved to capitalize retained earnings of 1,009, through the issuance of 1,009,618,410 common shares of a Nominal Value of P$1 and entitled to one vote per share.
Basic and diluted earnings per share attributable to the controlling company’s shareholders are calculated as follows:
| | | | | | | | | | | | |
| | | 2014 | | | 2013 | | | 2012 | |
Numerator: | | | | | | | | | | | | |
Income attributable to shareholders of parent company | | | 458 | | | | 779 | | | | 618 | |
Denominator: | | | | | | | | | | | | |
Weighted average number of ordinary shares | | | 2,019,236,820 | | | | 2,019,236,820 | | | | 2,019,236,820 | |
There have been no transactions involving common shares or potential common shares between the year closing date and the presentation of these financial statements.
F-44
13. Cash and cash equivalents
| | | | | | | | | | | | |
| | | 2014 | | | 2013 | | | 2012 | |
Cash and banks | | | 177 | | | | 116 | | | | 156 | |
Time deposits | | | 835 | | | | 231 | | | | 773 | |
Mutual funds | | | 1,266 | | | | 846 | | | | 331 | |
| | | | | | | | | | | | |
Cash and cash equivalents | | | 2,278 | | | | 1,193 | | | | 1,260 | |
| | | | | | | | | | | | |
Additional information about Cash Flows
The Company uses the indirect method which requires adjustments to net income for the year to calculate cash provided by operations.
The main transactions that did not have an impact on cash and cash equivalent and were excluded from the statements of cash flow as of December 31, 2014, 2013 and 2012 are the following:
| | | | | | | | | | | | |
| | | 2014 | | | 2013 | | | 2012 | |
Acquisition of property, plant and equipment | | | 49 | | | | 216 | | | | 12 | |
Acquisition of property, plant and equipment related to oil and gas areas | | | 670 | | | | — | | | | — | |
14. Trade receivables
| | | | | | | | | | | | | | | | | | | | | | | | | | | | |
| | | | | | 2014 | | | 2013 | | | 2012 | |
| | | Note | | | Current | | | Non-current | | | Current | | | Non-current | | | Current | | | Non-current | |
Receivables | | | | | | | | | | | | | | | | | | | | | | | | | | | | |
Petrochemical | | | | | | | 474 | | | | — | | | | 463 | | | | — | | | | 313 | | | | — | |
Refining and distribution | | | | | | | 616 | | | | 6 | | | | 541 | | | | 6 | | | | 452 | | | | 7 | |
Oil and gas exploration and production | | | | | | | 370 | | | | 92 | | | | 323 | | | | 74 | | | | 294 | | | | 57 | |
Gas and energy | | | | | | | 1,474 | | | | 49 | | | | 1,183 | | | | 62 | | | | 1,058 | | | | 75 | |
Related companies | | | 28 | | | | 67 | | | | — | | | | 43 | | | | — | | | | 92 | | | | — | |
| | | | | | | | | | | | | | | | | | | | | | | | | | | | |
| | | | | | | 3,001 | | | | 147 | | | | 2,553 | | | | 142 | | | | 2,209 | | | | 139 | |
Less: Allowance for doubtful | | | (a | ) | | | (56 | ) | | | (87 | ) | | | (34 | ) | | | (69 | ) | | | (41 | ) | | | (53 | ) |
| | | | | | | | | | | | | | | | | | | | | | | | | | | | |
| | | (b | ) | | | 2,945 | | | | 60 | | | | 2,519 | | | | 73 | | | | 2,168 | | | | 86 | |
| | | | | | | | | | | | | | | | | | | | | | | | | | | | |
| a) | The activity in the years ended December 31, 2014, 2013 and 2012, includes (40), (9) and (16) charged to “Administrative and selling expenses”. |
| b) | As of December 31, 2014, 2013 and 2012 current trade receivables include an average of 8%, 4% and 4%, respectively of non-impaired past due, which do not exceed a period of 3 months. |
F-45
15. Other receivables
| | | | | | | | | | | | | | | | | | | | | | | | | | | | |
| | | | | | 2014 | | | 2013 | | | 2012 | |
| | | Note | | | Current | | | Non-current | | | Current | | | Non-current | | | Current | | | Non-current | |
Joint ventures | | | | | | | 8 | | | | — | | | | 67 | | | | — | | | | 72 | | | | — | |
Related companies | | | 28 | | | | 440 | | | | — | | | | 409 | | | | — | | | | 663 | | | | — | |
Tax credits | | | | | | | 268 | | | | 67 | | | | 364 | | | | 79 | | | | 121 | | | | 80 | |
Contractual credit in Ecuador | | | | | | | 458 | | | | — | | | | 347 | | | | — | | | | 263 | | | | — | |
Expenses reimbursements | | | | | | | 1 | | | | — | | | | 2 | | | | — | | | | 2 | | | | — | |
Prepaid expenses | | | | | | | 166 | | | | 20 | | | | 75 | | | | 13 | | | | 169 | | | | 13 | |
Credit for new projects in the mixed companies in Venezuela | | | | | | | — | | | | 756 | | | | — | | | | 574 | | | | — | | | | 434 | |
Guarantee deposits | | | | | | | 11 | | | | 48 | | | | 7 | | | | 40 | | | | 6 | | | | 40 | |
Allowance for other receivables | | | (a | ) | | | — | | | | (756 | ) | | | — | | | | (574 | ) | | | — | | | | (434 | ) |
Receivables from the sale of companies | | | | | | | — | | | | — | | | | — | | | | — | | | | 29 | | | | — | |
Other | | | | | | | 324 | | | | 28 | | | | 280 | | | | 113 | | | | 228 | | | | 105 | |
| | | | | | | | | | | | | | | | | | | | | | | | | | | | |
| | | (b | ) | | | 1,676 | | | | 163 | | | | 1,551 | | | | 245 | | | | 1,553 | | | | 238 | |
| | | | | | | | | | | | | | | | | | | | | | | | | | | | |
| a) | Activity of (182), (140) y (54) in the years ended December 31, 2014, 2013 and 2012, respectively are shown in line “Other comprehensive income”. As of December 31, 2012 includes 143 related to write-offs. |
| b) | As of December 31, 2014, 2013 and 2012 current receivables include an average of 9%, 4% and 4%, respectively of non-provisioned due, which do not exceed a period of 3 months. |
16. Inventories
| | | | | | | | | | | | | | | | | | | | | | | | |
| | | 2014 | | | 2013 | | | 2012 | |
| | | Current | | | Non-current | | | Current | | | Non-current | | | Current | | | Non-current | |
Crude oil stock | | | 303 | | | | — | | | | 228 | | | | — | | | | 176 | | | | — | |
Raw materials and materials | | | 645 | | | | 67 | | | | 426 | | | | 58 | | | | 297 | | | | 45 | |
Work progress and finished products | | | 1,003 | | | | — | | | | 656 | | | | — | | | | 550 | | | | — | |
| | | | | | | | | | | | | | | | | | | | | | | | |
| | | 1,951 | | | | 67 | | | | 1,310 | | | | 58 | | | | 1,023 | | | | 45 | |
| | | | | | | | | | | | | | | | | | | | | | | | |
17. Investments in related companies
17.1. Investments in joint ventures
| | | | | | | | | | | | | | | | | | | | | | | | |
| | | 2014 | | | 2013 | | | 2012 | |
| | | Description of securities | | | Book value | | | Book value | | | Book value | |
| | | Face value | | | Amount | | | Cost | | | | |
CIESA | | $ | 1 | | | | 159,704,674 | | | | 596 | | | | 491 | | | | 497 | | | | 487 | |
Distrilec | | | — | | | | — | | | | — | | | | — | | | | — | | | | 202 | |
| | | | | | | | | | | | | | | | | | | | | | | | |
| | | | | | | | | | | 596 | | | | 491 | | | | 497 | | | | 689 | |
| | | | | | | | | | | | | | | | | | | | | | | | |
| | | | | | | | | | | | | | | | | | | | | | | | |
| | | Last available financial statement | | | | | | | |
| | | Date | | | Capital stock | | | Net income
for the year | | | Equity | | | Percentage
share | | | Main
business | |
CIESA | | | 12/31/2014 | | | | 639 | | | | (10 | ) | | | 1,251 | | | | 50.00 | | | | Investor | |
F-46
17.1.1. Distrilec
In the first quarter of 2013, the Company sold to Hidroelectrica Piedra del Águila S.A. and La Plata Cogeneración S.A. all of its direct and indirect interests in PEDASA and PFB, for an amount of US$ 35 million, with a loss of 34 shown under “Other operating expenses”, net (Note 9).
As of December 31, 2012, through PEDASA and PFB, the Company held an indirect ownership of 48.50% in Distrilec, parent company of EDESUR.
17.1.2. CIESA
The shareholders of CIESA, the parent company of TGS, may not sell their Class “A” shares representing 51% of TGS’s capital stock, without the prior authorization of the regulatory agency and the approval of the shareholders of CIESA.
17.1.3. Carrying value of the Company’s interests in CIESA and Distrilec
As of December 31, 2014, 2013 and 2012, the carrying value of the direct and indirect holding in CIESA was 491, 497 and 487, respectively.
As of December 31, 2012, the carrying value of the indirect interest in Distrilec amounted to 202, which included 19 and 25 from the allocation of the consideration paid for the indirect interest in Distrilec in excess of fair value of net assets acquired.
The book value of these interests does not exceed their recoverable value.
17.1.4. CIESA indebtedness
Due to the Argentine macroeconomic situation, starting with the enactment of the Public Emergency Law CIESA did not pay at maturity, in April 2002, either the principal and the last interest installment, their notes issued in 1997 for a nominal value of USD 200 million, or the cap and collar of interest rate agreements.
As of April 2004, the shareholders and creditors of financial CIESA held a series of agreements, which, among other actions, certain share in order to provide the necessary flexibility to advance the restructuring was planned transfers CIESA’s financial debt above. Thus, on 1 September 2005 entered into a Restructuring Agreement Financial Debt (Restructuring Agreement), which was subject to approval by the ENARGAS and CNDC, they succeeding from January 2009 a number of legal claims before the Courts of New York.
On May 10, 2011 CIESA entered into a Memorandum of Understanding with Pampa Energía S.A., Pampa Inversiones S.A. e Inversiones Argentina I Ltd. (Pampa Group), which also became the holder of the notes and on May 18, 2011, the parties to the CIESA Restructuring Agreement by which Pampa Group entered the agreement
On October 5, 2011, by note No. 11,362, ENARGAS have expressed no objections to the Settlement Regulatory Restructuring and said that the same may be enforced once the approval is obtained by the CNDC. As of the date of these financial statements, the authorization of the CNDC was not obtained.
On July 13, 2012, CIESA, Grupo Pampa and the Company entered into a settlement agreement whereby all parties involved waived all claims, title and interest under the lawsuit before the New York State Courts and terminated the same. As a result of the agreement, CIESA paid off all the financial debt by means of (i) the transfer to Pampa Group of 4.3% of TGS’s shares; (ii) the payment of approximately US$130 million; (iii) the release of the remaining financial debt, and (iv) execution of a fifth amendment to the Restructuring Agreement. It was agreed that upon obtaining the governmental approval, Grupo Pampa will receive shares representing 40% of CIESA’s capital stock which are held in trust by The Royal Bank of Scotland, Argentine Branch.
As a result of the full settlement of CIESA’s total financial debt, in the third quarter of 2012 the Company recorded a gain of 291 for its shareholding in CIESA, of which 221 and 165 are charged to Other operating expenses, net and Share of net loss of equity accounted investments, respectively, with a charge of 95 in Income tax.
F-47
Pursuant to the Agreement referred to in this note and the resolutions adopted at CIESA’s Board of Directors’ Meeting held on October 23, 2012, on January 2, 2013 CIESA gave notice to the CNV of full payment of Corporate Bonds, and on May 30, 2013 CIESA was withdrawn from the Public Offering and Listing System.
17.1.5. Tariff situation of the public utility companies
17.1.5.1. General framework
The scenario after the enactment of the Public Emergency Law significantly changed the financial equation of the public utility companies, which were affected, among others, by the local currency devaluation, the pesification and the elimination of indexation clauses on rates.
The Public Emergency Law provided for the conversion into Argentine pesos and the elimination of indexation clauses on public service rates, thus fixing them at the exchange rate of ARS 1 = US$ 1. In addition, the Executive Branch was empowered to renegotiate those agreements entered into to provide public services, along the following criteria: (i) rates impact on economic competitiveness and revenue allocation, (ii) service quality and investment plans, to the extent that they were contractually agreed upon, (iii) users interest and access to services, (iv) the safety in the system involved, and (v) companies’ profitability.
On February 12, 2002, the Executive Branch of Government issued Decree No. 293/02 whereby it recommended that the Ministry of the Economy and Production renegotiate the agreements executed with public utility companies. UNIREN was created in July 2003, which took over the work of the Renegotiation Commission and its aim is, among others, to provide assistance in the public works and services renegotiation process, to execute comprehensive or partial agreements, and to submit regulatory projects related to transitory rate adjustments.
In December 2013, the Law No. 26,896 was issued, which extended the public works and services renegotiation term to December 2015.
17.1.5.2. TGS
After UNIREN had submitted to TGS several proposals for the tariff adjustment as provided for in the concession contract that TGS had deemed insufficient, in October 2008 TGS executed a provisional agreement with UNIREN, which provides for a 20 % tariff increase to be retroactively applied as from September 1, 2008 and for the application of the cash from such increase to an investment plan in the gas transportation system provided under the same agreement.
On December 3, 2009, the PEN issued Decree No. 1,918/09 ratifying the provisional agreement. As a result, TGS will invoice its clients the tariff increase once the ENARGAS has published the new tariff schedule and has defined the invoicing method of the retroactive increase. This administrative formality, however, has not been completed and considering the excessive delay, in August 2010, TGS sent a letter to ENARGAS requesting authorization to publish the tariff schedule including the 20% provisional tariff increase and the method for collection of the retroactive increase and the application of an interest rate in accordance with the payment terms to be defined. ENARGAS answered TGS that it had forwarded the background information and the tariff project to the SCyCG, wich is part of the MPFIPyS, in compliance with Resolution No. 2,000/2005 issued by the MPFIPyS.
On September 30, 2010, TGS filed an action for the protection of its constitutional rights (“acción de amparo”) under Section 43 of the National Constitution and Law No.16,986, against ENARGAS and SCyCG to seek implementation of the new tariff schedule. On November 8, 2010, notice was given to TGS of the judgment granting the requested action and thus ordering SCyCG to return to ENARGAS within two days the documents relating to the new tariff schedule applicable to TGS in compliance with Decree No. 1,918/09, and instructing ENARGAS to define the tariff schedule and the method for collection of the retroactive increase within two days following receipt of the referred documents. ENARGAS and the SCyCG appealed.
F-48
In addition, on November 16, 2010, UNIREN proposed TGS to move forward with the renegotiation of the License Agreement within the scope and according to the terms and conditions of the Public Emergency Law, for which purpose suspension of the before mentioned action for the protection of constitutional rights was demanded by UNIREN. On November 18, 2010, TGS decided to authorize the suspension for a term of 20 business days automatically renewable unless TGS’s Board of Directors decided not to renew the same before or at the end of each period in order to move forward with the renegotiation of the License Agreement. On December 28, 2010, TGS sent a letter to ENARGAS and the MPFIPyS asking for the execution of the writing requesting the suspension. As of the date of these financial statements, no favorable answer to the letter has been received.
On April 5, 2011, Panel II of the Federal Court of Appeals in Administrative matters set a 60 business day term for SCyCG to take action as provided under Resolution No. 2,000/2005 and return the record to ENARGAS, and instructed ENARGAS to render its opinion as regards the adequacy of tariffs and the Provisional Tariff Schedule provided thereunder no later than 60 business days after receipt of the abovementioned record from SCyCG, upon verification of compliance with the requirements provided for in the provisional agreement dated October 9, 2008. TGS and ENARGAS filed each one extraordinary appeals which was rejected by the Court of Appeals on May 27, 2011. On June 14, 2011 ENARGAS filed a complaint against refusal to grant appeal before the Federal Supreme Court of Argentina. Meanwhile, on August 25, 2011 the SCyCG returned administrative actions cited ENARGAS realizing that it took the intervention by Resolution No. 2000/2005. On June 11, 2012 the Federal Supreme Court of Justice required the main actions in order to resolve the complaint filed by ENARGAS, having the Company placed the fact of compliance by the SCyCG the lawsuit willing to his respect the Supreme Court’s November 28, 2013 rejected the appeal filed by the ENARGAS against the decision rejecting the Extraordinary Appeal brought against the judgment which confirmed the substance of the judgment delivered by the Judge of First Instance upheld the amparo filed by the Company.
Since more than one year has elapsed since publication of Decree No. 1.918/09 and given authorization of the suspension of the action for the protection of constitutional rights, this meaning a material change in the conditions determining the original recording of the tariff increase, TGS’s management resolved to: (i) discontinue recording the revenues attributable to the tariff increase, and (ii) reverse the amount receivable previously accounted for in fiscal year ended December 31, 2009 and 2010 TGS management’s decision does not imply a waiver of the rights conferred by Decree No. 1,918/09.
This provisional agreement will be valid until the effective date of an agreement for the comprehensive renegotiation of the license to be entered into with the National Government. As of the date of these financial statements, TGS is evaluating that proposal. As set forth in the provisional agreement, TGS should reach an agreement with UNIREN on the modalities, terms and dates for the execution of the comprehensive agreement before the expiration date of the Economic Emergency Law. If no agreement is reached, UNIREN will submit a report to the PEN recommending the steps to be taken.
Early in October 2008, TGS received from UNIREN a proposal for a comprehensive renegotiation agreement (including the 20% initial tariff increase). In October 2011, TGS received a new proposal from UNIREN which was accepted by TGS, allowing UNIREN to initiate the relevant administrative procedure.
On April 7, 2014, through Resolution No. I-2852 ENARGAS approved tariff schedules applicable to the Natural Gas Transportation public utility provided by TGS, effective April 1, 2014. Tariff schedules provide for an increase in stages: an 8% increase as from April 1, 2014, an accumulated 14% increase since June 1, 2014 and an accumulated 20% increase since August 1, 2014.
This increase will be allocated to an investment plan to be implemented by TGS in connection with works in its transportation system to secure quality levels of the natural gas transportation service according to the Regulatory Framework of the natural gas industry.
Publication of tariff schedules represents the partial implementation of the Provisional Agreement entered into on October 9, 2008. In this respect, the Company will continue seeking the full implementation of the Provisional Agreement through the legal actions already initiated.
Investment CIESA / TGS
As of December 31, 2014 the book value of the investment in CIESA (TGS’s controlling shareholder ) is 491 and represents about 2% of the total assets of Petrobras Argentina.
F-49
17.2. Investment in associates
| | | | | | | | | | | | | | | | | | | | | | | | | | |
| | | | | 2014 | | | 2013 | | | 2012 | |
| | | | | Description of securities | | | Book value | | | Book value | | | Book value | |
| | | Note | | Face value | | | Amount | | | Cost | | | | |
OCP | | | | U$S | 0,01 | | | | 31,500 | | | | 98 | | | | — | | | | 253 | | | | 169 | |
Oleoductos del Valle S.A. | | | | $ | 10 | | | | 2,542,716 | | | | 61 | | | | 65 | | | | 44 | | | | 43 | |
Refinería del Norte S.A. | | | | $ | 1 | | | | 26,108,083 | | | | 63 | | | | 246 | | | | 192 | | | | 159 | |
Mixed Companies in Venezuela | | (a) | | | — | | | | — | | | | 2,714 | | | | 7,834 | | | | 5,981 | | | | 4,437 | |
Other | | | | | | | | | | | | | — | | | | 1 | | | | 1 | | | | 1 | |
Allowance for impairment of investments | | (b) | | | | | | | | | | | — | | | | (5,167 | ) | | | (2,903 | ) | | | (1,803 | ) |
| | | | | | | | | | | | | | | | | | | | | | | | | | |
| | | | | | | | | | | | | 2,936 | | | | 2,979 | | | | 3,568 | | | | 3,006 | |
| | | | | | | | | | | | | | | | | | | | | | | | | | |
| | | | | | | | | | | | | | | | | | | | | | |
| | | Last available financial statement | | | |
| | | Date | | | Capital
stock | | | Net income
for the year | | | Equity | | | Percentage
share | | | Main business |
Oleoductos del Valle S.A. | | | 12/31/2014 | | | | 110 | | | | 90 | | | | 296 | | | | 23.10 | | | Oil Transportation |
Refinería del Norte S.A. | | | 09/30/2014 | | | | 92 | | | | 305 | | | | 883 | | | | 28.50 | | | Refining |
| (a) | Included Petrokariña S.A., Petroritupano S.A., Petroven-Bras S.A. and Petrowayú S.A |
| (b) | The activity for the years ended December 31, 2014, 2013 and 2012, includes (921), (580) and (189) charged to “Other comprehensive income” and (1.342), (520) and (285), charged to “Share of net loss of equity accounted investments”, respectively (see note 17.3). |
For purposes of IFRS’s 12 requirements, the Company does not have significant investments in associates.
Investments in Mixed Companies in Venezuela
In April 2005, the MEP instructed PDVSA to review the thirty-two operating agreements signed by PDVSA affiliates with oil companies from 1992 through 1997. These instructions given by the MEP established that all the necessary measures should be taken by PDVSA to migrate all operating agreements effective at that time to mixed companies. In August 2006, the conversion operating agreements were signed, providing for that the equity interest of private partners in such mixed companies would be of 40%, with the remaining 60% to be held by the Venezuelan Government.
The companies Petroritupano S.A., Petrowayú S.A., Petroven-Bras S.A. and Petrokariña S.A. (collectively referred to as “mixed companies”) were organized as a result of migration of the operating agreements governing production activities in Venezuela in the Oritupano Leona, La Concepción, Acema and Mata areas, respectively.
The mixed companies have to sell to PDVSA all liquid hydrocarbons and the associated natural gas (when so provided in the agreement), produced in the delimited area, according to a price formula associated with international benchmarks such as WTS and WTI.
As of December 31, 2014, 2013 and 2012 the carrying value of the Company’s direct and indirect interest in the mixed companies, net of impairment charges, is 2,667, 3,078 and 2,634, respectively. The recoverability of the referred investments is highly sensitive to crude oil price volatility, to economic, social and regulatory changes and, particularly, to the resulting business plans. In determining the recoverable value, the Company considered prices based on business plans, production curves, transaction costs at market values and investment needs to develop the reserves of such companies. Discount rates used to measure recoverable value consider the type of asset involved, the business segment and the country where operations are conducted. The Company performed a sensitivity analysis relating to the discount rate, an increase or decrease of a 1%, would imply a decrease of 83 or an increase of 94, in the net investment, respectively, representing approximately 0.4% of the total assets of the Company. Additionally, the Company performed a sensitivity analysis relating to the price of crude oil used in cash flow projections, considering a Brent crude oil price of USD 52 per barrel in 2015, increasing to USD 82 per barrel in the long term, an increase or decrease of a 10%, would imply an increase of 217 and a decrease of 256, in the net investment, respectively, representing approximately a 1% of the total assets of the Company.
F-50
Upon the execution of the pertinent agreements in connection with the migration of the operating agreements, in 2006, the Government of Venezuela recognized a divisible and transferable credit in favor of the private companies participating in the mixed companies in the amount of US$ 88.5 million for Petrobras Argentina’s equity interest, which does not accrue interest and could be applied to the payment of acquisition bonds to be used in any new mixed ownership project for oil exploration and production activities, or licenses for gas exploration and production operations in Venezuela. Since projects for the use of the credit recognized had not materialized, the efforts to transfer such credit to third parties had not been successful, and other alternative uses of the credit was not anticipated, in 2007 the Company recorded an allowance for the full amount of the credit. As of December 31, 2014, 2013 and 2012 the Company maintains allowances for impairment on this asset of 756, 574 and 434, respectively.
Impairment charge on investments in Oleoductos de Crudos Pesados (OCP)—Ecuador
As regards the interpretation conflicts between OCP and the Ecuadorian Tax Authorities, the Court of Justice issued rulings confirming the tax debt assessment in favor of the State, so OCP filed extraordinary actions for protection with the Constitutional Court. These actions were rejected by the Constitutional Court at the end of 2014.
OCP reports a deficit in its equity as of December 31, 2014. However, considering that Petrobras Argentina has not taken on any commitment to provide capital contributions or financial assistance to OCP, the shares have been valued at zero, with a net loss of 464 having been recognized in the fiscal year 2014, after giving effect to the capitalization during 2014 of a credit the Company held against OCP.
17.3. Share of net loss of equity accounted investments
| | | | | | | | | | | | | | |
| | | Note | | 2014 | | | 2013 | | | 2012 | |
Mixed Companies in Venezuela | | (a) | | | (1,385 | ) | | | (357 | ) | | | (162 | ) |
Refinería del Norte S.A. | | | | | 97 | | | | 44 | | | | 11 | |
Distrilec | | | | | — | | | | — | | | | (253 | ) |
CIESA | | (b) | | | (6 | ) | | | 10 | | | | 219 | |
OCP | | | | | (464 | ) | | | 19 | | | | 20 | |
PELSA | | | | | | | | | — | | | | 26 | |
Other | | | | | 23 | | | | 5 | | | | (9 | ) |
| | | | | | | | | | | | | | |
| | | | | (1,735 | ) | | | (279 | ) | | | (148 | ) |
| | | | | | | | | | | | | | |
| (a) | Includes an allowance of 1,342, 520 and 285 for the years ended December 31, 2014, 2013 and 2012. |
| (b) | In 2012, includes 165 for the debt restructuring of CIESA. (Note 17.1.4) |
17.4. Dividends collected
| | | | | | | | | | | | | | | | |
| | | Note | | | 2014 | | | 2013 | | | 2012 | |
Refinería del Norte S.A. | | | | | | | 52 | | | | 16 | | | | — | |
OCP | | | | | | | — | | | | 4 | | | | 3 | |
PELSA | | | 17.5 | | | | — | | | | — | | | | 9 | |
Other | | | | | | | 3 | | | | 3 | | | | 2 | |
| | | | | | | | | | | | | | | | |
| | | | | | | 55 | | | | 23 | | | | 14 | |
| | | | | | | | | | | | | | | | |
F-51
17.5. Acquisition of PELSA
On May 31, 2012, the Company reached an agreement to acquire a 39.671% equity interest in Petrolera Entre Lomas S.A. from its controlling company Petrobras Participaciones S.L. for US$ 249.4 million. As from this date, Petrobras Argentina exercises control over Petrolera Entre Lomas S.A. with a shareholding of 58.88%.
The price agreed between the parties further includes a contingent payment to the seller for a period of 10 years from the acquisition to reflect the value of any identification of unconventional resources in commercially exploitable areas Entre Lomas, Bajada del Palo, Agua Amarga and Charco del Palenque. Such compensation will be done considering the market value of these resources to the valuation date, and will be conducted by an internationally renowned independent evaluator hired by agreement between the parties. As of the date of these financial statements unconventional commercially exploitable resources have not been identified, whereby the Company has not recognized liabilities related to this transaction.
When accounting for this acquisition, the Company recognized the subsidiary’s assets and liabilities at book value as of the transaction date. As the fair value of the net assets acquired was higher than book value, the Company recorded 693 in Equity (Note 2.6.8).
Effects PELSA consolidation in the financial statements of the Company:
The assets and liabilities incorporated in the May 31, 2012 were as follows:
| | | | |
Cash and cash equivalents | | | 110 | |
Property, plant and equipment | | | 1,098 | |
Other assets | | | 369 | |
| | | | |
Total assets | | | 1,577 | |
| | | | |
Total liabilities | | | 546 | |
| | | | |
The results incorporated since 1 June to December 31, 2012 are as follows:
| | | | |
Sales | | | 841 | |
Gross profit | | | 327 | |
Net incomes | | | 80 | |
If they had been consolidated since 1 January to December 31, 2012 the results have been incorporated as follows:
| | | | |
Sales | | | 1,414 | |
Gross profit | | | 585 | |
Net incomes | | | 271 | |
F-52
17.6. Information about interest in subsidiaries, associates, entities under joint control and other entities as of December 31, 2014
| | | | | | | | | | | | |
| | | | | % of Ownership and Votes | | | |
Subsidiaries | | Country | | Direct | | | Indirect | | | Business Segment |
Atalaya Energy S.R.L. (a) | | Argentina | | | 100.00 | | | | — | | | Oil and Gas Exploration and Production |
Canadian Hunter Argentina S.A (a) | | Argentina | | | 100.00 | | | | — | | | Oil and Gas Exploration and Production |
Corod Producción S.A. | | Venezuela | | | 100.00 | | | | — | | | Oil and Gas Exploration and Production |
EcuadorTLC S.A. | | Ecuador | | | 100.00 | | | | — | | | Oil and Gas Exploration and Production |
Eg3 Red S.A. | | Argentina | | | 95.00 | | | | 5.00 | | | Refining and Distribution |
Electricidade Com S.A. | | Brasil | | | — | | | | 100.00 | | | Gas and Energy |
Enecor S.A. | | Argentina | | | 69.99 | | | | — | | | Gas and Energy |
Petrobras Bolivia Internacional S.A. | | Bolivia | | | 100.00 | | | | — | | | Corporate |
Petrobras Energía Colombia | | Gran Cayman | | | — | | | | 100.00 | | | Oil and Gas Exploration and Production |
Petrobras Energía de México S.A. de C.V. | | México | | | — | | | | 100.00 | | | Oil and Gas Exploration and Production |
Petrobras Energía Ecuador | | Gran Cayman | | | — | | | | 100.00 | | | Oil and Gas Exploration and Production |
Petrobras Energía Internacional S.A. | | Argentina | | | 95.00 | | | | 5.00 | | | Corporate |
Petrobras Energía Operaciones Ecuador S.A. | | Ecuador | | | — | | | | 100.00 | | | Oil and Gas Exploration and Production |
Petrobras Hispano Argentina S.A. | | España | | | 100.00 | | | | — | | | Corporate |
Petrolera San Carlos S.A. | | Venezuela | | | — | | | | 100.00 | | | Oil and Gas Exploration and Production |
Transporte y Servicios de Gas en Uruguay S.A. | | Uruguay | | | 51.00 | | | | 13.55 | | | Gas and Energy |
World Energy Business S.A. | | Argentina | | | — | | | | 100.00 | | | Gas and Energy |
Petrolera Entre Lomas S.A. | | Argentina | | | 58.88 | | | | — | | | Oil and Gas Exploration and Production |
| | | | |
Joint ventures | | | | | | | | | | |
Cía. de Inversiones de Energía S.A. | | Argentina | | | 25.00 | | | | 25.00 | | | Gas and Energy |
Transportadora de Gas del Sur S.A. | | Argentina | | | — | | | | 25.50 | | | Gas and Energy |
| | | | |
Associates | | | | | | | | | | |
Coroil S.A. | | Venezuela | | | 20.00 | | | | 29.00 | | | Oil and Gas Exploration and Production |
Inversora Mata S.A. | | Venezuela | | | 49.00 | | | | — | | | Oil and Gas Exploration and Production |
Oleoducto de Crudos Pesados Ltd. | | Gran Cayman | | | — | | | | 11.42 | | | Oil and Gas Exploration and Production |
Oleoducto de Crudos Pesados S.A. | | Ecuador | | | — | | | | 11.42 | | | Oil and Gas Exploration and Production |
Oleoductos del Valle S.A. | | Argentina | | | 23.10 | | | | — | | | Oil and Gas Exploration and Production |
Petrokariña S.A. | | Venezuela | | | 29.20 | | | | 5.29 | | | Oil and Gas Exploration and Production |
Petroritupano S.A. | | Venezuela | | | 22.00 | | | | — | | | Oil and Gas Exploration and Production |
Petroven-Bras S.A. | | Venezuela | | | 29.20 | | | | 5.29 | | | Oil and Gas Exploration and Production |
Petrowayú S.A. | | Venezuela | | | 36.00 | | | | — | | | Oil and Gas Exploration and Production |
Refinería del Norte S.A. | | Argentina | | | 28.50 | | | | — | | | Refining and Distribution |
Urugua-í S.A. | | Argentina | | | 29.33 | | | | — | | | Gas and Energy |
| | | | |
Other interest in affiliates | | | | | | | | | | |
Termoeléctrica José de San Martín S.A. | | Argentina | | | 8.84 | | | | — | | | Gas and Energy |
Termoeléctrica Manuel Belgrano S.A. | | Argentina | | | 8.84 | | | | — | | | Gas and Energy |
| (a) | On March 19, 2015 the special shareholders’ meetings of PESA and Canadian Hunter Argentina S.A., and the meeting of Atalaya Energy S.R.L.’s members approved the merger of the before mentioned companies, whereby PESA absorbed Canadian Hunter Argentina S.A. and Atalaya Energy S.R.L., which were dissolved without going into liquidation. The effective date of the merger was January 1, 2015, whereupon the absorbed companies’ assets, liabilities, rights and obligations were deemed absorbed by PESA. |
Pursuant to Chapter X of the CNV Rules, the Company submitted before such agency the merger authorization formalities under File No. 395/2015. As of the date of these financial statements, regulatory acts and the instruction of the CNV to registration with the Public Registry of Commerce are still pending.
Changes in interest in related companies in fiscal years 2012 to 2014:
In May 2012 the Company acquired an additional 39.671% equity interest in PELSA, with equity interest totaling 58.88%.
In the first quarter of 2013, the Company sold 100% of its interest in PEDASA, through which the Company held a 48.5% indirect interest in Distrilec and a 27.33% indirect interest in Edesur.
In fiscal year 2014, liquidation of Propyme S.G.R, in which the Company held a 48.56% direct and a 0.07% indirect interest, was approved.
F-53
In December 2014, the Company acquired the 5% direct interest PEISA held in Atalaya Energy S.R.L. and Canadian Hunter Argentina S.A. As a result, as from this date the Company holds a 100% direct interest in both companies.
17.7. Relevant information
The table below shows the most relevant information from the statements of income and cash flows of the subsidiaries with material non-controlling interest, apply from the purchase of an additional interest in PELSA in May 2012 (Note 17.5)
| | | | | | | | | | | | | | | | |
Name | | Country | | | Proportion non-controllig interest | |
| | | 2014 | | | 2013 | | | 2012 | |
Petrolera Entre Lomas S.A. | | | Argentina | | | | 41 | % | | | 41 | % | | | 41 | % |
| | | | |
| Statement of profit or loss | | | | | 2014 | | | 2013 | | | 2012 | |
Sales | | | | | | | 2,609 | | | | 1,686 | | | | 841 | |
Cost of sales | | | | | | | (1,689 | ) | | | (1,044 | ) | | | (514 | ) |
| | | | | | | | | | | | | | | | |
Gross profit | | | | | | | 920 | | | | 642 | | | | 327 | |
| | | | | | | | | | | | | | | | |
Administrative and others expenses | | | | | | | (249 | ) | | | (179 | ) | | | (76 | ) |
Financial results | | | | | | | 16 | | | | (7 | ) | | | 1 | |
| | | | | | | | | | | | | | | | |
Income before income tax | | | | | | | 687 | | | | 456 | | | | 252 | |
| | | | | | | | | | | | | | | | |
Income tax | | | | | | | (395 | ) | | | (278 | ) | | | (118 | ) |
| | | | | | | | | | | | | | | | |
Net income | | | | | | | 292 | | | | 178 | | | | 134 | |
| | | | | | | | | | | | | | | | |
Attributable to non-controlling interests | | | | | | | 120 | | | | 73 | | | | 55 | |
Other comprehensive income | | | | | | | 572 | | | | 416 | | | | 95 | |
Attributable to non-controlling interests | | | | | | | 236 | | | | 171 | | | | 39 | |
Dividends paid to non-controlling interests | | | | | | | 61 | | | | 16 | | | | 18 | |
| | | | |
| Statement of financial position | | | | | 2014 | | | 2013 | | | 2012 | |
Current Assets | | | | | | | 981 | | | | 537 | | | | 455 | |
Non-current Assets | | | | | | | 2,784 | | | | 1,953 | | | | 1,387 | |
Current Liabilities | | | | | | | 848 | | | | 355 | | | | 346 | |
Non-current Liabilities | | | | | | | 422 | | | | 354 | | | | 268 | |
| | | | | | | | | | | | | | | | |
Equity | | | | | | | 2,495 | | | | 1,781 | | | | 1,228 | |
| | | | | | | | | | | | | | | | |
Attributable to non-controlling interests | | | | | | | 1,029 | | | | 734 | | | | 506 | |
| | | | |
| Cash flow | | | | | 2014 | | | 2013 | | | 2012 | |
Net cash provided by operations | | | | | | | 1,186 | | | | 657 | | | | 423 | |
Net cash used in investing activities | | | | | | | (756 | ) | | | (559 | ) | | | (143 | ) |
Net cash used in financing activities | | | | | | | (232 | ) | | | (145 | ) | | | (111 | ) |
Effect of exchange rate change | | | | | | | 61 | | | | 58 | | | | 11 | |
| | | | | | | | | | | | | | | | |
Increase (decrease) in cash and cash equivalents | | | | | | | 259 | | | | 11 | | | | 180 | |
| | | | | | | | | | | | | | | | |
Associates and joint arrangements
| | | | | | | | | | | | | | | | | | | | | | | | |
| | | 2014 | | | 2013 | | | 2012 | |
| | | Associates | | | Joint
Arrangements | | | Associates | | | Joint
Arrangements | | | Associates | | | Joint
Arrangements | |
Total other comprehensive income | | | 836 | | | | (11 | ) | | | 1,862 | | | | 19 | | | | 581 | | | | 148 | |
F-54
18. Other investments
| | | | | | | | | | | | | | | | | | | | |
| | | | | | 2014 | | | 2013 | | | 2012 | |
| | | Note | | | Cost | | | Book
value | | | Book
value | | | Book
value | |
Current | | | | | | | | | | | | | | | | | | | | |
Fideicomiso Financiero de Obra Gasoducto Sur | | | 31.2 | | | | 33 | | | | 33 | | | | 20 | | | | 20 | |
Other | | | | | | | — | | | | — | | | | 3 | | | | — | |
| | | | | | | | | | | | | | | | | | | | |
| | | | | | | 33 | | | | 33 | | | | 23 | | | | 20 | |
| | | | | | | | | | | | | | | | | | | | |
Non Current | | | | | | | | | | | | | | | | | | | | |
Loans to joint venture | | | | | | | 189 | | | | 189 | | | | 172 | | | | 130 | |
Related companies | | | 28 | | | | — | | | | — | | | | 128 | | | | 98 | |
Fideicomiso Financiero de Obra Gasoducto Sur | | | 31.2 | | | | 47 | | | | 47 | | | | 64 | | | | 82 | |
Allowance for impairment of investments | | | | | | | — | | | | (103 | ) | | | (79 | ) | | | (44 | ) |
Other | | | | | | | — | | | | 20 | | | | 16 | | | | 13 | |
| | | | | | | | | | | | | | | | | | | | |
| | | | | | | 236 | | | | 153 | | | | 301 | | | | 279 | |
| | | | | | | | | | | | | | | | | | | | |
F-55
19. Property, plant and equipment
Changes in property, plant and equipment
| | | | | | | | | | | | | | | | | | | | | | | | | | | | | | | | |
| | | Note | | | Production
wells,
exploratory
wells and oil
and gas
properties | | | Machinery,
tools and
equipments | | | Electricy
generation
plants | | | Industrial
plants | | | Work in
progress | | | Other | | | Total | |
Cost | | | | | | | | | | | | | | | | | | | | | | | | | | | | | | | | |
| | | | | | | | | | | | | | | | | | | | | | | | | | | | | | | | |
12/31/2011 | | | | | | | 8,896 | | | | 4,129 | | | | 1,134 | | | | 1,086 | | | | 1,021 | | | | 1,748 | | | | 18,014 | |
| | | | | | | | | | | | | | | | | | | | | | | | | | | | | | | | |
Translation effect | | | | | | | 168 | | | | 4 | | | | — | | | | — | | | | 15 | | | | 4 | | | | 191 | |
Additions | | | | | | | 207 | | | | 7 | | | | — | | | | 4 | | | | 1,515 | | | | 261 | | | | 1,994 | |
Net decreases and transfers | | | | | | | 1,296 | | | | 226 | | | | 31 | | | | 66 | | | | (1,595 | ) | | | (220 | ) | | | (196 | ) |
Adquisition of PELSA | | | | | | | 1,090 | | | | — | | | | — | | | | | | | | 88 | | | | 36 | | | | 1,214 | |
| | | | | | | | | | | | | | | | | | | | | | | | | | | | | | | | |
12/31/2012 | | | | | | | 11,657 | | | | 4,366 | | | | 1,165 | | | | 1,156 | | | | 1,044 | | | | 1,829 | | | | 21,217 | |
| | | | | | | | | | | | | | | | | | | | | | | | | | | | | | | | |
Translation effect | | | | | | | 597 | | | | 10 | | | | — | | | | — | | | | 15 | | | | 20 | | | | 642 | |
Additions | | | | | | | 360 | | | | 4 | | | | — | | | | 1 | | | | 2,196 | | | | 180 | | | | 2,741 | |
Net decreases and transfers | | | (a | ) | | | 1,821 | | | | 76 | | | | 19 | | | | 187 | | | | (1,990 | ) | | | (68 | ) | | | 45 | |
| | | | | | | | | | | | | | | | | | | | | | | | | | | | | | | | |
12/31/2013 | | | | | | | 14,435 | | | | 4,456 | | | | 1,184 | | | | 1,344 | | | | 1,265 | | | | 1,961 | | | | 24,645 | |
| | | | | | | | | | | | | | | | | | | | | | | | | | | | | | | | |
Translation effect | | | | | | | 1,018 | | | | 15 | | | | — | | | | — | | | | 38 | | | | 31 | | | | 1,102 | |
Additions | | | | | | | 1,117 | | | | 2 | | | | 1 | | | | — | | | | 3,316 | | | | 219 | | | | 4,655 | |
Net decreases and transfers | | | (b | ) | | | 757 | | | | (8 | ) | | | 148 | | | | 220 | | | | (3,130 | ) | | | (127 | ) | | | (2,140 | ) |
| | | | | | | | | | | | | | | | | | | | | | | | | | | | | | | | |
2014 | | | | | | | 17,327 | | | | 4,465 | | | | 1,333 | | | | 1,564 | | | | 1,489 | | | | 2,084 | | | | 28,262 | |
| | | | | | | | | | | | | | | | | | | | | | | | | | | | | | | | |
Depreciation | | | | | | | | | | | | | | | | | | | | | | | | | | | | | | | | |
| | | | | | | | | | | | | | | | | | | | | | | | | | | | | | | | |
12/31/2011 | | | | | | | 5,711 | | | | 3,188 | | | | 498 | | | | 414 | | | | — | | | | 1,147 | | | | 10,958 | |
| | | | | | | | | | | | | | | | | | | | | | | | | | | | | | | | |
Translation effect | | | | | | | 52 | | | | 1 | | | | — | | | | — | | | | — | | | | 1 | | | | 54 | |
Net decreases | | | | | | | — | | | | (3 | ) | | | — | | | | — | | | | — | | | | (10 | ) | | | (13 | ) |
Depreciation | | | | | | | 1,220 | | | | 301 | | | | 85 | | | | 73 | | | | — | | | | 59 | | | | 1,738 | |
| | | | | | | | | | | | | | | | | | | | | | | | | | | | | | | | |
12/31/2012 | | | | | | | 6,983 | | | | 3,487 | | | | 583 | | | | 487 | | | | — | | | | 1,197 | | | | 12,737 | |
| | | | | | | | | | | | | | | | | | | | | | | | | | | | | | | | |
Translation effect | | | | | | | 195 | | | | 3 | | | | — | | | | — | | | | — | | | | 6 | | | | 204 | |
Net decreases | | | (a | ) | | | — | | | | (10 | ) | | | — | | | | — | | | | — | | | | (4 | ) | | | (14 | ) |
Depreciation | | | | | | | 1,656 | | | | 308 | | | | 87 | | | | 72 | | | | — | | | | 71 | | | | 2,194 | |
| | | | | | | | | | | | | | | | | | | | | | | | | | | | | | | | |
12/31/2013 | | | | | | | 8,834 | | | | 3,788 | | | | 670 | | | | 559 | | | | — | | | | 1,270 | | | | 15,121 | |
| | | | | | | | | | | | | | | | | | | | | | | | | | | | | | | | |
Translation effect | | | | | | | 383 | | | | 6 | | | | — | | | | — | | | | — | | | | 11 | | | | 400 | |
Net decreases | | | (b | ) | | | (999 | ) | | | (452 | ) | | | (3 | ) | | | — | | | | — | | | | (26 | ) | | | (1,480 | ) |
Depreciation | | | | | | | 2,043 | | | | 337 | | | | 90 | | | | 80 | | | | — | | | | 82 | | | | 2,632 | |
| | | | | | | | | | | | | | | | | | | | | | | | | | | | | | | | |
2014 | | | | | | | 10,261 | | | | 3,679 | | | | 757 | | | | 639 | | | | — | | | | 1,337 | | | | 16,673 | |
| | | | | | | | | | | | | | | | | | | | | | | | | | | | | | | | |
Net book value 12/31/2014 | | | | | | | 7,066 | | | | 786 | | | | 576 | | | | 925 | | | | 1,489 | | | | 747 | | | | 11,589 | |
| | | | | | | | | | | | | | | | | | | | | | | | | | | | | | | | |
Net book value 12/31/2013 | | | | | | | 5,601 | | | | 668 | | | | 514 | | | | 785 | | | | 1,265 | | | | 691 | | | | 9,524 | |
| | | | | | | | | | | | | | | | | | | | | | | | | | | | | | | | |
Net book value 12/31/2012 | | | | | | | 4,674 | | | | 879 | | | | 582 | | | | 669 | | | | 1,044 | | | | 632 | | | | 8,480 | |
| | | | | | | | | | | | | | | | | | | | | | | | | | | | | | | | |
| (a) | Decreases on the category for the year ending “production wells, exploratory wells and oil and gas property” on December 31, 2013 includes 11 impairment Santa Cruz area II, charged in “Other operating expenses, net” (Note 9). |
| (b) | Decreases on the category for the year ending “production wells, exploratory wells and oil and gas property” on December 31, 2014 includes 94 impairment Colpa and Caranda areas, charged in “Other operating expenses, net” (Note 9). |
F-56
20. Financial loans
20.1. Global programs of non-convertible bonds
Global program of US$ 2.5 million:
As of December 31, 2014 the following classes of bonds issued under this program remained outstanding: Class S, for a face value of US$ 300 million, maturing in May 2017, at a 5.875% annual rate. Class S bonds are collateralized by a Standby Purchase Agreement provided by Petróleo Brasileiro, pursuant to which, in the event of failure to pay principal, interest and any other amount owed by Petrobras Argentina in connection with Class S bonds, Petróleo Brasileiro shall purchase the rights of bondholders to receive payments.
The proceeds from the bonds were used to refinance liabilities, increase working capital, and make capital expenditures in Argentina and capital contributions to associates.
Bond debt is presented net of the unaccrued portion of the issuance discounts and the incurred costs for such issuances.
Global program of US$ 500 million:
The Extraordinary Shareholders of Petrobras Argentina held on March 21, 2013 approved the creation of a global program for the issuance of bonds for an outstanding maximum principal amounting to US$ 500 million or its equivalent in any other currency, expiring within 5 years, or the maximum term that may be established by any applicable regulation in the future.
The creation of the program was authorized by Resolution No. 17,162 of the CNV of 15 Augusts 2013. No notes were issued as of the date of these financial statements.
20.2. Cross default clauses
Company’s outstanding bonds and other financial indebtedness include cross default provisions whereby the Trustee, as instructed by the bondholders representing at least 25% of the related outstanding capital, in the case of corporate bonds or the lender, as the case may be, may declare all the amounts owed to be due and payable if payment of any debt of the Company or their significant subsidiaries is accelerated or is not made when due, provided that those amounts exceed the higher of US$25 million or 1% of Petrobras Argentina’s shareholders’ equity upon those maturities, and that the default has not been defeated or cured within the applicable legal and / or contractual terms.
As of the date of these financial statements, Petrobras Argentina has complied with all terms and conditions related to its financial indebtedness.
20.3. Composition
The breakdown of the financial debt as of December 31, 2014, 2013 and 2012, is as follows:
| | | | | | | | | | | | | | | | | | | | | | | | |
| | | 2014 | | | 2013 | | | 2012 | |
| | | Current | | | Non current | | | Current | | | Non current | | | Current | | | Non current | |
Financial institutions | | | 73 | | | | 25 | | | | 193 | | | | 81 | | | | 100 | | | | 89 | |
Bonds | | | 19 | | | | 2,562 | | | | 15 | | | | 1,943 | | | | 1,008 | | | | 1,469 | |
| | | | | | | | | | | | | | | | | | | | | | | | |
| | | 92 | | | | 2,587 | | | | 208 | | | | 2,024 | | | | 1,108 | | | | 1,558 | |
| | | | | | | | | | | | | | | | | | | | | | | | |
F-57
Loans activity
Activity in loans and financing during 2014, 2013 and 2012 are as follows:
| | | | | | | | | | | | |
| | | 2014 | | | 2013 | | | 2012 | |
Beginning balance | | | 2,232 | | | | 2,666 | | | | 2,222 | |
Net decrease in short term loans | | | (124 | ) | | | 96 | | | | 2 | |
Accrued interest | | | 192 | | | | 212 | | | | 199 | |
Effect of exchange rate change | | | 671 | | | | 727 | | | | 315 | |
Interest paid | | | (181 | ) | | | (216 | ) | | | (178 | ) |
Increase in long term loans | | | — | | | | 49 | | | | — | |
Long-term loans paid | | | (111 | ) | | | (1,302 | ) | | | (85 | ) |
Adquisition of PELSA | | | — | | | | — | | | | 191 | |
| | | | | | | | | | | | |
Ending balance | | | 2,679 | | | | 2,232 | | | | 2,666 | |
| | | | | | | | | | | | |
Short and Long-term loans
The financial loans outstanding as of December 31, 2014 are as follows:
| | | | | | | | | | | | | | | | |
Type | | 2014 | | | 2013 | | | 2012 | | | Currency | | Annual interest rate |
Current Liabilities | | | | | | | | | | | | | | | | |
Financial institutions | | | 29 | | | | — | | | | — | | | USD | | Libo + 3,55% |
| | | — | | | | 42 | | | | — | | | USD | | Libo + 2,90% |
| | | — | | | | 98 | | | | — | | | USD | | Libo + 1,95% |
| | | — | | | | — | | | | 48 | | | USD | | Libo + 2,40% |
| | | 15 | | | | 23 | | | | 18 | | | USD | | Libo + 1,445% |
| | | — | | | | 21 | | | | — | | | USD | | Libo + 2,955% |
| | | — | | | | — | | | | 17 | | | USD | | Libo + 2,75% |
| | | — | | | | — | | | | 17 | | | USD | | Libo + 2,5% |
| | | — | | | | — | | | | — | | | USD | | 18.00% |
| | | 25 | | | | 6 | | | | — | | | USD | | 15.25% |
| | | 4 | | | | 3 | | | | — | | | USD | | Libo + 3,5% |
| | | | | | | | | | | | | | | | |
| | | 73 | | | | 193 | | | | 100 | | | | | |
| | | | | | | | | | | | | | | | |
Bonds - Class S | | | 19 | | | | 15 | | | | 11 | | | USD | | 5,875% |
Bonds - Class R | | | — | | | | — | | | | 997 | | | USD | | 9.375% |
| | | | | | | | | | | | | | | | |
| | | 19 | | | | 15 | | | | 1,008 | | | | | |
| | | | | | | | | | | | | | | | |
| | | 92 | | | | 208 | | | | 1,108 | | | | | |
| | | | | | | | | | | | | | | | |
Non Current Liabilities | | | | | | | | | | | | | | | | |
Financial institutions | | | 25 | | | | 48 | | | | — | | | ARS | | 15.25% |
| | | — | | | | 12 | | | | 26 | | | USD | | Libo + 1,445% |
| | | — | | | | — | | | | 31 | | | USD | | Libo + 2,90% |
| | | — | | | | — | | | | 16 | | | USD | | Libo + 2,955% |
| | | — | | | | 21 | | | | 16 | | | USD | | Libo + 3,55% |
| | | | | | | | | | | | | | | | |
| | | 25 | | | | 81 | | | | 89 | | | | | |
| | | | | | | | | | | | | | | | |
Bonds - Class S | | | 2,562 | | | | 1,943 | | | | 1,469 | | | USD | | 5,875% |
| | | | | | | | | | | | | | | | |
| | | 2,587 | | | | 2,024 | | | | 1,558 | | | | | |
| | | | | | | | | | | | | | | | |
F-58
The maturities of the long-term financial loans as of December 31, 2014, are as follows:
| | | | | | | | | | | | |
| | | 2014 | | | 2013 | | | 2012 | |
Less than 1 year | | | 92 | | | | 208 | | | | 1,108 | |
From 1 to 2 years | | | 24 | | | | 55 | | | | 64 | |
From 2 to 3 years | | | 2,563 | | | | 26 | | | | 25 | |
Over 3 years | | | — | | | | 1,943 | | | | 1,469 | |
| | | | | | | | | | | | |
| | | 2,679 | | | | 2,232 | | | | 2,666 | |
| | | | | | | | | | | | |
21. Current Taxes payables
| | | | | | | | | | | | |
| | | 2014 | | | 2013 | | | 2012 | |
Value Added | | | 296 | | | | 232 | | | | 212 | |
Gross Income | | | 43 | | | | 27 | | | | 28 | |
Income Tax | | | 485 | | | | 86 | | | | 136 | |
Royalties | | | 111 | | | | 71 | | | | 51 | |
Others | | | 199 | | | | 162 | | | | 43 | |
| | | | | | | | | | | | |
| | | 1,134 | | | | 578 | | | | 470 | |
| | | | | | | | | | | | |
22. Provisions
| | | | | | | | | | | | | | | | | | | | | | | | | | |
| | | | | 2014 | | | 2013 | | | 2012 | |
| | | | | | | | Non | | | | | | Non | | | | | | Non | |
| | | Notes | | Current | | | current | | | Current | | | current | | | Current | | | current | |
Related companies | | 28.2 | | | 187 | | | | 299 | | | | 115 | | | | 288 | | | | 137 | | | | 283 | |
Reserve for enviromental remadiation | | (a) | | | 191 | | | | 152 | | | | 112 | | | | 43 | | | | 259 | | | | 44 | |
Joint ventures | | | | | 27 | | | | — | | | | 43 | | | | — | | | | — | | | | 5 | |
Asset retirement obligation | | 29.3 | | | 45 | | | | 1,396 | | | | 12 | | | | 1,401 | | | | 77 | | | | 939 | |
Contingences | | (b) | | | 1 | | | | 320 | | | | 1 | | | | 318 | | | | 1 | | | | 259 | |
Renegotiation commitments oil areas | | | | | 670 | | | | — | | | | — | | | | — | | | | — | | | | — | |
Other liabilities | | | | | 132 | | | | 227 | | | | 102 | | | | 174 | | | | 169 | | | | 51 | |
| | | | | | | | | | | | | | | | | | | | | | | | | | |
| | | | | 1,253 | | | | 2,394 | | | | 385 | | | | 2,224 | | | | 643 | | | | 1,581 | |
| | | | | | | | | | | | | | | | | | | | | | | | | | |
| (a) | Activity in 2014, 2013 and 2012 fiscal years includes (5), (175) and (21) attributable to payments net of new charges. Fiscal year 2014 and 2013 includes 193 and 27, respectively shown under “Other operating income (expense)” (Note 9). |
| (b) | Activity in 2014, 2013 and 2012 fiscal years includes 109, 103 and 30 shown under Other operating income (expense) (Note 9) and (107), (44) and (33) attributable to disbursements for the year. |
Environmental matters
The Company is subject to extensive environmental regulations in Argentina and in the other countries in which it operates. Petrobras Argentina’s management believes that its current operations are in material compliance with applicable environmental requirements, as currently interpreted and enforced, including regulatory remediation commitments assumed. The Company has not incurred in any material environmental liabilities as a result of its operations to date. Petrobras Argentina undertakes environmental impact studies for new projects and investments and, to date, environmental requirements and restrictions imposed on these new projects have not had any material adverse impact on Petrobras Argentina’s business.
Sensitivity analysis
As regards provisions for environmental remediation and well plugging, the Company performed a sensitivity analysis relating to the 1% variation in the discount rate, with these changes not having a significant impact on charge to income for the year.
F-59
Other issues
The Company maintains interpretative differences with the AFIP, provincial tax authorities and foreign tax authorities about taxes applicable to its oil and gas activity. The Company’s Management and its legal advisors estimate that the outcome of these differences will not have significant adverse effects on the Company’s financial position or results of operations.
23. Social benefits and other payroll benefits
| | | | | | | | | | | | | | | | | | | | | | | | | | | | |
| | | | | | 2014 | | | 2013 | | | 2012 | |
| | | Note | | | Current | | | Non Current | | | Current | | | Non Current | | | Current | | | Non Current | |
Defined contribution plan(a) | | | 23.1 | | | | 5 | | | | — | | | | 4 | | | | — | | | | 4 | | | | — | |
Defined benefit plan | | | 23.2 | | | | — | | | | 308 | | | | — | | | | 235 | | | | — | | | | 210 | |
Other employment benefits | | | 23.3 | | | | — | | | | 130 | | | | — | | | | 101 | | | | — | | | | 59 | |
| | | | | | | | | | | | | | | | | | | | | | | | | | | | |
| | | | | | | 5 | | | | 438 | | | | 4 | | | | 336 | | | | 4 | | | | 269 | |
| | | | | | | | | | | | | | | | | | | | | | | | | | | | |
| (a) | Included in line “Other Liabilities” on “Current Provisions”. |
23.1. Defined contribution plan
Supplementary Pension Plan
In November 2005, Petrobras Argentina’s Board of Directors approved the implementation of a defined voluntary contribution plan for the employees who fulfill certain conditions. Through this plan, Petrobras Argentina makes contributions to a trust fund in an equal amount to the contributions made by the employees adhered to the plan, in conformity with a scheme defined for each salary level. The participating employees may make voluntary contributions exceeding those established in the mentioned scheme, which will not be considered for purposes of the contributions to be made by Petrobras Argentina.
In the years ended December 31, 2014, 2013 and 2012, Petrobras Argentina expensed of 21, 17 and 15, respectively, attributable to such benefit.
23.2. Defined benefit plan
Indemnity plan
This is a defined benefit plan for employees who fulfill certain conditions, and consists of granting, upon retirement, a one-month salary per year of service at the Company, with a minimum of six salaries, in conformity with a decreasing scale considering the years that the plan is in effect.
Compensatory fund
This is a defined benefit plan for employees of Petrobras Argentina who take part in the defined contribution plan effective at the time that joined the Company prior to May 31, 1995, and have reached a certain number of years of service. The benefit is based on the last computable salary and years of service of each employee included in the plan.
The plan is of a supplemental nature, so that the benefit received by the employee is represented by the amount determined under the provisions of this plan, after deducting benefits payable to the employee under the Suplplementary Pension Plan and the public retirement system, in order to that the aggregate benefit to each employee equals the one stipulated in this plan.
F-60
The plan calls for a contribution to a fund exclusively by Petrobras Argentina and without any contribution by the employees. The assets of the fund are contributed to a trust fund and invested in US dollar-denominated money market instruments in order to preserve the accumulated capital and obtain a return in line with a moderate risk profile. In addition, although there is no target asset allocation for the following years, funds are mainly invested in US government bonds, commercial papers rated A1 or P1, AAAm-rated mutual funds and time deposits in banks rated A+ or higher in the United States of America, in accordance with the Trust Agreement dated on March 27, 2002 entered with The Bank of New York Mellon, duly amended by the Permitted Investment Letter dated on September 14th, 2006. The Bank of New York Mellon is the trustee and Towers Watson is the managing agent. Should there be an excess (duly certified by an independent actuary) of the funds to be used to settle the benefits granted by the plan, Petrobras Argentina will be entitled to choice to use it, in which case it would have to notify the trustee thereof.
During 2014, 2013 and 2012 the most relevant actuarial information on the defined-benefits pension plans are as follows:
| | | | | | | | | | | | | | | | | | | | | | | | |
| | | 2014 | | | 2013 | | | 2012 | |
| | | Fair value
of
obligation | | | Fair value
of assets | | | Fair value
of
obligation | | | Fair value
of assets | | | Fair value
of
obligation | | | Fair value
of assets | |
At the beginning of the year | | | 298 | | | | 63 | | | | 259 | | | | 49 | | | | 181 | | | | 27 | |
Acquisition of PELSA | | | — | | | | — | | | | — | | | | — | | | | 35 | | | | 23 | |
Items classified in profit or loss | | | | | | | | | | | | | | | | | | | | | | | | |
Service cost | | | 10 | | | | — | | | | 7 | | | | — | | | | 5 | | | | — | |
Net Interest cost | | | 74 | | | | 9 | | | | 78 | | | | 15 | | | | 45 | | | | 8 | |
Plan Amendment | | | — | | | | — | | | | 6 | | | | — | | | | — | | | | — | |
Items classified in other comprehensive income | | | | | | | | | | | | | | | | | | | | | | | | |
Actuarial gains from experiencie adjustments | | | 9 | | | | — | | | | (38 | ) | | | — | | | | — | | | | (4 | ) |
Benefits paid | | | (18 | ) | | | (14 | ) | | | (14 | ) | | | (11 | ) | | | (7 | ) | | | (7 | ) |
Contributions paid | | | — | | | | 14 | | | | — | | | | 10 | | | | — | | | | 2 | |
Others | | | 19 | | | | 12 | | | | — | | | | — | | | | — | | | | — | |
| | | | | | | | | | | | | | | | | | | | | | | | |
At the end of the year (a) | | | 392 | | | | 84 | | | | 298 | | | | 63 | | | | 259 | | | | 49 | |
| | | | | | | | | | | | | | | | | | | | | | | | |
Net liability at the end of the year | | | | | | | 308 | | | | | | | | 235 | | | | | | | | 210 | |
| | | | | | | | | | | | | | | | | | | | | | | | |
| (a) | As of December 31, 2014, 2013 and 2012 the defined benefit obligation includes 221, 172 and 159 corresponding to the Compensatory Fund and 87, 63 and 51 for the Indemnity Plan, respectively. |
Principal assumptions and sensitivity analysis
| | | | | | | | | | | | | | | | |
| | | | Impact on defined benefit obligation | |
| | | Used | | | Change | | | Increase | | | Decrease | |
Discount rate | | | 4 | % | | | 1 | % | | | (10,10 | %) | | | 12 | % |
Future salary increases | | | 2 | % | | | 1 | % | | | 2.87 | % | | | (1,89 | %) |
The sensitivity analyses are based on a change in an assumption while holding all other assumptions constant. In practice, this is unlikely to occur, and changes in some of the assumptions may be correlated. Therefore, the presented analysis may not be representative of the actual change in the defined benefit obligation.
Benefit obligation are expected to be paid as follows:
| | | | |
2016 | | | 35 | |
2017 | | | 20 | |
2018 | | | 25 | |
2019 | | | 16 | |
2020-2024 | | | 127 | |
F-61
23.3. Other employment benefit obligations
Company employees falling within the scope of certain collective bargaining agreements and meeting the relevant requirements are eligible to receive a certain number of salary pays, when they leave the Company upon retirement or disability.
During 2014, 2013 and 2012 the most relevant actuarial information on the defined-benefits as follows:
| | | | | | | | | | | | |
| | | 2014 | | | 2013 | | | 2012 | |
Benefit obligation at the beginning of the year | | | 101 | | | | 59 | | | | 41 | |
Items classified in profit or loss | | | | | | | | | | | | |
Service cost | | | 8 | | | | 5 | | | | 3 | |
Net Interest cost | | | 37 | | | | 17 | | | | 10 | |
Items classified in other comprehensive income | | | | | | | | | | | | |
Actuarial gains from experiencie adjustments | | | (11 | ) | | | 22 | | | | 11 | |
Benefits paid | | | (5 | ) | | | (2 | ) | | | (6 | ) |
| | | | | | | | | | | | |
Benefit obligation at the end of the year | | | 130 | | | | 101 | | | | 59 | |
| | | | | | | | | | | | |
Principal assumptions and sensitivity analysis
| | | | | | | | | | | | | | | | |
| | | | | | Impact on defined benefit obligation | |
| | | Used | | | Change | | | Increase | | | Decrease | |
Discount rate | | | 4 | % | | | 1 | % | | | (10,51 | %) | | | 12.49 | % |
Future salary increases | | | 2 | % | | | 1 | % | | | 12.98 | % | | | (10,65 | %) |
The sensitivity analyses are based on a change in an assumption while holding all other assumptions constant. In practice, this is unlikely to occur, and changes in some of the assumptions may be correlated. Therefore, the presented analysis may not be representative of the actual change in the defined benefit obligation.
Benefit obligation are expected to be paid as follows:
| | | | |
2016 | | | 12 | |
2017 | | | 5 | |
2018 | | | 11 | |
2019 | | | 7 | |
2020-2024 | | | 67 | |
23.4. Pension plan financing – Optimum Petrobras Trust Fund
The Company, in its capacity as trustor, entered into a trust agreement with BNP Paribas Argentina Investment Partners S.A., in its capacity as trustee, which trust assets consist of shares of the Company (Note 2.6.8). As of December 31, 2014 which number 5,744,303 share of the Company.
The sole purpose of the trust is to make periodical contributions of shares and/or cash resulting from the sale of the shares in order for the Company to comply with the funding obligations under the Compensatory Fund (Note 23.2) and the Supplementary Pension Plan (Note 23.1).
F-62
24. Capital stock
As of December 31, 2014, the Company’s capital stock amounted to 2,019 shares, fully subscribed, issued, paid-in and authorized for public trading.
Changes in capital stock in the last three fiscal years:
| | | | | | | | | | | | |
| | | 2014 | | | 2013 | | | 2012 | |
Common shares of 1 vote and face value of $1 per share | | | 2,019 | | | | 2,019 | | | | 2,019 | |
The Company’s Shareholders Meeting held on March 29, 2012 resolved to capitalize retained earnings of 1,009, through the issuance of 1,009,618,410 common shares of a N/V of P$1 and entitled to one vote per share. On 4 September 2012 the CNV and the Stock Exchange of Buenos Aires authorized the issuance of such registration.
25. Reserves
| | | | | | | | | | | | |
| | | 2014 | | | 2013 | | | 2012 | |
Legal reserve | | | 553 | | | | 515 | | | | 483 | |
Optional reserve for future investment | | | 5,432 | | | | 4,943 | | | | 4,781 | |
Reserve for future dividends | | | 1,159 | | | | 1,050 | | | | 689 | |
| | | | | | | | | | | | |
| | | 7,144 | | | | 6,508 | | | | 5,953 | |
| | | | | | | | | | | | |
26. Unappropriated retained earnings
| | | | | | | | | | | | | | |
| | | Note | | 2014 | | | 2013 | | | 2012 | |
Balances at the beginning of the year | | | | | 752 | | | | 528 | | | | 6,635 | |
Capitalization | | (a) | | | — | | | | — | | | | (1,009 | ) |
Legal reserve | | (a) | | | (38 | ) | | | (32 | ) | | | (35 | ) |
Reserve for future investments | | (a) | | | (489 | ) | | | (162 | ) | | | (4,781 | ) |
Reserve for future dividends | | (a) | | | (225 | ) | | | (361 | ) | | | (900 | ) |
Income attributable to shareholders | | | | | 458 | | | | 779 | | | | 618 | |
| | | | | | | | | | | | | | |
Balances at the end of the period | | | | | 458 | | | | 752 | | | | 528 | |
| | | | | | | | | | | | | | |
| a) | The Company’s Shareholders’ Meeting held on March 29, 2012 resolved to distribute retained earnings totaling 6,725 of December 31, 2011, according to the local regulations effective as of that date. |
27. Other comprehensive income
| | | | | | | | | | | | |
| | | 2014 | | | 2013 | | | 2012 | |
Effect of exchange rate fluctuation | | | 1,097 | | | | 742 | | | | 625 | |
Income tax on the effect of exchange rate fluctuation | | | (664 | ) | | | (591 | ) | | | (581 | ) |
Actuarial profits and loss | | | 60 | | | | 58 | | | | 43 | |
Income Tax on actuarial gains and losses | | | (21 | ) | | | (20 | ) | | | (15 | ) |
| | | | | | | | | | | | |
| | | 472 | | | | 189 | | | | 72 | |
| | | | | | | | | | | | |
F-63
28. Related party transactions
28.1. General conditions
Related-party transactions are conducted in the ordinary course of business at arm’s length conditions and at market prices. The terms and conditions of these transactions are comparable to those offered by or obtained from non-related parties.
Acquisition of companies
In May 2012, the Company reached an agreement to acquire a 39.671% equity interest in PELSA from its controlling company Petrobras Participaciones S.L. (See Note 17.5).
Sale of companies
In December 2007 and in April 2009, Petrobras Argentina sold to PIB BV (a subsidiary of its holding company) a 40% equity interest and the remaining 60% equity interest in PVIE for US$423.3 million and US$619.4 million, respectively.
The agreed price further includes a contingent consideration in favor of the Company to reflect the value of the “Prospectus Kinteroni” in market conditions or, alternatively, non-participation of the buyer and their respective compensation. Such compensation defined by the parties a consequence of the discovery of gas and condensate in the prospectus Kinteroni of Block 57 in January 2008. The Company continues to negotiate with the buyer in order to agree on the amount.
Financial guarantees
In 2007, Petrobras Argentina issued US$300 million Class S corporate bonds, collateralized by a Standby Purchase Agreement provided by Petróleo Brasileiro (Note 20).
In December 2009, the Company took out two loans secured by Petróleo Brasileiro totaling USD 150 million: one loan from Banco Itaú Europa, in an amount of USD 100 million, to be repaid in 7 semi-annual installments, due December 2013, and another loan from HSBC Bank USA, in an amount of USD 50 million, due June 2012. These loans were prepaid during 2011.
Commercial transactions
The Company carries out commercial transactions in the ordinary course of business. The Company makes purchase and sale of crude oil and oil related products with PELSA, Refinor and EG3 Red, and operations of transportation of oil and gas with Oldelval and TGS. In addition, the Company makes crude oil and oil related products import and export transactions with subsidiaries of Petróleo Brasileiro, particularly with Brasken S.A. and Petrobras Global Trading BV.
F-64
28.2. Balances and transactions with related companies
Outstanding balances with related parties as of December 31, 2014, 2013 and 2012 are as follows:
| | | | | | | | | | | | | | | | | | | | | | | | |
| | | 2014 | | | | |
| | | Current | | | Non-current | | | | |
Company | | Trade
Receivables | | | Other
Receivables | | | Accounts
Payable | | | Provisions | | | Provisions | | | | |
Companies in wich it excercises significant influence | | | | | | | | | | | | | | | | | | | | | | | | |
OCP | | | — | | | | — | | | | — | | | | 130 | | | | 299 | | | | | |
Refinería del Norte S.A. | | | 13 | | | | 10 | | | | 8 | | | | — | | | | — | | | | | |
Other | | | — | | | | 84 | | | | 7 | | | | 2 | | | | — | | | | | |
| | | | | | | | | | | | | | | | | | | | | | | | |
| | | 13 | | | | 94 | | | | 15 | | | | 132 | | | | 299 | | | | | |
| | | | | | | | | | | | | | | | | | | | | | | | |
Companies under joint control | | | | | | | | | | | | | | | | | | | | | | | | |
TGS | | | 39 | | | | — | | | | 22 | | | | — | | | | — | | | | | |
| | | | | | | | | | | | | | | | | | | | | | | | |
| | | 39 | | | | — | | | | 22 | | | | — | | | | — | | | | | |
| | | | | | | | | | | | | | | | | | | | | | | | |
Petróleo Brasileiro Group companies | | | | | | | | | | | | | | | | | | | | | | | | |
Braskem S.A. | | | — | | | | — | | | | — | | | | — | | | | — | | | | | |
PIB BV | | | — | | | | 240 | | | | — | | | | — | | | | — | | | | | |
Petrobras Venezuela Inversiones y Servicios S.A. | | | — | | | | — | | | | — | | | | 36 | | | | — | | | | | |
Petrobras Global Trading B.V. | | | 8 | | | | — | | | | — | | | | — | | | | — | | | | | |
Petróleo Brasileiro | | | 4 | | | | 15 | | | | 162 | | | | 12 | | | | — | | | | | |
Other | | | 3 | | | | 91 | | | | 8 | | | | 7 | | | | — | | | | | |
| | | | | | | | | | | | | | | | | | | | | | | | |
| | | 15 | | | | 346 | | | | 170 | | | | 55 | | | | — | | | | | |
| | | | | | | | | | | | | | | | | | | | | | | | |
Total | | | 67 | | | | 440 | | | | 207 | | | | 187 | | | | 299 | | | | | |
| | | | | | | | | | | | | | | | | | | | | | | | |
| |
| | | 2013 | |
| | | Current | | | Non-current | |
Company | | Trade
Receivables | | | Other
Receivables | | | Accounts
Payable | | | Provisions | | | Other
Investments | | | Provisions | |
Companies in wich it excercises significant influence | | | | | | | | | | | | | | | | | | | | | | | | |
OCP | | | — | | | | — | | | | — | | | | 92 | | | | 127 | | | | 288 | |
Refinería del Norte S.A. | | | 4 | | | | 13 | | | | 7 | | | | — | | | | — | | | | — | |
Other | | | 6 | | | | 109 | | | | 6 | | | | 7 | | | | 1 | | | | — | |
| | | | | | | | | | | | | | | | | | | | | | | | |
| | | 10 | | | | 122 | | | | 13 | | | | 99 | | | | 128 | | | | 288 | |
| | | | | | | | | | | | | | | | | | | | | | | | |
Companies under joint control | | | | | | | | | | | | | | | | | | | | | | | | |
TGS | | | 21 | | | | 8 | | | | 12 | | | | — | | | | — | | | | — | |
| | | | | | | | | | | | | | | | | | | | | | | | |
| | | 21 | | | | 8 | | | | 12 | | | | — | | | | — | | | | — | |
| | | | | | | | | | | | | | | | | | | | | | | | |
Petróleo Brasileiro Group companies | | | | | | | | | | | | | | | | | | | | | | | | |
Braskem S.A. | | | — | | | | — | | | | 60 | | | | — | | | | — | | | | — | |
PIB BV | | | — | | | | 237 | | | | — | | | | — | | | | — | | | | — | |
Petrobras Venezuela Inversiones y Servicios S.A. | | | — | | | | — | | | | — | | | | 16 | | | | — | | | | — | |
Petróleo Brasileiro | | | 1 | | | | 3 | | | | 144 | | | | — | | | | — | | | | — | |
Other | | | 11 | | | | 39 | | | | 10 | | | | — | | | | — | | | | — | |
| | | | | | | | | | | | | | | | | | | | | | | | |
| | | 12 | | | | 279 | | | | 214 | | | | 16 | | | | — | | | | — | |
| | | | | | | | | | | | | | | | | | | | | | | | |
Total | | | 43 | | | | 409 | | | | 239 | | | | 115 | | | | 128 | | | | 288 | |
| | | | | | | | | | | | | | | | | | | | | | | | |
| |
| | | 2012 | |
| | | Current | | | Non-current | |
Company | | Trade
Receivables | | | Other
Receivables | | | Accounts
Payable | | | Provisions | | | Other
Investments | | | Provisions | |
Companies in wich it excercises significant influence | | | | | | | | | | | | | | | | | | | | | | | | |
OCP | | | — | | | | — | | | | — | | | | 97 | | | | 97 | | | | 283 | |
Refinería del Norte S.A. | | | 9 | | | | 14 | | | | 22 | | | | — | | | | — | | | | — | |
Other | | | 1 | | | | 8 | | | | 10 | | | | 9 | | | | 1 | | | | — | |
| | | | | | | | | | | | | | | | | | | | | | | | |
| | | 10 | | | | 22 | | | | 32 | | | | 106 | | | | 98 | | | | 283 | |
| | | | | | | | | | | | | | | | | | | | | | | | |
Companies under joint control | | | | | | | | | | | | | | | | | | | | | | | | |
TGS | | | 49 | | | | 6 | | | | 39 | | | | — | | | | — | | | | — | |
| | | | | | | | | | | | | | | | | | | | | | | | |
| | | 49 | | | | 6 | | | | 39 | | | | — | | | | — | | | | — | |
| | | | | | | | | | | | | | | | | | | | | | | | |
Petróleo Brasileiro Group companies | | | | | | | | | | | | | | | | | | | | | | | | |
Braskem S.A. | | | — | | | | — | | | | 16 | | | | — | | | | — | | | | — | |
PIB BV | | | — | | | | 152 | | | | — | | | | — | | | | — | | | | — | |
Petrobras Venezuela Inversiones y Servicios S.A. | | | — | | | | — | | | | — | | | | 31 | | | | — | | | | — | |
Petróleo Brasileiro | | | — | | | | 425 | | | | 85 | | | | — | | | | — | | | | — | |
Other | | | 33 | | | | 58 | | | | — | | | | — | | | | — | | | | — | |
| | | | | | | | | | | | | | | | | | | | | | | | |
| | | 33 | | | | 635 | | | | 101 | | | | 31 | | | | — | | | | — | |
| | | | | | | | | | | | | | | | | | | | | | | | |
Total | | | 92 | | | | 663 | | | | 172 | | | | 137 | | | | 98 | | | | 283 | |
| | | | | | | | | | | | | | | | | | | | | | | | |
The main transactions with related companies for the years ended December 31, 2014, 2013 and 2012 are as follows:
F-65
| | | | | | | | | | | | | | | | | | | | | | | | |
| | | 2014 | | | 2013 | | | 2012 | |
Company | | Purchases | | | Sales | | | Purchases | | | Sales | | | Purchases | | | Sales | |
Companies in wich it excercises significant influence | | | | | | | | | | | | | | | | | | | | | | | | |
Oleoductos del Valle S.A. | | | 77 | | | | 4 | | | | 46 | | | | 3 | | | | 37 | | | | 3 | |
PELSA | | | — | | | | — | | | | — | | | | — | | | | 5 | | | | 2 | |
Refinería del Norte S.A. | | | 151 | | | | 67 | | | | 86 | | | | 42 | | | | 124 | | | | 35 | |
| | | | | | | | | | | | | | | | | | | | | | | | |
| | | 228 | | | | 71 | | | | 132 | | | | 45 | | | | 166 | | | | 40 | |
| | | | | | | | | | | | | | | | | | | | | | | | |
Companies under joint control | | | | | | | | | | | | | | | | | | | | | | | | |
TGS | | | 88 | | | | 221 | | | | 68 | | | | 202 | | | | 82 | | | | 91 | |
| | | | | | | | | | | | | | | | | | | | | | | | |
| | | 88 | | | | 221 | | | | 68 | | | | 202 | | | | 82 | | | | 91 | |
| | | | | | | | | | | | | | | | | | | | | | | | |
Petróleo Brasileiro Group companies | | | | | | | | | | | | | | | | | | | | | | | | |
Braskem S.A. | | | 416 | | | | — | | | | 471 | | | | — | | | | 646 | | | | — | |
Petróleo Brasileiro | | | 40 | | | | 5 | | | | 122 | | | | 17 | | | | 66 | | | | 28 | |
Compañía Mega S.A. | | | — | | | | 18 | | | | — | | | | 7 | | | | — | | | | 7 | |
PIB BV | | | — | | | | — | | | | — | | | | — | | | | 80 | | | | — | |
Petrobras Paraguay Operaciones y Logistica S.R.L. | | | — | | | | 86 | | | | — | | | | 47 | | | | — | | | | 46 | |
Petrobras Global Trading BV | | | 65 | | | | 35 | | | | 41 | | | | — | | | | 192 | | | | 27 | |
Petrobras Chile Distribución Limitada | | | — | | | | 77 | | | | — | | | | 27 | | | | — | | | | — | |
Other | | | 4 | | | | 2 | | | | 3 | | | | 173 | | | | 4 | | | | 161 | |
| | | | | | | | | | | | | | | | | | | | | | | | |
| | | 525 | | | | 223 | | | | 637 | | | | 271 | | | | 988 | | | | 269 | |
| | | | | | | | | | | | | | | | | | | | | | | | |
Total | | | 841 | | | | 515 | | | | 837 | | | | 518 | | | | 1,236 | | | | 400 | |
| | | | | | | | | | | | | | | | | | | | | | | | |
During 2014, 2013 and 2012, the Company paid to its directors and executive officers salaries for approximately 26, 18 and 17, and no significant payments of other benefits were made. The members of the Board of Directors and executive officers do not receive any share based payments or compensation.
29. Oil and gas areas and participation in joint ventures
29.1. General considerations
The Company is jointly and severally liable with the other participants for meeting the contractual obligations under these arrangements.
The production areas in Argentina are operated pursuant to concession production agreements with free crude oil availability.
According to Law No.17,319, royalties equivalent to 12% of the wellhead price of crude oil and natural gas are paid in Argentina. The wellhead price is calculated by deducting freight and other sales related expenses from the sale prices obtained from transactions with third parties. This rate may increase from 3% to 4% depending to the producing jurisdiction and market value of the product.
The Company’s branch in Bolivia performs at its own risk and for its own account, in the name and on behalf of YPFB exploration and production activities within the Colpa Caranda area. Pursuant to the agreement, YPFB owns the hydrocarbons, pays royalties and direct tax on hydrocarbons, which in the aggregate amount to 50% of the production valued on the basis of sales prices, and applies the 80% of the surplus amount to pay, in the first place, the costs and depreciations associated to the development and operation of Petrobras Argentina’s branch, being the rest shared between YPFB and the branch on the basis of an index calculated based on production volumes, depreciation rate, prices and taxes paid, among other items.
29.2. Asset retirement obligations
In accordance with the regulations applicable in the countries where the Company performs oil and gas exploration and production activities. The Company must incur costs associated with well plugging and abandonment. The Company and the joint operations have not pledged any assets for the purpose of settling such obligations.
F-66
The following table summarizes the activity in asset retirement obligations for the years ended December 31, 2014, 2013 and 2012:
| | | | | | | | | | | | |
| | | 2014 | | | 2013 | | | 2012 | |
Beginning balance | | | 1,413 | | | | 1,016 | | | | 702 | |
Acquisition of PELSA | | | — | | | | — | | | | 52 | |
Accretion | | | 147 | | | | 46 | | | | 36 | |
Additions | | | — | | | | 61 | | | | 10 | |
Estimated cash flow changes | | | 311 | | | | 377 | | | | 209 | |
Decreases | | | (546 | ) | | | (124 | ) | | | — | |
Foreign currency translation / other | | | 116 | | | | 37 | | | | 7 | |
| | | | | | | | | | | | |
Ending balance | | | 1,441 | | | | 1,413 | | | | 1,016 | |
| | | | | | | | | | | | |
29.3. Exploratory well costs
The following table provides the year end balances and activity for exploratory well costs, during the years ended on December 31, 2014, 2013 and 2012:
| | | | | | | | | | | | | | | | |
| | | Notes | | | 2014 | | | 2013 | | | 2012 | |
Beginning balance | | | | | | | 298 | | | | 116 | | | | 174 | |
Traslation effect | | | | | | | 13 | | | | 5 | | | | 21 | |
Acquisition of PELSA | | | | | | | — | | | | — | | | | 43 | |
Additions | | | | | | | 349 | | | | 319 | | | | 65 | |
Transferred to development | | | | | | | (32 | ) | | | (115 | ) | | | (19 | ) |
Charged to expenses | | | 8 | | | | (11 | ) | | | (27 | ) | | | (168 | ) |
| | | | | | | | | | | | | | | | |
Ending balance | | | | | | | 617 | | | | 298 | | | | 116 | |
| | | | | | | | | | | | | | | | |
Number of wells at year end | | | | | | | 32 | | | | 23 | | | | 17 | |
| | | | | | | | | | | | | | | | |
F-67
29.4. Oil and gas areas and participation in joint-operations
As of December 31, 2014, the Company and associates are part of the joint operations and consortia for the exploration and production of oil and gas as indicated below:
| | | | | | | | | | | | | | | | | | |
| | | | | | | | Working Interest | | | | | Duration |
Name | | Note | | | Location | | Direct | | | Indirect | | | Operator | |
Production Argentina | | | | | | | | | | | | | | | | | | |
25 de Mayo - Medanito S.E. | | | (a | ) | | La Pampa and Río Negro | | | 100.00 | % | | | — | | | Petrobras Argentina | | 2016/2026 |
Jagüel de los Machos | | | (a | ) | | La Pampa and Río Negro | | | 100.00 | % | | | — | | | Petrobras Argentina | | 2015/2025 |
Bajada del Palo | | | | | | Neuquén | | | 3.85 | % | | | 43.07 | % | | PELSA | | 2025 |
Santa Cruz II | | | | | | Santa Cruz | | | 100.00 | % | | | — | | | Petrobras Argentina | | 2017 / 2028 |
Río Neuquén | | | (a | ) | | Neuquén and Río Negro | | | 100.00 | % | | | — | | | Petrobras Argentina | | 2027 |
Entre Lomas | | | (a | ) | | Neuquén and Río Negro | | | 3.85 | % | | | 43.07 | % | | PELSA | | 2026 |
Aguada de la Arena | | | | | | Neuquén | | | 80.00 | % | | | — | | | Petrobras Argentina | | 2036 |
Santa Cruz I | | | | | | Santa Cruz | | | 71.00 | % | | | — | | | Petrobras Argentina | | 2017 / 2035 |
Sierra Chata | | | | | | Neuquén | | | 19.89 | % | | | 25.67 | % | | Petrobras Argentina | | 2023 |
El Mangrullo | | | (b | ) | | Neuquén | | | 100.00 | % | | | — | | | Petrobras Argentina | | 2025 |
Atuel Norte | | | | | | Mendoza | | | 33.33 | % | | | — | | | Tecpetrol | | 2015 |
La Tapera - Puesto Quiroga | | | | | | Chubut | | | 35.67 | % | | | — | | | Tecpetrol | | 2027 |
El Tordillo | | | | | | Chubut | | | 35.67 | % | | | — | | | Tecpetrol | | 2027 |
Aguaragüe | | | | | | Salta | | | 15.00 | % | | | — | | | Tecpetrol | | 2023 / 2027 |
Estancia Agua Fresca | | | | | | Santa Cruz | | | 50.00 | % | | | — | | | Petrobras Argentina | | 2034 |
Gobernador Ayala | | | | | | Mendoza | | | 22.51 | % | | | — | | | Petro Andina Resources Ltd | | 2036 |
Puesto Oliverio | | | | | | Santa Cruz | | | 50.00 | % | | | — | | | Petrobras Argentina | | 2037 |
Charco del Palenque | | | | | | Río Negro | | | 3.85 | % | | | 43.07 | % | | PELSA | | 2034 |
Foreign | | | | | | | | | | | | | | | | | | |
Colpa - Caranda | | | | | | Bolivia | | | 100.00 | % | | | — | | | Petrobras Argentina | | 2029 |
Oritupano - Leona | | | | | | Venezuela | | | — | | | | 22.00 | % | | PDVSA | | 2025 |
Acema | | | | | | Venezuela | | | — | | | | 34.49 | % | | PDVSA | | 2025 |
La Concepción | | | | | | Venezuela | | | — | | | | 36.00 | % | | PDVSA | | 2025 |
Mata | | | | | | Venezuela | | | — | | | | 34.49 | % | | PDVSA | | 2025 |
Exploration Argentina | | | | | | | | | | | | | | | | | | |
Agua Amarga | | | (c | ) | | Río Negro | | | 3.85 | % | | | 43.07 | % | | PELSA | | — |
Glencross | | | | | | Santa Cruz | | | 87.00 | % | | | — | | | Petrobras Argentina | | 2033 |
Cerrito Oeste | | | | | | Santa Cruz | | | 50.00 | % | | | — | | | Petrobras Argentina | | 2037 |
El Campamento | | | | | | Santa Cruz | | | 50.00 | % | | | — | | | Petrobras Argentina | | 2037 |
Cerro Hamaca Norte | | | (d | ) | | Mendoza | | | 39.64 | % | | | — | | | Petro Andina Resources Ltd | | — |
Parva Negra | | | (e | ) | | Neuquén | | | 40.48 | % | | | 44.52 | % | | Petrobras Argentina | | 2018 |
Estancia Chiripá | | | | | | Santa Cruz | | | 87.00 | % | | | — | | | Petrobras Argentina | | 2033 |
Enarsa 1 (E1) | | | | | | Plataforma Continental Argentina | | | 25.00 | % | | | — | | | YPF | | 2020 |
Enarsa 3 (E3) | | | | | | Plataforma Continental Argentina | | | 35.00 | % | | | — | | | Petrobras Argentina | | 2020 |
Chirete | | | (f | ) | | Salta | | | 100.00 | % | | | — | | | Petrobras Argentina | | 2014 |
Río Atuel | | | | | | Mendoza | | | 33.33 | % | | | — | | | Tecpetrol | | 2015 |
Borde del Limay | | | | | | Neuquén | | | 85.00 | % | | | — | | | Petrobras Argentina | | 2015 |
Los Vértices | | | | | | Neuquén | | | 85.00 | % | | | — | | | Petrobras Argentina | | 2015 |
Veta Escondida y Rincón de Aranda | | | | | | Neuquén | | | 55.00 | % | | | — | | | Petrobras Argentina | | 2027 |
| (b) | The Company signed an agreement with Petrolera Pampa SA to make additional investments in well drilling, which would entitle Petrolera Pampa S.A. to obtain 43% of the production. |
| (c) | The Company had submitted a request for an annexation in existing concession Charco del Palenque. |
| (d) | The granting of the concession is in progress and the term will be 25 years from such granting. |
| (e) | The Company has yield 50% of its direct and indirect working interest to ExxonMobil Exploration Argentina S.A., the agreement has “Gas y Petróleo del Neuquén S.A” approval and its waiting for authority approval. |
| (f) | On March 4, 2015, the Secretary of Energy of the Province of Salta (by Resolution 07/2015), granted the extension of the Second Exploration Period of Chirete area for a period of two years from the expiration date. On March 19, 2015, our board of directors (the “Board of Directors”) approved the transfer of a 50% stake in the Chirete area to the High Luck Group. The agreement is subject to approval by the authorities of the Province of Salta before it becomes effective. |
F-68
Changes in interest in oil and gas areas in fiscal years 2012 to 2014:
In May 2012 the Company acquired an additional 39.671% equity interest in PELSA. As a result, as from that date the Company’s indirect interest in Bajada del Palo, Entre Lomas and Charco del Palenque areas increased from 14.05% to 43.07%.
In fiscal year 2012, the Company was awarded a 50% direct interest in Puesto Olivero, El Campamento and El Cerrito Oeste area.
In January 2014 the Company sold its 38.45% direct interest in Puesto Hernández area.
The Company had submitted a request for an exploitation concession in Parva Negra area, holding a direct and indirect interest of 47.63% and 52.37%, respectively. In 2014 the Company renegotiated its rights on the area and entered into a joint operation agreement with Gas y Petróleo del Neuquén S.A. (GyP), holder of the Parva Negra Este exploration permit, with GyP having a 15% interest and Petrobras (operator) having a 85% direct and indirect interest (40.48% direct and 44.52% indirect).
29.5. Production concession in the Veta Escondida area
On April 4, 2012, we were notified of a decision of the government of the Province of Neuquén to terminate our production concession in the Veta Escondida area. We have sought judicial relief, alleging that we have complied with all requirements under the concession and that we did not commit any breach which would support the decision adopted by the government of Neuquén. On June 28, 2012, the Company was served with an order rendered by the Argentine Supreme Court, upholding the provisional remedy obtained by the Company from the lower courts and instructing the Province of Neuquén to refrain from executing the termination of the concession until a ruling on the merits of the case is delivered.
On December 19, 2013, we (as operators) and Total Austral, having an interest of 55% and 45% in the Veta Escondida exploitation concession, respectively, reached an out-of-court agreement with the Province of Neuquén and Gas y Petróleo del Neuquén (“GyP”), to settle the dispute arising from the enactment of Provincial Decree No. 563/12, which declared the expiration of the concessionaires’ rights under this exploitation concession and led us to bring a complaint against the Province of Neuquén. During 2014, the term for the agreement approval by the Provincial Executive Branch expired.
On March 17, 2015, Provincial Decree No. 565/15 approved an agreement model including similar terms and conditions to those reached in the above mentioned one. The subscription by the parties to this new agreement model would finally settle the dispute. As of the date of this Annual Report, this agreement is still pending subscription.
29.6 Changes in working interest oil and gas areas
On January 31, 2014 the Board of Directors approved the sale to YPF S.A. of the entire interest in the Puesto Hernández Joint Operation (UTE) agreement, for a total price of USD 40.7 million and recognized income before income tax of 181 recorded in “Other operating income/expense, net” (Note 9). This transaction represents for the Company an early termination of the Joint Operation (UTE) agreement, whose assets represented approximately 1% of the total assets of the Company as of December 31, 2013.
The joint operation (UTE) agreement for the exploration and potential exploitation of the area Parva Negra Este, was approved by the Executive Branch of the province of Neuquén through Decree No. 575/14, published on April 4, 2014. The Company has the commitment to drill four onshore wells in the next two years, with a guaranteed amount of USD 27 million for the first year.
29.7 Renegotiation of interest in oil and gas areas
On December 30, 2014 the Legislative Body of the Province of Río Negro ratified the agreement entered into with the Province on December 9, 2014 and approved by the Argentine Executive Branch under Decree No. 1708/2014 on December 15, 2014, to extend for a 10-year term the three concessions the Company holds in that Province: 25 de Mayo – Medanito, Jagüel de los Machos and Río Neuquén.
This agreement mainly establishes the obligations of Petrobras Argentina S.A. to pay a Fixed Bond of USD 40 million, a USD 8 million contribution to Social Development and Institutional Strengthening and a 3% supplementary contribution on hydrocarbon production (in addition to the 12% royalty payment). Likewise, it was agreed to assign to Empresa de Desarrollo Hidrocarburífero Provincial Sociedad Anónima (EDHIPSA) 5% of the rights and obligations inherent to the production concession in the Rio Neuquén area in the Province.
F-69
Petrobras Argentina plans to spend about USD 907.7 million in hydrocarbon exploration and production as from the effective date of the agreement until the new expiration date of the concessions.
In addition, on December 30, 2014 the Legislative Body of the Province of Río Negro ratified the agreement entered into with PELSA to extend for a 10-year term the concession in the Entre Lomas field held by the Company in that Province.
This agreement mainly establishes the obligations of PELSA to pay a Fixed Bond of USD 25.3 million, a USD 5 million contribution to Social Development and Institutional Strengthening and a 3% supplementary contribution on hydrocarbon production (in addition to the 12% royalty payment). PELSA plans to spend about USD 491.8 million in hydrocarbon exploration and production as from the effective date of the agreement until the new expiration date of the concessions.
29.8. Investment commitments
In addition to the information in note 29.7, in Argentina, in connection with its interest in the consortia in charge of exploration activities in Río Colorado, Río Atuel, Borde del Limay, Chirete and Parva Negra Este oil areas, as of December 31, 2014 the Company has investment commitments of approximately USD 16 million, including drilling of exploration wells. Finally, PELSA has investment commitments totaling USD 26 million.
29.9. Relevant information
Relevant information on assets, liabilities and results related to the Company’s interests in joint operations as of December 31, 2014, 2013 and 2012, includes the following:
Assets and liabilities
| | | | | | | | | | | | |
| | | 2014 | | | 2013 | | | 2012 | |
Current assets | | | 341 | | | | 467 | | | | 362 | |
Non-current assets | | | 4,103 | | | | 3,255 | | | | 2,762 | |
| | | | | | | | | | | | |
Total assets | | | 4,444 | | | | 3,722 | | | | 3,124 | |
| | | | | | | | | | | | |
Current liabilities | | | 1,241 | | | | 1,011 | | | | 737 | |
Non-current liabilities | | | 625 | | | | 609 | | | | 476 | |
| | | | | | | | | | | | |
Total liabilities | | | 1,866 | | | | 1,620 | | | | 1,213 | |
| | | | | | | | | | | | |
Statements of Income for the years ended December 31, 2014, 2013 and 2012
| | | | | | | | | | | | |
| | | 2014 | | | 2013 | | | 2012 | |
Sales | | | 4,273 | | | | 3,413 | | | | 2,721 | |
Cost of sales | | | (3,375 | ) | | | (2,884 | ) | | | (1,960 | ) |
| | | | | | | | | | | | |
Gross profit | | | 898 | | | | 529 | | | | 761 | |
Administrative and selling expenses | | | (156 | ) | | | (97 | ) | | | (67 | ) |
Exploration expenses | | | (49 | ) | | | (43 | ) | | | (148 | ) |
Other operating expenses, net | | | (60 | ) | | | (24 | ) | | | (28 | ) |
Financial results | | | (259 | ) | | | (210 | ) | | | (87 | ) |
| | | | | | | | | | | | |
Net income before tax | | | 374 | | | | 155 | | | | 431 | |
| | | | | | | | | | | | |
The charge for income tax is not an obligation for UTEs but an obligation for companies which integrate them.
F-70
30. Operations in Ecuador
As from 2006 the Ecuadorian Government introduced major tax and regulatory reforms in the hydrocarbon sector which resulted in significant changes to the terms and conditions set forth at the time of execution of the Participation Agreements.
Amendatory Agreements and Law amending the Hydrocarbon Law
On October 31, 2008, EcuadorTLC S.A., Teikoku Oil Ecuador and Petroecuador, among others, executed the Amendatory Agreements regulating the operation of Block 18 and Palo Azul while the parties negotiated the migration to a new contract modality.
On July 26, 2010, the amendment to the Hydrocarbon Law in force was approved by operation of law, which provided for, among other things, the obligation to migrate to a new contract modality before November 24, 2010.
As a result of the negotiation process mentioned above, the Company decided not to accept the final proposal received from the Ecuadorian government, as this is insufficient to migrate to Service Agreements in Block 18 and Palo Azul Unified Field. Consequently, through Resolution dated November 25, 2010 the Hydrocarbon Secretary notified EcuadorTLC S.A. the termination of the Participation Agreements and instructed Petroamazonas EP to undertake the operational transition process.
Section 9 of the Amendatory Agreements indicates that the Ecuadorian government must compensate the terminated parties in an amount equivalent to unamortized investments adjusted by a variable rate and provides for a period of time for the Ecuadorian government and the terminated parties to work out the details of the termination payment.
On March 18, 2011, the Hydrocarbon Secretary issued Official Notice No. 626 to inform the Company that it was analyzing and structuring a new regulatory framework to determine a settlement price for the termination, to be applied instead of the provisions of the Amendatory Agreements. On April 11, 2011, the Company filed an answer to the Official Notice and rejected the terms thereof claiming these did not comply with the conditions set forth in the Amendatory Agreements by the parties concerned, which conditions may not be unilaterally modified. In this respect, the Company informed the Hydrocarbon Secretary that it would continue to seek compliance with the terms of the Amendatory Agreements.
On December 9, 2011, Petrobras Argentina served a notice on the Ecuadorian government (Trigger Letter) informing it of the existence of a dispute under the terms of the Treaty for the Promotion and Reciprocal Protection of Investments previously entered into between Argentina and Ecuador. Under the Treaty, this implies the opening of a negotiation period prior to a possible arbitration to seek enforcement of the provisions of the Amendatory Agreements.
On June 21, 2013, not having reached an agreement with the Ecuadorian government, EcuadorTLC SA, Cayman International Exploration Company and Teikoku Oil Ecuador, members of the joint operation, submitted to the Ecuadorian Goverment a letter of notification of a dispute under the terms of the Amendatory Agreements starting their decision to submit the dispute to international arbitration under the arbitration Rules of the United Nations Commission on International Trade Law.
Finally, on February 26, 2014 was presented the request for arbitration against Ecuador in the above terms
As of December 31, 2014 the Company has recorded 458 to be recovered from the Ecuadorian State in accordance with the provisions of the Amendments Agreement, disclosed in Other current receivables (Note 15). This amount does not include the interest calculation for update, as the Company believes that it is not possible to determine with certainty the interest rate to be applied.
Crude Oil Transportation Agreement with OCP
The Company holds a contract with OCP, whereby it assumed a commitment to an oil transport capacity of 80,000 barrels/day for a term of 15 years counted as from November 10,2003.
The transport contract is a “Ship or Pay” contract, so the Company must meet its contractual obligations for the total volume agreed upon, regardless of the real volume transported, and has to pay, the same as the other producers, a rate that covers the operating costs and financial services of OCP, among others.
F-71
During the life of the Amending Contracts, the transport capacity costs billed by OCP were expensed on a monthly basis. The costs of the crude volume actually transported were allocated to “Administrative and selling expenses”, while the portion of the transport capacity hired but not used was disclosed under “Other operating expenses, net” line (Note 9).
The Company has the right to sell the transport capacity in the heavy crude oil pipeline (OCP) to mitigate the negative impact of its non-use. Periodically, the Company negotiates the sale of the hired transport capacity. On December 31, 2008, the Company entered into a contract with Petroecuador whereby the Ecuadorian State assumed a commitment to charge, effective January 1, 2009, the available crude owned by it and transported through the heavy crude oil pipeline to the oil transport capacity hired by the Company, up to a maximum volume of 70,000 barrels/day. In addition, the Company has sold transport capacity of approximately 8,000 barrels/day of oil for the period from July 2004 to January 2012. As a result of the contract non-compliance by the buyers, the Company is making the pertinent claims. Lastly, 40% of the net contractual commitment resulting from the above has been assumed by Teikoku Oil Ecuador, as consideration for the transfer to this company of the 40% interest in Block 18 and Palo Azul in October 2008.
As regards the above-mentioned commitments, as of December 31, 2014 the Company carries a liability for the net transport capacity hired from OCP, in current and non-current provisions for 130 and 299, respectively (Note 28.2). The premises used in calculation of the provisions mainly include the estimate of the applicable rate and the transport capacity used by third parties. The discount rates used in the measurement consider the type of liability in question, the business segment and the country where the transactions are conducted.
The Company must hold letters of credit to ensure compliance with its financial commitments under the Ship or Pay transport contract with OCP and the commitments related to OCP trade payables.
The letters of credit, falling due in December 2018, will be gradually released in the same proportion as those commitments become extinguished. As of December 31, 2014, the Company holds letters of credit for approximately USD 49.5 million. The Company is required to renew or replace the letters of credit as they fall due; otherwise, those amounts shall be paid in cash.
31. Contributions to finance additions to infrastructure in the energy sector in Argentina
31.1. FONINVEMEM, 2008/2011 Agreement and Secretary of Energy Resolution No.95/2013 and No. 529/2014:
Through Resolution No. 712/04, the SE created the FONINVEMEM I trust for the purpose of granting creditors an incentive to invest in the MEM thus increasing the generation of electrical power in Argentina. In 2007, through Resolution S.E. No.564/07, the Secretary of Energy requested MEM agents to participate in FONINVEMEM II, with the purpose of complementing financing of FONINVEMEM I.
In addition, in November 2010 the Secretary of Energy and MEM generators (among which the Company is included) entered into an agreement for the following purposes: (i) enable addition of new generation capacity to meet the increase in demand for Energy and Power in the MEM; (ii) improve availability of existing generation equipment; (iii) determine a method to pay the amounts due to the generators accumulated in the 2008/2011 period, and (iv) recognize a higher Power price and an increase in recognized operating and maintenance costs.
On January 24, 2012, the Secretary of Energy Resolution No.495/12 suspended the greater recognition of operation and maintenance costs and higher prices of power affecting the remuneration paid to generators.
On March 26, 2013, the Secretary of Energy issued Resolution No. 95 which involved the change in the compensation of Generators, Cogeneration and Self-Generators MEM except the Generators Plus, the Binational Hydroelectric Generation and Nuclear Generation among others. Its main changes is the modification being paid Included Generators, for the case of Petrobras comprising the Combined Cycle and Hydroelectric Genelba Pichi Picún Leufú. The new resolution established that the generators had the option of joining or not the conditions. The May 31, 2013, the company adhered to the new rules being the above mentioned central framed under the new resolution.
On May 20, 2014, retroactive to February of the same year, the Department of Energy through Resolution No. 529/2014 updated the remunerative value of Resolution 95/2013 aforementioned. Additionally, the new legislation incorporating remuneration stands to cover nonrecurring Maintenance of thermal power plants and additional remuneration for thermal machines in periods of peak seasonal demand.
F-72
FONINVEMEM
The financing of FONINVEMEM I and II was made through the contribution of 35% and 50% of the credit balances recorded in 2004-2006 and in 2007, respectively, resulting from the spread between the selling price of energy and the variable generation cost. The total contribution in FONINVEMEM I by all the private power generating companies in the wholesale electric market is estimated at US$ 470 million, of which Petrobras Argentina contributed US$ 42 million. In addition, the Company was reimbursed the credit balances recorded in 2007 in the amount of US$16 million pursuant to Resolution No.564/07.
On October 17, 2005 and under the terms of Resolution No. 1,193 issued by the Secretary of Energy, Petrobras Argentina and other MEM creditors formally announced their decision to participate in the construction, operation and maintenance of two power plants of combined cycle 820 MW each.
For the purposes of the purchase of equipment and the construction, operation and maintenance of the power plants, two trusts funds were created. The procurement of the equipment, construction, operation and maintenance of each power plant will be undertaken by Termoeléctrica José de San Martín S.A. and Termoeléctrica Manuel Belgrano S.A., which will enter into a ten-year electricity supply agreement with CAMMESA for the 80% of the energy output, at a price that will allow to cover all costs. Also the contract provides the reimbursements of the FONINVEMEM and the repayment of the debt used to finance the initial investment. The 20% of the electricity output is sold in the spot market. Upon expiration of the supply agreement, the ownership of the assets held in trust will be transferred to the power generation companies proportionally to their contributions to finance the capital expenditure.
End of December 31, 2009, the gas turbines of both power plants were operating in open cycle mode and started to operate in combined cycle as from the first quarter of 2010.
The Company recovers the amounts contributed to the FONINVEMEM I, converted to US$ and adjusted by Libo rate + 1% p.a., in 120 monthly installments starting March 2010, upon authorization of commercial operations of both power plants in the combined cycle mode referred to above. In addition, the Company is a shareholder in both companies with 8.9% share.
By December 31, 2009 the funds contributed by the Company to FONINVEMEM II had been fully recovered through investment in additional electricity generation projects under Resolution No. 564/2007 issued by the Secretary of Energy, whereby the Company built Genelba Plus, a 165 MW thermoelectric plant close to the existing Genelba Power Plant.
2008/2011 Agreement
On November 25, 2010, the Secretary of Energy and MEM Generators signed the 2008/2011 Agreement which will be implemented through new generation projects that have to be submitted by Generators to the Secretary of Energy for selection and subsequent approval.
As regards payment to generators entered into the Agreement, certain methods established for them to maintain contribution margins, mainly as regards the Power price, recognition of higher variable maintenance costs and other non-fuel costs. The indicated mechanism was in effect until December 31, 2011, with the implementation of the Resolution No.495/12 indicated above.
Secretary of Energy Resolution No. 95/2013:
In March 2013, the Secretary of Energy issued Resolution No. 95/2013 which involved the modification of the remuneration scheme of Generators, Cogeneration and Self-Generators MEM except the Generators Plus , the Binational Hydroelectric Power Generation and Nuclear Generation among others.
F-73
The main changes apply to generators that have joined this new scheme are:
(a) Changes in the remuneration of generating agents by scale and technology . Fixed costs and non-fuel variables as well as additional remuneration are paid (the latter two items will be paid based on the generation of each machine). Part of the additional compensation will go to a trust fund works the electricity sector.
b) Temporary Suspension of contracts between private , both electrical energy and fuels and associated inputs, which will be administered by CAMMESA
c) Temporary Suspension of contracts Term Market for Base Demand and supply thus forcing the large users acquire their demand for electrical energy CAMMESA. Until October 7, 2013, the membership of the company at that resolution as Large User MEM were performed.
Secretary of Energy Resolution No. 529/2014:
In May 2014, retroactive to February, Resolution No. 529/2014 was issued to update the values of remunerative from Resolution No. 95/2013, the following remunerative concepts discriminated by scale and technology are added:
a) Remuneration of Non-Recurring Maintenance, a concept that is accrued and paid on the basis of maintenance to be performed.
b) Compensation of Thermal Machines Fixed Costs in Relation to the availability, which provides an increase in the price paid depending on the availability of the plant in the months of the year increased demand.
31.2. Fideicomiso Financiero de Obra Gasoducto Sur (Financial Trust for South Gas Pipeline)
In order to assist in financing the expansion of the transportation capacity of the General San Martín Gas Pipeline, in the offshore leg across the Straits of Magellan, in the fourth quarter of 2009 Petrobras Argentina underwrote bonds issued by Fideicomiso Financiero de Obra Gasoducto Sur, for an amount in pesos equal to US$30 million.
Petrobras Argentina received in exchange debt securities denominated in Argentine pesos (“VRD Obra-4 Estrecho Definitivos”) that bear interest at a rate equivalent to the Reference Stabilization Coefficient plus an annual nominal rate of 8%. The principal amortizes in 30 quarterly installments from April 25, 2011.
32. Contractual commitments, warranty bonds, sureties and guarantees granted
The warranty bonds, sureties and guarantees as of December 31, 2014 which are not disclosed in other notes amount to 1,461.
Additionally, in certain business operations in which the Company and the counterparty act as customers and suppliers, both sides issued guarantees for such operations by equivalent values, which at 31 December 2014 amount to 428.
F-74
In addition, as of December 31, 2014, the Company had the following contractual commitments:
| | | | | | | | | | | | | | |
| | | Note | | Total
(Units) | | | Total
(Millions of
Pesos) | | | Until | |
Purchase Commitments | | | | | | | | | | | | | | |
Long-term service agreement | | (a) | | | — | | | | 2,719 | | | | 2031 | |
Petroleum services and materials | | (a) | | | — | | | | 9,793 | | | | 2019 | |
Transportation capacity (in MMm3) | | (b) | | | 2,930 | | | | 1,312 | | | | 2032 | |
Gas purchase agreement for Genelba (in MMm3) | | | | | 94 | | | | 130 | | | | 2019 | |
Gasolines (in millions of cubic meters) | | | | | 6 | | | | 15,367 | | | | 2026 | |
Sales Commitments | | | | | | | | | | | | | | |
Natural gas (in MMm3) | | | | | 2,889 | | | | 1,803 | | | | 2019 | |
Electric power (in thousands of MWh) | | | | | 4,969 | | | | 6,169 | | | | 2022 | |
LPG (in thousands of tons) | | | | | 188 | | | | 2,045 | | | | 2021 | |
Gasolines (in millions of cubic meters) | | | | | 3 | | | | 9,563 | | | | 2026 | |
Diesel (in millions of cubic meters) | | | | | 86 | | | | 404 | | | | 2016 | |
| (a) | Estimated price of $0.45 per MMm3. |
| (b) | Prices are generally determined by formulas based on future market prices. Estimated prices used to calculate the monetary equivalent of these purchase commitments for purposes of the table are based on current market prices as of December 31, 2014 and may not reflect actual future prices. Accordingly, the peso amounts provided in this table with respect to these commitments are provided for illustrative purpose only. |
33. General Resolution No. 629/2014 - Save Documentation
On August 14, 2014, the CNV issued Resolution No. 629 by amending rules about guard documentation.
In this regard, the Company advises that trade books, corporate books and accounting records are in the registered office.
The Company has sent documentation of certain age to AdeA provider - File Management SA to be stored, it is in Ruta 36, km 34.5, Florencio Varela, Buenos Aires.
34. Subsequent events
a. Shareholders’ Meeting of Petrobras Argentina S.A.
On March 19, 2015, the Shareholders of Petrobras Argentina in their General Regular meeting: (a) approved (i) in accordance with legal requirements, an increase of 435 in the reserve for future investments, and the transfer to the legal reserve of 23 based on our results in 2014, and (ii) a net decrease of 137 in the reserve for future investments (consisting of an increase in the amount of 3,716 and a decrease in the amount of 3,853), and an increase of 137 in the reserve for future dividends; and (b) delegated to the Board of Directors the determination of the actual dividend distribution date and amount. As a result of the foregoing, as of the date of this Annual Report, the reserve for future dividends amounts to 1,296 and the reserve for future investments amounts to 5,731.
b. Sale of the entire interest in the Austral Basin in Argentina
On March 30, 2015 the Board of Directors approved the sale to Compañía General de Combustibles S.A. (CGC) of the entire interest in the Austral Basin in Argentina, which includes the interest in the “Uniones Transitorias de Empresas” (UTEs) Santa Cruz I, Santa Cruz I Oeste, Glencross and Estancia Chiripá, assets associated with Santa Cruz II, Punta Loyola Pier and oil and gas pipelines operated in the basin for a total price of U.S.$101 million and recognized income before income tax of 674.
F-75
35. Expenses classified by nature for the years ended December 31, 2014, 2013 and 2012
| | | | | | | | | | | | | | | | | | | | | | | | |
| | | 2012 | | | 2013 | | | 2014 | |
Accounts | | Total | | | Total | | | Total | | | Costs | | | Administrative
and selling
expenses | | | Exploration
expenses | |
Salaries and wages | | | 1,069 | | | | 1,269 | | | | 1,534 | | | | 755 | | | | 779 | | | | — | |
Other benefits to personnel | | | 199 | | | | 292 | | | | 348 | | | | 165 | | | | 183 | | | | — | |
Taxes, charges and contributions | | | 260 | | | | 365 | | | | 516 | | | | 39 | | | | 477 | | | | — | |
Fees and professional advisory | | | 86 | | | | 104 | | | | 146 | | | | 4 | | | | 142 | | | | — | |
Depreciation of property, plant and equipment | | | 1,738 | | | | 2,194 | | | | 2,632 | | | | 2,558 | | | | 74 | | | | — | |
Oil and gas royalties | | | 823 | | | | 1,128 | | | | 1,560 | | | | 1,560 | | | | — | | | | — | |
Spare parts and repairs | | | 536 | | | | 640 | | | | 727 | | | | 619 | | | | 108 | | | | — | |
Geological and geophysical expenses | | | 44 | | | | 55 | | | | 59 | | | | — | | | | — | | | | 59 | |
Abandoned and non-productive well write-downs | | | 168 | | | | 27 | | | | 11 | | | | — | | | | — | | | | 11 | |
Transportation and freights | | | 438 | | | | 522 | | | | 669 | | | | 228 | | | | 441 | | | | — | |
Procurement of works and services | | | 1,518 | | | | 1,945 | | | | 2,538 | | | | 2,325 | | | | 213 | | | | — | |
Fuel, gas, energy and other | | | 91 | | | | 129 | | | | 143 | | | | 130 | | | | 13 | | | | — | |
Other operating costs and consumptions | | | 177 | | | | 207 | | | | 297 | | | | 193 | | | | 104 | | | | — | |
Expense reimbursements | | | (185 | ) | | | (200 | ) | | | (235 | ) | | | (117 | ) | | | (118 | ) | | | — | |
| | | | | | | | | | | | | | | | | | | | | | | | |
Total 2014 | | | | | | | | | | | 10,945 | | | | 8,459 | | | | 2,416 | | | | 70 | |
| | | | | | | | | | | | | | | | | | | | | | | | |
Total 2013 | | | | | | | 8,677 | | | | | | | | 6,798 | | | | 1,797 | | | | 82 | |
| | | | | | | | | | | | | | | | | | | | | | | | |
Total 2012 | | | 6,962 | | | | | | | | | | | | 5,320 | | | | 1,430 | | | | 212 | |
| | | | | | | | | | | | | | | | | | | | | | | | |
F-76
GLOSSARY:
| | |
| |
| AFIP | | Administración Federal de Ingresos Públicos –Argentine Federal Public Revenues Administration |
| |
| ADS | | American Depositary Shares |
| |
| BCBA | | Buenos Aires Stock Exchange |
| |
| BOE | | Barrel Oil Equivalent |
| |
| BOL | | Bolivares |
| |
| BOPS | | Bi-oriented polystyrene |
| |
| CAMMESA | | Compañía Administradora del Mercado Mayorista Eléctrico S.A. |
| |
| CGN | | Compressed Natural Gas |
| |
| CIESA | | Compañía de Inversiones de Energía S.A. |
| |
| CNDC | | Comisión Nacional de Defensa de la Competencia - Argentine Anti-Trust Authorities |
| |
| CNV | | Comisión Nacional de Valores - Argentine Securities Commission |
| |
| CPCECABA | | Consejo Profesional de Ciencias Económicas de la Ciudad Autónoma de Buenos Aires - Professional Council in Economic Sciences of the City of Buenos Aires |
| |
| Distrilec | | Distrilec Inversora S.A. |
| |
| Edesur | | Empresa Distribuidora Sur S.A. (Edesur S.A.) |
| |
| EEUU | | Estados Unidos de Norteamérica - United States of America |
| |
| ENARGAS | | Ente Nacional Regulador del Gas - Argentine Gas Regulatory Agency |
| |
| ENARSA | | Energía Argentina S.A. |
| |
| ENRE | | Ente Nacional Regulador de la Electricidad - Federal Power Regulation Authority |
| |
| EPCA | | Enron Pipeline Company Argentina S.A. |
| |
| EU | | Euros |
| |
| FACPCE | | Federación Argentina de Consejos Profesionales de Ciencias Económicas - Argentine Federation of Professional Councils in Economic Sciences |
| |
| FONINVEMEM | | Fondo para las Inversiones Necesarias que permitan Incrementar la Oferta de Energía Eléctrica - Fund for the Investments Required to Increase the Electric Power Supply in the Electric Wholesale Market |
| |
| GWh | | Giga Watts hour |
| |
| HES | | Quality, Safety, Environmental and Health policies and guidelines |
| |
| IASB | | International Accounting Standards Board |
| |
| IFO | | Intermediate Fuel Oil |
| |
| IFRS | | International Financial Reporting Standards |
| |
| IPACE | | Argentine Professional Institute for Quality and Excellence |
| |
| LNG | | Liquid Natural Gas |
| |
| LPG | | Liquefied Petroleum Gas |
| |
| LSC | | Ley de Sociedades Comerciales - Business Associations Law |
| |
| Mbbl | | Thousands of barrels |
| |
| MEM | | Wholesale Electricity Market |
| |
| MEP | | Ministerio de Energía y Petróleo de Venezuela - Venezuelan Energy and Oil Ministry |
F-77
| | |
| |
| MMcf | | Millions of cubic meters |
| |
| Mcf | | Millions of cubic foot |
| |
| MOA | | Memorandum of Agreement |
| |
| MPFIPyS | | Ministerio de Planificación Federal, Inversión Pública y Servicios - Federal Planning, Public Investment and Services Ministry |
| |
| MW | | Mega Watts |
| |
| MWh | | Mega Watts Hour |
| |
| m3 | | Cubic Meters |
| |
| NRV | | Net Realizable Value |
| |
| NYSE | | New York Stock Exchange |
| |
| OCI | | Other Comprehensive Income |
| |
| OCP | | Oleoducto de Crudos Pesados Ltd. |
| |
| OHSAS | | Occupational Health and Safety Assessment Series |
| |
| ONG | | Nongovernmental Organization |
| |
| OPEC | | Organization of the Petroleum Exporting Countries |
| |
| PDVSA | | Petróleos de Venezuela S.A. |
| |
| PEDASA | | Petrobras Electricidad de Argentina S.A. |
| |
| PELSA | | Petrolera Entre Lomas S.A. |
| |
| PEN | | Poder Ejecutivo Nacional - Executive Branch of Government |
| |
| PEPSA | | Petrobras Energía Participaciones S.A. |
| |
| PES | | Argentine Pesos |
| |
| Petróleo Brasileiro | | Petróleo Brasileiro S.A. – PETROBRAS. |
| |
| PIB BV | | Petrobras Internacional Braspetro BV |
| |
| PVIE | | Petrobras Valores Internacional de España S.L. |
| |
| Rls | | Reales |
| |
| RT | | Technical Resolution |
| |
| RTI | | Revisión Tarifaria Integral - Complete Rate Review |
| |
| SCyCG | | Subsecretaría de Coordinación y Control de Gestión - Undersecretariat of Coordination and Control of Government Affairs |
| |
| SEC | | Security and Exchange Commission |
| |
| SFAS | | Statement of Financial Accounting Standard |
| |
| TGS | | Transportadora de Gas del Sur S.A. |
| |
| Tn | | Tonnes |
| |
| UNIREN | | Unidad de Renegociación y Análisis de Contratos de Servicios Públicos - Public Service Agreement Renegotiation and Analysis Unit |
| |
| US$ | | United States Dollars |
| |
| WACC | | Weighted Average Cost of Capital |
| |
| WTI | | West Texas Intermediate |
F-78
| | |
| |
| WTS | | West Texas Sour |
| |
| YPFB | | Yacimientos Petrolíferos Fiscales Bolivianos |
| |
| $ BOL | | Bolivian Pesos |
F-79
COMPAÑÍA DE INVERSIONES DE ENERGÍA S.A.
| | | | |
Report of independent registered public accounting firm of Compañía de Inversiones de Energía S.A. as of December 31, 2012 | | | F-81 | |
| |
Consolidated balance sheets of CIESA as of December 31, 2014, 2013 and 2012 | | | F-82 | |
| |
Consolidated statements of income of CIESA for the years ended December 31, 2014, 2013 and 201 | | | F-83 | |
| |
Consolidated statements of cash flows of CIESA for the years ended December 31, 2014, 2013 and 2012 | | | F-84 | |
| |
Consolidated statements of changes in equity of CIESA for the years ended December 31, 2014, 2013 and 2012 | | | F-85 | |
| |
Notes to the consolidated financial statements of CIESA for the years ended 2014, 2013 and 2012 | | | F-86 | |
F-80
Independent Auditor’s Report
Tothe Board of Directors and Shareholders of
Compañĺa de Inversiones de Energĺa S.A.
We have audited the accompanying consolidated financial statements of Compañĺa de nversiones de Energĺa S.A. and its subsidiaries, which comprise the consolidated balance sheet as of December 31, 2012 and the related consolidated statements of income, of changes in shareholders’ equity and of cash flows for the year then ended.
Management’s Responsibility for the Consolidated Financial Statements
Management is responsible for the preparation and fair presentation of the consolidated financial statements in accordance with accounting principles generally accepted in Argentina; this includes the design, implementation, and maintenance of internal control relevant to the preparation and fair presentation of consolidatedfinancial statements that are free from material misstatement, whether due to fraud or error.
Auditor’s Responsibility
Our responsibility is to express an opinion on the consolidatedfinancial statements based on our audit. We conducted our audit in accordance with auditing standards generally accepted in the United States of America. Those standards require that we plan and perform the audit to obtain reasonable assurance about whether the consolidatedfinancial statements are free from material misstatement.
An audit involves performing procedures to obtain audit evidence about the amounts and disclosures in the consolidated financial statements. The procedures selected depend on our judgment, including the assessment of the risks of material misstatement of the consolidatedfinancial statements, whether due to fraud or error. In making those risk assessments, we consider internal control relevant to the Company’s preparation and fair presentation of the consolidated financial statements in order to design audit procedures that are appropriate in the circumstances, but not for the purpose of expressing an opinion on the effectiveness of the Company’s internal control.Accordingly, we express no such opinion. An audit also includes evaluating the appropriateness of accounting policies used and the reasonableness of significant accounting estimates made by management, as well as evaluating the overall presentation of the consolidated financial statements. We believe that the audit evidence we have obtained is sufficient and appropriate to provide a basis for our audit opinion.
Opinion
In our opinion, the consolidated financial statements referred to above present fairly, in all material respects, the financial position of Compañĺa de Inversiones de Energĺa S.A. and its subsidiaries at December 31, 2012, and the results of its operations and its cash flows for the year then ended in accordance with accounting principles generally accepted in Argentina.
| | |
| PRICE WATERHOUSE & Co. S.R.L. |
| |
| By: | | /s/ Carlos N. Martínez (Partner) |
| | Carlos N. Martínez |
| |
| | Buenos Aires, Argentina |
| | April 24, 2013 |
F-81
COMPAÑÍA DE INVERSIONES DE ENERGÍA S.A.
CONSOLIDATED BALANCE SHEETS AS OF DECEMBER 31, 2014, 2013 AND 2012
(In thousands of Argentine pesos as described in Note 2.b.)
| | | | | | | | | | | | |
| | | 2014 | | | 2013 | | | 2012 | |
| | | (non-audited) | | | (non-audited) | | | | |
CURRENT ASSETS | | | | | | | | | | | | |
Cash and banks | | | 352,045 | | | | 125,664 | | | | 97,100 | |
Investments (Exhibit D) | | | 820,264 | | | | 1,119,686 | | | | 744,573 | |
Other investments (Note 4.e.) | | | 268,111 | | | | — | | | | — | |
Accounts receivable, net (Note 4.a.) | | | 411,362 | | | | 418,583 | | | | 449,081 | |
Other receivables (Note 4.b.) | | | 261,544 | | | | 192,193 | | | | 125,398 | |
Inventories | | | 29,131 | | | | 7,356 | | | | 54,282 | |
| | | | | | | | | | | | |
Total current assets | | | 2,142,457 | | | | 1,863,482 | | | | 1,470,434 | |
| | | | | | | | | | | | |
NON CURRENT ASSETS | | | | | | | | | | | | |
Accounts receivable (Note 4.c.) | | | 47,157 | | | | 38,136 | | | | 48,057 | |
Other receivables (Note 4.d.) | | | 56,179 | | | | 47,898 | | | | 50,875 | |
Other investments (note 4.f.) | | | 26,620 | | | | 213,309 | | | | — | |
Investments (Exhibit C) | | | 29,946 | | | | 32,361 | | | | 34,324 | |
Property, plant and equipment, net (Exhibit A) | | | 4,156,003 | | | | 4,016,972 | | | | 4,000,519 | |
| | | | | | | | | | | | |
Total non-current assets | | | 4,315,905 | | | | 4,348,676 | | | | 4,133,775 | |
| | | | | | | | | | | | |
Total assets | | | 6,458,362 | | | | 6,212,158 | | | | 5,604,209 | |
| | | | | | | | | | | | |
| | | | | | | | | | | | |
| | | 2014 | | | 2013 | | | 2012 | |
| | | (non-audited) | | | (non-audited) | | | | |
CURRENT LIABILITIES | | | | | | | | | | | | |
Accounts payable (Note 4.g.) | | | 559,780 | | | | 385,419 | | | | 363,756 | |
Loans (Note 6) | | | 553,159 | | | | 647,809 | | | | 22,400 | |
Payroll and social security taxes payable | | | 87,322 | | | | 67,020 | | | | 53,221 | |
Taxes payable (Note 4.h.) | | | 70,080 | | | | 76,361 | | | | 133,511 | |
Dividends payable | | | 36,796 | | | | — | | | | 68,868 | |
Advances from customers (Note 4.i.) | | | 27,202 | | | | 25,344 | | | | 24,639 | |
Other liabilities (Note 4.j.) | | | 3,812 | | | | 3,522 | | | | 2,495 | |
Provisions for contingencies
(Exhibit E) | | | 150,347 | | | | 143,412 | | | | 144,054 | |
| | | | | | | | | | | | |
Total current liabilities | | | 1,488,498 | | | | 1,348,887 | | | | 812,944 | |
| | | | | | | | | | | | |
NON CURRENT LIABILITIES | | | | | | | | | | | | |
Loans (Note 6) | | | 2,160,405 | | | | 2,017,705 | | | | 1,964,620 | |
Taxes payable (Note 4.l.) | | | 43,868 | | | | 29,936 | | | | 30,632 | |
Advances from customers (Note 4.k.) | | | 380,349 | | | | 311,905 | | | | 279,562 | |
Other liabilities | | | 372 | | | | — | | | | — | |
| | | | | | | | | | | | |
Total non-current liabilities | | | 2,584,994 | | | | 2,359,546 | �� | | | 2,274,814 | |
| | | | | | | | | | | | |
Total liabilities | | | 4,073,492 | | | | 3,708,433 | | | | 3,087,758 | |
| | | | | | | | | | | | |
MINORITY INTEREST | | | 1,150,521 | | | | 1,242,643 | | | | 1,262,464 | |
| | | | | | | | | | | | |
SHAREHOLDERS’ EQUITY | | | 1,234,349 | | | | 1,261,082 | | | | 1,253,987 | |
| | | | | | | | | | | | |
Total liabilities and shareholders’ equity | | | 6,458,362 | | | | 6,212,158 | | | | 5,604,209 | |
| | | | | | | | | | | | |
The accompanying notes are an integral part of these consolidated financial statements.
F-82
COMPAÑÍA DE INVERSIONES DE ENERGÍA S.A.
CONSOLIDATED STATEMENTS OF INCOME
FOR THE YEARS ENDED DECEMBER 31, 2014, 2013 AND 2012
(In thousands of Argentine pesos as described in Note 2.b.
except for per share and per ADS amounts in Argentine pesos)
| | | | | | | | | | | | |
| | | 2014 | | | 2013 | | | 2012 | |
| | | (non-audited) | | | (non-audited) | | | | |
Net revenues (Note 3) | | | 4,303,971 | | | | 2,864,986 | | | | 2,574,968 | |
Cost of sales (Exhibit F) | | | (2,565,535 | ) | | | (1,595,319 | ) | | | (1,351,734 | ) |
| | | | | | | | | | | | |
GROSS PROFIT | | | 1,738,436 | | | | 1,269,667 | | | | 1,223,234 | |
Administrative expenses (Exhibit H) | | | (167,672 | ) | | | (120,124 | ) | | | (95,347 | ) |
Selling expenses (Exhibit H) | | | (647,359 | ) | | | (457,364 | ) | | | (423,233 | ) |
| | | | | | | | | | | | |
OPERATING INCOME | | | 923,405 | | | | 692,179 | | | | 704,654 | |
Loss on related companies | | | (1,617 | ) | | | (2,765 | ) | | | (2,159 | ) |
FINANCIAL EXPENSES, NET | | | (825,244 | ) | | | (562,984 | ) | | | 431,342 | |
Generated by assets | | | | | | | | | | | | |
Interest income | | | 262,297 | | | | 163,293 | | | | 35,763 | |
Foreign exchange gain | | | 222,916 | | | | 162,235 | | | | 103,362 | |
| | | | | | | | | | | | |
| | | 485,213 | | | | 325,528 | | | | 139,125 | |
Generated by liabilities | | | | | | | | | | | | |
Interest expense (Exhibit H) | | | (321,738 | ) | | | (230,864 | ) | | | (206,603 | ) |
Foreign exchange loss (Exhibit H) | | | (935,541 | ) | | | (627,182 | ) | | | (325,031 | ) |
Result of the debt cancellation (Note 6) | | | — | | | | — | | | | 844,920 | |
Other expenses and financial charges (Exhibit H) | | | (53,178 | ) | | | (30,466 | ) | | | (21,069 | ) |
| | | | | | | | | | | | |
| | | (1,310,457 | ) | | | (888,512 | ) | | | 292,217 | |
Other income / (expenses), net (Note 2.r.) | | | 4,921 | | | | 12,054 | | | | (10,610 | ) |
NET INCOME BEFORE INCOME TAX | | | 101,465 | | | | 138,484 | | | | 1,123,227 | |
Income tax and asset tax expense(1) (Note 2.i.) | | | (92,660 | ) | | | (93,248 | ) | | | (452,478 | ) |
Minority interest | | | (35,538 | ) | | | (38,141 | ) | | | (98,602 | ) |
| | | | | | | | | | | | |
NET (LOSS) / INCOME FOR THE YEAR | | | (26,733 | ) | | | 7,095 | | | | 572,147 | |
| | | | | | | | | | | | |
Net (loss) / income per share (Note 2.s.) | | | (0.04 | ) | | | 0.01 | | | | 0.90 | |
| | | | | | | | | | | | |
| (1) | (Ps. 92.660), (Ps. 93.248) and Ps. (452.478) correspond to income tax expense for the years ended December 31, 2014, 2013 and 2012, respectively (see Note 2.l.) |
The accompanying notes are an integral part of these consolidated financial statements.
F-83
COMPAÑÍA DE INVERSIONES DE ENERGÍA S.A.
CONSOLIDATED STATEMENTS OF CASH FLOWS
FOR THE YEARS ENDED DECEMBER 31, 2014, 2013 AND 2012
(In thousands of Argentine pesos as described in Note 2.b.)
| | | | | | | | | | | | |
| | | 2014 | | | 2013 | | | 2012 | |
| | | (non-audited) | | | (non-audited) | | | | |
CASH FLOWS PROVIDED BY OPERATING ACTIVITIES | | | | | | | | | | | | |
Net (loss) / income for the year | | | (26,733 | ) | | | 7,095 | | | | 572,147 | |
Reconciliation of net (loss) / income to cash flows provided by operating activities | | | | | | | | | | | | |
Depreciation of property, plant and equipment | | | 255,662 | | | | 242,917 | | | | 233,670 | |
Retirement of property, plant and equipment | | | 3,916 | | | | 3,891 | | | | 2,696 | |
Net (Decrease) / Increase in allowances and provisions for contingencies | | | 19,966 | | | | (382 | ) | | | 13,374 | |
Loss on related companies | | | 1,615 | | | | 2,765 | | | | 2,159 | |
Minority interest | | | 35,538 | | | | 38,141 | | | | 98,602 | |
Interest expense | | | 296,561 | | | | 217,881 | | | | 206,603 | |
Interest income on investments other than cash and cash equivalents | | | (43,764 | ) | | | (15,585 | ) | | | (6,665 | ) |
Result of the debt cancellation | | | — | | | | — | | | | (844,920 | ) |
Income tax and asset tax expense | | | 92,660 | | | | 93,248 | | | | 452,478 | |
Foreign exchange loss and other financial results | | | 750,687 | | | | 557,721 | | | | 251,264 | |
Changes in assets and liabilities: | | | | | | | | | | | | |
Accounts receivable | | | (47,455 | ) | | | (870 | ) | | | (137,528 | ) |
Other receivables | | | (128,921 | ) | | | (49,414 | ) | | | (36,721 | ) |
Inventories | | | (21,775 | ) | | | 46,926 | | | | (46,694 | ) |
Accounts payable | | | 164,383 | | | | 512 | | | | 74,216 | |
Derivative financial instruments | | | (52,087 | ) | | | 11,525 | | | | — | |
Advances from customers | | | 70,750 | | | | 33,048 | | | | (6,410 | ) |
Payroll and social security taxes payable | | | 20,302 | | | | 13,799 | | | | 157 | |
Taxes payable | | | (78,698 | ) | | | (18,375 | ) | | | (28,347 | ) |
Other liabilities | | | 1,694 | | | | 226 | | | | (3,249 | ) |
Provisions for contingencies | | | (13,238 | ) | | | (18,547 | ) | | | (84 | ) |
Interest paid | | | (206,291 | ) | | | (169,475 | ) | | | (138,766 | ) |
Income tax and asset tax paid | | | (17,469 | ) | | | (120,673 | ) | | | (119,819 | ) |
| | | | | | | | | | | | |
Net cash provided by operating activities | | | 1,077,303 | | | | 876,374 | | | | 538,163 | |
| | | | | | | | | | | | |
CASH FLOWS (USED IN) / PROVIDED BY INVESTING ACTIVITIES | | | | | | | | | | | | |
Payment for the acquisition of property, plant and equipment | | | (350,559 | ) | | | (235,374 | ) | | | (215,438 | ) |
Investments other than cash and cash equivalents | | | 156,143 | | | | (249,260 | ) | | | 595,387 | |
Dividends collected | | | — | | | | 136,829 | | | | — | |
| | | | | | | | | | | | |
Net cash (used in) / provided by investing activities | | | (194,416 | ) | | | (347,805 | ) | | | 379,949 | |
| | | | | | | | | | | | |
CASH FLOWS USED IN FINANCING ACTIVITIES | | | | | | | | | | | | |
Proceeds from loans | | | — | | | | 30,000 | | | | 20,000 | |
Dividends paid | | | (79,593 | ) | | | (263,659 | ) | | | — | |
Payment of loans | | | (769,932 | ) | | | (4,444 | ) | | | (585,347 | ) |
| | | | | | | | | | | | |
Net cash used in financing activities | | | (849,525 | ) | | | (238,103 | ) | | | (565,347 | ) |
| | | | | | | | | | | | |
NET INCREASE IN CASH AND CASH EQUIVALENTS | | | 33,362 | | | | 290,466 | | | | 352,765 | |
Cash and cash equivalents at the beginning of the year | | | 993,616 | | | | 703,150 | | | | 350,385 | |
| | | | | | | | | | | | |
Cash and cash equivalents at the end of the year | | | 1,026,978 | | | | 993,616 | | | | 703,150 | |
| | | | | | | | | | | | |
For supplemental cash flow information see Note 5.
The accompanying notes are an integral part of these consolidated financial statements.
F-84
COMPAÑÍA DE INVERSIONES DE ENERGÍA S.A.
CONSOLIDATED STATEMENTS OF CHANGES IN SHAREHOLDERS’ EQUITY
FOR THE YEARS ENDED DECEMBER 31, 2014, 2013 AND 2012
(In thousands of Argentine pesos as described in Note 2.b.)
| | | | | | | | | | | | | | | | | | | | | | | | | | | | |
| | | Shareholders’ contributions | | | Retained earnings | | | | |
| | | | | | Total | | | | | | | | | | | | | | | Total | |
| | | Common | | | common | | | Legal | | | Future | | | IFRS | | | Accumulated | | | shareholders’ | |
| | | stock | | | stock | | | reserve | | | dividends reserve | | | reserve | | | retained earnings | | | equity | |
Balances at December 31, 2011 | | | 638,819 | | | | 638,819 | | | | 64,531 | | | | — | | | | — | | | | (21,510 | ) | | | 681,840 | |
| | | | | | | | | | | | | | | | | | | | | | | | | | | | |
Net income for the year | | | — | | | | — | | | | — | | | | — | | | | — | | | | 572,147 | | | | 572,147 | |
| | | | | | | | | | | | | | | | | | | | | | | | | | | | |
Balances at December 31, 2012 | | | 638,819 | | | | 638,819 | | | | 64,531 | | | | — | | | | — | | | | 550,637 | | | | 1,253,987 | |
| | | | | | | | | | | | | | | | | | | | | | | | | | | | |
Legal Reserve | | | — | | | | — | | | | 27,532 | | | | — | | | | — | | | | (27,532 | ) | | | — | |
Future Dividends Reserve | | | — | | | | — | | | | — | | | | 246,385 | | | | — | | | | (246,385 | ) | | | — | |
IFRS Reserve | | | — | | | | — | | | | — | | | | — | | | | 276,720 | | | | (276,720 | ) | | | — | |
Net income for the year | | | — | | | | — | | | | — | | | | — | | | | — | | | | 7,095 | | | | 7,095 | |
| | | | | | | | | | | | | | | | | | | | | | | | | | | | |
Balances at December 31, 2013 | | | 638,819 | | | | 638,819 | | | | 92,063 | | | | 246,385 | | | | 276,720 | | | | 7,095 | | | | 1,261,082 | |
| | | | | | | | | | | | | | | | | | | | | | | | | | | | |
Legal Reserve | | | — | | | | — | | | | 354 | | | | — | | | | — | | | | (354 | ) | | | — | |
Future Dividends Reserve | | | — | | | | — | | | | — | | | | 283,461 | | | | — | | | | (283,461 | ) | | | — | |
IFRS Reserve | | | — | | | | — | | | | — | | | | — | | | | (276,720 | ) | | | 276,720 | | | | — | |
Net loss for the year | | | — | | | | — | | | | — | | | | — | | | | — | | | | (26,733 | ) | | | (26,733 | ) |
| | | | | | | | | | | | | | | | | | | | | | | | | | | | |
Balances at December 31, 2014 | | | 638,819 | | | | 638,819 | | | | 92,417 | | | | 529,846 | | | | — | | | | (26,733 | ) | | | 1,234,349 | |
| | | | | | | | | | | | | | | | | | | | | | | | | | | | |
The accompanying notes are an integral part of these consolidated financial statements.
F-85
COMPAÑÍA DE INVERSIONES DE ENERGÍA S.A.
NOTES TO THE CONSOLIDATED FINANCIAL STATEMENTS
AS OF DECEMBER 31, 2014, 2013 AND 2012
(Amounts stated in thousands of Argentine pesos as described in Note 2.b,
except for per share and per ADS amounts in Argentine pesos or unless otherwise indicated)
Compañía de Inversiones de Energía S.A. (“CIESA” or “the Company”) was created on December 14, 1992.
CIESA is under co-control of: (i) the Petrobras Argentina and one of its subsidiaries (together “Petrobras Argentina Group”), which holds 50% of CIESA’s common stock, (ii) the CIESA Trust (whose trustee is The Royal Bank of Scotland N.V. Sucursal Argentina) (the “Trust”), which has a trust shareholding of 40% in CIESA. The remaining 10% is held by EPCA (a subsidiary of Pampa Energía S.A.).
The current ownership of CIESA’s common stock is the result of the first stage of the Master Settlement and Mutual Release Agreement (the “Settlement Agreement”), signed by Petrobras Argentina Group and Enron subsidiaries on April 16, 2004. The shareholding exchange was carried out on August 29, 2005, after the Ente Nacional Regulador del Gas (“ENARGAS”) approval by Note No. 4,858 issued in July 2005. In this stage, Enron subsidiaries transferred 40% of the outstanding share capital of CIESA to the Trust; and Petrobras Argentina Group transferred their TGS class “B” common shares (representing 7.35% of the outstanding share capital of Transportadora de Gas del Sur S.A. “TGS” or “the Controlled Company”) to Enron subsidiaries.
Under the Settlement Agreement and the subsequent agreements, including the 2012 Settlement Agreement after the transfer of 4.2962% of TGS’ common stock, CIESA currently holds 51% of TGS, one of the companies created as a result of the privatization of Gas del Estado S. E. (“GdE”) engaged in the transportation of natural gas, production and commercialization of natural gas liquids (“NGL”) and other services in Argentina. TGS’s pipeline system connects major gas fields in southern and western Argentina with distributors of gas in those areas and in the greater Buenos Aires area. The gas transportation license to operate this system for a period of thirty-five years (“the License”) was exclusively granted to TGS, which is entitled to a one-time extension of ten years provided that it has essentially met the obligations under the License and imposed by ENARGAS. The General Cerri Gas Processing Complex (the “Cerri Complex”), where TGS processes natural gas by extracting NGL, was transferred along with the gas transmission assets.
On May 30, 2013, the Company has been removed from the public offering by Resolution N° 17,094 of the Comisión Nacional de Valores (“CNV”).
| 2. | BASIS OF PRESENTATION AND SUMMARY OF SIGNIFICANT ACCOUNTING POLICIES |
The Company’s consolidated financial statements have been prepared in accordance with generally accepted accounting principles in Argentina (“Argentine GAAP”) as approved by Professional Council in Economic Sciences of the Autonomous City of Buenos Aires (“CPCECABA”) of the Autonomous City of Buenos Aires and the regulations of the ENARGAS. Argentine GAAP differs in certain significant respects from generally accepted accounting principles in the United States of America (“US GAAP”). Such differences involve methods of measuring and classifying the amounts shown in the financial statements, as well as additional disclosures required by US GAAP and Regulation S-X of the Securities and Exchange Commission (“SEC”). These consolidated financial statements do not include any valuation adjustments or additional disclosures to reflect such differences (see note 13).
The consolidated financial statements include the accounts of CIESA on its subsidiaries TGS and Telcosur S.A. (“Telcosur”), over which it has effective control. Investments in companies, in which the Company exercises significant influence, but not control, are accounted for under the equity method. The Company followed the methodology established in Technical Resolution (“TR”) No. 21 “Equity Method of Accounting, Consolidation of Financial Statements and Related Party Transactions”, of the Argentine Federation of Professional Councils in Economic Sciences (“FACPCE”) and approved by the CPCECABA. The accounting policies followed by Telcosur in the preparation of its financial information are consistent with those applied by TGS. All significant intercompany transactions have been eliminated in consolidation.
F-86
COMPAÑÍA DE INVERSIONES DE ENERGÍA S.A.
NOTES TO THE CONSOLIDATED FINANCIAL STATEMENTS
AS OF DECEMBER 31, 2014, 2013 AND 2012
(Amounts stated in thousands of Argentine pesos as described in Note 2.b,
except for per share and per ADS amounts in Argentine pesos or unless otherwise indicated)
Detailed data reflecting subsidiary direct control as of December 31, 2014, 2013 and 2012 is as follows:
| | | | | | | | | | | | | | | | | | | | | | | | | | | | | | |
| | | Percentage of shareholding and votes | | | | | | |
| | | 2014 | | | 2013 | | | 2012 | | | | | | |
Company | | Direct | | | Indirect | | | Direct | | | Indirect | | | Direct | | | Indirect | | | Closing Date | | | Legal Address |
TGS | | | 51.00 | | | | — | | | | 51.00 | | | | — | | | | 51.00 | | | | — | | | | December 31 | | | Don Bosco 3672, 5th Floor, Autonomous city of Buenos Aires |
Telcosur | | | — | | | | 51.00 | | | | — | | | | 51.00 | | | | — | | | | 51.00 | | | | December 31 | | | Don Bosco 3672, 6th Floor, Autonomous city of Buenos Aires |
Financial statements of TGS and Telcosur have been used for consolidation purposes for the years ended December 31, 2014, 2013 and 2012.
The preparation of the consolidated financial statements in conformity with generally accepted accounting principles requires management to make estimates and assumptions that affect the reported amounts of assets and liabilities and the disclosure of contingent assets and liabilities at the date of the consolidated financial statements, as well as the reported amounts of revenues and expenses during the reporting fiscal year. Estimates are used when accounting for the allowance for doubtful accounts, depreciation, amortization, income taxes, provision for contingencies, fair value of assets and present value of long term receivables. Actual results could be significantly different from such estimates.
| b) | Presentation of consolidated financial statements in constant Argentine pesos |
The consolidated financial statements contain comprehensive recognition of the effects of inflation through August 31, 1995 and from January 1, 2002 until February 28, 2003. As from that date, in line with professional and regulatory accounting standards, the Company discontinued the restatement of its financial statements.
In October 2013 and June 2014, respectively, the FACPCE issued TR N° 39 “Modification of TR N° 6 and 17 – Expression in homogeneous currency” and the Interpretation N° 8 “Application of paragraph 3.1 – Expression in homogeneous currency” with the goal of all the entities that present information in the currency of the same economy applied the rules. The financial statements of an entity whose functional currency is the currency of a hyperinflationary economy shall be stated in terms of the measuring unit current at the end of the reporting period.
Professional accounting standards establish that in a context of monetary stability, nominal currency will be used as a measuring unit at the end of the reporting period and, in an inflation context, the financial statements must be expressed in currency of purchasing power of the date to which they correspond, giving accounting recognition to variations in the internal price index to the wholesale posted by theInstituto Nacional de Estadística y Censos (“INDEC”), in accordance with the restatement method issued by the FACPCE in the TR N ° 39.
These financial statements have been prepared in accordance with TR N° 39, under the historical cost convention in nominal currency established in the Argentine accounting rules, applicable criterion in contexts of monetary stability.
F-87
COMPAÑÍA DE INVERSIONES DE ENERGÍA S.A.
NOTES TO THE CONSOLIDATED FINANCIAL STATEMENTS
AS OF DECEMBER 31, 2014, 2013 AND 2012
(Amounts stated in thousands of Argentine pesos as described in Note 2.b,
except for per share and per ADS amounts in Argentine pesos or unless otherwise indicated)
| c) | Short-term receivables and liabilities in currency |
Short-term receivables and liabilities, including accrued interest, if applicable, at the end of each year have been valued at their respective nominal amount, which does not materially differ from the present value of the future cash flow that the receivables and liabilities will generate, using the internal rate of return estimated at inception.
An allowance for trade receivables is established when there is objective evidence that the Company will not be able to collect all amounts due according to the original terms of the receivables. Significant financial difficulties of the debtor, probability that the debtor will enter bankruptcy or financial reorganization, and default or delinquency in payments, including the customers’ credit risk, historical trends and other relevant information are considered indicators that such receivables are impaired. Such evaluation may require future adjustments if economic conditions substantially differ from the assumptions made.
In light of the financial situation of MetroGAS S.A. (“MetroGAS”), as of December 31, 2012, its trade receivables were valued at their present value based on an estimated cash flow discounted at a market interest rate. As of December 31, 2013, all amounts due from MetroGAS were collected.
Tax credits (income tax and value added tax -“VAT”) recorded as a result of the reversion of the tariff increase (Note 7.a) have been valued at the discounted value of the amounts expected to be collected using a market interest rate.
| d) | Foreign currency assets and liabilities |
Assets and liabilities denominated in foreign currencies, including accrued interest, if applicable, have been translated at the prevailing exchange rates at the end of each year. Detailed information is disclosed in Exhibit G.
Inventories consist of natural gas of TGS (in excess of the “Line Pack” classified as property, plant and equipment) in the pipeline system, and the liquids obtained from natural gas processing at the Cerri Complex.
Inventories are measured at the lower of cost or net relievable value.
The assessment of the recoverable value of these assets is made at each reporting date, and the resulting loss is recognized in the statement of comprehensive income when the inventories are overstated.
The carrying amount of the inventories does not exceed its recoverable value.
Bank accounts, time deposits granted to Pampa have been valued at their face values plus accrued interest, which do not materially differ from their discounted value using the internal rate of return effective at inception.
Mutual funds and public bonds have been valued at their net realizable value at year-end.
| g) | Long-term receivables and liabilities |
Long-term receivables and liabilities which accrued interests have been valued based on the best estimate of the discounted value of the amounts expected to be collected or paid, as applicable, using the interest rate effective at the time of the initial measurement.
F-88
COMPAÑÍA DE INVERSIONES DE ENERGÍA S.A.
NOTES TO THE CONSOLIDATED FINANCIAL STATEMENTS
AS OF DECEMBER 31, 2014, 2013 AND 2012
(Amounts stated in thousands of Argentine pesos as described in Note 2.b,
except for per share and per ADS amounts in Argentine pesos or unless otherwise indicated)
Assets and liabilities generated as a result of the application of the deferred tax method (of corresponding, net of non-recoverable deferred tax assets), have been stated at their nominal value.
| h) | Non-current investments |
Equity investments in companies in which the Company’s ownership interest ranges between 20% and 50% have been accounted for under the equity method based on the financial statements as of September 30, 2014, 2013 and 2012 for Gas Link S.A. (“Link”), Transporte y Servicios de Gas en Uruguay S.A. (“TGU”) and Emprendimientos de Gas del Sur S.A. (“EGS”). These financial statements have been prepared applying similar accounting policies as those used by TGS to prepare its consolidated financial statements. As of December 31, 2014, investment in Link has been reduced to zero in the extent that it recorded a shareholder’s equity below zero. As of the date of issuance of these financial statements, has not incurred in any legal or constructive obligation or made payments on behalf of the associate. As of December 31, 2013, the investment in Link has been adjusted by Ps. 3,500 due to the elimination of the unrealized intercompany gains
The Company’s management is not aware of any significant subsequent events which affected: (i) the financial statements as of September 30, 2014 of Link, TGU and EGS, from this date to December 31, 2014; (ii) the financial statements as of September 30, 2013 of Link, TGU and EGS, from this date to December 31, 2013; and, (iii) the financial statements as of September 30, 2012 of Link, TGU and EGS, from this date to December 31, 2012.
The Company considers its foreign affiliate TGU to be a “non-integrated affiliate”. Consequently, TGU’s assets and liabilities have been translated into Argentine pesos using the exchange rate in effect at year-end, while its common stock and retained earnings accounts have been translated using historical exchange rates.
In addition, under of the CPCECABA Resolution MD No.3/2002 and No. 87/03 which provide that foreign currency losses arising from the devaluation of the peso from January 6, 2002 to July 28, 2003, related to liabilities in foreign currency as of such date, directly associated with the funds obtained to acquired TGS ownership, must be allocated to the cost of this assets. The foreign exchange capitalized is amortized in 26 years which corresponds to the years between January 6, 2002 and the finalization of TGS’ License. The amortization is allocated in Loss on related companies
| i) | Property, plant and equipment, net |
| | • | | Assets transferred from the privatization of GdE: The value of these assets was determined based on the price paid for the acquisition of 70% of the Company’s common stock, which amounted to US$ 561.2 million. This price was the basis to determine a total value of common stock of US$ 801.7 million, which, when added to the debt assumed under the Company’s privatization agreement (the “Transfer Agreement”) of US$ 395.0 million, resulted in a total value for property, plant and equipment of US$ 1,196.7 million. Such value, converted at the exchange rate in effect as of the date of the Transfer Agreement, has been restated for the effects of inflation as described in Note 2.b). |
| | • | | Line pack: It represents the natural gas in the transportation system that is necessary to keep the system at operating capacity, valued at acquisition cost and restated for the effects of inflation as described in Note 2.b). |
| | • | | Capitalization of foreign exchange loss: Resolutions No. 3/2002 and No. 87/03 issued by the CPCECABA established that exchange losses arising from the devaluation of the peso from January 6, 2002 to July 28, 2003, to the extent that they were related to foreign currency liabilities existing at the first date, may be added to the cost basis of assets acquired or constructed with direct financing by such foreign currency liabilities. Similar accounting treatment is permitted, but not required, for foreign exchange losses arising from indirect financing. It was assumed that the proceeds from such financings were used, firstly, to cover working capital requirements and, secondly, to finance the acquisition or construction of assets that do not qualify for capitalization. The remainder was assumed to relate to assets for which capitalization is permitted. |
F-89
COMPAÑÍA DE INVERSIONES DE ENERGÍA S.A.
NOTES TO THE CONSOLIDATED FINANCIAL STATEMENTS
AS OF DECEMBER 31, 2014, 2013 AND 2012
(Amounts stated in thousands of Argentine pesos as described in Note 2.b,
except for per share and per ADS amounts in Argentine pesos or unless otherwise indicated)
| | • | | Additions: They have been valued at acquisition cost restated for the effects of inflation as described in Note 2.b). The Controlled Company has capitalized all the investments stipulated as mandatory in the License during the first five-year period, in order to achieve system integrity and public safety equal to those required by international standards. Such investments included, among others, the costs of survey programs related to internal and external pipeline inspection, cathodic protection and pipeline replacement and recoating. Additionally, Resolutions No. 1,660 and No. 1,903 issued by ENARGAS include definitions prescribing which costs should be considered improvements and which costs should be considered maintenance expenses. Repair and maintenance costs have been expensed as incurred. |
| | • | | Depreciation: Accumulated depreciation related to natural gas transportation assets is computed under the straight-line method over the estimated useful lives of the specific assets, which are lower than the maximum useful lives established by ENARGAS through Resolutions No. 1,660 and No. 1,903. |
For depreciation of all other property, plant and equipment, the Controlled Company uses the straight-line method of depreciation and applies the annual depreciation rates disclosed in Exhibit A.
When assets are retired or otherwise disposed of, the cost and related accumulated depreciation are removed from the accounts, and any resulting gain or loss is reflected in the statement of income.
Capitalized foreign exchange loss is depreciated over the remaining useful lives of the assets that led to such capitalization.
| | • | | Financial expense capitalization: TGS capitalizes financial expense on long term construction projects. Financial expense capitalized was Ps. 10,409, Ps. 7,245 and Ps. 16,056 for the years ended December 31, 2014, 2013 and 2012, respectively. |
Based on the estimates made as discussed in Note 2.a) and b) the TGS’s management believes that the recorded value of property, plant and equipment does not exceed its recoverable value.
| j) | Other current and non-current investments |
Consist on the balance of the loan granted to Pampa Energía (note 10). It was initially measured at fair value and have been valued based on the best estimate of the discounted value of the amounts expected to be collected using the interest rate effective at the time of the initial measurement. This interest rat did not differ form the market interest rate at that moment.
Private bonds received as a consequence of the conclution of the MetroGAS bankrupcy proccess were measured at fair value.
| k) | Derivative Financial Instruments |
Derivative financial instruments have been value at fair value at reporting period. The fair value is determined as the effective amounts to be collected or paid to cancel the instrument.
Even though the management enter into these derivative financial instrument to hedge its exposure to currency fluctuation. As of the date of the issuance of these financial statements, in accordance with TR No. 18, the Company has not applied hedge accounting in any of its outstanding derivative financial instruments. As a consequence, changes in the measurement of derivative financial instruments, are recognized in the Statement of Income within “Net financial expenses.”
F-90
COMPAÑÍA DE INVERSIONES DE ENERGÍA S.A.
NOTES TO THE CONSOLIDATED FINANCIAL STATEMENTS
AS OF DECEMBER 31, 2014, 2013 AND 2012
(Amounts stated in thousands of Argentine pesos as described in Note 2.b,
except for per share and per ADS amounts in Argentine pesos or unless otherwise indicated)
The Company and its subsidiary have calculated their respective income tax charges using the deferred tax method, which considers the effect of temporary differences between the financial statement carrying amounts of existing assets and liabilities and their respective tax bases.
To estimate deferred tax assets and liabilities, the tax rate expected to be in effect at the time of utilization was applied to identify temporary differences based on the legal requirements effective at the date of preparation of these consolidated financial statements.
The reconciliation between the current tax an the income tax expense charged to the statement of income in the years ended December 31, 2014, 2013 and 2012 is as follows:
| | | | | | | | | | | | |
| | | 2014 | | | 2013 | | | 2012 | |
Current tax | | | (78,659 | ) | | | (95,493 | ) | | | (231,604 | ) |
Temporary differences variation | | | (14,001 | ) | | | 698 | | | | 13,410 | |
Tax loss carryforwards | | | 20,887 | | | | 12,222 | | | | (234,284 | ) |
Allowance for deferred tax assets (Exhibit E) | | | (20,887 | ) | | | (10,675 | ) | | | — | |
| | | | | | | | | | | | |
Income tax expense | | | (92,660 | ) | | | (93,248 | ) | | | (452,478 | ) |
| | | | | | | | | | | | |
The components of the net deferred tax assets and liabilities as of December 31, 2014, 2013 and 2012 are the following:
| | | | | | | | | | | | |
Non-current deferred tax assets and liabilities | | 2014 | | | 2013 | | | 2012 | |
Allowance for doubtful accounts | | | 1,218 | | | | 1,218 | | | | 1,219 | |
Deferred revenues | | | 46 | | | | (95 | ) | | | (237 | ) |
Tax credits discounted value loss | | | — | | | | — | | | | 10,950 | |
Account receivables discounted value | | | 8,762 | | | | 12,028 | | | | 3,568 | |
Loans | | | (6,376 | ) | | | (546 | ) | | | (872 | ) |
Property, plant and equipment, net | | | (91,236 | ) | | | (93,745 | ) | | | (95,135 | ) |
Other provisions | | | 3,946 | | | | 3,946 | | | | 3,946 | |
Provision for contingencies | | | 49,974 | | | | 51,679 | | | | 49,371 | |
Current investments | | | (8,659 | ) | | | (1,842 | ) | | | (111 | ) |
Present value loans | | | (1,543 | ) | | | (2,510 | ) | | | (3,264 | ) |
Income tax loss carryforward | | | 33,429 | | | | 10,675 | | | | — | |
Allowance for income tax loss carryforward | | | (33,429 | ) | | | (10,675 | ) | | | — | |
| | | | | | | | | | | | |
Net deferred tax liability(Notes 4.d. and 4.l.) | | | (43,868 | ) | | | (29,867 | ) (1) | | | (30,565 | ) |
| | | | | | | | | | | | |
| (1) | Net of deferred tax asset of Ps. 69 recorded under Other non-current receivables as of December 31, 2013. |
Income tax expense computed at the statutory tax rate on pre-tax income differs from the income tax expense for the years ended December 31, 2014, 2013 and 2012 as follows:
| | | | | | | | | | | | |
| | | 2014 | | | 2013 | | | 2012 | |
Pre-tax income | | | 101,465 | | | | 138,484 | | | | 1,123,227 | |
Statutory income tax rate | | | 35 | % | | | 35 | % | | | 35 | % |
Pre-tax income at statutory income tax rate | | | (35,513 | ) | | | (48,469 | ) | | | (393,129 | ) |
Permanent differences at statutory income tax rate: | | | | | | | | | | | | |
- Inflation adjustment | | | (29,331 | ) | | | (29,668 | ) | | | (30,505 | ) |
- Variation in deferred tax assets allowance | | | (20,887 | ) | | | (10,675 | ) | | | — | |
- Non-taxable income / (loss) or non-deductible expenses | | | 1,048 | | | | (174 | ) | | | (28,024 | ) |
- Others | | | (7,977 | ) | | | (4,262 | ) | | | (820 | ) |
| | | | | | | | | | | | |
Income tax expense | | | (92,660 | ) | | | (93,248 | ) | | | (452,478 | ) |
| | | | | | | | | | | | |
F-91
COMPAÑÍA DE INVERSIONES DE ENERGÍA S.A.
NOTES TO THE CONSOLIDATED FINANCIAL STATEMENTS
AS OF DECEMBER 31, 2014, 2013 AND 2012
(Amounts stated in thousands of Argentine pesos as described in Note 2.b,
except for per share and per ADS amounts in Argentine pesos or unless otherwise indicated)
Within the framework of Resolution No. 312/05 from the FACPCE, the net book value of the inflation adjustment included in the accounting value of the property, plant and equipment is a temporary difference and thus, the deferred tax liability is required to be recorded. However, said resolution permits companies to disclose the deferred tax liability in the notes to the financial statements instead of recording it. TGS had elected to disclose the deferred tax liability in notes to the consolidated financial statements. This deferred tax liability does not constitute an account payable, but it is a liability that will be reversed over the remaining period over which these assets are depreciated. In compliance with the resolution mentioned above, CIESA advises that, if that liability had been recognized, the deferred tax liability as of December 31, 2014, would have increased by Ps. 474,746 (generating a net liability position of Ps. 518,614) and a positive effect of Ps. 14,959, Ps. 15,131 and Ps.15,557 on the Company’s net (loss) / income for the years ended December 31, 2014, 2013 and 2012, respectively, would have been recognized. Additionally, in the subsequent years, TGS would have recorded a lower income tax expenses as follows:
| | | | |
| | | Amount | |
Year 2015 | | | 14,846 | |
Year 2016 | | | 12,046 | |
Year 2017 | | | 11,692 | |
Year 2018 onwards | | | 203,536 | |
| | | | |
Total | | | 242,120 | |
| | | | |
CIESA’s accumulated tax loss carryforwards that are available to offset future taxable income are the following:
| | | | | | | | |
Description | | Amount | | | Year of expiration | |
Tax loss carryforward 2013 | | | 35,834 | | | | 2018 | |
Tax loss carryforward 2014 (estimated) | | | 59,677 | | | | 2019 | |
| | | | | | | | |
Accumulated tax loss carryforward | | | 95,511 | | | | | |
| | | | | | | | |
The ultimate realization of deferred tax assets is dependent upon the generation of future taxable income during the years in which those temporary differences become recoverable. Management considers the scheduled reversal of deferred tax liabilities, projected future taxable income and tax planning in making these assessments. This evaluation is based on internal projections made as discussed in Note 2.a). Based on current financial information, the Company is uncertain that it will recover its entire deferred tax assets through future taxable income. Accordingly, the Company has recognized a valuation allowance of Ps. 33,429 and Ps 10,675 against its deferred tax assets, as of December 31, 2014 and 2013, respectively.
The Company and its subsidiary are subject to the Asset Tax Law (“Impuesto a la Ganancia Mínima Presunta”). The asset tax is calculated on an individual entity basis at the statutory tax rate of 1%, and is based upon the taxable assets of each Argentine entity as of the end of the year. This tax is complementary to income tax and the Company is required to pay the greater of the income tax or the asset tax. Any excess of the asset tax over the income tax may be carried forward and recognized as a payment on account of any excess of income tax over asset tax occurring within the subsequent ten years.
Finally, regarding the asset tax for the fiscal year 2011, the Company estimated that it was equal zero. To perform this estimation, the significant tax loss carryforward and the decisions taken by the Supreme Court of Justice under the judicial decree “Hermitage” on June 15, 2010, lately ratified by the judicial decree issued on June 7, 2011 (“Tren de la Costa SA c/Estado Nacional”), were taken under consideration. In both judicial decrees, the Supreme Court declared the unconstitutional nature of the asset tax, because of under specific circunstancies, which are entirely applible to CIESA, the asset tax is confiscatory.
F-92
COMPAÑÍA DE INVERSIONES DE ENERGÍA S.A.
NOTES TO THE CONSOLIDATED FINANCIAL STATEMENTS
AS OF DECEMBER 31, 2014, 2013 AND 2012
(Amounts stated in thousands of Argentine pesos as described in Note 2.b,
except for per share and per ADS amounts in Argentine pesos or unless otherwise indicated)
As of December 31, 2014, 2013 and 2012, the Company has not recorded any provision in respect of the asset tax because the determined amounts do not exceed what has been estimated for the income tax.
| n) | Advances from customers |
Mainly consist of pre-payments for the transportation of natural gas services made by customers in order to finance pipeline expansion works. Advances from customers are recognized initially at their fair value. Subsequent to initial recognition, advances from customers are measured at their amortized cost which is higher than the cost of rendering the gas transportation services that will cancel said advances.
| o) | Allowances and provisions for contingencies |
The Company provides for losses relating to its accounts receivable. The allowance for losses is based on management’s evaluation of various factors, including the credit risk of customers, historical trends and other information. While management uses the information available to make evaluations, future adjustments to the allowance may be necessary if future economic conditions differ substantially from the assumptions used in making the evaluations. Management has considered all events and/or transactions that are subject to reasonable and normal methods of estimation, and the consolidated financial statements reflect that consideration.
The Company has certain contingent liabilities with respect to existing court or out-of-court claims, lawsuits and other proceedings, including those involving legal and regulatory matters. The Company records liabilities when it is probable that future costs will be incurred and such costs can be reasonably estimated. Such accruals are based on developments known by TGS at the date of the issuance of these consolidated financial statements, estimates of the outcome of these matters and the experience of its legal counsel in contesting, litigating and settling other matters. As the scope of the contingent liabilities become better defined, there will be changes in the estimates of future costs, which could have a material effect on the Company’s future results of operations and financial condition or liquidity.
Contingencies and allowances are disclosed in Exhibit E.
| p) | Shareholders’ equity accounts |
These accounts have been restated to account for the effects of inflation as described in Note 2.b). The adjustment derived from the restatement of such account has been capitalized (Note 8.a.).
Revenue is measured at the fair value of the consideration received or receivable, and represents amounts receivable for goods and/or services supplied. The Company recognizes revenue when the amount of revenue can be reliably measured; when it is probable that future economic benefits will flow to the entity; and when specific criteria have been met for each of the Company’s activities, as described below.
Tax on exports and turnover tax are disclosed as Selling Expenses.
Natural Gas transportation services includes: (i) firm natural gas transportation, whose revenues are recognized when the capacity is reserved and paid for regardless of actual usage by the customer and (ii) interruptible natural gas transportation whose revenues are recognized at the inception of the rendering of the service.
Liquids Production and Commercialization services includes: (i) Liquids production and commercialization for its own account and on behalf on third parties, whose revenues are recognized at the time of the delivery of the liquids to the customers, and (ii) Other Liquids services, which corresponds mainly to the receipt, storage and dispatch from facilities located in Puerto Galván, and whose sales revenues are recognized when the service is provided.
F-93
COMPAÑÍA DE INVERSIONES DE ENERGÍA S.A.
NOTES TO THE CONSOLIDATED FINANCIAL STATEMENTS
AS OF DECEMBER 31, 2014, 2013 AND 2012
(Amounts stated in thousands of Argentine pesos as described in Note 2.b,
except for per share and per ADS amounts in Argentine pesos or unless otherwise indicated)
Services from Other Services segment primarily consist of the treatment, removal of impurities and natural gas compression, as well as inspection and maintenance of pipelines and compressor plants and services of steam generation for electricity production. Revenues from telecommunications services provided through Telcosur are recognized when the service is provided.
| r) | Statement of income accounts |
Accounts relating to the statement of income have been recorded considering the following criteria:
| | • | | Accounts that accumulate monetary transactions, at their nominal value. |
| | • | | Expenses related to consumption of non-monetary assets have been charged to the statement of income considering the restated cost of such assets as described in Note 2.b). |
| | • | | Gain on related companies was determined on the basis of TGS’ affiliates’ results and were disclosed under “Gain on related companies”. |
Other expenses, net for the years ended December 31, 2014, 2013 and 2012 include the following items:
| | | | | | | | | | | | |
| | | 2014 | | | 2013 | | | 2012 | |
| | | (non-audited) | | | (non-audited) | | | | |
Net (increase) / decrease and doubtfull accounts in provisions for contingencies (Exhibit E) | | | (1,641 | ) | | | 16,916 | | | | (13,374 | ) |
Others | | | 6,255 | | | | (4,862 | ) | | | 2,764 | |
| | | | | | | | | | | | |
Total | | | 4,614 | | | | 12,054 | | | | (10,610 | ) |
| | | | | | | | | | | | |
Earnings and dividends per share for the years ended December 31, 2014, 2013 and 2012 have been calculated based on 638,818,696 outstanding shares during each year. As the Company does not have preferred stock or convertible debt, the amount of basic earnings per share is the same as the amount of diluted earnings per share.
| 3. | CONSOLIDATED BUSINESS SEGMENT INFORMATION |
TGS’s business segments are as follows: (i) natural gas transportation services through its pipeline system; (ii) production and commercialization of liquids and (iii) other services and (iv) telecommunications.
Operating income consists of net revenues minus operating expenses. In the calculation of operating income, the following items have not been included: other expenses, net, gain on related companies, net financial results and income tax expense.
Assets and liabilities were allocated to each segment based on the specific identification of the assets and liabilities related to the specific business. Assets and liabilities that cannot be allocated to a specific segment were grouped under “Corporate” and include current investments and loans, among others.
F-94
COMPAÑÍA DE INVERSIONES DE ENERGÍA S.A.
NOTES TO THE CONSOLIDATED FINANCIAL STATEMENTS
AS OF DECEMBER 31, 2014, 2013 AND 2012
(Amounts stated in thousands of Argentine pesos as described in Note 2.b,
except for per share and per ADS amounts in Argentine pesos or unless otherwise indicated)
| | | | | | | | | | | | | | | | | | | | | | | | |
| | | Natural Gas
Transportation | | | Production and
Commercialization
of Liquids | | | Other
Services | | | Telecommunications | | | Corporate | | | Total | |
Year ended December 31, 2014 | | | | | | | | | | | | | | | | | | | | | | | | |
Net revenues | | | 744,089 | | | | 3,243,299 | | | | 256,716 | | | | 59,867 | | | | — | | | | 4,303,971 | |
Operating (loss) / income | | | (41,253 | ) | | | 809,672 | | | | 125,597 | | | | 32,226 | | | | (2,837 | ) | | | 923,405 | |
Depreciation of property, plant and equipment | | | 190,876 | | | | 48,112 | | | | 16,674 | | | | — | | | | — | | | | 255,662 | |
Identifiable assets | | | 5,078,245 | | | | 739,076 | | | | 314,616 | | | | 51,264 | | | | 275,161 | | | | 6,458,362 | |
Identifiable liabilities | | | 3,062,281 | | | | 577,090 | | | | 174,787 | | | | 21,046 | | | | 238,288 | | | | 4,073,492 | |
Year ended December 31, 2013 | | | | | | | | | | | | | | | | | | | | | | | | |
Net revenues | | | 661,023 | | | | 2,065,321 | | | | 109,153 | | | | 29,489 | | | | — | | | | 2,864,986 | |
Operating income / (loss) | | | 14,883 | | | | 649,030 | | | | 19,964 | | | | 10,701 | | | | (2,399 | ) | | | 692,179 | |
Depreciation of property, plant and equipment | | | (179,646 | ) | | | (47,039 | ) | | | (16,232 | ) | | | — | | | | — | | | | (242,917 | ) |
Identifiable assets | | | 4,984,194 | | | | 783,159 | | | | 287,265 | | | | 28,424 | | | | 129,116 | | | | 6,212,158 | |
Identifiable liabilities | | | 2,952,536 | | | | 443,611 | | | | 137,880 | | | | 13,012 | | | | 161,394 | | | | 3,708,433 | |
Year ended December 31, 2012 | | | | | | | | | | | | | | | | | | | | | | | | |
Net revenues | | | 603,355 | | | | 1,835,738 | | | | 109,409 | | | | 26,466 | | | | — | | | | 2,574,968 | |
Operating income / (loss) | | | 22,970 | | | | 648,407 | | | | 20,739 | | | | 9,651 | | | | (2,887 | ) | | | 704,654 | |
Depreciation of property, plant and equipment | | | 173,338 | | | | 44,918 | | | | 15,414 | | | | | | | | — | | | | 233,670 | |
Identifiable assets | | | 3,688,691 | | | | 678,749 | | | | 287,450 | | | | | | | | 949,319 | | | | 5,604,209 | |
Identifiable liabilities | | | 2,402,752 | | | | 416,637 | | | | 78,577 | | | | 10,647 | | | | 179,145 | | | | 3,087,758 | |
The Company renders services of natural gas transportation principally to gas distribution companies and Petrobras Argentina. Significant customers in terms of net revenues from gas transportation for the years ended December 31, 2014, 2013 and 2012 are as follows:
| | | | | | | | | | | | |
| | | 2014 | | | 2013 | | | 2012 | |
| | | (non-audited) | | | (non-audited) | | | | |
MetroGAS S.A. | | | 194,904 | | | | 183,724 | | | | 184,288 | |
Camuzzi Gas Pampeana S.A. | | | 108,668 | | | | 99,601 | | | | 98,062 | |
Gas Natural BAN S.A. (“BAN”) | | | 78,913 | | | | 70,614 | | | | 70,487 | |
Petrobras Argentina | | | 26,834 | | | | 31,698 | | | | 32,360 | |
Camuzzi Gas del Sur S.A. | | | 26,296 | | | | 23,934 | | | | 24,388 | |
Significant customers in the Production and Commercialization of Liquids segment are Petredec Limited (“Petredec”), Petrobras Global Trading BV (“Petrobras Global”), PBB-Polisur S.A. (“Polisur”) and Petroleo Brasileiro. Net revenues from these customers (include sales of liquids made on behalf of third parties, from which TGS withholds charges for the Production and Commercialization of Liquids) for the years ended December 31, 2014, 2013 and 2012 are as follows:
| | | | | | | | | | | | |
| | | 2014 | | | 2013 | | | 2012 | |
| | | (non-audited) | | | (non-audited) | | | | |
Polisur | | | 1,055,582 | | | | 735,380 | | | | 580,325 | |
Petredec | | | 944,233 | | | | 411,127 | | | | 342,757 | |
Trafigura Beheer B.V. Amsterdam (“Trafigura”) | | | — | | | | — | | | | 34,831 | |
Petroleo Brasileiro | | | 627,468 | | | | 343,150 | | | | 256,447 | |
Petrobras Global | | | — | | | | 373,791 | | | | 487,314 | |
F-95
COMPAÑÍA DE INVERSIONES DE ENERGÍA S.A.
NOTES TO THE CONSOLIDATED FINANCIAL STATEMENTS
AS OF DECEMBER 31, 2014, 2013 AND 2012
(Amounts stated in thousands of Argentine pesos as described in Note 2.b,
except for per share and per ADS amounts in Argentine pesos or unless otherwise indicated)
| 4. | SUMMARY OF SIGNIFICANT BALANCE SHEET ITEMS AS OF DECEMBER 31, 2014, 2013 AND 2012 |
| | | | | | | | | | | | | | |
| | | | | 2014 | | | 2013 | | | 2012 | |
| | | | | (non-audited) | | | (non-audited) | | | | |
a) | | Current accounts receivable, net | | | | | | | | | | | | |
| | Natural gas transportation | | | | | | | | | | | | |
| | Common | | | 108,235 | | | | 79,129 | | | | 135,488 | |
| | Related parties (Note 10) | | | 6,562 | | | | 3,335 | | | | 7,490 | |
| | | | | | | | | | | | | | |
| | Subtotal | | | 114,797 | | | | 82,464 | | | | 142,978 | |
| | | | | | | | | | | | | | |
| | Production and commercialization of liquids | | | | | | | | | | | | |
| | Common | | | 172,379 | | | | 241,900 | | | | 99,932 | |
| | Related parties (Note 10) | | | 33,211 | | | | 44,930 | | | | 140,658 | |
| | | | | | | | | | | | | | |
| | Subtotal | | | 205,590 | | | | 286,830 | | | | 240,590 | |
| | | | | | | | | | | | | | |
| | Other services | | | | | | | | | | | | |
| | Common | | | 73,935 | | | | 43,584 | | | | 42,004 | |
| | Related parties (Note 10) | | | 18,429 | | | | 9,826 | | | | 27,633 | |
| | Subtotal | | | 92,364 | | | | 53,410 | | | | 69,637 | |
| | | | | | | | | | | | | | |
| | Allowance for doubtful accounts | | | (1,389 | ) | | | (4,121 | ) | | | (4,124 | ) |
| | | | | | | | | | | | | | |
| | Total | | | 411,362 | | | | 418,583 | | | | 449,081 | |
| | | | | | | | | | | | | | |
b) | | Other current receivables | | | | | | | | | | | | |
| | Tax credits | | | 103,360 | | | | 29,111 | | | | 54,159 | |
| | Prepaid expenses | | | 14,008 | | | | 13,650 | | | | 11,217 | |
| | Advances to suppliers | | | 71,512 | | | | 59,503 | | | | 25,045 | |
| | Subsidies receivable | | | 50,527 | | | | 32,939 | | | | 21,560 | |
| | Credits to related parties | | | 3,118 | | | | — | | | | — | |
| | Derivative financial instruments | | | — | | | | 26,500 | | | | — | |
| | Guarantee deposits on derivative financial instruments | | | 7,433 | | | | — | | | | — | |
| | Others | | | 11,586 | | | | 30,490 | | | | 13,417 | |
| | | | | | | | | | | | | | |
| | Total | | | 261,544 | | | | 192,193 | | | | 125,398 | |
| | | | | | | | | | | | | | |
c) | | Non-current accounts receivable | | | | | | | | | | | | |
| | MetroGAS (1) | | | — | | | | — | | | | 27,176 | |
| | Gas trust fund | | | 47,157 | | | | 38,136 | | | | 45,580 | |
| | Profertil S.A. (“Profertil”) | | | — | | | | — | | | | 2,477 | |
| | Allowance for doubtful accounts (1) | | | — | | | | — | | | | (27,176 | ) |
| | | | | | | | | | | | | | |
| | Total | | | 47,157 | | | | 38,136 | | | | 48,057 | |
| | | | | | | | | | | | | | |
d) | | Other non-current receivables | | | | | | | | | | | | |
| | Deferred income tax (Note 2.l) | | | — | | | | 69 | | | | 67 | |
| | Easement expense to be recovered | | | 3,690 | | | | 3,690 | | | | 5,658 | |
| | Tax credits(2) | | | 48,124 | | | | 40,013 | | | | 41,163 | |
| | Others | | | 4,365 | | | | 4,126 | | | | 3,987 | |
| | | | | | | | | | | | | | |
| | Total | | | 56,179 | | | | 47,898 | | | | 50,875 | |
| | | | | | | | | | | | | | |
e) | | Other current investments | | | | | | | | | | | | |
| | Loans to related parties (Note 10) | | | 268,111 | | | | — | | | | — | |
| | | | | | | | | | | | | | |
| | Total | | | 268,111 | | | | — | | | | — | |
| | | | | | | | | | | | | | |
f) | | Other non-current investments | | | | | | | | | | | | |
| | Loans to related parties (Note 10) | | | — | | | | 194,154 | | | | — | |
| | Private bonds | | | 26,620 | | | | 19,155 | | | | — | |
| | | | | | | | | | | | | | |
| | Total | | | 26,620 | | | | 213,309 | | | | — | |
| | | | | | | | | | | | | | |
F-96
COMPAÑÍA DE INVERSIONES DE ENERGÍA S.A.
NOTES TO THE CONSOLIDATED FINANCIAL STATEMENTS
AS OF DECEMBER 31, 2014, 2013 AND 2012
(Amounts stated in thousands of Argentine pesos as described in Note 2.b,
except for per share and per ADS amounts in Argentine pesos or unless otherwise indicated)
| | | | | | | | | | | | | | |
g) | | Accounts payable | | | | | | | | | | | | |
| | Suppliers | | | 512,110 | | | | 310,001 | | | | 308,299 | |
| | Customers (credit balances) | | | 9,366 | | | | 48,032 | | | | 36,550 | |
| | Related companies | | | 38,304 | | | | 27,386 | | | | 18,907 | |
| | | | | | | | | | | | | | |
| | Total | | | 559,780 | | | | 385,419 | | | | 363,756 | |
| | | | | | | | | | | | | | |
h) | | Cu Current taxes payable | | | | | | | | | | | | |
| | Income tax (net of advances and others) | | | 25,911 | | | | 27,876 | | | | 88,526 | |
| | Turn over tax | | | 3,745 | | | | 3,332 | | | | — | |
| | Income tax | | | 6,490 | | | | 5,360 | | | | — | |
| | Tax on exports | | | 13,341 | | | | 34,539 | | | | 36,884 | |
| | Others | | | 20,593 | | | | 5,254 | | | | 8,101 | |
| | | | | | | | | | | | | | |
| | Total | | | 70,080 | | | | 76,361 | | | | 133,511 | |
| | | | | | | | | | | | | | |
i) | | Current advances from customers(3) | | | | | | | | | | | | |
| | Aluar Aluminio Argentino S.A.C.I. (“Aluar”) | | | 6,742 | | | | 6,742 | | | | 6,742 | |
| | Gas Trust | | | — | | | | 5,852 | | | | 6,578 | |
| | Total Austral S.A. (“Total Austral”) | | | 4,770 | | | | 4,770 | | | | 4,770 | |
| | YPF S.A. (“YPF”) | | | 2,262 | | | | — | | | | — | |
| | Pan American Sur S.A. (“PAS”) | | | 3,180 | | | | 3,180 | | | | 3,180 | |
| | Pan American Energy L.L.C. (“PAE”) | | | 2,182 | | | | — | | | | — | |
| | PBB Polisur S.A. (“Polisur”) | | | 2,187 | | | | — | | | | — | |
| | Others | | | 5,879 | | | | 4,800 | | | | 3,369 | |
| | | | | | | | | | | | | | |
| | Total | | | 27,202 | | | | 25,344 | | | | 24,639 | |
| | | | | | | | | | | | | | |
j) | | Other current liabilities | | | | | | | | | | | | |
| | Other provisions | | | 2,238 | | | | 1,644 | | | | 1,632 | |
| | Negative investement | | | — | | | | 801 | | | | — | |
| | Provision for compensation for Board of Directors and Supervisory Committee | | | 1,574 | | | | 1,077 | | | | 863 | |
| | | | | | | | | | | | | | |
| | Total | | | 3,812 | | | | 3,522 | | | | 2,495 | |
| | | | | | | | | | | | | | |
k) | | Non-current advances from customers(3) | | | | | | | | | | | | |
| | Aluar | | | 158,464 | | | | 165,206 | | | | 171,948 | |
| | Total Austral | | | 5,565 | | | | 10,335 | | | | 15,105 | |
| | YPF | | | 11,728 | | | | 13,498 | | | | 9,571 | |
| | PAE | | | 62,817 | | | | 64,821 | | | | — | |
| | PAS | | | 3,710 | | | | 6,890 | | | | 66,825 | |
| | Polisur | | | 132,917 | | | | 45,559 | | | | — | |
| | Otros | | | 5,148 | | | | 5,596 | | | | 16,113 | |
| | | | | | | | | | | | | | |
| | Total | | | 380,349 | | | | 311,905 | | | | 279,562 | |
| | | | | | | | | | | | | | |
l) | | Non-current taxes payable | | | | | | | | | | | | |
| | Deferred income tax (Note 2.l.) | | | 43,868 | | | | 29,936 | | | | 30,632 | |
| | | | | | | | | | | | | | |
| | Total | | | 43,868 | | | | 29,936 | | | | 30,632 | |
| | | | | | | | | | | | | | |
| (1) | Corresponds to the bills included in MetroGAS’ reorganization process. |
| (2) | As of December 31, 2014, 2013 and 2012, includes Ps. 44,977, Ps. 36,866 and Ps. 38,214 respectively, of income tax and VAT credits generated by the reversion of the tariff increase credit (see Note 7.a.), which will be collected through a tax recovery appeal. |
| (3) | These advances are mainly related to the financing of TGS pipeline system expansion works for the rendering of firm transportation services contracted by such clients. The main advance payments will be settled with the effective rendering of firm transportation service. |
F-97
COMPAÑÍA DE INVERSIONES DE ENERGÍA S.A.
NOTES TO THE CONSOLIDATED FINANCIAL STATEMENTS
AS OF DECEMBER 31, 2014, 2013 AND 2012
(Amounts stated in thousands of Argentine pesos as described in Note 2.b,
except for per share and per ADS amounts in Argentine pesos or unless otherwise indicated)
| 5. | SUPPLEMENTAL CASH FLOW INFORMATION |
For purposes of the consolidated statement of cash flows, the Company considers all highly liquid temporary investments with an original maturity of three months or less at the time of purchase to be cash equivalents. The cash flow statement has been prepared using the indirect method, which requires a series of adjustments to reconcile net (loss) / income for the period to net cash flows from operating activities.
Cash and cash equivalents at the end of the years ended December 31, 2014, 2013 and 2012 are as follows:
| | | | | | | | | | | | |
| | | 2014 | | | 2013 | | | 2012 | |
| | | (non-audited) | | | (non-audited) | | | | |
Cash and banks(1) | | | 352,097 | | | | 125,664 | | | | 97,100 | |
Current investments | | | 820,264 | | | | 1,119,686 | | | | 744,573 | |
Current investments with an original maturity of more than three months | | | (145,331 | ) | | | (251,734 | ) | | | (138,523 | ) |
| | | | | | | | | | | | |
Total cash and cash equivalents | | | 1,027,030 | | | | 993,616 | | | | 703,150 | |
| | | | | | | | | | | | |
| (1) | As of December 31, 2014, 2013 and 2012, includes Ps. 17,086, Ps. 79,937 and Ps. 57,617, respectively, corresponding to balances from bank accounts which accrue interes. |
Non-cash transactions are as follows:
| | | | | | | | | | | | |
| | | 2014 | | | 2013 | | | 2012 | |
| | | (non-audited) | | | (non-audited) | | | | |
Acquisition of property, plant and equipment through an increase in accounts payable | | | 44,159 | | | | 31,738 | | | | 15,836 | |
Interest capitalization | | | 10,409 | | | | 7,245 | | | | 5,923 | |
Short-term and long-term debt, net of issuance expenses as of December 31, 2014, 2013 and 2012 comprise the following:
| | | | | | | | | | | | |
| | | 2014 | | | 2013 | | | 2012 | |
| | | (non-audited) | | | (non-audited) | | | | |
Current loans: | | | | | | | | | | | | |
Promissory Notes | | | 212,587 | | | | — | | | | — | |
Interests payable | | | 28,494 | | | | 26,822 | | | | 17,923 | |
2007 EMTN Program: Series 1 notes(1) | | | 263,548 | | | | 608,823 | | | | — | |
Derivative financial instruments | | | 28,810 | | | | — | | | | — | |
Other loans | | | 19,720 | | | | 12,164 | | | | 4,477 | |
| | | | | | | | | | | | |
Total current loans | | | 553,159 | | | | 647,809 | | | | 22,400 | |
| | | | | | | | | | | | |
Non- current loans: | | | | | | | | | | | | |
Promissory Notes | | | — | | | | 155,474 | | | | 112,669 | |
2007 EMTN Program: Series 1 notes(1) | | | 527,096 | | | | 1,828,629 | | | | 1,836,395 | |
2014 EMTN Program: Series 1 notes(1) | | | 1,619,268 | | | | — | | | | — | |
Other loans | | | 14,041 | | | | 33,602 | | | | 15,556 | |
| | | | | | | | | | | | |
Total non-current loans | | | 2,160,405 | | | | 2,017,705 | | | | 1,964,620 | |
| | | | | | | | | | | | |
Total loans | | | 2,713,564 | | | | 2,665,514 | | | | 1,987,020 | |
| | | | | | | | | | | | |
F-98
COMPAÑÍA DE INVERSIONES DE ENERGÍA S.A.
NOTES TO THE CONSOLIDATED FINANCIAL STATEMENTS
AS OF DECEMBER 31, 2014, 2013 AND 2012
(Amounts stated in thousands of Argentine pesos as described in Note 2.b,
except for per share and per ADS amounts in Argentine pesos or unless otherwise indicated)
The breakdown of loans according to the currency is the following:
| | | | | | | | | | | | |
| | | 2014 | | | 2013 | | | 2012 | |
| | | (non-audited) | | | (non-audited) | | | | |
Argentine pesos | | | 33,761 | | | | 44,204 | | | | 17,544 | |
U.S. dollars | | | 2,679,803 | | | | 2,621,310 | | | | 1,969,476 | |
| | | | | | | | | | | | |
Total loans | | | 2,713,564 | | | | 2,665,514 | | | | 1,987,020 | |
| | | | | | | | | | | | |
CIESA Loans
Due to the Argentine macroeconomic situation, starting with the enactment of the Public Emergency Law and Reform of the Exchange Rate Regime N° 25,561, CIESA did not pay at maturity, in April 2002, either the principal and the last interest installment, their notes issued in 1997 for a nominal value of USD 200 million, or protection agreements interest rate variation associated (jointly with the notes, all this named the “Financial Debt”).
As of April 2004, the shareholders and creditors of financial CIESA held a series of agreements, which, among other actions, certain share in order to provide the necessary flexibility to advance the restructuring was planned transfers the Financial Debt.
On September 1, 2005, the Company, its shareholders and its creditors signed the Debt Restructuring Agreement. The said agreement indicates the issuance of debt and exchange of the Financial Debt for a nominal value of US$ 20,400,000 and its associated accrued unpaid interests through the promissory notes for a total amount of US$ 22,671,982 (the “New Debt”) which accrue interests at a 180 day LIBO rate plus 1% per annum, which cannot be higher than 5% annually. The interests are due on a semi-annual basis while the principal amortization will be due on September 1, 2015. According to the terms of the promissory notes, the Company capitalized the interests accrued between its date of issuance and March 1, 2008. In case the Company distributes dividends, the Company shall pay an early amortization amount equivalent to 5% of the dividends paid. The creditors of the New Debt are: Banco de la Nación Argentina S.A., BAPRO URUGUAY (the branch of the República Oriental del Uruguay of Banco de la Provincia de Buenos Aires S.A.), and Altieri Holdings Inc.
On May 18, 2011, the parties to the CIESA Restructuring Agreement entered into a fourth amendment of such agreement, which, among other things, provides for the replacement of AEI (the only financial creditor who is not a holder of the New Debt) by the Pampa Group in the CIESA Restructuring Agreement. On October 5, 2011, by note No.11,362, ENARGAS expressed no regulatory objections to the CIESA Restructuring Agreement and expressed that it may be effective after approval is obtained from the CNDC. At the date of issuance of these financial statements the CNDC authorization was not obtained even.
On July 13, 2012, Pampa and Petrobras Argentina Group entered into a settlement agreement (the “2012 Settlement Agreement”) waiving all cross-claims between Petrobras Argentina Group and AEI (and Pampa is its capacity as assignee to AEI) in the New York Litigation. Pursuant to the 2012 Settlement Agreement and as a relevant condition thereof, the above mentioned parties cancelled all of the CIESA Notes. As compensation for the cancellation of its notes, CIESA, among other payments agreed to (i) the transfer of 34,133,200 of our common stock (representing 4.2962% of our outstanding Class B Shares), to PISA; and (ii) once the pending governmental approval is obtained, the transfer of shares stock representing 40% of the capital stock in CIESA that is currently held in the Trust to PISA. Upon completion thereof, PISA will be the direct and indirect holder of 50% of the capital stock of CIESA.
To date the Company is currently evaluating several alternatives for the New Debt cancellation.
F-99
COMPAÑÍA DE INVERSIONES DE ENERGÍA S.A.
NOTES TO THE CONSOLIDATED FINANCIAL STATEMENTS
AS OF DECEMBER 31, 2014, 2013 AND 2012
(Amounts stated in thousands of Argentine pesos as described in Note 2.b,
except for per share and per ADS amounts in Argentine pesos or unless otherwise indicated)
Issuance of notes under the 2007 Global Program (the “2007 Program”):
The Extraordinary Shareholders’ meeting held on December 21, 2006 approved the creation of the Global Program for the issuance of new notes of a maximum aggregate amount of US$ 650,000,000 (The “2007 Global Program”) This Program was authorized by the CNV on January 18, 2007.
Accordingly, between May and June 2007, the Company refinanced its outstanding indebtedness through the issuance of US$500.0 million new notes (the “2007 Notes”), the early prepayment of its outstanding debt through an exchange offer, the cancellation of outstanding notes which did not participate in the exchange offer and cancellation of bank loans. The Company’s goal in issuing these notes was to improve the Company’s financial indebtedness profile and to ease the restrictions imposed by the prior debt restructured in 2004, including but not limited to dividend distribution, additional indebtedness and capital expenditures.
The 2007 Notes have a coupon rate of 7.875%, with interest being paid semiannually, and maturity date of May 2017. Principal on the 2007 Notes is to be paid in four equal annual installments beginning in May 2014 until maturity. The 2007 Notes are traded in theBolsa de Comercio de Buenos Aires (“BCBA”), theMercado Abierto Electrónico (“MAE”) and the Euro MTF of the Luxembourg Exchange.
Moreover, between August 2008 and August 2010, considering favorable conditions in the market, the Company reduced its financial indebtedness through the cancellation of a portion of the 2007 Notes for an aggregate amount of US$ 125,976,000, which had previously been purchased on the market at a lower price.
On January 10, 2014, TGS launched an offer to exchange its outstanding 2007 Notes for newly issued notes under the 2014 Global Program (the “2014 Global Program”), as it is described below. The period of acceptance of this offer expired on February 7, 2014. The percentage of acceptance received amounted to 67%. As a result of the exchange, a total US$ 123,283,000 of the 2007 Notes remained outstanding and thus, the amortization payments are expected to amount to US$ 30,820,750. After its first amortization in May 2014, as December 31, 2014, 2007 Notes amounted to US$ 92,462,250.
The fair value of the 2007 Notes is based on a discounted cash flow at an effective interest rate of 7.942%.
Covenants:
The 2007 Notes contain certain restrictive covenants that, among other things, limit the ability of the Company to (i) incur additional indebtedness, (ii) pay dividend, (iii) issue guarantees, (iv) dispose certain assets and (v) make certain related party transactions. The Company was in compliance with all covenants of the 2007 Notes as of the date of issuance of these financial statements.
The foregoing limitations are subject to exceptions as set forth in the Indenture. For example, the Company may incur in additional indebtedness as long as (i) after issuing it, the consolidated coverage ratio (calculated as the quotient of the consolidated adjusted EBITDA -earnings before financial results, income tax, depreciation and amortization-) and the consolidated interest expense) is equal or higher than 2.0:1; and (ii) the consolidated debt ratio (calculated as the quotient of the consolidated debt and the consolidated EBITDA) is equal or lower than 3.75:1; (ii) it is incurred to refinance outstanding debt and (iii) it is originated in advances from customers.
Additionally, the Company may pay dividends as long as (i) the Company is not in default under 2007 Notes, (ii) immediately after any dividend payment, the Company would be able to incur in additional indebtedness pursuant to item (i) and (ii) of the preceding paragraph.
F-100
COMPAÑÍA DE INVERSIONES DE ENERGÍA S.A.
NOTES TO THE CONSOLIDATED FINANCIAL STATEMENTS
AS OF DECEMBER 31, 2014, 2013 AND 2012
(Amounts stated in thousands of Argentine pesos as described in Note 2.b,
except for per share and per ADS amounts in Argentine pesos or unless otherwise indicated)
Issuance of notes under the 2014 Global Program (the “2014 Program”):
The 2014 Program provides for the issuance of up to a maximum principal amount of US$400 million in notes, and was authorized by resolutions of an Extraordinary Shareholders’ Meeting dated April 25, 2013, and by resolutions of its Board of Directors adopted on July 23, 2013 and December 23, 2013. The program was also authorized by the CNV on January 3, 2014, after the issuance of Resolution No. 17,262.
As it is mentioned above, on January 10, 2014 TGS launched an offer for a voluntary exchange. The exchange offer settled on February 7, 2014. TGS accepted 67% of the 2007 Notes. For this reason, on February 7, 2014, the Company issued its 2014 Notes in aggregate principal amount of US$255,451,506 under its 2014 Program. The main conditions of 2014 Notes are as follows:
| | | | |
| | | 2014 Notes |
Amount in US$ | | 255,451,506 |
Interest rate | | 9.625% anual |
| | |
| | | Scheduled payment date | | Percentage of
original principal
amount |
Amortization | | May 14, 2014 | | 25% |
| | May 14, 2018 | | 25% |
| | May 14, 2019 | | 25% |
| | May 14, 2020 | | 25% |
Frequency of Interest payment | | Semiannual, payable el May 14 and November 14 of each year. |
Guarantor | | None |
The 2014 Notes are traded in the BCBA, the MAE and the Euro MTF of the Luxembourg Exchange.
The terms and conditions of the 2014 Notes are similar to those applied to the 2007 Notes, having not changed financial covenants with respect to those effective for the 2007 Notes. According to the criteria established by TR 17, the exchange offer was not accounted for as an extinguishment of financial liabilities, and thus, the costs paid are amortized over the remaining life of the 2014 Notes.
The fair values are based on cash flows discounted at an effective rate of 10.126%.
| | a) | General framework and current tariff context: |
Regarding Company’s Natural Gas Transportation business, it is regulated by Law No. 24,076 (“the Natural Gas Act”), its regulatory Decree No. 1,738/92, other regulatory decrees, the Pliego de Bases y Condiciones para la Privatización de GdE, the transfer agreements and the licenses of the newly privatized companies establish the legal framework for the transportation and distribution of natural gas in Argentina. The Natural Gas Act created the Ente Nacional Regulador del Gas (“ENARGAS”), which is entitled, among other things, to set the basis for the calculation, monitoring and approval of tariffs. Previous the enactement of the Public Emergency Law, and cccording to the Regulatory Framework,
F-101
COMPAÑÍA DE INVERSIONES DE ENERGÍA S.A.
NOTES TO THE CONSOLIDATED FINANCIAL STATEMENTS
AS OF DECEMBER 31, 2014, 2013 AND 2012
(Amounts stated in thousands of Argentine pesos as described in Note 2.b,
except for per share and per ADS amounts in Argentine pesos or unless otherwise indicated)
transportation tariffs were to be calculated in US dollars and converted into Argentine pesos at the time the customer was billed using the exchange rate prevailing at the date of the billing. The basic natural gas transportation tariffs charged by TGS had been established at the time of the privatization of GdE and were to be adjusted, subject to prior authorization, in the following cases: (i) semi-annually to reflect changes in the US producer price index (“PPI”) and (ii) every five years according to efficiency and investment factors determined by ENARGAS. The “efficiency factor” is a reduction to the base tariff resulting from future efficiency programs while the “investment factor” increases the tariffs to compensate the licensees for future investments which are not repaid through tariffs. Also, subject to ENARGAS approval, tariffs were to be adjusted to reflect non-recurrent circumstances or tax changes, other than income tax.
The terms and conditions as described in the precedent paragraph in connection with tariff adjustments contemplated within the Regulatory Framework are no longer effective since the enactment of the Public Emergency Law in early 2002, which, among other provisions, eliminated tariff increases based on US dollar exchange rate fluctuations, foreign price indexes or any other indexing procedure and established a conversion rate of one peso to one US dollar for tariffs. The Public Emergency Law also granted the Executive Branch power to renegotiate contracts entered into with private utility companies, pursuant to the framework included in the said law as long as it is in force, which will expire in December 31, 2015, after several extensions.
In July 2003, the Unit for Renegotiation and Assessment of Utilities Contracts (“UNIREN”) was created under the joint jurisdiction of the Ministry of Economy and Production and the Ministry of Federal Planning, Public Investment and Services (“MPFIPyS”). UNIREN conducts the renegotiation process of the contracts related to utilities and public works, and is entitled to enter into total or partial agreements with the licensees and submit projects regulating the transitory adjustment of tariffs and prices, among other things.
In June and November 2005, TGS received two proposals from UNIREN. Said proposals provided for a tariff increase of 10%, an overall tariff review, and required TGS’s and its shareholders’ abandonment of any claim or lawsuit resulting from the effects of the Public Emergency Law on the License prior to the effectiveness of a renegotiation of the License, and also demanded TGS to hold the Argentine government harmless from any claim or lawsuit filed by its shareholders. Additionally, said proposals required TGS and its shareholders’ abandonment of any future claim or lawsuit regarding the PPI tariff adjustments which were not applied in 2000 and 2001. TGS responded to the proposals, and declared that the original 10% increase was insufficient and committed not to file any administrative, arbitration or judicial claim or lawsuit in Argentina or abroad, as long as a reasonable renegotiation agreement was reached. Moreover, TGS stated that the Company was determined to make its best efforts to obtain similar commitments from its investors.
In November 2005, in response to the requirement made by UNIREN, CIESA and Petrobras Argentina Holding (as CIESA’s shareholder) confirmed that they had not initiated or intended to initiate in the future any claim against the Argentine Republic. Furthermore, Ponderosa Assets L.P. (“Ponderosa”), as TGS and CIESA’s indirect shareholder at that time, informed on the existence of a claim which, jointly with Enron Corp., it initiated against the Argentine Republic before the International Center for the Settlement of Investment Disputes (“ICSID”) under the scope of the World Bank, and that it would only consider waiving its claim if Ponderosa has received fair compensation. In May 2007, the ICSID ordered the Argentine Government to pay US$ 106.2 million to Enron Corp. An ICSID committee annulled the award rendered in 2007 and ordered the American corporation to reimburse the Argentine Republic the total amount of the annulment award costs. This annulment does not prevent the plaintiff from filing a new claim before said tribunal. On October 18, 2010, Enron Creditors Recovery Corp. (Enron Corp’s new corporate name) and Ponderosa Assets filed a new claim against the Argentine Republic before the ICSID. In June 2011, the Tribunal that will hear the case was constituted.
F-102
COMPAÑÍA DE INVERSIONES DE ENERGÍA S.A.
NOTES TO THE CONSOLIDATED FINANCIAL STATEMENTS
AS OF DECEMBER 31, 2014, 2013 AND 2012
(Amounts stated in thousands of Argentine pesos as described in Note 2.b,
except for per share and per ADS amounts in Argentine pesos or unless otherwise indicated)
In October 2011, Pampa Energía acquired the rights to control, suspend and to abandon the legal actions of Ponderosa and Enron Creditors Recovery Corp against the Argentine government under the “Call Option Agreement” signed between Pampa Energía, Inversiones Argentina II and GEB Corp. on March 11, 2011. On January 12, 2015, by agreement of the disputing parties, the legal action of Enron Corp. and Ponderosa Assets LP held against the Argentine Republic before the ICSID was suspended until July 12, 2015.
On October 9, 2008, TGS signed a transitional agreement with UNIREN that contemplated a tariff increase of 20%, which is retroactively applicable to September 1, 2008 (the “Transitional Agrement”). According to this agreement, the funds generated by this tariff increase would be temporarily deposited in a trust fund until TGS needed them to carry out an investment plan for its pipeline system. Although the tariff increase has not been granted yet, we executed the investment plan called for under the 2008 Transitional Agreement using our own funds, and on September 6, 2011, ENARGAS determined that the works included in our investment plan were completed.
On December 3, 2009, the Executive Branch ratified the Transitional Agreement through the Presidential Decree No. 1,918/09. By means of this Decree, TGS will be able to bill the tariff increase to its clients as soon as ENARGAS publishes the new tariffs chart and sets the methodology to bill the retroactive effect. However, ENARGAS has not carried out these duties to date because of this delay, in August 2010, TGS requested ENARGAS authorization to issue the Tariff Chart including the 20% transitory tariff increase and the retroactive collection methodology, requesting the application of an interest rate in line with the established method of payment. ENARGAS responded to TGS that they had submitted the records and the tariff project to the Coordination and Management Control Under Secretariat (“SCyCG”), which is under the scope of the MPFIPyS, based on the Resolution No. 2000/2005 of the MPFIPyS.
On September 30, 2010, TGS filed anacción de amparo (a summary proceeding to guarantee constitutional rights) against ENARGAS and the SCyCG in order to obtain the implementation of the new tariff increase schedule. On October 25, 2010, ENARGAS and the SCyCG provided the information required by the Judge on October 19, 2010. On November 8, 2010 TGS was served notice of the judgment that upheld the injunction filed. Said judgment orders the SCyCG to return to ENARGAS -within a two-day period- the documents remitted by said body in connection with the Tariff Chart applicable to TGS under Decree No. 1,918/09; and orders ENARGAS -within two days following reception of said documents- to set the Tariff Chart and the retroactive collection methodology. ENARGAS and the SCyCG filed an appeal against the judgment that upheld theacción de amparo filed by TGS.
Moreover, on November 16, 2010, TGS received a proposal from UNIREN, which provides that in order to move forward with the renegotiation of the License within the scope and in the terms of the Emergency Law, see claims, appeals, or administrative or judicial action taken against the Federal Government in connection with or arising from the Renegotiation Process must be suspended. On November 18, 2010, TGS decided to authorize the suspension of theacción de amparo mentioned above for a twenty- working-day period automatically renewable at the expiration of said term (except that the Board before or at the expiration of each period decides not to renew it) in order to move forward with the renegotiation of the License Agreement. On December 28, 2010, TGS requested ENARGAS and the MPFIPyS the subscription of the suspension, and as of the date of the issuance of these consolidated financial statements, TGS has not received any favorable respond in this matter.
On April 5, 2011, the Second Chamber of the Court of Appeals in administrative federal matters in the City of Buenos Aires confirmed the sentence passed by the first instance judge, setting a 60 business day term for SCyCG to act according to the provisions of Resolution No. 2000/2005 and return to ENARGAS the documents remitted by ENARGAS in connection with the tariff increase schedule and for ENARGAS to decide, within a 60 business day term following receipt of said documents and verification of compliance with the provisions set forth in the 2008 Transitional Agreement, on the tariff adjustment and the transitional tariff schedule stipulated therein. ENARGAS filed an extraordinary appeal before the Court of Appeals, which was dismissed by the Court of Appeals on May 27, 2011. On June 14, 2011, ENARGAS filed an appeal before the Supreme Court of Justice requesting that the dismissal of the extraordinary appeal be vacated. On August 25, 2011, SCyCG returned to ENARGAS the administrative documents giving notice under Resolution No. 2000/2005. On June 11, 2012 the Supreme Court of
F-103
COMPAÑÍA DE INVERSIONES DE ENERGÍA S.A.
NOTES TO THE CONSOLIDATED FINANCIAL STATEMENTS
AS OF DECEMBER 31, 2014, 2013 AND 2012
(Amounts stated in thousands of Argentine pesos as described in Note 2.b,
except for per share and per ADS amounts in Argentine pesos or unless otherwise indicated)
Justice requested the files of the main proceedings in order to solve the appeal filed by ENARGAS, and thereby TGS recorded the fulfillment of the court action by the SCyCG. On November 28, 2013, the Supreme Court of Justice of the Argentine Republic dismissed the appeal requesting that the dismissal of the extraordinary appeal be vacated. This decision made by the Supreme Court of Justice is a final ruling on the subject.
According to the 2008 transitional agreement, TGS should reach an agreement with UNIREN on the terms and conditions of the overall renegotiation before the expiration date under the Public Emergency Law, on December 31, 2015. If TGS does not reach this agreement, then UNIREN would inform the Executive Branch and provide it with the recommendations of the procedural steps to follow.
In this regard, in October 2008, TGS received an integral license renegotiation agreement from UNIREN (which includes the initial 20% tariff increase), whose purpose is the license renegotiation and the overall tariff revision. In October 2011, TGS received a new proposal from UNIREN which included similar terms and conditions from the ones included in the last proposal received in 2008. This proposal was accepted by TGS allowing UNIREN to initiate the administrative process for signature when it concluded favorably after the intervention of different competent organisms. UNIREN issued a supplementary report for the subscription of the renegotiation agreement between the Argentine Government and TGS, filing it on December 22, 2011 together with the Agreement filed by TGS before the Legal Under Secretary of the MPFIPyS. Taking into consideration that the case was returned to UNIREN, on July 16, 2012 TGS called for the continuation of appropriate administrative proceedings. On October 4, 2012, TGS notified the UNIREN the filing made before ENARGAS and theComisión Nacional de Defensa de la Competencia (“CNDC”) regarding the suspension of the claim initiated by Enron Corp. and Ponderosa against the Argentine Republic mentioned above – the last was until July 12, 2015-, and formally required the order of quick sentence.
Under the framework of the 2008 Transitional Agreement, the ENARGAS issued Resolution No. I-2852 on April 7, 2014, containing the new rate schedules authorizing an increase to the rate applicable to the natural gas firm and interruptible transportation rates. The new rate schedules establish only a progressive 8% increase as from April 1, 2014, an accumulated 14% increase as from June 1, 2014 and an accumulated 20% increase as from August 1, 2014. The tariff increase is exiguous given the increase in operating costs suffered.
The funds generated by this tariff increase would be temporarily deposited in a trust fund for the payment of maintenance works in the pipeline system in order to guarantee the quality of the rendering of natural gas in accordance with the guidelines established in the Natural Gas Industry Regulatory Framework, according to an investment plan submitted by TGS and previously approved by the ENARGAS.
The publication of the new rate schedules partially implements the 2008 Transitional Agreement. The 2008 Transitional Agreement establishes that the tariff increase is effective retroactively starting September 1, 2008. TGS filed a motion for reconsideration before ENARGAS due to the omission regarding the methodology to recover the increase that should have been effective as from September 1, 2008 to March 31, 2014 following the provisions of the 2008 Transitional Agreement. Having spent in excess deadlines for the determination of the appeal by the ENARGAS, TGS considered denied its request, and asked the regulatory agency the transfer of the proceedings to the Secretary of Energy to focus on the analysis of the appellate subsidiary interposed in the motion for reconsideration form. Also, to cover the eventual refusal to that request, TGS filed a preliminary administrative appeal under the terms of art. 30 of the National Administrative Procedures Act to the Argentina Government claiming damages for the failure to implement the retroactive increase provisions of the 2008 Transitional Agreement for the period between September 1, 2008 and March 31, 2014.
On the other hand, with respect to the execution process corresponding to the appeal initiated In September 2010 we filed anacción de amparo against ENARGAS and SCyCG asking for implementation of the new tariff increase schedule. On September 19, 2014, the judge of the First Instance rejected TGS’ request that ENARGAS publish the tariff scheduled, alleging that after the
F-104
COMPAÑÍA DE INVERSIONES DE ENERGÍA S.A.
NOTES TO THE CONSOLIDATED FINANCIAL STATEMENTS
AS OF DECEMBER 31, 2014, 2013 AND 2012
(Amounts stated in thousands of Argentine pesos as described in Note 2.b,
except for per share and per ADS amounts in Argentine pesos or unless otherwise indicated)
issuance of resolution I-2852, said organism has complied with the publication of the tariff schedule authorized in Decree No. 1,918/09. Therefore, on September 25, 2014 TGS filed an appeal before the national Chamber for Federal Administrative Law Disputes of the City of Buenos Aires. This appeal was dismissed on December 18, 2014. TGS is currently focused on a special appeal
As part of the negotiations with the UNIREN, TGS continues focusing on following the necessary steps aimed to sign the Integral License Renegotiation Agreement initialed by TGS in October 2011. The indemnity given corresponds to the arbitration action initiated by Enron Corp. and Ponderosa Assets against the National Government for the damages suffered by Public Emergency Law. Although the executive secretariat of the UNIREN ruled favorably regarding the terms reached in the agreement accepted by TGS and recommended the signature of the Ministers of Economy and Finance, National Planning, Infrastructure and Services, as of the date of the issuance of these condensed interim consolidated financial statements, it has been unable to materialize. Also, as it is mentioned above, the Company filed a preliminary administrative appeal under the terms of art. 30 of the National Administrative Procedures Act to the Argentina Government claiming damages for the failure to implement the retroactive increase provisions of the 2008 Transitional Agreement for the period between September 1, 2008 and March 31, 2014.
TGS continues the negotiations with the National Government for the adjustment of the Charge for Access and Use (“CAU”) which has been created through Presidential Decree No. 180/05 to compensate TGS for the operation and maintenance of the natural gas transportation assets, mainly pipeline expansions owned by the Gas Trusts.
The License establishes, among other restrictions, that TGS will not be allowed to assume CIESA’s obligations, or to grant loans, real guarantees or any other kind of favor to CIESA’s creditors.
| | b) | Regulatory Framework for non-regulated segments |
The Production and Commercialization of Liquids segment is subject to regulation by ENARGAS, and as it is provided in the Transfer Agreement, is organized as a separate business unit within TGS, keeping accounting information separately. However, over recent years, the Argentine Government enacted regulations which significantly impacted on it.
In April 2005, the Argentine Government enacted Law No. 26,020 which sets forth the regulatory framework for the industry and commercialization of LPG. Among other things, the Law No. 26,020 creates the framework through which the Federal Energy Bureau establishes regulations meant to cause LPG suppliers to guarantee sufficient supply of LPG in the domestic market at low prices. Law No. 26,020 creates a price regime pursuant to which the Federal Energy Bureau periodically publish reference prices for LPG sold in the local market. It also sets forth LPG volumes to be sold in the local market.
On September 19, 2008 the Federal Energy Bureau and LPG producers, among others, signed an agreement on the price stabilization of the LPG bottles whereby the industry players committed to a substantial reduction in the price of butane ten, twelve and fifteen kgs. bottles (the “Stabilization Agreement”), to support low-income consumers throughout the national territory, guarantying the supply of the product at a fixed price –below the market price- to the producers with a quota to each of them. This price reduction is partially offset by a subsidy paid by a trust fund created for that purpose. This trust fund receives the funds provided by the rise in the wellhead natural gas price which was authorized by the Argentine government.
The validity period was originally agreed until December 1, 2009. As from that date, there were several extensions of the agreement by means of annual amendments. The most recent amendment was signed on April 29, 2014 and was ratified through Resolution No. 532/2014 of the Federal Energy Bureau.
F-105
COMPAÑÍA DE INVERSIONES DE ENERGÍA S.A.
NOTES TO THE CONSOLIDATED FINANCIAL STATEMENTS
AS OF DECEMBER 31, 2014, 2013 AND 2012
(Amounts stated in thousands of Argentine pesos as described in Note 2.b,
except for per share and per ADS amounts in Argentine pesos or unless otherwise indicated)
Participation in the Stabilization Agreement implies that the Company produces and markets LPG volumes required by the Federal Energy Bureau at prices significantly below the market. This situation implies that fail to cover production costs thus providing a negative operating margin. Because of this situation, TGS is working with the Federal Energy Bureau in the review of the Stabilization Agreement and, eventually, analyzing its continuity in the participation in this program.
Since 2002, LPG and natural gasoline exports have been subject to a tax on exports which implied a define percentage depending on the FOB price. In May 2004, the effective tax rate for LPG exports was increased from 4.76% to 16.67%. On May 24, 2007, it was increased to 20%.
Since November 2007 and March 2008, the Ministry of Economy established a variable export tax regime for the natural gasoline and LPG, respectively. According to this regime, if the international price of the relevant LPG product, as notified daily by the Secretary of Energy, is under the reference price established for such product the minimum applicable effective export duty for such product will be 31.03%. On the other hand, in the extent international prices were higher than reference prices, the effective export duty will increase. Due to international prices, the average effective tax rate for 2014 was 33.7%, 32.8% and 31.5% for natural gasoline, propane and butane, respectively.
For this reason, given the current scenario of prices and costs for the Liquids Production and Commercialization segment, the Company will continue with the steps taken so far with the national authorities to allow safeguard the sustainability of the business, particularly with regard to the revision of the current tax regime hydrocarbon exports, and the establishment of a price policy for the purchase of natural gas that stimulates production to meet the needs of the domestic market.
Through Presidential Decree No. 2,067/08, the Executive Branch created a tariff charge to be paid by (i) the users of regulated services of transportation and / or distribution, (ii) natural gas consumers receiving natural gas directly from producers without making use of transportation systems or natural gas distribution, (iii) the natural gas processing companies in order to finance the import of natural gas. The tariff charge sets forth in the Decree finance the higher price of the natural gas imports required to compensate the injection of natural gas necessary to meet national requirements (the “natural gas processing tariff charge”).
The payment of the natural gas processing tariff charge was selectively subsidized from 2008 according to the destination of the natural gas. In November 2011, however, ENARGAS issued Resolution No. 1,982/11 and 1,991/11 (the “Gas Tariff Resolutions”) which modified the list of the subsidy beneficiaries, and thus, involved a cost increase for many of our clients and for us (for certain of our consumption for our own account). The natural gas processing tariff charge increased from Ps. 0.049 to Ps. 0.405 per cubic meter of natural gas effective from December 1, 2011, representing a significant increase in our variable costs of natural gas processing.
In order to avoid this damage, TGS appealed against the Presidential Decree and the Resolutions including National Government, ENARGAS and MPFIPyS as defendants. On July 10, 2012, TGS obtained from the Court of Appeals in administrative federal matters based in the Autonomous City of Buenos Aires, the issue of a preliminary injunction which provides that TGS is exempt from the billing and the payment of the tariff charge increase according to the Resolutions, pending the resolution of the claim.
Should this situation disclosed in Note 9.d was not resolved favorably; TGS could have in the future a significant impact on the results of operations. Notwithstanding this, the Management believes it has sufficient grounds to defend its position.
F-106
COMPAÑÍA DE INVERSIONES DE ENERGÍA S.A.
NOTES TO THE CONSOLIDATED FINANCIAL STATEMENTS
AS OF DECEMBER 31, 2014, 2013 AND 2012
(Amounts stated in thousands of Argentine pesos as described in Note 2.b,
except for per share and per ADS amounts in Argentine pesos or unless otherwise indicated)
| | c) | Expansion of the natural gas transportation system |
Since 2004, the natural gas transportation system expansion works have been carried out under the Gas Trust Fund Program framework, which was created through Executive Branch Decree No. 180/04 and Resolution No. 185/04 issued by the MPFIPyS, aimed at financing the expansion of the national natural gas transportation system in a manner different from that established in the License.
Under such framework, the MPFIPyS, the Federal Energy Bureau and the natural gas transportation companies, among others, signed in April 2006 a Letter of Intent to carry out the second expansion of the gas pipeline system. In December 2006, the gas trust fund contracts for the second expansion were signed, and TGS entered into an agreement under which the Company will manage the expansion project.
Expansion works initiated in 2006, which where planned in gradual stages, were executed with the aim to be financed by other gas trust funds, whose trustors are the gas producers and the shippers who subscribed the additional capacity. The works will be repaid with a new tariff charge that will be finally paid by the business and industrial users with firm transportation contracts, except for the distribution companies. In addition, TGS is in charge of the rendering of firm transportation services. For these services, TGS is paid a monthly Charge for Access and Use (“CAU”). As of December 31, 2012, the incremental transportation capacity was 314 MMcf/d after the works came into service.
In May 2011, TGS received Valores Representativos de Deuda (“debt securities”) from the trust fund, date of issue February 2010, which cancelled the account receivable of Ps. 48.1 million related to services rendered for the 247 MMcf/d expansion works. These debt securities amortize principal in 85 monthly, consecutive and equal installments and bear CER interest plus an 8% from their date of issue.
In October 2011, TGS, the Federal Energy Bureau and the trustee of the gas trust funds agreed the terms and conditions under which TGS will render the operation and maintenance services of the assets associated with the incremental transportation capacity of 378 MMcf/d.
Moreover, in October 2011 an amendment to the management agreement corresponding to the works initiated in 2006 was agreed in order to include management services associated with an expansion which will increase firm transportation capacity by 131 MMcf/d and its remuneration, which amounted to Ps. 37 million. Said agreement provided an advance payment equivalent to 20% of the total remuneration, and the remainder 80% through debt securities which amortize principal, in 96 monthly, consecutive and equal installments and bear CER plus a spread of 8% from their date of issue.
As of the date of the issuance of these consolidated financial statements, TGS received debt securities from the trust fund which cancelled the 90% of the mentioned advanced payment and the works that started operating. The principal of said debt securities amounted to Ps. 25.8 million (including accrued interest) as of December 31, 2014 and it is amortized in 96 monthly, consecutive and equal installments which bear CER plus a spread of 8% from their date of issue. The 10% remaining amount was cancelled in cash.
A substantial portion of the assets transferred by GdE has been defined as essential for the performance of the natural gas transportation service. Therefore, the Company is required to keep separated and maintain these assets, together with any future improvements, in accordance with certain standards defined in the License.
The Company may not, for any reason, dispose of, encumber, lease, sublease or loan essential assets nor use such assets for purposes other than the provision of the licensed service without ENARGAS´s the prior authorization. Any expansion or improvements that it makes to the gas pipeline system may only be encumbered to secure loans that have a term of more than one year to finance such extensions or improvements.
F-107
COMPAÑÍA DE INVERSIONES DE ENERGÍA S.A.
NOTES TO THE CONSOLIDATED FINANCIAL STATEMENTS
AS OF DECEMBER 31, 2014, 2013 AND 2012
(Amounts stated in thousands of Argentine pesos as described in Note 2.b,
except for per share and per ADS amounts in Argentine pesos or unless otherwise indicated)
Upon expiration of the License, the Company will be required to transfer to the Argentine government or its designee, the essential assets listed in an updated inventory as of the expiration date, free of any debt, encumbrances or attachments, receiving compensation equal to the lower of the following two amounts:
| | i) | the net book value of the essential assets determined on the basis of the price paid by the acquiring joint venture, and the original cost of subsequent investments carried in US dollars and adjusted by the PPI, net of accumulated depreciation according to the calculation rules to be determined by ENARGAS; or |
| | ii) | the net proceeds of a new competitive bidding. |
Once the period of the extension of the License expires, TGS will be entitled to participate in the New Bidding, and thus, it shall be entitled to:
| | (i) | that its bid in the New Bidding be computed at an equal and not lower price, than the appraisal value determined by an investment bank selected by ENARGAS, which represents the value of the business of providing the licensed service as it is driven by the Licensee at the valuation date, as a going concern and without regard to the debts; |
| | (ii) | to obtain the new License, without payment, in the event that any bid submitted in the new tender exceeds the appraised value; |
| | (iii) | to match the best bid submitted by third parties in the new Bidding, if it would be higher than its bid mentioned in (i), paying the difference between both values to obtain the new License; |
| | (iv) | if the Licensee has participated in the New Bidding but is unwilling to match the best bid made by a third party, to receive the Appraisal Value as compensation for the transfer of the Essential Assets to the new licensee, any excess paid by the third party shall remain for the grantor. |
| 8. | COMMON STOCK AND DIVIDENDS |
As of December 31, 2014, 2013 and 2012 CIESA’s common stock subscribed, paid and issued is as follow:
| | | | |
Classes of stock | | | |
Class “A1” | | | 162,898,767 | |
Class “A2” | | | 162,898,767 | |
Class “B1” | | | 156,510,581 | |
Class “B2” | | | 92,628,711 | |
Class “B3” | | | 63,881,870 | |
| | | | |
| | | 638,818,696 | |
| | | | |
| | b) | Limitation on the transfer of the Company’s shares |
The Bid Package for the privatization of GdE (the “Bid Package”) stipulates that prior authorization of ENARGAS shall be required in the following instances:
| | • | | Transfer of Class A common shares representing 51% of the common stock unless such transfer is made within companies belonging to the same economic group. |
F-108
COMPAÑÍA DE INVERSIONES DE ENERGÍA S.A.
NOTES TO THE CONSOLIDATED FINANCIAL STATEMENTS
AS OF DECEMBER 31, 2014, 2013 AND 2012
(Amounts stated in thousands of Argentine pesos as described in Note 2.b,
except for per share and per ADS amounts in Argentine pesos or unless otherwise indicated)
| | • | | When any shareholder of CIESA has qualified to buy CIESA’s stock due to the shareholders’ equity, guarantee and/or technical background of its parent company and the latter sells its shares on the first one to other shareholders, or the current management is discontinued. |
| | • | | Any other corporate action implying a reduction in ownership interest. |
| | c) | Limitation on the transfer of TGS’ shares |
TGS’sby-laws provide that prior approval of ENARGAS and the unanimous approval of CIESA’s shareholders, under agreements among them, must be obtained in order to transfer Class A shares (representing 51% of common stock). The Bid Package states that approval of ENARGAS will be granted, provided that:
| | • | | The sale covers 51% of common stock or, if the proposed transaction is not a sale, the transaction that reduces the shareholding will result in the acquisition of a shareholding of not less than 51% by another investment company; and |
| | • | | The applicant provides evidence to the effect that the transaction will not impair the operating quality of the licensed service. |
TGS’s shares are traded on the Bolsa de Comercio de Buenos Aires (“BCBA”) and in the form of the ADS (registered with the SEC and representing 5 shares each) on the New York Stock Exchange.
In addition, the By-laws provide for the issuance of Profit Sharing Vouchers, as defined in Article 230 of the Argentine Business Associations Law, which Vouchers entitle all regular employees to share in 0.25% of the Company’s net income for each year.
According to law No. 25,063, the dividends paid in cash or in kind, in excess of the tax profit, will be subject to a 35% withholding tax of the income tax, as sole and only payment.
Furthermore, TGS is subject to certain restrictions for the payment of dividends, which were contemplated in the outstanding debt agreements (Note 6 – “Covenants”).
| | d) | Restrictions on distribution of retained earnings |
Under current Argentine legal requirements and CNV standards, 5% of each fiscal year’s net income must be appropriated into a legal reserve, provided that there is no unappropriated retained deficit. In such case, the 5% should be calculated on any excess of the net income over the unappropriated retained deficit. This appropriation is legally binding until such reserve equals 20% of the amount which results from the sum of the “Common stock nominal value” and the balance of “Cumulative inflation adjustment to common stock.”
| 9. | LEGAL AND REGULATORY MATTERS |
| | a) | Exemption of the sales of liquids in Turnover Tax |
In the framework of the Tax Agreement subscribed by the Argentine Government and the Provinces in 1993, and as from the enactment of provincial Law No. 11,490, TGS required the Tax Bureau of the Province of Buenos Aires to exempt the sales of liquids from the turnover tax. In September 2003, the Tax Bureau of the Province of Buenos Aires, through Resolution No. 4,560/03, denied the exemption. In October 2003, the Company filed an administrative appeal with the Tax Court of the Province of Buenos Aires.
In February 2007, the Tax Court partially upheld TGS’s complaint. In its pronouncement, the Tax Court stated that ethane sales were within the scope of the turnover tax exemption but that neither propane nor butane sales qualified for the exemption in the domestic market, because they were not raw materials for an industrial process.
F-109
COMPAÑÍA DE INVERSIONES DE ENERGÍA S.A.
NOTES TO THE CONSOLIDATED FINANCIAL STATEMENTS
AS OF DECEMBER 31, 2014, 2013 AND 2012
(Amounts stated in thousands of Argentine pesos as described in Note 2.b,
except for per share and per ADS amounts in Argentine pesos or unless otherwise indicated)
TGS filed an appeal in May 2007 before the Province of Buenos Aires Court alleging that propane and butane sales might be utilized for other uses different from petrochemical industry. As of the date of the issuance of these consolidated financial statements, the Court has not issued any sentence.
On February 19, 2008, TGS was notified with a formal assessment notice of Ps. 3.6 million (not including interest) regarding the payment of the turnover tax corresponding to the period ranging from August 2003 to December 2004. On March 11, 2008, TGS filed a discharge within the Tax Bureau of the Province of Buenos Aires which was rejected and thus, the Company filed an appeal with the Tax Court of this province in January 2009. On November 23, 2013 the Tax Court partially upheld TGS’s complaint. As of the date of these Financial Statements, the final settlement is still pending.
On December 4, 2012, TGS was notified with a new formal assessment notice of Ps. 0.8 million regarding the payment of the turnover tax corresponding to the fiscal year 2006 related to the production of liquefied gas, butane, propane and natural gasoline. On December 26, 2012, the Company answered the charges alleging the statute of limitations of the taxes claimed for 2006 period. On April 10, 2013, the Agencia de Recaudación de la Provincia de Buenos Aires (“ARBA”) did not accepted the answer of charges sent by TGS. On May 2, 2013, TGS lodged an appeal against ARBA’s decision to the Tax Court. On September 3, 2014, TGS was informed of the unfavorable sentence issued by the Tax Court. Due to the administrative proceedings are finished, the Company presented in the Contentious-Administrative Court the statute of limitations allegation.
On April 13, 2013, TGS was notified with a new formal assessment notice of Ps. 2.7 million (not including interest) regarding the payment of the turnover tax corresponding to the period ranging from January 2007 to April 2008. On June 14, 2013, TGS was notified of the penalty resolution which was appealed on July 13, 2013 alleging the statute of limitations of fiscal year 2007.
As of December 31, 2014, 2013 and 2012, TGS maintains a provision of Ps. 21.1 million, Ps. 43.3 and Ps. 39.1 million, respectively.
| | b) | Turnover tax calculated on the natural gas price used by TGS as fuel to render its transportation services |
Province of Santa Cruz
In November 2002, the Tax Bureau of the province of Santa Cruz sent TGS a formal assessment notice for the payment of the turnover tax calculated on the natural gas price used by TGS as fuel to render its transportation services.
This assessment corresponds to the period from January 1998 to October 2002. In August 2005, TGS paid the amount claimed of Ps. 1.6 million (including interests until December 4, 2002) and started a tax recovery process, first exhausting all other procedural steps, with the Tax Bureau of the province and then initiating a proceeding in the Provincial Tax Court.
In November 2012, the Department of Revenue of the Province of Santa Cruz sent TGS a formal assessment notice for the payment of the turnover tax for the periods from January 2006 to November 2007 and from January 2008 to April 2011 by the amount of Ps. 5.9 million. In September 2013 TGS paid Ps. 6.8 million (including interest as of that date) and initiated the tax recovery process, which is pending.
F-110
COMPAÑÍA DE INVERSIONES DE ENERGÍA S.A.
NOTES TO THE CONSOLIDATED FINANCIAL STATEMENTS
AS OF DECEMBER 31, 2014, 2013 AND 2012
(Amounts stated in thousands of Argentine pesos as described in Note 2.b,
except for per share and per ADS amounts in Argentine pesos or unless otherwise indicated)
Province of Río Negro
In November 2005, TGS received a notice from the Tax Bureau of the province of Río Negro claiming the payment of Ps. 0.2 million, on the same grounds as those of the Province of Santa Cruz, for the period from January 1999 to May 2005. On February 1, 2008, TGS initiated a tax recovery process with the Tax Court of the province of Río Negro to obtain the refund of Ps. 0.5 million paid in November 2007. The tax recovery process was rejected on August 1, 2012. It was appealed by TGS. On September 30, 2014, TGS requested the open of the evidence stage, which as of the date of issuance of this consolidated financial statements is ongoing.
Province of Tierra del Fuego, Antártida Argentina e Islas del Atlántico Sur
In September 2008, the Tax Bureau of the province of Tierra del Fuego e Islas del Atlántico Sur sent TGS a formal assessment notice for the payment of Ps. 11.2 million corresponding to 2002-2007 period. Once all legal actions were lodged, in February 2013, TGS paid the amounts claimed, beginning the tax recovery process.
In November 2013, the Tax Bureau of the province of Tierra del Fuego e Islas del Atlántico Sur initiated new formal assessments for the periods August 2008 and March 2013 and April 2013 and June 2014 asking for the payment of Ps. 24.1 million and Ps. 12.7 million, respectively. For that reason, TGS initiated legal actions, which are pending.
As of December 31, 2014, 2013 and 2012, the Company recorded a provision of Ps. 120.8 million, Ps. 85,1 million and 84.5 million, respectively, in respect of this contingency under the line item “Provisions”, which amounts were determined in accordance with the estimations of tax and interests, that would be payable as of such date, in case this contingency turns out unfavorable for the Company.
The Company’s management believes that, in case the Company’s position fails and the turnover tax has to be paid, TGS has a right to recover it by a transportation tariff increase as set forth in the License.
| | c) | Action for annulment of ENARGAS Resolutions No. I-1,982/11 and No. I-1,991/11 (the “Resolutions”) |
Within the framework of a legal action against the Resolutions (for further information, see Note 16.b), on July 10, 2012, TGS obtained from the Court of Appeals in administrative federal matters based in the Autonomous City of Buenos Aires, the issue of a preliminary injunction, ordering the Executive Branch (the Federal Energy Bureau), ENARGAS and Nación Fideicomisos S.A., as collection agents, not to bill or intend to collect from TGS the charge with the amounts in compliance with the provisions set forth in both Resolutions and to continue the billing and collection of the amounts stated prior to the issuance of said Resolutions.
ENARGAS and the Argentine National Government appealed the granting of the injunction before the Court of Appeals in administrative federal matters to resolve the applicability and legal continuity of the preliminary injunction. On December 21, 2012, TGS expanded the grounds of demand and requested the case to be referred to the defendants. Since March 18, 2013, the legal proceedings are ongoing at ENARGAS and the Executive Branch, the bodies to which such proceedings were referred by the Court of Appeals for a prior intervention before the issuance of its ruling.
The violation of the constitutional principles that govern matter and annulment of administrative acts carried out to implement the Resolutions mentioned above, is substantially the fundamental issue raised by TGS in the legal action, because no tax burden may be enforceable without the prior existence of a law framed within the constitutional precepts, and created by the Legislative Branch by a special law. This has been the basis adopted by the presiding judge to issue the injunction mentioned. This decision was confirmed on April 7, 2014 by the relevant Court of Appeals, but only for a period of six months. Pursuant to the prevailing legislation, the precautionary injunctions issued against the National Government are renewable at the request of a party at its maturity. TGS requested and obtained a new preliminary injunction which will expire on March 30, 2015. Given this limited duration, TGS filed an appeal before the Supreme Court.
F-111
COMPAÑÍA DE INVERSIONES DE ENERGÍA S.A.
NOTES TO THE CONSOLIDATED FINANCIAL STATEMENTS
AS OF DECEMBER 31, 2014, 2013 AND 2012
(Amounts stated in thousands of Argentine pesos as described in Note 2.b,
except for per share and per ADS amounts in Argentine pesos or unless otherwise indicated)
Furthermore, TGS to broaden the basis for their demand after the enactment of Law No. 26,784 which amended Law No. 26,095 so as to include the natural gas processing tariff charge under the taxes whose creation was delegated to the Executive Branch by the National Congress, TGS has referred to the presiding judge confiscatory character that the tariff charge would have on its economic and financial condition of being in full force Resolutions that implement it.
TGS’s Management believes it has enough valid arguments to defend their position, and thus, the Company has not recorded the increase of the charge for natural gas consumptions from the date of obtaining the injunction until the date of the issuance of these consolidated financial statements. In the event this injunction had not been obtained, the impact of the Resolutions for the years ended December 31, 2014, taking into account the possibility of carryforward the charge to the sales price of the product, would have implied a net loss of Ps. 182.8 million and. Meanwhile, the accumulated impact on the retained earnings since obtaining the injunction would have involved a reduction effect of Ps. 372.2 million.
| | d) | Repetition action of VAT and income tax |
On October 9, 2008, TGS signed the 2008 Transitional Agreement with UNIREN that contemplated a tariff increase of 20%, which would be retroactively applicable to September 1, 2008. On December 3, 2009, the Executive Branch ratified this transitional agreement through the Presidential Decree No. 1,918/09. By means of this decree, TGS will be able to bill the tariff increase to its clients as soon as ENARGAS publishes the new tariffs schedule and sets the methodology to bill the retroactive effect. Finally, this administrative act did not become effective and therefore in September 2010 TGS filed an acción de amparo (a summary proceeding to guarantee constitutional rights). Due to the passing of time since the enactment of Decree No. 1918/09, on December 16, 2010 the Board of Directors of the Company resolved to discontinue the recognition of the tariff increase revenue and to reverse the credit provision of the tariff increase revenue already accrued in the year ended December 31, 2009. The reversal of the tariff increase does not imply any resignation to the Company´s right resulting from the Decree No. 1,918/09.
On May 24, 2013, TGS filed a tax recovery appeal with respect to the income tax and VAT credits generated by the reversal of the tariff increase credit mentioned above. After the omission to pass judgment on the claim within the three months of the filing of the tax recovery appeal, on October 9, 2013, TGS filed an appeal before the Federal Tax Bureau, which was not solved yet. As of the date of the issuance of these consolidated financial statements, the case is in evidence stage.
The total amount claimed by TGS amounted to Ps. 69.4 million plus compensatory interests. The outstanding balance of this credit has been valued at its amortized cost and it has been included in “Other non-current receivables.”
In addition to the matters discussed above, TGS is a party to certain lawsuits and administrative proceedings which involve taxation, labor claims, social security, administrative and others arising in the ordinary course of business. The Company’s Management and its legal advisors estimate that the outcome of these differences will not have significant adverse effects on the Company’s financial position or results of operations. As of December 31, 2014, 2013 and 2012 the total amount of these provision amounted Ps. 8.3 million, Ps. 9,7 million and Ps. 9.7 million, respectively.
TGS is subject to extensive environmental regulations in Argentina. TGS’ management believes that its current operations are in material compliance with applicable environmental requirements, as currently interpreted and enforced. TGS has not incurred in any material environmental liabilities as a result of its operations to date. As of December 31, 2014, 2013and 2012 the total amount of these provision amounted Ps. 0.1 million, Ps 1,6 million and Ps. 9.7 million, respectively.
F-112
COMPAÑÍA DE INVERSIONES DE ENERGÍA S.A.
NOTES TO THE CONSOLIDATED FINANCIAL STATEMENTS
AS OF DECEMBER 31, 2014, 2013 AND 2012
(Amounts stated in thousands of Argentine pesos as described in Note 2.b,
except for per share and per ADS amounts in Argentine pesos or unless otherwise indicated)
| | 10. | BALANCES AND TRANSACTIONS WITH RELATED COMPANIES |
Transactions with related parties are carried out in the ordinary course of business according to common practices. The terms of these transactions are comparable to those offered by or obtained from unaffiliated parties.
Technical Assistance Agreement
Petrobras Argentina is TGS’s technical operator, according to the approval of ENARGAS in June 2004, and subject to the terms and conditions of the Technical Assistance Agreement which provides that Petrobras Argentina is in charge of providing services related to the operation and maintenance of the natural gas transportation system and related facilities and equipment, to ensure that the performance of the system is in conformity with international standards and in compliance with certain environmental standards. For these services, the Company pays a monthly fee based on a percentage of the operating income of the Company. In October 2014, TGS and Petrobras Argentina approved the renewal of the Technical Assistance Agreement for a three-year term, beginning on December 28, 2014.
Commercial transactions
During 2014, TGS entered into certain agreements to transfer natural gas and richness to TGS with Petrolera Pampa S.A. and Petrobras Argentina. These agreements will expire in April and October 2015, respectively. The price, which is denominated in US dollars, is determined according to common practices.
Moreover, TGS, under certain agreements, processes the natural gas in Cerri Complex and commercializes the liquids, renders natural gas transportation services and other services to its related companies, mainly to Petroleo Brasileiro; Petrobras Global and Compañía Mega.
Financial transactions. Loan agreement with Pampa Energía.
On October 5, 2011, TGS granted a US$26 million loan to Pampa Energía. Proceeds from the loan were used by Pampa Energía to exercise the option contained in the “Call Option Agreement”. Additionally, to guarantee compliance with its obligations, Pampa Energy created a pledge on the rights that correspond to the arbitration actions of Ponderosa Assets LP and Enron Creditors Recovery Corp. against Argentine Government acquired upon exercise of the option mentioned above. For more information, see Note 16.a.
After several extensions of the maturity, on May 7, 2013, TGS´s Board of Directors approved the amendments of certain terms and conditions of the loan granted to Pampa Energía, among others:
| | i) | Extended the expiration date until October 6, 2014, with option of an automatic renewal for one additional period of one year. For this reason, the current expiration date is October 6, 2015. |
| | ii) | Previous to the expiration date, the loan must be paid or prepaid compulsorily by the assignment of rights and obligations to TGS of all assigned to Pampa Energía, mentioned in Note 16.a, Ponderosa Assets LP and Enron Creditors Recovery Corp against Argentina in the event that, on or before the due date: (a) the 20% effective increase on the tariff schedule has been granted to TGS, under the provisions of the Transitional Agreement approved by Presidential Decree No. 1918/09 or (b) it has been granted to TGS: (x) the tariff adjustment as provided by the Adjustment Agreement initialed by TGS approved by the Board of Directors Meeting held on October 5, 2011, or (y) any other compensatory arrangements implemented by any mechanism or system of tariff revision in the future to replace those currently in force under the Public Emergency Law with an equivalent economic effect on TGS. |
F-113
COMPAÑÍA DE INVERSIONES DE ENERGÍA S.A.
NOTES TO THE CONSOLIDATED FINANCIAL STATEMENTS
AS OF DECEMBER 31, 2014, 2013 AND 2012
(Amounts stated in thousands of Argentine pesos as described in Note 2.b,
except for per share and per ADS amounts in Argentine pesos or unless otherwise indicated)
| | iii) | The current interest rate is equivalent to 6.8% annual plus VAT. |
As of December 31, 2014, the loan granted to Pampa Energía was exposed in “Other non-current investments” However, as of December 31, 2013 and 2012, it was exposed in “Current investments”.
Balances and transactions with related parties
The detail of significant outstanding balances for transactions entered into by TGS and its related parties as of December 31, 2014, 2013 and 2012 is as follows:
| | | | | | | | | | | | | | | | | | | | | | | | |
| | | 2014 | | | 2013 | | | 2012 | |
Company | | Accounts
receivable | | | Accounts
payable | | | Accounts
receivable | | | Accounts
payable | | | Accounts
receivable | | | Accounts
payable | |
Affiliate which exercises joint control: | | | | | | | | | | | | | | | | | | | | | | | | |
Petrobras Argentina | | | 24,462 | | | | 29,421 | | | | 12,614 | | | | 25,176 | | | | 32,503 | | | | 18,907 | |
Petrobras Hispano Argentina | | | 3,118 | | | | — | | | | — | | | | — | | | | — | | | | — | |
Affiliate which exercises significant influence: | | | | | | | | | | | | | | | | | | | | | | | | |
Pampa Inversiones SA. | | | — | | | | 7,760 | | | | — | | | | — | | | | — | | | | — | |
Pampa Energía | | | 268,111 | | | | — | | | | 194,154 | | | | — | | | | 138,523 | | | | — | |
Affiliates with significant influence: | | | | | | | | | | | | | | | | | | | | | | | | |
Link | | | 278 | | | | — | | | | 223 | | | | — | | | | 184 | | | | — | |
EGS | | | — | | | | 2,993 | | | | — | | | | 2,210 | | | | — | | | | — | |
Other related companies: | | | | | | | | | | | | | | | | | | | | | | | | |
Petrobras Global | | | — | | | | — | | | | — | | | | — | | | | 89,835 | | | | — | |
Petroleo Brasileiro | | | 25,475 | | | | — | | | | 39,573 | | | | — | | | | 47,020 | | | | — | |
Petrolera Pampa | | | — | | | | 5,891 | | | | — | | | | — | | | | — | | | | — | |
Compañía Mega S.A. | | | 7,736 | | | | — | | | | 5,357 | | | | — | | | | 3,765 | | | | — | |
WEB S.A. | | | — | | | | — | | | | 382 | | | | — | | | | 2,010 | | | | — | |
| | | | | | | | | | | | | | | | | | | | | | | | |
Total | | | 329,180 | | | | 46,065 | | | | 252,303 | | | | 27,386 | | | | 313,840 | | | | 18,907 | |
| | | | | | | | | | | | | | | | | | | | | | | | |
F-114
COMPAÑÍA DE INVERSIONES DE ENERGÍA S.A.
NOTES TO THE CONSOLIDATED FINANCIAL STATEMENTS
AS OF DECEMBER 31, 2014, 2013 AND 2012
(Amounts stated in thousands of Argentine pesos as described in Note 2.b,
except for per share and per ADS amounts in Argentine pesos or unless otherwise indicated)
The detail of significant transactions with related parties for the years ended December 31, 2014, 2013 and 2012 is as follows:
Year ended December 31, 2014
| | | | | | | | | | | | | | | | | | | | | | | | |
| | | Revenues | | | Costs | | | Financial
Results | |
Company | | Natural Gas
Transportation | | | Production and
commercialization
of liquids | | | Other
services | | | Gas
purchase
and others | | | Compensation
for technical
assistance | | | Interests
earned | |
Affiliate which exercises joint control: | | | | | | | | | | | | | | | | | | | | | | | | |
Petrobras Argentina | | | 30,192 | | | | 5,826 | | | | 52,200 | | | | 153,378 | | | | 69,966 | | | | — | |
Affiliate which exercises significant influence: | | | | | | | | | | | | | | | | | | | | | | | | |
Pampa Energía | | | — | | | | — | | | | — | | | | — | | | | — | | | | 14,941 | |
Pampa Inversiones | | | — | | | | — | | | | — | | | | 7,760 | | | | — | | | | — | |
Affiliates with significant influence: | | | | | | | | | | | | | | | | | | | | | | | | |
Link | | | — | | | | — | | | | 2,637 | | | | — | | | | — | | | | — | |
EGS | | | — | | | | — | | | | 173 | | | | — | | | | — | | | | — | |
Other related companies: | | | | | | | | | | | | | | | | | | | | | | | | |
Compañía Mega S.A. | | | 856 | | | | 74,405 | | | | 30 | | | | — | | | | — | | | | — | |
Petroleo Brasileiro | | | — | | | | 627,468 | | | | — | | | | — | | | | — | | | | — | |
Petrobras Pampa | | | — | | | | — | | | | — | | | | 30,479 | | | | — | | | | — | |
| | | | | | | | | | | | | | | | | | | | | | | | |
Total | | | 31,048 | | | | 707,699 | | | | 55,040 | | | | 191,617 | | | | 69,966 | | | | 14,941 | |
| | | | | | | | | | | | | | | | | | | | | | | | |
Year ended December 31, 2013
| | | | | | | | | | | | | | | | | | | | | | | | | | | | |
| | | Revenues | | | Costs | | | Financial
Results | |
Company | | Natural Gas
Transportation | | | Production and
commercialization
of liquids | | | Other
services | | | Gas
purchase
and others | | | Compensation
for technical
assistance | | | Interests
loss | | | Interest
earned | |
Affiliate which exercises joint control: | | | | | | | | | | | | | | | | | | | | | | | | | | | | |
Petrobras Argentina | | | 31,698 | | | | — | | | | 34,924 | | | | 147,977 | | | | 52,953 | | | | — | | | | — | |
Affiliate which exercises significant influence: | | | | | | | | | | | | | | | | | | | | | | | | | | | | |
Pampa Energía | | | — | | | | — | | | | — | | | | — | | | | — | | | | 130 | | | | 7,608 | |
Affiliates with significant influence: | | | | | | | | | | | | | | | | | | | | | | | | | | | | |
Link | | | — | | | | — | | | | 1,995 | | | | — | | | | — | | | | — | | | | — | |
Other related companies: | | | | | | | | | | | | | | | | | | | | | | | | | | | | |
Compañía Mega S.A. | | | 764 | | | | 43,080 | | | | 30 | | | | — | | | | — | | | | — | | | | — | |
WEB S.A. | | | 3,080 | | | | — | | | | — | | | | — | | | | — | | | | — | | | | — | |
Petroleo Brasileiro | | | — | | | | 343,150 | | | | — | | | | — | | | | — | | | | — | | | | — | |
Petrobras Global | | | — | | | | 373,791 | | | | | | | | | | | | | | | | | | | | | |
| | | | | | | | | | | | | | | | | | | | | | | | | | | | |
Total | | | 35,542 | | | | 760,021 | | | | 36,949 | | | | 147,977 | | | | 52,953 | | | | 130 | | | | 7,608 | |
| | | | | | | | | | | | | | | | | | | | | | | | | | | | |
F-115
COMPAÑÍA DE INVERSIONES DE ENERGÍA S.A.
NOTES TO THE CONSOLIDATED FINANCIAL STATEMENTS
AS OF DECEMBER 31, 2014, 2013 AND 2012
(Amounts stated in thousands of Argentine pesos as described in Note 2.b,
except for per share and per ADS amounts in Argentine pesos or unless otherwise indicated)
Year ended December 31, 2012:
| | | | | | | | | | | | | | | | | | | | | | | | | | | | |
| | | Revenues | | | Costs | | | Financial
Results | |
Company | | Natural Gas
Transportation | | | Production and
commercialization
of liquids | | | Other
services | | | Gas
purchase
and others | | | Compensation
for technical
assistance | | | Interests
loss | | | Interest
earned | |
Affiliate which exercises joint control: | | | | | | | | | | | | | | | | | | | | | | | | | | | | |
Petrobras Argentina | | | 32,360 | | | | 22,846 | | | | 29,256 | | | | 71,255 | | | | 52,046 | | | | — | | | | — | |
Affiliate which exercises significant influence: | | | | | | | | | | | | | | | | | | | | | | | | | | | | |
Pampa Energía | | | — | | | | — | | | | — | | | | — | | | | — | | | | — | | | | 6,665 | |
Affiliates with significant influence: | | | | | | | | | | | | | | | | | | | | | | | | | | | | |
Link | | | — | | | | — | | | | 1,737 | | | | — | | | | — | | | | — | | | | — | |
EGS | | | — | | | | — | | | | 47 | | | | — | | | | — | | | | — | | | | — | |
Other related companies: | | | | | | | | | | | | | | | | | | | | | | | | | | | | |
Inversiones Argentina | | | — | | | | — | | | | — | | | | — | | | | — | | | | 123 | | | | — | |
Compañía Mega S.A. | | | 757 | | | | 32,434 | | | | 1,371 | | | | — | | | | — | | | | — | | | | — | |
WEB S.A. | | | 3,048 | | | | — | | | | — | | | | — | | | | — | | | | — | | | | — | |
Petroleo Brasileiro | | | — | | | | 256,447 | | | | — | | | | — | | | | — | | | | — | | | | — | |
Petrobras Global | | | — | | | | 487,314 | | | | — | | | | — | | | | | | | | | | | | | |
| | | | | | | | | | | | | | | | | | | | | | | | | | | | |
Total | | | 36,165 | | | | 799,041 | | | | 32,411 | | | | 71,255 | | | | 52,046 | | | | 123 | | | | 6,665 | |
| | | | | | | | | | | | | | | | | | | | | | | | | | | | |
| 11. | SUBSIDIARY AND AFFILIATES |
Telcosur:
The corporate purpose of Telcosur is to render telecommunication services. Telcosur was created to assure the optimal utilization of TGS’s telecommunication system. TGS’s equity interest in the company is 99.98% and the remaining 0.02% is held by Petrobras Energía Internacional S.A.
Link:
Link was created in February 2001, with the purpose of the operation of a natural gas transportation system, which links TGS’s natural gas transportation system with the Cruz del Sur S.A. pipeline. The connection pipeline extends from Buchanan, located in the high-pressure ring that surrounds the city of Buenos Aires, which is part of TGS’s pipeline system, to Punta Lara. TGS’s ownership interest in such company is 49% and Dinarel S.A. holds the remaining 51%.
TGU:
TGU is a company incorporated in Uruguay. This company rendered operation and maintenance services to Gasoducto Cruz del Sur S.A. and its contract terminated in 2010. TGS holds 49% of its common stock and Petrobras Argentina holds the remaining 51%.
F-116
COMPAÑÍA DE INVERSIONES DE ENERGÍA S.A.
NOTES TO THE CONSOLIDATED FINANCIAL STATEMENTS
AS OF DECEMBER 31, 2014, 2013 AND 2012
(Amounts stated in thousands of Argentine pesos as described in Note 2.b,
except for per share and per ADS amounts in Argentine pesos or unless otherwise indicated)
EGS:
In September 2003, EGS, a company registered in Argentina, was incorporated. The ownership is distributed between TGS (49%) and TGU (51%). EGS operates its own pipeline, which connects TGS’s main pipeline system in the Province of Santa Cruz with a delivery point on the border with Chile.
In October 2012, ENARGAS issued a resolution which authorizes EGS to transfer the connection pipeline and service offerings in operation to TGS. On December 17, 2013 the sale of all the fixed assets of EGS to TGS for an amount of US$ 350,000 was made.
The financial statements were authorized for issuance by the Board on February 3, 2015.
No subsequent events between the end of the fiscal year ended December 31, 2014 and the date of the issuance (authorization) of these consolidated financial statements have had a material effect on the financial position or the results of operations of the Company.
| 13. | SUMMARY OF SIGNIFICANT QUALITATIVE DIFFERENCES BETWEEN ARGENTINE GAAP AND US GAAP |
The consolidated financial statements of CIESA have been prepared in accordance with Argentine GAAP, which differs in certain significant respects from US GAAP. Such differences involve methods of measuring the amounts shown in the consolidated financial statements, as well as additional disclosures required by US GAAP and Regulation S-X of the SEC.
The following summary describes the principal measurement differences, other than inflation accounting, and disclosure differences, between Argentine GAAP and US GAAP as they relate to the Company.
a)Capitalization of interest costs
Under Argentine GAAP, the Company capitalizes financial costs comprising interest and exchange differences.
Under US GAAP, Accounting Standards Codification (“ASC”) 835, “Interest”, requires interest capitalization on eligible assets, which have a period of time to get them ready for their intended use. Capitalization of foreign exchange differences is not allowed.
This difference leads to lower depreciation charges under US GAAP.
b)Capitalization of foreign exchange differences
Under Argentine GAAP, the Company capitalized foreign exchange losses derived from the devaluation of the Argentine Peso as from January 6, 2002 to July 28, 2003. Capitalization of foreign exchange losses is not allowed under US GAAP.
This difference leads to lower depreciation charges under US GAAP.
c)Present value accounting of other tax receivables
Under Argentine GAAP, long term tax receivables and (except for deferred tax assets and liabilities) are measured based on their best estimate of the present value of amounts expected to be collected or paid, as applicable. Under US GAAP, present valuing or discounting of these tax assets is not permitted.
F-117
COMPAÑÍA DE INVERSIONES DE ENERGÍA S.A.
NOTES TO THE CONSOLIDATED FINANCIAL STATEMENTS
AS OF DECEMBER 31, 2014, 2013 AND 2012
(Amounts stated in thousands of Argentine pesos as described in Note 2.b,
except for per share and per ADS amounts in Argentine pesos or unless otherwise indicated)
This difference leads to lower financial expenses under US GAAP.
d)Present value accounting of accounts receivable
Under Argentine GAAP, certain receivables are measured based on their best possible estimate of the present value of amounts expected to be collected using an estimated rate at the time of the initial measurement.
Under US GAAP, as of December 31, 2012 areceivables arising from transactions with customers in the normal course of business, under customary trade terms not exceeding one year, are generally accounted for at their nominal value, including accrued interest, if applicable.
e)Accounting for current investments
Under Argentine GAAP, investments in mutual funds are measured at fair value. Unrealized gains and losses for changes in fair value are included in the statement of income in the period in which they are incurred.
Under US GAAP, in accordance with ASC 320 “Investments—Debt and Equity Securities”, these investments would be classified as available for sale. Available for sale investments are valued at fair value with unrealized changes in fair value recognized in other comprehensive income in the period in which they are incurred.
f)Non-current investments in unconsolidated affiliated companies
Under both Argentine GAAP and US GAAP, two investments in companies where the Company has significant influence but not control are accounted for under the equity method of accounting. However, under US GAAP, the Company would adjust the Argentine GAAP balances to US GAAP prior to equity account for the investments. Some of the principal differences relate to (i) the reversal of capitalized foreign exchange differences; (ii) the reversal of discounting of certain tax receivables and (iii) the recognition of deferred income taxes on the US GAAP adjustments.
g)Valuation of property, plant and equipment
The Company acquired its subsidiary TGS as result of the privatization of Gas del Estado assets, a state-owned company owned by the Argentine Government. The Company paid a portion of the purchase price of 70% of TGS’s shares through the surrender of bonds issued by the Argentine Government. Under both Argentine GAAP and US GAAP, the initial carrying value of TGS’s net assets was based on the purchase price paid for the shares. However, under Argentine GAAP, the Company based its computation of the purchase price of the shares on a value of the surrendered bonds established by the Argentine Government. On the contrary, under US GAAP, the Company based this computation on the fair value of those bonds, which was less than their established value. Therefore, the initial carrying value of TGS’s net assets determined under US GAAP was lower than that determined under Argentine GAAP. Accordingly, this difference gives raise to differences in depreciation expense.
In addition, under Argentine GAAP, the subsidiary capitalized certain cancellation costs of assumed commitments and other costs as intangible assets and amortized them under the straight-line basis until December, 31, 2005.
Under US GAAP, the Company would have followed APB 16 at the time of the acquisition and would have considered those costs as adjustments to the purchase price paid for the shares. Therefore, under US GAAP, these costs would have been assigned to the cost of the fixed assets transferred, thus reclassifying from these costs from intangible assets. These costs would have followed the depreciation pattern of the respective fixed assets where the costs would have been assigned.
F-118
COMPAÑÍA DE INVERSIONES DE ENERGÍA S.A.
NOTES TO THE CONSOLIDATED FINANCIAL STATEMENTS
AS OF DECEMBER 31, 2014, 2013 AND 2012
(Amounts stated in thousands of Argentine pesos as described in Note 2.b,
except for per share and per ADS amounts in Argentine pesos or unless otherwise indicated)
Therefore, the net effect of the US GAAP adjustment would be the reversal of the amortization expense of the intangible assets and the recognition of a higher depreciation expense for fixed assets.
Moreover, following the guidance in APB 16, as the Company acquired 70% of the stock of TGS, the fixed assets transferred would have valued at the price effectively paid for the 70%. The remaining 30% would have been valued at the historical cost of the assets as carried in Gas del Estado books adjusted for inflation in accordance with Argentine GAAP.
Since Gas del Estado did not maintain separate records for its gas transportation business including TGS, it was impossible to reconstruct historical cost. However, the Company believes that the fair value of the transferred assets recorded in its books was significantly lower than the Gas del Estado book values restated for inflation at the date of acquisition. Consequently, no adjustment would have been recorded for the valuation of fixed assets of TGS under US GAAP.
h)Effect of the US GAAP adjustments on the Deferred income tax and Minority Interest
All of the previous US GAAP differences would have a corresponding deferred income tax effect. Additionally, the amount of minority interest would have a corresponding adjustment for the effect of the foregoing US GAAP adjustments.
Ricardo I. Monge
Board of Directors’ Chairman
F-119
EXHIBIT A
COMPAÑÍA DE INVERSIONES DE ENERGÍA S.A.
CONSOLIDATED BALANCE SHEETS AS OF DECEMBER 31, 2014, 2013 AND 2012
PROPERTY, PLANT AND EQUIPMENT, NET
(In thousands of Argentine pesos as described in Note 2.b.)
| | | | | | | | | | | | | | | | | | | | | | | | | | | | | | | | | | | | | | | | | | | | | | | | | | | | | | | | |
| | | 2014 | | | 2013 | | | 2012 | |
| | | (non-audited) | | | (non-audited) | | | | |
| | | Cost | | | Depreciation | | | | | | | | | | | | | |
Main Account | | Beginning
of the year | | | Additions | | | Retirements | | | Transfers | | | End of
the year | | | Accumulated at
the beginning
of the year | | | Retirements | | | For the year | | | Rate % | | | Accumulated
at the end
of the year | | | Impairment | | | Net
book
value | | | Net
book value | | | Net
book
value | |
Pipelines | | | 3,612,277 | | | | — | | | | — | | | | 18,963 | | | | 3,631,240 | | | | 1,348,651 | | | | — | | | | 85,773 | | | | (1) 2.2 | | | | 1,434,424 | | | | — | | | | 2,196,816 | | | | 2,263,626 | | | | 2,320,786 | |
Compressor plants | | | 1,354,086 | | | | — | | | | — | | | | 81,998 | | | | 1,436,084 | | | | 762,272 | | | | — | | | | 71,983 | | | | (1) 3.3 to 25 | | | | 834,255 | | | | — | | | | 601,829 | | | | 591,814 | | | | 623,070 | |
Other industrial plants | | | 2,868 | | | | — | | | | — | | | | — | | | | 2,868 | | | | 358 | | | | — | | | | 98 | | | | (1) 3.3 | | | | 456 | | | | — | | | | 2,412 | | | | 2,510 | | | | 2,608 | |
Stations of regulation and/or measurement of pressure | | | 126,403 | | | | — | | | | — | | | | 2,825 | | | | 129,228 | | | | 77,640 | | | | — | | | | 5,166 | | | | (1) 4 | | | | 82,806 | | | | — | | | | 46,422 | | | | 48,763 | | | | 52,283 | |
Other technical installations | | | 28,342 | | | | — | | | | — | | | | 13 | | | | 28,355 | | | | 19,027 | | | | — | | | | 975 | | | | (1) 6.7 | | | | 20,002 | | | | — | | | | 8,353 | | | | 9,315 | | | | 10,323 | |
| | | | | | | | | | | | | | | | | | | | | | | | | | | | | | | | | | | | | | | | | | | | | | | | | | | | | | | | |
Subtotal assets related to gas transportation service | | | 5,123,976 | | | | — | | | | — | | | | 103,799 | | | | 5,227,775 | | | | 2,207,948 | | | | — | | | | 163,995 | | | | — | | | | 2,371,943 | | | | — | | | | 2,855,832 | | | | 2,916,028 | | | | 3,009,070 | |
Assets related to gas upstream service | | | 205,084 | | | | — | | | | — | | | | 689 | | | | 205,773 | | | | 103,669 | | | | — | | | | 7,998 | | | | 2.2 to 25 | | | | 111,667 | | | | — | | | | 94,106 | | | | 101,415 | | | | 102,419 | |
Assets related to liquids production and commercialization service | | | 677,111 | | | | — | | | | — | | | | 18,437 | | | | 695,548 | | | | 483,606 | | | | — | | | | 42,821 | | | | (1) 5.9 | | | | 526,427 | | | | — | | | | 169,121 | | | | 193,505 | | | | 206,644 | |
Lands | | | 6,279 | | | | — | | | | — | | | | — | | | | 6,279 | | | | — | | | | — | | | | — | | | | — | | | | — | | | | — | | | | 6,279 | | | | 6,279 | | | | 6,279 | |
Buildings and constructions | | | 184,665 | | | | — | | | | — | | | | 11,539 | | | | 196,204 | | | | 93,198 | | | | — | | | | 4,502 | | | | 2 | | | | 97,700 | | | | — | | | | 98,504 | | | | 91,467 | | | | 93,094 | |
Fittings and fixtures in buildings | | | 5,692 | | | | — | | | | — | | | | 28,283 | | | | 33,975 | | | | 3,539 | | | | — | | | | 780 | | | | 4 | | | | 4,319 | | | | — | | | | 29,656 | | | | 2,153 | | | | 2,450 | |
Machinery, equipment and tools | | | 43,036 | | | | 3,381 | | | | 253 | | | | 753 | | | | 46,917 | | | | 34,941 | | | | 253 | | | | 1,712 | | | | 6.7 to 20 | | | | 36,400 | | | | — | | | | 10,517 | | | | 8,095 | | | | 5,438 | |
Computers and telecommunication systems | | | 363,374 | | | | — | | | | — | | | | 26,405 | | | | 389,779 | | | | 264,435 | | | | — | | | | 21,916 | | | | 6.7 to 20 | | | | 286,351 | | | | — | | | | 103,428 | | | | 98,939 | | | | 101,603 | |
Vehicles | | | 28,122 | | | | 3,549 | | | | 607 | | | | — | | | | 31,064 | | | | 19,210 | | | | 607 | | | | 2,968 | | | | 10 and 20 | | | | 21,571 | | | | — | | | | 9,493 | | | | 8,912 | | | | 7,634 | |
Furniture | | | 13,147 | | | | — | | | | — | | | | — | | | | 13,147 | | | | 12,645 | | | | — | | | | 98 | | | | 10 | | | | 12,743 | | | | — | | | | 404 | | | | 502 | | | | 581 | |
Capitalization of foreign exchange loss (1) | | | 177,272 | | | | — | | | | — | | | | — | | | | 177,272 | | | | 91,233 | | | | — | | | | 8,872 | | | | (1) 4.2 | | | | 100,105 | | | | — | | | | 77,167 | | | | 86,039 | | | | 93,560 | |
Materials | | | 226,701 | | | | 112,846 | | | | 3,916 | | | | (48,954 | ) | | | 286,677 | | | | — | | | | — | | | | — | | | | — | | | | — | | | | — | | | | 286,677 | | | | 226,701 | | | | 176,850 | |
Line pack | | | 13,872 | | | | — | | | | — | | | | — | | | | 13,872 | | | | 1,618 | | | | — | | | | — | | | | — | | | | 1,618 | | | | — | | | | 12,254 | | | | 12,254 | | | | 12,254 | |
Works in progress | | | 224,751 | | | | 253,614 | | | | — | | | | (140,951 | ) | | | 337,414 | | | | — | | | | — | | | | — | | | | — | | | | — | | | | — | | | | 337,414 | | | | 224,751 | | | | 140,287 | |
Advances to suppliers of property, plant and equipment | | | 39,932 | | | | 25,219 | | | | — | | | | — | | | | 65,151 | | | | — | | | | — | | | | — | | | | — | | | | — | | | | — | | | | 65,151 | | | | 39,932 | | | | 42,356 | |
| | | | | | | | | | | | | | | | | | | | | | | | | | | | | | | | | | | | | | | | | | | | | | | | | | | | | | | | |
Total 2014 | | | 7,333,014 | | | | 398,609 | | | | 4,776 | | | | — | | | | 7,726,847 | | | | 3,316,042 | | | | 860 | | | | 255,662 | | | | | | | | 3,570,844 | | | | — | | | | 4,156,003 | | | | | | | | | |
| | | | | | | | | | | | | | | | | | | | | | | | | | | | | | | | | | | | | | | | | | | | | | | | | | | | | | | | |
Total 2013 | | | 7,073,889 | | | | 265,685 | | | | 6,560 | | | | — | | | | 7,333,014 | | | | 3,073,370 | | | | 245 | | | | 242,917 | | | | | | | | 3,316,042 | | | | — | | | | | | | | 4,016,972 | | | | | |
| | | | | | | | | | | | | | | | | | | | | | | | | | | | | | | | | | | | | | | | | | | | | | | | | | | | | | | | |
Total 2012 | | | 6,887,221 | | | | 224,329 | | | | 37,661 | | | | — | | | | 7,073,889 | | | | 2,855,065 | | | | 15,365 | | | | 233,670 | | | | | | | | 3,073,370 | | | | — | | | | | | | | | | | | 4,000,519 | |
| | | | | | | | | | | | | | | | | | | | | | | | | | | | | | | | | | | | | | | | | | | | | | | | | | | | | | | | |
F-120
EXHIBIT C
COMPAÑÍA DE INVERSIONES DE ENERGÍA S.A.
CONSOLIDATED BALANCE SHEETS AS OF DECEMBER 31, 2014, 2013 AND 2012
NON-CURRENT INVESTMENTS
(In thousands of Argentine pesos, as described in Note 2.b.)
| | | | | | | | | | | | | | | | | | | | | | | | | | | | | | | | | | | | | | | | | | | | | | |
| | | 2014 | | | 2013 | | | 2012 | |
| | | (non-audited) | | | (non-audited) | | | | |
| | | | | | | | | | | | | | | Issuer information | | | | | | | |
| | | Description of securities | | | | | Lastest financial statements issued | | | | | | | | | | |
Name and issuer | | Face
value | | | Amount | | | Cost | | | Book value | | | Main business | | Date | | | Common
stock | | | Net income / (loss)
for the period | | | Shareholder’s
equity | | | % of Common
Stock | | | Book value | | | Book
value | |
Transporte y Servicios de Gas en Uruguay S.A. | | | Uruguayan peso 1 | | | | 196,000 | | | | 5 | | | | 1,698 | | | Pipeline Maintenance | | | 09/30/2014 | | | | 28 | | | | 139 | | | | 3,403 | | | | 49.00 | | | | 1,667 | | | | 1,528 | |
| | | | | | | | | | | | | | | | | | | | | | | | | | | | | | | | | | | | | | | | | | | | | 58,453 | |
Goodwill (2) | | | | | | | | | | | | | | | 58,453 | | | | | | | | | | | | | | | | | | | | | | | | | | 58,453 | | | | | |
Goodwill Amortization (2) | | | | | | | | | | | | | | | (31,936 | ) | | | | | | | | | | | | | | | | | | | | | | | | | (29,688 | ) | | | (27,440 | ) |
Emprendimientos de Gas del Sur S.A. | | | Ps.1 | | | | 116,130 | | | | 116 | | | | 1,731 | | | Pipeline
construction
and operation services | | | 09/30/2014 | | | | 237 | | | | 239 | | | | 3,937 | | | | 49.00 | | | | 1,929 | | | | 1,690 | |
| | | | | | | | | | | | | | | | | | | | | | | | | | | | | | | | | | | | | | | | | | | | | | |
Subtotal | | | | | | | | | | | | | | | 29,946 | | | | | | | | | | | | | | | | | | | | | | | | | | 32,361 | | | | 34,231 | |
Gas Link S.A. | | | Ps.1 | | | | 502,962 | | | | 503 | | | | — | | | Pipeline
construction
and operation services | | | 09/30/2014 | | | | 1,026 | | | | (894 | ) | | | 5,165 | | | | 49.00 | | | | (801 | )(1) y (2) | | | 93 | (1) |
| | | | | | | | | | | | | | | | | | | | | | | | | | | | | | | | | | | | | | | | | | | | | | |
Total | | | | | | | | | | | | | | | 29,946 | | | | | | | | | | | | | | | | | | | | | | | | | | 31,560 | | | | 34,324 | |
| | | | | | | | | | | | | | | | | | | | | | | | | | | | | | | | | | | | | | | | | | | | | | |
| (1) | Includes the elimination of intercompany profits. See Note 2.h). |
| (2) | Included in “Other current liabilities”. |
F-121
EXHIBIT D
COMPAÑÍA DE INVERSIONES DE ENERGÍA S.A.
CONSOLIDATED BALANCE SHEETS AS OF DECEMBER 31, 2014, 2013 AND 2012
CURRENT INVESTMENTS
(In thousands of Argentine pesos as described in Note 2.b.)
| | | | | | | | | | | | |
| | | 2014 | | | 2013 | | | 2012 | |
| | | (non-audited) | | | (non-audited) | | | | |
Mutual funds in local currency | | | 239,647 | | | | 228,817 | | | | 60,286 | |
Mutual funds in foreign currency | | | — | | | | — | | | | — | |
Public Bonds | | | 2,338 | | | | 112,100 | | | | — | |
Bank accounts in foreign currency | | | 720 | | | | 551 | | | | 58,905 | |
Time deposits in local currency | | | 577,560 | | | | 778,218 | | | | 463,509 | |
Time deposits in foreign currency | | | — | | | | — | | | | 23,350 | |
Loans granted to related parties in foreign currency (Note 10) | | | — | | | | — | | | | 138,523 | |
| | | | | | | | | | | | |
Total current investments | | | 820,265 | | | | 1,119,686 | | | | 744,573 | |
| | | | | | | | | | | | |
F-122
EXHIBIT E
COMPAÑÍA DE INVERSIONES DE ENERGÍA S.A.
CONSOLIDATED BALANCE SHEETS AS OF DECEMBER 31, 2014, 2013 AND 2012
ALLOWANCES AND PROVISIONS FOR CONTINGENCIES
(In thousands of Argentine pesos as described in Note 2.b)
| | | | | | | | | | | | | | | | | | | | | | | | |
Main account | | | | | Beginning
of the year | | | Additions | | | Applications | | | Decreases | | | End of
the year | |
| | | | | | (non-audited) | | | | | | | | | | | | | |
Deducted from assets | | | | | | | | | | | | | | | | | | | | | | | | |
Allowance for doubtful accounts | | | 2014 | | | | 4,121 | | | | — | | | | 2,525 | | | | 207 | | | | 1,389 | |
| | | | | | | | | | | | | | | | | | | | | | | | |
| | | 2013 | | | | 31,300 | | | | — | | | | 8,892 | | | | 18,287 | | | | 4,121 | |
| | | | | | | | | | | | | | | | | | | | | | | | |
| | | 2012 | | | | 31,173 | | | | 127 | (1) | | | — | | | | — | | | | 31,300 | |
| | | | | | | | | | | | | | | | | | | | | | | | |
Allowance for deferred tax assets | | | 2014 | | | | — | | | | 20,887 | (4) | | | — | | | | — | | | | 20,887 | |
| | | | | | | | | | | | | | | | | | | | | | | | |
| | | 2013 | | | | — | | | | 10,675 | (4) | | | — | | | | — | | | | 10,675 | |
| | | | | | | | | | | | | | | | | | | | | | | | |
| | | 2012 | | | | — | | | | — | | | | — | | | | — | | | | — | |
| | | | | | | | | | | | | | | | | | | | | | | | |
Included in liabilities | | | | | | | | | | | | | | | | | | | | | | | | |
Provision | | | 2014 | | | | 143,412 | | | | 42,859 | (2) | | | 13,238 | | | | 22,686 | (3) | | | 150,347 | |
| | | | | | | | | | | | | | | | | | | | | | | | |
| | | 2013 | | | | 144,054 | | | | 27,939 | (3) | | | 18,547 | | | | 10,034 | (3) | | | 143,412 | |
| | | | | | | | | | | | | | | | | | | | | | | | |
| | | 2012 | | | | 130,764 | | | | 15,982 | (3) | | | 84 | | | | 2,608 | (3) | | | 144,054 | |
| | | | | | | | | | | | | | | | | | | | | | | | |
| (1) | Included in “Selling expenses” |
| (2) | Ps. 24.327 included in “Other expense, net” and Ps. 18.532 included in “Financial expenses” |
| (3) | Included in “Other expense, net”. |
| (4) | Included in “Income tax expense”. |
F-123
EXHIBIT F
COMPAÑÍA DE INVERSIONES DE ENERGÍA S.A.
COST OF SALES FOR THE YEARS
ENDED DECEMBER 31, 2014, 2013 AND 2012
(In thousands of Argentine pesos as described in Note 2.b.)
| | | | | | | | | | | | |
| | | 2014 | | | 2013 | | | 2012 | |
| | | (non-audited) | | | (non-audited) | | | | |
Inventories at the beginning of the year | | | 7,356 | | | | 54,282 | | | | 7,588 | |
Natural gas purchases | | | 1,591,314 | | | | 744,249 | | | | 681,768 | |
Operating costs (Exhibit H) | | | 995,996 | | | | 804,144 | | | | 716,660 | |
Inventories at the end of the year | | | (29,131 | ) | | | (7,356 | ) | | | (54,282 | ) |
| | | | | | | | | | | | |
Cost of sales | | | 2,565,535 | | | | 1,595,319 | | | | 1,351,734 | |
| | | | | | | | | | | | |
F-124
EXHIBIT G
COMPAÑÍA DE INVERSIONES DE ENERGÍA S.A.
CONSOLIDATED BALANCE SHEETS AS OF DECEMBER 31, 2014, 2013 AND 2012
FOREIGN CURRENCY ASSETS AND LIABILITIES
(In thousands of Argentine pesos as described in Note 2.b.)
| | | | | | | | | | | | | | | | | | | | | | | | | | | | | | | | | | |
| | | 2014 | | | 2013 | | | 2012 | |
| | | Foreign currency
and amount
(in thousands) | | | Exchange
rate | | | Amount
in local
currency | | | Foreign currency
and amount
(in thousands) | | | Amount
in local
currency | | | Foreign currency
and amount
(in thousands) | | | Amount
in local
currency | |
| | | | | | | | | (non-audited) | | | | | | (non-audited) | | | | | | (non-audited) | |
CURRENT ASSETS | | | | | | | | | | | | | | | | | | | | | | | | | | | | | | | | | | |
Cash and deposits in banks | | US$ | | | 29,804 | | | | 8.451 | (1) | | | 251,874 | | | US$ | | | 12,439 | | | | 80,617 | | | US$ | | | 11,837 | | | | 57,694 | |
Investments, net | | US$ | | | — | | | | 8.451 | (1) | | | — | | | US$ | | | 16,915 | | | | 109,626 | | | US$ | | | 45,297 | | | | 220,777 | |
Other investments | | US$ | | | 31,725 | | | | 8.451 | (1) | | | 268,111 | | | US$ | | | — | | | | — | | | US$ | | | — | | | | — | |
Account receivables, net | | US$ | | | 15,248 | | | | 8.451 | (1) | | | 128,860 | | | US$ | | | 34,128 | | | | 221,184 | | | US$ | | | 41,204 | | | | 200,829 | |
Other receivables | | US$ | | | 4,500 | | | | 8.451 | (1) | | | 38,030 | | | US$ | | | 5,190 | | | | 33,636 | | | US$ | | | 3,359 | | | | 16,372 | |
| | | | | | | | | | | | | | | | | | | | | | | | | | | | | | | | | | |
| | | | | | | | | | | | | 686,875 | | | | | | | | | | 445,063 | | | | | | | | | | 495,672 | |
| | | | | | | | | | | | | | | | | | | | | | | | | | | | | | | | | | |
NON CURRENT ASSETS | | | | | | | | | | | | | | | | | | | | | | | | | | | | | | | | | | |
Account receivables | | US$ | | | 694 | | | | 8.451 | (1) | | | 5,869 | | | US$ | | | — | | | | — | | | US$ | | | 509 | | | | 2,481 | |
Other investments | | US$ | | | 3,150 | | | | 8.451 | (1) | | | 26,620 | | | US$ | | | 32,913 | | | | 213,309 | | | US$ | | | — | | | | — | |
Property, plant and equipment, net | | US$ | | | 5,185 | | | | 8.451 | (1) | | | 43,818 | | | US$ | | | 1,607 | | | | 10,415 | | | US$ | | | 3,007 | | | | 14,656 | |
| | Euros | | | 838 | | | | 10.265 | (1) | | | 8,602 | | | Euros | | | 2,407 | | | | 18,722 | | | Euros | | | 2,718 | | | | 17,499 | |
| | | | | | | | | | | | | | | | | | | | | | | | | | | | | | | | | | |
| | | | | | | | | | | | | 84,909 | | | | | | | | | | 242,446 | | | | | | | | | | 34,636 | |
| | | | | | | | | | | | | | | | | | | | | | | | | | | | | | | | | | |
| | | | | | | | | | | | | 771,784 | | | | | | | | | | 687,509 | | | | | | | | | | 530,308 | |
| | | | | | | | | | | | | | | | | | | | | | | | | | | | | | | | | | |
CURRENT LIABILITIES | | | | | | | | | | | | | | | | | | | | | | | | | | | | | | | | | | |
Accounts payable | | US$ | | | 34,746 | | | | 8.551 | (2) | | | 297,113 | | | US$ | | | 10,478 | | | | 68,327 | | | US$ | | | 8,347 | | | | 41,017 | |
| | Euros | | | — | | | | | | | | — | | | Euros | | | — | | | | — | | | Euros | | | — | | | | — | |
Tax Payable | | US$ | | | 31 | | | | 8.551 | (2) | | | 265 | | | US$ | | | 18 | | | | 117 | | | US$ | | | 4 | | | | 22 | |
Loans | | US$ | | | 59,014 | | | | 8.551 | (2) | | | 504,629 | | | US$ | | | 97,620 | | | | 636,578 | | | US$ | | | 3,837 | | | | 18,856 | |
Advances from customers | | US$ | | | — | | | | 8.551 | (2) | | | — | | | US$ | | | — | | | | — | | | US$ | | | 2,041 | | | | 10,029 | |
| | | | | | | | | | | | | | | | | | | | | | | | | | | | | | | | | | |
| | | | | | | | | | | | | 802,007 | | | | | | | | | | 705,022 | | | | | | | | | | 69,924 | |
| | | | | | | | | | | | | | | | | | | | | | | | | | | | | | | | | | |
NON CURRENT LIABILITIES | | | | | | | | | | | | | | | | | | | | | | | | | | | | | | | | | | |
Loans | | US$ | | | 251,007 | | | | 8.551 | (2) | | | 2,146,364 | | | US$ | | | 304,360 | | | | 1,984,732 | | | US$ | | | 396,952 | | | | 1,950,623 | |
| | | | | | | | | | | | | | | | | | | | | | | | | | | | | | | | | | |
| | | | | | | | | | | | | 2,146,364 | | | | | | | | | | 1,984,732 | | | | | | | | | | 1,950,623 | |
| | | | | | | | | | | | | | | | | | | | | | | | | | | | | | | | | | |
| | | | | | | | | | | | | 2,948,371 | | | | | | | | | | 2,689,754 | | | | | | | | | | 2,020,547 | |
| | | | | | | | | | | | | | | | | | | | | | | | | | | | | | | | | | |
| (1) | Buy exchange rate at the end of the year. |
| (2) | Sell exchange rate at the end of the year. |
US$: United States of America dollars
F-125
EXHIBIT H
COMPAÑÍA DE INVERSIONES DE ENERGÍA S.A
CONSOLIDATED INFORMATION REQUIRED UNDER ART 64, PARAGRAPH I, CLAUSE b) BUSINESS ASSOCIATIONS LAW
FOR THE YEARS ENDED DECEMBER 31, 2014, 2013 AND 2012
(In thousands of Argentine pesos as described in Note 2.b.)
| | | | | | | | | | | | | | | | | | | | | | | | | | | | | | | | |
| | | 2014 | | | 2013 | | | 2012 | |
| | | (non-audited) | | | (non-audited) | | | | |
Accounts | | Total | | | Regulated
Activities | | | Non Operating
Activities | | | Administrative
expenses(2) | | | Selling
expenses (3) | | | Financial
expense | | | Total | | | Total | |
Salaries, wages and other contributions | | | 416,968 | | | | 224,727 | | | | 84,138 | | | | 82,777 | | | | 25,326 | | | | — | | | | 305,657 | | | | 241,779 | |
Social security taxes | | | 74,640 | | | | 37,074 | | | | 15,027 | | | | 17,136 | | | | 5,403 | | | | — | | | | 55,159 | | | | 43,260 | |
Compensation of Directors and Supervisory Committee | | | 4,595 | | | | — | | | | — | | | | 4,595 | | | | — | | | | — | | | | 2,957 | | | | 2,322 | |
Professional services fees | | | 21,972 | | | | 1,238 | | | | 2,239 | | | | 17,417 | | | | 1,078 | | | | — | | | | 15,199 | | | | 14,442 | |
Technical operator assistance fees | | | 69,966 | | | | 3,000 | | | | 66,966 | | | | — | | | | — | | | | — | | | | 52,952 | | | | 52,046 | |
Materials | | | 26,597 | | | | 11,079 | | | | 15,518 | | | | — | | | | — | | | | — | | | | 18,790 | | | | 14,389 | |
Third parties services | | | 41,059 | | | | 15,650 | | | | 20,567 | | | | 4,842 | | | | — | | | | — | | | | 30,706 | | | | 24,873 | |
Telecommunications and postal expenses | | | 3,543 | | | | 252 | | | | 690 | | | | 2,461 | | | | 140 | | | | — | | | | 2,847 | | | | 2,434 | |
Rents | | | 1,802 | | | | 411 | | | | 122 | | | | 1,092 | | | | 177 | | | | — | | | | 1,354 | | | | 1,230 | |
Transportation and freight | | | 15,647 | | | | 11,059 | | | | 4,261 | | | | 325 | | | | 2 | | | | — | | | | 10,694 | | | | 9,051 | |
Easements | | | 14,832 | | | | 14,832 | | | | — | | | | — | | | | — | | | | — | | | | 18,172 | | | | 15,605 | |
Offices supplies | | | 1,669 | | | | 560 | | | | 208 | | | | 820 | | | | 81 | | | | — | | | | 1,068 | | | | 977 | |
Travel expenses | | | 6,142 | | | | 3,056 | | | | 1,008 | | | | 1,431 | | | | 647 | | | | — | | | | 3,981 | | | | 3,662 | |
Insurance | | | 19,380 | | | | 11,386 | | | | 6,853 | | | | 1,096 | | | | 45 | | | | — | | | | 15,987 | | | | 13,730 | |
Property, plant and equipment maintenance | | | 113,011 | | | | 79,984 | | | | 29,713 | | | | 2,718 | | | | 596 | | | | — | | | | 83,193 | | | | 75,068 | |
Depreciation of property, plant and equipment | | | 255,662 | | | | 175,460 | | | | 64,787 | | | | 15,415 | | | | — | | | | — | | | | 242,917 | | | | 233,670 | |
Taxes and contributions | | | 687,875 | | | | 47,016 | | | | 17,320 | | | | 9,993 | | | | 613,546 | (1) | | | — | | | | 489,735 | (1) | | | 443,498 | (1) |
Advertising | | | 136 | | | | — | | | | — | | | | — | | | | 136 | | | | — | | | | 45 | | | | 545 | |
Doubtful accounts | | | (207 | ) | | | — | | | | — | | | | — | | | | (207 | ) | | | — | | | | — | | | | 127 | |
Bank expenses | | | 1,625 | | | | — | | | | — | | | | 1,553 | | | | 72 | | | | — | | | | 1,135 | | | | 872 | |
Interest expense | | | 321,738 | | | | — | | | | — | | | | — | | | | — | | | | 321,738 | | | | 230,864 | | | | 206,603 | |
Foreign exchange loss | | | 935,541 | | | | — | | | | — | | | | — | | | | — | | | | 935,541 | | | | 627,182 | | | | 325,031 | |
Other expenses and financial charges | | | 53,178 | | | | — | | | | — | | | | — | | | | — | | | | 53,178 | | | | 30,466 | | | | 21,069 | |
Operations among business segments | | | — | | | | (17,299 | ) | | | 17,299 | | | | — | | | | — | | | | — | | | | 16,571 | | | | — | |
Costs of services rendered to third parties | | | 18,740 | | | | — | | | | 18,740 | | | | — | | | | — | | | | — | | | | — | | | | 32,381 | |
Other expenses | | | 15,373 | | | | 6,909 | | | | 4,146 | | | | 4,001 | | | | 317 | | | | — | | | | 12,513 | | | | 9,279 | |
| | | | | | | | | | | | | | | | | | | | | | | | | | | | | | | | |
Total 2014 | | | 3,121,484 | | | | 626,394 | | | | 369,602 | | | | 167,672 | | | | 647,359 | | | | 1,310,457 | | | | | | | | | |
| | | | | | | | | | | | | | | | | | | | | | | | | | | | | | | | |
Total 2013 | | | | | | | 521,908 | | | | 282,236 | | | | 120,124 | | | | 457,364 | | | | 888,512 | | | | 2,270,144 | | | | | |
| | | | | | | | | | | | | | | | | | | | | | | | | | | | | | | | |
Total 2012 | | | | | | | 473,413 | | | | 243,247 | | | | 95,347 | | | | 423,233 | | | | 552,703 | | | | | | | | 1,787,943 | |
| | | | | | | | | | | | | | | | | | | | | | | | | | | | | | | | |
| (1) | Includes tax on exports of Ps. 511,599 , Ps.363,435 and Ps.357,409 for the years ended December 31, 2014, 2013 and 2012 respectively. |
| (2) | From the total of Administrative Expenses, Ps. 44,327, Ps. 24,483 and Ps. 14,740 correspond to the non regulated activities for the years ended December 31, 2014, 2013 and 2012, respectively. |
| (3) | From the total of Selling Expenses, Ps. 612,020, Ps. 428,758 and Ps. 396,629 correspond to the non regulated activities for the years ended December 31, 2014, 2013 and 2012, respectively. |
F-126
EXHIBIT I
COMPAÑÍA DE INVERSIONES DE ENERGÍA S.A.
CONSOLIDATED BALANCE SHEET AS OF DECEMBER 31, 2014
DETAIL OF MATURITIES OF INVESTMENTS, RECEIVABLES AND LIABILITIES
(In thousands of Argentine pesos as described in Note 2.b.)
| | | | | | | | | | | | | | | | |
| | | Investments (1) | | | Receivables (2) | | | Loans | | | Other
liabilities(3) | |
Without specified maturity | | | 239,647 | | | | 3,690 | | | | — | | | | 45,092 | |
| | | | | | | | | | | | | | | | |
With specified maturity | | | | | | | | | | | | | | | | |
* Overdue | | | | | | | | | | | | | | | | |
Until 12-31-2013 | | | — | | | | 13,880 | | | | — | | | | 49,082 | |
From 01-01-14 to 03-31-14 | | | — | | | | 3,808 | | | | — | | | | 307 | |
From 04-01-14 to 06-30-14 | | | — | | | | 3,132 | | | | — | | | | 307 | |
From 07-01-14 to 09-30-14 | | | — | | | | 13,916 | | | | — | | | | 308 | |
From 10-01-14 to 12-31-14 | | | — | | | | 73,514 | | | | 4,809 | | | | 308 | |
| | | | | | | | | | | | | | | | |
Total Overdue | | | — | | | | 108,250 | | | | 4,809 | | | | 50,312 | |
| | | | | | | | | | | | | | | | |
* Non-due: | | | | | | | | | | | | | | | | |
From 01-01-15 to 03-31-15 | | | 580,617 | | | | 355,473 | | | | 5,222 | | | | 692,603 | |
From 04-01-15 to 06-30-15 | | | — | | | | 5,139 | | | | 324,548 | | | | 30,914 | |
From 07-01-15 to 09-30-15 | | | — | | | | 3,001 | | | | 216,678 | | | | 4,974 | |
From 10-01-15 to 12-31-15 | | | 268,111 | | | | 3,000 | | | | 1,902 | | | | 5,018 | |
During 2016 | | | — | | | | 14,138 | | | | 272,376 | | | | 152,714 | |
During 2017 | | | — | | | | 17,963 | | | | 261,159 | | | | 13,020 | |
During 2018 | | | — | | | | 8,479 | | | | 542,290 | | | | 11,719 | |
During 2019 | | | — | | | | 4,944 | | | | 542,290 | | | | 15,169 | |
From 2020 onwards | | | — | | | | 6,000 | | | | 542,290 | | | | 188,099 | |
| | | | | | | | | | | | | | | | |
Total non-due | | | 848,728 | | | | 418,137 | | | | 2,708,755 | | | | 1,114,230 | |
| | | | | | | | | | | | | | | | |
Total with specific maturity | | | 848,728 | | | | 526,387 | | | | 2,713,564 | | | | 1,164,542 | |
| | | | | | | | | | | | | | | | |
Total | | | 1,088,375 | | | | 530,077 | | | | 2,713,564 | | | | 1,209,634 | |
| | | | | | | | | | | | | | | | |
| (1) | Includes mutual funds, loans, time deposits, public and private and certain bank accounts. Such investments bear floating interest rates, except for Ps. 268,111 wich bear interests at 6.8% plus VAT annual. |
| (2) | Includes account receivables and other receivables, without the allowance for doubtful accounts. Said credits do not bear interests, except for Ps. 47,535 which bear CER plus a spread of 8%. The total credits without specific maturity correspond to non-current assets. |
| (3) | Corresponds to the total liabilities, except for provisions and loans. From the total Other liabilities without specified maturity, Ps. 1,224 correspond to current liabilities. |
F-127
Oil and Gas Supplementary Disclosures (Unaudited)
In December 2009, the Company adopted the Modernization of Oil and Gas Reporting rules, which were issued by the Securities and Exchange Commission (“SEC”) of the United States of America at the end of 2008.
The following information for the oil and gas producing activities has been prepared in accordance with the methodology prescribed by ASC 932 of the FASB Accounting Standards Codification (ASC) relating to Extractive Activities – Oil and Gas (formerly SFAS no. 69 Disclosures about Oil and Gas Producing Activities) and includes the Company’s and its subsidiaries’ oil and gas production activities as well as the equity shares in its associates valued by the equity method. The Company has oil and gas properties in Argentina and other countries in Latin America.
Amounts are stated in millions of pesos.
Capitalized costs
The following table presents the capitalized costs as of December 31, 2014, 2013 and 2012, for proved and unproved oil and gas properties, and the related accumulated depreciation and allowances, which reduce the value of assets.
| | | | | | | | | | | | | | | | | | | | |
| | | Consolidated Companies | | | Equity Method Investment | |
| | | Argentina | | | Rest of
Latin-
America | | | Total | | | Venezuela | | | Total | |
| | | (Stated in millions of Argentine pesos) | |
December 31, 2014 | | | | | | | | | | | | | | | | | | | | |
Proved properties: | | | | | | | | | | | | | | | | | | | | |
Equipment, camps and other facilities | | | 5,040 | | | | 194 | | | | 5,234 | | | | — | | | | — | |
Mining properties and wells | | | 15,078 | | | | 1,101 | | | | 16,179 | | | | 3,570 | | | | 3,570 | |
Unproved properties | | | 619 | | | | — | | | | 619 | | | | — | | | | — | |
| | | | | | | | | | | | | | | | | | | | |
Total capitalized costs | | | 20,737 | | | | 1,295 | | | | 22,032 | | | | 3,570 | | | | 3,570 | |
| | | | | | | | | | | | | | | | | | | | |
Accumulated depreciation and allowances which reduce the value of assets | | | (12,080 | ) | | | (968 | ) | | | (13,048 | ) | | | (1,711 | ) | | | (1,711 | ) |
| | | | | | | | | | | | | | | | | | | | |
Total net capitalized costs | | | 8,657 | | | | 327 | | | | 8,984 | | | | 1,859 | | | | 1,859 | |
| | | | | | | | | | | | | | | | | | | | |
| | | | | | | | | | | | | | | | | | | | |
| | | Consolidated Companies | | | Equity Method Investment | |
| | | Argentina | | | Rest of
Latin-
America | | | Total | | | Venezuela | | | Total | |
| | | (Stated in millions of Argentine pesos) | |
December 31, 2013 | | | | | | | | | | | | | | | | | | | | |
Proved properties: | | | | | | | | | | | | | | | | | | | | |
Equipment, camps and other facilities | | | 4,818 | | | | 85 | | | | 4,903 | | | | — | | | | — | |
Mining properties and wells | | | 13,097 | | | | 1,056 | | | | 14,153 | | | | 3,730 | | | | 3,730 | |
Unproved properties | | | 298 | | | | — | | | | 298 | | | | — | | | | — | |
| | | | | | | | | | | | | | | | | | | | |
Total capitalized costs | | | 18,213 | | | | 1,141 | | | | 19,354 | | | | 3,730 | | | | 3,730 | |
| | | | | | | | | | | | | | | | | | | | |
Accumulated depreciation and allowances which reduce the value of assets | | | (11,612 | ) | | | (637 | ) | | | (12,249 | ) | | | (1,181 | ) | | | (1,181 | ) |
| | | | | | | | | | | | | | | | | | | | |
Total net capitalized costs | | | 6,601 | | | | 504 | | | | 7,105 | | | | 2,549 | | | | 2,549 | |
| | | | | | | | | | | | | | | | | | | | |
S-1
| | | | | | | | | | | | | | | | | | | | |
| | | Consolidated Companies | | | Equity Method Investment | |
| | | Argentina | | | Rest of
Latin-
America | | | Total | | | Venezuela | | | Total | |
| | | (Stated in millions of Argentine pesos) | |
December 31, 2012 | | | | | | | | | | | | | | | | | | | | |
Proved properties: | | | | | | | | | | | | | | | | | | | | |
Equipment, camps and other facilities | | | 4,580 | | | | 64 | | | | 4,644 | | | | — | | | | — | |
Mining properties and wells | | | 11,250 | | | | 635 | | | | 11,885 | | | | 2,900 | | | | 2,900 | |
Unproved properties | | | 116 | | | | — | | | | 116 | | | | — | | | | — | |
| | | | | | | | | | | | | | | | | | | | |
Total capitalized costs | | | 15,946 | | | | 699 | | | | 16,645 | | | | 2,900 | | | | 2,900 | |
| | | | | | | | | | | | | | | | | | | | |
Accumulated depreciation and allowances which reduce the value of assets | | | (10,116 | ) | | | (462 | ) | | | (10,578 | ) | | | (807 | ) | | | (807 | ) |
| | | | | | | | | | | | | | | | | | | | |
Total net capitalized costs | | | 5,830 | | | | 237 | | | | 6,067 | | | | 2,093 | | | | 2,093 | |
| | | | | | | | | | | | | | | | | | | | |
Costs incurred
The following table presents those costs capitalized as well as expensed that were incurred during each of the years ended as of December 31, 2014, 2013 and 2012. The acquisition of properties includes the cost of acquisition of proved or unproved oil and gas properties. Exploration costs include geological and geophysical costs, costs necessary for retaining undeveloped properties, and drilling costs and exploratory well equipment. Development costs include drilling costs and equipment for developmental wells, costs incurred in improved recovery, the construction of facilities for extraction, treatment and storage of hydrocarbons and all necessary costs to maintain facilities for the existing developed reserves.
| | | | | | | | | | | | | | | | | | | | | | | | |
| | | Consolidated companies | | | Equity Method Investment | |
| | | Argentina | | | Rest of Latin-
America | | | Total | | | Argentina | | | Venezuela | | | Total | |
| | | (Stated in millions of Argentine pesos) | |
At December 31, 2014 | | | | | | | | | | | | | | | | | | | | | | | | |
Acquisition of properties: | | | | | | | | | | | | | | | | | | | | | | | | |
- Proved | | | — | | | | — | | | | — | | | | — | | | | — | | | | — | |
- Unproved | | | 21 | | | | — | | | | 21 | | | | — | | | | — | | | | — | |
Exploration costs | | | 386 | | | | — | | | | 386 | | | | — | | | | — | | | | — | |
Development costs | | | 3,810 | | | | 31 | | | | 3,841 | | | | — | | | | 539 | | | | 539 | |
| | | | | | | | | | | | | | | | | | | | | | | | |
Total costs incurred | | | 4,217 | | | | 31 | | | | 4,248 | | | | — | | | | 539 | | | | 539 | |
| | | | | | | | | | | | | | | | | | | | | | | | |
S-2
| | | | | | | | | | | | | | | | | | | | | | | | |
| | | Consolidated companies | | | Equity Method Investment | |
| | | Argentina | | | Rest of Latin-
America | | | Total | | | Argentina | | | Venezuela | | | Total | |
| | | (Stated in millions of Argentine pesos) | |
At December 31, 2013 | | | | | | | | | | | | | | | | | | | | | | | | |
Acquisition of properties: | | | | | | | | | | | | | | | | | | | | | | | | |
- Proved | | | — | | | | — | | | | — | | | | — | | | | — | | | | — | |
- Unproved | | | 59 | | | | — | | | | 59 | | | | — | | | | — | | | | — | |
Exploration costs | | | 315 | | | | — | | | | 315 | | | | — | | | | — | | | | — | |
Development costs | | | 2,087 | | | | 31 | | | | 2,118 | | | | — | | | | 240 | | | | 240 | |
| | | | | | | | | | | | | | | | | | | | | | | | |
Total costs incurred | | | 2,461 | | | | 31 | | | | 2,492 | | | | — | | | | 240 | | | | 240 | |
| | | | | | | | | | | | | | | | | | | | | | | | |
| | |
| | | Consolidated companies | | | Equity Method Investment | |
| | | Argentina | | | Rest of Latin-
America | | | Total | | | Argentina | | | Venezuela | | | Total | |
| | | (Stated in millions of Argentine pesos) | |
At December 31, 2012 | | | | | | | | | | | | | | | | | | | | | | | | |
Acquisition of properties: | | | | | | | | | | | | | | | | | | | | | | | | |
- Proved | | | 1,214 | | | | — | | | | 1,214 | | | | — | | | | — | | | | — | |
- Unproved | | | 28 | | | | — | | | | 28 | | | | 3 | | | | — | | | | 3 | |
Exploration costs | | | 110 | | | | — | | | | 110 | | | | 1 | | | | — | | | | 1 | |
Development costs | | | 1,576 | | | | 26 | | | | 1,602 | | | | 30 | | | | 95 | | | | 125 | |
| | | | | | | | | | | | | | | | | | | | | | | | |
Total costs incurred | | | 2,928 | | | | 26 | | | | 2,954 | | | | 34 | | | | 95 | | | | 129 | |
| | | | | | | | | | | | | | | | | | | | | | | | |
Results of operations
The breakdown of results of the operations shown below summarizes revenues and expenses directly associated with oil and gas-producing activities for the years ended December 31, 2014, 2013 and 2012. These activities are a part of the Oil and Gas Exploration and Production segment. This breakdown does not include any allocation of financial costs or expenses from Corporate and therefore it is not necessarily an indicator of the contribution in operations for oil and gas producing activities to the net income of the Company. Income tax for the years presented was calculated utilizing the deferred income tax criteria.
S-3
| | | | | | | | | | | | | | | | | | | | | | | | |
| | | Consolidated companies | | | Equity Method Investment | |
| | | Argentina | | | Rest of
Latin-
America | | | Total | | | Argentina | | | Venezuela | | | Total | |
| | | (Stated in millions of Argentine pesos) | |
At December 31, 2014 | | | | | | | | | | | | | | | | | | | | | �� | | | |
Net sales: | | | | | | | | | | | | | | | | | | | | | | | | |
- to third parties | | | 1,823 | | | | 192 | | | | 2,015 | | | | — | | | | 1,251 | | | | 1,251 | |
- transfers to other operations | | | 8,538 | | | | — | | | | 8,538 | | | | — | | | | — | | | | — | |
| | | | | | | | | | | | | | | | | | | | | | | | |
Total net sales | | | 10,361 | | | | 192 | | | | 10,553 | | | | — | | | | 1,251 | | | | 1,251 | |
Production costs: | | | | | | | | | | | | | | | | | | | | | | | | |
- Operating costs | | | (3,007 | ) | | | (81 | ) | | | (3,088 | ) | | | — | | | | (514 | ) | | | (514 | ) |
- Royalties and other | | | (1,875 | ) | | | (14 | ) | | | (1,889 | ) | | | — | | | | (374 | ) | | | (374 | ) |
| | | | | | | | | | | | | | | | | | | | | | | | |
Total production costs | | | (4,882 | ) | | | (95 | ) | | | (4,977 | ) | | | — | | | | (888 | ) | | | (888 | ) |
Exploration costs | | | (70 | ) | | | — | | | | (70 | ) | | | — | | | | — | | | | — | |
Depreciation, depletion, amortization and allowances which reduce the value of assets | | | (2,364 | ) | | | (31 | ) | | | (2,395 | ) | | | — | | | | (1,541 | ) | | | (1,541 | ) |
| | | | | | | | | | | | | | | | | | | | | | | | |
Results of operations before income tax | | | 3,045 | | | | 66 | | | | 3,111 | | | | — | | | | (1,178 | ) | | | (1,178 | ) |
Income tax | | | (1,066 | ) | | | (17 | ) | | | (1,083 | ) | | | — | | | | 339 | | | | 339 | |
| | | | | | | | | | | | | | | | | | | | | | | | |
Total Results of oil and gas operations | | | 1,979 | | | | 49 | | | | 2,028 | | | | — | | | | (839 | ) | | | (839 | ) |
| | | | | | | | | | | | | | | | | | | | | | | | |
S-4
| | | | | | | | | | | | | | | | | | | | | | | | |
| | | Consolidated companies | | | Equity Method Investment | |
| | | Argentina | | | Rest of
Latin-
America | | | Total | | | Argentina | | | Venezuela | | | Total | |
| | | (Stated in millions of Argentine pesos) | |
At December 31, 2013 | | | | | | | | | | | | | | | | | | | | | | | | |
Net sales: | | | | | | | | | | | | | | | | | | | | | | | | |
- to third parties | | | 1,625 | | | | 189 | | | | 1,814 | | | | — | | | | 1,172 | | | | 1,172 | |
- transfers to other operations | | | 6,024 | | | | — | | | | 6,024 | | | | — | | | | — | | | | — | |
| | | | | | | | | | | | | | | | | | | | | | | | |
Total net sales | | | 7,649 | | | | 189 | | | | 7,838 | | | | — | | | | 1,172 | | | | 1,172 | |
Production costs: | | | | | | | | | | | | | | | | | | | | | | | | |
- Operating costs | | | (2,525 | ) | | | (77 | ) | | | (2,602 | ) | | | — | | | | (306 | ) | | | (306 | ) |
- Royalties and other | | | (1,169 | ) | | | (9 | ) | | | (1,178 | ) | | | — | | | | (293 | ) | | | (293 | ) |
| | | | | | | | | | | | | | | | | | | | | | | | |
Total production costs | | | (3,694 | ) | | | (86 | ) | | | (3,780 | ) | | | — | | | | (599 | ) | | | (599 | ) |
Exploration costs | | | (82 | ) | | | — | | | | (82 | ) | | | — | | | | — | | | | — | |
Depreciation, depletion, amortization and allowances which reduce the value of assets | | | (1,934 | ) | | | (27 | ) | | | (1,961 | ) | | | — | | | | (985 | ) | | | (985 | ) |
| | | | | | | | | | | | | | | | | | | | | | | | |
Results of operations before income tax | | | 1,939 | | | | 76 | | | | 2,015 | | | | — | | | | (412 | ) | | | (412 | ) |
Income tax | | | (679 | ) | | | (20 | ) | | | (699 | ) | | | — | | | | 59 | | | | 59 | |
| | | | | | | | | | | | | | | | | | | | | | | | |
Total Results of oil and gas operations | | | 1,260 | | | | 56 | | | | 1,316 | | | | — | | | | (353 | ) | | | (353 | ) |
| | | | | | | | | | | | | | | | | | | | | | | | |
S-5
| | | | | | | | | | | | | | | | | | | | | | | | |
| | | Consolidated companies | | | Equity Method Investment | |
| | | Argentina | | | Rest of
Latin-
America | | | Total | | | Argentina | | | Venezuela | | | Total | |
| | | (Stated in millions of Argentine pesos) | |
At December 31, 2012 | | | | | | | | | | | | | | | | | | | | | | | | |
Net sales: | | | | | | | | | | | | | | | | | | | | | | | | |
- to third parties | | | 874 | | | | 168 | | | | 1,042 | | | | 109 | | | | 845 | | | | 954 | |
- transfers to other operations | | | 5,071 | | | | — | | | | 5,071 | | | | 1 | | | | — | | | | 1 | |
| | | | | | | | | | | | | | | | | | | | | | | | |
Total net sales | | | 5,945 | | | | 168 | | | | 6,113 | | | | 110 | | | | 845 | | | | 955 | |
Production costs: | | | | | | | | | | | | | | | | | | | | | | | | |
- Operating costs | | | (1,854 | ) | | | (72 | ) | | | (1,926 | ) | | | (25 | ) | | | (269 | ) | | | (294 | ) |
- Royalties and other | | | (987 | ) | | | (10 | ) | | | (997 | ) | | | (14 | ) | | | (195 | ) | | | (209 | ) |
| | | | | | | | | | | | | | | | | | | | | | | | |
Total production costs | | | (2,841 | ) | | | (82 | ) | | | (2,923 | ) | | | (39 | ) | | | (464 | ) | | | (503 | ) |
Exploration costs | | | (212 | ) | | | — | | | | (212 | ) | | | (1 | ) | | | — | | | | (1 | ) |
Depreciation, depletion, amortization and allowances which reduce the value of assets | | | (1,484 | ) | | | (23 | ) | | | (1,507 | ) | | | (23 | ) | | | (380 | ) | | | (403 | ) |
| | | | | | | | | | | | | | | | | | | | | | | | |
Results of operations before income tax | | | 1,365 | | | | 63 | | | | 1,471 | | | | 47 | | | | 1 | | | | 48 | |
Income tax | | | (478 | ) | | | (17 | ) | | | (495 | ) | | | (19 | ) | | | (53 | ) | | | (72 | ) |
| | | | | | | | | | | | | | | | | | | | | | | | |
Total Results of oil and gas operations | | | 887 | | | | 46 | | | | 976 | | | | 28 | | | | (52 | ) | | | (24 | ) |
| | | | | | | | | | | | | | | | | | | | | | | | |
Estimated oil and gas reserves
Proved reserves represent estimated quantities of oil (including crude oil, condensate and natural gas liquids) and natural gas, which available geological and engineering data demonstrates with reasonable certainty to be recoverable in the future from known reservoirs under existing economic and operating conditions. Proved developed reserves are proved reserves that can reasonably be expected to be recovered through existing wells with existing equipment and operating methods. The choice of method or combination of methods employed in the analysis of each reservoir was determined by the stage of development, quality and reliability of basic data, and production history.
The Company believes that its estimates of remaining proved recoverable oil and gas reserve volumes are reasonable and such estimates have been prepared in accordance with the SEC Modernization of Oil and Gas Reporting rules, which were issued by the SEC at the end of 2008.
The Company estimates its reserves at least once a year. The Company’s reserves estimation as of December 31, 2014, 2013 and 2012 was evaluated by DeGolyer and MacNaughton. The technical revision covered approximately 80%, 73% and 76% respectively, of the Company’s estimated reserves. DeGolyer and MacNaughton evaluated the proved oil and natural gas reserve estimates in accordance with Rule 4-10 of Regulation S-X, promulgated by the SEC, and in accordance with the oil and gas reserves disclosure provisions of ASC 932 of the FASB Accounting Standards Codification (ASC) relating to Extractive Activities-Oil and Gas (formerly SFAS no. 69 Disclosures about Oil and Gas Producing Activities). We provided all information required during the course of the evaluation process to the auditor’s satisfaction.
S-6
Proved reserves are estimated by the Company’s reservoir engineers. Reserves engineering is a subjective process of estimation of hydrocarbon accumulation, which cannot be accurately measured, and the reserve estimation depends on the quality of available information and the interpretation and judgment of the engineers and geologists. Therefore, the reserves estimations, as well as future production profiles, are often different than the quantities of hydrocarbons which are finally recovered. The accuracy of such estimations depends, in general, on the assumptions on which they are based.
The following table sets forth the estimated proved reserves of oil (includes crude oil, condensate and natural gas liquids) and natural gas as of December 31, 2014, 2013 and 2012:
| | | | | | | | | | | | | | | | | | | | | | | | | | | | | | | | | | | | |
| | | CRUDE OIL, CONDENSATE AND
NATURAL GAS LIQUIDS
IN THOUSANDS OF BARRELS | | | NATURAL GAS IN MILLIONS OF CUBIC FEET | |
| | | Consolidated
companies | | | Equity Method
Investment | | | Total | | | Consolidated
companies | | | Equity Method
Investment | | | Total | |
Proved reserves (developed and undeveloped) | | Argentina | | | Rest of
Latin-
America | | | Argentina | | | Venezuela | | | | Argentina | | | Argentina | | | Venezuela | | |
Reserves as of December 31, 2011(*) | | | 58,888 | | | | — | | | | 3,808 | | | | 29,537 | | | | 92,233 | | | | 732,653 | | | | 8,426 | | | | 43,452 | | | | 784,531 | |
| | | | | | | | | | | | | | | | | | | | | | | | | | | | | | | | | | | | |
Increase (Decrease) originated in: | | | | | | | | | | | | | | | | | | | | | | | | | | | | | | | | | | | | |
Revisions of previous estimates | | | (2,662 | ) | | | — | | | | 36 | | | | (3,800 | ) | | | (6,426 | ) | | | 22,024 | | | | 96 | | | | (4,913 | ) | | | 17,207 | |
Extensions and discoveries | | | 4,393 | | | | — | | | | 272 | | | | 1,130 | | | | 5,795 | | | | 14,618 | | | | 440 | | | | 8,802 | | | | 23,860 | |
Purchase of proved reserves in place | | | 19,674 | | | | — | | | | (3,779 | ) | | | — | | | | 15,895 | | | | 43,686 | | | | (8,391 | ) | | | — | | | | 35,295 | |
Year’s production | | | (16,048 | ) | | | — | | | | (337 | ) | | | (2,337 | ) | | | (18,722 | ) | | | (100,515 | ) | | | (571 | ) | | | (886 | ) | | | (101,972 | ) |
| | | | | | | | | | | | | | | | | | | | | | | | | | | | | | | | | | | | |
Reserves as of December 31, 2012(*) | | | 64,245 | | | | — | | | | — | | | | 24,530 | | | | 88,775 | | | | 712,466 | | | | — | | | | 46,455 | | | | 758,921 | |
| | | | | | | | | | | | | | | | | | | | | | | | | | | | | | | | | | | | |
Increase (Decrease) originated in: | | | | | | | | | | | | | | | | | | | | | | | | | | | | | | | | | | | | |
Revisions of previous estimates | | | 67 | | | | — | | | | — | | | | (1,086 | ) | | | (1,019 | ) | | | 65,774 | | | | — | | | | (4,362 | ) | | | 61,412 | |
Purchase of proved reserves in place | | | 13,204 | | | | — | | | | — | | | | — | | | | 13,204 | | | | 9,260 | | | | — | | | | — | | | | 9,260 | |
Year’s production | | | (16,675 | ) | | | — | | | | — | | | | (2,020 | ) | | | (18,695 | ) | | | (92,213 | ) | | | — | | | | (620 | ) | | | (92,833 | ) |
| | | | | | | | | | | | | | | | | | | | | | | | | | | | | | | | | | | | |
Reserves as of December 31, 2013(*) | | | 60,841 | | | | — | | | | — | | | | 21,424 | | | | 82,265 | | | | 695,287 | | | | — | | | | 41,473 | | | | 736,760 | |
| | | | | | | | | | | | | | | | | | | | | | | | | | | | | | | | | | | | |
Increase (Decrease) originated in: | | | | | | | | | | | | | | | | | | | | | | | | | | | | | | | | | | | | |
Revisions of previous estimates | | | (3,053 | ) | | | — | | | | — | | | | (1,766 | ) | | | (4,819 | ) | | | 23,424 | | | | — | | | | (13,277 | ) | | | 10,147 | |
Improved recovery | | | 520 | | | | — | | | | — | | | | — | | | | 520 | | | | 10,817 | | | | — | | | | — | | | | 10,817 | |
Extensions and discoveries | | | 2,955 | | | | — | | | | — | | | | — | | | | 2,955 | | | | 42,076 | | | | — | | | | — | | | | 42,076 | |
Purchase of proved reserves in place | | | 22,713 | | | | — | | | | — | | | | — | | | | 22,713 | | | | 46,975 | | | | — | | | | — | | | | 46,975 | |
Sale of proved reserves in place | | | (3,404 | ) | | | — | | | | — | | | | — | | | | (3,404 | ) | | | — | | | | — | | | | — | | | | — | |
Year’s production | | | (13,957 | ) | | | — | | | | — | | | | (1,691 | ) | | | (15,648 | ) | | | (89,858 | ) | | | — | | | | (591 | ) | | | (90,449 | ) |
| | | | | | | | | | | | | | | | | | | | | | | | | | | | | | | | | | | | |
Reserves as of December 31, 2014(*) | | | 66,615 | | | | — | | | | — | | | | 17,967 | | | | 84,582 | | | | 728,721 | | | | — | | | | 27,605 | | | | 756,326 | |
| | | | | | | | | | | | | | | | | | | | | | | | | | | | | | | | | | | | |
| | | | | | | |
(*) Includes proved developed reserves: | | | | | | | | | | | | | | | | | | | | | | | | | | | | | |
| | | | | | | | | |
As of December 31, 2012 | | | 48,936 | | | | — | | | | — | | | | 12,670 | | | | 61,606 | | | | 358,319 | | | | — | | | | 14,582 | | | | 372,901 | |
As of December 31, 2013 | | | 43,802 | | | | — | | | | — | | | | 12,448 | | | | 56,250 | | | | 320,642 | | | | — | | | | 14,868 | | | | 335,510 | |
As of December 31, 2014 | | | 51,986 | | | | — | | | | — | | | | 9,407 | | | | 61,393 | | | | 356,228 | | | | — | | | | 15,738 | | | | 371,966 | |
Bolivian proved reserves were not classified as such in 2014, 2013 and 2012 due to changes introduced to the Bolivian Constitution, which restrict the disclosure of estimated reserves for properties under its authority.
The estimated reserves were subjected to economic evaluation to determine their economic limits. Such estimated reserves in Argentina for years ended in 2014, 2013 and 2012 are stated prior to the payment of any royalties as they have the same impact as taxes on production and are not paid in kind, and therefore are treated as operating costs.
In Venezuela, as of December 31, 2014, 2013 and 2012, estimated reserves were calculated on the basis of the contractual structure in force, and are stated before royalties and are computed by multiplying our ownership in each mixed company by the proved reserve volumes of the relevant mixed company.
S-7
| | | | | | | | | | | | | | | | | | | | | | | | |
| | | 2014 | | | 2013 | | | 2012 | |
| | | Crude Oil,
Condensate
and Natural
Gas Liquids | | | Natural Gas | | | Crude Oil,
Condensate
and Natural
Gas Liquids | | | Natural Gas | | | Crude Oil,
Condensate
and Natural
Gas Liquids | | | Natural Gas | |
| | | In thousands of
barrels | | | In millions of
cubic feet | | | In thousands of
barrels | | | In millions of
cubic feet | | | In thousands of
barrels | | | In millions of
cubic feet | |
Net proved developed reserves: | | | | | | | | | | | | | | | | | | | | | | | | |
Consolidated entities | | | | | | | | | | | | | | | | | | | | | | | | |
Argentina | | | 51,986 | | | | 356,228 | | | | 43,802 | | | | 320,642 | | | | 48,936 | | | | 358,319 | |
Rest of Latin-America | | | — | | | | — | | | | — | | | | — | | | | — | | | | — | |
| | | | | | | | | | | | | | | | | | | | | | | | |
| | | 51,986 | | | | 356,228 | | | | 43,802 | | | | 320,642 | | | | 48,936 | | | | 358,319 | |
| | | | | | | | | | | | | | | | | | | | | | | | |
Equity method investees | | | | | | | | | | | | | | | | | | | | | | | | |
Argentina | | | — | | | | — | | | | — | | | | — | | | | — | | | | — | |
Venezuela | | | 9,407 | | | | 15,738 | | | | 12,448 | | | | 14,868 | | | | 12,670 | | | | 14,582 | |
| | | | | | | | | | | | | | | | | | | | | | | | |
| | | 9,407 | | | | 15,738 | | | | 12,448 | | | | 14,868 | | | | 12,670 | | | | 14,582 | |
| | | | | | | | | | | | | | | | | | | | | | | | |
Total consolidated and equity method investees | | | 61,393 | | | | 371,966 | | | | 56,250 | | | | 335,510 | | | | 61,606 | | | | 372,901 | |
| | | | | | | | | | | | | | | | | | | | | | | | |
Net proved undeveloped reserves: | | | | | | | | | | | | | | | | | | | | | | | | |
Consolidated entities | | | | | | | | | | | | | | | | | | | | | | | | |
Argentina | | | 14,629 | | | | 372,493 | | | | 17,039 | | | | 374,645 | | | | 15,309 | | | | 354,147 | |
Rest of Latin-America | | | — | | | | — | | | | — | | | | — | | | | — | | | | — | |
| | | | | | | | | | | | | | | | | | | | | | | | |
| | | 14,629 | | | | 372,493 | | | | 17,039 | | | | 374,645 | | | | 15,309 | | | | 354,147 | |
| | | | | | | | | | | | | | | | | | | | | | | | |
Equity method investees | | | | | | | | | | | | | | | | | | | | | | | | |
Argentina | | | — | | | | — | | | | — | | | | — | | | | — | | | | — | |
Venezuela | | | 8,560 | | | | 11,867 | | | | 8,976 | | | | 26,605 | | | | 11,860 | | | | 31,873 | |
| | | | | | | | | | | | | | | | | | | | | | | | |
| | | 8,560 | | | | 11,867 | | | | 8,976 | | | | 26,605 | | | | 11,860 | | | | 31,873 | |
| | | | | | | | | | | | | | | | | | | | | | | | |
Total consolidated and equity method investees | | | 23,189 | | | | 384,360 | | | | 26,015 | | | | 401,250 | | | | 27,169 | | | | 386,020 | |
| | | | | | | | | | | | | | | | | | | | | | | | |
Standardized measure of discounted future net cash flows
The following table discloses estimated future net cash flows from future production of proved developed and undeveloped reserves of crude oil, condensate, natural gas liquids and natural gas. As prescribed by SEC Modernization of Oil and Gas Reporting rules and ASC 932 of the FASB Accounting Standards Codification (ASC) relating to Extractive Activities – Oil and Gas (formerly SFAS no. 69 Disclosures about Oil and Gas Producing Activities), such future net cash flows were estimated using the average first-day-of-the-month price during the 12-month period for 2014, 2013 and 2012 and using a 10% annual discount factor. Future development and abandonment costs include estimated drilling costs, development and exploitation installations and abandonment costs. These future development costs were estimated based on evaluations made by the Company and the operators of the fields in which the Company has an interest. The future income tax was calculated by applying the tax rate in effect as of the date this supplementary information was filed.
This standardized measure is not intended to be and should not be interpreted as an estimate of the market value of the Company’s reserves. The purpose of this information is to give standardized data to help the users of the financial statements to compare different companies and make certain projections. It is important to point out that this information does not include, among other items, the effect of future changes in prices, costs and tax rates, which past experience indicates that are likely to occur, as well as the effect of future cash flows from reserves which have not yet been classified as proved reserves, of a discount factor more representative of the value of money over the lapse of time and of the risks inherent to the production of oil and gas. These future changes may have a significant impact on the future net cash flows disclosed below. For all these reasons, this information does not necessarily indicate the perception the Company has on the discounted future net cash flows derived from the reserves of hydrocarbons.
S-8
| | | | | | | | | | | | | | | | | | | | |
| | | Consolidated companies | | | Equity Method Investment | |
| | | Argentina | | | Rest of
Latin-
America | | | Total | | | Venezuela | | | Total | |
| | | (Stated in millions of Argentine pesos) | |
At December 31, 2014 | | | | | | | | | | | | | | | | | | | | |
Future cash flows | | | 61,252 | | | | 1,037 | | | | 62,289 | | | | 6,778 | | | | 6,778 | |
Future production costs | | | (32,004 | ) | | | (672 | ) | | | (32,676 | ) | | | (2,284 | ) | | | (2,284 | ) |
Future development and abandonment costs | | | (10,218 | ) | | | (243 | ) | | | (10,461 | ) | | | (1,224 | ) | | | (1,224 | ) |
Future income tax | | | (5,285 | ) | | | (62 | ) | | | (5,347 | ) | | | (130 | ) | | | (130 | ) |
| | | | | | | | | | | | | | | | | | | | |
Undiscounted future net cash flows | | | 13,745 | | | | 60 | | | | 13,805 | | | | 3,140 | | | | 3,140 | |
10% annual discount | | | (4,493 | ) | | | (27 | ) | | | (4,520 | ) | | | (1,216 | ) | | | (1,216 | ) |
| | | | | | | | | | | | | | | | | | | | |
Standardized measure of discounted future net cash flows | | | 9,252 | | | | 33 | | | | 9,285 | | | | 1,924 | | | | 1,924 | |
| | | | | | | | | | | | | | | | | | | | |
At December 31, 2013 | | | | | | | | | | | | | | | | | | | | |
Future cash flows | | | 39,279 | | | | 1,055 | | | | 40,334 | | | | 12,291 | | | | 12,291 | |
Future production costs | | | (20,993 | ) | | | (770 | ) | | | (21,763 | ) | | | (9,073 | ) | | | (9,073 | ) |
Future development and abandonment costs | | | (6,490 | ) | | | (185 | ) | | | (6,675 | ) | | | (843 | ) | | | (843 | ) |
Future income tax | | | (3,009 | ) | | | (60 | ) | | | (3,069 | ) | | | (535 | ) | | | (535 | ) |
| | | | | | | | | | | | | | | | | | | | |
Undiscounted future net cash flows | | | 8,787 | | | | 40 | | | | 8,827 | | | | 1,840 | | | | 1,840 | |
10% annual discount | | | (2,328 | ) | | | 29 | | | | (2,299 | ) | | | (652 | ) | | | (652 | ) |
| | | | | | | | | | | | | | | | | | | | |
Standardized measure of discounted future net cash flows | | | 6,459 | | | | 69 | | | | 6,528 | | | | 1,188 | | | | 1,188 | |
| | | | | | | | | | | | | | | | | | | | |
At December 31, 2012 | | | | | | | | | | | | | | | | | | | | |
Future cash flows | | | 29,877 | | | | 949 | | | | 30,826 | | | | 11,130 | | | | 11,130 | |
Future production costs | | | (14,050 | ) | | | (597 | ) | | | (14,647 | ) | | | (8,165 | ) | | | (8,165 | ) |
Future development and abandonment costs | | | (5,073 | ) | | | (73 | ) | | | (5,146 | ) | | | (647 | ) | | | (647 | ) |
Future income tax | | | (2,754 | ) | | | (81 | ) | | | (2,835 | ) | | | (519 | ) | | | (519 | ) |
| | | | | | | | | | | | | | | | | | | | |
Undiscounted future net cash flows | | | 8,000 | | | | 198 | | | | 8,198 | | | | 1,799 | | | | 1,799 | |
10% annual discount | | | (1,948 | ) | | | (75 | ) | | | (2,023 | ) | | | (609 | ) | | | (609 | ) |
| | | | | | | | | | | | | | | | | | | | |
Standardized measure of discounted future net cash flows | | | 6,052 | | | | 123 | | | | 6,175 | | | | 1,190 | | | | 1,190 | |
| | | | | | | | | | | | | | | | | | | | |
S-9
Changes in the standardized measure of discounted future net cash flows
The following table discloses the changes in the standardized measure of discounted future net cash flows for the years ended December 31, 2014, 2013 and 2012:
| | | | | | | | | | | | | | | | | | | | | | | | |
| | | Consolidated companies | | | Equity Method Investment | |
| | | Argentina | | | Rest of
Latin-
America | | | Total | | | Argentina | | | Venezuela | | | Total | |
| | | (Stated in millions of Argentine pesos) | |
Standardized measure at December 31, 2013 | | | 6,459 | | | | 69 | | | | 6,528 | | | | — | | | | 1,188 | | | | 1,188 | |
| | | | | | | | | | | | | | | | | | | | | | | | |
Changes related to oil & gas activities: | | | | | | | | | | | | | | | | | | | | | | | | |
Hydrocarbons sales net of production costs | | | (5,479 | ) | | | (97 | ) | | | (5,576 | ) | | | — | | | | (363 | ) | | | (363 | ) |
Net change in sales prices, net of future production costs | | | 689 | | | | 64 | | | | 753 | | | | — | | | | 981 | | | | 981 | |
Changes in future development costs | | | (5,107 | ) | | | (26 | ) | | | (5,133 | ) | | | — | | | | (550 | ) | | | (550 | ) |
Extensions, discoveries and improved recovery, net of future production and associated costs | | | 1,560 | | | | — | | | | 1,560 | | | | — | | | | — | | | | — | |
Development costs incurred | | | 3,810 | | | | 31 | | | | 3,841 | | | | — | | | | 539 | | | | 539 | |
Revisions of quantity estimates | | | (235 | ) | | | (97 | ) | | | (332 | ) | | | — | | | | (551 | ) | | | (551 | ) |
Purchase of reserves in place | | | 6,421 | | | | — | | | | 6,421 | | | | — | | | | — | | | | — | |
Sale of reserves in place | | | (721 | ) | | | — | | | | | | | | | | | | — | | | | | |
Net change in income taxes | | | (973 | ) | | | 7 | | | | (966 | ) | | | — | | | | 384 | | | | 384 | |
Accretion of discount | | | 1,126 | | | | 15 | | | | 1,141 | | | | — | | | | 203 | | | | 203 | |
Changes in production rates | | | (3 | ) | | | 47 | | | | 44 | | | | — | | | | (250 | ) | | | (250 | ) |
Other changes | | | 1,705 | | | | 20 | | | | 1,725 | | | | — | | | | 343 | | | | 343 | |
| | | | | | | | | | | | | | | | | | | | | | | | |
Standardized measure at December 31, 2014 | | | 9,252 | | | | 33 | | | | 10,006 | | | | — | | | | 1,924 | | | | 1,924 | |
| | | | | | | | | | | | | | | | | | | | | | | | |
S-10
| | | | | | | | | | | | | | | | | | | | | | | | |
| | | Consolidated companies | | | Equity Method Investment | |
| | | Argentina | | | Rest of
Latin-
America | | | Total | | | Argentina | | | Venezuela | | | Total | |
| | | (Stated in millions of Argentine pesos) | |
Standardized measure at December 31, 2012 | | | 6,052 | | | | 123 | | | | 6,175 | | | | — | | | | 1,190 | | | | 1,190 | |
| | | | | | | | | | | | | | | | | | | | | | | | |
Changes related to oil & gas activities: | | | | | | | | | | | | | | | | | | | | | | | | |
Hydrocarbons sales net of production costs | | | (3,955 | ) | | | (103 | ) | | | (4,058 | ) | | | — | | | | (573 | ) | | | (573 | ) |
Net change in sales prices, net of future production costs | | | (744 | ) | | | 1 | | | | (743 | ) | | | — | | | | 137 | | | | 137 | |
Changes in future development costs | | | (1,884 | ) | | | (100 | ) | | | (1,984 | ) | | | — | | | | (237 | ) | | | (237 | ) |
Extensions, discoveries and improved recovery, net of future production and associated costs | | | — | | | | — | | | | — | | | | — | | | | — | | | | — | |
Development costs incurred | | | 2,087 | | | | 31 | | | | 2,118 | | | | — | | | | 240 | | | | 240 | |
Revisions of quantity estimates | | | 324 | | | | 12 | | | | 336 | | | | — | | | | (106 | ) | | | (106 | ) |
Purchase of reserves in place | | | 1,768 | | | | — | | | | 1,768 | | | | — | | | | — | | | | — | |
Net change in income taxes | | | 527 | | | | 25 | | | | 552 | | | | — | | | | 76 | | | | 76 | |
Accretion of discount | | | 1,094 | | | | 23 | | | | 1,117 | | | | — | | | | 200 | | | | 200 | |
Changes in production rates | | | (227 | ) | | | 16 | | | | (211 | ) | | | — | | | | — | | | | — | |
Other changes | | | 1,417 | | | | 41 | | | | 1,458 | | | | — | | | | 261 | | | | 261 | |
| | | | | | | | | | | | | | | | | | | | | | | | |
Standardized measure at December 31, 2013 | | | 6,459 | | | | 69 | | | | 6,528 | | | | — | | | | 1,188 | | | | 1,188 | |
| | | | | | | | | | | | | | | | | | | | | | | | |
S-11
| | | | | | | | | | | | | | | | | | | | | | | | |
| | | Consolidated companies | | | Equity Method Investment | |
| | | Argentina | | | Rest of
Latin-
America | | | Total | | | Argentina | | | Venezuela | | | Total | |
| | | (Stated in millions of Argentine pesos) | |
Standardized measure at December 31, 2011 | | | 4,709 | | | | 97 | | | | 4,806 | | | | 250 | | | | 1,916 | | | | 2,166 | |
| | | | | | | | | | | | | | | | | | | | | | | | |
Changes related to oil & gas activities: | | | | | | | | | | | | | | | | | | | | | | | | |
Hydrocarbons sales net of production costs | | | (3,104 | ) | | | (86 | ) | | | (3,147 | ) | | | (71 | ) | | | (381 | ) | | | (452 | ) |
Net change in sales prices, net of future production costs | | | 897 | | | | 116 | | | | 1,013 | | | | 56 | | | | (1,185 | ) | | | (1,129 | ) |
Changes in future development costs | | | (1,947 | ) | | | (15 | ) | | | (1,962 | ) | | | (45 | ) | | | (384 | ) | | | (429 | ) |
Extensions, discoveries and improved recovery, net of future production and associated costs | | | 855 | | | | — | | | | 855 | | | | 29 | | | | 187 | | | | 216 | |
Development costs incurred | | | 1,576 | | | | 26 | | | | 1,602 | | | | 30 | | | | 95 | | | | 125 | |
Revisions of quantity estimates | | | 17 | | | | — | | | | 17 | | | | (1 | ) | | | (237 | ) | | | (238 | ) |
Purchase of reserves in place | | | 1,196 | | | | — | | | | 1,196 | | | | — | | | | — | | | | — | |
Net change in income taxes | | | 262 | | | | (2 | ) | | | 260 | | | | (22 | ) | | | 767 | | | | 745 | |
Accretion of discount | | | 916 | | | | 16 | | | | 932 | | | | 17 | | | | 328 | | | | 345 | |
Changes in production rates | | | 429 | | | | (67 | ) | | | 362 | | | | 35 | | | | (83 | ) | | | (48 | ) |
Other changes | | | 246 | | | | 38 | | | | 241 | | | | (278 | ) | | | 167 | | | | (111 | ) |
| | | | | | | | | | | | | | | | | | | | | | | | |
Standardized measure at December 31, 2012 | | | 6,052 | | | | 123 | | | | 6,175 | | | | — | | | | 1,190 | | | | 1,190 | |
| | | | | | | | | | | | | | | | | | | | | | | | |
S-12